SilverBow Resources Corporate Presentation March 2021
Forward-Looking Statements CAUTIONARY NOTE Regarding Potential Reserves Disclosures – Current SEC rules regarding oil and gas reserve information allow oil and gas companies to disclose proved reserves, and optionally probable and possible reserves that meet the SEC’s definitions of such terms. In this presentation, we refer to estimates of resource “potential” or “EUR” (estimated ultimate recovery quantities) or “IP” (initial production rates) or other descriptions of volumes potentially recoverable, which in addition to reserves generally classifiable as probable and possible include estimates of reserves that do not rise to the standards for possible reserves, and which SEC guidelines strictly prohibit us from including in filings with the SEC. U.S. Investors are urged to consider closely the oil and gas disclosures in our Form 10-K and other reports and filings with the SEC. These estimates are by their nature more speculative than estimates of proved reserves and are subject to greater uncertainties, and accordingly the likelihood of recovering those reserves is subject to substantially greater risk. THIS PRESENTATION has been prepared by the Company and includes market data and other statistical information from sources believed by it to be reliable, including independent industry publications, government publications or other published independent sources. Some data is also based on the Company’s good faith estimates, which is derived from its review of internal sources as well as the independent sources described above. Although the Company believes these sources are reliable, it has not independently verified the information and cannot guarantee its accuracy and completeness. THIS PRESENTATION includes information regarding our current drilling and completion costs and historical cost reductions. Future costs may be adversely impacted by increases in oil and gas prices which results in increased activity. THIS PRESENTATION references non-GAAP financial measures. Please see the Appendix to this presentation for definitions and reconciliations to the most directly comparable GAAP measure. Non-GAAP measures should not be considered in isolation or as a substitute for related GAAP measures or any other measure of a Company’s financial or operating performance presented in accordance with GAAP. THIS PRESENTATION includes information regarding our PV-10 as of 12/31/20. PV-10 represents the present value, discounted at 10% per year, of estimated future net cash flows. The Company’s calculation of PV-10 using SEC prices herein differs from the standardized measure of discounted future net cash flows determined in accordance with the rules and regulations of the SEC in that it is calculated before income taxes rather than after income taxes using the average price during the 12-month period, determined as an unweighted average of the first-day-of-the-month price for each month. The Company’s calculation of PV-10 using SEC prices should not be considered as an alternative to the standardized measure of discounted future net cash flows determined in accordance with the rules and regulations of the SEC. Please see the Appendix to this presentation for a reconciliation of PV-10 to Standardized Measure. THE MATERIAL INCLUDED herein which is not historical fact constitute “forward-looking statements” within the meaning of Section 27A of the Securities Act of 1933, as amended, and Section 21E of the Securities Exchange Act of 1934, as amended. These opinions, forecasts, scenarios and projections relate to, among other things, estimates of future commodity prices and operating and capital costs, capital expenditures, levels and costs of drilling activity, estimated production rates or forecasts of growth thereof, hydrocarbon reserve quantities and values, potential oil and gas reserves expressed as “EURs,” assumptions as to future hydrocarbon prices, liquidity, cash flows, operating results, availability of capital, internal rates of return, net asset values, drilling schedules and potential growth rates of reserves and production, all of which are forward-looking statements. These forward-looking statements are generally accompanied by words such as “could,” “believe,” “anticipate,” “intend,” “estimate,” “guidance” “budgeted,” “forecast” “expect,” “may,” “continue,” “predict,” “potential,” “project” and similar expressions although not all forward-looking statements contain such identifying words. Although the Company believes that such forward-looking statements are reasonable, the matters addressed represent management's expectations or beliefs concerning future events, and it is possible that the results described in this presentation will not be achieved. These forward-looking statements are based on current expectations and assumptions and are subject to a number of risks and uncertainties, many of which are beyond our control, which could cause actual results to differ materially from the results discussed in the forward-looking statements, including among other things: the severity and duration of world health events, including the COVID-19 pandemic, related economic repercussions and the resulting severe disruption in the oil and gas industry and negative impact on demand for oil and gas; the supply of oil and actions by the members of the Organization of the Petroleum Exporting Countries (“OPEC”) and Russia (together with OPEC and other allied producing countries, “OPEC+”) with respect to oil production levels and announcements of potential changes in such levels, including the ability of the OPEC+ countries to agree on and comply with supply limitations; operational challenges relating to the COVID-19 pandemic and efforts to mitigate the spread of the virus, including logistical challenges, protecting the health and well-being of our employees, remote work arrangements, performance of contracts and supply chain disruptions; shut-in and curtailment of production due to decreases in available storage capacity or other factors; volatility in natural gas, oil and NGL prices; liquidity including our ability to satisfy our short- or long-term liquidity needs; our ability to execute our business strategy, including the success of our drilling and development efforts; timing, cost and amount of future production of oil and natural gas; expectations regarding future free cash flow; and other factors discussed in the Company’s reports filed with the Securities and Exchange Commission (“SEC”), including its Annual Report on Form 10-K for the year ended December 31, 2020 (“Form 10-K”). All forward-looking statements speak only as of the date of this presentation. You should not place undue reliance on these forward-looking statements 2
SilverBow Investment Highlights Pure Play Eagle Ford E&P Focus on Costs & Margins Balanced Commodity Mix Exposure to Premium Markets Returns Driven Established operator with deep technical experience and in-basin knowledge Peer-leading cost structure with relentless focus on margins and capital efficiency Inventory provides optionality in capital allocation based on prevailing commodity prices Competitive advantage from exposure to favorable Gulf Coast pricing Maximize return on capital investments through repeat execution and financial discipline Long-term strategy remains intact with multiple playbooks for the future 3
4 Company Overview Corporate Profile SilverBow is an independent oil and gas company with operations across ~155,000 net acres spanning all commodity phase windows of the Eagle Ford Shale in South Texas Strategic Aim Targeted Results DISCIPLINE Ability to allocate capital across a diversified commodity base EXECUTION Track record of solid well results and free cash flow generation PRICING Infrastructure proximity to favorable Gulf Coast markets EFFICIENCY Focus on reducing costs to maximize margins and returns FLEXIBILITY Balance sheet provides financial and operational flexibility LEADERSHIP Proven management team with substantial experience in the play Continued emphasis debt paydown and free cash flow generation La Salle Live Oak Webb Dimmit SilverBow Acreage Legend Mc Mullen Note: Acreage position as of 12/31/20
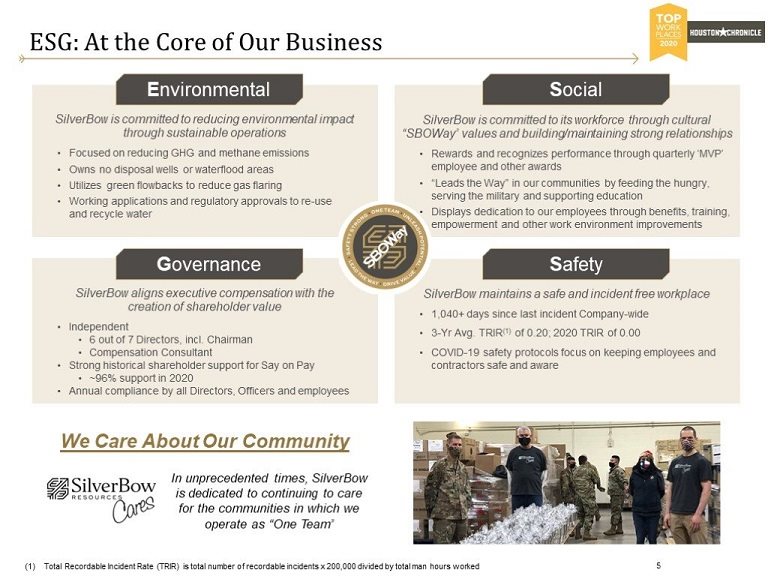
5 ESG: At the Core of Our Business SilverBow is committed to reducing environmental impact through sustainable operations Focused on reducing GHG and methane emissions Owns no disposal wells or waterflood areas Utilizes green flowbacks to reduce gas flaring Working applications and regulatory approvals to re-use and recycle water SilverBow maintains a safe and incident free workplace 1,040+ days since last incident Company-wide 3-Yr Avg. TRIR(1) of 0.20; 2020 TRIR of 0.00 COVID-19 safety protocols focus on keeping employees and contractors safe and aware SilverBow aligns executive compensation with the creation of shareholder value Independent 6 out of 7 Directors, incl. Chairman Compensation Consultant Strong historical shareholder support for Say on Pay ~96% support in 2020 Annual compliance by all Directors, Officers and employees SilverBow is committed to its workforce through cultural “SBOWay” values and building/maintaining strong relationships Rewards and recognizes performance through quarterly ‘MVP’ employee and other awards “Leads the Way” in our communities by feeding the hungry, serving the military and supporting education Displays dedication to our employees through benefits, training, empowerment and other work environment improvements In unprecedented times, SilverBow is dedicated to continuing to care for the communities in which we operate as “One Team” We Care About Our Community Environmental Social Governance Safety Total Recordable Incident Rate (TRIR) is total number of recordable incidents x 200,000 divided by total man hours worked
6 Leading “E”SG in the Eagle Ford 2019 Eagle Ford Operator Emission Intensity Source: Enverus. Peers includes public and private Eagle Ford operators with available data from 2019. Peers (in alphabetical order) include: Apache, BP, Callon, Chesapeake, Chevron, ConocoPhillips, Devon, Earthstone, Ensign, EOG, EP Energy, Escondido, EXCO Resources, GeoSouthern, Hawkwood, Lewis, Lonestar, Marathon, Matador, Mesquite, Murphy, Ovinitiv, Penn Virigina, Repsol, SM Energy, Trinity, Venado SBOW is one of the lowest emitting operators in the Eagle Ford (Kg CO2e per Boe) Peer Average = 26.3 Leader in equivalent emissions intensity across all Eagle Ford operators SBOW 60% below Eagle Ford average emission intensity
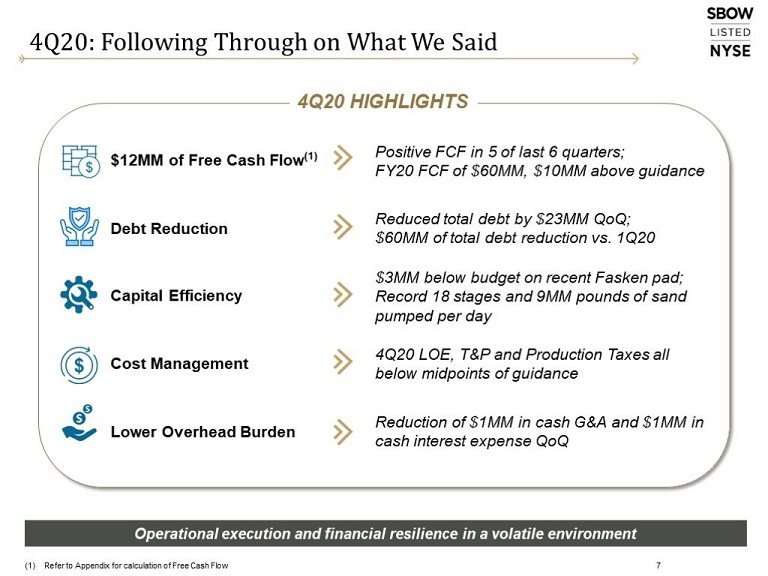
7 4Q20: Following Through on What We Said Operational execution and financial resilience in a volatile environment 4Q20 HIGHLIGHTS Refer to Appendix for calculation of Free Cash Flow
8 FY20: Results Exceeded Objectives 2020 highlights another year of executing on strategic objectives 2020 OBJECTIVES Refer to Appendix for calculation of Free Cash Flow Total Recordable Incident Rate (TRIR) is total number of recordable incidents x 200,000 divided by total man hours worked Includes drilling and completion capital costs incurred, per completed lateral footage 2020 RESULTS Sustainable Free Cash Flow ~$60MM Free Cash Flow(1) 2 Absolute Debt Reduction ~$50MM Net Debt Reduction 3 Highest Safety Standards ZERO 2020 TRIR(2) 4 Capital Efficiency 21% YoY Reduction in D&C $/ft(3) 1
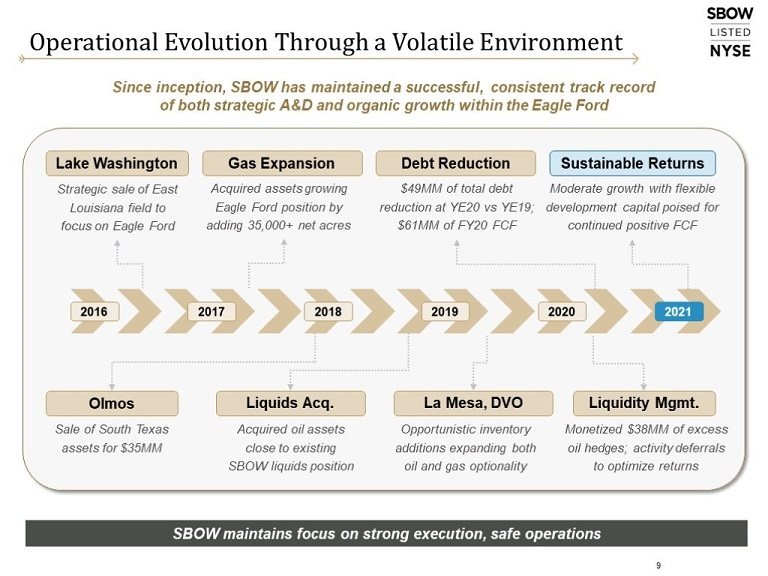
SBOW maintains focus on strong execution, safe operations Operational Evolution Through a Volatile Environment 2016 2017 2018 2019 2020 Lake Washington Strategic sale of East Louisiana field to focus on Eagle Ford Olmos Sale of South Texas assets for $35MM Sustainable Returns Moderate growth with flexible development capital poised for continued positive FCF Debt Reduction $49MM of total debt reduction at YE20 vs YE19; $61MM of FY20 FCF Liquidity Mgmt. Monetized $38MM of excess oil hedges; activity deferrals to optimize returns Gas Expansion Acquired assets growing Eagle Ford position by adding 35,000+ net acres La Mesa, DVO Opportunistic inventory additions expanding both oil and gas optionality Liquids Acq. Acquired oil assets close to existing SBOW liquids position Since inception, SBOW has maintained a successful, consistent track record of both strategic A&D and organic growth within the Eagle Ford 9 2021
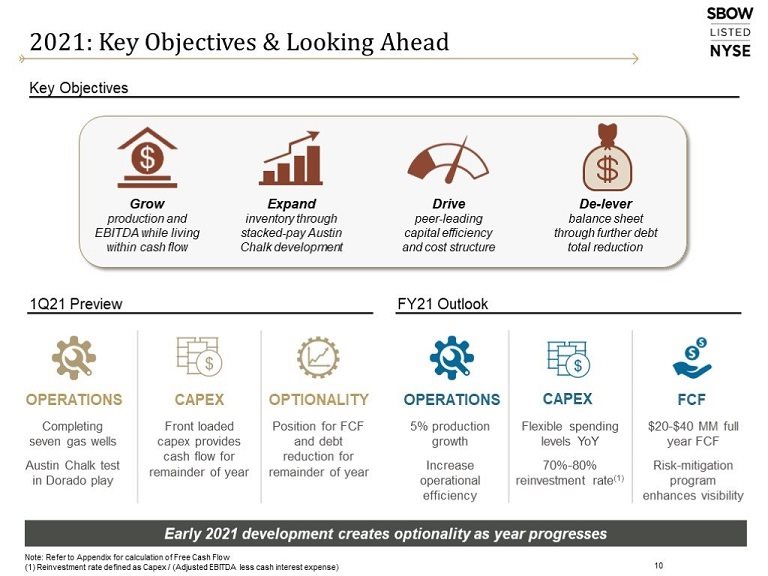
10 2021: Key Objectives & Looking Ahead Note: Refer to Appendix for calculation of Free Cash Flow (1) Reinvestment rate defined as Capex / (Adjusted EBITDA less cash interest expense) Key Objectives 1Q21 Preview FY21 Outlook Grow production and EBITDA while living within cash flow Drive peer-leading capital efficiency and cost structure De-lever balance sheet through further debt total reduction Completing seven gas wells Austin Chalk test in Dorado play Front loaded capex provides cash flow for remainder of year Position for FCF and debt reduction for remainder of year OPERATIONS CAPEX OPTIONALITY 5% production growth Increase operational efficiency Flexible spending levels YoY 70%-80% reinvestment rate(1) $20-$40 MM full year FCF Risk-mitigation program enhances visibility OPERATIONS CAPEX FCF Early 2021 development creates optionality as year progresses Expand inventory through stacked-pay Austin Chalk development
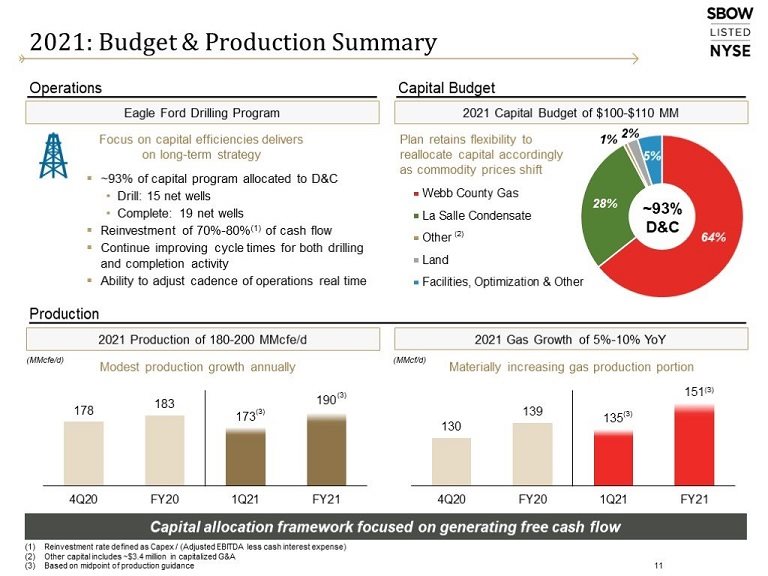
11 Capital Budget Operations Production 2021: Budget & Production Summary 2021 Capital Budget of $100-$110 MM ~93% D&C Plan retains flexibility to reallocate capital accordingly as commodity prices shift Eagle Ford Drilling Program ~93% of capital program allocated to D&C Drill: 15 net wells Complete: 19 net wells Reinvestment of 70%-80%(1) of cash flow Continue improving cycle times for both drilling and completion activity Ability to adjust cadence of operations real time 2021 Gas Growth of 5%-10% YoY (MMcf/d) Materially increasing gas production portion Focus on capital efficiencies delivers on long-term strategy Capital allocation framework focused on generating free cash flow Reinvestment rate defined as Capex / (Adjusted EBITDA less cash interest expense) Other capital includes ~$3.4 million in capitalized G&A Based on midpoint of production guidance 2021 Production of 180-200 MMcfe/d Modest production growth annually (MMcfe/d) (3) (3) (3) (2)
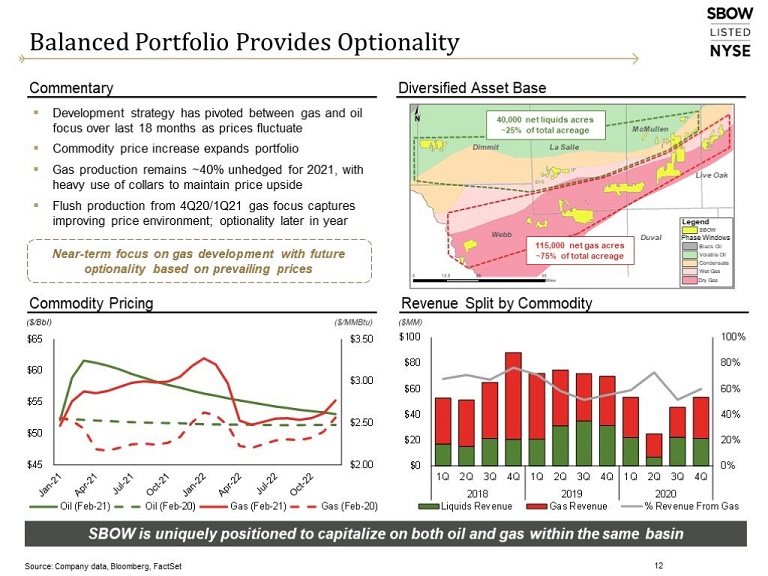
Revenue Split by Commodity Balanced Portfolio Provides Optionality Commentary Commodity Pricing ($MM) 12 Development strategy has pivoted between gas and oil focus over last 18 months as prices fluctuate Commodity price increase expands portfolio Gas production remains ~40% unhedged for 2021, with heavy use of collars to maintain price upside Flush production from 4Q20/1Q21 gas focus captures improving price environment; optionality later in year Source: Company data, Bloomberg, FactSet Diversified Asset Base SBOW is uniquely positioned to capitalize on both oil and gas within the same basin ($/Bbl) ($/MMBtu) Webb La Salle McMullen Duval Dimmit Live Oak 40,000 net liquids acres ~25% of total acreage 115,000 net gas acres ~75% of total acreage SBOW Legend Black Oil Volatile Oil Condensate Wet Gas Dry Gas Phase Windows Near-term focus on gas development with future optionality based on prevailing prices
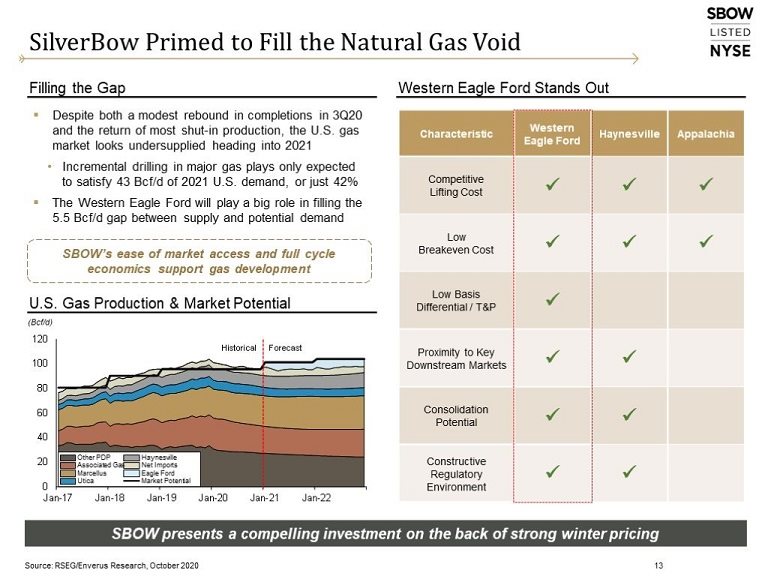
SilverBow Primed to Fill the Natural Gas Void 13 SBOW presents a compelling investment on the back of strong winter pricing Source: RSEG/Enverus Research, October 2020 Filling the Gap Western Eagle Ford Stands Out Despite both a modest rebound in completions in 3Q20 and the return of most shut-in production, the U.S. gas market looks undersupplied heading into 2021 Incremental drilling in major gas plays only expected to satisfy 43 Bcf/d of 2021 U.S. demand, or just 42% The Western Eagle Ford will play a big role in filling the 5.5 Bcf/d gap between supply and potential demand (Bcf/d) U.S. Gas Production & Market Potential SBOW’s ease of market access and full cycle economics support gas development
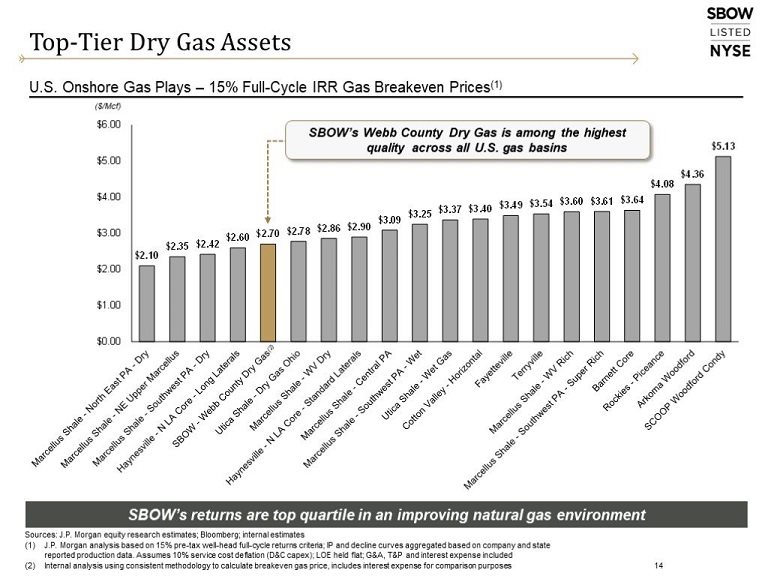
14 Top-Tier Dry Gas Assets Sources: J.P. Morgan equity research estimates; Bloomberg; internal estimates J.P. Morgan analysis based on 15% pre-tax well-head full-cycle returns criteria; IP and decline curves aggregated based on company and state reported production data. Assumes 10% service cost deflation (D&C capex); LOE held flat; G&A, T&P and interest expense included Internal analysis using consistent methodology to calculate breakeven gas price, includes interest expense for comparison purposes U.S. Onshore Gas Plays – 15% Full-Cycle IRR Gas Breakeven Prices(1) SBOW’s returns are top quartile in an improving natural gas environment ($/Mcf) SBOW’s Webb County Dry Gas is among the highest quality across all U.S. gas basins (2)
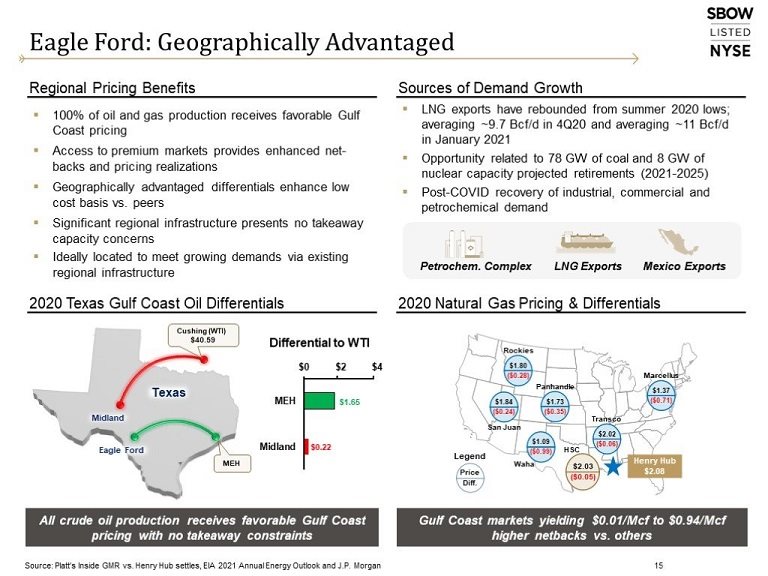
Regional Pricing Benefits Sources of Demand Growth LNG exports have rebounded from summer 2020 lows; averaging ~9.7 Bcf/d in 4Q20 and averaging ~11 Bcf/d in January 2021 Opportunity related to 78 GW of coal and 8 GW of nuclear capacity projected retirements (2021-2025) Post-COVID recovery of industrial, commercial and petrochemical demand 100% of oil and gas production receives favorable Gulf Coast pricing Access to premium markets provides enhanced net-backs and pricing realizations Geographically advantaged differentials enhance low cost basis vs. peers Significant regional infrastructure presents no takeaway capacity concerns Ideally located to meet growing demands via existing regional infrastructure 2020 Texas Gulf Coast Oil Differentials 2020 Natural Gas Pricing & Differentials Eagle Ford: Geographically Advantaged LNG Exports Mexico Exports Petrochem. Complex Gulf Coast markets yielding $0.01/Mcf to $0.94/Mcf higher netbacks vs. others All crude oil production receives favorable Gulf Coast pricing with no takeaway constraints Source: Platt’s Inside GMR vs. Henry Hub settles, EIA 2021 Annual Energy Outlook and J.P. Morgan 15 Price Diff. Henry Hub $2.08 HSC Waha Rockies Panhandle Marcellus Transco San Juan $1.09 ($0.99) $1.84 ($0.24) $1.80 ($0.28) $1.73 ($0.35) $1.37 ($0.71) $2.02 ($0.06) Legend $2.03 ($0.05) Differential to WTI Midland Eagle Ford Texas MEH Cushing (WTI) $40.59
16 SilverBow Realizes Favorable Pricing SBOW consistently realizes prices close to NYMEX benchmarks ($/Bbl) (% of WTI) ($/Mcf) (% of HH) Realized Oil Prices Realized Gas Prices 100% of HH Average Over Last 8 Quarters 97% of WTI Average Over Last 8 Quarters
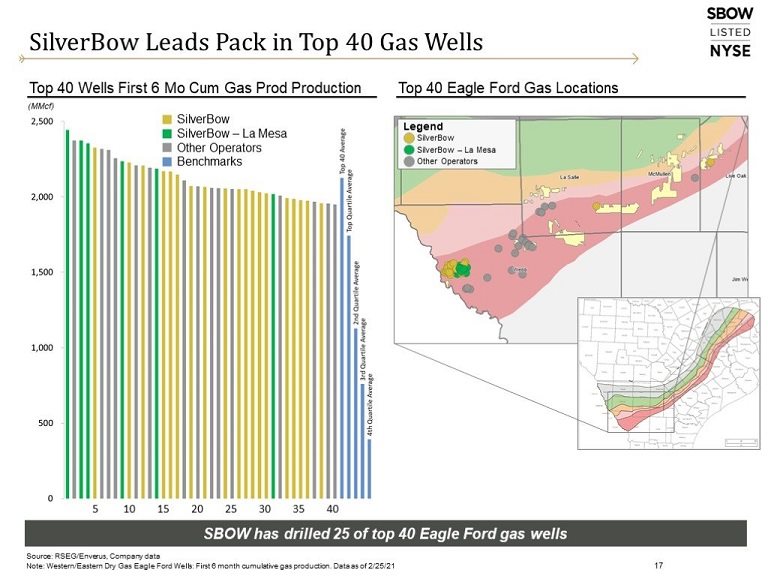
17 SilverBow Leads Pack in Top 40 Gas Wells (MMcf) Source: RSEG/Enverus, Company data Note: Western/Eastern Dry Gas Eagle Ford Wells: First 6 month cumulative gas production. Data as of 2/25/21 SBOW has drilled 25 of top 40 Eagle Ford gas wells Top 40 Wells First 6 Mo Cum Gas Prod Production Top 40 Eagle Ford Gas Locations
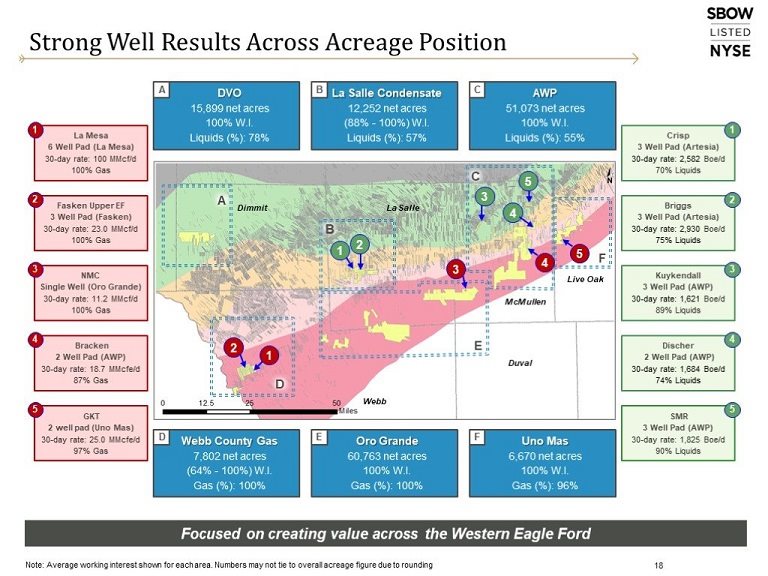
18 Strong Well Results Across Acreage Position Focused on creating value across the Western Eagle Ford Note: Average working interest shown for each area. Numbers may not tie to overall acreage figure due to rounding Crisp 3 Well Pad (Artesia) 30-day rate: 2,582 Boe/d 70% Liquids 1 Discher 2 Well Pad (AWP) 30-day rate: 1,684 Boe/d 74% Liquids 4 Briggs 3 Well Pad (Artesia) 30-day rate: 2,930 Boe/d 75% Liquids 2 Kuykendall 3 Well Pad (AWP) 30-day rate: 1,621 Boe/d 89% Liquids 3 DVO 15,899 net acres 100% W.I. Liquids (%): 78% Webb County Gas 7,802 net acres (64% - 100%) W.I. Gas (%): 100% La Salle Condensate 12,252 net acres (88% - 100%) W.I. Liquids (%): 57% Oro Grande 60,763 net acres 100% W.I. Gas (%): 100% AWP 51,073 net acres 100% W.I. Liquids (%): 55% Uno Mas 6,670 net acres 100% W.I. Gas (%): 96% A B C F E D La Salle McMullen Dimmit Webb Duval Live Oak A D B E C F
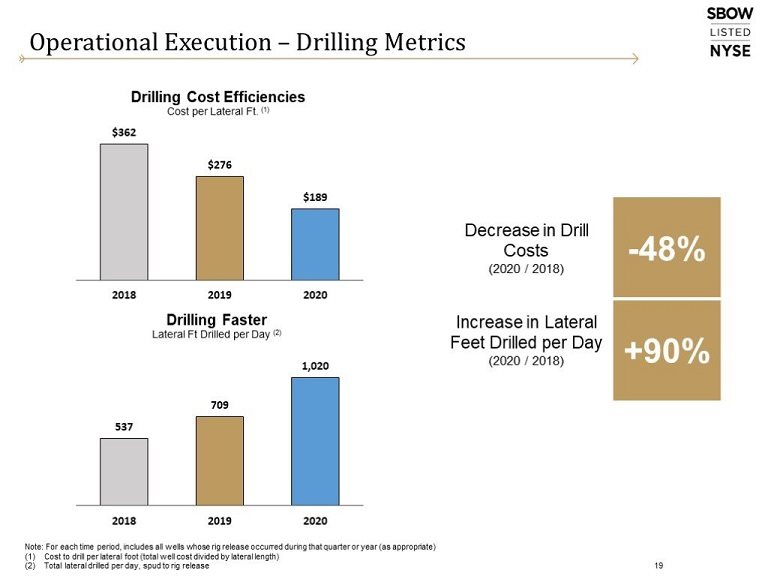
Operational Execution – Drilling Metrics Note: For each time period, includes all wells whose rig release occurred during that quarter or year (as appropriate) Cost to drill per lateral foot (total well cost divided by lateral length) Total lateral drilled per day, spud to rig release 19
20 Operational Execution – Completion Metrics Costs includes toe prep, stimulation, drill-out, tubing install and flowback Stages completed per day per pad, frac start to frac end CLAT stimulated per day, per well Average amount of proppant pumped per day (thousand of #s pumped)
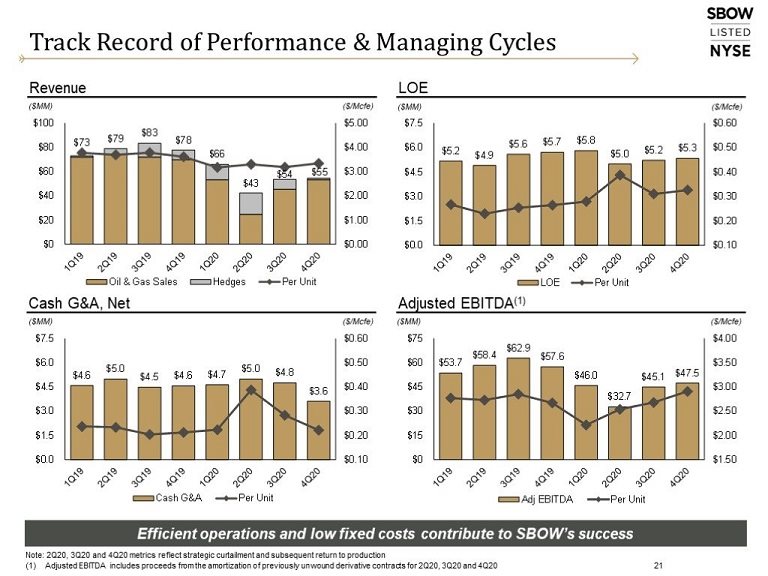
Track Record of Performance & Managing Cycles 21 Efficient operations and low fixed costs contribute to SBOW’s success Revenue LOE Cash G&A, Net Adjusted EBITDA(1) ($/Mcfe) ($MM) ($/Mcfe) ($MM) ($/Mcfe) ($MM) ($/Mcfe) ($MM) Note: 2Q20, 3Q20 and 4Q20 metrics reflect strategic curtailment and subsequent return to production Adjusted EBITDA includes proceeds from the amortization of previously unwound derivative contracts for 2Q20, 3Q20 and 4Q20
Built to Deliver Strong Margins at Low Prices 22 Cost efficiencies and risk management support full-cycle profitability and returns Corporate Cash Margin ($/Mcfe) Note: Production Expenses include LOE, T&P and Production Taxes
23 Peer-Leading Metrics Compared to Gas E&Ps Financial and capital discipline drive peer-leading EBITDA margin and FCF yield 2020 EBITDA Margin(1) Source: FactSet, RSEG/Enverus. Company filings and press releases. Peers (in alphabetical order) include: Antero Resources, Cabot Oil & Gas, CNX Resources, Comstock Resources, EQT Corporation, Range Resources, Southwestern Energy EBITDA Margin = 2020E EBITDA / 2020E Revenue. Consensus estimates of Revenue and EBITDA per FactSet as of 1/12/21 FCF Yield = 2020 FCF / Market Cap as of 1/12/21. Peer FCF per 3Q20 Enverus report defined as EBITDA less capex less interest expense using pricing as of 1/12/21 2020 FCF Yield(2) Peer Group Avg. (Excl. SBOW): 47% Peer Group Avg. (Excl. SBOW): (0%)
Financial Discipline is Integral to Strategy 24 Maintain strong balance sheet Active hedging program to protect returns and minimize downside exposure Working capital management No near-term debt maturities Relentless focus on driving down costs Monetize non-core assets to further streamline operations Minimize borrowing costs and financial leakage Disciplined capital allocation Align capital structure with business model Acute focus on full-cycle returns Strategic business planning across wide range of pricing and operational scenarios Conservative leverage ratio Total Debt / LTM Adjusted EBITDA(2): 2.50x Credit Facility Second Lien ($MM) Undrawn Credit Facility Second Lien Reduced RBL Borrowings Debt Maturity Schedule(1) ($MM) Credit facility borrowings as of 12/31/20. Borrowing Base reflects $310 million LTM Adjusted EBITDA includes $25.1 million of proceeds from the amortization of previously unwound derivatives for period ending 4Q20. LTM Adjusted EBITDA for covenant compliance for 4Q20 = $171.4 million Expect to continue generating free cash flow to reduce revolver borrowings $60MM Debt Paydown Over Last 9 Months
25 Active Hedging Program to Protects Returns Oil Hedging Natural Gas Hedging(1) Manage commodity price risk through a disciplined risk management program Maintain a simple hedge portfolio comprised primarily of fixed price swaps and two-way collars Manage potential downside risk to commodity prices while preserving upside optionality Systematically add hedges on a roll forward basis Hedge volumes for 2021 cover 91% and 61% of expected oil and gas production, respectively ($/Bbl) ($/MMBtu) Note: Hedge portfolio as of 2/26/21. Wt Avg Price assumes ceiling price for collars. Refer to Hedging Summary for additional details 2021 percentage hedged represents percent of expected oil and gas production hedged based on full year 2021 production guidance The above analysis assumes 1 Mcf equals 1 MMBtu Poised to benefit from 2021 collars preserving upside exposure to gas prices (Bbls/d) (Mcf/d)
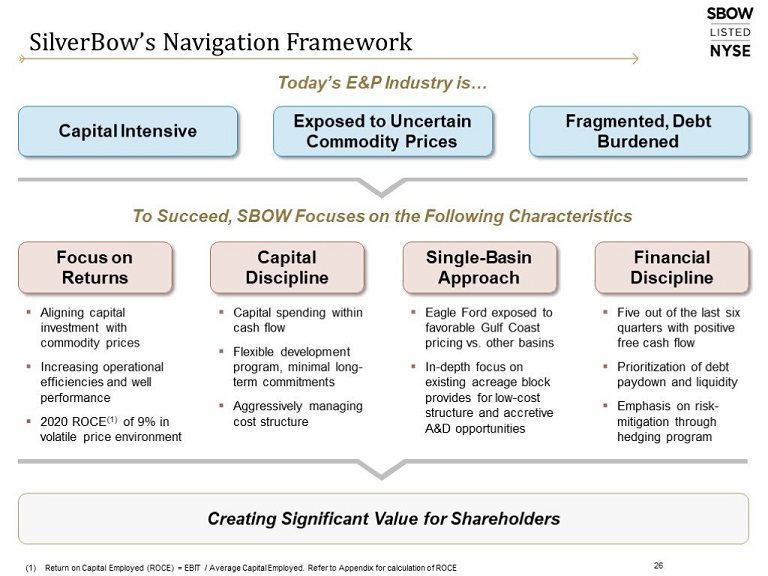
Creating Significant Value for Shareholders 26 SilverBow’s Navigation Framework Focus on Returns Capital Discipline Single-Basin Approach Financial Discipline Aligning capital investment with commodity prices Increasing operational efficiencies and well performance 2020 ROCE(1) of 9% in volatile price environment Today’s E&P Industry is… Capital Intensive Exposed to Uncertain Commodity Prices Fragmented, Debt Burdened To Succeed, SBOW Focuses on the Following Characteristics Capital spending within cash flow Flexible development program, minimal long-term commitments Aggressively managing cost structure Eagle Ford exposed to favorable Gulf Coast pricing vs. other basins In-depth focus on existing acreage block provides for low-cost structure and accretive A&D opportunities Five out of the last six quarters with positive free cash flow Prioritization of debt paydown and liquidity Emphasis on risk-mitigation through hedging program Return on Capital Employed (ROCE) = EBIT / Average Capital Employed. Refer to Appendix for calculation of ROCE
27 SilverBow’s Value Proposition Consistently generating free cash flow with high margins and a leading cost profile Pure Play Eagle Ford E&P Balanced Commodity Mix Focus on Costs & Margins Exposure to Premium Markets Returns Driven Established operator with deep technical experience and in-basin knowledge Peer-leading cost structure with relentless focus on margins and capital efficiency Inventory provides optionality in capital allocation based on prevailing commodity prices Competitive advantage from exposure to premium Gulf Coast pricing Maximize return on capital investments through repeat execution and financial discipline
Appendix 28
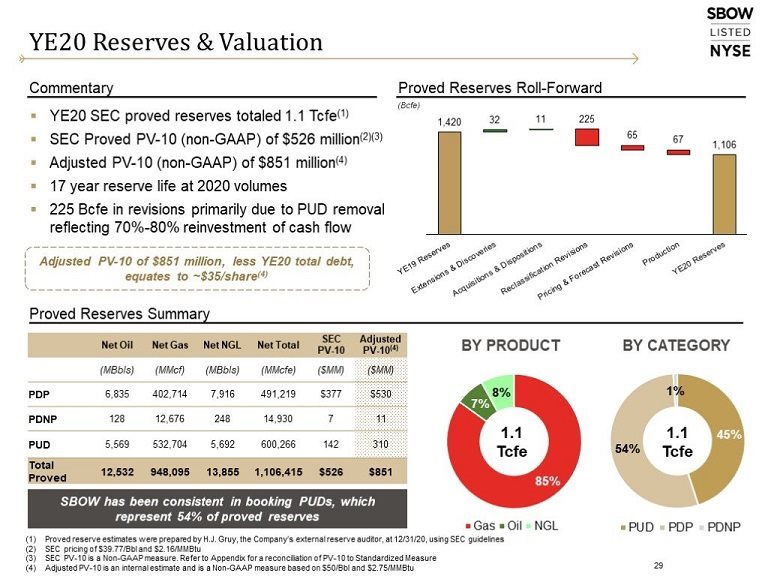
Proved Reserves Roll-Forward Commentary Proved Reserves Summary YE20 Reserves & Valuation 29 Proved reserve estimates were prepared by H.J. Gruy, the Company’s external reserve auditor, at 12/31/20, using SEC guidelines SEC pricing of $39.77/Bbl and $2.16/MMBtu SEC PV-10 is a Non-GAAP measure. Refer to Appendix for a reconciliation of PV-10 to Standardized Measure Adjusted PV-10 is an internal estimate and is a Non-GAAP measure based on $50/Bbl and $2.75/MMBtu SBOW has been consistent in booking PUDs, which represent 54% of proved reserves (Bcfe) YE20 SEC proved reserves totaled 1.1 Tcfe(1) SEC Proved PV-10 (non-GAAP) of $526 million(2)(3) Adjusted PV-10 (non-GAAP) of $851 million(4) 17 year reserve life at 2020 volumes 225 Bcfe in revisions primarily due to PUD removal reflecting 70%-80% reinvestment of cash flow Adjusted PV-10 of $851 million, less YE20 total debt, equates to ~$35/share(4)
31 Capital Structure & Credit Profile Revolving Credit Facility (due 2022) $310 million borrowing base $230 million outstanding LIBOR + 2.75%-3.75% 11 banks led by J.P. Morgan Total Debt / LTM Adjusted EBITDA < 3.5x Second Lien Facility (due 2024) $200 million outstanding LIBOR + 7.50% with 1% LIBOR floor December 2017 issuance NC2, 102 in Year 3, 101 in Year 4 and par thereafter until maturity Net Debt / LTM Adjusted EBITDA < 4.5x Common Equity "SBOW" stock symbol and listed on NYSE 11.937 million shares as of 1/31/21 Straightforward capital structure with improving metrics Capitalization(1) ($MM, except per unit amounts) Cash and debt balance as of 12/31/20 Reserves and PV-10 as of 12/31/20 and based on $50/Bbl and $2.75/MMBtu LTM Adjusted EBITDA includes $25.1 million of proceeds from the amortization of previously unwound derivatives for period ending 4Q20. LTM Adjusted EBITDA for covenant compliance for 4Q20 = $171.4 million
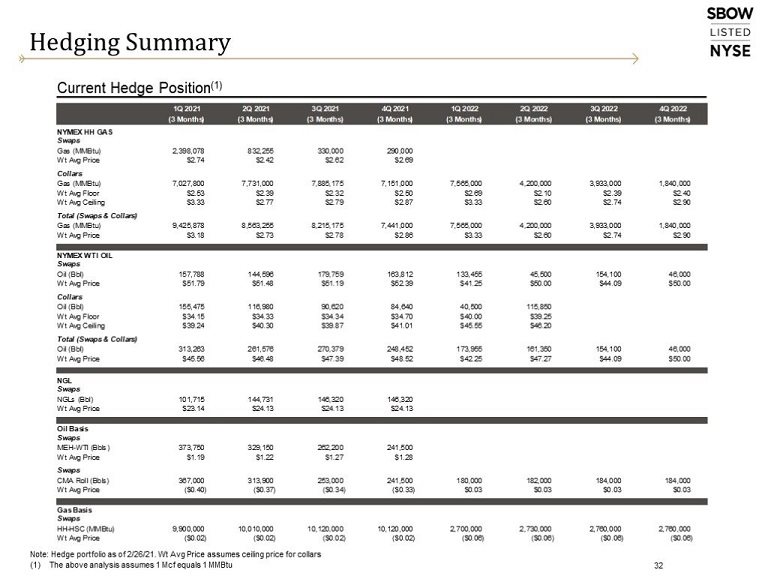
Hedging Summary 32 Note: Hedge portfolio as of 2/26/21. Wt Avg Price assumes ceiling price for collars The above analysis assumes 1 Mcf equals 1 MMBtu Current Hedge Position(1)
33 Calculation of Adjusted EBITDA & Free Cash Flow Note: Table represents as-reported figures Excludes proceeds/(payments) related to the divestiture/(acquisition) of oil and gas properties and equipment, outside of regular way land and leasing costs Adjusted EBITDA for Leverage Ratio includes $9.2 million of proceeds from the amortization of previously unwound derivative contracts for 4Q20. Adjusted EBITDA for covenant compliance for the 12 months ended 12/31/20 is $171.4 million
34 Calculation of Return on Capital Employed (“ROCE”) Note: Capital Employed - Beginning of Year represents prior year’s balance sheet 2020 shareholders’ equity excludes write-down of oil and gas properties B = Average of Beginning of Year and Year-End Capital Employed
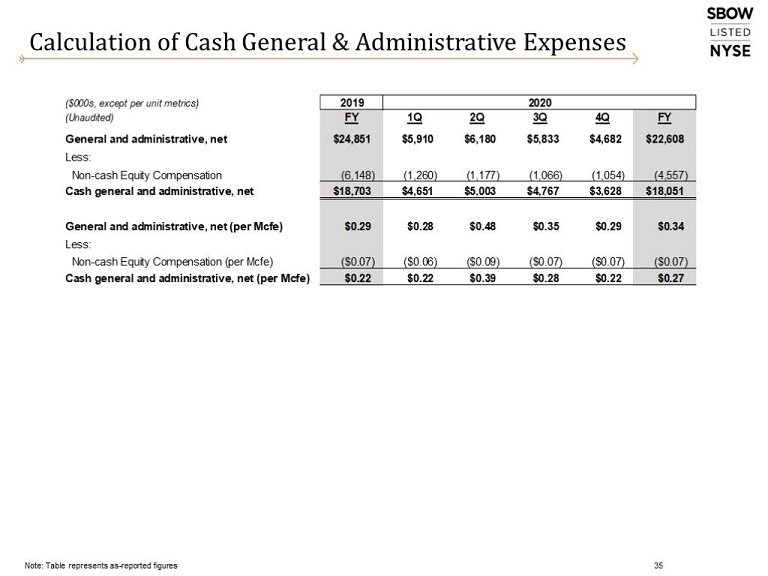
35 Calculation of Cash General & Administrative Expenses Note: Table represents as-reported figures
36 Reconciliation of PV-10 to Standardized Measure Estimates of future net revenues from our proved reserves, Standardized Measure and PV-10 (PV-10 is a non-GAAP measure defined below), as of December 31, 2020, is made in accordance with SEC criteria, which is based on the preceding 12-months' average adjusted price after differentials based on closing prices on the first business day of each month, excluding the effects of hedging and are held constant, for that year's reserves calculation, throughout the life of the properties, except where such guidelines permit alternate treatment, including, in the case of natural gas contracts, the use of fixed and determinable contractual price escalations. We have interests in certain tracts that are estimated to have additional hydrocarbon reserves that cannot be classified as proved and are not reflected in the following table. The following prices are used to estimate our SEC proved reserve volumes, year-end Standardized Measure and PV-10. The 12-month 2020 average adjusted prices after differentials were $2.13 per Mcf of natural gas, $37.83 per barrel of oil and $11.66 per barrel of NGL. As noted above, PV-10 Value is a non-GAAP measure. The most directly comparable GAAP measure to the PV-10 Value is the Standardized Measure. We believe the PV-10 Value is a useful supplemental disclosure to the Standardized Measure because the PV-10 Value is a widely used measure within the industry and is commonly used by securities analysts, banks and credit rating agencies to evaluate the value of proved reserves on a comparative basis across companies or specific properties without regard to the owner's income tax position. We use the PV-10 Value for comparison against our debt balances, to evaluate properties that are bought and sold and to assess the potential return on investment in our oil and gas properties. PV-10 Value is not a measure of financial or operating performance under GAAP, nor should it be considered in isolation or as a substitute for any GAAP measure. Our PV-10 Value and the Standardized Measure do not purport to represent the fair value of our proved oil and natural. The following table provides a reconciliation between the Standardized Measure and PV-10 Value of the Company's proved reserves: PV-10 represents the present value, discounted at 10% per year, of estimated future net cash flows. The Company’s calculation of PV-10 using SEC prices herein differs from the standardized measure of discounted future net cash flows determined in accordance with the rules and regulations of the SEC in that it is calculated before income taxes rather than after income taxes using the average price during the 12-month period, determined as an unweighted average of the first-day-of-the-month price for each month. The Company’s calculation of PV-10 using SEC prices should not be considered as an alternative to the standardized measure of discounted future net cash flows determined in accordance with the rules and regulations of the SEC.
Corporate Information 37 SBOWay
We use cookies on this site to provide a more responsive and personalized service. Continuing to browse, clicking I Agree, or closing this banner indicates agreement. See our Cookie Policy for more information.