UNITED STATES
SECURITIES AND EXCHANGE COMMISSION
WASHINGTON, D.C. 20549
FORM 10-Q
(Mark One)
| | þ | QUARTERLY REPORT PURSUANT TO SECTION 13 OR 15(d) OF THE SECURITIES EXCHANGE ACT OF 1934 |
| | | For the quarterly period ended December 31, 2007 |
OR
| | o | TRANSITION REPORT PURSUANT TO SECTION 13 OR 15(d) OF THE SECURITIES EXCHANGE ACT OF 1934 |
| | | For the transition period from_________________ to_________________ |
Commission file number: 1-9728
Epoch Holding Corporation
(Exact name of registrant as specified in its charter)
Delaware | 20-1938886 |
| (State or other jurisdiction | (I.R.S. employer |
| of incorporation or organization) | identification no.) |
640 Fifth Avenue, New York, NY 10019 (Address of principal executive offices) |
212-303-7200
(Registrant's telephone number, including area code)
Indicate by check mark whether the registrant (1) has filed all reports required to be filed by Section 13 or 15(d) of the Securities Exchange Act of 1934 during the preceding 12 months (or for such shorter period that the registrant was required to file such reports), and (2) has been subject to such filing requirements for the past 90 days. Yes þ No o
Indicate by check mark whether the registrant is a large accelerated filer, an accelerated filer, or a non-accelerated filer. See definition of “accelerated filer and large accelerated filer” in Rule 12b-2 of the Exchange Act. (Check one):
Large accelerated filer o | Accelerated filerþ | Non-accelerated filer o |
Indicate by check mark whether the registrant is a shell company (as defined in Rule 12b-2 of the Exchange Act). Yes o Noþ
At February 5, 2007, there were 20,414,139 shares of the Company's common stock, $.01 par value per share, outstanding.
EPOCH HOLDING CORPORATION AND SUBSIDIARIES
| | | | Page No. |
| | | |
| | | | |
| | | 3 |
| | | | |
| | | | 3 |
| | | | |
| | | | 4 |
| | | | |
| | | | 5 |
| | | | |
| | | | 6 |
| | | | |
| | | | 7-14 |
| | | | |
| | | 15-29 |
| | | | |
| | | 30 |
| | | | |
| | | 30 |
| | | | |
| | | 31 |
| | | | |
| | | 31 |
| | | | |
| | | 31 |
| | | | |
| | | 31 |
| | | | |
| | | 31 |
| | | | |
| | | 31 |
Item 1. Financial Statements.
EPOCH HOLDING CORPORATION AND SUBSIDIARIES
( in thousands, except share data)
| | | December 31, | | June 30, | |
| | | 2007 | | 2007 | |
| | | (Unaudited) | | | |
ASSETS | | | | | | | |
| | | | | | | | |
Current assets: | | | | | | | |
| Cash and cash equivalents | | $ | 32,929 | | $ | 3,097 | |
Short-term investments - (Note 2) | | | - | | | 21,850 | |
| Accounts receivable | | | 6,496 | | | 6,293 | |
Marketable securities (cost of $222 and $1,325, respectively) - (Notes 2 and 5) | | | 1,035 | | | 3,789 | |
Deferred tax asset - (Note 6) | | | 181 | | | - | |
| Prepaid and other current assets | | | 643 | | | 466 | |
| | | | | | | | |
| Total current assets | | | 41,284 | | | 35,495 | |
| | | | | | | | |
| Property and equipment (net of accumulated depreciation of $1,160 and $949, respectively) | | | 1,858 | | | 2,013 | |
| Security deposits | | | 1,088 | | | 1,072 | |
Other investments (cost of $4,325 and $756, respectively) - (Note 2) | | | 4,287 | | | 794 | |
| | | | | | | | |
| Total assets | | $ | 48,517 | | $ | 39,374 | |
| | | | | | | | |
LIABILITIES AND STOCKHOLDERS' EQUITY | | | | | | | |
| | | | | | | | |
Current liabilities: | | | | | | | |
| Accounts payable and accrued liabilities | | $ | 912 | | $ | 901 | |
| Accrued compensation and benefits | | | 5,371 | | | 1,810 | |
| Income taxes payable | | | 1,057 | | | 99 | |
| | | | | | | | |
| Total current liabilities | | | 7,340 | | | 2,810 | |
| | | | | | | | |
| Deferred rent | | | 855 | | | 898 | |
| Subtenant security deposit | | | 226 | | | 223 | |
| | | | | | | | |
| Total liabilities | | | 8,421 | | | 3,931 | |
| | | | | | | | |
Commitments and contingencies - (Note 4) | | | | | | | |
| | | | | | | | |
Stockholders' equity: | | | | | | | |
| Preferred stock, series A convertible, $1 par value per share, 1,000,000 shares authorized; 10,000 shares issued and outstanding | | | 10 | | | 10 | |
| Common stock, $0.01 par value per share, 60,000,000 shares authorized; 20,141,406 and 19,935,817 shares issued and outstanding, respectively | | | 201 | | | 199 | |
| Additional paid-in capital | | | 46,706 | | | 43,852 | |
| Accumulated deficit | | | (2,447 | ) | | (6,357 | ) |
| Unearned share-based compensation | | | (5,149 | ) | | (4,763 | ) |
| Accumulated other comprehensive income | | | 775 | | | 2,502 | |
| | | | | | | | |
| Total stockholders' equity | | | 40,096 | | | 35,443 | |
| | | | | | | | |
| Total liabilities and stockholders' equity | | $ | 48,517 | | $ | 39,374 | |
The accompanying notes are an integral part of these condensed consolidated financial statements.
EPOCH HOLDING CORPORATION AND SUBSIDIARIES
(in thousands, except share data)
| | | For the Three Months Ended | | For the Six Months Ended | |
| | | December 31, | | December 31, | |
| | | 2007 | | 2006 | | 2007 | | 2006 | |
Revenues: | | | | | | | | | | | | | |
| Investment advisory and management fees | | $ | 8,551 | | $ | 5,141 | | $ | 16,428 | | $ | 9,460 | |
| Performance fees | | | 172 | | | 971 | | | 172 | | | 971 | |
| Total revenues | | | 8,723 | | | 6,112 | | | 16,600 | | | 10,431 | |
| | | | | | | | | | | | | | |
Operating expenses: | | | | | | | | | | | | | |
| Employee related costs (excluding share-based compensation) | | | 4,563 | | | 3,637 | | | 8,812 | | | 6,473 | |
| Share-based compensation | | | 1,029 | | | 1,371 | | | 2,104 | | | 2,958 | |
| General, administrative and occupancy | | | 1,342 | | | 866 | | | 2,726 | | | 1,646 | |
| Professional fees and services | | | 582 | | | 548 | | | 1,339 | | | 853 | |
| Depreciation and amortization | | | 107 | | | 96 | | | 211 | | | 190 | |
| Total operating expenses | | | 7,623 | | | 6,518 | | | 15,192 | | | 12,120 | |
| | | | | | | | | | | | | | |
Operating income (loss) | | | 1,100 | | | (406 | ) | | 1,408 | | | (1,689 | ) |
| | | | | | | | | | | | | | |
Other income: - (Note 5) | | | | | | | | | | | | | |
| Realized gains on investments | | | 2,551 | | | 209 | | | 3,417 | | | 209 | |
| Dividend income | | | 3 | | | 2,354 | | | 6 | | | 2,354 | |
| Interest and other income | | | 542 | | | 1,291 | | | 1,056 | | | 1,537 | |
| | | | | | | | | | | | | | |
| Total other income | | | 3,096 | | | 3,854 | | | 4,479 | | | 4,100 | |
| | | | | | | | | | | | | | |
Income before income taxes | | | 4,196 | | | 3,448 | | | 5,887 | | | 2,411 | |
| | | | | | | | | | | | | | |
Provision for income taxes - (Note 6 ) | | | (1,649 | ) | | (99 | ) | | (1,243 | ) | | (99 | ) |
| | | | | | | | | | | | | | |
Net income | | | 2,547 | | | 3,349 | | | 4,644 | | | 2,312 | |
| | | | | | | | | | | | | | |
Cumulative preferred stock dividends - (Note 7) | | | (115 | ) | | (69 | ) | | (230 | ) | | (69 | ) |
| Non-cash charge attributable to beneficial conversion feature of preferred stock | | | - | | | (700 | ) | | - | | | (700 | ) |
| | | | | | | | | | | | | | |
Net income available to common stockholders for basic earnings per share | | $ | 2,432 | | $ | 2,580 | | $ | 4,414 | | $ | 1,543 | |
| | | | | | | | | | | | | | |
| | | | | | | | | | | | | |
Earnings per share - (Note 7) | | | | | | | | | | | | | |
| Basic | | $ | 0.12 | | $ | 0.13 | | $ | 0.22 | | $ | 0.08 | |
| Diluted | | $ | 0.12 | | $ | 0.13 | | $ | 0.21 | | $ | 0.08 | |
Weighted Average Shares Outstanding: | | | | | | | | | | | | | |
| Basic | | | 20,141 | | | 19,667 | | | 20,096 | | | 19,592 | |
| Diluted | | | 21,849 | | | 20,663 | | | 21,849 | | | 20,090 | |
The accompanying notes are an integral part of these condensed consolidated financial statements.
EPOCH HOLDING CORPORATION AND SUBSIDIARIES
(dollars and shares in thousands)
| | | | | | | | | | | | | | | | | Accumulated | | | |
| | | Preferred Stock | | | | | | Additional | | | | Unearned | | Other | | Total | |
| | | Series A Convertible | | Common Stock | | Paid-in | | Accumulated | | Share-Based | | Comprehensive | | Stockholders' | |
| | | Shares | | Amount | | Shares | | Amount | | Capital | | Deficit | | Compensation | | Income | | Equity | |
Balances at June 30, 2006 | | | - | | $ | - | | | 19,154 | | $ | 191 | | $ | 28,500 | | $ | (13,251 | ) | $ | (6,585 | ) | $ | - | | $ | 8,855 | |
| | | | | | | | | | | | | | | | | | | | | | | | | | | | | |
| Net income | | | | | | | | | | | | | | | | | | 7,893 | | | | | | | | | 7,893 | |
| Other comprehensive income | | | | | | | | | | | | | | | | | | | | | | | | 2,502 | | | 2,502 | |
Comprehensive income | | | | | | | | | | | | | | | | | | | | | | | | | | | 10,395 | |
| | | | | | | | | | | | | | | | | | | | | | | | | | | | | |
| Net issuance of restricted common stock | | | | | | | | | 735 | | | 7 | | | 4,438 | | | - | | | (3,933 | ) | | | | | 512 | |
| Amortization of unearned share-based compensation | | | | | | | | | - | | | - | | | - | | | - | | | 5,755 | | | | | | 5,755 | |
| Issuance of common stock upon exercise of stock options | | | | | | | | | 46 | | | 1 | | | 313 | | | - | | | - | | | | | | 314 | |
| Issuance of series A convertible preferred stock | | | 10 | | | 10 | | | | | | | | | 9,990 | | | | | | | | | | | | 10,000 | |
| Preferred stock issuance cost | | | | | | | | | | | | | | | (89 | ) | | | | | | | | | | | (89 | ) |
| Preferred stock dividends | | | | | | | | | | | | | | | | | | (299 | ) | | | | | | | | (299 | ) |
| Beneficial conversion feature associated with preferred stock | | | | | | | | | | | | | | | 700 | | | (700 | ) | | | | | | | | - | |
Balances at June 30, 2007 | | | 10 | | | 10 | | | 19,935 | | | 199 | | | 43,852 | | | (6,357 | ) | | (4,763 | ) | | 2,502 | | | 35,443 | |
| | | | | | | | | | | | | | | | | | | | | | | | | | | | | |
| Net income | | | | | | | | | | | | | | | | | | 4,644 | | | | | | | | | 4,644 | |
Other comprehensive income - (Note 8) | | | | | | | | | | | | | | | | | | | | | | | | (1,727 | ) | | (1,727 | ) |
Comprehensive income | | | | | | | | | | | | | | | | | | | | | | | | | | | 2,917 | |
| | | | | | | | | | | | | | | | | | | | | | | | | | | | | |
| Net issuance of restricted common stock | | | | | | | | | 206 | | | 2 | | | 2,488 | | | - | | | (2,236 | ) | | | | | 254 | |
| Amortization of unearned share-based compensation | | | | | | | | | - | | | - | | | - | | | - | | | 1,850 | | | | | | 1,850 | |
| Preferred stock dividends | | | | | | | | | | | | | | | | | | (230 | ) | | | | | | | | (230 | ) |
| Common stock dividends | | | | | | | | | | | | | | | | | | (504 | ) | | | | | | | | (504 | ) |
| Income tax benefit on dividends paid on unvested shares | | | | | | | | | | | | | | | 13 | | | | | | | | | | | | 13 | |
| Income tax benefit from the vesting of restricted shares | | | | | | | | | | | | | | | 353 | | | | | | | | | | | | 353 | |
Balances at December 31, 2007 (Unaudited) | | | 10 | | $ | 10 | | | 20,141 | | $ | 201 | | $ | 46,706 | | $ | (2,447 | ) | $ | (5,149 | ) | $ | 775 | | $ | 40,096 | |
The accompanying notes are an integral part of these condensed consolidated financial statements.
EPOCH HOLDING CORPORATION AND SUBSIDIARIES
( in thousands)
| | | For the Six Months Ended | |
| | | December 31, | |
| | | 2007 | | 2006 | |
Cash flows from operating activities: | | | | | | | |
| Net income | | $ | 4,644 | | $ | 2,312 | |
| Adjustments to reconcile net income to net cash provided by operating activities: | | | | | | | |
| Deferred income taxes | | | (181 | ) | | - | |
| Share-based compensation | | | 2,104 | | | 2,958 | |
| Depreciation and amortization | | | 211 | | | 190 | |
| Realized gains on investments | | | (3,417 | ) | | (209 | ) |
Dividend income received in stock - (Note 5a) | | | - | | | (2,240 | ) |
| Income tax benefit from payment of dividends on unvested shares | | | (13 | ) | | | |
| Income tax benefit from the vesting of restricted shares | | | (353 | ) | | - | |
| (Increase) decrease in operating assets: | | | | | | | |
| Accounts receivable | | | (203 | ) | | (2,744 | ) |
| Prepaid and other current assets | | | 167 | | | (33 | ) |
| Increase (decrease) in operating liabilities: | | | | | | | |
| Accounts payable and accrued liabilities | | | 11 | | | (882 | ) |
| Accrued compensation and benefits | | | 3,561 | | | 1,508 | |
| Income taxes payable | | | 1,324 | | | - | |
| Deferred rent | | | (43 | ) | | (69 | ) |
Net cash provided by operating activities | | | 7,812 | | | 791 | |
| | | | | | | | |
Cash flows from investing activities: | | | | | | | |
| Purchases and sales of short-term investments, net | | | 21,850 | | | (11,700 | ) |
| Proceeds from sales of marketable securities | | | 4,113 | | | 209 | |
| Investments in Epoch managed funds and products | | | (3,500 | ) | | - | |
| Capital expenditures | | | (56 | ) | | (65 | ) |
| Security deposits, net | | | (13 | ) | | (11 | ) |
| Purchases of other investments | | | (6 | ) | | - | |
Net cash provided by (used in) investing activities | | | 22,388 | | | (11,567 | ) |
| | | | | | | | |
Cash flows from financing activities: | | | | | | | |
| Common stock dividends | | | (504 | ) | | - | |
| Income tax benefit from payment of dividends on unvested shares | | | 13 | | | - | |
| Income tax benefit from the vesting of restricted shares | | | 353 | | | - | |
| Preferred stock dividends | | | (230 | ) | | (69 | ) |
| Proceeds from issuance of Series A convertible preferred stock | | | - | | | 10,000 | |
| Preferred stock issuance costs | | | - | | | (89 | ) |
Net cash (used in) provided by financing activities | | | (368 | ) | | 9,842 | |
| | | | | | | | |
Net increase (decrease) in cash and cash equivalents during period | | | 29,832 | | | (934 | ) |
| Cash and cash equivalents at beginning of period | | | 3,097 | | | 2,445 | |
| Cash and cash equivalents at end of period | | $ | 32,929 | | $ | 1,511 | |
The accompanying notes are an integral part of these condensed consolidated financial statements.
EPOCH HOLDING CORPORATION AND SUBSIDIARIES
FOR THE THREE AND SIX MONTHS ENDED DECEMBER 31, 2007 AND 2006
(Unaudited)
Note 1 - Organization
Business
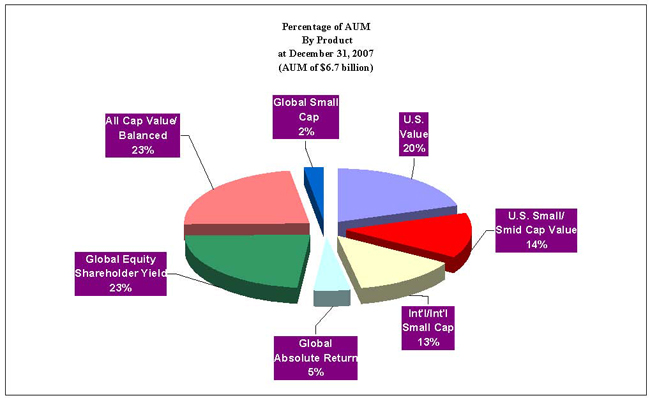
Epoch Holding Corporation ("Epoch" or the "Company"), a Delaware corporation, is a holding company whose sole line of business is investment advisory and investment management services. The operations of the Company are conducted through its wholly-owned subsidiary, Epoch Investment Partners, Inc. ("EIP"). EIP is a registered investment adviser under the Investment Advisers Act of 1940, as amended (the "Investment Advisers Act"). EIP provides investment advisory and investment management services to retirement plans, mutual funds, endowments, foundations and high net worth individuals. Headquartered in New York, NY with an office in Sherman Oaks, CA, the Company's current product offerings include U.S. All Cap Value, U.S. Value, U.S. Smid (small/mid) Cap Value, U.S. Small Cap Value, Global Small Cap, Global Absolute Return, International Small Cap, Balanced Portfolios, Global Equity Shareholder Yield, and Global All Cap.
Business segments
The Company's sole line of business is investment advisory and investment management services. There are no other operating or reportable segments.
Note 2 - Significant Accounting Policies
Basis of presentation
The unaudited condensed consolidated financial statements of the Company included herein have been prepared in accordance with accounting principles generally accepted in the United States of America (“GAAP”), and in accordance with the instructions to Form 10-Q pursuant to the rules and regulations of the Securities and Exchange Commission (“SEC”). In the opinion of management, all adjustments, consisting of normal recurring adjustments, necessary for a fair presentation of the financial condition and interim results of operations have been made. The results for the interim periods are not necessarily indicative of the results to be obtained for a full fiscal year.
The Company's unaudited condensed consolidated financial statements and the related notes should be read together with the consolidated financial statements and the related notes included in the Company's Annual Report on Form 10-K for the fiscal year ended June 30, 2007.
Certain reclassifications have been made to prior period financial statements to conform with the current period presentation.
Principles of consolidation
The accompanying condensed consolidated financial statements include the accounts of the Company and its subsidiaries. All material intercompany accounts and transactions have been eliminated in consolidation.
Use of estimates
The preparation of financial statements in conformity with accounting principles generally accepted in the United States of America requires management to make certain estimates and assumptions. These estimates and assumptions impact the reported amounts of assets and liabilities and disclosure of contingent assets and liabilities as of the dates of these condensed consolidated financial statements and the reported amounts of revenue and expenses during the reporting periods. Actual results could differ from those estimates.
Fair value of financial instruments
The carrying values of the Company's cash and cash equivalents, short-term investments, accounts receivable and accounts payable approximate fair value due to their short-term nature. Marketable securities and other investments are carried at fair value based on quoted market prices.
Financial instruments with concentration of credit risk
The financial instruments that potentially subject the Company to concentrations of credit risk consist principally of cash, cash equivalents, short-term investments, and marketable securities. Epoch invests its cash and cash equivalents with high-credit quality financial institutions in amounts which, at times, may be in excess of the FDIC insurance limits. Cash is also invested in varied high-grade, short-term liquid investments, thereby limiting exposure to concentrations of credit risk.
Cash equivalents
Cash equivalents are liquid investments primarily comprising money market instruments invested in short-term obligations of the U.S. government and its agencies, with maturities of three months or less when acquired. Cash equivalents are stated at cost, which approximates fair value due to their short maturity.
Short-term investments
Short-term investments consist of investment grade auction-rate securities with an active resale market and can be readily converted into cash to fund current operations, or satisfy other cash requirements as needed. Auction-rate securities have an underlying component of a long-term debt instrument. These securities mature on a shorter term than the underlying instrument based on an auction bid that resets the interest rate of the security. The auctions or interest rate reset dates occur at intervals that are generally between 7 and 28 days of the purchase. These securities provide a higher interest rate than similar short-term securities and provide higher liquidity than otherwise longer term investments. These securities are expected to be sold within one year, regardless of their legal maturity date. Accordingly, these securities were classified as current assets at June 30, 2007. All auction rate securities are bought and sold at par value.
During August and September 2007, in response to increasing credit quality concerns present in the fixed income securities market with respect to increasing mortgage defaults and delinquencies, tighter lending conditions, and severely constricted liquidity in the asset-backed commercial paper market, the Company liquidated all of its short-term investments. The proceeds from these liquidations have been invested solely in cash and cash equivalents as of December 31, 2007.
Marketable securities
Marketable securities are classified as available-for-sale and are carried at fair value based upon quoted market prices, with unrealized gains or losses reported in Accumulated Other Comprehensive Income, a separate component of stockholders’ equity. Realized gains and losses on the sales of these securities are calculated based on an average cost basis and reported in the Statement of Operations. These securities are classified as current assets on the Condensed Consolidated Balance Sheets as it is management’s intention to sell these securities within the next twelve months. See Note 5a - “eStara transaction” for further discussion.
Property and equipment
The cost of leasehold improvements are capitalized and such costs are amortized on a straight-line basis over the shorter of their estimated useful lives or lease term, as applicable. All other capital assets are recorded at cost and such costs are depreciated on a straight-line basis over their estimated useful lives. Generally, the useful lives are approximately 3 to 7 years for equipment, 1 to 3 years for purchased software, and 3 to 10 years for leasehold improvements and exclude option periods, if any. Repairs and maintenance are charged to expense as incurred. Upon sale or disposition of property and equipment, the cost and related accumulated depreciation are removed from the accounts and any resulting gain or loss is recognized in operations.
Other investments
During the fiscal year ended June 30, 2007 the Company made an initial investment of $750 thousand split equally into each of the three Company-sponsored mutual funds—the Epoch Global Equity Shareholder Yield Fund (“EPSYX”), the Epoch U.S. All Cap Equity Fund (“EPACX”), and the Epoch International Small Cap Fund (“EPIEX”). The Company also made additional investments of $500 thousand in the Epoch Global Absolute Return Fund, LLC and $3 million in a separate account of Epoch’s Global All-Cap product during the quarter ended December 31, 2007. The investments in the Company-sponsored mutual funds and the separate account of Epoch's Global All-Cap Product are classified as Other investments on the Condensed Consolidated Balance Sheets, are treated as available-for-sale securities, and are carried at fair value based upon quoted market prices. The Company intends to hold these investments for a period in excess of one year from the time of purchase. Any resulting change in market value is recorded as unrealized gain or loss in Accumulated Other Comprehensive Income, a separate component of stockholders’ equity.
EIP is the managing member of the Epoch Global Absolute Return Fund, LLC, a limited partnership whose underlying assets consist of marketable securities. The Company's investment in this partnership is accounted for using the equity method, under which EIP's share of the net earnings or losses from the partnership is reflected in income as earned, and any distributions are reflected as reductions from the investment.
Revenue recognition
Investment advisory and management fees are generally recognized as services are provided, pursuant to specific terms contained in advisory or sub-advisory contracts between EIP and its clients. Such contracts generally call for revenue to be determined as a percentage of assets under management (“AUM”). Generally, fees are billed on a quarterly basis, in arrears, based on the account's asset value at the end of a quarter. Advance payments, if received, are deferred and recognized during the periods for which services are provided.
The Company performs services for mutual funds under advisory and sub-advisory contracts. Fees for these contracts are calculated based upon the daily net asset values of the respective fund. Generally, advisory payments from the mutual funds are received monthly, while sub-advisory payments are received quarterly.
The Company also has certain contracts which contain “incentive clauses” that allow the Company to earn performance fees in the event that investment returns meet or exceed targeted amounts specified in the contracts. Revenues for these incentives are recognized only when such performance targets are met or exceeded at the end of the contract's year, typically at the end of each calendar year - the Company’s second fiscal quarter. Due to the inability to forecast financial markets, no revenues are recognized until the contract year ends, even when investment returns are exceeding the contractual targets within the contract year.
Share-based compensation
Employee and qualifying director share-based payments are accounted for in accordance with Statement of Financial Accounting Standards No. 123 (Revised 2004), Share-Based Compensation (“SFAS 123R”) using the fair value method. The fair value of the Company's restricted stock awards is based on the closing price of the Company's common stock at the grant date. Share-based compensation costs related to equity instruments are charged against income ratably over the fixed vesting period for the related equity instruments, with the initial charge generally recorded in the first full month following the grant. All outstanding stock options were fully vested prior to the adoption of SFAS 123R, accordingly there were no additional compensation costs related to any non-vested stock options required to be recorded at that time. There were no additional stock options issued for all periods presented.
Income taxes
The Company accounts for income taxes in accordance with Statement of Financial Accounting Standard No. 109, Accounting for Income Taxes (“SFAS 109”). SFAS 109 requires that deferred tax assets and liabilities arising from temporary differences between book and tax basis be recognized using the enacted statutory tax rates and laws that will be in effect when such differences are expected to reverse. Deferred tax assets are recognized for temporary differences that will result in deductible amounts in future years. Deferred tax liabilities are recognized for temporary differences that will result in taxable income in future years. In the case of deferred tax assets, SFAS 109 requires a reduction in deferred tax assets if it is more likely than not that some portion or all of the deferred tax asset will not be realized.
Any potential interest and penalties associated with a tax contingency, should one arise, would be included as a component of income tax expense in the period in which the assessment arises.
Earnings per common share
Basic earnings per share (“EPS”) is calculated by dividing net earnings applicable to common shareholders by the weighted average number of common shares outstanding during the period. Diluted EPS includes the determinants of basic EPS and, in addition, reflects the dilutive effect, if any, of common stock deliverable pursuant to the exercise of stock options or common stock issuable upon the conversion of convertible preferred stock.
Comprehensive income
Total comprehensive income is reported on the Condensed Consolidated Statement of Stockholder’s Equity and includes net income (loss) and, for investment securities available-for-sale, the change in unrealized gains (losses) and the reclassification of realized gains (losses) to net income.
Recently issued accounting standards
In June 2006, the FASB issued FASB Interpretation No. 48, Accounting for Uncertainty in Income Taxes—an interpretation of FASB Statement No. 109 (“FIN 48”). FIN 48 clarifies the accounting for income taxes by prescribing the minimum recognition threshold that a tax position must meet to be recognized in the financial statements. FIN 48 also provides guidance on measurement, derecognition, classification, interest and penalties, accounting in interim periods, disclosure and transition. FIN 48 must be implemented for fiscal years beginning after December 15, 2006. The Company adopted FIN 48 at the beginning of its fiscal year commencing July 1, 2007. The adoption of FIN 48 did not have a material effect on the Company's consolidated financial position, results of operations, or cash flows.
In September 2006, the FASB issued SFAS No. 157, Fair Value Measurements (“SFAS 157”). SFAS 157 defines fair value, establishes a framework for measuring fair value and enhances disclosures about fair value measurements required under other accounting pronouncements, but does not change existing guidance as to whether or not an instrument is carried at fair value. SFAS 157 is effective for fiscal years beginning after November 15, 2007, with earlier application permitted. The Company does not expect the adoption of this statement to have a material impact on its consolidated financial position, results of operations, or cash flows.
In February 2007, the FASB issued SFAS No. 159, The Fair Value Option for Financial Assets and Financial Liabilities (“SFAS 159”). SFAS 159 permits certain financial assets and financial liabilities to be measured at fair value, using an instrument-by-instrument election. The initial effect of adopting SFAS 159 must be accounted for as a cumulative effect adjustment to opening retained earnings for the fiscal year of adoption. Retrospective application to fiscal years preceding the effective date is not permitted. SFAS 159 is effective for the Company beginning July 1, 2008, although early adoption is permitted. The Company does not expect the adoption of this statement to have a material impact on its consolidated financial position, results of operations, or cash flows.
In June 2007, the Financial Accounting Standards Board (“FASB”) ratified the consensus reached by the Emerging Issues Task Force (“EITF”) in EITF Issue No. 06-11, “Accounting for Income Tax Benefits of Dividends on Share-Based Payment Awards” (“EITF 06-11”). EITF 06-11 requires that the realized income tax benefit from dividends paid on nonvested equity-classified employee share-based payment awards that are charged to retained earnings be recorded as an increase to additional paid-in capital, rather than a reduction to tax expense. The amount recognized in additional paid-in capital for the realized income tax benefit from dividends on those awards should be included in the pool of excess tax benefits available to absorb tax deficiencies on share-based payment awards. EITF 06-11 applies prospectively to the income tax benefits on dividends paid on unvested common shares, for fiscal years beginning after December 15, 2007, with early adoption permitted. There were no dividends declared or paid on unvested common shares prior to the ratification of EITF 06-11. The Company paid a dividend in November 2007 and has declared a dividend payable in February 2008. The Company is accounting for the tax benefits on all dividends declared on unvested common shares as an increase to additional paid-in capital, in accordance with EITF 06-11. The adoption of this pronouncement did not have a material impact on the Company’s consolidated financial position, results of operations, or cash flows.
Note 3 - Accounts Receivable
The Company's accounts receivable balances do not include an allowance for doubtful accounts for the periods presented and there have been no bad debt expenses recognized during the three and six months ended December 31, 2007 and 2006, respectively. Management believes these receivables are fully collectible.
Significant customers and contracts
For the three months ended December 31, 2007, CI Investments Inc. (“CI”), a Canadian-owned investment management company, accounted for approximately 16% of consolidated revenues, while Genworth Financial Asset Management, Inc. (“Genworth”), an investment adviser, through its investments in the EPIEX and EPSYX funds, as well as separate account mandates, accounted for approximately 26%. The Company's services and relationships with these clients are important to the Company's ongoing growth strategy, and retention of these customers is significant to the ongoing results of operations and liquidity of the Company. For the six months ended December 31, 2007, CI accounted for approximately 17% of consolidated revenues, while Genworth accounted for approximately 27% of consolidated revenues.
For the three months ended December 31, 2006, CI accounted for approxiamately 18% of consolidated revenues, while Genworth accounted for approximately 23%. For the six months ended December 31, 2006, CI accounted for approximately 19% of consolidated revenues, while Genworth accounted for approximately 23%.
Note 4 - Commitments and Contingencies
Employment agreements
The Company entered into a three year employment agreement with its Chief Executive Officer in November 2007, effective January 1, 2008. The agreement calls for a base annual salary of $350 thousand and bonus compensation in accordance with the Company’s bonus and incentive compensation plans then in effect. The agreement was reviewed and approved by the Company's Compensation Committee and the Board of Directors.
Other than as described above there are no employment contracts with any other employees or officers of the Company. There are written agreements with certain employees which provide for sales commissions or bonuses, subject to the attainment of certain performance criteria or continuation of employment. Such commitments under the various agreements total approximately $3.0 million at December 31, 2007. Of this amount, approximately $1.3 million is included in accrued compensation and benefits on the Condensed Consolidated Balance Sheet at December 31, 2007. An additional $0.5 million will be accrued during the remainder of the fiscal year ending June 30, 2008 and shortly thereafter. Approximately $1.2 million represents restricted stock awards to be issued during the remainder of the fiscal year ending June 30, 2008 and shortly thereafter.
Legal matters
From time to time, the Company or its subsidiaries may become parties to claims, legal actions and complaints arising in the ordinary course of business. Management is not aware of any claims which would have a material adverse effect on its consolidated financial statements.
Note 5 - Other Income
a) eStara transaction
During the fiscal year ended June 30, 2000, J Net Enterprises, Inc. (“J Net”), the predecessor company to Epoch, made a $4.0 million investment in eStara, Inc. ("eStara"), a technology-related company that provides conversion and tracking solutions to enhance on-line sales. This investment was comprised of 373,376 shares of Series C-1 and 553,893 shares of Series C-2, respectively, 8% cumulative convertible redeemable preferred stock. As there was no readily available market for the securities and the investment represented less than a 20% interest in eStara, the securities were valued at the Company’s initial cost. During the fiscal years ended June 30, 2001 and 2002, the carrying value of this investment was deemed, by J Net’s management, impaired and written down. During the fiscal year ended June 30, 2003, J Net’s management concluded its ability to recover its investment was remote and wrote down the remaining carrying value to zero. Accordingly, this investment had no carrying value at October 2, 2006. Additionally, no dividends had been paid through October 2, 2006. On October 2, 2006, eStara’s stockholders approved the acquisition of its stock by Art Technology Group, Inc. (NASDAQ ticker symbol “ARTG”). Under the terms of the agreement, ARTG acquired all of the outstanding common stock, preferred stock, and vested and unvested stock options of eStara.
The Company, as a holder of the preferred stock of eStara, received an amount per share equal to the original issue price, plus the amount of any accrued but unpaid cumulative dividends. Additionally, the Company was entitled to its approximately 5% proportionate share of remaining merger consideration. Accordingly, the Company received 2,431,577 common shares of ARTG and $267 thousand in cash. An additional $36 thousand of cash was held in escrow and released to the Company upon the first anniversary of the closing. Additional amounts, up to $150 thousand, may also be realized, pursuant to the earn-out provisions set forth in the merger agreement. The resultant shares held by the Company are currently classified as Marketable Securities on the Condensed Consolidated Balance Sheets in accordance with SFAS No. 115, Accounting for Certain Investments in Debt and Equity Securities. The common shares received from ARTG were subject to a lock-up agreement pursuant to which the shares were released to the Company in equal monthly installments over a period of 12 months, which commenced January 2007. As of December 31, 2007 the lock-up has fully expired.
The Company sold approximately 1.0 million shares of ARTG during the second half of the fiscal year ended June 30, 2007 and continues to sell shares. For the three and six months ended December 31, 2007, the Company sold approximately 0.8 million and 1.2 million shares, respectively, of ARTG and recorded realized gains of approximately $2.1 million and $3.0 million, respectively. These gains were reclassified, in accordance with the provisions of SFAS No. 115, “Accounting for Certain Investments in Debt and Equity Securities,” from Accumulated Other Comprehensive Income, a separate component of stockholders’ equity, to Realized gains on investments on the Condensed Statement of Operations. As of December 31, 2007, the Company had approximately 238 thousand shares of ARTG with a market value of approximately $1.0 million, the value of which is shown as marketable securities on the Condensed Consolidated Balance Sheet.
b) Strategic Data Corporation transaction
During the fiscal year ended June 30, 2000, J Net, the predecessor company to Epoch, made a $1.1 million investment in Strategic Data Corp. ("SDC"), a technology-related company that specializes in advertising optimization technology. This investment was comprised of 892,500 shares of Series B and 1,966,963 shares of Series C, convertible preferred stock. As there was no readily available market for the securities and the investment represented less than a 20% interest in SDC, the securities were valued at the Company’s initial cost. During the fiscal year ended June 30, 2001, the carrying value of this investment was deemed to be impaired by J Net’s management and written down to zero. Accordingly, this investment had no carrying value at February 20, 2007. Additionally, no dividends had been paid through February 20, 2007.
On February 20, 2007, SDC’s stockholders approved the acquisition of its stock by Fox Interactive Media, Inc. (“FIM”). Under the terms of the agreement, FIM acquired all of the outstanding common stock, preferred stock, and vested and unvested stock options of SDC.
As a result of the above-mentioned merger, the Company, as holder of the preferred stock of SDC, received an initial cash payment of approximately $2.2 million on March 22, 2007.
The SDC merger also calls for contingent payments, upon the achievement of certain targets and milestones, payable over a period of approximately 3.5 years from the closing, as well as release of an escrow fund. The Company’s share of additional contingent payments and escrow funds stemming from the acquisition ranges from zero to approximately $15.4 million.
The first target measurement date was November 2007 and the Company became entitled to receive approximately $344 thousand. Such amount has been accrued for and included in Realized gains on investments in the Condensed Consolidated Statement of Operations for the three and six months ended December 31, 2007.
Note 6 - Income taxes
In calculating the provision for income taxes, the Company uses an estimate of the annual effective tax rate based upon the facts and circumstances known at each interim period. On a quarterly basis, the actual effective tax rate is adjusted, as appropriate, based upon changed facts and circumstances, if any, as compared to those forecasted at the beginning of the fiscal year and each interim period thereafter.
Valuation allowance release
The Company reviews its deferred tax asset valuation allowances on a quarterly basis, or whenever events or changes in circumstances indicate that a review is required. In determining the requirement for a valuation allowance, the historical and projected financial results of the legal entity or consolidated group recording the net deferred tax asset is considered, along with any other positive or negative evidence. Since future financial results may differ from previous estimates, periodic adjustments to the Company’s valuation allowances may be necessary.
Based on the Company’s recent annual operating projections and the significant gains realized on sales of marketable securities, the Company concluded that it was more likely than not that the tax benefits from its tax basis on a previously impaired investment would be utilized in the future. As such, in the first quarter, the Company reversed the entire valuation allowance of approximately $1.1 million attributable to this fully valued deferred tax asset, as a credit to income tax expense.
Note 7 – Earnings Per Share
Basic earnings per share is computed by dividing net earnings by the weighted average number of common shares outstanding during the period.
Diluted earnings per share is computed by dividing net earnings, adjusted for the effect of dilutive securities, by the weighted average number of common and common equivalent shares outstanding during the period. The Company had 1,035,000 and 1,130,000 issued and outstanding stock options at December 31, 2007 and 2006, respectively.
For the three and six months ended December 31, 2006, the exercise price of the options was higher than the average market price of the common stock. The conversion of those options would have had an anti-dilutive effect, and thus, were excluded from the diluted earnings per share calculation for the three and six months ended December 31, 2006.
Preferred stock issued on November 7, 2006 and convertible into 1,666,667 shares of common stock has no effect on basic earnings per share, but was included in the calculation of diluted earnings per share for the three and six months ended December 31, 2007 and 2006, respectively. Upon conversion, the issuable shares of common stock will be included in the calculation of both the basic and diluted earnings per share.
The table on the following page sets forth the computation of basic and diluted earnings per share (in thousands, except per share data):
| | | Three Months Ended | | Six Months Ended | |
| | | December 31, | | December 31, | |
| | | 2007 | | 2006 | | 2007 | | 2006 | |
| | | | | | | | | | |
Numerator: | | | | | | | | | |
Net income available to common stockholders: | | | | | | | | | |
| Net income | | $ | 2,547 | | $ | 3,349 | | $ | 4,644 | | $ | 2,312 | |
| Preferred stock dividends | | | (115 | ) | | (69 | ) | | (230 | ) | | (69 | ) |
| Non-cash charge attributable to beneficial conversion feature of preferred stock | | | - | | | (700 | ) | | - | | | (700 | ) |
| | | | | | | | | | | | | | |
| Net income available to common stockholders for basic earnings per share | | | 2,432 | | | 2,580 | | | 4,414 | | | 1,543 | |
| | | | | | | | | | | | | | |
| Effect of dilutive securities: | | | | | | | | | | | | | |
| Preferred stock dividends | | | 115 | | | 69 | | | 230 | | | 69 | |
| | | | | | | | | | | | | | |
| Net income available to common stockholders after assumed conversions | | $ | 2,547 | | $ | 2,649 | | $ | 4,644 | | $ | 1,612 | |
| | | | | | | | | | | | | | |
Denominator: | | | | | | | | | | | | | |
| Average common shares outstanding | | | 20,141 | | | 19,667 | | | 20,096 | | | 19,592 | |
| Effect of dilutive securities: | | | | | | | | | | | | | |
| | | | | | | | | | | | | | |
| Weighted average shares issuable upon conversion of preferred stock | | | 1,667 | | | 996 | | | 1,667 | | | 498 | |
| | | | | | | | | | | | | | |
| Net common stock equivalents for the exercise of in-the-money stock options | | | 41 | | | - | | | 86 | | | - | |
| | | | | | | | | | | | | | |
| Average common and common equivalent shares outstanding - assuming dilution | | | 21,849 | | | 20,663 | | | 21,849 | | | 20,090 | |
| | | | | | | | | | | | | | |
| Basic earnings per share | | $ | 0.12 | | $ | 0.13 | | $ | 0.22 | | $ | 0.08 | |
| | | | | | | | | | | | | | |
| Diluted earnings per share | | $ | 0.12 | | $ | 0.13 | | $ | 0.21 | | $ | 0.08 | |
Note 8 - Comprehensive Income
A summary of comprehensive income is as follows (in thousands):
| | | For the Three Months | | For the Six Months | |
| | | Ended December 31, | | Ended December 31, | |
| | | 2007 | | 2006 | | 2007 | | 2006 | |
| Net income | | $ | 2,547 | | $ | 3,349 | | $ | 4,644 | | $ | 2,312 | |
| | | | | | | | | | | | | | |
| Other comprehensive income: | | | | | | | | | | | | | |
| | | | | | | | | | | | | | |
| Change in unrealized gain on available-for-sale securities | | | 831 | | | 3,536 | | | 1,346 | | | 3,536 | |
| | | | | | | | | | | | | | |
| Reclassification of realized gains to net income | | | (2,207 | ) | | - | | | (3,073 | ) | | - | |
| | | | | | | | | | | | | | |
| Comprehensive income | | $ | 1,171 | | $ | 6,885 | | $ | 2,917 | | $ | 5,848 | |
The total aggregate proceeds from sales of available-for-sale securities were approximately $2.9 million and $4.1 million, respectively, during the three and six months ended December 31, 2007.
Note 9 - Subsequent Events
Dividends
On January 14, 2008, the Company’s Board of Directors declared a quarterly cash dividend on the Company's Common Stock of $0.025 per share payable on February 20, 2008 to stockholders of record at the close of business on February 5, 2008. The total dividend to be paid is approximately $510 thousand.
The Company expects quarterly dividends going forward to be paid in February, May, August and November of each fiscal year, and anticipates a total annual dividend of $0.10 per common share. However, the actual declaration of future cash dividends, and the establishment of record and payment dates, will be subject to final determination by the Board of Directors each quarter after its review of the Company's financial performance.
Share- based compensation
On January 31, 2008 the Company issued 272,733 restricted stock awards to employees of the Company. Recipients of the restricted awards were immediately vested in 12.5% of the total shares received. The remaining 87.5% of unvested shares will vest over the next three years, subject to the recipients remaining as employees of the Company. Issuance of these awards will result in total stock compensation expense of $3.0 million over the vesting period, assuming no forfeitures.
*****
Set forth on the following pages is management's discussion and analysis of our financial condition and results of operations for the three and six months ended December 31, 2007 and 2006. Such information should be read in conjunction with our unaudited condensed consolidated financial statements together with the notes to the unaudited condensed consolidated financial statements. When we use the terms the “Company,” “management,” “we,” “us,” and “our,” we mean Epoch Holding Corporation, a Delaware corporation, and its consolidated subsidiaries.
Forward-Looking Statements
Certain information included, or incorporated by reference in this Quarterly Report on Form 10-Q and other materials filed or to be filed by Epoch Holding Corporation (“Epoch" or the “Company") with the Securities and Exchange Commission (“SEC") contain statements that may be considered forward-looking within the meaning of the Private Securities Litigation Reform Act of 1995. In some cases, you can identify these statements by forward-looking words such as “may," “might," “will," “should," “expect," “plan," “anticipate," “believe," “estimate," “predict," “potential" or “continue," and the negative of these terms and other comparable terminology. These forward-looking statements, which are subject to known and unknown risks, uncertainties and assumptions about the Company, may include projections of the Company's future financial performance based on the Company's growth strategies and anticipated trends in the Company's business. These statements are only predictions based on the Company's current expectations and projections about future events. There are important factors that could cause the Company's actual results, level of activity, performance or achievements to differ materially from the results, level of activity, performance or achievements expressed or implied by the forward-looking statements. In particular, you should consider the risks and uncertainties outlined in “Factors Which May Affect Future Results.”
These risks and uncertainties are not exhaustive. Other sections of this Quarterly Report on Form 10-Q may include additional factors which could adversely impact the Company's business and financial performance. Moreover, the Company operates in a very competitive and rapidly changing environment. New risks and uncertainties emerge from time to time, and it is not possible for the Company's management to predict all risks and uncertainties, nor can the Company assess the impact of all factors on the Company's business or the extent to which any factor, or combination of factors, may cause actual results to differ materially from those contained in any forward-looking statements.
Although the Company believes the expectations reflected in the forward-looking statements are reasonable, the Company cannot guarantee future results, level of activity, performance or achievements. Moreover, neither the Company nor any other person assumes responsibility for the accuracy or completeness of any of these forward-looking statements. You should not rely upon forward-looking statements as predictions of future events. The Company is under no duty to update any of these forward-looking statements after the date of this Quarterly Report on Form 10-Q, nor to conform the Company's prior statements to actual results or revised expectations, and the Company does not intend to do so.
Forward-looking statements include, but are not limited to, statements about the Company’s:
| · | business strategies and investment policies, |
| | possible or assumed future results of operations and operating cash flows, |
| · | financing plans and the availability of short-term borrowing, |
| · | potential growth opportunities, |
| · | recruitment and retention of the Company's key employees, |
| · | potential operating performance, achievements, productivity improvements, efficiency and cost reduction efforts, |
| · | likelihood of success and impact of litigation, |
| · | expectations with respect to the economy, securities markets, the market for mergers and acquisitions activity, the market for asset management activity and other industry trends, |
| · | effect from the impact of future legislation and regulation on the Company. |
Available Information
Reports the Company files electronically with the SEC via the SEC’s Electronic Data Gathering, Analysis and Retrieval system (“EDGAR”) may be accessed through the internet. The SEC maintains an internet site that contains reports, proxy and information statements, and other information regarding issuers that file electronically with the SEC, at www.sec.gov.
The Company maintains a website which contains current information on operations and other matters. The website address is www.eipny.com. Through the Investor Relations section of our website, and “Link to SEC Website” therein, we make available, free of charge, our Proxy Statement, Annual Report on Form 10-K, Quarterly Reports on Form 10-Q, Current Reports on Form 8-K, and any amendments to those reports filed or furnished pursuant to Section 13(a) or 15(d) of the Securities Exchange Act of 1934, as amended (the “Exchange Act”) as soon as reasonably practicable after we electronically file such material with, or furnish it to, the SEC.
Also available free of charge on our website within the Investors Relations section is our code of ethics and business conduct and charters for the Audit, Nominating/Corporate Governance, and the Compensation committees of our board of directors.
Factors Which May Affect Future Results
There are numerous risks which may affect the results of operations of the Company. Factors which could affect the Company's success include, but are not limited to, the Company's limited operating history in the investment advisory and investment management business, the ability to attract and retain clients, performance of the financial markets and invested assets managed by the Company, retention of key employees, misappropriation of assets and information by employees, system failures, significant changes in regulations, the costs of compliance associated with existing regulations and the penalties associated with non-compliance, and the risks associated with loss of key members of the management team.
In addition, the Company's ability to expand or alter its product offerings, whether through acquisitions or internal development is critical to its long-term success and has inherent risks. This success is dependent on the ability to identify and fund those products or acquisitions on terms which are favorable to the Company. There can be no assurance that any of these operating factors or acquisitions can be achieved or, if undertaken, they will be successful.
These and other risks related to our Company are discussed in greater detail under Part I, Item 1A. “Risk Factors” in the Company's Annual Report on Form 10-K for the fiscal year ended June 30, 2007.
Overview
Epoch Holding Corporation ("Epoch" or the "Company") is a holding company whose sole line of business is investment advisory and investment management services. The operations of the Company are conducted through its wholly-owned subsidiary, Epoch Investment Partners, Inc. ("EIP"). EIP is a registered investment adviser under the Investment Advisers Act of 1940, as amended (the "Investment Advisers Act").
Critical Accounting Policies and Critical Accounting Estimates
Our significant accounting policies are described in Note 2 of the Notes to the Consolidated Financial Statements included in our Annual Report on Form 10-K for the fiscal year ended June 30, 2007. A discussion of critical accounting policies is included in Management's Discussion and Analysis of Financial Condition and Results of Operations in our Annual Report on Form 10-K for the fiscal year ended June 30, 2007.
Financial Highlights
For the quarter ended December 31, 2007, the Company continued to achieve positive operating leverage, which is defined as the total revenue growth rate that exceeds the rate of growth of expenses. Total operating revenue increased by 43% from $6.1 million to $8.7 million, while total operating expenses increased by 17%. For the six months ended December 31, 2007, operating revenue increased by 59% from $10.4 million to $16.6 million, while total operating expenses increased by 25%. Operating margins continue to improve as the Company achieved operating profits of $1.1 million and $1.4 million for the three and six months ended December 31, 2007, respectively. The main driver of this positive trend has been the significant increase in assets under management (“AUM”), stemming from continued inflows, together with market appreciation. The Company finished the quarter ended December 31, 2007 with AUM of $6.7 billion, a 52% increase from AUM of $4.4 billion a year ago.
While operating income increased by $1.5 million from the same quarter a year ago, the Company recorded a reduction in net income of $0.8 million. The reduction in net income was primarily the result of a decrease in Other Income coupled with an increase in the provision for income taxes. The prior year tax provision was reduced significantly by the tax benefit of the utilization of net operating loss carryfowards. Basic earnings per share were $0.12 per share for the quarter ended December 31, 2007, down $0.01 from the same period a year ago.
For the six months ended December 31, 2007 the Company’s net income doubled, an increase of $2.3 million compared with the same period a year ago. The increase was primarily the result of a significant increase in management fees due to higher AUM levels. Basic earnings per share were $0.22 per share for the six months ended December 31, 2007, up $0.14 from the same period a year ago.
Business Environment
As an investment management and advisory firm, our results of operations can be directly impacted by global market, political, and economic trends. A favorable business environment can be depicted by several factors, including strong business profitability, robust investor confidence, low unemployment, and financial market transparency. These factors can directly affect capital appreciation, which in turn, impacts our investment advisory and management business.
The global market environment during the quarter ended December 31, 2007 experienced a negative trend, and ended the quarter weaker than it had begun. Worries about the U.S. economy, along with concerns about credit quality, continued to increase while energy prices moved higher. These factors led to a weaker stock market that lasted through the quarter. For the quarter ended December 31, 2007, assuming dividend reinvestment, the NASDAQ Composite Index decreased by 1.6%, while the Dow Jones Industrial Average and S&P 500 Index decreased by 3.9% and 3.3%, respectively. The global market environment was also volatile, driven by increasing concerns of economic slowdowns both in the U.S. and internationally, while a significantly weaker U.S. dollar helped returns of foreign equities in U.S. dollars terms. On a broad basis, developed global markets, as represented by the MSCI World Index, decreased by 2.4 % for the quarter.
For the six months ended December 31, 2007, the NASDAQ Composite Index increased by 2.3% and the Dow Jones Industrial Average increased by 0.1%, while the S&P 500 Index decreased by 1.4%. On a broad basis, developed global markets, as represented by the MSCI World Index, decreased by 0.1%.
In light of the weaker market conditions noted above, market depreciation negatively impacted AUM by $73 million during the three months ended December 31, 2007. Continued weakness in markets may further negatively impact AUM.
The following table sets forth the changes in our assets under management for the periods presented:
Assets Under Management and Flows (in millions)
| | | Three Months Ended | |
| | | December 31, | |
| | | 2007 | | 2006 | |
| | | | | | |
| Beginning of period assets | | $ | 6,426 | | $ | 3,847 | |
| Net Inflows/(Outflows) | | | 329 | | | 258 | |
| Market (Depreciation)/ Appreciation | | | (73 | ) | | 303 | |
| | | | | | | | |
| End of period assets | | $ | 6,682 | | $ | 4,408 | |
| | | Six Months Ended | |
| | | December 31, | |
| | | 2007 | | 2006 | |
| | | | | | |
| Beginning of period assets | | $ | 6,001 | | $ | 3,253 | |
| Net Inflows/(Outflows) | | | 600 | | | 692 | |
| Market Appreciation | | | 81 | | | 463 | |
| | | | | | | | |
| End of period assets | | $ | 6,682 | | $ | 4,408 | |
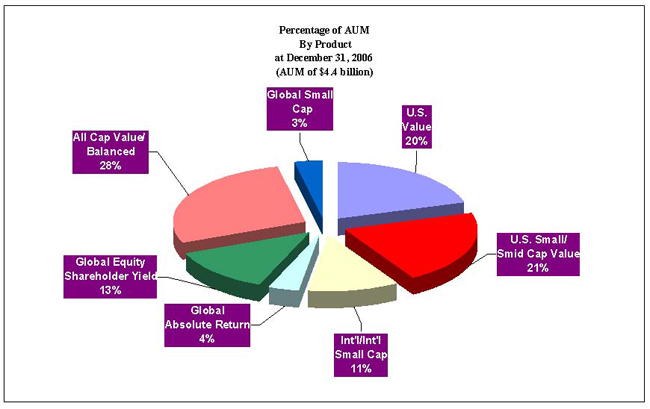
The following charts show the Company's products as a percentage of AUM as of December 31, 2007 and 2006, respectively:
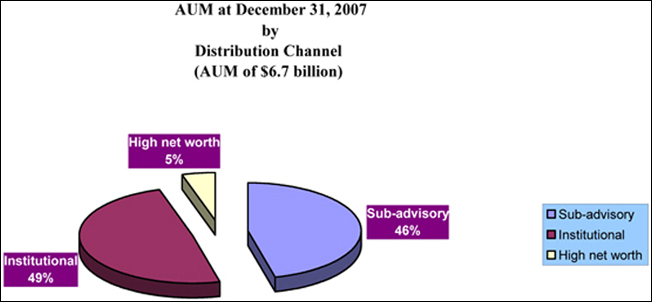
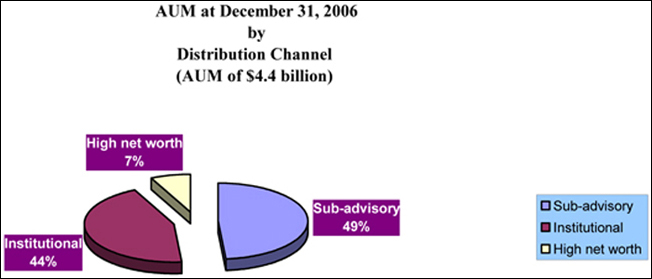
The table and charts that follow set forth the amount of AUM by distribution channel:
Assets Under Management By Distribution Channel | |
(dollars in millions) | |
| | | As of December 31, | | Amount Increased | | | |
| | | 2007 | | 2006 | | | | | |
Distribution Channel: | | | | | | | | | | | | | |
| | | | | | | | | | | | | | |
| Institutional | | $ | 3,285 | | $ | 1,940 | | $ | 1,345 | | | 69 | % |
| Sub-advisory | | | 3,081 | | | 2,146 | | | 935 | | | 44 | % |
| High net worth | | | 316 | | | 322 | | | (6 | ) | | (2 | %) |
| | | | | | | | | | | | | | |
| Total AUM | | $ | 6,682 | | $ | 4,408 | | $ | 2,274 | | | 52 | % |
Results of operations - three months ended December 31, 2007 and 2006
| | | | | | | Change | |
(Dollars in thousands) | | 2007 | | 2006 | | $ | | % | |
Revenues | | | | | | | | | | | | | |
Investment advisory and management fees | | $ | 8,551 | | $ | 5,141 | | $ | 3,410 | | | 66 | % |
Performance fees | | | 172 | | | 971 | | | (799 | ) | | (82 | %) |
Total operating revenues | | $ | 8,723 | | $ | 6,112 | | $ | 2,611 | | | 43 | % |
Total revenues from investment advisory and investment management services for the three months ended December 31, 2007 were $8.7 million, increasing approximately 43% from $6.1 million for the same period a year ago. This increase was attributable to the increase in assets under management from new customers, as well as market appreciation since the preceding year. Partially offsetting this increase was a reduction in performance fees of $0.8 million, stemming from reduced overall market returns in calendar year 2007 compared to calendar year 2006.
For the three months ended December 31, 2007, CI accounted for approximately 16% of revenues, while Genworth Financial Asset Management, Inc. (“Genworth”), an investment adviser, through its investments in the Epoch International Small Cap Fund (“EPIEX”) and the Epoch Global Equity Shareholder Yield Fund (“EPSYX”), as well as separate account mandates, accounted for approximately 26% of revenues.
For the three months ended December 31, 2006, CI accounted for approximately 18% of consolidated revenues, while Genworth accounted for approximately 23% of consolidated revenues.
| | | | | | | Change | |
(Dollars in thousands) | | 2007 | | 2006 | | $ | | % | |
Employee related costs (excluding share- based compensation) | | $ | 4,563 | | $ | 3,637 | | $ | 926 | | | 25 | % |
Expenses in this category include salaries, benefits, severance, incentive compensation, signing bonuses and commission expenses. For the three months ended December 31, 2007, these expenses were $4.6 million, an increase of $0.9 million, or 25%, from $3.6 million for the three months ended December 31, 2006. Increased headcount, including the addition of several senior experienced professionals to support the growth and expansion of the business, as well as higher incentive compensation levels, were the primary reasons for this increase. We expect the level of overall employee related costs to increase in future periods due to changes in staffing levels to support the growth and expansion of our business.
| | | | | | | Change | |
(Dollars in thousands) | | 2007 | | 2006 | | $ | | % | |
Share-based compensation | | $ | 1,029 | | $ | 1,371 | | $ | (342 | ) | | (25 | %) |
The Company believes that share-based compensation promotes unity in the workplace and a common objective with shareholders. Employee share-based compensation expense is recognized as follows: 12.5% immediately, and the remaining 87.5% ratably over the three-year vesting period of those awards.
Share-based compensation for the three months ended December 31, 2007 decreased by $0.3 million, or 25%, from $1.4 million for the three months ended December 31, 2006. Amortization of the shares issued to employee owners in connection with the acquisition of EIP in June 2004, which equaled approximately $0.8 million per quarter, was completed as of June 30, 2007. This reduction was partially offset by amortization of new stock awards.
In the three months ended December 31, 2007 and 2006, a total of 18,761 and 0 shares of restricted stock, respectively, were issued to employees. A total of 2,345 shares of the awards issued in the three months ended December 31, 2007, or approximately 12.5%, were immediately vested. The remaining 87.5% of the shares vest ratably over the subsequent three years. During the three months ended December 31, 2007 and 2006, a total of 0 and 9,369 shares, respectively, were forfeited by terminated employees.
For the current fiscal year non-employee directors receive $80,000 per year for their services. Non-employee director compensation is to be paid either fully in stock or a combination of a minimum of $60,000 in stock and a maximum of $20,000 in cash, at the election of the director. For the prior fiscal year non-employee directors received $50,000 for their services, payable fully in stock.
During the three months ended December 31, 2007 and December 31, 2006, no shares were granted to directors of the Company. Shares issued to directors through June 30, 2006 are subject to a three-year vesting period and vest one-third each year, or immediately in the event of death or disability. All director stock awards issued after June 30, 2006 will vest over one year. Share-based compensation expense is recognized ratably over the respective vesting period, in accordance with their underlying vesting provisions.
We expect share-based compensation costs will be lower than previous year levels as a result of the fully amortized employee owners’ shares noted above.
| | | | | | | Change | |
(Dollars in thousands) | | 2007 | | 2006 | | $ | | % | |
General, administrative and occupancy | | $ | 1,342 | | $ | 866 | | $ | 476 | | | 55 | % |
These expenses consist primarily of office rents, as well as expenses for travel and entertainment, advertising and marketing, information technology, utilities, insurance, and other office related expenses. For the three months ended December 31, 2007, such expenses were $1.3 million, an increase of $0.5 million from the comparable period a year ago. Increases in costs from travel-related expenses to support distribution efforts of new business relationships, higher market data services and information technology costs as a result of increased business activity levels, as well as increased rent expense for the additional space leased at the Company’s headquarters beginning in February 2007 were the main reasons for the rise in general, administrative and occupancy costs.
| | | | | | | Change | |
(Dollars in thousands) | | 2007 | | 2006 | | $ | | % | |
Professional fees and services | | $ | 582 | | $ | 548 | | $ | 34 | | | 6 | % |
These expenses consist primarily of outside legal fees for general corporate legal affairs, independent accountants' fees, consulting fees, and other professional services. For the three months ended December 31, 2007, such fees were virtually unchanged.
| | | | | | | Change | |
(Dollars in thousands) | | 2007 | | 2006 | | $ | | % | |
Other income | | $ | 3,096 | | $ | 3,854 | | $ | (758 | ) | | (20 | %) |
Other income includes interest income, dividend income, realized gains on investments, and rental income from subleased office space in New York. For the three months ended December 31, 2007, other income was $3.1 million, a decrease of $0.8 million from the three months ended December 31, 2006. The current quarter primarily includes realized gains from the sales of marketable securities. The comparable period a year ago includes dividend income and realized gains from the eStara transaction, along with the reversal of a previously recorded estimate, which was included in Interest and other income.
| | | | | | | Change | |
(Dollars in thousands) | | 2007 | | 2006 | | $ | | % | |
Provision for income taxes | | $ | 1,649 | | $ | 99 | | $ | 1,550 | | | 1566 | % |
For the three months ended December 31, 2007, the Company used an estimated annual effective income tax rate based upon facts and circumstances known at the end of the interim period. On a quarterly basis, the estimated effective tax rate is adjusted, as appropriate, based upon changed facts and circumstances, if any, as compared to those forecasted at the beginning of the fiscal year and each interim period thereafter.
The Company was not subject to regular income tax rates in the prior year because of its net operating loss carry forwards but was obligated to pay tax under the federal alternative minimum tax (“AMT”), which limits the application of net operating loss carry forwards to 90% of taxable income, in addition to certain AMT adjustments. The Company is subject to regular income tax rates in the current year, as the remaining net operating losses available to be utilized by the Company are subject to annual limitations, and are less, in the aggregate, than were available in the prior year.
Results of operations - six months ended December 31, 2007 and 2006
For the six months ended December 31, 2007, the Company recorded net income of $4.6 million, compared to $2.3 million for the same period a year ago. Basic earnings per share were $0.22 per share for the six month period ended December 31, 2007, from $0.08 per share for the same period a year ago.
The primary reasons for the improvement in earnings were the following:
| · | Total operating revenues increased approximately 59%, to $16.6 million from $10.4 million as a result of the significant increase in AUM as previously discussed. |
| | |
| · | Share-based compensation decreased by $0.9 million for the six months ended December 31, 2007 when compared with the same period a year ago. Amortization of the shares issued to employee owners in connection with the acquisition of EIP in June 2004, which equaled approximately $0.8 million per quarter, was completed as of June 30, 2007. This reduction was partially offset by amortization of new stock awards. |
| | |
| · | Other income increased by $0.4 million, which includes realized gains from the sales of marketable securities. |
| | |
| · | The Company released a valuation allowance during the first quarter ended September 30, 2007 of approximately $1.1 million against a deferred tax asset, the benefit of which is expected to be realized during the current fiscal year. |
| | | | | | | Change | |
(Dollars in thousands) | | 2007 | | 2006 | | $ | | % | |
Revenues | | | | | | | | | | | | | |
Investment advisory and management fees | | $ | 16,428 | | $ | 9,460 | | $ | 6,968 | | | 74 | % |
Performance fees | | | 172 | | | 971 | | | (799 | ) | | (82 | )% |
| | | | | | | | | | | | | | |
Total operating revenues | | $ | 16,600 | | $ | 10,431 | | $ | 6,169 | | | 59 | % |
Total revenues from investment advisory and investment management services for the six months ended December 31, 2007 were $16.6 million, increasing approximately 59%, from $10.4 million, for the same period a year ago. This increase was attributable to the increase in assets under management from new customers, as well as market appreciation since the preceding year.
For the six months ended December 31, 2007, CI accounted for approximately 17% of revenues, while Genworth Financial Asset Management, Inc. (“Genworth”), an investment adviser, through its investments in the Epoch International Small Cap Fund (“EPIEX”) and the Epoch Global Equity Shareholder Yield Fund (“EPSYX”), as well as separate account mandates, accounted for approximately 27% of revenues.
For the six months ended December 31, 2006, CI accounted for approximately 19% of consolidated revenues, while Genworth accounted for approximately 23% of consolidated revenues.
| | | | | | | Change | |
(Dollars in thousands) | | 2007 | | 2006 | | $ | | % | |
Employee related costs (excluding share-based compensation) | | $ | 8,812 | | $ | 6,473 | | $ | 2,339 | | | 36 | % |
For the six months ended December 31, 2007, these expenses were $8.8 million, an increase of $2.3 million, or 36%, from $6.5 million for the six months ended December 31, 2006. Increased headcount, including the addition of several senior experienced professionals to support the growth and expansion of the business, as well as higher incentive compensation levels, were the primary reasons for this increase. We expect the level of overall employee related costs to increase in future periods due to changes in staffing levels to support the growth and expansion of our business.
| | | | | | | Change | |
(Dollars in thousands) | | 2007 | | 2006 | | $ | | % | |
Share-based compensation | | $ | 2,104 | | $ | 2,958 | | $ | (854 | ) | | (29 | )% |
Share-based compensation for the six months ended December 31, 2007 decreased by $0.9 million, or 29% from $3.0 million for the six months ended December 31, 2006. Amortization of the shares issued to employee owners in connection with the acquisition of EIP in June 2004, which equaled approximately $0.8 million per quarter, was completed as of June 30, 2007. This reduction was partially offset by amortization of new stock awards.
In the six months ended December 31, 2007 and 2006, a total of 171,434 and 460,658 shares of restricted stock, respectively, were issued to employees. A total of 21,430 and 57,582 shares of the awards issued in the six months ended December 31, 2007 and 2006, respectively, or approximately 12.5%, were immediately vested. The remaining 87.5% of the shares vest ratably over the subsequent three years. During the six months ended December 31, 2007 and 2006, a total of 1,449 and 18,318 shares, respectively, were forfeited by terminated employees.
For the current fiscal year non-employee directors receive $80,000 per year for their services. Non-employee director compensation is to be paid either fully in stock or a combination of a minimum of $60,000 in stock and a maximum of $20,000 in cash, at the election of the director. For the prior fiscal year non-employee directors received $50,000 for their services, payable fully in stock.
During the six months ended December 31, 2007 and December 31, 2006, a total of 35,604 and 66,228 shares, respectively, were granted to directors of the Company. Shares issued to directors' after June 30, 2006 vest over one year. Shares issued to directors through June 30, 2006 are subject to a three-year vesting period and vest one-third each year, or immediately in the event of death or disability. Share-based compensation expense is recognized ratably over the respective vesting period, in accordance with their underlying vesting provisions.
We expect share-based compensation costs will be lower than previous year levels as a result of the fully amortized employee owners’ shares noted above.
| | | | | | | Change | |
(Dollars in thousands) | | 2007 | | 2006 | | $ | | % | |
General, administrative and occupancy | | $ | 2,726 | | $ | 1,646 | | $ | 1,080 | | | 66 | % |
For the six months ended December 31, 2007, such expenses were $2.7 million, an increase of $1.1 million from the comparable period a year ago. Increases in costs from travel-related expenses to support distribution efforts of new business relationships, higher market data services and information technology costs as a result of increased business activity levels, as well as increased rent expense from the additional space leased at the Company’s headquarters beginning in February 2007 were the main reasons for the rise in general, administrative and occupancy costs.
| | | | | | | Change | |
(Dollars in thousands) | | 2007 | | 2006 | | $ | | % | |
Professional fees and services | | $ | 1,339 | | $ | 853 | | $ | 486 | | | 57 | % |
For the six months ended December 31, 2007, such fees were $1.3 million, an increase of $0.5 million from the comparable period a year ago. The primary reasons for this increase were higher consulting expenses and audit fees in connection with compliance with Section 404 of the Sarbanes Oxley Act of 2002 (“SOX”), and increased legal fees in conjunction with our continued business expansion.
| | | | | | | Change | |
(Dollars in thousands) | | 2007 | | 2006 | | $ | | % | |
Other income | | $ | 4,479 | | $ | 4,100 | | $ | 379 | | | 9 | % |
For the six months ended December 31, 2007, other income increased to $4.5 million, an increase of $0.4 million from the six months ended December 31, 2006. The primary reason for this increase was the result of realized gains from the sales of marketable securities during the six months ended December 31, 2007. Other income in the previous year primarily included dividend income and realized gains from the eStara transaction.
| | | | | | | Change | |
(Dollars in thousands) | | 2007 | | 2006 | | $ | | % | |
Provision for income taxes | | $ | 1,243 | | $ | 99 | | $ | 1,144 | | | 1156 | % |
For the six months ended December 31, 2007, the Company used an estimated annual effective income tax rate based upon facts and circumstances known at the end of the interim period. On a quarterly basis, the estimated effective tax rate is adjusted, as appropriate, based upon changed facts and circumstances, if any, as compared to those forecasted at the beginning of the fiscal year and each interim period thereafter. The Company’s provision for income taxes for the six months ended December 31, 2007 has been reduced for the release of a valuation allowance of approximately $1.1 million against a previously impaired investment during the quarter ended September 30, 2007.
The Company was not subject to regular income tax rates in the prior year because of its net operating loss carry forwards but was obligated to pay tax under the federal alternative minimum tax (“AMT”), which limits the application of net operating loss carry forwards to 90% of taxable income, in addition to certain AMT adjustments. The Company is subject to regular income tax rates in the current year, as the remaining net operating losses available to be utilized by the Company are subject to annual limitations, and are less, in the aggregate, than were available in the prior year.
Liquidity and Capital Resources
A summary of cash flow data, together with short-term investments for the six months ended December 31, 2007 and 2006, respectively, is as follows (in thousands):
| | | December 31, | |
| | | 2007 | | 2006 | |
| Cash flows provided by (used in): | | | | | | | |
| Operating activities | | $ | 7,812 | | $ | 791 | |
| Investing activities | | | 22,388 | | | (11,567 | ) |
| Financing activities | | | (368 | ) | | 9,842 | |
| Net increase (decrease) in cash and cash equivalents | | | 29,832 | | | (934 | ) |
| Cash and cash equivalents at beginning of year | | | 3,097 | | | 2,445 | |
| | | | | | | | |
| Cash and cash equivalents at end of the period | | | 32,929 | | | 1,511 | |
| | | | | | | | |
| Short-term investments | | | - | | | 17,100 | |
| | | | | | | | |
| Cash, cash equivalents and short-term investments at end of period | | $ | 32,929 | | $ | 18,611 | |
Short-term investments consist of investment grade auction-rate securities with an active resale market and can be readily converted into cash to fund current operations, or satisfy other cash requirements as needed. Auction-rate securities have an underlying component of a long-term debt instrument. These securities mature on a shorter term than the underlying instrument based on an auction bid that resets the interest rate of the security. The auction or reset dates occur at intervals that are generally between 7 and 28 days of the purchase. These securities provide a higher interest rate than similar short-term securities and provide higher liquidity than otherwise longer term investments. These securities are expected to be sold within one year, regardless of their legal maturity date. Accordingly these securities have been classified as current assets in the Condensed Consolidated Balance Sheet. All auction rate securities are bought and sold at par value.
During August and September 2007, in response to increasing credit quality concerns present in the fixed income securities market such as increasing mortgage defaults and delinquencies, tighter lending conditions, and severely constricted liquidity in the asset-backed commercial paper market, the Company liquidated all of its short-term investments. The $21.9 million of proceeds from these liquidations were invested solely in cash and cash equivalents on the Condensed Consolidated Balance Sheet as of December 31, 2007.
Sources of funds for the Company's operations are derived from investment advisory and investment management fees, interest on the Company's cash, cash equivalents, and short-term investments, and sublease income. As of December 31, 2007, the Company had $32.9 million of cash and cash equivalents and $6.5 million of accounts receivable to fund its business growth strategy.
At December 31, 2007, accounts payable and accrued liabilities, which consist of accrued professional fees, trade payables and other liabilities, were $0.9 million. Accrued compensation and benefits, which consist primarily of accrued employee bonuses and sales commissions, were $5.4 million. There was no debt and management does not foresee any reason to incur debt unless a significant business opportunity warrants such action.
The Company's business does not require it to maintain significant capital balances. The Company's current financial condition is highly liquid, with cash and cash equivalents comprising approximately 68% of its total assets at December 31, 2007.
The Company expects to continue to increase staff to support the growth and expansion of its business and the related distribution efforts for its products. Management believes the existing cash and cash equivalents are adequate to provide the necessary resources to meet its operating needs for the foreseeable future as well as to implement its growth objectives.
Preferred Stock Dividends
As a result of the November 7, 2006 preferred stock issuance, the Company began paying semi-annual dividends on newly issued Series A Convertible Preferred Stock on December 31 and June 30 of each year. The semi-annual dividend payments are approximately $230 thousand, each June and December.
Common Stock Dividends
On October 9, 2007, the Company’s Board of Directors declared a quarterly cash dividend on the Company's Common Stock of $0.025 per share payable on November 15, 2007 to stockholders of record at the close of business on October 31, 2007. The total dividend paid was approximately $504 thousand.
On January 14, 2008, the Company’s Board of Directors declared a quarterly cash dividend on the Company's Common Stock of $0.025 per share payable on February 20, 2008 to stockholders of record at the close of business on February 5, 2008. The total dividend to be paid is approximately $510 thousand.
The Company expects quarterly dividends going forward to be paid in February, May, August and November of each fiscal year, and anticipates a total annual dividend of $0.10 per common share. However, the actual declaration of future cash dividends, and the establishment of record and payment dates, will be subject to final determination by the Board of Directors each quarter after its review of the Company's financial performance.
Working Capital
The Company's working capital and current ratio (current assets divided by current liabilities) for the six months ended December 31, 2007 and recent fiscal year ended June 30, 2007 is set forth in the table below (in thousands ):
| | | December 31, | | June 30, | | Increase | | Percent | |
| | | 2007 | | 2007 | | (Decrease) | | Change | |
| | | | | | | | | | |
| Current Assets | | $ | 41,284 | | $ | 35,495 | | $ | 5,789 | | | 16 | % |
| Current Liabilities | | | 7,340 | | | 2,810 | | | 4,530 | | | 161 | % |
| | | | | | | | | | | | | | |
| Working Capital | | $ | 33,944 | | $ | 32,685 | | $ | 1,259 | | | 4 | % |
| | | | | | | | | | | | | | |
| Current Ratio | | | 5.62 | | | 12.63 | | | (7.01 | ) | | (55 | %) |
Current Assets
Current assets increased $5.8 million at December 31, 2007 compared with June 30, 2007 primarily attributable to increases in cash and cash equivalents as a result of business expansion and the resultant revenue increases, along with proceeds from sales of marketable securities.
Current Liabilities
Current liabilities increased by $4.5 million at December 31, 2007 compared with June 30, 2007 primarily as a result of the increase in accrued incentive compensation and benefits coupled with an increase in income taxes payable.
Contractual Obligations
The Company's primary headquarters and operations are located in New York, New York. Business is conducted at a location with approximately 10,000 square feet under a long-term lease that expires in September 2015. The Company entered into a sublease agreement for an additional 3,100 square feet at its Company headquarters effective February 1, 2007.
The Company is also the primary party to another lease in New York, New York which expires in December 2010. This property is subleased to an unrelated third party. While the Company remains responsible for obligations under the lease, the sublease income, net of profit sharing with the landlord, more than offsets the Company's obligations under this lease. The subtenant has performed its obligations under the sublease agreement and the Company is not aware of any credit issues with the subtenant. As of December 31, 2007, the remaining future minimum payments under this lease total $1.4 million. Future minimum receipts from the subtenant, net of profit sharing with the landlord, total $1.5 million as of December 31, 2007.
The Company also has an office lease in Sherman Oaks, California with an annual option to renew. The obligations under this lease are minimal.
As previously disclosed in the Company’s Current Report on form 8-K dated November 28, 2007, the Company entered into a three year employment agreement with its Chief Executive Officer, effective January 1, 2008. The agreement calls for a base annual salary of $350 thousand and bonus compensation in accordance with the Company’s bonus and incentive compensation plans then in effect. The agreement was reviewed and approved by the Company's Compensation Committee and the Board of Directors.
Summary of Contractual Obligations
The following table summarizes all contractual obligations, including the aforementioned office leases (in thousands):
| | | Remaining | | Payments Due in | |
| | | Payments in | | Fiscal Years Ended June 30, | |
| | | | | 2009 - | | 2011 - | | 2013 and | | | |
| | | 2008 | | 2010 | | 2012 | | thereafter | | Total | |
| | | | | | | | | | | | |
| Primary New York operations | | $ | 488 | | $ | 1,952 | | $ | 1,421 | | $ | 2,330 | | $ | 6,191 | |
| Subleased New York lease | | | 240 | | | 961 | | | 200 | | | - | | | 1,401 | |
| Other office locations | | | 14 | | | 5 | | | - | | | - | | | 19 | |
| Other operating leases | | | 20 | | | 74 | | | - | | | - | | | 94 | |
| | | | | | | | | | | | | | | | | |
| Total obligations | | | 762 | | | 2,992 | | | 1,621 | | | 2,330 | | | 7,705 | |
| | | | | | | | | | | | | | | | | |
| Sublease income | | | (287 | ) | | (1,148 | ) | | (95 | ) | | - | | | (1,530 | ) |
| | | | | | | | | | | | | | | | | |
| Net obligations | | $ | 475 | | $ | 1,844 | | $ | 1,526 | | $ | 2,330 | | $ | 6,175 | |
Off-Balance Sheet Arrangements
As of December 31, 2007 the Company had no off-balance sheet arrangements.
Significant Transactions
eStara transaction
During the fiscal year ended June 30, 2000, J Net Enterprises, Inc. (“J Net”), the predecessor company to Epoch, made a $4.0 million investment in eStara, Inc. ("eStara"), a technology-related company that provides conversion and tracking solutions to enhance on-line sales. This investment was comprised of 373,376 shares of Series C-1 and 553,893 shares of Series C-2, respectively, 8% cumulative convertible redeemable preferred stock. As there was no readily available market for the securities and the investment represented less than a 20% interest in eStara, the securities were valued at the Company’s initial cost. During the fiscal years ended June 30, 2001 and 2002, the carrying value of this investment was deemed, by J Net’s management, impaired and written down. During the fiscal year ended June 30, 2003, J Net’s management concluded its ability to recover its investment was remote and wrote down the remaining carrying value to zero. Accordingly, this investment had no carrying value at October 2, 2006. Additionally, no dividends had been paid through October 2, 2006. On October 2, 2006, eStara’s stockholders approved the acquisition of its stock by Art Technology Group, Inc. (NASDAQ ticker symbol “ARTG”). Under the terms of the agreement, ARTG acquired all of the outstanding common stock, preferred stock, and vested and unvested stock options of eStara.
The Company, as a holder of the preferred stock of eStara, received an amount per share equal to the original issue price, plus the amount of any accrued but unpaid cumulative dividends. Additionally, the Company was entitled to its approximately 5% proportionate share of remaining merger consideration. Accordingly, the Company received 2,431,577 common shares of ARTG and $267 thousand in cash. An additional $36 thousand of cash was held in escrow and released to the Company upon the first anniversary of the closing. Additional amounts, up to $150 thousand, may also be realized, pursuant to the earn-out provisions set forth in the merger agreement. The resultant shares held by the Company are currently classified as Marketable securities on the Condensed Consolidated Balance Sheets in accordance with SFAS No. 115, Accounting for Certain Investments in Debt and Equity Securities. The common shares received from ARTG were subject to a lock-up agreement pursuant to which the shares were released to the Company in equal monthly installments over a period of 12 months, which commenced January 2007. As of December 31, 2007 the lock-up has fully expired.
The Company sold approximately 1.0 million shares of ARTG during the second half of the fiscal year ended June 30, 2007 and continues to sell shares. For the three and six months ended December 31, 2007, the Company sold approximately 0.8 million and 1.2 million shares, respectively, of ARTG and recorded realized gains of approximately $2.1 million and $3.0 million, respectively. These gains were reclassified, in accordance with the provisions of SFAS No. 115, “Accounting for Certain Investments in Debt and Equity Securities,” from Accumulated other comprehensive income, a separate component of stockholders’ equity, to Realized gains on investments on the Condensed Statement of Operations. As of December 31, 2007, the Company had approximately 238 thousand shares of ARTG with a market value of approximately $1.0 million, the value of which is shown as marketable securities on the Condensed Consolidated Balance Sheet.
Strategic Data Corporation transaction
During the fiscal year ended June 30, 2000, J Net, the predecessor company to Epoch, made a $1.1 million investment in Strategic Data Corp. ("SDC"), a technology-related company that specializes in advertising optimization technology. This investment was comprised of 892,500 shares of Series B and 1,966,963 shares of Series C, convertible preferred stock. As there was no readily available market for the securities and the investment represented less than a 20% interest in SDC, the securities were valued at the Company’s initial cost. During the fiscal year ended June 30, 2001, the carrying value of this investment was deemed to be impaired by J Net’s management and written down to zero. Accordingly, this investment had no carrying value at February 20, 2007. Additionally, no dividends had been paid through February 20, 2007.
On February 20, 2007, SDC’s stockholders approved the acquisition of its stock by Fox Interactive Media, Inc. (“FIM”). Under the terms of the agreement, FIM acquired all of the outstanding common stock, preferred stock, and vested and unvested stock options of SDC.
As a result of the above-mentioned merger, the Company, as holder of the preferred stock of SDC, received an initial cash payment of approximately $2.2 million on March 22, 2007.
The SDC merger also calls for contingent payments, upon the achievement of certain targets and milestones, payable over a period of approximately 3.5 years from the closing, as well as release of an escrow fund. The Company’s share of additional contingent payments and escrow funds stemming from the acquisition ranges from zero to approximately $15.4 million.
The first target measurement date was November 2007 and the Company became entitled to receive approximately $344 thousand. Such amount has been accrued for and included in Realized gains on investments in the Condensed Consolidated Statement of Operations for the three and six months ended December 31, 2007.
New Accounting Pronouncements
In June 2006, the FASB issued FASB Interpretation No. 48, Accounting for Uncertainty in Income Taxes—an interpretation of FASB Statement No. 109 (“FIN 48”). FIN 48 clarifies the accounting for income taxes by prescribing the minimum recognition threshold that a tax position must meet to be recognized in the financial statements. FIN 48 also provides guidance on measurement, derecognition, classification, interest and penalties, accounting in interim periods, disclosure and transition. FIN 48 must be implemented for fiscal years beginning after December 15, 2006. The Company adopted FIN 48 at the beginning of its fiscal year commencing July 1, 2007. The adoption of FIN 48 did not have a material effect on the Company's consolidated financial position, results of operations, or cash flows.
In September 2006, the FASB issued SFAS No. 157, Fair Value Measurements (“SFAS 157”). SFAS 157 defines fair value, establishes a framework for measuring fair value and enhances disclosures about fair value measurements required under other accounting pronouncements, but does not change existing guidance as to whether or not an instrument is carried at fair value. SFAS 157 is effective for fiscal years beginning after November 15, 2007, with earlier application permitted. The Company does not expect the adoption of this statement to have a material impact on its consolidated financial position, results of operations, or cash flows.
In February 2007, the FASB issued SFAS No. 159, The Fair Value Option for Financial Assets and Financial Liabilities (“SFAS 159”). SFAS 159 permits certain financial assets and financial liabilities to be measured at fair value, using an instrument-by-instrument election. The initial effect of adopting SFAS 159 must be accounted for as a cumulative effect adjustment to opening retained earnings for the fiscal year of adoption. Retrospective application to fiscal years preceding the effective date is not permitted. SFAS 159 is effective for the Company beginning July 1, 2008, although early adoption is permitted. The Company does not expect the adoption of this statement to have a material impact on its consolidated financial position, results of operations, or cash flows.
In June 2007, the Financial Accounting Standards Board (“FASB”) ratified the consensus reached by the Emerging Issues Task Force (“EITF”) in EITF Issue No. 06-11, “Accounting for Income Tax Benefits of Dividends on Share-Based Payment Awards” (“EITF 06-11”). EITF 06-11 requires that the realized income tax benefit from dividends paid on nonvested equity-classified employee share-based payment awards that are charged to retained earnings be recorded as an increase to additional paid-in capital, rather than a reduction to tax expense. The amount recognized in additional paid-in capital for the realized income tax benefit from dividends on those awards should be included in the pool of excess tax benefits available to absorb tax deficiencies on share-based payment awards. EITF 06-11 applies prospectively to the income tax benefits on dividends paid on unvested common shares, for fiscal years beginning after December 15, 2007, with early adoption permitted. There were no dividends declared or paid on unvested common shares prior to the ratification of EITF 06-11. The Company paid a dividend in November 2007 and has declared a dividend payable in February 2008. The Company is accounting for the tax benefits on all dividends declared on unvested common shares as an increase to additional paid-in capital, in accordance with EITF 06-11. The adoption of this pronouncement did not have a material impact on the Company’s consolidated financial position, results of operations, or cash flows.
Marketable securities
The Company is exposed to fluctuations in the market price of its marketable securities and other investments presented on its Condensed Consolidated Balance Sheets. These securities were acquired in connection with the eStara transaction. The total fair value of these securities as of December 31, 2007 was $1.0 million and $4.3 million, respectively. The Company does not hedge its market risk related to these securities and does not intend to do so in the future.
At December 31, 2007, the Company performed sensitivity analysis to assess the potential loss in the fair value of these market-risk sensitive securities. The following table represents the impact on the Company’s financial position assuming a hypothetical 10% decline in associated market indices (dollars in thousands):
| | | | | | | Estimated Fair | | | |
| | | | | | | Value After | | | |
| | | | | Hypothetical | | Hypothetical | | Decrease in | |
| | | Fair Value at | | Percentage | | Percentage | | Stockholders' | |
| | | December 31, 2007 | | Change | | Change | | Equity (1) | |
| | | | | | | | | | |
| Marketable securities | | $ | 1,035 | | | 10 | % | $ | 911 | | $ | 124 | |
| | | | | | | | | | | | | | |
| Other investments | | $ | 4,287 | | | 10 | % | $ | 3,898 | | $ | 389 | |
1) | Marketable securities and the investments in the Epoch mutual funds and the separate account of Epoch's Global All-Cap Product are classified as available-for-sale securities. Unrealized losses on available-for-sale securities are excluded from earnings and recorded in other comprehensive income as a separate component of stockholders’ equity until realized. The investment in the Epoch Global Absolute Return Fund, LLC is accounted for using the equity method, under which the Company's share of net realized and unrealized earnings or losses from the partnership is reflected in income. |
Cash and cash equivalents
Cash and cash equivalents are exposed to market risk due to changes in interest rates, which impacts interest income. We do not expect our interest income to be significantly affected by a sudden change in market interest rates. Presently, the Company neither participates in hedging activities nor does it have any derivative financial instruments.
Evaluation of Disclosure Controls and Procedures.
Our management, with the participation of the Company's principal executive officer and principal financial officer, has evaluated the effectiveness of the design and operation of our disclosure controls and procedures (as defined in Rules 13a-15(e) and 15d-15(e) under the Securities Exchange Act of 1934, as amended (the "Exchange Act")), as of the end of the period covered by this Quarterly Report on Form10-Q. Based on such evaluation, the Company's principal executive officer and principal financial officer have concluded that, as of the end of the period covered by this report, the Company's disclosure controls and procedures are effective to ensure that information required to be disclosed by us in reports that we file or submit under the Exchange Act is recorded, processed, summarized and reported within the required time periods and are designed to ensure that information required to be disclosed in our reports is accumulated and communicated to our management, including our principal executive officer and principal financial officer, as appropriate to allow timely decisions regarding required disclosure.
Changes in Internal Control Over Financial Reporting.
There has been no change in our internal control over financial reporting (as defined in Rules 13a-5(f) and 15d-15(f) under the Exchange Act) during the period covered by this Quarterly Report on Form 10-Q that has materially affected, or that is reasonably likely to materially affect, our internal control over financial reporting.
From time to time, the Company or its subsidiaries may become parties to claims, legal actions and complaints arising in the ordinary course of business. Management is not aware of any claims which would have a material adverse effect on its condensed consolidated financial statements.
There were no material changes from the risk factors set forth under Part I, Item 1A“Risk Factors” in our Annual Report on Form 10-K for the fiscal year ended June 30, 2007.
On November 29, 2007, the stockholders of Epoch Holding Corporation re-elected the chairman and the other five (5) directors standing for re-election at the annual meeting. Allan R. Tessler was re-elected as Chairman of the Board of Directors with 16,499,829 votes. The following individuals were also re-elected to the Company's Board of Directors and won with the following number of affirmative votes: William W. Priest (19,032,866), Eugene M. Freedman (18,913,830), Jeffrey L. Berenson (18,881,336), Enrique R. Arzac (19,025,166), and Peter A. Flaherty (18,912,764).
As previously disclosed in the Company’s Current Report on form 8-K dated November 28, 2007, David R. Markin retired from the Board of Directors effective as of the annual meeting. The Board has not nominated a replacement for Mr. Markin and, at such time as the Board deems appropriate, the Board may reduce the size of the Board, designate a substitute or leave the vacancy unfilled.
(a) Exhibits:
| Exhibit No. | | Description | |
| | | | |
| 10.1 | | | Employment agreement with Chief Executive Officer (D) | |
| 31.1 | | | Chief Executive Officer Certification (A) | |
| 31.2 | | | Principal Financial Officer Certification (A) | |
| 32.1 | | | Certification of Chief Executive Officer and Chief Financial Officer pursuant to 18 U.S.C. Section 1350 as Adopted Pursuant to Section 906 of the Sarbanes-Oxley Act of 2002 (A) | |
| 99.1 | | | Press release announcing AUM as of December 31, 2007 (B) | |
| 99.2 | | | Press release announcing declaration of common stock dividend (C) | |
| 99.3 | | | Press release announcing employment agreement with Chief Executive Officer and retirement of Board member (D) | |
| | (A)- Included herein. |
| | (B) - Incorporated by reference to Registrant’s Form 8-K dated January 7, 2008. |
| | (C) - Incorporated by reference to Registrant’s Form 8-K dated January 14, 2008. |
| | (D) – Incorporated by reference to Registrant’s Form 8-K dated November 28, 2007. |
Pursuant to the requirements of the Securities Exchange Act of 1934, the Registrant has duly caused this report to be signed on its behalf by the undersigned thereunto duly authorized.
| | EPOCH HOLDING CORPORATION |
| | (Registrant) |
| | |
| | By: | /s/ Adam Borak |
| | | Chief Financial Officer |
| Date: February 11, 2008 | | |