OMB APPROVAL
OMB Number: 3235-0570
Expires: August 31, 2020
Estimated average burden
hours per response 20.6
UNITED STATES
SECURITIES AND EXCHANGE COMMISSION
Washington, D.C.20549
FORM N-CSR
CERTIFIED SHAREHOLDER REPORT OF REGISTERED MANAGEMENT
INVESTMENT COMPANIES
Investment Company Act file number 811-01355
The Alger Funds
(Exact name of registrant as specified in charter)
360 Park Avenue South New York, New York 10010
(Address of principal executive offices) (Zip code)
Mr. Hal Liebes
Fred Alger Management, Inc.
360 Park Avenue South
New York, New York 10010
(Name and address of agent for service)
Registrant's telephone number, including area code: 212-806-8800
Date of fiscal year end: October 31
Date of reporting period: October 31, 2017
ITEM 1. REPORTS TO STOCKHOLDERS.
Table of Contents
The Alger Funds
|
| Shareholders’ Letter (Unaudited) | 1 |
| Fund Highlights (Unaudited) | 14 |
| Portfolio Summary (Unaudited) | 30 |
| Schedules of Investments | 32 |
| Statements of Assets and Liabilities | 67 |
| Statements of Operations | 75 |
| Statements of Changes in Net Assets | 79 |
| Financial Highlights 87 | 87 |
| Notes to Financial Statements | 120 |
| Report of Independent Registered Public Accounting Firm | 162 |
| Additional Information (Unaudited) | 163 |
Go Paperless With Alger Electronic Delivery Service
Alger is pleased to provide you with the ability to access regulatory materials online.
When documents such as prospectuses and annual and semi-annual reports are
available, we’ll send you an e-mail notification with a convenient link that will take you
directly to the fund information on our website. To sign up for this free service, simply
enroll at www.icsdelivery.com/alger.
Shareholders’ Letter October 31, 2017
Dear Shareholders,
Corporate Earnings Strengthen as Growth Stocks Trounce Value Stocks
During the one-year period ended October 31, 2017, strong corporate fundamentals and
economic growth continued to support the vibrant equity rally, with the S&P 500 Index
generating a noteworthy 23.63% gain. An equally dramatic trend of growth equities
outperforming value stocks continued with the 26.50% return of the S&P 500 Growth
Index substantially beating the 19.60% return of the index’s value-oriented counterpart.
Corporate Earnings Shine
The discussion in Washington of potential tax reform and other pro-growth initiatives, we
believe, appears to favorably support corporate America, and as a result, has contributed
to positive sentiment for U.S equities. We maintain, however, that corporate fundamentals,
including strong earnings combined with economic growth, have been the primary driver
of equity gains. As of the end of the reporting period, third-quarter S&P 500 earnings were
expected to increase 5.9%. As I write this letter, it appears that this past quarter will mark
the fifth consecutive quarter of earnings growth.
At Alger, our fundamental research seeks companies with strong potential for earnings
growth. We believe that a broad theme of companies developing innovative technology,
including cloud computing services, internet-connected devices, and artificial intelligence,
that can disrupt existing business models is creating attractive growth opportunities. This
trend was clearly apparent during the one year period ended September 30, 2017 of this year
with the Information Technology sector generating nearly twice the earnings–per–share
growth of the overall S&P 500 Index (11.9% vs. 6.0%).
We note that past periods of strong corporate earnings growth have resulted in increased
business spending and we believe the recent uptick in corporate earnings is likely to again
support business spending, which in turn could improve corporate productivity and provide
an additional boost to the economy.
The Economic Recovery Continues
Investors during the reporting period also reacted favorably to encouraging economic data,
such as the following developments:
• The U.S. Consumer Confidence Index climbed from 100.8 to 125.9.
• Wage growth continued with a 3.2% year-over-year increase in September.
• The Conference Board’s Leading Economic Indicator Index continued
climbing and hit a record high of 128.8 in August. The index’s September
reading of 128.6 was still high by historical standards.
Investor sentiment has also been supported by expectations for improving economic
growth globally. Indeed, Europe, Asia, and most of the Americas are on track to produce
economic growth in 2017. Corporate earnings in both developed and emerging markets
during the reporting period continued to strengthen while Purchasing Managers’ Index
readings in Europe and China were also encouraging. A perception that certain geopolitical
- 1 -
risks were moderating combined with fiscal and monetary stimulus in many countries
also supported investor sentiment. Those developments supported investor sentiment
relating to multinational corporations and extended the equity rally beyond the U.S. For
the reporting period, the MSCI ACWI ex USA Index generated a 24.20% return while the
MSCI Emerging Markets Index advanced 26.91%.
Growth Outperforms Value
The strong outperformance for growth equities during the reporting period and for the 10-
year period ended October 31, 2017 is also noteworthy. For the 10-year period, the S&P 500
Growth Index has outperformed the S&P 500 Value Index by 40.75 percent. As detailed
in a recent Alger paper “A New Perspective on Growth Versus Value” (available on Alger.
com), the biggest contributors to this “growth advantage” are the aforementioned strength
in technology companies’ earnings–per–share (EPS) growth and the weak performance of
low price-to-book stocks commonly found in the value category. The underperformance of
low price-to-book value stocks can be partially explained by a combination of corporations’
increasing reliance on intangible assets, accounting standards that fail to reflect those
changing business models, and the heavy reliance on one particular metric for style
classification (price-to-book value).1
Today, many businesses use fewer tangible assets, such as plants and equipment, than in the
past and they are increasingly more reliant on intangible resources, including research and
development, advertising, marketing, and training. Accounting professors Baruch Lev and
Feng Gu have observed that over the past 40 years the investment rate in physical capital fell
by 35% while the investment rate in intangible assets grew by almost 60%. 2
Internet businesses are an example. They use far fewer tangible assets relative to the income
they generate than do more traditional companies, such as auto manufacturers, that have to
build large factories. For internet companies, intangible assets can include search algorithms
that attract users who in turn drive advertising revenues. User data can also be considered
an intangible asset. Such data can support advertising revenue for digital media companies
and sales for online retailers. In these examples, intangible assets generate revenues that in
turn drive earnings growth.
The problem is that accounting practices haven’t kept up with the changing economy.
Spending on intangible assets (done organically rather than through acquisitions) is not
capitalized in current accounting standards and therefore is not included in book value,
rendering the price-to-book value metric less effective in our view. New economy companies
are therefore more likely to have high market values relative to their book values and be
classified as growth companies. By relying heavily on price-to-book valuations rather
than other methods of valuation such as price-to-earnings, style classification increasingly
separates companies based on business models. For example, digital companies with higher
returns on capital are more likely to be classified as growth even if their cash flows are large
relative to their market value. These companies, broadly speaking, have used innovation
to create products and services that have resulted in high returns on capital and strong
earnings growth. In doing so, they have outperformed companies with greater capital needs,
particularly tangible assets. Indeed, low price-to-book equities have underperformed not
just the broad market, but other value equities such as those with low price-to-earnings. Slow
economic growth during the past few years has also been a headwind for value stocks, which
- 2 -
tend to be cyclical. Low interest rates, furthermore, have hurt the performance of banks,
which have more significant representation in value indexes than in growth benchmarks.
The Accelerating Speed of Innovation
The divergence in growth and value is also being driven by technological advances that
are expanding at an exponential rate, which means the rate of change is accelerating.
This acceleration is apparent most famously in Moore’s law, which explains the rate of
improvement in transistors, but we also see it in information storage (e.g., hard drives),
information transportation (e.g., fiber-optic cables), wireless telecommunications, energy,
and even illumination.3 Technology is thus creating a potent engine to drive the economy
forward. The increasing pace of change means that newer innovations are spreading through
society faster. Older innovations such as the dishwasher and washing machine took many
decades to reach 50% penetration of the U.S. market, but more recent innovations such as
the internet and social media have taken 14 years and 9 years, respectively. The accelerating
rate of innovation may wreak havoc on value investing, which is essentially dependent on
the improvement of cheap valuations and depressed fundamentals. With change happening
more rapidly, value stocks that appear cheap may often simply be victims of change while
growth stocks may benefit as purveyors of change.
Conclusion
While we are ardent believers in growth investing, we are not suggesting that value investing
will always underperform. Rather, we maintain that the definitions of growth vs. value and
accounting standards need to evolve with the economy. We believe that investors reflexively
using “standard” but increasingly outdated valuation measures are at risk of missing
attractive equity opportunities that arise from the positive fundamental changes occurring
across industries and economies because of innovation.
At Alger, we are valuation-sensitive and our analysts and portfolio managers think intensely
about valuation and risk. However, we believe that when seeking attractive investment
returns, the fundamentals of a company, of a sector, and, indeed, of the economy matter
much more than valuations. Classically, for Alger, that means investing in growth companies
and fundamental growth that is the hallmark of the beginning of new eras and stages in
industries and in markets. Our observations of innovation and the other secular trends
that are supporting growth equities lead us to believe that this is an exciting time to be an
investor or shareholder. Our task at Alger, which has been our focus for more than 50 years,
is to continue to identify the winners and losers emerging from change.
Portfolio Matters
Alger Capital Appreciation Fund
The Alger Capital Appreciation Fund returned 29.84% for the fiscal 12-month period ended
October 31, 2017, compared to the 29.71% return of the Russell 1000 Growth Index.
During the reporting period, the largest portfolio sector weightings were Information
Technology and Consumer Discretionary. The largest sector overweight was Information
Technology and the largest sector underweight was Industrials. The Information Technology
and Financials sectors contributed to relative performance while Industrials and Health
Care were among sectors that detracted from results.
- 3 -
Apple, Inc.; Amazon.com, Inc.; Microsoft Corp.; Alphabet, Inc., Cl. C; and Facebook, Inc.,
Cl A. were among the top contributors to performance. Apple is a well-known provider
of smartphones, laptops, and other computing devices. Its shares outperformed during
the reporting period in response to the rapid growth of users for its iOS operating system,
excitement over new product launches, and strong sales of iPhones.
Conversely, Anadarko Petroleum Corp.; Molson Coors Brewing Co., Cl. B; Pioneer
Natural Resources Co.; QUALCOMM, Inc.; and Newell Brands, Inc. were among the top
detractors from results. Newell Brands is a leading global consumer products company. Its
brands include Rubbermaid, Paper Mate, Calphalon, Graco, and Levolor. Newell Brand’s
significant Jarden acquisition has been a transformational positive life cycle event. Jarden
has an impressive stable of brands such as Coleman, Rawlings, Marmot, and Yankee Candle.
Newell shares detracted from performance late in the reporting period after the company
lowered earnings guidance due to increased spending to stimulate categories where revenue
growth has been sluggish. The company also cited increased resin import costs associated
with Hurricane Harvey’s destruction in Texas. Resin is a very important component of
Newell’s plastic products.
Alger International Growth Fund
The Alger International Growth Fund returned 22.63% for the fiscal 12-month period
ended October 31, 2017, compared to the 24.20% return of the MSCI ACWI ex USA
Index.
Stock selection in China, Hong Kong, South Korea, and the Netherlands resulted in those
countries being among top contributors to relative performance. An overweight position
in China also supported performance. Stock selection, however, resulted in Canada, Brazil,
Switzerland, and Denmark being among countries that detracted from performance.
During the reporting period, the largest portfolio sector weightings were Financials and
Information Technology. The largest sector overweight was Information Technology and
the largest sector underweight was Consumer Discretionary. The Information Technology
and Financials sectors contributed to relative performance while Materials and Health Care
were among sectors that detracted from results.
Alibaba Group Holding Ltd.; Tencent Holdings Ltd.; Allianz SE; SK Hynix, Inc.; and
Broadcom Ltd. were among the top contributors to performance. Alibaba is the dominant
online commerce platform in China where e-commerce remains underpenetrated and has
been growing quickly. Alibaba’s platform model allows it to exploit the growth opportunity
without making big investments in inventory or infrastructure, which is allowing the
company to generate strong margins and cash flow. These attractive attributes were evident
in the third quarter of 2017 when the company said revenue growth exceeded consensus
expectations due to increased consumer adoption of online shopping and greater market
penetration. Investors have also been excited about substantial margin expansion as Alibaba’s
core commerce business benefited from scale benefits. Margins were also supported by the
company reducing investments in emerging businesses.
- 4 -
Conversely, Cenovus Energy Inc.; KDDI Corp.; BB Seguridade Participacoes SA; Asahi
Group Holdings, Ltd.; and Cemex Holdings Philippines, Inc. were the top detractors from
performance. Cenovus Energy is a Canadian integrated oil company. Cenovus shares
underperformed during the reporting period in response to concerns over crude oil prices.
Alger Mid Cap Growth Fund
The Alger Mid Cap Growth Fund returned 32.06% for the fiscal 12-month period ended
October 31, 2017, compared to the 26.25% return of the Russell Midcap Growth Index.
During the reporting period, the largest sector weightings were Information Technology
and Health Care. The largest sector overweight was Health Care and the largest underweight
was Information Technology. The Health Care and Financials sectors provided the greatest
contributions to relative performance while Consumer Discretionary and Consumer Staples
were among sectors that detracted from results.
Tolero Pharmaceutical, Inc., Series B Convertible Preferred Stock, Lam Research Corp.;
Tolero Pharmaceuticals, Inc., CDR; Autodesk, Inc.; and Broadcom Ltd. were the top
contributors to performance. Tolero Pharmaceuticals is a clinical-stage biopharmaceutical
company with a single purpose: alleviate human suffering through the development
of meaningful medicines to treat cancer and other serious human diseases. Early in the
reporting period, Sumitomo Dainippon Pharma announced plans to acquire Tolero. The
terms of the deal caused investors to revalue the company higher. As such, the Tolero
position contributed to the portfolio’s performance.
Conversely, TransDigm Group, Inc.; TreeHouse Foods, Inc.; Viacom, Inc., Cl. B;
O'Reilly Automotive, Inc.; and Advance Auto Parts, Inc. were the top detractors from
results. TransDigm Group produces, designs, and provides highly engineered aerospace
components, systems, and subsystems that are used on commercial and military aircraft.
TransDigm came under scrutiny for allegations that its various subsidiaries did not conform
to a 2014 rule that requires registrants to a federal procurement database to disclose their
parent companies.
Alger SMid Cap Focus Fund
Prior to August 30, 2017, the Fund was called the Alger SMid Cap Growth Fund. We
believe the Fund’s new name more accurately reflects the Fund’s high conviction investment
approach. As of March 1, 2017, Weatherbie Capital, which is a wholly owned subsidiary of
Alger Associates, Inc., the parent company of Fred Alger Management, Inc., became the
Fund’s sub-advisor. The Fund’s investment strategy remains unchanged.
The Fund returned 35.64% for the fiscal 12-month period ended October 31, 2017,
compared to the 30.07% return of the Russell 2500 Growth Index.
During the reporting period, the largest sector weightings were Information Technology
and Health Care. The largest sector overweight was Information Technology and the largest
underweight was Materials. The Information Technology and Health Care sectors provided
the greatest contributions to relative performance while Materials and Financials were
among the sectors that detracted from results.
- 5 -
Stamps.com, Inc.; Puma Biotechnology, Inc.; Wayfair, Inc., Cl. A; Portola Pharmaceuticals,
Inc.; and Paylocity Holding Corp. were the top contributors to performance. Wayfair is
an online retailer of household goods, including furniture, rugs, and lighting. Its stock
performed strongly early in 2017 in response to the company’s investments in logistics and
other initiatives driving revenue growth acceleration. The company, furthermore, has been
emerging as an e-commerce leader in a market segment with ample room for growth.
Conversely, Lions Gate Entertainment Corp., Cl. B; Francesca's Holdings Corp.; Middleby
Corp.; Signature Bank; and BofI Holding, Inc. were the top detractors from performance.
Middleby provides technology for cooking that is used by restaurants, hotels, prepared
food providers, and other commercial operations. It also provides products for residential
use, including items sold with Viking and AGA Rangemaster brands. The first quarter of
2017 was the fourth consecutive quarter in which the company’s overall results significantly
beat expectations. The performance of Middleby shares earlier in the year, however, was
hampered by the company’s organic growth being slightly softer than expectations and the
stock having performed extremely well over the past several quarters.
Alger Small Cap Growth Fund
The Alger Small Cap Growth Fund returned 36.59% for the fiscal 12-month period ended
October 31, 2017, compared to the 31.00% return of the Russell 2000 Growth Index.
During the reporting period, the largest sector weightings were Health Care and Information
Technology. The largest sector overweight was Health Care and the largest underweight was
Industrials. The Information Technology and Health Care sectors provided the greatest
contributions to relative performance while Industrials and Materials were among the
sectors that detracted from results.
Cognex Corp.; Take-Two Interactive Software, Inc.; Quidel Corp.; TubeMogul, Inc.; and
Sun Hydraulics Corp. were the top contributors to performance. Cognex is a leader in
machine vision technology that helps manufacturers reduce costs and maintain quality.
Its software and other products capture and analyze visual information to automate and
improve manufacturing and associated processes. Among other functions, manufacturers
use Cognex technology to locate, track, identify, and inspect items in the production
process. Cognex shares performed strongly after the company said it had generated better-
than-expected results driven by strength in logistics and automotive markets. Additionally,
Cognex provided strong guidance that came from an expected surge in demand from the
consumer electronics industry.
Conversely, Lions Gate Entertainment Corp., Cl. B; US Silica Holdings, Inc.; Endologix,
Inc.; Manhattan Associates, Inc.; and American Eagle Outfitters, Inc. were the top detractors
from results. US Silica is a leading producer of industrial minerals including sand that is
used when extracting oil with “fracking.” Performance of US Silica stock weakened largely
as a result of a pullback in oil prices. We believe a variety of factors differentiate it from
its competition. The company is a market share leader in fracking sand and in the silica
industry. It is also the lowest cost provider of sand and it has the largest distribution network
and strong logistics. Those factors make it well positioned to potentially benefit from a
- 6 -
potential multi-year increase in upstream spending, which primarily refers to investments in
exploration and production.
Alger Small Cap Focus Fund
The Alger Small Cap Focus Fund returned 33.60% for the fiscal 12-month period ended
October 31, 2017, compared to the 31.00% return of the Russell 2000 Growth Index.
Cognex Corp.; Veeva Systems, Inc., Cl. A; Medidata Solutions, Inc.; Blackbaud, Inc.; and
TubeMogul, Inc. were the top contributors to performance. Shares of Cognex performed
strongly in response to developments described in the Alger Small Cap Growth Fund
discussion.
Conversely, US Silica Holdings, Inc.; Endologix, Inc.; WisdomTree Investments, Inc.;
TESARO, Inc.; and Cardiovascular Systems, Inc. were the top detractors from results. The
performance of US Silica shares weakened in response to developments described in the
Alger Small Cap Growth Fund discussion.
Alger Health Sciences Fund
The Alger Health Sciences Fund returned 57.15% for the fiscal 12-month period ended
October 31, 2017, compared to the 23.63% return of the S&P 500 Index and the 23.96%
return of the Russell 3000 Health Care Index.
Tolero Pharmaceuticals Series B Convertible Preferred Stock, Tolero Pharmaceuticals,
Inc., CDR; Emmaus Life Sciences Inc.; UnitedHealth Group, Inc.; and ABIOMED, Inc.
were the top contributors to performance. UnitedHealth Group is a large managed health
care company. Early in the reporting period, expectations that the managed care industry’s
domestic revenue could benefit from lower U.S. corporate tax rates proposed by then
President-elect Donald Trump supported the performance of UnitedHealth stock during
the quarter. Additionally, the election of Trump alleviated concerns that the Democratic
Party and presidential candidate Hillary Clinton could offer a public health care plan that
would compete with managed care companies.
Conversely, Prosetta Biosciences, Inc., Series D; DexCom, Inc.; Bellicum Pharmaceuticals,
Inc.; Cempra, Inc.; and Alexion Pharmaceuticals, Inc. were the top detractors from results.
DexCom is focused on developing and providing continuous glucose monitoring (CGM)
systems for people with diabetes. Shares of DexCom underperformed early in the reporting
period due to concerns over potential market disruption from the launch of a competitive
product.
Alger Growth & Income Fund
The Alger Growth & Income Fund returned 23.22% for the fiscal 12-month period ended
October 31, 2017, compared to the 23.63% return of the S&P 500 Index.
The Fund invests in companies that are classified in one of the following categories: Dividend
Leaders, which generate high dividend yields; Dividend Growers, which have a history of
strong and consistent dividend growth; and Kings of Cash Flow, which have strong potential
for capital appreciation and returning cash to investors as a result of generating strong free
- 7 -
cash flow. During the reporting period, we continued to emphasize Dividend Growers and
Kings of Cash Flow, in part because Dividend Leaders continued to trade at high valuations.
The largest sector weightings during the reporting period were Information Technology
and Financials. The largest sector overweight was Consumer Staples and the largest sector
underweight was Utilities. The Financials and Consumer Discretionary sectors provided
the greatest contributions to relative performance while Information Technology and
Consumer Staples were among sectors that detracted from results.
Apple, Inc.; Microsoft Corp.; JPMorgan Chase & Co.; Boeing Co.; and Broadcom Ltd. were
the top contributors to performance. Shares of Apple performed strongly in response to
developments described in the Alger Capital Appreciation Fund discussion.
Conversely, General Electric Co.; Mattel, Inc.; CVS Caremark Corp.; QUALCOMM, Inc.; and
Molson Coors Brewing Co., Cl. B were the top detractors from performance. QUALCOMM
designs and manufactures semiconductors and software for the telecommunications
industry. Its chips are vital to the operation of telephone handsets. QUALCOMM share
performance weakened earlier in 2017 in response to news that Apple had filed a lawsuit
seeking to have the company’s pricing reduced.
I thank you for putting your trust in Alger.
Sincerely,

Daniel C. Chung, CFA
Chief Investment Officer
Fred Alger Management, Inc.
_______________________________
1 According to Russell’s U.S. Equity Indexes Institutional Benchmark Survey, December 2014, most institutional equity products
are benchmarked to a style index and, of those, 99% use Russell indexes. In total, $5.7 trillion is benchmarked to Russell indexes.
For each base index (the Russell 1000 and Russell 2000, and Russell Microcap), a composite value score is used to weight stocks
in the style indexes. Price-to-book value makes up 50% of that score. The other 50% is comprised of the Institutional Brokers’
Estimate Systems forecast medium-term growth (2 year) and sales per share historical growth (5 year) statistics.
2 Baruch Lev and Feng Gu, “The End of Accounting,” John Wiley & Sons, 2016.
3 Brad Neuman, “The Enduring Force of Innovation,” Fred Alger & Company, Incorporated.
Investors cannot invest directly in an index. Index performance does not reflect the
deduction for fees, expenses, or taxes.
This report and the financial statements contained herein are submitted for the general
information of shareholders of the funds. This report is not authorized for distribution to
prospective investors in a fund unless preceded or accompanied by an effective prospectus
for the fund. Fund performance returns represent the 12-month period return of Class
A shares prior to the deduction of any sales charges and include the reinvestment of any
dividends or distributions.
- 8 -
The performance data quoted represent past performance, which is not an
indication or guarantee of future results.
Standardized performance results can be found on the following pages. The investment
return and principal value of an investment in a fund will fluctuate so that an investor’s
shares, when redeemed, may be worth more or less than their original cost. Current
performance may be lower or higher than the performance quoted. For performance data
current to the most recent month-end, visit us at www.alger.com or call us at (800) 992-3863.
The views and opinions of the funds’ management in this report are as of the date of the
Shareholders’ Letter and are subject to change at any time subsequent to this date. There
is no guarantee that any of the assumptions that formed the basis for the opinions stated
herein are accurate or that they will materialize. Moreover, the information forming the
basis for such assumptions is from sources believed to be reliable; however, there is no
guarantee that such information is accurate. Any securities mentioned, whether owned in a
fund or otherwise, are considered in the context of the construction of an overall portfolio
of securities and therefore reference to them should not be construed as a recommendation
or offer to purchase or sell any such security. Inclusion of such securities in a fund and
transactions in such securities, if any, may be for a variety of reasons, including, without
limitation, in response to cash flows, inclusion in a benchmark, and risk control. The
reference to a specific security should also be understood in such context and not viewed as
a statement that the security is a significant holding in a fund. Please refer to the Schedule
of Investments for each fund which is included in this report for a complete list of fund
holdings as of October 31, 2017. Securities mentioned in the Shareholders’ Letter, if not
found in the Schedule of Investments, may have been held by the funds during the fiscal
period.
A Word about Risk
Investing in the stock market involves gains and losses and may not be suitable for all
investors. Growth stocks tend to be more volatile than other stocks as the price of growth
stocks tends to be higher in relation to their companies’ earnings and may be more sensitive
to market, political and economic developments. Stocks of small- and mid-sized companies
are subject to greater risk than stocks of larger, more established companies owing to such
factors as limited liquidity, inexperienced management, and limited financial resources.
Investing in foreign securities involves additional risk (including currency risk, risks related
to political, social or economic conditions, and risks associated with foreign markets, such
as increased volatility, limited liquidity, less stringent regulatory and legal system, and lack
of industry and country diversification), and may not be suitable for all investors. Some
of the countries where a fund can invest may have restrictions that could limit the access
to investment opportunities. The securities of issuers located in emerging markets can be
more volatile and less liquid than those of issuers in more mature economies. Investing
in emerging markets involves even higher levels of risk, including increased information,
market, and valuation risks, and may not be suitable for all investors. Special risks associated
with investments in emerging country issuers include exposure to currency fluctuations, less
liquidity, less developed or less efficient trading markets, lack of comprehensive company
information, political instability and different auditing and legal standards.
Funds that participate in leveraging, such as Capital Appreciation, SMid Cap Focus, and
Health Sciences, are subject to the risk that the cost of borrowing money to leverage will
- 9 -
exceed the returns for securities purchased or that the securities purchased may actually go
down in value; thus, a fund’s net asset value can decrease more quickly than if the fund had
not borrowed.
A small investment in derivatives could have a potentially large impact on a fund’s
performance. When purchasing options, a fund bears the risk that if the market value of
the underlying security does not move to a level that would make exercise of the option
profitable, the option will expire unexercised. When a call option written by a fund is
exercised, the fund will not participate in any increase in the underlying security’s value
above the exercise price. When a put option written by a fund is exercised, the fund will
be required to purchase the underlying security at a price in excess of its market value. Use
of options on securities indexes is subject to the risk that trading in the options may be
interrupted if trading in certain securities included in the index is interrupted, the risk that
price movements in a fund’s portfolio securities may not correlate precisely with movements
in the level of an index, and the risk that Fred Alger Management, Inc. may not predict
correctly movements in the direction of a particular market or of the stock market generally.
Because certain options may require settlement in cash, a fund may be forced to liquidate
portfolio securities to meet settlement obligations. Forward currency contracts are subject
to currency exchange rate risks and the risk that Fred Alger Management, Inc. may not
predict accurately future foreign exchange rates. Derivative contracts generally are subject to
the risk of non-performance by the contract counterparty. For a more detailed discussion
of the risks associated with a fund, please see the Prospectus.
Before investing, carefully consider a fund’s investment objective, risks, charges,
and expenses. For a prospectus or a summary prospectus containing this and other
information about The Alger Funds call us at (800) 992-3863 or visit us at www.
alger.com. Read it carefully before investing.
Fred Alger & Company, Incorporated, Distributor. Member NYSE Euronext,
SIPC.
NOT FDIC INSURED. NOT BANK GUARANTEED. MAY LOSE VALUE.
Definitions:
• S&P 500 Index: An index of large company stocks considered representative
of the U.S. stock market.
• The S&P 500 Growth Index is an index consisting of stocks within the S&P
500 Index that exhibit strong growth characteristics.
• The S&P 500 Value Index is an index consisting of stocks within the S&P
500 Index that exhibit strong value characteristics.
• The Conference Board’s Leading Economic Indicator Index is based on a va-
riety of economic data and is part of the Conference Board’s analytic system
that seeks to signal peaks and troughs in the business cycle.
• The Purchasing Managers' Index (PMI) is an indicator of the economic
health of the manufacturing sector.
• The U.S. Consumer Confidence Index (CCI) is an indicator designed to mea-
sure consumer confidence, which is defined as the degree of optimism on
the state of the economy that consumers are expressing through their activi-
- 10 -
ties of savings and spending.
• Morgan Stanley Capital International (MSCI) All Country World Index
(ACWI) ex USA is an unmanaged, market capitalization-weighted index de-
signed to provide a broad measure of equity market performance throughout
the world, including both developing and emerging markets, but excluding
the United States.
• MSCI Emerging Markets Index: A free float-adjusted market capitalization
index designed to measure equity market performance in the global emerging
markets.
• Russell 1000 Growth Index: An index of common stocks designed to track
performance of large-capitalization companies with greater than average
growth orientation.
• Russell Midcap Growth Index: An index of common stocks designed to
track performance of medium-capitalization companies with greater than
average growth orientation.
• Russell 2500 Growth Index: An index of common stocks designed to track
performance of small- and medium-capitalization companies with greater
than average growth orientation.
• Russell 2000 Growth Index: An index of common stocks designed to track
performance of small-capitalization companies with greater than average
growth orientation.
• The Russell 3000 Health Care Index is an unmanaged index representative
of companies involved in medical services or health care in the Russell 3000
Index, which is comprised of the 3,000 largest U.S. companies as determined
by total market capitalization.
- 11 -
| | | | | | | | |
| FUND PERFORMANCE AS OF 9/30/17 (Unaudited) |
| AVERAGE ANNUAL TOTAL RETURNS |
| | 1 | | 5 | | 10 | | SINCE | |
| | YEAR | | YEARS | | YEARS | | INCEPTION | |
| Alger Capital Appreciation Class A (Inception 12/31/96) | 14.44 | % | 13.48 | % | 8.11 | % | 9.13 | % |
| Alger Capital Appreciation Class B (Inception 11/1/93) | 14.88 | % | 13.59 | % | 7.98 | % | 9.10 | % |
| Alger Capital Appreciation Class C (Inception 7/31/97)*, † | 18.84 | % | 13.86 | % | 7.87 | % | 8.92 | % |
| Alger Capital Appreciation Class Z (Inception 12/29/10) | 21.18 | % | 15.10 | % | n/a | | 13.74 | % |
| |
| Alger International Growth Class A (Inception 12/31/96) | 11.09 | % | 5.36 | % | 2.19 | % | 5.37 | % |
| Alger International Growth Class B (Inception 11/11/86) | 11.37 | % | 5.43 | % | 2.19 | % | 5.34 | % |
| Alger International Growth Class C (Inception 7/31/97) *,† | 15.30 | % | 5.67 | % | 1.96 | % | 5.17 | % |
| Alger International Growth Class I (Inception 5/31/13) | 17.36 | % | n/a | | n/a | | 5.95 | % |
| Alger International Growth Class Z (Inception 12/29/10) | 17.73 | % | 6.98 | % | n/a | | 6.73 | % |
| |
| Alger Mid Cap Growth Class A (Inception 12/31/96) | 15.34 | % | 11.20 | % | 3.20 | % | 8.28 | % |
| Alger Mid Cap Growth Class B (Inception 5/24/93) | 15.72 | % | 11.32 | % | 3.11 | % | 8.24 | % |
| Alger Mid Cap Growth Class C (Inception 7/31/97) *,† | 19.70 | % | 11.49 | % | 2.88 | % | 7.68 | % |
| Alger Mid Cap Growth Class Z (Inception 5/28/15) | 21.97 | % | n/a | | n/a | | 4.94 | % |
| |
| Alger SMid Cap Focus Class A (Inception 5/8/02) | 18.60 | % | 11.42 | % | 5.75 | % | 8.61 | % |
| Alger SMid Cap Focus Class C (Inception 5/8/02) | 23.20 | % | 11.75 | % | 5.49 | % | 8.35 | % |
| Alger SMid Cap Focus Class I (Inception 8/5/07) | 25.16 | % | 12.62 | % | 6.38 | % | 9.05 | % |
| Alger SMid Cap Focus Class Y (Inception 8/30/17) * | n/a | | n/a | | n/a | | 5.22 | % |
| Alger SMid Cap Focus Class Z (Inception 12/29/10) | 25.60 | % | 13.00 | % | n/a | | 10.78 | % |
| |
| Alger Small Cap Growth Class A (Inception 12/31/96) | 17.24 | % | 9.79 | % | 5.36 | % | 4.64 | % |
| Alger Small Cap Growth Class B (Inception 11/11/86) | 17.83 | % | 9.87 | % | 5.38 | % | 4.62 | % |
| Alger Small Cap Growth Class C (Inception 7/31/97)*, † | 21.72 | % | 10.07 | % | 5.02 | % | 4.46 | % |
| Alger Small Cap Growth Class Z (Inception 12/29/10) | 24.26 | % | 11.38 | % | n/a | | 9.44 | % |
| |
| Alger Small Cap Focus Class A (Inception 3/3/08) | 13.99 | % | 12.57 | % | n/a | | 8.53 | % |
| Alger Small Cap Focus Class C (Inception 3/3/08) | 18.42 | % | 13.03 | % | n/a | | 8.36 | % |
| Alger Small Cap Focus Class I (Inception 3/3/08) | 20.23 | % | 13.97 | % | n/a | | 9.34 | % |
| Alger Small Cap Focus Class Y (Inception 2/28/17) | n/a | | n/a | | n/a | | 16.16 | % |
| Alger Small Cap Focus Class Z (Inception 12/29/10) | 20.74 | % | 14.30 | % | n/a | | 11.64 | % |
| |
| Alger Health Sciences Fund Class A (Inception 5/1/02) | 30.65 | % | 15.42 | % | 9.95 | % | 11.98 | % |
| Alger Health Sciences Fund Class C (Inception 5/1/02) | 35.87 | % | 15.80 | % | 9.70 | % | 11.71 | % |
| Alger Health Sciences Fund Class Z (Inception 5/28/15) | 38.48 | % | n/a | | n/a | | 6.80 | % |
| |
| Alger Growth & Income Class A (Inception 12/31/96) | 12.60 | % | 11.33 | % | 6.99 | % | 8.05 | % |
| Alger Growth & Income Class C (Inception 7/31/97) *,† | 16.94 | % | 11.69 | % | 6.75 | % | 7.84 | % |
| Alger Growth & Income Class Z (Inception 3/1/12) | 19.17 | % | 12.82 | % | n/a | | 12.58 | % |
The performance data quoted represents past performance, which is not an indication or a guarantee of future
results. The Fund’s average annual total returns include changes in share price and reinvestment of dividends and
capital gains.
Beginning August 7, 2015, Alger Small Cap Focus Fund (formerly Alger Growth Opportunities Fund) changed its
investment strategy to normally invest at least 80% of its net assets, plus any borrowings for investment purposes, in
equity securities of companies that, at the time of purchase of the securities, have a total market capitalization within
the range of companies included in the Russell 2000 Growth Index.
Beginning May 31, 2013, Alger International Growth Fund (formerly Alger Large Cap Growth Fund) changed its
investment strategy to include securities of foreign companies of any market capitalization; its previous investment
strategy considered securities of United States companies with a market capitalization equal to or greater than the
companies in the Russell 1000 Growth Index.
Beginning April 1, 2011, Alger Growth & Income Fund changed its investment strategy to focus on securities that
offer opportunities for capital appreciation as well as pay dividends. Previously, under the name “Alger Balanced
Fund”, its investment strategy focused on securities, including fixed-income, with an emphasis on income-producing
and a potential for capital appreciation.
- 12 -
* Historical performance prior to the inception of the Class, is that of the Fund’s Class A shares, which has been adjusted to
remove the sales charge imposed by Class A shares and adding the higher operating expenses of the Class C shares.
† Since inception performance is calculated since the inception of the Class A shares. Historical performance prior to July 31,
1997, inception of the class, is that of the Fund’s Class A shares, reduced to reflect the current maximum sales charge and the
higher operating expenses of the Class C shares.
- 13 -
ALGER CAPITAL APPRECIATION FUND
Fund Highlights Through October 31, 2017 (Unaudited)
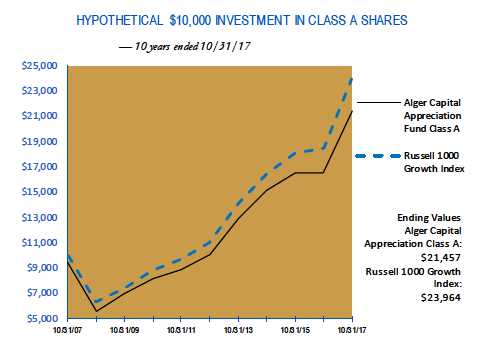
The chart above illustrates the change in value of a hypothetical $10,000 investment made in the Alger Capital
Appreciation Fund Class A shares, with a maximum sales charge of 5.25%, and the Russell 1000 Growth Index
(unmanaged index of common stocks) for the ten years ended October 31, 2017. Figures for the Alger Capital
Appreciation Fund Class A shares and the Russell 1000 Growth Index include reinvestment of dividends.
Performance for Alger Capital Appreciation Fund Class B, Class C and Class Z shares will vary from the results
shown above due to differences in expenses and sales charges those classes bear. Investors cannot invest directly in
any index. Index performance does not reflect deduction for fees, expenses, or taxes.
- 14 -
ALGER CAPITAL APPRECIATION FUND
Fund Highlights Through October 31, 2017 (Unaudited) (Continued)
| | | | | | | | |
| PERFORMANCE COMPARISON AS OF 10/31/17 |
| AVERAGE ANNUAL TOTAL RETURNS |
| | | | | | | | Since | |
| | 1 YEAR | | 5 YEARS | | 10 YEARS | | 12/31/1996 | |
| Class A (Inception 12/31/96) | 23.04 | % | 15.16 | % | 7.93 | % | 9.33 | % |
| Class B (Inception 11/1/93) | 23.82 | % | 15.28 | % | 7.80 | % | 9.30 | % |
| Class C (Inception 7/31/97)* | 27.88 | % | 15.54 | % | 7.70 | % | 9.12 | % |
| Russell 1000 Growth Index | 29.71 | % | 16.83 | % | 9.13 | % | 7.76 | % |
| | | | | | | |
| | | | | | | Since | |
| | 1 YEAR | | 5 YEARS | | 10 YEARS | 12/29/2010 | |
| Class Z (Inception 12/29/10) | 30.25 | % | 16.80 | % | n/a | 14.32 | % |
| Russell 1000 Growth Index | 29.71 | % | 16.83 | % | n/a | 14.51 | % |
The performance data quoted represents past performance, which is not an indication or a guarantee of future results. The Fund’s
average annual total returns include changes in share price and reinvestment of dividends and capital gains. Class A returns reflect the
maximum initial sales charge and Class B and C returns reflect the applicable contingent deferred sales charge. The chart and table above
do not reflect the deduction of taxes that a shareholder would have paid on Fund distributions or on the redemption of Fund shares.
Investment return and principal will fluctuate and the Fund’s shares, when redeemed, may be worth more or less than their original cost.
Current performance may be higher or lower than the performance quoted. For updated performance, visit us at www.alger.com or call
us at (800) 992-3863.
* Since inception performance is calculated since the inception of the Class A shares. Historical performance prior to July 31,
1997, inception of the class, is that of the Fund's Class A shares, reduced to reflect the current maximum sales charge and
the higher operating expenses of Class C shares.
- 15 -
ALGER INTERNATIONAL GROWTH FUND
Fund Highlights Through October 31, 2017 (Unaudited)
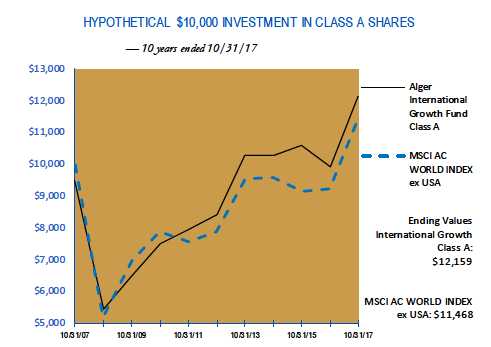
The chart above illustrates the change in value of a hypothetical $10,000 investment made in the Alger International
Growth Fund Class A shares, with a maximum sales charge of 5.25%, and the MSCI AC WORLD INDEX ex
USA (unmanaged index of common stocks) for the ten years ended October 31, 2017. Beginning May 31, 2013
Alger International Growth Fund changed its investment strategy to include securities of foreign companies of
any market capitalization. Previously, under the name “Alger Large Cap Growth Fund”, its investment strategy
considered securities of United States companies with a market capitalization equal to or greater than the companies
in the Russell 1000 Growth Index. Figures for the Alger International Growth Fund Class A shares and the index
include reinvestment of dividends. Performance for the Alger International Growth Fund Class B, Class C, Class
I and Class Z shares will vary from the results shown above due to differences in expenses and sales charges those
classes bear. Investors cannot invest directly in any index. Indices performance does not reflect deduction for fees,
expenses, or taxes.
- 16 -
ALGER INTERNATIONAL GROWTH FUND
Fund Highlights Through October 31, 2017 (Unaudited) (Continued)
| | | | | | | | |
| PERFORMANCE COMPARISON AS OF 10/31/17 |
| AVERAGE ANNUAL TOTAL RETURNS |
| | | | | | | | Since | |
| | 1 YEAR | | 5 YEARS | | 10 YEARS | | 12/31/1996 | |
| Class A (Inception 12/31/96) | 16.18 | % | 6.46 | % | 1.97 | % | 5.43 | % |
| Class B (Inception 11/11/86) | 16.71 | % | 6.55 | % | 1.98 | % | 5.40 | % |
| Class C (Inception 7/31/97)* | 20.70 | % | 6.78 | % | 1.75 | % | 5.23 | % |
| MSCI AC WORLD INDEX ex USA | 24.20 | % | 7.77 | % | 1.38 | % | 5.82 | % |
| | | | | | | |
| | | | | | | Since | |
| | 1 YEAR | | 5 YEARS | | 10 YEARS | 5/31/2013 | |
| Class I (Inception 5/31/13) | 22.84 | % | n/a | | n/a | 6.26 | % |
| MSCI AC WORLD INDEX ex USA | 24.20 | % | n/a | | n/a | 6.41 | % |
| |
| | | | | | | Since | |
| | 1 YEAR | | 5 YEARS | | 10 YEARS | 12/29/2010 | |
| Class Z (Inception 12/29/10) | 23.16 | % | 8.11 | % | n/a | 6.92 | % |
| MSCI AC WORLD INDEX ex USA | 24.20 | % | 7.77 | % | n/a | 5.15 | % |
The performance data quoted represents past performance, which is not an indication or a guarantee of future results. The Fund’s
average annual total returns include changes in share price and reinvestment of dividends and capital gains. Class A returns reflect the
maximum initial sales charge and Class C and B returns reflect the applicable contingent deferred sales charge. The chart and table above
do not reflect the deduction of taxes that a shareholder would have paid on Fund distributions or on the redemption of Fund shares.
Investment return and principal will fluctuate and the Fund’s shares, when redeemed, may be worth more or less than their original cost.
Current performance may be higher or lower than the performance quoted. For updated performance, visit us at www.alger.com or call
us at (800) 992-3863.
* Since inception performance is calculated since the inception of the Class A shares. Historical performance prior to July 31,
1997, inception of the class, is that of the Fund's Class A shares, reduced to reflect the current maximum sales charge and
the higher operating expenses of Class C shares.
- 17 -
ALGER MID CAP GROWTH FUND
Fund Highlights Through October 31, 2017 (Unaudited)

The chart above illustrates the change in value of a hypothetical $10,000 investment made in the Alger Mid Cap
Growth Fund Class A shares, with a maximum sales charge of 5.25%, and the Russell Midcap Growth Index (an
unmanaged index of common stocks) for the ten years ended October 31, 2017. Figures for the Alger Mid Cap
Growth Fund Class A shares and Russell Midcap Growth Index include reinvestment of dividends. Performance
for the Alger Mid Cap Growth Fund Class B, Class C and Class Z shares will vary from the results shown above due
to differences in expenses and sales charges those classes bear. Investors cannot invest directly in any index. Index
performance does not reflect deduction for fees, expenses, or taxes.
- 18 -
ALGER MID CAP GROWTH FUND
Fund Highlights Through October 31, 2017 (Unaudited) (Continued)
| | | | | | | | |
| PERFORMANCE COMPARISON AS OF 10/31/17 |
| AVERAGE ANNUAL TOTAL RETURNS |
| | | | | | | | Since | |
| | 1 YEAR | | 5 YEARS | | 10 YEARS | | 12/31/1996 | |
| Class A (Inception 12/31/96) | 25.07 | % | 12.61 | % | 3.06 | % | 8.42 | % |
| Class B (Inception 5/24/93) | 26.23 | % | 12.76 | % | 2.98 | % | 8.38 | % |
| Class C (Inception 7/31/97)* | 29.92 | % | 12.89 | % | 2.73 | % | 7.82 | % |
| Russell Midcap Growth Index | 26.25 | % | 15.34 | % | 8.23 | % | 8.85 | % |
| | | | | | |
| | | | | | Since | |
| | 1 YEAR | | 5 YEARS | 10 YEARS | 5/28/2015 | |
| Class Z (Inception 5/28/15) | 32.52 | % | n/a | n/a | 6.30 | % |
| Russell Midcap Growth Index | 26.25 | % | n/a | n/a | 8.28 | % |
The performance data quoted represents past performance, which is not an indication or a guarantee of future results. The Fund’s
average annual total returns include changes in share price and reinvestment of dividends and capital gains. Class A returns reflect the
maximum initial sales charge and Class C and B returns reflect the applicable contingent deferred sales charge. The chart and table above
do not reflect the deduction of taxes that a shareholder would have paid on Fund distributions or on the redemption of Fund shares.
Investment return and principal will fluctuate and the Fund’s shares, when redeemed, may be worth more or less than their original cost.
Current performance may be higher or lower than the performance quoted. For updated performance, visit us at www.alger.com or call
us at (800) 992-3863.
* Since inception performance is calculated since the inception of the Class A shares. Historical performance prior to July 31,
1997, inception of the class, is that of the Fund's Class A shares, reduced to reflect the current maximum sales charge and
the higher operating expenses of Class C shares.
- 19 -
ALGER SMID CAP FOCUS FUND
Fund Highlights Through October 31, 2017 (Unaudited)

The chart above illustrates the change in value of a hypothetical $10,000 investment made in the Alger SMid
Cap Focus Fund Class A shares, with a maximum sales charge of 5.25%, and the Russell 2500 Growth Index
(an unmanaged index of common stocks) for the ten years ended October 31, 2017. Effective March 1, 2017,
Weatherbie Capital, LLC, a wholly-owned subsidiary of Alger Associates, Inc., the parent company of Fred Alger
Management, Inc., began providing investment management to the Alger SMid Cap Focus Fund. Figures for the
Alger SMid Cap Focus Fund Class A shares and the Russell 2500 Growth Index include reinvestment of dividends.
Performance for the Alger SMid Cap Focus Fund Class C, Class I, Class Y and Class Z shares will vary from the
results shown above due to differences in expenses and sales charges those classes bear. Investors cannot invest
directly in any index. Index performance does not reflect deduction for fees, expenses, or taxes.
- 20 -
ALGER SMID CAP FOCUS FUND
Fund Highlights Through October 31, 2017 (Unaudited) (Continued)
| | | | | | | | |
| PERFORMANCE COMPARISON AS OF 10/31/17 |
| AVERAGE ANNUAL TOTAL RETURNS |
| | | | | | | | Since | |
| | 1 YEAR | | 5 YEARS | | 10 YEARS | | 5/8/2002 | |
| Class A (Inception 5/8/02) | 28.51 | % | 12.25 | % | 5.24 | % | 8.67 | % |
| Class C (Inception 5/8/02) | 33.64 | % | 12.60 | % | 4.99 | % | 8.42 | % |
| Class I (Inception 8/5/07)* | 35.63 | % | 13.46 | % | 5.87 | % | 9.11 | % |
| Russell 2500 Growth Index | 30.07 | % | 15.50 | % | 8.56 | % | 9.56 | % |
| | | | | |
| | | | | Since | |
| | 1 YEAR | 5 YEARS | 10 YEARS | 8/31/2017 | |
| Class Y (Inception 8/31/17) | n/a | n/a | n/a | 7.09 | % |
| Russell 2500 Growth Index | n/a | n/a | n/a | 8.24 | % |
| | | | | | | |
| | | | | | | Since | |
| | 1 YEAR | | 5 YEARS | | 10 YEARS | 12/29/2010 | |
| Class Z (Inception 12/29/10) | 36.11 | % | 13.85 | % | n/a | 10.91 | % |
| Russell 2500 Growth Index | 30.07 | % | 15.50 | % | n/a | 12.60 | % |
The performance data quoted represents past performance, which is not an indication or a guarantee of future results. The Fund’s average
annual total returns include changes in share price and reinvestment of dividends and capital gains. Class A returns reflect the maximum
initial sales charge and Class C returns reflect the applicable contingent deferred sales charge. The chart and table above do not reflect the
deduction of taxes that a shareholder would have paid on Fund distributions or on the redemption of Fund shares. Investment return
and principal will fluctuate and the Fund’s shares, when redeemed, may be worth more or less than their original cost. Current performance
may be higher or lower than the performance quoted. For updated performance, visit us at www.alger.com or call us at (800) 992-3863.
* Historical performance prior to August 5, 2007, inception of the class, is that of the Fund's Class A shares, which has
been reduced to remove the sales charge imposed by Class A shares.
- 21 -
ALGER SMALL CAP GROWTH FUND
Fund Highlights Through October 31, 2017 (Unaudited)
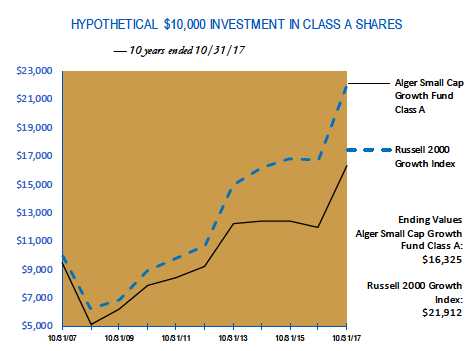
The chart above illustrates the change in value of a hypothetical $10,000 investment made in the Alger Small Cap
Growth Fund Class A shares, with a maximum sales charge of 5.25%, and the Russell 2000 Growth Index (an
unmanaged index of common stocks) for the ten years ended October 31, 2017. Figures for the Alger Small Cap
Growth Fund Class A shares and the Russell 2000 Growth Index include reinvestment of dividends. Performance
for the Alger Small Cap Growth Fund Class B, Class C and Class Z shares will vary from the results shown above due
to differences in expenses and sales charges those classes bear. Investors cannot invest directly in any index. Index
performance does not reflect deduction for fees, expenses, or taxes.
- 22 -
ALGER SMALL CAP GROWTH FUND
Fund Highlights Through October 31, 2017 (Unaudited) (Continued)
| | | | | | | | |
| PERFORMANCE COMPARISON AS OF 10/31/17 |
| AVERAGE ANNUAL TOTAL RETURNS |
| | | | | | | | Since | |
| | 1 YEAR | | 5 YEARS | | 10 YEARS | | 12/31/1996 | |
| Class A (Inception 12/31/96) | 29.43 | % | 10.94 | % | 5.02 | % | 4.76 | % |
| Class B (Inception 11/11/86) | 30.73 | % | 11.04 | % | 5.02 | % | 4.74 | % |
| Class C (Inception 7/31/97)* | 34.51 | % | 11.20 | % | 4.66 | % | 4.58 | % |
| Russell 2000 Growth Index | 31.00 | % | 15.36 | % | 8.16 | % | 6.92 | % |
| | | | | | | |
| | | | | | | Since | |
| | 1 YEAR | | 5 YEARS | | 10 YEARS | 12/29/2010 | |
| Class Z (Inception 12/29/10) | 37.16 | % | 12.55 | % | n/a | 9.79 | % |
| Russell 2000 Growth Index | 31.00 | % | 15.36 | % | n/a | 12.02 | % |
The performance data quoted represents past performance, which is not an indication or a guarantee of future results. The Fund’s
average annual total returns include changes in share price and reinvestment of dividends and capital gains. Class A returns reflect the
maximum initial sales charge and Class C and B returns reflect the applicable contingent deferred sales charge. The chart and table above
do not reflect the deduction of taxes that a shareholder would have paid on Fund distributions or on the redemption of Fund shares.
Investment return and principal will fluctuate and the Fund’s shares, when redeemed, may be worth more or less than their original cost.
Current performance may be higher or lower than the performance quoted. For updated performance, visit us at www.alger.com or call
us at (800) 992-3863.
* Since inception performance is calculated since the inception of the Class A shares. Historical performance prior to July 31,
1997, inception of the class, is that of the Fund's Class A shares, reduced to reflect the current maximum sales charge and
the higher operating expenses of Class C shares.
- 23 -
ALGER SMALL CAP FOCUS FUND
Fund Highlights Through October 31, 2017 (Unaudited)
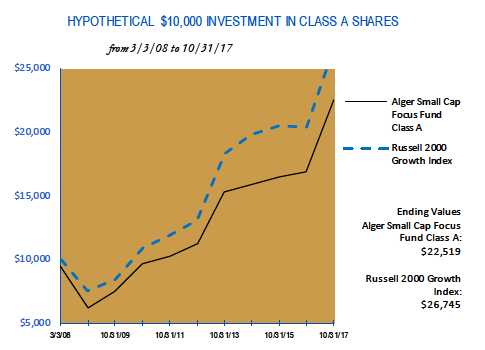
The chart above illustrates the change in value of a hypothetical $10,000 investment made in the Alger Small Cap
Focus Fund Class A shares, with an initial 5.25% maximum sales charge, the Russell 2000 Growth (unmanaged indices
of common stocks) from March 3, 2008, the inception date of the Alger Small Cap Focus Fund, through October
31, 2017. Prior to August 7, 2015, the Fund followed different investment strategies under the name “Alger Growth
Opportunities Fund” and prior to February 12, 2015 was managed by a different portfolio manager. Accordingly,
performance prior to those dates does not reflect the Fund’s current investment strategies and investment personnel.
Figures for the Alger Small Cap Focus Fund Class A shares, the Russell 2000 Growth Index include reinvestment of
dividends. Performance for the Alger Small Cap Focus Fund Class C, Class I, Class Y and Class Z shares will vary
from the results shown above due to differences in expenses and sales charges those classes bear. Investors cannot
invest directly in any index. Index performance does not reflect deduction for fees, expenses, or taxes.
- 24 -
ALGER SMALL CAP FOCUS FUND
Fund Highlights Through October 31, 2017 (Unaudited) (Continued)
| | | | | | | |
| PERFORMANCE COMPARISON AS OF 10/31/17 |
| AVERAGE ANNUAL TOTAL RETURNS |
| | | | | | | Since | |
| | 1 YEAR | | 5 YEARS | | 10 YEARS | 3/3/2008 | |
| Class A (Inception 3/3/08) | 26.57 | % | 13.68 | % | n/a | 8.76 | % |
| Class C (Inception 3/3/08) | 31.49 | % | 14.11 | % | n/a | 8.58 | % |
| Class I (Inception 3/3/08) | 33.57 | % | 15.09 | % | n/a | 9.57 | % |
| Russell 2000 Growth Index | 31.00 | % | 15.36 | % | n/a | 10.72 | % |
| | | | | | | |
| | | | | | | Since | |
| | 1 YEAR | | 5 YEARS | | 10 YEARS | 2/28/2017 | |
| Class Y (Inception 2/28/17) | n/a | | n/a | | n/a | 19.41 | % |
| Russell 2000 Growth Index | n/a | | n/a | | n/a | 13.93 | % |
| |
| |
| | | | | | | Since | |
| | 1 YEAR | | 5 YEARS | | 10 YEARS | 12/29/2010 | |
| Class Z (Inception 12/29/10) | 33.91 | % | 15.39 | % | n/a | 11.94 | % |
| Russell 2000 Growth Index | 31.00 | % | 15.36 | % | n/a | 12.02 | % |
The performance data quoted represents past performance, which is not an indication or a guarantee of future results. The Fund’s average
annual total returns include changes in share price and reinvestment of dividends and capital gains. Class A returns reflect the maximum
initial sales charge and Class C returns reflect the applicable contingent deferred sales charge. The chart and table above do not reflect the
deduction of taxes that a shareholder would have paid on Fund distributions or on the redemption of Fund shares. Investment return
and principal will fluctuate and the Fund’s shares, when redeemed, may be worth more or less than their original cost. Current performance
may be higher or lower than the performance quoted. For updated performance, visit us at www.alger.com or call us at (800) 992-3863.
- 25 -
ALGER HEALTH SCIENCES FUND
Fund Highlights Through October 31, 2017 (Unaudited)
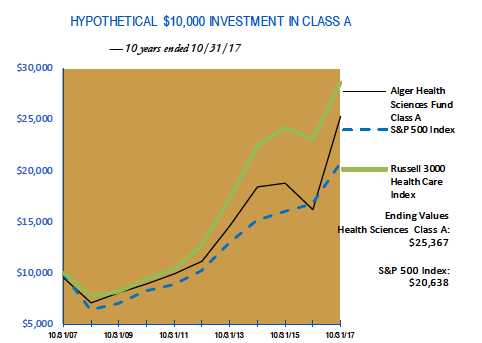
The chart above illustrates the change in value of a hypothetical $10,000 investment made in the Alger Health
Sciences Fund Class A shares, with a maximum sales charge of 5.25%, the S&P 500 Index and the Russel 3000
Health Care Index (an unmanaged index of common stocks) for the ten years ended October 31, 2017. Figures for
the Alger Health Sciences Fund Class A shares, the S&P 500 Index and the Russel 3000 Health Care Index include
reinvestment of dividends. Performance for the Alger Health Sciences Fund Class C and Class Z shares will vary
from the results shown above due to differences in expenses and sales charges those classes bear. Investors cannot
invest directly in any index. Index performance does not reflect deduction for fees, expenses, or taxes. The 1 year
performance ending October 31, 2017 shown in the graph above and the table below was significantly impacted
in a positive way by the disposition of a private equity investment held in the fund. It is unlikely that a similar
contribution to performance will reoccur in 2018.
- 26 -
ALGER HEALTH SCIENCES FUND
Fund Highlights Through October 31, 2017 (Unaudited) (Continued)
| | | | | | | | |
| PERFORMANCE COMPARISON AS OF 10/31/17 |
| AVERAGE ANNUAL TOTAL RETURNS |
| | | | | | | | Since | |
| | 1 YEAR | | 5 YEARS | | 10 YEARS | | 5/1/2002 | |
| Class A (Inception 5/1/02) | 48.88 | % | 16.54 | % | 9.76 | % | 12.02 | % |
| Class C (Inception 5/1/02) | 54.86 | % | 16.91 | % | 9.50 | % | 11.75 | % |
| S&P 500 Index | 23.63 | % | 15.18 | % | 7.51 | % | 7.90 | % |
| | | | | | |
| | | | | | Since | |
| | 1 YEAR | | 5 YEARS | 10 YEARS | 5/28/2015 | |
| Class Z (Inception 5/28/15) | 57.73 | % | n/a | n/a | 7.18 | % |
| S&P 500 Index | 23.63 | % | n/a | n/a | 10.61 | % |
The performance data quoted represents past performance, which is not an indication or a guarantee of future results. The Fund’s average
annual total returns include changes in share price and reinvestment of dividends and capital gains. Class A returns reflect the maximum
initial sales charge and Class C returns reflect the applicable contingent deferred sales charge. The chart and table above do not reflect the
deduction of taxes that a shareholder would have paid on Fund distributions or on the redemption of Fund shares. Investment return
and principal will fluctuate and the Fund’s shares, when redeemed, may be worth more or less than their original cost. Current performance
may be higher or lower than the performance quoted. For updated performance, visit us at www.alger.com or call us at (800) 992-3863.
- 27 -
ALGER GROWTH & INCOME FUND
Fund Highlights Through October 31, 2017 (Unaudited)
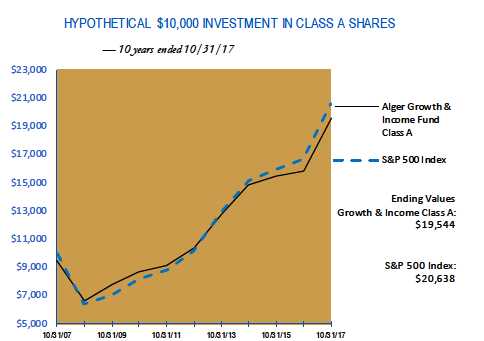
The chart above illustrates the change in value of a hypothetical $10,000 investment made in the Alger Growth &
Income Fund Class A shares, with a maximum sales charge of 5.25%, and the S&P 500 Index (an unmanaged index
of common stocks), for the ten years ended October 31, 2017. Beginning April 1, 2011, Alger Growth & Income
Fund changed its investment strategy to focus on securities that offer opportunities for capital appreciation as well
as pay dividends. Previously, under the name “Alger Balanced Fund”, its investment strategy focused on securities,
including fixed-income, with an emphasis on income-producing and a potential for capital appreciation. Figures for
the Alger Growth & Income Fund Class A shares, and the S&P 500 Index include reinvestment of dividends and/
or interest. Performance for the Alger Growth & Income Fund Class C and Class Z shares will vary from the results
shown above due to differences in expenses and sales charges those classes bear. Investors cannot invest directly in
any index. Index performance does not reflect deduction for fees, expenses, or taxes.
- 28 -
ALGER GROWTH & INCOME FUND
Fund Highlights Through October 31, 2017 (Unaudited) (Continued)
| | | | | | | | |
| PERFORMANCE COMPARISON AS OF 10/31/17 |
| AVERAGE ANNUAL TOTAL RETURNS |
| | | | | | | | Since | |
| | 1 YEAR | | 5 YEARS | | 10 YEARS | | 12/31/1996 | |
| Class A (Inception 12/31/96) | 16.75 | % | 12.25 | % | 6.93 | % | 8.12 | % |
| Class C (Inception 7/31/97)* | 21.28 | % | 12.61 | % | 6.70 | % | 7.92 | % |
| S&P 500 Index | 23.63 | % | 15.18 | % | 7.51 | % | 8.17 | % |
| | | | | | | |
| | | | | | | Since | |
| | 1 YEAR | | 5 YEARS | | 10 YEARS | 3/1/2012 | |
| Class Z (Inception 3/1/12) | 23.55 | % | 13.74 | % | n/a | 12.79 | % |
| S&P 500 Index | 23.63 | % | 15.18 | % | n/a | 14.10 | % |
The performance data quoted represents past performance, which is not an indication or a guarantee of future results. The Fund’s
average annual total returns include changes in share price and reinvestment of dividends and capital gains. Class A returns reflect the
maximum initial sales charge and Class C returns reflect the applicable contingent deferred sales charge. The chart and table above do
not reflect the deduction of taxes that a shareholder would have paid on Fund distributions or on the redemption of Fund shares. Prior
to April 1, 2011, the Fund followed a different investment objective and different strategies under the name “Alger Balanced Fund”.
Investment return and principal will fluctuate and the Fund’s shares, when redeemed, may be worth more or less than their original cost.
Current performance may be higher or lower than the performance quoted. For updated performance, visit us at www.alger.com or call
us at (800) 992-3863.
* Since inception performance is calculated since the inception of the Class A shares. Historical performance prior to July 31,
1997, inception of the class, is that of the Fund's Class A shares, reduced to reflect the current maximum sales charge and
the higher operating expenses of Class C shares.
- 29 -
PORTFOLIO SUMMARY†
October 31, 2017 (Unaudited)
| | | | | | | | | | | | |
| | | Alger Capital | | | Alger Mid Cap Growth | | | Alger SMid Cap Focus | | | Alger Small Cap Growth | |
| SECTORS | | Appreciation Fund | | | Fund | | | Fund | | | Fund | |
| Consumer Discretionary | | 18.0 | % | | 14.5 | % | | 14.9 | % | | 5.3 | % |
| Consumer Staples | | 1.9 | | | 1.9 | | | 0.0 | | | 1.2 | |
| Energy | | 1.2 | | | 1.1 | | | 0.0 | | | 1.1 | |
| Financials | | 7.0 | | | 7.4 | | | 6.7 | | | 4.6 | |
| Health Care | | 13.6 | | | 21.4 | | | 18.2 | | | 39.2 | |
| Industrials | | 5.9 | | | 13.9 | | | 16.1 | | | 6.3 | |
| Information Technology | | 45.7 | | | 30.8 | | | 35.5 | | | 37.3 | |
| Materials | | 3.7 | | | 5.4 | | | 0.0 | | | 2.1 | |
| Real Estate | | 2.2 | | | 2.3 | | | 5.0 | | | 1.0 | |
| Telecommunication Services | | 0.4 | | | 0.0 | | | 0.0 | | | 0.0 | |
| Short-Term Investments and | | | | | | | | | | | | |
| Net Other Assets | | 0.4 | | | 1.3 | | | 3.6 | | | 1.9 | |
| | | 100.0 | % | | 100.0 | % | | 100.0 | % | | 100.0 | % |
| |
| | | | | | Alger Small Cap Focus | | | Alger Health Sciences | | | Alger Growth & Income | |
| SECTORS | | | | | Fund | | | Fund | | | Fund | |
| Consumer Discretionary | | | | | 0.9 | % | | 0.0 | % | | 12.6 | % |
| Consumer Staples | | | | | 1.4 | | | 0.0 | | | 9.1 | |
| Energy | | | | | 0.0 | | | 0.0 | | | 5.0 | |
| Financials | | | | | 4.4 | | | 0.0 | | | 15.6 | |
| Health Care | | | | | 40.1 | | | 97.8 | | | 14.5 | |
| Industrials | | | | | 8.2 | | | 0.0 | | | 10.7 | |
| Information Technology | | | | | 42.0 | | | 0.0 | | | 22.2 | |
| Materials | | | | | 1.9 | | | 0.0 | | | 1.7 | |
| Real Estate | | | | | 0.0 | | | 0.0 | | | 2.4 | |
| Telecommunication Services | | | | | 0.0 | | | 0.0 | | | 2.7 | |
| Utilities | | | | | 0.0 | | | 0.0 | | | 0.8 | |
| Short-Term Investments and Net Other Assets | | | 1.1 | | | 2.2 | | | 2.7 | |
| | | | | | 100.0 | % | | 100.0 | % | | 100.0 | % |
- 30 -
PORTFOLIO SUMMARY†
October 31, 2017 (Unaudited) (Continued)
| | | |
| | | Alger International | |
| COUNTRY | | Growth Fund | |
| Argentina | | 0.3 | % |
| Australia | | 1.4 | |
| Austria | | 3.2 | |
| Brazil | | 0.6 | |
| Canada | | 9.0 | |
| China | | 10.4 | |
| Denmark | | 0.3 | |
| France | | 7.4 | |
| Germany | | 12.4 | |
| Hong Kong | | 2.4 | |
| India | | 0.8 | |
| Italy | | 2.5 | |
| Japan | | 16.8 | |
| Luxembourg | | 1.4 | |
| Netherlands | | 1.6 | |
| Norway | | 1.0 | |
| Russia | | 0.5 | |
| South Korea | | 4.5 | |
| Sweden | | 4.1 | |
| Switzerland | | 5.7 | |
| Taiwan | | 3.6 | |
| United Kingdom | | 5.3 | |
| United States | | 3.9 | |
| Cash and Net Other Assets | | 0.9 | |
| | | 100.0 | % |
† Based on net assets for each Fund.
- 31 -
THE ALGER FUNDS | ALGER CAPITAL APPRECIATION FUND
Schedule of Investments October 31, 2017
| | | | | |
| COMMON STOCKS—96.1% | | SHARES | | | VALUE |
| AEROSPACE & DEFENSE—0.5% | | | | | |
| General Dynamics Corp. | | 59,667 | | $ | 12,111,208 |
| The Boeing Co. | | 10,287 | | | 2,653,840 |
| | | | | | 14,765,048 |
| APPAREL ACCESSORIES & LUXURY GOODS—0.8% | | | | | |
| adidas AG | | 35,891 | | | 7,988,737 |
| PVH Corp. | | 108,462 | | | 13,754,066 |
| | | | | | 21,742,803 |
| APPLICATION SOFTWARE—4.0% | | | | | |
| Adobe Systems, Inc. * | | 135,268 | | | 23,693,543 |
| Autodesk, Inc. * | | 227,595 | | | 28,440,271 |
| salesforce. com, Inc. * | | 583,212 | | | 59,685,916 |
| | | | | 111,819,730 |
| ASSET MANAGEMENT & CUSTODY BANKS—0.7% | | | | | |
| BlackRock, Inc. , Cl. A | | 25,903 | | | 12,195,910 |
| WisdomTree Investments, Inc. | | 594,567 | | | 6,593,748 |
| | | | | | 18,789,658 |
| AUTO PARTS & EQUIPMENT—0.5% | | | | | |
| Delphi Automotive PLC. | | 142,476 | | | 14,159,265 |
| BIOTECHNOLOGY—4.3% | | | | | |
| AbbVie, Inc. | | 91,806 | | | 8,285,492 |
| ACADIA Pharmaceuticals, Inc. * | | 158,111 | | | 5,507,006 |
| BioMarin Pharmaceutical, Inc. * | | 111,131 | | | 9,122,744 |
| Celgene Corp. * | | 298,903 | | | 30,180,236 |
| Clovis Oncology, Inc. * | | 49,713 | | | 3,746,869 |
| Exact Sciences Corp. * | | 348,652 | | | 19,172,373 |
| Incyte Corp. * | | 24,409 | | | 2,764,319 |
| Sarepta Therapeutics, Inc. * | | 132,000 | | | 6,508,920 |
| Vertex Pharmaceuticals, Inc. * | | 238,133 | | | 34,822,188 |
| | | | | 120,110,147 |
| BROADCASTING—0.9% | | | | | |
| CBS Corp. , Cl. B | | 454,076 | | | 25,482,745 |
| BUILDING PRODUCTS—0.2% | | | | | |
| Johnson Controls International PLC. | | 166,535 | | | 6,892,884 |
| CABLE & SATELLITE—1.2% | | | | | |
| Charter Communications, Inc. , Cl. A* | | 13,352 | | | 4,461,838 |
| Comcast Corp. , Cl. A | | 777,889 | | | 28,027,341 |
| | | | | | 32,489,179 |
| COMMUNICATIONS EQUIPMENT—0.3% | | | | | |
| Palo Alto Networks, Inc. * | | 47,774 | | | 7,032,333 |
| CONSTRUCTION MATERIALS—0.7% | | | | | |
| Vulcan Materials Co. | | 171,104 | | | 20,831,912 |
| CONSUMER FINANCE—0.2% | | | | | |
| LendingClub Corp. * | | 1,208,860 | | | 6,878,413 |
| DATA PROCESSING & OUTSOURCED SERVICES—3.8% | | | | |
| Visa, Inc. , Cl. A | | 956,916 | | 105,241,622 |
- 32 -
THE ALGER FUNDS | ALGER CAPITAL APPRECIATION FUND
Schedule of Investments October 31, 2017 (Continued)
| | | | | |
| COMMON STOCKS—96.1% (CONT. ) | | SHARES | | | VALUE |
| DIVERSIFIED BANKS—2.4% | | | | | |
| Bank of America Corp. | | 1,522,528 | | $ | 41,702,042 |
| Citigroup, Inc. | | 184,173 | | | 13,536,716 |
| JPMorgan Chase & Co. | | 125,917 | | | 12,668,509 |
| | | | | | 67,907,267 |
| DIVERSIFIED CHEMICALS—0.4% | | | | | |
| DowDuPont, Inc. * | | 169,789 | | | 12,277,443 |
| FINANCIAL EXCHANGES & DATA—1.8% | | | | | |
| Intercontinental Exchange, Inc. | | 549,915 | | | 36,349,381 |
| S&P Global, Inc. | | 81,127 | | | 12,693,942 |
| | | | | | 49,043,323 |
| FOOD DISTRIBUTORS—0.1% | | | | | |
| Performance Food Group Co. * | | 92,727 | | | 2,624,174 |
| HEALTH CARE EQUIPMENT—3.0% | | | | | |
| ABIOMED, Inc. * | | 30,377 | | | 5,860,331 |
| Boston Scientific Corp. * | | 743,880 | | | 20,932,783 |
| Danaher Corp. | | 372,527 | | | 34,373,066 |
| Intuitive Surgical, Inc. | | 22,365 | | | 8,394,926 |
| Medtronic PLC. | | 192,599 | | | 15,508,072 |
| | | | | | 85,069,178 |
| HOME ENTERTAINMENT SOFTWARE—0.7% | | | | | |
| Electronic Arts, Inc. * | | 159,520 | | | 19,078,592 |
| HOME IMPROVEMENT RETAIL—2.0% | | | | | |
| The Home Depot, Inc. | | 329,699 | | | 54,657,500 |
| HOTELS RESORTS & CRUISE LINES—0.5% | | | | | |
| Norwegian Cruise Line Holdings Ltd. * | | 248,901 | | | 13,876,231 |
| HOUSEWARES & SPECIALTIES—0.6% | | | | | |
| Newell Brands, Inc. | | 388,026 | | | 15,823,700 |
| HYPERMARKETS & SUPER CENTERS—0.7% | | | | | |
| Wal-Mart Stores, Inc. | | 226,959 | | | 19,815,790 |
| INDUSTRIAL CONGLOMERATES—2.4% | | | | | |
| Honeywell International, Inc. | | 460,047 | | | 66,320,376 |
| INDUSTRIAL GASES—1.3% | | | | | |
| Air Products & Chemicals, Inc. | | 220,365 | | | 35,132,792 |
| INDUSTRIAL MACHINERY—1.4% | | | | | |
| Stanley Black & Decker, Inc. | | 234,168 | | | 37,829,840 |
| INTERNET & DIRECT MARKETING RETAIL—9.6% | | | | | |
| Amazon. com, Inc. * | | 194,247 | | | 214,697,324 |
| Expedia, Inc. | | 170,115 | | | 21,206,536 |
| Netflix, Inc. * | | 131,409 | | | 25,812,670 |
| The Priceline Group, Inc. * | | 3,514 | | | 6,718,627 |
| | | | | 268,435,157 |
| INTERNET SOFTWARE & SERVICES—13.8% | | | | | |
| Alibaba Group Holding Ltd. #* | | 417,450 | | | 77,182,331 |
| Alphabet, Inc. , Cl. C* | | 137,361 | | | 139,646,687 |
| Altaba, Inc. * | | 323,047 | | | 22,652,056 |
- 33 -
THE ALGER FUNDS | ALGER CAPITAL APPRECIATION FUND
Schedule of Investments October 31, 2017 (Continued)
| | | | | |
| COMMON STOCKS—96.1% (CONT. ) | | SHARES | | | VALUE |
| INTERNET SOFTWARE & SERVICES—13.8% (CONT. ) | | | | | |
| Facebook, Inc. , Cl. A* | | 815,269 | | $ | 146,797,336 |
| Palantir Technologies, Inc. , Cl. A*,@,(b) | | 153,282 | | | 881,371 |
| | | | | 387,159,781 |
| INVESTMENT BANKING & BROKERAGE—0.9% | | | | | |
| Morgan Stanley | | 503,091 | | | 25,154,550 |
| IT CONSULTING & OTHER SERVICES—1.1% | | | | | |
| Cognizant Technology Solutions Corp. , Cl. A | | 391,974 | | | 29,660,673 |
| LEISURE FACILITIES—0.6% | | | | | |
| Vail Resorts, Inc. | | 78,853 | | | 18,058,914 |
| LIFE SCIENCES TOOLS & SERVICES—1.0% | | | | | |
| Illumina, Inc. * | | 73,499 | | | 15,081,260 |
| Thermo Fisher Scientific, Inc. | | 70,627 | | | 13,689,631 |
| | | | | | 28,770,891 |
| MANAGED HEALTH CARE—4.7% | | | | | |
| Aetna, Inc. | | 246,322 | | | 41,882,130 |
| Cigna Corp. | | 23,668 | | | 4,667,803 |
| Humana, Inc. | | 45,936 | | | 11,729,757 |
| UnitedHealth Group, Inc. | | 351,512 | | | 73,894,853 |
| | | | | 132,174,543 |
| MOVIES & ENTERTAINMENT—0.2% | | | | | |
| Time Warner, Inc. | | 59,393 | | | 5,837,738 |
| OIL & GAS EQUIPMENT & SERVICES—0.5% | | | | | |
| Halliburton Co. | | 311,764 | | | 13,324,793 |
| OIL & GAS EXPLORATION & PRODUCTION—0.8% | | | | | |
| Pioneer Natural Resources Co. | | 144,552 | | | 21,635,098 |
| PERSONAL PRODUCTS—0.4% | | | | | |
| The Estee Lauder Cos, Inc. , Cl. A | | 97,938 | | | 10,950,448 |
| PHARMACEUTICALS—0.3% | | | | | |
| Bristol-Myers Squibb Co. | | 151,005 | | | 9,310,968 |
| RAILROADS—0.7% | | | | | |
| Union Pacific Corp. | | 175,631 | | | 20,336,313 |
| RESTAURANTS—1.2% | | | | | |
| McDonald's Corp. | | 209,514 | | | 34,969,982 |
| SEMICONDUCTOR EQUIPMENT—1.2% | | | | | |
| Applied Materials, Inc. | | 605,661 | | | 34,177,450 |
| SEMICONDUCTORS—6.0% | | | | | |
| Broadcom Ltd. | | 317,100 | | | 83,685,861 |
| Cavium, Inc. * | | 169,630 | | | 11,702,774 |
| Microchip Technology, Inc. | | 427,607 | | | 40,537,143 |
| Micron Technology, Inc. * | | 463,794 | | | 20,550,712 |
| NVIDIA Corp. | | 60,648 | | | 12,542,613 |
| | | | | 169,019,103 |
| SOFT DRINKS—0.1% | | | | | |
| PepsiCo, Inc. | | 24,649 | | | 2,717,059 |
- 34 -
THE ALGER FUNDS | ALGER CAPITAL APPRECIATION FUND
Schedule of Investments October 31, 2017 (Continued)
| | | | | |
| COMMON STOCKS—96.1% (CONT. ) | | SHARES | | | VALUE |
| SPECIALTY CHEMICALS—1.2% | | | | | |
| The Sherwin-Williams Co. | | 86,286 | | $ | 34,095,913 |
| SYSTEMS SOFTWARE—7.6% | | | | | |
| Choicestream, Inc. *,@,(a),(b) | | 82,955 | | | – |
| Microsoft Corp. | | 2,134,713 | | | 177,565,427 |
| Oracle Corp. | | 109,903 | | | 5,594,063 |
| Red Hat, Inc. * | | 120,787 | | | 14,594,693 |
| ServiceNow, Inc. * | | 129,834 | | | 16,407,123 |
| | | | | 214,161,306 |
| TECHNOLOGY HARDWARE STORAGE & PERIPHERALS—7.1% | | | |
| Apple, Inc. | | 1,090,750 | | | 184,380,380 |
| Western Digital Corp. | | 153,777 | | | 13,727,673 |
| | | | | 198,108,053 |
| TOBACCO—0.6% | | | | | |
| Philip Morris International, Inc. | | 168,126 | | | 17,592,705 |
| TRADING COMPANIES & DISTRIBUTORS—0.7% | | | | | |
| HD Supply Holdings, Inc. * | | 222,889 | | | 7,888,042 |
| United Rentals, Inc. * | | 82,876 | | | 11,725,296 |
| | | | | | 19,613,338 |
| WIRELESS TELECOMMUNICATION SERVICES—0.4% | | | | | |
| T-Mobile US, Inc. * | | 173,659 | | | 10,379,598 |
| TOTAL COMMON STOCKS | | | | | |
| (Cost $1,930,039,027) | | | | 2,691,336,319 |
| PREFERRED STOCKS—0.3% | | SHARES | | | VALUE |
| INTERNET SOFTWARE & SERVICES—0.1% | | | | | |
| Palantir Technologies, Inc. , Cl. B*,@,(b) | | 625,130 | | | 3,594,498 |
| Palantir Technologies, Inc. , Cl. D*,@,(b) | | 81,445 | | | 468,309 |
| | | | | | 4,062,807 |
| PHARMACEUTICALS—0.2% | | | | | |
| Intarcia Therapeutics, Inc. , Series DD*,@,(b) | | 76,682 | | | 4,403,847 |
| SYSTEMS SOFTWARE—0.0% | | | | | |
| Choicestream, Inc. , Series A*,@,(a),(b) | | 715,332 | | | – |
| Choicestream, Inc. , Series B*,@,(a),(b) | | 1,649,956 | | | – |
| | | | | | – |
| TOTAL PREFERRED STOCKS | | | | | |
| (Cost $8,711,512) | | | | | 8,466,654 |
| WARRANTS—0.0% | | SHARES | | | VALUE |
| SYSTEMS SOFTWARE—0.0% | | | | | |
| Choicestream, Inc. , 6/22/26*,@,(a),(b) | | 387,502 | | | – |
| (Cost $387,114) | | | | | – |
| MASTER LIMITED PARTNERSHIP—1.0% | | SHARES | | | VALUE |
| ASSET MANAGEMENT & CUSTODY BANKS—1.0% | | | | | |
| The Blackstone Group LP. | | 844,990 | | | 28,129,717 |
| (Cost $24,182,133) | | | | | 28,129,717 |
- 35 -
THE ALGER FUNDS | ALGER CAPITAL APPRECIATION FUND
Schedule of Investments October 31, 2017 (Continued)
| | | | | | |
| REAL ESTATE INVESTMENT TRUST—2.2% | | SHARES | | | | VALUE |
| SPECIALIZED—2.2% | | | | | | |
| Crown Castle International Corp. | | 162,428 | | | $ | 17,392,790 |
| Equinix, Inc. | | 93,727 | | | | 43,442,465 |
| | | | | | | 60,835,255 |
| TOTAL REAL ESTATE INVESTMENT TRUST | | | | | | |
| (Cost $53,504,714) | | | | | | 60,835,255 |
| | | PRINCIPAL | | | | |
| CORPORATE BONDS—0.0% | | AMOUNT | | | | VALUE |
| SYSTEMS SOFTWARE—0.0% | | | | | | |
| Choicestream, Inc. , 11.00%, 8/05/18@,(a),(b) | | 387,502 | | | | – |
| (Cost $388) | | | | | | – |
| Total Investments | | | | | | |
| (Cost $2,016,824,888) | | 99.6% | | $ | | 2,788,767,945 |
| Affiliated Securities (Cost $1,973,570) | | | | | | – |
| Unaffiliated Securities (Cost $2,014,851,318) | | | | | | 2,788,767,945 |
| Other Assets in Excess of Liabilities | | 0.4 | % | | | 12,490,859 |
| NET ASSETS | | 100.0 | % | $ | 2,801,258,804 |
# American Depositary Receipts.
(a) Deemed an affiliate of the Alger fund complex during the year for purposes of Section 2(a)(3) of the Investment Company
Act of 1940. See Affiliated Securities Note 11.
(b) Security is valued in good faith at fair value determined using significant unobservable inputs pursuant to procedures established
by the Board.
* Non-income producing security.
@ Restricted security - Investment in security not registered under the Securities Act of 1933. The investment is deemed to not be
liquid and may be sold only to qualified buyers.
| | | | | | | | | |
| | | | | % of net assets | | | | % of net assets | |
| | Acquisition | | Acquisition | (Acquisition | | | Market | as of | |
| Security | Date(s) | | Cost | Date) | | | Value | 10/31/2017 | |
| Choicestream, Inc. | 03/14/14 | $ | 24,057 | 0.00 | % | $ | 0 | 0.00 | % |
| Choicestream, Inc. , 11.00%, | | | | | | | | | |
| 8/05/18 | 08/04/16 | | 388 | 0.00 | % | | 0 | 0.00 | % |
| Choicestream, Inc. , 6/22/26 | 08/04/16 | | 387,114 | 0.02 | % | | 0 | 0.00 | % |
| Choicestream, Inc. , Series A | 12/17/13 | | 572,038 | 0.03 | % | | 0 | 0.00 | % |
| Choicestream, Inc. , Series B | 07/10/14 | | 989,973 | 0.05 | % | | 0 | 0.00 | % |
| Intarcia Therapeutics, Inc. , Series | | | | | | | | | |
| DD | 03/27/14 | | 2,483,730 | 0.14 | % | | 4,403,847 | 0.16 | % |
| Palantir Technologies, Inc. , Cl. A | 10/07/14 | | 997,406 | 0.05 | % | | 881,371 | 0.03 | % |
| Palantir Technologies, Inc. , Cl. B | 10/07/14 | | 4,128,004 | 0.22 | % | | 3,594,498 | 0.13 | % |
| Palantir Technologies, Inc. , Cl. D | 10/14/14 | | 537,767 | 0.03 | % | | 468,309 | 0.01 | % |
| Total | | | | | | $ | 9,348,025 | 0.33 | % |
| | | | | | | | | | |
Industry classifications are unaudited.
See Notes to Financial Statements.
- 36 -
THE ALGER FUNDS | ALGER INTERNATIONAL GROWTH FUND
Schedule of Investments October 31, 2017
| | | | |
| COMMON STOCKS—99.1% | | SHARES | | VALUE |
| ARGENTINA—0.3% | | | | |
| INTERNET & DIRECT MARKETING RETAIL—0.3% | | | | |
| Despegar. com Corp. * | | 20,088 | $ | 618,710 |
| (Cost $542,845) | | | | |
| AUSTRALIA—1.4% | | | | |
| DIVERSIFIED METALS & MINING—1.4% | | | | |
| Rio Tinto Ltd. | | 48,000 | | 2,557,910 |
| (Cost $2,404,516) | | | | |
| AUSTRIA—3.2% | | | | |
| DIVERSIFIED BANKS—3.2% | | | | |
| Bawag Group AG*,(a) | | 60,000 | | 3,180,040 |
| Erste Group Bank AG | | 58,000 | | 2,489,648 |
| | | | | 5,669,688 |
| (Cost $5,728,249) | | | | |
| BRAZIL—0.6% | | | | |
| DIVERSIFIED BANKS—0.6% | | | | |
| Banco Bradesco SA | | 100,000 | | 1,060,210 |
| (Cost $996,968) | | | | |
| CANADA—9.0% | | | | |
| DIVERSIFIED BANKS—1.9% | | | | |
| Royal Bank of Canada | | 44,000 | | 3,440,794 |
| FOOD RETAIL—1.2% | | | | |
| Alimentation Couche-Tard, Inc. , Cl. B | | 45,000 | | 2,110,280 |
| INTEGRATED OIL & GAS—0.9% | | | | |
| Suncor Energy, Inc. | | 45,000 | | 1,528,026 |
| LIFE & HEALTH INSURANCE—2.3% | | | | |
| Manulife Financial Corp. | | 207,000 | | 4,162,788 |
| OIL & GAS EXPLORATION & PRODUCTION—2.7% | | | | |
| Canadian Natural Resources Ltd. | | 85,000 | | 2,966,664 |
| Encana Corp. | | 162,000 | | 1,895,170 |
| | | | | 4,861,834 |
| TOTAL CANADA | | | | |
| (Cost $15,487,914) | | | | 16,103,722 |
| CHINA—10.4% | | | | |
| ALUMINUM—0.5% | | | | |
| Aluminum Corp. of China Ltd. , Cl. H* | | 1,000,000 | | 803,188 |
| AUTOMOBILE MANUFACTURERS—0.7% | | | | |
| BYD Co. , Ltd. , Cl. H | | 145,000 | | 1,267,834 |
| CASINOS & GAMING—0.7% | | | | |
| Sands China Ltd. | | 270,000 | | 1,273,754 |
| DIVERSIFIED BANKS—1.1% | | | | |
| China Construction Bank Corp. , Cl. H | | 2,170,000 | | 1,939,351 |
| ELECTRONIC EQUIPMENT & INSTRUMENTS—0.7% | | | | |
| Hangzhou Hikvision Digital Technology Co. , Ltd. , Cl. A | | 200,000 | | 1,185,321 |
| HEALTH CARE FACILITIES—0.7% | | | | |
| China Resources Phoenix Healthcare Holdings Co. , Ltd. | | 953,705 | | 1,252,602 |
- 37 -
THE ALGER FUNDS | ALGER INTERNATIONAL GROWTH FUND
Schedule of Investments October 31, 2017 (Continued)
| | | | |
| COMMON STOCKS—99.1% (CONT. ) | | SHARES | | VALUE |
| CHINA—10.4% (CONT. ) | | | | |
| INDUSTRIAL MACHINERY—0.4% | | | | |
| Shenzhen Inovance Technology Co. , Ltd. , Cl. A | | 149,940 | $ | 697,685 |
| INTERNET SOFTWARE & SERVICES—5.6% | | | | |
| Alibaba Group Holding Ltd. #* | | 39,044 | | 7,218,845 |
| Tencent Holdings Ltd. | | 65,800 | | 2,957,369 |
| | | | | 10,176,214 |
| TOTAL CHINA | | | | |
| (Cost $17,214,792) | | | | 18,595,949 |
| DENMARK—0.3% | | | | |
| BIOTECHNOLOGY—0.3% | | | | |
| Genmab A/S* | | 3,000 | | 605,802 |
| (Cost $675,637) | | | | |
| FRANCE—7.4% | | | | |
| APPAREL ACCESSORIES & LUXURY GOODS—1.0% | | | | |
| LVMH Moet Hennessy Louis Vuitton SE | | 6,000 | | 1,789,580 |
| AUTO PARTS & EQUIPMENT—1.1% | | | | |
| Valeo SA | | 28,061 | | 1,899,848 |
| DIVERSIFIED BANKS—1.9% | | | | |
| BNP Paribas SA | | 44,236 | | 3,452,599 |
| DIVERSIFIED SUPPORT SERVICES—0.6% | | | | |
| SPIE SA | | 39,000 | | 1,026,145 |
| ELECTRICAL COMPONENTS & EQUIPMENT—1.2% | | | | |
| Schneider Electric SE | | 24,900 | | 2,187,746 |
| INTEGRATED OIL & GAS—0.7% | | | | |
| TOTAL SA | | 23,000 | | 1,281,977 |
| PERSONAL PRODUCTS—0.9% | | | | |
| L'Oreal SA | | 7,500 | | 1,669,227 |
| TOTAL FRANCE | | | | |
| (Cost $12,516,646) | | | | 13,307,122 |
| GERMANY—12.4% | | | | |
| ADVERTISING—1.1% | | | | |
| Stroeer SE & Co. KGaA | | 31,600 | | 2,020,940 |
| APPAREL ACCESSORIES & LUXURY GOODS—0.6% | | | | |
| adidas AG | | 4,500 | | 1,001,625 |
| APPLICATION SOFTWARE—2.1% | | | | |
| SAP SE | | 33,264 | | 3,800,832 |
| AUTOMOBILE MANUFACTURERS—0.6% | | | | |
| Bayerische Motoren Werke AG | | 9,235 | | 947,145 |
| HEALTH CARE SERVICES—1.0% | | | | |
| Fresenius Medical Care AG & Co. KGaA | | 19,000 | | 1,839,618 |
| INDUSTRIAL CONGLOMERATES—1.6% | | | | |
| Siemens AG | | 20,045 | | 2,879,119 |
| INTEGRATED TELECOMMUNICATION SERVICES—1.0% | | | |
| Deutsche Telekom AG | | 100,000 | | 1,810,733 |
- 38 -
THE ALGER FUNDS | ALGER INTERNATIONAL GROWTH FUND
Schedule of Investments October 31, 2017 (Continued)
| | | | |
| COMMON STOCKS—99.1% (CONT. ) | | SHARES | | VALUE |
| GERMANY—12.4% (CONT. ) | | | | |
| INTERNET & DIRECT MARKETING RETAIL—0.3% | | | | |
| Shop Apotheke Europe NV*, (a) | | 7,630 | $ | 564,198 |
| MULTI-LINE INSURANCE—2.0% | | | | |
| Allianz SE | | 15,391 | | 3,593,166 |
| PHARMACEUTICALS—1.6% | | | | |
| Bayer AG | | 22,200 | | 2,887,753 |
| STEEL—0.5% | | | | |
| thyssenkrupp AG | | 34,000 | | 912,088 |
| TOTAL GERMANY | | | | |
| (Cost $20,702,635) | | | | 22,257,217 |
| HONG KONG—2.4% | | | | |
| HOUSEHOLD APPLIANCES—1.1% | | | | |
| Techtronic Industries Co. , Ltd. | | 330,000 | | 1,937,159 |
| LIFE & HEALTH INSURANCE—1.3% | | | | |
| AIA Group Ltd. | | 312,693 | | 2,356,276 |
| TOTAL HONG KONG | | | | |
| (Cost $3,848,285) | | | | 4,293,435 |
| INDIA—0.8% | | | | |
| DIVERSIFIED BANKS—0.8% | | | | |
| HDFC Bank Ltd. | | 50,200 | | 1,405,507 |
| (Cost $1,151,379) | | | | |
| ITALY—2.5% | | | | |
| DIVERSIFIED BANKS—1.1% | | | | |
| UniCredit SpA | | 100,000 | | 1,911,065 |
| INTERNET & DIRECT MARKETING RETAIL—1.0% | | | | |
| Yoox Net-A-Porter Group SpA | | 47,500 | | 1,774,299 |
| OIL & GAS EQUIPMENT & SERVICES—0.4% | | | | |
| Tenaris SA | | 60,000 | | 819,080 |
| TOTAL ITALY | | | | |
| (Cost $4,369,523) | | | | 4,504,444 |
| JAPAN—16.8% | | | | |
| COMMODITY CHEMICALS—1.4% | | | | |
| Toray Industries, Inc. | | 251,000 | | 2,540,533 |
| CONSTRUCTION & ENGINEERING—0.7% | | | | |
| Kyudenko Corp. | | 30,000 | | 1,324,582 |
| CONSUMER ELECTRONICS—1.5% | | | | |
| Sony Corp. | | 62,000 | | 2,593,751 |
| DIVERSIFIED BANKS—1.9% | | | | |
| Mitsubishi UFJ Financial Group, Inc. | | 501,000 | | 3,398,355 |
| ELECTRONIC COMPONENTS—1.3% | | | | |
| Alps Electric Co. , Ltd. | | 74,000 | | 2,264,700 |
| ELECTRONIC EQUIPMENT & INSTRUMENTS—0.7% | | | | |
| Keyence Corp. | | 2,400 | | 1,332,540 |
| GENERAL MERCHANDISE STORES—1.0% | | | | |
| Don Quijote Holdings Co. , Ltd. | | 43,000 | | 1,803,637 |
- 39 -
THE ALGER FUNDS | ALGER INTERNATIONAL GROWTH FUND
Schedule of Investments October 31, 2017 (Continued)
| | | | |
| COMMON STOCKS—99.1% (CONT. ) | | SHARES | | VALUE |
| JAPAN—16.8% (CONT. ) | | | | |
| HUMAN RESOURCE & EMPLOYMENT SERVICES—1.0% | | | |
| Persol Holdings Co. , Ltd. | | 75,000 | $ | 1,859,675 |
| INDUSTRIAL MACHINERY—3.2% | | | | |
| DMG Mori Co. , Ltd. | | 100,000 | | 2,016,559 |
| FANUC Corp. | | 10,700 | | 2,501,916 |
| Harmonic Drive Systems, Inc. | | 10,000 | | 519,632 |
| THK Co. , Ltd. | | 20,000 | | 729,524 |
| | | | | 5,767,631 |
| LIFE & HEALTH INSURANCE—1.2% | | | | |
| T&D Holdings, Inc. | | 130,000 | | 2,028,086 |
| REAL ESTATE SERVICES—1.0% | | | | |
| Open House Co. , Ltd. | | 45,000 | | 1,734,622 |
| SEMICONDUCTOR EQUIPMENT—0.4% | | | | |
| Disco Corp. | | 3,200 | | 741,526 |
| WIRELESS TELECOMMUNICATION SERVICES—1.5% | | | | |
| SoftBank Group Corp. | | 31,000 | | 2,747,288 |
| TOTAL JAPAN | | | | |
| (Cost $25,787,467) | | | | 30,136,926 |
| LUXEMBOURG—1.4% | | | | |
| REAL ESTATE OPERATING COMPANIES—1.4% | | | | |
| Aroundtown SA | | 370,000 | | 2,596,980 |
| (Cost $2,414,493) | | | | |
| NETHERLANDS—1.6% | | | | |
| DIVERSIFIED BANKS—0.3% | | | | |
| ING Groep NV | | 34,000 | | 628,303 |
| SEMICONDUCTOR EQUIPMENT—1.3% | | | | |
| ASML Holding NV | | 12,800 | | 2,313,600 |
| TOTAL NETHERLANDS | | | | |
| (Cost $2,790,161) | | | | 2,941,903 |
| NORWAY—1.0% | | | | |
| DIVERSIFIED BANKS—0.5% | | | | |
| Skandiabanken ASA(a) | | 81,000 | | 821,425 |
| PACKAGED FOODS & MEATS—0.5% | | | | |
| Leroy Seafood Group ASA | | 165,000 | | 990,847 |
| TOTAL NORWAY | | | | |
| (Cost $1,621,758) | | | | 1,812,272 |
| RUSSIA—0.5% | | | | |
| FOOD RETAIL—0.5% | | | | |
| X5 Retail Group NV*,(b) | | 20,000 | | 822,000 |
| (Cost $650,901) | | | | |
| SOUTH KOREA—4.5% | | | | |
| SEMICONDUCTORS—1.0% | | | | |
| SK Hynix, Inc. | | 23,000 | | 1,699,281 |
| STEEL—0.5% | | | | |
| POSCO | | 3,000 | | 876,224 |
- 40 -
THE ALGER FUNDS | ALGER INTERNATIONAL GROWTH FUND
Schedule of Investments October 31, 2017 (Continued)
| | | | |
| COMMON STOCKS—99.1% (CONT. ) | | SHARES | | VALUE |
| SOUTH KOREA—4.5% (CONT. ) | | | | |
| TECHNOLOGY HARDWARE STORAGE & PERIPHERALS—3.0% | | |
| Samsung Electronics Co. , Ltd. | | 2,200 | $ | 5,434,196 |
| TOTAL SOUTH KOREA | | | | |
| (Cost $7,096,786) | | | | 8,009,701 |
| SWEDEN—4.1% | | | | |
| BUILDING PRODUCTS—0.5% | | | | |
| Assa Abloy AB. , Cl. B | | 42,000 | | 885,433 |
| DIVERSIFIED BANKS—1.2% | | | | |
| Nordea Bank AB | | 184,000 | | 2,223,466 |
| ELECTRONIC MANUFACTURING SERVICES—0.7% | | | | |
| HMS Networks AB | | 67,766 | | 1,173,668 |
| HOUSEHOLD PRODUCTS—0.7% | | | | |
| Essity AB. , Cl. B* | | 43,000 | | 1,285,177 |
| OIL & GAS EXPLORATION & PRODUCTION—0.5% | | | | |
| Lundin Petroleum AB | | 40,000 | | 940,957 |
| REAL ESTATE OPERATING COMPANIES—0.5% | | | | |
| Fabege AB | | 43,000 | | 907,907 |
| TOTAL SWEDEN | | | | |
| (Cost $6,844,184) | | | | 7,416,608 |
| SWITZERLAND—5.7% | | | | |
| DIVERSIFIED CAPITAL MARKETS—2.9% | | | | |
| Credit Suisse Group AG | | 120,000 | | 1,891,250 |
| UBS Group AG | | 197,000 | | 3,351,918 |
| | | | | 5,243,168 |
| INDUSTRIAL MACHINERY—1.0% | | | | |
| Interroll Holding AG | | 1,245 | | 1,779,730 |
| PACKAGED FOODS & MEATS—1.8% | | | | |
| Nestle SA | | 38,000 | | 3,197,585 |
| TOTAL SWITZERLAND | | | | |
| (Cost $9,657,098) | | | | 10,220,483 |
| TAIWAN—3.6% | | | | |
| ENVIRONMENTAL & FACILITIES SERVICES—0.7% | | | | |
| Sunny Friend Environmental Technology Co. , Ltd. | | 200,000 | | 1,268,229 |
| INDUSTRIAL MACHINERY—1.1% | | | | |
| Airtac International Group | | 120,000 | | 1,946,574 |
| SEMICONDUCTORS—1.8% | | | | |
| Taiwan Semiconductor Manufacturing Co. , Ltd. | | 410,000 | | 3,316,929 |
| TOTAL TAIWAN | | | | |
| (Cost $5,898,466) | | | | 6,531,732 |
| UNITED KINGDOM—5.3% | | | | |
| ASSET MANAGEMENT & CUSTODY BANKS—1.2% | | | | |
| Man Group PLC. | | 843,518 | | 2,169,663 |
| HOUSEHOLD PRODUCTS—0.5% | | | | |
| Reckitt Benckiser Group PLC. | | 11,000 | | 984,356 |
- 41 -
THE ALGER FUNDS | ALGER INTERNATIONAL GROWTH FUND
Schedule of Investments October 31, 2017 (Continued)
| | | | | | |
| COMMON STOCKS—99.1% (CONT. ) | | SHARES | | | | VALUE |
| UNITED KINGDOM—5.3% (CONT. ) | | | | | | |
| IT CONSULTING & OTHER SERVICES—1.1% | | | | | | |
| Keywords Studios PLC. | | 90,819 | | | $ | 1,927,963 |
| PHARMACEUTICALS—0.9% | | | | | | |
| GlaxoSmithKline PLC. | | 87,104 | | | | 1,563,639 |
| TRADING COMPANIES & DISTRIBUTORS—1.6% | | | | | | |
| Ashtead Group PLC. | | 110,000 | | | | 2,834,187 |
| TOTAL UNITED KINGDOM | | | | | | |
| (Cost $8,360,366) | | | | | | 9,479,808 |
| UNITED STATES—3.9% | | | | | | |
| BUILDING PRODUCTS—0.4% | | | | | | |
| Johnson Controls International PLC. | | 15,000 | | | | 620,850 |
| HEALTH CARE EQUIPMENT—0.7% | | | | | | |
| Medtronic PLC. | | 16,000 | | | | 1,288,320 |
| PHARMACEUTICALS—0.5% | | | | | | |
| Allergan PLC. | | 5,000 | | | | 886,150 |
| SEMICONDUCTORS—2.3% | | | | | | |
| Broadcom Ltd. | | 15,632 | | | | 4,125,441 |
| TOTAL UNITED STATES | | | | | | |
| (Cost $6,627,067) | | | | | | 6,920,761 |
| TOTAL COMMON STOCKS | | | | | | |
| (Cost $163,388,136) | | | | | 177,868,890 |
| RIGHTS—0.0% | | SHARES | | | | VALUE |
| CHINA—0.0% | | | | | | |
| INTERNET SOFTWARE & SERVICES—0.0% | | | | | | |
| China Literature Ltd. , 11/08/17* | | 51 | | | | 337 |
| (Cost $–) | | | | | | |
| Total Investments | | | | | | |
| (Cost $163,388,136) | | 99.1 | % | $ | 177,869,227 |
| Unaffiliated Securities (Cost $163,388,136) | | | | | | 177,869,227 |
| Other Assets in Excess of Liabilities | | 0.9 | % | | | 1,574,353 |
| NET ASSETS | | 100.0 | % | $ | 179,443,580 |
# American Depositary Receipts.
(a) Pursuant to Securities and Exchange Commission Rule 144A, these securities may be sold prior to their maturity only to
qualified institutional buyers. These securities are however deemed to be liquid and represent 2.6% of the net assets of the
Fund.
(b) Global Depositary Receipts.
* Non-income producing security.
Industry classification are unaudited.
See Notes to Financial Statements.
- 42 -
THE ALGER FUNDS | ALGER MID CAP GROWTH FUND
Schedule of Investments October 31, 2017
| | | | |
| COMMON STOCKS—94.7% | | SHARES | | VALUE |
| AEROSPACE & DEFENSE—0.8% | | | | |
| HEICO Corp. | | 16,274 | $ | 1,475,726 |
| AIR FREIGHT & LOGISTICS—0.5% | | | | |
| XPO Logistics, Inc. * | | 11,797 | | 818,122 |
| APPAREL ACCESSORIES & LUXURY GOODS—1.7% | | | | |
| Michael Kors Holdings Ltd. * | | 15,248 | | 744,255 |
| PVH Corp. | | 17,958 | | 2,277,254 |
| | | | | 3,021,509 |
| APPAREL RETAIL—1.7% | | | | |
| Burlington Stores, Inc. * | | 15,433 | | 1,449,005 |
| Ross Stores, Inc. | | 27,119 | | 1,721,785 |
| | | | | 3,170,790 |
| APPLICATION SOFTWARE—3.7% | | | | |
| Autodesk, Inc. * | | 24,668 | | 3,082,513 |
| Paylocity Holding Corp. * | | 18,756 | | 1,001,758 |
| Splunk, Inc. * | | 22,938 | | 1,543,727 |
| Workday, Inc. , Cl. A* | | 10,894 | | 1,209,125 |
| | | | | 6,837,123 |
| ASSET MANAGEMENT & CUSTODY BANKS—1.0% | | | | |
| WisdomTree Investments, Inc. | | 169,767 | | 1,882,716 |
| AUTO PARTS & EQUIPMENT—1.0% | | | | |
| Delphi Automotive PLC. | | 17,738 | | 1,762,802 |
| BIOTECHNOLOGY—6.7% | | | | |
| Alexion Pharmaceuticals, Inc. * | | 5,379 | | 643,651 |
| BioMarin Pharmaceutical, Inc. * | | 10,965 | | 900,117 |
| Bluebird Bio, Inc. * | | 12,583 | | 1,750,295 |
| Clovis Oncology, Inc. * | | 23,020 | | 1,735,018 |
| Exact Sciences Corp. * | | 30,143 | | 1,657,564 |
| Incyte Corp. * | | 5,106 | | 578,254 |
| Sarepta Therapeutics, Inc. * | | 26,929 | | 1,327,869 |
| Spark Therapeutics, Inc. * | | 5,241 | | 423,997 |
| TESARO, Inc. * | | 12,720 | | 1,472,594 |
| Vertex Pharmaceuticals, Inc. * | | 12,336 | | 1,803,893 |
| | | | | 12,293,252 |
| BROADCASTING—0.5% | | | | |
| CBS Corp. , Cl. B | | 16,010 | | 898,481 |
| BUILDING PRODUCTS—1.5% | | | | |
| Fortune Brands Home & Security, Inc. | | 22,198 | | 1,466,400 |
| Johnson Controls International PLC. | | 9,396 | | 388,901 |
| Lennox International, Inc. | | 4,787 | | 914,939 |
| | | | | 2,770,240 |
| CASINOS & GAMING—0.8% | | | | |
| Wynn Resorts Ltd. | | 9,534 | | 1,406,170 |
| COMMUNICATIONS EQUIPMENT—2.6% | | | | |
| Lumentum Holdings, Inc. * | | 36,553 | | 2,308,322 |
| Palo Alto Networks, Inc. * | | 16,482 | | 2,426,150 |
| | | | | 4,734,472 |
- 43 -
THE ALGER FUNDS | ALGER MID CAP GROWTH FUND
Schedule of Investments October 31, 2017 (Continued)
| | | | |
| COMMON STOCKS—94.7% (CONT. ) | | SHARES | | VALUE |
| CONSTRUCTION MACHINERY & HEAVY TRUCKS—0.9% | | | |
| WABCO Holdings, Inc. * | | 11,821 | $ | 1,744,425 |
| CONSTRUCTION MATERIALS—1.3% | | | | |
| Vulcan Materials Co. | | 19,313 | | 2,351,358 |
| CONSUMER ELECTRONICS—0.0% | | | | |
| Roku, Inc. , Cl. A* | | 4,404 | | 89,754 |
| CONSUMER FINANCE—0.3% | | | | |
| LendingClub Corp. * | | 91,885 | | 522,826 |
| DATA PROCESSING & OUTSOURCED SERVICES—4.4% | | | |
| Alliance Data Systems Corp. | | 7,153 | | 1,600,341 |
| Fiserv, Inc. * | | 21,296 | | 2,756,341 |
| FleetCor Technologies, Inc. * | | 4,807 | | 794,453 |
| Total System Services, Inc. | | 23,332 | | 1,681,070 |
| WNS Holdings Ltd. #* | | 33,465 | | 1,268,993 |
| | | | | 8,101,198 |
| DIVERSIFIED SUPPORT SERVICES—0.6% | | | | |
| Cintas Corp. | | 7,001 | | 1,043,429 |
| ELECTRICAL COMPONENTS & EQUIPMENT—2.6% | | | | |
| AMETEK, Inc. | | 12,571 | | 848,417 |
| Hubbell, Inc. , Cl. B | | 13,933 | | 1,753,050 |
| Rockwell Automation, Inc. | | 10,587 | | 2,126,081 |
| | | | | 4,727,548 |
| ELECTRONIC COMPONENTS—0.8% | | | | |
| Universal Display Corp. | | 9,916 | | 1,452,694 |
| ELECTRONIC EQUIPMENT & INSTRUMENTS—1.3% | | | | |
| Cognex Corp. | | 5,113 | | 629,666 |
| Trimble, Inc. * | | 45,340 | | 1,853,499 |
| | | | | 2,483,165 |
| FERTILIZERS & AGRICULTURAL CHEMICALS—0.7% | | | | |
| FMC Corp. | | 13,234 | | 1,228,909 |
| FINANCIAL EXCHANGES & DATA—3.1% | | | | |
| Intercontinental Exchange, Inc. | | 32,859 | | 2,171,980 |
| MarketAxess Holdings, Inc. | | 9,899 | | 1,722,426 |
| S&P Global, Inc. | | 10,953 | | 1,713,816 |
| | | | | 5,608,222 |
| GENERAL MERCHANDISE STORES—1.1% | | | | |
| Dollar Tree, Inc. * | | 23,173 | | 2,114,536 |
| HEALTH CARE EQUIPMENT—5.2% | | | | |
| ABIOMED, Inc. * | | 14,824 | | 2,859,846 |
| Edwards Lifesciences Corp. * | | 4,780 | | 488,659 |
| IDEXX Laboratories, Inc. * | | 11,651 | | 1,936,047 |
| Insulet Corp. * | | 38,094 | | 2,240,308 |
| Intuitive Surgical, Inc. * | | 2,627 | | 986,071 |
| Masimo Corp. * | | 10,552 | | 926,044 |
| | | | | 9,436,975 |
- 44 -
THE ALGER FUNDS | ALGER MID CAP GROWTH FUND
Schedule of Investments October 31, 2017 (Continued)
| | | | |
| COMMON STOCKS—94.7% (CONT. ) | | SHARES | | VALUE |
| HEALTH CARE SUPPLIES—1.3% | | | | |
| Align Technology, Inc. * | | 9,823 | $ | 2,347,501 |
| HEALTH CARE TECHNOLOGY—0.7% | | | | |
| Medidata Solutions, Inc. * | | 17,554 | | 1,320,587 |
| HOME ENTERTAINMENT SOFTWARE—1.0% | | | | |
| Electronic Arts, Inc. * | | 15,359 | | 1,836,936 |
| HOME FURNISHINGS—0.6% | | | | |
| Mohawk Industries, Inc. * | | 4,381 | | 1,146,771 |
| HOMEBUILDING—0.6% | | | | |
| Lennar Corp. , Cl. A | | 19,187 | | 1,068,140 |
| HOTELS RESORTS & CRUISE LINES—2.1% | | | | |
| Extended Stay America, Inc. | | 111,904 | | 2,217,937 |
| Norwegian Cruise Line Holdings Ltd. * | | 29,453 | | 1,642,005 |
| | | | | 3,859,942 |
| HOUSEHOLD PRODUCTS—0.8% | | | | |
| Church & Dwight Co. , Inc. | | 34,319 | | 1,550,189 |
| HOUSEWARES & SPECIALTIES—0.6% | | | | |
| Newell Brands, Inc. | | 26,082 | | 1,063,624 |
| INDUSTRIAL CONGLOMERATES—1.5% | | | | |
| Roper Technologies, Inc. | | 10,654 | | 2,750,543 |
| INDUSTRIAL GASES—1.1% | | | | |
| Air Products & Chemicals, Inc. | | 12,454 | | 1,985,541 |
| INDUSTRIAL MACHINERY—3.4% | | | | |
| Fortive Corp. | | 25,094 | | 1,813,292 |
| Parker-Hannifin Corp. | | 7,440 | | 1,358,618 |
| Stanley Black & Decker, Inc. | | 13,701 | | 2,213,397 |
| Welbilt, Inc. * | | 37,978 | | 837,795 |
| | | | | 6,223,102 |
| INTERNET & DIRECT MARKETING RETAIL—1.4% | | | | |
| Despegar. com Corp. * | | 23,758 | | 731,747 |
| Expedia, Inc. | | 15,599 | | 1,944,571 |
| | | | | 2,676,318 |
| INTERNET SOFTWARE & SERVICES—1.2% | | | | |
| LogMeIn, Inc. | | 9,160 | | 1,108,818 |
| Match Group, Inc. * | | 38,649 | | 1,033,474 |
| Palantir Technologies, Inc. , Cl. A*,@,(a) | | 16,376 | | 94,162 |
| | | | | 2,236,454 |
| IT CONSULTING & OTHER SERVICES—2.4% | | | | |
| DXC Technology Co. | | 14,796 | | 1,354,130 |
| EPAM Systems, Inc. * | | 20,408 | | 1,860,189 |
| Gartner, Inc. * | | 10,125 | | 1,268,764 |
| | | | | 4,483,083 |
| LEISURE FACILITIES—1.1% | | | | |
| Vail Resorts, Inc. | | 9,091 | | 2,082,021 |
| LIFE SCIENCES TOOLS & SERVICES—3.3% | | | | |
| Agilent Technologies, Inc. | | 19,083 | | 1,298,217 |
- 45 -
THE ALGER FUNDS | ALGER MID CAP GROWTH FUND
Schedule of Investments October 31, 2017 (Continued)
| | | | |
| COMMON STOCKS—94.7% (CONT. ) | | SHARES | | VALUE |
| LIFE SCIENCES TOOLS & SERVICES—3.3% (CONT. ) | | | | |
| Illumina, Inc. * | | 12,232 | $ | 2,509,884 |
| Mettler-Toledo International, Inc. * | | 2,243 | | 1,531,139 |
| PRA Health Sciences, Inc. * | | 9,059 | | 737,674 |
| | | | | 6,076,914 |
| MANAGED HEALTH CARE—0.9% | | | | |
| Cigna Corp. | | 2,273 | | 448,281 |
| WellCare Health Plans, Inc. * | | 6,366 | | 1,258,813 |
| | | | | 1,707,094 |
| METAL & GLASS CONTAINERS—1.0% | | | | |
| Ball Corp. | | 44,396 | | 1,905,920 |
| OIL & GAS EXPLORATION & PRODUCTION—1.1% | | | | |
| Encana Corp. | | 81,762 | | 956,615 |
| Pioneer Natural Resources Co. | | 7,540 | | 1,128,512 |
| | | | | 2,085,127 |
| PACKAGED FOODS & MEATS—1.0% | | | | |
| McCormick & Co. , Inc. | | 11,101 | | 1,104,882 |
| Pinnacle Foods, Inc. | | 14,704 | | 800,192 |
| | | | | 1,905,074 |
| PAPER PACKAGING—0.9% | | | | |
| International Paper Co. | | 29,409 | | 1,684,254 |
| PHARMACEUTICALS—2.1% | | | | |
| Aerie Pharmaceuticals, Inc. * | | 30,365 | | 1,875,039 |
| GW Pharmaceuticals PLC. #* | | 2,892 | | 312,191 |
| Zoetis, Inc. , Cl. A | | 22,410 | | 1,430,206 |
| Zogenix, Inc. * | | 5,128 | | 192,300 |
| | | | | 3,809,736 |
| PROPERTY & CASUALTY INSURANCE—1.1% | | | | |
| The Progressive Corp. | | 40,172 | | 1,954,368 |
| RAILROADS—0.4% | | | | |
| Kansas City Southern | | 6,549 | | 682,537 |
| REGIONAL BANKS—1.8% | | | | |
| Citizens Financial Group, Inc. | | 23,317 | | 886,279 |
| Regions Financial Corp. | | 149,868 | | 2,319,957 |
| | | | | 3,206,236 |
| RESEARCH & CONSULTING SERVICES—0.5% | | | | |
| FTI Consulting, Inc. * | | 20,737 | | 886,507 |
| RESTAURANTS—0.5% | | | | |
| Dunkin' Brands Group, Inc. | | 16,611 | | 981,212 |
| SEMICONDUCTOR EQUIPMENT—2.3% | | | | |
| Lam Research Corp. | | 20,326 | | 4,239,394 |
| SEMICONDUCTORS—5.5% | | | | |
| Broadcom Ltd. | | 11,763 | | 3,104,373 |
| Cavium, Inc. * | | 36,940 | | 2,548,491 |
| Microchip Technology, Inc. | | 27,741 | | 2,629,847 |
- 46 -
THE ALGER FUNDS | ALGER MID CAP GROWTH FUND
Schedule of Investments October 31, 2017 (Continued)
| | | | | |
| COMMON STOCKS—94.7% (CONT. ) | | SHARES | | | VALUE |
| SEMICONDUCTORS—5.5% (CONT. ) | | | | | |
| Skyworks Solutions, Inc. | | 16,118 | | $ | 1,835,195 |
| | | | | | 10,117,906 |
| SPECIALIZED CONSUMER SERVICES—0.7% | | | | | |
| ServiceMaster Global Holdings, Inc. * | | 28,502 | | | 1,342,729 |
| SPECIALTY CHEMICALS—0.4% | | | | | |
| Axalta Coating Systems Ltd. * | | 24,551 | | | 816,321 |
| SYSTEMS SOFTWARE—4.5% | | | | | |
| Dell Technologies, Inc. , Cl. V* | | 15,794 | | | 1,307,269 |
| Proofpoint, Inc. * | | 20,031 | | | 1,851,065 |
| Red Hat, Inc. * | | 24,750 | | | 2,990,543 |
| ServiceNow, Inc. * | | 16,490 | | | 2,083,841 |
| | | | | | 8,232,718 |
| TECHNOLOGY HARDWARE STORAGE & PERIPHERALS—0.8% | | | |
| Western Digital Corp. | | 16,124 | | | 1,439,390 |
| TRADING COMPANIES & DISTRIBUTORS—0.8% | | | | | |
| United Rentals, Inc. * | | 10,985 | | | 1,554,158 |
| TRUCKING—0.5% | | | | | |
| Old Dominion Freight Line, Inc. | | 7,703 | | | 933,064 |
| TOTAL COMMON STOCKS | | | | | |
| (Cost $163,335,256) | | | | 174,167,853 |
| PREFERRED STOCKS—0.6% | | SHARES | | | VALUE |
| BIOTECHNOLOGY—0.4% | | | | | |
| Prosetta Biosciences, Inc. , Series D*,@,(a),(b) | | 219,610 | | | 685,183 |
| INTERNET SOFTWARE & SERVICES—0.2% | | | | | |
| Palantir Technologies, Inc. , Cl. B*,@,(a) | | 66,787 | | | 384,025 |
| Palantir Technologies, Inc. , Cl. D*,@,(a) | | 8,701 | | | 50,031 |
| | | | | | 434,056 |
| TOTAL PREFERRED STOCKS | | | | | |
| (Cost $1,486,720) | | | | | 1,119,239 |
| RIGHTS—0.9% | | SHARES | | | VALUE |
| BIOTECHNOLOGY—0.9% | | | | | |
| Tolero CDR*,@,(a),(c) | | 590,059 | | | 1,685,090 |
| | | | | | 1,685,090 |
| TOTAL RIGHTS | | | | | |
| (Cost $315,501) | | | | | 1,685,090 |
| REAL ESTATE INVESTMENT TRUST—2.3% | | SHARES | | | VALUE |
| HEALTH CARE—0.3% | | | | | |
| Omega Healthcare Investors, Inc. | | 22,865 | | | 659,884 |
| SPECIALIZED—2.0% | | | | | |
| CyrusOne, Inc. | | 26,967 | | | 1,655,504 |
| SBA Communications Corp. , Cl. A* | | 12,394 | | | 1,948,089 |
| | | | | | 3,603,593 |
| TOTAL REAL ESTATE INVESTMENT TRUST | | | | | |
| (Cost $4,060,102) | | | | | 4,263,477 |
- 47 -
THE ALGER FUNDS | ALGER MID CAP GROWTH FUND
Schedule of Investments October 31, 2017 (Continued)
| | | | | | |
| SPECIAL PURPOSE VEHICLE—0.2% | | SHARES | | | | VALUE |
| CONSUMER FINANCE—0.2% | | | | | | |
| JS Kred SPV I, LLC. *,@,(a) | | 314,956 | | | $ | 380,215 |
| (Cost $314,956) | | | | | | 380,215 |
| Total Investments | | | | | | |
| (Cost $169,512,535) | | 98.7% | | | | 181,615,874 |
| Affiliated Securities (Cost $988,245) | | | | | | 685,183 |
| Unaffiliated Securities (Cost $168,524,290) | | | | | | 180,930,691 |
| Other Assets in Excess of Liabilities | | 1.3 | % | | | 2,298,289 |
| NET ASSETS | | 100.0 | % | $ | 183,914,163 |
# American Depositary Receipts.
(a) Security is valued in good faith at fair value determined using significant unobservable inputs pursuant to procedures established by the
Board.
(b)Deemed an affiliate of the Alger fund complex during the year for purposes of Section 2(a)(3) of the Investment Company Act of
1940. See Affiliated Securities Note 11.
(c) Contingent Deferred Rights.
* Non-income producing security.
@ Restricted security - Investment in security not registered under the Securities Act of 1933. The investment is deemed to not be liquid
and may be sold only to qualified buyers.
| | | | | | | | | | |
| | | | | | % of net assets | | | | % of net assets | |
| | Acquisition | | Acquisition | | (Acquisition | | | Market | as of | |
| Security | Date(s) | | Cost | | Date) | | | Value | 10/31/2017 | |
| JS Kred SPV I, LLC. | 06/25/15 | $ | 314,956 | | 0.15 | % | $ | 380,215 | 0.21 | % |
| Palantir Technologies, Inc. , Cl. A | 10/07/14 | | 106,559 | | 0.05 | % | | 94,162 | 0.05 | % |
| Palantir Technologies, Inc. , Cl. B | 10/07/14 | | 441,023 | | 0.22 | % | | 384,025 | 0.21 | % |
| Palantir Technologies, Inc. , Cl. D | 10/14/14 | | 57,451 | | 0.03 | % | | 50,031 | 0.03 | % |
| Prosetta Biosciences, Inc. , Series D | 02/06/15 | | 988,245 | | 0.50 | % | | 685,183 | 0.37 | % |
| Tolero CDR | 02/06/17 | | 315,501 | | 0.19 | % | | 1,685,090 | 0.91 | % |
| Total | | | | | | | $ | 3,278,706 | 1.78 | % |
| | | | | | | | | | | |
Industry classifications are unaudited.
See Notes to Financial Statements.
- 48 -
THE ALGER FUNDS | ALGER SMID CAP FOCUS FUND
Schedule of Investments October 31, 2017
| | | | |
| COMMON STOCKS—93.4% | | SHARES | | VALUE |
| AEROSPACE & DEFENSE—2.7% | | | | |
| HEICO Corp. | | 56,850 | $ | 5,155,158 |
| AIR FREIGHT & LOGISTICS—3.6% | | | | |
| XPO Logistics, Inc. * | | 99,213 | | 6,880,422 |
| APPAREL ACCESSORIES & LUXURY GOODS—2.0% | | | | |
| Canada Goose Holdings, Inc. * | | 175,896 | | 3,778,246 |
| APPAREL RETAIL—0.1% | | | | |
| Francesca's Holdings Corp. * | | 27,027 | | 174,865 |
| APPLICATION SOFTWARE—14.9% | | | | |
| Ebix, Inc. | | 100,671 | | 6,840,594 |
| Everbridge, Inc. * | | 170,005 | | 4,528,933 |
| Globant SA* | | 57,638 | | 2,174,105 |
| HubSpot, Inc. * | | 38,751 | | 3,353,899 |
| Paylocity Holding Corp. * | | 132,917 | | 7,099,097 |
| RealPage, Inc. * | | 17,179 | | 743,851 |
| The Ultimate Software Group, Inc. * | | 18,945 | | 3,838,068 |
| | | | | 28,578,547 |
| ASSET MANAGEMENT & CUSTODY BANKS—0.7% | | | | |
| Financial Engines, Inc. | | 5,985 | | 216,058 |
| Virtus Investment Partners, Inc. | | 9,727 | | 1,132,223 |
| | | | | 1,348,281 |
| BIOTECHNOLOGY—7.5% | | | | |
| ACADIA Pharmaceuticals, Inc. * | | 87,368 | | 3,043,028 |
| Portola Pharmaceuticals, Inc. * | | 118,298 | | 5,845,104 |
| Puma Biotechnology, Inc. * | | 30,693 | | 3,907,219 |
| Ultragenyx Pharmaceutical, Inc. * | | 35,085 | | 1,617,068 |
| | | | | 14,412,419 |
| CONSUMER ELECTRONICS—0.8% | | | | |
| GoPro, Inc. , Cl. A* | | 148,379 | | 1,547,593 |
| EDUCATION SERVICES—3.4% | | | | |
| Chegg, Inc. * | | 425,794 | | 6,604,065 |
| ELECTRONIC MANUFACTURING SERVICES—2.2% | | | | |
| IPG Photonics Corp. * | | 20,093 | | 4,278,001 |
| GENERAL MERCHANDISE STORES—1.8% | | | | |
| Ollie's Bargain Outlet Holdings, Inc. * | | 76,357 | | 3,409,340 |
| HEALTH CARE DISTRIBUTORS—0.1% | | | | |
| PetIQ, Inc. , Cl. A* | | 6,421 | | 154,489 |
| HEALTH CARE EQUIPMENT—3.7% | | | | |
| Insulet Corp. * | | 120,503 | | 7,086,781 |
| HEALTH CARE FACILITIES—1.5% | | | | |
| US Physical Therapy, Inc. | | 42,257 | | 2,871,363 |
| HEALTH CARE SERVICES—1.1% | | | | |
| Diplomat Pharmacy, Inc. * | | 104,708 | | 2,204,103 |
| HEALTH CARE TECHNOLOGY—1.8% | | | | |
| Cotiviti Holdings, Inc. * | | 96,052 | | 3,377,188 |
- 49 -
THE ALGER FUNDS | ALGER SMID CAP FOCUS FUND
Schedule of Investments October 31, 2017 (Continued)
| | | | |
| COMMON STOCKS—93.4% (CONT. ) | | SHARES | | VALUE |
| HUMAN RESOURCE & EMPLOYMENT SERVICES—3.0% | | | |
| WageWorks, Inc. * | | 91,904 | $ | 5,858,880 |
| INDUSTRIAL MACHINERY—3.7% | | | | |
| Proto Labs, Inc. * | | 7,785 | | 679,241 |
| The Middleby Corp. * | | 56,432 | | 6,540,469 |
| | | | | 7,219,710 |
| INTERNET & DIRECT MARKETING RETAIL—5.0% | | | | |
| Wayfair, Inc. , Cl. A* | | 136,183 | | 9,519,192 |
| INTERNET SOFTWARE & SERVICES—11.9% | | | | |
| 2U, Inc. * | | 35,464 | | 2,256,574 |
| GTT Communications, Inc. * | | 159,705 | | 5,821,247 |
| Palantir Technologies, Inc. , Cl. A*,@,(a) | | 81,310 | | 467,533 |
| SPS Commerce, Inc. * | | 5,218 | | 256,517 |
| Stamps. com, Inc. * | | 35,624 | | 7,994,026 |
| The Trade Desk, Inc. , Cl. A* | | 94,382 | | 6,221,661 |
| | | | | 23,017,558 |
| IT CONSULTING & OTHER SERVICES—2.1% | | | | |
| EPAM Systems, Inc. * | | 43,654 | | 3,979,062 |
| LEISURE FACILITIES—1.8% | | | | |
| Planet Fitness, Inc. , Cl. A | | 127,507 | | 3,396,786 |
| PHARMACEUTICALS—0.6% | | | | |
| Aerie Pharmaceuticals, Inc. * | | 19,927 | | 1,230,492 |
| REAL ESTATE SERVICES—5.0% | | | | |
| FirstService Corp. * | | 131,453 | | 9,157,016 |
| Redfin Corp. * | | 21,981 | | 517,433 |
| | | | | 9,674,449 |
| REGIONAL BANKS—3.5% | | | | |
| Independent Bank Group, Inc. | | 39,864 | | 2,507,446 |
| Signature Bank* | | 32,367 | | 4,208,034 |
| | | | | 6,715,480 |
| RESTAURANTS—0.2% | | | | |
| Chuy's Holdings, Inc. * | | 14,148 | | 318,330 |
| SEMICONDUCTORS—1.4% | | | | |
| Impinj, Inc. * | | 15,697 | | 535,895 |
| MACOM Technology Solutions Holdings, Inc. * | | 53,166 | | 2,173,426 |
| | | | | 2,709,321 |
| TECHNOLOGY HARDWARE STORAGE & PERIPHERALS—1.8% | | |
| Electronics For Imaging, Inc. * | | 115,533 | | 3,565,348 |
| Stratasys Ltd. * | | 2,233 | | 50,287 |
| | | | | 3,615,635 |
| THRIFTS & MORTGAGE FINANCE—2.5% | | | | |
| BofI Holding, Inc. * | | 178,211 | | 4,793,876 |
| TRADING COMPANIES & DISTRIBUTORS—3.0% | | | | |
| H&E Equipment Services, Inc. | | 56,199 | | 1,851,195 |
- 50 -
THE ALGER FUNDS | ALGER SMID CAP FOCUS FUND
Schedule of Investments October 31, 2017 (Continued)
| | | | | | |
| COMMON STOCKS—93.4% (CONT. ) | | SHARES | | | | VALUE |
| TRADING COMPANIES & DISTRIBUTORS—3.0% (CONT. ) | | | | | |
| SiteOne Landscape Supply, Inc. * | | 63,005 | | | $ | 4,001,448 |
| | | | | | | 5,852,643 |
| TOTAL COMMON STOCKS | | | | | | |
| (Cost $147,690,927) | | | | | 179,762,275 |
| PREFERRED STOCKS—3.0% | | SHARES | | | | VALUE |
| BIOTECHNOLOGY—0.4% | | | | | | |
| Prosetta Biosciences, Inc. , Series D*,@,(a),(b) | | 231,474 | | | | 722,199 |
| INTERNET SOFTWARE & SERVICES—1.1% | | | | | | |
| Palantir Technologies, Inc. , Cl. B*,@,(a) | | 331,607 | | | | 1,906,740 |
| Palantir Technologies, Inc. , Cl. D*,@,(a) | | 43,203 | | | | 248,417 |
| | | | | | | 2,155,157 |
| PHARMACEUTICALS—1.5% | | | | | | |
| Intarcia Therapeutics, Inc. , Series DD*,@,(a) | | 49,317 | | | | 2,832,276 |
| TOTAL PREFERRED STOCKS | | | | | | |
| (Cost $5,114,017) | | | | | | 5,709,632 |
| RIGHTS—0.0% | | SHARES | | | | VALUE |
| BIOTECHNOLOGY—0.0% | | | | | | |
| Dyax Corp. *,@,(a) | | 37,550 | | | | 106,642 |
| (Cost $0) | | | | | | 106,642 |
| Total Investments | | | | | | |
| (Cost $152,804,944) | | 96.4% | | $ | | 185,578,549 |
| Affiliated Securities (Cost $1,041,633) | | | | | | 722,199 |
| Unaffiliated Securities (Cost $151,763,311) | | | | | | 184,856,350 |
| Other Assets in Excess of Liabilities | | 3.6 | % | | | 6,932,703 |
| NET ASSETS | | 100.0 | % | $ | 192,511,252 |
(a) Security is valued in good faith at fair value determined using significant unobservable inputs pursuant to procedures established
by the Board.
(b) Deemed an affiliate of the Alger fund complex during the year for purposes of Section 2(a)(3) of the Investment Company
Act of 1940. See Affiliated Securities Note 11.
* Non-income producing security.
@ Restricted security - Investment in security not registered under the Securities Act of 1933. The investment is deemed to not be
liquid and may be sold only to qualified buyers.
| | | | | | | | | |
| | | | | % of net assets | | | | % of net assets | |
| | Acquisition | | Acquisition | (Acquisition | | | Market | as of | |
| Security | Date(s) | | Cost | Date) | | | Value | 10/31/2017 | |
| Dyax Corp. Rights | 05/07/15 | $ | 0 | 0.00 | % | $ | 45,156 | 0.02 | % |
| Dyax Corp. Rights | 05/15/15 | | 0 | 0.00 | | | 1,704 | 0.00 | % |
| Dyax Corp. Rights | 06/18/15 | | 0 | 0.00 | | | 40,470 | 0.02 | % |
| Dyax Corp. Rights | 06/26/15 | | 0 | 0.00 | | | 19,312 | 0.01 | % |
| Intarcia Therapeutics, Inc. , Series | | | | | | | | | |
| DD | 03/27/14 | | 1,597,378 | 0.14 | % | | 2,832,276 | 1.47 | % |
| Palantir Technologies, Inc. , Cl. A | 10/07/14 | | 529,084 | 0.05 | % | | 467,533 | 0.24 | % |
| Palantir Technologies, Inc. , Cl. B | 10/07/14 | | 2,189,744 | 0.22 | % | | 1,906,740 | 0.99 | % |
| Palantir Technologies, Inc. , Cl. D | 10/14/14 | | 285,262 | 0.03 | % | | 248,417 | 0.13 | % |
| Prosetta Biosciences, Inc. , Series D | 02/06/15 | | 1,041,633 | 0.10 | % | | 722,199 | 0.38 | % |
| Total | | | | | | $ | 6,283,807 | 3.26 | % |
Industry classifications are unaudited.
See Notes to Financial Statements.
- 51 -
THE ALGER FUNDS | ALGER SMALL CAP GROWTH FUND
Schedule of Investments October 31, 2017
| | | | |
| COMMON STOCKS—96.4% | | SHARES | | VALUE |
| AEROSPACE & DEFENSE—1.0% | | | | |
| Hexcel Corp. | | 23,964 | $ | 1,454,375 |
| APPAREL RETAIL—0.4% | | | | |
| Burlington Stores, Inc. * | | 5,460 | | 512,639 |
| APPLICATION SOFTWARE—13.6% | | | | |
| ACI Worldwide, Inc. * | | 101,461 | | 2,443,181 |
| Blackbaud, Inc. | | 40,898 | | 4,142,968 |
| Ellie Mae, Inc. * | | 13,027 | | 1,171,779 |
| Everbridge, Inc. * | | 27,084 | | 721,518 |
| Guidewire Software, Inc. * | | 26,163 | | 2,092,517 |
| HubSpot, Inc. * | | 21,438 | | 1,855,459 |
| Manhattan Associates, Inc. * | | 43,165 | | 1,806,887 |
| Paycom Software, Inc. * | | 15,266 | | 1,254,865 |
| Tyler Technologies, Inc. * | | 21,601 | | 3,829,641 |
| | | | | 19,318,815 |
| ASSET MANAGEMENT & CUSTODY BANKS—1.9% | | | | |
| WisdomTree Investments, Inc. | | 239,936 | | 2,660,890 |
| BIOTECHNOLOGY—5.1% | | | | |
| ACADIA Pharmaceuticals, Inc. * | | 43,948 | | 1,530,709 |
| Bluebird Bio, Inc. * | | 4,216 | | 586,446 |
| CareDx, Inc. * | | 12,314 | | 72,037 |
| Clovis Oncology, Inc. * | | 9,154 | | 689,937 |
| Halozyme Therapeutics, Inc. * | | 51,042 | | 904,975 |
| Incyte Corp. * | | 6,064 | | 686,748 |
| Ironwood Pharmaceuticals, Inc. , Cl. A* | | 30,125 | | 463,322 |
| Sarepta Therapeutics, Inc. * | | 13,688 | | 674,955 |
| TESARO, Inc. * | | 9,526 | | 1,102,825 |
| Ultragenyx Pharmaceutical, Inc. * | | 12,869 | | 593,132 |
| | | | | 7,305,086 |
| BREWERS—0.5% | | | | |
| Craft Brew Alliance, Inc. * | | 42,368 | | 773,216 |
| COMMUNICATIONS EQUIPMENT—1.8% | | | | |
| Lumentum Holdings, Inc. * | | 18,980 | | 1,198,587 |
| NetScout Systems, Inc. * | | 52,671 | | 1,495,856 |
| | | | | 2,694,443 |
| CONSUMER FINANCE—2.0% | | | | |
| LendingClub Corp. * | | 495,519 | | 2,819,503 |
| ELECTRONIC COMPONENTS—2.3% | | | | |
| Dolby Laboratories, Inc. , Cl. A | | 27,658 | | 1,602,505 |
| Universal Display Corp. | | 11,755 | | 1,722,108 |
| | | | | 3,324,613 |
| ELECTRONIC EQUIPMENT & INSTRUMENTS—6.4% | | | | |
| Cognex Corp. | | 57,327 | | 7,059,821 |
| FLIR Systems, Inc. | | 45,623 | | 2,136,069 |
| | | | | 9,195,890 |
| FINANCIAL EXCHANGES & DATA—0.5% | | | | |
| MarketAxess Holdings, Inc. | | 4,185 | | 728,190 |
- 52 -
THE ALGER FUNDS | ALGER SMALL CAP GROWTH FUND
Schedule of Investments October 31, 2017 (Continued)
| | | | |
| COMMON STOCKS—96.4% (CONT. ) | | SHARES | | VALUE |
| HEALTH CARE EQUIPMENT—12.1% | | | | |
| Abaxis, Inc. | | 45,061 | $ | 2,180,952 |
| ABIOMED, Inc. * | | 19,874 | | 3,834,092 |
| Cantel Medical Corp. | | 47,896 | | 4,697,640 |
| Cardiovascular Systems, Inc. * | | 28,068 | | 675,597 |
| DexCom, Inc. * | | 16,919 | | 760,847 |
| Inogen, Inc. * | | 24,056 | | 2,379,860 |
| Insulet Corp. * | | 45,530 | | 2,677,619 |
| | | | | 17,206,607 |
| HEALTH CARE SUPPLIES—7.2% | | | | |
| Meridian Bioscience, Inc. | | 63,459 | | 948,712 |
| Neogen Corp. * | | 56,778 | | 4,553,596 |
| Quidel Corp. * | | 114,877 | | 4,704,213 |
| | | | | 10,206,521 |
| HEALTH CARE TECHNOLOGY—8.3% | | | | |
| Medidata Solutions, Inc. * | | 60,900 | | 4,581,507 |
| Quality Systems, Inc. * | | 82,749 | | 1,164,278 |
| Veeva Systems, Inc. , Cl. A* | | 58,318 | | 3,553,899 |
| Vocera Communications, Inc. * | | 89,531 | | 2,526,565 |
| | | | | 11,826,249 |
| HOME ENTERTAINMENT SOFTWARE—3.2% | | | | |
| Take-Two Interactive Software, Inc. * | | 41,322 | | 4,572,279 |
| HUMAN RESOURCE & EMPLOYMENT SERVICES—2.1% | | | |
| WageWorks, Inc. * | | 47,755 | | 3,044,381 |
| INDUSTRIAL MACHINERY—3.2% | | | | |
| DMC Global, Inc. | | 29,564 | | 643,017 |
| Sun Hydraulics Corp. | | 67,855 | | 3,903,698 |
| | | | | 4,546,715 |
| INTERNET & DIRECT MARKETING RETAIL—0.3% | | | | |
| Despegar. com Corp. * | | 12,715 | | 391,622 |
| INTERNET SOFTWARE & SERVICES—4.1% | | | | |
| Cornerstone OnDemand, Inc. * | | 37,515 | | 1,439,075 |
| NIC, Inc. | | 54,029 | | 918,493 |
| Q2 Holdings, Inc. * | | 36,341 | | 1,546,310 |
| Shopify, Inc. , Cl. A* | | 12,355 | | 1,229,199 |
| SPS Commerce, Inc. * | | 16,393 | | 805,880 |
| | | | | 5,938,957 |
| IT CONSULTING & OTHER SERVICES—1.3% | | | | |
| InterXion Holding NV* | | 33,466 | | 1,786,750 |
| LEISURE FACILITIES—1.0% | | | | |
| Planet Fitness, Inc. , Cl. A | | 52,869 | | 1,408,430 |
| LIFE SCIENCES TOOLS & SERVICES—3.8% | | | | |
| Bio-Techne Corp. | | 28,664 | | 3,755,557 |
| PRA Health Sciences, Inc. * | | 21,335 | | 1,737,309 |
| | | | | 5,492,866 |
| MANAGED HEALTH CARE—0.8% | | | | |
| HealthEquity, Inc. * | | 23,788 | | 1,194,633 |
- 53 -
THE ALGER FUNDS | ALGER SMALL CAP GROWTH FUND
Schedule of Investments October 31, 2017 (Continued)
| | | | | |
| COMMON STOCKS—96.4% (CONT. ) | | SHARES | | | VALUE |
| MOVIES & ENTERTAINMENT—1.5% | | | | | |
| Lions Gate Entertainment Corp. , Cl. A* | | 21,534 | | $ | 624,917 |
| Lions Gate Entertainment Corp. , Cl. B* | | 21,534 | | | 595,630 |
| Live Nation Entertainment, Inc. * | | 19,623 | | | 859,095 |
| | | | | | 2,079,642 |
| OIL & GAS EQUIPMENT & SERVICES—0.7% | | | | | |
| RPC, Inc. | | 43,747 | | | 1,063,490 |
| OIL & GAS EXPLORATION & PRODUCTION—0.4% | | | | | |
| Parsley Energy, Inc. , Cl. A* | | 19,498 | | | 518,647 |
| PERSONAL PRODUCTS—0.6% | | | | | |
| elf Beauty, Inc. * | | 42,704 | | | 904,898 |
| PHARMACEUTICALS—1.4% | | | | | |
| Aerie Pharmaceuticals, Inc. * | | 31,679 | | | 1,956,178 |
| RESTAURANTS—1.8% | | | | | |
| Shake Shack, Inc. , Cl. A* | | 34,579 | | | 1,312,619 |
| Wingstop, Inc. | | 35,951 | | | 1,217,660 |
| | | | | | 2,530,279 |
| SEMICONDUCTORS—2.2% | | | | | |
| Cavium, Inc. * | | 21,259 | | | 1,466,659 |
| Microsemi Corp. * | | 31,717 | | | 1,692,736 |
| | | | | | 3,159,395 |
| SPECIALTY CHEMICALS—2.1% | | | | | |
| Balchem Corp. | | 31,950 | | | 2,693,066 |
| Flotek Industries, Inc. * | | 64,794 | | | 318,786 |
| | | | | | 3,011,852 |
| SPECIALTY STORES—0.5% | | | | | |
| Five Below, Inc. * | | 12,094 | | | 668,194 |
| SYSTEMS SOFTWARE—2.3% | | | | | |
| Proofpoint, Inc. * | | 35,089 | | | 3,242,574 |
| TOTAL COMMON STOCKS | | | | | |
| (Cost $93,444,033) | | | | 137,538,819 |
| PREFERRED STOCKS—0.1% | | SHARES | | | VALUE |
| BIOTECHNOLOGY—0.1% | | | | | |
| Prosetta Biosciences, Inc. , Series D*,@,(a),(b) | | 50,688 | | | 158,147 |
| (Cost $228,096) | | | | | 158,147 |
| RIGHTS—0.4% | | SHARES | | | VALUE |
| BIOTECHNOLOGY—0.4% | | | | | |
| Dyax Corp. *,@,(a) | | 9,700 | | | 27,548 |
| Neuralstem, Inc. , Strike Price: 47.32, 1/8/19* | | 5,997 | | | – |
| Tolero CDR*,@,(a),(c) | | 174,782 | | | 499,142 |
| | | | | | 526,690 |
| TOTAL RIGHTS | | | | | |
| (Cost $94,483) | | | | | 526,690 |
- 54 -
THE ALGER FUNDS | ALGER SMALL CAP GROWTH FUND
Schedule of Investments October 31, 2017 (Continued)
| | | | | | |
| REAL ESTATE INVESTMENT TRUST—1.0% | | SHARES | | | | VALUE |
| SPECIALIZED—1.0% | | | | | | |
| CyrusOne, Inc. | | 22,660 | | | $ | 1,391,097 |
| (Cost $762,426) | | | | | | 1,391,097 |
| SPECIAL PURPOSE VEHICLE—0.2% | | SHARES | | | | VALUE |
| CONSUMER FINANCE—0.2% | | | | | | |
| JS Kred SPV I, LLC. *,@,(a) | | 290,078 | | | | 350,182 |
| (Cost $290,078) | | | | | | 350,182 |
| Total Investments | | | | | | |
| (Cost $94,819,116) | | 98.1% | | $ | | 139,964,935 |
| Affiliated Securities (Cost $228,096) | | | | | | 158,147 |
| Unaffiliated Securities (Cost $94,591,020) | | | | | | 139,806,788 |
| Other Assets in Excess of Liabilities | | 1.9 | % | | | 2,710,810 |
| NET ASSETS | | 100.0 | % | $ | 142,675,745 |
(a) Security is valued in good faith at fair value determined using significant unobservable inputs pursuant to procedures established by the
Board.
(b)Deemed an affiliate of the Alger fund complex during the year for purposes of Section 2(a)(3) of the Investment Company Act of
1940. See Affiliated Securities Note 11.
(c) Contingent Deferred Rights.
* Non-income producing security.
@ Restricted security - Investment in security not registered under the Securities Act of 1933. The investment is deemed to not be liquid
and may be sold only to qualified buyers.
| | | | | | | | | |
| | Acquisition | | Acquisition | (Acquisition | | | Market | as of | |
| Security | Date(s) | | Cost | Date) | | | Value | 10/31/2017 | |
| Dyax Corp. Rights | 05/01/15 | $ | 0 | 0.00 | % | $ | 27,548 | 0.02 | % |
| Dyax Corp. Rights | 08/14/15 | | 0 | 0.00 | % | | - | 0.00 | % |
| JS Kred SPV I, LLC. | 06/26/15 | | 290,078 | 0.15 | % | | 350,182 | 0.25 | % |
| Prosetta Biosciences, Inc. , Series D | 02/06/15 | | 228,096 | 0.10 | % | | 158,147 | 0.11 | % |
| Tolero CDR | 02/06/17 | | 94,483 | 0.08 | % | | 499,142 | 0.35 | % |
| Total | | | | | | $ | 1,035,019 | 0.73 | % |
| | | | | | | | | | |
Industry classifications are unaudited.
See Notes to Financial Statements.
- 55 -
THE ALGER FUNDS | ALGER SMALL CAP FOCUS FUND
Schedule of Investments October 31, 2017
| | | | | |
| COMMON STOCKS—98.9% | | SHARES | | | VALUE |
| APPLICATION SOFTWARE—20.8% | | | | | |
| ACI Worldwide, Inc. * | | 588,714 | | $ | 14,176,233 |
| ANSYS, Inc. * | | 68,576 | | | 9,375,025 |
| Blackbaud, Inc. | | 161,609 | | | 16,370,992 |
| Ellie Mae, Inc. * | | 147,245 | | | 13,244,688 |
| Guidewire Software, Inc. * | | 191,405 | | | 15,308,572 |
| HubSpot, Inc. * | | 101,748 | | | 8,806,289 |
| Manhattan Associates, Inc. * | | 153,118 | | | 6,409,519 |
| Paycom Software, Inc. * | | 160,514 | | | 13,194,251 |
| PROS Holdings, Inc. * | | 343,715 | | | 7,764,522 |
| Tyler Technologies, Inc. * | | 100,725 | | | 17,857,535 |
| | | | | 122,507,626 |
| ASSET MANAGEMENT & CUSTODY BANKS—2.0% | | | | | |
| WisdomTree Investments, Inc. | | 1,049,057 | | | 11,634,042 |
| BIOTECHNOLOGY—3.6% | | | | | |
| Clovis Oncology, Inc. * | | 40,454 | | | 3,049,018 |
| Incyte Corp. * | | 82,769 | | | 9,373,589 |
| Ironwood Pharmaceuticals, Inc. , Cl. A* | | 326,012 | | | 5,014,065 |
| TESARO, Inc. * | | 31,529 | | | 3,650,112 |
| | | | | | 21,086,784 |
| COMMUNICATIONS EQUIPMENT—0.8% | | | | | |
| NetScout Systems, Inc. * | | 176,656 | | | 5,017,030 |
| CONSUMER FINANCE—0.7% | | | | | |
| LendingClub Corp. * | | 771,647 | | | 4,390,672 |
| ELECTRONIC COMPONENTS—2.7% | | | | | |
| Universal Display Corp. | | 107,309 | | | 15,720,769 |
| ELECTRONIC EQUIPMENT & INSTRUMENTS—4.1% | | | | | |
| Cognex Corp. | | 194,674 | | | 23,974,103 |
| FINANCIAL EXCHANGES & DATA—1.7% | | | | | |
| MarketAxess Holdings, Inc. | | 58,110 | | | 10,111,140 |
| HEALTH CARE EQUIPMENT—16.5% | | | | | |
| Abaxis, Inc. | | 175,148 | | | 8,477,163 |
| ABIOMED, Inc. * | | 102,269 | | | 19,729,736 |
| Cantel Medical Corp. | | 206,481 | | | 20,251,656 |
| Cardiovascular Systems, Inc. * | | 311,141 | | | 7,489,164 |
| Heska Corp. * | | 100,888 | | | 9,836,580 |
| Inogen, Inc. * | | 150,256 | | | 14,864,826 |
| Insulet Corp. * | | 275,531 | | | 16,203,978 |
| | | | | | 96,853,103 |
| HEALTH CARE SUPPLIES—6.7% | | | | | |
| Meridian Bioscience, Inc. | | 349,446 | | | 5,224,218 |
| Neogen Corp. * | | 192,992 | | | 15,477,958 |
| Quidel Corp. * | | 458,927 | | | 18,793,060 |
| | | | | | 39,495,236 |
| HEALTH CARE TECHNOLOGY—9.6% | | | | | |
| Medidata Solutions, Inc. * | | 257,007 | | | 19,334,637 |
| Veeva Systems, Inc. , Cl. A* | | 387,454 | | | 23,611,447 |
- 56 -
THE ALGER FUNDS | ALGER SMALL CAP FOCUS FUND
Schedule of Investments October 31, 2017 (Continued)
| | | | | | |
| COMMON STOCKS—98.9% (CONT. ) | | SHARES | | | | VALUE |
| HEALTH CARE TECHNOLOGY—9.6% (CONT. ) | | | | | | |
| Vocera Communications, Inc. * | | 489,634 | | | $ | 13,817,472 |
| | | | | | | 56,763,556 |
| HUMAN RESOURCE & EMPLOYMENT SERVICES—2.7% | | | | | |
| WageWorks, Inc. * | | 250,322 | | | | 15,958,028 |
| INDUSTRIAL MACHINERY—5.5% | | | | | | |
| DMC Global, Inc. | | 319,740 | | | | 6,954,345 |
| Proto Labs, Inc. * | | 134,145 | | | | 11,704,151 |
| Sun Hydraulics Corp. | | 234,776 | | | | 13,506,663 |
| | | | | | | 32,165,159 |
| INTERNET SOFTWARE & SERVICES—8.6% | | | | | | |
| Cornerstone OnDemand, Inc. * | | 289,310 | | | | 11,097,931 |
| NIC, Inc. | | 386,399 | | | | 6,568,783 |
| Shopify, Inc. , Cl. A* | | 106,000 | | | | 10,545,940 |
| SPS Commerce, Inc. * | | 106,599 | | | | 5,240,407 |
| Stamps. com, Inc. * | | 76,653 | | | | 17,200,933 |
| | | | | | | 50,653,994 |
| LIFE SCIENCES TOOLS & SERVICES—2.1% | | | | | | |
| Bio-Techne Corp. | | 91,837 | | | | 12,032,484 |
| MANAGED HEALTH CARE—1.7% | | | | | | |
| HealthEquity, Inc. * | | 198,315 | | | | 9,959,379 |
| PERSONAL PRODUCTS—1.4% | | | | | | |
| elf Beauty, Inc. * | | 377,820 | | | | 8,006,006 |
| RESTAURANTS—0.9% | | | | | | |
| Wingstop, Inc. | | 160,745 | | | | 5,444,433 |
| SEMICONDUCTORS—2.4% | | | | | | |
| Cavium, Inc. * | | 207,160 | | | | 14,291,968 |
| SPECIALTY CHEMICALS—1.9% | | | | | | |
| Balchem Corp. | | 133,176 | | | | 11,225,405 |
| SYSTEMS SOFTWARE—2.5% | | | | | | |
| Proofpoint, Inc. * | | 158,992 | | | | 14,692,451 |
| TOTAL COMMON STOCKS | | | | | | |
| (Cost $476,387,221) | | | | | 581,983,368 |
| RIGHTS—0.0% | | SHARES | | | | VALUE |
| BIOTECHNOLOGY—0.0% | | | | | | |
| Tolero CDR*,@,(a),(b) | | 11,905 | | | | 33,998 |
| | | | | | | 33,998 |
| TOTAL RIGHTS | | | | | | |
| (Cost $6,436) | | | | | | 33,998 |
| Total Investments | | | | | | |
| (Cost $476,393,657) | | 98.9% | | | | 582,017,366 |
| Unaffiliated Securities (Cost $476,393,657) | | | | | | 582,017,366 |
| Other Assets in Excess of Liabilities | | 1.1 | % | | | 6,640,254 |
| NET ASSETS | | 100.0 | % | $ | 588,657,620 |
- 57 -
THE ALGER FUNDS | ALGER SMALL CAP FOCUS FUND
Schedule of Investments October 31, 2017 (Continued)
(a) Security is valued in good faith at fair value determined using significant unobservable inputs pursuant to procedures established by the
Board.
(b)Contingent Deferred Rights.
* Non-income producing security.
@ Restricted security - Investment in security not registered under the Securities Act of 1933. The investment is deemed to not be liquid
and may be sold only to qualified buyers.
| | | | | | | | | |
| | | | | % of net assets | | | | % of net assets | |
| | | Acquisition | Acquisition | (Acquisition | | | Market | as of | |
| Security | | Date(s) | Cost | Date) | | | Value | 10/31/2017 | |
| Tolero CDR | | 02/06/17 | 6,436 | 0.00 | % | | 33,998 | 0.01 | % |
| Total | | | | | | $ | 33,998 | 0.01 | % |
| | | | | | | | | | |
Industry classifications are unaudited.
See Notes to Financial Statements.
- 58 -
THE ALGER FUNDS | ALGER HEALTH SCIENCES FUND
Schedule of Investments October 31, 2017
| | | | |
| COMMON STOCKS—91.4% | | SHARES | | VALUE |
| BIOTECHNOLOGY—39.5% | | | | |
| AbbVie, Inc. | | 78,000 | $ | 7,039,500 |
| ACADIA Pharmaceuticals, Inc. * | | 19,000 | | 661,770 |
| Alexion Pharmaceuticals, Inc. * | | 24,000 | | 2,871,840 |
| Amicus Therapeutics, Inc. * | | 110,000 | | 1,566,400 |
| Avexis, Inc. * | | 7,500 | | 783,825 |
| Biogen, Inc. | | 9,000 | | 2,804,940 |
| BioMarin Pharmaceutical, Inc. * | | 38,000 | | 3,119,420 |
| Bioverativ, Inc. * | | 26,500 | | 1,497,250 |
| Bluebird Bio, Inc. * | | 22,000 | | 3,060,200 |
| Blueprint Medicines Corp. * | | 9,000 | | 597,780 |
| Celgene Corp. * | | 18,500 | | 1,867,945 |
| Clovis Oncology, Inc. * | | 30,247 | | 2,279,716 |
| Emmaus Life Sciences, Inc. *,@,(a) | | 479,063 | | 2,912,703 |
| Exact Sciences Corp. * | | 42,000 | | 2,309,580 |
| FibroGen, Inc. * | | 8,000 | | 446,800 |
| Five Prime Therapeutics, Inc. * | | 17,000 | | 762,620 |
| Genmab A/S* | | 7,500 | | 1,514,505 |
| Global Blood Therapeutics, Inc. * | | 12,000 | | 477,600 |
| Halozyme Therapeutics, Inc. * | | 158,000 | | 2,801,340 |
| Immunomedics, Inc. * | | 22,000 | | 235,840 |
| Incyte Corp. * | | 17,000 | | 1,925,250 |
| Juno Therapeutics, Inc. * | | 20,000 | | 898,200 |
| Ligand Pharmaceuticals, Inc. * | | 3,500 | | 508,725 |
| Loxo Oncology, Inc. * | | 5,000 | | 430,800 |
| Neurocrine Biosciences, Inc. * | | 10,000 | | 621,100 |
| Puma Biotechnology, Inc. * | | 6,500 | | 827,450 |
| Ra Pharmaceuticals, Inc. * | | 17,000 | | 223,380 |
| Radius Health, Inc. * | | 16,500 | | 529,815 |
| Repligen Corp. * | | 25,000 | | 930,000 |
| Sarepta Therapeutics, Inc. * | | 70,000 | | 3,451,700 |
| Spark Therapeutics, Inc. * | | 21,000 | | 1,698,900 |
| TESARO, Inc. * | | 18,500 | | 2,141,745 |
| Vertex Pharmaceuticals, Inc. * | | 39,000 | | 5,702,970 |
| vTv Therapeutics, Inc. , Cl. A* | | 2,000 | | 12,640 |
| Zealand Pharma A/S#* | | 40,000 | | 738,800 |
| | | | | 60,253,049 |
| HEALTH CARE DISTRIBUTORS—0.1% | | | | |
| PetIQ, Inc. , Cl. A* | | 8,500 | | 204,510 |
| HEALTH CARE EQUIPMENT—16.7% | | | | |
| ABIOMED, Inc. * | | 28,000 | | 5,401,760 |
| Baxter International, Inc. | | 27,000 | | 1,740,690 |
| Boston Scientific Corp. * | | 16,000 | | 450,240 |
| DexCom, Inc. * | | 3,000 | | 134,910 |
| Edwards Lifesciences Corp. * | | 7,500 | | 766,725 |
| IDEXX Laboratories, Inc. * | | 19,000 | | 3,157,230 |
| Insulet Corp. * | | 50,000 | | 2,940,500 |
| Intuitive Surgical, Inc. | | 11,500 | | 4,316,640 |
| Masimo Corp. * | | 12,000 | | 1,053,120 |
- 59 -
THE ALGER FUNDS | ALGER HEALTH SCIENCES FUND
Schedule of Investments October 31, 2017 (Continued)
| | | | | |
| COMMON STOCKS—91.4% (CONT. ) | | SHARES | | | VALUE |
| HEALTH CARE EQUIPMENT—16.7% (CONT. ) | | | | | |
| Mazor Robotics Ltd. #* | | 8,500 | | $ | 548,760 |
| Obalon Therapeutics, Inc. * | | 46,795 | | | 394,482 |
| Stryker Corp. | | 22,000 | | | 3,407,140 |
| Teleflex, Inc. | | 5,000 | | | 1,184,900 |
| | | | | | 25,497,097 |
| HEALTH CARE SUPPLIES—2.8% | | | | | |
| Align Technology, Inc. * | | 18,000 | | | 4,301,640 |
| HEALTH CARE TECHNOLOGY—0.8% | | | | | |
| Veeva Systems, Inc. , Cl. A* | | 19,000 | | | 1,157,860 |
| LIFE SCIENCES TOOLS & SERVICES—6.4% | | | | | |
| Agilent Technologies, Inc. | | 33,000 | | | 2,244,990 |
| Illumina, Inc. * | | 18,000 | | | 3,693,420 |
| Mettler-Toledo International, Inc. * | | 3,800 | | | 2,593,994 |
| PRA Health Sciences, Inc. * | | 8,500 | | | 692,155 |
| QIAGEN NV | | 17,000 | | | 575,620 |
| | | | | | 9,800,179 |
| MANAGED HEALTH CARE—11.9% | | | | | |
| Aetna, Inc. | | 15,012 | | | 2,552,490 |
| Cigna Corp. | | 13,500 | | | 2,662,470 |
| Humana, Inc. | | 10,500 | | | 2,681,175 |
| UnitedHealth Group, Inc. | | 43,000 | | | 9,039,460 |
| WellCare Health Plans, Inc. * | | 6,000 | | | 1,186,440 |
| | | | | | 18,122,035 |
| PHARMACEUTICALS—13.2% | | | | | |
| Aerie Pharmaceuticals, Inc. * | | 39,000 | | | 2,408,250 |
| AstraZeneca PLC. # | | 24,000 | | | 828,000 |
| Bristol-Myers Squibb Co. | | 91,000 | | | 5,611,060 |
| Eli Lilly & Co. | | 20,500 | | | 1,679,770 |
| GW Pharmaceuticals PLC. #* | | 9,000 | | | 971,550 |
| Intra-Cellular Therapies, Inc. * | | 18,000 | | | 280,620 |
| Johnson & Johnson | | 34,000 | | | 4,739,940 |
| Novo Nordisk A/S# | | 35,500 | | | 1,767,545 |
| Zoetis, Inc. , Cl. A | | 16,000 | | | 1,021,120 |
| Zogenix, Inc. * | | 20,692 | | | 775,951 |
| | | | | | 20,083,806 |
| TOTAL COMMON STOCKS | | | | | |
| (Cost $106,738,791) | | | | 139,420,176 |
| PREFERRED STOCKS—2.1% | | SHARES | | | VALUE |
| BIOTECHNOLOGY—1.8% | | | | | |
| Prosetta Biosciences, Inc. , Series D*,@,(a),(b) | | 897,366 | | | 2,799,782 |
| PHARMACEUTICALS—0.3% | | | | | |
| Intarcia Therapeutics, Inc. , Series DD*,@,(a) | | 7,546 | | | 433,366 |
| TOTAL PREFERRED STOCKS | | | | | |
| (Cost $4,282,562) | | | | | 3,233,148 |
- 60 -
THE ALGER FUNDS | ALGER HEALTH SCIENCES FUND
Schedule of Investments October 31, 2017 (Continued)
| | | | | | |
| RIGHTS—4.3% | | SHARES | | | | VALUE |
| BIOTECHNOLOGY—4.3% | | | | | | |
| Dyax Corp. *,@,(a) | | 21,800 | | | $ | 61,912 |
| Emmaus Life Sciences, Inc. , 9/11/18*,@,(a) | | 320,000 | | | | 950,400 |
| Neuralstem, Inc. , Strike Price: 47.32, 1/8/19*,(a) | | 26,472 | | | | – |
| Tolero CDR*,@,(a),(c) | | 1,956,996 | | | | 5,588,789 |
| | | | | | | 6,601,101 |
| TOTAL RIGHTS | | | | | | |
| (Cost $1,044,370) | | | | | | 6,601,101 |
| Total Investments | | | | | | |
| (Cost $112,065,723) | | 97.8% | | $ | | 149,254,425 |
| Affiliated Securities (Cost $4,038,147) | | | | | | 2,799,782 |
| Unaffiliated Securities (Cost $108,027,576) | | | | | | 146,454,643 |
| Other Assets in Excess of Liabilities | | 2.2 | % | | | 3,450,197 |
| NET ASSETS | | 100.0 | % | $ | 152,704,622 |
# American Depositary Receipts.
(a) Security is valued in good faith at fair value determined using significant unobservable inputs pursuant to procedures established by the
Board.
(b) Deemed an affiliate of the Alger fund complex during the year for the purpose of Section 2(a)(3) of the Investment Company Act of
1940, See Affiliated Securities Note 11.
(c) Contingent Deferred Rights.
* Non-income producing security.
@ Restricted security - Investment in security not registered under the Securities Act of 1933. The investment is deemed to not be liquid
and may be sold only to qualified buyers.
| | | | | | | | | | |
| | Acquisition | | Acquisition | | (Acquisition | | | Market | as of | |
| Security | Date(s) | | Cost | | Date) | | | Value | 10/31/2017 | |
| Dyax Corp. Rights | 04/01/15 | $ | 0 | | 0.00 | % | $ | 61,912 | 0.04 | % |
| Dyax Corp. Rights | 10/15/15 | | 0 | | 0.00 | % | | - | 0.00 | % |
| Emmaus Life Sciences, Inc. | 06/06/14 | | 556,721 | | 0.28 | % | | 967,103 | 0.63 | % |
| Emmaus Life Sciences, Inc. | 09/09/13 | | 800,000 | | 0.42 | % | | 1,945,600 | 1.27 | % |
| Emmaus Life Sciences, Inc. , Rights | 09/09/13 | | 0 | | 0.00 | % | | 950,400 | 0.62 | % |
| Intarcia Therapeutics, Inc. , Series | | | | | | | | | | |
| DD | 03/27/14 | | 290,376 | | 0.15 | % | | 433,366 | 0.29 | % |
| Prosetta Biosciences, Inc. , Series D | 02/06/15 | | 4,038,147 | | 2.00 | % | | 2,799,782 | 1.83 | % |
| Tolero CDR | 02/06/17 | | 1,044,370 | | 0.90 | % | | 5,588,789 | 3.67 | % |
| Total | | | | | | | $ | 12,746,952 | 8.35 | % |
Industry classifications are unaudited.
See Notes to Financial Statements.
- 61 -
THE ALGER FUNDS | ALGER GROWTH & INCOME FUND
Schedule of Investments October 31, 2017
| | | | |
| COMMON STOCKS—92.1% | | SHARES | | VALUE |
| AEROSPACE & DEFENSE—3.5% | | | | |
| General Dynamics Corp. | | 7,556 | $ | 1,533,717 |
| The Boeing Co. | | 10,004 | | 2,580,832 |
| | | | | 4,114,549 |
| AIR FREIGHT & LOGISTICS—0.4% | | | | |
| United Parcel Service, Inc. , Cl. B | | 4,399 | | 517,014 |
| AIRPORT SERVICES—0.5% | | | | |
| Macquarie Infrastructure Corp. | | 8,137 | | 565,928 |
| APPAREL ACCESSORIES & LUXURY GOODS—0.6% | | | | |
| Tapestry, Inc. * | | 16,537 | | 677,190 |
| APPAREL RETAIL—0.6% | | | | |
| The Gap, Inc. | | 26,419 | | 686,630 |
| ASSET MANAGEMENT & CUSTODY BANKS—1.7% | | | | |
| BlackRock, Inc. , Cl. A | | 4,284 | | 2,017,036 |
| AUTO PARTS & EQUIPMENT—0.7% | | | | |
| Delphi Automotive PLC. | | 8,803 | | 874,842 |
| BIOTECHNOLOGY—1.9% | | | | |
| AbbVie, Inc. | | 9,023 | | 814,326 |
| Amgen, Inc. | | 4,100 | | 718,402 |
| Gilead Sciences, Inc. | | 9,700 | | 727,112 |
| | | | | 2,259,840 |
| BREWERS—0.5% | | | | |
| Molson Coors Brewing Co. , Cl. B | | 7,489 | | 605,635 |
| BUILDING PRODUCTS—1.1% | | | | |
| Johnson Controls International PLC. | | 31,280 | | 1,294,679 |
| CABLE & SATELLITE—2.1% | | | | |
| Comcast Corp. , Cl. A | | 66,582 | | 2,398,949 |
| COMMUNICATIONS EQUIPMENT—1.3% | | | | |
| Cisco Systems, Inc. | | 43,199 | | 1,475,246 |
| CONSUMER ELECTRONICS—0.5% | | | | |
| Garmin Ltd. | | 11,100 | | 628,371 |
| CONSUMER FINANCE—0.5% | | | | |
| Discover Financial Services | | 8,743 | | 581,672 |
| DIVERSIFIED BANKS—6.7% | | | | |
| Bank of America Corp. | | 69,555 | | 1,905,112 |
| JPMorgan Chase & Co. | | 42,602 | | 4,286,187 |
| Wells Fargo & Co. | | 28,454 | | 1,597,408 |
| | | | | 7,788,707 |
| DIVERSIFIED CHEMICALS—1.1% | | | | |
| DowDuPont, Inc. | | 17,320 | | 1,252,409 |
| DRUG RETAIL—0.9% | | | | |
| CVS Health Corp. | | 15,600 | | 1,069,068 |
| ELECTRICAL COMPONENTS & EQUIPMENT—1.1% | | | | |
| Eaton Corp., PLC. | | 9,500 | | 760,190 |
- 62 -
THE ALGER FUNDS | ALGER GROWTH & INCOME FUND
Schedule of Investments October 31, 2017 (Continued)
| | | | |
| COMMON STOCKS—92.1% (CONT. ) | | SHARES | | VALUE |
| ELECTRICAL COMPONENTS & EQUIPMENT—1.1% (CONT. ) | | |
| Hubbell, Inc. , Cl. B | | 4,864 | $ | 611,988 |
| | | | | 1,372,178 |
| FINANCIAL EXCHANGES & DATA—1.6% | | | | |
| CME Group, Inc. , Cl. A | | 13,763 | | 1,887,871 |
| HEALTH CARE EQUIPMENT—0.6% | | | | |
| Medtronic PLC. | | 8,783 | | 707,207 |
| HOME IMPROVEMENT RETAIL—2.2% | | | | |
| The Home Depot, Inc. | | 15,200 | | 2,519,856 |
| HOTELS RESORTS & CRUISE LINES—1.5% | | | | |
| Extended Stay America, Inc. | | 37,604 | | 745,311 |
| Royal Caribbean Cruises Ltd. | | 8,400 | | 1,039,668 |
| | | | | 1,784,979 |
| HOUSEHOLD PRODUCTS—1.4% | | | | |
| The Procter & Gamble Co. | | 18,860 | | 1,628,372 |
| HYPERMARKETS & SUPER CENTERS—0.9% | | | | |
| Wal-Mart Stores, Inc. | | 11,700 | | 1,021,527 |
| INDUSTRIAL CONGLOMERATES—3.6% | | | | |
| General Electric Co. | | 68,347 | | 1,377,876 |
| Honeywell International, Inc. | | 19,156 | | 2,761,529 |
| | | | | 4,139,405 |
| INDUSTRIAL GASES—0.6% | | | | |
| Air Products & Chemicals, Inc. | | 4,609 | | 734,813 |
| INTEGRATED OIL & GAS—3.1% | | | | |
| Exxon Mobil Corp. | | 28,532 | | 2,378,142 |
| TOTAL SA# | | 23,119 | | 1,288,191 |
| | | | | 3,666,333 |
| INTEGRATED TELECOMMUNICATION SERVICES—2.7% | | | |
| AT&T, Inc. | | 30,300 | | 1,019,595 |
| Verizon Communications, Inc. | | 45,395 | | 2,173,059 |
| | | | | 3,192,654 |
| INTERNET & DIRECT MARKETING RETAIL—0.6% | | | | |
| Amazon. com, Inc. * | | 640 | | 707,379 |
| INTERNET SOFTWARE & SERVICES—5.2% | | | | |
| Alphabet, Inc. , Cl. A* | | 2,005 | | 2,071,245 |
| Alphabet, Inc. , Cl. C* | | 2,010 | | 2,043,447 |
| Facebook, Inc. , Cl. A* | | 10,900 | | 1,962,654 |
| | | | | 6,077,346 |
| INVESTMENT BANKING & BROKERAGE—2.3% | | | | |
| Morgan Stanley | | 54,020 | | 2,701,000 |
| LEISURE FACILITIES—0.6% | | | | |
| Six Flags Entertainment Corp. | | 10,410 | | 653,644 |
| MANAGED HEALTH CARE—3.3% | | | | |
| Aetna, Inc. | | 11,549 | | 1,963,676 |
| UnitedHealth Group, Inc. | | 8,912 | | 1,873,481 |
| | | | | 3,837,157 |
- 63 -
THE ALGER FUNDS | ALGER GROWTH & INCOME FUND
Schedule of Investments October 31, 2017 (Continued)
| | | | |
| COMMON STOCKS—92.1% (CONT. ) | | SHARES | | VALUE |
| MOVIES & ENTERTAINMENT—0.7% | | | | |
| Time Warner, Inc. | | 8,488 | $ | 834,286 |
| MULTI-LINE INSURANCE—0.8% | | | | |
| The Hartford Financial Services Group, Inc. | | 16,900 | | 930,345 |
| MULTI-UTILITIES—0.8% | | | | |
| Sempra Energy | | 7,991 | | 938,943 |
| OIL & GAS EQUIPMENT & SERVICES—0.7% | | | | |
| Halliburton Co. | | 19,500 | | 833,430 |
| OIL & GAS EXPLORATION & PRODUCTION—0.8% | | | | |
| ConocoPhillips | | 17,676 | | 904,127 |
| PACKAGED FOODS & MEATS—0.6% | | | | |
| The Kraft Heinz Co. | | 8,600 | | 665,038 |
| PHARMACEUTICALS—8.3% | | | | |
| Bristol-Myers Squibb Co. | | 28,880 | | 1,780,741 |
| Eli Lilly & Co. | | 20,500 | | 1,679,770 |
| GlaxoSmithKline PLC. # | | 21,339 | | 777,380 |
| Johnson & Johnson | | 20,000 | | 2,788,200 |
| Pfizer, Inc. | | 62,024 | | 2,174,561 |
| Roche Holding AG# | | 17,055 | | 493,145 |
| | | | | 9,693,797 |
| RAILROADS—0.5% | | | | |
| CSX Corp. | | 10,763 | | 542,778 |
| RESTAURANTS—2.5% | | | | |
| Darden Restaurants, Inc. | | 8,100 | | 666,387 |
| Dunkin' Brands Group, Inc. | | 10,654 | | 629,332 |
| McDonald's Corp. | | 9,800 | | 1,635,718 |
| | | | | 2,931,437 |
| SEMICONDUCTOR EQUIPMENT—1.0% | | | | |
| KLA-Tencor Corp. | | 10,895 | | 1,186,357 |
| SEMICONDUCTORS—4.3% | | | | |
| Broadcom Ltd. | | 10,900 | | 2,876,619 |
| Intel Corp. | | 35,637 | | 1,621,127 |
| QUALCOMM, Inc. | | 12,100 | | 617,221 |
| | | | | 5,114,967 |
| SOFT DRINKS—2.7% | | | | |
| PepsiCo, Inc. | | 20,247 | | 2,231,827 |
| The Coca-Cola Co. | | 20,700 | | 951,786 |
| | | | | 3,183,613 |
| SYSTEMS SOFTWARE—4.7% | | | | |
| Choicestream, Inc. *,@,(a),(b) | | 5,064 | | – |
| Microsoft Corp. | | 66,604 | | 5,540,121 |
| | | | | 5,540,121 |
| TECHNOLOGY HARDWARE STORAGE & PERIPHERALS—5.7% | | |
| Apple, Inc. | | 33,935 | | 5,736,372 |
| Western Digital Corp. | | 9,824 | | 876,988 |
| | | | | 6,613,360 |
- 64 -
THE ALGER FUNDS | ALGER GROWTH & INCOME FUND
Schedule of Investments October 31, 2017 (Continued)
| | | | | |
| COMMON STOCKS—92.1% (CONT. ) | | SHARES | | | VALUE |
| TOBACCO—2.1% | | | | | |
| Altria Group, Inc. | | 39,079 | | $ | 2,509,653 |
| TOTAL COMMON STOCKS | | | | | |
| (Cost $62,700,541) | | | | 107,861,738 |
| CONVERTIBLE PREFERRED STOCKS—0.4% | | SHARES | | | VALUE |
| PHARMACEUTICALS—0.4% | | | | | |
| Allergan PLC. , 5.50%, 3/1/2018 | | 770 | | | 495,641 |
| (Cost $770,000) | | | | | 495,641 |
| PREFERRED STOCKS—0.0% | | SHARES | | | VALUE |
| SYSTEMS SOFTWARE—0.0% | | | | | |
| Choicestream, Inc. , Series A*,@,(a),(b) | | 43,672 | | | – |
| Choicestream, Inc. , Series B*,@,(a),(b) | | 89,234 | | | – |
| | | | | | – |
| TOTAL PREFERRED STOCKS | | | | | |
| (Cost $88,464) | | | | | – |
| WARRANTS—0.0% | | SHARES | | | VALUE |
| SYSTEMS SOFTWARE—0.0% | | | | | |
| Choicestream, Inc. , 6/22/26*,@,(a),(b) | | 15,285 | | | – |
| (Cost $15,269) | | | | | – |
| MASTER LIMITED PARTNERSHIP—1.8% | | SHARES | | | VALUE |
| ASSET MANAGEMENT & CUSTODY BANKS—1.4% | | | | | |
| The Blackstone Group LP.(c) | | 50,400 | | | 1,677,816 |
| OIL & GAS STORAGE & TRANSPORTATION—0.4% | | | | | |
| Cheniere Energy Partners LP.*,(c) | | 16,300 | | | 456,237 |
| TOTAL MASTER LIMITED PARTNERSHIP | | | | | |
| (Cost $1,669,385) | | | | | 2,134,053 |
| REAL ESTATE INVESTMENT TRUST—3.0% | | SHARES | | | VALUE |
| HEALTH CARE—0.6% | | | | | |
| Welltower, Inc. | | 11,100 | | | 743,256 |
| MORTGAGE—0.6% | | | | | |
| Blackstone Mortgage Trust, Inc. , Cl. A(c) | | 22,200 | | | 706,626 |
| SPECIALIZED—1.8% | | | | | |
| Crown Castle International Corp. | | 11,257 | | | 1,205,400 |
| Lamar Advertising Co. , Cl. A | | 12,600 | | | 887,544 |
| | | | | | 2,092,944 |
| TOTAL REAL ESTATE INVESTMENT TRUST | | | | | |
| (Cost $2,848,793) | | | | | 3,542,826 |
| | | PRINCIPAL | | | |
| CORPORATE BONDS—0.0% | | AMOUNT | | | VALUE |
| SYSTEMS SOFTWARE—0.0% | | | | | |
| Choicestream, Inc. , 11.00%, 8/5/18@,(a),(b) | | 15,285 | | | – |
| (Cost $14) | | | | | – |
| SHORT—TERM INVESTMENTS—1.5% | | SHARES | | | VALUE |
| MONEY MARKET FUND—1.5% | | | | | |
| Invesco Government & Agency Portfolio | | 1,808,020 | | | 1,808,020 |
- 65 -
THE ALGER FUNDS | ALGER GROWTH & INCOME FUND
Schedule of Investments October 31, 2017 (Continued)
| | | | |
| SHORT—TERM INVESTMENTS—1.5% (CONT. ) | | SHARES | | VALUE |
| MONEY MARKET FUND—1.5% (CONT. ) | | | | |
| (Cost $1,808,020) | | | | 1,808,020 |
| Total Investments | | | | |
| (Cost $69,900,487) | | 98.8% | $ | 115,842,278 |
| Affiliated Securities (Cost $105,217) | | | | – |
| Unaffiliated Securities (Cost $69,795,270) | | | $ | 115,842,278 |
| Other Assets in Excess of Liabilities | | 1.2 | % | 1,337,772 |
| NET ASSETS | | 100.0% | $ | 117,180,050 |
# American Depositary Receipts.
(a) Deemed an affiliate of the Alger fund complex during the year for purposes of Section 2(a)(3) of the Investment Company
Act of 1940. See Affiliated Securities Note 11.
(b) Security is valued in good faith at fair value determined using significant unobservable inputs pursuant to procedures established
by the Board.
(c) All or portion of the security is on loan.
* Non-income producing security.
@ Restricted security - Investment in security not registered under the Securities Act of 1933. The investment is deemed to not be
liquid and may be sold only to qualified buyers.
| | | | | | | | | |
| | | | | % of net assets | | | | % of net assets | |
| | Acquisition | | Acquisition | (Acquisition | | | Market | as of | |
| Security | Date(s) | | Cost | Date) | | | Value | 10/31/2017 | |
| Choicestream, Inc. | 03/14/14 | $ | 1,469 | 0.00 | % | $ | 0 | 0.00 | % |
| Choicestream, Inc. , 11.00%, | | | | | | | | | |
| 8/05/18 | 08/04/16 | | 14 | 0.00 | % | | 0 | 0.00 | % |
| Choicestream, Inc. , 6/22/26 | 08/04/16 | | 15,269 | 0.02 | % | | 0 | 0.00 | % |
| Choicestream, Inc. , Series A | 12/17/13 | | 34,924 | 0.03 | % | | 0 | 0.00 | % |
| Choicestream, Inc. , Series B | 07/10/14 | | 53,541 | 0.05 | % | | 0 | 0.00 | % |
| Total | | | | | | $ | – | – | % |
Industry classifications are unaudited.
See Notes to Financial Statements.
- 66 -
THE ALGER FUNDS
Statement of Assets and Liabilities October 31, 2017
| | | | | | |
| | | Alger Capital | | Alger | |
| | | | Appreciation | | International | |
| | | | Fund | Growth Fund | |
| ASSETS: | | | | | | |
| Investments in unaffiliated securities, at value (Identified cost | | | | | | |
| below)*see accompanying schedules of investments | | $ | 2,788,767,945 | $ | 177,869,227 | |
| Investments in affiliated securities, at value (Identified cost | | | | | | |
| below)** see accompanying schedules of investments | | | — | | — | |
| Cash and cash equivalents | | | 2,241,247 | | — | |
| Foreign cash † | | | — | | 1,575,492 | |
| Receivable for investment securities sold | | | 27,105,409 | | 1,811,175 | |
| Receivable for shares of beneficial interest sold | | | 3,821,887 | | 31,953 | |
| Dividends and interest receivable | | | 893,106 | | 478,168 | |
| Receivable from Investment Manager | | | — | | 7,716 | |
| Prepaid expenses | | | 286,357 | | 69,126 | |
| Total Assets | | | 2,823,115,951 | | 181,842,857 | |
| |
| LIABILITIES: | | | | | | |
| Payable for investment securities purchased | | | 15,792,721 | | 718,987 | |
| Payable for shares of beneficial interest redeemed | | | 2,276,440 | | 109,403 | |
| Bank overdraft | | | — | | 1,163,792 | |
| Accrued investment advisory fees | | | 1,839,557 | | 111,202 | |
| Accrued transfer agent fees | | | 842,421 | | 61,406 | |
| Accrued distribution fees | | | 592,157 | | 58,728 | |
| Accrued administrative fees | | | 65,958 | | 4,307 | |
| Accrued shareholder administrative fees | | | 34,122 | | 2,454 | |
| Accrued other expenses | | | 413,771 | | 168,998 | |
| Total Liabilities | | | 21,857,147 | | 2,399,277 | |
| NET ASSETS | $ | 2,801,258,804 | $ | 179,443,580 | |
| |
| NET ASSETS CONSIST OF: | | | | | | |
| Paid in capital (par value of $. 001 per share) | | | 1,868,183,475 | | 158,468,061 | |
| Undistributed net investment income (accumulated loss) | | | 690,901 | | 6,606,650 | |
| Undistributed net realized gain (accumulated realized loss) | | | 160,488,034 | | (102,285 | ) |
| Net unrealized appreciation on investments | | | 771,896,394 | | 14,471,154 | |
| NET ASSETS | $ | 2,801,258,804 | $ | 179,443,580 | |
| * Identified cost | | $ | 2,014,851,318(a) | $ | 163,388,136 | (b) |
| ** Identified cost | | $ | 1,973,570(a) | $ | — | |
| † Cost of foreign cash | | $ | — | $ | 1,578,413 | |
| See Notes to Financial Statements. | | | | | | |
- 67 -
THE ALGER FUNDS
Statement of Assets and Liabilities October 31, 2017 (Continued)
| | | | |
| | | Alger Capital | Alger International |
| | Appreciation Fund | | Growth Fund |
| NET ASSETS BY CLASS: | | | | |
| Class A | $ | 1,506,389,446 | $ | 119,476,867 |
| Class B | $ | 14,819,650 | $ | 24,777,167 |
| Class C | $ | 297,043,917 | $ | 12,130,253 |
| Class I | $ | — | $ | 1,742,302 |
| Class Z | $ | 983,005,791 | $ | 21,316,991 |
| |
| SHARES OF BENEFICIAL INTEREST OUTSTANDING — NOTE 6: | | |
| Class A | | 58,240,629 | | 6,795,763 |
| Class B | | 712,120 | | 1,614,382 |
| Class C | | 14,207,232 | | 810,025 |
| Class I | | — | | 99,330 |
| Class Z | | 37,155,350 | | 1,199,316 |
| |
| NET ASSET VALUE PER SHARE: | | | | |
| Class A — Net Asset Value Per Share Class A | $ | 25.86 | $ | 17.58 |
| Class A — Offering Price Per Share | | | | |
| (includes a 5.25% sales charge) | $ | 27.30 | $ | 18.56 |
| Class B — Net Asset Value Per Share Class B | $ | 20.81 | $ | 15.35 |
| Class C — Net Asset Value Per Share Class C | $ | 20.91 | $ | 14.98 |
| Class I — Net Asset Value Per Share Class I | $ | — | $ | 17.54 |
| Class Z — Net Asset Value Per Share Class Z | $ | 26.46 | $ | 17.77 |
| See Notes to Financial Statements. | | | | |
(a) At October 31, 2017, the net unrealized appreciation on investments, based on cost for federal income tax purposes of
$2,038,655,869, amounted to $750,112,076 which consisted of aggregate gross unrealized appreciation of $789,468,224 and
aggregate gross unrealized depreciation of $39,356,148.
(b) At October 31, 2017, the net unrealized appreciation on investments, based on cost for federal income tax purposes of
$165,541,114, amounted to $12,328,113 which consisted of aggregate gross unrealized appreciation of $16,041,933 and
aggregate gross unrealized depreciation of $3,713,820.
- 68 -
THE ALGER FUNDS
Statement of Assets and Liabilities October 31, 2017 (Continued)
| | | | | | |
| | Alger Mid Cap | | Alger SMid Cap | |
| | Growth Fund | | | Focus Fund | |
| ASSETS: | | | | | | |
| Investments in unaffiliated securities, at value (Identified cost | | | | | | |
| below)*see accompanying schedules of investments | $ | 180,930,691 | | $ | 184,856,350 | |
| Investments in affiliated securities, at value (Identified cost | | | | | | |
| below)** see accompanying schedules of investments | | 685,183 | | | 722,199 | |
| Cash and cash equivalents | | 7,250,758 | | | 7,884,327 | |
| Receivable for investment securities sold | | 5,054,926 | | | — | |
| Receivable for shares of beneficial interest sold | | 122,571 | | | 1,016,297 | |
| Dividends and interest receivable | | 30,891 | | | 4,377 | |
| Receivable from Investment Manager | | 608 | | | 79 | |
| Receivable for escrow (Identified cost below) *** | | 678,214 | | | — | |
| Prepaid expenses | | 74,839 | | | 84,042 | |
| Total Assets | | 194,828,681 | | | 194,567,671 | |
| |
| LIABILITIES: | | | | | | |
| Payable for investment securities purchased | | 10,430,904 | | | 1,528,481 | |
| Payable for shares of beneficial interest redeemed | | 101,500 | | | 146,247 | |
| Accrued investment advisory fees | | 120,971 | | | 134,129 | |
| Accrued transfer agent fees | | 70,362 | | | 83,037 | |
| Accrued distribution fees | | 58,894 | | | 50,901 | |
| Accrued administrative fees | | 4,377 | | | 4,554 | |
| Accrued shareholder administrative fees | | 2,552 | | | 2,317 | |
| Accrued other expenses | | 124,958 | | | 106,753 | |
| Total Liabilities | | 10,914,518 | | | 2,056,419 | |
| NET ASSETS | $ | 183,914,163 | | $ | 192,511,252 | |
| |
| NET ASSETS CONSIST OF: | | | | | | |
| Paid in capital (par value of $. 001 per share) | | 170,823,184 | | | 136,359,683 | |
| Undistributed net investment income (accumulated loss) | | (1,143,185 | ) | | — | |
| Undistributed net realized gain | | 1,562,723 | | | 23,377,965 | |
| Net unrealized appreciation on investments | | 12,671,441 | | | 32,773,604 | |
| NET ASSETS | $ | 183,914,163 | | $ | 192,511,252 | |
| * Identified cost | $ | 168,524,290(a) | | $ | 151,763,311 | (b) |
| ** Identified cost | $ | 988,245(a) | | $ | 1,041,633 | (b) |
| *** Identified cost escrow receivable | $ | 107,969 | | $ | — | |
| See Notes to Financial Statements. | | | | | | |
- 69 -
THE ALGER FUNDS
Statement of Assets and Liabilities October 31, 2017 (Continued)
| | | | |
| | Alger Mid Cap | Alger SMid Cap |
| | | Growth Fund | | Focus Fund |
| NET ASSETS BY CLASS: | | | | |
| Class A | $ | 136,794,696 | $ | 84,643,875 |
| Class B | $ | 18,375,134 | $ | — |
| Class C | $ | 15,437,870 | $ | 31,650,764 |
| Class I | $ | — | $ | 23,373,585 |
| Class Y | $ | — | $ | 107,094 |
| Class Z | $ | 13,306,463 | $ | 52,735,934 |
| |
| SHARES OF BENEFICIAL INTEREST OUTSTANDING — NOTE 6: | | |
| Class A | | 10,157,515 | | 6,574,512 |
| Class B | | 1,702,127 | | — |
| Class C | | 1,446,497 | | 3,279,903 |
| Class I | | — | | 1,778,632 |
| Class Y | | — | | 8,150 |
| Class Z | | 981,004 | | 3,918,506 |
| |
| NET ASSET VALUE PER SHARE: | | | | |
| Class A — Net Asset Value Per Share Class A | $ | 13.47 | $ | 12.87 |
| Class A — Offering Price Per Share | | | | |
| (includes a 5.25% sales charge) | $ | 14.21 | $ | 13.59 |
| Class B — Net Asset Value Per Share Class B | $ | 10.80 | $ | — |
| Class C — Net Asset Value Per Share Class C | $ | 10.67 | $ | 9.65 |
| Class I — Net Asset Value Per Share Class I | $ | — | $ | 13.14 |
| Class Y — Net Asset Value Per Share Class Y | $ | — | $ | 13.14 |
| Class Z — Net Asset Value Per Share Class Z | $ | 13.56 | $ | 13.46 |
| See Notes to Financial Statements. | | | | |
(a) At October 31, 2017, the net unrealized appreciation on investments, based on cost for federal income tax purposes of
$169,584,580, amounted to $12,709,508 which consisted of aggregate gross unrealized appreciation of $14,917,401 and
aggregate gross unrealized depreciation of $2,207,893.
(b) At October 31, 2017, the net unrealized appreciation on investments, based on cost for federal income tax purposes of
$153,822,560, amounted to $31,755,989 which consisted of aggregate gross unrealized appreciation of $38,279,364 and
aggregate gross unrealized depreciation of $6,523,375.
- 70 -
THE ALGER FUNDS
Statement of Assets and Liabilities October 31, 2017 (Continued)
| | | | | | |
| | Alger Small Cap | | Alger Small Cap | |
| | Growth Fund | | | Focus Fund | |
| ASSETS: | | | | | | |
| Investments in unaffiliated securities, at value (Identified cost | | | | | | |
| below)*see accompanying schedules of investments | $ | 139,806,788 | | $ | 582,017,366 | |
| Investments in affiliated securities, at value (Identified cost | | | | | | |
| below)**see accompanying schedules of investments | | 158,147 | | | — | |
| Cash and cash equivalents | | 2,975,560 | | | 5,037,198 | |
| Receivable for shares of beneficial interest sold | | 23,106 | | | 6,066,271 | |
| Dividends and interest receivable | | 2,995 | | | — | |
| Receivable from Investment Manager | | 3,984 | | | — | |
| Receivable for escrow (Identified cost below) *** | | 200,894 | | | 13,684 | |
| Prepaid expenses | | 75,556 | | | 136,722 | |
| Total Assets | | 143,247,030 | | | 593,271,241 | |
| |
| LIABILITIES: | | | | | | |
| Payable for investment securities purchased | | — | | | 3,351,494 | |
| Payable for shares of beneficial interest redeemed | | 279,171 | | | 594,533 | |
| Accrued investment advisory fees | | 100,901 | | | 372,268 | |
| Due to investment advisor | | — | | | 10,409 | |
| Accrued transfer agent fees | | 44,518 | | | 64,842 | |
| Accrued distribution fees | | 34,049 | | | 80,465 | |
| Accrued administrative fees | | 3,426 | | | 13,650 | |
| Accrued shareholder administrative fees | | 1,903 | | | 5,647 | |
| Accrued other expenses | | 107,317 | | | 120,313 | |
| Total Liabilities | | 571,285 | | | 4,613,621 | |
| NET ASSETS | $ | 142,675,745 | | $ | 588,657,620 | |
| |
| NET ASSETS CONSIST OF: | | | | | | |
| Paid in capital (par value of $. 001 per share) | | 97,972,806 | | | 481,312,465 | |
| Undistributed net investment income (accumulated loss) | | (1,210,707 | ) | | (2,281,198 | ) |
| Undistributed net realized gain | | 600,530 | | | 3,991,162 | |
| Net unrealized appreciation on investments | | 45,313,116 | | | 105,635,191 | |
| NET ASSETS | $ | 142,675,745 | | $ | 588,657,620 | |
| * Identified cost | $ | 94,591,020(a) | | $ | 476,393,657 | (b) |
| ** Identified cost | $ | 228,096(a) | | $ | — | |
| *** Identified cost escrow receivable | $ | 32,333 | | $ | 2,202 | |
| See Notes to Financial Statements. | | | | | | |
- 71 -
THE ALGER FUNDS
Statement of Assets and Liabilities October 31, 2017 (Continued)
| | | | |
| | Alger Small Cap | Alger Small Cap |
| | | Growth Fund | | Focus Fund |
| NET ASSETS BY CLASS: | | | | |
| Class A | $ | 102,317,814 | $ | 77,790,754 |
| Class B | $ | 5,397,310 | $ | — |
| Class C | $ | 8,007,284 | $ | 48,344,909 |
| Class I | $ | — | $ | 109,145,914 |
| Class Y | $ | — | $ | 3,278,877 |
| Class Z | $ | 26,953,337 | $ | 350,097,166 |
| |
| SHARES OF BENEFICIAL INTEREST OUTSTANDING — NOTE 6: | | |
| Class A | | 12,183,357 | | 5,218,210 |
| Class B | | 841,283 | | — |
| Class C | | 1,286,384 | | 3,559,464 |
| Class I | | — | | 7,143,730 |
| Class Y | | — | | 212,310 |
| Class Z | | 3,135,249 | | 22,676,522 |
| |
| NET ASSET VALUE PER SHARE: | | | | |
| Class A — Net Asset Value Per Share Class A | $ | 8.40 | $ | 14.91 |
| Class A — Offering Price Per Share | | | | |
| (includes a 5.25% sales charge) | $ | 8.86 | $ | 15.73 |
| Class B — Net Asset Value Per Share Class B | $ | 6.42 | $ | — |
| Class C — Net Asset Value Per Share Class C | $ | 6.22 | $ | 13.58 |
| Class I — Net Asset Value Per Share Class I | $ | — | $ | 15.28 |
| Class Y — Net Asset Value Per Share Class Y | $ | — | $ | 15.44 |
| Class Z — Net Asset Value Per Share Class Z | $ | 8.60 | $ | 15.44 |
| See Notes to Financial Statements. | | | | |
(a) At October 31, 2017, the net unrealized appreciation on investments, based on cost for federal income tax purposes of
$95,495,975, amounted to $44,669,854 which consisted of aggregate gross unrealized appreciation of $48,425,619 and
aggregate gross unrealized depreciation of $3,755,765.
(b) At October 31, 2017, the net unrealized appreciation on investments, based on cost for federal income tax purposes of
$478,226,421, amounted to $103,804,629 which consisted of aggregate gross unrealized appreciation of $116,355,515 and
aggregate gross unrealized depreciation of $12,550,886.
- 72 -
THE ALGER FUNDS
Statement of Assets and Liabilities October 31, 2017 (Continued)
| | | | | | |
| | | Alger Health | | Alger Growth & | |
| | Sciences Fund | | Income Fund | |
| ASSETS: | | | | | | |
| Investments in unaffiliated securities, at value (Identified cost | | | | | | |
| below)*see accompanying schedules of investments # | | | | | | |
| (Including in Alger Growth & Income Fund securities loaned | | | | | | |
| at value of $1,770,840) | $ | 146,454,643 | | $ | 115,842,278 | |
| Investments in affiliated securities, at value (Identified cost | | | | | | |
| below)** see accompanying schedules of investments | | 2,799,782 | | | — | |
| Cash and cash equivalents | | 1,212,013 | | | 3,244,286 | |
| Receivable for investment securities sold | | 1,427,688 | | | — | |
| Receivable for shares of beneficial interest sold | | 213,414 | | | 85,341 | |
| Dividends and interest receivable | | 119,749 | | | 145,828 | |
| Receivable from Investment Manager | | 3,577 | | | — | |
| Receivable for escrow (Identified cost below) *** | | 2,249,371 | | | — | |
| Prepaid expenses | | 46,306 | | | 44,423 | |
| Total Assets | | 154,526,543 | | | | 119,362,156 | |
| |
| LIABILITIES: | | | | | | |
| Payable for investment securities purchased | | 1,057,766 | | | — | |
| Collateral on securities loaned at value (Note 4) | | — | | | 1,808,020 | |
| Payable for shares of beneficial interest redeemed | | 448,911 | | | 171,717 | |
| Accrued investment advisory fees | | 111,365 | | | 59,879 | |
| Accrued transfer agent fees | | 57,955 | | | 32,820 | |
| Accrued distribution fees | | 49,134 | | | 35,275 | |
| Accrued administrative fees | | 3,781 | | | 2,815 | |
| Accrued shareholder administrative fees | | 2,107 | | | 1,561 | |
| Accrued other expenses | | 90,902 | | | 70,019 | |
| Total Liabilities | | 1,821,921 | | | 2,182,106 | |
| NET ASSETS | $ | 152,704,622 | | $ | 117,180,050 | |
| |
| NET ASSETS CONSIST OF: | | | | | | |
| Paid in capital (par value of $. 001 per share) | | 110,957,641 | | | 68,899,347 | |
| Undistributed net investment income (accumulated loss) | | (1,081,795 | ) | | 432,973 | |
| Undistributed net realized gain | | 3,752,380 | | | 1,907,780 | |
| Net unrealized appreciation on investments | | 39,076,396 | | | 45,939,950 | |
| NET ASSETS | $ | 152,704,622 | | $ | 117,180,050 | |
| * Identified cost | $ | 108,027,576(a) | | | $ | 69,795,270 | (b) |
| ** Identified cost | $ | 4,038,147(a) | | | $ | 105,217 | (b) |
| *** Identified cost escrow receivable | $ | 357,397 | | $ | — | |
| # Includes collateral on stock loan | $ | — | | $ | 1,808,020 | |
| See Notes to Financial Statements. | | | | | | |
- 73 -
THE ALGER FUNDS
Statement of Assets and Liabilities October 31, 2017 (Continued)
| | | | |
| | | Alger Health | Alger Growth & |
| | Sciences Fund | | Income Fund |
| NET ASSETS BY CLASS: | | | | |
| Class A | $ | 95,913,068 | $ | 72,427,369 |
| Class C | $ | 31,147,996 | $ | 22,265,642 |
| Class Z | $ | 25,643,558 | $ | 22,487,039 |
| |
| SHARES OF BENEFICIAL INTEREST OUTSTANDING — NOTE 6: | | |
| Class A | | 3,812,328 | | 1,825,359 |
| Class C | | 1,539,374 | | 568,917 |
| Class Z | | 1,021,311 | | 566,236 |
| |
| NET ASSET VALUE PER SHARE: | | | | |
| Class A — Net Asset Value Per Share Class A | $ | 25.16 | $ | 39.68 |
| Class A — Offering Price Per Share | | | | |
| (includes a 5.25% sales charge) | $ | 26.55 | $ | 41.88 |
| Class C — Net Asset Value Per Share Class C | $ | 20.23 | $ | 39.14 |
| Class Z — Net Asset Value Per Share Class Z | $ | 25.11 | $ | 39.71 |
| See Notes to Financial Statements. | | | | |
(a) At October 31, 2017, the net unrealized appreciation on investments, based on cost for federal income tax purposes of
$113,858,539, amounted to $37,645,257 which consisted of aggregate gross unrealized appreciation of $41,122,549 and
aggregate gross unrealized depreciation of $3,477,292.
(b) At October 31, 2017, the net unrealized appreciation on investments, based on cost for federal income tax purposes of
$69,495,101, amounted to $46,347,177 which consisted of aggregate gross unrealized appreciation of $47,807,999 and
aggregate gross unrealized depreciation of $1,460,822.
- 74 -
THE ALGER FUNDS
Statement of Operations For the year ended October 31, 2017
| | | | | | |
| | | Alger Capital | | Alger International | |
| | Appreciation Fund | | | Growth Fund | |
| INCOME: | | | | | | |
| Dividends (net of foreign withholding taxes*) | $ | 29,254,304 | | $ | 3,745,619 | |
| Interest from unaffiliated securities | | 133,981 | | | 13,734 | |
| Interest from affiliated securities — Note 11 | | 7,714 | | | — | |
| Total Income | | 29,395,999 | | | 3,759,353 | |
| |
| EXPENSES: | | | | | | |
| Advisory fees — Note 3(a) | | 20,171,826 | | | 1,226,191 | |
| Distribution fees — Note 3(c) | | | | | | |
| Class A | | 3,529,805 | | | 273,570 | |
| Class B | | 156,187 | | | 239,646 | |
| Class C | | 2,979,811 | | | 131,611 | |
| Class I | | — | | | 16,200 | |
| Shareholder administrative fees — Note 3(f) | | 373,264 | | | 26,796 | |
| Administration fees — Note 3(b) | | 718,039 | | | 47,493 | |
| Custodian fees | | 166,684 | | | 137,831 | |
| Interest expenses | | 8,621 | | | 485 | |
| Transfer agent fees and expenses — Note 3(f) | | 1,897,028 | | | 156,128 | |
| Printing fees | | 342,350 | | | 45,500 | |
| Professional fees | | 232,916 | | | 64,650 | |
| Registration fees | | 120,433 | | | 91,836 | |
| Trustee fees — Note 3(g) | | 108,211 | | | 6,989 | |
| Fund accounting fees | | 339,058 | | | 28,290 | |
| Miscellaneous | | 199,673 | | | 45,493 | |
| Total Expenses | | 31,343,906 | | | 2,538,709 | |
| Less, expense reimbursements/waivers — Note 3(a) | | — | | | (48,600 | ) |
| Net Expenses | | 31,343,906 | | | 2,490,109 | |
| NET INVESTMENT INCOME (LOSS) | | (1,947,907 | ) | | 1,269,244 | |
| |
| REALIZED AND UNREALIZED GAIN (LOSS) ON INVESTMENTS AND FOREIGN | |
| CURRENCY: | | | | | | |
| Net realized gain on unaffiliated investments | | 201,205,273 | | | 20,254,607 | |
| Net realized (loss) on foreign currency transactions | | (5,020 | ) | | (150,591 | ) |
| Net change in unrealized appreciation on unaffiliated | | | | | | |
| investments | | 485,721,149 | | | 13,517,598 | |
| Net change in unrealized appreciation on affiliated | | | | | | |
| investments | | (1,740,728 | ) | | — | |
| Net change in unrealized appreciation on foreign currency | | 3 | | | 54,382 | |
| Net realized and unrealized gain on investments and foreign | | | | | | |
| currency | | 685,180,677 | | | 33,675,996 | |
| NET INCREASE IN NET ASSETS RESULTING | | | | | | |
| FROM OPERATIONS | $ | 683,232,770 | | $ | 34,945,240 | |
| * Foreign withholding taxes | $ | (44,745 | ) | $ | 431,762 | |
| See Notes to Financial Statements. | | | | | | |
- 75 -
THE ALGER FUNDS
Statement of Operations For the year ended October 31, 2017 (Continued)
| | | | | | |
| | Alger Mid Cap | | Alger SMid Cap | |
| | | Growth Fund | | | Focus Fund | |
| INCOME: | | | | | | |
| Dividends (net of foreign withholding taxes*) | $ | 1,282,777 | | $ | 501,322 | |
| Interest from unaffiliated securities | | 40,857 | | | 24,451 | |
| Total Income | | 1,323,634 | | | 525,773 | |
| |
| EXPENSES: | | | | | | |
| Advisory fees — Note 3(a) | | 1,305,514 | | | 1,328,138 | |
| Distribution fees — Note 3(c) | | | | | | |
| Class A | | 315,151 | | | 190,496 | |
| Class B | | 185,239 | | | 1,288 | |
| Class C | | 174,405 | | | 296,576 | |
| Class I | | — | | | 50,498 | |
| Shareholder administrative fees — Note 3(f) | | 27,710 | | | 23,286 | |
| Administration fees — Note 3(b) | | 47,239 | | | 45,091 | |
| Custodian fees | | 48,738 | | | 43,611 | |
| Interest expenses | | 38 | | | 2,687 | |
| Transfer agent fees and expenses — Note 3(f) | | 159,195 | | | 108,697 | |
| Printing fees | | 39,100 | | | 15,753 | |
| Professional fees | | 75,830 | | | 61,850 | |
| Registration fees | | 75,932 | | | 85,299 | |
| Trustee fees — Note 3(g) | | 7,135 | | | 6,700 | |
| Fund accounting fees | | 27,072 | | | 25,420 | |
| Miscellaneous | | 33,983 | | | 45,815 | |
| Total Expenses | | 2,522,281 | | | 2,331,205 | |
| Less, expense reimbursements/waivers — Note 3(a) | | (2,110 | ) | | (1,541 | ) |
| Net Expenses | | 2,520,171 | | | 2,329,664 | |
| NET INVESTMENT LOSS | | (1,196,537 | ) | | (1,803,891 | ) |
| |
| REALIZED AND UNREALIZED GAIN (LOSS) ON INVESTMENTS, ESCROW RECEIVABLE | |
| AND FOREIGN CURRENCY: | | | | | | |
| Net realized gain on unaffiliated investments | | 39,876,101 | | | 33,391,992 | |
| Net realized gain (loss) on foreign currency transactions | | (262 | ) | | 5 | |
| Net change in unrealized appreciation on unaffiliated | | | | | | |
| investments and escrow receivable | | 7,787,074 | | | 18,935,472 | |
| Net change in unrealized appreciation (depreciation) on | | | | | | |
| affiliated investments | | 652,377 | | | (212,956 | ) |
| Net change in unrealized appreciation on foreign currency | | 743 | | | — | |
| Net realized and unrealized gain on investments and foreign | | | | | | |
| currency | | 48,316,033 | | | 52,114,513 | |
| NET INCREASE IN NET ASSETS RESULTING | | | | | | |
| FROM OPERATIONS | $ | 47,119,496 | | $ | 50,310,622 | |
| * Foreign withholding taxes | $ | 741 | | $ | 9,930 | |
| See Notes to Financial Statements. | | | | | | |
- 76 -
THE ALGER FUNDS
Statement of Operations For the year ended October 31, 2017 (Continued)
| | | | | | |
| | Alger Small Cap | | Alger Small Cap | |
| | | Growth Fund | | | Focus Fund | |
| INCOME: | | | | | | |
| Dividends | $ | 638,649 | | $ | 1,221,705 | |
| Interest from unaffiliated securities | | 13,323 | | | 48,389 | |
| Total Income | | 651,972 | | | 1,270,094 | |
| |
| EXPENSES: | | | | | | |
| Advisory fees — Note 3(a) | | 1,064,498 | | | 2,793,505 | |
| Distribution fees — Note 3(c) | | | | | | |
| Class A | | 235,889 | | | 123,117 | |
| Class B | | 52,141 | | | — | |
| Class C | | 83,155 | | | 331,034 | |
| Class I | | — | | | 214,784 | |
| Shareholder administrative fees — Note 3(f) | | 20,155 | | | 42,599 | |
| Administration fees — Note 3(b) | | 36,140 | | | 102,429 | |
| Custodian fees | | 37,470 | | | 49,707 | |
| Interest expenses | | 83 | | | 57 | |
| Transfer agent fees and expenses — Note 3(f) | | 114,580 | | | 186,342 | |
| Printing fees | | 13,775 | | | 77,345 | |
| Professional fees | | 59,840 | | | 65,618 | |
| Registration fees | | 72,193 | | | 52,864 | |
| Trustee fees — Note 3(g) | | 5,451 | | | 15,795 | |
| Fund accounting fees | | 21,813 | | | 51,750 | |
| Miscellaneous | | 30,871 | | | 27,857 | |
| Total Expenses | | 1,848,054 | | | 4,134,803 | |
| Less, expense reimbursements/waivers — Note 3(a) | | (20,399 | ) | | (31,570 | ) |
| Net Expenses | | 1,827,655 | | | 4,103,233 | |
| NET INVESTMENT LOSS | | (1,175,683 | ) | | (2,833,139 | ) |
| |
| REALIZED AND UNREALIZED GAIN (LOSS) ON INVESTMENTS, ESCROW RECEIVABLE | |
| AND FOREIGN CURRENCY: | | | | | | |
| Net realized gain on unaffiliated investments | | 7,313,305 | | | 11,458,770 | |
| Net realized gain (loss) on foreign currency transactions | | (206 | ) | | 3 | |
| Net change in unrealized appreciation on unaffiliated | | | | | | |
| investments and escrow receivable | | 34,359,364 | | | 94,000,002 | |
| Net change in unrealized appreciation on affiliated | | | | | | |
| investments | | 209,240 | | | 17,429 | |
| Net change in unrealized appreciation on foreign currency | | 1,986 | | | — | |
| Net realized and unrealized gain on investments and foreign | | | | | | |
| currency | | 41,883,689 | | | 105,476,204 | |
| NET INCREASE IN NET ASSETS RESULTING | | | | | | |
| FROM OPERATIONS | $ | 40,708,006 | | $ | 102,643,065 | |
| See Notes to Financial Statements. | | | | | | |
- 77 -
THE ALGER FUNDS
Statement of Operations For the year ended October 31, 2017 (Continued)
| | | | | | |
| | | Alger Health | | Alger Growth & | |
| | Sciences Fund | | | Income Fund | |
| INCOME: | | | | | | |
| Dividends (net of foreign withholding taxes*) | $ | 667,390 | | $ | 2,933,636 | |
| Interest from unaffiliated securities | | 7,247 | | | 13,526 | |
| Interest from affiliated securities — Note 11 | | — | | | 300 | |
| Total Income | | 674,637 | | | 2,947,462 | |
| |
| EXPENSES: | | | | | | |
| Advisory fees — Note 3(a) | | 1,057,279 | | | 639,301 | |
| Distribution fees — Note 3(c) | | | | | | |
| Class A | | 208,938 | | | 175,147 | |
| Class B | | 1,562 | | | — | |
| Class C | | 314,134 | | | 225,906 | |
| Shareholder administrative fees — Note 3(f) | | 20,537 | | | 16,950 | |
| Administration fees — Note 3(b) | | 35,895 | | | 30,053 | |
| Custodian fees | | 44,515 | | | 30,050 | |
| Interest expenses | | 1,568 | | | — | |
| Transfer agent fees and expenses — Note 3(f) | | 102,758 | | | 96,150 | |
| Printing fees | | 23,575 | | | 23,350 | |
| Professional fees | | 60,997 | | | 51,595 | |
| Registration fees | | 51,434 | | | 85,316 | |
| Trustee fees — Note 3(g) | | 5,474 | | | 4,797 | |
| Fund accounting fees | | 20,189 | | | 17,873 | |
| Miscellaneous | | 53,961 | | | 24,357 | |
| Total Expenses | | 2,002,816 | | | 1,420,845 | |
| Less, expense reimbursements/waivers — Note 3(a) | | (19,844 | ) | | — | |
| Net Expenses | | 1,982,972 | | | 1,420,845 | |
| NET INVESTMENT INCOME (LOSS) | | (1,308,335 | ) | | 1,526,617 | |
| |
| REALIZED AND UNREALIZED GAIN (LOSS) ON INVESTMENTS, ESCROW RECEIVABLE | |
| AND FOREIGN CURRENCY: | | | | | | |
| Net realized gain on unaffiliated investments | | 11,821,887 | | | 1,793,541 | |
| Net realized gain (loss) on foreign currency transactions | | (357 | ) | | 1 | |
| Net change in unrealized appreciation on unaffiliated | | | | | | |
| investments and escrow receivable | | 41,308,474 | | | 18,984,696 | |
| Net change in unrealized appreciation (depreciation) on | | | | | | |
| affiliated investments | | 2,002,720 | | | (82,911 | ) |
| Net change in unrealized depreciation on foreign currency | | (267 | ) | | — | |
| Net realized and unrealized gain on investments and foreign | | | | | | |
| currency | | 55,132,457 | | | 20,695,327 | |
| NET INCREASE IN NET ASSETS RESULTING | | | | | | |
| FROM OPERATIONS | $ | 53,824,122 | | $ | 22,221,944 | |
| * Foreign withholding taxes | $ | 3,259 | | $ | 16,838 | |
| See Notes to Financial Statements. | | | | | | |
- 78 -
THE ALGER FUNDS
Statements of Changes in Net Assets
| | | | | | | | |
| | | | Alger Capital Appreciation Fund | |
| | | | For the | | | | For the | |
| | | | Year Ended | | | | Year Ended | |
| | | | October 31, 2017 | | | | October 31, 2016 | |
| Net investment loss | | $ | (1,947,907 | ) | | $ | (1,011,068 | ) |
| Net realized gain on investments and foreign currency | | | 201,200,253 | | | | 29,512,427 | |
| Net change in unrealized appreciation (depreciation) on | | | | | | | | |
| investments and foreign currency | | | 483,980,424 | | | | (39,911,973 | ) |
| Net increase (decrease) in net assets resulting from operations | | | 683,232,770 | | | | (11,410,614 | ) |
| |
| Dividends and distributions to shareholders from: | | | | | | | | |
| Net realized gains: | | | | | | | | |
| Class A | | | (11,084,751 | ) | | | (123,485,355 | ) |
| Class B | | | (164,694 | ) | | | (2,118,475 | ) |
| Class C | | | (3,040,556 | ) | | | (29,213,787 | ) |
| Class Z | | | (6,222,799 | ) | | | (47,387,508 | ) |
| Total dividends and distributions to shareholders | | | (20,512,800 | ) | | | (202,205,125 | ) |
| |
| Increase (decrease) from shares of beneficial interest transactions: | | | | | | |
| Class A | | | (211,704,220 | ) | | | (101,382,281 | ) |
| Class B | | | (5,635,461 | ) | | | (5,225,908 | ) |
| Class C | | | (84,512,025 | ) | | | 27,049,897 | |
| Class Z | | | 17,742,855 | | | | 163,806,675 | |
| Net increase (decrease) from shares of beneficial interest | | | | | | | | |
| transactions — Note 6(a) | | | (284,108,851 | ) | | | 84,248,383 | |
| Total increase (decrease) | | | 378,611,119 | | | | (129,367,356 | ) |
| |
| Net Assets: | | | | | | | | |
| Beginning of period | | | 2,422,647,685 | | | | 2,552,015,041 | |
| END OF PERIOD | | $ | 2,801,258,804 | | | $ | 2,422,647,685 | |
| Undistributed net investment income (accumulated loss) | | $ | 690,901 | | | $ | (2,163,396 | ) |
| See Notes to Financial Statements. | | | | | | | | |
- 79 -
THE ALGER FUNDS
Statements of Changes in Net Assets (Continued)
| | | | | | | |
| | | | Alger International Growth Fund | |
| | | | For the | | | For the | |
| | | | Year Ended | | | Year Ended | |
| | | | October 31, 2017 | | | October 31, 2016 | |
| Net investment income | $ | 1,269,244 | | $ | 2,038,922 | |
| Net realized gain (loss) on investments and foreign currency | | | 20,104,016 | | | (10,851,978 | ) |
| Net change in unrealized appreciation (depreciation) on | | | | | | | |
| investments and foreign currency | | | 13,571,980 | | | (5,746,664 | ) |
| Net increase (decrease) in net assets resulting from operations | | | 34,945,240 | | | (14,559,720 | ) |
| |
| Dividends and distributions to shareholders from: | | | | | | | |
| Net investment income: | | | | | | | |
| Class A | | | (1,756,266 | ) | | (52,326 | ) |
| Class B | | | (296,241 | ) | | — | |
| Class C | | | (149,655 | ) | | (295,560 | ) |
| Class I | | | (191,488 | ) | | (52,328 | ) |
| Class Z | | | (401,514 | ) | | (133,058 | ) |
| Total dividends and distributions to shareholders | | | (2,795,164 | ) | | (533,272 | ) |
| |
| Increase (decrease) from shares of beneficial interest transactions: | | | | | | |
| Class A | | | (8,687,179 | ) | | (21,592,184 | ) |
| Class B | | | (4,661,216 | ) | | (4,217,189 | ) |
| Class C | | | (5,427,207 | ) | | (4,666,312 | ) |
| Class I | | | (13,315,454 | ) | | 692,918 | |
| Class Z | | | (915,585 | ) | | 1,154,193 | |
| Net decrease from shares of beneficial interest transactions | | | | | | | |
| — Note 6(a) | | | (33,006,641 | ) | | (28,628,574 | ) |
| Total decrease | | | (856,565 | ) | | (43,721,566 | ) |
| |
| Net Assets: | | | | | | | |
| Beginning of period | | | 180,300,145 | | | 224,021,711 | |
| END OF PERIOD | $ | 179,443,580 | | $ | 180,300,145 | |
| Undistributed net investment income | $ | 6,606,650 | | $ | 1,967,138 | |
| See Notes to Financial Statements. | | | | | | | |
- 80 -
THE ALGER FUNDS
Statements of Changes in Net Assets (Continued)
| | | | | | |
| | | Alger Mid Cap Growth Fund | |
| | | For the | | | For the | |
| | | Year Ended | | | Year Ended | |
| | | October 31, 2017 | | | October 31, 2016 | |
| Net investment loss | $ | (1,196,537 | ) | $ | (842,010 | ) |
| Net realized gain (loss) on investments and foreign currency | | 39,875,839 | | | (3,808,585 | ) |
| Net change in unrealized appreciation (depreciation) on | | | | | | |
| investments, escrow receivable and foreign currency | | 8,440,194 | | | (3,841,136 | ) |
| Net increase (decrease) in net assets resulting from operations | | 47,119,496 | | | (8,491,731 | ) |
| |
| Increase (decrease) from shares of beneficial interest transactions: | | | | | |
| Class A | | (9,211,382 | ) | | (14,563,303 | ) |
| Class B | | (5,653,340 | ) | | (5,810,000 | ) |
| Class C | | (7,853,171 | ) | | (3,881,940 | ) |
| Class Z | | 3,081,444 | | | 5,393,922 | |
| Net decrease from shares of beneficial interest transactions | | | | | | |
| — Note 6(a) | | (19,636,449 | ) | | (18,861,321 | ) |
| Total increase (decrease) | | 27,483,047 | | | (27,353,052 | ) |
| |
| Net Assets: | | | | | | |
| Beginning of period | | 156,431,116 | | | 183,784,168 | |
| END OF PERIOD | $ | 183,914,163 | | $ | 156,431,116 | |
| Undistributed net investment income (accumulated loss) | $ | (1,143,185 | ) | $ | (656,460 | ) |
| See Notes to Financial Statements. | | | | | | |
- 81 -
THE ALGER FUNDS
Statements of Changes in Net Assets (Continued)
| | | | | | |
| | | Alger SMid Cap Focus Fund | |
| | | For the | | | For the | |
| | | Year Ended | | | Year Ended | |
| | | October 31, 2017 | | | October 31, 2016 | |
| Net investment loss | $ | (1,803,891 | ) | $ | (1,987,619 | ) |
| Net realized gain on investments and foreign currency | | 33,391,997 | | | 17,529,616 | |
| Net change in unrealized appreciation (depreciation) on | | | | | | |
| investments and foreign currency | | 18,722,516 | | | (24,476,457 | ) |
| Net increase (decrease) in net assets resulting from operations | | 50,310,622 | | | (8,934,460 | ) |
| |
| Dividends and distributions to shareholders from: | | | | | | |
| Net realized gains: | | | | | | |
| Class A | | (8,828,977 | ) | | (48,219,809 | ) |
| Class B | | — | | | (1,548,623 | ) |
| Class C | | (4,373,822 | ) | | (21,021,697 | ) |
| Class I | | (2,310,435 | ) | | (19,821,414 | ) |
| Class Z | | (3,902,307 | ) | | (50,943,545 | ) |
| Total dividends and distributions to shareholders | | (19,415,541 | ) | | (141,555,088 | ) |
| |
| Increase (decrease) from shares of beneficial interest transactions: | | | | | |
| Class A | | (12,604,986 | ) | | (24,776,293 | ) |
| Class B | | (1,749,902 | ) | | (866,833 | ) |
| Class C | | (5,044,572 | ) | | (414,663 | ) |
| Class I | | (13,761,000 | ) | | (17,203,713 | ) |
| Class Y | | 100,000 | | | — | |
| Class Z | | 16,063,610 | | | (50,359,541 | ) |
| Net decrease from shares of beneficial interest transactions | | | | | | |
| — Note 6(a) | | (16,996,850 | ) | | (93,621,043 | ) |
| Total increase (decrease) | | 13,898,231 | | | (244,110,591 | ) |
| |
| Net Assets: | | | | | | |
| Beginning of period | | 178,613,021 | | | 422,723,612 | |
| END OF PERIOD | $ | 192,511,252 | | $ | 178,613,021 | |
| Undistributed net investment income (accumulated loss) | $ | — | | $ | (1,451,230 | ) |
| See Notes to Financial Statements. | | | | | | |
- 82 -
THE ALGER FUNDS
Statements of Changes in Net Assets (Continued)
| | | | | | | | |
| | | | Alger Small Cap Growth Fund | |
| | | | For the | | | | For the | |
| | | | Year Ended | | | | Year Ended | |
| | | | October 31, 2017 | | | | October 31, 2016 | |
| Net investment loss | $ | (1,175,683 | ) | $ | (1,101,962 | ) |
| Net realized gain (loss) on investments and foreign currency | | | 7,313,099 | | | | (4,992,003 | ) |
| Net change in unrealized appreciation (depreciation) on | | | | | | | | |
| investments, escrow receivable and foreign currency | | | 34,570,590 | | | | (1,014,375 | ) |
| Net increase (decrease) in net assets resulting from operations | | | 40,708,006 | | | | (7,108,340 | ) |
| |
| Dividends and distributions to shareholders from: | | | | | | | | |
| Net realized gains: | | | | | | | | |
| Class A | | | — | | | | (22,341,073 | ) |
| Class B | | | — | | | | (1,545,156 | ) |
| Class C | | | — | | | | (3,286,045 | ) |
| Class Z | | | — | | | | (4,367,677 | ) |
| Total dividends and distributions to shareholders | | | — | | | | (31,539,951 | ) |
| |
| Increase (decrease) from shares of beneficial interest transactions: | | | | | | | |
| Class A | | | (12,430,487 | ) | | | (2,961,323 | ) |
| Class B | | | (1,185,565 | ) | | | 293,755 | |
| Class C | | | (3,259,058 | ) | | | (1,013,586 | ) |
| Class Z | | | (1,776,493 | ) | | | 5,064,750 | |
| Net increase (decrease) from shares of beneficial interest | | | | | | | | |
| transactions — Note 6(a) | | | (18,651,603 | ) | | | 1,383,596 | |
| Total increase (decrease) | | | 22,056,403 | | | | (37,264,695 | ) |
| |
| Net Assets: | | | | | | | | |
| Beginning of period | | | 120,619,342 | | | | 157,884,037 | |
| END OF PERIOD | $ | 142,675,745 | | $ | 120,619,342 | |
| Undistributed net investment income (accumulated loss) | $ | (1,210,707 | ) | $ | (867,784 | ) |
| See Notes to Financial Statements. | | | | | | | | |
- 83 -
THE ALGER FUNDS
Statements of Changes in Net Assets (Continued)
| | | | | | |
| | | Alger Small Cap Focus Fund | |
| | | For the | | | For the | |
| | | Year Ended | | | Year Ended | |
| | | October 31, 2017 | | | October 31, 2016 | |
| Net investment loss | $ | (2,833,139 | ) | $ | (1,000,896 | ) |
| Net realized gain (loss) on investments and foreign currency | | 11,458,773 | | | (4,992,344 | ) |
| Net change in unrealized appreciation on investments, escrow | | | | | | |
| receivable and foreign currency | | 94,017,431 | | | 8,560,677 | |
| Net increase in net assets resulting from operations | | 102,643,065 | | | 2,567,437 | |
| |
| Increase from shares of beneficial interest transactions: | | | | | | |
| Class A | | 40,801,281 | | | 8,957,748 | |
| Class C | | 23,617,747 | | | 7,769,087 | |
| Class I | | 8,060,474 | | | 32,766,158 | |
| Class Y | | 3,184,057 | | | — | |
| Class Z | | 226,869,100 | | | 50,888,678 | |
| Net increase from shares of beneficial interest transactions — | | | | | | |
| Note 6(a) | | 302,532,659 | | | 100,381,671 | |
| Total increase | | 405,175,724 | | | 102,949,108 | |
| |
| Net Assets: | | | | | | |
| Beginning of period | | 183,481,896 | | | 80,532,788 | |
| END OF PERIOD | $ | 588,657,620 | | $ | 183,481,896 | |
| Undistributed net investment income (accumulated loss) | $ | (2,281,198 | ) | $ | (860,396 | ) |
| See Notes to Financial Statements. | | | | | | |
- 84 -
THE ALGER FUNDS
Statements of Changes in Net Assets (Continued)
| | | | | | | |
| | | | Alger Health Sciences Fund | |
| | | | For the | | | For the | |
| | | | Year Ended | | | Year Ended | |
| | | | October 31, 2017 | | | October 31, 2016 | |
| Net investment loss | $ | (1,308,335 | ) | $ | (1,535,979 | ) |
| Net realized gain (loss) on investments and foreign currency | | | 11,821,530 | | | (6,988,494 | ) |
| Net change in unrealized appreciation (depreciation) on | | | | | | | |
| investments, escrow receivable and foreign currency | | | 43,310,927 | | | (14,207,120 | ) |
| Net increase (decrease) in net assets resulting from operations | | | 53,824,122 | | | (22,731,593 | ) |
| |
| Dividends and distributions to shareholders from: | | | | | | | |
| Net realized gains: | | | | | | | |
| Class A | | | — | | | (17,874,985 | ) |
| Class B | | | — | | | (956,709 | ) |
| Class C | | | — | | | (9,452,994 | ) |
| Class Z | | | — | | | (1,581,486 | ) |
| Total dividends and distributions to shareholders | | | — | | | (29,866,174 | ) |
| |
| Increase (decrease) from shares of beneficial interest transactions: | | | | | | |
| Class A | | | (8,001,420 | ) | | (21,876,355 | ) |
| Class B | | | (2,049,856 | ) | | (2,296,932 | ) |
| Class C | | | (10,603,299 | ) | | (9,242,011 | ) |
| Class Z | | | 15,675,422 | | | 1,257,746 | |
| Net decrease from shares of beneficial interest transactions | | | | | | | |
| — Note 6(a) | | | (4,979,153 | ) | | (32,157,552 | ) |
| Total increase (decrease) | | | 48,844,969 | | | (84,755,319 | ) |
| |
| Net Assets: | | | | | | | |
| Beginning of period | | | 103,859,653 | | | 188,614,972 | |
| END OF PERIOD | $ | 152,704,622 | | $ | 103,859,653 | |
| Undistributed net investment income (accumulated loss) | $ | (1,081,795 | ) | $ | (1,200,678 | ) |
| See Notes to Financial Statements. | | | | | | | |
- 85 -
THE ALGER FUNDS
Statements of Changes in Net Assets (Continued)
| | | | | | | |
| | | | Alger Growth & Income Fund | |
| | | | For the | | | For the | |
| | | | Year Ended | | | Year Ended | |
| | | | October 31, 2017 | | | October 31, 2016 | |
| Net investment income | $ | 1,526,617 | | $ | 1,665,959 | |
| Net realized gain (loss) on investments and foreign currency | | | 1,793,542 | | | (174,273 | ) |
| Net change in unrealized appreciation on investments and | | | | | | | |
| foreign currency | | | 18,901,785 | | | 832,293 | |
| Net increase in net assets resulting from operations | | | 22,221,944 | | | 2,323,979 | |
| |
| Dividends and distributions to shareholders from: | | | | | | | |
| Net investment income: | | | | | | | |
| Class A | | | (959,539 | ) | | (1,014,431 | ) |
| Class C | | | (147,657 | ) | | (182,538 | ) |
| Class Z | | | (277,597 | ) | | (202,816 | ) |
| Net realized gains: | | | | | | | |
| Class A | | | (20,167 | ) | | (2,110,139 | ) |
| Class C | | | (6,833 | ) | | (668,401 | ) |
| Class Z | | | (4,557 | ) | | (373,315 | ) |
| Total dividends and distributions to shareholders | | | (1,416,350 | ) | | (4,551,640 | ) |
| |
| Increase (decrease) from shares of beneficial interest transactions: | | | | | | |
| Class A | | | (5,098,191 | ) | | (5,271,860 | ) |
| Class C | | | (2,877,615 | ) | | 36,281 | |
| Class Z | | | 8,015,345 | | | 2,956,823 | |
| Net increase (decrease) from shares of beneficial interest | | | | | | | |
| transactions — Note 6(a) | | | 39,539 | | | (2,278,756 | ) |
| Total increase (decrease) | | | 20,845,133 | | | (4,506,417 | ) |
| |
| Net Assets: | | | | | | | |
| Beginning of period | | | 96,334,917 | | | 100,841,334 | |
| END OF PERIOD | $ | 117,180,050 | | $ | 96,334,917 | |
| Undistributed net investment income | $ | 432,973 | | $ | 360,022 | |
| See Notes to Financial Statements. | | | | | | | |
- 86 -
THE ALGER FUNDS
Financial Highlights for a share outstanding throughout the period
| | | | | | | | | | | | | | | | | | | | |
| Alger Capital Appreciation Fund | | | | | | | | | | | Class A | | | | | | | | | |
| | | Year ended | | | Year ended | | | Year ended | | | Year ended | | | Year ended | |
| | | 10/31/2017 | | | 10/31/2016 | | | 10/31/2015 | | | 10/31/2014 | | | 10/31/2013 | |
| Net asset value, beginning of period | | $ | 20.09 | | | $ | 21.83 | | | $ | 23.13 | | | $ | 21.18 | | | $ | 16.59 | |
| INCOME FROM INVESTMENT OPERATIONS: | | | | | | | | | | | | | | | | | | | | |
| Net investment income (loss)(i) | | | (0.02 | ) | | | – | | | | (0.04 | ) | | | (0.03 | ) | | | 0.11 | |
| Net realized and unrealized gain (loss) on | | | | | | | | | | | | | | | | | | | | |
| investments | | | 5.96 | | | | (0.07 | ) | | | 1.97 | | | | 3.51 | | | | 4.67 | |
| Total from investment operations | | | 5.94 | | | | (0.07 | ) | | | 1.93 | | | | 3.48 | | | | 4.78 | |
| Dividends from net investment income | | | – | | | | – | | | | – | | | | – | | | | (0.12 | ) |
| Distributions from net realized gains | | | (0.17 | ) | | | (1.67 | ) | | | (3.23 | ) | | | (1.53 | ) | | | (0.07 | ) |
| Net asset value, end of period | | $ | 25.86 | | | $ | 20.09 | | | $ | 21.83 | | | $ | 23.13 | | | $ | 21.18 | |
| Total return(ii) | | | 29.84 | % | | | (0.42 | )% | | | 9.15 | % | | | 17.35 | % | | | 29.11 | % |
| RATIOS/SUPPLEMENTAL DATA: | | | | | | | | | | | | | | | | | | | | |
| Net assets, end of period (000's omitted) | $ | 1,506,389 | | $ | 1,360,963 | | $ | 1,592,859 | | $ | 1,389,005 | | $ | 1,217,389 | |
| Ratio of gross expenses to average net assets | | | 1.23 | % | | | 1.22 | % | | | 1.23 | % | | | 1.24 | % | | | 1.26 | % |
| Ratio of net expenses to average net assets | | | 1.23 | % | | | 1.22 | % | | | 1.23 | % | | | 1.24 | % | | | 1.26 | % |
| Ratio of net investment income (loss) to average | | | | | | | | | | | | | | | | | | | | |
| net assets | | | (0.10 | )% | | | (0.02 | )% | | | (0.18 | )% | | | (0.14 | )% | | | 0.58 | % |
| Portfolio turnover rate | | | 72.99 | % | | | 103.80 | % | | | 141.43 | % | | | 147.78 | % | | | 123.81 | % |
| See Notes to Financial Statements. | | | | | | | | | | | | | | | | | | | | |
(i) Amount was computed based on average shares outstanding during the period.
(ii) Does not reflect the effect of sales charges, if applicable.
- 87 -
THE ALGER FUNDS
Financial Highlights for a share outstanding throughout the period
| | | | | | | | | | | | | | | |
| Alger Capital Appreciation Fund | | | | | | | | Class B | | | | | | | |
| | Year ended | | Year ended | | Year ended | | Year ended | | Year ended | |
| | 10/31/2017 | | 10/31/2016 | | 10/31/2015 | | 10/31/2014 | | 10/31/2013 | |
| Net asset value, beginning of period | $ | 16.32 | | $ | 18.17 | | $ | 19.91 | | $ | 18.58 | | $ | 14.57 | |
| INCOME FROM INVESTMENT OPERATIONS: | | | | | | | | | | | | | | | |
| Net investment loss(i) | | (0.15 | ) | | (0.14 | ) | | (0.17 | ) | | (0.17 | ) | | (0.02 | ) |
| Net realized and unrealized gain (loss) on | | | | | | | | | | | | | | | |
| investments | | 4.81 | | | (0.04 | ) | | 1.66 | | | 3.03 | | | 4.10 | |
| Total from investment operations | | 4.66 | | | (0.18 | ) | | 1.49 | | | 2.86 | | | 4.08 | |
| Distributions from net realized gains | | (0.17 | ) | | (1.67 | ) | | (3.23 | ) | | (1.53 | ) | | (0.07 | ) |
| Net asset value, end of period | $ | 20.81 | | $ | 16.32 | | $ | 18.17 | | $ | 19.91 | | $ | 18.58 | |
| Total return(ii) | | 28.82 | % | | (1.18 | )% | | 8.30 | % | | 16.37 | % | | 28.13 | % |
| RATIOS/SUPPLEMENTAL DATA: | | | | | | | | | | | | | | | |
| Net assets, end of period (000's omitted) | $ | 14,820 | | $ | 16,682 | | $ | 24,399 | | $ | 30,382 | | $ | 33,068 | |
| Ratio of gross expenses to average net assets | | 1.99 | % | | 2.04 | % | | 2.01 | % | | 2.03 | % | | 2.05 | % |
| Ratio of net expenses to average net assets | | 1.99 | % | | 2.04 | % | | 2.01 | % | | 2.03 | % | | 2.05 | % |
| Ratio of net investment income (loss) to average | | | | | | | | | | | | | | | |
| net assets | | (0.85 | )% | | (0.84 | )% | | (0.95 | )% | | (0.93 | )% | | (0.15 | )% |
| Portfolio turnover rate | | 72.99 | % | | 103.80 | % | | 141.43 | % | | 147.78 | % | | 123.81 | % |
| See Notes to Financial Statements. | | | | | | | | | | | | | | | |
(i) Amount was computed based on average shares outstanding during the period.
(ii) Does not reflect the effect of sales charges, if applicable.
- 88 -
THE ALGER FUNDS
Financial Highlights for a share outstanding throughout the period
| | | | | | | | | | | | | | | |
| Alger Capital Appreciation Fund | | | | | | | | Class C | | | | | | | |
| | Year ended | | Year ended | | Year ended | | Year ended | | Year ended | |
| | 10/31/2017 | | 10/31/2016 | | 10/31/2015 | | 10/31/2014 | | 10/31/2013 | |
| Net asset value, beginning of period | $ | 16.39 | | $ | 18.24 | | $ | 19.97 | | $ | 18.62 | | $ | 14.62 | |
| INCOME FROM INVESTMENT OPERATIONS: | | | | | | | | | | | | | | | |
| Net investment loss(i) | | (0.15 | ) | | (0.13 | ) | | (0.17 | ) | | (0.17 | ) | | (0.03 | ) |
| Net realized and unrealized gain (loss) on | | | | | | | | | | | | | | | |
| investments | | 4.84 | | | (0.05 | ) | | 1.67 | | | 3.05 | | | 4.12 | |
| Total from investment operations | | 4.69 | | | (0.18 | ) | | 1.50 | | | 2.88 | | | 4.09 | |
| Dividends from net investment income | | – | | | – | | | – | | | – | | | (0.02 | ) |
| Distributions from net realized gains | | (0.17 | ) | | (1.67 | ) | | (3.23 | ) | | (1.53 | ) | | (0.07 | ) |
| Net asset value, end of period | $ | 20.91 | | $ | 16.39 | | $ | 18.24 | | $ | 19.97 | | $ | 18.62 | |
| Total return(ii) | | 28.88 | % | | (1.17 | )% | | 8.33 | % | | 16.44 | % | | 28.14 | % |
| RATIOS/SUPPLEMENTAL DATA: | | | | | | | | | | | | | | | |
| Net assets, end of period (000's omitted) | $ | 297,044 | | $ | 309,114 | | $ | 314,402 | | $ | 236,985 | | $ | 198,377 | |
| Ratio of gross expenses to average net assets | | 1.97 | % | | 1.98 | % | | 1.99 | % | | 2.00 | % | | 2.02 | % |
| Ratio of net expenses to average net assets | | 1.97 | % | | 1.98 | % | | 1.99 | % | | 2.00 | % | | 2.02 | % |
| Ratio of net investment income (loss) to average | | | | | | | | | | | | | | | |
| net assets | | (0.83 | )% | | (0.78 | )% | | (0.94 | )% | | (0.90 | )% | | (0.20 | )% |
| Portfolio turnover rate | | 72.99 | % | | 103.80 | % | | 141.43 | % | | 147.78 | % | | 123.81 | % |
| See Notes to Financial Statements. | | | | | | | | | | | | | | | |
(i) Amount was computed based on average shares outstanding during the period.
(ii) Does not reflect the effect of sales charges, if applicable.
- 89 -
THE ALGER FUNDS
Financial Highlights for a share outstanding throughout the period
| | | | | | | | | | | | | | | |
| Alger Capital Appreciation Fund | | | | | | | | Class Z | | | | | | | |
| | Year ended | | Year ended | | Year ended | | Year ended | | Year ended | |
| | 10/31/2017 | | 10/31/2016 | | 10/31/2015 | | 10/31/2014 | | 10/31/2013 | |
| Net asset value, beginning of period | $ | 20.48 | | $ | 22.15 | | $ | 23.35 | | $ | 21.31 | | $ | 16.68 | |
| INCOME FROM INVESTMENT OPERATIONS: | | | | | | | | | | | | | | | |
| Net investment income(i) | | 0.05 | | | 0.06 | | | 0.03 | | | 0.04 | | | 0.11 | |
| Net realized and unrealized gain (loss) on | | | | | | | | | | | | | | | |
| investments | | 6.10 | | | (0.06 | ) | | 2.00 | | | 3.53 | | | 4.76 | |
| Total from investment operations | | 6.15 | | | – | | | 2.03 | | | 3.57 | | | 4.87 | |
| Dividends from net investment income | | – | | | – | | | – | | | – | | | (0.17 | ) |
| Distributions from net realized gains | | (0.17 | ) | | (1.67 | ) | | (3.23 | ) | | (1.53 | ) | | (0.07 | ) |
| Net asset value, end of period | $ | 26.46 | | $ | 20.48 | | $ | 22.15 | | $ | 23.35 | | $ | 21.31 | |
| Total return(ii) | | 30.25 | % | | (0.08 | )% | | 9.54 | % | | 17.68 | % | | 29.58 | % |
| RATIOS/SUPPLEMENTAL DATA: | | | | | | | | | | | | | | | |
| Net assets, end of period (000's omitted) | $ | 983,006 | | $ | 735,889 | | $ | 620,355 | | $ | 286,186 | | $ | 183,790 | |
| Ratio of gross expenses to average net assets | | 0.88 | % | | 0.89 | % | | 0.90 | % | | 0.93 | % | | 0.93 | % |
| Ratio of net expenses to average net assets | | 0.88 | % | | 0.89 | % | | 0.90 | % | | 0.93 | % | | 0.93 | % |
| Ratio of net investment income (loss) to average | | | | | | | | | | | | | | | |
| net assets | | 0.23 | % | | 0.30 | % | | 0.12 | % | | 0.16 | % | | 0.58 | % |
| Portfolio turnover rate | | 72.99 | % | | 103.80 | % | | 141.43 | % | | 147.78 | % | | 123.81 | % |
| See Notes to Financial Statements. | | | | | | | | | | | | | | | |
(i) Amount was computed based on average shares outstanding during the period.
(ii) Does not reflect the effect of sales charges, if applicable.
- 90 -
THE ALGER FUNDS
Financial Highlights for a share outstanding throughout the period
| | | | | | | | | | | | | | | |
| Alger International Growth Fund | | | | | | | | Class A | | | | | | | |
| | Year ended | | Year ended | | Year ended | | Year ended | | Year ended | |
| | 10/31/2017 | | 10/31/2016 | | 10/31/2015 | | 10/31/2014 | | 10/31/2013 | |
| Net asset value, beginning of period | $ | 14.58 | | $ | 15.57 | | $ | 15.29 | | $ | 15.27 | | $ | 12.61 | |
| INCOME FROM INVESTMENT OPERATIONS: | | | | | | | | | | | | | | | |
| Net investment income(i) | | 0.13 | | | 0.16 | | | 0.03 | | | 0.04 | | | 0.11 | |
| Net realized and unrealized gain (loss) on | | | | | | | | | | | | | | | |
| investments | | 3.11 | | | (1.14 | ) | | 0.40 | | | (0.02 | ) | | 2.64 | |
| Total from investment operations | | 3.24 | | | (0.98 | ) | | 0.43 | | | 0.02 | | | 2.75 | |
| Dividends from net investment income | | (0.24 | ) | | (0.01 | ) | | (0.15 | ) | | – | | | (0.09 | ) |
| Net asset value, end of period | $ | 17.58 | | $ | 14.58 | | $ | 15.57 | | $ | 15.29 | | $ | 15.27 | |
| Total return(ii) | | 22.63 | % | | (6.32 | )% | | 2.85 | % | | 0.15 | % | | 21.98 | % |
| RATIOS/SUPPLEMENTAL DATA: | | | | | | | | | | | | | | | |
| Net assets, end of period (000's omitted) | $ | 119,477 | | $ | 107,398 | | $ | 137,207 | | $ | 130,957 | | $ | 145,096 | |
| Ratio of gross expenses to average net assets | | 1.34 | % | | 1.35 | % | | 1.32 | % | | 1.32 | % | | 1.37 | % |
| Ratio of net expenses to average net assets | | 1.34 | % | | 1.35 | % | | 1.32 | % | | 1.32 | % | | 1.37 | % |
| Ratio of net investment income (loss) to average | | | | | | | | | | | | | | | |
| net assets | | 0.83 | % | | 1.08 | % | | 0.18 | % | | 0.25 | % | | 0.79 | % |
| Portfolio turnover rate | | 148.35 | % | | 134.84 | % | | 114.81 | % | | 97.50 | % | | 217.57 | % |
| See Notes to Financial Statements. | | | | | | | | | | | | | | | |
(i) Amount was computed based on average shares outstanding during the period.
(ii) Does not reflect the effect of sales charges, if applicable.
- 91 -
THE ALGER FUNDS
Financial Highlights for a share outstanding throughout the period
| | | | | | | | | | | | | | | |
| Alger International Growth Fund | | | | | | | | Class B | | | | | | | |
| | Year ended | | Year ended | | Year ended | | Year ended | | Year ended | |
| | 10/31/2017 | | 10/31/2016 | | 10/31/2015 | | 10/31/2014 | | 10/31/2013 | |
| Net asset value, beginning of period | $ | 12.76 | | $ | 13.71 | | $ | 13.44 | | $ | 13.51 | | $ | 11.18 | |
| INCOME FROM INVESTMENT OPERATIONS: | | | | | | | | | | | | | | | |
| Net investment income (loss)(i) | | 0.02 | | | 0.05 | | | (0.07 | ) | | (0.06 | ) | | 0.02 | |
| Net realized and unrealized gain (loss) on | | | | | | | | | | | | | | | |
| investments | | 2.73 | | | (1.00 | ) | | 0.34 | | | (0.01 | ) | | 2.33 | |
| Total from investment operations | | 2.75 | | | (0.95 | ) | | 0.27 | | | (0.07 | ) | | 2.35 | |
| Dividends from net investment income | | (0.16 | ) | | – | | | –(ii) | | | – | | | (0.02 | ) |
| Net asset value, end of period | $ | 15.35 | | $ | 12.76 | | $ | 13.71 | | $ | 13.44 | | $ | 13.51 | |
| Total return(iii) | | 21.71 | % | | (6.86 | )% | | 2.04 | % | | (0.52 | )% | | 21.07 | % |
| RATIOS/SUPPLEMENTAL DATA: | | | | | | | | | | | | | | | |
| Net assets, end of period (000's omitted) | $ | 24,777 | | $ | 25,033 | | $ | 31,357 | | $ | 38,520 | | $ | 63,826 | |
| Ratio of gross expenses to average net assets | | 2.05 | % | | 2.06 | % | | 2.04 | % | | 2.02 | % | | 2.04 | % |
| Ratio of net expenses to average net assets | | 2.05 | % | | 2.06 | % | | 2.04 | % | | 2.02 | % | | 2.04 | % |
| Ratio of net investment income (loss) to average | | | | | | | | | | | | | | | |
| net assets | | 0.13 | % | | 0.37 | % | | (0.53 | )% | | (0.47 | )% | | 0.17 | % |
| Portfolio turnover rate | | 148.35 | % | | 134.84 | % | | 114.81 | % | | 97.50 | % | | 217.57 | % |
| See Notes to Financial Statements. | | | | | | | | | | | | | | | |
(i) Amount was computed based on average shares outstanding during the period.
(ii) Amount was less than $0.005 per share.
(iii) Does not reflect the effect of sales charges, if applicable.
- 92 -
THE ALGER FUNDS
Financial Highlights for a share outstanding throughout the period
| | | | | | | | | | | | | | | |
| Alger International Growth Fund | | | | | | | | Class C | | | | | | | |
| | Year ended | | Year ended | | Year ended | | Year ended | | Year ended | |
| | 10/31/2017 | | 10/31/2016 | | 10/31/2015 | | 10/31/2014 | | 10/31/2013 | |
| Net asset value, beginning of period | $ | 12.44 | | $ | 13.57 | | $ | 13.36 | | $ | 13.44 | | $ | 11.12 | |
| INCOME FROM INVESTMENT OPERATIONS: | | | | | | | | | | | | | | | |
| Net investment income (loss)(i) | | 0.01 | | | 0.04 | | | (0.08 | ) | | (0.07 | ) | | – | |
| Net realized and unrealized gain (loss) on | | | | | | | | | | | | | | | |
| investments | | 2.66 | | | (0.99 | ) | | 0.36 | | | (0.01 | ) | | 2.33 | |
| Total from investment operations | | 2.67 | | | (0.95 | ) | | 0.28 | | | (0.08 | ) | | 2.33 | |
| Dividends from net investment income | | (0.13 | ) | | (0.18 | ) | | (0.07 | ) | | – | | | (0.01 | ) |
| Net asset value, end of period | $ | 14.98 | | $ | 12.44 | | $ | 13.57 | | $ | 13.36 | | $ | 13.44 | |
| Total return(ii) | | 21.70 | % | | (7.04 | )% | | 1.99 | % | | (0.60 | )% | | 20.94 | % |
| RATIOS/SUPPLEMENTAL DATA: | | | | | | | | | | | | | | | |
| Net assets, end of period (000's omitted) | $ | 12,130 | | $ | 15,190 | | $ | 21,697 | | $ | 20,567 | | $ | 17,786 | |
| Ratio of gross expenses to average net assets | | 2.13 | % | | 2.14 | % | | 2.09 | % | | 2.08 | % | | 2.15 | % |
| Ratio of net expenses to average net assets | | 2.13 | % | | 2.14 | % | | 2.09 | % | | 2.08 | % | | 2.15 | % |
| Ratio of net investment income (loss) to average | | | | | | | | | | | | | | | |
| net assets | | 0.06 | % | | 0.29 | % | | (0.60 | )% | | (0.49 | )% | | 0.03 | % |
| Portfolio turnover rate | | 148.35 | % | | 134.84 | % | | 114.81 | % | | 97.50 | % | | 217.57 | % |
| See Notes to Financial Statements. | | | | | | | | | | | | | | | |
(i) Amount was computed based on average shares outstanding during the period.
(ii) Does not reflect the effect of sales charges, if applicable.
- 93 -
THE ALGER FUNDS
Financial Highlights for a share outstanding throughout the period
| | | | | | | | | | | | | | | |
| Alger International Growth Fund | | | | | | | | Class I | | | | | | From 5/31/2013 | |
| | | | | | | | | | | | | | (commencement | |
| | Year ended | | | Year ended | | | Year ended | | | Year ended | | | of operationa) to | |
| | 10/31/2017 | | 10/31/2016 | | 10/31/2015 | | 10/31/2014 | | | 10/31/2013 (i) | |
| Net asset value, beginning of period | $ | 14.55 | | $ | 15.55 | | $ | 15.27 | | $ | 15.29 | | $ | 13.94 | |
| INCOME FROM INVESTMENT OPERATIONS: | | | | | | | | | | | | | | | |
| Net investment income(ii) | | 0.17 | | | 0.21 | | | 0.05 | | | 0.12 | | | 0.03 | |
| Net realized and unrealized gain (loss) on | | | | | | | | | | | | | | | |
| investments | | 3.09 | | | (1.16 | ) | | 0.41 | | | (0.07 | ) | | 1.32 | |
| Total from investment operations | | 3.26 | | | (0.95 | ) | | 0.46 | | | 0.05 | | | 1.35 | |
| Dividends from net investment income | | (0.27 | ) | | (0.05 | ) | | (0.18 | ) | | (0.07 | ) | | – | |
| Net asset value, end of period | $ | 17.54 | | $ | 14.55 | | $ | 15.55 | | $ | 15.27 | | $ | 15.29 | |
| Total return(iii) | | 22.84 | % | | (6.12 | )% | | 3.04 | % | | 0.31 | % | | 9.68 | % |
| RATIOS/SUPPLEMENTAL DATA: | | | | | | | | | | | | | | | |
| Net assets, end of period (000's omitted) | $ | 1,742 | | $ | 14,202 | | $ | 14,435 | | $ | 3,722 | | $ | 157 | |
| Ratio of gross expenses to average net assets | | 1.48 | % | | 1.33 | % | | 1.30 | % | | 1.27 | % | | 15.73 | % |
| Ratio of expense reimbursements to average | | | | | | | | | | | | | | | |
| net assets | | (0.33 | )% | | (0.18 | )% | | (0.15 | )% | | (0.12 | )% | | (14.58 | )% |
| Ratio of net expenses to average net assets | | 1.15 | % | | 1.15 | % | | 1.15 | % | | 1.15 | % | | 1.15 | % |
| Ratio of net investment income (loss) to average | | | | | | | | | | | | | | | |
| net assets | | 1.14 | % | | 1.43 | % | | 0.34 | % | | 0.76 | % | | 0.44 | % |
| Portfolio turnover rate | | 148.35 | % | | 134.84 | % | | 114.81 | % | | 97.50 | % | | 217.57 | % |
| See Notes to Financial Statements. | | | | | | | | | | | | | | | |
(i) Ratios have been annualized; total return has not been annualized; portfolio turnover is for the twelve months then ended.
(ii) Amount was computed based on average shares outstanding during the period.
(iii) Does not reflect the effect of sales charges, if applicable.
- 94 -
THE ALGER FUNDS
Financial Highlights for a share outstanding throughout the period
| | | | | | | | | | | | | | | |
| Alger International Growth Fund | | | | | | | | Class Z | | | | | | | |
| | Year ended | | Year ended | | Year ended | | Year ended | | Year ended | |
| | 10/31/2017 | | 10/31/2016 | | 10/31/2015 | | 10/31/2014 | | 10/31/2013 | |
| Net asset value, beginning of period | $ | 14.74 | | $ | 15.73 | | $ | 15.44 | | $ | 15.35 | | $ | 12.66 | |
| INCOME FROM INVESTMENT OPERATIONS: | | | | | | | | | | | | | | | |
| Net investment income(i) | | 0.20 | | | 0.23 | | | 0.12 | | | 0.13 | | | 0.33 | |
| Net realized and unrealized gain (loss) on | | | | | | | | | | | | | | | |
| investments | | 3.14 | | | (1.15 | ) | | 0.39 | | | (0.04 | ) | | 2.50 | |
| Total from investment operations | | 3.34 | | | (0.92 | ) | | 0.51 | | | 0.09 | | | 2.83 | |
| Dividends from net investment income | | (0.31 | ) | | (0.07 | ) | | (0.22 | ) | | – | | | (0.14 | ) |
| Net asset value, end of period | $ | 17.77 | | $ | 14.74 | | $ | 15.73 | | $ | 15.44 | | $ | 15.35 | |
| Total return(ii) | | 23.16 | % | | (5.88 | )% | | 3.27 | % | | 0.59 | % | | 22.56 | % |
| RATIOS/SUPPLEMENTAL DATA: | | | | | | | | | | | | | | | |
| Net assets, end of period (000's omitted) | $ | 21,317 | | $ | 18,477 | | $ | 19,326 | | $ | 8,573 | | $ | 2,277 | |
| Ratio of gross expenses to average net assets | | 1.03 | % | | 1.04 | % | | 1.03 | % | | 1.04 | % | | 1.12 | % |
| Ratio of expense reimbursements to average | | | | | | | | | | | | | | | |
| net assets | | (0.14 | )% | | (0.15 | )% | | (0.14 | )% | | (0.15 | )% | | (0.13 | )% |
| Ratio of net expenses to average net assets | | 0.89 | % | | 0.89 | % | | 0.89 | % | | 0.89 | % | | 0.99 | % |
| Ratio of net investment income (loss) to average | | | | | | | | | | | | | | | |
| net assets | | 1.27 | % | | 1.57 | % | | 0.73 | % | | 0.82 | % | | 2.50 | % |
| Portfolio turnover rate | | 148.35 | % | | 134.84 | % | | 114.81 | % | | 97.50 | % | | 217.57 | % |
| See Notes to Financial Statements. | | | | | | | | | | | | | | | |
(i) Amount was computed based on average shares outstanding during the period.
(ii) Does not reflect the effect of sales charges, if applicable.
- 95 -
THE ALGER FUNDS
Financial Highlights for a share outstanding throughout the period
| | | | | | | | | | | | | | | |
| Alger Mid Cap Growth Fund | | | | | | | | Class A | | | | | | | |
| | Year ended | | Year ended | | Year ended | | Year ended | | Year ended | |
| | 10/31/2017 | | 10/31/2016 | | 10/31/2015 | | 10/31/2014 | | 10/31/2013 | |
| Net asset value, beginning of period | $ | 10.20 | | $ | 10.66 | | $ | 10.54 | | $ | 9.38 | | $ | 7.05 | |
| INCOME FROM INVESTMENT OPERATIONS: | | | | | | | | | | | | | | | |
| Net investment loss(i) | | (0.07 | ) | | (0.03 | ) | | (0.07 | ) | | (0.04 | ) | | (0.03 | ) |
| Net realized and unrealized gain (loss) on | | | | | | | | | | | | | | | |
| investments | | 3.34 | | | (0.43 | ) | | 0.19 | | | 1.20 | | | 2.36 | |
| Total from investment operations | | 3.27 | | | (0.46 | ) | | 0.12 | | | 1.16 | | | 2.33 | |
| Net asset value, end of period | $ | 13.47 | | $ | 10.20 | | $ | 10.66 | | $ | 10.54 | | $ | 9.38 | |
| Total return(ii) | | 32.06 | % | | (4.32 | )% | | 1.23 | % | | (12.37 | )% | | 33.05 | % |
| RATIOS/SUPPLEMENTAL DATA: | | | | | | | | | | | | | | | |
| Net assets, end of period (000's omitted) | $ | 136,795 | | $ | 111,423 | | $ | 131,592 | | $ | 142,977 | | $ | 143,231 | |
| Ratio of gross expenses to average net assets | | 1.32 | % | | 1.33 | % | | 1.32 | % | | 1.35 | % | | 1.39 | % |
| Ratio of net expenses to average net assets | | 1.32 | % | | 1.33 | % | | 1.32 | % | | 1.35 | % | | 1.39 | % |
| Ratio of net investment income (loss) to average | | | | | | | | | | | | | | | |
| net assets | | (0.55 | )% | | (0.32 | )% | | (0.67 | )% | | (0.38 | )% | | (0.31 | )% |
| Portfolio turnover rate | | 162.65 | % | | 99.42 | % | | 122.05 | % | | 194.81 | % | | 156.98 | % |
| See Notes to Financial Statements. | | | | | | | | | | | | | | | |
(i) Amount was computed based on average shares outstanding during the period.
(ii) Does not reflect the effect of sales charges, if applicable.
- 96 -
THE ALGER FUNDS
Financial Highlights for a share outstanding throughout the period
| | | | | | | | | | | | | | | |
| Alger Mid Cap Growth Fund | | | | | | | | Class B | | | | | | | |
| | Year ended | | Year ended | | Year ended | | Year ended | | Year ended | |
| | 10/31/2017 | | 10/31/2016 | | 10/31/2015 | | 10/31/2014 | | 10/31/2013 | |
| Net asset value, beginning of period | $ | 8.23 | | $ | 8.67 | | $ | 8.63 | | $ | 7.73 | | $ | 5.86 | |
| INCOME FROM INVESTMENT OPERATIONS: | | | | | | | | | | | | | | | |
| Net investment loss(i) | | (0.12 | ) | | (0.09 | ) | | (0.12 | ) | | (0.09 | ) | | (0.07 | ) |
| Net realized and unrealized gain (loss) on | | | | | | | | | | | | | | | |
| investments | | 2.69 | | | (0.35 | ) | | 0.16 | | | 0.99 | | | 1.94 | |
| Total from investment operations | | 2.57 | | | (0.44 | ) | | 0.04 | | | 0.90 | | | 1.87 | |
| Net asset value, end of period | $ | 10.80 | | $ | 8.23 | | $ | 8.67 | | $ | 8.63 | | $ | 7.73 | |
| Total return(ii) | | 31.23 | % | | (5.07 | )% | | 0.46 | % | | 11.64 | % | | 31.91 | % |
| RATIOS/SUPPLEMENTAL DATA: | | | | | | | | | | | | | | | |
| Net assets, end of period (000's omitted) | $ | 18,375 | | $ | 19,005 | | $ | 26,151 | | $ | 33,377 | | $ | 50,341 | |
| Ratio of gross expenses to average net assets | | 2.05 | % | | 2.05 | % | | 2.02 | % | | 2.04 | % | | 2.10 | % |
| Ratio of net expenses to average net assets | | 2.05 | % | | 2.05 | % | | 2.02 | % | | 2.04 | % | | 2.10 | % |
| Ratio of net investment income (loss) to average | | | | | | | | | | | | | | | |
| net assets | | (1.28 | )% | | (1.05 | )% | | (1.36 | )% | | (1.05 | )% | | (1.02 | )% |
| Portfolio turnover rate | | 162.65 | % | | 99.42 | % | | 122.05 | % | | 194.81 | % | | 156.98 | % |
| See Notes to Financial Statements. | | | | | | | | | | | | | | | |
(i) Amount was computed based on average shares outstanding during the period.
(ii) Does not reflect the effect of sales charges, if applicable.
- 97 -
THE ALGER FUNDS
Financial Highlights for a share outstanding throughout the period
| | | | | | | | | | | | | | | |
| Alger Mid Cap Growth Fund | | | | | | | | Class C | | | | | | | |
| | Year ended | | Year ended | | Year ended | | Year ended | | Year ended | |
| | 10/31/2017 | | 10/31/2016 | | 10/31/2015 | | 10/31/2014 | | 10/31/2013 | |
| Net asset value, beginning of period | $ | 8.15 | | $ | 8.58 | | $ | 8.56 | | $ | 7.68 | | $ | 5.82 | |
| INCOME FROM INVESTMENT OPERATIONS: | | | | | | | | | | | | | | | |
| Net investment loss(i) | | (0.13 | ) | | (0.09 | ) | | (0.13 | ) | | (0.10 | ) | | (0.08 | ) |
| Net realized and unrealized gain (loss) on | | | | | | | | | | | | | | | |
| investments | | 2.65 | | | (0.34 | ) | | 0.15 | | | 0.98 | | | 1.94 | |
| Total from investment operations | | 2.52 | | | (0.43 | ) | | 0.02 | | | 0.88 | | | 1.86 | |
| Net asset value, end of period | $ | 10.67 | | $ | 8.15 | | $ | 8.58 | | $ | 8.56 | | $ | 7.68 | |
| Total return(ii) | | 30.92 | % | | (5.01 | )% | | 0.35 | % | | 11.46 | % | | 31.96 | % |
| RATIOS/SUPPLEMENTAL DATA: | | | | | | | | | | | | | | | |
| Net assets, end of period (000's omitted) | $ | 15,438 | | $ | 18,495 | | $ | 23,628 | | $ | 25,932 | | $ | 26,320 | |
| Ratio of gross expenses to average net assets | | 2.13 | % | | 2.16 | % | | 2.12 | % | | 2.16 | % | | 2.21 | % |
| Ratio of net expenses to average net assets | | 2.13 | % | | 2.16 | % | | 2.12 | % | | 2.16 | % | | 2.21 | % |
| Ratio of net investment income (loss) to average | | | | | | | | | | | | | | | |
| net assets | | (1.35 | )% | | (1.16 | )% | | (1.47 | )% | | (1.19 | )% | | (1.13 | )% |
| Portfolio turnover rate | | 162.65 | % | | 99.42 | % | | 122.05 | % | | 194.81 | % | | 156.98 | % |
| See Notes to Financial Statements. | | | | | | | | | | | | | | | |
(i) Amount was computed based on average shares outstanding during the period.
(ii) Does not reflect the effect of sales charges, if applicable.
- 98 -
THE ALGER FUNDS
Financial Highlights for a share outstanding throughout the period
| Alger Mid Cap Growth Fund | | | | | Class Z | | | | |
| | | | | | | | From 5/28/2015 | |
| | | | | | | | (commencement | |
| | | Year ended | | | | Year ended | | | | | operations) to | | |
| | 10/31/2017 | | 10/31/2016 | | 10/31/2015 (i) | |
| Net asset value, beginning of period | $ | 10.24 | | $ | 10.67 | | $ | 11.70 | |
| INCOME FROM INVESTMENT OPERATIONS: | | | | | | | | | |
| Net investment income (loss)(ii) | | (0.04 | ) | | 0.04 | | | (0.02 | ) |
| Net realized and unrealized gain (loss) on | | | | | | | | | |
| investments | | 3.36 | | | (0.47 | ) | | (1.01 | ) |
| Total from investment operations | | 3.32 | | | (0.43 | ) | | (1.03 | ) |
| Net asset value, end of period | $ | 13.56 | | $ | 10.24 | | $ | 10.67 | |
| Total return(iii) | | 32.52 | % | | (4.03 | )% | | (8.80 | )% |
| RATIOS/SUPPLEMENTAL DATA: | | | | | | | | | |
| Net assets, end of period (000's omitted) | $ | 13,306 | | $ | 7,508 | | $ | 2,413 | |
| Ratio of gross expenses to average net assets | | 1.07 | % | | 1.23 | % | | 1.76 | % |
| Ratio of expense reimbursements to average | | | | | | | | | |
| net assets | | (0.02 | )% | | (0.21 | )% | | (0.77 | )% |
| Ratio of net expenses to average net assets | | 1.05 | % | | 1.02 | % | | 0.99 | % |
| Ratio of net investment income (loss) to average | | | | | | | | | |
| net assets | | (0.29 | )% | | 0.40 | % | | (0.49 | )% |
| Portfolio turnover rate | | 162.65 | % | | 99.42 | % | | 122.05 | % |
| See Notes to Financial Statements. | | | | | | | | | |
(i) Ratios have been annualized; total return has not been annualized; portfolio turnover is for the twelve months then ended.
(ii) Amount was computed based on average shares outstanding during the period.
(iii) Does not reflect the effect of sales charges, if applicable.
- 99 -
THE ALGER FUNDS
Financial Highlights for a share outstanding throughout the period
| | | | | | | | | | | | | | | |
| Alger SMid Cap Focus Fund | | | | | | | | Class A | | | | | | | |
| | Year ended | | Year ended | | Year ended | | Year ended | | Year ended | |
| | 10/31/2017 | | 10/31/2016 | | 10/31/2015 | | 10/31/2014 | | 10/31/2013 | |
| Net asset value, beginning of period | $ | 10.64 | | $ | 16.72 | | $ | 19.32 | | $ | 20.89 | | $ | 16.72 | |
| INCOME FROM INVESTMENT OPERATIONS: | | | | | | | | | | | | | | | |
| Net investment loss(i) | | (0.12 | ) | | (0.08 | ) | | (0.12 | ) | | (0.09 | ) | | (0.03 | ) |
| Net realized and unrealized gain (loss) on | | | | | | | | | | | | | | | |
| investments | | 3.58 | | | (0.04 | ) | | 0.09 | | | 1.53 | | | 4.92 | |
| Total from investment operations | | 3.46 | | | (0.12 | ) | | (0.03 | ) | | 1.44 | | | 4.89 | |
| Distributions from net realized gains | | (1.23 | ) | | (5.96 | ) | | (2.57 | ) | | (3.01 | ) | | (0.72 | ) |
| Net asset value, end of period | $ | 12.87 | | $ | 10.64 | | $ | 16.72 | | $ | 19.32 | | $ | 20.89 | |
| Total return(ii) | | 35.64 | % | | (0.92 | )% | | (0.31 | )% | | 7.68 | % | | 30.39 | % |
| RATIOS/SUPPLEMENTAL DATA: | | | | | | | | | | | | | | | |
| Net assets, end of period (000's omitted) | $ | 84,644 | | $ | 82,618 | | $ | 159,061 | | $ | 241,510 | | $ | 294,846 | |
| Ratio of gross expenses to average net assets | | 1.35 | % | | 1.35 | % | | 1.30 | % | | 1.27 | % | | 1.29 | % |
| Ratio of net expenses to average net assets | | 1.35 | % | | 1.35 | % | | 1.30 | % | | 1.27 | % | | 1.29 | % |
| Ratio of net investment income (loss) to average | | | | | | | | | | | | | | | |
| net assets | | (1.02 | )% | | (0.69 | )% | | (0.65 | )% | | (0.45 | )% | | (0.19 | )% |
| Portfolio turnover rate | | 157.39 | % | | 164.36 | % | | 110.40 | % | | 91.59 | % | | 95.67 | % |
| See Notes to Financial Statements. | | | | | | | | | | | | | | | |
(i) Amount was computed based on average shares outstanding during the period.
(ii) Does not reflect the effect of sales charges, if applicable.
- 100 -
THE ALGER FUNDS
Financial Highlights for a share outstanding throughout the period
| | | | | | | | | | | | | | | |
| Alger SMid Cap Focus Fund | | | | | | | | Class C | | | | | | | |
| | Year ended | | Year ended | | Year ended | | Year ended | | Year ended | |
| | 10/31/2017 | | 10/31/2016 | | 10/31/2015 | | 10/31/2014 | | 10/31/2013 | |
| Net asset value, beginning of period | $ | 8.32 | | $ | 14.45 | | $ | 17.16 | | $ | 19.00 | | $ | 15.39 | |
| INCOME FROM INVESTMENT OPERATIONS: | | | | | | | | | | | | | | | |
| Net investment loss(i) | | (0.15 | ) | | (0.13 | ) | | (0.22 | ) | | (0.21 | ) | | (0.16 | ) |
| Net realized and unrealized gain (loss) on | | | | | | | | | | | | | | | |
| investments | | 2.71 | | | (0.04 | ) | | 0.08 | | | 1.38 | | | 4.49 | |
| Total from investment operations | | 2.56 | | | (0.17 | ) | | (0.14 | ) | | 1.17 | | | 4.33 | |
| Distributions from net realized gains | | (1.23 | ) | | (5.96 | ) | | (2.57 | ) | | (3.01 | ) | | (0.72 | ) |
| Net asset value, end of period | $ | 9.65 | | $ | 8.32 | | $ | 14.45 | | $ | 17.16 | | $ | 19.00 | |
| Total return(ii) | | 34.64 | % | | (1.72 | )% | | (1.09 | )% | | 6.92 | % | | 29.34 | % |
| RATIOS/SUPPLEMENTAL DATA: | | | | | | | | | | | | | | | |
| Net assets, end of period (000's omitted) | $ | 31,651 | | $ | 32,183 | | $ | 54,768 | | $ | 63,572 | | $ | 68,161 | |
| Ratio of gross expenses to average net assets | | 2.12 | % | | 2.15 | % | | 2.07 | % | | 2.03 | % | | 2.06 | % |
| Ratio of net expenses to average net assets | | 2.12 | % | | 2.15 | % | | 2.07 | % | | 2.03 | % | | 2.06 | % |
| Ratio of net investment income (loss) to average | | | | | | | | | | | | | | | |
| net assets | | (1.79 | )% | | (1.49 | )% | | (1.43 | )% | | (1.21 | )% | | (0.96 | )% |
| Portfolio turnover rate | | 157.39 | % | | 164.36 | % | | 110.40 | % | | 91.59 | % | | 95.67 | % |
| See Notes to Financial Statements. | | | | | | | | | | | | | | | |
(i) Amount was computed based on average shares outstanding during the period.
(ii) Does not reflect the effect of sales charges, if applicable.
- 101 -
THE ALGER FUNDS
Financial Highlights for a share outstanding throughout the period
| | | | | | | | | | | | | | | |
| Alger SMid Cap Focus Fund | | | | | | | | Class I | | | | | | | |
| | Year ended | | Year ended | | Year ended | | Year ended | | Year ended | |
| | 10/31/2017 | | 10/31/2016 | | 10/31/2015 | | 10/31/2014 | | 10/31/2013 | |
| Net asset value, beginning of period | $ | 10.84 | | $ | 16.91 | | $ | 19.54 | | $ | 21.09 | | $ | 16.88 | |
| INCOME FROM INVESTMENT OPERATIONS: | | | | | | | | | | | | | | | |
| Net investment loss(i) | | (0.11 | ) | | (0.07 | ) | | (0.11 | ) | | (0.09 | ) | | (0.04 | ) |
| Net realized and unrealized gain (loss) on | | | | | | | | | | | | | | | |
| investments | | 3.64 | | | (0.04 | ) | | 0.05 | | | 1.55 | | | 4.97 | |
| Total from investment operations | | 3.53 | | | (0.11 | ) | | (0.06 | ) | | 1.46 | | | 4.93 | |
| Distributions from net realized gains | | (1.23 | ) | | (5.96 | ) | | (2.57 | ) | | (3.01 | ) | | (0.72 | ) |
| Net asset value, end of period | $ | 13.14 | | $ | 10.84 | | $ | 16.91 | | $ | 19.54 | | $ | 21.09 | |
| Total return(ii) | | 35.63 | % | | (0.79 | )% | | (0.48 | )% | | 7.70 | % | | 30.34 | % |
| RATIOS/SUPPLEMENTAL DATA: | | | | | | | | | | | | | | | |
| Net assets, end of period (000's omitted) | $ | 23,374 | | $ | 32,606 | | $ | 70,677 | | $ | 699,237 | | $ | 692,445 | |
| Ratio of gross expenses to average net assets | | 1.35 | % | | 1.25 | % | | 1.31 | % | | 1.27 | % | | 1.31 | % |
| Ratio of net expenses to average net assets | | 1.35 | % | | 1.25 | % | | 1.31 | % | | 1.27 | % | | 1.31 | % |
| Ratio of net investment income (loss) to average | | | | | | | | | | | | | | | |
| net assets | | (0.99 | )% | | (0.58 | )% | | (0.62 | )% | | (0.45 | )% | | (0.22 | )% |
| Portfolio turnover rate | | 157.39 | % | | 164.36 | % | | 110.40 | % | | 91.59 | % | | 95.67 | % |
| See Notes to Financial Statements. | | | | | | | | | | | | | | | |
(i) Amount was computed based on average shares outstanding during the period.
(ii) Does not reflect the effect of sales charges, if applicable.
- 102 -
THE ALGER FUNDS
Financial Highlights for a share outstanding throughout the period
| | | |
| Alger SMid Cap Focus Fund | | Class Y | |
| | From 8/31/2017 | |
| | (commencement | |
| | of operations) to | |
| | 10/31/2017 | (i) |
| Net asset value, beginning of period | $ | 12.27 | |
| INCOME FROM INVESTMENT OPERATIONS: | | | |
| Net investment loss(ii) | | (0.02 | ) |
| Net realized and unrealized gain on investments | 0.89 | |
| Total from investment operations | | 0.87 | |
| Net asset value, end of period | $ | 13.14 | |
| Total return(iii) | | 7.09 | % |
| RATIOS/SUPPLEMENTAL DATA: | | | |
| Net assets, end of period (000's omitted) | $ | 107 | |
| Ratio of gross expenses to average net assets | | 9.54 | % |
| Ratio of expense reimbursements to average | | | |
| net assets | | (8.67 | )% |
| Ratio of net expenses to average net assets | | 0.87 | % |
| Ratio of net investment income (loss) to average | | | |
| net assets | | (0.78 | )% |
| Portfolio turnover rate | | 157.39 | % |
| See Notes to Financial Statements. | | | |
(i) Ratios have been annualized; total return has not been annualized; portfolio turnover is for the twelve months then ended.
(ii) Amount was computed based on average shares outstanding during the period.
(iii) Does not reflect the effect of sales charges, if applicable.
- 103 -
THE ALGER FUNDS
Financial Highlights for a share outstanding throughout the period
| | | | | | | | | | | | | | | |
| Alger SMid Cap Focus Fund | | | | | | | | Class Z | | | | | | | |
| | Year ended | | Year ended | | Year ended | | Year ended | | Year ended | |
| | 10/31/2017 | | 10/31/2016 | | 10/31/2015 | | 10/31/2014 | | 10/31/2013 | |
| Net asset value, beginning of period | $ | 11.04 | | $ | 17.08 | | $ | 19.63 | | $ | 21.11 | | $ | 16.84 | |
| INCOME FROM INVESTMENT OPERATIONS: | | | | | | | | | | | | | | | |
| Net investment income (loss)(i) | | (0.09 | ) | | (0.05 | ) | | (0.06 | ) | | (0.02 | ) | | 0.02 | |
| Net realized and unrealized gain (loss) on | | | | | | | | | | | | | | | |
| investments | | 3.74 | | | (0.03 | ) | | 0.08 | | | 1.55 | | | 4.97 | |
| Total from investment operations | | 3.65 | | | (0.08 | ) | | 0.02 | | | 1.53 | | | 4.99 | |
| Distributions from net realized gains | | (1.23 | ) | | (5.96 | ) | | (2.57 | ) | | (3.01 | ) | | (0.72 | ) |
| Net asset value, end of period | $ | 13.46 | | $ | 11.04 | | $ | 17.08 | | $ | 19.63 | | $ | 21.11 | |
| Total return(ii) | | 36.11 | % | | (0.57 | )% | | (0.02 | )% | | 8.07 | % | | 30.78 | % |
| RATIOS/SUPPLEMENTAL DATA: | | | | | | | | | | | | | | | |
| Net assets, end of period (000's omitted) | $ | 52,736 | | $ | 29,565 | | $ | 134,051 | | $ | 52,091 | | $ | 67,852 | |
| Ratio of gross expenses to average net assets | | 1.06 | % | | 1.01 | % | | 0.99 | % | | 0.95 | % | | 0.96 | % |
| Ratio of net expenses to average net assets | | 1.06 | % | | 1.01 | % | | 0.99 | % | | 0.95 | % | | 0.96 | % |
| Ratio of net investment income (loss) to average | | | | | | | | | | | | | | | |
| net assets | | (0.77 | )% | | (0.40 | )% | | (0.33 | )% | | (0.13 | )% | | 0.13 | % |
| Portfolio turnover rate | | 157.39 | % | | 164.36 | % | | 110.40 | % | | 91.59 | % | | 95.67 | % |
| See Notes to Financial Statements. | | | | | | | | | | | | | | | |
(i) Amount was computed based on average shares outstanding during the period.
(ii) Does not reflect the effect of sales charges, if applicable.
- 104 -
THE ALGER FUNDS
Financial Highlights for a share outstanding throughout the period
| | | | | | | | | | | | | | | |
| Alger Small Cap Growth Fund | | | | | | | | Class A | | | | | | | |
| | Year ended | | Year ended | | Year ended | | Year ended | | Year ended | |
| | 10/31/2017 | | 10/31/2016 | | 10/31/2015 | | 10/31/2014 | | 10/31/2013 | |
| Net asset value, beginning of period | $ | 6.15 | | $ | 8.00 | | $ | 8.96 | | $ | 9.97 | | $ | 7.79 | |
| INCOME FROM INVESTMENT OPERATIONS: | | | | | | | | | | | | | | | |
| Net investment loss(i) | | (0.06 | ) | | (0.05 | ) | | (0.08 | ) | | (0.07 | ) | | (0.04 | ) |
| Net realized and unrealized gain (loss) on | | | | | | | | | | | | | | | |
| investments | | 2.31 | | | (0.21 | ) | | 0.11 | | | 0.19 | | | 2.53 | |
| Total from investment operations | | 2.25 | | | (0.26 | ) | | 0.03 | | | 0.12 | | | 2.49 | |
| Distributions from net realized gains | | – | | | (1.59 | ) | | (0.99 | ) | | (1.13 | ) | | (0.31 | ) |
| Net asset value, end of period | $ | 8.40 | | $ | 6.15 | | $ | 8.00 | | $ | 8.96 | | $ | 9.97 | |
| Total return(ii) | | 36.59 | % | | (3.92 | )% | | 0.16 | % | | 1.30 | % | | 33.15 | % |
| RATIOS/SUPPLEMENTAL DATA: | | | | | | | | | | | | | | | |
| Net assets, end of period (000's omitted) | $ | 102,318 | | $ | 85,556 | | $ | 115,594 | | $ | 139,497 | | $ | 175,214 | |
| Ratio of gross expenses to average net assets | | 1.38 | % | | 1.38 | % | | 1.35 | % | | 1.35 | % | | 1.38 | % |
| Ratio of expense reimbursements to average | | | | | | | | | | | | | | | |
| net assets | | – | | | – | | | – | | | – | | | (0.02 | )% |
| Ratio of net expenses to average net assets | | 1.38 | % | | 1.38 | % | | 1.35 | % | | 1.35 | % | | 1.36 | % |
| Ratio of net investment income (loss) to average | | | | | | | | | | | | | | | |
| net assets | | (0.88 | )% | | (0.79 | )% | | (0.92 | )% | | (0.81 | )% | | (0.49 | )% |
| Portfolio turnover rate | | 30.32 | % | | 55.25 | % | | 131.72 | % | | 88.98 | % | | 93.97 | % |
| See Notes to Financial Statements. | | | | | | | | | | | | | | | |
(i) Amount was computed based on average shares outstanding during the period.
(ii) Does not reflect the effect of sales charges, if applicable.
- 105 -
THE ALGER FUNDS
Financial Highlights for a share outstanding throughout the period
| | | | | | | | | | | | | | | |
| Alger Small Cap Growth Fund | | | | | | | | Class B | | | | | | | |
| | Year ended | | Year ended | | Year ended | | Year ended | | Year ended | |
| | 10/31/2017 | | 10/31/2016 | | 10/31/2015 | | 10/31/2014 | | 10/31/2013 | |
| Net asset value, beginning of period | $ | 4.73 | | $ | 6.57 | | $ | 7.59 | | $ | 8.67 | | $ | 6.86 | |
| INCOME FROM INVESTMENT OPERATIONS: | | | | | | | | | | | | | | | |
| Net investment loss(i) | | (0.09 | ) | | (0.08 | ) | | (0.12 | ) | | (0.12 | ) | | (0.09 | ) |
| Net realized and unrealized gain (loss) on | | | | | | | | | | | | | | | |
| investments | | 1.78 | | | (0.17 | ) | | 0.09 | | | 0.17 | | | 2.21 | |
| Total from investment operations | | 1.69 | | | (0.25 | ) | | (0.03 | ) | | 0.05 | | | 2.12 | |
| Distributions from net realized gains | | – | | | (1.59 | ) | | (0.99 | ) | | (1.13 | ) | | (0.31 | ) |
| Net asset value, end of period | $ | 6.42 | | $ | 4.73 | | $ | 6.57 | | $ | 7.59 | | $ | 8.67 | |
| Total return(ii) | | 35.73 | % | | (4.80 | )% | | (0.55 | )% | | 0.61 | % | | 32.21 | % |
| RATIOS/SUPPLEMENTAL DATA: | | | | | | | | | | | | | | | |
| Net assets, end of period (000's omitted) | $ | 5,397 | | $ | 4,998 | | $ | 6,564 | | $ | 8,874 | | $ | 13,626 | |
| Ratio of gross expenses to average net assets | | 2.19 | % | | 2.18 | % | | 2.16 | % | | 2.11 | % | | 2.13 | % |
| Ratio of expense reimbursements to average | | | | | | | | | | | | | | | |
| net assets | | – | | | – | | | – | | | – | | | (0.02 | )% |
| Ratio of net expenses to average net assets | | 2.19 | % | | 2.18 | % | | 2.16 | % | | 2.11 | % | | 2.11 | % |
| Ratio of net investment income (loss) to average | | | | | | | | | | | | | | | |
| net assets | | (1.68 | )% | | (1.59 | )% | | (1.73 | )% | | (1.56 | )% | | (1.24 | )% |
| Portfolio turnover rate | | 30.32 | % | | 55.25 | % | | 131.72 | % | | 88.98 | % | | 93.97 | % |
| See Notes to Financial Statements. | | | | | | | | | | | | | | | |
(i) Amount was computed based on average shares outstanding during the period.
(ii) Does not reflect the effect of sales charges, if applicable.
- 106 -
THE ALGER FUNDS
Financial Highlights for a share outstanding throughout the period
| | | | | | | | | | | | | | | |
| Alger Small Cap Growth Fund | | | | | | | | Class C | | | | | | | |
| | Year ended | | Year ended | | Year ended | | Year ended | | Year ended | |
| | 10/31/2017 | | 10/31/2016 | | 10/31/2015 | | 10/31/2014 | | 10/31/2013 | |
| Net asset value, beginning of period | $ | 4.59 | | $ | 6.42 | | $ | 7.44 | | $ | 8.52 | | $ | 6.76 | |
| INCOME FROM INVESTMENT OPERATIONS: | | | | | | | | | | | | | | | |
| Net investment loss(i) | | (0.09 | ) | | (0.08 | ) | | (0.12 | ) | | (0.12 | ) | | (0.10 | ) |
| Net realized and unrealized gain (loss) on | | | | | | | | | | | | | | | |
| investments | | 1.72 | | | (0.16 | ) | | 0.09 | | | 0.17 | | | 2.17 | |
| Total from investment operations | | 1.63 | | | (0.24 | ) | | (0.03 | ) | | 0.05 | | | 2.07 | |
| Distributions from net realized gains | | – | | | (1.59 | ) | | (0.99 | ) | | (1.13 | ) | | (0.31 | ) |
| Net asset value, end of period | $ | 6.22 | | $ | 4.59 | | $ | 6.42 | | $ | 7.44 | | $ | 8.52 | |
| Total return(ii) | | 35.51 | % | | (4.79 | )% | | (0.70 | )% | | 0.61 | % | | 31.94 | % |
| RATIOS/SUPPLEMENTAL DATA: | | | | | | | | | | | | | | | |
| Net assets, end of period (000's omitted) | $ | 8,007 | | $ | 8,708 | | $ | 13,724 | | $ | 16,119 | | $ | 19,461 | |
| Ratio of gross expenses to average net assets | | 2.17 | % | | 2.22 | % | | 2.16 | % | | 2.15 | % | | 2.18 | % |
| Ratio of expense reimbursements to average | | | | | | | | | | | | | | | |
| net assets | | – | | | – | | | – | | | – | | | (0.02 | )% |
| Ratio of net expenses to average net assets | | 2.17 | % | | 2.22 | % | | 2.16 | % | | 2.15 | % | | 2.16 | % |
| Ratio of net investment income (loss) to average | | | | | | | | | | | | | | | |
| net assets | | (1.64 | )% | | (1.64 | )% | | (1.73 | )% | | (1.61 | )% | | (1.31 | )% |
| Portfolio turnover rate | | 30.32 | % | | 55.25 | % | | 131.72 | % | | 88.98 | % | | 93.97 | % |
| See Notes to Financial Statements. | | | | | | | | | | | | | | | |
(i) Amount was computed based on average shares outstanding during the period.
(ii) Does not reflect the effect of sales charges, if applicable.
- 107 -
THE ALGER FUNDS
Financial Highlights for a share outstanding throughout the period
| | | | | | | | | | | | | | | |
| Alger Small Cap Growth Fund | | | | | | | | Class Z | | | | | | | |
| | Year ended | | Year ended | | Year ended | | Year ended | | Year ended | |
| | 10/31/2017 | | 10/31/2016 | | 10/31/2015 | | 10/31/2014 | | 10/31/2013 | |
| Net asset value, beginning of period | $ | 6.27 | | $ | 8.10 | | $ | 9.04 | | $ | 10.01 | | $ | 7.79 | |
| INCOME FROM INVESTMENT OPERATIONS: | | | | | | | | | | | | | | | |
| Net investment loss(i) | | (0.04 | ) | | (0.03 | ) | | (0.05 | ) | | (0.04 | ) | | (0.02 | ) |
| Net realized and unrealized gain (loss) on | | | | | | | | | | | | | | | |
| investments | | 2.37 | | | (0.21 | ) | | 0.10 | | | 0.20 | | | 2.55 | |
| Total from investment operations | | 2.33 | | | (0.24 | ) | | 0.05 | | | 0.16 | | | 2.53 | |
| Distributions from net realized gains | | – | | | (1.59 | ) | | (0.99 | ) | | (1.13 | ) | | (0.31 | ) |
| Net asset value, end of period | $ | 8.60 | | $ | 6.27 | | $ | 8.10 | | $ | 9.04 | | $ | 10.01 | |
| Total return(ii) | | 37.16 | % | | (3.55 | )% | | 0.52 | % | | 1.73 | % | | 33.67 | % |
| RATIOS/SUPPLEMENTAL DATA: | | | | | | | | | | | | | | | |
| Net assets, end of period (000's omitted) | $ | 26,953 | | $ | 21,357 | | $ | 22,002 | | $ | 64,684 | | $ | 79,723 | |
| Ratio of gross expenses to average net assets | | 1.08 | % | | 1.06 | % | | 1.04 | % | | 1.03 | % | | 1.05 | % |
| Ratio of expense reimbursements to average | | | | | | | | | | | | | | | |
| net assets | | (0.09 | )% | | (0.07 | )% | | (0.05 | )% | | (0.04 | )% | | (0.06 | )% |
| Ratio of net expenses to average net assets | | 0.99 | % | | 0.99 | % | | 0.99 | % | | 0.99 | % | | 0.99 | % |
| Ratio of net investment income (loss) to average | | | | | | | | | | | | | | | |
| net assets | | (0.50 | )% | | (0.41 | )% | | (0.55 | )% | | (0.45 | )% | | (0.18 | )% |
| Portfolio turnover rate | | 30.32 | % | | 55.25 | % | | 131.72 | % | | 88.98 | % | | 93.97 | % |
| See Notes to Financial Statements. | | | | | | | | | | | | | | | |
(i) Amount was computed based on average shares outstanding during the period.
(ii) Does not reflect the effect of sales charges, if applicable.
- 108 -
THE ALGER FUNDS
Financial Highlights for a share outstanding throughout the period
| | | | | | | | | | | | | | | |
| Alger Small Cap Focus Fund | | | | | | | | Class A | | | | | | | |
| | Year ended | | Year ended | | Year ended | | Year ended | | Year ended | |
| | 10/31/2017 | | 10/31/2016 | | 10/31/2015 | | 10/31/2014 | | 10/31/2013 | |
| Net asset value, beginning of period | $ | 11.16 | | $ | 10.95 | | $ | 11.52 | | $ | 12.98 | | $ | 10.88 | |
| INCOME FROM INVESTMENT OPERATIONS: | | | | | | | | | | | | | | | |
| Net investment loss(i) | | (0.11 | ) | | (0.09 | ) | | (0.14 | ) | | (0.11 | ) | | (0.08 | ) |
| Net realized and unrealized gain on investments | 3.86 | | | 0.30 | | | 0.55 | | | 0.60 | | | 3.55 | |
| Total from investment operations | | 3.75 | | | 0.21 | | | 0.41 | | | 0.49 | | | 3.47 | |
| Distributions from net realized gains | | – | | | – | | | (0.98 | ) | | (1.95 | ) | | (1.37 | ) |
| Net asset value, end of period | $ | 14.91 | | $ | 11.16 | | $ | 10.95 | | $ | 11.52 | | $ | 12.98 | |
| Total return(ii) | | 33.60 | % | | 1.92 | % | | 3.78 | % | | 4.23 | % | | 36.03 | % |
| RATIOS/SUPPLEMENTAL DATA: | | | | | | | | | | | | | | | |
| Net assets, end of period (000's omitted) | $ | 77,791 | | $ | 23,653 | | $ | 14,480 | | $ | 7,241 | | $ | 7,563 | |
| Ratio of gross expenses to average net assets | | 1.22 | % | | 1.36 | % | | 1.82 | % | | 2.22 | % | | 2.45 | % |
| Ratio of expense reimbursements to average | | | | | | | | | | | | | | | |
| net assets | | (0.02 | )% | | (0.11 | )% | | (0.22 | )% | | (0.62 | )% | | (0.85 | )% |
| Ratio of net expenses to average net assets | | 1.20 | % | | 1.25 | % | | 1.60 | % | | 1.60 | % | | 1.60 | % |
| Ratio of net investment income (loss) to average | | | | | | | | | | | | | | | |
| net assets | | (0.86 | )% | | (0.84 | )% | | (1.24 | )% | | (0.95 | )% | | (0.69 | )% |
| Portfolio turnover rate | | 44.56 | % | | 75.50 | % | | 162.44 | % | | 91.91 | % | | 92.82 | % |
| See Notes to Financial Statements. | | | | | | | | | | | | | | | |
(i) Amount was computed based on average shares outstanding during the period.
(ii) Does not reflect the effect of sales charges, if applicable.
- 109 -
THE ALGER FUNDS
Financial Highlights for a share outstanding throughout the period
| | | | | | | | | | | | | | | |
| Alger Small Cap Focus Fund | | | | | | | | Class C | | | | | | | |
| | Year ended | | Year ended | | Year ended | | Year ended | | Year ended | |
| | 10/31/2017 | | 10/31/2016 | | 10/31/2015 | | 10/31/2014 | | 10/31/2013 | |
| Net asset value, beginning of period | $ | 10.25 | | $ | 10.12 | | $ | 10.79 | | $ | 12.34 | | $ | 10.48 | |
| INCOME FROM INVESTMENT OPERATIONS: | | | | | | | | | | | | | | | |
| Net investment loss(i) | | (0.20 | ) | | (0.15 | ) | | (0.20 | ) | | (0.17 | ) | | (0.15 | ) |
| Net realized and unrealized gain on investments | 3.53 | | | 0.28 | | | 0.51 | | | 0.57 | | | 3.38 | |
| Total from investment operations | | 3.33 | | | 0.13 | | | 0.31 | | | 0.40 | | | 3.23 | |
| Distributions from net realized gains | | – | | | – | | | (0.98 | ) | | (1.95 | ) | | (1.37 | ) |
| Net asset value, end of period | $ | 13.58 | | $ | 10.25 | | $ | 10.12 | | $ | 10.79 | | $ | 12.34 | |
| Total return(ii) | | 32.49 | % | | 1.28 | % | | 3.06 | % | | 3.65 | % | | 35.00 | % |
| RATIOS/SUPPLEMENTAL DATA: | | | | | | | | | | | | | | | |
| Net assets, end of period (000's omitted) | $ | 48,345 | | $ | 15,928 | | $ | 8,020 | | $ | 2,612 | | $ | 2,636 | |
| Ratio of gross expenses to average net assets | | 1.97 | % | | 2.12 | % | | 2.53 | % | | 2.99 | % | | 3.23 | % |
| Ratio of expense reimbursements to average | | | | | | | | | | | | | | | |
| net assets | | (0.02 | )% | | (0.13 | )% | | (0.28 | )% | | (0.74 | )% | | (0.98 | )% |
| Ratio of net expenses to average net assets | | 1.95 | % | | 1.99 | % | | 2.25 | % | | 2.25 | % | | 2.25 | % |
| Ratio of net investment income (loss) to average | | | | | | | | | | | | | | | |
| net assets | | (1.61 | )% | | (1.57 | )% | | (1.91 | )% | | (1.60 | )% | | (1.34 | )% |
| Portfolio turnover rate | | 44.56 | % | | 75.50 | % | | 162.44 | % | | 91.91 | % | | 92.82 | % |
| See Notes to Financial Statements. | | | | | | | | | | | | | | | |
(i) Amount was computed based on average shares outstanding during the period.
(ii) Does not reflect the effect of sales charges, if applicable.
- 110 -
THE ALGER FUNDS
Financial Highlights for a share outstanding throughout the period
| | | | | | | | | | | | | | | |
| Alger Small Cap Focus Fund | | | | | | | | Class I | | | | | | | |
| | Year ended | | Year ended | | Year ended | | Year ended | | Year ended | |
| | 10/31/2017 | | 10/31/2016 | | 10/31/2015 | | 10/31/2014 | | 10/31/2013 | |
| Net asset value, beginning of period | $ | 11.44 | | $ | 11.22 | | $ | 11.75 | | $ | 13.17 | | $ | 11.00 | |
| INCOME FROM INVESTMENT OPERATIONS: | | | | | | | | | | | | | | | |
| Net investment loss(i) | | (0.11 | ) | | (0.09 | ) | | (0.12 | ) | | (0.08 | ) | | (0.05 | ) |
| Net realized and unrealized gain on investments | 3.95 | | | 0.31 | | | 0.57 | | | 0.61 | | | 3.59 | |
| Total from investment operations | | 3.84 | | | 0.22 | | | 0.45 | | | 0.53 | | | 3.54 | |
| Distributions from net realized gains | | – | | | – | | | (0.98 | ) | | (1.95 | ) | | (1.37 | ) |
| Net asset value, end of period | $ | 15.28 | | $ | 11.44 | | $ | 11.22 | | $ | 11.75 | | $ | 13.17 | |
| Total return(ii) | | 33.57 | % | | 1.96 | % | | 4.07 | % | | 4.50 | % | | 36.31 | % |
| RATIOS/SUPPLEMENTAL DATA: | | | | | | | | | | | | | | | |
| Net assets, end of period (000's omitted) | $ | 109,146 | | $ | 75,648 | | $ | 40,924 | | $ | 2,359 | | $ | 2,034 | |
| Ratio of gross expenses to average net assets | | 1.21 | % | | 1.32 | % | | 1.56 | % | | 2.19 | % | | 2.43 | % |
| Ratio of expense reimbursements to average | | | | | | | | | | | | | | | |
| net assets | | (0.01 | )% | | (0.09 | )% | | (0.21 | )% | | (0.84 | )% | | (1.08 | )% |
| Ratio of net expenses to average net assets | | 1.20 | % | | 1.23 | % | | 1.35 | % | | 1.35 | % | | 1.35 | % |
| Ratio of net investment income (loss) to average | | | | | | | | | | | | | | | |
| net assets | | (0.80 | )% | | (0.81 | )% | | (1.07 | )% | | (0.70 | )% | | (0.46 | )% |
| Portfolio turnover rate | | 44.56 | % | | 75.50 | % | | 162.44 | % | | 91.91 | % | | 92.82 | % |
| See Notes to Financial Statements. | | | | | | | | | | | | | | | |
(i) Amount was computed based on average shares outstanding during the period.
(ii) Does not reflect the effect of sales charges, if applicable.
- 111 -
THE ALGER FUNDS
Financial Highlights for a share outstanding throughout the period
| | | |
| Alger Small Cap Focus Fund | | Class Y | |
| | From 3/1/2017 | |
| | (commencement | |
| | of operations) to | |
| | 10/31/2017 | (i) |
| Net asset value, beginning of period | $ | 12.93 | |
| INCOME FROM INVESTMENT OPERATIONS: | | | |
| Net investment loss(ii) | | (0.08 | ) |
| Net realized and unrealized gain on investments | 2.59 | |
| Total from investment operations | | 2.51 | |
| Net asset value, end of period | $ | 15.44 | |
| Total return(iii) | | 19.41 | % |
| RATIOS/SUPPLEMENTAL DATA: | | | |
| Net assets, end of period (000's omitted) | $ | 3,279 | |
| Ratio of gross expenses to average net assets | | 1.51 | % |
| Ratio of expense reimbursements to average | | | |
| net assets | | (0.61 | )% |
| Ratio of net expenses to average net assets | | 0.90 | % |
| Ratio of net investment income (loss) to average | | | |
| net assets | | (0.83 | )% |
| Portfolio turnover rate | | 44.56 | % |
| See Notes to Financial Statements. | | | |
(i) Ratios have been annualized; total return has not been annualized; portfolio turnover is for the twelve months then ended.
(ii) Amount was computed based on average shares outstanding during the period.
(iii) Does not reflect the effect of sales charges, if applicable.
- 112 -
THE ALGER FUNDS
Financial Highlights for a share outstanding throughout the period
| | | | | | | | | | | | | | | |
| Alger Small Cap Focus Fund | | | | | | | | Class Z | | | | | | | |
| | Year ended | | Year ended | | Year ended | | Year ended | | Year ended | |
| | 10/31/2017 | | 10/31/2016 | | 10/31/2015 | | 10/31/2014 | | 10/31/2013 | |
| Net asset value, beginning of period | $ | 11.53 | | $ | 11.28 | | $ | 11.77 | | $ | 13.16 | | $ | 10.97 | |
| INCOME FROM INVESTMENT OPERATIONS: | | | | | | | | | | | | | | | |
| Net investment loss(i) | | (0.08 | ) | | (0.07 | ) | | (0.08 | ) | | (0.05 | ) | | (0.02 | ) |
| Net realized and unrealized gain on investments | 3.99 | | | 0.32 | | | 0.57 | | | 0.61 | | | 3.58 | |
| Total from investment operations | | 3.91 | | | 0.25 | | | 0.49 | | | 0.56 | | | 3.56 | |
| Distributions from net realized gains | | – | | | – | | | (0.98 | ) | | (1.95 | ) | | (1.37 | ) |
| Net asset value, end of period | $ | 15.44 | | $ | 11.53 | | $ | 11.28 | | $ | 11.77 | | $ | 13.16 | |
| Total return(ii) | | 33.91 | % | | 2.22 | % | | 4.43 | % | | 4.78 | % | | 36.61 | % |
| RATIOS/SUPPLEMENTAL DATA: | | | | | | | | | | | | | | | |
| Net assets, end of period (000's omitted) | $ | 350,097 | | $ | 68,253 | | $ | 17,109 | | $ | 3,368 | | $ | 3,202 | |
| Ratio of gross expenses to average net assets | | 0.90 | % | | 1.01 | % | | 1.56 | % | | 2.11 | % | | 2.38 | % |
| Ratio of expense reimbursements to average | | | | | | | | | | | | | | | |
| net assets | | – | | | – | | | (0.55 | )% | | (1.01 | )% | | (1.28 | )% |
| Ratio of net expenses to average net assets | | 0.90 | % | | 1.01 | % | | 1.01 | % | | 1.10 | % | | 1.10 | % |
| Ratio of net investment income (loss) to average | | | | | | | | | | | | | | | |
| net assets | | (0.58 | )% | | (0.58 | )% | | (0.68 | )% | | (0.45 | )% | | (0.20 | )% |
| Portfolio turnover rate | | 44.56 | % | | 75.50 | % | | 162.44 | % | | 91.91 | % | | 92.82 | % |
| See Notes to Financial Statements. | | | | | | | | | | | | | | | |
(i) Amount was computed based on average shares outstanding during the period.
(ii) Does not reflect the effect of sales charges, if applicable.
- 113 -
THE ALGER FUNDS
Financial Highlights for a share outstanding throughout the period
| | | | | | | | | | | | | | | |
| Alger Health Sciences Fund | | | | | | | | Class A | | | | | | | |
| | Year ended | | Year ended | | Year ended | | Year ended | | Year ended | |
| | 10/31/2017 | | 10/31/2016 | | 10/31/2015 | | 10/31/2014 | | 10/31/2013 | |
| Net asset value, beginning of period | $ | 16.01 | | $ | 21.94 | | $ | 26.96 | | $ | 25.35 | | $ | 21.75 | |
| INCOME FROM INVESTMENT OPERATIONS: | | | | | | | | | | | | | | | |
| Net investment loss(i) | | (0.19 | ) | | (0.15 | ) | | (0.25 | ) | | (0.14 | ) | | (0.05 | ) |
| Net realized and unrealized gain (loss) on | | | | | | | | | | | | | | | |
| investments | | 9.34 | | | (2.39 | ) | | 0.82 | | | 5.89 | | | 6.11 | |
| Total from investment operations | | 9.15 | | | (2.54 | ) | | 0.57 | | | 5.75 | | | 6.06 | |
| Dividends from net investment income | | – | | | – | | | (0.16 | ) | | – | | | (0.01 | ) |
| Distributions from net realized gains | | – | | | (3.39 | ) | | (5.43 | ) | | (4.14 | ) | | (2.45 | ) |
| Net asset value, end of period | $ | 25.16 | | $ | 16.01 | | $ | 21.94 | | $ | 26.96 | | $ | 25.35 | |
| Total return(ii) | | 57.15 | % | | (14.06 | )% | | 1.72 | % | | 26.29 | % | | 30.81 | % |
| RATIOS/SUPPLEMENTAL DATA: | | | | | | | | | | | | | | | |
| Net assets, end of period (000's omitted) | $ | 95,913 | | $ | 68,686 | | $ | 122,814 | | $ | 139,306 | | $ | 129,870 | |
| Ratio of gross expenses to average net assets | | 1.38 | % | | 1.41 | % | | 1.31 | % | | 1.31 | % | | 1.35 | % |
| Ratio of net expenses to average net assets | | 1.38 | % | | 1.41 | % | | 1.31 | % | | 1.31 | % | | 1.35 | % |
| Ratio of net investment income (loss) to average | | | | | | | | | | | | | | | |
| net assets | | (0.86 | )% | | (0.87 | )% | | (1.05 | )% | | (0.59 | )% | | (0.21 | )% |
| Portfolio turnover rate | | 106.66 | % | | 93.49 | % | | 133.92 | % | | 167.94 | % | | 115.08 | % |
| See Notes to Financial Statements. | | | | | | | | | | | | | | | |
(i) Amount was computed based on average shares outstanding during the period.
(ii) Does not reflect the effect of sales charges, if applicable.
- 114 -
THE ALGER FUNDS
Financial Highlights for a share outstanding throughout the period
| | | | | | | | | | | | | | | |
| Alger Health Sciences Fund | | | | | | | | Class C | | | | | | | |
| | Year ended | | Year ended | | Year ended | | Year ended | | Year ended | |
| | 10/31/2017 | | 10/31/2016 | | 10/31/2015 | | 10/31/2014 | | 10/31/2013 | |
| Net asset value, beginning of period | $ | 12.98 | | $ | 18.53 | | $ | 23.60 | | $ | 22.83 | | $ | 19.95 | |
| INCOME FROM INVESTMENT OPERATIONS: | | | | | | | | | | | | | | | |
| Net investment loss(i) | | (0.28 | ) | | (0.24 | ) | | (0.37 | ) | | (0.29 | ) | | (0.20 | ) |
| Net realized and unrealized gain (loss) on | | | | | | | | | | | | | | | |
| investments | | 7.53 | | | (1.92 | ) | | 0.73 | | | 5.20 | | | 5.53 | |
| Total from investment operations | | 7.25 | | | (2.16 | ) | | 0.36 | | | 4.91 | | | 5.33 | |
| Dividends from net investment income | | – | | | – | | | –(ii) | | | – | | | – | |
| Distributions from net realized gains | | – | | | (3.39 | ) | | (5.43 | ) | | (4.14 | ) | | (2.45 | ) |
| Net asset value, end of period | $ | 20.23 | | $ | 12.98 | | $ | 18.53 | | $ | 23.60 | | $ | 22.83 | |
| Total return(iii) | | 55.86 | % | | (14.70 | )% | | 0.95 | % | | 25.37 | % | | 29.81 | % |
| RATIOS/SUPPLEMENTAL DATA: | | | | | | | | | | | | | | | |
| Net assets, end of period (000's omitted) | $ | 31,148 | | $ | 28,242 | | $ | 53,487 | | $ | 60,628 | | $ | 56,717 | |
| Ratio of gross expenses to average net assets | | 2.15 | % | | 2.18 | % | | 2.08 | % | | 2.06 | % | | 2.10 | % |
| Ratio of net expenses to average net assets | | 2.15 | % | | 2.18 | % | | 2.08 | % | | 2.06 | % | | 2.10 | % |
| Ratio of net investment income (loss) to average | | | | | | | | | | | | | | | |
| net assets | | (1.63 | )% | | (1.65 | )% | | (1.81 | )% | | (1.34 | )% | | (0.98 | )% |
| Portfolio turnover rate | | 106.66 | % | | 93.49 | % | | 133.92 | % | | 167.94 | % | | 115.08 | % |
| See Notes to Financial Statements. | | | | | | | | | | | | | | | |
(i) Amount was computed based on average shares outstanding during the period.
(ii) Amount was less than $0.05 per share.
(iii) Does not reflect the effect of sales charges, if applicable.
- 115 -
THE ALGER FUNDS
Financial Highlights for a share outstanding throughout the period
| Alger Health Sciences Fund | | | | | Class Z | | | | |
| | | | | | | | From 5/28/2015 | |
| | | | | | | | (commencement | |
| | | Year ended | | | | Year ended | | | | | of operations) to | | |
| | 10/31/2017 | | 10/31/2016 | | 10/31/2015 (i) | |
| Net asset value, beginning of period | $ | 15.92 | | $ | 21.76 | | $ | 25.03 | |
| INCOME FROM INVESTMENT OPERATIONS: | | | | | | | | | |
| Net investment loss(ii) | | (0.11 | ) | | (0.08 | ) | | (0.05 | ) |
| Net realized and unrealized gain (loss) on | | | | | | | | | |
| investments | | 9.30 | | | (2.37 | ) | | (3.22 | ) |
| Total from investment operations | | 9.19 | | | (2.45 | ) | | (3.27 | ) |
| Distributions from net realized gains | | – | | | (3.39 | ) | | – | |
| Net asset value, end of period | $ | 25.11 | | $ | 15.92 | | $ | 21.76 | |
| Total return(iii) | | 57.73 | % | | (13.63 | )% | | (13.06 | )% |
| RATIOS/SUPPLEMENTAL DATA: | | | | | | | | | |
| Net assets, end of period (000's omitted) | $ | 25,644 | | $ | 4,980 | | $ | 6,517 | |
| Ratio of gross expenses to average net assets | | 1.12 | % | | 1.16 | % | | 1.36 | % |
| Ratio of expense reimbursements to average | | | | | | | | | |
| net assets | | (0.13 | )% | | (0.17 | )% | | (0.28 | )% |
| Ratio of net expenses to average net assets | | 0.99 | % | | 0.99 | % | | 1.08 | % |
| Ratio of net investment income (loss) to average | | | | | | | | | |
| net assets | | (0.48 | )% | | (0.45 | )% | | (0.47 | )% |
| Portfolio turnover rate | | 106.66 | % | | 93.49 | % | | 133.92 | % |
| See Notes to Financial Statements. | | | | | | | | | |
(i) Ratios have been annualized; total return has not been annualized; portfolio turnover is for the twelve months then ended.
(ii) Amount was computed based on average shares outstanding during the period.
(iii) Does not reflect the effect of sales charges, if applicable.
- 116 -
THE ALGER FUNDS
Financial Highlights for a share outstanding throughout the period
| | | | | | | | | | | | | | | |
| Alger Growth & Income Fund | | | | | | | | Class A | | | | | | | |
| | Year ended | | Year ended | | Year ended | | Year ended | | Year ended | |
| | 10/31/2017 | | 10/31/2016 | | 10/31/2015 | | 10/31/2014 | | 10/31/2013 | |
| Net asset value, beginning of period | $ | 32.66 | | $ | 33.37 | | $ | 33.56 | | $ | 29.63 | | $ | 24.43 | |
| INCOME FROM INVESTMENT OPERATIONS: | | | | | | | | | | | | | | | |
| Net investment income(i) | | 0.56 | | | 0.59 | | | 0.59 | | | 0.63 | | | 0.56 | |
| Net realized and unrealized gain on investments | 6.97 | | | 0.24 | | | 0.81 | | | 3.92 | | | 5.11 | |
| Total from investment operations | | 7.53 | | | 0.83 | | | 1.40 | | | 4.55 | | | 5.67 | |
| Dividends from net investment income | | (0.50 | ) | | (0.50 | ) | | (0.51 | ) | | (0.62 | ) | | (0.47 | ) |
| Distributions from net realized gains | | (0.01 | ) | | (1.04 | ) | | (1.08 | ) | | – | | | – | |
| Net asset value, end of period | $ | 39.68 | | $ | 32.66 | | $ | 33.37 | | $ | 33.56 | | $ | 29.63 | |
| Total return(ii) | | 23.22 | % | | 2.62 | % | | 4.26 | % | | 15.53 | % | | 23.45 | % |
| RATIOS/SUPPLEMENTAL DATA: | | | | | | | | | | | | | | | |
| Net assets, end of period (000's omitted) | $ | 72,427 | | $ | 64,123 | | $ | 70,933 | | $ | 73,674 | | $ | 80,832 | |
| Ratio of gross expenses to average net assets | | 1.19 | % | | 1.14 | % | | 1.15 | % | | 1.18 | % | | 1.19 | % |
| Ratio of net expenses to average net assets | | 1.19 | % | | 1.14 | % | | 1.15 | % | | 1.18 | % | | 1.19 | % |
| Ratio of net investment income (loss) to average | | | | | | | | | | | | | | | |
| net assets | | 1.52 | % | | 1.85 | % | | 1.76 | % | | 2.00 | % | | 2.07 | % |
| Portfolio turnover rate | | 7.78 | % | | 5.36 | % | | 15.83 | % | | 21.20 | % | | 29.27 | % |
| See Notes to Financial Statements. | | | | | | | | | | | | | | | |
(i) Amount was computed based on average shares outstanding during the period.
(ii) Does not reflect the effect of sales charges, if applicable.
- 117 -
THE ALGER FUNDS
Financial Highlights for a share outstanding throughout the period
| | | | | | | | | | | | | | | |
| Alger Growth & Income Fund | | | | | | | | Class C | | | | | | | |
| | Year ended | | Year ended | | Year ended | | Year ended | | Year ended | |
| | 10/31/2017 | | 10/31/2016 | | 10/31/2015 | | 10/31/2014 | | 10/31/2013 | |
| Net asset value, beginning of period | $ | 32.23 | | $ | 32.95 | | $ | 33.18 | | $ | 29.33 | | $ | 24.22 | |
| INCOME FROM INVESTMENT OPERATIONS: | | | | | | | | | | | | | | | |
| Net investment income(i) | | 0.28 | | | 0.35 | | | 0.33 | | | 0.38 | | | 0.34 | |
| Net realized and unrealized gain on investments | 6.88 | | | 0.24 | | | 0.80 | | | 3.89 | | | 5.08 | |
| Total from investment operations | | 7.16 | | | 0.59 | | | 1.13 | | | 4.27 | | | 5.42 | |
| Dividends from net investment income | | (0.24 | ) | | (0.27 | ) | | (0.28 | ) | | (0.42 | ) | | (0.31 | ) |
| Distributions from net realized gains | | (0.01 | ) | | (1.04 | ) | | (1.08 | ) | | – | | | – | |
| Net asset value, end of period | $ | 39.14 | | $ | 32.23 | | $ | 32.95 | | $ | 33.18 | | $ | 29.33 | |
| Total return(ii) | | 22.28 | % | | 1.87 | % | | 3.47 | % | | 14.65 | % | | 22.53 | % |
| RATIOS/SUPPLEMENTAL DATA: | | | | | | | | | | | | | | | |
| Net assets, end of period (000's omitted) | $ | 22,266 | | $ | 20,790 | | $ | 21,156 | | $ | 19,999 | | $ | 17,173 | |
| Ratio of gross expenses to average net assets | | 1.94 | % | | 1.88 | % | | 1.90 | % | | 1.93 | % | | 1.96 | % |
| Ratio of net expenses to average net assets | | 1.94 | % | | 1.88 | % | | 1.90 | % | | 1.93 | % | | 1.96 | % |
| Ratio of net investment income (loss) to average | | | | | | | | | | | | | | | |
| net assets | | 0.76 | % | | 1.09 | % | | 0.99 | % | | 1.22 | % | | 1.27 | % |
| Portfolio turnover rate | | 7.78 | % | | 5.36 | % | | 15.83 | % | | 21.20 | % | | 29.27 | % |
| See Notes to Financial Statements. | | | | | | | | | | | | | | | |
(i) Amount was computed based on average shares outstanding during the period.
(ii) Does not reflect the effect of sales charges, if applicable.
- 118 -
THE ALGER FUNDS
Financial Highlights for a share outstanding throughout the period
| | | | | | | | | | | | | | | |
| Alger Growth & Income Fund | | | | | | | | Class Z | | | | | | | |
| | Year ended | | Year ended | | Year ended | | Year ended | | Year ended | |
| | 10/31/2017 | | 10/31/2016 | | 10/31/2015 | | 10/31/2014 | | 10/31/2013 | |
| Net asset value, beginning of period | $ | 32.69 | | $ | 33.39 | | $ | 33.57 | | $ | 29.64 | | $ | 24.43 | |
| INCOME FROM INVESTMENT OPERATIONS: | | | | | | | | | | | | | | | |
| Net investment income(i) | | 0.65 | | | 0.67 | | | 0.66 | | | 0.63 | | | 0.59 | |
| Net realized and unrealized gain on investments | 6.99 | | | 0.26 | | | 0.82 | | | 4.00 | | | 5.14 | |
| Total from investment operations | | 7.64 | | | 0.93 | | | 1.48 | | | 4.63 | | | 5.73 | |
| Dividends from net investment income | | (0.61 | ) | | (0.59 | ) | | (0.58 | ) | | (0.70 | ) | | (0.52 | ) |
| Distributions from net realized gains | | (0.01 | ) | | (1.04 | ) | | (1.08 | ) | | – | | | – | |
| Net asset value, end of period | $ | 39.71 | | $ | 32.69 | | $ | 33.39 | | $ | 33.57 | | $ | 29.64 | |
| Total return(ii) | | 23.55 | % | | 2.91 | % | | 4.53 | % | | 15.78 | % | | 23.74 | % |
| RATIOS/SUPPLEMENTAL DATA: | | | | | | | | | | | | | | | |
| Net assets, end of period (000's omitted) | $ | 22,487 | | $ | 11,422 | | $ | 8,752 | | $ | 8,441 | | $ | 2,306 | |
| Ratio of gross expenses to average net assets | | 0.90 | % | | 0.87 | % | | 0.91 | % | | 1.05 | % | | 1.36 | % |
| Ratio of expense reimbursements to average | | | | | | | | | | | | | | | |
| net assets | | – | | | – | | | – | | | (0.10 | )% | | (0.41 | )% |
| Ratio of net expenses to average net assets | | 0.90 | % | | 0.87 | % | | 0.91 | % | | 0.95 | % | | 0.95 | % |
| Ratio of net investment income (loss) to average | | | | | | | | | | | | | | | |
| net assets | | 1.75 | % | | 2.09 | % | | 1.99 | % | | 1.98 | % | | 2.18 | % |
| Portfolio turnover rate | | 7.78 | % | | 5.36 | % | | 15.83 | % | | 21.20 | % | | 29.27 | % |
| See Notes to Financial Statements. | | | | | | | | | | | | | | | |
(i) Amount was computed based on average shares outstanding during the period.
(ii) Does not reflect the effect of sales charges, if applicable.
- 119 -
THE ALGER FUNDS
NOTES TO FINANCIAL STATEMENTS
NOTE 1 — General:
The Alger Funds (the “Trust”) is a diversified, open-end registered investment company
organized as a business trust under the laws of the Commonwealth of Massachusetts. The
Trust qualifies as an investment company as defined in Financial Accounting Standards
Board Accounting Standards Codification 946-Financial Services – Investment Companies.
The Trust operates as a series company currently offering an unlimited number of shares
of beneficial interest in eight funds — Alger Capital Appreciation Fund, Alger International
Growth Fund, Alger Mid Cap Growth Fund, Alger SMid Cap Focus Fund (formerly Alger
SMid Cap Growth Fund), Alger Small Cap Growth Fund, Alger Small Cap Focus Fund,
Alger Health Sciences Fund and Alger Growth & Income Fund (collectively, the “Funds”
or individually, each a “Fund”). Alger Capital Appreciation Fund, Alger International
Growth Fund, Alger Mid Cap Growth Fund, Alger SMid Cap Focus Fund, Alger Small
Cap Growth Fund, Alger Small Cap Focus Fund and Alger Health Sciences Fund normally
invest primarily in equity securities and each has an investment objective of long-term
capital appreciation. Alger Growth & Income Fund also normally invests primarily in equity
securities but has an investment objective of both capital appreciation and current income.
Each Fund offers one or more of the following share classes: Class A, B, C, I, Y and Z.
Class A shares are generally subject to an initial sales charge while Class B and C shares are
generally subject to a deferred sales charge. Class B shares will automatically convert to Class
A shares eight years after the end of the calendar month in which the order to purchase
was accepted. The conversion is completed without the imposition of any sales charges or
other fees. Class I, Y and Z shares are sold to institutional investors without an initial or
deferred sales charge. Each class has identical rights to assets and earnings, except that each
share class bears the pro rata allocation of the Fund’s expense other than a class expense
(not including advisory or custodial fees or other expenses related to the management of
the Fund’s assets) to a share class.
Alger Small Cap Focus Fund started offering Class Y shares on February 28, 2017. The
Class B Shares of each of Alger SMid Cap Focus Fund and Alger Health Sciences Fund
were converted into Class A Shares of the relevant Fund on November 29, 2016. Alger
SMid Cap Growth Fund changed its name to Alger SMid Cap Focus Fund effective August
30, 2017. Alger SMid Cap Focus Fund started offering Class Y shares on August 30, 2017.
NOTE 2 — Significant Accounting Policies:
(a) Investment Valuation: The Funds value their financial instruments (including escrow
receivable) at fair value using independent dealers or pricing services under policies approved
by the Trust’s Board of Trustees (“Board”). Investments are valued on each day the New
York Stock Exchange (the “NYSE”) is open, as of the close of the NYSE (normally 4:00
p.m. Eastern Standard Time).
Equity securities, including traded rights, warrants and option contracts for which valuation
information is readily available are valued at the last quoted sales price or official closing
price as reported by an independent pricing service on the primary market or exchange on
which they are traded. In the absence of quoted sales, such securities are valued at the bid
- 120 -
THE ALGER FUNDS
NOTES TO FINANCIAL STATEMENTS (Continued)
price or, in the absence of a recent bid price, the equivalent as obtained from one or more
of the major market makers for the securities to be valued.
Debt securities generally trade in the over-the-counter market. Debt securities with
remaining maturities of more than sixty days at the time of acquisition are valued on
the basis of last available bid prices or current market quotations provided by dealers
or pricing services. In determining the value of a particular investment, pricing services
may use certain information with respect to transactions in such investments, quotations
from dealers, pricing matrixes, market transactions in comparable investments, various
relationships observed in the market between investments and calculated yield measures
based on valuation technology commonly employed in the market for such investments.
Asset-backed and mortgage-backed securities are valued by independent pricing services
using models that consider estimated cash flows of each tranche of the security, establish a
benchmark yield and develop an estimated tranche-specific spread to the benchmark yield
based on the unique attributes of the tranche. Debt securities with a remaining maturity of
sixty days or less are valued at amortized cost which approximates market value.
Securities for which market quotations are not readily available (including escrow receivable)
are valued at fair value, as determined in good faith pursuant to procedures established by
the Board.
Securities in which the Funds invest may be traded in foreign markets that close before the
close of the NYSE. Developments that occur between the close of the foreign markets
and the close of the NYSE may result in adjustments to the closing foreign prices to reflect
what the investment manager, pursuant to policies established by the Board, believes to be
the fair value of these securities as of the close of the NYSE. The Funds may also fair value
securities in other situations, for example, when a particular foreign market is closed but the
Funds are open.
Financial Accounting Standards Board Accounting Standards Codification 820 – Fair Value
Measurements and Disclosures (“ASC 820”) defines fair value as the price that the Funds
would receive upon selling an investment in a timely transaction to an independent buyer
in the principal or most advantageous market of the investment. ASC 820 established a
three-tier hierarchy to maximize the use of observable market data and minimize the use of
unobservable inputs and to establish classification of fair value measurements for disclosure
purposes. Inputs refer broadly to the assumptions that market participants would use in
pricing the asset or liability and may be observable or unobservable. Observable inputs
are based on market data obtained from sources independent of the Funds. Unobservable
inputs are inputs that reflect the Funds’ own assumptions based on the best information
available in the circumstances. The three-tier hierarchy of inputs is summarized in the three
broad Levels listed below.
• Level 1 – quoted prices in active markets for identical investments
• Level 2 – significant other observable inputs (including quoted prices for similar
investments, interest rates, prepayment speeds, credit risk, etc.)
- 121 -
THE ALGER FUNDS
NOTES TO FINANCIAL STATEMENTS (Continued)
• Level 3 – significant unobservable inputs (including the Funds’ own assumptions in
determining the fair value of investments)
The Funds’ valuation techniques are generally consistent with either the market or the
income approach to fair value. The market approach considers prices and other relevant
information generated by market transactions involving identical or comparable assets
to measure fair value. The income approach converts future amounts to a current, or
discounted, single amount. These fair value measurements are determined on the basis
of the value indicated by current market expectations about such future events. Inputs
for Level 1 include exchange-listed prices and broker quotes in an active market. Inputs
for Level 2 include the last trade price in the case of a halted security, an exchange-listed
price which has been adjusted for fair value factors, and prices of closely related securities.
Additional Level 2 inputs include an evaluated price which is based upon a compilation of
observable market information such as spreads for fixed income and preferred securities.
Inputs for Level 3 include revenue multiples, earnings before interest, taxes, depreciation
and amortization (“EBITDA”) multiples, discount rates, time to exit and the probabilities
of success of certain outcomes. Such unobservable market information may be obtained
from a company’s financial statements and from industry studies, market data, and market
indicators such as benchmarks and indexes. Because of the inherent uncertainty and often
limited markets for restricted securities, the values may significantly differ from the values
if there was an active market.
Valuation processes are determined by a Valuation Committee (“Committee”) established
by the Board and comprised of representatives of the Trust’s investment adviser. The
Committee reports its fair valuation determinations to the Board which is responsible for
approving valuation policy and procedures.
While the Committee meets on an as-needed basis, the Committee generally meets
quarterly to review and evaluate the effectiveness of the procedures for making fair value
determinations. The Committee considers, among other things, the results of quarterly back
testing of the fair value model for foreign securities, pricing comparisons between primary
and secondary price sources, the outcome of price challenges put to the Funds’ pricing
vendor, and variances between transactional prices and previous mark-to-markets.
The Funds will record a change to a security’s fair value level if new inputs are available
or it becomes evident that inputs previously considered for leveling have changed or are
no longer relevant. Transfers between Levels 1, 2 and 3 are recognized at the end of the
reporting period.
(b) Cash and Cash Equivalents: Cash and cash equivalents include U.S. dollars, foreign cash
and overnight time deposits.
(c) Securities Transactions and Investment Income: Securities transactions are recorded on a
trade date basis. Realized gains and losses from securities transactions are recorded on the
identified cost basis. Dividend income is recognized on the ex-dividend date and interest
income is recognized on the accrual basis.
- 122 -
THE ALGER FUNDS
NOTES TO FINANCIAL STATEMENTS (Continued)
Premiums and discounts on debt securities purchased are amortized or accreted over the
lives of the respective securities.
(d) Foreign Currency Translations: The books and records of the Funds are maintained in U.S.
dollars. Foreign currencies, investments and other assets and liabilities are translated into
U.S. dollars at the prevailing rates of exchange on the valuation date. Purchases and sales
of investment securities and income and expenses are translated into U.S. dollars at the
prevailing exchange rates on the respective dates of such transactions.
Net realized gains and losses on foreign currency transactions represent net gains and losses
from the disposition of foreign currencies, currency gains and losses realized between the
trade dates and settlement dates of security transactions, and the difference between the
amount of net investment income accrued and the U.S. dollar amount actually received.
The effects of changes in foreign currency exchange rates on investments in securities
are included in realized and unrealized gain or loss on investments in the accompanying
Statements of Operations.
(e) Option Contracts: When a Fund writes an option, an amount equal to the premium received
by the Fund is recorded as a liability and is subsequently adjusted to the current fair value
of the option written. Premiums received from writing options that expire unexercised are
treated by the Fund on the expiration date as realized gains from investments. The difference
between the premium and the amount paid on effecting a closing purchase transaction,
including brokerage commissions, is also treated as a realized gain, or, if the premium is less
than the amount paid for the closing purchase transaction, as a realized loss. If a call option
is exercised, the premium is added to the proceeds from the sale of the underlying security
in determining whether the Fund has realized a gain or loss. If a put option is exercised, the
premium reduces the cost basis of the securities purchased by the Fund. The Fund as writer
of an option bears the market risk of an unfavorable change in the price of the security
underlying the written option.
The Funds may also purchase put and call options. Each Fund pays a premium which is
included in the Fund’s accompanying Statement of Assets and Liabilities as an investment
and subsequently marked to market to reflect the current value of the option. Premiums
paid for purchasing options which expire are treated as realized losses. The risk associated
with purchasing put and call options is limited to the premium paid. Premiums paid for
purchasing options which are exercised or closed are added to the amounts paid or offset
against the proceeds on the underlying security to determine the realized gain or loss.
(f) Lending of Fund Securities: The Funds may lend their securities to financial institutions,
provided that the market value of the securities loaned will not at any time exceed one
third of a Fund’s total assets, as defined in its prospectuses. The Funds earn fees on the
securities loaned, which are included in interest income in the accompanying Statements
of Operations. In order to protect against the risk of failure by the borrower to return the
securities loaned or any delay in the delivery of such securities, the loan is collateralized by
cash or securities that are maintained with the Custodian in an amount equal to at least 102
percent of the current market value of U.S. loaned securities or 105 percent for non-U.S.
loaned securities. The market value of the loaned securities is determined at the close of
- 123 -
THE ALGER FUNDS
NOTES TO FINANCIAL STATEMENTS (Continued)
business of the Funds. Any required additional collateral is delivered to the Custodian and
any excess collateral is returned to the borrower on the next business day. In the event the
borrower fails to return the loaned securities when due, the Funds may take the collateral
to replace the securities. If the value of the collateral is less than the purchase cost of
replacement securities, the Custodian shall be responsible for any shortfall, but only to
the extent that the shortfall is not due to any diminution in collateral value, as defined in
the securities lending agreement. The Funds are required to maintain the collateral in a
segregated account and determine its value each day until the loaned securities are returned.
Cash collateral may be invested as determined by the Funds. Collateral is returned to the
borrower upon settlement of the loan.
(g) Dividends to Shareholders: Dividends and distributions payable to shareholders are recorded
on the ex-dividend date. The Funds declare and pay dividends from net investment income,
if available, annually except that Alger Growth & Income Fund declares and pays such
dividends quarterly. With respect to all Funds, dividends from net realized gains, offset by
any loss carryforward, are declared and paid annually after the end of the fiscal year in which
earned.
Each class is treated separately in determining the amounts of dividends from net investment
income payable to holders of its shares.
The characterization of distributions to shareholders for financial reporting purposes is
determined in accordance with federal income tax rules. Therefore, the source of a Fund’s
distributions may be shown in the accompanying financial statements as either from, or in
excess of, net investment income, net realized gain on investment transactions, or return of
capital, depending on the type of book/tax differences that may exist. Capital accounts within
the financial statements are adjusted for permanent book/tax differences. Reclassifications
result primarily from the differences in tax treatment of net operating losses, foreign
currency transactions and premium/discount of debt securities. The reclassifications are
done annually at fiscal year end and have no impact on the net asset values of the Funds and
are designed to present each Fund’s capital accounts on a tax basis.
(h) Federal Income Taxes: It is each Fund’s policy to comply with the requirements of the
Internal Revenue Code Subchapter M applicable to regulated investment companies and to
distribute all of its taxable income to its shareholders. Provided the Funds maintain such
compliance, no federal income tax provision is required. Each Fund is treated as a separate
entity for the purpose of determining such compliance.
Financial Accounting Standards Board Accounting Standards Codification 740 – Income
Taxes (“ASC 740”) requires the Funds to measure and recognize in their financial statements
the benefit of a tax position taken (or expected to be taken) on an income tax return
if such position will more likely than not be sustained upon examination based on the
technical merits of the position. No tax years are currently under investigation. The Funds
file income tax returns in the U.S., as well as New York State and New York City. The
statute of limitations on the Funds’ tax returns remains open for the tax years 2014-2017.
Management does not believe there are any uncertain tax positions that require recognition
of a tax liability.
- 124 -
THE ALGER FUNDS
NOTES TO FINANCIAL STATEMENTS (Continued)
(i) Allocation Methods: The Trust accounts separately for the assets, liabilities and operations
of each Fund. Expenses directly attributable to each Fund are charged to that Fund’s
operations; expenses which are applicable to all Funds are allocated among them based on
net assets. Income, realized and unrealized gains and losses, and expenses of each Fund
are allocated among the Fund’s classes based on relative net assets, with the exception of
distribution fees, transfer agency fees, and shareholder servicing and related fees.
(j) Estimates: These financial statements have been prepared in accordance with accounting
principles generally accepted in the United States of America, which require using estimates
and assumptions that affect the reported amounts therein. Actual results may differ from
those estimates. All such estimates are of normal recurring nature.
NOTE 3 — Investment Advisory Fees and Other Transactions with Affiliates:
(a) Investment Advisory Fees: Fees incurred by each Fund, pursuant to the provisions of
the Trust’s Investment Advisory Agreement with Fred Alger Management, Inc. (“Alger
Management” or the “Manager”), are payable monthly and computed based on the
following rates. The actual rate paid as a percentage of average daily net assets, for the year
ended October 31, 2017, is set forth below under the heading “Actual Rate.”
| | | | | | | | | | | | | | | | | | | | | |
| | | Tier 1 | | | Tier 2 | | | | Tier 3 | | | | Tier 4 | | | | Tier 5 | | | Actual Rate | |
| Alger Capital | | | | | | | | | | | | | | | | | | | | | |
| Appreciation | | | | | | | | | | | | | | | | | | | | | |
| Fund(a) | | 0.810 | % | | 0.650 | % | | | 0.600 | % | | | 0.550 | % | | | 0.450 | % | | 0.773 | % |
| Alger International | | | | | | | | | | | | | | | | | | | | | |
| Growth Fund(b) | | 0.710 | | | 0.600 | | | | — | | | | — | | | | — | | | 0.710 | |
| Alger Mid Cap | | | | | | | | | | | | | | | | | | | | | |
| Growth Fund(b) | | 0.760 | | | 0.700 | | | | — | | | | — | | | | — | | | 0.760 | |
| Alger SMid Cap | | | | | | | | | | | | | | | | | | | | | |
| Focus Fund(b) | | 0.810 | | | 0.750 | | | | — | | | | — | | | | — | | | 0.810 | |
| Alger Small Cap | | | | | | | | | | | | | | | | | | | | | |
| Growth Fund(b) | | 0.810 | | | 0.750 | | | | — | | | | — | | | | — | | | 0.810 | |
| Alger Small Cap | | | | | | | | | | | | | | | | | | | | | |
| Focus Fund(d) | | 0.750 | | | — | | | | — | | | | — | | | | — | | | 0.750 | |
| Alger Health | | | | | | | | | | | | | | | | | | | | | |
| Sciences Fund(c) | 0.810 | | | 0.650 | | | | — | | | | — | | | | — | | | 0.810 | |
| Alger Growth & | | | | | | | | | | | | | | | | | | | | | |
| Income Fund(b) | | 0.585 | | | 0.550 | | | | — | | | | — | | | | — | | | 0.585 | |
(a) Tier 1 rate is paid on assets up to $2 billion, Tier 2 rate is paid on assets between $2 and
$3 billion, Tier 3 rate is paid on assets between $3 and $4 billion, Tier 4 rate is paid on assets
between $4 and $5 billion, and Tier 5 rate is paid on assets in excess of $5 billion.
(b) Tier 1 rate is paid on assets up to $1 billion and Tier 2 rate is paid on assets in excess of
$1 billion.
(c) Tier 1 rate is paid on assets up to $500 million and Tier 2 rate is paid on assets in excess
of $500 million.
(d) Tier 1 is based on all assets.
- 125 -
THE ALGER FUNDS
NOTES TO FINANCIAL STATEMENTS (Continued)
Alger Management has established expense caps for several share classes, effective through
August 29, 2018, whereby it reimburses the share classes if annualized operating expenses
(excluding interest, taxes, brokerage, dividend expense and extraordinary expenses) exceed
the rates, based on average daily net assets, listed below:
| | | | | | | | | | | | | | |
| | | | | | | | | | | | | FEES WAIVED |
| | | | | | | | | | | | | / REIMBURSED |
| | | | | | | | | | | | | FOR THE YEAR |
| | | | | CLASS | | | | | | | ENDED |
| | | | | | | | | | | | | OCTOBER 31, |
| | A | | B | C | | I | | Y | | Z | | | 2017 |
| Alger International Growth Fund | – | | – | – | | 1.15 | % | – | | 0.89 | % | | $ | 48,600 |
| Alger Mid Cap Growth Fund | – | | – | – | | – | | – | | 1.05 | | | | 2,110 |
| Alger SMid Cap Focus Fund | – | | – | – | | – | | 0.87 | % | – | | | | 1,541 |
| Alger Small Cap Growth Fund | – | | – | – | | – | | – | | 0.99 | | | | 20,399 |
| Alger Small Cap Focus Fund | 1.20 | % | – | 1.95 | % | 1.20 | | 0.90 | | 1.10 | | | | 31,570 |
| Alger Health Sciences Fund | – | | – | – | | – | | – | | 0.99 | | | | 19,844 |
Fred Alger Management Inc. may, during the one-year term of the expense reimbursement
contract, recoup any expenses waived or reimbursed pursuant to the expense reimbursement
contract to the extent that such recoupment would not cause the expense ratio to exceed
the lesser of the stated limitation in effect at the time of (i) the waiver or reimbursement
and (ii) the recoupment. For the year ended October 31, 2017, the recoupments made by
the Funds to the Investment Manager for the Alger International Growth Fund, Alger Mid
Cap Growth Fund, Alger SMid Cap Focus Fund, Alger Small Cap Growth Fund, Alger
Small Cap Focus Fund and Alger Health Sciences Fund were $0, $0, $0, $0, $13,886 and
$0, respectively as of October 31, 2017; the total repayments that may potentially be made
by the Funds to the Investment Manager for the Alger International Growth Fund, Alger
Mid Cap Growth Fund, Alger SMid Cap Focus Fund, Alger Small Cap Growth Fund,
Alger Small Cap Focus Fund and Alger Health Sciences Fund were $25,169, $1,672, $1,541,
$16,553, $31,570 and $15,803, respectively which will expire August 28, 2018.
(b) Administration Fees: Fees incurred by each Fund, pursuant to the provisions of the Trust’s
Administration Agreement with Fred Alger Management, Inc., are payable monthly and
computed based on the average daily net assets of each Fund at the annual rate of 0.0275%.
(c) Distribution Fees:
Class A Shares: The Trust has adopted a Plan of Distribution pursuant to which each Fund
pays Fred Alger & Company, Incorporated, the Fund’s distributor (the “Distributor” or
“Alger Inc.”) and an affiliate of Alger Management, a fee at the annual rate of 0.25% of
the respective average daily net assets of the Class A shares of the designated Fund to
compensate Alger Inc. for its activities and expenses incurred in distributing the Class A
shares and shareholder servicing. Fees paid may be more or less than the expenses incurred
by Alger Inc.
Class B Shares: The Trust has adopted an Amended and Restated Plan of Distribution
pursuant to which Class B shares of each Fund issuing such shares reimburse Alger Inc.
for costs and expenses incurred by Alger Inc. in connection with advertising, marketing and
- 126 -
THE ALGER FUNDS
NOTES TO FINANCIAL STATEMENTS (Continued)
selling the Class B shares, and shareholder servicing, not to exceed an annual rate of 1% of
the respective average daily net assets of the Class B shares of the designated Fund. If in
any month, the costs incurred by Alger Inc. relating to the Class B shares are in excess of
the distribution fees charged to the Class B shares of the Fund, the excess may be carried
forward, with interest, and sought to be reimbursed in future periods. As of October 31, 2017,
such excess carried forward was $22,305,823, $16,561,506, $10,852,760 and $16,892,114
for Class B shares of Alger Capital Appreciation Fund, Alger International Growth Fund,
Alger Mid Cap Growth Fund and Alger Small Cap Growth Fund, respectively. Contingent
deferred sales charges imposed on redemptions of Class B shares will reduce the amount of
distribution expenses for which reimbursement may be sought. See Note 3(d) below.
Class C Shares: The Trust has adopted a Distribution Plan pursuant to which Class C shares
of each Fund pay Alger Inc. a fee at the annual rate of 1% of the respective average daily
net assets of the Class C shares of the designated Fund to compensate Alger Inc. for its
activities and expenses incurred in distributing the Class C shares and shareholder servicing.
The fees paid may be more or less than the expenses incurred by Alger Inc.
Class I Shares: The Trust has adopted a Distribution Plan pursuant to which Class I shares of
Alger International Growth Fund, Alger SMid Cap Focus Fund and Alger Small Cap Focus
Fund each pay Alger Inc. a fee at the annual rate of 0.25% of the average daily net assets of
the Fund’s Class I shares to compensate Alger Inc. for its activities and expenses incurred in
distributing the Class I shares and shareholder servicing. The fees paid may be more or less
than the expenses incurred by Alger Inc.
(d) Sales Charges: Purchases and sales of shares of the Funds may be subject to initial sales
charges or contingent deferred sales charges. The contingent deferred sales charges are
used by Alger Inc. to offset distribution expenses previously incurred. Sales charges do
not represent expenses of the Trust. For the year ended October 31, 2017, the initial sales
charges and contingent deferred sales charges imposed, all of which were retained by Alger
Inc., were as follows:
| | | | | |
| | | | | CONTINGENT |
| | INITIAL SALES | DEFERRED SALES |
| | | CHARGES | | | CHARGES |
| Alger Capital Appreciation Fund | $ | 8,771 | $ | 51,595 |
| Alger International Growth Fund | | 3,842 | | | 7,642 |
| Alger Mid Cap Growth Fund | | 2,080 | | | 38,391 |
| Alger SMid Cap Focus Fund | | 810 | | | 6,045 |
| Alger Small Cap Growth Fund | | 1,841 | | | 10,583 |
| Alger Small Cap Focus Fund | | 19 | | | 12,897 |
| Alger Health Sciences Fund | | 1,421 | | | 9,360 |
| Alger Growth & Income Fund | | 3,114 | | | 718 |
(e) Brokerage Commissions: During the year ended October 31, 2017, Alger Capital
Appreciation Fund, Alger International Growth Fund, Alger Mid Cap Growth Fund, Alger
SMid Cap Focus Fund, Alger Small Cap Growth Fund, Alger Small Cap Focus Fund, Alger
Health Sciences Fund and Alger Growth & Income Fund paid Alger Inc. commissions of
- 127 -
THE ALGER FUNDS
NOTES TO FINANCIAL STATEMENTS (Continued)
$327,823, $5,148, $63,450, $52,035, $7,174, $79,795, $20,576 and $4,573 respectively, in
connection with securities transactions.
(f) Shareholder Administrative Fees: The Trust has entered into a shareholder administrative
services agreement with Alger Management to compensate Alger Management for its
liaison and administrative oversight of Boston Financial Data Services, Inc., the transfer
agent, and other related services. The Funds compensate Alger Management at the annual
rate of 0.0165% of their respective average daily net assets for the Class A, Class B and
Class C shares and 0.01% of their respective average daily net assets of the Class I and Class
Z shares for these services.
Alger Management makes payments to intermediaries that provide sub-accounting
services to omnibus accounts invested in the Funds. A portion of the fees paid by Alger
Management to intermediaries that provide sub-accounting services are charged back to
the appropriate Fund, subject to certain limitations, as approved by the Board. For the year
ended October 31, 2017, Alger Management charged back to Alger Capital Appreciation
Fund, Alger International Growth Fund, Alger Mid Cap Growth Fund, Alger SMid Cap
Focus Fund, Alger Small Cap Growth Fund, Alger Small Cap Focus Fund, Alger Health
Sciences Fund and Alger Growth & Income Fund, $1,195,183, $57,574, $73,865, $105,062,
$40,833, $90,667, $64,434 and $39,729, respectively, for these services, which are included in
transfer agent fees and expenses in the accompanying Statements of Operations.
(g) Trustees’ Fees: Effective March 1, 2016, each Independent Trustee receives a fee of
$27,250 for each board meeting attended, to a maximum of $109,000 per annum, paid pro
rata by each fund in the Alger Fund Complex, plus travel expenses incurred for attending
the meeting. The term “Alger Fund Complex” refers to the Trust, The Alger Institutional
Funds, The Alger Funds II, The Alger Portfolios and Alger Global Growth Fund, each of
which is a registered investment company managed by Fred Alger Management, Inc. The
Independent Trustee appointed as Chairman of the Board of Trustees receives additional
compensation of $26,000 per annum paid pro rata by each fund in the Alger Fund Complex.
Additionally, each member of the Audit Committee receives a fee of $2,500 for each Audit
Committee meeting attended to a maximum of $10,000 per annum, paid pro rata by each
fund in the Alger Fund Complex.
(h) Interfund Trades: The Funds engage in purchase and sale transactions with other funds
advised by Alger Management. For the year ended October 31, 2017, these purchases and
sales were as follows:
| | | | | | |
| | Purchases | | Sales | | Realized loss |
| Alger SMid Cap Focus Fund | $ | – | $ | 13,470,504 | $ | 2,783,090 |
| Alger Small Cap Growth | | | | | | |
| Fund | | 2,687,146 | | – | | – |
| Alger Small Cap Focus Fund | | 1,185,122 | | – | | – |
(i) Interfund Loans: The Funds, along with other funds advised by Alger Management, may
borrow money from and lend money to each other for temporary or emergency purposes
with the exception of the Alger International Growth Fund which can only borrow for
temporary or emergency purposes. To the extent permitted under its investment restrictions,
- 128 -
THE ALGER FUNDS
NOTES TO FINANCIAL STATEMENTS (Continued)
each fund may lend uninvested cash in an amount up to 15% of its net assets to other funds.
If a fund has borrowed from other funds and has aggregate borrowings from all sources
that exceed 10% of the fund’s total assets, such fund will secure all of its loans from other
funds. The interest rate charged on interfund loans is equal to the average of the overnight
time deposit rate and bank loan rate available to the funds. There were no interfund loans
outstanding as of October 31, 2017.
During the year ended October 31, 2017, Alger Capital Appreciation Fund, Alger
International Growth Fund, Alger SMid Cap Focus Fund, Alger Small Cap Growth Fund
and Alger Health Sciences Fund incurred interfund loan interest expense of $8,448, $215,
$2,021, $36 and $1,131, respectively and Alger Capital Appreciation Fund, Alger Mid Cap
Growth Fund, Alger SMid Cap Focus Fund, Alger Small Cap Growth Fund, Alger Small
Cap Focus Fund and Alger Growth & Income Fund earned interfund loan interest income
of $9,826, $2,679, $4,095, $828, $7,454 and $406 respectively.
(j) Other Transactions With Affiliates: Certain officers of the Trust are directors and officers
of Alger Management and the Distributor. At October 31, 2017, Alger Management and its
affiliated entities owned the following shares:
| | | | | | | | | | | |
| | | | | SHARE CLASS | | | | | |
| | | A | | B | C | I | | Y | | | Z |
| Alger Capital Appreciation Fund | | 62,200 | | — | — | — | | — | | | 24,398 |
| Alger International Growth Fund | | — | | — | — | 7,454 | | — | | | 111,246 |
| Alger Mid Cap Growth Fund | | — | | — | — | — | | — | | | 85,681 |
| Alger SMid Cap Focus Fund | | 158,916 | | — | 96,218 | — | | 8,150 | | | 77,335 |
| Alger Small Cap Growth Fund | | 62,507 | | — | — | — | | — | | | 78,354 |
| Alger Small Cap Focus Fund | | — | | — | — | — | | 773 | | 286,570 |
| Alger Health Sciences Fund | | — | | — | — | — | | — | | | 4,712 |
| Alger Growth & Income Fund | | — | | — | — | — | | — | | | 29,285 |
NOTE 4 — Securities Transactions:
The following summarizes the securities transactions by the Trust, other than U.S.
Government securities, short-term securities, purchased options and short sales, for the
year ended October 31, 2017:
| | | | |
| | | PURCHASES | | SALES |
| Alger Capital Appreciation Fund | $ | 1,873,352,470 | $ | 2,095,760,177 |
| Alger International Growth Fund | | 250,198,038 | | 278,721,771 |
| Alger Mid Cap Growth Fund | | 266,712,019 | | 267,992,552 |
| Alger SMid Cap Focus Fund | | 252,374,819 | | 296,785,703 |
| Alger Small Cap Growth Fund | | 39,020,811 | | 53,422,743 |
| Alger Small Cap Focus Fund | | 460,416,695 | | 162,468,041 |
| Alger Health Sciences Fund | | 145,701,878 | | 137,314,477 |
| Alger Growth & Income Fund | | 8,244,870 | | 9,505,797 |
Transactions in foreign securities may involve certain considerations and risks not typically
associated with those of U.S. companies because of, among other factors, the level of
governmental supervision and regulation of foreign security markets, and the possibility of
political or economic instability. Additional risks associated with investing in the emerging
- 129 -
THE ALGER FUNDS
NOTES TO FINANCIAL STATEMENTS (Continued)
markets include increased volatility, limited liquidity, and less stringent regulatory and legal
system.
The following table summarizes the Fund’s securities lending agreements by counterparty
which are subject to rights of offset as of October 31, 2017.
Alger Growth & Income Fund
| | | | | | | |
| | | | | | | Fair Value | |
| | | | | | | on Non- | |
| | | Securities | | Cash | | Cash | |
| | | Loaned at | | Collateral | | Collateral | Net |
| Counterparty | | Value | | Received(a) | | Received | Amount(b) |
| Barclays Capital Inc. | $ | 1,057,600 | $ | 1,057,600 | | — | — |
| BNP Paribas U.S. A. | | 532,633 | | 532,633 | | — | — |
| Deutsche Bank Securities Inc. | | 180,607 | | 180,607 | | — | — |
| Total | $ | 1,770,840 | $ | 1,770,840 | | — | — |
(a) Collateral with a value of $1,808,020 has been received in connection with securities
lending agreements and excess collateral received from the individual counterparty is not
shown for financial reporting purposes.
(b) The Market value of loaned securities is determined as of October 31, 2017. The net
amount would be subject to the borrower default indemnity in the event of default by the
counterparty.
NOTE 5 — Borrowing:
The Funds may borrow from their custodian on an uncommitted basis. Each Fund pays the
custodian a market rate of interest, generally based upon the London Interbank Offered
Rate. The Funds may also borrow from other funds advised by Alger Management, as
discussed in Note 3(i). For the year ended October 31, 2017, the Funds had the following
borrowings:
| | | | |
| | | AVERAGE DAILY | WEIGHTED AVERAGE | |
| | | BORROWING | INTEREST RATE | |
| Alger Capital Appreciation Fund | $ | 458,456 | 1.93 | % |
| Alger International Growth Fund | | 37,198 | 2.49 | |
| Alger Mid Cap Growth Fund | | 2,009 | 2.04 | |
| Alger SMid Cap Focus Fund | | 154,385 | 1.54 | |
| Alger Small Cap Growth Fund | | 3,971 | 1.73 | |
| Alger Small Cap Focus Fund | | 1,773 | 3.28 | |
| Alger Health Sciences Fund | | 85,570 | 1.78 | |
- 130 -
THE ALGER FUNDS
NOTES TO FINANCIAL STATEMENTS (Continued)
The highest amount borrowed during the year ended October 31, 2017, for each Fund was
as follows:
| | |
| | HIGHEST BORROWING |
| Alger Capital Appreciation Fund | $ | 44,611,000 |
| Alger International Growth Fund | | 4,135,740 |
| Alger Mid Cap Growth Fund | | 6,790 |
| Alger SMid Cap Focus Fund | | 6,556,518 |
| Alger Small Cap Growth Fund | | 873,382 |
| Alger Small Cap Focus Fund | | 213,095 |
| Alger Health Sciences Fund | | 4,512,000 |
NOTE 6 — Share Capital:
(a) The Trust has an unlimited number of authorized shares of beneficial interest of $.001
par value which are presently divided into eight series. Each series is divided into separate
classes. The transactions of shares of beneficial interest were as follows:
| | | | | | | | | | | | | | | | |
| | | FOR THE YEAR ENDED | | | FOR THE YEAR ENDED | |
| | | OCTOBER 31, 2017 | | | OCTOBER 31, 2016 | |
| | | SHARES | | | | | AMOUNT | | | SHARES | | | | | AMOUNT | |
| Alger Capital Appreciation Fund | | | | | | | | | | | | | | | | |
| Class A: | | | | | | | | | | | | | | | | |
| Shares sold | | 9,689,310 | | | $ | | 217,629,905 | | | 15,687,296 | | | $ | | 312,919,378 | |
| Shares converted from Class B | | 108,980 | | | | | 2,430,953 | | | 138,345 | | | | | 2,805,840 | |
| Shares converted from Class C | | 1,302 | | | | | 26,374 | | | 1,881 | | | | | 36,969 | |
| Dividends reinvested | | 449,205 | | | | | 9,145,829 | | | 5,111,190 | | | | | 104,063,825 | |
| Shares redeemed | | (19,738,816 | ) | | (440,937,281 | ) | | (26,172,211 | ) | | (521,208,293 | ) |
| Net decrease | | (9,490,019) | | | $ | | (211,704,220) | | | (5,233,499) | | | $ | | | (101,382,281) | |
| Class B: | | | | | | | | | | | | | | | | |
| Shares sold | | 39,692 | | | $ | | 724,548 | | | 71,059 | | | $ | | 1,160,531 | |
| Shares converted to Class A | | (134,879 | ) | | | | (2,430,953 | ) | | (168,903 | ) | | | | (2,805,840 | ) |
| Dividends reinvested | | 9,352 | | | | | 154,115 | | | 114,399 | | | | | 1,904,747 | |
| Shares redeemed | | (224,368 | ) | | | | (4,083,171 | ) | | (336,950 | ) | | | | (5,485,346 | ) |
| Net decrease | | (310,203 | ) | | $ | | (5,635,461 | ) | | (320,395 | ) | | $ | | (5,225,908 | ) |
| Class C: | | | | | | | | | | | | | | | | |
| Shares sold | | 1,425,032 | | | $ | | 25,783,457 | | | 4,518,897 | | | $ | | 73,901,380 | |
| Shares converted to Class A | | (1,601 | ) | | | | (26,374 | ) | | (2,296 | ) | | | | (36,969 | ) |
| Dividends reinvested | | 134,686 | | | | | 2,230,392 | | | 1,219,048 | | | | | 20,382,484 | |
| Shares redeemed | | (6,206,033 | ) | | (112,499,500 | ) | | (4,114,364 | ) | | | | (67,196,998 | ) |
| Net increase (decrease) | | (4,647,916) | | | $ | | | (84,512,025) | | | 1,621,285 | | | $ | | | 27,049,897 | |
| Class Z: | | | | | | | | | | | | | | | | |
| Shares sold | | 13,672,585 | | | $ | | 314,440,638 | | | 12,133,141 | | | $ | | 247,827,394 | |
| Dividends reinvested | | 274,934 | | | | | 5,707,638 | | | 2,060,384 | | | | | 42,629,342 | |
| Shares redeemed | | (12,726,738 | ) | | (302,405,421 | ) | | (6,268,239 | ) | | (126,650,061 | ) |
| Net increase | | 1,220,781 | | | $ | | | 17,742,855 | | | 7,925,286 | | | $ | | | 163,806,675 | |
- 131 -
THE ALGER FUNDS
NOTES TO FINANCIAL STATEMENTS (Continued)
| | | | | | | | | | | | | | | | |
| | | FOR THE YEAR ENDED | | | | FOR THE YEAR ENDED | |
| | | OCTOBER 31, 2017 | | | | OCTOBER 31, 2016 | |
| | | SHARES | | | | AMOUNT | | | | SHARES | | | | AMOUNT | |
| Alger International Growth Fund | | | | | | | | | | | | | | | | |
| Class A: | | | | | | | | | | | | | | | | |
| Shares sold | | 458,493 | | $ | | 7,127,236 | | | | 428,060 | | $ | | 6,288,824 | |
| Shares converted from Class B | | | 56,458 | | | | 870,429 | | | | 57,050 | | | | 839,382 | |
| Shares converted from Class C | | | — | | | | — | | | | 404 | | | | 5,744 | |
| Dividends reinvested | | 109,870 | | | | 1,565,668 | | | | 3,042 | | | | 46,449 | |
| Shares redeemed | | (1,193,619 | ) | | | (18,250,512 | ) | | | (1,938,462 | ) | | | (28,772,583 | ) |
| Net decrease | | (568,798 | ) | $ | | (8,687,179 | ) | | | (1,449,906) | | $ | | (21,592,184) | |
| Class B: | | | | | | | | | | | | | | | | |
| Shares sold | | | 21,725 | | $ | | 293,078 | | | | 27,149 | | $ | | 347,798 | |
| Shares converted to Class A | | (64,471 | ) | | | (870,429 | ) | | | (64,930 | ) | | | (839,382 | ) |
| Dividends reinvested | | | 20,616 | | | | 258,110 | | | | — | | | | — | |
| Shares redeemed | | (324,659 | ) | | | (4,341,975 | ) | | | (287,366 | ) | | | (3,725,605 | ) |
| Net decrease | | (346,789 | ) | $ | | (4,661,216 | ) | | | (325,147 | ) | $ | | (4,217,189 | ) |
| Class C: | | | | | | | | | | | | | | | | |
| Shares sold | | | 46,795 | | $ | | 621,993 | | | | 153,803 | | $ | | 1,968,937 | |
| Shares converted to Class A | | | — | | | | — | | | | (472 | ) | | | (5,744 | ) |
| Dividends reinvested | | | 8,801 | | | | 107,543 | | | | 16,873 | | | | 221,367 | |
| Shares redeemed | | (466,550 | ) | | | (6,156,743 | ) | | | (548,419 | ) | | | (6,850,872 | ) |
| Net decrease | | (410,954 | ) | $ | | (5,427,207 | ) | | | (378,215 | ) | $ | | (4,666,312 | ) |
| Class I: | | | | | | | | | | | | | | | | |
| Shares sold | | 138,234 | | $ | | 2,107,070 | | | | 863,053 | | $ | | 12,503,069 | |
| Dividends reinvested | | | 13,354 | | | | 189,629 | | | | 3,430 | | | | 52,174 | |
| Shares redeemed | | (1,028,135 | ) | | | (15,612,153 | ) | | | (819,147 | ) | | | (11,862,325 | ) |
| Net increase (decrease) | | (13,315,454) | | $ | | (13,315,454) | | | | 47,336 | | $ | | 692,918 | |
| Class Z: | | | | | | | | | | | | | | | | |
| Shares sold | | 571,173 | | $ | | 8,633,441 | | | | 1,891,889 | | $ | | 28,235,200 | |
| Dividends reinvested | | | 17,752 | | | | 254,748 | | | | 5,881 | | | | 90,447 | |
| Shares redeemed | | (642,950 | ) | | | (9,803,774 | ) | | | (1,873,345 | ) | | | (27,171,454 | ) |
| Net increase (decrease) | | (54,025 | ) | $ | | (915,585 | ) | | | 24,425 | | $ | | 1,154,193 | |
- 132 -
THE ALGER FUNDS
NOTES TO FINANCIAL STATEMENTS (Continued)
| | | | | | | | | | | | | | | |
| | | FOR THE YEAR ENDED | | | | FOR THE YEAR ENDED | |
| | | OCTOBER 31, 2017 | | | | OCTOBER 31, 2016 | |
| | | SHARES | | | | AMOUNT | | | | SHARES | | | | AMOUNT | |
| Alger Mid Cap Growth Fund | | | | | | | | | | | | | | | |
| Class A: | | | | | | | | | | | | | | | |
| Shares sold | | 1,046,017 | | $ | | 12,486,864 | | | | 1,084,526 | | $ | | 10,979,693 | |
| Shares converted from Class B | | 141,540 | | | | 1,621,207 | | | | 121,289 | | | | 1,246,159 | |
| Shares redeemed | | (1,956,826 | ) | | | (23,319,453 | ) | | | (2,629,068 | ) | | | (26,789,155 | ) |
| Net decrease | | (769,269 | ) | $ | | (9,211,382 | ) | | | (1,423,253) | | $ | | (14,563,303) | |
| Class B: | | | | | | | | | | | | | | | |
| Shares sold | | 41,627 | | $ | | 387,908 | | | | 46,923 | | $ | | 386,839 | |
| Shares converted to Class A | | (175,722 | ) | | | (1,621,207 | ) | | | (149,628 | ) | | | (1,246,159 | ) |
| Shares redeemed | | (471,763 | ) | | | (4,420,041 | ) | | | (606,867 | ) | | | (4,950,680 | ) |
| Net decrease | | (605,858 | ) | | $ | (5,653,340 | ) | | | (709,572 | ) | | $ | (5,810,000 | ) |
| Class C: | | | | | | | | | | | | | | | |
| Shares sold | | 97,401 | | $ | | 894,977 | | | | 326,217 | | $ | | 2,736,652 | |
| Shares redeemed | | (921,197 | ) | | | (8,748,148 | ) | | | (808,642 | ) | | | (6,618,592 | ) |
| Net decrease | | (823,796 | ) | | $ | (7,853,171 | ) | | | (482,425 | ) | | | (3,881,940 | ) |
| Class Z: | | | | | | | | | | | | | | | |
| Shares sold | | 406,537 | | $ | | 4,945,974 | | | | 574,450 | | $ | | 6,081,886 | |
| Shares redeemed | | (158,616 | ) | | | (1,864,530 | ) | | | (67,553 | ) | | | (687,964 | ) |
| Net increase | | 247,921 | | $ | | 3,081,444 | | | | 506,897 | | $ | | 5,393,922 | |
- 133 -
THE ALGER FUNDS
NOTES TO FINANCIAL STATEMENTS (Continued)
| | | | | | | | | | | | | | | | |
| | | FOR THE YEAR ENDED | | | FOR THE YEAR ENDED | |
| | | OCTOBER 31, 2017 | | | OCTOBER 31, 2016 | |
| | | SHARES | | | | | AMOUNT | | | SHARES | | | | AMOUNT | |
| Alger SMid Cap Focus Fund | | | | | | | | | | | | | | | | |
| Class A: | | | | | | | | | | | | | | | | |
| Shares sold | | 1,946,494 | | | $ | | 22,801,014 | | | 1,457,730 | | $ | | 16,428,330 | |
| Shares converted from Class B | | | 57,142 | | | | | 646,985 | | | 39,432 | | | | 431,408 | |
| Dividends reinvested | | 808,239 | | | | | 8,163,213 | | | 4,172,831 | | | | 44,649,289 | |
| Shares redeemed | | (4,005,168 | ) | | | | (44,216,198 | ) | | (7,414,974 | ) | | | (86,285,320 | ) |
| Net decrease | | (12,604,986) | | | $ | | (12,604,986) | | | (1,744,981) | | $ | | | (24,776,293) | |
| Class B: | | | | | | | | | | | | | | | | |
| Shares sold | | | — | | | $ | | — | | | 15,952 | | $ | | 133,355 | |
| Shares converted to Class A | | (73,902 | ) | | | | (646,985 | ) | | (50,211 | ) | | | (431,408 | ) |
| Dividends reinvested | | | — | | | | | — | | | 165,010 | | | | 1,379,484 | |
| Shares redeemed | | (125,390 | ) | | | | (1,102,917 | ) | | (220,953 | ) | | | (1,948,264 | ) |
| Net decrease | | (199,292 | ) | | | $ | (1,749,902 | ) | | (90,202 | ) | | $ | (866,833 | ) |
| Class C: | | | | | | | | | | | | | | | | |
| Shares sold | | 580,576 | | | $ | | 5,154,524 | | | 642,040 | | $ | | 5,413,882 | |
| Dividends reinvested | | 452,082 | | | | | 3,444,868 | | | 1,957,334 | | | | 16,500,322 | |
| Shares redeemed | | (1,622,577 | ) | | | | (13,643,964 | ) | | (2,519,607 | ) | | | (22,328,867 | ) |
| Net increase (decrease) | | (589,919 | ) | | | $ | (5,044,572 | ) | | 79,767 | | $ | | (414,663 | ) |
| Class I: | | | | | | | | | | | | | | | | |
| Shares sold | | 973,316 | | | $ | | 11,605,106 | | | 392,587 | | $ | | 4,352,261 | |
| Dividends reinvested | | 218,352 | | | | | 2,251,213 | | | 1,747,857 | | | | 19,016,684 | |
| Shares redeemed | | (2,422,205 | ) | | | | (27,617,319 | ) | | (3,310,494 | ) | | | (40,572,658 | ) |
| Net decrease | | | (1,230,537) | | | $ | | | (13,761,000) | | | | | (1,170,050) | | $ | | | | (17,203,713) | |
| Class Y: | | | | | | | | | | | | | | | | |
| Shares sold | | | 8,150 | | | $ | | 100,000 | | | — | | | | — | |
| Dividends reinvested | | | — | | | | | — | | | — | | | | — | |
| Shares redeemed | | | — | | | | | — | | | — | | | | — | |
| Net increase | | | 8,150 | | | $ | | 100,000 | | | — | | $ | | — | |
| Class Z: | | | | | | | | | | | | | | | | |
| Shares sold | | 3,379,068 | | | $ | | 41,006,991 | | | 3,415,585 | | $ | | 45,335,807 | |
| Dividends reinvested | | 263,184 | | | | | 2,771,328 | | | 4,220,629 | | | | 46,722,362 | |
| Shares redeemed | | (2,402,265 | ) | | | | (27,714,709 | ) | | (12,804,443) | | | | | | (142,417,710) | |
| Net increase (decrease) | | 1,239,987 | | | $ | | | 16,063,610 | | | (5,168,229) | | $ | | | | (50,359,541) | |
- 134 -
THE ALGER FUNDS
NOTES TO FINANCIAL STATEMENTS (Continued)
| | | | | | | | | | | | | | | | |
| | | FOR THE YEAR ENDED | | | FOR THE YEAR ENDED | |
| | | OCTOBER 31, 2017 | | | OCTOBER 31, 2016 | |
| | | SHARES | | | | | AMOUNT | | | SHARES | | | | | AMOUNT | |
| Alger Small Cap Growth Fund | | | | | | | | | | | | | | | | |
| Class A: | | | | | | | | | | | | | | | | |
| Shares sold | | 501,894 | | | $ | | 3,668,162 | | | 727,901 | | | $ | | 4,433,041 | |
| Shares converted from Class B | | 73,279 | | | | | 527,790 | | | 89,271 | | | | | 556,042 | |
| Dividends reinvested | | 223 | | | | | 636 | | | 3,299,670 | | | | | 20,986,414 | |
| Shares redeemed | | (2,313,171 | ) | | | | (16,627,075 | ) | | (4,640,378 | ) | | | | (28,936,820 | ) |
| Net decrease | | (1,737,775) | | | $ | | | (12,430,487) | | | (523,536 | ) | | | $ | (2,961,323 | ) |
| Class B: | | | | | | | | | | | | | | | | |
| Shares sold | | 27,255 | | | $ | | 151,035 | | | 25,632 | | | $ | | 122,745 | |
| Shares converted to Class A | | (95,463 | ) | | | | (527,790 | ) | | (114,838 | ) | | | | (556,042 | ) |
| Dividends reinvested | | 168 | | | | | 829 | | | 310,086 | | | | | 1,528,725 | |
| Shares redeemed | | (146,832 | ) | | | | (809,639 | ) | | (163,578 | ) | | | | (801,673 | ) |
| Net increase (decrease) | | (214,872 | | | | $ | (1,185,565 | ) | | 57,302 | | | $ | | 293,755 | |
| Class C: | | | | | | | | | | | | | | | | |
| Shares sold | | 137,045 | | | $ | | 769,467 | | | 220,860 | | | $ | | 1,051,271 | |
| Dividends reinvested | | — | | | | | — | | | 549,988 | | | | | 2,634,442 | |
| Shares redeemed | | (747,174 | ) | | | | (4,028,525 | ) | | (1,010,403 | ) | | | | (4,699,299 | ) |
| Net decrease | | (610,129 | ) | | | $ | (3,259,058 | ) | | (239,555 | ) | | | $ | (1,013,586 | ) |
| Class Z: | | | | | | | | | | | | | | | | |
| Shares sold | | 511,816 | | | $ | | 3,761,847 | | | 983,036 | | | $ | | 6,487,482 | |
| Dividends reinvested | | — | | | | | — | | | 587,321 | | | | | 3,794,092 | |
| Shares redeemed | | (784,477 | ) | | | | (5,538,340 | ) | | (877,811 | ) | | | | (5,216,824 | ) |
| Net increase (decrease) | | (272,661 | ) | | | $ | (1,776,493 | ) | | 692,546 | | | $ | | 5,064,750 | |
| |
| Alger Small Cap Focus Fund | | | | | | | | | | | | | | | | |
| Class A: | | | | | | | | | | | | | | | | |
| Shares sold | | 4,529,977 | | | $ | | 59,601,860 | | | 1,580,972 | | | $ | | 17,237,961 | |
| Shares redeemed | | (1,430,695 | ) | | | | (18,800,579 | ) | | (784,484 | ) | | | | (8,280,213 | ) |
| Net increase | | 3,099,282 | | | $ | | | 40,801,281 | | | 796,488 | | | $ | | 8,957,748 | |
| Class C: | | | | | | | | | | | | | | | | |
| Shares sold | | 2,475,781 | | | $ | | 29,320,652 | | | 1,016,020 | | | $ | | 10,265,323 | |
| Shares redeemed | | (470,854 | ) | | | | (5,702,905 | ) | | (253,728 | ) | | | | (2,496,236 | ) |
| Net increase | | 2,004,927 | | | $ | | | 23,617,747 | | | 762,292 | | | $ | | 7,769,087 | |
| Class I: | | | | | | | | | | | | | | | | |
| Shares sold | | 6,099,183 | | | $ | | 81,251,851 | | | 4,555,749 | | | $ | | 50,270,692 | |
| Shares redeemed | | (5,566,454 | ) | | | | (73,191,377 | ) | | (1,592,057 | ) | | | | (17,504,534 | ) |
| Net increase | | 532,729 | | | $ | | 8,060,474 | | | 2,963,692 | | | $ | | 32,766,158 | |
| Class Y: | | | | | | | | | | | | | | | | |
| Shares sold | | 225,179 | | | $ | | 3,381,828 | | | — | | | $ | | — | |
| Shares redeemed | | (12,869 | ) | | | | (197,771 | ) | | — | | | | | — | |
| Net increase | | 212,310 | | | $ | | 3,184,057 | | | — | | | $ | | — | |
| Class Z: | | | | | | | | | | | | | | | | |
| Shares sold | | 19,563,666 | | | $ | | 265,592,605 | | | 5,872,255 | | | $ | | 65,862,734 | |
| Shares redeemed | | (2,809,086 | ) | | | | (38,723,505 | ) | | (1,467,281 | ) | | | | (14,974,056 | ) |
| Net increase | | 16,754,580 | | | $ | | | 226,869,100 | | | 4,404,974 | | | $ | | 50,888,678 | |
- 135 -
THE ALGER FUNDS
NOTES TO FINANCIAL STATEMENTS (Continued)
| | | | | | | | | | | | | | | | |
| | | FOR THE YEAR ENDED | | | | FOR THE YEAR ENDED | |
| | | OCTOBER 31, 2017 | | | | OCTOBER 31, 2016 | |
| | | SHARES | | | | | AMOUNT | | | | SHARES | | | | AMOUNT | |
| Alger Health Sciences Fund | | | | | | | | | | | | | | | | |
| Class A: | | | | | | | | | | | | | | | | |
| Shares sold | | 1,200,761 | | | $ | | 26,563,354 | | | | 570,670 | | $ | | 9,965,192 | |
| Shares converted from Class B | | 49,479 | | | | | 832,610 | | | | 39,317 | | | | 680,424 | |
| Shares converted from Class C | | — | | | | | — | | | | 6,096 | | | | 113,325 | |
| Dividends reinvested | | — | | | | | — | | | | 812,450 | | | | 15,501,550 | |
| Shares redeemed | | (1,727,402 | ) | | | | (35,397,384 | ) | | | (2,736,188 | ) | | | (48,136,846 | ) |
| Net decrease | | (477,162 | ) | | | $ | (8,001,420 | ) | | | (1,307,655) | | $ | | (21,876,355) | |
| Class B: | | | | | | | | | | | | | | | | |
| Shares sold | | — | | | $ | | — | | | | 11,426 | | $ | | 176,984 | |
| Shares converted to Class A | | (61,433 | ) | | | | (832,610 | ) | | | (48,364 | ) | | | (680,424 | ) |
| Dividends reinvested | | — | | | | | — | | | | 48,679 | | | | 754,035 | |
| Shares redeemed | | (89,753 | ) | | | | (1,217,246 | ) | | | (174,636 | ) | | | (2,547,527 | ) |
| Net decrease | | (151,186 | ) | | | $ | (2,049,856 | ) | | | (162,895 | ) | | $ | (2,296,932 | ) |
| Class C: | | | | | | | | | | | | | | | | |
| Shares sold | | 90,211 | | | $ | | 1,606,440 | | | | 230,392 | | $ | | 3,501,663 | |
| Shares converted to Class A | | — | | | | | — | | | | (7,475 | ) | | | (113,325 | ) |
| Dividends reinvested | | — | | | | | — | | | | 423,918 | | | | 6,600,406 | |
| Shares redeemed | | (726,978 | ) | | | | (12,209,739 | ) | | | (1,356,871 | ) | | | (19,230,755 | ) |
| Net decrease | | (636,767) | | | $ | | (10,603,299) | | | | (710,036 | ) | | $ | (9,242,011 | ) |
| Class Z: | | | | | | | | | | | | | | | | |
| Shares sold | | 1,459,814 | | | $ | | 32,466,332 | | | | 311,511 | | $ | | 6,202,443 | |
| Dividends reinvested | | — | | | | | — | | | | 51,369 | | | | 970,367 | |
| Shares redeemed | | (751,377 | ) | | | | (16,790,910 | ) | | | (349,534 | ) | | | (5,915,064 | ) |
| Net increase | | 708,437 | | | | $ | | 15,675,422 | | | | 13,346 | | $ | | 1,257,746 | |
| |
| Alger Growth & Income Fund | | | | | | | | | | | | | | | | |
| Class A: | | | | | | | | | | | | | | | | |
| Shares sold | | 279,518 | | | $ | | 10,035,074 | | | | 238,516 | | $ | | 7,617,466 | |
| Shares converted from Class C | | 52 | | | | | 1,711 | | | | 98 | | | | 3,268 | |
| Dividends reinvested | | 23,781 | | | | | 868,228 | | | | 84,971 | | | | 2,728,977 | |
| Shares redeemed | | (441,195 | ) | | | | (16,003,204 | ) | | | (486,173 | ) | | | (15,621,571 | ) |
| Net decrease | | (137,844 | ) | | | | $ | (5,098,191 | ) | | | (162,588 | ) | | $ | (5,271,860 | ) |
| Class C: | | | | | | | | | | | | | | | | |
| Shares sold | | 93,748 | | | $ | | 3,327,914 | | | | 153,477 | | $ | | 4,821,344 | |
| Shares converted to Class A | | (53 | ) | | | | (1,711 | ) | | | (99 | ) | | | (3,268 | ) |
| Dividends reinvested | | 3,778 | | | | | 134,841 | | | | 22,681 | | | | 720,305 | |
| Shares redeemed | | (173,595 | ) | | | | (6,338,659 | ) | | | (173,057 | ) | | | (5,502,100 | ) |
| Net increase (decrease) | | (76,122 | ) | | | | $ | (2,877,615 | ) | | | 3,002 | | $ | | 36,281 | |
| Class Z: | | | | | | | | | | | | | | | | |
| Shares sold | | 355,883 | | | $ | | 13,070,499 | | | | 261,707 | | $ | | 8,515,819 | |
| Dividends reinvested | | 5,260 | | | | | 193,579 | | | | 12,088 | | | | 388,529 | |
| Shares redeemed | | (144,335 | ) | | | | (5,248,733 | ) | | | (186,481 | ) | | | (5,947,525 | ) |
| Net increase | | 216,808 | | | $ | | 8,015,345 | | | | 87,314 | | $ | | 2,956,823 | |
- 136 -
THE ALGER FUNDS
NOTES TO FINANCIAL STATEMENTS (Continued)
NOTE 7 — Income Tax Information:
The tax character of distributions paid during the year ended October 31, 2017 and the year
ended October 31, 2016 were as follows:
| | | | |
| | FOR THE YEAR ENDED | FOR THE YEAR ENDED |
| | OCTOBER 31, 2017 | OCTOBER 31, 2016 |
| Alger Capital Appreciation Fund | | | | |
| Distributions paid from: | | | | |
| Ordinary Income | | — | | — |
| Long-term capital gain | $ | 20,512,800 | $ | 202,205,125 |
| Total distributions paid | $ | 20,512,800 | $ 202,205,125 |
| |
| Alger International Growth Fund | | | | |
| Distributions paid from: | | | | |
| Ordinary Income | | 2,795,164 | | 533,272 |
| Long-term capital gain | | — | | — |
| Total distributions paid | $ | 2,795,164 | $ | 533,272 |
| |
| Alger Mid Cap Growth Fund | | | | |
| Distributions paid from: | | | | |
| Ordinary Income | | — | | — |
| Long-term capital gain | | — | | — |
| Total distributions paid | | — | | — |
| |
| Alger SMid Cap Focus Fund | | | | |
| Distributions paid from: | | | | |
| Ordinary Income | | — | | — |
| Long-term capital gain | | 19,415,541 | | 141,555,088 |
| Total distributions paid | $ | 19,415,541 | $ | 141,555,088 |
| |
| Alger Small Cap Growth Fund | | | | |
| Distributions paid from: | | | | |
| Ordinary Income | | — | | — |
| Long-term capital gain | | — | | 31,539,951 |
| Total distributions paid | | — | $ | 31,539,951 |
| |
| Alger Small Cap Focus Fund | | | | |
| Distributions paid from: | | | | |
| Ordinary Income | | — | | — |
| Long-term capital gain | | — | | — |
| Total distributions paid | | — | | — |
- 137 -
THE ALGER FUNDS
NOTES TO FINANCIAL STATEMENTS (Continued)
| | | | | |
| | FOR THE YEAR ENDED | FOR THE YEAR ENDED | |
| | OCTOBER 31, 2017 | OCTOBER 31, 2016 | |
| Alger Health Sciences Fund | | | | | |
| Distributions paid from: | | | | | |
| Ordinary Income | | — | | 6,883,316 | |
| Long-term capital gain | | — | | 22,982,858 | |
| Total distributions paid | | — | $ | 29,866,174 | |
| |
| Alger Growth & Income Fund | | | | | |
| Distributions paid from: | | | | | |
| Ordinary Income | | 1,384,793 | | 1,399,785 | |
| Long-term capital gain | | 31,557 | | 3,151,855 | |
| Total distributions paid | $ | 1,416,350 | $ | 4,551,640 | |
| |
| As of October 31, 2017 the components of accumulated gains (losses) on a tax basis were | |
| as follows: | | | | | |
| |
| Alger Capital Appreciation Fund | | | | | |
| Undistributed ordinary income | | | $ | 8,460,675 | |
| Undistributed long-term gains | | | | 174,549,241 | |
| Net accumulated earnings | | | | 183,009,916 | |
| Capital loss carryforwards | | | | — | |
| Net unrealized appreciation | | | | 750,065,413 | |
| Total accumulated earnings | | | $ | 933,075,329 | |
| |
| Alger International Growth Fund | | | | | |
| Undistributed ordinary income | | | | 8,657,343 | |
| Undistributed long-term gains | | | | — | |
| Net accumulated earnings | | | | 8,657,343 | |
| Capital loss carryforwards | | | | — | |
| Net unrealized appreciation | | | | 12,318,176 | |
| Total accumulated earnings | | | $ | 20,975,519 | |
| |
| Alger Mid Cap Growth Fund | | | | | |
| Undistributed ordinary income | | | | — | |
| Undistributed long-term gains | | | | 1,595,047 | |
| Net accumulated earnings | | | | 1,595,047 | |
| Capital loss carryforwards | | | | — | |
| Late year ordinary income losses | | | | (1,211,433 | ) |
| Net unrealized appreciation | | | | 12,707,365 | |
| Total accumulated earnings | | | $ | 13,090,979 | |
- 138 -
THE ALGER FUNDS
NOTES TO FINANCIAL STATEMENTS (Continued)
| | | |
| Alger SMid Cap Focus Fund | | | |
| Undistributed ordinary income | | 19,700,220 | |
| Undistributed long-term gains | | 4,695,361 | |
| Net accumulated earnings | | 24,395,581 | |
| Capital loss carryforwards | | — | |
| Net unrealized appreciation | | 31,755,988 | |
| Total accumulated earnings | $ | 56,151,569 | |
| |
| Alger Small Cap Growth Fund | | | |
| Undistributed ordinary income | | — | |
| Undistributed long-term gains | | 1,540,306 | |
| Net accumulated earnings | | 1,540,306 | |
| Capital loss carryforwards | | — | |
| Late year ordinary income losses | | (1,505,957 | ) |
| Net unrealized appreciation | | 44,668,590 | |
| Total accumulated earnings | $ | 44,702,939 | |
| |
| Alger Small Cap Focus Fund | | | |
| Undistributed ordinary income | | — | |
| Undistributed long-term gains | | 5,821,724 | |
| Net accumulated earnings | | 5,821,724 | |
| Capital loss carryforwards | | — | |
| Late year ordinary income losses | | (2,281,198 | ) |
| Net unrealized appreciation | | 103,804,629 | |
| Total accumulated earnings | $ | 107,345,155 | |
| |
| Alger Health Sciences Fund | | | |
| Undistributed ordinary income | | — | |
| Undistributed long-term gains | | 4,820,920 | |
| Net accumulated earnings | | 4,820,920 | |
| Capital loss carryforwards | | — | |
| Late year ordinary income losses | | (714,916 | ) |
| Net unrealized appreciation | | 37,640,977 | |
| Total accumulated earnings | $ | 41,746,981 | |
| |
| Alger Growth & Income Fund | | | |
| Undistributed ordinary income | | 86,537 | |
| Undistributed long-term gains | | 1,848,830 | |
| Net accumulated earnings | | 1,935,367 | |
| Capital loss carryforwards | | — | |
| Net unrealized appreciation | | 46,345,336 | |
| Total accumulated earnings | $ | 48,280,703 | |
At October 31, 2017, the Funds, for federal income tax purposes, had no capital loss
carryforwards.
During the year ended October 31, 2017, Alger International Growth Fund and Alger Mid
Cap Growth Fund utilized $1,654,113 and $34,620,840 of its capital loss carryforwards,
respectively.
- 139 -
THE ALGER FUNDS
NOTES TO FINANCIAL STATEMENTS (Continued)
Under the Regulated Investment Company Modernization Act of 2010, capital losses
incurred by the Funds on or after January 1, 2011 (Post Act) will not be subject to expiration.
The difference between book-basis and tax-basis unrealized appreciation (depreciation) is
determined annually and is attributable primarily to the tax deferral of losses on wash sales,
U.S. Internal Revenue Code Section 988 currency transactions, nondeductible expenses
on dividends sold short, the tax treatment of partnerships investments, the realization of
unrealized appreciation of passive foreign investment companies, and return of capital from
real estate investment trust investments.
Permanent differences, primarily from net operating losses and real estate investment trusts
and partnership investments sold by the Fund, resulted in the following reclassifications
among the Fund’s components of net assets at October 31, 2017:
| | | |
| Alger Capital Appreciation Fund | | | |
| Accumulated undistributed net investment income (accumulated loss) | $ | 4,802,204 | |
| Accumulated net realized gain (accumulated realized loss) | $ | (4,802,204 | ) |
| Paid-in Capital | $ | – | |
| |
| Alger International Growth Fund | | | |
| Accumulated undistributed net investment income (accumulated loss) | $ | 6,165,432 | |
| Accumulated net realized gain (accumulated realized loss) | $ | 639,154 | |
| Paid-in Capital | $ | (6,804,586 | ) |
| |
| Alger Mid Cap Growth Fund | | | |
| Accumulated undistributed net investment income (accumulated loss) | $ | 709,812 | |
| Accumulated net realized gain (accumulated realized loss) | $ | 234,703 | |
| Paid-in Capital | $ | (944,515 | ) |
| |
| Alger SMid Cap Focus Fund | | | |
| Accumulated undistributed net investment income (accumulated loss) | $ | 3,255,121 | |
| Accumulated net realized gain (accumulated realized loss) | $ | (3,255,121 | ) |
| Paid-in Capital | $ | – | |
| |
| Alger Small Cap Growth Fund | | | |
| Accumulated undistributed net investment income (accumulated loss) | $ | 832,760 | |
| Accumulated net realized gain (accumulated realized loss) | $ | 109,122 | |
| Paid-in Capital | $ | (941,882 | ) |
| |
| Alger Small Cap Focus Fund | | | |
| Accumulated undistributed net investment income (accumulated loss) | $ | 1,412,337 | |
| Accumulated net realized gain (accumulated realized loss) | $ | (1,412,337 | ) |
| Paid-in Capital | $ | – | |
- 140 -
THE ALGER FUNDS
NOTES TO FINANCIAL STATEMENTS (Continued)
| | | |
| Alger Health Sciences Fund | | | |
| Accumulated undistributed net investment income (accumulated loss) | $ | 1,427,218 | |
| Accumulated net realized gain (accumulated realized loss) | $ | (197,133 | ) |
| Paid-in Capital | $ | (1,230,085 | ) |
| Alger Growth & Income Fund | | | |
| Accumulated undistributed net investment income (accumulated loss) | $ | (68,873 | ) |
| Accumulated net realized gain (accumulated realized loss) | $ | 68,872 | |
| Paid-in Capital | $ | 1 | |
NOTE 8 — Fair Value Measurements:
The following is a summary of the inputs used as of October 31, 2017 in valuing the Funds’
investments carried at fair value on a recurring basis. Based upon the nature, characteristics,
and risks associated with their investments, the Funds have determined that presenting them
by security type and sector is appropriate.
| | | | | | | | | | | |
| Alger Capital Appreciation | | | | | | | | | | | |
| Fund | | TOTAL FUND | | LEVEL 1 | | LEVEL 2 | | LEVEL 3 | |
| COMMON STOCKS | | | | | | | | | | | |
| Consumer Discretionary | $ | 505,533,213 | $ | 497,544,476 | $ | 7,988,737 | | | — | |
| Consumer Staples | | | 53,700,176 | | 53,700,176 | | — | | | — | |
| Energy | | | 34,959,891 | | 34,959,891 | | — | | | — | |
| Financials | | 167,773,210 | | 167,773,210 | | — | | | — | |
| Health Care | | 375,435,729 | | 375,435,729 | | — | | | — | |
| Industrials | | 165,757,799 | | 165,757,799 | | — | | | — | |
| Information Technology | | 1,275,458,643 | | 1,274,577,272 | | — | | $ | 881,371 | * |
| Materials | | 102,338,060 | | 102,338,060 | | — | | | — | |
| Telecommunication Services | | | 10,379,598 | | 10,379,598 | | — | | | — | |
| TOTAL COMMON STOCKS | $ | | 2,691,336,319 | $ | 2,682,466,211 | $ | 7,988,737 | | $ | 881,371 | |
| CORPORATE BONDS | | | | | | | | | | | |
| Information Technology | | | — | | — | | — | | | —* | |
| MASTER LIMITED PARTNERSHIP | | | | | | | | |
| Financials | | | 28,129,717 | | 28,129,717 | | — | | | — | |
| PREFERRED STOCKS | | | | | | | | | | | |
| Health Care | | | 4,403,847 | | — | | — | | $ | 4,403,847 | |
| Information Technology | | | 4,062,807 | | — | | — | | | 4,062,807 | * |
| TOTAL PREFERRED | | | | | | | | | | | |
| STOCKS | $ | 8,466,654 | | — | | — | | $ | 8,466,654 | |
| REAL ESTATE INVESTMENT TRUST | | | | | | | | |
| Real Estate | | | 60,835,255 | | 60,835,255 | | — | | | — | |
| WARRANTS | | | | | | | | | | | |
| Information Technology | | | — | | — | | — | | | —* | |
| TOTAL INVESTMENTS IN | | | | | | | | | | | |
| SECURITIES | $ | 2,788,767,945 | $ | 2,771,431,183 | $ | 7,988,737 | | $ | 9,348,025 | |
- 141 -
THE ALGER FUNDS
NOTES TO FINANCIAL STATEMENTS (Continued)
| | | | | | | | | | | |
| Alger International Growth | | | | | | | | | | | |
| Fund | | TOTAL FUND | | | LEVEL 1 | LEVEL 2 | | LEVEL 3 |
| COMMON STOCKS | | | | | | | | | | | |
| Consumer Discretionary | | $ | 19,492,480 | | $ | 1,182,909 | $ | 18,309,571 | | | — |
| Consumer Staples | | | 11,059,472 | | | 2,932,280 | | 8,127,192 | | | — |
| Energy | | | 9,431,874 | | | 6,389,860 | | 3,042,014 | | | — |
| Financials | | | 45,503,910 | | | 11,843,832 | | 33,660,078 | | | — |
| Health Care | | | 10,323,884 | | | 2,174,470 | | 8,149,414 | | | — |
| Industrials | | | 25,077,586 | | | 2,400,580 | | 22,677,006 | | | — |
| Information Technology | | | 39,492,211 | | | 16,759,517 | | 22,732,694 | | | — |
| Materials | | | 7,689,943 | | | — | | 7,689,943 | | | — |
| Real Estate | | | 5,239,509 | | | 1,194,088 | | 4,045,421 | | | — |
| Telecommunication Services | | | 4,558,021 | | | — | | 4,558,021 | | | — |
| TOTAL COMMON STOCKS | | $ | 177,868,890 | $ | 44,877,536 | $ | 132,991,354 | | | — |
| RIGHTS | | | | | | | | | | | |
| Information Technology | | | 337 | | | 337 | | — | | | — |
| TOTAL INVESTMENTS IN | | | | | | | | | | | |
| SECURITIES | | $ | 177,869,227 | $ | 44,877,873 | $ | 132,991,354 | | | — |
| |
| Alger Mid Cap Growth Fund | | TOTAL FUND | | | LEVEL 1 | LEVEL 2 | | LEVEL 3 |
| COMMON STOCKS | | | | | | | | | | | |
| Consumer Discretionary | | | 26,684,799 | | | 26,684,799 | | — | | | — |
| Consumer Staples | | | 3,455,263 | | | 3,455,263 | | — | | | — |
| Energy | | | 2,085,127 | | | 2,085,127 | | — | | | — |
| Financials | | | 13,174,368 | | | 13,174,368 | | — | | | — |
| Health Care | | | 36,992,059 | | | 36,992,059 | | — | | | — |
| Industrials | | | 25,609,401 | | | 25,609,401 | | — | | | — |
| Information Technology | | | 56,194,533 | | | 56,100,371 | | — | | | 94,162 |
| Materials | | | 9,972,303 | | | 9,972,303 | | — | | | — |
| TOTAL COMMON STOCKS | $ | | 174,167,853 | $ | 174,073,691 | | — | | $ | 94,162 |
| PREFERRED STOCKS | | | | | | | | | | | |
| Health Care | | | 685,183 | | | — | | — | | | 685,183 |
| Information Technology | | | 434,056 | | | — | | — | | | 434,056 |
| TOTAL PREFERRED | | | | | | | | | | | |
| STOCKS | $ | 1,119,239 | | | — | | — | | $ | 1,119,239 |
| RIGHTS | | | | | | | | | | | |
| Health Care | | | 1,685,090 | | | — | | — | | | 1,685,090 |
| REAL ESTATE INVESTMENT TRUST | | | | | | | | |
| Real Estate | | | 4,263,477 | | | 4,263,477 | | — | | | — |
| SPECIAL PURPOSE VEHICLE | | | | | | | | | |
| Financials | | | 380,215 | | | — | | — | | | 380,215 |
| TOTAL INVESTMENTS IN | | | | | | | | | | | |
| SECURITIES | $ | 181,615,874 | $ | 178,337,168 | | — | | $ | 3,278,706 |
| Escrow Receivable | | $ | 678,214 | | $ | — | $ | 678,214 | *** | $ | — |
- 142 -
THE ALGER FUNDS
NOTES TO FINANCIAL STATEMENTS (Continued)
| | | | | | | | | | | |
| Alger SMid Cap Focus Fund | | TOTAL FUND | | | LEVEL 1 | | LEVEL 2 | | LEVEL 3 |
| COMMON STOCKS | | | | | | | | | | | |
| Consumer Discretionary | | | 28,748,417 | | | 28,748,417 | | — | | | — |
| Financials | | | 12,857,637 | | | 12,857,637 | | — | | | — |
| Health Care | | | 31,336,835 | | | 31,336,835 | | — | | | — |
| Industrials | | | 30,966,813 | | | 30,966,813 | | — | | | — |
| Information Technology | | | 66,178,124 | | | 65,710,591 | | — | | | 467,533 |
| Real Estate | | | 9,674,449 | | | 9,674,449 | | — | | | — |
| TOTAL COMMON STOCKS | $ | | 179,762,275 | $ | 179,294,742 | | — | | $ | 467,533 |
| PREFERRED STOCKS | | | | | | | | | | | |
| Health Care | | | 3,554,475 | | | — | | — | | | 3,554,475 |
| Information Technology | | | 2,155,157 | | | — | | — | | | 2,155,157 |
| TOTAL PREFERRED | | | | | | | | | | | |
| STOCKS | $ | 5,709,632 | | | — | | — | | $ | 5,709,632 |
| RIGHTS | | | | | | | | | | | |
| Health Care | | | 106,642 | | | — | | — | | | 106,642 |
| TOTAL INVESTMENTS IN | | | | | | | | | | | |
| SECURITIES | $ | 185,578,549 | $ | 179,294,742 | | — | | $ | 6,283,807 |
| |
| Alger Small Cap Growth | | | | | | | | | | | |
| Fund | | TOTAL FUND | | | LEVEL 1 | | LEVEL 2 | | LEVEL 3 |
| COMMON STOCKS | | | | | | | | | | | |
| Consumer Discretionary | | $ | 7,590,806 | | $ | 7,590,806 | | — | | | — |
| Consumer Staples | | | 1,678,114 | | | 1,678,114 | | — | | | — |
| Energy | | | 1,582,137 | | | 1,582,137 | | — | | | — |
| Financials | | | 6,208,583 | | | 6,208,583 | | — | | | — |
| Health Care | | | 55,188,141 | | | 55,188,141 | | — | | | — |
| Industrials | | | 9,045,471 | | | 9,045,471 | | — | | | — |
| Information Technology | | | 53,233,715 | | | 53,233,715 | | — | | | — |
| Materials | | | 3,011,852 | | | 3,011,852 | | — | | | — |
| TOTAL COMMON STOCKS | $ | | 137,538,819 | $ | 137,538,819 | | — | | | — |
| PREFERRED STOCKS | | | | | | | | | | | |
| Health Care | | | 158,147 | | | — | | — | | | 158,147 |
| REAL ESTATE INVESTMENT TRUST | | | | | | | | |
| Real Estate | | | 1,391,097 | | | 1,391,097 | | — | | | — |
| RIGHTS | | | | | | | | | | | |
| Health Care | | | 526,690 | | | — | | —** | | | 526,690 |
| SPECIAL PURPOSE VEHICLE | | | | | | | | | |
| Financials | | | 350,182 | | | — | | — | | | 350,182 |
| TOTAL INVESTMENTS IN | | | | | | | | | | | |
| SECURITIES | $ | 139,964,935 | $ | 138,929,916 | | — | | $ | 1,035,019 |
| Escrow Receivable | | $ | 200,894 | | $ | — | $ | 200,894 | *** | $ | — |
- 143 -
THE ALGER FUNDS
NOTES TO FINANCIAL STATEMENTS (Continued)
| | | | | | | | | | | | |
| Alger Small Cap Focus Fund | | TOTAL FUND | | | LEVEL 1 | | LEVEL 2 | | | LEVEL 3 |
| COMMON STOCKS | | | | | | | | | | | | |
| Consumer Discretionary | $ | | 5,444,433 | | $ | 5,444,433 | | — | | | | — |
| Consumer Staples | | | 8,006,006 | | | 8,006,006 | | — | | | | — |
| Financials | | | 26,135,854 | | | 26,135,854 | | — | | | | — |
| Health Care | | 236,190,542 | | 236,190,542 | | — | | | | — |
| Industrials | | | 48,123,187 | | | 48,123,187 | | — | | | | — |
| Information Technology | | 246,857,941 | | 246,857,941 | | — | | | | — |
| Materials | | | 11,225,405 | | | 11,225,405 | | — | | | | — |
| TOTAL COMMON STOCKS | $ | | 581,983,368 | $ | 581,983,368 | | — | | | | — |
| RIGHTS | | | | | | | | | | | | |
| Health Care | | | 33,998 | | | — | | — | | | | 33,998 |
| TOTAL INVESTMENTS IN | | | | | | | | | | | | |
| SECURITIES | $ | 582,017,366 | $ | 581,983,368 | | — | | | $ | 33,998 |
| Escrow Receivable | $ | | 13,684 | $ | | — | $ | 13,684 | *** | | $ | — |
| |
| Alger Health Sciences Fund | | TOTAL FUND | | | LEVEL 1 | | LEVEL 2 | | | LEVEL 3 |
| COMMON STOCKS | | | | | | | | | | | | |
| Health Care | | 139,420,176 | | 134,992,968 | | 1,514,505 | | | | 2,912,703 |
| PREFERRED STOCKS | | | | | | | | | | | | |
| Health Care | | | 3,233,148 | | | — | | — | | | | 3,233,148 |
| RIGHTS | | | | | | | | | | | | |
| Health Care | | | 6,601,101 | | | — | | —** | | | | 6,601,101 |
| TOTAL INVESTMENTS IN | | | | | | | | | | | | |
| SECURITIES | $ | 149,254,425 | $ | 134,992,968 | $ | 1,514,505 | | $ | 12,746,952 |
| Escrow Receivable | $ | | 2,249,371 | $ | | — | $ | 2,249,371 | *** | | $ | — |
| Alger Growth & Income Fund | | TOTAL FUND | | | LEVEL 1 | | LEVEL 2 | | | LEVEL 3 |
| COMMON STOCKS | | | | | | | | | | | | |
| Consumer Discretionary | | | 14,697,563 | | | 14,697,563 | | — | | | | — |
| Consumer Staples | | | 10,682,906 | | | 10,682,906 | | — | | | | — |
| Energy | | | 5,403,890 | | | 5,403,890 | | — | | | | — |
| Financials | | | 15,906,631 | | | 15,906,631 | | — | | | | — |
| Health Care | | | 16,498,001 | | | 16,498,001 | | — | | | | — |
| Industrials | | | 12,546,531 | | | 12,546,531 | | — | | | | — |
| Information Technology | | | 26,007,397 | | | 26,007,397 | | — | | | | —* |
| Materials | | | 1,987,222 | | | 1,987,222 | | — | | | | — |
| Telecommunication Services | | | 3,192,654 | | | 3,192,654 | | — | | | | — |
| Utilities | | | 938,943 | | | 938,943 | | — | | | | — |
| TOTAL COMMON STOCKS | $ | | 107,861,738 | $ | | 107,861,738 | | — | | | | — |
| CONVERTIBLE PREFERRED STOCKS | | | | | | | | | |
| Health Care | | | 495,641 | | | 495,641 | | — | | | | — |
| CORPORATE BONDS | | | | | | | | | | | | |
| Information Technology | | | — | | | — | | — | | | | —* |
| MASTER LIMITED PARTNERSHIP | | | | | | | | | |
| Energy | | | 456,237 | | | 456,237 | | — | | | | — |
| Financials | | | 1,677,816 | | | 1,677,816 | | — | | | | — |
| TOTAL MASTER LIMITED | | | | | | | | | | | | |
| PARTNERSHIP | $ | 2,134,053 | $ | 2,134,053 | | — | | | | — |
- 144 -
THE ALGER FUNDS
NOTES TO FINANCIAL STATEMENTS (Continued)
| | | | | | | | |
| Alger Growth & Income Fund | | TOTAL FUND | | | LEVEL 1 | LEVEL 2 | LEVEL 3 |
| PREFERRED STOCKS | | | | | | | | |
| Information Technology | | | — | | | — | — | —* |
| REAL ESTATE INVESTMENT TRUST | | | | | |
| Financials | $ | | 706,626 | $ | | 706,626 | — | — |
| Real Estate | | | 2,836,200 | | | 2,836,200 | — | — |
| TOTAL REAL ESTATE | | | | | | | | |
| INVESTMENT TRUST | $ | 3,542,826 | $ | 3,542,826 | — | — |
| WARRANTS | | | | | | | | |
| Information Technology | | | — | | | — | — | —* |
| SHORT-TERM INVESTMENTS | | | | | | |
| Money Market Fund | | | 1,808,020 | | | 1,808,020 | — | — |
| TOTAL INVESTMENTS IN | | | | | | | | |
| SECURITIES | $ | 115,842,278 | $ | 115,842,278 | — | — |
* Alger Capital Appreciation Fund’s and Alger Growth & Income Fund’s shares of
Choicestream Inc. common stock, preferred stock, corporate bonds and warrants are
classified as a Level 3 investment and are fair valued at zero as of October 31, 2017.
** Alger Small Cap Growth Fund’s and Alger Health Sciences Fund’s holdings of
Neuralstem, Inc.’s rights are classified as a Level 2 investment and are fair valued at zero as
of October 31, 2017.
*** Amounts held for indemnification claims of Sumitomo Dainippon Pharma Co., Ltd.
following its acquisition of Tolero Pharmaceuticals, Inc.
| | | |
| | FAIR VALUE | |
| | MEASUREMENTS | |
| | | USING | |
| | SIGNIFICANT | |
| | UNOBSERVABLE | |
| | INPUTS (LEVEL 3) | |
| Alger Capital Appreciation Fund | Common Stocks | |
| Opening balance at November 1, 2016 | $ | 1,172,607 | |
| Transfers into Level 3 | | — | |
| Transfers out of Level 3 | | — | |
| Total gains or losses | | | |
| Included in net realized gain (loss) on investments | | – | |
| Included in net unrealized gain (loss) on investments | | (291,236 | ) |
| Purchases and sales | | | |
| Purchases | | – | |
| Sales | | – | |
| Closing balance at October 31, 2017 | | 881,371 | * |
| Net change in unrealized appreciation (depreciation) attributable to | | | |
| investments still held at October 31, 2017 | $ | (291,236 | ) |
- 145 -
THE ALGER FUNDS
NOTES TO FINANCIAL STATEMENTS (Continued)
| | | |
| | FAIR VALUE | |
| | MEASUREMENTS | |
| | | USING | |
| | SIGNIFICANT | |
| | UNOBSERVABLE | |
| | INPUTS (LEVEL 3) | |
| Alger Capital Appreciation Fund | Corporate Bonds | |
| Opening balance at November 1, 2016 | $ | 387,502 | |
| Transfers into Level 3 | | — | |
| Transfers out of Level 3 | | — | |
| Accrued discounts | | — | |
| Total gains or losses | | | |
| Included in net realized gain (loss) on investments | | – | |
| Included in net unrealized gain (loss) on investments | | (387,502 | ) |
| Purchases and sales | | | |
| Purchases | | – | |
| Sales | | – | |
| Closing balance at October 31, 2017 | | 0 | * |
| Net change in unrealized appreciation (depreciation) attributable to | | | |
| investments still held at October 31, 2017 | $ | (387,502 | ) |
| |
| Alger Capital Appreciation Fund | Preferred Stocks | |
| Opening balance at November 1, 2016 | $ | 10,752,714 | |
| Transfers into Level 3 | | — | |
| Transfers out of Level 3 | | — | |
| Total gains or losses | | | |
| Included in net realized gain (loss) on investments | | – | |
| Included in net unrealized gain (loss) on investments | | (2,286,060 | ) |
| Purchases and sales | | | |
| Purchases | | – | |
| Sales | | – | |
| Closing balance at October 31, 2017 | | 8,466,654 | * |
| Net change in unrealized appreciation (depreciation) attributable to | | | |
| investments still held at October 31, 2017 | $ | (2,286,060 | ) |
| |
| Alger Capital Appreciation Fund | | Warrants | |
| Opening balance at November 1, 2016 | $ | 379,752 | |
| Transfers into Level 3 | | — | |
| Transfers out of Level 3 | | — | |
| Total gains or losses | | | |
| Included in net realized gain (loss) on investments | | – | |
| Included in net unrealized gain (loss) on investments | | (379,752 | ) |
| Purchases and sales | | | |
| Purchases | | – | |
| Sales | | – | |
| Closing balance at October 31, 2017 | | 0 | * |
| Net change in unrealized appreciation (depreciation) attributable to | | | |
| investments still held at October 31, 2017 | $ | (379,752 | ) |
- 146 -
THE ALGER FUNDS
NOTES TO FINANCIAL STATEMENTS (Continued)
| | | |
| | FAIR VALUE | |
| | MEASUREMENTS | |
| | | USING | |
| | SIGNIFICANT | |
| | UNOBSERVABLE | |
| | INPUTS (LEVEL 3) | |
| Alger Mid Cap Growth Fund | Common Stocks | |
| Opening balance at November 1, 2016 | $ | 125,276 | |
| Transfers into Level 3 | | — | |
| Transfers out of Level 3 | | — | |
| Total gains or losses | | | |
| Included in net realized gain (loss) on investments | | — | |
| Included in net unrealized gain (loss) on investments | | (31,114 | ) |
| Purchases and sales | | | |
| Purchases | | — | |
| Sales | | — | |
| Closing balance at October 31, 2017 | | 94,162 | |
| Net change in unrealized appreciation (depreciation) attributable to | | | |
| investments still held at October 31, 2017 | $ | (31,114 | ) |
| |
| Alger Mid Cap Growth Fund | Preferred Stocks | |
| Opening balance at November 1, 2016 | $ | 2,103,258 | |
| Transfers into Level 3 | | — | |
| Transfers out of Level 3 | | — | |
| Total gains or losses | | | |
| Included in net realized gain (loss) on investments | | 3,292,352 | |
| Included in net unrealized gain (loss) on investments | | 508,950 | |
| Purchases and Sales/Conversion | | | |
| Purchases | | — | |
| Sales/Conversion | | (4,785,321 | ) |
| Closing balance at October 31, 2017 | | 1,119,239 | |
| Net change in unrealized appreciation (depreciation) attributable to | | | |
| investments still held at October 31, 2017 | $ | 3,801,302 | |
| |
| Alger Mid Cap Growth Fund | | Rights | |
| Opening balance at November 1, 2016 | $ | — | |
| Transfers into Level 3 | | — | |
| Transfers out of Level 3 | | — | |
| Total gains or losses | | | |
| Included in net realized gain (loss) on investments | | — | |
| Included in net unrealized gain (loss) on investments | | 1,369,589 | |
| Purchases and sales | | | |
| Purchases | | 315,501 | |
| Sales | | — | |
| Closing balance at October 31, 2017 | | 1,685,090 | |
| Net change in unrealized appreciation (depreciation) attributable to | | | |
| investments still held at October 31, 2017 | $ | 1,369,589 | |
- 147 -
THE ALGER FUNDS
NOTES TO FINANCIAL STATEMENTS (Continued)
| | | |
| | FAIR VALUE | |
| | MEASUREMENTS | |
| | | USING | |
| | SIGNIFICANT | |
| | UNOBSERVABLE | |
| | INPUTS (LEVEL 3) | |
| | Special Purpose | |
| Alger Mid Cap Growth Fund | | Vehicle | |
| Opening balance at November 1, 2016 | $ | 327,271 | |
| Transfers into Level 3 | | — | |
| Transfers out of Level 3 | | — | |
| Total gains or losses | | | |
| Included in net realized gain (loss) on investments | | – | |
| Included in net unrealized gain (loss) on investments | | 52,944 | |
| Purchases and sales | | | |
| Purchases | | – | |
| Sales | | – | |
| Closing balance at October 31, 2017 | | 380,215 | |
| Net change in unrealized appreciation (depreciation) attributable to | | | |
| investments still held at October 31, 2017 | $ | 52,944 | |
| |
| | FAIR VALUE | |
| | MEASUREMENTS | |
| | | USING | |
| | SIGNIFICANT | |
| | UNOBSERVABLE | |
| | INPUTS (LEVEL 3) | |
| Alger SMid Cap Focus Fund | Common Stocks | |
| Opening balance at November 1, 2016 | $ | 622,021 | |
| Transfers into Level 3 | | — | |
| Transfers out of Level 3 | | — | |
| Total gains or losses | | | |
| Included in net realized gain (loss) on investments | | – | |
| Included in net unrealized gain (loss) on investments | | (154,488 | ) |
| Purchases and sales | | | |
| Purchases | | – | |
| Sales | | – | |
| Closing balance at October 31, 2017 | | 467,533 | |
| Net change in unrealized appreciation (depreciation) attributable to | | | |
| investments still held at October 31, 2017 | $ | (154,488 | ) |
- 148 -
THE ALGER FUNDS
NOTES TO FINANCIAL STATEMENTS (Continued)
| | | |
| | FAIR VALUE | |
| | MEASUREMENTS | |
| | | USING | |
| | SIGNIFICANT | |
| | UNOBSERVABLE | |
| | INPUTS (LEVEL 3) | |
| Alger SMid Cap Focus Fund | Preferred Stocks | |
| Opening balance at November 1, 2016 | $ | 6,615,493 | |
| Transfers into Level 3 | | — | |
| Transfers out of Level 3 | | — | |
| Total gains or losses | | | |
| Included in net realized gain (loss) on investments | | – | |
| Included in net unrealized gain (loss) on investments | | (905,861 | ) |
| Purchases and sales | | | |
| Purchases | | – | |
| Sales | | – | |
| Closing balance at October 31, 2017 | | 5,709,632 | |
| Net change in unrealized appreciation (depreciation) attributable to | | | |
| investments still held at October 31, 2017 | $ | (905,861 | ) |
| |
| Alger SMid Cap Focus Fund | | Rights | |
| Opening balance at November 1, 2016 | $ | — | |
| Transfers into Level 3 | | — | |
| Transfers out of Level 3 | | — | |
| Total gains or losses | | | |
| Included in net realized gain (loss) on investments | | – | |
| Included in net unrealized gain (loss) on investments | | 106,642 | |
| Purchases and sales | | | |
| Purchases | | – | |
| Sales | | – | |
| Closing balance at October 31, 2017 | | 106,642 | |
| Net change in unrealized appreciation (depreciation) attributable to | | | |
| investments still held at October 31, 2017 | $ | 106,642 | |
- 149 -
THE ALGER FUNDS
NOTES TO FINANCIAL STATEMENTS (Continued)
| | | |
| | FAIR VALUE | |
| | MEASUREMENTS | |
| | | USING | |
| | SIGNIFICANT | |
| | UNOBSERVABLE | |
| | INPUTS (LEVEL 3) | |
| Alger Small Cap Growth Fund | Preferred Stocks | |
| Opening balance at November 1, 2016 | $ | 396,005 | |
| Transfers into Level 3 | | — | |
| Transfers out of Level 3 | | — | |
| Total gains or losses | | | |
| Included in net realized gain (loss) on investments | | 971,746 | |
| Included in net unrealized gain (loss) on investments | | 209,240 | |
| Purchases and Sales/Conversion | | | |
| Purchases | | – | |
| Sales/Conversion | | (1,418,844 | ) |
| Closing balance at October 31, 2017 | | 158,147 | |
| Net change in unrealized appreciation (depreciation) attributable to | | | |
| investments still held at October 31, 2017 | $ | (1,180,986 | ) |
| |
| Alger Small Cap Growth Fund | | Rights | |
| Opening balance at November 1, 2016 | $ | — | |
| Transfers into Level 3 | | — | |
| Transfers out of Level 3 | | — | |
| Total gains or losses | | | |
| Included in net realized gain (loss) on investments | | — | |
| Included in net unrealized gain (loss) on investments | | 432,207 | |
| Purchases and sales | | | |
| Purchases | | 94,483 | |
| Sales | | — | |
| Closing balance at October 31, 2017 | | 526,690 | |
| Net change in unrealized appreciation (depreciation) attributable to | | | |
| investments still held at October 31, 2017 | $ | 432,207 | |
| |
| | Special Purpose | |
| Alger Small Cap Growth Fund | | Vehicle | |
| Opening balance at November 1, 2016 | $ | 301,420 | |
| Transfers into Level 3 | | — | |
| Transfers out of Level 3 | | — | |
| Total gains or losses | | | |
| Included in net realized gain (loss) on investments | | – | |
| Included in net unrealized gain (loss) on investments | | 48,762 | |
| Purchases and sales | | | |
| Purchases | | – | |
| Sales | | – | |
| Closing balance at October 31, 2017 | | 350,182 | |
| Net change in unrealized appreciation (depreciation) attributable to | | | |
| investments still held at October 31, 2017 | $ | 48,762 | |
- 150 -
THE ALGER FUNDS
NOTES TO FINANCIAL STATEMENTS (Continued)
| | | |
| | FAIR VALUE | |
| | MEASUREMENTS | |
| | | USING | |
| | SIGNIFICANT | |
| | UNOBSERVABLE | |
| | INPUTS (LEVEL 3) | |
| Alger Small Cap Focus Fund | Preferred Stocks | |
| Opening balance at November 1, 2016 | $ | 56,319 | |
| Transfers into Level 3 | | — | |
| Transfers out of Level 3 | | — | |
| Total gains or losses | | | |
| Included in net realized gain (loss) on investments | | 82,330 | |
| Included in net unrealized gain (loss) on investments | | (1,282 | ) |
| Purchases and Sales/Conversion | | | |
| Purchases | | – | |
| Sales/Conversion | | (137,367 | ) |
| Closing balance at October 31, 2017 | | – | |
| Net change in unrealized appreciation (depreciation) attributable to | | | |
| investments still held at October 31, 2017 | $ | 81,048 | |
| |
| Alger Small Cap Focus Fund | | Rights | |
| Opening balance at November 1, 2016 | $ | — | |
| Transfers into Level 3 | | — | |
| Transfers out of Level 3 | | — | |
| Total gains or losses | | | |
| Included in net realized gain (loss) on investments | | – | |
| Included in net unrealized gain (loss) on investments | | 27,562 | |
| Purchases and sales | | | |
| Purchases | | 6,436 | |
| Sales | | – | |
| Closing balance at October 31, 2017 | | 33,998 | |
| Net change in unrealized appreciation (depreciation) attributable to | | | |
| investments still held at October 31, 2017 | $ | 27,562 | |
- 151 -
THE ALGER FUNDS
NOTES TO FINANCIAL STATEMENTS (Continued)
| | | |
| | FAIR VALUE | |
| | MEASUREMENTS | |
| | | USING | |
| | SIGNIFICANT | |
| | UNOBSERVABLE | |
| | INPUTS (LEVEL 3) | |
| Alger Health Sciences Fund | Common Stocks | |
| Opening balance at November 1, 2016 | $ | 143,719 | |
| Transfers into Level 3 | | — | |
| Transfers out of Level 3 | | — | |
| Total gains or losses | | | |
| Included in net realized gain (loss) on investments | | — | |
| Included in net unrealized gain (loss) on investments | | 2,768,984 | |
| Purchases and sales | | | |
| Purchases | | — | |
| Sales | | — | |
| Closing balance at October 31, 2017 | | 2,912,703 | |
| Net change in unrealized appreciation (depreciation) attributable to | | | |
| investments still held at October 31, 2017 | $ | 2,768,984 | |
| |
| Alger Health Sciences Fund | Preferred Stocks | |
| Opening balance at November 1, 2016 | $ | 6,250,448 | |
| Transfers into Level 3 | | — | |
| Transfers out of Level 3 | | — | |
| Total gains or losses | | | |
| Included in net realized gain (loss) on investments | | 10,958,392 | |
| Included in net unrealized gain (loss) on investments | | 1,970,683 | |
| Purchases and Sales/Conversion | | | |
| Purchases | | – | |
| Sales/Conversion | | (15,946,375 | ) |
| Closing balance at October 31, 2017 | | 3,233,148 | |
| Net change in unrealized appreciation (depreciation) attributable to | | | |
| investments still held at October 31, 2017 | $ | 12,929,075 | |
| |
| Alger Health Sciences Fund | | Rights | |
| Opening balance at November 1, 2016 | $ | — | |
| Transfers into Level 3 | | — | |
| Transfers out of Level 3 | | — | |
| Total gains or losses | | | |
| Included in net realized gain (loss) on investments | | — | |
| Included in net unrealized gain (loss) on investments | | 5,556,731 | |
| Purchases and sales | | | |
| Purchases | | 1,044,370 | |
| Sales | | — | |
| Closing balance at October 31, 2017 | | 6,601,101 | |
| Net change in unrealized appreciation (depreciation) attributable to | | | |
| investments still held at October 31, 2017 | $ | 5,556,731 | |
- 152 -
THE ALGER FUNDS
NOTES TO FINANCIAL STATEMENTS (Continued)
| | | |
| | FAIR VALUE | |
| | MEASUREMENTS | |
| | | USING | |
| | SIGNIFICANT | |
| | UNOBSERVABLE | |
| | INPUTS (LEVEL 3) | |
| Alger Growth & Income Fund | Common Stocks | |
| Opening balance at November 1, 2016 | $ | — | |
| Transfers into Level 3 | | — | |
| Transfers out of Level 3 | | — | |
| Accrued discount | | — | |
| Total gains or losses | | | |
| Included in net realized gain (loss) on investments | | — | |
| Included in net unrealized gain (loss) on investments | | — | |
| Purchases and sales | | | |
| Purchases | | — | |
| Sales | | — | |
| Closing balance at October 31, 2017 | | 0 | * |
| Net change in unrealized appreciation (depreciation) attributable to | | | |
| investments still held at October 31, 2017 | $ | — | |
| |
| Alger Growth & Income Fund | Corporate Bonds | |
| Opening balance at November 1, 2016 | $ | 15,285 | |
| Transfers into Level 3 | | — | |
| Transfers out of Level 3 | | — | |
| Total gains or losses | | | |
| Included in net realized gain (loss) on investments | | — | |
| Included in net unrealized gain (loss) on investments | | (15,285 | ) |
| Purchases and sales | | | |
| Purchases | | — | |
| Sales | | — | |
| Closing balance at October 31, 2017 | | 0 | * |
| Net change in unrealized appreciation (depreciation) attributable to | | | |
| investments still held at October 31, 2017 | $ | (15,285 | ) |
| |
| Alger Growth & Income Fund | Preferred Stocks | |
| Opening balance at November 1, 2016 | $ | 52,648 | |
| Transfers into Level 3 | | — | |
| Transfers out of Level 3 | | — | |
| Total gains or losses | | | |
| Included in net realized gain (loss) on investments | | — | |
| Included in net unrealized gain (loss) on investments | | (52,648 | ) |
| Purchases and sales | | | |
| Purchases | | — | |
| Sales | | — | |
| Closing balance at October 31, 2017 | | 0 | * |
| Net change in unrealized appreciation (depreciation) attributable to | | | |
| investments still held at October 31, 2017 | $ | (52,648 | ) |
- 153 -
THE ALGER FUNDS
NOTES TO FINANCIAL STATEMENTS (Continued)
| | | |
| | FAIR VALUE | |
| | MEASUREMENTS | |
| | | USING | |
| | SIGNIFICANT | |
| | UNOBSERVABLE | |
| | INPUTS (LEVEL 3) | |
| Alger Growth & Income Fund | | Warrants | |
| Opening balance at November 1, 2016 | $ | 14,979 | |
| Transfers into Level 3 | | — | |
| Transfers out of Level 3 | | — | |
| Total gains or losses | | | |
| Included in net realized gain (loss) on investments | | — | |
| Included in net unrealized gain (loss) on investments | | (14,979 | ) |
| Purchases and sales | | | |
| Purchases | | — | |
| Sales | | — | |
| Closing balance at October 31, 2017 | | 0 | * |
| Net change in unrealized appreciation (depreciation) attributable to | | | |
| investments still held at October 31, 2017 | $ | (14,979 | ) |
*Level 3 securities are fair valued at zero at the end of the period.
The following table provides quantitative information about our Level 3 fair value
measurements of our investments as of October 31, 2017. In addition to the techniques
and inputs noted in the table below, according to our valuation policy we may also use other
valuation techniques and methodologies when determining our fair value measurements.
The table below is not intended to be all-inclusive, but rather provides information on the
Level 3 inputs as they relate to our fair value measurements.
| | | | | | | |
| | | Fair Value | Valuation | Unobservable | | | Weighted |
| | | October 31, 2017 | Methodology | Input | Input/Range | | Average Inputs |
| Alger Capital Appreciation Fund | | | | | |
| Common Stocks | $ | 881,371 | Market | Market Quotation | N/A* | | N/A |
| Approach | | | | |
| Preferred Stocks | | 8,466,654 | Market | Time to Exit | 2 years | | N/A |
| | | | Approach | Volatility | 80.5% | | N/A |
| | | | | Market Quotation | N/A | | N/A |
- 154 -
THE ALGER FUNDS
NOTES TO FINANCIAL STATEMENTS (Continued)
| | | | | | | |
| | Fair Value | Valuation | Unobservable | | | Weighted | |
| | October 31, 2017 | Methodology | Input | Input/Range | | Average Inputs | |
| Alger Mid Cap Growth Fund | | | | | | |
| Common Stocks | 94,162 | Market | Market Quotation | N/A* | | N/A | |
| Approach | | | | | |
| Preferred Stocks | 434,056 | Market | Market Quotation | N/A* | | N/A | |
| Approach | | | | | |
| Preferred Stocks | 685,183 | Income | Discount Rate | 38%-42% | | N/A | |
| | Approach | | | | | |
| Special Purpose Vehicle | 380,215 | Market Approach | Revenue Multiple | 2.9x-4.2x | | N/A | |
| Rights | 1,685,090 | Income | Discount Rate | 5.14%-30.72% | | N/A | |
| Approach | | | | | |
| |
| Alger SMid Cap Focus Fund | | | | | | |
| Common Stocks | 467,533 | Market | Market Quotation | N/A* | | N/A | |
| Approach | | | | | |
| Preferred Stocks | 4,987,433 | Market | Time to Exit | 2 years | | N/A | |
| Approach | | | | | |
| | | | Volatility | 80.5% | | N/A | |
| | | | Market Quotation | N/A* | | N/A | |
| Preferred Stocks | 722,199 | Income | Discount Rate | 38%-42% | | N/A | |
| Approach | | | | | |
| Rights | 106,642 | Income | Discount Rate | 2.05% | | N/A | |
| Approach | | | | | |
| |
| Alger Small Cap Growth Fund | | | | | | |
| Preferred Stocks | 158,147 | Income | Discount Rate | 38%-42% | | N/A | |
| Approach | | | | | |
| Special Purpose Vehicle | 350,182 | Market Approach | Revenue Multiple | 2.9x-4.2x | | N/A | |
| Rights | 526,690 | Income | Discount Rate | 2.05%-30.72% | | 17.10% | |
| Approach | | | | | |
| Alger Small Cap Focus Fund | | | | | | |
| Rights | 33,998 | Income | Discount Rate | 5.14%-30.72% | | N/A | |
| Approach | | | | | |
- 155 -
THE ALGER FUNDS
NOTES TO FINANCIAL STATEMENTS (Continued)
| | | | | | | |
| | Fair Value | Valuation | Unobservable | | | Weighted | |
| | October 31, 2017 | Methodology | Input | Input/Range | | Average Inputs | |
| Alger Health Sciences Fund | | | | | | |
| Common Stocks | 2,912,703 | Market Approach | Revenue Multiple | 6.0x | | N/A | |
| Preferred Stocks | 2,799,782 | Income | Discount Rate | 38%-42% | | N/A | |
| Approach | | | | | |
| Preferred Stocks | 433,366 | Market | Time to Exit | 2 years | | N/A | |
| | Approach | | | | | |
| | | | Volatility | 80.5% | | N/A | |
| Rights | 5,650,701 | Income | Discount Rate | 2.05-30.72% | | 17.76% | |
| | Approach | | | | | |
| Rights | 950,400 | Market | Revenue Multiple | 6.0x | | N/A | |
| | Approach | | | | | |
* The Fund utilized a market approach to fair value this security. The significant unobservable
input used in the valuation model was a market quotation available to the Fund at October
31, 2017.
The significant unobservable inputs used in the fair value measurement of the Fund’s
securities are revenue and EBITDA multiples, discount rates, and the probabilities of
success of certain outcomes. Significant increases and decreases in these inputs in isolation
and interrelationships between those inputs could result in significantly higher or lower fair
value measurements than those noted in the table above. Generally, increases in revenue and
EBITDA multiples, decreases in discount rates, and increases in the probabilities of success
results in higher fair value measurements, whereas decreases in revenues and EBITDA
multiples, increases in discount rates, and decreases in the probabilities of success results in
lower fair value measurements.
On October 31, 2017, there were no transfers of securities between Level 1 and Level 2.
Certain of the Funds’ assets and liabilities are held at carrying amount or face value, which
approximates fair value for financial statement purposes. As of October 31, 2017, such
assets are categorized within the disclosure hierarchy as follows:
| | | | | | | | |
| | TOTAL FUND | | LEVEL 1 | | LEVEL 2 | LEVEL 3 |
| Cash, Foreign cash and Cash equivalents: | | | | | | |
| Alger Capital Appreciation Fund | $ | 2,241,247 | | $ | — | $ | 2,241,247 | — |
| Alger International Growth Fund | | | | | | | | |
| Foreign cash | | 1,575,492 | | 1,575,492 | | — | — |
| Bank overdraft | | (1,163,792) | | | (1,163,792) | | — | — |
| Alger Mid Cap Growth Fund | | 7,250,758 | | | — | | 7,250,758 | — |
| Alger SMid Cap Focus Fund | | 7,884,327 | | | — | | 7,884,327 | — |
| Alger Small Cap Growth Fund | | 2,975,560 | | | — | | 2,975,560 | — |
| Alger Small Cap Focus Fund | | 5,037,198 | | | — | | 5,037,198 | — |
| Alger Health Sciences Fund | | 1,212,013 | | | — | | 1,212,013 | — |
| Alger Growth & Income Fund | | 3,244,286 | | | — | | 3,244,286 | — |
| Collateral on securities loaned | | 1,808,020 | | | — | | 1,808,020 | — |
- 156 -
THE ALGER FUNDS
NOTES TO FINANCIAL STATEMENTS (Continued)
NOTE 9 — Derivatives:
Financial Accounting Standards Board Accounting Standards Codification 815 – Derivatives
and Hedging (“ASC 815”) requires qualitative disclosures about objectives and strategies for
using derivatives, quantitative disclosures about fair value amounts of and gains and losses
on derivative instruments, and disclosures about credit-risk-related contingent features in
derivative agreements.
Options—The Funds seek to capture the majority of the returns associated with equity
market investments. To meet this investment goal, the Funds invest in a broadly diversified
portfolio of common stocks, while also buying and selling call and put options on equities
and equity indexes. The Funds purchase call options to increase their exposure to the stock
market and also provide diversification of risk. The Funds purchase put options in order
to protect from significant market declines that may occur over a short period of time. The
Funds will write covered call and cash secured put options to generate cash flows while
reducing the volatility of the Funds’ portfolios. The cash flows may be an important source
of the Funds’ returns, although written call options may reduce the Funds’ ability to profit
from increases in the value of the underlying security or equity portfolio. The value of a
call option generally increases as the price of the underlying stock increases and decreases
as the stock decreases in price. Conversely, the value of a put option generally increases as
the price of the underlying stock decreases and decreases as the stock increases in price.
The combination of the diversified stock portfolio and the purchase and sale of options
is intended to provide the Funds with the majority of the returns associated with equity
market investments but with reduced volatility and returns that are augmented with the cash
flows from the sale of options. During the year ended October 31, 2017, options were used
in accordance with these objectives.
The Funds’ option contracts were not subject to any rights of offset with any counterparty.
All of the Funds’ options were exchange traded which utilize a clearing house that acts as an
intermediary between buyer and seller, receiving initial and maintenance margin from both,
and guaranteeing performance of the option contract.
There were no open derivative instruments throughout the period or as of October 31,
2017.
NOTE 10 — Principal Risks:
As of October 31, 2017, the Funds invested a significant portion of their assets in securities
in the consumer discretionary, health care and information technology sectors. Changes in
economic conditions affecting such sectors would have an impact on the Funds and could
affect the value, income and/or liquidity of positions in such securities.
In the normal course of business, the Funds invest in securities and enter into transactions
where risks exist due to fluctuations in the market (market risk) or failure of the issuer
of a security to meet all its obligations (issuer credit risk). The value of securities held by
the Funds may decline in response to certain events, including those directly involving the
issuers whose securities are owned by the Funds; conditions affecting the general economy;
- 157 -
THE ALGER FUNDS
NOTES TO FINANCIAL STATEMENTS (Continued)
overall market changes; local, regional or global political, social or economic instability; and
currency and interest rate and price fluctuations. Similar to issuer credit risk, the Funds may
be exposed to counterparty credit risk, or the risk that an entity with which the Funds have
unsettled or open transactions may fail to or be unable to perform on its commitments. The
Funds manage counterparty credit risk by entering into transactions only with counterparties
that they believe have the financial resources to honor their obligations and by monitoring
the financial stability of those counterparties. Financial assets, which potentially expose
the Funds to market, issuer and counterparty credit risks, consist principally of financial
instruments and receivables due from counterparties. The extent of the Funds’ exposure to
market, issuer and counterparty credit risks with respect to these financial assets is generally
approximated by its value recorded in the Statement of Assets and Liabilities, less any
collateral held by the Funds.
The Funds invest in companies that are not yet available in the public markets and that are
accessible only through private equity investments. The Funds may also invest in venture
capital or private equity funds, direct private equity investments and other investments that
may have limited liquidity. There may be no trading market for these securities, and their
sale or transfer may be limited or prohibited by contract or legal requirements, or may be
dependent on an exit strategy, such as an initial public offering or the sale of a business,
which may not occur, or may be dependent on managerial assistance provided by other
investors and their willingness to provide additional financial support. The securities may
be able to be liquidated, if at all, at disadvantageous prices. As a result, the Funds may be
required to hold these positions for several years, if not longer, regardless of adverse price
movements. Such positions may cause the Funds to be less liquid than would otherwise be
the case.
NOTE 11 — Affiliated Securities:
The issuers of the securities listed below are deemed to be affiliates of the Funds because
the Funds or their affiliates owned 5% or more of the issuer’s voting securities during all
or part of the year ended October 31, 2017. Purchase and sale transactions and dividend
income earned during the period were as follows:
- 158 -
THE ALGER FUNDS
NOTES TO FINANCIAL STATEMENTS (Continued)
| | | | | | | | | | | | | | | | | | | |
| | | | | | | | | | | | | | | Net Increase | | | | |
| | Shares/ | | | | Shares/ | | | | | | | | | (Decrease) | | | | |
| | Par at | | | | Par at | | | | | | | | | | in | | | Value at |
| | October 31, | Purchases/ | Sales/ | | October 31, | | Interest | | Realized | | Unrealized | | | | October 31, |
| Security | 2016 | Conversion | Conversion | | 2017 | | Income | | Gain (Loss) | | | App(Dep) | | | | 2017 |
| Alger Capital Appreciation Fund | | | | | | | | | | | | | | | | | | |
| Common Stocks | | | | | | | | | | | | | | | | | | | |
| Choicestream, Inc. | 82,955 | – | – | | 82,955 | $ | | – | | $ | | – | | $ | – | | | $ | – |
| Preferred Stocks | | | | | | | | | | | | | | | | | | | |
| Choicestream, Inc. , | | | | | | | | | | | | | | | | | | | |
| Series A | 715,332 | – | – | | 715,332 | | | – | | | | – | | | – | | | | – |
| Choicestream, Inc. , | | | | | | | | | | | | | | | | | | | |
| Series B | 1,649,956 | – | – | | 1,649,956 | | | – | | | | – | | | (973,474 | ) | | | – |
| Warrants | | | | | | | | | | | | | | | | | | | |
| Choicestream, Inc. , | | | | | | | | | | | | | | | | | | | |
| 6/22/26 | 387,502 | – | – | | 387,502 | | | – | | | | – | | | (379,752 | ) | | | – |
| Corporate Bonds | | | | | | | | | | | | | | | | | | | |
| Choicestream, Inc. , | | | | | | | | | | | | | | | | | | | |
| 11.00%, 8/5/18 | 387,502 | – | – | | 387,502 | | 7,714 | | | | – | | | (387,502 | ) | | | – |
| Total | | | | | | $ | 7,714 | | $ | | – | | $ | (1,740,728 | ) | | $ | – |
| |
| |
| |
| |
| | | | | | | | | | | | | | | Net Increase | | | | |
| | Shares/ | | | | Shares/ | | | | | | | | | (Decrease) | | | | |
| | Par at | | | | Par at | | | | | | | | | | in | | | Value at |
| | October 31, | Purchases/ | Sales/ | | October 31, | | Interest | | Realized | | Unrealized | | | | October 31, |
| Security | 2016 | Conversion | Conversion | | 2017 | | Income | | Gain (Loss) | | | App(Dep) | | | | 2017 |
| Alger Mid Cap Growth Fund | | | | | | | | | | | | | | | | | | |
| Preferred Stocks | | | | | | | | | | | | | | | | | | | |
| Prosetta Biosciences, | | | | | | | | | | | | | | | | | | | |
| Inc. , Series D | 219,610 | – | – | | 219,610 | | $ | – | | $ | | – | $ | (202,041 | ) | | $ | 685,183 |
| Tolero | | | | | | | | | | | | | | | | | | | |
| Pharmaceuticals, | | | | | | | | | | | | | | | | | | | |
| Inc. , Series B* | 495,000 | – | (495,000 | ) | – * | | $ | – | $ | 3,292,351 | $ | | – | | | $ | – * |
| Total | | | | | | | $ | – | $ | 3,292,351 | $ | (202,041 | ) | | $ | 685,183 |
| |
| |
| |
| |
| | | | | | | | | | | | | | | Net Increase | | | | |
| | Shares/ | | | | Shares/ | | | | | | | | | (Decrease) | | | | |
| | Par at | | | | Par at | | | | | | | | | | in | | | Value at |
| | October 31, | Purchases/ | Sales/ | | October 31, | | Interest | | Realized | | | Unrealized | | | | October 31, |
| Security | 2016 | Conversion | Conversion | | 2017 | | Income | | Gain (Loss) | | | | App(Dep) | | | | 2017 |
| Alger SMid Cap Focus Fund | | | | | | | | | | | | | | | | | | |
| Preferred Stocks | | | | | | | | | | | | | | | | | | | |
| Prosetta Biosciences, | | | | | | | | | | | | | | | | | | | |
| Inc. , Series D | 231,474 | – | – | | 231,474 | | $ | – | | $ | – | | $ | (212,956 | ) | $ | 722,199 |
| Total | | | | | | | $ | – | | $ | – | | $ | | | (212,956 | ) | $ | 722,199 |
- 159 -
THE ALGER FUNDS
NOTES TO FINANCIAL STATEMENTS (Continued)
| | | | | | | | | | | | | | | | | |
| | | | | | | | | | | | | Net Increase | | | | |
| | Shares/ | | | | Shares/ | | | | | | | (Decrease) | | | | |
| | Par at | | | | Par at | | | | | | | | in | | | Value at | |
| | October 31, | Purchases/ | Sales/ | | October 31, | Interest | | Realized | | Unrealized | | | October 31, | |
| Security | 2016 | Conversion | Conversion | | 2017 | Income | | Gain (Loss) | | | App(Dep) | | | 2017 | |
| Alger Small Cap Growth Fund | | | | | | | | | | | | | | | | |
| Preferred Stocks | | | | | | | | | | | | | | | | | |
| Prosetta Biosciences, | | | | | | | | | | | | | | | | | |
| Inc. , Series D | 50,688 | – | – | | 50,688 | $ | | – | $ | – | $ | | (46,633 | ) | $ | 158,147 | |
| Tolero | | | | | | | | | | | | | | | | | |
| Pharmaceuticals, | | | | | | | | | | | | | | | | | |
| Inc. , Series B* | 148,237 | – | (148,237 | ) | – * | $ | | – | $ | 971,747 | $ | | – | | $ | – * | |
| Total | | | | | | $ | | – | $ | 971,747 | $ | (46,633 | ) | $ | 158,147 | |
| |
| |
| |
| |
| | | | | | | | | | | | | Net Increase | | | | |
| | Shares/ | | | | Shares/ | | | | | | | (Decrease) | | | | |
| | Par at | | | | Par at | | | | | | | | in | | | Value at | |
| | October 31, | Purchases/ | Sales/ | | October 31, | Interest | | Realized | | Unrealized | | | October 31, | |
| Security | 2016 | Conversion | Conversion | | 2017 | | Income | | Gain (Loss) | | | App(Dep) | | | 2017 | |
| Alger Small Cap Focus Fund | | | | | | | | | | | | | | | | |
| Preferred Stocks | | | | | | | | | | | | | | | | | |
| Tolero | | | | | | | | | | | | | | | | | |
| Pharmaceuticals, | | | | | | | | | | | | | | | | | |
| Inc. , Series B* | 10,097 | – | (10,097 | ) | – * | $ | | – | $ | 66,189 | | $ | – | | $ | – * | |
| Total | | | | | | $ | | – | $ | 66,189 | | $ | – | | $ | – | |
| |
| |
| |
| |
| | | | | | | | | | | | | Net Increase | | | | |
| | Shares/ | | | | Shares/ | | | | | | | (Decrease) | | | | |
| | Par at | | | | Par at | | | | | | | | in | | | Value at | |
| | October 31, | Purchases/ | Sales/ | | October 31, | Interest | | | Realized | | Unrealized | | | October 31, | |
| Security | 2016 | Conversion | Conversion | | 2017 | Income | | | Gain (Loss) | | | App(Dep) | | | 2017 | |
| Alger Health Sciences Fund | | | | | | | | | | | | | | | | |
| Preferred Stocks | | | | | | | | | | | | | | | | | |
| Prosetta Biosciences, | | | | | | | | | | | | | | | | | |
| Inc. , Series D | 897,366 | – | – | | 897,366 | $ | – | $ | | – | $ | (825,577 | ) | $ | 2,799,782 | |
| Tolero | | | | | | | | | | | | | | | | | |
| Pharmaceuticals, | | | | | | | | | | | | | | | | | |
| Inc. , Series B* | 1,638,547 | – | (1,638,547 | ) | – * | $ | – | $ | | 10,926,308 | $ | | – | | $ | – * | |
| Total | | | | | | $ | – | $ | | 10,926,308 | $ | (825,577 | ) | $ | 2,799,782 | |
- 160 -
THE ALGER FUNDS
NOTES TO FINANCIAL STATEMENTS (Continued)
| | | | | | | | | | | | | |
| | | | | | | | | | Net Increase | | | |
| | Shares/ | | | Shares/ | | | | | (Decrease) | | | |
| | Par at | | | Par at | | | | | | in | | Value at |
| | October 31, | Purchases/ | Sales/ | October 31, | | Interest | Realized | | Unrealized | | October 31, |
| Security | 2016 | Conversion | Conversion | 2017 | | Income | Gain (Loss) | | App(Dep) | | 2017 |
| Alger Growth & Income Fund | | | | | | | | | | | | |
| Common Stocks | | | | | | | | | | | | | |
| Choicestream, Inc. | 5,064 | – | – | 5,064 | $ | – | $ | – | $ | – | | $ | – |
| Preferred Stocks | | | | | | | | | | | | | |
| Choicestream, Inc. , | | | | | | | | | | | | | |
| Series A | 43,672 | – | – | 43,672 | | – | | – | | – | | | – |
| Choicestream, Inc. , | | | | | | | | | | | | | |
| Series B | 89,234 | – | – | 89,234 | | – | | – | | (52,647 | ) | | – |
| Warrants | | | | | | | | | | | | | |
| Choicestream, Inc., | | | | | | | | | | | | | |
| 6/22/26 | 15,285 | – | – | 15,285 | | – | | – | | (14,979 | ) | | – |
| Corporate Bonds | | | | | | | | | | | | | |
| Choicestream, Inc., | | | | | | | | | | | | | |
| 11.00%, 8/5/18 | 15,285 | – | – | 15,285 | | 300 | | – | $ | (15,285 | ) | | – |
| Total | | | | | $ | 300 | $ | – | $ | (82,911 | ) | $ | – |
* On February 6, 2017 Tolero Pharmaceuticals, Inc., Series B was no longer an affiliated
security of the Funds.
NOTE 12 — Subsequent Events:
Management of each Fund has evaluated events that have occurred subsequent to October
31, 2017 through the issuance date of the Financial Statements. No such events have been
identified which require recognition and/or disclosure.
- 161 -
REPORT OF INDEPENDENT REGISTERED PUBLIC ACCOUNTING FIRM
To the Board of Trustees of The Alger Funds and Shareholders of Alger Capital
Appreciation Fund, Alger International Growth Fund, Alger Mid Cap Growth Fund, Alger
SMid Cap Focus Fund (formerly known as Alger SMid Cap Growth Fund), Alger Small
Cap Growth Fund, Alger Small Cap Focus Fund, Alger Health Sciences Fund, and Alger
Growth & Income Fund:
We have audited the accompanying statements of assets and liabilities, including the schedules
of investments, of The Alger Funds, comprised of the Alger Capital Appreciation Fund,
Alger International Growth Fund, Alger Mid Cap Growth Fund, Alger SMid Cap Focus
Fund (formerly known as Alger SMid Cap Growth Fund), Alger Small Cap Growth Fund,
Alger Small Cap Focus Fund, Alger Health Sciences Fund, and Alger Growth & Income
Fund (the “Funds”) as of October 31, 2017, and the related statements of operations for
the year then ended, the statements of changes in net assets for each of the two years
in the period then ended, and the financial highlights for each of the periods presented.
These financial statements and financial highlights are the responsibility of the Funds’
management. Our responsibility is to express an opinion on these financial statements and
financial highlights based on our audits.
We conducted our audits in accordance with the standards of the Public Company
Accounting Oversight Board (United States). Those standards require that we plan and
perform the audit to obtain reasonable assurance about whether the financial statements and
financial highlights are free of material misstatement. The Funds are not required to have,
nor were we engaged to perform, an audit of their internal control over financial reporting.
Our audits included consideration of internal control over financial reporting as a basis for
designing audit procedures that are appropriate in the circumstances, but not for the purpose
of expressing an opinion on the effectiveness of the Funds’ internal control over financial
reporting. Accordingly, we express no such opinion. An audit also includes examining, on
a test basis, evidence supporting the amounts and disclosures in the financial statements,
assessing the accounting principles used and significant estimates made by management,
as well as evaluating the overall financial statement presentation. Our procedures included
confirmation of securities owned as of October 31, 2017, by correspondence with the
custodian and brokers; when replies were not received from brokers, we performed other
auditing procedures. We believe that our audits provide a reasonable basis for our opinion.
In our opinion, the financial statements and financial highlights referred to above present
fairly, in all material respects, the financial position of each of the portfolios constituting
The Alger Funds as of October 31, 2017, the results of their operations for the year then
ended, the changes in their net assets for each of the two years in the period then ended, and
the financial highlights for each of the periods presented, in conformity with accounting
principles generally accepted in the United States of America.
Deloitte & Touche LLP
New York, New York
December 22, 2017
- 162 -
THE ALGER FUNDS
ADDITIONAL INFORMATION (Unaudited)
Shareholder Expense Example
As a shareholder of a Fund, you incur two types of costs: transaction costs, if applicable,
including sales charges (loads) and redemption fees; and ongoing costs, including
management fees, distribution (12b-1) fees, if applicable, and other fund expenses. This
example is intended to help you understand your ongoing costs (in dollars) of investing in
the Fund and to compare these costs with the ongoing costs of investing in other mutual
funds.
The example below is based on an investment of $1,000 invested at the beginning of the
six-month period starting May 1, 2017 and ending October 31, 2017.
Actual Expenses
The first line for each class of shares in the table below provides information about actual
account values and actual expenses. You may use the information in this line, together
with the amount you invested, to estimate the expenses that you would have paid over the
period. Simply divide your account value by $1,000 (for example, an $8,600 account value
divided by $1,000 = 8.6), then multiply the result by the number in the first line under the
heading entitled “Expenses Paid during the Period” to estimate the expenses you paid on
your account during this period.
Hypothetical Example for Comparison Purposes
The second line for each class of shares in the table below provides information about
hypothetical account values and hypothetical expenses based on the Fund’s actual expense
ratios for each class of shares and an assumed rate of return of 5% per year before expenses,
which is not the Fund’s actual return. The hypothetical account values and expenses may not
be used to estimate the actual ending account balance or expenses you paid for the period.
You may use this information to compare the ongoing costs of investing in the Fund and
other funds. To do so, compare this 5% hypothetical example with the 5% hypothetical
examples that appear in the shareholder reports of other funds.
Please note that the expenses shown in the table are meant to highlight your ongoing costs
only and do not reflect any transaction costs, such as sales charges (loads) and redemption
fees. Therefore, the second line under each class of shares in the table is useful in comparing
ongoing costs only, and will not help you determine the relative total costs of owning
different funds. In addition, if these transactional costs were included, your costs would
have been higher.
- 163 -
THE ALGER FUNDS
ADDITIONAL INFORMATION (Unaudited) (Continued)
| | | | | | | | | | |
| | | | | | | | | | Annualized | |
| | | | | | | | Expenses | | Expense | |
| | | | | | | | Paid During | | Ratio | |
| | | | | | Ending | | the Six | | For the | |
| | | Beginning | | Account | | Months | | Six Months | |
| | | Account | | Value | | Ended | | Ended | |
| | | | Value | | October 31, | | October 31, | | October 31, | |
| | | May 1, 2017 | | 2017 | | 2017 | (a) | 2017 | (b) |
| Alger Capital Appreciation Fund | | | | | | | | | |
| Class A | Actual | $ | 1,000.00 | $ | 1,130.68 | $ | 6.61 | | 1.23 | % |
| | Hypothetical(c) | | 1,000.00 | | 1,019.00 | | 6.26 | | 1.23 | |
| Class B | Actual | | 1,000.00 | | 1,126.69 | | 10.67 | | 1.99 | |
| | Hypothetical(c) | | 1,000.00 | | 1,015.17 | | 10.11 | | 1.99 | |
| Class C | Actual | | 1,000.00 | | 1,126.62 | | 10.56 | | 1.97 | |
| | Hypothetical(c) | | 1,000.00 | | 1,015.27 | | 10.01 | | 1.97 | |
| Class Z | Actual | | 1,000.00 | | 1,132.70 | | 4.73 | | 0.88 | |
| | Hypothetical(c) | | 1,000.00 | | 1,020.77 | | 4.48 | | 0.88 | |
| | | | | | | | | | | |
| Alger International Growth Fund | | | | | | | | | |
| Class A | Actual | $ | 1,000.00 | $ | 1,138.60 | $ | 7.22 | | 1.34 | % |
| | Hypothetical(c) | | 1,000.00 | | 1,018.45 | | 6.82 | | 1.34 | |
| Class B | Actual | | 1,000.00 | | 1,134.52 | | 11.03 | | 2.05 | |
| | Hypothetical(c) | | 1,000.00 | | 1,014.87 | | 10.41 | | 2.05 | |
| Class C | Actual | | 1,000.00 | | 1,133.99 | | 11.46 | | 2.13 | |
| | Hypothetical(c) | | 1,000.00 | | 1,014.47 | | 10.82 | | 2.13 | |
| Class I | Actual | | 1,000.00 | | 1,138.96 | | 6.20 | | 1.15 | |
| | Hypothetical(c) | | 1,000.00 | | 1,019.41 | | 5.85 | | 1.15 | |
| Class Z | Actual | | 1,000.00 | | 1,140.57 | | 4.80 | | 0.89 | |
| | Hypothetical(c) | | 1,000.00 | | 1,020.72 | | 4.53 | | 0.89 | |
| | | | | | | | | | | |
| Alger Mid Cap Growth Fund | | | | | | | | | |
| Class A | Actual | $ | 1,000.00 | $ | 1,127.20 | $ | 7.08 | | 1.32 | % |
| | Hypothetical(c) | | 1,000.00 | | 1,018.55 | | 6.72 | | 1.32 | |
| Class B | Actual | | 1,000.00 | | 1,123.83 | | 10.97 | | 2.05 | |
| | Hypothetical(c) | | 1,000.00 | | 1,014.87 | | 10.41 | | 2.05 | |
| Class C | Actual | | 1,000.00 | | 1,121.98 | | 11.39 | | 2.13 | |
| | Hypothetical(c) | | 1,000.00 | | 1,014.47 | | 10.82 | | 2.13 | |
| Class Z | Actual | | 1,000.00 | | 1,128.95 | | 5.63 | | 1.05 | |
| | Hypothetical(c) | | 1,000.00 | | 1,019.91 | | 5.35 | | 1.05 | |
| | | | | | | | | | | |
- 164 -
THE ALGER FUNDS
ADDITIONAL INFORMATION (Unaudited) (Continued)
| | | | | | | | | | |
| | | | | | | | | | Annualized | |
| | | | | | | | Expenses | | Expense | |
| | | | | | | | Paid During | | Ratio | |
| | | | | | Ending | | the Six | | For the | |
| | | Beginning | | Account | | Months | | Six Months | |
| | | Account | | Value | | Ended | | Ended | |
| | | | Value | | October 31, | | October 31, | | October 31, | |
| | | May 1, 2017 | | 2017 | | 2017 | (a) | 2017 | (b) |
| Alger SMid Cap Focus Fund | | | | | | | | | |
| Class A | Actual | $ | 1,000.00 | $ | 1,192.77 | $ | 7.46 | | 1.35 | % |
| | Hypothetical(c) | | 1,000.00 | | 1,018.40 | | 6.87 | | 1.35 | |
| Class C | Actual | | 1,000.00 | | 1,189.89 | | 11.70 | | 2.12 | |
| | Hypothetical(c) | | 1,000.00 | | 1,014.52 | | 10.76 | | 2.12 | |
| Class I | Actual | | 1,000.00 | | 1,193.46 | | 7.46 | | 1.35 | |
| | Hypothetical(c) | | 1,000.00 | | 1,018.40 | | 6.87 | | 1.35 | |
| Class Y | Actual | | 1,000.00 | | 1,070.90 | | 4.53 | | 0.87 | |
| | Hypothetical(c) | | 1,000.00 | | 1,020.82 | | 4.43 | | 0.87 | |
| Class Z | Actual | | 1,000.00 | | 1,195.38 | | 5.87 | | 1.06 | |
| | Hypothetical(c) | | 1,000.00 | | 1,019.86 | | 5.40 | | 1.06 | |
| | | | | | | | | | | |
| Alger Small Cap Growth Fund | | | | | | | | | |
| Class A | Actual | $ | 1,000.00 | $ | 1,152.26 | $ | 7.49 | | 1.38 | % |
| | Hypothetical(c) | | 1,000.00 | | 1,018.25 | | 7.02 | | 1.38 | |
| Class B | Actual | | 1,000.00 | | 1,148.48 | | 11.86 | | 2.19 | |
| | Hypothetical(c) | | 1,000.00 | | 1,014.17 | | 11.12 | | 2.19 | |
| Class C | Actual | | 1,000.00 | | 1,147.60 | | 11.75 | | 2.17 | |
| | Hypothetical(c) | | 1,000.00 | | 1,014.27 | | 11.02 | | 2.17 | |
| Class Z | Actual | | 1,000.00 | | 1,155.91 | | 5.38 | | 0.99 | |
| | Hypothetical(c) | | 1,000.00 | | 1,020.21 | | 5.04 | | 0.99 | |
| | | | | | | | | | | |
| Alger Small Cap Focus Fund | | | | | | | | | |
| Class A | Actual | $ | 1,000.00 | $ | 1,157.61 | $ | 6.53 | | 1.20 | % |
| | Hypothetical(c) | | 1,000.00 | | 1,019.16 | | 6.11 | | 1.20 | |
| Class C | Actual | | 1,000.00 | | 1,152.80 | | 10.58 | | 1.95 | |
| | Hypothetical(c) | | 1,000.00 | | 1,015.38 | | 9.91 | | 1.95 | |
| Class I | Actual | | 1,000.00 | | 1,156.70 | | 6.52 | | 1.20 | |
| | Hypothetical(c) | | 1,000.00 | | 1,019.16 | | 6.11 | | 1.20 | |
| Class Y | Actual | | 1,000.00 | | 1,159.16 | | 4.63 | | 0.90 | |
| | Hypothetical(c) | | 1,000.00 | | 1,020.92 | | 4.33 | | 0.90 | |
| Class Z | Actual | | 1,000.00 | | 1,159.16 | | 4.90 | | 0.90 | |
| | Hypothetical(c) | | 1,000.00 | | 1,020.67 | | 4.58 | | 0.90 | |
| | | | | | | | | | | |
- 165 -
THE ALGER FUNDS
ADDITIONAL INFORMATION (Unaudited) (Continued)
| | | | | | | | | | |
| | | | | | | | | | Annualized | |
| | | | | | | | Expenses | | Expense | |
| | | | | | | | Paid During | | Ratio | |
| | | | | | Ending | | the Six | | For the | |
| | | Beginning | | Account | | Months | | Six Months | |
| | | Account | | Value | | Ended | | Ended | |
| | | | Value | | October 31, | | October 31, | | October 31, | |
| | | May 1, 2017 | | 2017 | | 2017 | (a) | 2017 | (b) |
| Alger Health Sciences Fund | | | | | | | | | |
| Class A | Actual | $ | 1,000.00 | $ | 1,136.92 | $ | 7.43 | | 1.38 | % |
| | Hypothetical(c) | | 1,000.00 | | 1,018.25 | | 7.02 | | 1.38 | |
| Class C | Actual | | 1,000.00 | | 1,132.06 | | 11.55 | | 2.15 | |
| | Hypothetical(c) | | 1,000.00 | | 1,014.37 | | 10.92 | | 2.15 | |
| Class Z | Actual | | 1,000.00 | | 1,139.29 | | 5.34 | | 0.99 | |
| | Hypothetical(c) | | 1,000.00 | | 1,020.21 | | 5.04 | | 0.99 | |
| | | | | | | | | | | |
| Alger Growth & Income Fund | | | | | | | | | |
| Class A | Actual | $ | 1,000.00 | $ | 1,077.54 | $ | 6.23 | | 1.19 | % |
| | Hypothetical(c) | | 1,000.00 | | 1,019.21 | | 6.06 | | 1.19 | |
| Class C | Actual | | 1,000.00 | | 1,073.37 | | 10.14 | | 1.94 | |
| | Hypothetical(c) | | 1,000.00 | | 1,015.43 | | 9.86 | | 1.94 | |
| Class Z | Actual | | 1,000.00 | | 1,079.29 | | 4.72 | | 0.90 | |
| | Hypothetical(c) | | 1,000.00 | | 1,020.67 | | 4.58 | | 0.90 | |
(a) Expenses are equal to the annualized expense ratio of the respective share class,
multiplied by the average account value over the period, multiply by 184/365 (to reflect the
one-half year period).
(b) Annualized.
(c) 5% annual return before expenses.
- 166 -
THE ALGER FUNDS
ADDITIONAL INFORMATION (Unaudited) (Continued)
Tax Information
In accordance with subchapter M of the Internal Revenue Code of 1986, as amended, for
the year ended October 31, 2017, 100.00% of the Alger Growth & Income Fund’s dividends
qualified for the dividends deduction for corporations. For the year ended October 31, 2017,
certain dividends paid by the Funds may be subject to a maximum rate of 15%, as provided
by the Jobs and Growth Tax Relief Reconciliation Act of 2003. Of the distributions paid
during the fiscal year, 100% of the Alger International Growth Fund and Alger Growth &
Income Fund’s dividends may be considered qualified dividend income.
Shareholders should not use the above information to prepare their tax returns. Since the
Fund's fiscal year is not the calendar year, another notification will be sent with respect to
calendar year 2017. Such notification, which will reflect the amount to be used by tax payers
on their federal income tax returns, will be made in conjunction with Form 1099 DIV and
will be mailed in January 2018. Shareholders are advised to consult their own tax advisers
with respect to the tax consequences of their investment in the Fund.
- 167 -
THE ALGER FUNDS
ADDITIONAL INFORMATION (Unaudited) (Continued)
Trustees and Officers of the Trust
Information about the trustees and officers of the Trust is set forth below. In the table the
term "Alger Fund Complex" refers to the Trust, The Alger Portfolios, The Alger Institutional
Funds, Alger Global Growth Fund and The Alger Funds II, each of which is a registered
investment company managed by Fred Alger Management, Inc. ("Alger Management").
Each Trustee serves until an event of termination, such as death or resignation, or until his
or her successor is duly elected; each officer's term of office is one year. Unless otherwise
noted, the address of each person named below is 360 Park Avenue South, New York, NY
10010.
- 168 -
THE ALGER FUNDS
ADDITIONAL INFORMATION (Unaudited) (Continued)
| | | |
| | | | Number |
| | | | of Funds |
| | | | in the |
| | | | Alger |
| | | | Fund |
| | | | Complex |
| | | Trustee | which are |
| | | and/or | Overseen |
| Name, Age, Position with | | Officer | by |
| the Fund | Principal Occupations | Since | Trustee |
| INTERESTED TRUSTEE | | | |
| |
| Hilary M. Alger (56) | Director of Development, Pennsylvania Ballet 2004- | 2003 | 24 |
| | 2013; Associate Director of Development, College | | |
| | of Arts and Science and Graduate School, University | | |
| | of Virginia 1999-2003. | | |
| NON-INTERESTED | | | |
| TRUSTEE | | | |
| |
| Charles F. Baird, Jr. (64) | Managing Director of North Castle Partners, | 2000 | 24 |
| | a private equity securities group; Chairman of | | |
| | Elizabeth Arden Red Door Spas and Barry’s | | |
| | Bootcamp, former Chairman of Cascade Helmets, | | |
| | gloProfessional (makeup and skincare business), | | |
| | Contigo (manufacturer of mugs and water bottles), | | |
| | and International Fitness. | | |
| Roger P. Cheever (72) | Associate Vice President for Principal Gifts and | 2000 | 24 |
| | Senior Associate Dean for Development in the | | |
| | Faculty of Arts and Sciences at Harvard University; | | |
| | Formerly Deputy Director of the Harvard College | | |
| | Fund. | | |
| Stephen E. O'Neil (84) | Attorney. Private Investor since 1981. Formerly of | 1986 | 24 |
| | Counsel to the law firm of Kohler & Barnes. | | |
| David Rosenberg (55) | Associate Professor of Law since January 2006 | 2007 | 24 |
| | (Assistant Professor 2000-2005), Zicklin School of | | |
| | Business, Baruch College, City University of New | | |
| | York. | | |
| Nathan E. Saint-Amand | Medical doctor in private practice; Member of the | 1986 | 24 |
| M. D. (79) | Board of the Manhattan Institute (non-profit policy | | |
| | research) since 1988; Formerly Co-Chairman, Special | | |
| | Projects Committee, Memorial Sloan Kettering. | | |
Ms. Alger is an “interested person” (as defined in the Investment Company Act) of the
Trust because of her affiliations with Alger Management. No Trustee is a director of any
public company except as indicated under “Principal Occupations”.
- 169 -
THE ALGER FUNDS
ADDITIONAL INFORMATION (Unaudited) (Continued)
| | | | |
| | | | | Number |
| | | | | of Funds |
| | | | | in the |
| | | | | Alger |
| | | | | Fund |
| | | | | Complex |
| | | | Trustee | which are |
| Name, Age, Position with | | | and/or | Overseen |
| the | | | Officer | by |
| Fund | Principal Occupations | | Since | Trustee |
| OFFICERS | | | | |
| Hal Liebes (53) | Executive Vice President, Chief Operating Officer | | 2005 | N/A |
| President | and Secretary of Alger Management and Alger Inc. ; | | | |
| | Director since 2006 of Alger Management, Alger | | | |
| | Inc. and Analyst Resources, Inc. | | | |
| Tina Payne (43) | Senior Vice President, General Counsel and | | 2017 | N/A |
| Secretary, | Chief Compliance Officer of Alger Management | | | |
| Chief Compliance Officer | since 2017. Formerly, Senior Vice President and | | | |
| | Associate General Counsel, Cohen & Steers Capital | | | |
| | Management, from 2007 to 2017 | | | |
| Lisa A. Moss (52) | Senior Vice President and Assistant General Counsel | | 2006 | N/A |
| Assistant Secretary | of Alger Management. | | | |
| Christopher E. Ullman (32) | Associate Counsel of Alger Management since | | 2016 | N/A |
| Assistant Secretary | 2016. Formerly, Associate, Legal and Compliance, | | | |
| | BlackRock from 2015 to 2016; Compliance | | | |
| | Associate, Bridgewater Associates, from 2013 to | | | |
| | 2014; and full-time student fro m 2010 to 2013. | | |
| Michael D. Martins (52) | Senior Vice President of Alger Management. | | 2005 | N/A |
| Treasurer | | | | |
| Anthony S. Caputo (62) | Vice President of Alger Management. | | 2007 | N/A |
| Assistant Treasurer | | | | |
| Sergio M. Pavone (56) | Vice President of Alger Management. | | 2007 | N/A |
| Assistant Treasurer | | | | |
- 170 -
THE ALGER FUNDS
ADDITIONAL INFORMATION (Unaudited) (Continued)
Investment Management Agreement Renewal
At an in-person meeting held on September 12, 2017, the Trustees, including the Independent
Trustees, unanimously approved renewal of the Investment Advisory Agreement (the
“Agreement”) between the Trust and Fred Alger Management, Inc. (“Alger Management”).
The Independent Trustees were assisted in their review by independent legal counsel and met
with such counsel in executive session separate from representatives of Alger Management.
In evaluating the Agreement, the Trustees drew on materials that they had requested and
which were provided to them in advance of the meeting by Alger Management and by
counsel. The materials covered, among other matters, (i) the nature, extent and quality
of the services provided by Alger Management under the Agreement, (ii) the investment
performance of each of the Trust’s portfolios (each a “Fund”), (iii) the costs to Alger
Management of its services and the profits realized by Alger Management and Fred Alger
& Company, Incorporated (“Alger Inc.”), from their relationship with the Trust, and (iv)
the extent to which economies of scale would be realized if and as the Funds grow and
whether the fee levels in the Agreement reflected such economies of scale. These materials
included a presentation and analysis of the Funds and Alger Management’s services by
FUSE Research Network LLC (“FUSE”), an independent consulting firm selected by
the Trust’s Chief Compliance Officer and having no other material relationship with the
Trustees, Alger Management or its affiliates.
In deciding whether to approve renewal of the Agreement, the Trustees considered various
factors, including those enumerated above. They also considered other direct and indirect
benefits to Alger Management and its affiliates from their relationship with the Trust.
Nature, Extent and Quality of Services. In considering the nature, extent and quality of
the services provided by Alger Management pursuant to the Agreement, the Trustees relied
on their prior experience as Trustees of the Trust, their familiarity with the personnel and
resources of Alger Management and its affiliate (derived in part from quarterly meetings
with and presentations by Fund investment management, distribution and administration
personnel), and the materials provided at the meeting. They noted that under the Agreement
Alger Management is responsible for managing the investment operations of the Funds.
The Trustees reviewed the background and experience of Alger Management's senior
investment management personnel, including the individuals currently responsible for
the investment operations of the Funds. They also considered the resources and practices
of Alger Management in managing each Fund's portfolio, as well as Alger Management's
overall investment management business. They noted especially Alger Management's
history of expertise in managing portfolios of "growth" stocks and that, according to an
analysis provided by FUSE, the characteristics of each Fund had been consistent with
those of a growth-oriented fund. They further noted that Alger Management’s investment
management team includes several individuals with deep and successful backgrounds in
international investing, a sector in which the International Growth Fund is active, and that
during the year Alger Management had continued its ongoing efforts to strengthen its
investment management team through strategic hires, realignment of portfolio management
responsibilities, and similar measures. The Trustees concluded that Alger Management's
- 171 -
THE ALGER FUNDS
ADDITIONAL INFORMATION (Unaudited) (Continued)
experience, resources and strength in the areas of importance to the Funds are considerable.
They also noted that certain administrative, compliance, reporting and accounting services
necessary for the conduct of the Trust’s affairs are provided separately under a Fund
Administration Agreement and a Shareholder Administrative Services Agreement with
Alger Management. The Trustees considered the strengthened legal, control and compliance
environment at Alger Management and within the Trust and Alger Management’s ongoing
implementation of a firm-wide cybersecurity facility, including software and hardware
installations, extensive security procedures and intensive personnel training.
Investment Performance of the Funds. Drawing upon information provided at the
meeting by Alger Management as well as FUSE and upon reports provided to the Trustees
by Alger Management throughout the preceding year, the Trustees reviewed each Fund’s
returns for the year-to-date (at 6/30/17), second-quarter of 2017, 1-, 3-, and 5-year and
longer periods to the extent available (and its year-by-year returns), and compared them with
benchmark and peer-group data for the same periods. They also consulted supplemental
performance data through 7/31/17. They were pleased to note that all of the Funds other
than the Alger International Growth Fund had surpassed or, in rare cases (Alger Capital
Appreciation Fund and Classes B and C of Alger Mid Cap Growth Fund), matched their
peer medians for the second-quarter, year-to-date and one-year periods ended 6/30/17.
In several cases this outperformance reached well into the top quartile, and several Funds’
out performance was sustained for longer periods. Performance by these Funds against
their benchmarks in the second quarter, year-to-date, and one-year periods ended 6/30/17
was also strong except for isolated instances when a share class fell just below the Fund’s
benchmark. Of particular interest was the fact that the performance of Alger SMid Cap
Focus Fund under its new Investment Sub-Adviser (as of March of 2017), Weatherbie
Capital, LLC, was better than the Fund’s peers and benchmark. The Alger International
Growth Fund, on the other hand underperformed against its peers and benchmark for all
periods of five years or less ended 6/30/17, often placing in the bottom quartile against its
peers and generally below its benchmark. Encouragingly, the Fund surpassed its benchmark
in all share classes for the quarter ended 6/30/17.
As had been the practice at every quarterly meeting of Trustees throughout the year,
representatives of Alger Management discussed with the Trustees the recent performance
of each Fund and the measures that the firm was in the process of instituting or had
instituted to improve the performance of Funds that had consistently underperformed.
In expanding orally on the written materials they had provided to the Trustees, the FUSE
representatives commented further on the performance of the various Funds, discussing,
among other things, how differences among funds in a peer group can distort the picture
that a fund’s performance ranking may suggest. Throughout, the Trustees were mindful of
conditions and trends in the current market in equity securities, including growth stocks, and
their impact on the performance and assets of the Funds. On the basis of their review and
these discussions, including especially a discussion of sources of, and measures to address,
the underperformance of the International Growth Fund, the Trustees determined that the
performance of that Fund was acceptable, while meriting continued scrutiny, and that the
performance of the other Funds was highly satisfactory.
- 172 -
THE ALGER FUNDS
ADDITIONAL INFORMATION (Unaudited) (Continued)
Fund Fees and Expense Ratios; Profitability to Alger Management and its Affiliates.
The Trustees reviewed each Fund's management fee and expense ratio and compared
them with those of a group of comparable funds. In order to assist the Trustees in this
comparison, FUSE had provided the Trustees with comparative information with respect
to the advisory fees and expense ratios of similar funds. That information indicated that the
advisory fees of all but two of the Funds were below or near the median for the applicable
FUSE reference group, with only the fee for the Capital Appreciation Fund placing in the
top (most expensive) quartile of the Fund’s reference group. The Trustees expected that
that fee, just within the threshold of the top quartile, would continue to be effectively
reduced somewhat by operation of the Fund’s four tiered fee breakpoints, one of which
had already been reached. The other advisory fee placing significantly above the peer-fund
median was that of the Health Sciences Fund, which ranked less than half-way up in the
quartile immediately above the median. Of the 31 expense ratios for the Funds’ various
share classes, 11 were below or virtually at their peer medians and seven more were slightly
above the applicable median; of the remaining 13, all but seven (the Class A and C Shares
of the Capital Appreciation Fund, the Class A Shares of the Mid Cap Fund, the Class A
and C Shares of the SMid Cap Focus Fund and the Class A and C Shares of the Health
Sciences Fund) were for Fund classes of small asset size that suffered thereby in comparison
to their Funds’ peers. The Trustees noted that none of the seven remaining expense ratios
was in the top (i.e., most expensive) quartile. The Trustees determined that the expense-ratio
information should be taken into account in weighing the size of the fee against the nature,
extent and quality of the services provided.
The Trustees also considered fees paid to Alger Management by five other types of clients,
specifically mutual funds for which Alger Management acted as sub-adviser, other pooled
investment vehicles (including UCITS and hedge funds), separately managed institutional
accounts, “wrap programs,” and collective investment trusts. The Trustees determined that
in all five cases the fees were of doubtful relevance for purposes of comparison with those
of the Funds because of the differences in services provided by Alger Management to those
types of clients as opposed to the Funds, but that to the extent that meaningful comparison
was practicable, the differences in services adequately explained the differences in the fees.
The Trustees then considered the profitability of the Investment Advisory Agreement to
Alger Management and its affiliates, and the methodology used by Alger Management in
determining such profitability. The Trustees reviewed previously-provided data on each
Fund's profitability to Alger Management and its affiliates for the year ended June 30, 2017.
After discussing with representatives of FUSE the expense-allocation practices, which
FUSE reported to be consistent with accepted industry practice, used in computing the
costs that formed the bases of the profitability calculations, the Trustees turned to the
profitability data provided. After analysis and discussion, they concluded in each case that,
to the extent that Alger Management’s and its affiliates’ relationships with the Fund had
been profitable, the profit margin was not unacceptable.
Economies of Scale. On the basis of their discussions with management and their analysis
of information provided at the meeting, the Trustees determined that the nature of the
- 173 -
THE ALGER FUNDS
ADDITIONAL INFORMATION (Unaudited) (Continued)
Funds and their operations is such that Alger Management is likely to realize economies
of scale in the management of each Fund at some point as (and if) it grows in size. In
that connection, they noted that the advisory fee schedules in the Agreement include fee
reductions for each Fund (other than the Alger Small Cap Focus Fund) at specified Fund asset
levels (“breakpoints”); these have the effect of lowering a Fund’s overall management fee as
the Fund grows past a breakpoint, thus sharing with the Fund’s shareholders economies of
scale achieved by Alger Management in managing the growing Fund. Instituting breakpoints
for the Alger Small Cap Focus Fund, with assets at 6/30/17 of less than $271 million, and
for which Alger Management was waiving some of its management fees, was, as it had
been previously, deemed premature; in this connection, the Trustees noted that the Fund’s
advisory fee ranked in the lowest quartile of its peers at June 30, 2017.
Other Benefits to Alger Management. The Trustees considered whether Alger
Management benefits in other ways from its relationship with the Trust. They noted that
Alger Management maintains soft-dollar arrangements in connection with the Funds'
brokerage transactions, reports on which are regularly supplied to the Trustees at their
quarterly meetings and summaries of which, listing commissions by Fund for the twelve
months through June 30, 2017, had been included in the materials supplied prior to the
meeting. The Trustees also noted that Alger Management receives fees from the Funds
under the Fund Administration Agreement and the Shareholder Administrative Services
Agreement, and that Alger Inc. provides a considerable portion of the Funds' equity
brokerage and receives shareholder servicing fees from the Funds as well. The Trustees
had been provided with information regarding, and had considered, the administration fee,
shareholder administrative services fee, brokerage and shareholder servicing fee benefits in
connection with their review of the profitability to Alger Management and its affiliates of
their relationships with the Funds. As to other benefits received, the Trustees determined
that none were so significant as to render Alger Management's fees excessive.
Conclusions and Determinations. At the conclusion of these discussions, each of the
Independent Trustees expressed the opinion that he had been furnished with sufficient
information to make an informed business decision with respect to renewal of the
Investment Advisory Agreement. Based on its discussions and considerations as described
above, the Board made the following conclusions and determinations in respect of each
Fund:
• The Board concluded that the nature, extent and quality of the services provided
to the Fund by Alger Management are adequate and appropriate.
• The Board determined that the Fund’s performance was acceptable.
• The Board concluded that the advisory fee paid to Alger Management by the
Fund was reasonable in light of comparative performance and expense and advi-
sory fee information, costs of the services provided and profits to be realized and
benefits derived or to be derived by Alger Management and its affiliates from the
relationship with the Fund. In the case of certain Funds, the Trustees noted that
Alger Management had undertaken to cap Fund expenses through expense re-
- 174 -
THE ALGER FUNDS
ADDITIONAL INFORMATION (Unaudited) (Continued)
imbursements and fee waivers, thus in effect lowering the fees it actually received
from the Fund.
• With respect to each Fund other than the comparatively small Alger Small Cap
Focus Fund, the Board accepted Alger Management’s acknowledgement that
economies of scale were likely to be achieved in the management of the Fund as
(and if) it grew in size and determined that the fee breakpoints in the Agreement
provided a means by which Alger Management would share the benefits of such
economies with Fund shareholders.
The Board considered these conclusions and determinations and, without any one factor
being dispositive, determined with respect to each Fund that renewal of the Investment
Advisory Agreement was in the best interests of the Fund and its shareholders.
- 175 -
THE ALGER FUNDS
ADDITIONAL INFORMATION (Unaudited) (Continued)
Sub-Advisory Agreement Approval
At their in-person meeting held on September 12, 2017, the Trustees, including the
Independent Trustees, unanimously approved renewal of the Sub-Investment Advisory
Agreement (the “Agreement”), dated March 1, 2017, between Fred Alger Management,
Inc. (“Alger Management”), the Trust’s investment adviser, and Weatherbie Capital, LLC
(“Weatherbie”), a registered investment adviser, with respect to the Alger SMid Cap Focus
Fund (the “Fund”; formerly, Alger SMid Cap Growth Fund), a series of the Trust. The
Independent Trustees were assisted in their review by independent legal counsel and met
with such counsel in executive session separate from representatives of Alger Management.
In evaluating the Agreement, the Trustees drew on materials provided to them by Alger
Management and Weatherbie. The Weatherbie materials included a detailed written account
of the firm’s history, investment management personnel, investment philosophy and
practices, and historic investment performance. The Trustees also reviewed the proposed
Agreement itself and drew upon discussions with Alger Management regarding the sub-
advisory arrangement with Weatherbie.
The Trustees noted that, under the terms of the Agreement, Weatherbie, under the
supervision of Alger Management, manages all or a portion of the Fund’s assets as allocated
by Alger Management, in return for a fee representing a specified percentage of the fee paid
by the Fund to Alger Management with respect to the Weatherbie-managed assets. The fee
is paid by Alger Management out of its own resources.
In their evaluation of the Agreement, the Trustees focused primarily upon the nature, extent
and quality of the services provided by Weatherbie under the Agreement and the fee to
be paid to Weatherbie. The Trustees did not regard other subjects normally addressed in
evaluations of advisory agreements, such as profitability of the relationship to the adviser
and economies of scale expected to be realized, as relevant or appropriate under the
circumstances.
Nature, Extent and Quality of Services; Investment Performance. In considering
the nature, extent and quality of the services provided by Weatherbie pursuant to the
Agreement, the Trustees relied on the foregoing materials and discussions, as well as detailed
information regarding the performance of the Fund provided by FUSE Research Network
LLC (“FUSE”), an independent consulting firm selected by the Trust’s Chief Compliance
Officer and having no other material relationship with Alger Management or its affiliates.
They noted Weatherbie’s extensive background and resources as an investment management
company in general and with respect to small-and mid-cap growth stocks, which represent
the primary focus of the Fund’s investments, in particular, and the experience and
qualifications of the Weatherbie personnel who provide portfolio management services to
the Fund. As to performance history, they noted that, in the performance data provided in
the materials, the firm’s Specialized Growth Composite, a portfolio of small- and midcap
growth stocks (net of management fees), had surpassed the Russell 2000 Growth Index
over the short and long term periods, although it trailed the index in mid-range periods.
As to the performance of the Fund itself to date during Weatherbie’s tenure, the FUSE
- 176 -
THE ALGER FUNDS
ADDITIONAL INFORMATION (Unaudited) (Continued)
materials revealed that the Fund’s performance since March 2017 had outperformed the
Fund’s peers and benchmark. The Trustees were satisfied with the performance as reported
and concluded that Weatherbie’s experience, resources and strength in areas of importance
to the Fund were considerable.
Sub-advisory Fee; Profitability; Economies of Scale. In evaluating the sub-advisory fee
to be paid to Weatherbie, the Trustees did not consider the profitability of the Agreement
to Weatherbie or the topic of economies of scale, having determined that these topics were
at the outset prospective and speculative only and, in any event, could be appropriately
addressed, if deemed necessary, in the course of the annual review of the Trust’s
Investment Advisory Agreement with Alger Management with respect to the Fund. As
to the sub-advisory fee itself, the Trustees noted that the fee is paid not by the Fund but
by Alger Management out of its own resources. After discussion with Alger Management,
they concluded that, in light of the services that Weatherbie provides to the Fund and
of the fee paid by the Fund to Alger Management, which they had determined at their
September meeting to be fair and reasonable, there was no reason not to conclude that the
sub-advisory fee to Weatherbie was fair and reasonable. Nor did they consider that such
foreseeable additional benefits as might accrue to that firm by virtue of its relationship with
the Fund would render the sub-advisory fee excessive. In that connection, they noted that,
by virtue of its ability under the Agreement to allocate trades in the securities making up
the managed assets, Weatherbie would be in a position to receive soft-dollar benefits from
selected brokers, and they determined to consider such benefits in subsequent evaluations
of the Agreement. Based on their general familiarity with such matters as discussed in
the industry, the Trustees considered the Agreement, including the sub-advisory fee, to
be unexceptional, while meeting the needs of the Fund, and therefore did not consider it
necessary to compare the Agreement specifically with other arrangements.
At the conclusion of these discussions, each of the Trustees expressed the opinion that he/
she had been furnished with sufficient information to make an informed business decision
with respect to renewal of the Agreement. Based on its discussions and considerations as
described above, the Board made the following determinations:
• The Board concluded that the nature, extent and quality of the services provided
by Weatherbie were appropriate and acceptable and that Weatherbie’s perfor-
mance was satisfactory.
• The Board concluded that the fee to be paid to Weatherbie by Alger Management
was fair and reasonable.
• The Board determined that attention to profitability and economies of scale, if
and when deemed appropriate, could be paid in the context of a review of the
Fund’s investment advisory agreement with Alger Management.
The Board considered these conclusions and determinations and, without any one factor
being dispositive, determined that renewal of the proposed Sub-Investment Advisory
Agreement between Alger Management and Weatherbie with respect to the Fund was in the
best interests of the Fund and its shareholders.
- 177 -
THE ALGER FUNDS
ADDITIONAL INFORMATION (Unaudited) (Continued)
Privacy Policy
| | |
| U. S. Consumer Privacy Notice | Rev. 12/20/16 |
| FACTS | WHAT DOES ALGER DO WITH YOUR PERSONAL INFORMATION? |
| Why? | Financial companies choose how they share your personal information. Federal law |
| | gives consumers the right to limit some but not all sharing. Federal law also requires us |
| | to tell you how we collect, share, and protect your personal information. Please read this |
| | notice carefully to understand what we do. | |
| What? | The types of personal information we collect and share depend on the product or service |
| | you have with us. | |
| | This information can include: | |
| | • Social Security number and | |
| | • Account balances and | |
| | • Transaction history and | |
| | • Purchase history and | |
| | • Assets | |
| | When you are no longer our customer, we continue to share your information as |
| | described in this notice. | |
| How? | All financial companies need to share personal information to run their everyday business. |
| | In the section below, we list the reasons financial companies can share personal |
| | information; the reasons Alger chooses to share; and whether you can limit this sharing. |
| | |
| Reasons we can share your | Does | Can you limit |
| personal information | Alger share? | this sharing? |
| For our everyday business | Yes | No |
| purposes — such as to process your | | |
| transactions, maintain your account(s), | | |
| respond to court orders and legal | | |
| investigations, or report to credit bureaus | | |
| For our marketing purposes — to | Yes | No |
| offer our products and services to you | | |
| For joint marketing with other | No | We don’t share |
| financial companies | | |
| For our affiliates’ everyday | Yes | No |
| business purposes — information about | | |
| your transactions and experiences | | |
| For our affiliates’ everyday | No | We don’t share |
| business purposes — information about | | |
| your creditworthiness | | |
| For nonaffiliates to market to you | No | We don’t share |
| Questions? Call 1-800-342-2186 | | |
- 178 -
THE ALGER FUNDS
ADDITIONAL INFORMATION (Unaudited) (Continued)
| |
| Who we are | |
| Who is providing this notice? | Alger includes Fred Alger Management, Inc. and Fred |
| | Alger & Company, Incorporated as well as the following |
| | funds: The Alger Funds, The Alger Funds II, The Alger |
| | Institutional Funds, The Alger Portfolios, and Alger |
| | Global Growth Fund. |
| |
| What we do | |
| How does Alger | To protect your personal information from unauthorized |
| protect my personal | access and use, we use security measures that comply |
| information? | with federal law. These measures include computer |
| | safeguards and secured files and buildings. |
| How does Alger | We collect your personal information, for example, |
| collect my personal | when you: |
| information? | • Open an account or |
| | • Make deposits or withdrawals from your account or |
| | • Give us your contact information or |
| | • Provide account information or |
| | • Pay us by check. |
| |
| |
| Why can’t I limit all sharing? | Federal law gives you the right to limit only |
| | • sharing for affiliates’ everyday business purposes |
| | information about your credit worthiness |
| | • affiliates from using your information to market to you |
| | • sharing for nonaffiliates to market to you |
| | State laws and individual companies may give you |
| | additional rights to limit sharing. |
| |
| Definitions | |
| Affiliates | Companies related by common ownership or control. |
| | They can be financial and nonfinancial companies. |
| | • Our affiliates include Fred Alger Management, Inc. |
| | and Fred Alger & Company, Incorporated as well as the |
| | following funds: The Alger Funds, The Alger Funds II, |
| | The Alger Institutional Funds, The Alger Portfolios, and |
| | Alger Global Growth Fund. |
| Nonaffiliates | Companies not related by common ownership or |
| | control. They can be financial and nonfinancial |
| | companies |
| Joint marketing | A formal agreement between nonaffiliated financial |
| | companies that together market financial products or |
| | services to you. |
| Other important information | |
- 179 -
THE ALGER FUNDS
ADDITIONAL INFORMATION (Unaudited) (Continued)
Proxy Voting Policies
A description of the policies and procedures the Fund uses to determine how to vote
proxies relating to portfolio securities and the proxy voting record is available, without
charge, by calling (800) 992-3863 or online on the Fund’s website at http://www.alger.com
or on the SEC’s website at http://www.sec.gov.
Fund Holdings
The Board of Trustees has adopted policies and procedures relating to disclosure of the
Funds’ portfolio securities. These policies and procedures recognize that there may be
legitimate business reasons for holdings to be disclosed and seek to balance those interests
to protect the proprietary nature of the trading strategies and implementation thereof by
the Funds.
Generally, the policies prohibit the release of information concerning portfolio holdings
which have not previously been made public to individual investors, institutional investors,
intermediaries that distribute the Funds’ shares and other parties which are not employed
by the Manager or its affiliates except when the legitimate business purposes for selective
disclosure and other conditions (designed to protect the Funds) are acceptable.
The Funds make their full holdings available semi-annually in shareholder reports filed on
Form N-CSR and after the first and third fiscal quarters in regulatory filings on Form N-Q.
These shareholder reports and regulatory filings are filed with the SEC, as required by federal
securities laws, and are generally available within sixty (60) days of the end of the Funds’
fiscal quarter. The Funds’ Forms N-Q are available online on the SEC’s website at www.sec.
gov or may be reviewed and copied at the SEC’s Public Reference Room in Washington,
D.C. Information regarding the operation of the SEC’s Public Reference Room may be
obtained by calling 1-800-SEC-0330.
In addition, the Funds make publicly available their respective month-end top 10 holdings
with a 10 day lag and their month-end full portfolios with a 60 day lag on their website www.
alger.com and through other marketing communications (including printed advertising/
sales literature and/or shareholder telephone customer service centers). No compensation
or other consideration is received for the non-public disclosure of portfolio holdings
information.
In accordance with the foregoing, the Funds provide portfolio holdings information to
service providers who provide necessary or beneficial services when such service providers
need access to this information in the performance of their services and are subject to
duties of confidentiality (1) imposed by law, including a duty not to trade on non-public
information, and/or (2) pursuant to an agreement that confidential information is not to
be disclosed or used (including trading on such information) other than as required by law.
From time to time, the Funds will communicate with these service providers to confirm
that they understand the Funds’ policies and procedures regarding such disclosure. This
agreement must be approved by the Funds’ Chief Compliance Officer, President, Secretary
or Assistant Secretary.
- 180 -
THE ALGER FUNDS
ADDITIONAL INFORMATION (Unaudited) (Continued)
The Board of Trustees periodically reviews a report disclosing the third parties to whom
each Fund’s holdings information has been disclosed and the purpose for such disclosure,
and it considers whether or not the release of information to such third parties is in the best
interest of the Fund and its shareholders.
In addition to material the Funds routinely provide to shareholders, the Manager may,
upon request, make additional statistical information available regarding the Funds. Such
information will include, but not be limited to, relative weightings and characteristics of
a Fund’s portfolio versus its peers or an index (such as P/E ratio, alpha, beta, capture
ratio, maximum drawdown, standard deviation, EPS forecasts, Sharpe ratio, information
ratio, R-squared, and market cap analysis), security specific impact on overall portfolio
performance, month-end top ten contributors to and detractors from performance,
breakdown of High Unit Volume Growth holdings vs. Positive Lifecycle Change holdings,
portfolio turnover, and requests of a similar nature. Please contact the Funds at (800) 992-
3863 to obtain such information.
- 181 -
THE ALGER FUNDS
360 Park Avenue South
New York, NY 10010
(800) 992-3863
www.alger.com
Investment Manager
Fred Alger Management, Inc.
360 Park Avenue South
New York, NY 10010
Distributor
Fred Alger & Company, Incorporated
360 Park Avenue South
New York, NY 10010
Transfer Agent and Dividend Disbursing Agent
Boston Financial Data Services, Inc.
P.O. Box 8480
Boston, MA 02266
Custodian
Brown Brothers Harriman & Company
50 Post Office Square
Boston, MA 02110
This report is submitted for the general information of the shareholders of The Alger
Funds. It is not authorized for distribution to prospective investors unless accompanied by
an effective Prospectus for the Trust, which contains information concerning the Trust’s
investment policies, fees and expenses as well as other pertinent information.
- 182 -
(This page has been intentionally left blank.)
(This page has been intentionally left blank.)
(This page has been intentionally left blank.)
(This page has been intentionally left blank.)
(This page has been intentionally left blank.)
(This page has been intentionally left blank.)
(This page has been intentionally left blank.)
ITEM 2. CODE OF ETHICS.
(a) The Registrant has adopted a code of ethics (the "Code of Ethics") that applies to its
principal executive officer, principal financial officer, principal accounting officer or
controller, or persons performing similar functions.
(b) Not applicable.
(c) The Registrant has not amended its Code of Ethics during the period covered by the
shareholder report presented in Item 1 hereto.
(d) The Registrant has not granted a waiver or an implicit waiver from a provision of its
Code of Ethics during the period covered by the shareholder report presented in Item 1
hereto.
(e) Not applicable.
(f) The Registrant's Code of Ethics is attached as an Exhibit hereto.
ITEM 3. AUDIT COMMITTEE FINANCIAL EXPERT.
The Board of Trustees of the Registrant determined that Stephen E. O’Neil is an audit committee
financial expert (within the meaning of that phrase specified in the instructions to Form N-CSR)
on the Registrant’s audit committee. Mr. O’Neil is an “independent” trustee – i.e., he is not an
interested person of the Registrant as defined in the Investment Company Act of 1940, nor has
he accepted directly or indirectly any consulting, advisory or other compensatory fee from the
Registrant, other than in his capacity as Trustee.
ITEM 4. PRINCIPAL ACCOUNTANT FEES AND SERVICES.
| | |
| a) Audit Fees: | | |
| October 31, 2017 | $ | 279,600 |
| October 31, 2016 | $ | 273,600 |
b) Audit-Related Fees: NONE
c) Tax Fees for tax advice, tax compliance and tax planning:
| | |
| October 31, 2017 | $ | 63,017 |
| October 31, 2016 | $ | 61,539 |
| |
| d) All Other Fees: | | |
| October 31, 2017 | $ | 15,616 |
| October 31, 2016 | $ | 15,360 |
Other fees include a review and consent for Registrants registration statement filing and
a review of the semi-annual financial statements.
e) 1) Audit Committee Pre-Approval Policies And Procedures:
Audit and non-audit services provided by the Registrant’s independent registered public
accounting firm (the “Auditors”) on behalf the Registrant must be pre-approved by the
Audit Committee. Non-audit services provided by the Auditors on behalf of the
Registrant’s Investment Adviser or any entity controlling, controlled by, or under
common control with the Investment Adviser must be pre-approved by the Audit
Committee if such non-audit services directly relate to the operations or financial
reporting of the Registrant.
2) All fees in item 4(b) through 4(d) above were approved by the Registrants’ Audit
Committee.
f) Not Applicable
g) Non-Audit Fees:
| | | |
| October 31, 2017 | $ | 224,414 , €94,197 |
| October 31, 2016 | $ | 219,975 , €93,631 |
h) The audit committee of the board of trustees has considered whether the provision of the
non-audit services that were rendered to the registrant's investment adviser and any entity
controlling, controlled by, or under common control, with the adviser that provides ongoing
services to the registrant that were not approved pursuant to (c)(7)(ii) of Rule 2-01 of
Regulation S-X is compatible with maintaining the principle accountant's independence.
ITEM 5. AUDIT COMMITTEE OF LISTED REGISTRANTS.
Not applicable
ITEM 6. INVESTMENTS.
Not applicable
ITEM 7. DISCLOSURE OF PROXY VOTING POLICIES AND PROCEDURES FOR CLOSED-END MANAGEMENT
INVESTMENT COMPANIES.
Not applicable
ITEM 8. PORTFOLIO MANAGERS OF CLOSED-END MANAGEMENT INVESTMENT COMPANIES.
Not applicable
ITEM 9. PURCHASES OF EQUITY SECURITIES BY CLOSED-END MANAGEMENT INVESTMENT COMPANY
AND AFFILIATED PURCHASERS.
Not applicable
ITEM 10. SUBMISSION OF MATTERS TO A VOTE OF SECURITY HOLDERS.
None
ITEM 11. CONTROLS AND PROCEDURES.
(a) The Registrant’s principal executive officer and principal financial officer have concluded
that the Registrant’s disclosure controls and procedures (as defined in Rule 30a-3(c) under
the Investment Company Act of 1940, as amended) are effective based on their evaluation
of the disclosure controls and procedures as of a date within 90 days of the filing date of
this document.
(b) No changes in the Registrant’s internal control over financial reporting occurred during
the Registrant’s second fiscal half-year that materially affected, or are reasonably likely to
materially affect, the Registrant’s internal control over financial reporting.
ITEM 12. EXHIBITS.
(a) (1) Code of Ethics as Exhibit 99.CODE ETH
(a) (2) Certifications of principal executive officer and principal financial officer as required by
rule 30a-2(a) under the Investment Company Act of 1940 are attached as Exhibit 99.CERT
(b) Certifications of principal executive officer and principal financial officer as required by rule
30a-2(b) under the Investment Company Act of 1940 are attached as Exhibit 99.906CERT
SIGNATURES
Pursuant to the requirements of the Securities Exchange Act of 1934 and the Investment
Company Act of 1940, the registrant has duly caused this report to be signed on its behalf
by the undersigned, thereunto duly authorized.
The Alger Funds
By: /s/Hal Liebes
Hal Liebes
President
Date: December 11, 2017
Pursuant to the requirements of the Securities Exchange Act of 1934 and the Investment
Company Act of 1940, this report has been signed below by the following persons on behalf
of the registrant and in the capacities and on the dates indicated.
By: /s/Hal Liebes
Hal Liebes
President
Date: December 11, 2017
By: /s/Michael D. Martins
Michael D. Martins
Treasurer
Date: December 11, 2017