FERRO REPORTS FOURTH QUARTER AND FULL YEAR 2018 RESULTS DELIVERS STRONG YEAR-OVER-YEAR PERFORMANCE; PROVIDES 2019 GUIDANCE |
Fourth Quarter * | | Full Year * |
| Net Sales increased 4.7% to $395.5M | | | Net Sales increased 15.4% to $1,612.4M |
| Organic salescc grew 3.6% | | | Organic salescc grew 5.2% |
| GAAP diluted EPS improved to $0.13 versus a loss of $0.10 | | | GAAP diluted EPS increased 40.3% to $0.94 |
| Adjusted EPS increased 13.8% to $0.33 | | | Adjusted EPS increased 16.3% to $1.50 |
| Net Income1 improved to $11.0M compared to a loss of $8.7M | | | Net Income1 increased 40.4% to $80.1M |
| Adjusted EBITDA grew 6.4% to $56.1M | | | Adjusted EBITDA grew 12.0% to $259.1M |
| Net Cash provided by Operating Activities increased 193.6% to $147.1M | | | Net Cash provided by Operating Activities increased 115.6% to $182.8M |
| Adjusted Free Cash Flow Conversion of 178.9% | | | Adjusted Free Cash Flow Conversion of 50.9% |
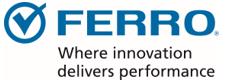
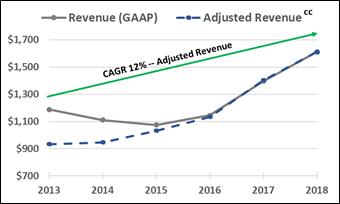
Five years into its value creation strategy, Ferro delivers a sustained, strong rate of revenue and gross profit growth.
*Comparative information is relative to prior-year fourth quarter and full year.
1 Net Income attributable to Ferro Corporation common shareholders.
cc Constant Currency
| | |

| Ferro’s team delivered another year of strong performance, with revenue growth of 15%, adjusted EPS growth of 16% and adjusted EBITDA growth of 12%. The business continued to demonstrate strong cash generation, with adjusted free cash flow conversion at 51% for the year. We are very pleased with our full-year results, particularly given the challenges of elevated raw material prices, customer destocking, and order pattern anomalies encountered during the year. For 2019, we remain focused on executing the Dynamic Innovation and Optimization phase of our strategy. We continue to leverage innovation and optimization to strengthen our business, drive sustainable growth and to generate cash. Our innovation initiatives feed our product pipeline and our cash generation provides us flexibility to invest in acquisitions, buy back shares and pay down debt. Peter Thomas
Chairman, President and CEO, Ferro Corporation | |
| |
| 
|

| | | | | | | | |
Key Results * (amounts in millions, except EPS) | | | | | | | | |
| | | | | | | | |
Sales and Gross Profits | Q4 2018 | % Change | 2018 | % Change |
Net Sales | $ | 395.5 | | 4.7% | $ | 1,612.4 | | 15.4% |
Net Sales cc | | 395.5 | | 9.1% | | 1,612.4 | | 14.9% |
Gross Profit (GAAP) | | 105.1 | | -0.3% | | 455.9 | | 9.5% |
Adjusted Gross Profit cc | | 108.8 | | 3.5% | | 462.3 | | 7.4% |
| | | | | | | | |
Net Income, EBITDA and EPS | Q4 2018 | % Change | 2018 | % Change |
Net Income 1 | $ | 11.0 | | NM | $ | 80.1 | | 40.4% |
Adjusted EBITDA | | 56.1 | | 6.4% | | 259.1 | | 12.0% |
GAAP diluted EPS | $ | 0.13 | | NM | $ | 0.94 | | 40.3% |
Adjusted EPS | | 0.33 | | 13.8% | | 1.50 | | 16.3% |
| | | | | | | | |
Cash Flow | Q4 2018 | % Change | 2018 | % Change |
Net Cash provided by operating activities (GAAP) | $ | 147.1 | | 193.6% | $ | 182.8 | | 115.6% |
Adjusted Free Cash Flow 2 | | 157.7 | | 183.9% | | 189.1 | | 118.9% |
*Comparative information is relative to prior-year fourth quarter and full year.
cc Constant Currency
1 Note: Net Income attributable to Ferro Corporation common shareholders.
2 Note: Adjusted Free Cash Flow is defined as GAAP Net Cash provided by operating activities, less Capex, plus cash used for restructuring, acquisition-related professional fees, divested businesses and assets, and certain optimization projects (including Capital Expenditures).
| | | | | | | | |
Fourth-Quarter and Full-Year Commentary | | | | | | | | |
Net Sales in the fourth quarter of 2018 increased 4.7% to $395.5 million, as Ferro completed another strong year of growth in revenue and profitability. The fourth quarter constituted the Company’s tenth consecutive quarter of organic growth; since the third quarter of 2016, Ferro has delivered organic growth at a rate of approximately 6% per year.
As previously reported, margins came under pressure in the fourth quarter due to escalated destocking by higher-margin Tile customers within the Performance Coatings segment and order timing within the Performance Colors and Glass segment.
For the full year, Ferro increased GAAP EPS by 40.3% to $0.94 and increased Adjusted EPS by 16.3% to $1.50. Net Income improved 40.4% to $80.1 million and Adjusted EBITDA increased 12.0% to $259.1 million. Net Cash provided by Operating Activities was $182.8 million with Cash Conversion of Net Income3 at 228.2% and Adjusted Free Cash Flow conversion of Adjusted EBITDA4 at 50.9%.
In 2018, the Company deployed approximately $144.8 million in investments comprised of $75.0 million for acquisitions, $41.0 million in capital related to optimization projects and $28.8 million for the purchase 1.5 million shares of Ferro common stock. Approximately $11.8 million of the $28.8 million in stock buybacks occurred in the fourth quarter. The Company finished the year with a Net Debt-to-Adjusted EBITDA ratio of 2.8 times.
3 Note: Cash Conversion of Net Income is defined as GAAP Net Cash Provided by Operating Activities, divided by Net Income.
4 Note: Adjusted Free Cash Flow Conversion of Adjusted EBITDA is defined as Adjusted Free Cash Flow, divided by Adjusted EBITDA. See tables 9 and 11.
Segment Results * (amounts in millions, except EPS) | |
| | | | | | | | | | |
| | Performance Coatings | Q4 2018 | % Change | 2018 | % Change |
| Net Sales | $ | 179.9 | | 6.1% | $ | 733.9 | | 23.6% |
| Net Sales (Constant Currency) | | 179.9 | | 12.8% | | 733.9 | | 24.5% |
| Gross Profit (GAAP) | | 35.4 | | -3.3% | | 165.7 | | 13.7% |
| Adjusted Gross Profit (Constant Currency) | | 36.5 | | -1.0% | | 166.7 | | 10.7% |
| | | | | | | | | | |

| | Performance Colors & Glass | Q4 2018 | % Change | 2018 | % Change |
| Net Sales | $ | 117.6 | | -5.1% | $ | 487.5 | | 9.6% |
| Net Sales (Constant Currency) | | 117.6 | | -2.7% | | 487.5 | | 8.1% |
| Gross Profit (GAAP) | | 38.7 | | -8.3% | | 167.4 | | 6.3% |
| Adjusted Gross Profit (Constant Currency) | | 38.7 | | -7.1% | | 167.5 | | 3.4% |
| | | | | | | | | | |

| | Color Solutions | Q4 2018 | % Change | 2018 | % Change |
| Net Sales | $ | 97.9 | | 16.4% | $ | 391.0 | | 9.2% |
| Net Sales (Constant Currency) | | 97.9 | | 19.4% | | 391.0 | | 7.8% |
| Gross Profit (GAAP) | | 31.0 | | 18.9% | | 124.9 | | 9.8% |
| Adjusted Gross Profit (Constant Currency) | | 33.4 | | 30.6% | | 129.0 | | 9.6% |
*Comparative information is relative to prior-year fourth quarter and full year.
| | | | | |
| | | | | Adjusted Free Cash |
| Net Sales | Adjusted | Adjusted | Adjusted | Flow from |
| (% of PY Sales) | Tax Rate | EBITDA | Diluted EPS | Operations Conversion |
2018 Results | $1,612.4M | 23% | $259.1M | $1.50 | 50.9% |
2019 Guidance | 3.0% - 4.0% | 26.5% -27.5% | $280 - $290M | $1.55 - $1.65 | 45% - 50% |
YoY Change | 3.0% to 4.0% | +350 bps to +450bps | +8% to +12% | +3% to +10% | |
YoY Constant Change1 | 5.5% to 6.5% | | +10% to +15% | +7% to +14% | |
Ferro’s 2019 guidance reflects robust year-on-year revenue and earnings growth. The Company’s focus on innovation and optimization, which drove performance in 2018, is expected to continue driving growth and profitability in 2019.
The 2019 guidance assumes no acquisitions, divestitures, restructuring, acquisition-related professional fees, optimization programs spend, or repurchase of common stock.
1 Remeasurement of 2018 reported and adjusted results using 2019 guidance exchange rates
Note: The full-year 2019 guidance uses foreign exchange rates as of December 31, 2018, which includes a USD/EUR exchange rate at 1.147.
Ferro is providing Adjusted Diluted EPS, Adjusted EBITDA and Adjusted Free Cash Flow from Operations Conversion guidance on a continuing operations basis. While it is likely that Ferro could incur charges for items excluded from Adjusted Diluted EPS, Adjusted EBITDA and Adjusted Free Cash Flow from Operations conversion such as mark-to-market adjustments of pension and other postretirement benefit obligations, restructuring and impairment charges, and legal and professional expenses related to certain business development activities, it is not possible, without unreasonable effort, to identify the amount or significance of these items or the potential for other transactions that may impact future GAAP net income and cash flow from operating activities. Management does not believe these items to be representative of underlying business performance. Management is unable to reconcile, without unreasonable effort, the Company's forecasted range of these adjusted non-GAAP financial measures to their most directly comparable GAAP financial measures.
Currency Exposure 2018 Weighting | | 2019 Guidance FX sensitivity |
EUR - Euro | 40% to 45% | | % Change | Operating Profit |
CNY -Yuan Renminbi | 6% to 8% | | +1% all FX change | ~ $1.5 million to ~$1.7 million |
MXN – Mexican Peso | 4% to 6% | | +1% Euro change | ~$1.1 million to ~$1.3 million |
EGP – Egyptian Pound | 3% to 5% | | | |
Constant Currency
Constant currency results reflect the remeasurement of 2017 reported and adjusted local currency results using 2018 exchange rates, which produces constant currency comparative figures to 2018 reported and adjusted results. These non-GAAP financial measures should not be considered as a substitute for the measures of financial performance prepared in accordance with GAAP.
Conference Call
Ferro will conduct an investor teleconference at 8:00 a.m. EDT Thursday, February 28, 2019. Investors can access this conference via any of the following:
• Webcast can be accessed by clicking on the Investors link at the top of Ferro’s website at ferro.com.
• Live telephone: Call 800-698-9012 within the U.S. or +1 303-223-2691 outside the U.S. Please join the call at least 10 minutes before the start time.
• Webcast replay: Available on Ferro’s Investor website at ferro.com beginning at approximately 4:30 p.m. Eastern Time on February 28, 2019
• Telephone replay: Call 800-633-8284 within the U.S. or +1 402-977-9140 outside the U.S. (for both U.S. and outside the U.S. access code is 21916423).
• Presentation material and podcast: Earnings presentation material and podcasts can be accessed through the Investors portion of the Company’s Web site at ferro.com.
About Ferro Corporation
Ferro Corporation (www.ferro.com) is a leading global supplier of technology-based functional coatings and color solutions. Ferro supplies functional coatings for glass, metal, ceramic and other substrates and color solutions in the form of specialty pigments and colorants for a broad range of industries and applications. Ferro products are sold into the building and construction, automotive, electronics, industrial products, household furnishings and appliance markets. The Company’s reportable segments include: Performance Coatings (metal and ceramic coatings), Performance Colors and Glass (glass coatings), and Color Solutions. Headquartered in Mayfield Heights, Ohio, the Company has approximately 6,100 associates globally and reported 2018 sales of $1.6 billion.
Cautionary Note on Forward-Looking Statements
Certain statements in this press release may constitute “forward-looking statements” within the meaning of federal securities laws. These statements are subject to a variety of uncertainties, unknown risks, and other factors concerning the Company’s operations and business environment. Important factors that could cause actual results to differ materially from those suggested by these forward-looking statements and that could adversely affect the Company’s future financial performance include the following:
| · | | demand in the industries into which Ferro sells its products may be unpredictable, cyclical, or heavily influenced by consumer spending; |
| · | | the effectiveness of the Company’s efforts to improve operating margins through sales growth, price increases, productivity gains, and improved purchasing techniques; |
| · | | currency conversion rates and economic, social, political, and regulatory conditions in the U.S. and around the world; |
| · | | the availability of reliable sources of energy and raw materials at a reasonable cost; |
| · | | Ferro’s ability to successfully implement and/or administer its optimization initiatives, including its investment and restructuring programs, and to produce the desired results; |
| · | | Ferro’s ability to successfully introduce new products and services or enter into new growth markets; |
| · | | Ferro’s ability to identify suitable acquisition candidates, complete acquisitions, effectively integrate the acquired businesses and achieve the expected synergies, as well as the acquisitions being accretive and Ferro achieving the expected returns on invested capital; |
| · | | competitive factors, including intense price competition; |
| · | | the impact of damage to, or the interruption, failure or compromise of the Company’s information systems due to events including but not limited to aging information systems infrastructure, computer viruses and cyber security breaches; |
| · | | the implementation and operations of business information systems and processes; |
| · | | increased, and possibly inconsistent, domestic and foreign regulations of privacy and data security; |
| · | | restrictive covenants in the Company’s credit facilities could affect its strategic initiatives and liquidity; |
| · | | Ferro’s ability to access capital markets, borrowings or financial transactions; |
| · | | increasingly aggressive domestic and foreign governmental regulation of hazardous and other materials and regulations affecting health, safety and the environment; |
| · | | our ability to address safety, human health, product liability and environmental risks associated with our current and historical products, product life cycles and production processes; |
| · | | exposure to lawsuits, governmental investigations and proceedings relating to current and historical operations and products; |
| · | | sale of products and materials into highly regulated industries; |
| · | | limited or no redundancy for certain of the Company’s manufacturing facilities and possible interruption of operations at those facilities; |
| · | | Ferro’s ability to protect its intellectual property, including trade secrets, or to successfully resolve claims of infringement brought against it; |
| · | | Ferro’s multi-jurisdictional tax structure and its ability to reduce its effective tax rate, including the impact of the Company’s performance on its ability to utilize significant deferred tax assets; |
| · | | the impact of the Tax Cuts and Jobs Act on our business; |
| · | | Ferro’s borrowing costs could be affected adversely by interest rate increases; |
| · | | stringent labor and employment laws and relationships with the Company’s employees; |
| · | | management of Ferro’s general and administrative expenses; |
| · | | the impact of requirements to fund employee benefit costs, especially post-retirement costs; |
| · | | implementation of business processes and information systems, including the outsourcing of functions to third parties; |
| · | | risks associated with the manufacture and sale of material into industries making products for sensitive applications; |
| · | | our ability to attract and retain key personnel; |
Cautionary Note on Forward-Looking Statements (continued)
| · | | changes in U.S. and other governments’ trade policies; |
| · | | risks and uncertainties associated with intangible assets; |
| · | | liens on the Company’s assets by its lenders affect its ability to dispose of property and businesses; |
| · | | amount and timing of any repurchase of Ferro’s common stock; |
| · | | challenges associated with a multi-national company such as Ferro competing lawfully with local competitors in certain regions of the world; |
| · | | the effectiveness of strategies to increase Ferro’s return on invested capital, internal rate of return and other return metrics, and the short-term impact that acquisitions may have on such metrics; and |
| · | | other factors affecting the Company’s business that are beyond its control, including disasters, accidents and governmental actions. |
The risks and uncertainties identified above are not the only risks the Company faces. Additional risks and uncertainties not presently known to the Company or that it currently believes to be immaterial also may adversely affect the Company. Should any known or unknown risks and uncertainties develop into actual events, these developments could have material adverse effects on our business, financial condition and results of operations.
This release contains time-sensitive information that reflects management’s best analysis only as of the date of this release. The Company does not undertake any obligation to publicly update or revise any forward-looking statements to reflect future events, information or circumstances that arise after the date of this release.
Additional information regarding these risks can be found in our Annual Report on Form 10-K for the year ended December 31, 2018.
Ferro Corporation
Investor Contact:
Kevin Cornelius Grant, 216.875.5451
Head of Investor Relations and Corporate Communications
kevincornelius.grant@ferro.com
Media Contact:
Mary Abood, 216.875.5401
Director, Corporate Communications
mary.abood@ferro.com
Table 1
Ferro Corporation and Subsidiaries
Consolidated Statements of Operations
| | | | | | | | | | | | |
(Dollars in thousands, except per share amounts) | | Three Months Ended | | Twelve Months Ended |
| | December 31, (Unaudited) | | December 31, |
| | 2018 | | 2017 | | 2018 | | 2017 |
| | | | | | | | | | | | |
Net sales | | $ | 395,474 | | $ | 377,543 | | $ | 1,612,408 | | $ | 1,396,742 |
Cost of sales | | | 290,359 | | | 272,074 | | | 1,156,475 | | | 980,521 |
Gross profit | | | 105,115 | | | 105,469 | | | 455,933 | | | 416,221 |
Selling, general and administrative expenses | | | 71,006 | | | 77,050 | | | 278,566 | | | 265,418 |
Restructuring and impairment charges | | | 2,860 | | | 3,696 | | | 13,295 | | | 11,409 |
Other expense (income): | | | | | | | | | | | | |
Interest expense | | | 8,656 | | | 7,833 | | | 33,371 | | | 27,754 |
Interest earned | | | (177) | | | (345) | | | (674) | | | (901) |
Foreign currency losses, net | | | 1,133 | | | 979 | | | 8,187 | | | 6,554 |
Loss on extinguishment of debt | | | - | | | - | | | 3,226 | | | 3,905 |
Miscellaneous expense (income), net | | | 16,493 | | | (4,761) | | | 15,970 | | | (8,436) |
Income before income taxes | | | 5,144 | | | 21,017 | | | 103,992 | | | 110,518 |
Income tax expense | | | (6,200) | | | 29,564 | | | 23,046 | | | 52,750 |
Net income (loss) | | | 11,344 | | | (8,547) | | | 80,946 | | | 57,768 |
Less: Net income attributable to noncontrolling interests | | | 368 | | | 139 | | | 853 | | | 714 |
Net income (loss) attributable to Ferro Corporation common shareholders | | $ | 10,976 | | $ | (8,686) | | $ | 80,093 | | $ | 57,054 |
| | | | | | | | | | | | |
Earnings (loss) per share attributable to Ferro Corporation common shareholders: | | | | | | | | | | | | |
Basic earnings (loss) per share | | $ | 0.13 | | $ | (0.10) | | $ | 0.95 | | $ | 0.68 |
Diluted earnings (loss) per share | | $ | 0.13 | | $ | (0.10) | | $ | 0.94 | | $ | 0.67 |
| | | | | | | | | | | | |
Shares outstanding: | | | | | | | | | | | | |
Weighted-average basic shares | | | 83,298 | | | 83,913 | | | 83,940 | | | 83,713 |
Weighted-average diluted shares | | | 84,278 | | | 83,913 | | | 85,085 | | | 85,156 |
End-of-period basic shares | | | 83,002 | | | 84,049 | | | 83,002 | | | 84,049 |
Table 2
Ferro Corporation and Subsidiaries
Segment Net Sales and Gross Profit (unaudited)
| | | | | | | | | | | | |
| | | | | | | | | | | | |
(Dollars in thousands) | | Three Months Ended | | Twelve Months Ended |
| | December 31, | | December 31, |
| | 2018 | | 2017 | | 2018 | | 2017 |
Segment Net Sales | | | | | | | | | | | | |
Performance Coatings | | $ | 179,890 | | $ | 169,480 | | $ | 733,926 | | $ | 594,029 |
Performance Colors and Glass | | | 117,646 | | | 123,920 | | | 487,455 | | | 444,653 |
Color Solutions | | | 97,938 | | | 84,143 | | | 391,027 | | | 358,060 |
Total segment net sales | | $ | 395,474 | | $ | 377,543 | | $ | 1,612,408 | | $ | 1,396,742 |
| | | | | | | | | | | | |
Segment Gross Profit | | | | | | | | | | | | |
Performance Coatings | | $ | 35,389 | | $ | 36,592 | | $ | 165,708 | | $ | 145,797 |
Performance Colors and Glass | | | 38,661 | | | 42,159 | | | 167,446 | | | 157,544 |
Color Solutions | | | 30,988 | | | 26,052 | | | 124,852 | | | 113,694 |
Other costs of sales | | | 77 | | | 666 | | | (2,073) | | | (814) |
Total gross profit | | $ | 105,115 | | $ | 105,469 | | $ | 455,933 | | $ | 416,221 |
| | | | | | | | | | | | |
Selling, general and administrative expenses | | | | | | | | | | | | |
Strategic services | | | 39,115 | | | 39,470 | | | 157,020 | | | 138,551 |
Functional services | | | 25,199 | | | 28,062 | | | 104,629 | | | 102,516 |
Incentive compensation | | | 3,468 | | | 4,649 | | | 8,476 | | | 12,581 |
Stock-based compensation | | | 3,224 | | | 4,869 | | | 8,441 | | | 11,770 |
Total selling, general and administrative expenses | | $ | 71,006 | | $ | 77,050 | | $ | 278,566 | | $ | 265,418 |
| | | | | | | | | | | | |
Table 3
Ferro Corporation and Subsidiaries
Consolidated Balance Sheets
| | | | | | |
| | | | | | |
(Dollars in thousands) | | December 31, | | December 31, |
| | 2018 | | 2017 |
ASSETS | | | | | | |
Current assets | | | | | | |
Cash and cash equivalents | | $ | 104,301 | | $ | 63,551 |
Accounts receivable, net | | | 306,882 | | | 354,416 |
Inventories | | | 356,998 | | | 324,180 |
Other receivables | | | 91,143 | | | 67,137 |
Other current assets | | | 23,960 | | | 16,448 |
Total current assets | | | 883,284 | | | 825,732 |
Other assets | | | | | | |
Property, plant and equipment, net | | | 381,341 | | | 321,742 |
Goodwill | | | 216,464 | | | 195,369 |
Intangible assets, net | | | 184,953 | | | 187,616 |
Deferred income taxes | | | 103,488 | | | 108,025 |
Other non-current assets | | | 42,930 | | | 43,718 |
Total assets | | $ | 1,812,460 | | $ | 1,682,202 |
| | | | | | |
LIABILITIES AND EQUITY | | | | | | |
Current liabilities | | | | | | |
Loans payable and current portion of long-term debt | | $ | 10,260 | | $ | 25,136 |
Accounts payable | | | 256,573 | | | 211,711 |
Accrued payrolls | | | 39,989 | | | 48,201 |
Accrued expenses and other current liabilities | | | 77,995 | | | 70,151 |
Total current liabilities | | | 384,817 | | | 355,199 |
Other liabilities | | | | | | |
Long-term debt, less current portion | | | 811,137 | | | 726,491 |
Postretirement and pension liabilities | | | 173,046 | | | 166,680 |
Other non-current liabilities | | | 57,611 | | | 77,152 |
Total liabilities | | | 1,426,611 | | | 1,325,522 |
Equity | | | | | | |
Total Ferro Corporation shareholders’ equity | | | 376,631 | | | 344,814 |
Noncontrolling interests | | | 9,218 | | | 11,866 |
Total liabilities and equity | | $ | 1,812,460 | | $ | 1,682,202 |
Table 4
Ferro Corporation and Subsidiaries
Condensed Consolidated Statements of Cash Flows
| | | | | | | | | | | | |
(Dollars in thousands) | | Three Months Ended | | Twelve Months Ended |
| | December 31, (Unaudited) | | December 31, |
| | 2018 | | 2017 | | 2018 | | 2017 |
Cash flows from operating activities | | | | | | | | | | | | |
Net income (loss) | | $ | 11,344 | | $ | (8,547) | | $ | 80,946 | | $ | 57,768 |
(Gain) loss on sale of assets | | | (321) | | | 362 | | | 164 | | | (852) |
Depreciation and amortization | | | 13,736 | | | 14,045 | | | 53,974 | | | 50,085 |
Interest amortization | | | 893 | | | 1,121 | | | 3,577 | | | 3,496 |
Restructuring and impairment charges | | | (193) | | | 3,964 | | | 4,084 | | | 7,593 |
Loss on extinguishment of debt | | | — | | | — | | | 3,226 | | | 3,905 |
Accounts receivable | | | 56,324 | | | 19,100 | | | 19,885 | | | (25,852) |
Inventories | | | 24,911 | | | (15,583) | | | (33,922) | | | (46,962) |
Accounts payable | | | 24,784 | | | 25,569 | | | 35,887 | | | 26,150 |
Other current assets and liabilities, net | | | 16,051 | | | (17,842) | | | (1,280) | | | (29,497) |
Other adjustments, net | | | (422) | | | 27,910 | | | 16,252 | | | 38,956 |
Net cash provided by operating activities | | | 147,107 | | | 50,099 | | | 182,793 | | | 84,790 |
| | | | | | | | | | | | |
Cash flows from investing activities | | | | | | | | | | | | |
Capital expenditures for property, plant and equipment and other long-lived assets | | | (16,465) | | | (20,418) | | | (80,619) | | | (50,552) |
Proceeds from sale of equity method investment | | | — | | | — | | | — | | | 2,268 |
Collections of financing receivables | | | 7,020 | | | — | | | 7,020 | | | — |
Business acquisitions, net of cash acquired | | | (27,152) | | | (59,264) | | | (74,954) | | | (131,194) |
Other investing activities | | | — | | | 16 | | | 37 | | | 567 |
Net cash (used in) investing activities | | | (36,597) | | | (79,666) | | | (148,516) | | | (178,911) |
| | | | | | | | | | | | |
Cash flows from financing activities | | | | | | | | | | | | |
Net (repayments) under loan payable | | | (1,895) | | | (8,831) | | | (19,077) | | | (19,634) |
Proceeds from revolving credit facility - 2014 Credit Facility | | | — | | | — | | | — | | | 15,628 |
Principal payments on revolving credit facility - 2014 Credit Facility | | | — | | | — | | | — | | | (327,183) |
Proceeds from term loan facility - Credit Facility | | | — | | | — | | | — | | | 623,827 |
Principal payments on term loan facility - 2014 Credit Facility | | | — | | | — | | | — | | | (243,250) |
Principal payments on term loan facility - Credit Facility | | | — | | | (1,640) | | | (304,060) | | | (4,872) |
Principal payments on term loan facility - Amended Credit Facility | | | (2,050) | | | — | | | (6,150) | | | — |
Proceeds from term loan facility - Amended Credit Facility | | | — | | | — | | | 466,075 | | | — |
Proceeds from revolving credit facility - Credit Facility | | | — | | | 110,818 | | | 134,950 | | | 180,605 |
Principal payments on revolving credit facility - Credit Facility | | | — | | | (60,205) | | | (212,950) | | | (102,605) |
Proceeds from revolving credit facility - Amended Credit Facility | | | 72,012 | | | — | | | 240,035 | | | — |
Principal payments on revolving credit facility - Amended Credit Facility | | | (183,945) | | | — | | | (240,035) | | | — |
Principal payments on other long-term debt | | | — | | | (993) | | | — | | | (3,971) |
Proceeds from other long-term debt | | | — | | | — | | | — | | | 2,700 |
Payment of debt issuance costs | | | — | | | — | | | (3,466) | | | (12,927) |
Acquisition related contingent consideration payment | | | — | | | — | | | (9,464) | | | (1,315) |
Purchase of treasury stock | | | (11,808) | | | — | | | (28,807) | | | — |
Other financing activities | | | (4,168) | | | 1,178 | | | (7,684) | | | 1,360 |
Net cash (used in) provided by financing activities | | | (131,854) | | | 40,327 | | | 9,367 | | | 108,363 |
Effect of exchange rate changes on cash and cash equivalents | | | (633) | | | 580 | | | (2,894) | | | 3,727 |
(Decrease) increase in cash and cash equivalents | | | (21,977) | | | 11,340 | | | 40,750 | | | 17,969 |
Cash and cash equivalents at beginning of period | | | 126,278 | | | 52,211 | | | 63,551 | | | 45,582 |
Cash and cash equivalents at end of period | | $ | 104,301 | | $ | 63,551 | | $ | 104,301 | | $ | 63,551 |
| | | | | | | | | | | | |
Cash paid during the period for: | | | | | | | | | | | | |
Interest | | $ | 9,053 | | $ | 6,256 | | $ | 33,910 | | $ | 26,850 |
Income taxes | | $ | 19,212 | | $ | 9,043 | | $ | 36,789 | | $ | 25,662 |
Table 5
Ferro Corporation and Subsidiaries
Supplemental Information
Reconciliation of Reported Income to Adjusted Income
For the Three Months Ended December 31 (unaudited)
| | | | | | | | | | | | | | | | | | | | | |
| | | | | | | | | | | | | | | | | | | | | |
| | | | | | | | | | | | | | | | | | | | | |
(Dollars in thousands, except per share amounts) | | | Cost of sales | | | Selling general and administrative expenses | | | Restructuring and impairment charges | | | Other expense, net | | | Income tax expense5 | | | Net income (loss) attributable to common shareholders | | | Diluted earnings (loss) per share |
| | | | | | | | | | | | | | | | | | | | | |
| | 2018 |
| | | | | | | | | | | | | | | | | | | | | |
As reported | | $ | 290,359 | | $ | 71,006 | | $ | 2,860 | | $ | 26,105 | | $ | (6,200) | | $ | 10,976 | | $ | 0.13 |
Adjustments: | | | | | | | | | | | | | | | | | | | | | |
Restructuring | | | — | | | — | | | (2,860) | | | — | | | — | | | 2,860 | | | 0.03 |
Pension1 | | | — | | | — | | | — | | | (18,300) | | | — | | | 18,300 | | | 0.22 |
Acquisition related costs2 | | | (1,794) | | | (1,731) | | | — | | | 2,143 | | | — | | | 1,382 | | | 0.02 |
Costs related to optimization projects | | | (1,863) | | | (2,617) | | | — | | | — | | | — | | | 4,480 | | | 0.05 |
Costs related to divested businesses and assets | | | — | | | (286) | | | | | | (1,946) | | | — | | | 2,232 | | | 0.03 |
Other4 | | | — | | | — | | | — | | | 492 | | | — | | | (492) | | | (0.01) |
Tax on adjustments | | | — | | | — | | | — | | | — | | | 11,781 | | | (11,781) | | | (0.14) |
Total adjustments6 | | | (3,657) | | | (4,634) | | | (2,860) | | | (17,611) | | | 11,781 | | | 16,981 | | | 0.20 |
As adjusted | | $ | 286,702 | | $ | 66,372 | | $ | — | | $ | 8,494 | | $ | 5,581 | | $ | 27,957 | | $ | 0.33 |
| | | | | | | | | | | | | | | | | | | | | |
| | | | | | | | | | | | | | | | | | | | | |
| | 2017 |
| | | | | | | | | | | | | | | | | | | | | |
As reported | | $ | 272,074 | | $ | 77,050 | | $ | 3,696 | | $ | 3,706 | | $ | 29,564 | | $ | (8,686) | | $ | (0.10) |
Adjustments: | | | | | | | | | | | | | | | | | | | | | |
Restructuring | | | — | | | — | | | (3,696) | | | — | | | — | | | 3,696 | | | 0.04 |
Pension1 | | | — | | | — | | | — | | | 3,852 | | | — | | | (3,852) | | | (0.05) |
Acquisition related costs3 | | | (2,191) | | | (5,099) | | | — | | | (254) | | | — | | | 7,544 | | | 0.09 |
Costs related to optimization projects | | | (950) | | | (1,511) | | | — | | | — | | | — | | | 2,461 | | | 0.03 |
Costs related to divested businesses and assets | | | — | | | (544) | | | — | | | (155) | | | — | | | 699 | | | 0.01 |
Tax on adjustments | | | — | | | — | | | — | | | — | | | (22,702) | | | 22,702 | | | 0.27 |
Total adjustments6 | | | (3,141) | | | (7,154) | | | (3,696) | | | 3,443 | | | (22,702) | | | 33,250 | | | 0.39 |
As adjusted | | $ | 268,933 | | $ | 69,896 | | $ | — | | $ | 7,149 | | $ | 6,862 | | $ | 24,564 | | $ | 0.29 |
| (1) | | The adjustments relate to pension and other postretirement benefit mark-to-market adjustments and settlements. |
| (2) | | The adjustments to “Cost of Sales” primarily include the amortization of purchase accounting adjustments related to our recent acquisitions. The adjustments to “Selling, general and administrative expenses” primarily include legal, professional and other expenses related to acquisition costs. The adjustments to “Other expense, net” primarily relate to earn out adjustments related to acquisitions that are beyond the measurement period. |
| (3) | | The adjustments to “Cost of Sales” primarily include the amortization of purchase accounting adjustments related to our recent acquisitions. The adjustments to “Selling, general and administrative expenses” primarily include legal, professional and other expenses related to acquisition costs. The adjustments to “Other expense, net” primarily relate other costs required to complete the acquisition of Endeka. |
| (4) | | The adjustments to “Other expense, net” primarily related to a gain on asset sales. |
| (5) | | Income tax expense reflects the reported expense, adjusted for adjustments being tax effected at the respective statutory rate where the item originated, as well as the impacts associated with the Tax Cuts and Jobs Act that were recorded in 2018 and 2017 and the impact associated with a rate change in Colombia. |
| (6) | | Due to rounding, total earnings per share related to adjustments does not always add to the total adjusted earnings per share. |
It should be noted that adjusted net income, earnings per share and other adjusted items referred to above are financial measures not required by, or presented in accordance with, accounting principles generally accepted in the United States (U.S. GAAP). These Non-GAAP financial measures should be considered as a supplement to, and not as a substitute for, the financial measures prepared in accordance with U.S. GAAP, and a reconciliation of these financial measures to the most comparable U.S. GAAP financial measures is presented. We believe this data provides investors with additional useful information on the underlying operations and trends of the business and enables period-to-period comparability of financial performance.
Table 6
Ferro Corporation and Subsidiaries
Supplemental Information
Reconciliation of Reported Income to Adjusted Income
For the Twelve Months Ended December 31 (unaudited)
| | | | | | | | | | | | | | | | | | | | | |
| | | | | | | | | | | | | | | | | | | | | |
(Dollars in thousands, except per share amounts) | | | Cost of sales | | | Selling general and administrative expenses | | | Restructuring and impairment charges | | | Other expense, net | | | Income tax expense6 | | | Net income attributable to common shareholders | | | Diluted earnings per share |
| | | | | | | | | | | | | | | | | | | | | |
| | 2018 |
| | | | | | | | | | | | | | | | | | | | | |
As reported | | $ | 1,156,475 | | $ | 278,566 | | $ | 13,295 | | $ | 60,080 | | $ | 23,046 | | $ | 80,093 | | $ | 0.94 |
Adjustments: | | | | | | | | | | | | | | | | | | | | | |
Restructuring | | | — | | | — | | | (13,295) | | | — | | | — | | | 13,295 | | | 0.16 |
Pension1 | | | — | | | — | | | — | | | (18,300) | | | — | | | 18,300 | | | 0.22 |
Acquisition related costs2 | | | (3,535) | | | (13,210) | | | — | | | 1,289 | | | — | | | 15,456 | | | 0.18 |
Costs related to optimization projects | | | (2,812) | | | (7,491) | | | — | | | — | | | — | | | 10,303 | | | 0.12 |
Costs related to divested businesses and assets | | | — | | | (670) | | | — | | | (2,234) | | | — | | | 2,904 | | | 0.03 |
Other4 | | | — | | | — | | | — | | | (2,056) | | | — | | | 2,056 | | | 0.02 |
Tax on adjustments | | | — | | | — | | | — | | | — | | | 14,643 | | | (14,643) | | | (0.17) |
Total adjustments7 | | | (6,347) | | | (21,371) | | | (13,295) | | | (21,301) | | | 14,643 | | | 47,671 | | | 0.56 |
As adjusted | | $ | 1,150,128 | | $ | 257,195 | | $ | — | | $ | 38,779 | | $ | 37,689 | | $ | 127,764 | | $ | 1.50 |
| | | | | | | | | | | | | | | | | | | | | |
| | | | | | | | | | | | | | | | | | | | | |
| | 2017 |
| | | | | | | | | | | | | | | | | | | | | |
As reported | | $ | 980,521 | | $ | 265,418 | | $ | 11,409 | | $ | 28,876 | | $ | 52,750 | | $ | 57,054 | | $ | 0.67 |
Adjustments: | | | | | | | | | | | | | | | | | | | | | |
Restructuring | | | — | | | — | | | (11,409) | | | — | | | — | | | 11,409 | | | 0.13 |
Pension1 | | | — | | | — | | | — | | | 3,852 | | | — | | | (3,852) | | | (0.05) |
Acquisition related costs3 | | | (7,508) | | | (16,359) | | | — | | | (1,975) | | | — | | | 25,842 | | | 0.30 |
Costs related to optimization projects | | | (1,196) | | | (2,528) | | | — | | | — | | | — | | | 3,724 | | | 0.04 |
Costs related to divested businesses and assets | | | (70) | | | (2,693) | | | — | | | 3,953 | | | — | | | (1,190) | | | (0.01) |
Other5 | | | — | | | — | | | — | | | (5,448) | | | — | | | 5,448 | | | 0.06 |
Tax on adjustments | | | — | | | — | | | — | | | — | | | (11,780) | | | 11,780 | | | 0.14 |
Total adjustments7 | | | (8,774) | | | (21,580) | | | (11,409) | | | 382 | | | (11,780) | | | 53,161 | | | 0.62 |
As adjusted | | $ | 971,747 | | $ | 243,838 | | $ | — | | $ | 29,258 | | $ | 40,970 | | $ | 110,215 | | $ | 1.29 |
| (1) | | The adjustments relate to pension and other postretirement benefit mark-to-market adjustments and settlements. |
| (2) | | The adjustments to “Cost of Sales” primarily include the amortization of purchase accounting adjustments related to our recent acquisitions. The adjustments to “Selling, general and administrative expenses” primarily include legal, professional and other expenses related to acquisition costs. The adjustments to “Other expense, net” primarily relate to earn out adjustments related to acquisitions that are beyond the measurement period. |
| (3) | | The adjustments to “Cost of Sales” primarily include the amortization of purchase accounting adjustments related to our recent acquisitions. The adjustments to “Selling, general and administrative expenses” primarily include legal, professional and other expenses related to acquisition costs. The adjustments to “Other expense, net” primarily relate to earn out adjustments related to acquisitions that are beyond the measurement period and other costs required to complete the acquisition of Endeka. |
| (4) | | The adjustments to “Other expense, net” primarily relate to impacts of currency related items in Argentina, debt extinguishment charges, fees expensed associated with the Amended Credit Facility and a gain recognized on increasing our ownership interest in FMU. |
| (5) | | The adjustments to “Other expense, net” primarily relate to the foreign exchange loss incurred on our Euro-denominated term loan, an impairment on an equity method investment, gains and losses on asset sales, debt extinguishment charges, and the gain recognized on increasing our ownership interest in Gardenia. |
| (6) | | Income tax expense reflects the reported expense, adjusted for adjustments being tax effected at the respective statutory rate where the item originated, as well as the impacts associated with the Tax Cuts and Jobs Act that were recorded in 2018 and 2017 and the impact associated with a rate change in Colombia. |
| (7) | | Due to rounding, total earnings per share related to adjustments does not always add to the total adjusted earnings per share. |
It should be noted that adjusted net income, earnings per share and other adjusted items referred to above are financial measures not required by, or presented in accordance with, accounting principles generally accepted in the United States (U.S. GAAP). These Non-GAAP financial measures should be considered as a supplement to, and not as a substitute for, the financial measures prepared in accordance with U.S. GAAP, and a reconciliation of these financial measures to the most comparable U.S. GAAP financial measures is presented. We believe this data provides investors with additional useful information on the underlying operations and trends of the business and enables period-to-period comparability of financial performance.
Table 7
Ferro Corporation and Subsidiaries
Supplemental Information
Constant Currency Schedule of Adjusted Operating Profit (unaudited)
| | | | | | | | | | | | |
| | Three Months Ended |
(Dollars in thousands) | | December 31, |
| | 2017 | | Adjusted 20171 | | 2018 | | 2018 vs Adjusted 2017 |
Segment net sales | | | | | | | | | | | | |
Performance Coatings | | $ | 169,480 | | $ | 159,512 | | $ | 179,890 | | $ | 20,378 |
Performance Colors and Glass | | | 123,920 | | | 120,968 | | | 117,646 | | | (3,322) |
Color Solutions | | | 84,143 | | | 82,007 | | | 97,938 | | | 15,931 |
Total segment net sales | | $ | 377,543 | | $ | 362,487 | | $ | 395,474 | | $ | 32,987 |
| | | | | | | | | | | | |
Segment adjusted gross profit | | | | | | | | | | | | |
Performance Coatings | | $ | 38,688 | | $ | 36,875 | | $ | 36,519 | | $ | (356) |
Performance Colors and Glass | | | 42,699 | | | 41,676 | | | 38,713 | | | (2,963) |
Color Solutions | | | 26,150 | | | 25,540 | | | 33,352 | | | 7,812 |
Other costs of sales | | | 1,073 | | | 1,047 | | | 188 | | | (859) |
Total adjusted gross profit2 | | $ | 108,610 | | $ | 105,138 | | $ | 108,772 | | $ | 3,634 |
Adjusted gross profit percentage | | | | | | 29.0% | | | 27.5% | | | |
| | | | | | | | | | | | |
Adjusted selling, general and administrative expenses | | | | | | | | | | | | |
Strategic services | | | 39,298 | | | 37,046 | | | 38,720 | | | 1,674 |
Functional services | | | 21,080 | | | 21,282 | | | 20,960 | | | (322) |
Incentive compensation | | | 4,649 | | | 4,555 | | | 3,468 | | | (1,087) |
Stock-based compensation | | | 4,869 | | | 4,869 | | | 3,224 | | | (1,645) |
Total adjusted selling, general and administrative expenses3 | | $ | 69,896 | | $ | 67,752 | | $ | 66,372 | | $ | (1,380) |
| | | | | | | | | | | | |
Adjusted operating profit | | $ | 38,714 | | $ | 37,386 | | $ | 42,400 | | $ | 5,014 |
Adjusted operating profit as a % of net sales | | | 10.3% | | | 10.3% | | | 10.7% | | | |
| (1) | | Reflects the remeasurement of 2017 reported and adjusted local currency results using 2018 exchange rates, resulting in constant currency comparative figures to 2018 reported and adjusted results. See Table 5 for Non-GAAP adjustments applicable to the three month period. |
| (2) | | Refer to Table 5 for the reconciliation of adjusted gross profit for the three months ended December 31, 2018 and 2017, respectively. |
| (3) | | Refer to Table 5 for the reconciliation of adjusted SG&A expenses for the three months ended December 31, 2018 and 2017, respectively. |
It should be noted that adjusted net sales, gross profit, SG&A expenses, and operating profit are financial measures not required by, or presented in accordance with, accounting principles generally accepted in the United States (U.S. GAAP). These Non-GAAP financial measures should be considered as a supplement to, and not as a substitute for, the financial measures prepared in accordance with U.S. GAAP and a reconciliation of these financial measures to the most comparable U.S. GAAP financial measures are presented within this table, as well as Table 5. We believe this data provides investors with additional useful information on the underlying operations and trends of the business and enables period-to-period comparability of financial performance.
Table 8
Ferro Corporation and Subsidiaries
Supplemental Information
Constant Currency Schedule of Adjusted Operating Profit (unaudited)
| | | | | | | | | | | | |
| | Twelve Months Ended |
(Dollars in thousands) | | December 31, |
| | 2017 | | Adjusted 20171 | | 2018 | | 2018 vs Adjusted 2017 |
Segment net sales | | | | | | | | | | | | |
Performance Coatings | | $ | 594,029 | | $ | 589,713 | | $ | 733,926 | | $ | 144,213 |
Performance Colors and Glass | | | 444,653 | | | 450,938 | | | 487,455 | | | 36,517 |
Color Solutions | | | 358,060 | | | 362,700 | | | 391,027 | | | 28,327 |
Total segment net sales | | $ | 1,396,742 | | $ | 1,403,351 | | $ | 1,612,408 | | $ | 209,057 |
| | | | | | | | | | | | |
Segment adjusted gross profit | | | | | | | | | | | | |
Performance Coatings | | $ | 148,932 | | $ | 150,538 | | $ | 166,705 | | $ | 16,167 |
Performance Colors and Glass | | | 159,622 | | | 161,918 | | | 167,502 | | | 5,584 |
Color Solutions | | | 116,456 | | | 117,724 | | | 129,013 | | | 11,289 |
Other costs of sales | | | (15) | | | 87 | | | (940) | | | (1,027) |
Total adjusted gross profit2 | | $ | 424,995 | | $ | 430,267 | | $ | 462,280 | | $ | 32,013 |
Adjusted gross profit percentage | | | | | | 30.7% | | | 28.7% | | | |
| | | | | | | | | | | | |
Adjusted selling, general and administrative expenses | | | | | | | | | | | | |
Strategic services | | | 137,272 | | | 138,591 | | | 155,713 | | | 17,122 |
Functional services | | | 82,215 | | | 82,108 | | | 84,572 | | | 2,464 |
Incentive compensation | | | 12,581 | | | 12,654 | | | 8,469 | | | (4,185) |
Stock-based compensation | | | 11,770 | | | 11,770 | | | 8,441 | | | (3,329) |
Total adjusted selling, general and administrative expenses3 | | $ | 243,838 | | $ | 245,123 | | $ | 257,195 | | $ | 12,072 |
| | | | | | | | | | | | |
Adjusted operating profit | | $ | 181,157 | | $ | 185,144 | | $ | 205,085 | | $ | 19,941 |
Adjusted operating profit as a % of net sales | | | 13.0% | | | 13.2% | | | 12.7% | | | |
| (1) | | Reflects the remeasurement of 2017 reported and adjusted local currency results using 2018 exchange rates, resulting in constant currency comparative figures to 2018 reported and adjusted results. See Table 6 for Non-GAAP adjustments applicable to the twelve month period. |
| (2) | | Refer to Table 6 for the reconciliation of adjusted gross profit for the twelve months ended December 31, 2018 and 2017, respectively. |
| (3) | | Refer to Table 6 for the reconciliation of adjusted SG&A expenses for the twelve months ended December 31, 2018 and 2017, respectively. |
It should be noted that adjusted net sales, gross profit, SG&A expenses, and operating profit are financial measures not required by, or presented in accordance with, accounting principles generally accepted in the United States (U.S. GAAP). These Non-GAAP financial measures should be considered as a supplement to, and not as a substitute for, the financial measures prepared in accordance with U.S. GAAP and a reconciliation of these financial measures to the most comparable U.S. GAAP financial measures are presented within this table, as well as Table 6. We believe this data provides investors with additional useful information on the underlying operations and trends of the business and enables period-to-period comparability of financial performance.
Table 9
Ferro Corporation and Subsidiaries
Supplemental Information
Reconciliation of Net income (loss) attributable to Ferro Corporation
common shareholders to Adjusted EBITDA (unaudited)
| | | | | | | | | | | | | | | | |
| | | | | | | | | | | | | | | | |
(Dollars in thousands) | | Three Months Ended | | Twelve Months Ended |
| | December 31, | | December 31, |
| | 2018 | | 2017 | | 2018 | | 2017 |
| | | | | | | | | | | | | | | | |
Net income (loss) attributable to Ferro Corporation common shareholders | | $ | 10,976 | | | $ | (8,686) | | | $ | 80,093 | | | $ | 57,054 | |
Less: Net income attributable to noncontrolling interests | | | 368 | | | | 139 | | | | 853 | | | | 714 | |
Restructuring and impairment charges | | | 2,860 | | | | 3,696 | | | | 13,295 | | | | 11,409 | |
Other expense (income), net | | | 17,449 | | | | (4,127) | | | | 26,709 | | | | 1,122 | |
Interest expense | | | 8,656 | | | | 7,833 | | | | 33,371 | | | | 27,754 | |
Income tax expense | | | (6,200) | | | | 29,564 | | | | 23,046 | | | | 52,750 | |
Depreciation and amortization | | | 14,629 | | | | 15,166 | | | | 57,551 | | | | 53,581 | |
Less: interest amortization expense and other | | | (893) | | | | (1,121) | | | | (3,577) | | | | (3,496) | |
Cost of sales adjustments1 | | | 3,657 | | | | 3,141 | | | | 6,347 | | | | 8,774 | |
SG&A adjustments1 | | | 4,634 | | | | 7,154 | | | | 21,371 | | | | 21,580 | |
Adjusted EBITDA | | $ | 56,136 | | | $ | 52,759 | | | $ | 259,059 | | | $ | 231,242 | |
| | | | | | | | | | | | | | | | |
Net sales | | $ | 395,474 | | | $ | 377,543 | | | $ | 1,612,408 | | | $ | 1,396,742 | |
Adjusted EBITDA as a % of net sales | | | 14.2 | % | | | 14.0 | % | | | 16.1 | % | | | 16.6 | % |
| (1) | | For details of Non-GAAP adjustments, refer to Table 5 and Table 6 for the reconciliation of adjusted cost of sales and adjusted SG&A for the three and twelve months ended December 31, 2018 and 2017, respectively. |
It should be noted that adjusted EBITDA is a financial measure not required by, or presented in accordance with, accounting principles generally accepted in the United States (U.S. GAAP). This Non-GAAP financial measure should be considered as a supplement to, and not as a substitute for, the financial measures prepared in accordance with U.S. GAAP and a reconciliation of this financial measure to the most comparable U.S. GAAP financial measure is presented. We believe this data provides investors with additional useful information on the underlying operations and trends of the business and enables period-to-period comparability of financial performance.
Table 10
Ferro Corporation and Subsidiaries
Supplemental Information
Change in Net Debt (unaudited)
| | | | | | | | | | | | |
(Dollars in thousands) | | Three Months Ended | | Twelve Months Ended |
| | December 31, | | December 31, |
| | 2018 | | 2017 | | 2018 | | 2017 |
Beginning of period | | | | | | | | | | | | |
Gross debt | | $ | 938,340 | | $ | 699,684 | | $ | 759,078 | | $ | 578,205 |
Cash | | | 126,278 | | | 52,211 | | | 63,551 | | | 45,582 |
Debt, net of cash | | | 812,062 | | | 647,473 | | | 695,527 | | | 532,623 |
| | | | | | | | | | | | |
Unamortized debt issuance costs | | | 5,063 | | | 7,743 | | | 7,451 | | | 3,720 |
Debt, net of cash and unamortized debt issuance costs | | | 806,999 | | | 639,730 | | | 688,076 | | | 528,903 |
| | | | | | | | | | | | |
End of period | | | | | | | | | | | | |
Gross debt | | | 826,224 | | | 759,078 | | | 826,224 | | | 759,078 |
Cash | | | 104,301 | | | 63,551 | | | 104,301 | | | 63,551 |
Debt, net of cash | | | 721,923 | | | 695,527 | | | 721,923 | | | 695,527 |
| | | | | | | | | | | | |
Unamortized debt issuance costs | | | 4,827 | | | 7,451 | | | 4,827 | | | 7,451 |
Debt, net of cash and unamortized debt issuance costs | | | 717,096 | | | 688,076 | | | 717,096 | | | 688,076 |
| | | | | | | | | | | | |
Change from FX on Euro term loan | | | - | | | (5,005) | | | (5,657) | | | (33,883) |
Unamortized debt issuance costs | | | (236) | | | (292) | | | (2,624) | | | 3,731 |
FX on cash | | | (633) | | | 580 | | | (2,894) | | | 3,727 |
Assumption of debt from acquisitions | | | (6,014) | | | (15,431) | | | (6,014) | | | (23,406) |
| | | | | | | | | | | | |
Period decrease (increase) in debt, net of cash, unamortized debt issuance costs, FX, and assumption of debt from acquisitions | | $ | 96,786 | | $ | (28,198) | | $ | (11,831) | | $ | (109,342) |
| | | | | | | | | | | | |
Period decrease (increase) in debt, net of cash and unamortized debt issuance costs | | $ | 89,903 | | $ | (48,346) | | $ | (29,020) | | $ | (159,173) |
It should be noted that the change in net debt is a financial measure not required by, or presented in accordance with, accounting principles generally accepted in the United States (U.S. GAAP). This Non-GAAP financial measure should be considered as a supplement to, and not as a substitute for, the financial measures prepared in accordance with U.S. GAAP and a reconciliation of this financial measure to the most comparable U.S. GAAP financial measure is presented. We believe this data provides investors with additional useful information on the underlying operations and trends of the business and enables period-to-period comparability of financial performance.
Table 11
Ferro Corporation and Subsidiaries
Supplemental Information
Reconciliation of Net Cash Provided by Operating Activities (GAAP) to
Adjusted Free Cash Flow from Continuing Operations (Non-GAAP) (unaudited)
| | | | | | | | | | | | |
(Dollars in thousands) | | Three Months Ended December 31 | | Twelve Months Ended December 31 |
| | 2018 | | 2017 | | 2018 | | 2017 |
Cash flows from operating activities | | | | | | | | | | | | |
Net income (loss) | | $ | 11,344 | | $ | (8,547) | | $ | 80,946 | | $ | 57,768 |
(Gain) loss on sale of assets | | | (321) | | | 362 | | | 164 | | | (852) |
Depreciation and amortization | | | 13,736 | | | 14,045 | | | 53,974 | | | 50,085 |
Interest amortization | | | 893 | | | 1,121 | | | 3,577 | | | 3,496 |
Restructuring and impairment charges | | | (193) | | | 3,964 | | | 4,084 | | | 7,593 |
Loss on extinguishment of debt | | | - | | | - | | | 3,226 | | | 3,905 |
Accounts receivable | | | 56,324 | | | 19,100 | | | 19,885 | | | (25,852) |
Inventories | | | 24,911 | | | (15,583) | | | (33,922) | | | (46,962) |
Accounts payable | | | 24,784 | | | 25,569 | | | 35,887 | | | 26,150 |
Other current assets and liabilities, net | | | 16,051 | | | (17,842) | | | (1,280) | | | (29,497) |
Other adjustments, net | | | (422) | | | 27,910 | | | 16,252 | | | 38,956 |
Net cash provided by operating activities (GAAP) | | $ | 147,107 | | $ | 50,099 | | $ | 182,793 | | $ | 84,790 |
Less: Capital Expenditures | | | (16,465) | | | (20,418) | | | (80,619) | | | (50,552) |
Plus: Cash (remitted) collected for AR securitization | | | 7,020 | | | - | | | 7,020 | | | - |
Free Cash Flow provided by Continuing Operations (Non-GAAP) | | | 137,662 | | | 29,681 | | | 109,194 | | | 34,238 |
Plus: cash used for restructuring | | | 3,053 | | | (268) | | | 9,211 | | | 3,816 |
Plus: cash used for capital expenditures related to optimization projects(1) | | | 9,227 | | | 8,428 | | | 41,014 | | | 16,303 |
Plus: Cash used for net working capital investment related to optimization projects(2) | | | 3,001 | | | 6,994 | | | 8,424 | | | 8,128 |
Plus: Cash used for acquisition related professional fees(3) | | | 1,330 | | | 8,905 | | | 11,627 | | | 18,702 |
Plus: Cash used for optimization projects(3) | | | 3,172 | | | 1,265 | | | 8,995 | | | 2,528 |
Plus: Cash used for divested businesses and assets(3) | | | 286 | | | 544 | | | 670 | | | 2,693 |
Adjusted Free Cash Flow from Continuing Operations (Non-GAAP) | | | 157,731 | | | 55,549 | | | 189,135 | | | 86,408 |
| | | | | | | | | | | | |
Net Income (Loss) Attributable to Ferro Corporation Common Shareholders | | | 10,976 | | | (8,686) | | | 80,093 | | | 57,054 |
| | | | | | | | | | | | |
Net Cash Provided by Operating Activities Conversion of Net Income (Loss) Attributable to Ferro Corporation Common Shareholders | | | 1340.3% | | | -576.8% | | | 228.2% | | | 148.6% |
| | | | | | | | | | | | |
Adjusted EBITDA (Non-GAAP) - From Table 9 | | | 56,136 | | | 52,759 | | | 259,059 | | | 231,242 |
| | | | | | | | | | | | |
Adjusted Free Cash Flow Conversion of Adjusted EBITDA from Continuing Operations (Non-GAAP) | | | 281.0% | | | 105.3% | | | 73.0% | | | 37.4% |
Adjusted Free Cash Flow Conversion of Adjusted EBITDA from Continuing Operations, adjusted for AR Securitization impact (Non-GAAP)(4) | | | 178.9% | | | 105.3% | | | 50.9% | | | 37.4% |
| (1) | | The adjustment to capital expenditures represents capital spend for certain optimization projects that are not expected to recur in the long-term at the current rate. See Table 10 for the reconciliation of period change in debt, net of cash, unamortized debt issuance costs, FX, and assumption of debt from acquisitions. |
| (2) | | The adjustment to net working capital represents spend for the build in inventory related to the optimization project noted in (1) above. This build in inventory is considered to be outside of the normal operations of the underlying business, and expected to be temporary in nature. |
| (3) | | The adjustment represents those cash outlays for (a) acquisition related professional fees, (b) costs related to certain optimization projects, and (c) costs related to divested businesses and assets, as detailed in the description of Non-GAAP adjustments in Table 5 and Table 6 for the three and twelve months ended December 31, 2018 and 2017, respectively. |
| (4) | | Adjusted free cash flow conversation of adjusted EBITDA from continuing operations adjusted for the cash proceeds from the AR Securitization of $57.3 million. |
It should be noted that adjusted free cash flow from continuing operations is a financial measure not required by, or presented in accordance with, accounting principles generally accepted in the United States (U.S. GAAP). The Non-GAAP financial measure should be considered as a supplement to, and not as a substitute for, the financial measures prepared in accordance with U.S. GAAP and a reconciliation of these financial measures to the most comparable U.S. GAAP financial measures is presented. We believe this data provides investors with additional useful information on the underlying operations and trends of the business and enables period-to-period comparability of financial performance. Additionally, certain elements of these measures are used in the calculation of certain incentive compensation programs for management.
Table 12
Ferro Corporation and Subsidiaries
Supplemental Information
Reconciliation of Net Sales and Gross Profit (GAAP) to
Adjusted Net Sales and Gross Profit (Non-GAAP) (unaudited)
| | | | | | |
(Dollars in thousands) | | | Net Sales | | | Gross Profit |
| | 2018 |
As Reported (GAAP) | | $ | 1,612,408 | | $ | 455,933 |
Non-GAAP Adjustments1 | | | - | | | 6,347 |
Constant Currency FX Impact2 | | | - | | | - |
As Adjusted from Continuing Operations (Non-GAAP measure) | | $ | 1,612,408 | | $ | 462,280 |
| | | | | | |
| | 2017 |
As Reported (GAAP) | | $ | 1,396,742 | | $ | 416,221 |
Non-GAAP Adjustments1 | | | - | | | 8,774 |
Constant Currency FX Impact2 | | | 6,609 | | | 5,272 |
As Adjusted from Continuing Operations (Non-GAAP measure) | | $ | 1,403,351 | | $ | 430,267 |
| | | | | | |
| | 2016 |
As Reported (GAAP) | | $ | 1,145,292 | | $ | 356,378 |
Non-GAAP Adjustments1 | | | - | | | 3,792 |
Constant Currency FX Impact2 | | | (11,049) | | | 1,556 |
As Adjusted from Continuing Operations (Non-GAAP measure) | | $ | 1,134,243 | | $ | 361,726 |
| | | | | | |
| | 2015 |
As Reported (GAAP) | | $ | 1,075,341 | | $ | 300,522 |
Non-GAAP Adjustments1 | | | - | | | 8,270 |
Sold Business Venezuela1 | | | (8,400) | | | 700 |
Constant Currency FX Impact2 | | | (34,376) | | | (4,413) |
As Adjusted from Continuing Operations (Non-GAAP measure) | | $ | 1,032,565 | | $ | 305,079 |
| | | | | | |
| | 2014 |
As Reported (GAAP) | | $ | 1,111,626 | | $ | 293,089 |
Non-GAAP Adjustments1 | | | - | | | (422) |
Sold Business Venezuela1 | | | (19,793) | | | (3,385) |
Constant Currency FX Impact2 | | | (146,092) | | | (32,837) |
As Adjusted from Continuing Operations (Non-GAAP measure) | | $ | 945,741 | | $ | 256,445 |
| | | | | | |
| | 2013 |
As Reported (GAAP) | | $ | 1,188,582 | | $ | 278,569 |
Non-GAAP Adjustments1 | | | - | | | 4,015 |
Sold Business Venezuela and Metal Powders & Solar product lines1 | | | (102,007) | | | (9,559) |
Constant Currency FX Impact2 | | | (152,917) | | | (32,409) |
As Adjusted from Continuing Operations (Non-GAAP measure) | | $ | 933,658 | | $ | 240,616 |
1. For 2018 and 2017, refer to Table 6 for a description of the Non-GAAP adjustments that were recorded in "Cost of Sales”. For 2016, 2015, 2014 and 2013, the Non-GAAP adjustments relate to acquisitions related costs, costs related to certain optimization projects, and costs related to divested businesses and assets.
2. Reflects the remeasurement of 2017, 2016, 2015, 2014 and 2013 reported and adjusted results using 2018 average exchange rates, resulting in a constant currency comparative figures to 2018 reported and adjusted results.
It should be noted that adjusted net sales and adjusted gross profit referred to above are financial measures not required by, or presented in accordance with, accounting principles generally accepted in the United States (U.S. GAAP). These Non-GAAP financial measures should be considered as a supplement to, and not as a substitute for, the financial measures prepared in accordance with U.S. GAAP and a reconciliation of these financial measures to the most comparable U.S. GAAP financial measures is presented. We believe this data provides investors with additional useful information on the underlying operations and trends of the business and enables period-to-period comparability of financial performance.