UNITED STATES
SECURITIES AND EXCHANGE COMMISSION
Washington, D.C. 20549
FORM N-CSR
CERTIFIED SHAREHOLDER REPORT OF REGISTERED
MANAGEMENT INVESTMENT COMPANIES
Investment Company Act file Number 811-03171
Value Line U.S. Government Securities Fund, Inc.
(Exact name of registrant as specified in charter)
7 Times Square, 21st Floor, New York, N.Y. 10036-6524
(Address of principal executive offices) (Zip Code)
Registrant’s telephone number, including area code: 212-907-1900
Date of fiscal year end: August 31, 2012
Date of reporting period: August 31, 2012
Item I. Reports to Stockholders.
A copy of the Annual Report to Stockholders for the period ended 8/31/12 is included with this Form.
| INVESTMENT ADVISER | EULAV Asset Management 7 Times Square 21st Floor New York, NY 10036-6524 | A N N U A L R E P O R T | |||
| A u g u s t 3 1 , 2 0 1 2 | |||||
| DISTRIBUTOR | EULAV Securities LLC | ||||
7 Times Square 21st Floor | |||||
| New York, NY 10036-6524 | |||||
| CUSTODIAN BANK | State Street Bank and Trust Co. | ||||
| 225 Franklin Street | |||||
| Boston, MA 02110 | |||||
| SHAREHOLDER | State Street Bank and Trust Co. | ||||
| SERVICING AGENT | c/o BFDS | ||||
| P.O. Box 219729 | |||||
| Kansas City, MO 64121-9729 | |||||
Value Line U.S. Government Securities Fund, Inc. | |||||
| INDEPENDENT | PricewaterhouseCoopers LLP | ||||
| REGISTERED PUBLIC | 300 Madison Avenue | ||||
| ACCOUNTING FIRM | New York, NY 10017 | ||||
| LEGAL COUNSEL | Peter D. Lowenstein, Esq. | ||||
| 496 Valley Road | |||||
| Cos Cob, CT 06807-0272 | |||||
| DIRECTORS | Mitchell E. Appel | ||||
| Joyce E. Heinzerling | |||||
| Francis C. Oakley | |||||
| David H. Porter | |||||
| Paul Craig Roberts | |||||
| Nancy-Beth Sheerr | |||||
| Daniel S. Vandivort | |||||
| OFFICERS | Mitchell E. Appel | ||||
| President | |||||
| Michael J. Wagner | |||||
| Chief Compliance Officer | |||||
| Emily D. Washington | |||||
| Treasurer and Secretary | |||||
 | |||||
 | |||||
| This audited report is issued for information to shareholders. It is not authorized for distribution to prospective investors unless preceded or accompanied by a currently effective prospectus of the Fund (obtainable from the Distributor). | |||||
| #00088203 | |||||
| Value Line U.S. Government Securities Fund, Inc. |
| To Our Value Line U.S. Government |
To Our Shareholders (unaudited):
Enclosed is your annual report for the one year period ended August 31, 2012. I encourage you to carefully review this report, which includes economic observations, your Fund’s performance data and highlights, schedule of investments, and financial statements.
Interest rates fell over the course of the year. For the twelve months ended August 31, 2012, the 5-year U.S. Treasury note declined 37 basis points from 0.96% to 0.59%. The longer-term 10-year U.S. Treasury note dropped 67 basis points from 2.22% to 1.55%.
A weak economy and moderately contained inflation accounted for the drop in interest rates from August 2011 to August 2012. Except for the fourth quarter of 2011 where the economy grew at a 4.1% rate, growth has been subpar, averaging between 1% and 2%. The modest recession among European Union countries resulting from its debt and banking crisis has pushed bond yields down further.
For the period the Fund gained 3.32%. The Fund trailed its benchmark, Barclays Capital 50% Government/ 50% MBS Index(1), which gained 4.23%. During the latter part of 2011, as interest rates declined, the Fund’s risk profile was moderately lower than its benchmark and caused the Fund to lag the benchmark. Since the beginning of 2012, the Fund has increased its risk profile to be more in line with its index benchmark.
Going forward we expect to maintain our current risk parameters as interest rates are anticipated to remain low. A sluggish U.S. economy and slow global growth should keep the U.S. Federal Reserve and other central banks accommodative, supporting low interest rates. Keeping interest rates low is one of the necessary conditions essential in working out of the current economic and financial malaise.
We will continue to maintain our strategy of investing the Fund’s assets in a well-diversified highly rated portfolio of U.S. Treasuries, U.S. government agencies and mortgage-backed securities issued by U.S. government agencies. Additionally, by limiting the average maturity to no more than ten years, we provide a counterweight against gyrating interest rates.
Thank you for your confidence in the Fund and we appreciate your continued support.
| Sincerely, | ||
| /s/ Mitchell Appel | ||
| Mitchell Appel, President | ||
| /s/ Jeff Geffen | ||
| Jeff Geffen, Senior Portfolio Manager |
| (1) | The Barclays Capital 50% Government/ 50% MBS Index represents the intermediate maturities (1-10 years) of the U.S. Treasury and U.S. Agency segment of the fixed-income market. The returns for the Index do not reflect charges, expenses, or taxes, and it is not possible to directly invest in this Index. |
2
| Value Line U.S. Government Securities Fund, Inc. |
| Securities Fund Shareholders |
Economic Highlights (unaudited)
The U.S. stock market has displayed remarkable strength this year with the S&P 500 returning 13.5% through August 31, 2012. The resilience of the market was evident as it posted positive returns despite some strong headwinds, including a weakening outlook for global economic growth. Several members of the European Union continued to face a serious debt crisis including Greece, Portugal, Italy, and Spain. Tough austerity measures have been implemented but it is still unclear as to the timetable for the resolution of the debt crisis most severely affecting southern Europe.
At home, GDP grew 2.2% for the first quarter of the year, slowing to 1.5% for the second quarter. The second quarter slowdown was not surprising given that consumer spending has been lackluster, the government has been cutting spending, and hiring has been tepid. A sluggish labor market remains the primary stumbling block for the U.S. economy. Employment growth averaged 75,000 per month in the second quarter, down from a monthly average of 226,000 in the first quarter. However, there has been modest improvement in the overall unemployment rate this year, dropping from 8.5% at year-end 2011 to 8.1% on August 31, 2012.
Consumer confidence unexpectedly rose in July after declining much of the year, but retreated in August. The latest reading indicated the most pessimism thus far year, driven by growing concerns over the job market and the near-term outlook for business conditions. Despite this pessimism, retail sales came in stronger than expected in August, boosted by demand for automobiles. It is critical for the growth of the domestic economy that consumers continue to spend as they account for 70% of economic activity.
The housing market has been a bit of a bright spot for the economy. Home prices nationwide on a year-over-year basis in August 2012 soared 4.6%. This was the biggest year-over-year increase since July 2006. Particularly encouraging was the breadth of the rebound, with all but six states experiencing the gains.
U.S. Treasury bond prices defied those investors expecting a weakened performance after the U.S. government’s loss of it AAA rating last year from the Standard and Poor’s rating agency. The other major rating agencies, Moody’s and Fitch, maintained their AAA ratings for U.S. government debt. Many investors were drawn to the relative safety of U.S. Treasury bonds amidst the uncertainty of world economic events. While the 10-year U.S. Treasury bond hovered around a 2% yield in the first quarter, it had touched a 1.5% yield by the end of August.
3
| Value Line U.S. Government Securities Fund, Inc. |
| (unaudited) |
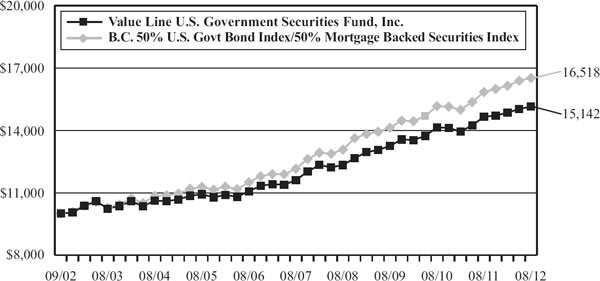
The following graph compares the performance of the Value Line U.S. Government Securities Fund, Inc. to that of the Barclays Capital 50% U.S. Government Bond Index/50% Mortgage Backed Securities Index (the “Index”). The Value Line U.S. Government Securities Fund, Inc. is a professionally managed mutual fund, while the Index is not available for investment and is unmanaged. The returns for the Index do not reflect charges, expenses or taxes, but do include the reinvestment of dividends. The comparison is shown for illustrative purposes only.
Comparison of a Change in Value of a $10,000 Investment in the Value Line U.S. Government
Securities Fund, Inc., and the Barclays Capital 50% U.S. Government Bond
Index/50% Mortgage Backed Securities Index*
Performance Data: **
| Average Annual | Growth of an Assumed | |||||||
| Total Return | Investment of $10,000 | |||||||
| 1 year ended 8/31/12 | 3.32 | % | $ | 10,332 | ||||
| 5 years ended 8/31/12 | 5.45 | % | $ | 13,041 | ||||
| 10 years ended 8/31/12 | 4.24 | % | $ | 15,142 | ||||
| * | The Barclays Capital 50% U.S. Government Bond Index/50% Mortgage Backed Securities Index is representative of 50% of the performance of the total universe of investment-grade fixed income securities issued by the United States government or its agencies and 50% of the performance of investment-grade fixed-rate mortgage-backed pass-through securities of Government National Mortgage Associations (GNMA), Federal National Mortgage Association (FNMA) and Federal Home Loan Mortgage Corporation (FHLMC). The returns for the Index do not reflect charges, expenses or taxes, which are deducted from the Fund’s returns and it is not possible to directly invest in this unmanaged Index. |
| ** | The performance data quoted represent past performance and are no guarantee of future performance. The average annual total returns and growth of an assumed investment of $10,000 include dividends reinvested and capital gains distributions accepted in shares. The investment return and principal value of an investment will fluctuate so that an investment, when redeemed, may be worth more or less than its original cost. The performance data and graph do not reflect the deduction of taxes that a shareholder would pay on fund distributions or the redemption of fund shares. |
4
| Value Line U.S. Government Securities Fund, Inc. |
| FUND EXPENSES (unaudited): |
Example
As a shareholder of the Fund, you incur ongoing costs, including management fees, distribution and service (12b-1) fees, and other Fund expenses. This Example is intended to help you understand your ongoing costs (in dollars) of investing in the Fund and to compare these costs with the ongoing costs of investing in other mutual funds.
The Example is based on an investment of $1,000 invested at the beginning of the period and held for the entire period (March 1, 2012 through August 31, 2012).
Actual Expenses
The first line of the table below provides information about actual account values and actual expenses. You may use the information in this line, together with the amount you invested, to estimate the expenses that you paid over the period. Simply divide your account value by $1,000 (for example an $8,600 account value divided by $1,000 = 8.6), then multiply the result by the number in the first line under the heading “Expenses Paid During Period” to estimate the expenses you paid on your account during this period.
Hypothetical Example for Comparison Purposes
The second line of the table below provides information about hypothetical account values and hypothetical expenses based on the Fund’s actual expense ratio and an assumed rate of return of 5% per year before expenses, which is not the Fund’s actual return. The hypothetical account values and expenses may not be used to estimate the actual ending account balance or expenses you paid for the period. You may use this information to compare the ongoing costs of investing in the Fund and other funds. To do so, compare this 5% hypothetical example with the 5% hypothetical examples that appear in the shareholder reports of other funds.
Please note that the expenses shown in the table are meant to highlight your ongoing costs only and do not reflect any transactional costs, such as sales charges (loads), redemption fees, or exchange fees. Therefore, the table is useful in comparing ongoing costs only and will not help you determine the relative total costs of owning different funds. In addition, if transactional costs were included, your costs would have been higher.
| Expenses | ||||||||||||
| Beginning | Ending | paid during | ||||||||||
| account value | account value | period 3/1/12 | ||||||||||
| 3/1/12 | 8/31/12 | thru 8/31/12* | ||||||||||
| Actual | $ | 1,000.00 | $ | 1,019.59 | $ | 4.53 | ||||||
| Hypothetical (5% return before expenses) | $ | 1,000.00 | $ | 1,020.65 | $ | 4.53 | ||||||
| * | Expenses are equal to the Fund’s annualized expense ratio of 0.89% multiplied by the average account value over the period, multiplied by 184/366 to reflect the one-half year period. This expense ratio may differ from the expense ratio shown in the Financial Highlights. |
5
| Value Line U.S. Government Securities Fund, Inc. |
| Portfolio Highlights at August 31, 2012 (unaudited) |
Ten Largest Holdings
| Principal | Percentage of | |||||||||||
| Issue | Amount | Value | Net Assets | |||||||||
| U.S. Treasury Notes, 1.50%, 7/31/16 | $ | 3,200,000 | $ | 3,333,251 | 4.1 | % | ||||||
| U.S. Treasury Bonds, 7.88%, 2/15/21 | 1,600,000 | 2,455,000 | 3.1 | % | ||||||||
| Federal Home Loan Bank, 5.00%, 12/21/15 | 2,000,000 | 2,296,434 | 2.9 | % | ||||||||
| U.S. Treasury Notes, 3.13%, 5/15/19 | 1,800,000 | 2,057,625 | 2.6 | % | ||||||||
| U.S. Treasury Notes, 3.13%, 5/15/21 | 1,750,000 | 2,010,176 | 2.5 | % | ||||||||
| Federal National Mortgage Association Pool #MA1107, 3.50%, 7/1/32 | 1,687,661 | 1,802,071 | 2.2 | % | ||||||||
| Federal National Mortgage Association, 7.25%, 5/15/30 | 1,000,000 | 1,630,209 | 2.0 | % | ||||||||
| U.S. Treasury Notes, 2.25%, 7/31/18 | 1,500,000 | 1,626,562 | 2.0 | % | ||||||||
| Federal National Mortgage Association, 2.38%, 7/28/15 | 1,500,000 | 1,586,029 | 2.0 | % | ||||||||
| U.S. Treasury Bonds, 6.25%, 5/15/30 | 900,000 | 1,434,656 | 1.8 | % | ||||||||
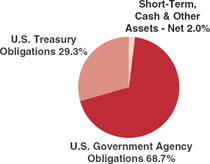
| Asset Allocation — Percentage of Fund’s Net Assets |
| Coupon Distribution |
| Percentage of | ||||
| Fund’s | ||||
| Investments | ||||
| Less than 4% | 44.6 | % | ||
| 4-4.99% | 26.5 | % | ||
| 5-5.99% | 17.3 | % | ||
| 6-6.99% | 5.7 | % | ||
| 7-7.99% | 5.9 | % | ||
6
| Value Line U.S. Government Securities Fund, Inc. | |
| Schedule of Investments | August 31, 2012 |
Principal Amount | Rate | Maturity Date | Value | ||||||||
| U.S. GOVERNMENT AGENCY OBLIGATIONS (68.7%) | |||||||||||
| FEDERAL FARM CREDIT BANK (1.2%) | |||||||||||
| $ | 1,000,000 | Federal Farm Credit Bank | 1.90 | % | 11/15/17 | $ | 1,002,396 | ||||
| 1,000,000 | TOTAL FEDERAL FARM CREDIT BANK (Cost $1,000,000) | 1,002,396 | |||||||||
| FEDERAL HOME LOAN BANK (4.4%) | |||||||||||
| 2,000,000 | Federal Home Loan Bank | 5.00 | 12/21/15 | 2,296,434 | |||||||
| 1,000,000 | Federal Home Loan Bank | 5.00 | 11/17/17 | 1,214,557 | |||||||
| 3,000,000 | TOTAL FEDERAL HOME LOAN BANK (Cost $3,175,980) | 3,510,991 | |||||||||
| FEDERAL HOME LOAN MORTGAGE CORPORATION (24.5%) | |||||||||||
| 327,691 | Federal Home Loan Mortgage Corporation REMIC Trust Series 2849 Class VA | 5.00 | 8/15/15 | 341,003 | |||||||
| 1,000,000 | Federal Home Loan Mortgage Corporation | 5.50 | 7/18/16 | 1,189,353 | |||||||
| 1,000,000 | Federal Home Loan Mortgage Corporation | 2.00 | 8/25/16 | 1,056,230 | |||||||
| 1,100,000 | Federal Home Loan Mortgage Corporation | 1.25 | 5/12/17 | 1,125,962 | |||||||
| 56,205 | Federal Home Loan Mortgage Corporation REMIC Trust Series 2767 Class CA | 4.00 | 9/15/17 | 56,468 | |||||||
| 4,604 | Federal Home Loan Mortgage Corporation Gold PC Pool #E92226 | 5.00 | 11/1/17 | 4,995 | |||||||
| 1,000,000 | Federal Home Loan Mortgage Corporation | 5.13 | 11/17/17 | 1,217,204 | |||||||
| 67,393 | Federal Home Loan Mortgage Corporation Gold PC Pool #E93499 | 5.00 | 12/1/17 | 73,117 | |||||||
| 5,696 | Federal Home Loan Mortgage Corporation Gold PC Pool #E92829 | 5.00 | 12/1/17 | 6,180 | |||||||
| 286,236 | Federal Home Loan Mortgage Corporation REMIC Trust Series 2643 Class ME | 3.50 | 3/15/18 | 294,066 | |||||||
| 6,786 | Federal Home Loan Mortgage Corporation Gold PC Pool #E98960 | 5.00 | 9/1/18 | 7,363 | |||||||
| 27,243 | Federal Home Loan Mortgage Corporation Gold PC Pool #B12822 | 5.00 | 3/1/19 | 29,847 | |||||||
| 1,000,000 | Federal Home Loan Mortgage Corporation | 3.75 | 3/27/19 | 1,165,156 | |||||||
| 15,848 | Federal Home Loan Mortgage Corporation Gold PC Pool #B17398 | 4.50 | 12/1/19 | 17,120 | |||||||
| 101,902 | Federal Home Loan Mortgage Corporation Gold PC Pool #G18044 | 4.50 | 3/1/20 | 110,016 | |||||||
See Notes to Financial Statements.
7
| Value Line U.S. Government Securities Fund, Inc. |
| Schedule of Investments |
Principal Amount | Rate | Maturity Date | Value | ||||||||
| $ | 69,076 | Federal Home Loan Mortgage Corporation Gold PC Pool #B18034 | 4.50 | % | 4/1/20 | $ | 74,577 | ||||
| 303,853 | Federal Home Loan Mortgage Corporation Gold PC Pool #J12462 | 4.00 | 6/1/20 | 325,913 | |||||||
| 16,056 | Federal Home Loan Mortgage Corporation Gold PC Pool #J00118 | 5.00 | 10/1/20 | 17,437 | |||||||
| 252,205 | Federal Home Loan Mortgage Corporation Gold PC Pool #J00139 | 5.00 | 10/1/20 | 273,625 | |||||||
| 11,484 | Federal Home Loan Mortgage Corporation Gold PC Pool #G11986 | 5.00 | 4/1/21 | 12,464 | |||||||
| 15,802 | Federal Home Loan Mortgage Corporation Gold PC Pool #G12319 | 5.00 | 6/1/21 | 17,161 | |||||||
| 783,850 | Federal Home Loan Mortgage Corporation Gold PC Pool #G14216 | 3.50 | 7/1/21 | 829,834 | |||||||
| 83,115 | Federal Home Loan Mortgage Corporation Gold PC Pool #J03233 | 5.00 | 8/1/21 | 90,213 | |||||||
| 360,204 | Federal Home Loan Mortgage Corporation Gold PC Pool #G12381 | 5.00 | 9/1/21 | 391,189 | |||||||
| 7,862 | Federal Home Loan Mortgage Corporation REMIC Trust Series 2773 Class DA | 5.00 | 6/15/22 | 7,859 | |||||||
| 187,436 | Federal Home Loan Mortgage Corporation Gold PC Pool #J08096 | 5.00 | 6/1/23 | 202,711 | |||||||
| 217,158 | Federal Home Loan Mortgage Corporation Gold PC Pool #J09098 | 5.00 | 12/1/23 | 236,144 | |||||||
| 12,577 | Federal Home Loan Mortgage Corporation REMIC Trust Series 3132 Class MA | 5.50 | 12/15/23 | 12,592 | |||||||
| 562,001 | Federal Home Loan Mortgage Corporation Gold PC Pool #J09739 | 4.50 | 5/1/24 | 604,471 | |||||||
| 3,942 | Federal Home Loan Mortgage Corporation REMIC Trust Series 3147 Class YE | 5.50 | 7/15/24 | 3,941 | |||||||
| 368,908 | Federal Home Loan Mortgage Corporation Gold PC Pool #J11210 | 4.00 | 11/1/24 | 393,154 | |||||||
| 643,199 | Federal Home Loan Mortgage Corporation Gold PC Pool #J11587 | 4.00 | 1/1/25 | 703,764 | |||||||
| 151,812 | Federal Home Loan Mortgage Corporation Gold PC Pool #E02704 | 4.50 | 7/1/25 | 163,189 | |||||||
| 455,707 | Federal Home Loan Mortgage Corporation REMIC Trust Series 3567 Class BJ | 4.50 | 6/15/27 | 478,308 | |||||||
| 279,532 | Federal Home Loan Mortgage Corporation Gold PC Pool #C91239 | 4.50 | 3/1/29 | 302,224 | |||||||
See Notes to Financial Statements.
8
| Value Line U.S. Government Securities Fund, Inc. |
| August 31, 2012 |
Principal Amount | Rate | Maturity Date | Value | ||||||||
| $ | 45,505 | Federal Home Loan Mortgage Corporation REMIC Trust Series 2645 Class NA | 3.50 | % | 9/15/31 | $ | 46,256 | ||||
| 424,247 | Federal Home Loan Mortgage Corporation Gold PC Pool #C77717 | 6.00 | 3/1/33 | 475,308 | |||||||
| 282,781 | Federal Home Loan Mortgage Corporation Gold PC Pool #A29526 | 5.00 | 1/1/35 | 307,948 | |||||||
| 96,735 | Federal Home Loan Mortgage Corporation Gold PC Pool #A29633 | 5.00 | 1/1/35 | 105,344 | |||||||
| 213,835 | Federal Home Loan Mortgage Corporation Pool #783022 (1) | 2.37 | 2/1/35 | 229,529 | |||||||
| 115,249 | Federal Home Loan Mortgage Corporation Gold PC Pool #A56491 | 5.00 | 1/1/37 | 125,272 | |||||||
| 106,892 | Federal Home Loan Mortgage Corporation Gold PC Pool #G08184 | 5.00 | 1/1/37 | 116,188 | |||||||
| 194,418 | Federal Home Loan Mortgage Corporation Gold PC Pool #A56467 | 5.50 | 1/1/37 | 213,559 | |||||||
| 294,448 | Federal Home Loan Mortgage Corporation Gold PC Pool #A80938 | 5.50 | 8/1/38 | 321,697 | |||||||
| 1,095,086 | Federal Home Loan Mortgage Corporation REMIC Trust Series 3632 Class AP | 3.00 | 2/15/40 | 1,158,317 | |||||||
| 777,004 | Federal Home Loan Mortgage Corporation Gold PC Pool #C03516 | 4.00 | 9/1/40 | 831,907 | |||||||
| 929,876 | Federal Home Loan Mortgage Corporation Gold PC Pool #A95803 | 4.00 | 12/1/40 | 1,023,111 | |||||||
| 413,264 | Federal Home Loan Mortgage Corporation Gold PC Pool #A96409 | 3.50 | 1/1/41 | 437,512 | |||||||
| 399,942 | Federal Home Loan Mortgage Corporation Gold PC Pool #G06224 | 3.50 | 1/1/41 | 423,408 | |||||||
| 660,849 | Federal Home Loan Mortgage Corporation Gold PC Pool #A97135 | 4.50 | 2/1/41 | 715,529 | |||||||
| 78,099 | Federal Home Loan Mortgage Corporation Gold PC Pool #Q01181 | 4.50 | 6/1/41 | 84,561 | |||||||
| 186,694 | Federal Home Loan Mortgage Corporation Gold PC Pool #Q06307 | 3.50 | 2/1/42 | 197,648 | |||||||
| 1,000,000 | Federal Home Loan Mortgage Corporation Gold PC TBA | 3.50 | 12/1/99 | 1,057,969 | |||||||
| 18,100,307 | TOTAL FEDERAL HOME LOAN MORTGAGE CORPORATION (Cost $18,600,078) | 19,705,913 | |||||||||
| FEDERAL NATIONAL MORTGAGE ASSOCIATION (33.6%) | |||||||||||
| 1,500,000 | Federal National Mortgage Association (2) | 2.38 | 7/28/15 | 1,586,029 | |||||||
| 10,642 | Federal National Mortgage Association Pool #511823 | 5.50 | 5/1/16 | 11,565 | |||||||
See Notes to Financial Statements.
9
| Value Line U.S. Government Securities Fund, Inc. |
| Schedule of Investments |
Principal Amount | Rate | Maturity Date | Value | ||||||||
| $ | 585,732 | Federal National Mortgage Association REMIC Trust Series 2005-40 Class VG | 4.50 | % | 6/25/16 | $ | 610,110 | ||||
| 8,123 | Federal National Mortgage Association Pool #615289 | 5.50 | 12/1/16 | 8,827 | |||||||
| 46,979 | Federal National Mortgage Association Pool #622373 | 5.50 | 12/1/16 | 51,051 | |||||||
| 34,087 | Federal National Mortgage Association Pool #631328 | 5.50 | 2/1/17 | 37,148 | |||||||
| 55,478 | Federal National Mortgage Association Pool #623503 | 6.00 | 2/1/17 | 59,908 | |||||||
| 2,735 | Federal National Mortgage Association Pool #643277 | 5.50 | 4/1/17 | 2,980 | |||||||
| 3,179 | Federal National Mortgage Association Pool #638247 | 5.50 | 5/1/17 | 3,465 | |||||||
| 500,000 | Federal National Mortgage Association | 1.10 | 7/11/17 | 504,665 | |||||||
| 23,258 | Federal National Mortgage Association REMIC Trust Series 2003-52 Class KR | 3.50 | 7/25/17 | 23,290 | |||||||
| 89,594 | Federal National Mortgage Association Pool #254684 | 5.00 | 3/1/18 | 97,596 | |||||||
| 27,325 | Federal National Mortgage Association Pool #685183 | 5.00 | 3/1/18 | 29,766 | |||||||
| 39,117 | Federal National Mortgage Association Pool #703936 | 5.00 | 5/1/18 | 42,611 | |||||||
| 263,749 | Federal National Mortgage Association Pool #257566 | 4.50 | 1/1/19 | 284,837 | |||||||
| 463,224 | Federal National Mortgage Association Pool #780956 | 4.50 | 5/1/19 | 510,251 | |||||||
| 142,831 | Federal National Mortgage Association Pool #790984 | 5.00 | 7/1/19 | 155,589 | |||||||
| 169,079 | Federal National Mortgage Association Pool #786915 | 5.00 | 8/1/19 | 184,920 | |||||||
| 369,431 | Federal National Mortgage Association Pool #735063 | 4.50 | 12/1/19 | 400,355 | |||||||
| 10,824 | Federal National Mortgage Association REMIC Trust Series 2003-28 Class KA | 4.25 | 3/25/22 | 10,854 | |||||||
| 127,575 | Federal National Mortgage Association REMIC Trust Series 2003-17 Class ED | 4.25 | 9/25/22 | 130,131 | |||||||
| 795,693 | Federal National Mortgage Association Pool #890121 | 5.00 | 3/1/23 | 866,265 | |||||||
| 80,204 | Federal National Mortgage Association REMIC Trust Series 2003-38 Class TC | 5.00 | 3/25/23 | 85,240 | |||||||
| 609,590 | Federal National Mortgage Association Pool #AH8061 | 4.00 | 6/1/26 | 653,093 | |||||||
| 880,174 | Federal National Mortgage Association Pool #AI3053 | 4.00 | 7/1/26 | 942,987 | |||||||
| 50,530 | Federal National Mortgage Association Pool #412682 | 6.00 | 3/1/28 | 56,941 | |||||||
| 515,180 | Federal National Mortgage Association Pool #MA0361 | 4.00 | 3/1/30 | 556,844 | |||||||
| 1,000,000 | Federal National Mortgage Association | 7.25 | 5/15/30 | 1,630,209 | |||||||
| 389,798 | Federal National Mortgage Association Pool #MA0616 | 4.00 | 1/1/31 | 421,321 | |||||||
| 204 | Federal National Mortgage Association Pool #568625 | 7.50 | 1/1/31 | 212 | |||||||
| 31,821 | Federal National Mortgage Association Pool #571090 | 7.50 | 1/1/31 | 32,594 | |||||||
| 815,637 | Federal National Mortgage Association Pool #MA0641 | 4.00 | 2/1/31 | 881,600 | |||||||
| 1,747 | Federal National Mortgage Association Pool #573935 | 7.50 | 3/1/31 | 1,882 | |||||||
| 780,496 | Federal National Mortgage Association Pool #MA0804 | 4.00 | 7/1/31 | 843,616 | |||||||
See Notes to Financial Statements.
10
| Value Line U.S. Government Securities Fund, Inc. |
| August 31, 2012 |
Principal Amount | Rate | Maturity Date | Value | ||||||||
| $ | 449,818 | Federal National Mortgage Association Pool #MA3894 | 4.00 | % | 9/1/31 | $ | 486,195 | ||||
| 4,931 | Federal National Mortgage Association Pool #629297 | 6.50 | 2/1/32 | 5,738 | |||||||
| 307,420 | Federal National Mortgage Association Pool #626440 | 7.50 | 2/1/32 | 377,955 | |||||||
| 5,763 | Federal National Mortgage Association Pool #634996 | 6.50 | 5/1/32 | 6,641 | |||||||
| 27,838 | Federal National Mortgage Association Pool #254383 | 7.50 | 6/1/32 | 34,312 | |||||||
| 1,687,661 | Federal National Mortgage Association Pool #MA1107 | 3.50 | 7/1/32 | 1,802,071 | |||||||
| 94,262 | Federal National Mortgage Association Pool #254476 | 5.50 | 9/1/32 | 104,301 | |||||||
| 3,411 | Federal National Mortgage Association Pool #688539 | 5.50 | 3/1/33 | 3,770 | |||||||
| 193,731 | Federal National Mortgage Association Pool #650386 | 5.00 | 7/1/33 | 213,335 | |||||||
| 106,728 | Federal National Mortgage Association Pool #726889 | 5.50 | 7/1/33 | 117,962 | |||||||
| 135,464 | Federal National Mortgage Association Pool #759028 | 5.50 | 1/1/34 | 149,722 | |||||||
| 145,741 | Federal National Mortgage Association Pool #761913 | 5.50 | 2/1/34 | 161,233 | |||||||
| 116,056 | Federal National Mortgage Association Pool #763393 | 5.50 | 2/1/34 | 128,272 | |||||||
| 110,804 | Federal National Mortgage Association Pool #769862 | 5.50 | 2/1/34 | 122,398 | |||||||
| 10,007 | Federal National Mortgage Association Pool #769682 | 5.00 | 3/1/34 | 10,997 | |||||||
| 376,920 | Federal National Mortgage Association REMIC Trust Series 2004-60 Class LB | 5.00 | 4/25/34 | 410,308 | |||||||
| 4,384 | Federal National Mortgage Association Pool #778141 | 5.00 | 5/1/34 | 4,818 | |||||||
| 132,151 | Federal National Mortgage Association Pool #773586 | 5.50 | 6/1/34 | 145,979 | |||||||
| 172,695 | Federal National Mortgage Association Pool #255311 | 6.00 | 7/1/34 | 193,685 | |||||||
| 6,328 | Federal National Mortgage Association Pool #258149 | 5.50 | 9/1/34 | 6,992 | |||||||
| 1,359 | Federal National Mortgage Association Pool #789150 | 5.00 | 10/1/34 | 1,494 | |||||||
| 208,127 | Federal National Mortgage Association Pool #255496 | 5.00 | 11/1/34 | 228,733 | |||||||
| 25,382 | Federal National Mortgage Association Pool #797154 | 5.50 | 11/1/34 | 28,181 | |||||||
| 60,699 | Federal National Mortgage Association Pool #801063 | 5.50 | 11/1/34 | 67,049 | |||||||
| 61,649 | Federal National Mortgage Association Pool #803675 | 5.50 | 12/1/34 | 68,099 | |||||||
| 109,013 | Federal National Mortgage Association Pool #804683 | 5.50 | 12/1/34 | 120,419 | |||||||
| 261,805 | Federal National Mortgage Association Pool #815813 (1) | 2.50 | 2/1/35 | 279,972 | |||||||
| 16,308 | Federal National Mortgage Association Pool #255580 | 5.50 | 2/1/35 | 18,015 | |||||||
| 205,051 | Federal National Mortgage Association Pool #735224 | 5.50 | 2/1/35 | 226,634 | |||||||
| 173,084 | Federal National Mortgage Association Pool #896016 | 6.00 | 8/1/36 | 191,147 | |||||||
| 158,697 | Federal National Mortgage Association Pool #901561 | 5.50 | 10/1/36 | 174,310 | |||||||
| 398,227 | Federal National Mortgage Association Pool #919584 | 6.00 | 6/1/37 | 439,786 | |||||||
| 186,457 | Federal National Mortgage Association Pool #943647 | 5.50 | 7/1/37 | 204,568 | |||||||
| 81,396 | Federal National Mortgage Association Pool #AA2531 | 4.50 | 3/1/39 | 88,081 | |||||||
| 264,957 | Federal National Mortgage Association Pool #AA9181 | 4.50 | 8/1/39 | 286,718 | |||||||
See Notes to Financial Statements.
11
| Value Line U.S. Government Securities Fund, Inc. |
| Schedule of Investments |
Principal Amount | Rate | Maturity Date | Value | ||||||||
| $ | 672,366 | Federal National Mortgage Association REMIC Trust Series 2009-88 Class MA | 4.50 | % | 10/25/39 | $ | 736,053 | ||||
| 64,685 | Federal National Mortgage Association Pool #AD1035 | 4.50 | 2/1/40 | 70,199 | |||||||
| 253,209 | Federal National Mortgage Association Pool #AD5234 | 4.50 | 7/1/40 | 274,797 | |||||||
| 381,396 | Federal National Mortgage Association Pool #AD7136 | 5.00 | 7/1/40 | 418,442 | |||||||
| 678,827 | Federal National Mortgage Association Pool #890236 | 4.50 | 8/1/40 | 734,376 | |||||||
| 1,031,825 | Federal National Mortgage Association Pool #AD8408 | 4.50 | 8/1/40 | 1,119,796 | |||||||
| 704,472 | Federal National Mortgage Association Pool #AE2078 | 4.50 | 8/1/40 | 764,533 | |||||||
| 296,030 | Federal National Mortgage Association Pool #AD8536 | 5.00 | 8/1/40 | 326,187 | |||||||
| 872,745 | Federal National Mortgage Association Pool #AH5575 | 4.00 | 2/1/41 | 936,780 | |||||||
| 886,830 | Federal National Mortgage Association Pool #AI3051 | 4.50 | 7/1/41 | 964,101 | |||||||
| 917,075 | Federal National Mortgage Association Pool #AI0814 | 4.50 | 8/1/41 | 996,982 | |||||||
| 304,525 | Federal National Mortgage Association Pool #AJ5888 | 4.50 | 11/1/41 | 331,059 | |||||||
| 648,356 | Federal National Mortgage Association Pool #AJ7440 | 4.50 | 11/1/41 | 704,848 | |||||||
| 24,440,701 | TOTAL FEDERAL NATIONAL MORTGAGE ASSOCIATION (Cost $25,308,541) | 27,006,795 | |||||||||
| GOVERNMENT NATIONAL MORTGAGE ASSOCIATION (5.0%) | |||||||||||
| 64,633 | Government National Mortgage Association Pool #003645 | 4.50 | 12/20/19 | 70,992 | |||||||
| 3,308 | Government National Mortgage Association Pool #557681 | 6.00 | 8/15/31 | 3,770 | |||||||
| 44,227 | Government National Mortgage Association Pool #548880 | 6.00 | 12/15/31 | 50,400 | |||||||
| 45,903 | Government National Mortgage Association Pool #551762 | 6.00 | 4/15/32 | 52,210 | |||||||
| 20,058 | Government National Mortgage Association Pool #582415 | 6.00 | 11/15/32 | 22,813 | |||||||
| 203,311 | Government National Mortgage Association Pool #604485 | 6.00 | 7/15/33 | 231,815 | |||||||
| 103,749 | Government National Mortgage Association Pool #622603 | 6.00 | 11/15/33 | 117,743 | |||||||
| 3,293 | Government National Mortgage Association Pool #429786 | 6.00 | 12/15/33 | 3,800 | |||||||
| 6,337 | Government National Mortgage Association Pool #626480 | 6.00 | 2/15/34 | 7,246 | |||||||
| 86,858 | Government National Mortgage Association Pool #605025 | 6.00 | 2/15/34 | 98,981 | |||||||
| 78,864 | Government National Mortgage Association Pool #610944 | 5.50 | 4/15/34 | 88,724 | |||||||
| 36,867 | Government National Mortgage Association Pool #605245 | 5.50 | 6/15/34 | 41,372 | |||||||
| 94,729 | Government National Mortgage Association Pool #583008 | 5.50 | 6/15/34 | 106,305 | |||||||
| 780,964 | Government National Mortgage Association Series 2009-103 Class TK | 3.00 | 9/20/38 | 809,369 | |||||||
| 846,542 | Government National Mortgage Association Series 2010-151 Class KA | 3.00 | 9/16/39 | 892,382 | |||||||
See Notes to Financial Statements.
12
| Value Line U.S. Government Securities Fund, Inc. |
| August 31, 2012 |
Principal Amount | Rate | Maturity Date | Value | ||||||||
| $ | 754,804 | Government National Mortgage Association Series 2011-17 Class EP | 3.50 | % | 12/16/39 | $ | 795,036 | ||||
| 599,923 | Government National Mortgage Association Series 2011-136 Class GB | 2.50 | 5/20/40 | 622,117 | |||||||
| 3,774,370 | TOTAL GOVERNMENT NATIONAL MORTGAGE ASSOCIATION (Cost $3,904,931) | 4,015,075 | |||||||||
| 50,315,378 | TOTAL U.S. GOVERNMENT AGENCY OBLIGATIONS (Cost $51,989,530) | 55,241,170 | |||||||||
| U.S. TREASURY OBLIGATIONS (29.3%) | |||||||||||
| 450,000 | U.S. Treasury Notes | 1.88 | 8/31/17 | 478,055 | |||||||
| 1,800,000 | U.S. Treasury Notes | 3.13 | 5/15/19 | 2,057,625 | |||||||
| 1,200,000 | U.S. Treasury Notes | 3.50 | 5/15/20 | 1,410,281 | |||||||
| 1,500,000 | U.S. Treasury Notes | 2.25 | 7/31/18 | 1,626,562 | |||||||
| 700,000 | U.S. Treasury Notes | 2.38 | 7/31/17 | 760,211 | |||||||
| 3,200,000 | U.S. Treasury Notes | 1.50 | 7/31/16 | 3,333,251 | |||||||
| 1,750,000 | U.S. Treasury Notes | 3.13 | 5/15/21 | 2,010,176 | |||||||
| 500,000 | U.S. Treasury Notes | 2.25 | 11/30/1 | 541,094 | |||||||
| 1,300,000 | U.S. Treasury Notes | 1.88 | 9/30/17 | 1,380,844 | |||||||
| 1,000,000 | U.S. Treasury Notes | 2.38 | 5/31/18 | 1,091,016 | |||||||
| 700,000 | U.S. Treasury Notes | 2.13 | 8/15/21 | 743,805 | |||||||
| 1,300,000 | U.S. Treasury Notes | 1.00 | 3/31/17 | 1,327,321 | |||||||
| 700,000 | U.S. Treasury Notes | 1.13 | 5/31/19 | 707,657 | |||||||
| 1,600,000 | U.S. Treasury Bonds | 7.88 | 2/15/21 | 2,455,000 | |||||||
| 500,000 | U.S. Treasury Bonds | 6.00 | 2/15/26 | 740,312 | |||||||
| 150,000 | U.S. Treasury Bonds | 7.25 | 8/15/22 | 230,344 | |||||||
| 900,000 | U.S. Treasury Bonds | 6.25 | 5/15/30 | 1,434,656 | |||||||
| 300,000 | U.S. Treasury Bonds | 6.13 | 8/15/29 | 468,047 | |||||||
| 600,000 | U.S. Treasury Bonds | 4.50 | 5/15/38 | 825,187 | |||||||
| 20,150,000 | TOTAL U.S. TREASURY OBLIGATIONS (Cost $23,067,488) | 23,621,444 | |||||||||
| SHORT-TERM INVESTMENTS (5.1%) | |||||||||||
| REPURCHASE AGREEMENT (3.1%) | |||||||||||
| 2,500,000 | With Morgan Stanley, 0.16%, dated 08/31/12, due 09/04/12, delivery value $2,500,044 (collateralized by $2,230,000 U.S. Treasury Notes 3.1250% due 05/15/21, with a value of $2,584,778) | 2,500,000 | |||||||||
See Notes to Financial Statements.
13
| Value Line U.S. Government Securities Fund, Inc. |
| Schedule of Investments |
Principal Amount | Value | ||||||||||
| INVESTMENTS OF CASH COLLATERAL FOR SECURITIES ON LOAN (2.0%) | |||||||||||
| REPURCHASE AGREEMENT (2.0%) | |||||||||||
| $ | 595,061 | Joint Repurchase Agreement with Morgan Stanley, 0.18%, dated 08/31/12, due 09/04/12, delivery value $595,073 (collateralized by $606,962 U.S. Treasury STRIPS 0.000% due 02/15/16–05/15/19, with a value of $606,962) | $ | 595,061 | |||||||
| 495,884 | Joint Repurchase Agreement with Barclays, 0.19%, dated 08/31/12, due 09/04/12, delivery value $495,895 (collateralized by $505,805 U.S. Treasury Inflation Indexed Bonds 2.125% due 02/15/40, with a value of $505,483) | 495,884 | |||||||||
| 515,720 | Joint Repurchase Agreement with Credit Suisse First Boston, 0.18%, dated 08/31/12, due 09/04/12, delivery value $515,730 (collateralized by $526,101 U.S. Treasury Note 1.750% due 01/31/14, with a value of $525,343) | 515,720 | |||||||||
| TOTAL INVESTMENTS OF CASH COLLATERAL FOR SECURITIES ON LOAN (Cost $1,606,665) | 1,606,665 | ||||||||||
TOTAL SHORT-TERM INVESTMENTS (5.1%) (Cost $4,106,665) | 4,106,665 | ||||||||||
TOTAL INVESTMENT SECURITIES (103.1%) (Cost $79,163,683) | 82,969,279 | ||||||||||
| EXCESS OF LIABILITIES OVER CASH AND OTHER ASSETS (-3.1%) | (2,514,706 | ) | |||||||||
| NET ASSETS (100.0%) | $ | 80,454,573 | |||||||||
| NET ASSET VALUE, OFFERING AND REDEMPTION PRICE PER OUTSTANDING SHARE ($80,454,573 ÷ 6,592,250 shares outstanding) | $ | 12.20 | |||||||||
| (1) | Adjustable rate security. The rate shown is as of August 31, 2012. |
| (2) | A portion or all of the security was held on loan. As of August 31, 2012, the market value (including accrued interest) of the securities on loan was $1,587,666. |
| TBA | To Be Announced |
See Notes to Financial Statements.
14
| Value Line U.S. Government Securities Fund, Inc. |
| Statement of Assets and Liabilities at August 31, 2012 |
| Assets: | ||||
| Investment securities, at value (Cost - $76,663,683) (securities on loan, at value, $1,587,666)* | $ | 80,469,279 | ||
| Repurchase agreement (Cost - $2,500,000) | 2,500,000 | |||
| Cash | 80,203 | |||
| Interest receivable | 357,506 | |||
| Prepaid expenses | 5,249 | |||
| Receivable for securities lending income | 1,455 | |||
| Receivable for capital shares sold | 397 | |||
| Total Assets | 83,414,089 | |||
| Liabilities: | ||||
| Payable upon return of securities on loan | 1,615,968 | |||
| Payable for securities purchased | 1,265,941 | |||
| Payable for capital shares redeemed | 7,068 | |||
| Accrued expenses: | ||||
| Advisory fee | 34,037 | |||
| Other | 36,502 | |||
| Total Liabilities | 2,959,516 | |||
| Net Assets | $ | 80,454,573 | ||
| Net assets consist of: | ||||
| Capital stock, at $1.00 par value (authorized 100,000,000, outstanding 6,592,250 shares) | $ | 6,592,250 | ||
| Additional paid-in capital | 68,760,630 | |||
| Undistributed net investment income | 29,047 | |||
| Accumulated net realized gain on investments | 1,267,050 | |||
| Net unrealized appreciation of investments | 3,805,596 | |||
| Net Assets | $ | 80,454,573 | ||
| Net Asset Value, Offering and Redemption Price per Outstanding Share ($80,454,573 ÷ 6,592,250 shares outstanding) | $ | 12.20 | ||
* The market value of securities on loan includes accrued interest.
| Statement of Operations for the Year Ended August 31, 2012 |
| Investment Income: | ||||
| Interest | $ | 2,271,591 | ||
| Securities lending income | 1,601 | |||
| Total Income | 2,273,192 | |||
| Expenses: | ||||
| Advisory fee | 404,497 | |||
| Service and distribution plan fees | 202,248 | |||
| Auditing and legal fees | 75,992 | |||
| Transfer agent fees | 51,390 | |||
| Printing and postage | 48,248 | |||
| Custodian fees | 46,137 | |||
| Registration and filing fees | 37,466 | |||
| Directors’ fees and expenses | 17,542 | |||
| Insurance | 10,572 | |||
| Other | 14,496 | |||
| Total Expenses Before Fees Waived and Custody Credits | 908,588 | |||
| Less: Service and Distribution Plan Fees Waived | (202,248 | ) | ||
| Less: Custody Credits | (120 | ) | ||
| Net Expenses | 706,220 | |||
| Net Investment Income | 1,566,972 | |||
| Net Realized and Unrealized Gain/(Loss) on Investments: | ||||
| Net Realized Gain | 1,984,985 | |||
| Change in Net Unrealized Appreciation/(Depreciation) | (904,927 | ) | ||
| Net Realized Gain and Change in Net Unrealized Appreciation/(Depreciation) on Investments | 1,080,058 | |||
| Net Increase in Net Assets from Operations | $ | 2,647,030 | ||
See Notes to Financial Statements.
15
| Value Line U.S. Government Securities Fund, Inc. |
| Statement of Changes in Net Assets for the Years Ended August 31, 2012 and 2011 |
| Year Ended | Year Ended | |||||||
| August 31, 2012 | August 31, 2011 | |||||||
| Operations: | ||||||||
| Net investment income | $ | 1,566,972 | $ | 1,922,124 | ||||
| Net realized gain on investments | 1,984,985 | 1,416,088 | ||||||
| Change in net unrealized appreciation/(depreciation) | (904,927 | ) | (512,738 | ) | ||||
| Net increase in net assets from operations | 2,647,030 | 2,825,474 | ||||||
| Distributions to Shareholders: | ||||||||
| Net investment income | (1,861,489 | ) | (2,167,104 | ) | ||||
| Net realized gain from investment transactions | (1,670,740 | ) | (1,269,237 | ) | ||||
| Total Distributions | (3,532,229 | ) | (3,436,341 | ) | ||||
| Capital Share Transactions: | ||||||||
| Proceeds from sale of shares | 3,407,631 | 3,225,747 | ||||||
| Proceeds from reinvestment of dividends and distributions to shareholders | 3,161,640 | 3,049,842 | ||||||
| Cost of shares redeemed | (7,640,465 | ) | (10,680,017 | ) | ||||
| Net decrease in net assets from capital share transactions | (1,071,194 | ) | (4,404,428 | ) | ||||
| Total Decrease in Net Assets | (1,956,393 | ) | (5,015,295 | ) | ||||
| Net Assets: | ||||||||
| Beginning of year | 82,410,966 | 87,426,261 | ||||||
| End of year | $ | 80,454,573 | $ | 82,410,966 | ||||
| Undistributed net investment income, at end of year | $ | 29,047 | $ | 334,917 | ||||
See Notes to Financial Statements.
16
| Value Line U.S. Government Securities Fund, Inc. |
| Notes to Financial Statements |
1. Significant Accounting Policies
Value Line U.S. Government Securities Fund, Inc., (the “Fund”) is registered under the Investment Company Act of 1940, as amended, as a diversified, open-end management investment company whose primary investment objective is to obtain maximum income without undue risk to principal. Capital preservation and possible capital appreciation are secondary objectives.
The following significant accounting policies are in conformity with generally accepted accounting principles for investment companies. Such policies are consistently followed by the Fund in the preparation of its financial statements. Generally accepted accounting principles require management to make estimates and assumptions that affect the reported amounts and disclosures in the financial statements. Actual results may differ from those estimates, and such differences could be material.
(A) Security Valuation: The Fund’s investments are carried at fair value. With assistance from an independent pricing service (the “Service”) approved by the Board of Directors, portfolio securities are valued at the bid prices on the basis of valuations provided by dealers in such securities. Some of the general factors which may be considered by the dealers in arriving at such valuations include the fundamental analytic data relating to the security and an evaluation of the forces which influence the market in which these securities are purchased and sold. Determination of values may involve subjective judgment, as the actual market value of a particular security can be established only by negotiation between the parties in a sales transaction. If a portfolio security is not priced in this manner, the value is determined on the valuation date by reference to valuations obtained from the Service which determines valuations for normal institutional-size trading units of debt securities, without exclusive reliance upon quoted prices. The Service takes into account appropriate factors such as institutional-size trading in similar groups of securities, yield, quality, coupon rate, maturity, type of issue, trading characteristics and other market data in determining valuations. Short-term instruments with maturities of 60 days or less at the date of purchase are valued at amortized cost, which approximates market value. Other assets and securities for which market valuations are not readily available will be valued at fair value by the Adviser pursuant to policies and procedures adopted by the Board of Directors. At August 31, 2012, there were no securities that had been fair valued.
(B) Fair Value Measurements: The Fund follows fair valuation accounting standards (FASB ASC 820-10) which establish a definition of fair value and set out a hierarchy for measuring fair value. These standards require additional disclosures about the various inputs and valuation techniques used to develop the measurements of fair value and a discussion of changes in valuation techniques and related inputs during the period. These inputs are summarized in the three broad levels listed below:
| ● | Level 1 – Inputs that reflect unadjusted quoted prices in active markets for identical assets or liabilities that the Fund has the ability to access at the measurement date; |
| ● | Level 2 – Inputs other than quoted prices that are observable for the asset or liability either directly or indirectly, including inputs in markets that are not considered to be active; |
| ● | Level 3 – Inputs that are unobservable. |
Transfers between investment levels may occur as the markets fluctuate and/or the availability of data used in an investment’s valuation changes. The inputs or methodologies used for valuing securities are not necessarily an indication of the risk associated with investing in those securities.
17
| Value Line U.S. Government Securities Fund, Inc. |
| August 31, 2012 |
The following table summarizes the inputs used to value the Fund’s investments in securities as of August 31, 2012:
| Investments in Securities: | Level 1 | Level 2 | Level 3 | Total | ||||||||||||
| Assets | ||||||||||||||||
| U.S. Government Agency Obligations | $ | 0 | $ | 55,241,170 | $ | 0 | $ | 55,241,170 | ||||||||
| U.S. Treasury Obligations | 0 | 23,621,444 | 0 | 23,621,444 | ||||||||||||
| Short-Term Investments | 0 | 4,106,665 | 0 | 4,106,665 | ||||||||||||
| Total Investments in Securities | $ | 0 | $ | 82,969,279 | $ | 0 | $ | 82,969,279 | ||||||||
The Fund follows the updated provisions surrounding fair value measurements and disclosures on transfers in and out of all levels of the fair value hierarchy on a gross basis and the reasons for the transfers as well as to disclosures about the valuation techniques and inputs used to measure fair value for investments that fall in either Level 2 or Level 3 of the fair value hierarchy.
For the year ended August 31, 2012, there was no significant transfer activity between Level 1 and Level 2.
For the year ended August 31, 2012, there were no Level 3 investments. The Schedule of Investments includes a breakdown of the Schedule’s investments by category.
(C) Repurchase Agreements: In connection with transactions in repurchase agreements, the Fund’s custodian takes possession of the underlying collateral securities, the value of which exceeds the principal amount of the repurchase transaction, including accrued interest. To the extent that any repurchase transaction exceeds one business day, it is the Fund’s policy to mark-to-market on a daily basis to ensure the adequacy of the collateral. In the event of default of the obligation to repurchase, the Fund has the right to liquidate the collateral and apply the proceeds in satisfaction of the obligation. Under certain circumstances, in the event of default or bankruptcy by the other party to the agreement, realization and/or retention of the collateral or proceeds may be subject to legal proceedings.
In April 2011, the Financial Accounting Standards Board (“FASB”) issued an Accounting Standards Update (“ASU”) related to the accounting for repurchase agreements and similar agreements that both entitle and obligate a transferor to repurchase or redeem financial assets before their maturity. The ASU modifies the criteria for determining effective control of transferred assets and as a result certain agreements may be accounted for as secured borrowings. The ASU is effective prospectively for new transfers and existing transactions that are modified in the first interim or annual period beginning on or after December 15, 2011. The Fund is evaluating the implications of this change.
(D) Federal Income Taxes: It is the policy of the Fund to qualify as a regulated investment company by complying with the provisions available to regulated investment companies, as defined in the applicable sections of the Internal Revenue Code, and to distribute all of its investment income and capital gains to its shareholders. Therefore, no provision for federal income tax is required.
Management has analyzed the Fund’s tax positions taken on federal and state income tax returns for all open tax years (fiscal years ended August 31, 2009 through August 31, 2012), and has concluded that no provision for federal or state tax income tax is required in the Fund’s financial statements. The Fund’s federal and state income tax returns for tax years for which the applicable statutes of limitations have not expired are subject to examination by the Internal Revenue Service and state departments of revenue.
(E) Security Transactions and Related Income: Security transactions are accounted for on the date the securities are purchased or sold. Realized gains and losses on securities transactions are determined using the identified cost method. Interest income, adjusted for the amortization of discount and premium, is earned from settlement date and recognized on the accrual basis. Gains and losses realized on prepayments received on mortgage-related securities are recorded as interest income.
18
| Value Line U.S. Government Securities Fund, Inc. |
| Notes to Financial Statements |
The Fund may invest in Treasury Inflation-Protection Securities (TIPS). The principal value and interest payout of TIPS are periodically adjusted according to the rate of inflation based on the Consumer Price Index. The adjustments for principal and income due to inflation are reflected in interest income in the Statement of Operations.
(F) Representations and Indemnifications: In the normal course of business, the Fund enters into contracts that contain a variety of representations and warranties which provide general indemnifications. The Fund’s maximum exposure under these arrangements is unknown, as this would involve future claims that may be made against the Fund that have not yet occurred. However, based on experience, the Fund expects the risk of loss to be remote.
(G) Securities Lending: Under an agreement with State Street Bank & Trust (“State Street”), the Fund can lend its securities to brokers, dealers and other financial institutions approved by the Board of Directors. By lending its investment securities, the Fund attempts to increase its net investment income through receipt of interest on the loan. Any gain or loss in the market price of the securities loaned that might occur and any interest or dividends declared during the term of the loan would accrue to the account of the Fund. Risks of delay in recovery of the securities or even loss of rights in the collateral may occur should the borrower of the securities fail financially. Generally, in the event of a counter-party default, the Fund has the right to use the collateral to offset the losses incurred. The lending fees received and the Fund’s portion of the interest income earned on cash collateral are included in the Statement of Operations.
Upon entering into a securities lending transaction, the Fund receives cash or other securities as collateral in an amount equal to or exceeding 102% of the current market value of the loaned securities. Any cash received as collateral is invested by State Street Global Advisors, acting in its capacity as securities lending agent (the “Agent”), in The Value Line Funds collateral account, which is subsequently invested into joint repurchase agreements. A portion of the dividends received on the collateral is rebated to the borrower of the securities and the remainder is split between the Agent and the Fund.
The Fund enters into a joint repurchase agreement whereby its uninvested cash collateral from securities lending is deposited into a joint cash account with other funds managed by the investment adviser and is used to invest in one or more repurchase agreements. The value and face amount of the joint repurchase agreement are allocated to the funds based on their pro-rata interest. A repurchase agreement is accounted for as a loan by the fund to the seller, collateralized by securities which are delivered to the fund’s custodian. The market value, including accrued interest, of the initial collateralization is required to be at least 102% of the dollar amount invested by the funds, with the value of the underlying securities marked to market daily to maintain coverage of at least 100%. The joint repurchase agreement held by the Fund at fiscal year end had been entered into on August 31, 2012.
As of August 31, 2012, the Fund loaned securities which were collateralized by cash. The value of the securities on loan and the value of the related collateral were as follows:
| Value of | Total Collateral | |||||||||
| Securities | Value of | (including | ||||||||
| Loaned | Collateral | Calculated Mark) | ||||||||
| $ | 1,587,666 | $ | 1,615,968 | $ | 1,619,713 | |||||
(H) Subsequent Events: Management has evaluated all subsequent transactions and events through the date on which these financial statements were issued, and except as already included in the notes to these financial statements, has determined that no additional items require disclosure.
19
| Value Line U.S. Government Securities Fund, Inc. |
| August 31, 2012 |
2. Investment Risks
Securities issued by U.S. Government agencies or government-sponsored enterprises may not be guaranteed by the U.S. Treasury. The Government National Mortgage Association (“GNMA” or “Ginnie Mae”), a wholly-owned U.S. Government corporation, is authorized to guarantee, with the full faith and credit of the U.S. Government, the timely payment of principal and interest on securities issued by institutions approved by GNMA and backed by pools of mortgages insured by the Federal Housing Administration or guaranteed by the Department of Veteran Affairs. Government-related guarantors (i.e., not backed by the full faith and credit of the U.S. Government) include the Federal National Mortgage Association (“FNMA” or “Fannie Mae”) and the Federal Home Loan Mortgage Corporation (“FHLMC” or “Freddie Mac”). Pass-through securities issued by FNMA are guaranteed as to timely payment of principal and interest by FNMA but are not backed by the full faith and credit of the U.S. Government. FHLMC guarantees the timely payment of interest and ultimate collection of principal, but its participation certificates are not backed by the full faith and credit of the U.S. Government.
3. Capital Share Transactions and Dividends to Shareholders
Transactions in capital stock were as follows:
| Year Ended | Year Ended | |||||||
| August 31, 2012 | August 31, 2011 | |||||||
| Shares sold | 279,080 | 266,418 | ||||||
| Shares issued to shareholders in reinvestment of dividends and distributions | 261,601 | 255,299 | ||||||
| Shares redeemed | (625,941 | ) | (886,402 | ) | ||||
| Net decrease | (85,260 | ) | (364,685 | ) | ||||
| Dividends per share from net investment income | $ | 0.2815 | $ | 0.3158 | ||||
| Distributions per share from net realized gains | $ | 0.2556 | $ | 0.1837 | ||||
Dividends and distributions to shareholders are recorded on the ex-dividend date.
4. Purchases and Sales of Securities
Purchases and sales of investment securities, excluding short-term securities, were as follows:
| Year Ended | ||||
| August 31, 2012 | ||||
| Purchases: | ||||
| U.S. Treasury Obligations | $ | 69,554,715 | ||
| U.S. Government Agency Obligations | 22,729,368 | |||
| Total Purchases | $ | 92,284,083 | ||
| Sales: | ||||
| U.S. Treasury Obligations | $ | 67,028,918 | ||
| U.S. Government Agency Obligations | 13,577,871 | |||
| Total Sales | $ | 80,606,789 | ||
5. Income Taxes
At August 31, 2012, information on the tax components of capital is as follows:
| Cost of investments for tax purposes | $ | 79,172,573 | ||
| Gross tax unrealized appreciation | $ | 3,797,192 | ||
| Gross tax unrealized depreciation | (486 | ) | ||
| Net tax unrealized appreciation on investments | $ | 3,796,706 | ||
| Undistributed ordinary income | $ | 357,968 | ||
| Undistributed long-term gain | $ | 947,019 |
Permanent book-tax differences relating to the classification of income in the current year were reclassified within the composition of the net asset accounts. The Fund decreased undistributed net investment income by $11,353 and increased accumulated net realized gain on investments by $11,353. Net assets were not affected by this reclassification. These reclasses were primarily due to differing treatments of bond premiums for tax purposes.
20
| Value Line U.S. Government Securities Fund, Inc. |
| Notes to Financial Statements |
On December 22, 2010, the Regulated Investment Company Modernization Act of 2010 (“the Act”) was signed by the President. Under the Act, net capital losses recognized by the Portfolio after December 31, 2010, may get carried forward indefinitely, and retain their character as short-term and/or long term losses. Prior to this Act, pre-enactment net capital losses incurred by the Fund were carried forward for eight years and treated as short-term losses. The Act requires under the transition that post-enactment net capital losses are used before pre-enactment net capital losses.
The tax composition of dividends paid during the years ended August 31, 2012 and August 31, 2011 is as follows:
| August 31, | August 31, | |||||||
| 2012 | 2011 | |||||||
| Ordinary income | $ | 2,532,203 | $ | 2,417,815 | ||||
| Long-term capital gain | 1,000,026 | 1,018,526 | ||||||
| $ | 3,532,229 | $ | 3,436,341 | |||||
6. Investment Advisory Fees, Service and Distribution Fees and Transactions With Affiliates
An advisory fee of $404,497 was paid or payable to EULAV Asset Management (the “Adviser”) for the year ended August 31, 2012. This was computed at the rate of 0.50% of the Fund’s average daily net assets during the year and paid monthly. The Adviser provides research, investment programs, supervision of the investment portfolio and pays costs of administrative services, office space, equipment and compensation of administrative, bookkeeping, and clerical personnel necessary for managing the affairs of the Fund. The Adviser also provides persons, satisfactory to the Fund’s Board of Directors, to act as officers and employees of the Fund and pays their salaries.
The Fund has a Service and Distribution Plan (the “Plan”), adopted pursuant to Rule 12b-1 under the Investment Company Act of 1940, which compensates EULAV Securities LLC (the “Distributor”) for advertising, marketing and distributing the Fund’s shares and for servicing the Fund’s shareholders at an annual rate of 0.25% of the Fund’s average daily net assets. Fees amounting to $202,248, before fee waivers, were accrued under the Plan for the year ended August 31, 2012. Effective January 1, 2009 through December 31, 2014, the Distributor contractually agreed to waive the 12b-1 fee. There is no assurance that the Distributor will extend the fee waiver beyond such date. For the year ended August 31, 2012, all 12b-1 fees were waived. The Distributor has no right to recoup previously waived amounts.
For the year ended August 31, 2012, the Fund’s expenses were reduced by $120 under a custody credit arrangement with the custodian.
Direct expenses of the Fund are charged to the Fund while common expenses of the Value Line Funds are allocated proportionately based upon the Funds’ respective net assets. The Fund bears all other costs and expenses.
Certain officers and a Trustee of the Adviser are also officers and a director of the Fund. At August 31, 2012, the officers and Director of the Fund as a group owned 572 shares, representing less than 1% of the outstanding shares.
21
| Value Line U.S. Government Securities Fund, Inc. |
| Financial Highlights |
Selected data for a share of capital stock outstanding throughout each year:
| Years Ended August 31, | ||||||||||||||||||||
| 2012 | 2011 | 2010 | 2009 | 2008 | ||||||||||||||||
| Net asset value, beginning of year | $ | 12.34 | $ | 12.41 | $ | 12.06 | $ | 11.62 | $ | 11.42 | ||||||||||
| Income from investment operations: | ||||||||||||||||||||
| Net investment income | 0.24 | 0.28 | 0.35 | 0.40 | 0.46 | |||||||||||||||
| Net gains on securities (both realized and unrealized) | 0.16 | 0.15 | 0.44 | 0.45 | 0.24 | |||||||||||||||
| Total from investment operations | 0.40 | 0.43 | 0.79 | 0.85 | 0.70 | |||||||||||||||
| Less distributions: | ||||||||||||||||||||
| Dividends from net investment income | (0.28 | ) | (0.32 | ) | (0.36 | ) | (0.41 | ) | (0.50 | ) | ||||||||||
| Distributions from net realized gains | (0.26 | ) | (0.18 | ) | (0.08 | ) | — | — | ||||||||||||
| Total distributions | (0.54 | ) | (0.50 | ) | (0.44 | ) | (0.41 | ) | (0.50 | ) | ||||||||||
| Net asset value, end of year | $ | 12.20 | $ | 12.34 | $ | 12.41 | $ | 12.06 | $ | 11.62 | ||||||||||
| Total return | 3.32 | % | 3.65 | % | 6.69 | % | 7.46 | % | 6.22 | % | ||||||||||
| Ratios/Supplemental Data: | ||||||||||||||||||||
| Net assets, end of year (in thousands) | $ | 80,455 | $ | 82,411 | $ | 87,426 | $ | 89,609 | $ | 87,919 | ||||||||||
Ratio of expenses to average net assets(1) | 1.12 | % | 1.09 | % | 1.03 | %(2) | 1.07 | % | 1.01 | % | ||||||||||
Ratio of expenses to average net assets(3) | 0.87 | % | 0.84 | % | 0.77 | %(4) | 0.82 | % | 0.76 | % | ||||||||||
| Ratio of net investment income to average net assets | 1.94 | % | 2.31 | % | 2.87 | % | 3.37 | % | 3.96 | % | ||||||||||
| Portfolio turnover rate | 103 | % | 71 | % | 50 | % | 58 | % | 51 | % | ||||||||||
| (1) | Ratio reflects expenses grossed up for the custody credit arrangement and grossed up for the waiver of the service and distribution plan fees by the Distributor. The ratio of expenses to average net assets, net of custody credits, but exclusive of the fee waivers would have been 1.00% for the year ended August 31, 2008 and would have been unchanged for the other years shown. |
| (2) | Ratio reflects expenses grossed up for the reimbursement by Value Line, Inc. of certain expenses incurred by the Fund. |
| (3) | Ratio reflects expenses net of the custody credit arrangement and net of the waiver of the service and distribution plan fees by the Distributor. |
| (4) | Ratio reflects expenses net of the reimbursement by Value Line, Inc. of certain expenses incurred by the Fund. |
See Notes to Financial Statements.
22
| Value Line U.S. Government Securities Fund, Inc. |
| Report of Independent Registered Public Accounting Firm |
To the Board of Directors and Shareholders of Value Line U.S. Government Securities Fund, Inc.
In our opinion, the accompanying statement of assets and liabilities, including the schedule of investments, and the related statements of operations and of changes in net assets and the financial highlights present fairly, in all material respects, the financial position of Value Line U.S. Government Securities Fund, Inc. (the “Fund”) at August 31, 2012, the results of its operations for the year then ended, the changes in its net assets for each of the two years in the period then ended and the financial highlights for each of the five years in the period then ended, in conformity with accounting principles generally accepted in the United States of America. These financial statements and financial highlights (hereafter referred to as “financial statements”) are the responsibility of the Fund’s management. Our responsibility is to express an opinion on these financial statements based on our audits. We conducted our audits of these financial statements in accordance with the standards of the Public Company Accounting Oversight Board (United States). Those standards require that we plan and perform the audit to obtain reasonable assurance about whether the financial statements are free of material misstatement. An audit includes examining, on a test basis, evidence supporting the amounts and disclosures in the financial statements, assessing the accounting principles used and significant estimates made by management, and evaluating the overall financial statement presentation. We believe that our audits, which included confirmation of securities at August 31, 2012 by correspondence with the custodian and brokers, provide a reasonable basis for our opinion.
PricewaterhouseCoopers LLP
New York, New York
October 25, 2012
23
Annual Report
FACTORS CONSIDERED BY THE BOARD IN APPROVING CONTINUANCE OF
THE INVESTMENT ADVISORY AGREEMENT
FOR VALUE LINE U.S. GOVERNMENT SECURITIES FUND, INC.
The Investment Company Act of 1940 (the “1940 Act”) requires the Board of Directors, including a majority of Directors who are not “interested persons” of Value Line U.S. Government Securities Fund, Inc. (the “Fund”), as that term is defined in the 1940 Act (the “Independent Directors”), to annually consider the continuance of the Fund’s investment advisory agreement (“Agreement”) with its investment adviser, EULAV Asset Management.1
In considering whether the continuance of the Agreement was in the best interests of the Fund and its shareholders, the Board requested and the Adviser provided such information as the Board deemed to be reasonably necessary to evaluate the terms of the Agreement. At meetings held throughout the year, including the meeting specifically focused upon the review of the Agreement, the Independent Directors met in executive sessions separately from the non-Independent Director of the Fund and any officers of the Adviser. In selecting the Adviser and approving the continuance of the Agreement, the Independent Directors relied upon the assistance of counsel to the Independent Directors.
Both in the meeting specifically focused upon the review of the Agreement and at other meetings, the Board, including the Independent Directors, received materials relating to the Adviser’s investment and management services under the Agreement. These materials included information on: (i) the investment performance of the Fund, compared to a peer group of funds consisting of the Fund and all retail and institutional intermediate U.S. government funds regardless of asset size or primary channel of distribution (the “Performance Universe”), and its benchmark index, each as classified and prepared by Lipper Inc., an independent evaluation service (“Lipper”); (ii) the investment process, portfolio holdings, investment restrictions, valuation procedures, and financial statements for the Fund; (iii) sales and redemption data with respect to the Fund; (iv) the general investment outlook in the markets in which the Fund invests; (v) arrangements with respect to the distribution of the Fund’s shares; (vi) the allocation and cost of the Fund’s brokerage (none of which was effected through any affiliate of the Adviser); and (vii) the overall nature, quality and extent of services provided by the Adviser.
1 For periods prior to December 23, 2010, the term “Adviser” means the Adviser’s predecessor entities that previously served as the Fund’s adviser, EULAV Asset Management, LLC and Value Line, Inc. (“VLI”). Likewise, for periods prior to December 23, 2010, the term “Distributor” refers to the predecessor entities of the Fund’s current distributor, EULAV Securities LLC (the “Distributor”), which included EULAV Securities, Inc. and Value Line Securities, Inc.
24
As part of their review, the Board requested, and the Adviser provided, additional information in order to evaluate the quality of the Adviser’s services and the reasonableness of its fees under the Agreement. In a separate executive session, the Independent Directors reviewed information, which included data comparing: (i) the Fund’s management fee, transfer agent and custodian fees, Rule 12b-1 fee, and other non-management expenses, to those incurred by a peer group of funds consisting of the Fund and eight other retail no-load intermediate U.S. government funds (excluding outliers), as selected objectively by Lipper (“Expense Group”), and a peer group of funds consisting of the Fund, the Expense Group and all other retail no-load intermediate U.S. government funds (excluding outliers), as selected objectively by Lipper (“Expense Universe”); (ii) the Fund’s expense ratio to those of its Expense Group and Expense Universe; and (iii) the Fund’s investment performance over various time periods to the average performance of the Performance Universe as well as the appropriate Lipper Index, as selected objectively by Lipper (the “Lipper Index”).
In the separate executive session, the Independent Directors also reviewed information regarding: (a) the financial results and condition of the Adviser, and the Adviser’s and certain of its affiliates’ profitability from the services that have been performed for the Fund and the Value Line family of funds; (b) the Adviser’s investment management staffing and resources; (c) the ownership, control and day-to-day management of the Adviser, including representations of VLI that it does not “control” (as that term is defined in the 1940 Act) either the Adviser or Value Line Securities, Inc.; and (d) the Fund’s potential for achieving economies of scale. In support of its review of the statistical information, the Board was provided with a detailed description of the methodology used by Lipper to determine the Expense Group, the Expense Universe and the Performance Universe to prepare its information.
The following summarizes matters considered by the Board in connection with its continuance of the Agreement. However, the Board did not identify any single factor as all-important or controlling, and the summary does not detail all the matters that were considered.
Investment Performance. The Board reviewed the Fund’s overall investment performance and compared it to its Performance Universe and the Lipper Index. The Board noted that the Fund underperformed the Performance Universe average and the Lipper Index for the one-year, three-year, and five-year periods ended March 31, 2012. The Board also noted that the Fund’s performance for the ten-year period ended March 31, 2012 was slightly above the performance of the Performance Universe average but not the Lipper Index.
The Adviser’s Personnel and Methods. The Board reviewed the background of the portfolio manager responsible for the daily management of the Fund’s portfolio, seeking to achieve the Fund’s investment objectives and adhering to the Fund’s investment strategies. The Independent Directors also engaged in discussions with the Adviser’s senior management responsible for the overall functioning of the Fund’s investment operations. The Board viewed favorably (i) the Adviser’s use of analytic tools in support of the portfolio management, compliance and shareholder relation functions which the Adviser previously committed resources to acquire, (ii) continuity of the Adviser’s staff attributable in part to its actions previously taken to attract and retain personnel, including its prior improvements to employee benefit programs and increased base compensation and merit-based compensation for certain staff members to be more industry competitive, and (iii) that the Adviser continues to receive the Value Line ranking systems without cost. The Board concluded that the Fund’s management team and the Adviser’s overall resources were adequate and that the Adviser had investment management capabilities and personnel essential to performing its duties under the Agreement.
25
Management Fee and Expenses. The Board considered the Adviser’s management fee under the Agreement relative to the management fee applicable to the funds in the Expense Group and Expense Universe averages, both before and after applicable fee waivers. Before giving effect to fee waivers applicable to certain funds in the Expense Group, the Board noted that, for the most recent fiscal year for which audited financial data is available, the Fund’s management fee rate was less than that of the Expense Group average. After giving effect to applicable fee waivers, the Board also noted that, for the most recent fiscal year for which audited financial data is available, the Fund’s management fee rate was less than that of the Expense Group average and the Expense Universe average. The Board concluded that the Fund’s management fee rate was satisfactory for the purpose of approving continuance of the Agreement.
The Board also considered the Fund’s total expense ratio relative to its Expense Group and Expense Universe averages. The Distributor and the Board agreed that the Distributor will extend the existing contractual waiver of the Fund’s Rule 12b-1 fee for another one-year period ending December 31, 2014. This waiver effectively reduces the Fund’s Rule 12b-1 fee rate from 0.25% to 0% of the Fund’s average daily net assets. Such waiver cannot be changed during the contractual waiver period without the Board’s approval. The Board noted that, for the most recent fiscal year for which audited financial data is available, the Fund’s expense ratio was less than that of the Expense Group average and the Expense Universe average, after giving effect to fee waivers applicable to the Fund and certain funds in the Expense Group and Universe. The Board concluded that the average expense ratio was satisfactory for the purpose of approving continuance of the Agreement.
Nature, Extent and Quality of Services. The Board considered the nature, extent and quality of other services provided by the Adviser and the Distributor. At meetings held throughout the year, the Board reviewed the resources and effectiveness of the Adviser’s overall compliance program, as well as the services provided by the Distributor. The Board viewed favorably the additional resources devoted by the Adviser to enhance its and the Fund’s overall compliance program as well as steps being undertaken to enhance the shareholders’ experience with the Fund, such as a more robust website. The Board reviewed the services provided by the Adviser and its affiliates in supervising the Fund’s third party service providers. Based on this review, the Board concluded that the nature, quality, cost, and extent of such other services provided by the Adviser and its affiliates were satisfactory, reliable and beneficial to the Fund’s shareholders.
26
Profitability. The Board considered the level of profitability of the Adviser and its affiliates with respect to the Fund individually and in the aggregate for all the funds within the Value Line group of funds, including the impact of the restructuring and certain actions taken during prior years. These actions included the reduction (voluntary in some instances and contractual in other instances) of management and/or Rule 12b-1 fees for certain funds, the Adviser’s termination of the use of soft dollar research, and the cessation of trading through the Distributor. The Board also considered the Adviser’s continued attention to the rationalization and differentiation of funds within the Value Line group of funds to better identify opportunities for savings and efficiencies among the funds. The Board concluded that the profitability of the Adviser and its affiliates with respect to the Fund, including the financial results derived from the Fund’s Agreement, were within a range the Board considered reasonable.
Other Benefits. The Board also considered the character and amount of other direct and incidental benefits received by the Adviser and its affiliates from their association with the Fund. The Board concluded that potential “fall-out” benefits that the Adviser and its affiliates may receive, such as greater name recognition, appear to be reasonable, and may in some cases benefit the Fund.
Economies of Scale. The Board considered that, given the current and anticipated size of the Fund, any perceived and potential economies of scale were not yet a significant consideration for the Fund and that the addition of break points to the fee structure was not currently necessary.
Fees and Services Provided for Other Comparable Funds/Accounts Managed by the Adviser and its Affiliates. The Board was informed by the Adviser that the Adviser does not manage any non-mutual fund account that has similar objectives and policies as those of the Fund.
Conclusion. The Board examined the totality of the information it was provided at the meeting specifically addressing approval of the Agreement and at other meetings held during the past year and did not identify any single controlling factor. Based on its evaluation of all material factors deemed relevant and with the advice of independent counsel, the Board concluded that the rate at which the Fund pays a management fee to the Adviser under the Agreement does not constitute a fee that is so disproportionately large as to bear no reasonable relationship to the services rendered and that could not have been the product of arm’s-length bargaining. Further, the Board concluded that the Fund’s Agreement, and the management fee rate thereunder, is fair and reasonable and voted to continue the Agreement as in the best interest of the Fund and its shareholders.
27
| Value Line U.S. Government Securities Fund, Inc. |
| Federal Tax Notice (unaudited) |
| During the year ended August 31, 2012, the Fund distributed $1,000,026 from long-term capital gains. |
The Fund files its complete schedule of portfolio holdings with the Securities and Exchange Commission (“SEC”) for the first and third quarters of each fiscal year on Form N-Q. The Fund’s Forms N-Q are available on the SEC’s website at http://www.sec.gov and may be reviewed and copied at the SEC’s Public Reference Room in Washington, D.C. Information on the operation of the Public Reference Room may be obtained by calling 1-800-SEC-0330.
A description of the policies and procedures that the Fund uses to determine how to vote proxies relating to portfolio securities, and information regarding how the Fund voted these proxies for the 12-month period ended June 30 is available through the Fund’s website at http://www.vlfunds.com and on the SEC’s website at http://www.sec.gov. The description of the policies and procedures is also available without charge, upon request, by calling 1-800-243-2729.
28
| Value Line U.S. Government Securities Fund, Inc. |
| Management of the Fund |
MANAGEMENT INFORMATION
The business and affairs of the Fund are managed by the Fund’s officers under the direction of the Board of Directors. The following table sets forth information on each Director and Officer of the Fund. Each Director serves as a director or trustee of each of the 12 Value Line Funds. Each Director serves until his or her successor is elected and qualified.
| Length of | Principal Occupation | |||||
| Name, Address, and YOB | Position | Time Served | During the Past 5 Years | |||
| Interested Director* | ||||||
Mitchell E. Appel YOB: 1970 Other Directorships: None | Director | Since 2010 | President of each of the Value Line Funds since June 2008; Chief Financial Officer of Value Line, Inc. (“Value Line”) from April 2008 to December 2010 and from September 2005 to November 2007; Director from February 2010 to December 2010; Chief Financial Officer of XTF Asset Management from November 2007 to April 2008; Chief Financial Officer of the Distributor since April 2008 and President since February 2009; President of the Adviser since February 2009, Trustee since December 2010 and Treasurer since January 2011. | |||
| Non-Interested Directors | ||||||
Joyce E. Heinzerling 500 East 77th Street New York, NY 10162 YOB: 1956 Other Directorships: Burnham Investors Trust, since 2004 (4 funds). | Director | Since 2008 | President, Meridian Fund Advisers LLC. (consultants) since April 2009; General Counsel, Archery Capital LLC (private investment fund) until April 2009. | |||
Francis C. Oakley 54 Scott Hill Road Williamstown, MA 01267 YOB: 1931 Other Directorships: None | Director | Since 2000 | Professor of History, Williams College, (1961-2002). Professor Emeritus since 2002; President Emeritus since 1994 and President, (1985-1994); Chairman (1993-1997) and Interim President (2002-2003) of the American Council of Learned Societies. Trustee since 1997and Chairman of the Board since 2005, National Humanities Center. | |||
David H. Porter 5 Birch Run Drive Saratoga Springs, NY 12866 YOB: 1935 Other Directorships: None | Director | Since 1997 | Professor, Skidmore College since 2008; Visiting Professor of Classics, Williams College, (1999-2008); President Emeritus, Skidmore College since 1999 and President, (1987-1998). | |||
Paul Craig Roberts 169 Pompano St. Panama City Beach, FL 32413 YOB: 1939 Other Directorships: None | Director | Since 1983 | Chairman, Institute for Political Economy. |
29
| Value Line U.S. Government Securities Fund, Inc. |
| Management of the Fund |
| Length of | Principal Occupation | |||||
| Name, Address, and YOB | Position | Time Served | During the Past 5 Years | |||
Nancy-Beth Sheerr 1409 Beaumont Drive Gladwyne, PA 19035 YOB: 1949 Other Directorships: None | Director | Since 1996 | Senior Financial Adviser, Veritable L.P. (Investment Adviser). | |||
Daniel S. Vandivort 59 Indian Head Road Riverside, CT 06878 YOB: 1954 Other Directorships: None | Director (Chairman of Board since 2010) | Since 2008 | President, Chief Investment Officer, Weiss, Peck and Greer/Robeco Investment Management (2005-2007); Managing Director, Weiss, Peck and Greer, (1995-2005). | |||
| Officers | ||||||
Mitchell E. Appel YOB: 1970 | President | Since 2008 | President of each of the Value Line Funds since June 2008; Chief Financial Officer of Value Line from April 2008 to December 2010 and from September 2005 to November 2007; Director from February 2010 to December 2010; Chief Financial Officer of XTF Asset Management from November 2007 to April 2008; Chief Financial Officer of the Distributor since April 2008 and President since February 2009; President of the Adviser since February 2009, Trustee since December 2010 and Treasurer since January 2011. | |||
Michael J. Wagner YOB: 1950 | Chief Compliance Officer | Since 2009 | Chief Compliance Officer Value Line Funds since June 2009; President of Northern Lights Compliance Service, LLC (formerly Fund Compliance Services, LLC (2006 – present)) and Senior Vice President (2004 – 2006) and President and Chief Operations Officer (2003 – 2006) of Gemini Fund Services, LLC; Director of Constellation Trust Company until 2008. | |||
Emily D. Washington YOB: 1979 | Treasurer and Secretary | Since 2008 | Treasurer and Chief Financial Officer (Principal Financial and Accounting Officer) of each of the Value Line Funds since August 2008 and Secretary since 2010; Associate Director of Mutual Fund Accounting at Value Line until August 2008. |
| * | Mr. Appel is an “interested person” as defined in the Investment Company Act of 1940 by virtue of his position with the Adviser and Distributor. |
Unless otherwise indicated, the address for each of the above officers is c/o Value Line Funds, 7 Times Square, New York, NY 10036.
| The Fund’s Statement of Additional Information (SAI) includes additional information about the Fund’s Directors and is available, without charge, upon request by calling 1-800-243-2729 or on the Fund’s website, www.vlfunds.com. |
30
| Value Line U.S. Government Securities Fund, Inc. |
[This Page Intentionally Left Blank.]
31
| Value Line U.S. Government Securities Fund, Inc. |
| The Value Line Family of Funds |
In 1950, Value Line started its first mutual fund. Since then, knowledgeable investors have been relying on the Value Line Funds to help them build their financial futures. Over the years, Value Line Funds has evolved into what we are today – a diversified family of no-load mutual funds with a wide range of investment objectives – ranging from small, mid and large capitalization equities to taxable and tax-exempt fixed income. We also provide strategies that effectively combine both equities and fixed income, diligently taking into account the potential risk and reward of each investment.
1950 — The Value Line Fund seeks long-term growth of capital. Current income is a secondary objective.
1952 — Value Line Income and Growth Fund’s primary investment objective is income, as high and dependable as is consistent with reasonable risk. Capital growth to increase total return is a secondary objective.
1956 — Value Line Premier Growth Fund seeks long-term growth of capital. No consideration is given to current income in the choice of investments.
1972 — Value Line Larger Companies Fund’s sole investment objective is to realize capital growth.
1979 — Value Line U.S. Government Money Market Fund, a money market fund, seeks to secure as high a level of current income as is consistent with maintaining liquidity and preserving capital. An investment in the Fund is not insured or guaranteed by the Federal Deposit Insurance Corporation or any other government agency. Although the Fund seeks to preserve the value of your investment at $1.00 per share, it is possible to lose money by investing in the Fund.
1981 — Value Line U.S. Government Securities Fund seeks maximum income without undue risk to capital. Under normal conditions, at least 80% of the value of its net assets will be invested in securities issued or guaranteed by the U.S. Government and its agencies and instrumentalities.
1983 — Value Line Centurion Fund* seeks long-term growth of capital.
1984 — The Value Line Tax Exempt Fund seeks to provide investors with the maximum income exempt from federal income taxes while avoiding undue risk to principal. The fund may be subject to state and local taxes and the Alternative Minimum Tax (if applicable).
1986 — Value Line Aggressive Income Trust seeks to maximize current income.
1987 — Value Line Strategic Asset Management Trust* seeks to achieve a high total investment return consistent with reasonable risk.
1993 — Value Line Emerging Opportunities Fund invests in U.S. common stocks of small capitalization companies, with its primary objective being long-term growth of capital.
1993 — Value Line Asset Allocation Fund seeks high total investment return, consistent with reasonable risk. The Fund invests in stocks, bonds and money market instruments utilizing quantitative modeling to determine the asset mix.
| * | Only available through the purchase of Guardian Investor, a tax deferred variable annuity, or ValuePlus, a variable life insurance policy. |
For more complete information about any of the Value Line Funds, including charges and expenses, send for a prospectus from EULAV Securities LLC, 7 Times Square, New York, New York 10036-6524 or call 1-800-243-2729, 9am-5pm CST, Monday-Friday, or visit us at www.vlfunds.com. Read the prospectus carefully before you invest or send money.
32
Item 2. Code of Ethics
(a) The Registrant has adopted a Code of Ethics that applies to its principal executive officer, and principal financial officer and principal accounting officer.
(f) Pursuant to item 12(a), the Registrant is attaching as an exhibit a copy of its Code of Ethics that applies to its principal executive officer, and principal financial officer and principal accounting officer.
Item 3. Audit Committee Financial Expert.
(a)(1)The Registrant has an Audit Committee Financial Expert serving on its Audit Committee.
(2) The Registrant’s Board has designated Daniel S.Vandivort, a member of the Registrant’s Audit Committee, as the Registrant’s Audit Committee Financial Expert. Mr. Vansivort is an independent director who has served as President,Chief Investment Officer to Weis,Peck and Greer/Robeco Investment Management. He has also previously served as Managing Director for Weis,Peck and Greer(1995-2005).
A person who is designated as an “audit committee financial expert” shall not make such person an "expert" for any purpose, including without limitation under Section 11 of the Securities Act of 1933 or under applicable fiduciary laws, as a result of being designated or identified as an audit committee financial expert. The designation or identification of a person as an audit committee financial expert does not impose on such person any duties, obligations, or liabilities that are greater than the duties, obligations, and liabilities imposed on such person as a member of the audit committee and Board of Trustees in the absence of such designation or identification.
Item 4. Principal Accountant Fees and Services
(a)Audit Fees 2012 - $21,284
(b) Audit-Related fees – None.
(c) Tax Preparation Fees 2012 -$7,859
(d) All Other Fees – None
(e) (1) Audit Committee Pre-Approval Policy. All services to be performed for the Registrant by PricewaterhouseCoopers LLP must be pre-approved by the audit committee.
(e) (2) Not applicable.
(f) Not applicable.
(g) Aggregate Non-Audit Fees 2012 -$1,550
(h) Not applicable.
Item 11. Controls and Procedures.
| (a) | The registrant’s principal executive officer and principal financial officer have concluded that the registrant’s disclosure controls and procedures (as defined in rule 30a-2(c) under the Act (17 CFR 270.30a-2(c) ) based on their evaluation of these controls and procedures as of a date within 90 days of the filing date of this report, are appropriately designed to ensure that material information relating to the registrant is made known to such officers and are operating effectively. |
| (b) | The registrant’s principal executive officer and principal financial officer have determined that there have been no significant changes in the registrant’s internal controls or in other factors that could significantly affect these controls subsequent to the date of their evaluation, including corrective actions with regard to significant deficiencies and material weaknesses. |
Item 12. Exhibits.
| (a) | Code of Business Conduct and Ethics for Principal Executive and Senior Financial Officers attached hereto as Exhibit 99.COE |
| (b) | (1) Certification pursuant to Rule 30a-2(a) under the Investment Company Act of 1940 (17 CFR 270.30a-2) attached hereto as Exhibit 99.CERT. |
(2) Certification pursuant to Section 906 of the Sarbanes-Oxley Act of 2002 attached hereto as Exhibit 99.906.CERT. |
SIGNATURES
Pursuant to the requirements of the Securities Exchange Act of 1934 and the Investment Company Act of 1940, the registrant has duly caused this report to be signed on its behalf by the undersigned, thereunto duly authorized.
| By: | /s/ Mitchell E. Appel | |
| Mitchell E. Appel, President | ||
| Date: | November 6, 2012 | |
| Pursuant to the requirements of the Securities Exchange Act of 1934 and the Investment Company Act of 1940, this report has been signed below by the following persons on behalf of the registrant and in the capacities and on the dates indicated. | ||
| By: | /s/ Mitchell E. Appel | |
| Mitchell E. Appel, President, Principal Executive Officer | ||
| By: | /s/ Emily D. Washington | |
| Emily D. Washington, Treasurer, Principal Financial Officer | ||
| Date: | November 6, 2012 | |