00003525412024FYfalse00000524850000107832http://fasb.org/us-gaap/2024#PropertyPlantAndEquipmentNethttp://fasb.org/us-gaap/2024#PropertyPlantAndEquipmentNethttp://fasb.org/us-gaap/2024#OtherLiabilitiesCurrenthttp://fasb.org/us-gaap/2024#OtherLiabilitiesCurrenthttp://fasb.org/us-gaap/2024#OtherLiabilitiesNoncurrenthttp://fasb.org/us-gaap/2024#OtherLiabilitiesNoncurrenthttp://fasb.org/us-gaap/2024#PropertyPlantAndEquipmentNethttp://fasb.org/us-gaap/2024#PropertyPlantAndEquipmentNethttp://fasb.org/us-gaap/2024#PropertyPlantAndEquipmentNethttp://fasb.org/us-gaap/2024#PropertyPlantAndEquipmentNethttp://fasb.org/us-gaap/2024#PropertyPlantAndEquipmentNethttp://fasb.org/us-gaap/2024#PropertyPlantAndEquipmentNethttp://fasb.org/us-gaap/2024#OtherLiabilitiesCurrenthttp://fasb.org/us-gaap/2024#OtherLiabilitiesCurrenthttp://fasb.org/us-gaap/2024#OtherLiabilitiesCurrenthttp://fasb.org/us-gaap/2024#OtherLiabilitiesCurrenthttp://fasb.org/us-gaap/2024#OtherLiabilitiesCurrenthttp://fasb.org/us-gaap/2024#OtherLiabilitiesCurrenthttp://fasb.org/us-gaap/2024#OtherLiabilitiesNoncurrenthttp://fasb.org/us-gaap/2024#OtherLiabilitiesNoncurrenthttp://fasb.org/us-gaap/2024#OtherLiabilitiesNoncurrenthttp://fasb.org/us-gaap/2024#OtherLiabilitiesNoncurrenthttp://fasb.org/us-gaap/2024#OtherLiabilitiesNoncurrenthttp://fasb.org/us-gaap/2024#OtherLiabilitiesNoncurrent
UNITED STATES
SECURITIES AND EXCHANGE COMMISSION
WASHINGTON, D.C. 20549
FORM 10-K
☒ ANNUAL REPORT PURSUANT TO SECTION 13 OR 15(d) OF THE SECURITIES EXCHANGE ACT OF 1934
For the fiscal year ended December 31, 2024
or
☐ TRANSITION REPORT PURSUANT TO SECTION 13 OR 15(d) OF THE SECURITIES EXCHANGE ACT OF 1934
For the transition period from to
Name of Registrant, State of Incorporation, Address of Principal Executive Offices, Telephone Number, Commission File Number, IRS Employer Identification Number
ALLIANT ENERGY CORPORATION
(a Wisconsin Corporation)
4902 N. Biltmore Lane
Madison, Wisconsin 53718
Telephone (608) 458-3311
Commission File Number - 1-9894
IRS Employer Identification Number - 39-1380265
INTERSTATE POWER & LIGHT COMPANY
(an Iowa corporation)
Alliant Energy Tower
Cedar Rapids, Iowa 52401
Telephone (319) 786-4411
Commission File Number - 1-4117
IRS Employer Identification Number - 42-0331370
WISCONSIN POWER & LIGHT COMPANY
(a Wisconsin corporation)
4902 N. Biltmore Lane
Madison, Wisconsin 53718
Telephone (608) 458-3311
Commission File Number - 0-337
IRS Employer Identification Number - 39-0714890
This combined Form 10-K is separately filed by Alliant Energy Corporation, Interstate Power and Light Company and Wisconsin Power and Light Company. Information contained in the Form 10-K relating to Interstate Power and Light Company and Wisconsin Power and Light Company is filed by each such registrant on its own behalf. Each of Interstate Power and Light Company and Wisconsin Power and Light Company makes no representation as to information relating to registrants other than itself.
Securities registered pursuant to Section 12(b) of the Act:
Alliant Energy Corporation, Common Stock, $0.01 Par Value, Trading Symbol LNT, Nasdaq Global Select Market
Securities registered pursuant to Section 12(g) of the Act: None
Indicate by check mark if the registrant is a well-known seasoned issuer, as defined in Rule 405 of the Securities Act.
Alliant Energy Corporation - Yes ☒ No ☐
Interstate Power and Light Company - Yes ☒ No ☐
Wisconsin Power and Light Company - Yes ☒ No ☐
Indicate by check mark if the registrant is not required to file reports pursuant to Section 13 or Section 15(d) of the Act.
Alliant Energy Corporation - Yes ☐ No ☒
Interstate Power and Light Company - Yes ☐ No ☒
Wisconsin Power and Light Company - Yes ☐ No ☒
Indicate by check mark whether the registrant (1) has filed all reports required to be filed by Section 13 or 15(d) of the Securities Exchange Act of 1934 during the preceding 12 months (or for such shorter period that the registrants were required to file such reports) and (2) has been subject to such filing requirements for the past 90 days.
Alliant Energy Corporation - Yes ☒ No ☐
Interstate Power and Light Company - Yes ☒ No ☐
Wisconsin Power and Light Company - Yes ☒ No ☐
Indicate by check mark whether the registrant has submitted electronically every Interactive Data File required to be submitted pursuant to Rule 405 of Regulation S-T (§232.405 of this chapter) during the preceding 12 months (or for such shorter period that the registrant was required to submit such files).
Alliant Energy Corporation - Yes ☒ No ☐
Interstate Power and Light Company - Yes ☒ No ☐
Wisconsin Power and Light Company - Yes ☒ No ☐
Indicate by check mark whether the registrant is a large accelerated filer, accelerated filer, non-accelerated filer, smaller reporting company, or emerging growth company. See the definitions of “large accelerated filer,” “accelerated filer,” “smaller reporting company,” and “emerging growth company” in Rule 12b-2 of the Exchange Act.
Alliant Energy Corporation - Large Accelerated Filer ☒ Accelerated Filer ☐ Non-accelerated Filer ☐ Smaller Reporting Company ☐ Emerging Growth Company ☐
Interstate Power and Light Company - Large Accelerated Filer ☐ Accelerated Filer ☐ Non-accelerated Filer ☒ Smaller Reporting Company ☐ Emerging Growth Company ☐
Wisconsin Power and Light Company - Large Accelerated Filer ☐ Accelerated Filer ☐ Non-accelerated Filer ☒ Smaller Reporting Company ☐ Emerging Growth Company ☐
If an emerging growth company, indicate by check mark if the registrant has elected not to use the extended transition period for complying with any new or revised financial accounting standards provided pursuant to Section 13(a) of the Exchange Act.
Alliant Energy Corporation ☐
Interstate Power and Light Company ☐
Wisconsin Power and Light Company ☐
Indicate by check mark whether the registrant has filed a report on and attestation to its management’s assessment of the effectiveness of its internal control over financial reporting under Section 404(b) of the Sarbanes-Oxley Act (§ 15 U.S.C. 7262(b)) by the registered public accounting firm that prepared or issued its audit report.
Alliant Energy Corporation ☒
Interstate Power and Light Company ☐
Wisconsin Power and Light Company ☐
If securities are registered pursuant to Section 12(b) of the Act, indicate by check mark whether the financial statements of the registrant included in the filing reflect the correction of an error to previously issued financial statements.
Alliant Energy Corporation ☐
Interstate Power and Light Company ☐
Wisconsin Power and Light Company ☐
Indicate by check mark whether any of those error corrections are restatements that required a recovery analysis of incentive-based compensation received by any of the registrant's executive officers during the relevant recovery period pursuant to §240.10D-1(b).
Alliant Energy Corporation ☐
Interstate Power and Light Company ☐
Wisconsin Power and Light Company ☐
Indicate by check mark whether the registrant is a shell company (as defined in Rule 12b-2 of the Exchange Act).
Alliant Energy Corporation - Yes ☐ No ☒
Interstate Power and Light Company - Yes ☐ No ☒
Wisconsin Power and Light Company - Yes ☐ No ☒
The aggregate market value of the voting and non-voting common equity held by nonaffiliates as of June 30, 2024:
Alliant Energy Corporation - $13.0 billion
Interstate Power and Light Company - $0
Wisconsin Power and Light Company - $0
Number of shares outstanding of each class of common stock as of January 31, 2025:
Alliant Energy Corporation, Common Stock, $0.01 par value, 256,692,381 shares outstanding
Interstate Power and Light Company, Common Stock, $2.50 par value, 13,370,788 shares outstanding (all outstanding shares are owned beneficially and of record by Alliant Energy Corporation)
Wisconsin Power and Light Company, Common Stock, $5 par value, 13,236,601 shares outstanding (all outstanding shares are owned beneficially and of record by Alliant Energy Corporation)
DOCUMENTS INCORPORATED BY REFERENCE
Portions of the Proxy Statement relating to Alliant Energy Corporation’s 2025 Annual Meeting of Shareowners are, or will be upon filing with the Securities and Exchange Commission, incorporated by reference into Part III hereof.
TABLE OF CONTENTS
DEFINITIONS
The following abbreviations or acronyms used in this report are defined below: | | | | | | | | | | | |
| Abbreviation or Acronym | Definition | Abbreviation or Acronym | Definition |
| 2025 Alliant Energy Proxy Statement | Alliant Energy’s Proxy Statement for the 2025 Annual Meeting of Shareowners | GAAP | U.S. generally accepted accounting principles |
| AEF | Alliant Energy Finance, LLC | GHG | Greenhouse gases |
| AFUDC | Allowance for funds used during construction | IPL | Interstate Power and Light Company |
| Alliant Energy | Alliant Energy Corporation | IRS | Internal Revenue Service |
| ARO | Asset retirement obligation | ITC | ITC Midwest LLC |
| ATC | American Transmission Company LLC | IUC | Iowa Utilities Commission |
| ATC Holdings | Interest in American Transmission Company LLC and ATC Holdco LLC | KWh | Kilowatt-hour |
| ATI | AE Transco Investments, LLC | MDA | Management’s Discussion and Analysis of Financial Condition and Results of Operations |
| CA | Certificate of authority | MGP | Manufactured gas plant |
| CAA | Clean Air Act | MISO | Midcontinent Independent System Operator, Inc. |
| CCR | Coal combustion residuals | MW | Megawatt |
| CO2 | Carbon dioxide | MWh | Megawatt-hour |
| Corporate Services | Alliant Energy Corporate Services, Inc. | N/A | Not applicable |
| CPCN | Certificate of Public Convenience and Necessity | Note(s) | Combined Notes to Consolidated Financial Statements |
| CSAPR | Cross-State Air Pollution Rule | OIP | Alliant Energy Omnibus Incentive Plan |
| CWIP | Construction work in progress | OPEB | Other postretirement benefits |
| DAEC | Duane Arnold Energy Center | PPA | Purchased power agreement |
| DCP | Alliant Energy Deferred Compensation Plan | PSCW | Public Service Commission of Wisconsin |
| Dth | Dekatherm | Receivables Agreement | Receivables Purchase and Sale Agreement |
| EGU | Electric generating unit | SEC | Securities and Exchange Commission |
| EPA | U.S. Environmental Protection Agency | U.S. | United States of America |
| EPS | Earnings per weighted average common share | VEBA | Voluntary Employees’ Beneficiary Association |
| FERC | Federal Energy Regulatory Commission | VIE | Variable interest entity |
| Financial Statements | Consolidated Financial Statements | West Riverside | West Riverside Energy Center and Solar Facility |
| FTR | Financial transmission right | WPL | Wisconsin Power and Light Company |
| Fuel-related | Electric production fuel and purchased power | | |
FORWARD-LOOKING STATEMENTS
Statements contained in this report that are not of historical fact are forward-looking statements intended to qualify for the safe harbors from liability established by the Private Securities Litigation Reform Act of 1995. These forward-looking statements can be identified as such because the statements include words such as “may,” “believe,” “expect,” “anticipate,” “plan,” “project,” “will,” “projections,” “estimate,” or other words of similar import. Similarly, statements that describe future financial performance or plans or strategies are forward-looking statements. Such forward-looking statements are subject to certain risks and uncertainties that could cause actual results to differ materially from those expressed in, or implied by, such statements. Some, but not all, of the risks and uncertainties of Alliant Energy, IPL and WPL that could materially affect actual results include:
•IPL’s and WPL’s ability to obtain adequate and timely rate relief to allow for, among other things, the recovery of and/or the return on costs, including fuel costs, operating costs, transmission costs, capacity costs, costs of generation projects including such costs that exceed initial estimates, deferred expenditures, deferred tax assets, tax expense, interest expense, capital expenditures, marginal costs to service new customers, and remaining costs related to EGUs that have been or may be permanently closed and certain other retired assets, environmental remediation costs, and decreases in sales volumes, as well as earning their authorized rates of return, payments to their parent of expected levels of dividends, and the impact of rate design on current and potential customers and demand for energy in their service territories;
•the impact of IPL’s retail electric base rate moratorium;
•weather effects on utility sales volumes and operations;
•the direct or indirect effects resulting from cybersecurity incidents or attacks on Alliant Energy, IPL, WPL, or their suppliers, contractors and partners, or responses to such incidents;
•the impact of customer- and third party-owned generation, including alternative electric suppliers, in IPL’s and WPL’s service territories on system reliability, operating expenses and customers’ demand for electricity;
•economic conditions and the impact of business or facility closures in IPL’s and WPL’s service territories;
•the ability and cost to provide sufficient generation and the ability of ITC and ATC to provide sufficient transmission capacity for potential load growth, including significant new commercial or industrial customers, such as data centers;
•the ability of potential large load growth customers to timely construct new facilities, as well as the resulting higher system load demand by expected levels and timeframes;
•the impact of energy efficiency, franchise retention and customer disconnects on sales volumes and operating income;
•the impact that price changes may have on IPL’s and WPL’s customers’ demand for electric, gas and steam services and their ability to pay their bills;
•changes in the price of delivered natural gas, transmission, purchased electric energy, purchased electric capacity and delivered coal, particularly during elevated market prices, and any resulting changes to counterparty credit risk, due to shifts in supply and demand caused by market conditions, regulations and MISO’s seasonal resource adequacy process;
•the ability to obtain regulatory approval for construction projects with acceptable conditions;
•the ability to complete construction of generation and energy storage projects by planned in-service dates and within the cost targets set by regulators due to cost increases of and access to materials, equipment and commodities, which could result from tariffs, duties or other assessments, labor issues or supply shortages, the ability to successfully resolve warranty issues or contract disputes;
•the ability to achieve the expected level of tax benefits based on tax guidelines, timely in-service dates, compliance with prevailing wage and apprenticeship requirements, project costs and the level of electricity output generated by qualifying generating facilities, and the ability to efficiently utilize the renewable generation and energy storage project tax benefits to achieve IPL’s authorized rate of return and for the benefit of IPL’s and WPL’s customers;
•the impacts of changes in the tax code, including tax rates, minimum tax rates, adjustments made to deferred tax assets and liabilities, and changes impacting the availability of and ability to transfer renewable tax credits;
•the ability to utilize tax credits generated to date, and those that may be generated in the future, before they expire, as well as the ability to transfer tax credits that may be generated in the future at adequate pricing;
•federal and state regulatory or governmental actions, including the impact of legislation, regulatory agency orders and executive orders, and changes in public policy, including the potential repeal of the Inflation Reduction Act of 2022;
•disruptions to ongoing operations and the supply of materials, services, equipment and commodities needed to continue to operate and maintain existing assets and to construct capital projects, which may result from geopolitical issues, tariffs, supplier manufacturing constraints, regulatory requirements, labor issues or transportation issues, and thus affect the ability to meet capacity requirements and result in increased capacity expense;
•inflation and higher interest rates;
•the future development of technologies related to electrification, and the ability to reliably store and manage electricity;
•employee workforce factors, including the ability to hire and retain employees with specialized skills, impacts from employee retirements, changes in key executives, ability to create desired corporate culture, collective bargaining agreements and negotiations, work stoppages or restructurings;
•disruptions in the supply and delivery of natural gas, purchased electricity and coal;
•changes to the creditworthiness of, or performance of obligations by, counterparties with which Alliant Energy, IPL and WPL have contractual arrangements, including large load growth customers, participants in the energy markets and fuel suppliers and transporters;
•the impact of penalties or third-party claims related to, or in connection with, a failure to maintain the security of personally identifiable information, including associated costs to notify affected persons and to mitigate their information security concerns;
•impacts that terrorist attacks may have on Alliant Energy’s, IPL’s and WPL’s operations and recovery of costs associated with restoration activities, or on the operations of Alliant Energy’s investments;
•any material post-closing payments related to any past asset divestitures, including the transfer of renewable tax credits, which could result from, among other things, indemnification agreements, warranties, guarantees or litigation;
•continued access to the capital markets on competitive terms and rates, and the actions of credit rating agencies;
•changes to MISO’s resource adequacy process establishing capacity planning reserve margin and capacity accreditation requirements that may impact how and when new and existing generating facilities, including IPL’s and WPL’s additional solar generation, may be accredited with energy capacity, and may require IPL and WPL to adjust their current resource plans, to add resources to meet the requirements of MISO’s process, or procure capacity in the market whereby such costs might not be recovered in rates;
•issues associated with environmental remediation and environmental compliance, including compliance with all current environmental and emissions laws, regulations and permits and future changes in environmental laws and regulations, including the CCR Rule, CSAPR and federal, state or local regulations for emissions reductions, including GHG, from new and existing fossil-fueled EGUs under the CAA, and litigation associated with environmental requirements;
•increased pressure from customers, investors and other stakeholders to more rapidly reduce GHG emissions;
•the timely development of technologies, innovations and advancements to provide cost effective alternatives to traditional energy sources;
•the ability to defend against environmental claims brought by state and federal agencies, such as the EPA and state natural resources agencies, or third parties, such as the Sierra Club, and the impact on operating expenses of defending and resolving such claims;
•the direct or indirect effects resulting from breakdown or failure of equipment in the operation of electric and gas distribution systems, such as mechanical problems, disruptions in telecommunications, technological problems, and explosions or fires, and compliance with electric and gas transmission and distribution safety regulations, including regulations promulgated by the Pipeline and Hazardous Materials Safety Administration;
•issues related to the availability and operations of EGUs, including start-up risks, breakdown or failure of equipment, availability of warranty coverage and successful resolution of warranty issues or contract disputes for equipment breakdowns or failures, performance below expected or contracted levels of output or efficiency, operator error, employee safety, transmission constraints, compliance with mandatory reliability standards and risks related to recovery of resulting incremental operating, fuel-related and capital costs through rates;
•impacts that excessive heat, excessive cold, storms, wildfires, or natural disasters may have on Alliant Energy’s, IPL’s and WPL’s operations and construction activities, and recovery of costs associated with restoration activities, or on the operations of Alliant Energy’s investments;
•Alliant Energy’s ability to sustain its dividend payout ratio goal;
•changes to costs of providing benefits and related funding requirements of pension and OPEB plans due to the market value of the assets that fund the plans, economic conditions, financial market performance, interest rates, timing and form of benefits payments, life expectancies and demographics;
•material changes in employee-related benefit and compensation costs, including settlement losses related to pension plans;
•risks associated with operation and ownership of non-utility holdings;
•changes in technology that alter the channels through which customers buy or utilize Alliant Energy’s, IPL’s or WPL’s products and services;
•impacts on equity income from unconsolidated investments from changes in valuations of the assets held, as well as potential changes to ATC’s authorized return on equity;
•impacts of IPL’s future tax benefits from Iowa rate-making practices, including deductions for repairs expenditures and cost of removal obligations, allocation of mixed service costs and state depreciation, and recoverability of the associated regulatory assets from customers, when the differences reverse in future periods;
•current or future litigation, regulatory investigations, proceedings or inquiries;
•reputational damage from negative publicity, protests, fines, penalties and other negative consequences resulting in regulatory and/or legal actions;
•the direct or indirect effects resulting from pandemics;
•the effect of accounting standards issued periodically by standard-setting bodies;
•the ability to successfully complete tax audits and changes in tax accounting methods with no material impact on earnings and cash flows; and
Alliant Energy, IPL and WPL each assume no obligation, and disclaim any duty, to update the forward-looking statements in this report, except as required by law.
Available Information. Alliant Energy routinely posts important information on its website and considers the Investors section of its website, www.alliantenergy.com/investors, a channel of distribution for material information. Information contained on Alliant Energy’s website is not incorporated herein by reference.
WEBSITE ACCESS TO REPORTS
Alliant Energy, IPL and WPL make their periodic and current reports, and amendments to those reports, available, free of charge, on Alliant Energy’s website at www.alliantenergy.com/investors on the same day as such material is electronically filed with, or furnished to, the SEC. Alliant Energy, IPL and WPL are not including the information contained on Alliant Energy’s website as a part of, or incorporating it by reference into, this report.
PART I
This report includes information relating to Alliant Energy, IPL and WPL (as well as AEF and Corporate Services). Where appropriate, information relating to a specific entity has been segregated and labeled as such. Unless otherwise noted, the information herein excludes discontinued operations for all periods presented. The terms “we,” “our” and “us” used in this report refer collectively to Alliant Energy, IPL and WPL.
ITEM 1. BUSINESS
A. GENERAL
Alliant Energy maintains its principal executive offices in Madison, Wisconsin. Alliant Energy operates as a regulated investor-owned public utility holding company, and its purpose-driven strategy is to serve its customers and build stronger communities. Alliant Energy’s primary focus is to provide regulated electric and natural gas service to approximately 1,000,000 electric and approximately 430,000 natural gas customers in the Midwest through its two public utility subsidiaries, IPL and WPL. The primary first tier wholly-owned subsidiaries of Alliant Energy are as follows:
1) IPL - is a public utility engaged principally in the generation and distribution of electricity and the distribution and transportation of natural gas to retail customers in select markets in Iowa. IPL provides utility services to incorporated communities as directed by the IUC and utilizes non-exclusive franchises, which cover the use of public right-of-ways for utility facilities in incorporated communities for a maximum term of 25 years. At December 31, 2024, IPL supplied electric and natural gas service to approximately 500,000 and 230,000 retail customers, respectively, in Iowa. IPL also sells electricity to wholesale customers in Minnesota (IPL’s related wholesale power agreement expires July 2025), Illinois and Iowa. IPL is also engaged in the generation and distribution of steam for two customers in Cedar Rapids, Iowa, which are each under contract through 2025 for taking minimum quantities of annual steam usage, with certain conditions, after which IPL expects to exit the steam business.
2) WPL - is a public utility engaged principally in the generation and distribution of electricity and the distribution and transportation of natural gas to retail customers in select markets in Wisconsin. WPL operates in municipalities pursuant to permits of indefinite duration and state statutes authorizing utility operation in areas annexed by a municipality. At December 31, 2024, WPL supplied electric and natural gas service to approximately 500,000 and 200,000 retail customers, respectively. WPL also sells electricity to wholesale customers in Wisconsin.
3) CORPORATE SERVICES - provides administrative services to Alliant Energy, IPL, WPL and AEF.
4) AEF - Alliant Energy’s non-utility holdings are organized under AEF, which manages a portfolio of wholly-owned subsidiaries and additional holdings, including the following distinct platforms:
ATI - currently holds all of Alliant Energy’s interest in ATC Holdings. ATC Holdings is comprised of a 16% ownership interest in ATC and a 20% ownership interest in ATC Holdco LLC. ATC is an independent, for-profit, transmission-only company. ATC Holdco LLC holds an interest in Duke-American Transmission Company, LLC, a joint venture between Duke Energy Corporation and ATC, that owns electric transmission infrastructure in North America.
Corporate Venture Investments - includes various minority ownership interests in regional and national venture funds, including a global coalition of energy companies working together to help identify and research innovative technologies and business models within the emerging energy economy.
Non-utility Wind Farm - includes a 50% cash equity ownership interest in a 225 MW non-utility wind farm located in Oklahoma.
Sheboygan Falls Energy Facility - is a 347 MW, simple-cycle, natural gas-fired EGU near Sheboygan Falls, Wisconsin, which is currently leased to WPL through 2044. Refer to Note 9 for additional information on WPL’s Sheboygan Falls Energy Facility lease.
Travero - is a supply chain solutions company, including a short-line rail freight service in Iowa; a Mississippi River barge, rail and truck freight terminal in Illinois; freight brokerage services; wind turbine blade recycling services; and a rail-served warehouse in Iowa.
Development-ready Sites - includes various rail-served and ready-to-build manufacturing and industrial sites throughout Alliant Energy’s service territories, with access to various airports and interstate freeways.
B. INFORMATION RELATING TO ALLIANT ENERGY ON A CONSOLIDATED BASIS
1) HUMAN CAPITAL MANAGEMENT - Alliant Energy’s core purpose is to serve customers and build stronger communities. We constantly strive to attract, retain and develop a qualified workforce of high-performing employees and foster an environment of high levels of engagement.
Employees - At December 31, 2024, Alliant Energy, IPL and WPL had the following full- and part-time employees:
| | | | | | | | | | | | | | | | | |
| Total | | Number of | | Percentage of Employees |
| Number of | | Bargaining Unit | | Covered by Collective |
| Employees | | Employees | | Bargaining Agreements |
| Alliant Energy | 2,998 | | 1,732 | | 58% |
| IPL | 1,043 | | 759 | | 73% |
| WPL | 1,003 | | 860 | | 86% |
The majority of IPL’s bargaining unit employees are covered by the International Brotherhood of Electrical Workers Local 204 (Cedar Rapids) collective bargaining agreement, which expires August 31, 2028. All of WPL’s bargaining unit employees are covered by the International Brotherhood of Electrical Workers Local 965 collective bargaining agreement, which expires May 31, 2026.
Safety - Safety is integral to our company’s culture. It is one of our Values - “Live safety. Everyone. Always. Our first priority is that nobody gets hurt.” Alliant Energy is committed to providing a safe environment for our employees, visitors, customers, contractors, vendors and the communities in which we live and work.
We focus on the proactive management of our safety performance. Our comprehensive behavioral safety-based program consists of leading indicators, lagging indicators and targeted focus programs. We utilize a formal safety management system to capture and track best practices, near misses, job site briefings, safety observations, safety conversations and any unsafe conditions. This system provides the insights needed to help drive a positive safety culture and help ensure compliance with safety rules, processes and procedures. We also use this system to broadly share lessons learned in support of shaping the mindsets and behaviors needed to help prevent similar events from occurring elsewhere. Collectively, this information is used to evaluate the safety performance of the executive and management teams related to their goals, and safety metrics are factored into short-term incentive awards.
We maintain executive and local safety leadership teams to establish our safety vision, strategy and priorities, and ensure education and recognition of employee actions that improve our safety culture. This leadership provides strong support for sustained growth of both employee and public safety programs and initiatives.
Public safety is equally important, as we interact with our customers to provide energy to their homes and businesses. We offer awareness campaigns, natural gas and electric public safety presentations, and free online resources and training programs and guidance to assist local emergency responders.
Total Rewards - Our market-competitive Total Rewards programs are designed to meet the varied and evolving needs of our employees. Through a variety of health, welfare and compensation programs, we offer employees choice and control, and help support their financial, physical, and mental well-being. We provide tools and resources to employees to help maintain and improve their health. Short- and long-term incentive plans have a mix of operational and financial metrics that align employees with strategic corporate goals.
In addition to competitive salaries and wages, our Total Rewards programs include:
•competitive short- and long-term incentive compensation;
•a 401(k) savings plan with an employer contribution and employer match;
•healthcare and insurance benefits, including medical, vision, dental, life, short-term disability, and long-term disability insurance;
•health savings and flexible spending accounts;
•enhanced offerings to support the well-being of employees and their families;
•paid time off to use for vacation, personal time, sick time, holidays, bereavement, jury duty, military leave, parental leave, maternity leave, and adoption leave;
•adoption assistance;
•legal planning assistance;
•tuition reimbursement;
•Vacation Donation program; and
•Volunteer Grants and a Matching Gifts program.
Annually, Alliant Energy awards up to 25 scholarships to children of its current employees and eligible retirees. Award recipients have achieved excellent records in high school, are pursuing a higher education, and may enroll in any accredited two- or four-year college, university or vocational-technical school in the U.S.
Employee Engagement - A workplace where everyone feels meaningful connection to work and company goals is crucial for the success and retention of our employees, to attract future talent and to execute our purpose-driven strategy to serve our customers and build stronger communities. It is one of our Values - “Care for others: Together we create a workplace where people feel like they can use their backgrounds, talents and perspectives to their fullest potential.” Alliant Energy believes the achievement of its strategic objectives can only be achieved with a focused and engaged workforce.
Our efforts to advance employee engagement in our workforce include:
•Learning: We offer various learning opportunities for employees, such as participating in area summits, supporting company-wide listening sessions, providing training opportunities, and hosting speakers, among other programs, as well as leaders facilitating conversations around employee engagement, helping to ensure employees are seen, heard and valued;
•Listening and responding: We collect and act upon feedback through employee sentiment surveys;
•Empowering: We promote and foster an engaged workforce, providing opportunities to collaborate, network, and share their insights and talents; and
•Leading: Our Leadership Team identifies and champions initiatives to help advance a culture that values employee engagement.
Talent Development and Workforce Readiness - We support all employees in their skill development and career growth, offering several training opportunities, development programs and tuition reimbursement, as well as leadership development and succession planning. Development goals and conversations with leadership help identify opportunities to learn through a mix of on-the-job experience, collaboration and formal content to build needed skills for today and the future.
To help attract and introduce a wide range of candidates to our industry, we have early careers programs that include apprenticeships, youth programs (high school) and internships (college). Our programs provide a pipeline of talented students to engage in meaningful, hands-on work experiences. Our apprenticeship program combines supervised, structured on-the-job training with related instruction to produce highly skilled trade and technical workers, and builds lifetime skills and comprehensive knowledge in the high-demand technical trades necessary for our success. The apprenticeship program gives us the flexibility to tailor training to match our needs - training employees in our facilities, on our equipment, and consistent with our safety standards and employee expectations. We instill company Values, methods and procedures from day one.
2) REGULATION - Alliant Energy, IPL and WPL are subject to regulation by various federal, state and local agencies. The following includes the primary regulations impacting Alliant Energy’s, IPL’s and WPL’s businesses.
FERC -
Public Utility Holding Company Act of 2005 - Alliant Energy is registered with FERC as a public utility holding company, pursuant to the Public Utility Holding Company Act of 2005, and is required to maintain certain records and to report certain transactions involving its public utilities, service company and other entities regulated by FERC. Corporate Services, IPL and WPL are subject to regulation by FERC under the Public Utility Holding Company Act of 2005 for various matters including, but not limited to, affiliate transactions, public utility mergers, acquisitions and dispositions, and books, records and accounting requirements.
Energy Policy Act of 2005 - The Energy Policy Act of 2005 requires creation of an Electric Reliability Organization to provide oversight by FERC. FERC designated North American Electric Reliability Corporation, which also provides oversight of cybersecurity standards, as the overarching Electric Reliability Organization. Midwest Reliability Organization, which is a regional member of North American Electric Reliability Corporation, has direct responsibility for mandatory electric reliability standards for IPL and WPL.
Federal Power Act of 1935 - FERC also has jurisdiction, under the Federal Power Act of 1935, over certain electric utility facilities and operations, electric wholesale sales, interstate electric transmission rates, dividend payments, issuance of IPL’s securities, and accounting practices of Corporate Services, IPL and WPL.
Electric Wholesale Rates - FERC has authority over IPL's and WPL's wholesale electric market-based rates. Market-based rate authorization allows for wholesale sales of electricity within FERC’s wholesale markets, including the MISO market, and in transactions directly with third parties, based on the market value of the transactions. IPL and WPL also have FERC-approved cost of service formula-based rates related to the provision of firm full- and partial-requirement wholesale electric sales, which allow for true-ups to actual costs, including fuel costs.
Electric Transmission Rates - FERC regulates the rates charged for electric transmission facilities used in interstate commerce. IPL and WPL do not own or operate FERC-regulated electric transmission facilities; however, both IPL and WPL pay for the use of the interstate electric transmission system based upon FERC-regulated rates. IPL and WPL rely primarily on the use of the ITC and ATC transmission systems, respectively.
Natural Gas Act - FERC regulates the transportation and sale for resale of natural gas in interstate commerce under the Natural Gas Act. Under the Natural Gas Act, FERC has authority over certain natural gas facilities and operations of IPL and WPL.
IUC - IPL is subject to regulation by the IUC for various matters including, but not limited to, retail utility rates and standards of service, accounting requirements, the construction of EGUs, and the acquisition, sale or lease of assets with values that exceed 3% of IPL’s revenues. In Iowa, counties and cities are prohibited from regulating the sale of natural gas and propane, which supports IPL’s ability to provide gas utility service to retail customers and industries.
Retail Utility Base Rates - IPL files periodic requests with the IUC for retail rate changes and may base those requests on either historical or forward-looking test periods. The IUC must decide on requests for retail rate changes within 10 months of the date of the application for which changes are filed, subject to certain exceptions. The historical test periods may be adjusted for certain known and measurable changes to capital investments, cost of capital and operating and maintenance expenses consistent with IUC rules and regulations. The IUC has rules that establish minimum filing requirements for rate reviews using a forward-looking test period, and a related subsequent proceeding review after the close of the forward-looking test period. The rules provide that in the subsequent proceeding review, a utility’s actual costs and revenues will be presumed to be reasonably consistent with the forward-looking test period if the utility’s actual return on common equity falls within a standard of reasonableness of 50 basis points above to 50 basis points below the authorized return on common equity. If the utility’s actual return on common equity is outside of this range, future rates could be adjusted. In addition, the rules require that IPL must receive an order from the IUC related to the subsequent proceeding review before it can file another rate review. Also, IPL is required to defer a portion of its earnings if its annual regulatory return on common equity exceeds certain levels. Refer to “Rate Matters” in MDA for discussion of IPL’s retail electric base rate moratorium from October 2025 through September 2029 approved by the IUC in IPL’s most recent retail electric rate review.
Energy Efficiency - In accordance with Iowa law, IPL is required to file an energy efficiency plan (EEP) every five years with the IUC. An EEP provides a utility’s plan and related budget to achieve specified levels of electric and gas energy savings. IUC approval demonstrates that IPL’s EEP is reasonably expected to achieve cost-effective delivery of the energy efficiency programs. Refer to Note 1(g) for discussion of the recovery of these costs from IPL’s retail electric and gas customers.
Electric Generating Units - IPL must obtain a certificate of public convenience, use and necessity (GCU Certificate) from the IUC in order to construct a new, or significantly alter (including fuel switching) an existing, EGU or energy storage facility located in Iowa with a nameplate generating capacity of 25 MW or more. IPL’s ownership and operation of EGUs (including those located outside the state of Iowa) to serve Iowa customers is subject to retail utility rate regulation by the IUC.
Gas Pipeline Projects - IPL must obtain a pipeline permit from the IUC related to the siting of utility gas pipelines in Iowa that will be operated at a pressure over 150 pounds per square inch and will transport gas to a distribution system or single, large volume customer.
Advance Rate-making Principles - Iowa law allows Iowa utilities to request rate-making principles prior to making certain investments in Iowa. As a result, IPL may file for, and the IUC must render a decision on, rate-making principles for certain new EGUs located in Iowa, including any alternate energy production facility (such as a wind, solar, energy storage or nuclear-fired facility), combined-cycle natural gas-fired EGU, and certain base-load EGUs with a nameplate generating capacity of 300 MW or more. Advance rate-making principles are also available for the repowering of an alternative energy production facility or certain significant alterations of an existing EGU. Upon approval of rate-making principles by the IUC, IPL must either construct the EGU or repower the alternative energy production facility under the approved rate-making principles, or not at all. If rate-making principles are not approved by the IUC, IPL may construct the facility, subject to other applicable approvals (such as a GCU Certificate), subject to recovery in future rate reviews.
The IUC’s 2023 order for the advance rate-making principles for IPL’s 400 MW of solar generation projects placed in service in 2024 included a consumer protection plan, which monitors IPL’s achievement of certain aggregate summer capacity factors for those projects during June, July and August each calendar year over 30 years. Actual three-year rolling average summer capacity factors will be compared to target capacity factors, which may result in surpluses or deficits that would be offset against one another and contribute to an accumulated balance in a given calendar year. Surpluses or deficits will be capped at $3 million in aggregate per year. At the end of the program, any accumulated deficit balance would be addressed in IPL’s next rate review, and any accumulated surplus balance would not result in any return to IPL.
Electric Generating Unit Environmental Controls Projects - At its sole discretion, IPL may submit an updated emissions plan and budget to the IUC setting out a multi-year plan and budget for managing regulated emissions from its coal-fired EGUs in a cost-effective manner. IPL must simultaneously submit this plan and budget to the Iowa Department of Natural Resources for a determination of whether the plan and budget meet state environmental requirements for regulated emissions. The reasonable and prudent costs associated with implementing the approved plan are expected to be included in IPL’s future retail electric rates.
PSCW - WPL is subject to regulation by the PSCW related to its operations in Wisconsin for various matters including, but not limited to, retail utility rates and standards of service, accounting requirements, issuance and use of proceeds of securities, affiliate transactions, approval of the location and construction of EGUs and certain other additions and extensions to facilities. In addition, Alliant Energy is subject to regulation by the PSCW for the type and amount of Alliant Energy’s holdings in non-utility businesses and other affiliated interest activities, among other matters.
Retail Utility Base Rates - WPL files periodic requests with the PSCW for retail rate changes, which are based on forward-looking test periods. There is no statutory time limit for the PSCW to decide on retail base rate requests. However, the PSCW attempts to process retail base rate reviews in approximately 10 months and has the ability to approve interim retail rate relief, subject to refund, if necessary. Currently, WPL is required to defer a portion of its earnings if its annual regulatory return on common equity exceeds certain levels.
Public Benefits - WPL contributes 1.2% of its annual retail utility revenues to help fund Focus on Energy, Wisconsin’s state-wide energy efficiency and renewable energy resource program. In addition, WPL contributes to a program that provides assistance to income-eligible residents in Wisconsin. These contributions are recovered from customers through a monthly bill surcharge of the lesser of 3% of customers’ utilities bills or $750. Refer to Note 1(g) for discussion of the recovery of these costs from WPL’s retail electric and gas customers.
New Electric Generating Units - A CA application is required to be filed with the PSCW for construction approval of any new EGU (including energy storage) with a capacity of less than 100 MW and a project cost of $16.3 million or more. WPL must obtain a CPCN from the PSCW in order to construct a new EGU (including energy storage) in Wisconsin with a capacity of 100 MW or more. In addition, WPL’s ownership and operation of EGUs (including those located outside the state of Wisconsin) to serve Wisconsin customers are subject to retail utility rate regulation by the PSCW.
Electric Generating Unit Upgrades and Electric Distribution Projects - A CA application is required to be filed with the PSCW for construction approval of any additions to EGUs, including environmental controls projects, as well as electric distribution projects, with estimated project costs of $16.3 million or more.
Gas Distribution Projects - A CA application is required to be filed with the PSCW for construction approval of gas projects with an estimated project cost of $8.1 million or more and at any time that WPL requests to extend gas service to a new portion of its service territory.
Advance Rate-making Principles - Wisconsin law provides Wisconsin utilities with the opportunity to request rate-making principles prior to the purchase or construction of any EGU utilized to serve Wisconsin customers. WPL is not obligated to file for or accept authorized rate-making principles under Wisconsin law. WPL can proceed with an approved project under traditional rate-making terms or accept authorized rate-making principles under Wisconsin law.
Department of Homeland Security Transportation Security Administration - Alliant Energy, IPL and WPL are subject to regulation for physical and cybersecurity of their natural gas pipeline systems, and are applying, and monitoring for changes to, these requirements to their pipeline systems.
Environmental - Alliant Energy, IPL and WPL are subject to regulation of environmental matters by federal, state and local authorities as a result of their current and past operations. Alliant Energy, IPL and WPL monitor these environmental matters and address them by installing controls that reduce emissions and by implementing operational modifications or other measures to address compliance obligations. There is currently significant regulatory uncertainty with respect to environmental rules and regulations discussed below. Given the evolving nature of environmental regulations and other related regulatory requirements, Alliant Energy, IPL and WPL develop and periodically update their compliance plans to address these environmental obligations. Prudent expenditures incurred by IPL and WPL to comply with environmental requirements are eligible to be recovered in rates from their customers. The following are major environmental matters that could potentially have a significant impact on financial condition and results of operations.
Air Quality -
Climate Change and Greenhouse Gas Regulations - In 2007, the Supreme Court provided direction on the EPA’s authority to regulate GHG and ruled that these emissions are covered by the CAA. In 2009, the EPA issued a ruling that found GHG emissions contribute to climate change and therefore threaten public health and welfare, which is the basis for implementing CO2 reduction standards under the CAA. The primary GHG directly emitted from Alliant Energy’s utility operations is CO2 from the combustion of fossil fuels at its EGUs.
Clean Air Act Section 111(d) - In May 2024, the EPA enacted the final Section 111(d) rule under the CAA for certain fossil-fueled EGUs, which requires states to implement plans to reduce CO2 emissions through various Best System of Emission Reduction (BSER) measures at affected sources, including retirement, enforceable limits on operational capacity, co-firing with low-GHG fuels, or carbon capture and energy storage technology. State plans are subject to EPA approval, and must be submitted by May 2026. The final rule’s compliance requirements will be phased in beginning in 2030 and covers fossil-fueled EGUs that utilize steam boilers to generate electricity, including IPL’s coal-fired Ottumwa Generating Station, George Neal Generating Station, Prairie Creek Generating Station Unit 3 and Louisa Generating Station, WPL’s coal-fired Edgewater Generating Station Unit 5 (WPL currently plans to convert Edgewater Unit 5 to natural gas in 2028, subject to regulatory approvals), and IPL’s natural gas-fired Burlington Generating Station and Prairie Creek Generating Station Unit 4. The final rule does not apply to EGUs that are retired by January 2032. If WPL’s coal-fired Columbia Energy Center is retired by the end of 2029, the final rule would not be applicable; however, if WPL converts Columbia Unit 1 and/or Unit 2 to natural gas, then the final rule would be applicable for the EGUs that are converted. In addition, the final rule does not impact existing natural gas-fired combustion turbines, including IPL’s Marshalltown Generating Station and Emery Generating Station, and WPL’s Riverside Energy Center and West Riverside Energy Center; however, these EGUs could be subject to future Section 111(d) rules to reduce CO2 emissions from existing combustion turbines. Alliant Energy, IPL and WPL are currently unable to predict with certainty the future outcome or impact of these matters, including resolution of ongoing litigation.
Clean Air Act Section 111(b) - In 2015, the EPA published final standards under Section 111(b) of the CAA, which establish CO2 emissions limits for certain new fossil-fueled EGUs, including IPL’s Marshalltown Generation Station and WPL’s West Riverside Energy Center. In addition, in May 2024, the EPA enacted final revised standards under Section 111(b), which establish CO2 emissions limits from certain new and reconstructed fossil-fueled EGU combustion turbines that commenced operation after May 23, 2023 with a capacity greater than 25 MW. The final revised standards do not apply to IPL’s and WPL’s current fossil-fueled EGU combustion turbines since they were all placed into service before May 23, 2023 and have not been reconstructed since that date. Alliant Energy, IPL and WPL are currently unable to predict with certainty the future outcome or impact of these revised standards, including resolution of ongoing litigation.
Cross-State Air Pollution Rule - CSAPR is a regional sulfur dioxide and nitrogen oxides cap-and-trade program, where compliance with emission limits may be achieved by purchasing emission allowances and/or reducing emissions through changes in operations or the additions of environmental controls. CSAPR emission allowances may be banked for future year compliance. CSAPR establishes state-specific annual sulfur dioxide and nitrogen oxides emission caps and ozone season nitrogen oxides emission caps. In 2023, the EPA finalized revisions to the CSAPR state-specific ozone season nitrogen oxides emission caps and utility-specific emission allowances for certain states, including Wisconsin, beginning in 2023; however, these revisions were stayed by the Supreme Court in June 2024. In November 2024, the EPA issued an interim final rule to stay the 2023 rule and re-establish the prior emission caps and allowance allocations, including Wisconsin, pending judicial review. WPL currently receives, and expects to receive in the future, enough CSAPR emission allowances to ensure ongoing compliance without the need to purchase additional allowances or materially curtail operations. These revisions do not currently apply to Iowa; however, Iowa could be included in a future rule. As a result, Alliant Energy and IPL are currently unable to predict with certainty the future outcome or impacts of these matters.
New Source Performance Standards (NSPS) for Combustion Turbines - The EPA establishes requirements under the CAA for various categories of stationary sources that cause or contribute significantly to air pollution, and may reasonably be anticipated to endanger public health or welfare, which are referred to as NSPS. These standards reflect the degree of emission limitation achievable through the application of the BSER. In December 2024, the EPA proposed updates to the NSPS for combustion turbines built, reconstructed, or modified after December 13, 2024, which would establish more stringent emission limits for nitrogen oxides emissions and retain the current sulfur dioxide emission limits. This proposal would establish size-based subcategories for new, reconstructed or modified combustion turbines, and could require combustion controls or selective catalytic reduction control equipment. Alliant Energy, IPL and WPL are currently evaluating the proposed rule and are unable to predict with certainty future compliance impacts; however, costs to comply with this rule could have a material impact on their financial condition and results of operations.
Water Quality -
Effluent Limitation Guidelines - In May 2024, the EPA enacted a final rule that revises discharge limits for specific categories of wastewater from existing steam EGUs. The new limitations will be implemented in each facility’s wastewater discharge permits issued by state agencies and become effective as soon as possible but no later than December 31, 2029. Alliant Energy, IPL and WPL are currently evaluating the final rule and are unable to predict with certainty future compliance impacts, including resolution of ongoing litigation; however, costs to comply with this rule could have a material impact on their financial condition and results of operations.
Land and Solid Waste -
Coal Combustion Residuals Rule - The CCR Rule, which initially became effective in 2015, regulates CCR as a non-hazardous waste. In May 2024, the EPA revised the CCR Rule, which significantly expands the scope of regulation, and as discussed in Note 13, Alliant Energy, IPL and WPL recorded additional AROs in 2024. IPL and WPL have coal ash ponds at current and former EGU sites, and active and inactive CCR landfills, that are impacted by this rule. Alliant Energy, IPL and WPL continue to evaluate the revised CCR Rule and are unable to predict with certainty the future outcome or impact of these updates, including resolution of ongoing litigation.
Manufactured Gas Plant Sites - Refer to Note 16(e) for discussion of IPL’s and WPL’s MGP sites.
Renewable Energy Standards - Iowa and Wisconsin have renewable energy standards, which establish the minimum amount of energy IPL and WPL must supply from renewable resources. IPL primarily relies upon renewable energy generated from the wind or solar resources it owns and renewable energy acquired under PPAs to meet these requirements. WPL utilizes its current renewable portfolio, which primarily consists of wind, solar and hydro energy, both owned and acquired under PPAs, to meet these requirements. IPL and WPL currently exceed their respective renewable energy standards requirements.
3) STRATEGY - Refer to “Overview” in MDA for discussion of Alliant Energy’s strategy, which supports its mission to deliver energy solutions and exceptional service that its customers and communities count on - affordably, safely, reliably and sustainably.
C. INFORMATION RELATING TO UTILITY OPERATIONS
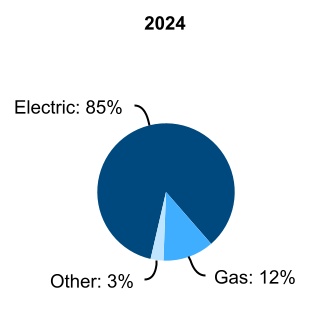
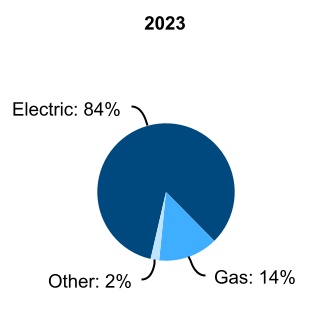
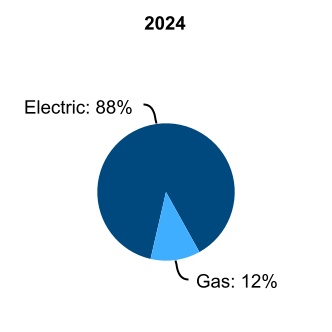
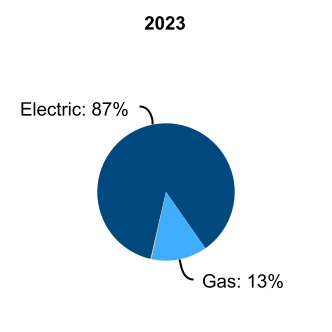
Alliant Energy’s utility business includes the operations of IPL (electric, gas and steam operations) and WPL (electric and gas operations), which are both reportable segments. IPL’s and WPL’s electric, gas and other revenues as a percentage of total revenues were as follows:
1) ELECTRIC UTILITY OPERATIONS
General - Alliant Energy’s electric utility operations are located in the Midwest with IPL providing retail and wholesale electric service in Iowa and WPL providing retail and wholesale electric service in Wisconsin. IPL also sells electricity to wholesale customers in Minnesota and Illinois. Refer to the “Electric Operating Information” tables for additional details regarding electric utility operations.
Customers - IPL and WPL provide electric utility service to a large base of retail customers in several industries, with the largest concentrations in the farming, agriculture, industrial manufacturing, chemical (including ethanol), packaging and food industries. IPL and WPL also sell electricity to wholesale customers, which primarily consist of municipalities and rural electric cooperatives.
Seasonality - Electric sales are seasonal to some extent with the annual peak normally occurring in the summer months due to air conditioning requirements. Electric sales are also impacted to a certain extent in the winter months due to heating requirements.
Competition - Retail electric customers in Iowa and Wisconsin currently do not have the ability to choose their electric supplier, and IPL and WPL have obligations to serve all their retail electric customers. Although electric service in Iowa and Wisconsin is regulated, IPL and WPL still face competition from self-generation by large industrial customers, customer- and third party-owned generation (e.g. solar panels), alternative energy sources, and petitions to municipalize (Iowa) as well as service territory expansions by municipal utilities through annexations (Wisconsin). In addition, the wholesale power market is competitive and IPL and WPL compete against independent power producers, other utilities and MISO market purchases to serve wholesale customers for their electric energy and capacity needs. Alliant Energy’s strategy includes actions to retain current customers and attract new customers into IPL’s and WPL’s service territories in an effort to keep energy rates low for all of their customers. Refer to “Overview” in MDA for discussion of the strategy element focusing on growing customer demand.
Electric Supply - Alliant Energy, IPL and WPL have met, and expect to continue meeting, customer demand of electricity through a mix of electric supply, including owned EGUs, PPAs and additional purchases from wholesale energy markets. Alliant Energy expects its current mix of electric supply to continue to evolve with new wind and solar generation, energy storage facilities, new natural gas resources, refurbishing of existing wind farms, improvements at existing natural gas-fired EGUs and converting certain coal-fired EGUs to natural gas. Long-term generation plans are intended to meet growing customer demand, reduce air emissions and water impacts, reduce reliance on wholesale market purchases and mitigate the impacts of future EGU retirements while maintaining compliance with long-term electric demand planning reserve margins, renewable energy standards established by regulators, among other requirements.
Electric Demand Planning Reserve Margin - IPL and WPL are required to maintain a planning reserve margin above their load at the time of the MISO-wide peak each season to ensure reliable electric service to their customers. IPL and WPL utilize accredited capacity from EGUs they own, and have rights to through PPAs, to meet a substantial portion of their current MISO planning reserve margin requirements and periodically rely on short-term market capacity purchases to supplement the accredited capacity from such EGUs.
MISO Seasonal Resource Adequacy Process - MISO’s resource adequacy process includes capacity planning reserve margins and capacity accreditation requirements with four distinct seasons, to help ensure the reliability of electricity in the MISO region. Capacity planning reserve margins are required for all market participants on a seasonal basis, and seasonal accredited capacity values are determined for certain classes of generating resources, including higher accredited capacity for wind generation during the Spring, Fall and Winter seasons and higher accredited capacity for solar generation during the Summer season. Beginning with the June 1, 2028 through May 31, 2029 planning period, MISO will implement a Direct Loss of Load methodology to determine capacity accreditation, which will incorporate forward-looking analysis, and historical resource-specific performance during periods of high system risk over the previous three years. Alliant Energy, IPL and WPL currently plan to construct and/or acquire additional renewable, energy storage and natural gas resources to meet the requirements of the seasonal resource adequacy process and have reflected the estimated capital expenditures for these projects in the “Generation” lines in the construction and acquisition table in “Liquidity and Capital Resources.” Seasonal capacity reserve margins are as follows: | | | | | | | | | | | | | | | | | | | | | | | |
| June 2025 - August 2025 | | September 2025 - November 2025 | | December 2025 - February 2026 | | March 2026 - May 2026 |
| Required installed capacity reserve margin | 15.7% | | 25.3% | | 38.6% | | 38.8% |
| Required unforced capacity reserve margin | 7.9% | | 14.9% | | 18.4% | | 25.3% |
Generation Fuel Supply - IPL and WPL own a portfolio of EGUs located in Iowa, Wisconsin and Minnesota with a fuel mix that includes natural gas, renewable resources and coal. Refer to “Properties” in Item 2 for details of IPL’s and WPL’s EGUs. The average cost of delivered fuel per million British Thermal Units used for electric generation was as follows: | | | | | | | | | | | | | | | | | | | | | | | | | | | | | | | | | | | |
| IPL | | WPL |
| 2024 | | 2023 | | 2022 | | 2024 | | 2023 | | 2022 |
| All fuels | $2.49 | | $2.83 | | $4.37 | | $2.74 | | $3.09 | | $4.47 |
| Natural gas (a) | 2.52 | | 3.10 | | 5.76 | | 3.03 | | 3.47 | | 6.02 |
| Coal | 2.29 | | 2.09 | | 2.31 | | 2.37 | | 2.54 | | 2.43 |
(a)The average cost of natural gas includes commodity and transportation costs, as well as realized gains and losses from swap and option contracts used to hedge the price of natural gas volumes expected to be used by IPL’s and WPL’s natural gas-fired EGUs.
Natural Gas - Alliant Energy, IPL and WPL own several natural gas-fired EGUs, and WPL also has exclusive rights to the output of AEF’s Sheboygan Falls Energy Facility under an affiliated lease agreement. These facilities help meet customer demand for electricity when natural gas prices are low enough to make natural gas-fired generation economical compared to other fuel sources. Alliant Energy manages the gas supply to these gas-fired EGUs and helps ensure an adequate supply is available at known prices through a combination of gas commodity, pipeline transportation and storage agreements held by IPL and WPL for numerous years. Alliant Energy, IPL and WPL believe they are reasonably insulated against gas price volatility for these EGUs given their use of forward contracts and hedging practices, as well as their regulatory cost-recovery mechanisms.
Coal - Coal is one of the fuel sources for owned EGUs. Coal contracts entered into with different entities help ensure that a specified supply of coal is available, and delivered, at known prices for IPL’s and WPL’s coal-fired EGUs. Alliant Energy, IPL and WPL believe their coal supply portfolio represents a reasonable balance between the risks of insufficient supplies and those associated with being unable to respond to future coal market changes. Remaining coal requirements are expected to be met from either future term contracts or purchases in the spot market. Currently, all of the coal utilized by IPL and WPL is from the Wyoming Powder River Basin.
Alliant Energy, IPL and WPL believe they are reasonably insulated against coal price volatility given their current coal procurement process, the specific coal market in their primary purchase region and regulatory cost-recovery mechanisms. The coal procurement process supports periodic purchases, staggering of contract terms, stair-stepped levels of supply going forward and different suppliers. Similarly, given the term lengths of their transportation agreements and strategic alignment of agreement expirations for negotiation purposes, Alliant Energy, IPL and WPL believe they are reasonably insulated against future higher coal transportation rates from the major railroads.
Purchased Power - IPL and WPL periodically enter into PPAs and purchase electricity from wholesale energy markets to meet a portion of their customer demand for electricity.
Electric Transmission - IPL and WPL do not own electric transmission service assets and currently receive transmission services from ITC and ATC, respectively. ITC and ATC are independent, for-profit, transmission-only companies and are transmission-owning members of the MISO Regional Transmission Organization, Midwest Reliability Organization and Reliability First Corporation Regional Entities. The annual transmission service rates that ITC or ATC charges their customers are calculated each calendar year using a FERC-approved cost of service formula rate. As a result, ITC and ATC can implement new rates each calendar year without filing a request with FERC. However, new rates are subject to challenge by either FERC or customers. If the rates proposed by ITC or ATC are determined by FERC to be unjust or unreasonable, or another mechanism is determined by FERC to be just and reasonable, ITC’s or ATC’s rates would change accordingly. Refer to Note 1(g) for discussion of a transmission cost rider utilized by IPL for recovery of its electric transmission service expense, and discussion of WPL’s escrow for recovery of electric transmission service expense, which is recovered from its retail electric customers through changes in base rates determined during periodic rate proceedings. Refer to Note 16(g) for discussion of a court case and resulting FERC order, which decreased the base return on equity authorized for MISO transmission owners, including ATC.
MISO Markets - IPL and WPL are members of MISO, a FERC-approved Regional Transmission Organization, which is responsible for monitoring and ensuring equal access to the transmission system in their footprint. IPL and WPL participate in the wholesale energy and ancillary services markets operated by MISO, which are discussed in more detail below. As agent for IPL and WPL, Corporate Services enters into energy, capacity, ancillary services, and transmission sale and purchase transactions within MISO. Corporate Services assigns such sales and purchases between IPL and WPL based on statements received from MISO.
Wholesale Energy Market - IPL and WPL sell and purchase power in the day-ahead and real-time wholesale energy markets operated by MISO. MISO’s bid/offer-based markets compare the cost of IPL and WPL generation against other generators, which affects IPL and WPL generation operations, energy purchases and energy sales. MISO generally dispatches the lowest cost generators, while recognizing current system constraints, to reduce costs for purchasers in the wholesale energy market. In addition, MISO may dispatch generators that support reliability needs, but that would not have operated based on economic needs. In these cases, MISO’s settlement assures that these generators are made whole financially for their variable costs.
Ancillary Services Market - IPL and WPL also participate in MISO’s ancillary services market, which integrates the procurement and use of regulation and contingency reserves with the existing wholesale energy market to ensure reliability of electricity supply. MISO’s ancillary services market has had the overall impact of lowering ancillary services costs in the MISO footprint.
Financial Transmission Rights and Auction Revenue Rights - In areas of constrained transmission capacity, energy costs could be higher due to congestion and its impact on locational marginal prices. FTRs provide a hedge for certain congestion costs that occur in the MISO energy market. MISO allocates auction revenue rights to IPL and WPL annually based on a fiscal year from June 1 through May 31 and historical use of the transmission system. The allocated auction revenue rights are used by IPL and WPL to acquire FTRs through the FTR auctions operated by MISO.
Resource Adequacy - MISO has resource adequacy requirements to help ensure adequate resources to meet forecasted peak load obligations plus a reserve margin. Accredited capacity assigned to EGUs is available to meet these requirements. In order for an EGU to receive accredited capacity, it must meet MISO capacity accreditation requirements, which can include satisfying transmission requirements identified in its interconnection agreement prior to the MISO planning year. Refer to “Electric Demand Planning Reserve Margin” above for discussion of MISO’s seasonal resource adequacy process establishing capacity planning reserve margin and capacity accreditation requirements.
| | | | | | | | | | | | | | | | | |
| Electric Operating Information - Alliant Energy | 2024 | | 2023 | | 2022 |
| Revenues (in millions): | | | | | |
| Residential | $1,236 | | | $1,220 | | | $1,233 | |
| Commercial | 821 | | | 820 | | | 821 | |
| Industrial | 952 | | | 968 | | | 965 | |
| Retail subtotal | 3,009 | | | 3,008 | | | 3,019 | |
| Sales for resale: | | | | | |
| Wholesale | 200 | | | 213 | | | 233 | |
| Bulk power and other | 86 | | | 71 | | | 111 | |
| Other | 77 | | | 53 | | | 58 | |
| Total | $3,372 | | | $3,345 | | | $3,421 | |
| Sales (000s MWh): | | | | | |
| Residential | 7,104 | | | 7,176 | | | 7,479 | |
| Commercial | 6,304 | | | 6,329 | | | 6,436 | |
| Industrial | 11,161 | | | 11,435 | | | 11,494 | |
| Retail subtotal | 24,569 | | | 24,940 | | | 25,409 | |
| Sales for resale: | | | | | |
| Wholesale | 2,783 | | | 2,859 | | | 2,866 | |
| Bulk power and other | 5,620 | | | 4,730 | | | 3,734 | |
| Other | 57 | | | 58 | | | 62 | |
| Total | 33,029 | | | 32,587 | | | 32,071 | |
| Customers (End of Period): | | | | | |
| Retail | 1,002,967 | | | 995,982 | | | 989,369 | |
| Other | 2,915 | | | 2,914 | | | 2,903 | |
| Total | 1,005,882 | | | 998,896 | | | 992,272 | |
| Other Selected Electric Data: | | | | | |
| Maximum summer peak hour demand (MW) | 5,638 | | | 5,856 | | | 5,629 | |
| Maximum winter peak hour demand (MW) | 4,317 | | | 4,240 | | | 4,415 | |
| Cooling degree days (a): | | | | | |
| Cedar Rapids, Iowa (IPL) (normal - 819) | 890 | | | 974 | | | 908 | |
| Madison, Wisconsin (WPL) (normal - 704) | 742 | | | 781 | | | 787 | |
| Sources of electric energy (000s MWh): | | | | | |
| Gas | 13,883 | | | 14,764 | | | 11,438 | |
| Purchased power: | | | | | |
| Wind (b) | 4,285 | | | 4,067 | | | 4,422 | |
| | | | | |
| Other (b) | 1,715 | | | 1,883 | | | 2,803 | |
| Wind (b) | 5,540 | | | 5,410 | | | 6,424 | |
| Solar (b) | 1,833 | | | 471 | | | 41 | |
| Coal | 6,204 | | | 6,447 | | | 7,416 | |
| Other (b) | 201 | | | 186 | | | 198 | |
| Total | 33,661 | | | 33,228 | | | 32,742 | |
| Revenue per KWh sold to retail customers (cents) | $12.25 | | | $12.06 | | | $11.88 | |
(a)Cooling degree days are calculated using a simple average of the high and low temperatures each day compared to a 65 degree base. Normal degree days are calculated using a rolling 20-year average of historical cooling degree days. Refer to “Gas Operating Information” below for details of heating degree days. (b)All or some of the renewable energy attributes associated with generation from these sources may be used in future years to comply with renewable energy standards or other regulatory requirements.
| | | | | | | | | | | | | | | | | | | | | | | | | | | | | | | | | | | |
| Electric Operating Information | IPL | | WPL |
| 2024 | | 2023 | | 2022 | | 2024 | | 2023 | | 2022 |
| Revenues (in millions): | | | | | | | | | | | |
| Residential | $640 | | | $641 | | | $673 | | | $596 | | | $579 | | | $560 | |
| Commercial | 525 | | | 519 | | | 536 | | | 296 | | | 301 | | | 285 | |
| Industrial | 497 | | | 501 | | | 538 | | | 455 | | | 467 | | | 427 | |
| Retail subtotal | 1,662 | | | 1,661 | | | 1,747 | | | 1,347 | | | 1,347 | | | 1,272 | |
| Sales for resale: | | | | | | | | | | | |
| Wholesale | 61 | | | 62 | | | 64 | | | 139 | | | 151 | | | 169 | |
| Bulk power and other | (6) | | | 11 | | | 13 | | | 92 | | | 60 | | | 98 | |
| Other | 30 | | | 27 | | | 35 | | | 47 | | | 26 | | | 23 | |
| Total | $1,747 | | | $1,761 | | | $1,859 | | | $1,625 | | | $1,584 | | | $1,562 | |
| Sales (000s MWh): | | | | | | | | | | | |
| Residential | 3,573 | | | 3,586 | | | 3,793 | | | 3,531 | | | 3,590 | | | 3,686 | |
| Commercial | 3,974 | | | 3,988 | | | 4,049 | | | 2,330 | | | 2,341 | | | 2,387 | |
| Industrial | 6,073 | | | 6,335 | | | 6,428 | | | 5,088 | | | 5,100 | | | 5,066 | |
| Retail subtotal | 13,620 | | | 13,909 | | | 14,270 | | | 10,949 | | | 11,031 | | | 11,139 | |
| Sales for resale: | | | | | | | | | | | |
| Wholesale | 750 | | | 766 | | | 771 | | | 2,033 | | | 2,093 | | | 2,095 | |
| Bulk power and other | 1,138 | | | 1,465 | | | 1,401 | | | 4,482 | | | 3,265 | | | 2,333 | |
| Other | 32 | | | 32 | | | 33 | | | 25 | | | 26 | | | 29 | |
| Total | 15,540 | | | 16,172 | | | 16,475 | | | 17,489 | | | 16,415 | | | 15,596 | |
| Customers (End of Period): | | | | | | | | | | | |
| Retail | 503,279 | | | 500,938 | | | 498,515 | | | 499,688 | | | 495,044 | | | 490,854 | |
| Other | 881 | | | 878 | | | 867 | | | 2,034 | | | 2,036 | | | 2,036 | |
| Total | 504,160 | | | 501,816 | | | 499,382 | | | 501,722 | | | 497,080 | | | 492,890 | |
| Other Selected Electric Data: | | | | | | | | | | | |
| Maximum summer peak hour demand (MW) | 2,833 | | | 2,940 | | | 2,895 | | | 2,805 | | | 2,926 | | | 2,800 | |
| Maximum winter peak hour demand (MW) | 2,359 | | | 2,294 | | | 2,449 | | | 2,034 | | | 1,946 | | | 2,046 | |
| Cooling degree days (a): | | | | | | | | | | | |
| Cedar Rapids, Iowa (IPL) (normal - 819) | 890 | | | 974 | | | 908 | | | N/A | | N/A | | N/A |
| Madison, Wisconsin (WPL) (normal - 704) | N/A | | N/A | | N/A | | 742 | | | 781 | | | 787 | |
| Sources of electric energy (000s MWh): | | | | | | | | | | | |
| Gas | 5,965 | | | 6,636 | | | 4,625 | | | 7,918 | | | 8,128 | | | 6,813 | |
| Purchased power: | | | | | | | | | | | |
| Wind (b) | 2,681 | | | 2,504 | | | 2,985 | | | 1,604 | | | 1,563 | | | 1,437 | |
| | | | | | | | | | | |
| Other (b) | 1,228 | | | 730 | | | 835 | | | 487 | | | 1,153 | | | 1,968 | |
| Wind (b) | 4,347 | | | 4,257 | | | 4,991 | | | 1,193 | | | 1,153 | | | 1,433 | |
| Solar (b) | 119 | | | 11 | | | 11 | | | 1,714 | | | 460 | | | 30 | |
| Coal | 1,442 | | | 2,252 | | | 3,305 | | | 4,762 | | | 4,195 | | | 4,111 | |
| Other (b) | — | | | 1 | | | 2 | | | 201 | | | 185 | | | 196 | |
| Total | 15,782 | | | 16,391 | | | 16,754 | | | 17,879 | | | 16,837 | | | 15,988 | |
| Revenue per KWh sold to retail customers (cents) | $12.20 | | | $11.94 | | | $12.24 | | | $12.30 | | | $12.21 | | | $11.42 | |
(a)Cooling degree days are calculated using a simple average of the high and low temperatures each day compared to a 65 degree base. Normal degree days are calculated using a rolling 20-year average of historical cooling degree days. Refer to “Gas Operating Information” below for details of heating degree days. (b)All or some of the renewable energy attributes associated with generation from these sources may be used in future years to comply with renewable energy standards or other regulatory requirements.
2) GAS UTILITY OPERATIONS
General - Alliant Energy’s gas utility operations are located in the Midwest with IPL providing gas service in Iowa and WPL providing gas service in Wisconsin. Refer to the “Gas Operating Information” tables for additional details regarding gas utility operations. Refer to Note 1(g) for information relating to utility natural gas cost recovery mechanisms and Note 16(b) for discussion of natural gas commitments.
Customers - IPL and WPL provide gas utility service to a large base of retail customers and industries, including research, education, hospitality, manufacturing and chemicals (including ethanol). In addition, IPL and WPL provide transportation service to commercial and industrial customers by moving customer-owned gas through Alliant Energy’s distribution systems to the customers’ meters.
Seasonality - Gas sales follow a seasonal pattern with an annual base-load of gas and a large heating peak occurring during the winter season. Natural gas obtained from producers, marketers and brokers, as well as gas in storage, is utilized to meet the peak heating season requirements. Storage contracts generally allow IPL and WPL to purchase gas in the summer and inject it into underground storage fields, and remove it from storage fields in the winter to deliver to customers.
Competition - Gas customers in Iowa and Wisconsin currently do not have the ability to choose their gas distributor, and IPL and WPL have obligations to serve all their gas customers. While the gas utility distribution function is expected to remain a regulated function, sales of the natural gas commodity and related services are subject to competition from third-parties who provide alternative fuel sources (e.g. propane). However, when natural gas service is available for a given area, customers in such area have generally selected natural gas over propane as a more cost competitive solution for their fuel needs. Refer to “Customer Investments” in MDA for discussion of plans to expand gas distribution systems.
Gas Supply - IPL and WPL maintain purchase agreements with numerous suppliers of natural gas from various gas producing regions of the U.S. and Canada. In providing gas commodity service to retail customers, Corporate Services administers a portfolio of transportation and storage contracts on behalf of IPL and WPL. The tariffs for IPL’s and WPL’s retail gas customers provide for subsequent adjustments to their rates for the cost of gas sold to these customers. As a result, natural gas prices do not have a material impact on IPL’s or WPL’s operating income.
Gas Demand Planning Reserve Margin - IPL and WPL are required to maintain adequate pipeline capacity to ensure they meet their customers’ maximum daily system demand requirements. IPL and WPL currently have planning reserve margins of 2% and 5%, respectively, above their forecasted maximum daily system demand requirements from November 2024 through March 2025.
| | | | | | | | | | | | | | | | | |
| Gas Operating Information - Alliant Energy | 2024 | | 2023 | | 2022 |
| Revenues (in millions): | | | | | |
| Residential | $275 | | | $316 | | | $371 | |
| Commercial | 133 | | | 163 | | | 197 | |
| Industrial | 11 | | | 16 | | | 20 | |
| Retail subtotal | 419 | | | 495 | | | 588 | |
| Transportation/other | 46 | | | 45 | | | 54 | |
| Total | $465 | | | $540 | | | $642 | |
| Sales (000s Dths): | | | | | |
| Residential | 24,243 | | | 25,838 | | | 31,109 | |
| Commercial | 16,974 | | | 18,291 | | | 21,097 | |
| Industrial | 2,272 | | | 2,276 | | | 2,815 | |
| Retail subtotal | 43,489 | | | 46,405 | | | 55,021 | |
| Transportation/other | 123,386 | | | 115,177 | | | 104,812 | |
| Total | 166,875 | | | 161,582 | | | 159,833 | |
| Retail Customers (End of Period) | 430,699 | | | 428,143 | | | 426,153 | |
| Other Selected Gas Data: | | | | | |
| Heating degree days (a): | | | | | |
| Cedar Rapids, Iowa (IPL) (normal - 6,736) | 5,450 | | | 5,807 | | | 7,222 | |
| Madison, Wisconsin (WPL) (normal - 6,987) | 5,801 | | | 6,157 | | | 7,210 | |
| Revenue per Dth sold to retail customers | $9.63 | | | $10.67 | | | $10.69 | |
| Purchased gas costs per Dth sold to retail customers | $5.06 | | | $6.37 | | | $6.97 | |
| | | | | | | | | | | | | | | | | | | | | | | | | | | | | | | | | | | |
| Gas Operating Information | IPL | | WPL |
| 2024 | | 2023 | | 2022 | | 2024 | | 2023 | | 2022 |
| Revenues (in millions): | | | | | | | | | | | |
| Residential | $148 | | | $176 | | | $202 | | | $127 | | | $140 | | | $169 | |
| Commercial | 68 | | | 86 | | | 101 | | | 65 | | | 77 | | | 96 | |
| Industrial | 7 | | | 11 | | | 14 | | | 4 | | | 5 | | | 6 | |
| Retail subtotal | 223 | | | 273 | | | 317 | | | 196 | | | 222 | | | 271 | |
| Transportation/other | 27 | | | 27 | | | 34 | | | 19 | | | 18 | | | 20 | |
| Total | $250 | | | $300 | | | $351 | | | $215 | | | $240 | | | $291 | |
| Sales (000s Dths): | | | | | | | | | | | |
| Residential | 12,413 | | | 13,146 | | | 16,250 | | | 11,830 | | | 12,692 | | | 14,859 | |
| Commercial | 7,714 | | | 8,477 | | | 10,257 | | | 9,260 | | | 9,814 | | | 10,840 | |
| Industrial | 1,513 | | | 1,505 | | | 1,985 | | | 759 | | | 771 | | | 830 | |
| Retail subtotal | 21,640 | | | 23,128 | | | 28,492 | | | 21,849 | | | 23,277 | | | 26,529 | |
| Transportation/other | 43,075 | | | 43,232 | | | 43,264 | | | 80,311 | | | 71,945 | | | 61,548 | |
| Total | 64,715 | | | 66,360 | | | 71,756 | | | 102,160 | | | 95,222 | | | 88,077 | |
| Retail Customers (End of Period) | 226,838 | | | 226,265 | | | 226,284 | | | 203,861 | | | 201,878 | | | 199,869 | |
| Other Selected Gas Data: | | | | | | | | | | | |
| Maximum daily winter peak demand (Dth) | 267,820 | | | 290,922 | | | 259,474 | | | 221,135 | | | 234,796 | | | 201,980 | |
| Heating degree days (a): | | | | | | | | | | | |
| Cedar Rapids, Iowa (IPL) (normal - 6,736) | 5,450 | | | 5,807 | | | 7,222 | | N/A | | N/A | | N/A |
| Madison, Wisconsin (WPL) (normal - 6,987) | N/A | | N/A | | N/A | | 5,801 | | | 6,157 | | | 7,210 |
| Revenue per Dth sold to retail customers | $10.30 | | $11.80 | | $11.13 | | $8.97 | | $9.54 | | $10.22 |
| Purchased gas cost per Dth sold to retail customers | $5.68 | | $7.16 | | $7.17 | | $4.44 | | $5.59 | | $6.77 |
(a)Heating degree days are calculated using a simple average of the high and low temperatures each day compared to a 65 degree base. Normal degree days are calculated using a rolling 20-year average of historical heating degree days.
3) OTHER UTILITY OPERATIONS - STEAM - IPL’s Prairie Creek facility provides steam for IPL’s two high-pressure steam customers in Iowa. These customers are each under contract through 2025 for taking minimum quantities of annual steam usage, with certain conditions, after which IPL currently expects to exit the steam business.
ITEM 1A. RISK FACTORS
You should carefully consider each of the risks described below relating to Alliant Energy, IPL and WPL, together with all of the other information contained in this combined report, before making an investment decision with respect to our securities. If any of the following risks develop into actual events, our business, financial condition or results of operations could be materially and adversely affected, and you may lose all or part of your investment.
Risks Related to Laws and Regulations
Our utility business is significantly impacted by government legislation, regulation and oversight - Our utility financial condition is influenced by how regulatory authorities, including the IUC, the PSCW and FERC, establish the rates we can charge our customers, our authorized rates of return and common equity levels, and the costs that may be recovered from customers. Our ability to timely obtain rate adjustments to earn authorized rates of return depends upon timely regulatory action under applicable statutes and regulations, and cannot be guaranteed. IPL and WPL may not receive an adequate amount of rate relief to recover all costs and earn their authorized rates of return, rates may be reduced, rate refunds may be required, rate adjustments may not be approved on a timely basis, costs may not be otherwise recovered through rates, earnings above certain thresholds may be required to be refunded, recovery of capital expenditures, including those for electric distribution systems, above certain thresholds may be capped or not be allowed, rates may be temporarily frozen, such as IPL’s current retail electric rate base moratorium through September 2029, laws, rules or settlements may limit the ability to file rate adjustments or the period covered by a rate adjustment, regulatory decisions may limit the ability to defer recovery of and a return on prudently incurred costs in between rate reviews, certain rate base items may not receive a full weighted average cost of capital, and authorized rates of return on capital may be reduced. As a result, we may experience adverse impacts on our financial condition and results of operations.
In addition, our operations are subject to extensive regulation primarily by the IUC, the PSCW and FERC. We are also subject to oversight and monitoring by organizations such as the North American Electric Reliability Corporation, the Midwest Reliability Organization, the Pipeline and Hazardous Materials Safety Administration, the Midcontinent Independent System Operator, Inc. (MISO) and the Department of Homeland Security Transportation Security Administration. The impacts on our operations include: our ability to site and construct new energy facilities, such as renewable energy, energy storage projects, or natural gas-fired electric generating units, and recover associated costs; our ability to decommission generating facilities
and recover related costs and the remaining carrying value of these facilities and related assets; MISO’s resource adequacy process establishing seasonal capacity planning reserve margin and capacity accreditation requirements, as well as additional changes to capacity accreditation, such as the direct loss of load methodology, impact how and when existing and new generating facilities such as IPL’s and WPL’s additional solar generation are accredited with energy capacity, and may require IPL and WPL to adjust their current resource plans, to add resources to meet the requirements of MISO’s seasonal resource adequacy process, or procure capacity whereby such costs might not be recovered in rates; the impact of the lack of availability of existing and new generating facilities has on our accredited capacity for such facilities pursuant to MISO’s seasonal resource adequacy process; IPL’s ability to achieve certain aggregate summer capacity factors under the consumer protection plan for its up to 400 MW of solar generation projects; the rates paid to transmission operators and how those costs are recovered from customers, including our ability to continue to use a transmission rider in Iowa; our ability to site, construct and recover costs for new natural gas pipelines; our ability to recover costs to upgrade our electric and gas distribution systems; the amount of certain sources of energy we must use, such as renewable sources; our ability to purchase generating facilities and recover the costs associated therewith; our ability to sell utility assets and any conditions placed upon the sale of such assets; our ability to enter into purchased power agreements and recover the costs associated therewith; the allocation of expenditures by transmission companies on transmission network upgrades and our ability to recover costs associated therewith; reliability; safety; the issuance of securities and ability to use other financing arrangements for our renewable energy projects; accounting matters; and transactions between affiliates. These regulatory authorities and organizations are also empowered to impose financial penalties and other sanctions, including requirements to implement new compliance programs. Failure to obtain approvals for any of these matters in a timely manner, or receipt of approvals with uneconomical conditions, may cause us not to pursue the construction of such projects, or to record an impairment of our assets, or may cause a delay in construction of such projects such that we are not able to meet new demand growth, and may have a material adverse impact on our financial condition and results of operations. Our regulators or legislatures could change regulations or laws to permit third parties to provide renewable energy directly to our customers without being treated as a utility, potentially causing a competitive disadvantage for us. Changes to these regulations could materially increase our costs or cause us to reconsider our strategy, which could have a material adverse impact on our financial condition and results of operations.
Provisions of the Wisconsin Utility Holding Company Act may limit our ability to invest in or grow our non-utility activities and may deter potential purchasers who might be willing to pay a premium for our stock.
Our utility businesses are subject to numerous environmental laws and regulations - Our utilities are subject to numerous federal, regional, state and local environmental laws, regulations, court orders, and international treaties. These laws, regulations and court orders generally concern emissions into the air, discharges into water, use of water, wetlands preservation, remediation of contamination, waste disposal and containment, disposal of coal combustion residuals, hazardous waste disposal, threatened and endangered species, and noise regulation, among others. Failure to comply with such laws, regulations and court orders, or to obtain or comply with any necessary environmental permits pursuant to such laws and regulations, could result in injunctions, fines or other sanctions. Environmental laws and regulations affecting power generation and electric and gas distribution are complex and subject to continued uncertainty and could be changed by the current or future Presidential or Gubernatorial Administrations. These laws and regulations have imposed, and proposed laws and regulations could impose in the future, additional costs on our utility operations and requirements that impact our ability to continue operating electric generating units. We have incurred, and will continue to incur, capital and other expenditures to comply with these and other environmental laws and regulations. Changes in or new development of environmental restrictions may force us to incur significant expenses or expenses that may exceed our estimates. Our future plans and existing operations may be impacted by changing expectations, including environmental and social justice concerns related to renewable energy and a low-carbon economy. There can be no assurance that we would be able to recover all or any increased environmental costs from our customers. Failure to comply with the laws, regulations and court orders, changes in the laws and regulations and failure to recover costs of compliance may adversely impact our financial condition and results of operations.
Actions related to global climate change and reducing greenhouse gas (GHG) emissions could negatively impact us - We have established voluntary GHG reduction goals and continue to review our strategy; however, the ability to achieve our voluntary GHG reduction goals and implement our strategy is subject to uncertainties as to how climate change concerns will ultimately impact us and various factors that may be out of our control. These uncertainties include transition risks related to laws and regulations, technology and business operations, or economic and market conditions. Research and development of technologies, innovations, and advancements may not evolve as anticipated in order to provide cost-effective alternatives to traditional energy sources. We could suffer financial loss, reputational damage, litigation, or other negative repercussions if we are unable to meet our voluntary GHG reduction goals. In addition, there are physical risks associated with adapting to changing climate conditions and extreme weather events. Further, assessment of the science to evaluate and limit global temperature rise continues to evolve. We could incur costs or other obligations to comply with future GHG regulations, and could become the target of legal claims or challenges, because generating electricity using fossil fuels emits GHGs. Further, investors may determine that we are too reliant on fossil fuels, reducing demand for our stock, which may cause our stock price to decrease, or investors may not buy our debt securities, which may cause our cost of capital to increase. We could face additional pressures from customers, investors or other stakeholders to more rapidly reduce GHG emissions on a voluntary-basis, including faster adoption of lower GHG emitting technologies and management of excess renewable energy credits. The pace and feasibility to fully achieve decarbonization is also contingent on the future development and full-scale deployment of emerging energy technologies and supporting infrastructure, as well as electrification of other economic sectors.
Changing economic conditions and drivers to support significant load growth, including data centers, could influence electric demand. This could affect the timing of retirement for our existing coal-fired electric generating units, and our need to add new fossil-fueled generation resources due to growing electric loads. We may not be able to recover all costs for projects to reduce GHG emissions in rates if regulators determine that the pace of GHG emissions efforts or new technologies are not prudent. The extent of the U.S. Environmental Protection Agency’s proposed rules to regulate GHG emissions at fossil-fuel fired electric generating units and specific impacts, including state plans to implement the emissions reductions, remains uncertain. There could also be changes by the current or future Presidential or Gubernatorial Administrations. Various legislative and regulatory proposals to address climate change at the national, state and local levels continue to be introduced. Potential future requirements to reduce GHGs from the energy and manufacturing sectors could affect our operations in various ways. Regulation or legislation mandating GHG emissions reductions or other clean energy standards affecting utility companies could materially increase costs, causing some electric generating units to be uneconomical to operate or maintain. We are vulnerable to potential risks associated with the construction of electric generating units that may extend to our supply chain and natural gas operations. Regulation of oil and gas production could affect our upstream supply of natural gas for electricity generation and to provide directly to our residential and business customers from our local distribution company. This could result in rapid increased demand for alternative non-fossil fuel energy sources and economy-wide electrification. Changes to regional and local climate trends such as the frequency, seasonality, and severity of weather conditions could directly and indirectly impact our company. Acute and chronic physical risks could disrupt our operations or affect our property. Furthermore, it could affect the timing of peak demand and overall energy consumption of our customers. We cannot provide any assurance regarding the potential impacts of climate change or related policies and regulations to reduce GHG emissions on our operations, which could have a material adverse impact on our financial condition and results of operations.
Changes to certain tax elections, tax regulations and future taxable income could negatively impact our financial condition and results of operations - We have significantly reduced our federal and state income tax obligations through tax planning strategies and the utilization of bonus depreciation deductions for certain expenditures for property. These tax planning strategies and bonus depreciation deductions have reduced taxable income, which in turn has generated large tax credit carryforwards. We plan to utilize all of these tax credit carryforwards in the future to reduce our income tax obligations. If we cannot generate enough taxable income in the future to utilize all of the tax credit carryforwards before they expire due to lower than expected financial performance or changes to tax regulations, we may incur material charges to earnings. The Inflation Reduction Act of 2022 allows for the sale or transfer of eligible renewable tax credits to other taxpayers. We have sold, and continue to plan to sell, a substantial amount of our eligible renewable tax credits. The inability to sell renewable tax credits at reasonable terms, or the determination that renewable tax credits that we generate or sell are not eligible or are eligible at a different rate, could materially impact our tax credit carryforward position or result in liability to purchasers of the tax credits, which could subject us to significant litigation, liability and costs. Repeal or amendment of the Inflation Reduction Act of 2022, or portions of the Inflation Reduction Act of 2022, could have an adverse impact on our financial condition and results of operations, including, but not limited to, a material increase in customer costs, a material decrease in cash flows from operating activities, which could impact metrics used by rating agencies, and a negative impact on the economics of future planned renewable and energy storage projects. In addition, our tax liability is determined by our taxable income multiplied by the current tax rates in effect. If the federal or state tax rates are increased, or we become subject to a corporate alternative minimum tax, we may experience adverse impacts to our financial condition and results of operations until those rates are reflected in our regulatory filings.
Our utility business currently operates wind and solar generating facilities, which generate production tax credits that are eligible to be used to reduce our federal tax obligations. The amount of production tax credits we earn is dependent on the level of electricity output generated by our qualifying generating facilities and sold to an unrelated buyer, and the applicable tax credit rate. A variety of operating and economic parameters, including transmission constraints, the imbalance of supply and demand of energy resulting in unfavorable pricing for wind or solar energy, adverse weather conditions and breakdown or failure of equipment, could significantly reduce the production tax credits generated by our wind or solar facilities resulting in a material adverse impact on our financial condition and results of operations.
Our utility business is developing energy storage facilities, which are expected to generate investment tax credits. Investment tax credits are dependent on the tax capitalized costs of the qualifying generating facilities and the applicable tax credit rate. If there is a disagreement on the qualifying costs or whether the facility qualifies for higher levels of investment tax credits, the amount of investment tax credits awarded may be significantly reduced, possibly adversely impacting our financial condition and results of operations. If energy storage facilities are not completed in the anticipated timeframe or investment tax credits are not able to be generated or sold due to the repeal or amendment of the Inflation Reduction Act of 2022, we may experience adverse impacts on our financial condition and results of operations.
The Inflation Reduction Act of 2022 introduced new labor requirements that are required to qualify for the full value of renewable tax credits. Failure to meet these requirements on renewable projects that began construction after January 28, 2023 could result in a significant reduction in the amount of renewable tax credits, which could adversely impact our financial condition and results of operations.
Risks Related to Business Operations
Demand for energy may decrease - Our results of operations are affected by the demand for energy in our service territories. Energy demand may decrease due to many things, including economic conditions, proliferation of customer and third party-
owned generation, technological advances that reduce the costs of renewable energy and energy storage solutions for our customers, government policies, such as the Inflation Reduction Act of 2022, which incentivize customer and third party-owned generation, loss of service territory or franchises, energy efficiency measures, changes in customer usage due to rate design changes, such as time of use rates, technological advances that improve energy efficiency, third-party disrupters, loss of wholesale customers, loss of customers that pursue their own renewable projects to achieve specific sustainability goals, and the adverse impact of tariffs on our customers. The loss of sales due to lower demand for energy may increase our rates for remaining customers, as our rates must cover our fixed costs. Increased customer rates may cause decreased demand for energy as customers move to customer and third party-owned generation and implement energy efficiency measures to reduce costs. The loss of customers, the inability to replace those customers with new customers, and the decrease in demand for energy could negatively impact our financial condition and results of operations.
Our utility business is seasonal and may be adversely affected by the impacts of weather - Electric and gas utility businesses are seasonal businesses. Demand for electricity is greater in the summer months associated with higher air conditioning needs and winter months associated with higher heating needs. Demand for natural gas depends significantly upon temperature patterns in winter months due to heavy use in residential and commercial heating. As a result, our overall operating results in the future may fluctuate substantially on a seasonal basis. In addition, we have historically generated less revenues and income when temperatures are warmer in the winter and/or cooler in the summer. Thus, mild winters and/or summers could have an adverse impact on our financial condition and results of operations.
Demand for energy from high usage customers may impact our business - The ability to serve significant new commercial or industrial customers on contract rates, including data centers, may require certain regulatory approvals, and the activities and costs related to the construction, acquisition or contracts for additional generation capacity and transmission required to meet the high demands of such customers could be significant. The inability or delays in obtaining regulatory approvals or securing additional capacity or transmission, due to supply chain risk, operational risk, or other factors, may impact our ability, or the cost, to provide energy to new customers, the contract rates may not fully recover the costs, the contracts may increase counterparty credit risk, and the costs to provide service may be higher than expected. The contract rates for high usage customers are subject to regulatory approvals and our regulatory authorities may change the rates we can charge and the costs that can be recovered. A high usage customer may decide not to take energy, take less energy than anticipated, or not take service on the anticipated schedule, due to changes in business needs, construction delays, technological advances that improve energy efficiency, or other factors, which may result in lower demand for energy than anticipated. The addition of high usage customers may increase the concentration of sales, and increase revenue and earnings volatility. These factors could negatively impact our financial condition and results of operations.
A cyber attack may disrupt our operations or lead to a loss or misuse of confidential and proprietary information or potential liability - We operate in an industry that requires the continuous use and operation of information and telecommunications systems. We face threats from use of malicious code (such as malware, viruses and ransomware), employee theft or misuse, vulnerabilities (such as the log4j and MOVEit vulnerabilities), fraud attempts, phishing attacks and advanced persistent threats. This includes threats from nation-state actors (such as VOLT TYPHOON and SALT TYPHOON), which have demonstrated an increased focus on targeting critical industries, including telecommunications and energy. Incidents of ransomware attacks have been increasing in frequency and magnitude. Emerging artificial intelligence technologies may be used to develop new hacking tools, exploit vulnerabilities, obscure malicious activities, and increase the difficulty detecting threats. Cyber attacks targeting electronic control systems used at our generating facilities and for electric and gas distribution systems could result in a full or partial disruption of our electric and/or gas operations. We have relied on a global supply chain for certain components of our operating and technology systems, which may increase our exposure to cyber attacks. Any disruption of these operations could result in a loss of service to customers and a significant decrease in revenues, as well as significant expense to repair system damage and remedy security breaches. Due to the evolving nature of cyber attacks and cybersecurity, our current safeguards to protect our operating systems and information technology assets may not always be effective. We rely on third parties for software to protect against cyber attacks and we are at risk if such third parties are targets of cyber attacks. Measures taken to avoid, detect, mitigate or recover from cybersecurity breaches or incidents may be insufficient or become ineffective, and there are no assurances that cybersecurity breaches or incidents will not impact our business, operations and financial condition. If the technology systems were to fail or be breached by a cyber attack or a computer virus, and not be recovered in a timely fashion, we may be unable to fulfill critical business functions and confidential data could be compromised, adversely impacting our financial condition and results of operation.
In addition, we use information technology systems to collect and retain sensitive information, including personal information about our customers, shareowners and employees, which is subject to privacy laws and regulations. In some cases, we outsource administration of certain functions to vendors that have been or could be targets of cyber attacks. Any theft, loss and/or fraudulent use of customer, shareowner, employee or proprietary data as a result of a cyber attack could subject us to significant litigation, liability and costs, as well as adversely impact our reputation with customers and regulators, among others.
Our strategy includes large construction projects, which are subject to risks - Our strategy includes constructing renewable generating facilities, energy storage facilities, natural gas-fired generating facilities, and large-scale additions and upgrades to our electric and gas distribution systems and generating assets. These construction and upgrade projects are subject to various risks. These risks include: the inability to obtain necessary regulatory approvals and permits in a timely
manner; adverse interpretation or enforcement of permit conditions; changes in applicable laws or regulations; changes in costs of materials, equipment, commodities, fuel or labor including due to inflation, tariffs or labor issues; delays caused by construction accidents or injuries; shortages in materials, equipment, or qualified labor; changes to the scope or timing of the projects; general contractors, subcontractors, or equipment not performing as required under their contracts; the inability to agree to contract terms or disputes in contract terms; the inability to successfully resolve warranty claims; poor initial cost estimates; work stoppages; adverse weather conditions; government actions; legal action; unforeseen engineering or technology issues; limited access to capital or other financing arrangements; and other adverse economic conditions. We outsource certain business functions to third-party suppliers and service providers, and substandard performance by those third parties could harm our business, reputation and results of operations. We may not be able to recover all costs for the projects in rates and face increased risk of potential impairment of our project investment if a construction project is not completed or is delayed, or final costs exceed expectations or the costs approved by our regulators. For example, WPL has notified the PSCW that its solar generating facility developments have exceeded the approved costs. We may not be able to meet capacity requirements, including new demand from high usage customers, to comply with electric demand planning reserve margins if a construction project is not completed or is delayed. Inability to recover costs, or inability to complete projects or recover costs in a timely manner, could adversely impact our financial condition and results of operations.
Supply chain disruptions could negatively impact our operations and implementation of our strategy - Our operations and strategy depend on the global supply chain to procure the equipment, materials and other resources necessary to provide services in a safe and reliable manner and construct new utility infrastructure. The global supply chain has experienced, and is expected to continue to experience, disruptions due to a multitude of factors, such as geopolitical issues, supplier manufacturing constraints, labor issues, transportation issues, tariffs, changes in laws, executive orders, resource availability, long lead times, tighter credit markets, inflation, pandemics and weather. These disruptions have impacted, and are expected to continue to impact, our ability to receive critical materials, supplies and services in a timely and economic manner. This could have an adverse impact by increasing costs and delaying the construction, maintenance or repair of items that are needed to support normal operations or are necessary to our construction projects to implement our strategy. Inability to recover higher costs, or inability to complete projects in a timely manner, could adversely impact our financial condition and results of operations.
We face risks associated with operating electric and natural gas infrastructure - The operation of electric generation and distribution infrastructure involves many risks, including start-up risks, breakdown or failure of equipment, fires developing from our power lines, transformers, energy storage facilities, or substations, dam failure at one of our hydroelectric facilities, the dependence on a specific fuel source, including the supply and transportation of fuel, the risk of performance below expected or contracted levels of output or efficiency, members of the public or contractors coming into contact with our infrastructure, public and employee safety, operator error, and ruptured oil and chemical tanks. The operation of our natural gas distribution and transportation infrastructure also involves many risks, such as leaks, explosions, mechanical problems, members of the public or contractors coming into contact with our infrastructure, and employee and public safety. In addition, the North American electric transmission grid is highly interconnected and, in extraordinary circumstances, disruptions at particular points within the grid could cause an extensive power outage in our service territories. Increased utilization of customer- and third party-owned generation technologies could also disrupt the reliability and balance of the electricity grid. Further, the electric transmission system in our utilities’ service territories can experience constraints, limiting our ability to transmit electricity. The transmission constraints could result in an inability to deliver electricity from generating facilities, particularly wind and solar generating facilities, to the national grid, or to access lower cost sources of electricity.
These risks could cause significant harm to employees, customers and the public, including loss of human life, significant damage to property, adverse impacts on the environment and impairment of our operations, all of which could result in substantial financial losses to us. We are also responsible for compliance with new and changing regulatory standards involving safety, reliability and environmental compliance, including regulations under the Pipeline and Hazardous Materials Safety Administration, the Occupational Health and Safety Administration, the North American Electric Reliability Corporation and the Department of Homeland Security Transportation Security Administration. Failure to meet these regulatory standards could result in substantial fines. Lastly, we have obligations to provide electric and natural gas service to customers under regulatory requirements and contractual commitments. Failure to meet our service obligations could adversely impact our financial condition and results of operations.
Storms or other natural disasters may impact our operations in unpredictable ways - Storms and other natural disasters, including events such as floods, tornadoes, windstorms like the 2020 derecho in Iowa, blizzards, ice storms, extreme hot temperatures, extreme cold temperatures, fires, wildfires, solar flares or pandemics may adversely impact our ability to generate, purchase or distribute electric energy and gas or obtain fuel or other critical supplies. In addition, we could incur large costs to repair damage to our generating facilities and electric and gas infrastructure, or costs related to environmental remediation, due to storms or other natural disasters. The restoration costs may not be fully covered by insurance policies and may not be fully recovered in rates, or recovery in rates may be delayed. Insurance coverage may not continue to be available at all, or at rates or terms similar to those presently available to us. In addition, our insurance may not be sufficient or effective under all circumstances and against all hazards or liabilities to which we may be subject. Any losses for which we are not fully insured or that are not covered by insurance at all could materially adversely affect our results of operations and financial position. Storms and natural disasters may impact our customers and the resulting reduced demand for energy could cause
lower sales and revenues, which may not be replaced or recovered in rates, or rate recovery may be delayed. Any of these items could adversely impact our financial condition and results of operations.
Threats of terrorism and catastrophic events that could result from terrorism may impact our operations in unpredictable ways - We are subject to direct and indirect effects of terrorist threats and activities. Generation, transmission and distribution facilities, in general, have been identified as potential targets of physical or cyber attacks. Physical attacks on transmission and distribution facilities that appeared to be terrorist-style attacks have occurred. Our gas distribution system could also be the target of terrorist threats and activities. The risks posed by such attacks could include, among other things, the inability to generate, purchase or distribute electric energy or obtain fuel sources, the increased cost of security and insurance, the disruption of, volatility in, or other effects on capital markets, and a decline in the economy and/or energy usage within our service territories, all of which could adversely impact our financial condition and results of operations. In addition, the cost of repairing damage to our facilities and infrastructure caused by acts of terrorism, and the loss of revenue if such events prevent us from providing utility service to our customers, could adversely impact our financial condition and results of operations.
We may not be able to fully recover costs related to commodity prices - We have natural gas and coal supply and transportation contracts in place for some of the natural gas and coal we require to generate electricity. We also have transportation and supply agreements in place to facilitate delivery of natural gas to our customers. Our counterparties to these contracts may not fulfill their obligations to provide natural gas, coal, financial settlements or collateral to us due to financial or operational problems caused by natural disasters, severe weather, economic conditions, labor shortages, employee strikes, transportation issues, pandemics, physical attacks or cyber attacks. If we were unable to obtain enough natural gas or coal for our electric generating units under our existing contracts, or to obtain electricity under existing or future purchased power agreements, we could be required to purchase natural gas or coal at higher prices, need to secure higher cost delivery of natural gas or coal, be forced to curtail the operation of our natural gas-fired or coal-fired generating facilities, be forced to purchase electricity from higher-cost generating resources in the MISO energy market and/or be required to purchase replacement capacity to comply with electric demand planning reserve margins. We may be obligated to pay for coal deliveries under our contracts even if our coal-fired generating facilities do not operate enough to fully utilize the amounts of coal covered by the contracts. If, for natural gas delivery to our customers, we were unable to obtain our natural gas supply requirements under existing or future natural gas supply and transportation contracts, we could be required to purchase natural gas at higher prices from other sources. Natural gas market prices have been volatile in the past and could be volatile in the future due to additional future regulations, increased demand including due to increased liquified natural gas demand from foreign countries, limited global suppliers of natural gas, periods of extremely cold temperatures or disruption in supply caused by major storms or pipeline explosions. Our utility business also operates wind and solar generating facilities that sell electricity in the MISO energy market. If MISO energy market prices result in unfavorable pricing for wind or solar energy, this may reduce the energy market revenue produced by those facilities and result in higher electricity costs that would need to be recovered from customers. We may not be able to pass on all of the changes in costs to our customers, especially at WPL where we do not have an automatic retail electric fuel cost adjustment clause to timely recover such costs and where electric fuel cost recovery may be limited if WPL earns in excess of its authorized return on common equity. Increases in prices and costs due to disruptions that are not recovered in rates fully or not recovered in a timely manner, may adversely impact our financial condition and results of operations.
Energy industry changes could have a negative effect on our businesses - We operate in a highly regulated business environment. The advent of new and unregulated markets has the potential to significantly impact our financial condition and results of operations. Further, competitors may not be subject to the same operating, regulatory and financial requirements that we are, potentially causing a substantial competitive disadvantage for us. Changes in public policy, such as new tax incentives that we cannot take advantage of or efforts to deregulate the utility industry, could provide an advantage to competitors. Changes in technology could also alter the channels through which electric customers produce, store, buy or utilize power, which could reduce the revenues or increase the expenses of our utility companies. Increased competition in our primary retail electric service territories may have an adverse impact on our financial condition and results of operations.
We face risks related to non-utility operations - We rely on our non-utility operations for a portion of our earnings. If our non-utility holdings do not perform at expected levels, we could experience an adverse impact on our financial condition and results of operations.
Risks Related to Economic, Financial and Labor Market Conditions
We are subject to employee workforce factors that could affect our businesses - We operate in an industry that requires specialized technical skills. Further, we must build a workforce that is innovative, customer-focused and competitive to thrive in the future in order to successfully implement our strategy. We have seen and anticipate a steady pace of retirements due to our aging workforce. The labor market for our employees is very competitive, increasing the likelihood that we may lose critical employees or have difficulty hiring qualified employees for critical roles and not have enough time to adequately train employees to prepare for upcoming retirements. It may be difficult to hire and retain such a skilled workforce due to labor market conditions, such as low unemployment rates in our service territories, the length of time employees need to acquire the skills, and general competition for talent. The competitive employment market also increases the amounts we pay our employees in critical positions, which we may be unable to recover in rates. We are also subject to collective bargaining agreements covering approximately 1,700 employees. Any work stoppage experienced in connection with negotiations of
collective bargaining agreements could adversely affect our financial condition and results of operations as well as our ability to implement our strategy.
We are subject to limitations on our ability to pay dividends - Alliant Energy is a holding company with no significant operations of its own. The primary sources of funds for Alliant Energy to pay dividends to its shareowners are dividends and distributions from its subsidiaries, primarily its utility subsidiaries. Our subsidiaries are separate and distinct legal entities and have no obligation to pay any amounts to Alliant Energy, whether by dividends, distributions, loans or other payments. The ability of our subsidiaries to pay dividends or make distributions to Alliant Energy and, accordingly, our ability to pay dividends on Alliant Energy common stock will depend on regulatory limitations, earnings, cash flows, capital requirements and general financial condition of our subsidiaries. Our utilities have dividend payment restrictions based on the terms of regulatory limitations applicable to them. If we do not receive adequate dividends and distributions from our subsidiaries, then we may not be able to make, or may have to reduce, dividend payments on Alliant Energy common stock.
We are subject to risks related to inflation - We have experienced a significant increase in inflation. The impact of supply chain disruptions and other factors continue to create uncertainty in near-term economic conditions, including whether inflation will continue and at what rate. Increases in inflation raise our costs for labor, materials and services. Inflation may also cause interest rates to increase or stay elevated, increasing our cost of capital. Failure to timely recover these increased costs in rates may adversely impact our financial condition and results of operations. Further, increased costs due to inflation will directly and indirectly increase customer costs, which may decrease demand for energy or impact our customers’ ability to pay their bills, which could adversely impact our financial condition and results of operations.
We may incur material post-closing adjustments related to past asset and business divestitures - We have sold certain non-utility subsidiaries and may continue to incur liabilities relating to our previous ownership of, or the transactions pursuant to which we disposed of, these subsidiaries and assets. Any potential liability depends on a number of factors outside of our control. Any required payments on retained liabilities, guarantees or indemnification obligations with respect to past and future asset or business divestitures could adversely impact our financial condition and results of operations.
We are dependent on the capital markets and could be negatively impacted by disruptions in the capital markets - Successful implementation of our strategy is dependent upon our ability to access the capital markets. We have forecasted capital expenditures of approximately $11 billion over the next four years. Disruption, uncertainty or volatility in the capital markets could increase our cost of capital or limit our ability to raise funds needed to operate our businesses. Disruptions could be caused by Federal Reserve policies and actions, currency concerns, inflation, economic downturn or uncertainty, monetary policies, a negative view of the utility industry or our company, failures of financial institutions, U.S. debt management concerns, U.S. debt limit and budget debates, including government shutdowns, European and worldwide sovereign debt concerns, other global or geopolitical events, or other factors. IPL and WPL have entered into conditional commitments with the U.S. Department of Energy’s Loan Programs Office for loan guarantees of approximately $3 billion in aggregate and WPL has been selected for additional grants. The inability to access these funds due to federal action or other reasons may increase our costs and interest rates. Increases in interest rates will cause the cost of capital to increase and may cause the price of our equity securities to decline. Any disruptions in capital markets could adversely impact our ability to implement our strategy.
We rely on our strong credit ratings to access the credit markets. If our credit ratings are downgraded for any reason, such as worsening credit metric impacts, reduced liquidity, negative changes to our regulatory environment, or general negative outlook for the utility industry, we could pay higher interest rates in future financings, the pool of potential lenders could be reduced, borrowing costs under existing credit facilities could increase, our access to the commercial paper market could be limited, or we could be required to provide additional credit assurance, including cash collateral, to contract counterparties. If our access to capital were to become significantly constrained or costs of capital increased significantly due to lowered credit ratings, prevailing industry conditions, regulatory constraints, volatility of the capital markets, inflation or other factors, our financial condition and results of operations could be adversely affected.
Our pension and other postretirement benefits plans are subject to investment and interest rate risk that could negatively impact our financial condition - We have pension and other postretirement benefits plans that provide benefits to many of our employees and retirees. Costs of providing benefits and related funding requirements of these plans are subject to changes in the liabilities of the plans and market value of the assets that fund the plans. The funded status of the plans and the related costs reflected in our financial statements are affected by various factors, which are subject to an inherent degree of uncertainty, including economic conditions, financial market performance, interest rates, life expectancies and demographics. Recessions and volatility in the domestic and international financial markets have negatively affected the asset values of our pension plans at various times in the past. Poor investment returns or lower interest rates may necessitate accelerated funding of the plans to meet minimum federal government requirements, which could have an adverse impact on our financial condition and results of operations.
ITEM 1B. UNRESOLVED STAFF COMMENTS
None.
ITEM 1C. CYBERSECURITY
We operate in an industry that requires the continuous use and operation of information and telecommunications systems. In addition, we use information technology systems to collect and retain sensitive information, including confidential and proprietary information about our businesses, and personal information about our customers, shareowners and employees.
Cybersecurity risks are identified as key risks through the enterprise risk management (ERM) program. These risks could include use of malicious code, employee theft or misuse, advanced persistent threats, vulnerabilities, fraud attempts, and phishing attacks that could cause, among others, an operations or information technology system failure, or breach or loss of sensitive information. The potential impact of cybersecurity risks on our business operations, results of operations or financial condition is discussed in the “Risks Related to Business Operations” section of Item 1A “Risk Factors.” We have not had any material cybersecurity breaches or incidents and have not incurred any material expenses, penalties or settlement costs related to any cybersecurity breaches or incidents. However, measures that we take to avoid, detect, mitigate or recover from cybersecurity breaches or incidents may be insufficient or become ineffective, and there are no assurances that cybersecurity breaches or incidents will not impact our business operations and strategy, results of operations and financial condition.
We maintain a cybersecurity program that includes development and implementation of policies, procedures and tools designed to help ensure availability of critical operations, information technology and telecommunication systems and safeguard sensitive information. The cybersecurity program is assessed against industry standards, including certain Center for Internet Security critical security controls. This assessment is conducted by a third party periodically and internally at least annually. We are also required to comply with cybersecurity standards under the North American Electric Reliability Corporation (NERC) Critical Infrastructure Protection and by the Department of Homeland Security Transportation Security Administration. We also periodically collaborate with federal and state law enforcement experts, external assessors, consultants, industry peers and other third parties in connection with understanding market and threat conditions used to identify, assess and mitigate cybersecurity risks.
The cybersecurity program includes:
•a dedicated cybersecurity team;
•operations, information technology and telecommunication systems implemented with segmentation and multiple levels of access controls;
•a security operations center that continuously monitors information technology and telecommunications systems;
•an incident response team composed of individuals from the information technology, operations, accounting, finance, legal, and communications departments, as needed, which is activated to respond to cybersecurity incidents;
•periodic drills and exercises to address risks and prepare for extraordinary scenarios, including industry collaboration on incident preparation, such as GridEx drills hosted by NERC, participation in a full activation drill at least annually, and several tabletop drills during the year;
•periodic drills with the full executive team, including the Chief Executive Officer (CEO), Chief Financial Officer (CFO), Chief Accounting Officer (CAO), Chief Information Officer (CIO) and General Counsel;
•periodic information security awareness training and phishing simulations for employees and contractors who access our networks;
•periodic security assessments of evolving risks and threats that lead to strengthening of cybersecurity measures;
•implementation of automation solutions to strengthen detection and response capabilities; and
•maintenance of cyber liability insurance.
We also address cybersecurity risks associated with third-party service providers, including those in our supply chain or who have access to our customer and employee data or our information technology systems. Third-party risks are included in the ERM program and the cybersecurity program. Diligence is performed on third parties that have access to information technology systems, data or facilities that house such systems or data. High-risk vendors are identified and continually monitored for cybersecurity threat risks. Additionally, third parties that have access to information technology systems, data or facilities that house such systems or data, agree by contract to manage their cybersecurity risks, provide notification in the event of a cybersecurity incident, and be subject to cybersecurity audits.
Our cybersecurity program is overseen by our Senior Vice President and CIO, who has nearly four decades of experience in information technology, including two decades as a CIO, having previously held CIO roles with other organizations, as well as experience in the utility sector. The CIO oversees a team dedicated to the support of cybersecurity tools and the overall cybersecurity program. The CIO reports to the Executive Vice President and CFO. The CIO provides periodic briefs regarding prevention, detection, mitigation and remediation of cybersecurity incidents, as well as risks, threats and the threat landscape to the Board and executive management, including the CEO, CFO and CAO. These briefs are used to help continuously improve our cybersecurity program and to inform risk assessments as part of the ERM program.
The full Board of Directors is responsible for oversight of our key cybersecurity risks. The Board retains direct oversight of cybersecurity matters to best utilize the experiences and expertise of all Board members. Management, including the CIO, provides reports approximately quarterly to the Board regarding risks, threats, the threat landscape, assessments of and improvements to the cybersecurity program, and internal response preparedness.
ITEM 2. PROPERTIES
Alliant Energy - As a holding company, Alliant Energy doesn’t directly own any significant properties other than the stock of its subsidiaries. The principal properties of those subsidiaries are as follows:
IPL and WPL
Electric - At December 31, 2024, IPL’s and WPL’s facilities by primary fuel type were as follows:
| | | | | | | | | | | | | | | | | | | | |
| IPL | | | | | | | | | | Generating |
| | | | In-service | | | | | | Capacity |
| Name of Facility and Location | | | | Dates | | | | | | in MW (a) |
| Marshalltown Generating Station (Units 1-3); Marshalltown, IA | | | | 2017 | | | | | | 652 |
| Emery Generating Station (Units 1-3); Mason City, IA | | | | 2004 | | | | | | 531 |
| Marshalltown Combustion Turbines (Units 1-3); Marshalltown, IA | | | | 1978 | | | | | | 105 |
| Burlington Generating Station (Unit 1); Burlington, IA | | | | 1968 | | | | | | 131 |
| Prairie Creek Generating Station (Unit 4); Cedar Rapids, IA | | | | 1967 | | | | | | 126 |
| Burlington Combustion Turbines (Units 1-4); Burlington, IA | | | | 1994-1996 | | | | | | 37 |
| Total Gas | | | | | | | | | | 1,582 |
| Upland Prairie (121 Units); Clay and Dickinson Cos., IA | | | | 2019 | | | | | | 299 |
| Whispering Willow - North (81 Units); Franklin Co., IA | | | | 2020 | | | | | | 201 |
| Whispering Willow - East (121 Units); Franklin Co., IA | | | | 2009 | | | | | | 200 |
| Golden Plains (82 Units); Winnebago and Kossuth Cos., IA | | | | 2020 | | | | | | 200 |
| English Farms (69 Units); Poweshiek Co., IA | | | | 2019 | | | | | | 172 |
| Richland (53 Units); Sac Co., IA | | | | 2020 | | | | | | 131 |
| Franklin County (60 Units); Franklin Co., IA | | | | 2012 | | | | | | 99 |
| Total Wind | | | | | | | | | | 1,302 |
| Pleasant Creek (Units 1-2), Linn Co., IA | | | | 2024 | | | | | | 200 |
| Wever; Lee Co., IA | | | | 2024 | | | | | | 150 |
| Creston; Union Co., IA | | | | 2024 | | | | | | 50 |
| Dubuque; Dubuque, IA | | | | 2017 | | | | | | 5 |
| Marshalltown; Marshalltown, IA | | | | 2020 | | | | | | 3 |
| Customer-hosted and Community Solar; various locations in IA | | | | 2024 | | | | | | 11 |
| Total Solar | | | | | | | | | | 419 |
| Ottumwa Generating Station (Unit 1); Ottumwa, IA (b) | | | | 1981 | | | | | | 339 |
| George Neal Generating Station (Unit 4); Sioux City, IA (c) | | | | 1979 | | | | | | 167 |
| George Neal Generating Station (Unit 3); Sioux City, IA (d) | | | | 1975 | | | | | | 140 |
| Prairie Creek Generating Station (Units 1 and 3); Cedar Rapids, IA | | | | 1958-1997 | | | | | | 30 |
| Louisa Generating Station (Unit 1); Louisa, IA (e) | | | | 1983 | | | | | | 30 |
| Total Coal | | | | | | | | | | 706 |
| Lime Creek Combustion Turbines (Units 1-2); Mason City, IA | | | | 1991 | | | | | | 70 |
| Total Oil | | | | | | | | | | 70 |
| Energy Storage; various locations in IA | | | | 2019-2023 | | | | | | 9 |
| Total Energy Storage | | | | | | | | | | 9 |
| Total capacity | | | | | | | | | | 4,088 |
| | | | | | | | | | | | | | | | | | | | |
| WPL | | | | | | | | | | Generating |
| | | | In-service | | | | | | Capacity |
| Name of Facility and Location | | | | Dates | | | | | | in MW (a) |
| Riverside Energy Center (Units 1-3); Beloit, WI | | | | 2004 | | | | | | 536 |
| West Riverside Energy Center (Units 1-3); Beloit, WI (f) | | | | 2020 | | | | | | 387 |
| Neenah Energy Facility (Units 1-2); Neenah, WI | | | | 2000 | | | | | | 292 |
| South Fond du Lac Combustion Turbines (2 Units); Fond du Lac, WI (g) | | | | 1994 | | | | | | 163 |
| Total Gas | | | | | | | | | | 1,378 |
| Bent Tree (122 Units); Freeborn Co., MN | | | | 2010-2011 | | | | | | 201 |
| Kossuth (56 Units); Kossuth Co., IA | | | | 2020 | | | | | | 152 |
| Cedar Ridge (41 Units); Fond du Lac Co., WI | | | | 2008 | | | | | | 68 |
| Forward Wind Energy Center (37 Units); Dodge and Fond du Lac Cos., WI (h) | | | | 2008 | | | | | | 59 |
| Total Wind | | | | | | | | | | 480 |
| Grant County, Grant Co., WI | | | | 2024 | | | | | | 200 |
| Wood County, Wood Co., WI | | | | 2022 | | | | | | 150 |
| Onion River, Sheboygan Co., WI | | | | 2023 | | | | | | 150 |
| Springfield, Dodge Co., WI | | | | 2023 | | | | | | 100 |
| Wautoma, Waushara Co., WI | | | | 2023 | | | | | | 99 |
| Crawfish River, Jefferson Co., WI | | | | 2023 | | | | | | 75 |
| Paddock, Rock Co., WI | | | | 2023 | | | | | | 65 |
| Bear Creek, Richland Co., WI | | | | 2022 | | | | | | 50 |
| North Rock, Rock Co., WI | | | | 2022 | | | | | | 50 |
| Albany, Green Co., WI | | | | 2023 | | | | | | 50 |
| Beaver Dam, Dodge Co., WI | | | | 2023 | | | | | | 50 |
| Cassville, Grant Co., WI | | | | 2023 | | | | | | 50 |
| West Riverside, Beloit, WI (f) | | | | 2021 | | | | | | 2 |
| Customer-hosted and Community Solar; various locations in WI | | | | 2021-2022 | | | | | | 4 |
| Total Solar | | | | | | | | | | 1,095 |
| Columbia Energy Center (Units 1-2); Portage, WI (i) | | | | 1975-1978 | | | | | | 598 |
| Edgewater Generating Station (Unit 5); Sheboygan, WI | | | | 1985 | | | | | | 406 |
| Total Coal | | | | | | | | | | 1,004 |
| Prairie du Sac (8 Units); Prairie du Sac, WI | | | | 1914-1940 | | | | | | 13 |
| Kilbourn (4 Units); Wisconsin Dells, WI | | | | 1926-1939 | | | | | | 6 |
| Total Hydro | | | | | | | | | | 19 |
| Energy Storage; various locations in WI | | | | 2022-2023 | | | | | | 9 |
| Total Energy Storage | | | | | | | | | | 9 |
| Total capacity | | | | | | | | | | 3,985 |
(a)Based on the summer installed generating capacity included in MISO’s resource adequacy process for the planning period from June 2024 through May 2025, except for wind facilities, solar facilities and energy storage, which are based on nameplate capacity.
(b)Represents IPL’s 48% ownership interest, which is operated by IPL.
(c)Represents IPL’s 25.695% ownership interest, which is operated by MidAmerican Energy Company.
(d)Represents IPL’s 28% ownership interest, which is operated by MidAmerican Energy Company.
(e)Represents IPL’s 4% ownership interest, which is operated by MidAmerican Energy Company.
(f)Represents WPL’s 56.6% ownership interest, which is operated by WPL.
(g)Represents Units 2 and 3, which WPL owns. WPL also operates, but does not own, South Fond du Lac Combustion Turbines Units 1 and 4.
(h)Represents WPL’s 42.64% ownership interest, which is operated by Invenergy Services, LLC.
(i)Represents WPL’s 53.5% ownership interest, which is operated by WPL.
IPL and WPL own overhead electric distribution line, underground electric distribution cable and substation distribution transformers, substantially all of which are located in Iowa for IPL and Wisconsin for WPL.
Gas - IPL’s and WPL’s gas properties consist primarily of mains and services, meters, regulating and gate stations and other related transmission and distribution equipment. IPL’s and WPL’s gas distribution facilities include gas mains located in Iowa and Wisconsin, respectively.
Other - IPL’s other property includes steam service assets. Refer to Note 9 for information regarding WPL’s lease of the Sheboygan Falls Energy Facility from AEF’s Non-utility Generation business.
Corporate Services - Corporate Services’ property included in “Property, plant and equipment, net” on Alliant Energy’s balance sheet at December 31, 2024 consisted primarily of computer software, and the corporate headquarters building located in Madison, Wisconsin.
AEF - AEF’s principal properties included in “Property, plant and equipment, net” on Alliant Energy’s balance sheet at December 31, 2024 were as follows:
Non-utility Generation - Includes the Sheboygan Falls Energy Facility, a 347 MW, simple-cycle, natural gas-fired facility near Sheboygan Falls, Wisconsin that was placed in service in 2005 and is leased to WPL. The summer installed generating capacity included in MISO’s resource adequacy process for the planning period from June 2024 through May 2025 for the Sheboygan Falls Energy Facility was 298 MW.
Travero - Includes a short-line rail freight service in Iowa; a Mississippi River barge, rail and truck freight terminal in Illinois; wind turbine blade recycling services; and a rail-served warehouse in Iowa.
Development-ready Sites - includes various rail-served and ready-to-build manufacturing and industrial sites throughout Iowa and Wisconsin, with access to various airports, interstate freeways and Alliant Energy’s electric services.
ITEM 3. LEGAL PROCEEDINGS
None. SEC regulations require Alliant Energy, IPL and WPL to disclose information about certain proceedings arising under federal, state or local environmental provisions when a governmental authority is a party to the proceedings and such proceedings involve potential monetary sanctions that Alliant Energy, IPL and WPL reasonably believe will exceed a specified threshold. Pursuant to the SEC regulations, Alliant Energy, IPL and WPL use a threshold of $1 million for purposes of determining whether disclosure of any such proceedings is required. Applying this threshold, there are no environmental matters to disclose for this period. Refer to Note 16(c) for discussion of legal and administrative proceedings before various courts and agencies with respect to matters arising in the ordinary course of business.
ITEM 4. MINE SAFETY DISCLOSURES
None.
INFORMATION ABOUT EXECUTIVE OFFICERS
The executive officers of Alliant Energy, IPL and WPL for which information must be included are the same; however, different positions may be held at the various registrants. None of the executive officers for Alliant Energy, IPL or WPL listed below are related to any member of the Board of Directors or nominee for director or any other executive officer. All of the executive officers have no definite terms of office and serve at the pleasure of the Board of Directors. The executive officers of Alliant Energy, IPL and WPL as of the date of this filing are as follows:
| | | | | | | | | | | | | | | | | | | | |
| Name | | Age as of Filing Date | | Registrant | | Positions |
| Lisa M. Barton | | 59 | | Alliant Energy | | Ms. Barton has served as President and Chief Executive Officer (CEO) and as a director since January 2024. She previously served as President and Chief Operating Officer (COO) since February 2023, as Executive Vice President (VP) and COO of American Electric Power Company, Inc. (AEP) from January 2021 to November 2022, and as Executive VP - Utilities of AEP from January 2020 to December 2020. |
| | | | IPL and WPL | | Ms. Barton has served as CEO since February 2023, and as a director since January 2024. |
| Robert J. Durian | | 54 | | Alliant Energy, IPL and WPL | | Mr. Durian has served as Executive VP and Chief Financial Officer (CFO) since February 2020. He previously served as Senior VP and CFO since February 2019. |
| David A. de Leon | | 62 | | Alliant Energy and IPL | | Mr. de Leon has served as Senior VP since January 2019. |
| | | | WPL | | Mr. de Leon has served as President since January 2019. |
| Mayuri N. Farlinger | | 42 | | Alliant Energy and WPL | | Ms. Farlinger has served as Vice President since January 2022. She previously served as Director of Operations from January 2020 to December 2021. |
| | | | IPL | | Ms. Farlinger has served as President since May 2024. |
| Raja Sundararajan | | 49 | | Alliant Energy, IPL and WPL | | Mr. Sundararajan has served as Executive VP since June 2023. He previously served as Executive VP - External Affairs of AEP since July 2022, as Senior VP - Regulatory and Customer Solutions of AEP from July 2021 to July 2022, and as President and COO of AEP Ohio from January 2019 to July 2021. |
| | | | | | | | | | | | | | | | | | | | |
| Name | | Age as of Filing Date | | Registrant | | Positions |
| Benjamin M. Bilitz | | 50 | | Alliant Energy, IPL and WPL | | Mr. Bilitz has served as Chief Accounting Officer and Controller since December 2016. |
| Dylan M. Syse | | 39 | | Alliant Energy, IPL and WPL | | Mr. Syse was selected to become Chief Accounting Officer and Controller effective March 2, 2025. He has served as Assistant Controller since November 2021, as Manager - Accounting and Reporting from May 2020 to November 2021, and as Manager - Accounting from May 2018 to April 2020. |
PART II
ITEM 5. MARKET FOR REGISTRANTS’ COMMON EQUITY, RELATED STOCKHOLDER MATTERS AND ISSUER PURCHASES OF EQUITY SECURITIES
Common Stock Data - Alliant Energy’s common stock trades on the Nasdaq Global Select Market under the symbol “LNT,” and the closing sales price at December 31, 2024 was $59.14.
Shareowners - At December 31, 2024, there were 19,293 holders of record of Alliant Energy’s common stock, including holders through Alliant Energy’s Shareowner Direct Plan. Alliant Energy is the sole common shareowner of all 13,370,788 and 13,236,601 shares of IPL and WPL common stock, respectively, currently outstanding. As a result, there is no established public trading market for the common stock of either IPL or WPL.
Dividends - In October 2024, Alliant Energy announced an increase in its targeted 2025 annual common stock dividend to $2.03 per share, which is equivalent to a quarterly rate of $0.5075 per share, beginning with the February 2025 dividend payment. The timing and amount of future dividends is subject to approval of quarterly dividend declarations from Alliant Energy’s Board of Directors, and is dependent upon earnings expectations, capital requirements, and general financial business conditions, among other factors.
Common Stock Repurchases - A summary of Alliant Energy common stock repurchases for the quarter ended December 31, 2024 was as follows:
| | | | | | | | | | | | | | | | | | | | | | | | | | |
| | Total Number | | Average Price | | Total Number of Shares | | Maximum Number (or Approximate |
| | of Shares | | Paid Per | | Purchased as Part of | | Dollar Value) of Shares That May |
| Period | | Purchased (a) | | Share | | Publicly Announced Plan | | Yet Be Purchased Under the Plan (a) |
| October 1 to October 31 | | 6,487 | | $59.67 | | — | | N/A |
| November 1 to November 30 | | 2,933 | | 62.65 | | — | | N/A |
| December 1 to December 31 | | 19 | | 59.99 | | — | | N/A |
| | 9,439 | | 60.60 | | — | | |
(a)All shares were purchased on the open market and held in a rabbi trust under the DCP. There is no limit on the number of shares of Alliant Energy common stock that may be held under the DCP, which currently does not have an expiration date.
ITEM 6. [RESERVED]
ITEM 7. MANAGEMENT’S DISCUSSION AND ANALYSIS OF FINANCIAL CONDITION AND RESULTS OF OPERATIONS
This MDA includes information relating to Alliant Energy, IPL and WPL, as well as AEF and Corporate Services. Where appropriate, information relating to a specific entity has been segregated and labeled as such. The following discussion and analysis should be read in conjunction with the Financial Statements and Notes included in this report. Unless otherwise noted, all “per share” references in MDA refer to earnings per diluted share. In addition, this MDA includes certain financial information for 2024 compared to 2023. Refer to MDA in the combined 2023 Form 10-K for details on certain financial information for 2023 compared to 2022.
OVERVIEW
Mission, Purpose and Strategy
Alliant Energy’s mission is to deliver affordable energy solutions and exceptional service that its customers and the communities it serves count on - affordably, safely, reliably, and sustainably. This mission aligns with Alliant Energy’s purpose - to serve customers and build stronger communities - which guides it through the ever-changing dynamics of the economy and the energy industry. Alliant Energy takes its responsibility as a corporate citizen seriously and remains a careful steward of the environment and supports the communities in its service territories. Alliant Energy’s mission and purpose are supported by a strategy focused on meeting evolving customer expectations, providing an attractive return for investors, and advancing emerging technologies with safe, secure energy production. This strategy includes the following key elements:
Providing affordable energy solutions for customers - Alliant Energy’s strategy focuses on affordable energy solutions that support retention and growth of its existing customers and attract new customers to its service territories.
Key Highlights -
•Alliant Energy’s resource plan continues to add resources in Iowa and Wisconsin, which is expected to result in continued reliability and affordability for its utility customers. As a result, Alliant Energy directly reinvests in the communities it serves through the addition of skilled jobs, economic development and increased tax revenue. From 2022 through 2024, Alliant Energy completed projects that resulted in approximately 1,500 MW of additional zero-fuel cost solar generation resources in aggregate (WPL completed 1,089 MW of solar generation in Wisconsin in 2022-2024 and IPL completed 400 MW of solar generation in Iowa in 2024), which generate renewable tax credits that are provided to its electric customers.
•Alliant Energy, IPL and WPL have utilized, and expect to continue to utilize, various provisions of the Inflation Reduction Act of 2022 to enhance tax benefits expected from wind, solar and energy storage projects in Iowa and Wisconsin, including transferring certain future tax credits from such projects to other corporate taxpayers. The Inflation Reduction Act of 2022 is expected to result in more cost benefits for IPL’s and WPL’s customers, higher rate base amounts, and improvements in long-term cash flows over the life of the solar, energy storage and wind refurbishment projects. Refer to Note 1(c) for discussion of $216 million and $98 million of proceeds from renewable tax credits transferred to other corporate taxpayers in 2024 and 2023, respectively. •Reductions in Iowa corporate income tax rates resulting from tax reform enacted in 2022 are expected to provide cost benefits to IPL’s electric and gas customers in the future. IPL’s retail electric and gas customers began receiving these benefits with the new base rates effective October 1, 2024.
•IPL maintaining flat base rates for its retail electric and gas customers from 2021 through September 30, 2024, as well as a retail electric base rate moratorium from October 2025 through September 2029 approved by the IUC in IPL’s most recent retail electric rate review.
•Significant fuel cost reductions beginning in 2023 with the completion of various solar facilities.
•Completion of a restructuring and voluntary employee separation program in 2024, which is expected to reduce operation and maintenance expenses in the future.
•Issuance of new long-term debt at historically low interest rates for IPL ($300 million of 3.1% senior debentures due 2051) and WPL ($300 million of 1.95% green bonds due 2031) in 2021 and WPL ($600 million of 3.95% green bonds due 2032) in 2022.
•IPL and WPL have entered into conditional commitments with the U.S. Department of Energy’s Loan Programs Office for loan guarantees of approximately $1.4 billion and $1.6 billion, respectively. If finalized, such loans would provide low interest financing for IPL’s and WPL’s expected construction of renewable generation and energy storage projects.
•In July 2024, the U.S. Department of Energy Office of Clean Energy Demonstrations awarded WPL’s Columbia Energy Storage Project, an approximately 20 MW compressed CO2-based long-duration energy storage system at the Columbia Energy Center site, up to approximately $30 million in grant funding during construction of the project. In addition, in October 2024, the U.S. Department of Energy Office of Grid Deployment selected WPL’s Smart Power Automation for Rural Communities program application to move into the final stage of award negotiations for up to $50 million in grant funding under the Grid Resilience and Innovation Partnerships Program. If finalized, any grant proceeds would reduce the cost of the projects for WPL’s customers.
Making customer-focused investments - Alliant Energy’s strategic priorities include making significant customer-focused investments toward more reliable, resilient, and sustainable customer energy solutions. Alliant Energy’s strategy drives a capital allocation process focused on: 1) transitioning its generation portfolio to meet the growing interest and needs of customers for reliable and sustainable sources of energy, 2) upgrading its electric and gas distribution systems to strengthen safety, reliability and resiliency, as well as enable distributed energy solutions in its service territories, and 3) enhancing its customers’ and employees’ experience with evolving technology and greater flexibility.
•Over the next five years, Alliant Energy currently plans to develop and/or acquire new generation investments to add flexibility with evolving load growth, including approximately 1,200 MW of new wind and solar generation in aggregate, approximately 1,000 MW of energy storage, approximately 750 MW of new natural gas resources, refurbishments at approximately 600 MW of existing wind farms, and improvements at approximately 650 MW of existing natural gas-fired EGUs and the conversion of existing coal-fired EGUs to natural gas. Alliant Energy is currently evaluating the impact of potential additional large load growth customers and MISO’s seasonal resource adequacy requirements on its resource plans and will update these generation investment plans as needed in the future.
•Completion of new solar generation at WPL (1,089 MW in Wisconsin from 2022-2024) and IPL (400 MW in Iowa in 2024), and IPL’s refurbishment of the existing Franklin County wind farm in Iowa in 2024.
•Improving reliability and resiliency with more underground electric distribution, and enabling distributed energy solutions with higher capacity lines. Currently, approximately 28% of Alliant Energy’s electric distribution system is underground.
•Alliant Energy continues to partner with its commercial and industrial customers in Iowa and Wisconsin to help develop renewable solutions to support their sustainability initiatives.
•Installing fiber optic routes between Alliant Energy’s facilities to enhance its communications network to improve resiliency and reliability of, and enable and strengthen, the integrated grid network focused on less densely populated rural areas. Currently, approximately 1,000 miles of underground fiber optic routes have been installed.
Growing customer demand - Alliant Energy’s strategy supports expanding electric and gas usage in its service territories by promoting electrification initiatives and economic development.
Key Highlights -
•The IUC’s order for IPL’s most recent retail electric rate review includes the creation of an individual customer rate tariff, allowing IPL to attract new load growth to its service territory. In addition, Iowa’s Major Economic Growth Attraction program and Wisconsin’s sales and use tax exemption for qualified data centers, encourage economic development in Alliant Energy’s service territory.
•IPL has entered into electric service agreements with two new customers, who currently expect to build data centers at the Big Cedar Industrial Center in Cedar Rapids, Iowa in IPL’s service territory. These agreements include aggregate, maximum demands of approximately 1.9 gigawatts. The electric service agreements are subject to IUC approval under the individual customer rate tariff that was included in the IUC’s September 2024 order for IPL’s retail electric rate review. The actual timing and amount of increases in IPL’s load are subject to various factors, including interconnections and actual customer demand, and any executed or future agreements with customers are not expected to result in immediate increases in load.
•Various development-ready sites, which are rail-served and in close proximity to a variety of transportation options, are located throughout Alliant Energy’s service territories.
RESULTS OF OPERATIONS
Financial Results Overview - The table below includes diluted EPS for Utilities and Corporate Services, ATC Holdings, and Non-utility and Parent, which are non-GAAP financial measures. Alliant Energy believes these non-GAAP financial measures are useful to investors because they facilitate an understanding of performance and trends, and provide additional information about Alliant Energy’s operations on a basis consistent with the measures that management uses to manage its operations and evaluate its performance. Alliant Energy’s net income and EPS attributable to Alliant Energy common shareowners were as follows (dollars in millions, except per share amounts):
| | | | | | | | | | | | | | | | | | | | | | | |
| 2024 | | 2023 |
| Income (Loss) | | EPS | | Income (Loss) | | EPS |
| | | | | | | |
| Utilities and Corporate Services | $722 | | $2.81 | | $724 | | $2.86 |
| ATC Holdings | 40 | | 0.16 | | 35 | | 0.14 |
| Non-utility and Parent | (72) | | (0.28) | | (56) | | (0.22) |
| | | | | | | |
| | | | | | | |
| Alliant Energy Consolidated | $690 | | $2.69 | | $703 | | $2.78 |
Alliant Energy’s Utilities and Corporate Services net income decreased by $2 million in 2024 compared to 2023. The decrease was primarily due to an asset valuation charge for IPL’s Lansing Generating Station as a result of the IUC order for IPL’s retail electric rate review, estimated temperature impacts on retail electric and gas sales, restructuring and voluntary separation charges, an ARO charge allocated to the steam business at IPL due to the revised CCR Rule, higher depreciation and financing expenses, and lower AFUDC. These items were partially offset by higher revenue requirements from capital investments.
Alliant Energy’s Non-utility and Parent net income decreased by $16 million in 2024 compared to 2023, primarily due to higher financing expense.
Net Income Variances - The following items contributed to increased (decreased) net income for 2024 compared to 2023 (in millions):
| | | | | | | | | | | | | | | | | |
| Alliant Energy | | IPL | | WPL |
| Revenues: | | | | | |
| $27 | | ($14) | | $41 |
| (75) | | (50) | | (25) |
| Changes in other utility | 2 | | — | | 2 |
| | | | | |
| Changes in total revenues | (46) | | (64) | | 18 |
| Operating expenses: | | | | | |
Changes in electric production fuel and purchased power (Refer to details below) | 108 | | 13 | | 96 |
Changes in electric transmission service (Refer to details below) | (30) | | 3 | | (33) |
| 75 | | 43 | | 33 |
Asset valuation charge for IPL’s Lansing Generating Station in 2024 (Refer to Note 2 for details) | (60) | | (60) | | — |
Changes in other operation and maintenance (Refer to details below) | (1) | | (5) | | (8) |
| Changes in depreciation and amortization (Higher primarily due to solar generation placed in service in 2024 and 2023, as well as WPL’s amortization of liquidated damages related to West Riverside procurement contracts, which resulted in reductions to depreciation and amortization expenses in 2023, and updated electric depreciation rates for IPL effective October 1, 2024) | (96) | | (16) | | (77) |
| Changes in taxes other than income taxes | (7) | | (3) | | (4) |
| Changes in total operating expenses | (11) | | (25) | | 7 |
| Changes in operating income | (57) | | (89) | | 25 |
| Other income and deductions: | | | | | |
| Changes in interest expense (Higher primarily due to financings completed in 2024 and 2023) | (55) | | (22) | | (16) |
| | | | | |
| Changes in AFUDC (Primarily due to changes in levels of CWIP balances related to solar generation and energy storage, and IPL’s refurbishment of the existing Franklin County wind farm) | (25) | | 22 | | (47) |
| Changes in Other | 6 | | 14 | | (11) |
| Changes in total other income and deductions | (74) | | 14 | | (74) |
| Changes in income before income taxes | (131) | | (75) | | (49) |
Changes in income taxes (Refer to Note 11 for details) | 118 | | 71 | | 49 |
| | | | | |
| | | | | |
| Changes in net income | ($13) | | ($4) | | $— |
| | | | | |
| | | | | |
| | | | | |
| | | | | |
| | | | | |
| | | | | |
| | | | | |
| | | | | |
| | | | | |
Electric and Gas Revenues and Sales Summary - Electric and gas revenues (in millions), and MWh and Dth sales (in thousands), were as follows:
| | | | | | | | | | | | | | | | | | | | | | | | | | | | | | | | | | | | | | | | | | | | | | | | | | | |
| Electric | | | | Gas |
| Revenues | | | | MWhs Sold | | | | Revenues | | Dths Sold |
| 2024 | | 2023 | | | | 2024 | | 2023 | | | | 2024 | | 2023 | | 2024 | | 2023 |
| Alliant Energy | | | | | | | | | | | | | | | | | | | |
| Retail | $3,009 | | | $3,008 | | | | | 24,569 | | | 24,940 | | | | | $419 | | | $495 | | | 43,489 | | | 46,405 | |
| Sales for resale: | | | | | | | | | | | | | | | | | | | |
| Wholesale | 200 | | | 213 | | | | | 2,783 | | | 2,859 | | | | | N/A | | N/A | | N/A | | N/A |
| Bulk power and other | 86 | | | 71 | | | | | 5,620 | | | 4,730 | | | | | N/A | | N/A | | N/A | | N/A |
| Transportation/Other | 77 | | | 53 | | | | | 57 | | | 58 | | | | | 46 | | | 45 | | | 123,386 | | | 115,177 | |
| $3,372 | | | $3,345 | | | | | 33,029 | | | 32,587 | | | | | $465 | | | $540 | | | 166,875 | | | 161,582 | |
| IPL | | | | | | | | | | | | | | | | | | | |
| Retail | $1,662 | | | $1,661 | | | | | 13,620 | | | 13,909 | | | | | $223 | | | $273 | | | 21,640 | | | 23,128 | |
| Sales for resale: | | | | | | | | | | | | | | | | | | | |
| Wholesale | 61 | | | 62 | | | | | 750 | | | 766 | | | | | N/A | | N/A | | N/A | | N/A |
| Bulk power and other | (6) | | | 11 | | | | | 1,138 | | | 1,465 | | | | | N/A | | N/A | | N/A | | N/A |
| Transportation/Other | 30 | | | 27 | | | | | 32 | | | 32 | | | | | 27 | | | 27 | | | 43,075 | | | 43,232 | |
| $1,747 | | | $1,761 | | | | | 15,540 | | | 16,172 | | | | | $250 | | | $300 | | | 64,715 | | | 66,360 | |
| WPL | | | | | | | | | | | | | | | | | | | |
| Retail | $1,347 | | | $1,347 | | | | | 10,949 | | | 11,031 | | | | | $196 | | | $222 | | | 21,849 | | | 23,277 | |
| Sales for resale: | | | | | | | | | | | | | | | | | | | |
| Wholesale | 139 | | | 151 | | | | | 2,033 | | | 2,093 | | | | | N/A | | N/A | | N/A | | N/A |
| Bulk power and other | 92 | | | 60 | | | | | 4,482 | | | 3,265 | | | | | N/A | | N/A | | N/A | | N/A |
| Transportation/Other | 47 | | | 26 | | | | | 25 | | | 26 | | | | | 19 | | | 18 | | | 80,311 | | | 71,945 | |
| $1,625 | | | $1,584 | | | | | 17,489 | | | 16,415 | | | | | $215 | | | $240 | | | 102,160 | | | 95,222 | |
Sales Trends and Temperatures - Alliant Energy’s retail electric sales volumes decreased 1% in 2024 compared to 2023, primarily due to changes in sales volumes at IPL’s industrial customers due to standby service customers that can use other generation, and changes in temperatures. Alliant Energy’s retail gas sales volumes decreased 6% in 2024 compared to 2023, primarily due to changes in temperatures.
Estimated decreases to operating income from the impacts of temperatures were as follows (in millions):
| | | | | | | | | | | | | | | | | | | | | | | | | | | | | | | | | | | | | | | | | |
| Electric | | | Gas | |
| 2024 | | 2023 | | Change | | | | | 2024 | | 2023 | | Change | | | |
| IPL | ($14) | | ($1) | | ($13) | | | | | ($12) | | ($8) | | ($4) | | | |
| WPL | (15) | | (5) | | (10) | | | | | (10) | | (6) | | (4) | | | |
| Total Alliant Energy | ($29) | | ($6) | | ($23) | | | | | ($22) | | ($14) | | ($8) | | | |
Electric Sales for Resale - Bulk Power and Other - Bulk power and other volume changes were due to changes in sales in the wholesale energy markets operated by MISO. These changes are impacted by several factors, including the availability and dispatch of Alliant Energy’s EGUs and electricity demand within these wholesale energy markets. Changes in bulk power and other revenues were largely offset by changes in fuel-related costs, and therefore did not have a significant impact on operating income.
Gas Transportation/Other - Gas transportation/other sales volume changes were largely due to changes in the gas volumes supplied to Alliant Energy’s natural gas-fired EGUs caused by the availability and dispatch of such EGUs.
Electric Utility Revenue Variances - The following items contributed to increased (decreased) electric utility revenues for 2024 compared to 2023 (in millions):
| | | | | | | | | | | | | | | | | |
| Alliant Energy | | IPL | | WPL |
| Higher revenue requirements (a)(b) | $240 | | $85 | | $155 |
| Higher (lower) sales for resale bulk power and other revenues (c) | 15 | | (17) | | 32 |
Deferral of incremental solar generation construction costs at WPL in 2024 (Refer to Note 3) | 12 | | — | | 12 |
| (142) | | (42) | | (100) |
Changes in WPL refunds/collections of previous over-/under-collection of retail electric fuel-related costs (offset in electric production fuel and purchased power expenses) (Refer to Note 2) | (33) | | — | | (33) |
| Estimated changes in sales volumes caused by temperatures | (23) | | (13) | | (10) |
| Lower revenues at IPL due to credits on customers’ bills through the tax benefit rider in 2024 (partially offset by changes in income taxes) (a) | (16) | | (16) | | — |
| Lower wholesale revenues at WPL primarily due to lower fuel-related costs and lower sales | (13) | | (1) | | (12) |
| | | | | |
Lower revenues at IPL related to changes in recovery amounts for energy efficiency costs through the energy efficiency rider (mostly offset by changes in energy efficiency expense) (Refer to Note 1(g)) | (13) | | (13) | | — |
| Changes in WPL electric fuel-related costs, net of recoveries (d) | (10) | | — | | (10) |
| Other | 10 | | 3 | | 7 |
| $27 | | ($14) | | $41 |
(a)In September 2024, the IUC issued an order authorizing an annual base rate increase of $185 million for IPL’s retail electric customers, with customers receiving partially offsetting credits for the first 12 months through a tax benefit rider, for the October 2024 through September 2025 forward-looking Test Period. Rate changes were effective October 1, 2024, which reflect revenue requirement impacts of increasing electric rate base including investments in solar generation, updated depreciation rates, and certain incremental costs incurred resulting from the 2020 derecho windstorm. In addition, effective October 1, 2024, IPL’s renewable energy rider was discontinued, and certain production tax credits are credited to IPL’s retail electric customers through IPL’s fuel-related cost recovery mechanism. Credits on IPL’s customers’ bills are expected to be offset by a reduction in income tax expense.
(b)In December 2023, the PSCW issued an order authorizing an annual base rate increase of $49 million for WPL’s retail electric customers, covering the 2024 forward-looking Test Period, which reflects revenue requirement impacts of increasing electric rate base and lower forecasted fuel-related expenses.
(c)Alliant Energy’s and WPL’s sales for resale bulk power and other revenues increased primarily due to higher volumes and higher prices for electricity sold by WPL to MISO wholesale energy markets. Alliant Energy’s increase was partially offset by decreased sales for resale bulk power and other revenues at IPL primarily due to lower prices for electricity and capacity sold by IPL to MISO wholesale energy markets. These changes were largely offset by changes in fuel-related costs.
(d)WPL’s cost recovery mechanism for retail fuel-related expenses supports deferrals of amounts that fall outside an approved fuel monitoring range of forecasted fuel-related expenses determined by the PSCW each year. The difference between revenue collected and actual fuel-related expenses incurred within the fuel monitoring range increases or decreases Alliant Energy’s and WPL’s electric utility revenues. WPL estimates the increase (decrease) to electric utility revenues from amounts within the fuel monitoring range were approximately ($4) million and $6 million in 2024 and 2023, respectively.
Gas Utility Revenue Variances - The following items contributed to increased (decreased) gas utility revenues for 2024 compared to 2023 (in millions):
| | | | | | | | | | | | | | | | | |
| Alliant Energy | | IPL | | WPL |
| ($75) | | ($42) | | ($33) |
| Estimated changes in sales volumes caused by temperatures | (8) | | (4) | | (4) |
Lower revenues at IPL related to changes in recovery amounts for energy efficiency costs through the energy efficiency rider (mostly offset by changes in energy efficiency expense) (Refer to Note 1(g)) | (6) | | (6) | | — |
| Higher revenue requirements (a) (b) | 14 | | 2 | | 12 |
| | | | | |
| ($75) | | ($50) | | ($25) |
(a)In September 2024, the IUC issued an order authorizing an annual base rate increase of $10 million for IPL’s retail gas customers, for the October 2024 through September 2025 forward-looking Test Period. Rate changes were effective October 1, 2024, which reflect revenue requirement impacts of increasing gas rate base.
(b)In December 2023, the PSCW issued an order authorizing an annual base rate increase of $13 million for WPL’s retail gas customers, covering the 2024 forward-looking Test Period, which reflects revenue requirement impacts of increasing gas rate base.
Electric Production Fuel and Purchased Power Expenses Variances - The following items contributed to (increased) decreased electric production fuel and purchased power expenses for 2024 compared to 2023 (in millions):
| | | | | | | | | | | | | | | | | |
| Alliant Energy | | IPL | | WPL |
| Lower electric production fuel costs (a) | $108 | | $72 | | $36 |
Changes in WPL refunds/collections of previous over-/under-collection of retail electric fuel-related costs (offset in electric utility revenue) (Refer to Note 2) | 33 | | — | | 33 |
Changes in regulatory recovery of retail electric fuel-related costs (Refer to Note 1(g)) | 21 | | (21) | | 42 |
| Higher purchased power expense (b) | (49) | | (38) | | (11) |
| Other | (5) | | — | | (4) |
| $108 | | $13 | | $96 |
(a)Electric production fuel costs decreased at IPL primarily due to lower natural gas prices in 2024 compared to 2023, and lower natural gas and coal volumes due to lower dispatch of IPL’s EGUs in 2024. Electric production fuel costs decreased at WPL primarily due to lower natural gas prices in 2024 compared to 2023, and higher dispatch of WPL’s renewable EGUs in 2024, partially offset by higher coal volumes due to higher dispatch of WPL’s coal-fired EGU’s in 2024.
(b)Purchased power expense increased primarily due to higher prices for electricity purchased by IPL and WPL, and higher volumes of electricity purchased at IPL due to lower dispatch of IPL’s EGUs in 2024, partially offset by lower volumes of electricity purchased at WPL due to higher dispatch of WPL’s EGUs in 2024.
Electric Transmission Service Expense Variances - The following items contributed to (increased) decreased electric transmission service expense for 2024 compared to 2023 (in millions):
| | | | | | | | | | | | | | | | | |
| Alliant Energy | | IPL | | WPL |
| | | | | |
Changes in regulatory recovery for the difference between actual electric transmission service costs and those costs used to determine rates (Refer to Note 1(g)) | ($28) | | ($7) | | ($21) |
| | | | | |
| Other (primarily due to changes in transmission service costs provided by third parties) | (2) | | 10 | | (12) |
| ($30) | | $3 | | ($33) |
Cost of Gas Sold Expense Variances - The following items contributed to (increased) decreased cost of gas sold expense for 2024 compared to 2023 (in millions):
| | | | | | | | | | | | | | | | | |
| Alliant Energy | | IPL | | WPL |
| Lower natural gas prices and lower retail gas volumes | $105 | | $66 | | $39 |
Changes in the regulatory recovery of gas costs (Refer to Note 1(g)) | (30) | | (24) | | (6) |
| | | | | |
| Other | — | | 1 | | — |
| $75 | | $43 | | $33 |
Other Operation and Maintenance Expenses Variances - The following items contributed to (increased) decreased other operation and maintenance expenses for 2024 compared to 2023 (in millions):
| | | | | | | | | | | | | | | | | |
| Alliant Energy | | IPL | | WPL |
| | | | | |
| | | | | |
| | | | | |
Restructuring and voluntary employee separation charges in 2024 (excluding payroll taxes) (Refer to Note 12(a)) | ($27) | | ($13) | | ($12) |
ARO charge for steam assets at IPL in 2024 (Refer to Note 13) | (20) | | (20) | | — |
| Lower energy efficiency expense at IPL (mostly offset by lower revenues) | 20 | | 20 | | — |
| Lower generation and energy delivery expenses | 11 | | 3 | | 8 |
| Other | 15 | | 5 | | (4) |
| ($1) | | ($5) | | ($8) |
Other Future Considerations - In addition to items discussed in this report, the following key items could impact Alliant Energy’s, IPL’s and WPL’s future financial condition or results of operations:
•Financing Plans - Alliant Energy currently expects to issue up to $25 million of common stock in 2025 through its Shareowner Direct Plan. In 2025, IPL currently expects to issue up to $600 million of long-term debt, and AEF and/or Alliant Energy at the parent company level expect to issue up to $600 million of long-term debt in aggregate. IPL and AEF each have $300 million of long-term debt maturing in 2025.
•Common Stock Dividends - Alliant Energy announced a 6% increase in its targeted 2025 annual common stock dividend to $2.03 per share, which is equivalent to a quarterly rate of $0.5075 per share, beginning with the February 2025 dividend payment. The timing and amount of future dividends is subject to approval of quarterly dividend declarations from Alliant Energy’s Board of Directors, and is dependent upon earnings expectations, capital requirements, and general financial business conditions, among other factors.
•Cash Flows From Operating Activities - Alliant Energy, IPL and WPL currently expect an increase in future cash flows from operating activities resulting from the transfer of future renewable tax credits to other corporate taxpayers pursuant to the Inflation Reduction Act of 2022. In addition, Alliant Energy, IPL and WPL currently expect an increase in future cash flows from operating activities resulting from higher earnings on increasing rate base at IPL and WPL.
•Higher Earnings on Increasing Rate Base - Alliant Energy, IPL and WPL currently expect increases in electric utility and gas utility revenues in 2025 compared to 2024 due to impacts from increasing revenue requirements related to investments in the utility business. In addition, Alliant Energy, IPL and WPL currently expect a decrease in the effective income tax rate in 2025 compared to 2024 due to additional tax credits from renewable generation and energy storage projects placed in service in 2024 and/or expected to be placed in service in 2025. A majority of the differences between actual renewable tax credits and renewable tax credits used to determine rates are recorded in regulatory assets or regulatory liabilities on the balance sheets until they are reflected in future billings to customers. Investment tax credits resulting from IPL energy storage projects expected to be placed in service in 2025 may be utilized to offset any revenue deficiency on an annual basis up to the earnings sharing mechanism threshold included in IPL’s retail electric rate review settlement agreement discussed in “Rate Matters.” •Sales Trends and Temperatures - In July 2025, IPL’s wholesale power agreement with Southern Minnesota Energy Cooperative (SMEC) will expire (sales to SMEC represented approximately 5% of IPL’s total electric sales in 2024), which is not expected to have a material impact on Alliant Energy’s or IPL’s future financial condition and results of operations. In 2024, warmer than normal temperatures in the winter and cooler than normal temperatures in the summer in Alliant Energy’s, IPL’s and WPL’s service territories resulted in lower retail electric and gas sales volumes and operating income.
•Other Operation and Maintenance Expenses - Alliant Energy, IPL and WPL currently expect a decrease in other operation and maintenance expenses in 2025 compared to 2024 largely due to the asset valuation charge for IPL’s Lansing Generating Station and ARO charge for steam assets at IPL recorded in 2024, charges for restructuring and voluntary employee separation recorded in 2024, as well as expected future cost savings related to Alliant Energy’s restructuring activities. These items are expected to be partially offset by higher generation maintenance and energy delivery expenses.
•Depreciation and Amortization Expense - Alliant Energy, IPL and WPL currently expect an increase in depreciation and amortization expense in 2025 compared to 2024 due to capital projects placed in service in 2024 and 2025, and updated electric depreciation rates for IPL effective October 1, 2024.
•Interest Expense - Alliant Energy, IPL and WPL currently expect an increase in interest expense in 2025 compared to 2024 due to financings completed in 2024 and planned in 2025 as discussed above.
CUSTOMER INVESTMENTS
Alliant Energy’s, IPL’s and WPL’s strategic priorities include making significant customer-focused investments toward reliable, resilient and sustainable customer energy solutions. These priorities include:
Resource Planning
Alliant Energy’s current resource plan continues to add resources in Iowa and Wisconsin, and serves as a guide to meet customer demand for affordable, safe, reliable and sustainable energy. Over the next five years, Alliant Energy currently plans to develop and/or acquire new generation investments to add flexibility with evolving load growth, including approximately 1,200 MW of new wind and solar generation in aggregate, approximately 1,000 MW of energy storage, approximately 750 MW of new natural gas resources, refurbishments at approximately 600 MW of existing wind farms, and improvements at approximately 650 MW of existing natural gas-fired EGUs and the conversion of existing coal-fired EGUs to natural gas. Alliant Energy is currently evaluating the impact of potential additional large load growth customers and MISO’s seasonal resource adequacy requirements on its resource plans and will update these generation investment plans as needed in the future. Estimated capital expenditures for these planned projects for 2025 through 2028 are included in the “Generation” section in the construction and acquisition table in “Liquidity and Capital Resources.” Information on IPL’s and WPL’s regulatory filings and/or approvals for future generation and energy storage projects, as well as recently completed projects, are as follows:
WPL’s Generation and Energy Storage Projects -
Solar - In 2022 through 2024, WPL completed 1,089 MW of new solar generation projects in Wisconsin, including the Grant County facility (200 MW) in 2024. Refer to Note 3 for discussion of the construction costs associated with these projects.
Energy Storage - In 2023, the PSCW issued orders authorizing WPL to construct, own and operate energy storage at the Grant County (100 MW) and Wood County (75 MW) solar projects in Wisconsin, which is currently expected to be placed in service in the second half of 2025, and at the Edgewater Generation Station in Wisconsin (approximately 99 MW), which is currently expected to be placed in service in 2026.
In July 2024, the U.S. Department of Energy Office of Clean Energy Demonstrations awarded WPL’s Columbia Energy Storage Project, an approximately 20 MW compressed CO2-based long-duration energy storage system at the Columbia
Energy Center site, up to approximately $30 million in grant funding during construction of the project. In August 2024, WPL filed a CA application with the PSCW for construction approval of the energy storage system. A decision from the PSCW is currently expected in the second quarter of 2025. If finalized, any grant proceeds would reduce the cost of the project for WPL’s customers.
Existing Natural Gas-Fired Electric Generating Unit Improvements - In April 2024, the PSCW issued orders authorizing WPL to construct improvements at the existing natural gas-fired Neenah Energy Facility and Sheboygan Falls Energy Facility, which would increase the capacity and efficiency of the EGUs.
Existing Wind Farm Refurbishment - In July 2024, WPL filed a CA application with the PSCW for approval to refurbish the Bent Tree wind farm, which would be eligible for production tax credits under the Inflation Reduction Act of 2022. A decision from the PSCW is currently expected in the first quarter of 2025.
IPL’s Generation and Energy Storage Projects -
Solar - In 2024, IPL completed new solar generation projects in Iowa, including the Wever facility (150 MW), the Creston facility (50 MW), and the first (50 MW) and second (150 MW) phases of the Pleasant Creek facility. Refer to Note 3 for discussion of the construction costs associated with these projects.
Energy Storage - IPL received approval from the IUC to construct, own and operate up to approximately 140 MW of energy storage in Iowa (100 MW at the Wever project and 40 MW at the Creston project), which is currently expected to be placed in service in 2025 and 2026.
Natural Gas-fired Electric Generating Unit - In February 2025, IPL filed request with the IUC for approval to construct, own and operate the Cedar River Generating Station, a 94 MW natural gas-fired EGU using Reciprocating Internal Combustion Engine (RICE) technology, at the site of IPL’s Prairie Creek Generation Station. A decision from the IUC is currently expected in the fourth quarter of 2025.
Existing Wind Farm Refurbishment - In 2024, IPL completed the refurbishment of the existing Franklin County wind farm in Iowa. IPL currently expects the refurbishment of the existing Whispering Willow - East wind farm to be completed in 2026. These projects are eligible for production tax credits under the Inflation Reduction Act of 2022.
WPL’s West Riverside Natural Gas-fired Generating Station - In 2020, WPL completed the construction of West Riverside, a 723 MW natural gas-fired combined-cycle EGU in Beloit, Wisconsin. WPL entered into agreements with neighboring utilities and electric cooperatives that provide each of them options to purchase a partial ownership interest in West Riverside. The purchase price for such options is based on the ownership interest acquired and the net book value of West Riverside on the date of the purchase. The timing and ownership amount of the options are as follows:
| | | | | | | | |
| Counterparty | | Option Amount and Timing |
| WEC Energy Group, Inc. (WEC) | | In 2023 and 2024, WEC acquired 200 MW in aggregate, pursuant to PSCW and FERC approval (a) |
| Madison Gas and Electric Company (MGE) | | In 2023 and 2024, MGE acquired 50 MW in aggregate, pursuant to PSCW and FERC approval |
| Electric cooperatives | | Approximately 60 MW were acquired in 2018 |
(a)WPL may exercise reciprocal options, subject to approval by the PSCW, to purchase up to 200 MW of any natural-gas combined-cycle EGU that WEC places in service prior to May 2030.
Plant Retirements and Fuel Switching - The current strategy includes the retirement, or fuel switch from coal to natural gas, of various EGUs in the next several years. IPL currently expects to retire Prairie Creek Unit 1 and fuel switch Prairie Creek Unit 3 (65 MW in aggregate) by December 31, 2025. WPL currently expects to convert the coal-fired Edgewater Unit 5 (414 MW) to natural gas in 2028. In addition, WPL currently plans to cease coal operations at Columbia Units 1 and 2 (595 MW in aggregate) by the end of 2029, as well as evaluate the conversion of Columbia Unit 1 and/or Unit 2 to natural gas. Alliant Energy, IPL and WPL are working with MISO, state regulatory commissions and other regulatory agencies, as required, to determine the timing of these actions, which are subject to change depending on operational, regulatory, market and other factors. Refer to Note 3 for additional details on Columbia Units 1 and 2, and Edgewater Unit 5.
Environmental Stewardship - Alliant Energy’s environmental stewardship is focused on the implementation of a responsible energy strategy to meet its customers’ energy needs affordably, safely, reliably and sustainably. Alliant Energy periodically reviews and updates this strategy to reflect changes needed to support the transition to a low-carbon economy. Alliant Energy’s current voluntary environmental-related goals and achievements include the following:
•Exceeded its 2020 targets by reducing air emissions for sulfur dioxide by over 90%, nitrogen oxides by over 80% and mercury by over 90% from 2005 levels.
•By 2030, reduce GHG emissions from its utility operations by 50% from 2005 levels, reduce its electric utility water supply by 75% from 2005 levels and electrify 100% of its owned light-duty fleet vehicles.
•By 2040, eliminate all coal-fired EGUs from its generating fleet.
•By 2050, aspire to achieve net-zero GHG emissions from its utility operations.
Alliant Energy’s aspirational GHG goal includes EPA reportable emissions based on applicable regulatory compliance requirements for CO2, methane and nitrous oxide from its owned fossil-fueled EGUs and distribution of natural gas. In addition, Alliant Energy’s environmental stewardship efforts include a goal to partner to plant more than 1 million trees by the end of 2030. Future updates to sustainable energy plans and attaining these goals will depend on future economic developments, evolving energy technologies and emerging trends in Alliant Energy’s service territories.
Other Customer-focused Investments
Electric and Gas Distribution Systems - Customer-focused investments include replacing, modernizing and upgrading infrastructure in the electric and gas distribution systems. Electric system investments will focus on areas such as improving reliability and resiliency with more underground electric distribution and enabling distributed energy solutions with higher capacity lines. Gas system investments will focus on pipeline replacement to ensure safety and pipeline expansion to support reliability and economic development. Estimated capital expenditures for expected and current electric and gas distribution infrastructure projects for 2025 through 2028 are included in the “Electric and gas distribution systems” lines in the construction and acquisition expenditures table in “Liquidity and Capital Resources.”
Grid Resilience and Innovation Partnerships Program for WPL - In October 2024, the U.S. Department of Energy Office of Grid Deployment selected WPL’s Smart Power Automation for Rural Communities program application to move into the final stage of award negotiations for up to $50 million in grant funding under the Grid Resilience and Innovation Partnerships Program. WPL currently expects to submit project plans to the PSCW in 2025 when award negotiations are nearing completion. If finalized, any grant proceeds would reduce the cost of the project for WPL’s customers.
Fiber Optic Telecommunication Network - Alliant Energy is currently installing fiber optic routes between its facilities to enhance its communications network to improve resiliency and reliability of, and enable and strengthen, the integrated grid network focused on less densely populated rural areas.
Gas Pipeline Expansion - IPL and WPL currently expect to make investments to extend various gas distribution systems to provide natural gas to unserved or underserved areas in their service territories.
Gas Pipeline Safety - The Pipeline and Hazardous Materials Safety Administration published various final rules from 2019 through 2024 that updated safety requirements for gas transmission pipelines, and updated procedures were implemented to address these rules. Plans to address certain requirements for specific pipelines were developed and implemented, with identified remediation efforts to be completed by July 2035. In response to these rule changes, Alliant Energy, IPL and WPL have been assessing, testing and modifying certain of IPL’s and WPL’s pipelines, and updating practices for assessment and operation of all IPL and WPL pipelines. Alliant Energy, IPL, and WPL also continue to evaluate the impact of these final rules and resulting remediation plans on their financial condition and results of operations.
Technology - Alliant Energy, IPL and WPL currently plan to make investments in technology to enhance productivity and efficiency through automation, customer self-service and telework. Estimated capital expenditures for expected and current technology projects for 2025 through 2028 are included in the “Other” line in the construction and acquisition expenditures table in “Liquidity and Capital Resources.”
Non-utility business - Alliant Energy continues to explore growth of its Travero businesses and other limited scope opportunities outside of, but complementary to, Alliant Energy’s core utility business. This non-utility strategy continues to evolve through exploration of modest strategic opportunities that are accretive to earnings and cash flows.
RATE MATTERS
Rate Reviews
Retail Base Rate Filings - Base rate changes reflect both returns on additions to infrastructure and recovery of changes in costs incurred or expected to be incurred to provide electric and gas service to retail customers. Given that a portion of the rate changes will offset changes in costs, revenues from rate changes should not be expected to result in an equal change in net income for either IPL or WPL.
IPL’s Retail Electric and Gas Rate Reviews (October 2024 Through September 2025 Forward-looking Test Period) - In September 2024, the IUC issued an order for IPL’s retail electric and gas rate reviews for the October 2024 through September 2025 forward-looking Test Period with rate changes effective October 1, 2024. Key drivers for the rate review included revenue requirement impacts of increasing electric and gas rate base, including investments in solar generation, as well as updated depreciation rates and certain incremental costs incurred resulting from the 2020 derecho windstorm. The IUC’s order included the following provisions:
•Annual retail electric base rate increase of $185 million, with customers receiving partially offsetting credits for the first 12 months through a tax benefit rider, and a subsequent retail electric base rate moratorium through September 2029;
•During the moratorium, IPL may request updated rates if its actual return on common equity is 100 or more basis points below the authorized return on common equity for a single calendar year or 50 or more basis points below the authorized return on common equity for two consecutive years, and/or if a material change in laws or regulations causes the moratorium to become unsustainable;
•Annual retail gas base rate increase of $10 million;
•Electric earnings sharing mechanism beginning in calendar year 2025, where IPL would apply excess earnings to the remaining net book value of IPL’s highest earning asset with advance ratemaking principles (currently the Emery Generation Station) based on its authorized return on common equity as follows;
| | | | | | | | |
| Threshold Above Authorized | | |
| Return on Common Equity | | Sharing |
| First 50 basis points | | 75% customers, 25% IPL |
| >50 to 100 basis points | | 50% customers, 50% IPL |
| >100 to 150 basis points | | 25% customers, 75% IPL |
| >150 basis points | | 100% customers |
•Investment tax credits resulting from renewable generation and energy storage projects may be utilized to offset any revenue deficiency on an annual basis up to IPL’s return on common equity threshold; any remaining investment tax credits, net of the cost of transferability, that are not used to offset any revenue deficiency, will be deferred by IPL and carried forward to offset any revenue deficiency in future years;
•Creation of an individual customer rate tariff, which would allow IPL to attract new load growth to its service territory;
•Electric distribution system investment cap not to exceed $900 million in aggregate or $325 million in any given year from 2026 through 2029, with certain exceptions;
•IPL to retain renewable production tax credits from new generation resources not included in base rates and the repowering of existing wind farms, including the Franklin County wind farm refurbishment, as well as retain energy margins for new generation resources and energy storage;
•Discontinuation of the renewable energy rider; and
•A return of the remaining net book value of the Lansing Generating Station; however, the IUC’s order does not include a return on the remaining net book value of Lansing, resulting in Alliant Energy and IPL recording a pre-tax non-cash charge of $60 million to “Asset valuation charge for IPL’s Lansing Generating Station” in their income statements in 2024.
WPL’s Retail Electric and Gas Rate Reviews (2024/2025 Forward-looking Test Period) - In December 2023, the PSCW issued an order authorizing annual base rate increases of $49 million and $13 million for WPL’s retail electric and gas customers, respectively, effective January 1, 2024, for the 2024 forward-looking Test Period. The PSCW’s order also authorized WPL to implement an additional $60 million increase in annual rates for its retail electric customers, effective January 1, 2025, for the 2025 forward-looking Test Period. The key drivers for the annual base rate increases include revenue requirement impacts of increasing electric and gas rate base, including investments in solar generation and energy storage. The order extends, with certain modifications, an earnings sharing mechanism through 2025. Under the earnings sharing mechanism, WPL will defer a portion of its earnings if its annual regulatory return on common equity exceeds 9.95% during the 2024/2025 Test Period. WPL must defer 50% of its excess earnings between 9.95% and 10.55%, and 100% of any excess earnings above 10.55%. The PSCW also authorized WPL to defer the incremental under-/over-collection of solar and energy storage renewable tax credits that are different than the approved amounts. Refer to Note 3 for discussion of the PSCW’s 2024 orders related to the deferral of, and deferral of a return on, incremental solar generation construction costs in 2024 and 2025.
WPL’s Retail Fuel-related Rate Filing (2023 Forward-looking Test Period) - In August 2024, the PSCW issued an order authorizing WPL to refund $34 million, plus interest, to its retail electric customers in 2024 for fuel-related costs incurred by WPL in 2023 that were lower than fuel-related costs used to determine rates for such period.
Rate Review Details - Details related to IPL’s and WPL’s key jurisdictions were as follows:
| | | | | | | | | | | | | | | | | | | | | | | | | | | | | |
| | | Average | | Authorized Return | | Common Equity | | |
| Regulatory | | Rate Base | | on Common | | Component of Regulatory | | Effective |
| Body | | (in millions) | | Equity (a) | | Capital Structure | | Date |
| IPL Retail Electric (October 2024-September 2025 Test Period) (b) | | | | | | | | | |
| Marshalltown | IUC | | $484 | | 11.00% | | 51.0% | | 10/1/2024 |
| Emery | IUC | | 90 | | 12.23% | | 51.0% | | 10/1/2024 |
| Whispering Willow - East | IUC | | 124 | | 11.70% | | 51.0% | | 10/1/2024 |
| Wind | IUC | | 1,218 | | 11.00% | | 51.0% | | 10/1/2024 |
| Solar | IUC | | 511 | | 10.25% | | 51.0% | | 10/1/2024 |
| Other (c) | IUC | | 4,852 | | 9.34% | | 51.0% | | 10/1/2024 |
| IPL Retail Gas (October 2024-September 2025 Test Period) (b) | IUC | | 630 | | 9.65% | | 51.0% | | 10/1/2024 |
| IPL Wholesale Electric | FERC | | 170 | | 10.97% | | 50.0% | | 1/1/2024 |
| WPL Retail Electric and Gas | | | | | | | | | |
| Electric (2025 Test Period) (d) | PSCW | | 5,774 | | 9.80% | | 53.7% | | 1/1/2025 |
| Gas (2025 Test Period) (d) | PSCW | | 532 | | 9.80% | | 53.7% | | 1/1/2025 |
| WPL Wholesale Electric | FERC | | 510 | | 10.90% | | 55.0% | | 1/1/2024 |
(a)Authorized returns on common equity may not be indicative of actual returns earned or projections of future returns.
(b)Average rate base amounts reflect IPL’s allocated retail share of rate base and do not include CWIP and were calculated using a forecasted 13-month average for the test period.
(c)Average rate base amounts include assets that do not have advance rate-making principles (9.65% return on common equity), production tax credits carryforwards for 1,000 MW of wind generating facilities placed in service in 2019 and 2020 (5% return on common equity), as well as the portion of Whispering Willow - East that does not earn a return on investment.
(d)Average rate base amounts reflect WPL’s allocated retail share of rate base and do not include CWIP or a cash working capital allowance, and were calculated using a forecasted 13-month average for the test period. The PSCW provides a return on selected CWIP and a cash working capital allowance by adjusting the percentage return on rate base.
Planned Rate Review - WPL currently expects to file a retail electric and gas rate review with the PSCW by the end of the second quarter of 2025 for the 2026/2027 forward-looking Test Period. The key drivers for the anticipated filing include revenue requirement impacts of increasing electric and gas rate base. Any rate changes granted from this pending request are expected to be effective on January 1, 2026, with a decision from the PSCW expected by the end of 2025.
LEGISLATIVE MATTERS
In May 2024, the Major Economic Growth Attraction program was enacted in Iowa, which offers various tax incentives for up to two qualified businesses for certain large-scale projects with capital investments greater than $1 billion constructed on certified sites greater than 250 acres in Iowa. The most significant provision of this program for Alliant Energy encourages economic development in IPL’s service territory. Alliant Energy has various development-ready sites throughout Iowa, including the Big Cedar Industrial Center Mega-site in Cedar Rapids, Iowa, and the Prairie View Industrial Center Super Park in Ames, Iowa.
In May 2024, legislation was enacted in Iowa related to the advance rate-making principles for certain generation and energy storage investments located in Iowa. The most significant provisions of this legislation for Alliant Energy would allow IPL to include energy storage and nuclear-fired generation projects in the advance rate-making principles request process prior to making these investments in Iowa, and require IPL to obtain a certificate of public convenience, use and necessity (GCU Certificate) from the IUC in order to construct energy storage projects.
In July 2023, legislation was enacted in Wisconsin, which creates a sales and use tax exemption for the sale of certain property for qualified data centers. The most significant provision of this legislation for Alliant Energy encourages economic development in WPL’s service territory.
In August 2022, the Inflation Reduction Act of 2022 was enacted. The most significant provisions of the legislation for Alliant Energy, IPL and WPL relate to a 10-year extension of tax credits for clean energy projects, a new production tax credit for eligible solar projects, a new stand-alone investment tax credit for energy storage projects and the right to transfer renewable tax credits generated after 2022 to other corporate taxpayers. The new legislation also includes a requirement for corporations with income over $1 billion to pay a 15% minimum tax; however, Alliant Energy is currently below this income level. Alliant Energy, IPL and WPL are utilizing various provisions of the new legislation to enhance the tax benefits expected from their current and planned renewable generation and energy storage projects, including transferring tax credits from such projects to other corporate taxpayers. The impact of these changes is expected to result in more cost benefits for IPL’s and WPL’s customers, higher rate base amounts, additional financing needs expected to be satisfied with additional long-term debt and common stock issuances, and improvements in long-term cash flows over the life of the solar, energy storage and wind projects. Repeal or amendment of the Inflation Reduction Act of 2022, or portions of the Inflation Reduction Act of 2022, could have an adverse impact on Alliant Energy’s, IPL’s and WPL’s financial condition and results of operations. Refer to Note 1(c) for discussion of the transfer of renewable tax credits to other corporate taxpayers in 2023 and 2024.
Refer to Note 11 for discussion of Iowa tax reform enacted in 2022.
LIQUIDITY AND CAPITAL RESOURCES
Overview - Alliant Energy, IPL and WPL expect to maintain adequate liquidity to operate their businesses and implement their strategy as a result of operating cash flows generated by their utility business, and available capacity under a single revolving credit facility and IPL’s sales of accounts receivable program, supplemented by periodic issuances of long-term debt and Alliant Energy equity securities. As summarized below, Alliant Energy, IPL and WPL believe they have the ability to generate and obtain adequate amounts of cash to meet their requirements and plans for cash in the next 12 months and beyond.
Liquidity Position - At December 31, 2024, Alliant Energy had $81 million of cash and cash equivalents, $742 million ($275 million at the parent company, $250 million at IPL and $217 million at WPL) of available capacity under the single revolving credit facility and $40 million of available capacity at IPL under its sales of accounts receivable program.
Capital Structure - Alliant Energy, IPL and WPL plan to maintain debt-to-total capitalization ratios that are consistent with investment-grade credit ratings, as well as maintain capital structures consistent with the authorized levels approved by IPL’s and WPL’s regulators. Financial capital structures as of December 31, 2024 were as follows (Common Equity (CE); Long-term Debt (including current maturities) (LD); Short-term Debt (SD)):
Alliant Energy, IPL and WPL intend to manage their capital structures and liquidity positions in such a way that facilitates their ability to raise funds reliably and on reasonable terms and conditions, while maintaining capital structures consistent with those approved by regulators. In addition to capital structures, other important factors used to determine the characteristics of future financings include financial coverage ratios, capital spending plans, regulatory orders and rate-making considerations, levels of debt and equity imputed by rating agencies, market conditions, the impact of tax initiatives and legislation, and any potential proceeds from asset sales. The PSCW factors certain imputed debt adjustments, including certain lease obligations, in establishing a regulatory capital structure as part of WPL’s retail rate reviews. The IUC does not make any explicit adjustments for imputed debt in establishing capital ratios used in determining customer rates, although such adjustments are considered by IPL in recommending an appropriate capital structure. Debt imputations by rating agencies include, among others, pension and OPEB obligations, the sales of accounts receivable program and certain lease obligations.
Credit and Capital Markets - Alliant Energy, IPL and WPL maintain a single revolving credit facility to provide backstop liquidity to their commercial paper programs, and ensure a committed source of liquidity in the event the commercial paper market becomes disrupted. In addition, IPL maintains a sales of accounts receivable program as an alternative financing source; however, if customer arrears were to exceed certain levels, IPL’s access to the program may be restricted.
Primary Sources and Uses of Cash - Alliant Energy’s most significant source of cash is from electric and gas sales to IPL’s and WPL’s customers. Cash from these sales reimburses IPL and WPL for prudently-incurred expenses to provide service to their utility customers and generally provides IPL and WPL a return of and a return on the assets used to provide such services. Capital needed to retire debt and fund capital expenditures related to large strategic projects is expected to be met primarily through external financings.
Cash Flows - Selected information from the cash flows statements was as follows (in millions):
| | | | | | | | | | | | | | | | | | | | | | | | | | | | | | | | | | | | | | |
| Alliant Energy | | IPL | | WPL |
| 2024 | | 2023 | | | 2024 | | 2023 | | | 2024 | | 2023 | |
| Cash, cash equivalents and restricted cash, January 1 | $63 | | | $24 | | | | $53 | | | $15 | | | | $7 | | | $5 | | |
| Cash flows from (used for): | | | | | | | | | | | | | | |
| Operating activities | 1,167 | | | 867 | | | | 357 | | | 261 | | | | 761 | | | 578 | | |
| Investing activities | (1,547) | | | (1,401) | | | | (684) | | | (326) | | | | (724) | | | (946) | | |
| Financing activities | 398 | | | 573 | | | | 303 | | | 103 | | | | 7 | | | 370 | | |
| Net increase (decrease) | 18 | | | 39 | | | | (24) | | | 38 | | | | 44 | | | 2 | | |
| Cash, cash equivalents and restricted cash, December 31 | $81 | | | $63 | | | | $29 | | | $53 | | | | $51 | | | $7 | | |
Operating Activities - The following items contributed to increased (decreased) operating activity cash flows for 2024 compared to 2023 (in millions):
| | | | | | | | | | | | | | | | | |
| Alliant Energy | | IPL | | WPL |
| | | | | |
| | | | | |
| | | | | |
| Higher collections from WPL’s retail electric and gas base rate increases | $254 | | $87 | | $167 |
| Changes in income taxes paid/received (a) | 109 | | 58 | | 64 |
| Changes in levels of production fuel | 19 | | 2 | | 17 |
| Timing of WPL’s fuel-related cost recoveries from retail electric customers | (75) | | — | | (75) |
| | | | | |
| Changes in the sales of accounts receivable at IPL | (56) | | (56) | | — |
| | | | | |
| | | | | |
| | | | | |
| Changes in interest payments | (56) | | (19) | | (17) |
| Decreased collections from IPL’s and WPL’s retail customers caused by temperature impacts on electric and gas sales | (31) | | (17) | | (14) |
| | | | | |
| | | | | |
| Other (primarily due to other changes in working capital) | 136 | | 41 | | 41 |
| $300 | | $96 | | $183 |
(a)Refer to the cash flows statements for details of renewable tax credits transferred to other corporate taxpayers in 2023 and 2024.
Income Tax Payments and Receipts - Income tax (payments) receipts were as follows (in millions):
| | | | | | | | | | | | | |
| 2024 | | 2023 | | |
| IPL | $175 | | $117 | | |
| WPL | 14 | | (50) | | |
| Other subsidiaries | 8 | | 21 | | |
| Alliant Energy | $197 | | $88 | | |
Alliant Energy, IPL and WPL currently do not expect to make any significant federal income tax payments over the next few years based on their current credit carryforward positions; however, some tax payments and receipts may occur for state taxes and between consolidated group members (including IPL and WPL) under the tax sharing agreement between Alliant Energy and its subsidiaries. Refer to Note 11 for discussion of the carryforward positions.
As discussed in “Legislative Matters,” the Inflation Reduction Act of 2022 provides the right to transfer renewable tax credits to other corporate taxpayers. Refer to the cash flows statements and Note 1(c) for details of renewable tax credits transferred to other corporate taxpayers in 2023 and 2024. Alliant Energy, IPL and WPL currently intend to transfer all eligible renewable tax credits in the future, and as a result, expect an increase in future cash flows from operating activities.
Higher Earnings on Increasing Rate Base - Refer to “Other Future Considerations” for discussion of expected increases in future cash flows from operating activities resulting from higher earnings on increasing rate base at IPL and WPL.
Pension Plan Contributions - Alliant Energy, IPL and WPL currently expect to make $20 million, $1 million and $14 million of pension plan contributions in 2025, respectively, based on the funded status and assumed return on assets for each plan as of the December 31, 2024 measurement date. Refer to Note 12(a) for discussion of pension plan contributions in 2024 and the current funded levels of pension plans.
Investing Activities - The following items contributed to increased (decreased) investing activity cash flows for 2024 compared to 2023 (in millions):
| | | | | | | | | | | | | | | | | |
| Alliant Energy | | IPL | | WPL |
| (Higher) lower utility construction and acquisition expenditures (a) | ($321) | | ($512) | | $191 |
| | | | | |
| Changes in the amount of cash receipts on sold receivables | 140 | | 140 | | — |
| | | | | |
| Other | 35 | | 14 | | 31 |
| ($146) | | ($358) | | $222 |
(a)Largely due to higher expenditures for IPL’s and WPL’s energy storage, IPL’s solar generation and IPL’s refurbishment of an existing wind farm, partially offset by lower expenditures for WPL’s solar generation.
Construction and Acquisition Expenditures - Construction and acquisition expenditures and financing plans are reviewed, approved and updated as part of the strategic planning process. Changes may result from a number of reasons, including changes in expected load growth, regulatory requirements, changing legislation, not obtaining favorable and acceptable regulatory approval on certain projects, changing costs of projects due to market conditions, improvements in technology, and improvements to ensure resiliency and reliability of the electric and gas distribution systems. Refer to “Rate Matters” for discussion of an electric distribution system investment cap included in IPL’s rate review settlement agreement, which was approved by the IUC in September 2024. Alliant Energy, IPL and WPL have not yet entered into contractual commitments relating to the majority of their anticipated future construction and acquisition expenditures. As a result, they have some discretion with regard to the level and timing of these expenditures. The table below summarizes anticipated construction and acquisition expenditures (in millions), which are focused on adding generation to meet growing customer demand for electricity, including initial expected future data center growth, and strengthening the resiliency and reliability of the electric grid, and include renewable generation and energy storage projects, dispatchable gas generation projects and converting certain coal-fired EGUs to natural gas. Alliant Energy, IPL and WPL are currently evaluating the impact of additional potential large load growth customers on their resource plans and will update their anticipated construction and acquisition expenditures as needed in the future. Cost estimates represent Alliant Energy’s, IPL’s and WPL’s portion of construction expenditures and exclude AFUDC and capitalized interest, if applicable. Refer to “Customer Investments” for further discussion of certain key utility business projects impacting construction and acquisition plans, and the related regulatory filings.
| | | | | | | | | | | | | | | | | | | | | | | | | | | | | | | | | | | | | | | | | | | | |
| Alliant Energy | | IPL | | WPL |
| 2025 | 2026 | 2027 | 2028 | | 2025 | 2026 | 2027 | 2028 | | 2025 | 2026 | 2027 | 2028 |
| Generation: | | | | | | | | | | | | | | |
| Renewables and energy storage projects | $800 | | $1,115 | | $1,325 | | $1,340 | | | $455 | | $540 | | $595 | | $565 | | | $345 | | $575 | | $730 | | $775 | |
| Gas projects | 390 | | 570 | | 780 | | 655 | | | 145 | | 175 | | 365 | | 355 | | | 195 | | 365 | | 415 | | 300 | |
| Other | 130 | | 120 | | 55 | | 55 | | | 65 | | 55 | | 25 | | 15 | | | 65 | | 65 | | 30 | | 40 | |
| Distribution: | | | | | | | | | | | | | | |
| Electric systems | 585 | | 570 | | 560 | | 580 | | | 310 | | 275 | | 280 | | 280 | | | 275 | | 295 | | 280 | | 300 | |
| Gas systems | 80 | | 85 | | 85 | | 85 | | | 35 | | 40 | | 40 | | 40 | | | 45 | | 45 | | 45 | | 45 | |
| Other | 220 | | 220 | | 215 | | 245 | | | 45 | | 50 | | 60 | | 45 | | | 30 | | 25 | | 30 | | 30 | |
| $2,205 | | $2,680 | | $3,020 | | $2,960 | | | $1,055 | | $1,135 | | $1,365 | | $1,300 | | | $955 | | $1,370 | | $1,530 | | $1,490 | |
West Riverside Options - WPL entered into agreements with neighboring utilities that provided them options to purchase a partial ownership interest in West Riverside. Upon exercise of such options and the resulting sales, WPL received proceeds from the sales in 2023 and 2024. Refer to “Customer Investments” for additional information.
Renewable Tax Credits - IPL and WPL started construction in 2024, and currently expect to start construction in the first half of 2025, of certain renewable and energy storage projects, with the intention of preserving the qualification of any renewable tax credits associated with these projects.
Financing Activities - The following items contributed to increased (decreased) financing activity cash flows for 2024 compared to 2023 (in millions):
| | | | | | | | | | | | | | | | | |
| Alliant Energy | | IPL | | WPL |
| Higher payments to retire long-term debt | ($301) | | ($500) | | $— |
| Lower net proceeds from common stock issuances | (223) | | — | | — |
| (Higher) lower common stock dividends | (36) | | 80 | | (12) |
| Net changes in the amount of commercial paper outstanding | 250 | | 50 | | (163) |
| Higher net proceeds from issuance of long-term debt | 158 | | 347 | | — |
| | | | | |
| | | | | |
| | | | | |
| Higher (lower) capital contributions from IPL’s and WPL’s parent company, Alliant Energy | — | | 245 | | (190) |
| Other | (23) | | (22) | | 2 |
| ($175) | | $200 | | ($363) |
FERC and Public Utility Holding Company Act Financing Authorizations - Under the Public Utility Holding Company Act of 2005, FERC has authority over the issuance of utility securities, except to the extent that a public utility’s primary state regulatory commission has retained jurisdiction over such matters. FERC currently has authority over the issuance of securities by IPL. FERC does not have authority over the issuance of securities by Alliant Energy, WPL, AEF or Corporate Services. In 2023, IPL received authorization from FERC to issue securities in 2024 and 2025 as follows (in millions):
| | | | | | | | | | | |
| Initial Authorization | | Remaining Capacity as of December 31, 2024 |
| Long-term debt securities issuances in aggregate | $1,700 | | $1,050 |
| Short-term debt securities outstanding at any time (including borrowings from its parent) | 400 | | 350 |
| Preferred stock issuances in aggregate | 300 | | 300 |
State Regulatory Financing Authorizations - In March 2023, WPL received authorization from the PSCW to have up to $500 million of short-term borrowings and/or letters of credit outstanding at any time through the expiration date of WPL’s credit facility agreement. As of December 31, 2024, WPL also had authority to issue up to $600 million of long-term debt securities in aggregate through December 2025 pursuant to a February 2023 PSCW order.
Shelf Registrations - Alliant Energy, IPL and WPL have current shelf registration statements on file with the SEC for availability to issue unspecified amounts of securities through December 2026. Alliant Energy’s shelf registration statement may be used to issue common stock, debt and other securities. IPL’s and WPL’s shelf registration statements may be used to issue preferred stock and debt securities.
Common Stock Dividends - Payment of common stock dividends is subject to dividend declaration by Alliant Energy’s Board of Directors and is dependent upon, among other factors, regulatory limitations, earnings, cash flows, capital requirements and general financial condition of subsidiaries. Alliant Energy’s general long-term goal is to maintain a dividend payout ratio that is competitive with the industry average. Based on that, Alliant Energy’s goal is to maintain a dividend payout ratio of approximately 60% to 70% of consolidated earnings from continuing operations. Refer to “Results of Operations” for discussion of expected common stock dividends in 2025.
Common Stock Issuances - Refer to Note 7 for discussion of common stock issuances by Alliant Energy in 2023 and 2024, and “Results of Operations” for discussion of expected issuances of common stock in 2025.
Short-term Debt - In December 2024, Alliant Energy, IPL and WPL amended and extended their single revolving credit facility agreement, which expires in December 2029 and is discussed in Note 8(a). There are currently 14 lenders that participate in the credit facility, with respective commitments ranging from $25 million to $130 million. Subject to certain conditions, Alliant Energy, IPL and WPL may exercise two extension options, which would each extend the maturity date by one year. The credit facility has a provision to expand the facility size up to an additional $700 million, for a potential total commitment of $2 billion, subject to lender approval for Alliant Energy and subject to lender and regulatory approvals for IPL and WPL.
The credit agreement contains customary events of default, including a cross-default provision that would be triggered if Alliant Energy or certain of its significant subsidiaries (including IPL and WPL) defaults on debt (other than non-recourse debt) totaling $100 million or more. IPL and WPL are subject to a similar cross-default provision with respect to their own respective consolidated debt. A default by Alliant Energy or its non-utility subsidiaries would not trigger a cross-default at IPL or WPL, nor would a default by either of IPL or WPL constitute a cross-default event for the other. If an event of default under the credit agreement occurs and is continuing, then the lenders may declare any outstanding obligations of the defaulting borrower under the credit agreement immediately due and payable.
The single credit facility agreement contains a financial covenant, which requires Alliant Energy, IPL and WPL to maintain certain debt-to-capital ratios in order to borrow under the credit facility. AEF’s term loan credit agreement contains a financial covenant, which requires Alliant Energy to maintain a certain debt-to-capital ratio in order to borrow under the term loan credit agreement. The required debt-to-capital ratios compared to the actual debt-to-capital ratios at December 31, 2024 were as follows:
| | | | | | | | | | | | | | | | | |
| Alliant Energy | | IPL | | WPL |
| Requirement, not to exceed | 65% | | 65% | | 65% |
| Actual | 60% | | 48% | | 48% |
The debt component of the capital ratios includes, when applicable, long- and short-term debt (excluding non-recourse debt and hybrid securities to the extent the total carrying value of such hybrid securities does not exceed 15% of consolidated capital of the applicable borrower), finance lease obligations, certain letters of credit, guarantees of the foregoing and new synthetic leases. Unfunded vested benefits under qualified pension plans and sales of accounts receivable are not included in the debt-to-capital ratios. The equity component of the capital ratios excludes accumulated other comprehensive income (loss).
Long-term Debt - Refer to Note 8(b) for discussion of issuances and retirements of long-term debt in 2024, and “Results of Operations” for discussion of expected issuances and retirements of long-term debt in 2025. In 2023, IPL issued $300 million of 5.7% senior debentures due 2033, and used the net proceeds to reduce cash amounts received from its sales of accounts receivable program, reduce commercial paper classified as long-term debt, and for general corporate purposes; pending application of the proceeds, such proceeds were placed in money market fund investments. In 2023, WPL issued $300 million of 4.95% green bond debentures due 2033, and an amount equal to or in excess of the net proceeds was disbursed for the development and acquisition of its solar EGUs. In 2023, AEF issued $300 million of 5.95% senior notes due 2029 and used the net proceeds to reduce Alliant Energy’s outstanding commercial paper and for general corporate purposes. In 2023, AEF entered into a $300 million interest rate swap maturing in January 2026 to mitigate interest rate risk. Under the terms of the swap, AEF exchanged a variable interest rate for a fixed interest rate of 3.93% on a portion of its variable-rate term loan borrowings. In 2023, Alliant Energy issued $575 million of 3.875% convertible senior notes due 2026, and used the net proceeds for general corporate purposes.
Impact of Credit Ratings on Liquidity and Collateral Obligations -
Ratings Triggers - The long-term debt of Alliant Energy and its subsidiaries is not subject to any repayment requirements as a result of explicit credit rating downgrades or so-called “ratings triggers.” However, Alliant Energy and its subsidiaries are parties to various agreements that contain provisions dependent on credit ratings. In the event of a significant downgrade, Alliant Energy or its subsidiaries may need to provide credit support, such as letters of credit or cash collateral equal to the amount of any exposure, or may need to unwind contracts or pay underlying obligations. In the event of a significant downgrade, management believes Alliant Energy, IPL and WPL have sufficient liquidity to cover counterparty credit support or collateral requirements under these various agreements. In addition, a downgrade in the credit ratings of Alliant Energy, IPL or WPL could also result in them paying higher interest rates in future financings, reduce flexibility with future financing plans, reduce their pool of potential lenders, increase their borrowing costs under existing credit facilities or limit their access to the commercial paper market. Credit ratings and outlooks as of the date of this report are as follows:
| | | | | | | | | | | | | | |
| | Standard & Poor’s Ratings Services | | Moody’s Investors Service |
| Alliant Energy: | Corporate/issuer | A- | | Baa2 |
| Commercial paper | A-2 | | P-2 |
| Senior unsecured long-term debt | BBB+ | | N/A |
| Outlook | Negative | | Stable |
| IPL: | Corporate/issuer | A- | | Baa1 |
| Commercial paper | A-2 | | P-2 |
| Senior unsecured long-term debt | A- | | Baa1 |
| Outlook | Negative | | Stable |
| WPL: | Corporate/issuer | A | | Baa1 |
| Commercial paper | A-1 | | P-2 |
| Senior unsecured long-term debt | A | | Baa1 |
| Outlook | Negative | | Stable |
Standard & Poor’s Ratings Services and Moody’s Investors Service issued credit ratings of BBB+ and Baa2, respectively, for the senior notes issued by AEF in 2018, 2020, 2022, 2023 and 2024 (with Alliant Energy as guarantor). Credit ratings are not recommendations to buy or sell securities and are subject to change, and each rating should be evaluated independently of any other rating. Each of Alliant Energy, IPL or WPL assumes no obligation to update their respective credit ratings. Refer to Note 14 for additional information on ratings triggers for commodity contracts accounted for as derivatives.
Off-Balance Sheet Arrangements -
Special Purpose Entities - IPL maintains a Receivables Agreement whereby it may sell its customer accounts receivables, unbilled revenues and certain other accounts receivables to a third party through wholly-owned and consolidated special purpose entities. The purchase commitment from the third party to which IPL sells its receivables expires in March 2026. In 2024 and 2023, IPL evaluated the third party that purchases IPL’s receivable assets under the Receivables Agreement and believes that the third party is a VIE; however, IPL concluded consolidation of the third party was not required.
In addition, IPL’s sales of accounts receivable program agreement contains a cross-default provision that is triggered if IPL or Alliant Energy incurs an event of default on debt totaling $100 million or more. If an event of default under IPL’s sales of accounts receivable program agreement occurs, then the counterparty could terminate such agreement. Refer to Note 5(b) for additional information regarding IPL’s sales of accounts receivable program.
Guarantees and Indemnifications - At December 31, 2024, various guarantees and indemnifications are outstanding related to Alliant Energy’s cash equity ownership interest in a non-utility wind farm, prior divestiture activities and transfers of renewable tax credits to other corporate taxpayers. Refer to Note 16(d) for additional information.
Certain Financial Commitments -
Contractual Obligations - Alliant Energy, IPL and WPL have various long-term contractual obligations as of December 31, 2024, which include long-term debt maturities in Note 8(b), operating and finance leases in Note 9, capital purchase obligations in Note 16(a), and other purchase obligations in Note 16(b). At December 31, 2024, Alliant Energy, IPL and WPL had no uncertain tax positions recorded as liabilities. Refer to Note 12(a) for anticipated pension and OPEB funding amounts. Refer to “Construction and Acquisition Expenditures” above for additional information on construction and acquisition programs. In addition, at December 31, 2024, there were various other liabilities included on the balance sheets that, due to the nature of the liabilities, the timing of payments cannot be estimated.
OTHER MATTERS
Market Risk Sensitive Instruments and Positions - Primary market risk exposures are associated with commodity prices, counterparty credit risk, investment prices and interest rates. Risk management policies are used to monitor and assist in mitigating these market risks and derivative instruments are used to manage some of the exposures related to commodity prices and interest rates. Refer to Notes 1(h) and 14 for further discussion of derivative instruments, and Note 1(g) for details of utility cost recovery mechanisms that significantly reduce commodity risk.
Commodity Price - Alliant Energy, IPL and WPL are exposed to the impact of market fluctuations in the price and transportation costs of commodities they procure and market. Established policies and procedures mitigate risks associated with these market fluctuations, including the use of various commodity derivatives and contracts of various durations for the forward sale and purchase of these commodities. Exposure to commodity price risks in the utility businesses is also significantly mitigated by current rate-making structures in place for recovery of fuel-related costs as well as the cost of natural gas purchased for resale. IPL’s electric and gas tariffs and WPL’s wholesale electric and gas tariffs provide for subsequent monthly adjustments to their tariff rates for material changes in prudently incurred commodity costs. IPL’s and WPL’s rate mechanisms, combined with commodity derivatives, significantly reduce commodity risk associated with their electric and gas service. WPL’s retail electric service is exposed to the impact of changes in commodity prices due largely to the current retail recovery mechanism in place in Wisconsin for fuel-related costs.
Counterparty Credit Risk - Alliant Energy, IPL, and WPL are exposed to credit risk related to losses resulting from counterparties’ nonperformance of their contractual obligations. Alliant Energy, IPL and WPL maintain credit policies intended to minimize overall credit risk and actively monitor these policies to reflect changes and scope of operations. Alliant Energy, IPL, and WPL conduct credit reviews for certain counterparties, and employ credit risk controls such as letters of credit, parental guarantees, master netting agreements and termination provisions. Credit exposure is monitored, and when necessary, activity with a specific counterparty is limited until credit enhancement is provided. Distress in the financial markets could increase Alliant Energy’s, IPL’s and WPL’s credit risk.
Investment Price - Alliant Energy, IPL and WPL are exposed to investment price risk as a result of their investments in securities, largely related to securities held by their pension and OPEB plans, as well as unconsolidated investments accounted for under the equity method of accounting. Refer to Note 12(a) for details of the securities held by their pension and OPEB plans, and Note 6 for details of equity investments. Refer to “Critical Accounting Estimates” for the impact on retirement plan costs of changes in the rate of returns earned by plan assets.
Interest Rate - Alliant Energy, IPL and WPL are exposed to risk resulting from changes in interest rates associated with variable-rate borrowings. In addition, Alliant Energy and IPL are exposed to risk resulting from changes in interest rates on cash amounts outstanding under IPL’s sales of accounts receivable program. Assuming the impact of a hypothetical 100 basis point increase in interest rates on variable-rate borrowings and cash amounts outstanding under IPL’s sales of accounts receivable program at December 31, 2024, Alliant Energy’s, IPL’s and WPL’s annual pre-tax expense would increase by approximately $6 million, $1 million and $2 million, respectively. Refer to Notes 5(b) and 8 for additional information on cash amounts outstanding under IPL’s sales of accounts receivable program, and short- and long-term variable-rate borrowings, respectively. Refer to “Critical Accounting Estimates” for the impacts of changes in discount rates on retirement plan obligations and costs.
Critical Accounting Estimates - Alliant Energy’s, IPL’s and WPL’s financial statements are prepared in conformity with GAAP, which requires management to apply accounting policies, judgments and assumptions, and make estimates that affect results of operations and the amounts of assets and liabilities reported in the financial statements. The following accounting estimates are critical to the business and the understanding of financial results as they require critical assumptions and judgments by management. The results of these assumptions and judgments form the basis for making estimates regarding the results of operations and the amounts of assets and liabilities that are not readily apparent from other sources. Actual financial results may differ materially from estimates. Management has discussed these critical accounting estimates with the Audit Committee of the Board of Directors. Refer to Note 1 for additional discussion of accounting estimates used in the preparation of the financial statements.
Regulatory Assets and Regulatory Liabilities - IPL and WPL are regulated by various federal and state regulatory agencies. As a result, they are subject to GAAP for regulated operations, which recognizes that the actions of a regulator can provide reasonable assurance of the existence of an asset or liability. Regulatory assets or regulatory liabilities arise as a result of a difference between GAAP and actions imposed by the regulatory agencies in the rate-making process. Regulatory assets generally represent incurred costs that have been deferred as such costs are probable of recovery in future customer rates. Regulatory liabilities generally represent obligations to make refunds to customers or amounts collected in rates for which the related costs have not yet been incurred. Regulatory assets and regulatory liabilities are recognized in accordance with the rulings of applicable federal and state regulators, and future regulatory rulings may impact the carrying value and accounting treatment of regulatory assets and regulatory liabilities. Note 2 provides details of the nature and amounts of regulatory assets and regulatory liabilities assessed at December 31, 2024.
Assumptions and judgments are made each reporting period regarding whether regulatory assets are probable of future recovery and regulatory liabilities are probable future obligations by considering factors such as regulatory environment changes, rate orders issued by the applicable regulatory agencies, historical decisions by such regulatory agencies regarding similar regulatory assets and regulatory liabilities, and subsequent events of such regulatory agencies. The decisions made by regulatory agencies have an impact on the recovery of costs, the rate of return on invested capital and the timing and amount of assets to be recovered by rates. A change in these decisions may result in a material impact on results of operations and the amount of assets and liabilities in the financial statements.
In May 2023, IPL retired the Lansing Generating Station. IPL was previously allowed a full recovery of and a full return on this EGU from its retail customers. In September 2024, the IUC approved IPL’s retail electric rate review for the October 2024 through September 2025 forward-looking Test Period, which includes a return of the remaining net book value of Lansing; however, the IUC did not approve a return on the remaining net book value of Lansing, therefore the return on the remaining net book value is no longer recoverable from IPL’s retail electric customers. As a result a pre-tax non-cash charge of $60 million was recorded to “Asset valuation charge for IPL’s Lansing Generating Station” in Alliant Energy’s and IPL’s income statements in 2024, with a corresponding decrease in Alliant Energy’s and IPL’s assets retired early regulatory assets. IPL is currently allowed a full recovery of and a full return on this EGU from its wholesale customers.
Income Taxes - Alliant Energy, IPL and WPL are subject to income taxes in various jurisdictions. Assumptions and judgments are made each reporting period to estimate income tax assets, liabilities, benefits and expenses. Judgments and assumptions are supported by historical data and reasonable projections. Significant changes in these judgments and assumptions could have a material impact on financial condition and results of operations. Alliant Energy’s and IPL’s critical assumptions and judgments for 2024 included estimates of qualifying deductions for repairs expenditures, allocation of mixed service costs and state depreciation, and costs related to retirement or removal of depreciable property due to the impact of Iowa rate-making principles on such property-related differences. Critical assumptions and judgments also include projections of future taxable income used to determine the ability to utilize federal credit carryforwards prior to their expiration. Refer to Note 11 for further discussion of tax matters.
Effect of Rate-making on Property-related Differences - Alliant Energy’s and IPL’s effective income tax rates are normally impacted by certain property-related differences at IPL for which deferred tax is not recorded in the income statement pursuant to Iowa rate-making principles. Changes in methods or assumptions regarding the amount of IPL’s qualifying repairs expenditures, allocation of mixed service costs and state depreciation, and costs related to retirement or removal of depreciable property, could result in a material impact on Alliant Energy’s and IPL’s financial condition and results of operations.
Carryforward Utilization - Significant federal tax credit carryforwards exist for Alliant Energy, IPL and WPL as of December 31, 2024. Based on projections of current and future taxable income, Alliant Energy, IPL and WPL plan to utilize all of these carryforwards approximately five years before expiration. Changes in tax regulations or assumptions regarding current and future taxable income could require valuation allowances in the future resulting in a material impact on financial condition and results of operations.
Long-Lived Assets - Periodic assessments regarding the recoverability of certain long-lived assets are completed when factors indicate the carrying value of such assets may not be recoverable or such assets are planned to be sold. These assessments require significant assumptions and judgments by management. The long-lived assets assessed for impairment generally include certain assets within regulated operations that may not be fully recovered from IPL’s and WPL’s customers as a result of regulatory decisions in the future, and assets within non-utility operations that are proposed to be sold or are currently generating operating losses.
Regulated Operations - Alliant Energy’s, IPL’s and WPL’s long-lived assets within their regulated operations that were assessed for impairment and/or plant abandonment in 2024 included WPL’s generating units subject to early retirement and solar generation projects.
Generating Units Subject to Early Retirement - Alliant Energy and WPL evaluate future plans for their electric generation fleet and have announced the early retirement of certain EGUs. When it becomes probable that an EGU will be retired before the end of its useful life, Alliant Energy and WPL must assess whether the EGU meets the criteria to be considered probable of abandonment. EGUs that are considered probable of abandonment generally have material remaining net book values and are expected to cease operations in the near term significantly before the end of their original estimated useful lives. If an EGU meets such criteria to be considered probable of abandonment, Alliant Energy and WPL must assess the probability of full recovery of the remaining carrying value of such EGU. If it is probable that regulators will not allow full recovery of and a full return on the remaining net book value of the abandoned EGU, an impairment charge is recognized equal to the difference between the remaining carrying value and the present value of the future revenues expected from the abandoned EGU.
Alliant Energy and WPL concluded that the coal-fired Columbia Units 1 and 2 met the criteria to be considered probable of abandonment as of December 31, 2024. WPL currently plans to cease coal operations at Columbia Units 1 and 2 by the end of 2029, as well as evaluate the conversion of Columbia Unit 1 and/or Unit 2 to natural gas. WPL is currently allowed a full recovery of and a full return on the Columbia EGUs from both its retail and wholesale customers, and as a result, Alliant Energy and WPL concluded that no impairment was required as of December 31, 2024. Alliant Energy, IPL and WPL evaluated their other EGUs that are subject to early retirement and determined that no other EGUs met the criteria to be considered probable of abandonment as of December 31, 2024. Note 3 provides additional details on these EGUs.
Solar Generation Projects - Alliant Energy and WPL review property, plant and equipment for possible impairment whenever events or changes in circumstances indicate all or a portion of the carrying value of the assets may be disallowed for rate-making purposes. If WPL is disallowed recovery of any portion of, or is only allowed a partial return on, the carrying value of its solar generation projects, then an impairment charge is recognized. Alliant Energy and WPL currently expect construction costs associated with WPL’s approximately 1,100 MW of new solar generation will exceed the construction cost estimates previously approved by the PSCW by approximately $205 million. In 2024, the PSCW issued orders approving deferral of, and the deferral of a return on, the incremental solar generation construction costs in 2024 and 2025. Alliant Energy and WPL concluded that there was not a probable disallowance of higher rate base amounts as of December 31, 2024 given construction costs were reasonably and prudently incurred. “Customer Investments” provides details of WPL’s solar generation projects recently completed.
AROs - The fair value of a legal obligation associated with the retirement of an asset is recorded as a liability when an asset is placed in service, when a legal obligation is subsequently identified or when sufficient information becomes available to determine a reasonable estimate of the fair value of future retirement costs. Alliant Energy, IPL and WPL estimate the fair value of their AROs using present value techniques, in which they make various assumptions, including estimates of the amounts and timing of future cash flows associated with retirement activities, inflation and discount rates. Estimates of the timing and amounts of future cash outlays are based on projections of when and how assets will be retired and the cost of future removal activities. The estimates are subject to change and future updates could have a material impact on Alliant Energy’s, IPL’s and WPL’s financial condition and results of operations. In 2024, substantially due to the enactment of the revised CCR Rule, which significantly expands the scope of regulation to include coal ash ponds at sites that no longer produce electricity and inactive landfills, Alliant Energy, IPL and WPL recorded additional AROs of $409 million, $201 million and $208 million, respectively. These amounts are expected to be adjusted in the future, as additional information is obtained for the specific site closure plans, including the determination of whether or not individual sites are considered legal obligations and the acceptance and approval of compliance approaches, which could change management assumptions and result in a material change to the recorded ARO amounts. Refer to Note 13 for further discussion of AROs.
Pensions and Other Postretirement Benefits - Alliant Energy, IPL and WPL sponsor various defined benefit pension and OPEB plans that provide benefits to a significant portion of their employees and retirees. Assumptions and judgments are made periodically to estimate the obligations and costs related to their retirement plans. There are many judgments and assumptions involved in determining an entity’s pension and other postretirement liabilities and costs each period including employee demographics (including life expectancies and compensation levels), discount rates, assumed rates of return and funding. Changes made to plan provisions may also impact current and future benefits costs. Judgments and assumptions are supported by historical data and reasonable projections and are reviewed at least annually. The following table shows the impacts of changing certain key actuarial assumptions discussed above (in millions):
| | | | | | | | | | | | | | | | | | | | | | | | | | |
| | Defined Benefit Pension Plans | | OPEB Plans |
| Change in Actuarial Assumption | | Impact on Projected Benefit Obligation at December 31, 2024 | | Impact on 2025 Net Periodic Benefit Costs | | Impact on Accumulated Benefit Obligation at December 31, 2024 | | Impact on 2025 Net Periodic Benefit Costs |
| Alliant Energy | | | | | | | | |
| 1% change in discount rate | | $85 | | $7 | | $10 | | $— |
| 1% change in expected rate of return | | N/A | | 7 | | N/A | | 1 |
| IPL | | | | | | | | |
| 1% change in discount rate | | 39 | | 3 | | 4 | | — |
| 1% change in expected rate of return | | N/A | | 3 | | N/A | | 1 |
| WPL | | | | | | | | |
| 1% change in discount rate | | 38 | | 3 | | 4 | | — |
| 1% change in expected rate of return | | N/A | | 3 | | N/A | | — |
Contingencies - Assumptions and judgments are made each reporting period regarding the future outcome of contingent events. Loss contingency amounts are recorded for any contingent events for which the likelihood of loss is probable and able to be reasonably estimated based upon current available information. The amounts recorded may differ from actuals when the uncertainty is resolved. The estimates made in accounting for contingencies, and the gains and losses that are recorded upon the ultimate resolution of these uncertainties, could have a significant effect on results of operations and the amount of assets and liabilities in the financial statements. Certain contingencies require estimation each reporting period of the expected credit losses on those contingencies, which requires significant judgment and may result in the recognition of a credit loss liability. Note 16 provides further discussion of contingencies assessed at December 31, 2024 that may have a material impact on financial condition and results of operations, including various pending legal proceedings, guarantees and indemnifications.
ITEM 7A. QUANTITATIVE AND QUALITATIVE DISCLOSURES ABOUT MARKET RISK
ITEM 8. FINANCIAL STATEMENTS AND SUPPLEMENTARY DATA
REPORT OF INDEPENDENT REGISTERED PUBLIC ACCOUNTING FIRM
To the Shareowners and the Board of Directors of Alliant Energy Corporation:
Opinion on the Financial Statements
We have audited the accompanying consolidated balance sheets of Alliant Energy Corporation and subsidiaries (the “Company”) as of December 31, 2024 and 2023, the related consolidated statements of income, equity, and cash flows, for each of the three years in the period ended December 31, 2024, and the related notes and the schedules listed in the Index at Item 15 (collectively referred to as the “financial statements”). In our opinion, the financial statements present fairly, in all material respects, the financial position of the Company as of December 31, 2024 and 2023, and the results of its operations and its cash flows for each of the three years in the period ended December 31, 2024, in conformity with accounting principles generally accepted in the United States of America.
We have also audited, in accordance with the standards of the Public Company Accounting Oversight Board (United States) (PCAOB), the Company’s internal control over financial reporting as of December 31, 2024, based on criteria established in Internal Control - Integrated Framework (2013) issued by the Committee of Sponsoring Organizations of the Treadway Commission and our report dated February 21, 2025, expressed an unqualified opinion on the Company’s internal control over financial reporting.
Basis for Opinion
These financial statements are the responsibility of the Company’s management. Our responsibility is to express an opinion on the Company’s financial statements based on our audits. We are a public accounting firm registered with the PCAOB and are required to be independent with respect to the Company in accordance with the U.S. federal securities laws and the applicable rules and regulations of the Securities and Exchange Commission and the PCAOB.
We conducted our audits in accordance with the standards of the PCAOB. Those standards require that we plan and perform the audit to obtain reasonable assurance about whether the financial statements are free of material misstatement, whether due to error or fraud. Our audits included performing procedures to assess the risks of material misstatement of the financial statements, whether due to error or fraud, and performing procedures that respond to those risks. Such procedures included examining, on a test basis, evidence regarding the amounts and disclosures in the financial statements. Our audits also included evaluating the accounting principles used and significant estimates made by management, as well as evaluating the overall presentation of the financial statements. We believe that our audits provide a reasonable basis for our opinion.
Critical Audit Matter
The critical audit matter communicated below is a matter arising from the current-period audit of the financial statements that was communicated or required to be communicated to the audit committee and that (1) relates to accounts or disclosures that are material to the financial statements and (2) involved our especially challenging, subjective, or complex judgments. The communication of critical audit matters does not alter in any way our opinion on the financial statements, taken as a whole, and we are not, by communicating the critical audit matter below, providing a separate opinion on the critical audit matter or on the accounts or disclosures to which it relates.
Regulatory Accounting - Impact of rate regulation on the financial statements - Refer to Notes 1, 2, and 3 to the financial statements
Critical Audit Matter Description
Alliant Energy Corporation, through its wholly-owned subsidiaries Interstate Power and Light Company and Wisconsin Power and Light Company, is subject to rate regulation by regulatory agencies. Management has determined it meets the requirements under accounting principles generally accepted in the United States of America to prepare its financial statements applying the Regulated Operations Topic 980 of the Financial Accounting Standards Board’s Accounting Standards Codification.
The Company’s rates are subject to regulatory rate-setting processes and periodic earnings oversight. The regulation of rates is premised on the full recovery of prudently incurred costs and a reasonable rate of return on invested capital. Regulatory assets generally represent incurred costs that have been deferred and are probable of recovery in future customer rates. Regulatory liabilities generally represent obligations to make refunds to customers or amounts collected in rates for which the costs have not yet been incurred. The Company’s regulatory assets and regulatory liabilities are recognized in accordance with the rulings of the regulatory agencies. A change in these rulings may result in a material impact on results of operations and the amount of certain assets and liabilities in the financial statements. Future regulatory rulings may impact the carrying value and accounting treatment of certain regulatory assets and regulatory liabilities.
We identified the impact of rate regulation as a critical audit matter due to the significant judgments made by management to support its assertions about certain impacted account balances and disclosures and the high degree of subjectivity involved in assessing the impact of relevant future regulatory orders on the financial statements. Management judgments include assessing the likelihood of the recovery of incurred costs and refund of obligations to customers in future rates. Given that management’s accounting judgments are based on assumptions about the outcome of future decisions by the regulatory agencies, auditing these judgments required specialized knowledge of accounting for rate regulation and the rate-setting process due to its inherent complexities.
How the Critical Audit Matter Was Addressed in the Audit
Our audit procedures related to the regulatory filings by management and the uncertainty of future decisions by the regulatory agencies included the following, among others:
•We tested the effectiveness of management’s controls over the evaluation of certain regulatory assets and regulatory liabilities, including the monitoring and evaluation of regulatory developments that may affect the likelihood of recovering costs in future rates or of a future reduction in rates.
•We inspected and evaluated the Company’s analysis supporting the probability of recovery for certain regulatory assets or refund to customers or future reduction in customer rates for regulatory liabilities not yet addressed in a regulatory order to assess management’s assertions.
•We inquired of management regarding current events impacting the Company and inspected minutes of the board of directors and other committees of the Company and evaluated whether matters were identified that may have an impact on certain recorded regulatory assets and liabilities.
•We read relevant regulatory orders, interpretations, filings made by the Company or its stakeholders, and other publicly available information issued by the regulatory agencies that pertain to the Company. We evaluated the external information and assessed whether there are matters in such information that would be contradictory to management’s assertion of probability of recovery of certain regulatory assets or refund of regulatory liabilities, or impact other recorded balances.
•We inspected minutes of the board of directors and other committees of the Company, regulatory orders and other filings with the regulatory agencies to identify evidence that may contradict management’s assertion regarding probability of abandonment or that may have an impact on the recorded balances.
•We evaluated the Company’s disclosures related to the impacts of rate regulation and regulatory developments, including disclosures related to certain regulatory balances recorded.
/s/ Deloitte & Touche LLP
Milwaukee, Wisconsin
February 21, 2025
We have served as the Company’s auditor since 2002.
ALLIANT ENERGY CORPORATION
CONSOLIDATED STATEMENTS OF INCOME
| | | | | | | | | | | | | | | | | |
| Year Ended December 31, |
| 2024 | | 2023 | | 2022 |
| (in millions, except per share amounts) |
| Revenues: | | | | | |
| Electric utility | $3,372 | | | $3,345 | | | $3,421 | |
| Gas utility | 465 | | | 540 | | | 642 | |
| Other utility | 54 | | | 52 | | | 49 | |
| Non-utility | 90 | | | 90 | | | 93 | |
| Total revenues | 3,981 | | | 4,027 | | | 4,205 | |
| Operating expenses: | | | | | |
| Electric production fuel and purchased power | 628 | | | 736 | | | 830 | |
| Electric transmission service | 613 | | | 583 | | | 573 | |
| Cost of gas sold | 224 | | | 299 | | | 389 | |
| Other operation and maintenance: | | | | | |
| Asset valuation charge for IPL’s Lansing Generating Station | 60 | | | — | | | — | |
| Other | 676 | | | 675 | | | 704 | |
| Depreciation and amortization | 772 | | | 676 | | | 671 | |
| Taxes other than income taxes | 122 | | | 115 | | | 110 | |
| Total operating expenses | 3,095 | | | 3,084 | | | 3,277 | |
| Operating income | 886 | | | 943 | | | 928 | |
| Other (income) and deductions: | | | | | |
| Interest expense | 449 | | | 394 | | | 325 | |
| Equity income from unconsolidated investments, net | (61) | | | (61) | | | (51) | |
| Allowance for funds used during construction | (75) | | | (100) | | | (60) | |
| Other | (3) | | | 3 | | | 6 | |
| Total other (income) and deductions | 310 | | | 236 | | | 220 | |
| Income before income taxes | 576 | | | 707 | | | 708 | |
| Income tax expense (benefit) | (114) | | | 4 | | | 22 | |
| | | | | |
| | | | | |
| | | | | |
| | | | | |
| Net income attributable to Alliant Energy common shareowners | $690 | | | $703 | | | $686 | |
| Weighted average number of common shares outstanding: | | | | | |
| Basic | 256.5 | | | 253.0 | | | 250.9 | |
| Diluted | 256.8 | | | 253.3 | | | 251.2 | |
| | | | | |
| | | | | |
| | | | | |
| | | | | |
| Earnings per weighted average common share attributable to Alliant Energy common shareowners (basic and diluted) | $2.69 | | | $2.78 | | | $2.73 | |
| | | | | |
| | | | | |
| | | | | |
| | | | | |
| | | | | |
| | | | | |
Refer to accompanying Combined Notes to Consolidated Financial Statements.
ALLIANT ENERGY CORPORATION
CONSOLIDATED BALANCE SHEETS
| | | | | | | | | | | |
| December 31, |
| 2024 | | 2023 |
| (in millions, except per
share and share amounts) |
| ASSETS | | | |
| Current assets: | | | |
| Cash and cash equivalents | $81 | | | $62 | |
| Accounts receivable, less allowance for expected credit losses | 427 | | | 475 | |
| Production fuel, at weighted average cost | 54 | | | 62 | |
| Gas stored underground, at weighted average cost | 55 | | | 79 | |
| Materials and supplies, at weighted average cost | 186 | | | 202 | |
| Regulatory assets | 210 | | | 232 | |
| | | |
| Other | 171 | | | 160 | |
| Total current assets | 1,184 | | | 1,272 | |
| Property, plant and equipment, net | 18,701 | | | 17,157 | |
| Investments: | | | |
| ATC Holdings | 415 | | | 386 | |
| Other | 224 | | | 216 | |
| Total investments | 639 | | | 602 | |
| Other assets: | | | |
| Regulatory assets | 2,064 | | | 2,029 | |
| Deferred charges and other | 126 | | | 177 | |
| Total other assets | 2,190 | | | 2,206 | |
| Total assets | $22,714 | | | $21,237 | |
| | | | | | | | | | | |
| LIABILITIES AND EQUITY | | | |
| Current liabilities: | | | |
| Current maturities of long-term debt | $1,171 | | | $809 | |
| Commercial paper | 558 | | | 475 | |
| | | |
| Accounts payable | 532 | | | 611 | |
| | | |
| | | |
| Regulatory liabilities | 69 | | | 107 | |
| Other | 385 | | | 302 | |
| Total current liabilities | 2,715 | | | 2,304 | |
| Long-term debt, net (excluding current portion) | 8,677 | | | 8,225 | |
| Other liabilities: | | | |
| Deferred tax liabilities | 2,188 | | | 2,042 | |
| Regulatory liabilities | 959 | | | 1,023 | |
| Pension and other benefit obligations | 224 | | | 249 | |
| Other | 947 | | | 617 | |
| Total other liabilities | 4,318 | | | 3,931 | |
Commitments and contingencies (Note 16) | | | |
| Equity: | | | |
| Alliant Energy Corporation common equity: | | | |
| Common stock - $0.01 par value - 480,000,000 shares authorized; 256,690,222 and 256,096,848 shares outstanding | 3 | | | 3 | |
| Additional paid-in capital | 3,060 | | | 3,030 | |
| Retained earnings | 3,954 | | | 3,756 | |
| Accumulated other comprehensive income | 1 | | | 1 | |
| Shares in deferred compensation trust - 372,116 and 379,006 shares at a weighted average cost of $36.56 and $34.48 per share | (14) | | | (13) | |
| Total Alliant Energy Corporation common equity | 7,004 | | | 6,777 | |
| | | |
| | | |
| Total liabilities and equity | $22,714 | | | $21,237 | |
Refer to accompanying Combined Notes to Consolidated Financial Statements.
ALLIANT ENERGY CORPORATION
CONSOLIDATED STATEMENTS OF CASH FLOWS
| | | | | | | | | | | | | | | | | |
| Year Ended December 31, |
| 2024 | | 2023 | | 2022 |
| (in millions) |
| Cash flows from operating activities: | | | | | |
| Net income | $690 | | | $703 | | | $686 | |
| Adjustments to reconcile net income to net cash flows from operating activities: | | | | | |
| Depreciation and amortization | 772 | | | 676 | | | 671 | |
| | | | | |
| Deferred tax expense (benefit) and tax credits | (117) | | | 14 | | | 13 | |
| | | | | |
| | | | | |
| | | | | |
| Asset valuation charge for IPL’s Lansing Generating Station | 60 | | | — | | | — | |
| Other | (22) | | | (39) | | | (17) | |
| Other changes in assets and liabilities: | | | | | |
| Accounts receivable | (547) | | | (414) | | | (672) | |
| | | | | |
| Regulatory assets | 70 | | | 24 | | | (108) | |
| Derivative assets | 13 | | | 149 | | | (61) | |
| Accounts payable | 96 | | | (122) | | | 78 | |
| Regulatory liabilities | (103) | | | (149) | | | 22 | |
| | | | | |
| Deferred income taxes (a) | 259 | | | 84 | | | 4 | |
| Pension and other benefit obligations | (25) | | | (28) | | | (97) | |
| | | | | |
| Other | 21 | | | (31) | | | (33) | |
| Net cash flows from operating activities | 1,167 | | | 867 | | | 486 | |
| Cash flows used for investing activities: | | | | | |
| Construction and acquisition expenditures: | | | | | |
| Utility business | (2,052) | | | (1,731) | | | (1,392) | |
| Other | (197) | | | (123) | | | (92) | |
| Cash receipts on sold receivables | 593 | | | 453 | | | 598 | |
| Proceeds from sales of partial ownership interests in West Riverside | 123 | | | 120 | | | — | |
| Other | (14) | | | (120) | | | (47) | |
| Net cash flows used for investing activities | (1,547) | | | (1,401) | | | (933) | |
| Cash flows from financing activities: | | | | | |
| Common stock dividends | (492) | | | (456) | | | (428) | |
| Proceeds from issuance of common stock, net | 23 | | | 246 | | | 25 | |
| | | | | |
| Proceeds from issuance of long-term debt | 1,613 | | | 1,455 | | | 1,338 | |
| Payments to retire long-term debt | (809) | | | (508) | | | (633) | |
| Net change in commercial paper | 83 | | | (167) | | | 127 | |
| | | | | |
| | | | | |
| Other | (20) | | | 3 | | | 2 | |
| Net cash flows from financing activities | 398 | | | 573 | | | 431 | |
| Net increase (decrease) in cash, cash equivalents and restricted cash | 18 | | | 39 | | | (16) | |
| Cash, cash equivalents and restricted cash at beginning of period | 63 | | | 24 | | | 40 | |
| Cash, cash equivalents and restricted cash at end of period | $81 | | | $63 | | | $24 | |
| Supplemental cash flows information: | | | | | |
| Cash (paid) received during the period for: | | | | | |
| Interest | ($434) | | | ($378) | | | ($311) | |
| Income taxes, net (a) | $197 | | | $88 | | | ($6) | |
| Significant non-cash investing and financing activities: | | | | | |
| Accrued capital expenditures | $224 | | | $364 | | | $382 | |
| Beneficial interest obtained in exchange for securitized accounts receivable | $163 | | | $216 | | | $185 | |
(a) 2024 and 2023 include $216 million and $98 million, respectively, of proceeds from renewable tax credits transferred to other corporate taxpayers
Refer to accompanying Combined Notes to Consolidated Financial Statements.
ALLIANT ENERGY CORPORATION
CONSOLIDATED STATEMENTS OF EQUITY
| | | | | | | | | | | | | | | | | | | | | | | | | | | | | | | | | | | | | | | |
| | | | | | | |
| | | | | | | Accumulated | | Shares in | | | | | | |
| | | Additional | | | | Other | | Deferred | | | | | | Total |
| Common | | Paid-In | | Retained | | Comprehensive | | Compensation | | | | | | Common |
| Stock | | Capital | | Earnings | | Income | | Trust | | | | | | Equity |
| (in millions) |
| 2022: | | | | | | | | | | | | | | | |
| Beginning balance | $3 | | $2,749 | | $3,250 | | $— | | ($12) | | | | | | $5,990 |
| Net income attributable to Alliant Energy common shareowners | | | | | 686 | | | | | | | | | | 686 |
| Common stock dividends ($1.71 per share) | | | | | (428) | | | | | | | | | | (428) |
| Shareowner Direct Plan issuances | | | 25 | | | | | | | | | | | | 25 |
| Equity-based compensation plans and other | | | 3 | | 1 | | | | (1) | | | | | | 3 |
| | | | | | | | | | | | | | | |
| | | | | | | | | | | | | | | |
| | | | | | | | | | | | | | | |
| Ending balance | 3 | | 2,777 | | 3,509 | | — | | (13) | | | | | | 6,276 |
| 2023: | | | | | | | | | | | | | | | |
| Net income attributable to Alliant Energy common shareowners | | | | | 703 | | | | | | | | | | 703 |
| Common stock dividends ($1.81 per share) | | | | | (456) | | | | | | | | | | (456) |
| At-the-market offering program, net and Shareowner Direct Plan issuances | | | 246 | | | | | | | | | | | | 246 |
| Equity-based compensation plans and other | | | 7 | | | | | | | | | | | | 7 |
| | | | | | | | | | | | | | | |
| | | | | | | | | | | | | | | |
| | | | | | | | | | | | | | | |
| | | | | | | | | | | | | | | |
| Other comprehensive income, net of tax | | | | | | | 1 | | | | | | | | 1 |
| Ending balance | 3 | | 3,030 | | 3,756 | | 1 | | (13) | | | | | | 6,777 |
| 2024: | | | | | | | | | | | | | | | |
| Net income attributable to Alliant Energy common shareowners | | | | | 690 | | | | | | | | | | 690 |
| Common stock dividends ($1.92 per share) | | | | | (492) | | | | | | | | | | (492) |
| Shareowner Direct Plan issuances | | | 23 | | | | | | | | | | | | 23 |
| Equity-based compensation plans and other | | | 7 | | | | | | (1) | | | | | | 6 |
| | | | | | | | | | | | | | | |
| | | | | | | | | | | | | | | |
| | | | | | | | | | | | | | | |
| | | | | | | | | | | | | | | |
| Ending balance | $3 | | $3,060 | | $3,954 | | $1 | | ($14) | | | | | | $7,004 |
Refer to accompanying Combined Notes to Consolidated Financial Statements.
REPORT OF INDEPENDENT REGISTERED PUBLIC ACCOUNTING FIRM
To the Shareowner and the Board of Directors of Interstate Power and Light Company:
Opinion on the Financial Statements
We have audited the accompanying consolidated balance sheets of Interstate Power and Light Company and subsidiaries (the “Company”) as of December 31, 2024 and 2023, the related consolidated statements of income, equity, and cash flows, for each of the three years in the period ended December 31, 2024, and the related notes and the schedule listed in the Index at Item 15 (collectively referred to as the “financial statements”). In our opinion, the financial statements present fairly, in all material respects, the financial position of the Company as of December 31, 2024 and 2023, and the results of its operations and its cash flows for each of the three years in the period ended December 31, 2024, in conformity with accounting principles generally accepted in the United States of America.
Basis for Opinion
These financial statements are the responsibility of the Company’s management. Our responsibility is to express an opinion on the Company’s financial statements based on our audits. We are a public accounting firm registered with the Public Company Accounting Oversight Board (United States) (PCAOB) and are required to be independent with respect to the Company in accordance with the U.S. federal securities laws and the applicable rules and regulations of the Securities and Exchange Commission and the PCAOB.
We conducted our audits in accordance with the standards of the PCAOB. Those standards require that we plan and perform the audit to obtain reasonable assurance about whether the financial statements are free of material misstatement, whether due to error or fraud. The Company is not required to have, nor were we engaged to perform, an audit of its internal control over financial reporting. As part of our audits, we are required to obtain an understanding of internal control over financial reporting but not for the purpose of expressing an opinion on the effectiveness of the Company’s internal control over financial reporting. Accordingly, we express no such opinion.
Our audits included performing procedures to assess the risks of material misstatement of the financial statements, whether due to error or fraud, and performing procedures that respond to those risks. Such procedures included examining, on a test basis, evidence regarding the amounts and disclosures in the financial statements. Our audits also included evaluating the accounting principles used and significant estimates made by management, as well as evaluating the overall presentation of the financial statements. We believe that our audits provide a reasonable basis for our opinion.
Critical Audit Matter
The critical audit matter communicated below is a matter arising from the current-period audit of the financial statements that was communicated or required to be communicated to the audit committee and that (1) relates to accounts or disclosures that are material to the financial statements and (2) involved our especially challenging, subjective, or complex judgments. The communication of critical audit matters does not alter in any way our opinion on the financial statements, taken as a whole, and we are not, by communicating the critical audit matter below, providing a separate opinion on the critical audit matter or on the accounts or disclosures to which it relates.
Regulatory Accounting - Impact of rate regulation on the financial statements - Refer to Notes 1 and 2 to the financial statements
Critical Audit Matter Description
Interstate Power and Light Company is subject to rate regulation by regulatory agencies. Management has determined it meets the requirements under accounting principles generally accepted in the United States of America to prepare its financial statements applying the Regulated Operations Topic 980 of the Financial Accounting Standards Board’s Accounting Standards Codification.
The Company’s rates are subject to regulatory rate-setting processes and periodic earnings oversight. The regulation of rates is premised on the full recovery of prudently incurred costs and a reasonable rate of return on invested capital. Regulatory assets generally represent incurred costs that have been deferred and are probable of recovery in future customer rates. Regulatory liabilities generally represent obligations to make refunds to customers or amounts collected in rates for which the costs have not yet been incurred. The Company’s regulatory assets and regulatory liabilities are recognized in accordance with the rulings of the regulatory agencies. A change in these rulings may result in a material impact on results of operations and the amount of certain assets and liabilities in the financial statements. Future regulatory rulings may impact the carrying value and accounting treatment of certain regulatory assets and regulatory liabilities.
We identified the impact of rate regulation as a critical audit matter due to the significant judgments made by management to support its assertions about certain impacted account balances and disclosures and the high degree of subjectivity involved in assessing the impact of relevant future regulatory orders on the financial statements. Management judgments include assessing the likelihood of the recovery of incurred costs and refund of obligations to customers in future rates. Given that management’s accounting judgments are based on assumptions about the outcome of future decisions by the regulatory agencies, auditing these judgments required specialized knowledge of accounting for rate regulation and the rate-setting process due to its inherent complexities.
How the Critical Audit Matter Was Addressed in the Audit
Our audit procedures related to the regulatory filings by management and the uncertainty of future decisions by the regulatory agencies included the following, among others:
•We tested the effectiveness of management’s controls over the evaluation of certain regulatory assets and regulatory liabilities, including the monitoring and evaluation of regulatory developments that may affect the likelihood of recovering costs in future rates or of a future reduction in rates.
•We inspected and evaluated the Company’s analysis supporting the probability of recovery for certain regulatory assets or refund to customers or future reduction in customer rates for regulatory liabilities not yet addressed in a regulatory order to assess management’s assertions.
•We inquired of management regarding current events impacting the Company and inspected minutes of the board of directors and other committees of the Company and evaluated whether matters were identified that may have an impact on certain recorded regulatory assets and liabilities.
•We read relevant regulatory orders, interpretations, filings made by the Company or its stakeholders, and other publicly available information issued by the regulatory agencies that pertain to the Company. We evaluated the external information and assessed whether there are matters in such information that would be contradictory to management’s assertion of probability of recovery of certain regulatory assets or refund of regulatory liabilities, or impact other recorded balances.
•We evaluated the Company’s disclosures related to the impacts of rate regulation and regulatory developments, including disclosures related to certain regulatory balances recorded.
/s/ Deloitte & Touche LLP
Milwaukee, Wisconsin
February 21, 2025
We have served as the Company’s auditor since 2002.
INTERSTATE POWER AND LIGHT COMPANY
CONSOLIDATED STATEMENTS OF INCOME
| | | | | | | | | | | | | | | | | |
| Year Ended December 31, |
| 2024 | | 2023 | | 2022 |
| (in millions) |
| Revenues: | | | | | |
| Electric utility | $1,747 | | | $1,761 | | | $1,859 | |
| Gas utility | 250 | | | 300 | | | 351 | |
| Steam and other | 49 | | | 49 | | | 46 | |
| Total revenues | 2,046 | | | 2,110 | | | 2,256 | |
| Operating expenses: | | | | | |
| Electric production fuel and purchased power | 269 | | | 282 | | | 383 | |
| Electric transmission service | 417 | | | 420 | | | 407 | |
| Cost of gas sold | 123 | | | 166 | | | 206 | |
| Other operation and maintenance: | | | | | |
| Asset valuation charge for IPL’s Lansing Generating Station | 60 | | | — | | | — | |
| Other | 358 | | | 353 | | | 369 | |
| Depreciation and amortization | 404 | | | 388 | | | 381 | |
| Taxes other than income taxes | 60 | | | 57 | | | 57 | |
| Total operating expenses | 1,691 | | | 1,666 | | | 1,803 | |
| Operating income | 355 | | | 444 | | | 453 | |
| Other (income) and deductions: | | | | | |
| Interest expense | 177 | | | 155 | | | 148 | |
| Allowance for funds used during construction | (43) | | | (21) | | | (11) | |
| Other | (12) | | | 2 | | | 6 | |
| Total other (income) and deductions | 122 | | | 136 | | | 143 | |
| Income before income taxes | 233 | | | 308 | | | 310 | |
| Income tax benefit | (129) | | | (58) | | | (50) | |
| Net income | $362 | | | $366 | | | $360 | |
| | | | | |
| | | | | |
Earnings per share data is not disclosed given Alliant Energy Corporation is the sole shareowner of all shares of IPL’s common stock outstanding during the periods presented.
Refer to accompanying Combined Notes to Consolidated Financial Statements.
INTERSTATE POWER AND LIGHT COMPANY
CONSOLIDATED BALANCE SHEETS
| | | | | | | | | | | |
| December 31, |
| 2024 | | 2023 |
| (in millions, except per
share and share amounts) |
| ASSETS | | | |
| Current assets: | | | |
| Cash and cash equivalents | $29 | | | $53 | |
| Accounts receivable, less allowance for expected credit losses | 192 | | | 242 | |
| | | |
| Production fuel, at weighted average cost | 30 | | | 27 | |
| Gas stored underground, at weighted average cost | 25 | | | 35 | |
| Materials and supplies, at weighted average cost | 113 | | | 122 | |
| Regulatory assets | 77 | | | 93 | |
| Other | 43 | | | 51 | |
| Total current assets | 509 | | | 623 | |
| Property, plant and equipment, net | 9,336 | | | 8,298 | |
| Other assets: | | | |
| Regulatory assets | 1,509 | | | 1,484 | |
| Deferred charges and other | 53 | | | 84 | |
| Total other assets | 1,562 | | | 1,568 | |
| Total assets | $11,407 | | | $10,489 | |
| | | | | | | | | | | |
| LIABILITIES AND EQUITY | | | |
| Current liabilities: | | | |
| Current maturities of long-term debt | $300 | | | $500 | |
| Commercial paper | 50 | | | — | |
| Accounts payable | 263 | | | 262 | |
| Accounts payable to associated companies | 47 | | | 51 | |
| Accrued taxes | 77 | | | 50 | |
| Accrued interest | 48 | | | 40 | |
| Regulatory liabilities | 54 | | | 72 | |
| Other | 89 | | | 50 | |
| Total current liabilities | 928 | | | 1,025 | |
| Long-term debt, net (excluding current portion) | 3,790 | | | 3,445 | |
| Other liabilities: | | | |
| Deferred tax liabilities | 1,179 | | | 1,091 | |
| Regulatory liabilities | 492 | | | 572 | |
| Pension and other benefit obligations | 46 | | | 51 | |
| Other | 511 | | | 331 | |
| Total other liabilities | 2,228 | | | 2,045 | |
Commitments and contingencies (Note 16) | | | |
| Equity: | | | |
| Interstate Power and Light Company common equity: | | | |
| Common stock - $2.50 par value - 24,000,000 shares authorized; 13,370,788 shares outstanding | 33 | | | 33 | |
| Additional paid-in capital | 3,212 | | | 2,887 | |
| Retained earnings | 1,216 | | | 1,054 | |
| Total Interstate Power and Light Company common equity | 4,461 | | | 3,974 | |
| | | |
| | | |
| Total liabilities and equity | $11,407 | | | $10,489 | |
Refer to accompanying Combined Notes to Consolidated Financial Statements.
INTERSTATE POWER AND LIGHT COMPANY
CONSOLIDATED STATEMENTS OF CASH FLOWS
| | | | | | | | | | | | | | | | | |
| Year Ended December 31, |
| 2024 | | 2023 | | 2022 |
| (in millions) |
| Cash flows from operating activities: | | | | | |
| Net income | $362 | | | $366 | | | $360 | |
| Adjustments to reconcile net income to net cash flows from operating activities: | | | | | |
| Depreciation and amortization | 404 | | | 388 | | | 381 | |
| Deferred tax expense (benefit) and tax credits | (91) | | | 8 | | | (13) | |
| | | | | |
| Asset valuation charge for IPL’s Lansing Generating Station | 60 | | | — | | | — | |
| Other | (12) | | | (10) | | | (8) | |
| Other changes in assets and liabilities: | | | | | |
| Accounts receivable | (544) | | | (437) | | | (611) | |
| | | | | |
| Regulatory assets | (2) | | | 58 | | | 56 | |
| Derivative assets | 6 | | | 84 | | | (54) | |
| | | | | |
| Accounts payable | 31 | | | (68) | | | 65 | |
| Regulatory liabilities | (61) | | | (92) | | | 53 | |
| | | | | |
| Deferred income taxes (a) | 178 | | | 36 | | | (24) | |
| Pension and other benefit obligations | (5) | | | (11) | | | (65) | |
| | | | | |
| Other | 31 | | | (61) | | | (57) | |
| Net cash flows from operating activities | 357 | | | 261 | | | 83 | |
| Cash flows from (used for) investing activities: | | | | | |
| Construction and acquisition expenditures | (1,224) | | | (712) | | | (372) | |
| Cash receipts on sold receivables | 593 | | | 453 | | | 598 | |
| Other | (53) | | | (67) | | | (11) | |
| Net cash flows from (used for) investing activities | (684) | | | (326) | | | 215 | |
| Cash flows from (used for) financing activities: | | | | | |
| Common stock dividends | (200) | | | (280) | | | (321) | |
| Capital contributions from parent | 325 | | | 80 | | | — | |
| | | | | |
| Proceeds from issuance of long-term debt | 643 | | | 296 | | | — | |
| Payments to retire long-term debt | (500) | | | — | | | — | |
| Net change in commercial paper | 50 | | | — | | | — | |
| Other | (15) | | | 7 | | | 4 | |
| Net cash flows from (used for) financing activities | 303 | | | 103 | | | (317) | |
| Net increase (decrease) in cash, cash equivalents and restricted cash | (24) | | | 38 | | | (19) | |
| Cash, cash equivalents and restricted cash at beginning of period | 53 | | | 15 | | | 34 | |
| Cash, cash equivalents and restricted cash at end of period | $29 | | | $53 | | | $15 | |
| Supplemental cash flows information: | | | | | |
| Cash (paid) received during the period for: | | | | | |
| Interest | ($169) | | | ($150) | | | ($148) | |
| Income taxes, net (a) | $175 | | | $117 | | | $36 | |
| Significant non-cash investing and financing activities: | | | | | |
| Accrued capital expenditures | $128 | | | $140 | | | $56 | |
| Beneficial interest obtained in exchange for securitized accounts receivable | $163 | | | $216 | | | $185 | |
(a) 2024 and 2023 includes $117 million and $76 million, respectively, of proceeds from renewable tax credits transferred to other corporate taxpayers
Refer to accompanying Combined Notes to Consolidated Financial Statements.
INTERSTATE POWER AND LIGHT COMPANY
CONSOLIDATED STATEMENTS OF EQUITY
| | | | | | | | | | | | | | | | | | | | | | | | | |
| | | | | |
| | | Additional | | | | | | Total |
| Common | | Paid-In | | Retained | | | | Common |
| Stock | | Capital | | Earnings | | | | Equity |
| (in millions) |
| 2022: | | | | | | | | | |
| Beginning balance | $33 | | $2,807 | | $929 | | | | $3,769 |
| Net income | | | | | 360 | | | | 360 |
| Common stock dividends | | | | | (321) | | | | (321) |
| | | | | | | | | |
| | | | | | | | | |
| | | | | | | | | |
| Ending balance | 33 | | 2,807 | | 968 | | | | 3,808 |
| 2023: | | | | | | | | | |
| Net income | | | | | 366 | | | | 366 |
| Common stock dividends | | | | | (280) | | | | (280) |
| Capital contributions from parent | | | 80 | | | | | | 80 |
| | | | | | | | | |
| | | | | | | | | |
| Ending balance | 33 | | 2,887 | | 1,054 | | | | 3,974 |
| 2024: | | | | | | | | | |
| Net income | | | | | 362 | | | | 362 |
| Common stock dividends | | | | | (200) | | | | (200) |
| Capital contributions from parent | | | 325 | | | | | | 325 |
| | | | | | | | | |
| Ending balance | $33 | | $3,212 | | $1,216 | | | | $4,461 |
Refer to accompanying Combined Notes to Consolidated Financial Statements.
REPORT OF INDEPENDENT REGISTERED PUBLIC ACCOUNTING FIRM
To the Shareowner and the Board of Directors of Wisconsin Power and Light Company:
Opinion on the Financial Statements
We have audited the accompanying consolidated balance sheets of Wisconsin Power and Light Company and subsidiaries (the “Company”) as of December 31, 2024 and 2023, the related consolidated statements of income, equity, and cash flows, for each of the three years in the period ended December 31, 2024, and the related notes and the schedule listed in the Index at Item 15 (collectively referred to as the “financial statements”). In our opinion, the financial statements present fairly, in all material respects, the financial position of the Company as of December 31, 2024 and 2023, and the results of its operations and its cash flows for each of the three years in the period ended December 31, 2024, in conformity with accounting principles generally accepted in the United States of America.
Basis for Opinion
These financial statements are the responsibility of the Company’s management. Our responsibility is to express an opinion on the Company’s financial statements based on our audits. We are a public accounting firm registered with the Public Company Accounting Oversight Board (United States) (PCAOB) and are required to be independent with respect to the Company in accordance with the U.S. federal securities laws and the applicable rules and regulations of the Securities and Exchange Commission and the PCAOB.
We conducted our audits in accordance with the standards of the PCAOB. Those standards require that we plan and perform the audit to obtain reasonable assurance about whether the financial statements are free of material misstatement, whether due to error or fraud. The Company is not required to have, nor were we engaged to perform, an audit of its internal control over financial reporting. As part of our audits, we are required to obtain an understanding of internal control over financial reporting but not for the purpose of expressing an opinion on the effectiveness of the Company’s internal control over financial reporting. Accordingly, we express no such opinion.
Our audits included performing procedures to assess the risks of material misstatement of the financial statements, whether due to error or fraud, and performing procedures that respond to those risks. Such procedures included examining, on a test basis, evidence regarding the amounts and disclosures in the financial statements. Our audits also included evaluating the accounting principles used and significant estimates made by management, as well as evaluating the overall presentation of the financial statements. We believe that our audits provide a reasonable basis for our opinion.
Critical Audit Matter
The critical audit matter communicated below is a matter arising from the current-period audit of the financial statements that was communicated or required to be communicated to the audit committee and that (1) relates to accounts or disclosures that are material to the financial statements and (2) involved our especially challenging, subjective, or complex judgments. The communication of critical audit matters does not alter in any way our opinion on the financial statements, taken as a whole, and we are not, by communicating the critical audit matter below, providing a separate opinion on the critical audit matter or on the accounts or disclosures to which it relates.
Regulatory Accounting - Impact of rate regulation on the financial statements - Refer to Notes 1, 2, and 3 to the financial statements
Critical Audit Matter Description
Wisconsin Power and Light Company is subject to rate regulation by regulatory agencies. Management has determined it meets the requirements under accounting principles generally accepted in the United States of America to prepare its financial statements applying the Regulated Operations Topic 980 of the Financial Accounting Standards Board’s Accounting Standards Codification.
The Company’s rates are subject to regulatory rate-setting processes and periodic earnings oversight. The regulation of rates is premised on the full recovery of prudently incurred costs and a reasonable rate of return on invested capital. Regulatory assets generally represent incurred costs that have been deferred and are probable of recovery in future customer rates. Regulatory liabilities generally represent obligations to make refunds to customers or amounts collected in rates for which the costs have not yet been incurred. The Company’s regulatory assets and regulatory liabilities are recognized in accordance with the rulings of the regulatory agencies. A change in these rulings may result in a material impact on results of operations and the amount of certain assets and liabilities in the financial statements. Future regulatory rulings may impact the carrying value and accounting treatment of certain regulatory assets and regulatory liabilities.
We identified the impact of rate regulation as a critical audit matter due to the significant judgments made by management to support its assertions about certain impacted account balances and disclosures and the high degree of subjectivity involved in assessing the impact of relevant future regulatory orders on the financial statements. Management judgments include assessing the likelihood of the recovery of incurred costs and refund of obligations to customers in future rates. Given that management’s accounting judgments are based on assumptions about the outcome of future decisions by the regulatory agencies, auditing these judgments required specialized knowledge of accounting for rate regulation and the rate-setting process due to its inherent complexities.
How the Critical Audit Matter Was Addressed in the Audit
Our audit procedures related to the regulatory filings by management and the uncertainty of future decisions by the regulatory agencies included the following, among others:
•We tested the effectiveness of management’s controls over the evaluation of certain regulatory assets and regulatory liabilities, including the monitoring and evaluation of regulatory developments that may affect the likelihood of recovering costs in future rates or of a future reduction in rates.
•We inspected and evaluated the Company’s analysis supporting the probability of recovery for certain regulatory assets or refund to customers or future reduction in customer rates for regulatory liabilities not yet addressed in a regulatory order to assess management’s assertions.
•We inquired of management regarding current events impacting the Company and inspected minutes of the board of directors and other committees of the Company and evaluated whether matters were identified that may have an impact on certain recorded regulatory assets and liabilities.
•We read relevant regulatory orders, interpretations, filings made by the Company or its stakeholders, and other publicly available information issued by the regulatory agencies that pertain to the Company. We evaluated the external information and assessed whether there are matters in such information that would be contradictory to management’s assertion of probability of recovery of certain regulatory assets or refund of regulatory liabilities, or impact other recorded balances.
•We inspected minutes of the board of directors and other committees of the Company, regulatory orders and other filings with the regulatory agencies to identify evidence that may contradict management’s assertion regarding probability of abandonment or that may have an impact on the recorded balances.
•We evaluated the Company’s disclosures related to the impacts of rate regulation and regulatory developments, including disclosures related to certain regulatory balances recorded.
/s/ Deloitte & Touche LLP
Milwaukee, Wisconsin
February 21, 2025
We have served as the Company’s auditor since 2002.
WISCONSIN POWER AND LIGHT COMPANY
CONSOLIDATED STATEMENTS OF INCOME
| | | | | | | | | | | | | | | | | |
| Year Ended December 31, |
| 2024 | | 2023 | | 2022 |
| (in millions) |
| Revenues: | | | | | |
| Electric utility | $1,625 | | | $1,584 | | | $1,562 | |
| Gas utility | 215 | | | 240 | | | 291 | |
| Other | 5 | | | 3 | | | 3 | |
| Total revenues | 1,845 | | | 1,827 | | | 1,856 | |
| Operating expenses: | | | | | |
| Electric production fuel and purchased power | 359 | | | 455 | | | 447 | |
| Electric transmission service | 196 | | | 163 | | | 166 | |
| Cost of gas sold | 101 | | | 134 | | | 183 | |
| Other operation and maintenance | 279 | | | 271 | | | 278 | |
| Depreciation and amortization | 357 | | | 280 | | | 283 | |
| Taxes other than income taxes | 56 | | | 52 | | | 47 | |
| Total operating expenses | 1,348 | | | 1,355 | | | 1,404 | |
| Operating income | 497 | | | 472 | | | 452 | |
| Other (income) and deductions: | | | | | |
| Interest expense | 165 | | | 149 | | | 121 | |
| | | | | |
| Allowance for funds used during construction | (32) | | | (79) | | | (49) | |
| Other | 8 | | | (3) | | | (1) | |
| Total other (income) and deductions | 141 | | | 67 | | | 71 | |
| Income before income taxes | 356 | | | 405 | | | 381 | |
| Income taxes | 11 | | | 60 | | | 66 | |
| Net income | $345 | | | $345 | | | $315 | |
| | | | | |
| | | | | |
Earnings per share data is not disclosed given Alliant Energy Corporation is the sole shareowner of all shares of WPL’s common stock outstanding during the periods presented.
Refer to accompanying Combined Notes to Consolidated Financial Statements.
WISCONSIN POWER AND LIGHT COMPANY
CONSOLIDATED BALANCE SHEETS
| | | | | | | | | | | |
| December 31, |
| 2024 | | 2023 |
| (in millions, except per
share and share amounts) |
| ASSETS | | | |
| Current assets: | | | |
| Cash and cash equivalents | $51 | | | $7 | |
| Accounts receivable, less allowance for expected credit losses | 220 | | | 219 | |
| Production fuel, at weighted average cost | 24 | | | 35 | |
| Gas stored underground, at weighted average cost | 30 | | | 44 | |
| Materials and supplies, at weighted average cost | 69 | | | 77 | |
| Regulatory assets | 133 | | | 139 | |
| Prepaid gross receipts tax | 51 | | | 49 | |
| Other | 57 | | | 43 | |
| Total current assets | 635 | | | 613 | |
| Property, plant and equipment, net | 8,861 | | | 8,415 | |
| Other assets: | | | |
| Regulatory assets | 555 | | | 545 | |
| Deferred charges and other | 55 | | | 61 | |
| Total other assets | 610 | | | 606 | |
| Total assets | $10,106 | | | $9,634 | |
| | | | | | | | | | | |
| LIABILITIES AND EQUITY | | | |
| Current liabilities: | | | |
| | | |
| Commercial paper | $183 | | | $318 | |
| Accounts payable | 209 | | | 293 | |
| | | |
| Accrued interest | 44 | | | 40 | |
| Regulatory liabilities | 15 | | | 35 | |
| Other | 94 | | | 89 | |
| Total current liabilities | 545 | | | 775 | |
| Long-term debt, net | 3,370 | | | 3,070 | |
| Other liabilities: | | | |
| Deferred tax liabilities | 865 | | | 827 | |
| Regulatory liabilities | 467 | | | 451 | |
| | | |
| Pension and other benefit obligations | 102 | | | 121 | |
| Other | 656 | | | 493 | |
| Total other liabilities | 2,090 | | | 1,892 | |
Commitments and contingencies (Note 16) | | | |
| Equity: | | | |
| Wisconsin Power and Light Company common equity: | | | |
| Common stock - $5 par value - 18,000,000 shares authorized; 13,236,601 shares outstanding | 66 | | | 66 | |
| Additional paid-in capital | 2,533 | | | 2,478 | |
| Retained earnings | 1,502 | | | 1,353 | |
| Total Wisconsin Power and Light Company common equity | 4,101 | | | 3,897 | |
| Total liabilities and equity | $10,106 | | | $9,634 | |
Refer to accompanying Combined Notes to Consolidated Financial Statements.
WISCONSIN POWER AND LIGHT COMPANY
CONSOLIDATED STATEMENTS OF CASH FLOWS
| | | | | | | | | | | | | | | | | |
| Year Ended December 31, |
| 2024 | | 2023 | | 2022 |
| (in millions) |
| Cash flows from operating activities: | | | | | |
| Net income | $345 | | | $345 | | | $315 | |
| Adjustments to reconcile net income to net cash flows from operating activities: | | | | | |
| Depreciation and amortization | 357 | | | 280 | | | 283 | |
| | | | | |
| | | | | |
| | | | | |
| | | | | |
| Equity component of allowance for funds used during construction | (23) | | | (59) | | | (36) | |
| Other | (28) | | | 12 | | | 25 | |
| Other changes in assets and liabilities: | | | | | |
| | | | | |
| Regulatory assets | 72 | | | (34) | | | (163) | |
| Derivative assets | 7 | | | 65 | | | (7) | |
| Accounts payable | 50 | | | (57) | | | 22 | |
| Regulatory liabilities | (41) | | | (57) | | | (31) | |
| Deferred income taxes (a) | 84 | | | 50 | | | 32 | |
| | | | | |
| Other | (62) | | | 33 | | | (141) | |
| Net cash flows from operating activities | 761 | | | 578 | | | 299 | |
| Cash flows used for investing activities: | | | | | |
| Construction and acquisition expenditures | (828) | | | (1,019) | | | (1,020) | |
| Proceeds from sales of partial ownership interests in West Riverside | 123 | | | 120 | | | — | |
| Other | (19) | | | (47) | | | (13) | |
| Net cash flows used for investing activities | (724) | | | (946) | | | (1,033) | |
| Cash flows from financing activities: | | | | | |
| Common stock dividends | (196) | | | (184) | | | (176) | |
| Capital contributions from parent | 55 | | | 245 | | | 530 | |
| Proceeds from issuance of long-term debt | 297 | | | 297 | | | 588 | |
| Payments to retire long-term debt | — | | | — | | | (250) | |
| Net change in commercial paper | (135) | | | 28 | | | 54 | |
| | | | | |
| | | | | |
| Other | (14) | | | (16) | | | (9) | |
| Net cash flows from financing activities | 7 | | | 370 | | | 737 | |
| Net increase in cash, cash equivalents and restricted cash | 44 | | | 2 | | | 3 | |
| Cash, cash equivalents and restricted cash at beginning of period | 7 | | | 5 | | | 2 | |
| Cash, cash equivalents and restricted cash at end of period | $51 | | | $7 | | | $5 | |
| Supplemental cash flows information: | | | | | |
| Cash (paid) received during the period for: | | | | | |
| Interest | ($163) | | | ($146) | | | ($111) | |
| Income taxes, net (a) | $14 | | | ($50) | | | ($56) | |
| Significant non-cash investing and financing activities: | | | | | |
| Accrued capital expenditures | $87 | | | $217 | | | $319 | |
(a) 2024 and 2023 includes $99 million and $22 million, respectively, of proceeds from renewable tax credits transferred to other corporate taxpayers
Refer to accompanying Combined Notes to Consolidated Financial Statements.
WISCONSIN POWER AND LIGHT COMPANY
CONSOLIDATED STATEMENTS OF EQUITY
| | | | | | | | | | | | | | | | | | | | | | | | | |
| | | | | |
| | | Additional | | | | | | Total |
| Common | | Paid-In | | Retained | | | | Common |
| Stock | | Capital | | Earnings | | | | Equity |
| (in millions) |
| 2022: | | | | | | | | | |
| Beginning balance | $66 | | $1,704 | | $1,053 | | | | $2,823 |
| Net income | | | | | 315 | | | | 315 |
| Common stock dividends | | | | | (176) | | | | (176) |
| Capital contributions from parent | | | 530 | | | | | | 530 |
| Other | | | (1) | | | | | | (1) |
| Ending balance | 66 | | 2,233 | | 1,192 | | | | 3,491 |
| 2023: | | | | | | | | | |
| Net income | | | | | 345 | | | | 345 |
| Common stock dividends | | | | | (184) | | | | (184) |
| Capital contributions from parent | | | 245 | | | | | | 245 |
| | | | | | | | | |
| | | | | | | | | |
| | | | | | | | | |
| Ending balance | 66 | | 2,478 | | 1,353 | | | | 3,897 |
| 2024: | | | | | | | | | |
| Net income | | | | | 345 | | | | 345 |
| Common stock dividends | | | | | (196) | | | | (196) |
| Capital contributions from parent | | | 55 | | | | | | 55 |
| | | | | | | | | |
| | | | | | | | | |
| | | | | | | | | |
| Ending balance | $66 | | $2,533 | | $1,502 | | | | $4,101 |
Refer to accompanying Combined Notes to Consolidated Financial Statements.
ALLIANT ENERGY CORPORATION
INTERSTATE POWER AND LIGHT COMPANY
WISCONSIN POWER AND LIGHT COMPANY
COMBINED NOTES TO CONSOLIDATED FINANCIAL STATEMENTS
NOTE 1. SUMMARY OF SIGNIFICANT ACCOUNTING POLICIES
NOTE 1(a) General -
Description of Business - Alliant Energy’s financial statements include the accounts of Alliant Energy and its consolidated subsidiaries. Alliant Energy is a Midwest U.S. energy holding company, whose primary wholly-owned subsidiaries are IPL, WPL, AEF and Corporate Services.
IPL’s financial statements include the accounts of IPL and its consolidated subsidiaries, including IPL SPE LLC, which is used for IPL’s sales of accounts receivable program. IPL is a direct subsidiary of Alliant Energy and is a public utility engaged principally in the generation and distribution of electricity and the distribution and transportation of natural gas to retail customers in select markets in Iowa. IPL also sells electricity to wholesale customers in Minnesota, Illinois and Iowa, and is engaged in the generation and distribution of steam for two customers in Cedar Rapids, Iowa. In July 2025, IPL’s wholesale power agreement with Southern Minnesota Energy Cooperative will expire.
WPL’s financial statements include the accounts of WPL and its consolidated subsidiaries. WPL is a direct subsidiary of Alliant Energy and is a public utility engaged principally in the generation and distribution of electricity and the distribution and transportation of natural gas to retail customers in select markets in Wisconsin. WPL also sells electricity to wholesale customers in Wisconsin.
AEF is comprised of Travero, ATI, corporate venture investments, a non-utility wind farm, the Sheboygan Falls Energy Facility and other non-utility holdings. Travero includes a short-line rail freight service in Iowa; a Mississippi River barge, rail and truck freight terminal in Illinois; freight brokerage services; wind turbine blade recycling services; and a rail-served warehouse in Iowa. ATI, a wholly-owned subsidiary of AEF, holds all of Alliant Energy’s interest in ATC Holdings. Corporate venture investments includes various minority ownership interests in regional and national venture funds, including a global coalition of energy companies working together to help identify and research innovative technologies and business models within the emerging energy economy. The non-utility wind farm includes a 50% cash equity ownership interest in a 225 MW wind farm located in Oklahoma. The Sheboygan Falls Energy Facility is a 347 MW, simple-cycle, natural gas-fired EGU near Sheboygan Falls, Wisconsin, which is currently leased to WPL through 2044.
Corporate Services is the subsidiary formed to provide administrative services to Alliant Energy and its subsidiaries.
Basis of Presentation - The financial statements reflect investments in controlled subsidiaries on a consolidated basis and Alliant Energy’s, IPL’s and WPL’s proportionate shares of jointly-owned utility EGUs. Unconsolidated investments that Alliant Energy and WPL do not control are accounted for under the equity method of accounting. Under the equity method of accounting, Alliant Energy and WPL initially record the investment at cost, and adjust the carrying amount of the investment to recognize their respective share of the earnings or losses of the investee. Dividends received from an investee reduce the carrying amount of the equity investment. Investments that do not meet the criteria for consolidation or the equity method of accounting are accounted for under the cost method.
All intercompany balances and transactions, other than certain transactions affecting the rate-making process at IPL and WPL, have been eliminated from the financial statements. Such transactions not eliminated include costs that are recoverable from customers through rate-making processes. The financial statements are prepared in conformity with GAAP, which give recognition to the rate-making practices of FERC and state commissions having regulatory jurisdiction.
Certain prior period amounts in the Financial Statements and Notes have been reclassified to conform to the current period presentation for comparative purposes.
Use of Estimates - The preparation of the financial statements requires management to make estimates and assumptions that affect: (a) the reported amounts of assets and liabilities and the disclosure of contingent assets and liabilities at the date of the financial statements; and (b) the reported amounts of revenues and expenses during the reporting period. Actual results could differ from those estimates.
NOTE 1(b) Regulatory Assets and Regulatory Liabilities - Alliant Energy, IPL and WPL are subject to regulation by FERC and various state regulatory commissions. As a result, Alliant Energy, IPL and WPL are subject to GAAP provisions for regulated operations, which provide that rate-regulated public utilities record certain costs and credits allowed in the rate-making process in different periods than for non-utility entities. Regulatory assets generally represent incurred costs that have been deferred as such costs are probable of recovery in future customer rates. Regulatory liabilities generally represent obligations to make refunds to customers or amounts collected in rates for which the related costs have not yet been incurred. Amounts recorded as regulatory assets or regulatory liabilities are generally recognized in the income statements at the time they are reflected in rates.
NOTE 1(c) Income Taxes - The liability method of accounting is followed for deferred taxes, which requires the establishment of deferred tax assets and liabilities, as appropriate, for temporary differences between the tax basis of assets and liabilities and the amounts reported in the financial statements. Deferred taxes are recorded using currently enacted tax rates and estimates of state apportionment. Changes in deferred tax assets and liabilities associated with certain property-related differences at IPL are accounted for differently than other subsidiaries of Alliant Energy due to rate-making practices in Iowa. Rate-making practices in Iowa do not allow the impact of certain deferred tax expenses (benefits) to be included in the determination of retail rates. Based on these rate-making practices, deferred tax expense (benefit) related to these property-related differences at IPL is not recorded in the income statement but instead recorded to regulatory assets or regulatory liabilities until these temporary differences reverse. In Wisconsin, the PSCW allows rate recovery of deferred tax expense on all temporary differences.
The flow-through method of accounting is used for investment tax credits. Certain federal investment tax credits related to utility property, plant and equipment are subject to statutory tax normalization rules limiting how they may be treated in rate-making. As appropriate to reflect the rate-making practices, investment tax credits are deferred and amortized over the book depreciable lives of the related property or other period prescribed by rate regulation.
Alliant Energy files a consolidated federal income tax return and a combined return in Wisconsin, which include Alliant Energy and its subsidiaries. Alliant Energy subsidiaries with a presence in Iowa file as part of a consolidated return in Iowa.
Alliant Energy allocates consolidated income tax expense to its subsidiaries that are members of the group that file a consolidated or combined income tax return. IPL and WPL use the separate return approach for calculating their income tax provisions and related deferred tax assets and liabilities. IPL and WPL are assumed to file separate tax returns with the federal and state taxing authorities, except that net operating losses (and other current or deferred tax attributes) are characterized as realized (or realizable) by IPL and WPL when those tax attributes are realized (or realizable) by the consolidated tax return group of Alliant Energy (even if IPL and WPL would not otherwise have realized the attributes on a stand-alone basis).
The Inflation Reduction Act of 2022 provides the ability to transfer renewable tax credits to other corporate taxpayers. In 2023 and 2024, IPL and WPL entered into agreements to transfer renewable tax credits from certain wind, solar and energy storage facilities to other corporate taxpayers in exchange for cash. Alliant Energy, IPL and WPL have elected to record transfers of renewable tax credits as part of income taxes, and cash received from the transfer of renewable tax credits is recorded in cash flows from operating activities. For renewable tax credits subject to future transfer, a valuation allowance is recorded for the difference between the tax value of the credits and the expected sales price. Renewable tax credits and any related valuation allowances are derecognized when control of the tax credits is transferred to other corporate taxpayers. Beginning October 1, 2024, IPL’s renewable energy rider was discontinued, and production tax credits, excluding production tax credits from the refurbishment of existing wind farms, are credited to IPL’s retail electric customers through its fuel-related cost recovery mechanism. Investment tax credits resulting from IPL’s renewable generation and energy storage projects that are not yet included in base rates may be utilized to offset any revenue deficiency on an annual basis up to IPL’s return on common equity threshold; any remaining investment tax credits, net of the cost of transferability, that are not used to offset any revenue deficiency, will be deferred by IPL and carried forward to offset any revenue deficiency in future years. At WPL, pursuant to escrow treatment approved by the PSCW, the difference between actual solar and energy storage tax credits and the amount of renewable tax credits collected from customers as electric revenues is recognized in “Income taxes” in Alliant Energy’s and WPL’s income statements. An offsetting amount is recorded in regulatory assets or regulatory liabilities on Alliant Energy’s and WPL’s balance sheets until reflected in future billings to customers. Refer to Notes 11 and 16(d) for further discussion of the transfer of renewable tax credits to other corporate taxpayers, including related valuation allowances and indemnification requirements, respectively.
NOTE 1(d) Cash, Cash Equivalents and Restricted Cash - Cash and cash equivalents include short-term liquid investments that have original maturities of less than 90 days. At December 31, 2024, Alliant Energy’s, IPL’s and WPL’s cash and cash equivalents included $52 million, $9 million, and $43 million, respectively, of money market fund investments, with weighted average interest rates of 4%. At December 31, 2024 and 2023, Alliant Energy’s restricted cash was not material.
NOTE 1(e) Property, Plant and Equipment -
Utility Plant -
General - Utility plant is recorded at the original cost of acquisition or construction, which includes material, labor, contractor services, AFUDC and allocable overheads, such as supervision, engineering, certain administrative costs directly related to construction, benefits, certain taxes and transportation. Repairs, replacements and renewals of items of property determined to be less than a unit of property or that do not increase the property’s life or functionality are charged to maintenance expense. Property, plant and equipment that is probable of being retired early is classified as plant anticipated to be retired early. Generally, ordinary retirements of utility plant and salvage value are netted and charged to accumulated depreciation upon removal from utility plant accounts and no gain or loss is recognized consistent with rate-making principles. However, if regulators have approved recovery of the remaining net book value of property, plant and equipment that is retired early, or such approval by regulators is probable, the remaining net book value is reclassified from property, plant and equipment to regulatory assets upon retirement.
Depreciation - IPL and WPL use a combination of remaining life and straight-line depreciation methods as approved by their respective regulatory commissions. The composite or group method of depreciation is used, in which a single depreciation rate is applied to the gross investment in a particular class of property. This method pools similar assets and then depreciates each group as a whole. Periodic depreciation studies are performed to determine the appropriate group lives, net salvage, estimated cost of removal and group depreciation rates. These depreciation studies are subject to review and approval by IPL’s and WPL’s respective regulatory commissions. Depreciation expense is included within the recoverable cost of service component of rates collected from customers. The average rates of depreciation for electric, gas and other properties, consistent with current rate-making practices, were as follows:
| | | | | | | | | | | | | | | | | | | | | | | | | | | | | | | | | | | |
| IPL | | WPL |
| 2024 | | 2023 | | 2022 | | 2024 | | 2023 | | 2022 |
| Electric - generation | 3.3% | | 3.3% | | 3.4% | | 3.4% | | 3.0% | | 3.4% |
| Electric - distribution | 2.8% | | 2.8% | | 2.8% | | 2.7% | | 2.7% | | 2.5% |
| Electric - other | 5.2% | | 5.6% | | 5.7% | | 6.1% | | 6.3% | | 6.8% |
| Gas | 3.3% | | 3.3% | | 3.3% | | 2.5% | | 2.5% | | 2.4% |
| Other | 4.6% | | 6.2% | | 6.1% | | 4.4% | | 4.6% | | 4.9% |
In October 2024, the IUC issued an order approving the implementation of updated depreciation rates for IPL effective October 1, 2024. IPL estimates the new average rates of depreciation for its electric generation and electric distribution properties will be approximately 3.8% and 3.0%, respectively, during 2025.
AFUDC - AFUDC represents costs to finance construction additions, including a return on equity component and cost of debt component as required by regulatory accounting. AFUDC for IPL’s construction projects is calculated in accordance with FERC guidelines. AFUDC for WPL’s retail and wholesale jurisdiction construction projects is calculated in accordance with PSCW and FERC guidelines, respectively. The AFUDC rates, computed in accordance with the prescribed regulatory formula, were as follows:
| | | | | | | | | | | | | | | | | |
| 2024 | | 2023 | | 2022 |
| IPL | 7.0% | | 7.0% | | 7.0% |
| | | | | |
| WPL (retail jurisdiction) | 7.4% | | 7.4% | | 7.0% |
| WPL (wholesale jurisdiction) | 7.1% | | 7.1% | | 6.2% |
In accordance with their respective regulatory commission decisions, IPL applies its AFUDC rates to 100% of applicable CWIP balances, and WPL generally applies its AFUDC rates to 50% of applicable CWIP balances and the remaining 50% of applicable CWIP balances earns a return on such balances as part of its rate base. WPL may be authorized to apply its AFUDC rates to 100% of the retail portion of the CWIP balances for construction projects requiring a CA or CPCN that were approved by the PSCW after its then most recent rate order.
Non-utility and Other Property -
General - Non-utility property is recorded at the original cost of acquisition or construction, which includes material, labor and contractor services. Repairs, replacements and renewals of items of property determined to be less than a unit of property or that do not increase the property’s life or functionality are charged to maintenance expense. Upon retirement or sale of non-utility property, the original cost and related accumulated depreciation are removed from the accounts and any gain or loss is included in the income statements.
Costs related to software developed or obtained for internal use are capitalized and amortized on a straight-line basis over the estimated useful life of the related software. If software is retired prior to being fully amortized, the remaining book value is recorded as a loss in the income statements.
NOTE 1(f) Revenue Recognition -
Utility - Revenues from Alliant Energy’s utility business are primarily from electric and gas sales to customers. Utility revenues are recognized over time as services are rendered or commodities are delivered to customers, and include billed and unbilled components. The billed component is based on the reading of customers’ meters, which occurs on a systematic basis throughout each reporting period and represents the fair value of the services provided or commodities delivered. The unbilled component is recorded at the end of each reporting period based on estimated amounts of energy delivered to customers but not yet billed.
IPL and WPL accrue revenues from their wholesale customers to the extent that the actual net revenue requirements calculated in accordance with FERC-approved formula rates for the reporting period are higher or lower than the amounts billed to wholesale customers during such period. Regulatory assets or regulatory liabilities are recorded as the offset for these accrued revenues under formulaic rate-making programs. As of December 31, 2024, the related amounts accrued for IPL and WPL were not material.
IPL and WPL participate in bid/offer-based wholesale energy and ancillary services markets operated by MISO. The MISO transactions are grouped together, resulting in a net supply to or net purchase from MISO for each hour of each day. The net supply to MISO is recorded as bulk power sales in “Electric utility revenues” and the net purchase from MISO is recorded in “Electric production fuel and purchased power” in the income statements.
Non-utility - Revenues from Alliant Energy’s non-utility businesses are primarily from its Travero business and are recognized over time as services are rendered to customers.
Taxes Collected from Customers - Sales or various other taxes collected by certain of Alliant Energy’s subsidiaries on behalf of other agencies are recorded on a net basis and are not included in revenues.
Other - Alliant Energy, IPL and WPL do not disclose the value of unsatisfied performance obligations for: (i) contracts with an original expected length of one year or less; and (ii) contracts for which revenue is recognized at the amount to which they have the right to invoice for services performed.
NOTE 1(g) Utility Cost Recovery Mechanisms -
Electric Production Fuel and Purchased Power (Fuel-related Costs) - Fuel-related costs are incurred to generate and purchase electricity to meet the demand of IPL’s and WPL’s electric customers. These fuel-related costs include the cost of fossil fuels (primarily natural gas and coal) used to produce electricity at their EGUs, and electricity purchased from MISO wholesale energy markets and under PPAs. These fuel-related costs are recorded in “Electric production fuel and purchased power” in the income statements.
IPL Retail - The cost recovery mechanisms for IPL’s retail electric customers provide for monthly adjustments to their electric rates for changes in fuel-related costs. Changes in the under-/over-collection of these costs are recognized in “Electric production fuel and purchased power” in Alliant Energy’s and IPL’s income statements. The cumulative effects of the under-/over-collection of these costs are recorded in regulatory assets or regulatory liabilities on Alliant Energy’s and IPL’s balance sheets until they are reflected in future billings to customers.
WPL Retail - The cost recovery mechanism for WPL’s retail electric customers is based on forecasts of certain fuel-related costs expected to be incurred during forward-looking test periods and fuel monitoring ranges determined by the PSCW during each retail electric rate proceeding or in a separate fuel cost plan approval proceeding. If WPL’s actual fuel-related costs fall outside these fuel monitoring ranges, WPL is authorized to defer the incremental under-/over-collection of fuel-related costs that are outside the approved ranges. Deferral of under-collections are reduced to the extent actual return on common equity earned by WPL during the fuel cost plan year exceeds the most recently authorized return on common equity. Deferred amounts for fuel-related costs outside the approved fuel monitoring ranges are primarily recognized in “Electric production fuel and purchased power” in Alliant Energy’s and WPL’s income statements. The cumulative effects of these deferred amounts are recorded in regulatory assets or regulatory liabilities on Alliant Energy’s and WPL’s balance sheets until they are reflected in future billings to customers.
IPL and WPL Wholesale - The cost recovery mechanisms for IPL’s and WPL’s wholesale electric customers provide for subsequent adjustments to their electric rates for changes in fuel-related costs. Changes in the under-/over-collection of these costs are recognized in “Electric production fuel and purchased power” in the income statements. The cumulative effects of the under-/over-collection of these costs are recorded in regulatory assets or regulatory liabilities on the balance sheets until they are reflected in future billings to customers.
Electric Capacity - PPAs help meet the electricity demand of IPL’s and WPL’s customers. Certain PPAs include minimum payments for IPL’s and WPL’s rights to electric generating capacity, which are charged each period to “Electric production fuel and purchased power” in the income statements. Purchased electric capacity expenses are recovered from IPL’s and WPL’s retail electric customers through changes in base rates determined during periodic rate proceedings. Purchased electric capacity expenses are recovered from IPL’s and WPL’s wholesale electric customers through annual changes in base rates determined by a formula rate structure. Electric capacity revenues are refunded to IPL's retail electric customers through changes in base rates determined during periodic rate proceedings, and to IPL and WPL's wholesale electric customers through annual changes in base rates determined by a formula rate structure. Electric capacity revenues are refunded to WPL's retail electric customers through its fuel cost recovery mechanism.
Electric Transmission Service - Costs incurred for the transmission of electricity to meet the demands of IPL’s and WPL’s customers are charged to “Electric transmission service” in the income statements.
IPL Retail - Electric transmission service expense is recovered from IPL’s retail electric customers through a transmission cost rider. This cost recovery mechanism provides for periodic adjustments to electric rates charged to retail electric customers for changes in electric transmission service expense. Changes in the under-/over-collection of these costs are recognized in “Electric transmission service” in Alliant Energy’s and IPL’s income statements. The cumulative effects of the under-/over-collection of these costs are recorded in regulatory assets or regulatory liabilities on Alliant Energy’s and IPL’s balance sheets until they are reflected in future billings to customers.
WPL Retail - Electric transmission service expense is recovered from WPL’s retail electric customers through changes in base rates determined during periodic rate proceedings. Pursuant to escrow accounting treatment approved by the PSCW, the difference between actual electric transmission service expense incurred and the amount of electric transmission service costs collected from customers as electric revenues is recognized in “Electric transmission service” in Alliant Energy’s and WPL’s income statements. An offsetting amount is recorded in regulatory assets or regulatory liabilities on Alliant Energy’s and WPL’s balance sheets until reflected in future billings to customers.
IPL and WPL Wholesale - IPL and WPL arrange transmission service for the majority of their respective wholesale electric customers. Electric transmission service expense is allocated to and recovered from these customers based on a load ratio share computation.
Cost of Gas Sold - Costs are incurred for the purchase, transportation and storage of natural gas to serve IPL’s and WPL’s gas customers and the costs associated with the natural gas delivered to customers are charged to “Cost of gas sold” in the income statements. The tariffs for IPL’s and WPL’s retail gas customers provide for subsequent adjustments to their rates periodically for changes in the cost of gas sold. Changes in the under-/over-collection of these costs are also recognized in “Cost of gas sold” in the income statements. The cumulative effects of the under-/over-collection of these costs are recorded in regulatory assets or regulatory liabilities on the balance sheets until they are reflected in future billings to customers.
Energy Efficiency Costs - Costs incurred to fund energy efficiency programs and initiatives that help customers reduce their energy usage are charged to “Other operation and maintenance” in the income statements. Energy efficiency costs incurred by IPL are recovered from its retail electric and gas customers through energy efficiency and demand response cost recovery factor tariffs, which are revised annually and include a reconciliation to eliminate any under-/over-collection of energy efficiency costs from prior periods. Pursuant to escrow accounting treatment approved by the PSCW, the difference between actual energy efficiency costs incurred by WPL and the amount collected from its retail electric and gas customers is recovered through changes in base rates determined during periodic rate proceedings, and reconciliations eliminate any under-/over-collection of energy efficiency costs from prior periods. Changes in the under-/over-collection of energy efficiency costs for IPL and WPL are recognized in “Other operation and maintenance” in the income statements. The cumulative effects of the under-/over-collection of these costs for IPL and WPL are recorded in regulatory assets or regulatory liabilities on the balance sheets until they are reflected in future billings to customers.
Renewable Energy Rider - IPL utilized a renewable energy rider prior to its discontinuation on October 1, 2024, effective with the IUC’s order for IPL’s retail electric rate review for the October 2024 through September 2025 Test Period. Prior to October 1, 2024, IPL recovered a return of, as well as earned a return on, its wind generation placed in service in 2019 and 2020 from its retail electric customers through the renewable energy rider. Other applicable costs and tax benefits associated with this wind generation, excluding operation and maintenance expenses, were also included in the rider. This cost recovery mechanism provided for annual adjustments to electric rates charged to IPL’s retail electric customers for actual renewable energy costs and tax benefits. Changes in the under-/over-collection of these costs were recognized in “Electric utility revenue” in Alliant Energy’s and IPL’s income statements. The cumulative effects of the under-/over-collection of these costs for IPL are recorded in regulatory assets or regulatory liabilities on Alliant Energy’s and IPL’s balance sheets until they are reflected in future billings to customers. Refer to Note 1(c) for further discussion of the treatment of IPL’s renewable tax credits for rate-making purposes.
NOTE 1(h) Financial Instruments - Financial instruments are periodically used for risk management purposes to mitigate exposures to fluctuations in certain commodity prices, transmission congestion costs and interest rates. The fair value of those financial instruments that are determined to be derivatives are recorded as assets or liabilities on the balance sheets. Certain commodity purchase and sales contracts qualified for and were designated under the normal purchase and sale exception, and were accounted for on the accrual basis of accounting. Alliant Energy, IPL and WPL have elected to not net the fair value amounts of derivatives subject to a master netting arrangement by counterparty. Alliant Energy, IPL and WPL do not offset fair value amounts recognized for the right to reclaim cash collateral (receivable) or the obligation to return cash collateral (payable) against fair value amounts recognized for derivative instruments that are executed with the same counterparty under the same master netting arrangement. Refer to Note 2 for discussion of the recognition of regulatory assets and regulatory liabilities related to the unrealized losses and gains on commodity derivative instruments. Refer to Notes 14, 15 and 16(f) for further discussion of derivatives and related credit risk.
NOTE 1(i) Asset Impairments -
Property, Plant and Equipment of Regulated Operations - Property, plant and equipment of regulated operations are reviewed for possible impairment whenever events or changes in circumstances indicate all or a portion of the carrying value of the assets may be disallowed for rate-making purposes. If IPL or WPL are disallowed recovery of any portion of, or are only allowed a partial return on, the carrying value of their regulated property, plant and equipment that is under construction, has been recently completed or is probable of abandonment, or conclude it is probable recovery or a full return will be disallowed, then an impairment charge is recognized.
Property, Plant and Equipment of Non-utility Operations - Property, plant and equipment of non-utility operations are reviewed for possible impairment whenever events or changes in circumstances indicate the carrying value of the assets may not be recoverable. Impairment is indicated if the carrying value of an asset exceeds its undiscounted future cash flows. If an impairment is indicated, a charge is recognized equal to the amount the carrying value exceeds the asset’s fair value.
Unconsolidated Equity Investments - If events or circumstances indicate the carrying value of investments accounted for under the equity method of accounting exceeds fair value and the decline in value is other than temporary, potential impairment is assessed. If an impairment is indicated, a charge is recognized equal to the amount the carrying value exceeds the investment’s fair value.
NOTE 1(j) Asset Retirement Obligations - The fair value of a legal obligation associated with the retirement of an asset is recorded as a liability when an asset is placed in service, when a legal obligation is subsequently identified or when sufficient information becomes available to determine a reasonable estimate of the fair value of future retirement costs. When an ARO is recorded as a liability, an equivalent amount is added to the asset cost. The fair value of AROs at inception is determined using discounted cash flows analyses. The liability is accreted to its present value and the capitalized cost is depreciated over the useful life of the related asset. Accretion and depreciation expenses related to AROs for IPL’s and WPL’s regulated operations are recorded to regulatory assets on the balance sheets. Revisions in estimated cash flows for IPL’s and WPL’s regulated operations are recorded as an increase or decrease to the ARO liability, with an offset to the asset cost, unless the asset is already retired and then the offset is recorded to regulatory assets or regulatory liabilities on the balance sheets. Upon regulatory approval to recover IPL’s AROs expenditures, its regulatory assets are amortized to depreciation and amortization expenses in Alliant Energy’s and IPL’s income statements over the same time period the ARO expenditures are recovered from IPL’s customers. WPL’s regulatory assets related to AROs are recovered as a component of depreciation rates pursuant to PSCW and FERC orders. Upon settlement of the ARO liability, an entity settles the obligation for its recorded amount or incurs a gain or loss. Any gains or losses related to AROs for IPL’s and WPL’s regulated operations are recorded to regulatory liabilities or regulatory assets on the balance sheets. Refer to Note 13 for details of an ARO charge for steam assets at IPL in 2024.
NOTE 1(k) Debt Issuance and Retirement Costs - Debt issuance costs and debt premiums or discounts are presented on the balance sheets as a direct adjustment to the carrying amount of the related debt liability, and are deferred and amortized over the expected life of each debt issue, considering maturity dates and, if applicable, redemption rights held by others. Alliant Energy’s non-utility businesses and Corporate Services record to interest expense in the period of retirement any unamortized debt issuance costs and debt premiums or discounts on debt retired early.
NOTE 1(l) Current Expected Credit Losses Estimates - Current expected credit losses are estimated for trade and other receivables and credit exposures on guarantees of the performance by third parties. The current expected credit losses for short-term trade receivables are based on estimates of losses resulting from the inability of customers to make required payments. The methodology used to estimate losses is based on historical write-offs, regional economic conditions, significant events that could impact collectability, such as significant weather related matters and related regulatory actions, and actual and forecasted changes to the accounts receivable aging portfolio and write-offs. The current expected credit losses related to guarantees of the performance by third parties are estimated using both quantitative and qualitative information, which utilizes potential outcomes in a range of possible estimated amounts.
NOTE 1(m) Variable Interest Entities - An entity is considered a VIE if its equity investors do not have sufficient equity at risk for the entity to finance its activities without additional subordinated financial support from other parties, the entity is structured with disproportionate voting rights and substantially all of the entity’s activities are conducted on behalf of the investor with disproportionately fewer voting rights, or its equity investors lack any of the following characteristics: (1) power, through voting rights or similar rights, to direct the activities of the entity that most significantly impact the entity’s economic performance; (2) the obligation to absorb expected losses of the entity; or (3) the right to receive expected benefits of the entity. The primary beneficiary of a VIE is required to consolidate the VIE. The financial statements do not reflect any consolidation of VIEs.
NOTE 1(n) Leases - The determination of whether an arrangement qualifies as a lease occurs at the inception of the arrangement. Arrangements that qualify as leases are classified as either operating or finance. Operating and finance lease liabilities represent obligations to make payments arising from the lease. Operating and finance lease assets represent the right to use an underlying asset for the lease term and are recognized at the lease commencement date based on the present value of the lease payments over the lease term. Leases with initial terms less than 12 months are not recognized as leases. For operating leases, an incremental borrowing rate, as determined at the lease commencement date, is used to determine the present value of the lease payments. For finance leases, the rate implicit in the lease, if known, is used to determine the present value of the lease payments. If the rate implicit in the lease is not known, the incremental borrowing rate, as determined at the lease commencement date, is used to determine the present value of the lease payments. Lease terms include options to extend or terminate the lease when it is reasonably certain that the option will be exercised. Operating lease expense is recognized on a straight-line basis over the expected lease term. Finance lease expense is comprised of depreciation and amortization, and interest expenses. Finance lease assets related to leased land for solar generation are accounted for as operating leases for rate-making purposes. All other finance lease assets are depreciated on a straight-line basis over the shorter of the useful life of the underlying asset or the lease term.
NOTE 2. REGULATORY MATTERS
Regulatory Assets - Alliant Energy, IPL and WPL assess whether IPL’s and WPL’s regulatory assets are probable of future recovery by considering factors such as applicable regulations, recent orders by the applicable regulatory agencies, historical treatment of similar costs by the applicable regulatory agencies and regulatory environment changes. Based on these assessments, Alliant Energy, IPL and WPL believe the regulatory assets recognized as of December 31, 2024 are probable of future recovery. However, no assurance can be made that IPL and WPL will recover all of these regulatory assets in future rates. If future recovery of a regulatory asset ceases to be probable, the regulatory asset will be charged to expense. At December 31, regulatory assets were comprised of the following items (in millions):
| | | | | | | | | | | | | | | | | | | | | | | | | | | | | | | | | | | |
| Alliant Energy | | IPL | | WPL |
| 2024 | | 2023 | | 2024 | | 2023 | | 2024 | | 2023 |
| Tax-related | $989 | | | $934 | | | $870 | | | $831 | | | $119 | | | $103 | |
| AROs | 401 | | | 194 | | | 281 | | | 160 | | | 120 | | | 34 | |
| Pension and OPEB costs | 315 | | | 347 | | | 157 | | | 171 | | | 158 | | | 176 | |
| Assets retired early | 180 | | | 273 | | | 168 | | | 259 | | | 12 | | | 14 | |
| Commodity cost recovery | 68 | | | 120 | | | 2 | | | 12 | | | 66 | | | 108 | |
| Derivatives | 60 | | | 102 | | | 15 | | | 34 | | | 45 | | | 68 | |
| Non-service pension and OPEB costs | 51 | | | 46 | | | 19 | | | 18 | | | 32 | | | 28 | |
| WPL’s Western Wisconsin gas distribution expansion investments | 42 | | | 44 | | | — | | | — | | | 42 | | | 44 | |
| IPL’s DAEC PPA amendment | 18 | | | 42 | | | 18 | | | 42 | | | — | | | — | |
| Other | 150 | | | 159 | | | 56 | | | 50 | | | 94 | | | 109 | |
| $2,274 | | | $2,261 | | | $1,586 | | | $1,577 | | | $688 | | | $684 | |
At December 31, 2024, IPL and WPL had $199 million and $23 million, respectively, of regulatory assets that were not earning a return on investment. IPL’s regulatory assets that were not earning a return consisted primarily of the retired Lansing Generating Station, retired analog electric meters, emission allowances and costs for certain construction projects. WPL’s regulatory assets that were not earning a return consisted primarily of costs for certain construction projects. The other regulatory assets reported in the above table either earn a return or the cash has not yet been expended, in which case the assets are offset by liabilities that also do not incur a carrying cost.
Tax-related - IPL and WPL record regulatory assets for certain temporary differences (primarily related to utility property, plant and equipment at IPL) that result in a decrease in current rates charged to customers and an increase in future rates charged to customers based on the timing of income tax expense that is used to determine such rates. These temporary differences for IPL include the impacts of qualifying deductions for repairs expenditures, allocation of mixed service costs, and Iowa accelerated tax depreciation, which all contribute to lower current income tax expense during the first part of an asset’s useful life and higher current income tax expense during the latter part of an asset’s useful life. Conversely, cost of removal obligations contribute to higher current income tax expense during the first part of an asset’s useful life and lower current income tax expense during the latter part of an asset’s useful life. These regulatory assets will be recovered from customers in the future when these temporary differences reverse resulting in additional current income tax expense used to determine customers’ rates. Refer to Note 11 for discussion of Iowa Tax Reform, which resulted in a decrease in Alliant Energy’s and IPL’s tax-related regulatory assets in 2024.
AROs - Alliant Energy, IPL and WPL believe it is probable that certain differences between expenses accrued for AROs related to their utility operations and expenses recovered currently in rates will be recoverable in future rates, and are deferring the differences as regulatory assets. Refer to Note 13 for discussion of the recognition of additional ARO regulatory assets in 2024, substantially resulting from the enactment of the revised CCR Rule.
Pension and other postretirement benefits costs - The IUC, PSCW and FERC have authorized IPL and WPL to record the previously unrecognized net actuarial gains and losses, and prior service costs and credits, as regulatory assets in lieu of accumulated other comprehensive loss on the balance sheets, as these amounts are expected to be recovered in future rates. These regulatory assets will be increased or decreased as the net actuarial gains or losses, and prior service costs or credits, are subsequently amortized and recognized as a component of net periodic benefit costs. Regulatory assets are also increased or decreased as a result of the annual defined benefit plan measurement process. Pension and OPEB costs are included within the recoverable cost of service component of rates charged to IPL’s and WPL’s retail and wholesale customers, which are based upon pension and OPEB costs determined in accordance with GAAP and are calculated in accordance with IPL’s and WPL’s respective regulatory jurisdictions.
Assets retired early - IPL and WPL have retired various natural gas- and coal-fired EGUs, and IPL has retired certain analog electric meters. As a result, the remaining net book value of these assets was reclassified from property, plant and equipment to a regulatory asset on their respective balance sheets. Details regarding the recovery of the remaining net book value of these assets from IPL’s and WPL’s customers are as follows (dollars in millions):
| | | | | | | | | | | | | | | | | | | | | | | | | | | | | | | | |
| Entity | | Asset | | Retirement Date | | Regulatory Asset Balance as of Dec. 31, 2024 | | Recovery | | Regulatory Approval |
| IPL | | Lansing | | 2023 | | $131 | | Return of (IUC and FERC) and return on (FERC) remaining net book value through 2037 (a) | | IUC and FERC (b) |
| IPL | | Analog electric meters | | 2019 | | 15 | | Return of remaining net book value through 2028 | | IUC and FERC |
| IPL | | Sutherland Units 1 and 3 | | 2017 | | 15 | | Return of and return on remaining net book value through 2027 (a) | | IUC and FERC |
| IPL | | M.L. Kapp Unit 2 | | 2018 | | 7 | | Return of and return on remaining net book value through 2029 (a) | | IUC and FERC |
| | | | | | | | | | |
| WPL | | Edgewater Unit 4 | | 2018 | | 12 | | Return of and return on remaining net book value through 2028 | | PSCW and FERC |
(a)The remaining regulatory asset balances include differences between expected and actual cost of removal obligations.
(b)IPL was previously allowed a full recovery of and a full return on the Lansing Generation Station from both its retail and wholesale customers. The IUC’s September 2024 order for IPL’s retail electric rate review for the October 2024 through September 2025 forward-looking Test Period includes a return of the remaining net book value of Lansing, but does not include a return on the remaining net book value of Lansing, effective October 1, 2024. As a result, the return on the remaining net book value is no longer recoverable from IPL’s retail electric customers, and a pre-tax non-cash charge of $60 million was recorded to “Asset valuation charge for IPL’s Lansing Generating Station” in Alliant Energy’s and IPL’s income statements in 2024, with a corresponding decrease in Alliant Energy’s and IPL’s assets retired early regulatory assets.
Commodity cost recovery - Refer to Note 1(g) for details of IPL’s and WPL’s commodity cost recovery mechanisms. The cost recovery mechanism for WPL’s retail electric customers is based on forecasts of certain fuel-related costs expected to be incurred during forward-looking test periods and fuel monitoring ranges determined by the PSCW during each retail electric rate proceeding or in a separate fuel cost plan approval proceeding. In 2022, WPL’s actual fuel-related costs fell outside these fuel monitoring ranges, resulting in a $117 million deferral as of December 31, 2022, which WPL is collecting from October 2023 through December 2025 from its retail electric customers, plus interest ($12 million and $50 million was collected in 2023 and 2024, respectively). In 2023, WPL’s actual fuel-related costs fell outside these fuel monitoring ranges, resulting in a $34 million regulatory liability as of December 31, 2023, which was refunded in 2024 to its retail electric customers, plus interest.
Derivatives - In accordance with IPL’s and WPL’s fuel and natural gas recovery mechanisms, prudently incurred costs from derivative instruments are recoverable from customers in the future after any losses are realized, and gains from derivative instruments are refundable to customers in the future after any gains are realized. Based on these recovery mechanisms, the changes in the fair value of derivative liabilities/assets resulted in comparable changes to regulatory assets/liabilities on the balance sheets. Refer to Note 14 for discussion of changes in Alliant Energy’s, IPL’s and WPL’s derivative liabilities/assets during 2024, which resulted in comparable changes to regulatory assets/liabilities on the balance sheets.
Non-service pension and OPEB costs - Non-service pension and OPEB costs are recorded to regulatory assets to reflect the impacts of rate-making, and are recovered from IPL’s and WPL’s electric and gas customers through depreciation expense based on the depreciation rates for plant in-service.
WPL’s Western Wisconsin gas distribution expansion investments - WPL made contributions in aid of construction to a third party for investments as part of its Western Wisconsin gas distribution expansion project. Pursuant to authorization by the PSCW, Alliant Energy and WPL have recorded a regulatory asset for these costs, and are authorized by the PSCW to recover these amounts from WPL’s retail gas customers in base rates from 2021 through the end of 2040.
IPL’s DAEC PPA Amendment - In 2020, IPL made a buyout payment of $110 million in exchange for shortening the term of its DAEC PPA by 5 years. The buyout payment, including a return on, is being recovered from IPL’s retail and wholesale customers from 2021 through 2025, and is currently being amortized to “Electric production fuel and purchased power” in Alliant Energy’s and IPL’s income statements.
Regulatory Liabilities - At December 31, regulatory liabilities were comprised of the following items (in millions):
| | | | | | | | | | | | | | | | | | | | | | | | | | | | | | | | | | | |
| Alliant Energy | | IPL | | WPL |
| 2024 | | 2023 | | 2024 | | 2023 | | 2024 | | 2023 |
| Tax-related | $582 | | $566 | | $286 | | $299 | | $296 | | $267 |
| Cost of removal obligations | 347 | | 366 | | 205 | | 242 | | 142 | | 124 |
| Derivatives | 53 | | 65 | | 29 | | 34 | | 24 | | 31 |
| Commodity cost recovery | 17 | | 48 | | 12 | | 13 | | 5 | | 35 |
| | | | | | | | | | | |
| | | | | | | | | | | |
| | | | | | | | | | | |
| | | | | | | | | | | |
| | | | | | | | | | | |
| Other | 29 | | 85 | | 14 | | 56 | | 15 | | 29 |
| $1,028 | | $1,130 | | $546 | | $644 | | $482 | | $486 |
Tax-related regulatory liabilities reduce revenue requirement calculations utilized in IPL’s and WPL’s respective rate proceedings. Cost of removal obligations, to the extent expensed through depreciation rates, reduce rate base. A significant portion of the remaining regulatory liabilities is not used to adjust revenue requirement calculations.
Tax-related - Alliant Energy’s, IPL’s and WPL’s tax-related regulatory liabilities are primarily related to excess deferred tax benefits resulting from the remeasurement of accumulated deferred income taxes caused by the Tax Cuts and Jobs Act. The majority of these benefits related to accelerated depreciation are subject to tax normalization rules. These rules limit the rate at which these tax benefits are allowed to be passed on to customers. The increase in Alliant Energy’s and WPL’s tax-related regulatory liabilities was primarily due to tax benefits resulting from WPL electing investment tax credit treatment for its Cassville solar facility in 2024. A majority of these benefits will be addressed in a future regulatory proceeding, with a portion of the benefits passed on to WPL’s electric customers in 2024 and 2025.
Cost of removal obligations - Alliant Energy, IPL and WPL collect in rates future removal costs for many assets that do not have associated AROs or that have removal costs in addition to AROs. Alliant Energy, IPL and WPL record a regulatory liability for the amounts collected in rates for these future removal costs and reduce the regulatory liability for amounts spent on removal activities. Cash payments related to cost of removal obligations are included in “Other” in cash flows used for investing activities.
Rate Reviews -
WPL’s Retail Electric and Gas Rate Reviews (2024/2025 Forward-looking Test Period) - In December 2023, the PSCW issued an order authorizing annual base rate increases of $49 million and $13 million for WPL’s retail electric and gas customers, respectively, effective January 1, 2024, for the 2024 forward-looking Test Period. The PSCW’s order also authorized WPL to implement an additional $60 million increase in annual rates for its retail electric customers, effective January 1, 2025, for the 2025 forward-looking Test Period. The key drivers for the annual base rate increases include revenue requirement impacts of increasing electric and gas rate base, including investments in solar generation and energy storage. In addition, the PSCW’s order extended, with certain modifications, an earnings sharing mechanism through the end of 2025. The PSCW also authorized WPL to defer the incremental under-/over-collection of solar and energy storage renewable tax credits that are outside of the approved amounts, which are included in the tax-related lines of the regulatory assets and regulatory liabilities tables above. Refer to Note 3 for discussion of PSCW orders approving deferral of, and the deferral of a return on, incremental solar generation construction costs in 2024 and 2025.
WPL’s Retail Fuel-related Rate Filing (2021 Forward-looking Test Period) - In 2023, WPL collected $37 million, plus interest, from its retail electric customers related to actual fuel-related costs for 2021 that were higher than fuel-related costs used to determine rates for such period.
IPL’s Retail Electric and Gas Rate Reviews (October 2024 through September 2025 Forward-looking Test Period) - In September 2024, the IUC issued an order authorizing annual base rate increases of $185 million for IPL’s retail electric customers, with customers receiving partially offsetting credits for the first 12 months through a tax benefit rider, and $10 million for IPL’s retail gas customers, for the October 2024 through September 2025 forward-looking Test Period. Rate changes were effective October 1, 2024. The IUC’s order also reflects the following:
•Electric earnings sharing mechanism beginning in calendar year 2025, where IPL would apply excess earnings to the remaining net book value of IPL’s highest earning asset with advance ratemaking principles (currently the Emery Generation Station) based on its authorized return on common equity;
•Investment tax credits resulting from renewable generation and energy storage projects may be utilized to offset any revenue deficiency on an annual basis up to IPL’s return on common equity threshold; any remaining investment tax credits, net of the cost of transferability, that are not used to offset any revenue deficiency, will be deferred by IPL and carried forward to offset any revenue deficiency in future years; and
•Discontinuation of the renewable energy rider.
NOTE 3. PROPERTY, PLANT AND EQUIPMENT
At December 31, details of property, plant and equipment on the balance sheets were as follows (in millions):
| | | | | | | | | | | | | | | | | | | | | | | | | | | | | | | | | | | |
| Alliant Energy | | IPL | | WPL |
| 2024 | | 2023 | | 2024 | | 2023 | | 2024 | | 2023 |
| Utility: | | | | | | | | | | | |
| Electric plant: | | | | | | | | | | | |
| Generation in service (a)(b) | $11,156 | | | $9,180 | | | $5,924 | | | $5,025 | | | $5,232 | | | $4,155 | |
| Distribution in service | 7,811 | | | 7,314 | | | 4,344 | | | 4,091 | | | 3,467 | | | 3,223 | |
| Other in service | 595 | | | 567 | | | 385 | | | 356 | | | 210 | | | 211 | |
| Anticipated to be retired early (c) | 784 | | | 1,629 | | | — | | | — | | | 784 | | | 1,629 | |
| Total electric plant | 20,346 | | | 18,690 | | | 10,653 | | | 9,472 | | | 9,693 | | | 9,218 | |
| Gas plant in service | 1,863 | | | 1,791 | | | 981 | | 951 | | | 882 | | | 840 | |
| Other plant in service (d) | 734 | | | 653 | | | 456 | | 411 | | | 278 | | | 242 | |
| Accumulated depreciation (c) | (6,229) | | | (5,924) | | | (3,360) | | | (3,180) | | | (2,869) | | | (2,744) | |
| Net plant | 16,714 | | | 15,210 | | | 8,730 | | | 7,654 | | | 7,984 | | | 7,556 | |
| Leased Sheboygan Falls Energy Facility, net (e) | — | | | — | | | — | | | — | | | 74 | | | 79 | |
| Leased land for solar generation, net | 189 | | | 172 | | | 53 | | | 33 | | | 136 | | | 139 | |
| Construction work in progress | 1,215 | | | 1,245 | | | 548 | | 605 | | | 667 | | | 640 | |
| Other, net | 5 | | | 7 | | | 5 | | | 6 | | | — | | | 1 | |
| Total utility | 18,123 | | | 16,634 | | | 9,336 | | | 8,298 | | | 8,861 | | | 8,415 | |
| Non-utility and other: | | | | | | | | | | | |
| Non-utility Generation, net (f) | 103 | | | 68 | | | — | | | — | | | — | | | — | |
| Corporate Services and other, net (g) | 475 | | 455 | | | — | | | — | | | — | | | — | |
| Total non-utility and other | 578 | | | 523 | | | — | | | — | | | — | | | — | |
| Total property, plant and equipment | $18,701 | | | $17,157 | | | $9,336 | | | $8,298 | | | $8,861 | | | $8,415 | |
(a)Alliant Energy and WPL currently expect construction costs associated with WPL’s approximately 1,100 MW of new solar generation will exceed the construction cost estimates previously approved by the PSCW by approximately $205 million. In 2024, the PSCW issued orders approving deferral of, and the deferral of a return on, the incremental solar generation construction costs in 2024 and 2025. Alliant Energy and WPL concluded that there was not a probable disallowance of the higher rate base amounts as of December 31, 2024 given construction costs were reasonably and prudently incurred.
(b)In September 2024, the IUC approved IPL’s retail electric rate review for the October 2024 through September 2025 forward-looking Test Period, which allows IPL to recover construction costs associated with its 400 MW of new solar generation, including AFUDC and transmission upgrade costs among other costs, above the original cost target of $1,650/kilowatt up to $1,837.5/kilowatt. The costs up to the original cost target of $1,650/kilowatt will earn a return on common equity of 10.25%. The costs between $1,650/kilowatt and $1,837.5/kilowatt will earn a return on common equity that is the same as other assets without advance rate-making principles, without having to establish that such costs were reasonably and prudently incurred. Alliant Energy and IPL currently do not expect these construction costs will exceed $1,837.5/kilowatt.
(c)WPL previously received approval from MISO to retire the coal-fired Columbia Units 1 and 2, and Edgewater Unit 5. WPL currently plans to cease coal operations at Columbia Units 1 and 2 by the end of 2029, as well as evaluate the conversion of Columbia Unit 1 and/or Unit 2 to natural gas. Alliant Energy and WPL concluded that Columbia Units 1 and 2 met the criteria to be considered probable of abandonment as of December 31, 2024. As of December 31, 2024 and 2023, the net book value of Columbia Units 1 and 2 in aggregate was $413 million and $428 million, respectively. As of December 31, 2023, WPL anticipated retiring Edgewater Unit 5 by June 1, 2025, and Alliant Energy and WPL concluded that Edgewater Unit 5 met the criteria to be considered probable of abandonment. In May 2024, WPL announced updated plans to convert Edgewater Unit 5 to natural gas by 2028, subject to regulatory approvals. As a result, as of December 31, 2024, Alliant Energy and WPL concluded that Edgewater Unit 5 no longer meets the criteria to be considered probable of abandonment. WPL is currently allowed a full recovery of and a full return on these EGUs from both its retail and wholesale customers, and as a result, as of December 31, 2024, Alliant Energy and WPL concluded that no disallowance was probable.
(d)Includes IPL’s steam service assets, which are fully depreciated as of December 31, 2024. IPL’s steam customers are each under contract through 2025 for taking minimum quantities of annual steam usage, with certain conditions.
(e)Less accumulated amortization of $116 million and $112 million for WPL as of December 31, 2024 and 2023, respectively. Refer to Note 9 for discussion of WPL’s renewal of this lease in 2024. For Alliant Energy, the leased Sheboygan Falls Energy Facility is eliminated upon consolidation and is included in the “Non-utility Generation, net” line within Alliant Energy’s consolidated property, plant and equipment. (f)Less accumulated depreciation of $78 million and $75 million for Alliant Energy as of December 31, 2024 and 2023, respectively.
(g)Less accumulated depreciation of $289 million and $275 million for Alliant Energy as of December 31, 2024 and 2023, respectively.
AFUDC - AFUDC represents costs to finance construction additions, including a return on equity component and cost of debt component as required by regulatory accounting. The concurrent credit for the amount of AFUDC capitalized is recorded as “Allowance for funds used during construction” in the income statements. The amount of AFUDC generated by equity and debt components was as follows (in millions):
| | | | | | | | | | | | | | | | | | | | | | | | | | | | | | | | | | | | | | | | | | | | | | | | | | | | | |
| Alliant Energy | | IPL | | WPL |
| 2024 | | 2023 | | 2022 | | 2024 | | 2023 | | 2022 | | 2024 | | 2023 | | 2022 |
| Equity | $54 | | $74 | | $44 | | $31 | | $15 | | $8 | | $23 | | $59 | | $36 |
| Debt | 21 | | 26 | | 16 | | 12 | | 6 | | 3 | | 9 | | 20 | | 13 |
| $75 | | $100 | | $60 | | $43 | | $21 | | $11 | | $32 | | $79 | | $49 |
Non-utility and Other - The non-utility and other property, plant and equipment recorded on Alliant Energy’s balance sheets include the following:
Non-utility Generation - The Sheboygan Falls Energy Facility was placed in service in 2005 and is depreciated using the straight-line method over a 35-year period.
Corporate Services and Other - Property, plant and equipment related to Corporate Services include computer software, and the corporate headquarters building located in Madison, Wisconsin. The majority of the software is amortized over a 5-year period. Other property, plant and equipment include Travero assets (a short-line rail freight service in Iowa; a Mississippi River barge, rail and truck freight terminal in Illinois; wind turbine blade recycling services; and a rail-served warehouse in Iowa). All Corporate Services and Other property, plant and equipment are depreciated using the straight-line method over periods ranging from 5 to 30 years.
NOTE 4. JOINTLY-OWNED ELECTRIC UTILITY PLANT
Under joint ownership agreements with other utilities, IPL and WPL have undivided ownership interests in jointly-owned EGUs. Each of the respective owners is responsible for the financing of its portion of the construction costs. IPL’s and WPL’s shares of expenses from jointly-owned EGUs are included in the corresponding operating expenses (e.g., electric production fuel, other operation and maintenance, etc.) in the income statements. Information relative to IPL’s and WPL’s ownership interest in these jointly-owned EGUs at December 31, 2024 was as follows (dollars in millions):
| | | | | | | | | | | | | | | | | | | | | | | |
| Ownership | | Electric | | Accumulated Provision | | Construction |
| Interest % | | Plant | | for Depreciation | | Work in Progress |
| IPL | | | | | | | |
| Ottumwa Unit 1 | 48.0% | | $648 | | $277 | | $7 |
| George Neal Unit 4 | 25.7% | | 197 | | 110 | | 7 |
| George Neal Unit 3 | 28.0% | | 181 | | 89 | | 20 |
| Louisa Unit 1 | 4.0% | | 43 | | 23 | | — |
| | | 1,069 | | 499 | | 34 |
| WPL | | | | | | | |
| Columbia Units 1-2 and Energy Storage System | 53.5% | | 859 | | 378 | | 6 |
| West Riverside Energy Center and Solar Facility (a) | 56.6% | | 449 | | 59 | | 5 |
| Forward Wind Energy Center | 42.6% | | 119 | | 56 | | — |
| | | 1,427 | | 493 | | 11 |
| Alliant Energy | | | $2,496 | | $992 | | $45 |
(a)In 2023 and 2024, WEC Energy Group, Inc. and Madison Gas and Electric Company acquired partial ownership interests in West Riverside. The related proceeds are included in “Proceeds from sales of partial ownership interests in West Riverside” in investing activities in Alliant Energy’s and WPL’s cash flows statements in 2023 and 2024.
NOTE 5. RECEIVABLES
NOTE 5(a) Accounts Receivable - Details for accounts receivable included on the balance sheets as of December 31 were as follows (in millions):
| | | | | | | | | | | | | | | | | | | | | | | | | | | | | | | | | | | |
| Alliant Energy | | IPL | | WPL |
| 2024 | | 2023 | | 2024 | | 2023 | | 2024 | | 2023 |
| Customer | $113 | | | $121 | | | $— | | | $— | | | $98 | | | $110 | |
| Unbilled utility revenues | 101 | | | 93 | | | — | | | — | | | 101 | | | 93 | |
| Deferred proceeds | 163 | | | 216 | | | 163 | | | 216 | | | — | | | — | |
| Other | 58 | | | 53 | | | 29 | | | 26 | | | 29 | | | 24 | |
| Allowance for expected credit losses | (8) | | | (8) | | | — | | | — | | | (8) | | | (8) | |
| $427 | | | $475 | | | $192 | | | $242 | | | $220 | | | $219 | |
In 2024, gross write-offs for accounts receivable were as follows (in millions):
| | | | | | | | | | | |
| Originated in 2023 | | Originated in 2024 |
| Alliant Energy | $12 | | $14 |
| IPL | 8 | | 9 |
| WPL | 4 | | 5 |
NOTE 5(b) Sales of Accounts Receivable - IPL maintains a Receivables Agreement whereby it may sell its customer accounts receivables, unbilled revenues and certain other accounts receivables to a third party through wholly-owned and consolidated special purpose entities. In March 2024, IPL amended and extended through March 2026 the purchase commitment from the third party to which it sells its receivables. IPL pays a monthly fee to the third party that varies based on interest rates, limits on cash proceeds and cash amounts received from the third party. Deferred proceeds represent IPL’s interest in the receivables sold to the third party. At IPL’s request, deferred proceeds are paid to IPL from collections of receivables, after paying any required expenses incurred by the third party and the collection agent. Corporate Services acts as collection agent for the third party and receives a fee for collection services. The Receivables Agreement can be terminated by the third party if arrears or write-offs exceed certain levels. The transfers of receivables meet the criteria for sale accounting established by the transfer of financial assets accounting rules. IPL believes that the allowance for expected credit losses related to its sales of receivables is a reasonable approximation of credit risk of the customers that generated the receivables. Refer to Note 15 for discussion of the fair value of deferred proceeds.
Under the Receivables Agreement, IPL has the right to receive cash proceeds, up to a certain limit, from the third party in exchange for the receivables sold. The limit on cash proceeds fluctuates between $5 million and $110 million, which IPL may change periodically throughout the year. As of December 31, 2024, the limit on cash proceeds was $110 million and IPL had $40 million of available capacity under its sales of accounts receivable program. Cash proceeds are used by IPL to meet short-term financing needs, and cannot exceed the current limit or amount of receivables available for sale, whichever is less. IPL’s maximum and average outstanding aggregate cash proceeds (based on daily outstanding balances) related to the sales of accounts receivable program were as follows (in millions):
| | | | | | | | | | | | | | | | | | | | | | | | | | | | | | | | | | | |
| Maximum | | Average |
| 2024 | | 2023 | | 2022 | | 2024 | | 2023 | | 2022 |
| Outstanding aggregate cash proceeds | $110 | | $110 | | $80 | | $31 | | $51 | | $14 |
As of December 31, the attributes of IPL’s receivables sold under the Receivables Agreement were as follows (in millions):
| | | | | | | | | | | |
| 2024 | | 2023 |
| Customer accounts receivable | $137 | | $130 |
| Unbilled utility revenues | 108 | | 98 |
| Other receivables | — | | 1 |
| Receivables sold to third party | 245 | | 229 |
| Less: cash proceeds | 70 | | 1 |
| Deferred proceeds | 175 | | 228 |
| Less: allowance for expected credit losses | 12 | | 12 |
| Fair value of deferred proceeds | $163 | | $216 |
| Outstanding receivables past due | $21 | | $22 |
Additional attributes of IPL’s receivables sold under the Receivables Agreement were as follows (in millions):
| | | | | | | | | | | | | | | | | |
| 2024 | | 2023 | | 2022 |
| Collections | $2,090 | | $2,233 | | $2,302 | |
| Write-offs, net of recoveries | 12 | | 12 | | 9 | |
NOTE 6. INVESTMENTS
Unconsolidated Equity Investments - Alliant Energy’s unconsolidated investments accounted for under the equity method of accounting are as follows (in millions):
| | | | | | | | | | | | | | | | | | | | | | | | | | | | | | | | | | | |
| Ownership Interest at | | Carrying Value at December 31, | | Equity (Income) / Loss |
| December 31, 2024 | | 2024 | | 2023 | | 2024 | | 2023 | | 2022 |
| ATC Holdings | 16%, 20% | | $415 | | $386 | | ($57) | | ($49) | | ($41) |
| Non-utility wind farm in Oklahoma | 50% | | 107 | | 104 | | (6) | | (7) | | (5) |
| Corporate venture investments | Various | | 78 | | 74 | | 3 | | (2) | | (3) |
| Other | Various | | 23 | | 21 | | (1) | | (3) | | (2) |
| | | $623 | | $585 | | ($61) | | ($61) | | ($51) |
| | | | | | | | | | | |
| | | | | | | | | | | |
Summary aggregate financial information from the financial statements of these holdings is as follows (in millions):
| | | | | | | | | | | | | | | | | | | | | | | |
| Alliant Energy | | |
| 2024 | | 2023 | | 2022 | | | | | | |
| Revenues | $1,005 | | $898 | | $813 | | | | | | |
| Operating income | 433 | | 384 | | 350 | | | | | | |
| Net income | 434 | | 370 | | 675 | | | | | | |
| As of December 31: | | | | | | | | | | | |
| Current assets | 223 | | 221 | | | | | | | | |
| Non-current assets | 9,930 | | 9,032 | | | | | | | | |
| Current liabilities | 524 | | 528 | | | | | | | | |
| Non-current liabilities | 3,933 | | 3,584 | | | | | | | | |
| Noncontrolling interest | 221 | | 259 | | | | | | | | |
ATC Holdings - As of December 31, 2024, Alliant Energy has a 16% ownership interest in ATC and a 20% ownership interest in ATC Holdco LLC, collectively referred to as ATC Holdings. ATC is an independent, for-profit, transmission-only company. ATC Holdco LLC holds Duke-American Transmission Company, LLC, a joint venture between Duke Energy Corporation and ATC, that owns electric transmission infrastructure in North America. Refer to Note 16(g) for discussion of a reduction in earnings recorded in 2022 related to a court decision, and subsequent FERC order, which reduced the base return on equity authorized for MISO transmission owners, including ATC.
Non-utility Wind Farm in Oklahoma - The non-utility wind farm located in Oklahoma provides electricity to a third-party under a long-term PPA, and has both cash and tax equity ownership. Alliant Energy does not maintain or operate the wind farm, and provided a parent guarantee of its subsidiary’s indemnification obligations under the operating agreement and PPA. Refer to Note 16(d) for discussion of the guarantee.
Corporate Venture Investments - Alliant Energy has various minority ownership interests in regional and national venture funds, including a global coalition of energy companies working together to help identify and research innovative technologies and business models within the emerging energy economy.
NOTE 7. COMMON EQUITY
Common Share Activity - A summary of Alliant Energy’s common stock activity was as follows:
| | | | | | | | | | | | | | | | | |
| 2024 | | 2023 | | 2022 |
| Shares outstanding, January 1 | 256,096,848 | | | 251,134,966 | | | 250,474,529 | |
| | | | | |
| At-the-market offering program | — | | | 4,372,561 | | | — | |
| Shareowner Direct Plan | 439,107 | | | 454,987 | | | 437,669 | |
| Equity-based compensation plans | 154,267 | | | 134,334 | | | 222,768 | |
| | | | | |
| Shares outstanding, December 31 | 256,690,222 | | | 256,096,848 | | | 251,134,966 | |
At December 31, 2024, Alliant Energy had a total of 12 million shares available for issuance in the aggregate, pursuant to its 2020 OIP, Shareowner Direct Plan and 401(k) Savings Plan.
At-the-Market Offering Program - In December 2022, Alliant Energy filed a prospectus supplement to sell up to $225 million of its common stock through an at-the-market offering program. In 2023, Alliant Energy issued 4,372,561 shares of common stock through this program and received cash proceeds of $223 million, net of $2 million in commissions and fees. The proceeds from the issuances of common stock were used for general corporate purposes. This at-the-market offering program has expired.
Shareowner Direct Plan - Alliant Energy satisfies its requirements under the Shareowner Direct Plan (dividend reinvestment and stock purchase plan) by acquiring Alliant Energy common stock through original issue, rather than on the open market.
NOTE 8. DEBT
NOTE 8(a) Short-term Debt - Alliant Energy and its subsidiaries maintain committed bank lines of credit to provide short-term borrowing flexibility and back-stop liquidity for commercial paper outstanding. At December 31, 2024, the short-term borrowing capacity under a single credit facility agreement, which expires in December 2029, totaled $1.3 billion ($600 million for Alliant Energy at the parent company level, $300 million for IPL and $400 million for WPL). Subject to certain conditions, Alliant Energy (at the parent company level), IPL and WPL may each reallocate and change its sublimit up to $1 billion, $400 million and $500 million, respectively, within the $1.3 billion total commitment. Information regarding Alliant Energy’s, IPL’s and WPL’s commercial paper classified as short-term debt was as follows (dollars in millions):
| | | | | | | | | | | | | | | | | | | | | | | | | | | | | | | | | | | |
| Alliant Energy | | IPL | | WPL |
| December 31 | 2024 | | 2023 | | 2024 | | 2023 | | 2024 | | 2023 |
| Amount outstanding | $558 | | $475 | | $50 | | $— | | $183 | | $318 |
| Weighted average interest rates | 4.5% | | 5.5% | | 4.6% | | N/A | | 4.5% | | 5.4% |
| Available credit facility capacity | $742 | | $525 | | $250 | | $150 | | $217 | | $82 |
| | | | | | | | | | | | | | | | | | | | | | | | | | | | | | | | | | | |
| Alliant Energy | | IPL | | WPL |
| For the year ended | 2024 | | 2023 | | 2024 | | 2023 | | 2024 | | 2023 |
| Maximum amount outstanding (based on daily outstanding balances) | $632 | | $793 | | $80 | | $70 | | $390 | | $349 |
| Average amount outstanding (based on daily outstanding balances) | $327 | | $386 | | $1 | | $2 | | $70 | | $157 |
| Weighted average interest rates | 5.3% | | 5.2% | | 5.1% | | 5.3% | | 5.4% | | 5.1% |
NOTE 8(b) Long-Term Debt - Long-term debt, net as of December 31 was as follows (dollars in millions):
| | | | | | | | | | | | | | | | | | | | | | | | | | | | | | | | | | | |
| 2024 | | 2023 |
| Alliant Energy | | IPL | | WPL | | Alliant Energy | | IPL | | WPL |
| Senior Debentures (a): | | | | | | | | | | | |
| 3.4%, due 2025 | $250 | | | $250 | | | $— | | | $250 | | | $250 | | | $— | |
| 5.5%, due 2025 | 50 | | | 50 | | | — | | | 50 | | | 50 | | | — | |
| 4.1%, due 2028 | 500 | | | 500 | | | — | | | 500 | | | 500 | | | — | |
| 3.6%, due 2029 | 300 | | | 300 | | | — | | | 300 | | | 300 | | | — | |
| 2.3%, due 2030 | 400 | | | 400 | | | — | | | 400 | | | 400 | | | — | |
| 5.7%, due 2033 | 300 | | | 300 | | | — | | | 300 | | | 300 | | | — | |
| 6.45%, due 2033 | 100 | | | 100 | | | — | | | 100 | | | 100 | | | — | |
| 4.95%, due 2034 (b) | 350 | | | 350 | | | — | | | — | | | — | | | — | |
| 6.3%, due 2034 | 125 | | | 125 | | | — | | | 125 | | | 125 | | | — | |
| 6.25%, due 2039 | 300 | | | 300 | | | — | | | 300 | | | 300 | | | — | |
| 4.7%, due 2043 | 250 | | | 250 | | | — | | | 250 | | | 250 | | | — | |
| 3.7%, due 2046 | 300 | | | 300 | | | — | | | 300 | | | 300 | | | — | |
| 3.5%, due 2049 | 300 | | | 300 | | | — | | | 300 | | | 300 | | | — | |
| 3.1%, due 2051 | 300 | | | 300 | | | — | | | 300 | | | 300 | | | — | |
| 5.45%, due 2054 (b) | 300 | | | 300 | | | — | | | — | | | — | | | — | |
| 3.25% (Retired in 2024) | — | | | — | | | — | | | 500 | | | 500 | | | — | |
| 4,125 | | | 4,125 | | | — | | | 3,975 | | | 3,975 | | | — | |
| Debentures (a): | | | | | | | | | | | |
| 3.05%, due 2027 | 300 | | | — | | | 300 | | | 300 | | | — | | | 300 | |
| 3%, due 2029 | 350 | | | — | | | 350 | | | 350 | | | — | | | 350 | |
| 1.95%, due 2031 | 300 | | | — | | | 300 | | | 300 | | | — | | | 300 | |
| 3.95%, due 2032 | 600 | | | — | | | 600 | | | 600 | | | — | | | 600 | |
| 4.95% due 2033 | 300 | | | — | | | 300 | | | 300 | | | — | | | 300 | |
| 5.375%, due 2034 (c) | 300 | | | — | | | 300 | | | — | | | — | | | — | |
| 6.25%, due 2034 | 100 | | | — | | | 100 | | | 100 | | | — | | | 100 | |
| 6.375%, due 2037 | 300 | | | — | | | 300 | | | 300 | | | — | | | 300 | |
| 7.6%, due 2038 | 250 | | | — | | | 250 | | | 250 | | | — | | | 250 | |
| 4.1%, due 2044 | 250 | | | — | | | 250 | | | 250 | | | — | | | 250 | |
| 3.65%, due 2050 | 350 | | | — | | | 350 | | | 350 | | | — | | | 350 | |
| 3,400 | | | — | | | 3,400 | | | 3,100 | | | — | | | 3,100 | |
| Other: | | | | | | | | | | | |
| AEF term loan credit agreement through March 2025, 6% at December 31, 2024 (with Alliant Energy as guarantor) (d) | 300 | | | — | | | — | | | — | | | — | | | — | |
| AEF 1.4% senior notes, due 2026 (with Alliant Energy as guarantor) (a) | 200 | | | — | | | — | | | 200 | | | — | | | — | |
| Alliant Energy 3.875% convertible senior notes, due 2026 (e) | 575 | | | — | | | — | | | 575 | | | — | | | — | |
| AEF 5.4% senior notes, due 2027 (with Alliant Energy as guarantor) (a)(f) | 375 | | | — | | | — | | | — | | | — | | | — | |
| AEF 4.25% senior notes, due 2028 (with Alliant Energy as guarantor) (a) | 300 | | | — | | | — | | | 300 | | | — | | | — | |
| AEF 5.95% senior notes, due 2029 (with Alliant Energy as guarantor) (a) | 300 | | | — | | | — | | | 300 | | | — | | | — | |
| AEF 3.6% senior notes, due 2032 (with Alliant Energy as guarantor) (a) | 350 | | | — | | | — | | | 350 | | | — | | | — | |
| | | | | | | | | | | |
| AEF term loan credit agreement, 6% at December 31, 2023 (with Alliant Energy as guarantor) (Retired in 2024) (d) | — | | | — | | | — | | | 300 | | | — | | | — | |
| Sheboygan Power, LLC 5.06% senior secured notes (secured by the Sheboygan Falls Energy Facility and related assets) (Retired in 2024) | — | | | — | | | — | | | 9 | | | — | | | — | |
| | | | | | | | | | | |
| | | | | | | | | | | |
| | | | | | | | | | | |
| 2,400 | | | — | | | — | | | 2,034 | | | — | | | — | |
| Subtotal | 9,925 | | | 4,125 | | | 3,400 | | | 9,109 | | | 3,975 | | | 3,100 | |
| Current maturities | (1,171) | | | (300) | | | — | | | (809) | | | (500) | | | — | |
| Unamortized debt issuance costs | (55) | | | (25) | | | (20) | | | (54) | | | (21) | | | (19) | |
| Unamortized debt (discount) and premium, net | (22) | | | (10) | | | (10) | | | (21) | | | (9) | | | (11) | |
| Long-term debt, net (g) | $8,677 | | | $3,790 | | | $3,370 | | | $8,225 | | | $3,445 | | | $3,070 | |
(a)Contains optional redemption provisions which, if elected by the issuer at its sole discretion, could require material redemption premium payments by the issuer. The redemption premium payments under these optional redemption provisions are variable and dependent on applicable U.S. Treasury rates at the time of redemption.
(b)In September 2024, IPL issued $350 million of 4.95% senior debentures due 2034 and $300 million of 5.45% senior debentures due 2054. A portion of the net proceeds was used for the retirement of IPL’s $500 million 3.25% senior debentures, and the remainder of the net proceeds was used for general corporate purposes.
(c)In March 2024, WPL issued $300 million of 5.375% debentures due 2034. The debentures were issued as green bonds, and an amount equal to or in excess of the net proceeds was disbursed for the development and acquisition of WPL’s solar EGUs.
(d)In March 2024, AEF entered into a $300 million variable rate term loan credit agreement, which amended and restated the term loan credit agreement that expired in March 2024, and retired the $300 million variable rate term loan set forth therein. AEF’s restated agreement includes an option to increase the amount outstanding with one or more additional term loans in an aggregate amount not to exceed $100 million. Refer to Note 14 for information on AEF’s related interest rate swap. (f)In June 2024, AEF issued $375 million of 5.4% senior notes due 2027. The net proceeds were used to reduce Alliant Energy’s outstanding commercial paper and for general corporate purposes.
(g)There were no significant sinking fund requirements related to the outstanding long-term debt.
Convertible Senior Notes - In March 2023, Alliant Energy issued $575 million of 3.875% convertible senior notes (the Notes), which are senior unsecured obligations, and used the net proceeds from the issuance for general corporate purposes. The Notes will mature on March 15, 2026 unless earlier converted or repurchased. Alliant Energy may not redeem the Notes prior to the maturity date. Holders may convert their Notes at their option at any time prior to the close of business on the business day immediately preceding December 15, 2025 only under the following circumstances:
•during any calendar quarter commencing after the calendar quarter ending on June 30, 2023 (and only during such calendar quarter), if the last reported sale price of Alliant Energy’s common stock for at least 20 trading days (whether or not consecutive) during a period of 30 consecutive trading days ending on, and including, the last trading day of the immediately preceding calendar quarter is greater than or equal to 130% of the conversion price on each applicable trading day during such period;
•during the 5 business day period after any 10 consecutive trading day period (the “measurement period”) in which the trading price (as defined in the related Indenture) per $1,000 principal amount of Notes for each trading day of the measurement period was less than 98% of the product of the last reported sale price of Alliant Energy’s common stock and the conversion rate on each such trading day; or
•upon the occurrence of specified corporate events.
On or after December 15, 2025 until the close of business on the business day immediately preceding the maturity date, holders may convert all or any portion of their Notes at any time, regardless of the foregoing circumstances. Upon conversion of the Notes, Alliant Energy will pay cash up to the aggregate principal amount of the Notes to be converted and pay or deliver, as the case may be, cash, shares of its common stock or a combination of cash and shares of its common stock, at its election, in respect of the remainder, if any, of its conversion obligation in excess of the aggregate principal amount of the Notes being converted.
The initial conversion rate is 15.5461 shares of common stock per $1,000 principal amount of Notes (equivalent to an initial conversion price of approximately $64.32 per share of Alliant Energy’s common stock). The conversion rate is subject to adjustment in some events but will not be adjusted for any accrued and unpaid interest. In addition, following certain corporate events that occur prior to the maturity date, Alliant Energy will, in certain circumstances, increase the conversion rate for a holder who elects to convert its Notes in connection with such a corporate event.
If Alliant Energy undergoes a fundamental change (as defined in the related Indenture), then, subject to certain conditions, holders of the Notes may require Alliant Energy to repurchase for cash all or any portion of its Notes at a fundamental change repurchase price equal to 100% of the principal amount of the Notes to be repurchased, plus accrued and unpaid interest to, but excluding, the fundamental change repurchase date.
As of December 31, 2024, the conditions allowing holders of the Notes to convert their Notes were not met. As of December 31, 2024 and 2023, the Notes were classified on Alliant Energy’s balance sheets as “Current maturities of long-term debt” and “Long-term debt, net,” respectively. As of December 31, 2024 and 2023, the net carrying amount of the Notes was $571 million and $568 million, with unamortized debt issuance costs of $4 million and $7 million, and the estimated fair value (Level 2) of the Notes was $591 million and $572 million. As of December 31, 2024, there were no shares of Alliant Energy’s common stock related to the potential conversion of the Notes included in diluted EPS based on Alliant Energy’s average stock prices and the relevant terms of the Notes.
Five-Year Schedule of Long-term Debt Maturities - At December 31, 2024, long-term debt maturities for 2025 through 2029 were as follows (in millions):
| | | | | | | | | | | | | | | | | | | | | | | | | | | | | |
| 2025 | | 2026 | | 2027 | | 2028 | | 2029 |
| IPL | $300 | | $— | | $— | | $500 | | $300 |
| WPL | — | | — | | 300 | | — | | 350 |
| | | | | | | | | |
| AEF | 300 | | 200 | | 375 | | 300 | | 300 |
| Alliant Energy parent company | — | | 575 | | — | | — | | — |
| Alliant Energy | $600 | | $775 | | $675 | | $800 | | $950 |
Fair Value of Long-term Debt - Refer to Note 15 for information on the fair value of long-term debt outstanding.
NOTE 9. LEASES
Operating Leases - Alliant Energy’s, IPL’s and WPL’s operating leases primarily include leases of space on telecommunication towers and leases of property. Operating lease details are as follows (dollars in millions):
| | | | | | | | | | | | | | | | | | | | | | | | | | | | | | | | | | | |
| December 31, 2024 | | December 31, 2023 |
| Alliant Energy | | IPL | | WPL | | Alliant Energy | | IPL | | WPL |
| Property, plant and equipment, net | $22 | | $12 | | $9 | | $23 | | $13 | | $9 |
| Other current liabilities | $2 | | $1 | | $1 | | $2 | | $1 | | $1 |
| Other liabilities | 20 | | 11 | | 8 | | 21 | | 12 | | 8 |
| Total operating lease liabilities | $22 | | $12 | | $9 | | $23 | | $13 | | $9 |
| Weighted average remaining lease term | 11 years | | 11 years | | 12 years | | 12 years | | 12 years | | 12 years |
| Weighted average discount rate | 4% | | 4% | | 4% | | 4% | | 4% | | 4% |
| | | | | | | | | | | |
| | | |
| | | | | | | | | | | |
| | | | | | | | | | | |
Finance Leases - WPL is currently leasing the Sheboygan Falls Energy Facility from AEF’s Non-utility Generation business. WPL is responsible for the operation of the EGU and has exclusive rights to its output. In 2024, WPL renewed this financing lease through 2044. There are no lease renewal periods remaining. For Alliant Energy, the leased Sheboygan Falls Energy Facility is eliminated upon consolidation and therefore is not reflected in Alliant Energy’s amounts below.
Related to their investments in solar generation, IPL and WPL entered into various land lease agreements with unaffiliated parties that have commenced. The leases have various terms with optional renewal periods that are assumed to be extended through the end of the estimated useful lives of the solar generating facilities. The leases do not contain purchase options and are fixed lease payments.
Finance lease details are as follows (dollars in millions):
| | | | | | | | | | | | | | | | | | | | | | | | | | | | | | | | | | | |
| December 31, 2024 | | December 31, 2023 |
| Alliant Energy | | IPL | | WPL | | Alliant Energy | | IPL | | WPL |
| Property, plant and equipment, net: | | | | | | | | | | | |
| Sheboygan Falls Energy Facility | N/A | | N/A | | $74 | | N/A | | N/A | | $79 |
| Leased land for solar generation | $189 | | $53 | | 136 | | $172 | | $33 | | 139 |
| $189 | | $53 | | $210 | | $172 | | $33 | | $218 |
| Other current liabilities: | | | | | | | | | | | |
| Sheboygan Falls Energy Facility | N/A | | N/A | | $7 | | N/A | | N/A | | $11 |
| Leased land for solar generation | $— | | $— | | — | | $— | | $— | | — |
| — | | — | | 7 | | — | | — | | 11 |
| Other liabilities: | | | | | | | | | | | |
| Sheboygan Falls Energy Facility | N/A | | N/A | | 71 | | N/A | | N/A | | 78 |
| Leased land for solar generation | 189 | | 53 | | 136 | | 172 | | 33 | | 139 |
| 189 | | 53 | | 207 | | 172 | | 33 | | 217 |
| Total finance lease liabilities | $189 | | $53 | | $214 | | $172 | | $33 | | $228 |
| Weighted average remaining lease term | 31 years | | 28 years | | 28 years | | 33 years | | 29 years | | 27 years |
| Weighted average discount rate | 5% | | 5% | | 5% | | 5% | | 5% | | 5% |
| | | | | | | | | | | | | | | | | | | | | | | | | | | | | | | | | | | | | | | | | | | | | | | | | | | | | |
| Alliant Energy | | IPL | | WPL |
| 2024 | | 2023 | | 2022 | | 2024 | | 2023 | | 2022 | | 2024 | | 2023 | | 2022 |
| Depreciation and amortization expenses | $— | | | $1 | | | $— | | | $— | | | $— | | | $— | | | $4 | | | $6 | | | $6 | |
| Interest expense | 8 | | | 6 | | | 3 | | | 2 | | | 1 | | | — | | | 10 | | | 8 | | | 7 | |
| Total finance lease expense | $8 | | | $7 | | | $3 | | | $2 | | | $1 | | | $— | | | $14 | | | $14 | | | $13 | |
Finance lease liabilities arising from obtaining leased assets, which represent non-cash financing activities, were as follows (in millions):
| | | | | | | | | | | | | | | | | | | | | | | | | | | | | | | | | | | | | | | | | |
| Alliant Energy | | IPL | | WPL |
| 2024 | | 2023 | | | | 2024 | | 2023 | | | | 2024 | | 2023 | | |
| Finance lease liabilities arising from obtaining leased assets | $20 | | | $34 | | | | | $20 | | | $33 | | | | | $— | | | $71 | | | |
Expected Maturities - As of December 31, 2024, expected maturities of lease liabilities were as follows (in millions):
| | | | | | | | | | | | | | | | | | | | | | | | | | | | | | | | | | | | | | | | | | | | | | | | | | | | | |
| 2025 | | 2026 | | 2027 | | 2028 | | 2029 | | Thereafter | | Total | | Less: amount representing interest | | Present value of minimum lease payments |
| Operating Leases: | | | | | | | | | | | | | | | | | |
| Alliant Energy | $3 | | | $3 | | | $3 | | | $3 | | | $2 | | | $14 | | $28 | | $6 | | $22 |
| IPL | 2 | | | 2 | | | 1 | | | 1 | | | 1 | | | 8 | | 15 | | 3 | | 12 |
| WPL | 1 | | | 1 | | | 1 | | | 1 | | | 1 | | | 7 | | 12 | | 3 | | 9 |
| Finance Leases: | | | | | | | | | | | | | | | | | |
| Alliant Energy | 9 | | | 9 | | | 9 | | | 10 | | | 10 | | | 337 | | 384 | | 195 | | 189 |
| IPL | 3 | | | 3 | | | 3 | | | 3 | | | 3 | | | 92 | | 107 | | 54 | | 53 |
| WPL | 17 | | | 13 | | | 13 | | | 13 | | | 13 | | | 324 | | 393 | | 179 | | 214 |
NOTE 10. REVENUES
Revenues from Alliant Energy’s, IPL’s and WPL’s utility businesses are primarily from electric and gas sales provided to customers based on approved tariffs or specific contracts with customers. IPL’s and WPL’s primary performance obligations under such arrangements are to deliver electricity and gas, and their customers simultaneously receive and consume the electricity and gas. For such arrangements, revenues are recognized equivalent to the value of the electricity or gas supplied during each period, including amounts billed during each period and changes in amounts estimated to be billed at the end of each period. IPL and WPL apply the right to invoice method to measure progress towards completing performance obligations to transfer electricity and gas to their customers.
IPL provides retail electric and gas service to customers in Iowa, and WPL provides retail and wholesale electric and retail gas service to customers in Wisconsin. IPL also provides electricity to wholesale customers in Minnesota, Illinois and Iowa, as well as steam from its Prairie Creek Generating Station to high-pressure steam customers in Iowa.
IPL’s and WPL’s retail electric and gas revenues include sales to residential, commercial and industrial customers. IPL’s and WPL’s retail electric and gas customer prices are based on IPL’s and WPL’s cost of service and are determined through general rate review proceedings and various tariff filings with the IUC and PSCW, respectively. Such tariff-based services provide electricity or gas to customers without a defined contractual term.
IPL and WPL have wholesale electric market-based rate authority from FERC allowing them to participate in wholesale energy markets (e.g. MISO) and transact directly with third parties. This authority from FERC allows sales of electricity referred to as bulk power sales based on current market values. FERC also allows IPL and WPL to enter into power supply agreements with municipalities and rural electric cooperatives with defined contractual terms, which include standard pricing mechanisms that are detailed in current tariffs accepted by FERC through wholesale rate review proceedings.
Revenues from Alliant Energy’s non-utility business customers are primarily from its Travero business, which includes a short-line rail freight service in Iowa; a Mississippi River barge, rail and truck freight terminal in Illinois; freight brokerage services; wind turbine blade recycling services; and a rail-served warehouse in Iowa.
Disaggregation of revenues from contracts with customers is provided for each reportable segment (IPL and WPL), as well as by customer class within electric and gas sales, as follows (in millions):
| | | | | | | | | | | | | | | | | | | | | | | | | | | | | | | | | | | | | | | | | | | | | | | | | | | | | |
| Alliant Energy | | IPL | | WPL |
| 2024 | | 2023 | | 2022 | | 2024 | | 2023 | | 2022 | | 2024 | | 2023 | | 2022 |
| Electric Utility: | | | | | | | | | | | | | | | | | |
| Retail - residential | $1,236 | | | $1,220 | | | $1,233 | | | $640 | | | $641 | | | $673 | | | $596 | | | $579 | | | $560 | |
| Retail - commercial | 821 | | | 820 | | | 821 | | | 525 | | | 519 | | | 536 | | | 296 | | | 301 | | | 285 | |
| Retail - industrial | 952 | | | 968 | | | 965 | | | 497 | | | 501 | | | 538 | | | 455 | | | 467 | | | 427 | |
| Wholesale | 200 | | | 213 | | | 233 | | | 61 | | | 62 | | | 64 | | | 139 | | | 151 | | | 169 | |
| Bulk power and other | 163 | | | 124 | | | 169 | | | 24 | | | 38 | | | 48 | | | 139 | | | 86 | | | 121 | |
| Total Electric Utility | 3,372 | | | 3,345 | | | 3,421 | | | 1,747 | | | 1,761 | | | 1,859 | | | 1,625 | | | 1,584 | | | 1,562 | |
| Gas Utility: | | | | | | | | | | | | | | | | | |
| Retail - residential | 275 | | | 316 | | | 371 | | | 148 | | | 176 | | | 202 | | | 127 | | | 140 | | | 169 | |
| Retail - commercial | 133 | | | 163 | | | 197 | | | 68 | | | 86 | | | 101 | | | 65 | | | 77 | | | 96 | |
| Retail - industrial | 11 | | | 16 | | | 20 | | | 7 | | | 11 | | | 14 | | | 4 | | | 5 | | | 6 | |
| Transportation/other | 46 | | | 45 | | | 54 | | | 27 | | | 27 | | | 34 | | | 19 | | | 18 | | | 20 | |
| Total Gas Utility | 465 | | | 540 | | | 642 | | | 250 | | | 300 | | | 351 | | | 215 | | | 240 | | | 291 | |
| Other Utility: | | | | | | | | | | | | | | | | | |
| Steam | 40 | | | 45 | | | 39 | | | 40 | | | 45 | | | 39 | | | — | | | — | | | — | |
| Other utility | 14 | | | 7 | | | 10 | | | 9 | | | 4 | | | 7 | | | 5 | | | 3 | | | 3 | |
| Total Other Utility | 54 | | | 52 | | | 49 | | | 49 | | | 49 | | | 46 | | | 5 | | | 3 | | | 3 | |
| Non-Utility and Other: | | | | | | | | | | | | | | | | | |
| | | | | | | | | | | | | | | | | |
| Travero and other | 90 | | | 90 | | | 93 | | | — | | | — | | | — | | | — | | | — | | | — | |
| Total Non-Utility and Other | 90 | | | 90 | | | 93 | | | — | | | — | | | — | | | — | | | — | | | — | |
| Total revenues | $3,981 | | | $4,027 | | | $4,205 | | | $2,046 | | | $2,110 | | | $2,256 | | | $1,845 | | | $1,827 | | | $1,856 | |
NOTE 11. INCOME TAXES
Income Tax Expense (Benefit) - The components of “Income tax expense (benefit)” in the income statements were as follows (in millions):
| | | | | | | | | | | | | | | | | | | | | | | | | | | | | | | | | | | | | | | | | | | | | | | | | | | | | |
| Alliant Energy | | IPL | | WPL |
| 2024 | | 2023 | | 2022 | | 2024 | | 2023 | | 2022 | | 2024 | | 2023 | | 2022 |
| Current tax expense (benefit): | | | | | | | | | | | | | | | | | |
| Federal | $13 | | ($3) | | $7 | | ($19) | | ($44) | | ($29) | | $37 | | $48 | | $46 |
| State | (10) | | (6) | | 2 | | (19) | | (21) | | (8) | | 23 | | 25 | | 16 |
| | | | | | | | | | | | | | | | | |
| Deferred tax expense (benefit): | | | | | | | | | | | | | | | | | |
| Federal | 60 | | 100 | | 109 | | 38 | | 87 | | 91 | | 24 | | 10 | | 10 |
| State | 15 | | 36 | | 28 | | (17) | | 17 | | 1 | | 7 | | 3 | | 12 |
| Production tax credits | (177) | | (121) | | (123) | | (108) | | (95) | | (105) | | (69) | | (26) | | (18) |
| Investment tax credits | (15) | | (1) | | (1) | | (4) | | (1) | | — | | (11) | | — | | — |
| | | | | | | | | | | | | | | | | |
| | | | | | | | | | | | | | | | | |
| | | | | | | | | | | | | | | | | |
| Provision recorded as a change in accrued interest | — | | (1) | | — | | — | | (1) | | — | | — | | — | | — |
| ($114) | | $4 | | $22 | | ($129) | | ($58) | | ($50) | | $11 | | $60 | | $66 |
Income Tax Rates - The overall income tax rates shown in the following table were computed by dividing income tax expense (benefit) by income before income taxes. In 2024, Alliant Energy’s and IPL’s effective income tax rates were impacted by the pre-tax non-cash charge of $60 million for IPL’s Lansing Generation Station discussed in Note 2. | | | | | | | | | | | | | | | | | | | | | | | | | | | | | | | | | | | | | | | | | | | | | | | | | | | | | |
| Alliant Energy | | IPL | | WPL |
| 2024 | | 2023 | | 2022 | | 2024 | | 2023 | | 2022 | | 2024 | | 2023 | | 2022 |
| Statutory federal income tax rate | 21% | | 21% | | 21% | | 21% | | 21% | | 21% | | 21% | | 21% | | 21% |
| State income taxes, net of federal benefits | (1) | | 2 | | 3 | | (12) | | (2) | | (2) | | 6 | | 5 | | 6 |
| Production tax credits | (31) | | (17) | | (18) | | (46) | | (31) | | (34) | | (20) | | (7) | | (5) |
| Investment tax credits | (3) | | — | | — | | (2) | | — | | — | | (3) | | — | | — |
Amortization of excess deferred taxes (Refer to Note 2) | (2) | | (2) | | (2) | | (5) | | (2) | | (2) | | — | | (2) | | (3) |
| Effect of rate-making on property-related differences | (5) | | (4) | | (1) | | (10) | | (5) | | (1) | | (1) | | (3) | | (2) |
| | | | | | | | | | | | | | | | | |
| | | | | | | | | | | | | | | | | |
| | | | | | | | | | | | | | | | | |
| Other items, net | 1 | | 1 | | — | | (1) | | — | | 2 | | — | | 1 | | — |
| Overall income tax rate | (20%) | | 1% | | 3% | | (55%) | | (19%) | | (16%) | | 3% | | 15% | | 17% |
Deferred Tax Assets and Liabilities - The deferred tax assets and liabilities included on the balance sheets at December 31 arise from the following temporary differences (in millions):
| | | | | | | | | | | | | | | | | | | | | | | | | | | | | | | | | | | |
| Alliant Energy | | IPL | | WPL |
| 2024 | | 2023 | | 2024 | | 2023 | | 2024 | | 2023 |
| Deferred tax liabilities: | | | | | | | | | | | |
| Property | $2,596 | | | $2,453 | | | $1,521 | | | $1,415 | | | $999 | | | $972 | |
| ATC Holdings | 135 | | | 127 | | | — | | | — | | | — | | | — | |
| Other | 178 | | | 213 | | | 120 | | | 157 | | | 66 | | | 64 | |
| Total deferred tax liabilities | 2,909 | | | 2,793 | | | 1,641 | | | 1,572 | | | 1,065 | | | 1,036 | |
| Deferred tax assets: | | | | | | | | | | | |
| Federal credit carryforwards | 605 | | | 649 | | | 426 | | | 449 | | | 166 | | | 191 | |
| | | | | | | | | | | |
| Net operating losses carryforwards - state | 20 | | | 26 | | | 1 | | | 1 | | | — | | | — | |
| Other | 98 | | | 79 | | | 37 | | | 32 | | | 34 | | | 19 | |
| Subtotal deferred tax assets | 723 | | | 754 | | | 464 | | | 482 | | | 200 | | | 210 | |
| Valuation allowances | (2) | | | (3) | | | (2) | | | (1) | | | — | | | (1) | |
| Total deferred tax assets | 721 | | | 751 | | | 462 | | | 481 | | | 200 | | | 209 | |
| Total deferred tax liabilities, net | $2,188 | | | $2,042 | | | $1,179 | | | $1,091 | | | $865 | | | $827 | |
Carryforwards - At December 31, 2024, carryforwards and expiration dates were estimated as follows (in millions):
| | | | | | | | | | | | | | | | | | | | | | | |
| Range of Expiration Dates | | Alliant Energy | | IPL | | WPL |
| | | | | | | |
| State net operating losses | 2025-2044 | | $338 | | $7 | | $1 |
| Federal tax credits | 2033-2044 | | 605 | | 426 | | 166 |
Valuation Allowances - Refer to Note 1(c) for discussion of valuation allowances related to the expected transfer of renewable tax credits to other corporate taxpayers.
Uncertain Tax Positions - At December 31, 2024, 2023 and 2022, there were no uncertain tax positions or penalties accrued related to uncertain tax positions. As of December 31, 2024, no material changes to unrecognized tax benefits are expected during the next 12 months.
Open tax years - Tax years that remain subject to the statute of limitations in the major jurisdictions for each of Alliant Energy, IPL and WPL are as follows:
| | | | | | | | | | | |
| Consolidated federal income tax returns (a) | 2021 | - | 2023 |
| Consolidated Iowa income tax returns (b) | 2021 | - | 2023 |
| Wisconsin combined tax returns (c) | 2020 | - | 2023 |
(a)The 2021 and 2022 federal tax returns are effectively settled as a result of participation in the IRS Compliance Assurance Program, which allows Alliant Energy and the IRS to work together to resolve issues related to Alliant Energy’s current tax year before filing its federal income tax return. The statute of limitations for these federal tax returns expires three years from each filing date.
(b)The statute of limitations for these Iowa tax returns expires three years from each filing date.
(c)The statute of limitations for these Wisconsin combined tax returns expires four years from each filing date.
Iowa Tax Reform - Pursuant to Iowa tax reform enacted in 2022, annually, and by each November 1, the Iowa Department of Revenue will establish corporate income tax rates for the next tax year based on net corporate income tax receipts for the prior tax year, and reduce such rates if the minimum receipt threshold is met. These corporate income tax rate reductions are currently expected to occur over a period of several years, with a target corporate income tax rate of 5.5%, compared to the 9.8% Iowa corporate income tax rate in effect at the time the Iowa tax reform was enacted. In 2022 and 2023, the Iowa Department of Revenue announced an Iowa corporate income tax rate of 8.4% effective January 1, 2023, and 7.1% effective January 1, 2024, respectively.
Deferred tax assets and liabilities are measured at the enacted tax rate expected to be applied when temporary differences are to be realized or settled. Given the announcements of the new Iowa corporate income tax rates, Alliant Energy’s and IPL’s deferred tax liabilities were remeasured in 2022 and 2023 based upon the new rates effective January 1, 2023 and January 1, 2024, which resulted in a $77 million and $74 million reduction of Alliant Energy’s and IPL’s tax-related regulatory assets and a corresponding decrease in their deferred tax liabilities in 2022 and 2023, respectively. In addition, Iowa tax reform made Iowa state income taxes fully deductible for the purpose of determining Iowa state income tax obligations beginning with the 2023 tax year. Alliant Energy reflected the deduction of the additional Iowa state income taxes in its 2023 Iowa state income tax return filed in 2024, which resulted in a $26 million reduction of Alliant Energy’s and IPL’s tax-related regulatory assets and a corresponding decrease in their deferred tax liabilities in 2024. The reductions in tax-related regulatory assets are expected to provide cost benefits to IPL’s customers in the future.
Alliant Energy parent company’s deferred tax assets were remeasured based upon the new rates effective January 1, 2023 and January 1, 2024, and the deduction of Iowa state income taxes included in Alliant Energy’s 2023 Iowa state income tax return filed in 2024, which resulted in charges of $8 million, $10 million and $11 million recorded to income tax expense in Alliant Energy’s income statement and an increase in deferred income tax liabilities on Alliant Energy’s balance sheets in 2022, 2023 and 2024, respectively. Alliant Energy is currently unable to predict with certainty the timing or amount of any future rate reductions.
NOTE 12. BENEFIT PLANS
NOTE 12(a) Pension and Other Postretirement Benefits Plans - Retirement benefits are provided to substantially all employees through various qualified and non-qualified non-contributory defined benefit pension plans (currently closed to new hires), and/or through defined contribution plans (including 401(k) savings plans). Benefits of the non-contributory defined benefit pension plans are based on the plan participant’s years of service, age and compensation. Benefits of the defined contribution plans are based on the plan participant’s years of service, age, compensation and contributions. Certain defined benefit postretirement health care and life benefits are provided to eligible retirees. In general, the retiree health care plans consist of fixed benefit subsidy structures and the retiree life insurance plans are non-contributory.
IPL and WPL account for their participation in Alliant Energy and Corporate Services sponsored plans as multiple-employer plans. For IPL and WPL, amounts below represent the amounts for their plan participants covered under plans they sponsor, as well as amounts directly assigned to them related to certain participants in the Alliant Energy and Corporate Services sponsored plans.
Assumptions - The weighted-average assumptions for defined benefit pension and OPEB plans at the measurement date of December 31 were as follows:
| | | | | | | | | | | | | | | | | | | | | | | | | | | | | | | | | | | | | | | | | | | | | | | | | | | | | |
| Defined Benefit Pension Plans | | OPEB Plans |
| Alliant Energy | 2024 | | 2023 | | 2022 | | 2024 | | 2023 | | 2022 |
| Discount rate for benefit obligations | 5.65% | | 5.36% | | 5.54% | | 5.62% | | 5.40% | | 5.53% |
| Discount rate for net periodic cost | 5.36% | | 5.54% | | 2.91% | | 5.40% | | 5.53% | | 2.81% |
| Expected rate of return on plan assets | 7.73% | | 7.80% | | 7.80% | | 6.22% | | 6.50% | | 6.40% |
| Interest crediting rate for Alliant Energy Cash Balance Pension Plan | 6.24% | | 10.75% | | 9.22% | | N/A | | N/A | | N/A |
| Rate of compensation increase | 3.50% | - | 4.50% | | 3.30% | - | 4.50% | | 3.30% | - | 4.50% | | N/A | | N/A | | N/A |
| | | | | | | | | | | | | | | | | |
| | | | | | | | | | | |
| | | | | | | | | | | |
| | | | | | | | | | | | | | | | | | | | | | | | | | | | | | | | | | | |
| Qualified Defined Benefit Pension Plan | | OPEB Plans |
| IPL | 2024 | | 2023 | | 2022 | | 2024 | | 2023 | | 2022 |
| Discount rate for benefit obligations | 5.66% | | 5.35% | | 5.55% | | 5.61% | | 5.40% | | 5.53% |
| Discount rate for net periodic cost | 5.35% | | 5.55% | | 2.94% | | 5.40% | | 5.53% | | 2.80% |
| Expected rate of return on plan assets | 7.60% | | 7.80% | | 7.80% | | 6.60% | | 6.90% | | 6.50% |
| Rate of compensation increase | 3.75% | | 3.30% | | 3.30% | | N/A | | N/A | | N/A |
| | | | | | | | | | | |
| | | | | | | | | | | |
| | | | | | | | | | | |
| | | | | | | | | | | | | | | | | | | | | | | | | | | | | | | | | | | |
| Qualified Defined Benefit Pension Plan | | OPEB Plans |
| WPL | 2024 | | 2023 | | 2022 | | 2024 | | 2023 | | 2022 |
| Discount rate for benefit obligations | 5.66% | | 5.35% | | 5.54% | | 5.61% | | 5.40% | | 5.53% |
| Discount rate for net periodic cost | 5.35% | | 5.54% | | 2.94% | | 5.40% | | 5.53% | | 2.79% |
| Expected rate of return on plan assets | 7.80% | | 7.80% | | 7.80% | | 5.61% | | 5.65% | | 5.49% |
| Rate of compensation increase | 3.50% | | 3.30% | | 3.30% | | N/A | | N/A | | N/A |
| | | | | | | | | | | |
| | | | | | | | | | | |
| | | | | | | | | | | |
Expected rate of return on plan assets - The expected rate of return on plan assets is based on projected asset class returns using target allocations. A forward-looking building blocks approach is used, and historical returns, survey information and capital market information are analyzed to support the expected rate of return on plan assets assumption. Refer to “Investment Strategy for Plan Assets” below for additional information related to investment strategy and mix of assets for the pension and OPEB plans.
Life Expectancy - The life expectancy assumption is used in determining the benefit obligation and net periodic benefit cost for defined benefit pension and OPEB plans. This assumption utilizes base mortality tables that were released in 2019 by the Society of Actuaries and mortality projection tables that were released in 2021 by the Society of Actuaries.
Net Periodic Benefit Costs - The components of net periodic benefit costs for sponsored defined benefit pension and OPEB plans are included below (in millions). The service cost component of net periodic benefit costs is included in “Other operation and maintenance” expenses in the income statements and all other components of net periodic benefit costs are included in “Other (income) and deductions” in the income statements or regulatory assets on the balance sheets.
| | | | | | | | | | | | | | | | | | | | | | | | | | | | | | | | | | | |
| Alliant Energy | Defined Benefit Pension Plans | | OPEB Plans |
| 2024 | | 2023 | | 2022 | | 2024 | | 2023 | | 2022 |
| Service cost | $5 | | | $5 | | | $9 | | | $2 | | | $2 | | | $3 | |
| Interest cost | 45 | | | 47 | | | 36 | | | 8 | | | 9 | | | 6 | |
| Expected return on plan assets (a) | (55) | | | (53) | | | (69) | | | (5) | | | (5) | | | (5) | |
| Amortization of prior service credit (b) | (1) | | | (1) | | | (1) | | | — | | | — | | | — | |
| Amortization of actuarial loss (c) | 24 | | | 28 | | | 32 | | | — | | | 1 | | | 2 | |
| Settlement losses (d) | — | | | — | | | 26 | | | — | | | — | | | — | |
| $18 | | | $26 | | | $33 | | | $5 | | | $7 | | | $6 | |
| | | | | | | | | | | | | | | | | | | | | | | | | | | | | | | | | | | |
| IPL | Defined Benefit Pension Plans | | OPEB Plans |
| 2024 | | 2023 | | 2022 | | 2024 | | 2023 | | 2022 |
| Service cost | $3 | | | $3 | | | $6 | | | $1 | | | $1 | | | $1 | |
| Interest cost | 20 | | | 21 | | | 16 | | | 3 | | | 3 | | | 2 | |
| Expected return on plan assets (a) | (26) | | | (26) | | | (31) | | | (4) | | | (3) | | | (4) | |
| | | | | | | | | | | |
| Amortization of actuarial loss (c) | 9 | | | 11 | | | 13 | | | — | | | 1 | | | 1 | |
| Settlement losses (d) | — | | | — | | | 13 | | | — | | | — | | | — | |
| $6 | | | $9 | | | $17 | | | $— | | | $2 | | | $— | |
| | | | | | | | | | | | | | | | | | | | | | | | | | | | | | | | | | | |
| WPL | Defined Benefit Pension Plans | | OPEB Plans |
| 2024 | | 2023 | | 2022 | | 2024 | | 2023 | | 2022 |
| Service cost | $2 | | | $2 | | | $3 | | | $1 | | | $1 | | | $1 | |
| Interest cost | 20 | | | 20 | | | 16 | | | 3 | | | 3 | | | 2 | |
| Expected return on plan assets (a) | (23) | | | (22) | | | (31) | | | (1) | | | (1) | | | (1) | |
| | | | | | | | | | | |
| Amortization of actuarial loss (c) | 11 | | | 13 | | | 15 | | | — | | | 1 | | | 2 | |
| Settlement losses (d) | — | | | — | | | 13 | | | — | | | — | | | — | |
| $10 | | | $13 | | | $16 | | | $3 | | | $4 | | | $4 | |
(a)The expected return on plan assets is based on the expected rate of return on plan assets and the fair value approach to the market-related value of plan assets.
(b)Unrecognized prior service credits for the OPEB plans are amortized over the average future service period to full eligibility of the participants of each plan.
(c)Unrecognized net actuarial gains or losses in excess of 10% of the greater of the plans’ benefit obligations or assets are amortized over the average future service lives of plan participants, except for the Alliant Energy Cash Balance Pension Plan where gains or losses outside the 10% threshold are amortized over the time period the participants are expected to receive benefits.
(d)Settlement losses related to payments made to retired executives of Alliant Energy and lump sum payments related to IPL’s and WPL’s qualified defined benefit pension plans. In 2022, the majority of Alliant Energy’s, IPL’s, and WPL’s pension settlement losses were recognized as regulatory assets in accordance with regulatory treatment, and $7 million was included in “Other (income) and deductions” in Alliant Energy’s and IPL’s income statements related to IPL’s qualified defined benefit pension plan.
Benefit Plan Assets and Obligations - A reconciliation of the funded status of qualified and non-qualified defined benefit pension and OPEB plans to the amounts recognized on the balance sheets at December 31 was as follows (in millions):
| | | | | | | | | | | | | | | | | | | | | | | |
| Defined Benefit Pension Plans | | OPEB Plans |
| Alliant Energy | 2024 | | 2023 | | 2024 | | 2023 |
| Change in benefit obligation: | | | | | | | |
| Net benefit obligation at January 1 | $876 | | | $875 | | | $160 | | | $168 | |
| Service cost | 5 | | | 5 | | | 2 | | | 2 | |
| Interest cost | 45 | | | 47 | | | 8 | | | 9 | |
| Plan participants’ contributions | — | | | — | | | 3 | | | 4 | |
| | | | | | | |
| | | | | | | |
| Actuarial (gain) loss | (19) | | | 23 | | | (7) | | | (3) | |
| | | | | | | |
| Gross benefits paid | (66) | | | (74) | | | (18) | | | (20) | |
| | | | | | | |
| Net benefit obligation at December 31 | 841 | | | 876 | | | 148 | | | 160 | |
| Change in plan assets: | | | | | | | |
| Fair value of plan assets at January 1 | 732 | | | 706 | | | 83 | | | 83 | |
| Actual return on plan assets | 38 | | | 86 | | | 5 | | | 8 | |
| Employer contributions | 11 | | | 14 | | | 7 | | | 8 | |
| Plan participants’ contributions | — | | | — | | | 3 | | | 4 | |
| Gross benefits paid | (66) | | | (74) | | | (18) | | | (20) | |
| Fair value of plan assets at December 31 | 715 | | | 732 | | | 80 | | | 83 | |
| Under funded status at December 31 | ($126) | | | ($144) | | | ($68) | | | ($77) | |
| | | | | | | | | | | | | | | | | | | | | | | |
| Defined Benefit Pension Plans | | OPEB Plans |
| Alliant Energy | 2024 | | 2023 | | 2024 | | 2023 |
| Amounts recognized on the balance sheets consist of: | | | | | | | |
| Non-current assets | $— | | | $— | | | $17 | | | $14 | |
| Current liabilities | (3) | | | (2) | | | (7) | | | (8) | |
| Pension and other benefit obligations | (123) | | | (142) | | | (78) | | | (83) | |
| Net amounts recognized at December 31 | ($126) | | | ($144) | | | ($68) | | | ($77) | |
| Amounts recognized in Regulatory Assets consist of: | | | | | | | |
| Net actuarial loss | $312 | | | $337 | | | $4 | | | $11 | |
| Prior service credit | (2) | | | (2) | | | — | | | — | |
| $310 | | | $335 | | | $4 | | | $11 | |
| | | | | | | | | | | | | | | | | | | | | | | |
| Defined Benefit Pension Plans | | OPEB Plans |
| IPL | 2024 | | 2023 | | 2024 | | 2023 |
| Change in benefit obligation: | | | | | | | |
| Net benefit obligation at January 1 | $387 | | | $389 | | | $65 | | | $68 | |
| Service cost | 3 | | | 3 | | | 1 | | | 1 | |
| Interest cost | 20 | | | 21 | | | 3 | | | 3 | |
| Plan participants’ contributions | — | | | — | | | 1 | | | 2 | |
| | | | | | | |
| | | | | | | |
| Actuarial (gain) loss | (8) | | | 9 | | | (3) | | | (1) | |
| | | | | | | |
| Gross benefits paid | (30) | | | (35) | | | (8) | | | (8) | |
| | | | | | | |
| Net benefit obligation at December 31 | 372 | | | 387 | | | 59 | | | 65 | |
| Change in plan assets: | | | | | | | |
| Fair value of plan assets at January 1 | 352 | | | 344 | | | 61 | | | 58 | |
| Actual return on plan assets | 18 | | | 42 | | | 4 | | | 7 | |
| Employer contributions | — | | | 1 | | | 1 | | | 2 | |
| Plan participants’ contributions | — | | | — | | | 1 | | | 2 | |
| Gross benefits paid | (30) | | | (35) | | | (8) | | | (8) | |
| Fair value of plan assets at December 31 | 340 | | | 352 | | | 59 | | | 61 | |
| Under funded status at December 31 | ($32) | | | ($35) | | | $— | | | ($4) | |
| | | | | | | | | | | | | | | | | | | | | | | |
| Defined Benefit Pension Plans | | OPEB Plans |
| IPL | 2024 | | 2023 | | 2024 | | 2023 |
| Amounts recognized on the balance sheets consist of: | | | | | | | |
| Non-current assets | $— | | | $— | | | $13 | | | $10 | |
| Current liabilities | (1) | | | — | | | (1) | | | (1) | |
| Pension and other benefit obligations | (31) | | | (35) | | | (12) | | | (13) | |
| Net amounts recognized at December 31 | ($32) | | | ($35) | | | $— | | | ($4) | |
| Amounts recognized in Regulatory Assets consist of: | | | | | | | |
| Net actuarial loss | $126 | | | $135 | | | $7 | | | $9 | |
| Prior service credit | (1) | | | (1) | | | — | | | — | |
| $125 | | | $134 | | | $7 | | | $9 | |
| | | | | | | | | | | | | | | | | | | | | | | |
| Defined Benefit Pension Plans | | OPEB Plans |
| WPL | 2024 | | 2023 | | 2024 | | 2023 |
| Change in benefit obligation: | | | | | | | |
| Net benefit obligation at January 1 | $381 | | | $381 | | | $61 | | | $65 | |
| Service cost | 2 | | | 2 | | | 1 | | | 1 | |
| Interest cost | 20 | | | 20 | | | 3 | | | 3 | |
| Plan participants’ contributions | — | | | — | | | 1 | | | 2 | |
| | | | | | | |
| | | | | | | |
| Actuarial (gain) loss | (8) | | | 10 | | | (3) | | | (2) | |
| | | | | | | |
| Gross benefits paid | (30) | | | (32) | | | (7) | | | (8) | |
| | | | | | | |
| Net benefit obligation at December 31 | 365 | | | 381 | | | 56 | | | 61 | |
| Change in plan assets: | | | | | | | |
| Fair value of plan assets at January 1 | 306 | | | 291 | | | 14 | | | 14 | |
| Actual return on plan assets | 17 | | | 35 | | | — | | | 1 | |
| Employer contributions | 10 | | | 12 | | | 5 | | | 5 | |
| Plan participants’ contributions | — | | | — | | | 1 | | | 2 | |
| Gross benefits paid | (30) | | | (32) | | | (7) | | | (8) | |
| Fair value of plan assets at December 31 | 303 | | | 306 | | | 13 | | | 14 | |
| Under funded status at December 31 | ($62) | | | ($75) | | | ($43) | | | ($47) | |
| | | | | | | | | | | | | | | | | | | | | | | |
| Defined Benefit Pension Plans | | OPEB Plans |
| WPL | 2024 | | 2023 | | 2024 | | 2023 |
| Amounts recognized on the balance sheets consist of: | | | | | | | |
| Non-current assets | $— | | | $— | | | $4 | | | $4 | |
| Current liabilities | — | | | — | | | (6) | | | (6) | |
| Pension and other benefit obligations | (62) | | | (75) | | | (41) | | | (45) | |
| Net amounts recognized at December 31 | ($62) | | | ($75) | | | ($43) | | | ($47) | |
| Amounts recognized in Regulatory Assets consist of: | | | | | | | |
| Net actuarial loss | $135 | | | $148 | | | $— | | | $3 | |
| | | | | | | |
| | | | | | | |
Accumulated benefit obligations, aggregate amounts applicable to defined benefit pension and OPEB plans with accumulated benefit obligations in excess of plan assets, as well as defined benefit pension plans with projected benefit obligations in excess of plan assets as of the December 31 measurement date are as follows (in millions):
| | | | | | | | | | | | | | | | | | | | | | | |
| Defined Benefit Pension Plans | | OPEB Plans |
| Alliant Energy | 2024 | | 2023 | | 2024 | | 2023 |
| Accumulated benefit obligations | $824 | | | $857 | | | $148 | | | $160 | |
| Plans with accumulated benefit obligations in excess of plan assets: | | | | | | | |
| Accumulated benefit obligations | 824 | | | 857 | | | 148 | | | 160 | |
| Fair value of plan assets | 715 | | | 732 | | | 80 | | | 83 | |
| Plans with projected benefit obligations in excess of plan assets: | | | | | | | |
| Projected benefit obligations | 841 | | | 876 | | | N/A | | N/A |
| Fair value of plan assets | 715 | | | 732 | | | N/A | | N/A |
| | | | | | | | | | | | | | | | | | | | | | | |
| Defined Benefit Pension Plans | | OPEB Plans |
| IPL | 2024 | | 2023 | | 2024 | | 2023 |
| Accumulated benefit obligations | $362 | | | $377 | | | $59 | | | $65 | |
| Plans with accumulated benefit obligations in excess of plan assets: | | | | | | | |
| Accumulated benefit obligations | 362 | | | 377 | | | N/A | | 65 | |
| Fair value of plan assets | 340 | | | 352 | | | N/A | | 61 | |
| Plans with projected benefit obligations in excess of plan assets: | | | | | | | |
| Projected benefit obligations | 372 | | | 387 | | | N/A | | N/A |
| Fair value of plan assets | 340 | | | 352 | | | N/A | | N/A |
| | | | | | | | | | | | | | | | | | | | | | | |
| Defined Benefit Pension Plans | | OPEB Plans |
| WPL | 2024 | | 2023 | | 2024 | | 2023 |
| Accumulated benefit obligations | $358 | | | $373 | | | $56 | | | $61 | |
| Plans with accumulated benefit obligations in excess of plan assets: | | | | | | | |
| Accumulated benefit obligations | 358 | | | 373 | | | 56 | | | 61 | |
| Fair value of plan assets | 303 | | | 306 | | | 13 | | | 14 | |
| Plans with projected benefit obligations in excess of plan assets: | | | | | | | |
| Projected benefit obligations | 365 | | | 381 | | | N/A | | N/A |
| Fair value of plan assets | 303 | | | 306 | | | N/A | | N/A |
In addition to the amounts recognized in regulatory assets in the above tables for IPL and WPL, regulatory assets were recognized for amounts associated with Corporate Services employees participating in other Alliant Energy sponsored benefit plans that were allocated to IPL and WPL at December 31 as follows (in millions):
| | | | | | | | | | | | | | | | | | | | | | | |
| IPL | | WPL |
| 2024 | | 2023 | | 2024 | | 2023 |
| Regulatory assets | $25 | | $28 | | $22 | | $24 |
| | | | | | | |
Estimated Future Employer Contributions and Benefit Payments - Estimated funding for the qualified and non-qualified defined benefit pension and OPEB plans for 2025 is as follows (in millions):
| | | | | | | | | | | | | | | | | |
| Alliant Energy | | IPL | | WPL |
| Defined benefit pension plans (a) | $20 | | $1 | | $14 |
| OPEB plans | 7 | | 1 | | 6 |
(a)Alliant Energy sponsors several non-qualified defined benefit pension plans that cover certain current and former key employees of IPL and WPL. Alliant Energy allocates pension costs to IPL and WPL for these plans. In addition, IPL and WPL amounts reflect funding for their non-bargaining employees who are participants in the Alliant Energy and Corporate Services sponsored qualified and non-qualified defined benefit pension plans.
Expected benefit payments for the qualified and non-qualified defined benefit plans, which reflect expected future service, as appropriate, are as follows (in millions):
| | | | | | | | | | | | | | | | | | | | | | | | | | | | | | | | | | | |
| Alliant Energy | 2025 | | 2026 | | 2027 | | 2028 | | 2029 | | 2030 - 2034 |
| Defined benefit pension benefits | $79 | | | $75 | | | $74 | | | $74 | | | $74 | | | $329 |
| OPEB | 16 | | | 16 | | | 15 | | | 15 | | | 14 | | | 62 |
| $95 | | | $91 | | | $89 | | | $89 | | | $88 | | | $391 |
| | | | | | | | | | | | | | | | | | | | | | | | | | | | | | | | | | | |
| IPL | 2025 | | 2026 | | 2027 | | 2028 | | 2029 | | 2030 - 2034 |
| Defined benefit pension benefits | $36 | | | $34 | | | $33 | | | $33 | | | $32 | | | $148 |
| OPEB | 7 | | | 6 | | | 6 | | | 6 | | | 6 | | | 24 |
| $43 | | | $40 | | | $39 | | | $39 | | | $38 | | | $172 |
| | | | | | | | | | | | | | | | | | | | | | | | | | | | | | | | | | | |
| WPL | 2025 | | 2026 | | 2027 | | 2028 | | 2029 | | 2030 - 2034 |
| Defined benefit pension benefits | $33 | | | $31 | | | $31 | | | $31 | | | $31 | | | $144 |
| OPEB | 7 | | | 6 | | | 6 | | | 5 | | | 5 | | | 23 |
| $40 | | | $37 | | | $37 | | | $36 | | | $36 | | | $167 |
Investment Strategy for Plan Assets - Investment strategies for defined benefit pension and OPEB plan assets combine preservation of principal and prudent risk-taking to protect the integrity of plan assets, in order to meet the obligations to plan participants while minimizing benefit costs over the long term. Investment risk of plan assets is mitigated through an asset mix, which is governed by allocation targets. The asset allocation is monitored regularly, and appropriate steps are taken as needed to rebalance the assets within the prescribed ranges.
Defined Benefit Pension Plan Assets - Defined benefit pension plan assets have a long-term investment time horizon and are classified into return-seeking and liability-hedging portfolios. The return-seeking portfolio includes: public equities with different market capitalization, investment style and geography; liquid alternative securities, which include hedge fund strategies; and fixed income investments, which include, but are not limited to, high-yield bonds, emerging market debt, bank loans and private credit bonds. The liability-hedging portfolio includes: fixed-income investments including investment grade instruments of government and corporate issuers, as well as private placements and securitized assets; and fixed income derivative contracts for liability and interest rate hedging positions. At December 31, 2024, the current target ranges and actual allocations for the defined benefit pension plan assets were as follows:
| | | | | | | | | | | | | | | | | |
| Target Range | | Actual |
| Allocation | | Allocation |
| | | | | |
| Public equity securities | 32% | - | 49% | | 44% |
| Liquid alternative securities | 0% | - | 12% | | 6% |
| Return-seeking fixed income securities | 4% | - | 18% | | 8% |
| Liability-hedging fixed income securities (including cash and equivalents) | 34% | - | 53% | | 42% |
| | | | | |
Other Postretirement Benefits Plan Assets - OPEB plan assets are comprised of specific assets within certain defined benefit pension plans (401(h) assets) as well as assets held in VEBA trusts. For asset pools with a long-term investment time horizon, investments include public equities with different market capitalization, investment style and geography, and fixed income securities including investment grade instruments of government and corporate issuers. At December 31, 2024, the current target ranges and actual allocations for assets with a long-term investment horizon were as follows:
| | | | | | | | | | | | | | | | | |
| Target Range | | Actual |
| Allocation | | Allocation |
| Cash and equivalents | 0% | - | 5% | | 1% |
| Public equity securities | 0% | - | 40% | | 27% |
| | | | | |
| | | | | |
| Fixed income securities | 40% | - | 100% | | 72% |
Fair Value Measurements - Fair value measurement accounting establishes three levels of fair value hierarchy that prioritize the inputs to valuation techniques used to measure fair value. Refer to Note 15 for discussion of levels within the fair value hierarchy. Level 1 items include investments in securities held in registered investment companies, which are valued at the closing price reported in the active market in which the securities are traded. Level 2 items include cash and equivalents consisting of money market fund investments and cash collateral supporting derivative financial instruments. Certain investments that are measured at fair value using the net asset value practical expedient have not been classified in the fair value hierarchy. These fair value amounts are included below to reconcile the fair value hierarchy to the respective total plan assets.
At December 31, the fair values of qualified and non-qualified defined benefit pension plan assets were as follows (in millions):
| | | | | | | | | | | | | | | | | | | | | | | | | | | | | | | | | | | | | | | | | | | | | | | |
| 2024 | | 2023 |
| Fair | | Level | | Level | | Level | | Fair | | Level | | Level | | Level |
| Alliant Energy | Value | | 1 | | 2 | | 3 | | Value | | 1 | | 2 | | 3 |
| Cash and equivalents | $49 | | | $— | | | $49 | | | $— | | | $19 | | | $— | | | $19 | | | $— | |
| Equity securities | — | | | — | | | — | | | — | | | 223 | | | 223 | | | — | | | — | |
| | | | | | | | | | | | | | | |
| Global asset securities | — | | | — | | | — | | | — | | | 39 | | | 39 | | | — | | | — | |
| Fixed income securities | — | | | — | | | — | | | — | | | 143 | | | 31 | | | 112 | | | — | |
| Total assets in fair value hierarchy | 49 | | | $— | | | $49 | | | $— | | | 424 | | | $293 | | | $131 | | | $— | |
| Assets measured at net asset value | 667 | | | | | | | | | 306 | | | | | | | |
| Accrued investment income | — | | | | | | | | | 2 | | | | | | | |
| Due to brokers, net (pending trades with brokers) | (1) | | | | | | | | | — | | | | | | | |
| Total pension plan assets | $715 | | | | | | | | | $732 | | | | | | | |
| | | | | | | | | | | | | | | | | | | | | | | | | | | | | | | | | | | | | | | | | | | | | | | |
| 2024 | | 2023 |
| Fair | | Level | | Level | | Level | | Fair | | Level | | Level | | Level |
| IPL | Value | | 1 | | 2 | | 3 | | Value | | 1 | | 2 | | 3 |
| Cash and equivalents | $21 | | | $— | | | $21 | | | $— | | | $9 | | | $— | | | $9 | | | $— | |
| Equity securities | — | | | — | | | — | | | — | | | 107 | | | 107 | | | — | | | — | |
| | | | | | | | | | | | | | | |
| Global asset securities | — | | | — | | | — | | | — | | | 19 | | | 19 | | | — | | | — | |
| Fixed income securities | — | | | — | | | — | | | — | | | 69 | | | 15 | | | 54 | | | — | |
| Total assets in fair value hierarchy | 21 | | | $— | | | $21 | | | $— | | | 204 | | | $141 | | | $63 | | | $— | |
| Assets measured at net asset value | 319 | | | | | | | | | 147 | | | | | | | |
| Accrued investment income | — | | | | | | | | | 1 | | | | | | | |
| | | | | | | | | | | | | | | |
| Total pension plan assets | $340 | | | | | | | | | $352 | | | | | | | |
| | | | | | | | | | | | | | | | | | | | | | | | | | | | | | | | | | | | | | | | | | | | | | | |
| 2024 | | 2023 |
| Fair | | Level | | Level | | Level | | Fair | | Level | | Level | | Level |
| WPL | Value | | 1 | | 2 | | 3 | | Value | | 1 | | 2 | | 3 |
| Cash and equivalents | $22 | | | $— | | | $22 | | | $— | | | $8 | | | $— | | | $8 | | | $— | |
| Equity securities | — | | | — | | | — | | | — | | | 93 | | | 93 | | | — | | | — | |
| | | | | | | | | | | | | | | |
| Global asset securities | — | | | — | | | — | | | — | | | 16 | | | 16 | | | — | | | — | |
| Fixed income securities | — | | | — | | | — | | | — | | | 60 | | | 13 | | | 47 | | | — | |
| Total assets in fair value hierarchy | 22 | | | $— | | | $22 | | | $— | | | 177 | | | $122 | | | $55 | | | $— | |
| Assets measured at net asset value | 281 | | | | | | | | | 128 | | | | | | | |
| Accrued investment income | — | | | | | | | | | 1 | | | | | | | |
| | | | | | | | | | | | | | | |
| Total pension plan assets | $303 | | | | | | | | | $306 | | | | | | | |
At December 31, the fair values of OPEB plan assets were as follows (in millions):
| | | | | | | | | | | | | | | | | | | | | | | | | | | | | | | | | | | | | | | | | | | | | | | |
| 2024 | | 2023 |
| Fair | | Level | | Level | | Level | | Fair | | Level | | Level | | Level |
| Alliant Energy | Value | | 1 | | 2 | | 3 | | Value | | 1 | | 2 | | 3 |
| Cash and equivalents | $8 | | | $— | | | $8 | | | $— | | | $9 | | | $— | | | $9 | | | $— | |
| Equity securities | 20 | | | 20 | | | — | | | — | | | 8 | | | 8 | | | — | | | — | |
| | | | | | | | | | | | | | | |
| | | | | | | | | | | | | | | |
| Fixed income securities | 52 | | | 52 | | | — | | | — | | | 47 | | | 47 | | | — | | | — | |
| Total assets in fair value hierarchy | 80 | | | $72 | | | $8 | | | $— | | | 64 | | | $55 | | | $9 | | | $— | |
| Assets measured at net asset value | — | | | | | | | | | 19 | | | | | | | |
| | | | | | | | | | | | | | | |
| | | | | | | | | | | | | | | |
| Total OPEB plan assets | $80 | | | | | | | | | $83 | | | | | | | |
| | | | | | | | | | | | | | | | | | | | | | | | | | | | | | | | | | | | | | | | | | | | | | | |
| 2024 | | 2023 |
| Fair | | Level | | Level | | Level | | Fair | | Level | | Level | | Level |
| IPL | Value | | 1 | | 2 | | 3 | | Value | | 1 | | 2 | | 3 |
| Cash and equivalents | $1 | | | $— | | | $1 | | | $— | | | $1 | | | $— | | | $1 | | | $— | |
| Equity securities | 18 | | | 18 | | | — | | | — | | | 6 | | | 6 | | | — | | | — | |
| | | | | | | | | | | | | | | |
| | | | | | | | | | | | | | | |
| Fixed income securities | 40 | | | 40 | | | — | | | — | | | 36 | | | 36 | | | — | | | — | |
| Total assets in fair value hierarchy | 59 | | | $58 | | | $1 | | | $— | | | 43 | | | $42 | | | $1 | | | $— | |
| Assets measured at net asset value | — | | | | | | | | | 18 | | | | | | | |
| | | | | | | | | | | | | | | |
| | | | | | | | | | | | | | | |
| Total OPEB plan assets | $59 | | | | | | | | | $61 | | | | | | | |
| | | | | | | | | | | | | | | | | | | | | | | | | | | | | | | | | | | | | | | | | | | | | | | |
| 2024 | | 2023 |
| Fair | | Level | | Level | | Level | | Fair | | Level | | Level | | Level |
| WPL | Value | | 1 | | 2 | | 3 | | Value | | 1 | | 2 | | 3 |
| Cash and equivalents | $— | | | $— | | | $— | | | $— | | | $1 | | | $— | | | $1 | | | $— | |
| Equity securities | 2 | | | 2 | | | — | | | — | | | 2 | | | 2 | | | — | | | — | |
| Fixed income securities | 11 | | | 11 | | | — | | | — | | | 11 | | | 11 | | | — | | | — | |
| Total OPEB plan assets | $13 | | | $13 | | | $— | | | $— | | | $14 | | | $13 | | | $1 | | | $— | |
| | | | | | | | | | | | | | | |
| | | | | | | | | | | | | | | |
| | | | | | | | | | | | | | | |
| | | | | | | | | | | | | | | |
For the various defined benefit pension and OPEB plans, Alliant Energy common stock represented less than 1% of assets directly held in the plans at December 31, 2024 and 2023.
401(k) Savings Plans - A significant number of employees participate in defined contribution retirement plans (401(k) savings plans). Alliant Energy common stock directly held by participants represented 7% and 8% of total assets in the 401(k) savings plans at December 31, 2024 and 2023, respectively. Costs related to the 401(k) savings plans, which are partially based on the participants’ contributions and include allocated costs associated with Corporate Services employees for IPL and WPL, were as follows (in millions):
| | | | | | | | | | | | | | | | | | | | | | | | | | | | | | | | | | | | | | | | | | | | | | | | | | | | | |
| Alliant Energy | | IPL | | WPL |
| 2024 | | 2023 | | 2022 | | 2024 | | 2023 | | 2022 | | 2024 | | 2023 | | 2022 |
| 401(k) costs | $31 | | | $30 | | | $28 | | | $14 | | | $14 | | | $13 | | | $15 | | | $14 | | | $13 | |
Restructuring and Voluntary Employee Separation Charges - In 2024, Alliant Energy announced restructuring activities, including offering certain employees a voluntary separation package. Approximately 5% of total Alliant Energy employees accepted the package, and as a result of the restructuring activities, Alliant Energy, IPL and WPL recorded pre-tax charges of $29 million, $14 million and $13 million, respectively, in 2024. These charges were primarily recorded in “Other operation and maintenance” expenses in the income statements.
NOTE 12(b) Equity-based Compensation Plans - In 2020, Alliant Energy’s shareowners approved the 2020 OIP, which permits the grant of shares of Alliant Energy common stock, restricted stock, restricted stock units, performance shares, performance units, and other stock-based or cash-based awards to key employees. At December 31, 2024, performance shares and restricted stock units were outstanding under the 2020 OIP, and 7 million shares of Alliant Energy common stock remained available for grants under the 2020 OIP. Alliant Energy satisfies share payouts related to equity awards through the issuance of new shares of its common stock. Nonvested awards generally do not have non-forfeitable rights to dividends or dividend equivalents when dividends are paid to common shareowners. A summary of compensation expense, including amounts allocated to IPL and WPL, and the related income tax benefits recognized for share-based compensation awards was as follows (in millions):
| | | | | | | | | | | | | | | | | | | | | | | | | | | | | | | | | | | | | | | | | | | | | | | | | | | | | |
| Alliant Energy | | IPL | | WPL |
| 2024 | | 2023 | | 2022 | | 2024 | | 2023 | | 2022 | | 2024 | | 2023 | | 2022 |
| Compensation expense | $12 | | $12 | | $13 | | $6 | | $6 | | $7 | | $5 | | $5 | | $5 |
| Income tax benefits | 3 | | 3 | | 3 | | 2 | | 2 | | 2 | | 1 | | 1 | | 1 |
As of December 31, 2024, Alliant Energy’s, IPL’s and WPL’s total unrecognized compensation cost related to share-based compensation awards was $10 million, $5 million and $5 million, respectively, which is expected to be recognized over a weighted average period of between one year and two years. Share-based compensation expense is recognized on a straight-line basis over the requisite service periods and is recorded in “Other operation and maintenance” in the income statements. As of December 31, 2024, 564,743 shares were included in the calculation of diluted EPS related to the nonvested equity awards.
Performance Shares (Total Shareowner Return Metric) - Payouts of certain performance shares are contingent upon achievement over a three-year period of specified performance criteria, which currently is total shareowner return relative to an investor-owned utility peer group. Performance shares grants are to be paid out in shares of Alliant Energy common stock and are accounted for as equity awards. The fair value of each of these performance shares is based on the fair value of the underlying common stock on the grant date and the probability of satisfying the market condition contained in the agreement during a three-year performance period. The actual number of these performance shares that will be paid out upon vesting is dependent upon actual performance and may range from zero to 200% of the target number of shares. If minimum performance targets are not met during the performance period, these performance shares are forfeited. Compensation expense is recorded ratably over the performance period based on the fair value of the awards at the grant date. A summary of the performance shares activity, with amounts representing the target number of awards, was as follows:
| | | | | | | | | | | | | | | | | | | | | | | | | | | | | | | | | | | |
| 2024 | | 2023 | | 2022 |
| Shares | | Weighted
Average Grant
Date Fair Value | | Shares | | Weighted
Average Grant
Date Fair Value | | Shares | | Weighted
Average Grant
Date Fair Value |
| Nonvested awards, January 1 | 233,954 | | $52.60 | | 190,273 | | $54.13 | | 196,429 | | $51.59 |
| Granted | 127,874 | | 46.04 | | 108,712 | | 55.68 | | 74,106 | | 54.45 |
| Vested | (47,497) | | 46.19 | | (53,431) | | 64.04 | | (71,101) | | 47.48 |
| Forfeited | (24,932) | | 46.16 | | (11,600) | | 53.88 | | (9,161) | | 53.99 |
| Nonvested awards, December 31 | 289,399 | | 51.31 | | 233,954 | | 52.60 | | 190,273 | | 54.13 |
Restricted Stock Units - Payouts of restricted stock units are based on the expiration of a three-year time-vesting period. Restricted stock unit grants are to be paid out in shares of Alliant Energy common stock and are accounted for as equity awards. The fair value of each of these restricted stock units is based on the closing market price of one share of Alliant Energy common stock on the grant date of the award. Compensation expense is recorded ratably over the performance period based on the fair value of the awards on the grant date. A summary of the restricted stock units activity was as follows:
| | | | | | | | | | | | | | | | | | | | | | | | | | | | | | | | | | | |
| 2024 | | 2023 | | 2022 |
| Units | | Weighted
Average Grant
Date Fair Value | | Units | | Weighted
Average Grant
Date Fair Value | | Units | | Weighted
Average Grant
Date Fair Value |
| Nonvested awards, January 1 | 234,259 | | $52.58 | | 198,275 | | $54.53 | | 217,819 | | $50.54 |
| Granted | 129,854 | | 48.69 | | 106,124 | | 52.77 | | 77,122 | | 56.88 |
| Vested | (71,441) | | 48.65 | | (55,345) | | 59.40 | | (82,770) | | 46.08 |
| Forfeited | (3,524) | | 48.40 | | (14,795) | | 54.53 | | (13,896) | | 55.53 |
| Nonvested awards, December 31 | 289,148 | | 51.85 | | 234,259 | | 52.58 | | 198,275 | | 54.53 |
Performance Shares (Net Income and Workforce Composition Metrics) (formerly granted as Performance Restricted Stock Units) - Payouts of certain performance shares are contingent upon achievement over a three-year period of specific performance criteria, which currently is specified growth of cumulative consolidated net income from continuing operations, as well as a workforce composition metric. Performance shares grants are to be paid out in shares of Alliant Energy common stock and are accounted for as equity awards. The fair value of each of these performance shares is based on the closing market price of one share of Alliant Energy common stock on the grant date of the award. The actual number of these performance shares that will be paid out upon vesting is dependent upon actual performance and may range from zero to 200% of the target number of shares under each award type. If minimum performance targets are not met during the performance period, these performance shares are forfeited. Compensation expense is recorded ratably over the performance period based on a probability assessment of payouts for the awards at each reporting period. A summary of the performance shares activity, with amounts representing the target number of awards, was as follows:
| | | | | | | | | | | | | | | | | | | | | | | | | | | | | | | | | | | |
| 2024 | | 2023 | | 2022 |
| Shares | | Weighted Average Grant Date Fair Value | | Shares | | Weighted Average Grant Date Fair Value | | Shares | | Weighted Average Grant Date Fair Value |
| Nonvested awards, January 1 | 257,639 | | $52.76 | | 199,874 | | $54.74 | | 196,429 | | $50.74 |
| Granted | 146,143 | | 48.55 | | 124,217 | | 52.71 | | 84,670 | | 57.01 |
| Vested | (67,852) | | 48.66 | | (53,431) | | 59.36 | | (71,101) | | 46.24 |
| Forfeited | (5,230) | | 48.40 | | (13,021) | | 55.47 | | (10,124) | | 55.92 |
| Nonvested awards, December 31 | 330,700 | | 51.81 | | 257,639 | | 52.76 | | 199,874 | | 54.74 |
NOTE 12(c) Deferred Compensation Plan - Alliant Energy maintains a DCP under which certain key employees may defer up to 100% of base salary and short-term cash incentive compensation and members of its Board of Directors may elect to defer all or part of their retainer and committee fees. Key employees who have made the maximum allowed contribution to the Alliant Energy 401(k) Savings Plan may receive an additional credit to the DCP. Key employees and Board of Directors members may elect to have their deferrals credited to a company stock account, an interest account, equity accounts or mutual fund accounts based on certain benchmark funds.
Company Stock Account - The DCP does not permit reallocation of deferrals credited to the company stock account and all distributions from participants’ company stock accounts are made in the form of shares of Alliant Energy common stock. The deferred compensation obligations for participants’ company stock accounts are recorded in “Additional paid-in capital” and the shares of Alliant Energy common stock held in a rabbi trust to satisfy this obligation are recorded in “Shares in deferred compensation trust” on Alliant Energy’s balance sheets. At December 31, the carrying value of the deferred compensation obligation for the company stock account and the shares in the deferred compensation trust based on the historical value of the shares of Alliant Energy common stock contributed to the rabbi trust, and the fair market value of the shares held in the rabbi trust, were as follows (in millions):
| | | | | | | | | | | |
| 2024 | | 2023 |
| Carrying value | $14 | | $13 |
| Fair market value | 22 | | 19 |
Interest, Equity and Mutual Fund Accounts - Distributions from participants’ interest, equity and mutual fund accounts are in the form of cash payments. The deferred compensation obligations for participants’ interest, equity and mutual fund accounts are recorded in “Pension and other benefit obligations” on the balance sheets. At December 31, 2024 and 2023, the carrying value of Alliant Energy’s deferred compensation obligations for participants’ interest, equity and mutual fund accounts, which approximates fair market value, was $23 million and $21 million, respectively.
NOTE 13. ASSET RETIREMENT OBLIGATIONS
Recognized AROs relate to legal obligations for the removal, closure, dismantlement and management of several assets including, but not limited to, active and inactive ash landfills, ash ponds, wind farms, groundwater, solar facilities, above ground storage tanks and batteries. Recognized AROs also include legal obligations for the management and final disposition of asbestos and polychlorinated biphenyls. AROs are recorded in “Other current liabilities” and “Other liabilities” on the balance sheets. Refer to Note 2 for information regarding regulatory assets related to AROs. A reconciliation of the changes in AROs associated with long-lived assets is as follows (in millions): | | | | | | | | | | | | | | | | | | | | | | | | | | | | | | | | | | | |
| Alliant Energy | | IPL | | WPL |
| 2024 | | 2023 | | 2024 | | 2023 | | 2024 | | 2023 |
| Balance, January 1 | $246 | | | $279 | | | $148 | | | $195 | | | $98 | | | $84 | |
| Revisions in estimated cash flows | (3) | | | (6) | | | (1) | | | (9) | | | (2) | | | 3 | |
| Liabilities settled | (8) | | | (51) | | | (6) | | | (44) | | | (2) | | | (7) | |
| Liabilities incurred (a) | 409 | | | 16 | | | 201 | | | 1 | | | 208 | | | 15 | |
| Accretion expense | 19 | | | 8 | | | 8 | | | 5 | | | 11 | | | 3 | |
| Balance, December 31 | $663 | | | $246 | | | $350 | | | $148 | | | $313 | | | $98 | |
(a)In 2024, substantially due to the enactment of the revised CCR Rule, which significantly expands the scope of regulation to include coal ash ponds at sites that no longer produce electricity and inactive landfills, including some IPL and WPL facilities, Alliant Energy, IPL and WPL initially recorded additional AROs, additional ARO regulatory assets for EGUs no longer in operation, additional property, plant and equipment for EGUs still in operation, and a pre-tax non-cash charge of $20 million recorded to “Other operation and maintenance” in Alliant Energy’s and IPL’s income statements for the portion allocated to IPL’s steam business for IPL’s Prairie Creek Generating Station and the retired Sixth Street Generating Station as established in prior rate reviews. The amounts initially recorded in 2024 are expected to be adjusted in the future as additional information is obtained for the specific site closure plans, including the determination of whether or not individual sites are considered legal obligations and the acceptance and approval of compliance approaches, which could change management assumptions and result in a material change to the recorded amounts.
NOTE 14. DERIVATIVE INSTRUMENTS
Commodity Derivatives -
Purpose - Derivative instruments were utilized for risk management purposes to mitigate pricing volatility for fuel used to supply natural gas-fired EGUs, natural gas supplied to retail customers, and purchased electricity, as well as optimize the value of natural gas pipeline capacity and electric generation, which may include swap, physical forward and option contracts. In addition, FTRs help manage transmission congestion costs in the MISO market. Risk policies are maintained that govern the use of such derivative instruments.
Notional Amounts - As of December 31, 2024, gross notional amounts and settlement/delivery years related to outstanding swap contracts, option contracts, physical forward contracts and FTRs that were accounted for as commodity derivative instruments were as follows (units in thousands):
| | | | | | | | | | | | | | | | | | | | | | | | | | | | | | | | | | | | | | | | | | | | | | | | | | | |
| Electricity | | FTRs | | Natural Gas | | | | Diesel Fuel |
| MWhs | | Years | | MWhs | | Years | | Dths | | Years | | | | | | Gallons | | Years |
| Alliant Energy | 1,422 | | | 2025-2026 | | 10,232 | | | 2025 | | 147,894 | | | 2025-2032 | | | | | | 2,520 | | | 2025 |
| IPL | 383 | | | 2025-2026 | | 3,551 | | | 2025 | | 61,489 | | | 2025-2030 | | | | | | — | | | — |
| WPL | 1,039 | | | 2025-2026 | | 6,681 | | | 2025 | | 86,405 | | | 2025-2032 | | | | | | 2,520 | | | 2025 |
Financial Statement Presentation - Derivative instruments are recorded at fair value each reporting date on the balance sheet as assets or liabilities. At December 31, the fair values of current derivative assets are included in “Other current assets,” non-current derivative assets are included in “Deferred charges and other,” current derivative liabilities are included in “Other current liabilities” and non-current derivative liabilities are included in “Other liabilities” on the balance sheets as follows (in millions):
| | | | | | | | | | | | | | | | | | | | | | | | | | | | | | | | | | | |
| Alliant Energy | | IPL | | WPL |
| 2024 | | 2023 | | 2024 | | 2023 | | 2024 | | 2023 |
| Current derivative assets | $41 | | $44 | | $29 | | $30 | | $12 | | $14 |
| Non-current derivative assets | 34 | | 44 | | 19 | | 24 | | 15 | | 20 |
| Current derivative liabilities | 26 | | 51 | | 11 | | 22 | | 15 | | 29 |
| Non-current derivative liabilities | 32 | | 47 | | 2 | | 8 | | 30 | | 39 |
In 2024, Alliant Energy’s, IPL’s and WPL’s derivative liabilities decreased primarily due to settlements of natural gas contracts and higher natural gas prices. Based on IPL’s and WPL’s cost recovery mechanisms, the changes in the fair value of derivative liabilities/assets resulted in comparable changes to regulatory assets/liabilities on the balance sheets.
Credit Risk-related Contingent Features - Various agreements contain credit risk-related contingent features, including requirements to maintain certain credit ratings and/or limitations on liability positions under the agreements based on credit ratings. Certain of these agreements with credit risk-related contingency features are accounted for as derivative instruments. In the event of a material change in creditworthiness or if liability positions exceed certain contractual limits, credit support may need to be provided up to the amount of exposure under the contracts, or the contracts may need to be unwound and underlying liability positions paid. At December 31, 2024 and 2023, the aggregate fair value of all derivative instruments with credit risk-related contingent features in a net liability position was not materially different than amounts that would be required to be posted as credit support to counterparties by Alliant Energy, IPL or WPL if the most restrictive credit risk-related contingent features for derivative agreements in a net liability position were triggered.
Balance Sheet Offsetting - The fair value amounts of derivative instruments subject to a master netting arrangement are not netted by counterparty on the balance sheets. However, if the fair value amounts of derivative instruments by counterparty were netted, derivative assets and derivative liabilities related to commodity contracts would have been presented on the balance sheets at December 31 as follows:
| | | | | | | | | | | | | | | | | | | | | | | | | | | | | | | | | | | |
| Alliant Energy | | IPL | | WPL |
| Gross | | | | Gross | | | | Gross | | |
| (as reported) | | Net | | (as reported) | | Net | | (as reported) | | Net |
| 2024 | | | | | | | | | | | |
| Derivative assets | $75 | | $64 | | $48 | | $43 | | $27 | | $21 |
| Derivative liabilities | 58 | | 47 | | 13 | | 8 | | 45 | | 39 |
| 2023 | | | | | | | | | | | |
| Derivative assets | 88 | | 47 | | 54 | | 32 | | 34 | | 15 |
| Derivative liabilities | 98 | | 57 | | 30 | | 8 | | 68 | | 49 |
Fair value amounts recognized for the right to reclaim cash collateral (receivable) or the obligation to return cash collateral (payable) are not offset against fair value amounts recognized for derivative instruments executed with the same counterparty under the same master netting arrangement.
Interest Rate Derivative - In January 2023, AEF entered into a $300 million interest rate swap maturing in January 2026 to mitigate interest rate risk. Under the terms of the swap, AEF exchanged a variable interest rate for a fixed interest rate of 3.93% on a portion of its variable-rate term loan borrowings. The related interest rate derivative was valued based on quoted prices that utilize current market interest rate forecasts. As of both December 31, 2024 and 2023, $1 million of non-current interest rate derivative assets was recorded in “Deferred charges and other” on Alliant Energy’s balance sheets. This interest rate derivative was designated as a cash flow hedge, with changes in fair value recorded as other comprehensive income/loss. As of both December 31, 2024 and 2023, accumulated other comprehensive income included $1 million of income related to the interest rate swap. In 2024 and 2023, $4 million and $3 million, respectively, of reductions to interest expense were recorded in Alliant Energy’s income statement related to the interest rate swap.
NOTE 15. FAIR VALUE MEASUREMENTS
Valuation Hierarchy - Fair value measurement accounting establishes three levels of fair value hierarchy that prioritize the inputs to valuation techniques used to measure fair value. Level 1 pricing inputs are quoted prices available in active markets for identical assets or liabilities as of the reporting date. Level 2 pricing inputs are quoted prices for similar assets or liabilities in active markets or quoted prices for identical or similar assets or liabilities in markets that are not active as of the reporting date. Level 3 pricing inputs are unobservable inputs for assets or liabilities for which little or no market data exist and require significant management judgment or estimation.
The fair value hierarchy gives the highest priority to quoted prices in active markets (Level 1) and the lowest priority to unobservable data (Level 3). In some cases, the inputs used to measure fair value might fall in different levels of the fair value hierarchy. The lowest level input that is significant to a fair value measurement in its entirety determines the applicable level in the fair value hierarchy. Assessing the significance of a particular input to the fair value measurement in its entirety requires judgment, considering factors specific to the asset or liability.
Valuation Techniques -
Derivative assets and derivative liabilities - Swap, option and physical forward commodity contracts were non-exchange-based derivative instruments and were valued using indicative price quotations from a pricing vendor that provides daily exchange forward price settlements, from broker or dealer quotations, from market publications or from on-line exchanges. The indicative price quotations reflected the average of the bid-ask mid-point prices and were obtained from sources believed to provide the most liquid market for the commodity. A portion of these indicative price quotations were corroborated using quoted prices for similar assets or liabilities in active markets and categorized derivative instruments based on such indicative price quotations as Level 2. Commodity contracts that were valued using indicative price quotations based on significant assumptions such as seasonal or monthly shaping and indicative price quotations that could not be readily corroborated were categorized as Level 3. Swap, option and physical forward commodity contracts were predominately at liquid trading points.
FTRs were valued using auction prices and were categorized as Level 3. Refer to Note 14 for additional details of derivative assets and derivative liabilities.
Deferred proceeds (sales of receivables) - The fair value of IPL’s deferred proceeds related to its sales of accounts receivable program was calculated each reporting date using the cost approach valuation technique. The fair value represents the carrying amount of receivables sold less the allowance for expected credit losses associated with the receivables sold and cash amounts received from the receivables sold due to the short-term nature of the collection period. These inputs were considered unobservable and deferred proceeds were categorized as Level 3. Deferred proceeds represent IPL’s maximum exposure to loss related to the receivables sold. Refer to Note 5(b) for additional information regarding deferred proceeds.
Long-term debt (including current maturities) - The fair value of long-term debt instruments was based on a discounted cash flow methodology using observable data from comparably traded securities with similar credit profiles, and was classified as Level 2. Refer to Note 8(b) for additional information regarding long-term debt.
Fair Value of Financial Instruments - The carrying amounts of current assets and current liabilities approximate fair value because of the short maturity of such financial instruments. Carrying amounts and related estimated fair values of other financial instruments at December 31 were as follows (in millions):
| | | | | | | | | | | | | | | | | | | | | | | | | | | | | | | | | | | | | | | | | | | | | | | | | | | | | | | | | | | |
| Alliant Energy | 2024 | | 2023 |
| | | Fair Value | | | | Fair Value |
| Carrying | | Level | | Level | | Level | | | | Carrying | | Level | | Level | | Level | | |
| Amount | | 1 | | 2 | | 3 | | Total | | Amount | | 1 | | 2 | | 3 | | Total |
| Assets: | | | | | | | | | | | | | | | | | | | |
| Money market fund investments | $52 | | | $52 | | | $— | | | $— | | | $52 | | | $45 | | | $45 | | | $— | | | $— | | | $45 | |
| Commodity derivatives | 75 | | | — | | | 48 | | | 27 | | | 75 | | | 88 | | | — | | | 59 | | | 29 | | | 88 | |
| Interest rate derivatives | 1 | | | — | | | 1 | | | — | | | 1 | | | 1 | | | — | | | 1 | | | — | | | 1 | |
| Deferred proceeds | 163 | | | — | | | — | | | 163 | | | 163 | | | 216 | | | — | | | — | | | 216 | | | 216 | |
| Liabilities: | | | | | | | | | | | | | | | | | | | |
| Commodity derivatives | 58 | | | — | | | 56 | | | 2 | | | 58 | | | 98 | | | — | | | 93 | | | 5 | | | 98 | |
| | | | | | | | | | | | | | | | | | | |
| Long-term debt (incl. current maturities) | 9,848 | | | — | | | 9,577 | | | — | | | 9,577 | | | 9,034 | | | — | | | 8,677 | | | — | | | 8,677 | |
| | | | | | | | | | | | | | | | | | | | | | | | | | | | | | | | | | | | | | | | | | | | | | | | | | | | | | | | | | | |
| IPL | 2024 | | 2023 |
| | | Fair Value | | | | Fair Value |
| Carrying | | Level | | Level | | Level | | | | Carrying | | Level | | Level | | Level | | |
| Amount | | 1 | | 2 | | 3 | | Total | | Amount | | 1 | | 2 | | 3 | | Total |
| Assets: | | | | | | | | | | | | | | | | | | | |
| Money market fund investments | $9 | | | $9 | | | $— | | | $— | | | $9 | | | $45 | | | $45 | | | $— | | | $— | | | $45 | |
| Commodity derivatives | 48 | | | — | | | 26 | | | 22 | | | 48 | | | 54 | | | — | | | 30 | | | 24 | | | 54 | |
| Deferred proceeds | 163 | | | — | | | — | | | 163 | | | 163 | | | 216 | | | — | | | — | | | 216 | | | 216 | |
| Liabilities: | | | | | | | | | | | | | | | | | | | |
| Commodity derivatives | 13 | | | — | | | 11 | | | 2 | | | 13 | | | 30 | | | — | | | 25 | | | 5 | | | 30 | |
| Long-term debt (incl. current maturities) | 4,090 | | | — | | | 3,736 | | | — | | | 3,736 | | | 3,945 | | | — | | | 3,664 | | | — | | | 3,664 | |
| | | | | | | | | | | | | | | | | | | | | | | | | | | | | | | | | | | | | | | | | | | | | | | | | | | | | | | | | | | |
| WPL | 2024 | | 2023 |
| | | Fair Value | | | | Fair Value |
| Carrying | | Level | | Level | | Level | | | | Carrying | | Level | | Level | | Level | | |
| Amount | | 1 | | 2 | | 3 | | Total | | Amount | | 1 | | 2 | | 3 | | Total |
| Assets: | | | | | | | | | | | | | | | | | | | |
| Money market fund investments | $43 | | | $43 | | | $— | | | $— | | | $43 | | | $— | | | $— | | | $— | | | $— | | | $— | |
| Commodity derivatives | 27 | | | — | | | 22 | | | 5 | | | 27 | | | 34 | | | — | | | 29 | | | 5 | | | 34 | |
| Liabilities: | | | | | | | | | | | | | | | | | | | |
| Commodity derivatives | 45 | | | — | | | 45 | | | — | | | 45 | | | 68 | | | — | | | 68 | | | — | | | 68 | |
| Long-term debt | 3,370 | | | — | | | 3,170 | | | — | | | 3,170 | | | 3,070 | | | — | | | 2,933 | | | — | | | 2,933 | |
Information for fair value measurements using significant unobservable inputs (Level 3 inputs) was as follows (in millions):
| | | | | | | | | | | | | | | | | | | | | | | |
| Alliant Energy | Commodity Contract Derivative | | |
| Assets and (Liabilities), net | | Deferred Proceeds |
| 2024 | | 2023 | | 2024 | | 2023 |
| Beginning balance, January 1 | $24 | | $19 | | $216 | | $185 |
| Total net gains (losses) included in changes in net assets (realized/unrealized) | (3) | | 3 | | — | | — |
| | | | | | | |
| | | | | | | |
| Purchases | 59 | | 62 | | — | | — |
| Sales | (3) | | (3) | | — | | — |
| Settlements (a) | (52) | | (57) | | (53) | | 31 |
| Ending balance, December 31 | $25 | | $24 | | $163 | | $216 |
| The amount of total net gains (losses) for the period included in changes in net assets attributable to the change in unrealized gains (losses) relating to assets and liabilities held at December 31 | ($3) | | $3 | | $— | | $— |
| | | | | | | | | | | | | | | | | | | | | | | |
| IPL | Commodity Contract Derivative | | |
| Assets and (Liabilities), net | | Deferred Proceeds |
| 2024 | | 2023 | | 2024 | | 2023 |
| Beginning balance, January 1 | $19 | | $16 | | $216 | | $185 |
| Total net losses included in changes in net assets (realized/unrealized) | (4) | | (3) | | — | | — |
| | | | | | | |
| | | | | | | |
| Purchases | 45 | | 51 | | — | | — |
| Sales | (2) | | (3) | | — | | — |
| Settlements (a) | (38) | | (42) | | (53) | | 31 |
| Ending balance, December 31 | $20 | | $19 | | $163 | | $216 |
| The amount of total net losses for the period included in changes in net assets attributable to the change in unrealized losses relating to assets and liabilities held at December 31 | ($4) | | ($3) | | $— | | $— |
| | | | | | | | | | | |
| WPL | Commodity Contract Derivative |
| Assets and (Liabilities), net |
| 2024 | | 2023 |
| Beginning balance, January 1 | $5 | | $3 |
| Total net gains included in changes in net assets (realized/unrealized) | 1 | | 6 |
| | | |
| | | |
| Purchases | 14 | | 11 |
| Sales | (1) | | — |
| Settlements | (14) | | (15) |
| Ending balance, December 31 | $5 | | $5 |
| The amount of total net gains for the period included in changes in net assets attributable to the change in unrealized gains relating to assets and liabilities held at December 31 | $1 | | $6 |
(a)Settlements related to deferred proceeds are due to the change in the carrying amount of receivables sold less the allowance for expected credit losses associated with the receivables sold and cash amounts received from the receivables sold.
Commodity Contracts - The fair value of FTR and natural gas commodity contracts categorized as Level 3 was recognized as net derivative assets at December 31 as follows (in millions):
| | | | | | | | | | | | | | | | | | | | | | | | | | | | | | | | | | | |
| Alliant Energy | | IPL | | WPL |
| Excluding FTRs | | FTRs | | Excluding FTRs | | FTRs | | Excluding FTRs | | FTRs |
| 2024 | $— | | $25 | | $— | | $20 | | $— | | $5 |
| 2023 | 3 | | 21 | | 3 | | 16 | | — | | 5 |
NOTE 16. COMMITMENTS AND CONTINGENCIES
NOTE 16(a) Capital Purchase Commitments - Various contractual obligations contain minimum future commitments related to capital expenditures for certain construction projects, including IPL’s and WPL’s expansion of energy storage, and improvements at WPL’s natural gas-fired Neenah Energy Facility and Sheboygan Falls Energy Facility. At December 31, 2024, Alliant Energy’s, IPL’s, and WPL’s minimum future commitments in 2025 for these projects were $448 million, $294 million, and $153 million, respectively.
NOTE 16(b) Other Purchase Commitments - Various commodity supply, transportation and storage contracts help meet obligations to provide electricity and natural gas to utility customers. In addition, there are various purchase commitments associated with other goods and services. At December 31, 2024, the related minimum future commitments, excluding amounts for purchased power commitments that do not have minimum thresholds but will require payment when electricity is generated by the provider, were as follows (in millions):
| | | | | | | | | | | | | | | | | | | | | | | | | | | | | | | | | | | | | | | | | |
| Alliant Energy | 2025 | | 2026 | | 2027 | | 2028 | | 2029 | | Thereafter | | Total |
| | | | | | | | | | | | | |
| Natural gas | $268 | | $177 | | $130 | | $102 | | $84 | | $120 | | $881 |
| Coal | 75 | | 33 | | 22 | | 5 | | — | | — | | 135 |
| Other (a) | 51 | | 20 | | 7 | | 7 | | 2 | | 22 | | 109 |
| $394 | | $230 | | $159 | | $114 | | $86 | | $142 | | $1,125 |
| | | | | | | | | | | | | | | | | | | | | | | | | | | | | | | | | | | | | | | | | |
| IPL | 2025 | | 2026 | | 2027 | | 2028 | | 2029 | | Thereafter | | Total |
| | | | | | | | | | | | | |
| Natural gas | $160 | | $104 | | $85 | | $64 | | $49 | | $20 | | $482 |
| Coal | 34 | | 19 | | 10 | | 5 | | — | | — | | 68 |
| Other (a) | 18 | | 2 | | 2 | | 2 | | 2 | | 21 | | 47 |
| $212 | | $125 | | $97 | | $71 | | $51 | | $41 | | $597 |
| | | | | | | | | | | | | | | | | | | | | | | | | | | | | | | | | | | | | | | | | |
| WPL | 2025 | | 2026 | | 2027 | | 2028 | | 2029 | | Thereafter | | Total |
| | | | | | | | | | | | | |
| Natural gas | $108 | | $73 | | $45 | | $38 | | $35 | | $100 | | $399 |
| Coal | 41 | | 14 | | 12 | | — | | — | | — | | 67 |
| Other (a) | 22 | | 1 | | — | | — | | — | | — | | 23 |
| $171 | | $88 | | $57 | | $38 | | $35 | | $100 | | $489 |
(a)Includes individual commitments incurred during the normal course of business that exceeded $1 million at December 31, 2024.
NOTE 16(c) Legal Proceedings - Alliant Energy, IPL and WPL are involved in legal and administrative proceedings before various courts and agencies with respect to matters arising in the ordinary course of business. Although unable to predict the outcome of these matters, Alliant Energy, IPL and WPL believe that appropriate reserves have been established and final disposition of these actions will not have a material effect on their financial condition or results of operations.
NOTE 16(d) Guarantees and Indemnifications -
Whiting Petroleum Corporation (Whiting Petroleum) - In 2004, Alliant Energy sold its remaining interest in Whiting Petroleum, an independent oil and gas company. Alliant Energy Resources, LLC, as the successor to a predecessor entity that owned Whiting Petroleum, and a wholly-owned subsidiary of AEF, has guaranteed the partnership obligations of an affiliate of Whiting Petroleum under multiple general partnership agreements in the oil and gas industry. The guarantees do not include a maximum limit. Based on information made available to Alliant Energy by Whiting Petroleum, the Whiting Petroleum affiliate holds an approximate 6% share in the partnerships, and currently known obligations include costs associated with the future abandonment of certain facilities owned by the partnerships. The general partnerships were formed under California law, and Alliant Energy Resources, LLC may need to perform under the guarantees if the affiliate of Whiting Petroleum is unable to meet its partnership obligations.
Whiting Petroleum previously completed bankruptcy proceedings and business combinations, which substantially reduce the likelihood that Alliant Energy will be obligated to make any payments under these guarantees. As of December 31, 2024, the currently known partnership obligations for the abandonment obligations are estimated at $54 million, which represents Alliant Energy’s currently estimated maximum exposure under the guarantees. Alliant Energy is not currently aware of, nor does it currently expect to incur in the future, any material liabilities related to these guarantees and therefore has not recognized any material liabilities related to these guarantees as of December 31, 2024 and 2023.
Non-utility Wind Farm in Oklahoma - In 2017, a wholly-owned subsidiary of AEF acquired a cash equity ownership interest in a non-utility wind farm located in Oklahoma. The wind farm provides electricity to a third-party under a long-term PPA. Alliant Energy provided a parent guarantee of its subsidiary’s indemnification obligations under the related operating agreement and PPA. Alliant Energy’s obligations under the operating agreement were $43 million as of December 31, 2024 and will reduce annually until expiring in July 2047. Alliant Energy’s obligations under the PPA are subject to a maximum limit of $17 million and expire in December 2031, subject to potential extension. Alliant Energy is not aware of any material liabilities related to this guarantee that it is probable that it will be obligated to pay and therefore has not recognized any material liabilities related to this guarantee as of December 31, 2024 and 2023.
Transfers of Renewable Tax Credits - In 2023 and 2024, IPL and WPL entered into agreements to transfer renewable tax credits from certain wind, solar and energy storage facilities to other corporate taxpayers in exchange for cash. As of December 31, 2024, IPL and WPL provided indemnifications associated with $193 million and $121 million, respectively, of proceeds for renewable tax credits transferred to other corporate taxpayers in the event of an adverse interpretation of tax law,
including whether the related tax credits meet the qualification requirements. Alliant Energy, IPL and WPL believe the likelihood of having to make any material cash payments under these indemnifications is remote.
NOTE 16(e) Environmental Matters - Alliant Energy, IPL and WPL are subject to environmental regulations as a result of their current and past operations. These regulations are designed to protect public health and the environment and have resulted in compliance, remediation, containment and monitoring obligations, which are recorded as current and non-current environmental liabilities. Substantially all of the environmental liabilities recorded on the balance sheets relate to MGP sites.
Manufactured Gas Plant Sites - IPL and WPL have current or previous ownership interests in various sites that are previously associated with the production of gas for which IPL and WPL have, or may have in the future, liability for investigation, remediation and monitoring costs. IPL and WPL are working pursuant to the requirements of various federal and state agencies to investigate, mitigate, prevent and remediate, where necessary, the environmental impacts to property, including natural resources, at and around these former MGP sites in order to protect public health and the environment. At December 31, 2024, estimated future costs expected to be incurred for the investigation, remediation and monitoring of the MGP sites, as well as environmental liabilities recorded on the balance sheets for these sites, which are not discounted, were as follows (in millions):
| | | | | | | | | | | | | | | | | | | | | | | | | | | | | | | | | | | |
| Alliant Energy | | IPL | | WPL |
| Range of estimated future costs | $7 | | - | $28 | | $5 | | - | $17 | | $2 | | - | $11 |
| Current and non-current environmental liabilities | $12 | | $7 | | $5 |
IPL Consent Decree - In 2015, the U.S. District Court for the Northern District of Iowa approved a Consent Decree that IPL entered into with the EPA, the Sierra Club, the State of Iowa and Linn County in Iowa, thereby resolving potential CAA issues associated with emissions from IPL’s coal-fired generating facilities in Iowa. IPL has completed various requirements under the Consent Decree. IPL’s remaining requirements include fuel switching or retiring Prairie Creek Units 1 and 3 by December 31, 2025. Alliant Energy and IPL currently expect to recover material costs incurred by IPL related to compliance with the terms of the Consent Decree from IPL’s electric customers.
Other Environmental Contingencies - In addition to the environmental liabilities discussed above, various environmental rules are monitored that may have a significant impact on future operations. Several of these environmental rules are subject to legal challenges, reconsideration and/or other uncertainties. Given uncertainties regarding the outcome, timing and compliance plans for these environmental matters, the complete financial impact of each of these rules is not able to be determined; however, future capital investments and/or modifications to EGUs and electric and gas distribution systems to comply with certain of these rules could be significant. Specific current, proposed or potential environmental matters include, among others: CSAPR, Effluent Limitation Guidelines, CCR Rule, and various legislation and EPA regulations to monitor and regulate the emission of GHG, including the CAA.
NOTE 16(f) Credit Risk - IPL provides retail electric and gas services in Iowa and wholesale electric service in Minnesota, Illinois and Iowa. WPL provides retail electric and gas services and wholesale electric service in Wisconsin. The geographic concentration of IPL’s and WPL’s customers did not contribute significantly to overall credit risk exposure. In addition, as a result of a large customer base, IPL and WPL did not have any significant credit risk concentration for receivables arising from the sale of electricity or gas services.
Alliant Energy, IPL and WPL are subject to credit risk related to the ability of counterparties to meet their contractual payment obligations, including reimbursement of transmission costs from large load growth customers, or the potential non-performance of counterparties to deliver contracted commodities and other goods or services at the contracted price. Credit policies are maintained to mitigate credit risk. These credit policies include evaluation of the financial condition of certain counterparties, use of credit risk-related contingent provisions in certain agreements that require credit support from counterparties not meeting specific criteria, different counterparties to reduce concentrations of credit risk and the use of standardized agreements that facilitate the netting of cash flows associated with certain counterparties. Based on these credit policies and different counterparties, as well as utility cost recovery mechanisms, it is unlikely that counterparty non-performance would have a material effect on financial condition or results of operations. However, there is no assurance that these items will protect against all losses from counterparty non-performance.
Refer to Notes 5(a) and 14 for details of allowances for expected credit losses and credit risk-related contingent features, respectively.
NOTE 16(g) MISO Transmission Owner Return on Equity Complaints - A group of stakeholders, including MISO cooperative and municipal utilities, previously filed complaints with FERC requesting a reduction to the base return on equity authorized for MISO transmission owners, including ITC and ATC. In 2019, FERC issued an order on the previously filed complaints and reduced the base return on equity authorized for the MISO transmission owners to 9.88% for November 12, 2013 through February 11, 2015, and subsequent to September 28, 2016. In 2020, FERC issued orders in response to various rehearing requests and increased the base return on equity authorized for the MISO transmission owners from 9.88% to 10.02% for November 12, 2013 through February 11, 2015, and subsequent to September 28, 2016. In 2022, the U.S. Court of Appeals for the District of Columbia vacated FERC’s prior orders that established the base return on equity authorized
for the MISO transmission owners and remanded the cases to FERC for further proceedings. As a result of the 2022 court decision, Alliant Energy recorded a $6 million reduction in “Equity income from unconsolidated investments” in its income statement in 2022 to reflect the then-anticipated reduction in the base return on equity authorized for the MISO transmission owners. In October 2024, FERC issued an order reducing the base return on equity authorized for MISO transmission owners to 9.98%, and as a result, the MISO transmission owners will provide refunds based on the 9.98% base return on equity, with interest, for November 12, 2013 through February 11, 2015, and subsequent to September 28, 2016, which did not result in any material impacts on Alliant Energy’s results of operations or financial condition in 2024. Any further changes in FERC’s decisions may have an impact on Alliant Energy’s share of ATC’s future earnings and customer costs; however, Alliant Energy is currently unable to predict with certainty the future outcome or impact of any further changes.
NOTE 17. SEGMENTS OF BUSINESS
Alliant Energy - Alliant Energy’s reportable segments as of December 31, 2024 are:
•IPL - is a utility primarily serving electric and natural gas customers in Iowa, and is its own reportable segment as shown in the tables below.
•WPL - is a utility serving electric and natural gas customers in Wisconsin, and is its own reportable segment as shown in the tables below.
Other, which is not a reportable segment of Alliant Energy, includes the operations of AEF and its subsidiaries, Corporate Services, the Alliant Energy parent company, and any Alliant Energy parent company consolidating adjustments. AEF is comprised of Alliant Energy’s interest in ATC Holdings, Travero, a non-utility wind farm, corporate venture investments, the Sheboygan Falls Energy Facility and other non-utility holdings. The “Other” columns are included in the tables below to reconcile to consolidated amounts. Prior to December 31, 2024, reportable segments for Alliant Energy’s, IPL’s, and WPL’s utility business were electric operations, gas operations, and other. In the fourth quarter of 2024, Alliant Energy, IPL and WPL adopted the Financial Accounting Standards Board’s accounting standard for improvements to reportable segment disclosures. Previously reported information for prior periods has been recast to conform with the current period presentation.
Alliant Energy’s chief operating decision maker (CODM) is its President and CEO, and IPL’s and WPL’s CODM is their CEO. The CODM uses net income generated from IPL’s and WPL’s operations to assess segment performance, make operating decisions, and allocate resources. Alliant Energy’s administrative support services are directly charged to the applicable segment where practicable. In all other cases, administrative support services are allocated to the applicable segment based on services agreements. There was no single customer whose revenues were 10% or more of Alliant Energy’s, IPL’s and WPL’s respective consolidated revenues. All of Alliant Energy’s, IPL’s and WPL’s operations and assets are located in the U.S. Certain financial information relating to Alliant Energy’s, IPL’s and WPL’s reportable segments, which represents the services provided to their customers, and reconciliation to consolidated amounts, was as follows (in millions):
| | | | | | | | | | | | | | | | | | | | | | | | | | | | | |
| Utility | | | | |
| | | | | Total | | | | Alliant |
| | | | | Reportable | | | | Energy |
| 2024 | IPL | | WPL | | Segments | | Other | | Consolidated |
| Electric utility revenues | $1,747 | | | $1,625 | | | $3,372 | | | N/A | | $3,372 |
| Gas utility revenues | 250 | | | 215 | | | 465 | | | N/A | | 465 |
| Other revenues | 49 | | | 5 | | | 54 | | | $90 | | 144 |
| Total revenues | 2,046 | | | 1,845 | | | 3,891 | | | 90 | | 3,981 |
| Electric production fuel and purchased power expense | 269 | | | 359 | | | 628 | | | N/A | | 628 |
| Electric transmission service expense | 417 | | | 196 | | | 613 | | | N/A | | 613 |
| Cost of gas sold expense | 123 | | | 101 | | | 224 | | | N/A | | 224 |
| Asset valuation charge for IPL’s Lansing Generation Station | 60 | | | — | | | 60 | | | N/A | | 60 |
| Other operation and maintenance expense | 358 | | | 279 | | | 637 | | | 39 | | 676 |
| Other segment items: | | | | | | | | | |
| Depreciation and amortization expense | 404 | | | 357 | | | 761 | | | 11 | | 772 |
| Interest expense | 177 | | 165 | | 342 | | 107 | | 449 |
| Equity income from unconsolidated investments, net | — | | | (2) | | | (2) | | | (59) | | (61) |
| Income tax expense (benefit) | (129) | | | 11 | | (118) | | | 4 | | (114) |
| Other (a) | 5 | | | 34 | | 39 | | | 5 | | 44 |
| Net income (loss) | 362 | | 345 | | 707 | | (17) | | 690 |
| Total assets | 11,407 | | | 10,106 | | | 21,513 | | | 1,201 | | 22,714 |
| Investments in equity method subsidiaries | 5 | | | 17 | | | 22 | | | 601 | | 623 |
| Construction and acquisition expenditures | 1,224 | | | 828 | | | 2,052 | | | 197 | | 2,249 |
| | | | | | | | | | | | | | | | | | | | | | | | | | | | | |
| Utility | | | | |
| | | | | Total | | | | Alliant |
| | | | | Reportable | | | | Energy |
2023 (amounts may not foot due to rounding) | IPL | | WPL | | Segments | | Other | | Consolidated |
| Electric utility revenues | $1,761 | | | $1,584 | | | $3,345 | | | N/A | | $3,345 |
| Gas utility revenues | 300 | | | 240 | | | 540 | | | N/A | | 540 |
| Other revenues | 49 | | | 3 | | | 52 | | | $90 | | 142 |
| Total revenues | 2,110 | | | 1,827 | | | 3,937 | | | 90 | | 4,027 |
| Electric production fuel and purchased power expense | 282 | | | 455 | | | 737 | | | N/A | | 736 |
| Electric transmission service expense | 420 | | | 163 | | | 583 | | | N/A | | 583 |
| Cost of gas sold expense | 166 | | | 134 | | | 300 | | | N/A | | 299 |
| Other operation and maintenance expense | 353 | | | 271 | | | 624 | | | 51 | | 675 |
| Other segment items: | | | | | | | | | |
| Depreciation and amortization expense | 388 | | | 280 | | | 668 | | | 8 | | 676 |
| Interest expense | 155 | | | 149 | | | 304 | | | 90 | | 394 |
| Equity income from unconsolidated investments, net | — | | | (3) | | | (3) | | | (58) | | (61) |
| Income tax expense (benefit) | (58) | | | 60 | | | 2 | | | 2 | | 4 |
| Other (a) | 38 | | | (27) | | | 11 | | | 5 | | 18 |
| Net income (loss) | 366 | | | 345 | | | 711 | | | (8) | | 703 |
| Total assets | 10,489 | | | 9,634 | | | 20,123 | | | 1,114 | | 21,237 |
| Investments in equity method subsidiaries | 5 | | | 16 | | | 21 | | | 564 | | 585 |
| Construction and acquisition expenditures | 712 | | | 1,019 | | | 1,731 | | | 123 | | 1,854 |
| | | | | | | | | | | | | | | | | | | | | | | | | | | | | |
| Utility | | | | |
| | | | | Total | | | | Alliant |
| | | | | Reportable | | | | Energy |
| 2022 | IPL | | WPL | | Segments | | Other | | Consolidated |
| Electric utility revenues | $1,859 | | | $1,562 | | | $3,421 | | | N/A | | $3,421 |
| Gas utility revenues | 351 | | | 291 | | | 642 | | | N/A | | 642 |
| Other revenues | 46 | | | 3 | | | 49 | | | $93 | | 142 |
| Total revenues | 2,256 | | | 1,856 | | | 4,112 | | | 93 | | 4,205 |
| Electric production fuel and purchased power expense | 383 | | | 447 | | | 830 | | | N/A | | 830 |
| Electric transmission service expense | 407 | | | 166 | | | 573 | | | N/A | | 573 |
| Cost of gas sold expense | 206 | | | 183 | | | 389 | | | N/A | | 389 |
| Other operation and maintenance expense | 369 | | | 278 | | | 647 | | | 57 | | 704 |
| Other segment items: | | | | | | | | | |
| Depreciation and amortization expense | 381 | | | 283 | | | 664 | | | 7 | | 671 |
| Interest expense | 148 | | | 121 | | | 269 | | | 56 | | 325 |
| Equity income from unconsolidated investments, net | — | | | (1) | | | (1) | | | (50) | | (51) |
| Income tax expense (benefit) | (50) | | | 66 | | | 16 | | | 6 | | 22 |
| Other (a) | 52 | | | (2) | | | 50 | | | 6 | | 56 |
| Net income | 360 | | | 315 | | | 675 | | | 11 | | 686 |
| Total assets | 10,075 | | | 8,987 | | | 19,062 | | | 1,101 | | 20,163 |
| Investments in equity method subsidiaries | 5 | | | 15 | | | 20 | | | 522 | | 542 |
| Construction and acquisition expenditures | 372 | | | 1,020 | | | 1,392 | | | 92 | | 1,484 |
(a)Other segment items for each reportable segment include AFUDC, taxes other than income taxes, interest income, and other miscellaneous income and deductions.
NOTE 18. RELATED PARTIES
Service Agreements - Pursuant to service agreements, IPL and WPL receive various administrative and general services from an affiliate, Corporate Services. These services are billed to IPL and WPL at cost based on expenses incurred by Corporate Services for the benefit of IPL and WPL, respectively. These costs consisted primarily of employee compensation and benefits, fees associated with various professional services, depreciation and amortization of property, plant and equipment, and a return on net assets. Corporate Services also acts as agent on behalf of IPL and WPL pursuant to the service agreements. As agent, Corporate Services enters into energy, capacity, ancillary services, and transmission sale and purchase transactions within MISO. Corporate Services assigns such sales and purchases among IPL and WPL based on
statements received from MISO. The amounts billed for services provided, sales credited and purchases were as follows (in millions):
| | | | | | | | | | | | | | | | | | | | | | | | | | | | | | | | | | | |
| IPL | | WPL |
| 2024 | | 2023 | | 2022 | | 2024 | | 2023 | | 2022 |
| Corporate Services billings | $183 | | $181 | | $181 | | $171 | | $163 | | $155 |
| Sales credited | — | | 11 | | 19 | | 84 | | 55 | | 74 |
| Purchases billed | 430 | | 431 | | 435 | | 54 | | 35 | | 174 |
As of December 31, net intercompany payables to Corporate Services were as follows (in millions):
| | | | | | | | | | | |
| 2024 | | 2023 |
| IPL | $135 | | $129 |
| WPL | 64 | | 72 |
ATC - Pursuant to various agreements, WPL receives a range of transmission services from ATC. WPL provides operation, maintenance, and construction services to ATC. WPL and ATC also bill each other for use of shared facilities owned by each party. The related amounts billed between the parties were as follows (in millions):
| | | | | | | | | | | | | | | | | |
| 2024 | | 2023 | | 2022 |
| ATC billings to WPL | $152 | | $159 | | $140 |
| WPL billings to ATC | 16 | | 20 | | 18 |
As of December 31, 2024 and 2023, WPL owed ATC net amounts of $10 million and $10 million, respectively.
WPL’s Sheboygan Falls Energy Facility Lease - Refer to Note 9 for discussion of WPL’s Sheboygan Falls Energy Facility lease.
ITEM 9. CHANGES IN AND DISAGREEMENTS WITH ACCOUNTANTS ON ACCOUNTING AND FINANCIAL DISCLOSURE
None.
ITEM 9A. CONTROLS AND PROCEDURES
Alliant Energy’s, IPL’s and WPL’s management evaluated, with the participation of each of Alliant Energy’s, IPL’s and WPL’s Chief Executive Officer, Chief Financial Officer and Disclosure Committee, the effectiveness of the design and operation of Alliant Energy’s, IPL’s and WPL’s disclosure controls and procedures as of the end of the quarter ended December 31, 2024 pursuant to the requirements of the Securities Exchange Act of 1934, as amended. Based on their evaluation, the Chief Executive Officer and the Chief Financial Officer concluded that Alliant Energy’s, IPL’s and WPL’s disclosure controls and procedures were effective as of the end of the quarter ended December 31, 2024.
There was no change in Alliant Energy’s, IPL’s and WPL’s internal control over financial reporting that occurred during the quarter ended December 31, 2024 that has materially affected, or is reasonably likely to materially affect, Alliant Energy’s, IPL’s and WPL’s internal control over financial reporting.
Management’s Annual Report on Internal Control over Financial Reporting - The management of Alliant Energy, IPL and WPL are responsible for establishing and maintaining adequate internal control over financial reporting, as such term is defined in Rules 13a-15(f) and 15d-15(f) under the Securities Exchange Act of 1934, as amended. Alliant Energy’s, IPL’s and WPL’s internal control over financial reporting is designed to provide reasonable assurance regarding the reliability of financial reporting and the preparation of financial statements for external purposes in accordance with GAAP.
Because of the inherent limitations of internal control over financial reporting, misstatements may not be prevented or detected on a timely basis. Also, projections of any evaluation of the effectiveness of the internal control over financial reporting to future periods are subject to the risk that the controls may become inadequate because of changes in conditions, or that the degree of compliance with the policies or procedures may deteriorate.
Alliant Energy’s, IPL’s and WPL’s management assessed the effectiveness of their respective internal control over financial reporting as of December 31, 2024 using the criteria set forth in Internal Control - Integrated Framework (2013) issued by the Committee of Sponsoring Organizations of the Treadway Commission. Based on these assessments, Alliant Energy’s, IPL’s and WPL’s management concluded that, as of December 31, 2024, their respective internal control over financial reporting was effective.
Deloitte & Touche LLP, Alliant Energy’s independent registered public accounting firm, has audited Alliant Energy’s internal control over financial reporting. That report is included herein. This report does not include an attestation report of IPL’s and WPL’s independent registered public accounting firm regarding its assessment of IPL’s and WPL’s internal control over financial reporting.
REPORT OF INDEPENDENT REGISTERED PUBLIC ACCOUNTING FIRM
To the Shareowners and the Board of Directors of Alliant Energy Corporation:
Opinion on Internal Control over Financial Reporting
We have audited the internal control over financial reporting of Alliant Energy Corporation and subsidiaries (the “Company”) as of December 31, 2024, based on criteria established in Internal Control - Integrated Framework (2013) issued by the Committee of Sponsoring Organizations of the Treadway Commission (COSO). In our opinion, the Company maintained, in all material respects, effective internal control over financial reporting as of December 31, 2024, based on criteria established in Internal Control - Integrated Framework (2013) issued by COSO.
We have also audited, in accordance with the standards of the Public Company Accounting Oversight Board (United States) (PCAOB), the consolidated financial statements as of and for the year ended December 31, 2024, of the Company and our report dated February 21, 2025, expressed an unqualified opinion on the Company’s 2024 financial statements.
Basis for Opinion
The Company’s management is responsible for maintaining effective internal control over financial reporting and for its assessment of the effectiveness of internal control over financial reporting, included in the accompanying Management’s Annual Report on Internal Control over Financial Reporting. Our responsibility is to express an opinion on the Company’s internal control over financial reporting based on our audit. We are a public accounting firm registered with the PCAOB and are required to be independent with respect to the Company in accordance with the U.S. federal securities laws and the applicable rules and regulations of the Securities and Exchange Commission and the PCAOB.
We conducted our audit in accordance with the standards of the PCAOB. Those standards require that we plan and perform the audit to obtain reasonable assurance about whether effective internal control over financial reporting was maintained in all material respects. Our audit included obtaining an understanding of internal control over financial reporting, assessing the risk that a material weakness exists, testing and evaluating the design and operating effectiveness of internal control based on the assessed risk, and performing such other procedures as we considered necessary in the circumstances. We believe that our audit provides a reasonable basis for our opinion.
Definition and Limitations of Internal Control over Financial Reporting
A company’s internal control over financial reporting is a process designed to provide reasonable assurance regarding the reliability of financial reporting and the preparation of financial statements for external purposes in accordance with generally accepted accounting principles. A company’s internal control over financial reporting includes those policies and procedures that (1) pertain to the maintenance of records that, in reasonable detail, accurately and fairly reflect the transactions and dispositions of the assets of the company; (2) provide reasonable assurance that transactions are recorded as necessary to permit preparation of financial statements in accordance with generally accepted accounting principles, and that receipts and expenditures of the company are being made only in accordance with authorizations of management and directors of the company; and (3) provide reasonable assurance regarding prevention or timely detection of unauthorized acquisition, use, or disposition of the company’s assets that could have a material effect on the financial statements.
Because of its inherent limitations, internal control over financial reporting may not prevent or detect misstatements. Also, projections of any evaluation of effectiveness to future periods are subject to the risk that controls may become inadequate because of changes in conditions, or that the degree of compliance with the policies or procedures may deteriorate.
/s/ Deloitte & Touche LLP
Milwaukee, Wisconsin
February 21, 2025
ITEM 9B. OTHER INFORMATION
During the quarter ended December 31, 2024, no director or officer of Alliant Energy, IPL or WPL adopted or terminated a Rule 10b5-1 trading arrangement or non-Rule 10b5-1 trading arrangement, as each term is defined in Item 408(a) of Regulation S-K.
ITEM 9C. DISCLOSURE REGARDING FOREIGN JURISDICTIONS THAT PREVENT INSPECTIONS
None.
PART III
ITEM 10. DIRECTORS, EXECUTIVE OFFICERS AND CORPORATE GOVERNANCE
The directors of Alliant Energy, IPL and WPL are the same, and therefore, the information required by Item 10 relating to directors and nominees for election of directors is the same for all registrants. The information required by Item 10 relating to directors and nominees for election of directors at the 2025 Annual Meeting of Shareowners, the timely filing of reports under Section 16 of the Securities Exchange Act of 1934, audit committees and audit committee financial experts, insider trading policies and procedures, and Alliant Energy’s, IPL’s and WPL’s Code of Conduct is incorporated herein by reference to the relevant information in the 2025 Alliant Energy Proxy Statement, which will be filed with the SEC within 120 days after the end of Alliant Energy’s, IPL’s and WPL’s fiscal years. The code of ethics, also referred to as the Code of Conduct, of Alliant Energy, IPL and WPL are the same. Information regarding executive officers of Alliant Energy, IPL and WPL may be found in Part I of this report under the caption “Information About Executive Officers.”
ITEM 11. EXECUTIVE COMPENSATION
The directors and executive officers of Alliant Energy, IPL and WPL for which compensation information must be included are the same. Therefore, the information required by Item 11 for each of Alliant Energy, IPL and WPL is incorporated herein by reference to the relevant information in the 2025 Alliant Energy Proxy Statement, which will be filed with the SEC within 120 days after the end of Alliant Energy’s, IPL’s and WPL’s fiscal years.
ITEM 12. SECURITY OWNERSHIP OF CERTAIN BENEFICIAL OWNERS AND MANAGEMENT AND RELATED STOCKHOLDER MATTERS
Information regarding Alliant Energy’s equity compensation plans as of December 31, 2024 was as follows:
| | | | | | | | | | | | | | | | | | | | |
| | (A) | | (B) | | (C) |
| | Number of securities to be | | Weighted-average | | Number of securities remaining available |
| | issued upon exercise of | | exercise price of | | for future issuance under equity |
| | outstanding options, | | outstanding options, | | compensation plans (excluding |
| Plan Category | | warrants and rights | | warrants and rights | | securities reflected in column (A)) |
| Equity compensation plans approved by shareowners | | 1,529,346 (a) | | $51.63 | | 7,107,084 (b) |
| Equity compensation plans not approved by shareowners (c) | | N/A | | N/A | | N/A (d) |
| | 1,529,346 | | $51.63 | | 7,107,084 |
(a)Represents performance shares and restricted stock units granted under the 2020 OIP, all of which are paid out in shares of Alliant Energy’s common stock. The performance share awards reflect an assumed payout at the maximum performance multiplier of 200%. The restricted stock units vest at the expiration of a three-year time-vesting period.
(b)All of the available shares under the 2020 OIP may be issued as awards in the form of shares of Alliant Energy’s common stock, restricted stock, restricted stock units, performance shares, performance units and other stock-based or cash-based awards. As of December 31, 2024, there were performance shares and restricted stock units outstanding under the 2020 OIP, the only plan under which such equity awards are currently granted.
(c)As of December 31, 2024, there were 372,116 shares of Alliant Energy’s common stock held under the DCP, which is described in Note 12(c). (d)There is no limit on the number of shares of Alliant Energy’s common stock that may be held under the DCP.
The remainder of the information required by Item 12 for Alliant Energy, and the information required by Item 12 for each of IPL and WPL, is incorporated herein by reference to the relevant information in the 2025 Alliant Energy Proxy Statement, which will be filed with the SEC within 120 days after the end of Alliant Energy’s, IPL’s and WPL’s fiscal year.
ITEM 13. CERTAIN RELATIONSHIPS AND RELATED TRANSACTIONS, AND DIRECTOR INDEPENDENCE
The information required by Item 13 for each of Alliant Energy, IPL and WPL is incorporated herein by reference to the relevant information in the 2025 Alliant Energy Proxy Statement, which will be filed with the SEC within 120 days after the end of Alliant Energy’s, IPL’s and WPL’s fiscal years.
ITEM 14. PRINCIPAL ACCOUNTING FEES AND SERVICES
ALLIANT ENERGY
The information required by Item 14 is incorporated herein by reference to the relevant information in the 2025 Alliant Energy Proxy Statement, which will be filed with the SEC within 120 days after the end of Alliant Energy’s fiscal year.
IPL AND WPL
Each of IPL’s and WPL’s Audit Committee of the Board of Directors has adopted a policy that requires advance approval of all audit, audit-related, tax and other permitted services performed by the independent registered public accounting firm. The policy provides for pre-approval by the Audit Committee of specifically defined audit and non-audit services after the Audit Committee is provided with the appropriate level of details regarding the specific services to be provided. The policy does not permit delegation of the Audit Committee’s authority to management. In the event the need for specific services arises between Audit Committee meetings, the Audit Committee has delegated to the Chairperson of the Audit Committee authority to approve permitted services provided that the Chairperson reports any decisions to the Audit Committee at its next scheduled meeting. The principal accounting fees billed to Alliant Energy by its independent registered public accounting firm, all of which were approved in advance by the Audit Committee, directly related and allocated to IPL and WPL were as follows (in thousands):
| | | | | | | | | | | | | | | | | | | | | | | | | | | | | | | | | | | | | | | | | | | | | | | |
| IPL | | WPL |
| 2024 | | 2023 | | 2024 | | 2023 |
| Fees | | % of Total | | Fees | | % of Total | | Fees | | % of Total | | Fees | | % of Total |
| Audit fees | $1,412 | | 96% | | $1,468 | | 95% | | $1,242 | | 92% | | $1,228 | | 92% |
| Audit-related fees | 59 | | 4% | | 57 | | 4% | | 103 | | 8% | | 103 | | 8% |
| Tax fees | 3 | | —% | | 8 | | 1% | | 3 | | —% | | 7 | | —% |
| All other fees | 3 | | —% | | 4 | | —% | | 2 | | —% | | 4 | | —% |
| $1,477 | | 100% | | $1,537 | | 100% | | $1,350 | | 100% | | $1,342 | | 100% |
IPL’s and WPL’s audit fees for 2024 and 2023 consisted of the respective fees billed for the audits of the financial statements of IPL and its subsidiaries and WPL and its subsidiaries, for reviews of financial statements included in Form 10-Q filings, and for services normally provided in connection with statutory and regulatory filings, such as financing transactions. IPL’s and WPL’s audit fees also included their respective portion of fees for the 2024 and 2023 audits of Alliant Energy’s financial statements and effectiveness of internal controls over financial reporting. IPL’s and WPL’s audit-related fees for 2024 and 2023 consisted of the fees billed for services rendered related to employee benefits plan audits and other attest services. IPL’s and WPL’s tax fees for 2024 consisted of the fees billed for professional services rendered for tax compliance, and 2023 consisted of the fees billed for professional services rendered for tax compliance, tax advice and tax planning, including all services performed by the tax professional staff of affiliates of the independent registered public accounting firm, except those rendered in connection with the audit. All other fees for 2024 and 2023 for IPL and WPL consisted of license fees for accounting research software products and seminars. The Audit Committee does not consider the provision of non-audit services by the independent registered public accounting firm described above to be incompatible with maintaining independence of the independent registered public accounting firm.
PART IV
ITEM 15. EXHIBITS, FINANCIAL STATEMENT SCHEDULES
(1)Consolidated Financial Statements - Refer to Item 8 Financial Statements and Supplementary Data for Alliant Energy’s, IPL’s and WPL’s financial statements and Reports of Independent Registered Public Accounting Firm (Public Company Accounting Oversight Board ID No. 34).
(2)Financial Statement Schedules -
SCHEDULE I - CONDENSED PARENT COMPANY FINANCIAL STATEMENTS
| | | | | | | | | | | | | | | | | |
| ALLIANT ENERGY CORPORATION (Parent Company Only) | Year Ended December 31, |
| CONDENSED STATEMENTS OF INCOME | 2024 | | 2023 | | 2022 |
| (in millions) |
| | | | | |
| Operating expenses | $3 | | | $3 | | | $9 | |
| Operating loss | (3) | | | (3) | | | (9) | |
| Other (income) and deductions: | | | | | |
| Equity earnings from consolidated subsidiaries | (734) | | | (742) | | | (707) | |
| Interest expense | 40 | | | 34 | | | 6 | |
| Other | 5 | | | 4 | | | 1 | |
| Total other (income) and deductions | (689) | | | (704) | | | (700) | |
| Income before income taxes | 686 | | | 701 | | | 691 | |
| Income tax expense (benefit) | (3) | | | (5) | | | 2 | |
| Net income | $689 | | | $706 | | | $689 | |
Refer to accompanying Notes to Condensed Financial Statements.
| | | | | | | | | | | |
| ALLIANT ENERGY CORPORATION (Parent Company Only) | December 31, |
| CONDENSED BALANCE SHEETS | 2024 | | 2023 |
| (in millions) |
| ASSETS | | | |
| Current assets: | | | |
| Notes receivable from affiliated companies | $103 | | | $96 | |
| Income tax refunds receivable | 12 | | | — | |
| Other | 2 | | | 1 | |
| Total current assets | 117 | | | 97 | |
| Investments: | | | |
| Investments in consolidated subsidiaries | 9,123 | | | 8,405 | |
| Other | 1 | | | 2 | |
| Total investments | 9,124 | | | 8,407 | |
| Other assets | 84 | | | 90 | |
| Total assets | $9,325 | | | $8,594 | |
| | | | | | | | | | | |
| LIABILITIES AND EQUITY | | | |
| Current liabilities: | | | |
| Current maturities of long-term debt | $571 | | | $— | |
| Commercial paper | 325 | | | 157 | |
| Notes payable to affiliated companies | 1,401 | | | 1,068 | |
| Other | 10 | | | 10 | |
| Total current liabilities | 2,307 | | | 1,235 | |
| Long-term debt, net (excluding current portion) | — | | | 568 | |
| Other liabilities | 3 | | | 2 | |
| Common equity: | | | |
| Common stock and additional paid-in capital | 3,063 | | | 3,033 | |
| Retained earnings | 3,965 | | | 3,768 | |
| Accumulated other comprehensive income | 1 | | | 1 | |
| Shares in deferred compensation trust | (14) | | | (13) | |
| Total common equity | 7,015 | | | 6,789 | |
| Total liabilities and equity | $9,325 | | | $8,594 | |
Refer to accompanying Notes to Condensed Financial Statements.
| | | | | | | | | | | | | | | | | |
| ALLIANT ENERGY CORPORATION (Parent Company Only) | Year Ended December 31, |
| CONDENSED STATEMENTS OF CASH FLOWS | 2024 | | 2023 | | 2022 |
| (in millions) |
| Net cash flows from operating activities | $355 | | | $445 | | | $492 | |
| Cash flows used for investing activities: | | | | | |
| Capital contributions to consolidated subsidiaries | (380) | | | (325) | | | (530) | |
| | | | | |
| Net change in notes receivable from and payable to affiliates | 326 | | | (281) | | | 369 | |
| | | | | |
| | | | | |
| Net cash flows used for investing activities | (54) | | | (606) | | | (161) | |
| Cash flows from (used for) financing activities: | | | | | |
| Common stock dividends | (492) | | | (456) | | | (428) | |
| Proceeds from issuance of common stock, net | 23 | | | 246 | | | 25 | |
| Proceeds from issuance of long-term debt | — | | | 565 | | | — | |
| | | | | |
| Net change in commercial paper | 168 | | | (195) | | | 73 | |
| Other | — | | | 1 | | | (1) | |
| Net cash flows from (used for) financing activities | (301) | | | 161 | | | (331) | |
| Net increase (decrease) in cash, cash equivalents and restricted cash | — | | | — | | | — | |
| Cash, cash equivalents and restricted cash at beginning of period | — | | | — | | | — | |
| Cash, cash equivalents and restricted cash at end of period | $— | | | $— | | | $— | |
| Supplemental cash flows information: | | | | | |
| Cash (paid) received during the period for: | | | | | |
| Interest | ($40) | | | ($27) | | | ($6) | |
| Income taxes, net | $8 | | | $22 | | | $15 | |
Refer to accompanying Notes to Condensed Financial Statements.
ALLIANT ENERGY CORPORATION (Parent Company Only)
NOTES TO CONDENSED FINANCIAL STATEMENTS
Pursuant to rules and regulations of the SEC, the Condensed Financial Statements of Alliant Energy Corporation (Parent Company Only) do not reflect all of the information and notes normally included with financial statements prepared in accordance with GAAP. Therefore, these Condensed Financial Statements should be read in conjunction with the Financial Statements and related Notes included in the combined 2024 Form 10-K, Part II, Item 8, which is incorporated herein by reference.
In the Condensed Financial Statements of Alliant Energy Corporation (Parent Company Only), investments in subsidiaries are accounted for using the equity method.
SCHEDULE II - VALUATION AND QUALIFYING ACCOUNTS AND RESERVES
| | | | | | | | | | | | | | | | | | | | | |
| | | | Additions | | |
| Balance, | (Charged to | | | Balance, |
| Description | January 1 | Expense) | | Deductions (a) | December 31 |
| (in millions) |
Valuation and Qualifying Accounts Which are Deducted in the Balance Sheet from the Assets to Which They Apply:
| | | | | | | | | | | | | | | | | | | | | | | | |
| Accumulated Provision for Uncollectible Accounts: | | | | |
| | Alliant Energy (b) | | | | | |
| | | Year ended December 31, 2024 | $8 | $24 | | $24 | $8 |
| | | Year ended December 31, 2023 | 7 | 20 | | 19 | 8 |
| | | Year ended December 31, 2022 | 11 | 17 | | 21 | 7 |
| | IPL (b) | | | | |
| | | Year ended December 31, 2024 | $— | $13 | | $13 | $— |
| | | Year ended December 31, 2023 | — | 11 | | 11 | — |
| | | Year ended December 31, 2022 | 1 | 7 | | 8 | — |
| | WPL | | | | |
| | | Year ended December 31, 2024 | $8 | $11 | | $11 | $8 |
| | | Year ended December 31, 2023 | 7 | 9 | | 8 | 8 |
| | | Year ended December 31, 2022 | 10 | 10 | | 13 | 7 |
Note: The above provisions relate to various customer, notes and other receivable balances included in various line items on the respective balance sheets.
(a)Deductions are of the nature for which the reserves were created. In the case of the accumulated provision for uncollectible accounts, deductions from this reserve are reduced by recoveries of amounts previously written off.
(b)Refer to Note 5(b) for discussion of IPL’s sales of accounts receivable program.
NOTE: All other schedules are omitted because they are not applicable or not required, or because that required information is shown either in the financial statements or in the notes thereto.
(3) Exhibits Required by SEC Regulation S-K - Pursuant to Item 601(b)(4)(iii) of Regulation S-K, the registrants agree to furnish to the SEC, upon request, any instrument defining the rights of holders of unregistered long-term debt not filed as an exhibit to this combined Form 10-K. No such instrument authorizes securities in excess of 10% of the total assets of Alliant Energy, IPL or WPL, as the case may be. The following exhibits for Alliant Energy, IPL and WPL are filed herewith or incorporated herein by reference.
| | | | | |
| Exhibit Number | Description |
| 3.1 | |
| 3.1a | |
| 3.2 | |
| 3.3 | |
| 3.4 | |
| 3.5 | |
| 3.6 | |
| 4.1 | |
| 4.1a | |
| 4.1b | |
| 4.2 | |
| 4.3 | Indenture, dated as of June 12, 2018, among AEF, Alliant Energy, as guarantor, and The Bank of New York Mellon Trust Company, N.A., as trustee (incorporated by reference to Exhibit 4.1 to Alliant Energy’s Form 8-K, filed June 12, 2018 (File No. 1-9894)) |
| 4.4 | |
| 4.5 | Indenture, dated as of February 28, 2022, among AEF, Alliant Energy, as guarantor, and The Bank of New York Mellon Trust Company, N.A., as trustee (incorporated by reference to Exhibit 4.1 to Alliant Energy’s Form 8-K, filed March 1, 2022 (File No. 1-9894)) |
| 4.6 | Indenture, dated as of November 10, 2023, among AEF, Alliant Energy, as guarantor, and The Bank of New York Mellon Trust Company, N.A., as trustee (incorporated by reference to Exhibit 4.1 to Alliant Energy's Form 8-K, filed November 13, 2023 (File No. 1-9894)) |
| 4.7 | Indenture, dated as of June 6, 2024, among AEF, Alliant Energy, as guarantor, and The Bank of New York Mellon Trust Company, N.A., as trustee (incorporated by reference to Exhibit 4.1 to Alliant Energy’s Form 8-K, filed June 6, 2024 (File No. 1-9894)) |
| 4.8 | |
| 4.8a | First Supplemental Indenture, dated September 16, 2021, among WPL, Wells Fargo Bank, National Association, as Original Trustee, and U.S. Bank National Association, as Series Trustee (incorporated by reference to Exhibit 4.1 to WPL's Form 8-K, filed September 16, 2021 (File No. 0-337)) |
| 4.9 | |
| 4.10 | |
| 4.11 | |
| 4.12 | |
| | | | | |
| Exhibit Number | Description |
| 4.13 | |
| 4.14 | |
| 4.15 | |
| 4.16 | |
| 4.17 | |
| 4.18 | |
| 4.19 | |
| 4.20 | |
| 4.21 | |
| 4.21a | |
| 4.22 | |
| 4.23 | |
| 4.24 | |
| 4.25 | |
| 4.26 | |
| 4.27 | |
| 4.28 | |
| 4.29 | |
| 4.30 | |
| 4.31 | |
| 4.32 | |
| 4.33 | |
| 4.34 | |
| 10.1 | |
| 10.2# | |
| 10.2a# | |
| 10.2b# | |
| 10.2c# | |
| 10.2d# | |
| 10.2e# | |
| 10.2f# | |
| 10.2g# | |
| | | | | |
| Exhibit Number | Description |
| 10.3# | |
| 10.4# | |
| 10.5# | |
| 10.5a# | |
| 10.5b# | |
| 10.6# | |
| 10.6a# | |
| 10.7# | |
| 10.8# | |
| 10.9# | |
| 10.10# | |
| 10.11# | |
| 10.12# | |
| 10.13# | |
| 10.14# | |
| 19 | |
| 21.1 | |
| 23.1 | |
| 23.2 | |
| 23.3 | |
| 31.1 | |
| 31.2 | |
| 31.3 | |
| 31.4 | |
| 31.5 | |
| 31.6 | |
| 32.1 | |
| 32.2 | |
| 32.3 | |
| 97 | |
| 101.INS | Inline XBRL Instance Document - the instance document does not appear in the Interactive Data File because its XBRL tags are embedded within the Inline XBRL document |
| 101.SCH | Inline XBRL Taxonomy Extension Schema Document |
| 101.CAL | Inline XBRL Taxonomy Extension Calculation Linkbase Document |
| 101.LAB | Inline XBRL Taxonomy Extension Label Linkbase Document |
| 101.PRE | Inline XBRL Taxonomy Extension Presentation Linkbase Document |
| 101.DEF | Inline XBRL Taxonomy Extension Definition Linkbase Document |
| 104 | Cover Page Interactive Data File (embedded within the Inline XBRL document) |
# A management contract or compensatory plan or arrangement.
ITEM 16. FORM 10-K SUMMARY
None.
SIGNATURES
Pursuant to the requirements of Section 13 or 15(d) of the Securities Exchange Act of 1934, the Registrants have duly caused this report to be signed on their behalf by the undersigned, thereunto duly authorized on the 21st day of February 2025.
| | | | | | | | | | | | | | |
| ALLIANT ENERGY | | INTERSTATE POWER | | WISCONSIN POWER |
| CORPORATION | | AND LIGHT COMPANY | | AND LIGHT COMPANY |
| By: /s/ Lisa M. Barton | | By: /s/ Lisa M. Barton | | By: /s/ Lisa M. Barton |
| Lisa M. Barton | | Lisa M. Barton | | Lisa M. Barton |
| President and Chief Executive Officer | | Chief Executive Officer | | Chief Executive Officer |
Pursuant to the requirements of the Securities Exchange Act of 1934, this report has been signed below by the following persons on behalf of the Registrants and in the capacities indicated on the 21st day of February 2025.
| | | | | | | | | | | | | | |
| ALLIANT ENERGY | | INTERSTATE POWER | | WISCONSIN POWER |
| CORPORATION | | AND LIGHT COMPANY | | AND LIGHT COMPANY |
| /s/ Lisa M. Barton | | /s/ Lisa M. Barton | | /s/ Lisa M. Barton |
| Lisa M. Barton | | Lisa M. Barton | | Lisa M. Barton |
| President, Chief Executive Officer and Director (Principal Executive Officer) | | Chief Executive Officer and Director (Principal Executive Officer) | | Chief Executive Officer and Director (Principal Executive Officer) |
| | | | |
| /s/ Robert J. Durian | | /s/ Robert J. Durian | | /s/ Robert J. Durian |
| Robert J. Durian | | Robert J. Durian | | Robert J. Durian |
| Executive Vice President and Chief Financial Officer (Principal Financial Officer) | | Executive Vice President and Chief Financial Officer (Principal Financial Officer) | | Executive Vice President and Chief Financial Officer (Principal Financial Officer) |
| | | | |
| /s/ Benjamin M. Bilitz | | /s/ Benjamin M. Bilitz | | /s/ Benjamin M. Bilitz |
| Benjamin M. Bilitz | | Benjamin M. Bilitz | | Benjamin M. Bilitz |
| Chief Accounting Officer and Controller (Principal Accounting Officer) | | Chief Accounting Officer and Controller (Principal Accounting Officer) | | Chief Accounting Officer and Controller (Principal Accounting Officer) |
| | | | |
| /s/ John O. Larsen | | /s/ John O. Larsen | | /s/ John O. Larsen |
| John O. Larsen, Chairman of the Board and Director | | John O. Larsen, Chairman of the Board and Director | | John O. Larsen, Chairman of the Board and Director |
| | | | |
| /s/ Patrick E. Allen | | /s/ Patrick E. Allen | | /s/ Patrick E. Allen |
| Patrick E. Allen, Director | | Patrick E. Allen, Director | | Patrick E. Allen, Director |
| | | | |
| /s/ Ignacio A. Cortina | | /s/ Ignacio A. Cortina | | /s/ Ignacio A. Cortina |
| Ignacio A. Cortina, Director | | Ignacio A. Cortina, Director | | Ignacio A. Cortina, Director |
| | | | |
| /s/ Stephanie L. Cox | | /s/ Stephanie L. Cox | | /s/ Stephanie L. Cox |
| Stephanie L. Cox, Director | | Stephanie L. Cox, Director | | Stephanie L. Cox, Director |
| | | | |
| /s/ N. Joy Falotico | | /s/ N. Joy Falotico | | /s/ N. Joy Falotico |
| N. Joy Falotico, Director | | N. Joy Falotico, Director | | N. Joy Falotico, Director |
| | | | |
| /s/ Michael D. Garcia | | /s/ Michael D. Garcia | | /s/ Michael D. Garcia |
| Michael D. Garcia, Director | | Michael D. Garcia, Director | | Michael D. Garcia, Director |
| | | | |
| /s/ Roger K. Newport | | /s/ Roger K. Newport | | /s/ Roger K. Newport |
| Roger K. Newport, Director | | Roger K. Newport, Director | | Roger K. Newport, Director |
| | | | |
| /s/ Thomas F. O’Toole | | /s/ Thomas F. O’Toole | | /s/ Thomas F. O’Toole |
| Thomas F. O’Toole, Director | | Thomas F. O’Toole, Director | | Thomas F. O’Toole, Director |
| | | | |
| /s/ Christie Raymond | | /s/ Christie Raymond | | /s/ Christie Raymond |
| Christie Raymond, Director | | Christie Raymond, Director | | Christie Raymond, Director |
| | | | |
| /s/ Carol P. Sanders | | /s/ Carol P. Sanders | | /s/ Carol P. Sanders |
| Carol P. Sanders, Director | | Carol P. Sanders, Director | | Carol P. Sanders, Director |