UNITED STATES
SECURITIES AND EXCHANGE COMMISSION
Washington, D.C. 20549
CERTIFIED SHAREHOLDER REPORT OF REGISTERED MANAGEMENT INVESTMENT COMPANIES
| | |
| Investment Company Act file number: | | 811-03175 |
| |
| Exact name of registrant as specified in charter: | | Prudential Sector Funds, Inc. |
| |
| Address of principal executive offices: | | 655 Broad Street, 6Floor |
| | Newark, New Jersey 07102 |
| |
| Name and address of agent for service: | | Andrew R. French |
| | 655 Broad Street, 6Floor |
| | Newark, New Jersey 07102 |
| |
| Registrant’s telephone number, including area code: | | |
| |
| Date of fiscal year end: | | 11/30/2024 |
| |
| Date of reporting period: | | 11/30/2024 |
Item 1 – Reports to Stockholders
| | (a) | Report transmitted to stockholders pursuant to Rule 30e-1 under the Act (17 CFR 270.30e-1). |
PGIM Jennison Financial Services Fund
ANNUAL SHAREHOLDER REPORT – November 30, 2024
This annual shareholder report contains important information about the Class A shares of
PGIM
Jennison Financial Services Fund (the “Fund”)
for the period of December 1, 2023 to November 30, 2024.
You can find additional information about the Fund at
pgim.com/investments/mutual-funds/prospectuses-fact-sheets
. You can also request
this information by contacting us at (800) 225-1852 or (973) 367-3529 from outside the US.
WHAT WERE THE FUND COSTS FOR THE LAST YEAR?
(Based on a hypothetical $10,000 investment)
| Costs of a $10,000 investment | Costs paid as a percentage of a $10,000 investment |
PGIM Jennison Financial Services Fund—Class A | | |
WHAT AFFECTED THE FUND’S PERFORMANCE DURING THE REPORTING PERIOD?
■
Capital asset prices increased over the reporting period as investors reacted positively to the slowing pace of inflation and sustained economic
growth. The US Federal Reserve moved to lower the federal funds rate by 50 basis points at its September meeting and by another 25 basis
points at its November meeting. (One basis point equals 0.01%.) Equities responded favorably to the moves, especially interest-rate-sensitive
sectors of the market. Financial stocks (as represented by the S&P Composite 1500 Financials Index) generally outperformed the overall equity
market (as represented by the S&P 500 Index).
■
The Fund’s security selection within capital markets (led by KKR & Co. Inc. and The Goldman Sachs Group Inc.), financial services (especially
Apollo Global Management Inc.), and insurance (driven by Ryan Specialty Holdings Inc. and The Progressive Corp.) were the largest
contributors to the Fund’s solid performance and its significant outperformance relative to the Index. An underweight in financial services and
an overweight in banks also bolstered relative results.
■
On the negative side, stock selection in the banking industry, along with overweights in insurance and mortgage REITs, and non-Index positions
in consumer discretionary, detracted the most.
HOW HAS THE FUND PERFORMED OVER THE PAST 10 YEARS?
The Fund’s past performance is not a good predictor of the Fund’s future performance.
The returns do not reflect the deduction of
taxes that a shareholder would pay on Fund distributions or redemption of Fund shares.
Visit
pgim.com/investments/mutual-funds/prospectuses-fact-sheets
or call (800) 225-1852 or (973) 367-3529 from outside the US for more recent performance data.
The line graph reflects a hypothetical $10,000 investment in Class A shares and assumes that all recurring fees (including management fees)
were deducted and dividends and distributions were reinvested. Without waiver of fees and/or expense reimbursements, if any, the returns would
have been lower.
Cumulative Performance: November 30, 2014 to November 30, 2024 Initial Investment of $10,000 |
The line graph reflects the return on the Fund's Class A shares with sales charges.
Average Annual Total Returns as of 11/30/2024 |
| | | |
Class A with sales charges | | | |
Class A without sales charges | | | |
| | | |
S&P Composite 1500 Financials Index | | | |
WHAT ARE SOME KEY FUND STATISTICS AS OF 11/30/2024?
| |
| |
Total advisory fees paid for the year | |
Portfolio turnover rate for the year | |
WHAT ARE SOME CHARACTERISTICS OF THE FUND’S HOLDINGS AS OF 11/30/2024?
| |
| |
Transaction & Payment Processing Services | |
| |
Asset Management & Custody Banks | |
Property & Casualty Insurance | |
Investment Banking & Brokerage | |
| |
| |
Other Diversified Financial Services | |
Financial Exchanges & Data | |
| |
| |
| |
| |
| |
Affiliated Mutual Fund - Short Term Investment | |
| |
Liabilities in excess of other assets | |
| |
You can find additional information at
pgim.com/investments/mutual-funds/prospectuses-fact-sheets
or by scanning the QR code below,
including the Fund’s prospectus, financial information, fund holdings, and proxy voting information. You can also request this information by
contacting us at (800) 225-1852 or (973) 367-3529 from outside the US.
To receive your fund documents online, go to
pgim.com/investments/resource/edelivery
and enroll.
PGIM Jennison Financial Services Fund
PGIM Jennison Financial Services Fund
ANNUAL SHAREHOLDER REPORT – November 30, 2024
This annual shareholder report contains important information about the Class C shares of PGIM Jennison Financial Services Fund (the “Fund”)
for the period of December 1, 2023 to November 30, 2024.
You can find additional information about the Fund at
pgim.com/investments/mutual-funds/prospectuses-fact-sheets
. You can also request
this information by contacting us at (800) 225-1852 or (973) 367-3529 from outside the US.
WHAT WERE THE FUND COSTS FOR THE LAST YEAR?
(Based on a hypothetical $10,000 investment)
| Costs of a $10,000 investment | Costs paid as a percentage of a $10,000 investment |
PGIM Jennison Financial Services Fund—Class C | | |
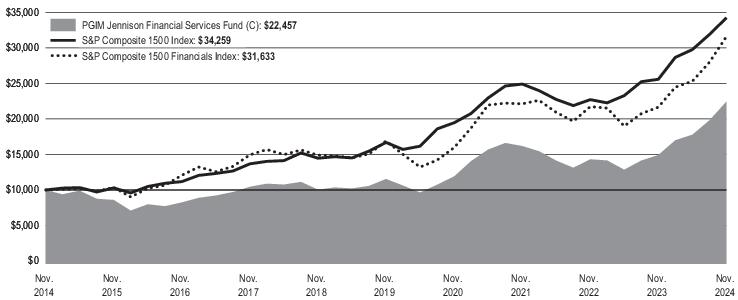
WHAT AFFECTED THE FUND’S PERFORMANCE DURING THE REPORTING PERIOD?
■
Capital asset prices increased over the reporting period as investors reacted positively to the slowing pace of inflation and sustained economic
growth. The US Federal Reserve moved to lower the federal funds rate by 50 basis points at its September meeting and by another 25 basis
points at its November meeting. (One basis point equals 0.01%.) Equities responded favorably to the moves, especially interest-rate-sensitive
sectors of the market. Financial stocks (as represented by the S&P Composite 1500 Financials Index) generally outperformed the overall equity
market (as represented by the S&P 500 Index).
■
The Fund’s security selection within capital markets (led by KKR & Co. Inc. and The Goldman Sachs Group Inc.), financial services (especially
Apollo Global Management Inc.), and insurance (driven by Ryan Specialty Holdings Inc. and The Progressive Corp.) were the largest
contributors to the Fund’s solid performance and its significant outperformance relative to the Index. An underweight in financial services and
an overweight in banks also bolstered relative results.
■
On the negative side, stock selection in the banking industry, along with overweights in insurance and mortgage REITs, and non-Index positions
in consumer discretionary, detracted the most.
HOW HAS THE FUND PERFORMED OVER THE PAST 10 YEARS?
The Fund’s past performance is not a good predictor of the Fund’s future performance.
The returns do not reflect the deduction of
taxes that a shareholder would pay on Fund distributions or redemption of Fund shares.
Visit
pgim.com/investments/mutual-funds/prospectuses-fact-sheets
or call (800) 225-1852 or (973) 367-3529 from outside the US for more recent performance data.
The line graph reflects a hypothetical $10,000 investment in Class C shares and assumes that all recurring fees (including management fees)
were deducted and dividends and distributions were reinvested. Without waiver of fees and/or expense reimbursements, if any, the returns would
have been lower.
Cumulative Performance: November 30, 2014 to November 30, 2024 Initial Investment of $10,000 |
Average Annual Total Returns as of 11/30/2024 |
| | | |
Class C with sales charges | | | |
Class C without sales charges | | | |
| | | |
S&P Composite 1500 Financials Index | | | |
WHAT ARE SOME KEY FUND STATISTICS AS OF 11/30/2024?
| |
| |
Total advisory fees paid for the year | |
Portfolio turnover rate for the year | |
WHAT ARE SOME CHARACTERISTICS OF THE FUND’S
HOLDINGS
AS OF 11/30/2024?
| |
| |
Transaction & Payment Processing Services | |
| |
Asset Management & Custody Banks | |
Property & Casualty Insurance | |
Investment Banking & Brokerage | |
| |
| |
Other Diversified Financial Services | |
Financial Exchanges & Data | |
| |
| |
| |
| |
| |
Affiliated Mutual Fund - Short Term Investment | |
| |
Liabilities in excess of other assets | |
| |
You can find additional information at
pgim.com/investments/mutual-funds/prospectuses-fact-sheets
or by scanning the QR code below,
including the Fund’s prospectus, financial information, fund holdings, and proxy voting information. You can also request this information by
contacting us at (800) 225-1852 or (973) 367-3529 from outside the US.
To receive your fund documents online, go to
pgim.com/investments/resource/edelivery
and enroll.
PGIM Jennison Financial Services Fund
PGIM Jennison Financial Services Fund
ANNUAL SHAREHOLDER REPORT – November 30, 2024
This annual shareholder report contains important information about the Class R shares of PGIM Jennison Financial Services Fund (the “Fund”)
for the period of December 1, 2023 to November 30, 2024.
You can find additional information about the Fund at
pgim.com/investments/mutual-funds/prospectuses-fact-sheets
. You can also request
this information by contacting us at (800) 225-1852 or (973) 367-3529 from outside the US.
WHAT WERE THE FUND COSTS FOR THE LAST YEAR?
(Based on a hypothetical $10,000 investment)
| Costs of a $10,000 investment | Costs paid as a percentage of a $10,000 investment |
PGIM Jennison Financial Services Fund—Class R | | |
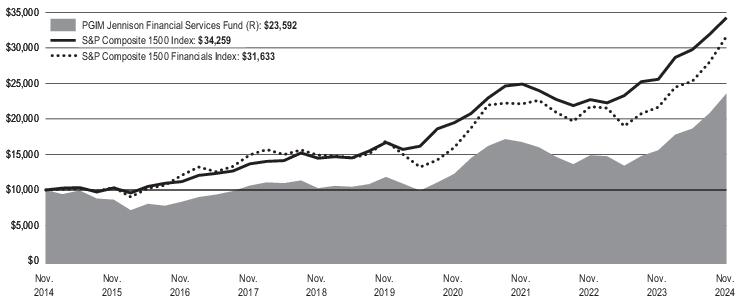
WHAT AFFECTED THE FUND’S PERFORMANCE DURING THE REPORTING PERIOD?
■
Capital asset prices increased over the reporting period as investors reacted positively to the slowing pace of inflation and sustained economic
growth. The US Federal Reserve moved to lower the federal funds rate by 50 basis points at its September meeting and by another 25 basis
points at its November meeting. (One basis point equals 0.01%.) Equities responded favorably to the moves, especially interest-rate-sensitive
sectors of the market. Financial stocks (as represented by the S&P Composite 1500 Financials Index) generally outperformed the overall equity
market (as represented by the S&P 500 Index).
■
The Fund’s security selection within capital markets (led by KKR & Co. Inc. and The Goldman Sachs Group Inc.), financial services (especially
Apollo Global Management Inc.), and insurance (driven by Ryan Specialty Holdings Inc. and The Progressive Corp.) were the largest
contributors to the Fund’s solid performance and its significant outperformance relative to the Index. An underweight in financial services and
an overweight in banks also bolstered relative results.
■
On the negative side, stock selection in the banking industry, along with overweights in insurance and mortgage REITs, and non-Index positions
in consumer discretionary, detracted the most.
HOW HAS THE FUND PERFORMED OVER THE PAST 10 YEARS?
The Fund’s past performance is not a good predictor of the Fund’s future performance.
The returns do not reflect the deduction of
taxes that a shareholder would pay on Fund distributions or redemption of Fund shares.
Visit
pgim.com/investments/mutual-funds/prospectuses-fact-sheets
or call (800) 225-1852 or (973) 367-3529 from outside the US for more recent performance data.
The line graph reflects a hypothetical $10,000 investment in Class R shares and assumes that all recurring fees (including management fees)
were deducted and dividends and distributions were reinvested. Without waiver of fees and/or expense reimbursements, if any, the returns would
have been lower.
Cumulative Performance: November 30, 2014 to November 30, 2024 Initial Investment of $10,000 |
Average Annual Total Returns as of 11/30/2024 |
| | | |
| | | |
| | | |
S&P Composite 1500 Financials Index | | | |
WHAT ARE SOME KEY FUND STATISTICS AS OF 11/30/2024?
| |
| |
Total advisory fees paid for the year | |
Portfolio turnover rate for the year | |
WHAT ARE SOME CHARACTERISTICS OF THE FUND’S
HOLDINGS
AS OF 11/30/2024?
| |
| |
Transaction & Payment Processing Services | |
| |
Asset Management & Custody Banks | |
Property & Casualty Insurance | |
Investment Banking & Brokerage | |
| |
| |
Other Diversified Financial Services | |
Financial Exchanges & Data | |
| |
| |
| |
| |
| |
Affiliated Mutual Fund - Short Term Investment | |
| |
Liabilities in excess of other assets | |
| |
You can find additional information at
pgim.com/investments/mutual-funds/prospectuses-fact-sheets
or by scanning the QR code below,
including the Fund’s prospectus, financial information, fund holdings, and proxy voting information. You can also request this information by
contacting us at (800) 225-1852 or (973) 367-3529 from outside the US.
To receive your fund documents online, go to
pgim.com/investments/resource/edelivery
and enroll.
PGIM Jennison Financial Services Fund
PGIM Jennison Financial Services Fund
ANNUAL SHAREHOLDER REPORT – November 30, 2024
This annual shareholder report contains important information about the Class Z shares of PGIM Jennison Financial Services Fund (the “Fund”)
for the period of December 1, 2023 to November 30, 2024.
You can find additional information about the Fund at
pgim.com/investments/mutual-funds/prospectuses-fact-sheets
. You can also request
this information by contacting us at (800) 225-1852 or (973) 367-3529 from outside the US.
WHAT WERE THE FUND COSTS FOR THE LAST YEAR?
(Based on a hypothetical $10,000 investment)
| Costs of a $10,000 investment | Costs paid as a percentage of a $10,000 investment |
PGIM Jennison Financial Services Fund—Class Z | | |
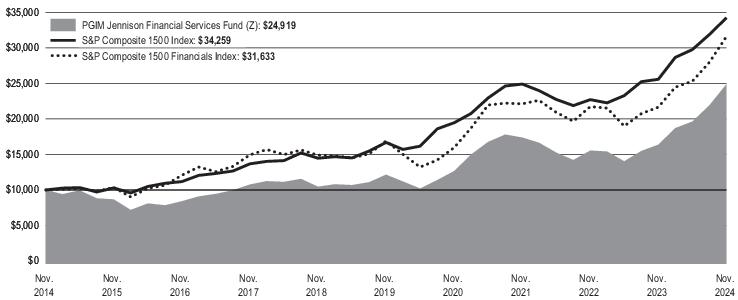
WHAT AFFECTED THE FUND’S PERFORMANCE DURING THE REPORTING PERIOD?
■
Capital asset prices increased over the reporting period as investors reacted positively to the slowing pace of inflation and sustained economic
growth. The US Federal Reserve moved to lower the federal funds rate by 50 basis points at its September meeting and by another 25 basis
points at its November meeting. (One basis point equals 0.01%.) Equities responded favorably to the moves, especially interest-rate-sensitive
sectors of the market. Financial stocks (as represented by the S&P Composite 1500 Financials Index) generally outperformed the overall equity
market (as represented by the S&P 500 Index).
■
The Fund’s security selection within capital markets (led by KKR & Co. Inc. and The Goldman Sachs Group Inc.), financial services (especially
Apollo Global Management Inc.), and insurance (driven by Ryan Specialty Holdings Inc. and The Progressive Corp.) were the largest
contributors to the Fund’s solid performance and its significant outperformance relative to the Index. An underweight in financial services and
an overweight in banks also bolstered relative results.
■
On the negative side, stock selection in the banking industry, along with overweights in insurance and mortgage REITs, and non-Index positions
in consumer discretionary, detracted the most.
HOW HAS THE FUND PERFORMED OVER THE PAST 10 YEARS?
The Fund’s past performance is not a good predictor of the Fund’s future performance.
The returns do not reflect the deduction of
taxes that a shareholder would pay on Fund distributions or redemption of Fund shares.
Visit
pgim.com/investments/mutual-funds/prospectuses-fact-sheets
or call (800) 225-1852 or (973) 367-3529 from outside the US for more recent performance data.
The line graph reflects a hypothetical $10,000 investment in Class Z shares and assumes that all recurring fees (including management fees)
were deducted and dividends and distributions were reinvested. Without waiver of fees and/or expense reimbursements, if any, the returns would
have been lower.
Cumulative Performance: November 30, 2014 to November 30, 2024 Initial Investment of $10,000 |
Average Annual Total Returns as of 11/30/2024 |
| | | |
| | | |
| | | |
S&P Composite 1500 Financials Index | | | |
WHAT ARE SOME KEY FUND STATISTICS
AS
OF 11/30/2024?
| |
| |
Total advisory fees paid for the year | |
Portfolio turnover rate for the year | |
WHAT ARE SOME CHARACTERISTICS OF
THE
FUND’S
HOLDINGS
AS OF 11/30/2024?
| |
| |
Transaction & Payment Processing Services | |
| |
Asset Management & Custody Banks | |
Property & Casualty Insurance | |
Investment Banking & Brokerage | |
| |
| |
Other Diversified Financial Services | |
Financial Exchanges & Data | |
| |
| |
| |
| |
| |
Affiliated Mutual Fund - Short Term Investment | |
| |
Liabilities in excess of other assets | |
| |
You can find additional information at
pgim.com/investments/mutual-funds/prospectuses-fact-sheets
or by scanning the QR code below,
including the Fund’s prospectus, financial information, fund holdings, and proxy voting information. You can also request this information by
contacting us at (800) 225-1852 or (973) 367-3529 from outside the US.
To receive your fund documents online, go to
pgim.com/investments/resource/edelivery
and enroll.
PGIM Jennison Financial Services Fund
PGIM Jennison Financial Services Fund
ANNUAL SHAREHOLDER REPORT – November 30, 2024
This annual shareholder report contains important information about the Class R6 shares of PGIM Jennison Financial Services Fund (the “Fund”)
for the period of December 1, 2023 to November 30, 2024.
You can find additional information about the Fund at
pgim.com/investments/mutual-funds/prospectuses-fact-sheets
. You can also request
this information by contacting us at (800) 225-1852 or (973) 367-3529 from outside the US.
WHAT WERE THE FUND COSTS FOR THE LAST YEAR?
(Based on a hypothetical $10,000 investment)
| Costs of a $10,000 investment | Costs paid as a percentage of a $10,000 investment |
PGIM Jennison Financial Services Fund—Class R6 | | |
WHAT AFFECTED THE FUND’S PERFORMANCE DURING THE REPORTING PERIOD?
■
Capital asset prices increased over the reporting period as investors reacted positively to the slowing pace of inflation and sustained economic
growth. The US Federal Reserve moved to lower the federal funds rate by 50 basis points at its September meeting and by another 25 basis
points at its November meeting. (One basis point equals 0.01%.) Equities responded favorably to the moves, especially interest-rate-sensitive
sectors of the market. Financial stocks (as represented by the S&P Composite 1500 Financials Index) generally outperformed the overall equity
market (as represented by the S&P 500 Index).
■
The Fund’s security selection within capital markets (led by KKR & Co. Inc. and The Goldman Sachs Group Inc.), financial services (especially
Apollo Global Management Inc.), and insurance (driven by Ryan Specialty Holdings Inc. and The Progressive Corp.) were the largest
contributors to the Fund’s solid performance and its significant outperformance relative to the Index. An underweight in financial services and
an overweight in banks also bolstered relative results.
■
On the negative side, stock selection in the banking industry, along with overweights in insurance and mortgage REITs, and non-Index positions
in consumer discretionary, detracted the most.
HOW HAS THE FUND PERFORMED OVER THE PAST 10 YEARS?
The Fund’s past performance is not a good predictor of the Fund’s future performance.
The returns do not reflect the deduction of
taxes that a shareholder would pay on Fund distributions or redemption of Fund shares.
Visit
pgim.com/investments/mutual-funds/prospectuses-fact-sheets
or call (800) 225-1852 or (973) 367-3529 from outside the US for more recent performance data.
The line graph reflects a hypothetical $10,000 investment in Class R6 shares and assumes that all recurring fees (including management fees)
were deducted and dividends and distributions were reinvested. Without waiver of fees and/or expense reimbursements, if any, the returns would
have been lower.
Cumulative Performance: January 26, 2018 to November 30, 2024 Initial Investment of $10,000 |
Average Annual Total Returns as of 11/30/2024 |
| | | |
| | | |
| | | |
S&P Composite 1500 Financials Index | | | |
Since Inception returns are provided for the share class since it has less than 10 fiscal years of returns. Since Inception returns for the Indexes are measured from the closest
month-end to the class’s inception date.
WHAT ARE SOME KEY FUND STATISTICS AS OF 11/30/2024?
| |
| |
Total advisory fees paid for the year | |
Portfolio turnover rate for the year | |
WHAT ARE SOME CHARACTERISTICS OF THE FUND’S
HOLDINGS
AS OF 11/30/2024?
| |
| |
Transaction & Payment Processing Services | |
| |
Asset Management & Custody Banks | |
Property & Casualty Insurance | |
Investment Banking & Brokerage | |
| |
| |
Other Diversified Financial Services | |
Financial Exchanges & Data | |
| |
| |
| |
| |
| |
Affiliated Mutual Fund - Short Term Investment | |
| |
Liabilities in excess of other assets | |
| |
You can find additional information at
pgim.com/investments/mutual-funds/prospectuses-fact-sheets
or by scanning the QR code below,
including the Fund’s prospectus, financial information, fund holdings, and proxy voting information. You can also request this information by
contacting us at (800) 225-1852 or (973) 367-3529 from outside the US.
To receive your fund documents online, go to
pgim.com/investments/resource/edelivery
and enroll.
PGIM Jennison Financial Services Fund
PGIM Jennison Health Sciences Fund
ANNUAL SHAREHOLDER REPORT – November 30, 2024
This annual shareholder report contains important information about the Class A shares of PGIM Jennison Health Sciences Fund (the “Fund”) for
the period of December 1, 2023 to November 30, 2024.
You can find additional information about the Fund at
pgim.com/investments/mutual-funds/prospectuses-fact-sheets
. You can also request
this information by contacting us at (800) 225-1852 or (973) 367-3529 from outside the US.
WHAT WERE THE FUND COSTS FOR THE LAST YEAR?
(Based on a hypothetical $10,000 investment)
| Costs of a $10,000 investment | Costs paid as a percentage of a $10,000 investment |
PGIM Jennison Health Sciences Fund—Class A | | |
WHAT AFFECTED THE FUND’S PERFORMANCE DURING THE REPORTING PERIOD?
■
Capital asset prices increased over the reporting period as investors reacted positively to the slowing pace of inflation and sustained economic
growth. The US Federal Reserve moved to lower the federal funds rate by 50 basis points at its September meeting and by another 25 basis
points at its November meeting. (One basis point equals 0.01%.) Equities responded favorably to the moves, especially interest-rate-sensitive
areas of the market. Health care stocks (as represented by the S&P Composite 1500 Health Care Index (Index)) generally underperformed the
overall equity market (as represented by the S&P 500 Index).
■
The Fund’s holdings within pharmaceuticals (especially Bristol-Myers Squibb Co. and Verona Pharma plc), biotechnology (led by Arcutis
Biotherapeutics Inc. and Crinetics Pharmaceuticals Inc.), and medtech (driven by DexCom Inc. and Boston Scientific Corp.) were the largest
contributors to the Fund’s solid performance and its significant outperformance relative to the Index.
■
On the negative side, stock selection in health care providers & services (especially Humana Inc. and UnitedHealth Group Inc.), along with an
underweight in medtech relative to the Index, detracted the most.
HOW HAS THE FUND PERFORMED OVER THE PAST 10 YEARS?
The Fund’s past performance is not a good predictor of the Fund’s future performance.
The returns do not reflect the deduction of
taxes that a shareholder would pay on Fund distributions or redemption of Fund shares.
Visit
pgim.com/investments/mutual-funds/prospectuses-fact-sheets
or call (800) 225-1852 or (973) 367-3529 from outside the US for more recent performance data.
The line graph reflects a hypothetical $10,000 investment in Class A shares and assumes that all recurring fees (including management fees)
were deducted and dividends and distributions were reinvested. Without waiver of fees and/or expense reimbursements, if any, the returns would
have been lower.
Cumulative Performance: November 30, 2014 to November 30, 2024 Initial Investment of $10,000 |
The line graph reflects the return on the Fund's Class A shares with sales charges.
Average Annual Total Returns as of 11/30/2024 |
| | | |
Class A with sales charges | | | |
Class A without sales charges | | | |
| | | |
S&P Composite 1500 Health Care Index | | | |
WHAT ARE SOME KEY FUND STATISTICS AS OF 11/30/2024?
| |
| |
Total advisory fees paid for the year | |
Portfolio turnover rate for the year | |
WHAT ARE SOME CHARACTERISTICS OF THE FUND’S HOLDINGS AS OF 11/30/2024?
| |
| |
| |
| |
| |
Life Sciences Tools & Services | |
Affiliated Mutual Fund - Short Term Investment (2.1% represents investments purchased with collateral from securities on loan) | |
| |
| |
| |
Liabilities in excess of other assets | |
| |
You can find additional information at
pgim.com/investments/mutual-funds/prospectuses-fact-sheets
or by scanning the QR code below,
including the Fund’s prospectus, financial information, fund holdings, and proxy voting information. You can also request this information by
contacting us at (800) 225-1852 or (973) 367-3529 from outside the US.
To receive your fund documents online, go to
pgim.com/investments/resource/edelivery
and enroll.
PGIM Jennison Health Sciences Fund
PGIM Jennison Health Sciences Fund
ANNUAL SHAREHOLDER REPORT – November 30, 2024
This annual shareholder report contains important information about the Class C shares of PGIM Jennison Health Sciences Fund (the “Fund”) for
the period of December 1, 2023 to November 30, 2024.
You can find additional information about the Fund at
pgim.com/investments/mutual-funds/prospectuses-fact-sheets
. You can also request
this information by contacting us at (800) 225-1852 or (973) 367-3529 from outside the US.
WHAT WERE THE FUND COSTS FOR THE LAST YEAR?
(Based on a hypothetical $10,000 investment)
| Costs of a $10,000 investment | Costs paid as a percentage of a $10,000 investment |
PGIM Jennison Health Sciences Fund—Class C | | |
WHAT AFFECTED THE FUND’S PERFORMANCE DURING THE REPORTING PERIOD?
■
Capital asset prices increased over the reporting period as investors reacted positively to the slowing pace of inflation and sustained economic
growth. The US Federal Reserve moved to lower the federal funds rate by 50 basis points at its September meeting and by another 25 basis
points at its November meeting. (One basis point equals 0.01%.) Equities responded favorably to the moves, especially interest-rate-sensitive
areas of the market. Health care stocks (as represented by the S&P Composite 1500 Health Care Index (Index)) generally underperformed the
overall equity market (as represented by the S&P 500 Index).
■
The Fund’s holdings within pharmaceuticals (especially Bristol-Myers Squibb Co. and Verona Pharma plc), biotechnology (led by Arcutis
Biotherapeutics Inc. and Crinetics Pharmaceuticals Inc.), and medtech (driven by DexCom Inc. and Boston Scientific Corp.) were the largest
contributors to the Fund’s solid performance and its significant outperformance relative to the Index.
■
On the negative side, stock selection in health care providers & services (especially Humana Inc. and UnitedHealth Group Inc.), along with an
underweight in medtech relative to the Index, detracted the most.
HOW HAS THE FUND PERFORMED OVER THE PAST 10 YEARS?
The Fund’s past performance is not a good predictor of the Fund’s future performance.
The returns do not reflect the deduction of
taxes that a shareholder would pay on Fund distributions or redemption of Fund shares.
Visit
pgim.com/investments/mutual-funds/prospectuses-fact-sheets
or call (800) 225-1852 or (973) 367-3529 from outside the US for more recent performance data.
The line graph reflects a hypothetical $10,000 investment in Class C shares and assumes that all recurring fees (including management fees)
were deducted and dividends and distributions were reinvested. Without waiver of fees and/or expense reimbursements, if any, the returns would
have been lower.
Cumulative Performance: November 30, 2014 to November 30, 2024 Initial Investment of $10,000 |
Average Annual Total Returns as of 11/30/2024 |
| | | |
Class C with sales charges | | | |
Class C without sales charges | | | |
| | | |
S&P Composite 1500 Health Care Index | | | |
WHAT ARE SOME KEY FUND STATISTICS AS OF 11/30/2024?
| |
| |
Total advisory fees paid for the year | |
Portfolio turnover rate for the year | |
WHAT ARE SOME CHARACTERISTICS OF THE FUND’S HOLDINGS AS OF 11/30/2024?
| |
| |
| |
| |
| |
Life Sciences Tools & Services | |
Affiliated Mutual Fund - Short Term Investment (2.1% represents investments purchased with collateral from securities on loan) | |
| |
| |
| |
Liabilities in excess of other assets | |
| |
You can find additional information at
pgim.com/investments/mutual-funds/prospectuses-fact-sheets
or by scanning the QR code below,
including the Fund’s prospectus, financial information, fund holdings, and proxy voting information. You can also request this information by
contacting us at (800) 225-1852 or (973) 367-3529 from outside the US.
To receive your fund documents online, go to
pgim.com/investments/resource/edelivery
and enroll.
PGIM Jennison Health Sciences Fund
PGIM Jennison Health Sciences Fund
ANNUAL SHAREHOLDER REPORT – November 30, 2024
This annual shareholder report contains important information about the Class R shares of PGIM Jennison Health Sciences Fund (the “Fund”) for
the period of December 1, 2023 to November 30, 2024.
You can find additional information about the Fund at
pgim.com/investments/mutual-funds/prospectuses-fact-sheets
. You can also request
this information by contacting us at (800) 225-1852 or (973) 367-3529 from outside the US.
WHAT WERE THE FUND COSTS FOR THE LAST YEAR?
(Based on a hypothetical $10,000 investment)
| Costs of a $10,000 investment | Costs paid as a percentage of a $10,000 investment |
PGIM Jennison Health Sciences Fund—Class R | | |
WHAT AFFECTED THE FUND’S PERFORMANCE DURING THE REPORTING PERIOD?
■
Capital asset prices increased over the reporting period as investors reacted positively to the slowing pace of inflation and sustained economic
growth. The US Federal Reserve moved to lower the federal funds rate by 50 basis points at its September meeting and by another 25 basis
points at its November meeting. (One basis point equals 0.01%.) Equities responded favorably to the moves, especially interest-rate-sensitive
areas of the market. Health care stocks (as represented by the S&P Composite 1500 Health Care Index (Index)) generally underperformed the
overall equity market (as represented by the S&P 500 Index).
■
The Fund’s holdings within pharmaceuticals (especially Bristol-Myers Squibb Co. and Verona Pharma plc), biotechnology (led by Arcutis
Biotherapeutics Inc. and Crinetics Pharmaceuticals Inc.), and medtech (driven by DexCom Inc. and Boston Scientific Corp.) were the largest
contributors to the Fund’s solid performance and its significant outperformance relative to the Index.
■
On the negative side, stock selection in health care providers & services (especially Humana Inc. and UnitedHealth Group Inc.), along with an
underweight in medtech relative to the Index, detracted the most.
HOW HAS THE FUND PERFORMED OVER THE PAST 10 YEARS?
The Fund’s past performance is not a good predictor of the Fund’s future performance.
The returns do not reflect the deduction of
taxes that a shareholder would pay on Fund distributions or redemption of Fund shares.
Visit
pgim.com/investments/mutual-funds/prospectuses-fact-sheets
or call (800) 225-1852 or (973) 367-3529 from outside the US for more recent performance data.
The line graph reflects a hypothetical $10,000 investment in Class R shares and assumes that all recurring fees (including management fees)
were deducted and dividends and distributions were reinvested. Without waiver of fees and/or expense reimbursements, if any, the returns would
have been lower.
Cumulative Performance: November 30, 2014 to November 30, 2024 Initial Investment of $10,000 |
Average Annual Total Returns as of 11/30/2024 |
| | | |
| | | |
| | | |
S&P Composite 1500 Health Care Index | | | |
WHAT ARE SOME KEY FUND STATISTICS AS OF 11/30/2024?
| |
| |
Total advisory fees paid for the year | |
Portfolio turnover rate for the year | |
WHAT ARE SOME CHARACTERISTICS OF THE FUND’S HOLDINGS AS OF 11/30/2024?
| |
| |
| |
| |
| |
Life Sciences Tools & Services | |
Affiliated Mutual Fund - Short Term Investment (2.1% represents investments purchased with collateral from securities on loan) | |
| |
| |
| |
Liabilities in excess of other assets | |
| |
You can find additional information at
pgim.com/investments/mutual-funds/prospectuses-fact-sheets
or by scanning the QR code below,
including the Fund’s prospectus, financial information, fund holdings, and proxy voting information. You can also request this information by
contacting us at (800) 225-1852 or (973) 367-3529 from outside the US.
To receive your fund documents online, go to
pgim.com/investments/resource/edelivery
and enroll.
PGIM Jennison Health Sciences Fund
PGIM Jennison Health Sciences Fund
ANNUAL SHAREHOLDER REPORT – November 30, 2024
This annual shareholder report contains important information about the Class Z shares of PGIM Jennison Health Sciences Fund (the “Fund”) for
the period of December 1, 2023 to November 30, 2024.
You can find additional information about the Fund at
pgim.com/investments/mutual-funds/prospectuses-fact-sheets
. You can also request
this information by contacting us at (800) 225-1852 or (973) 367-3529 from outside the US.
WHAT WERE THE FUND COSTS FOR THE LAST YEAR?
(Based on a hypothetical $10,000 investment)
| Costs of a $10,000 investment | Costs paid as a percentage of a $10,000 investment |
PGIM Jennison Health Sciences Fund—Class Z | | |
WHAT AFFECTED THE FUND’S PERFORMANCE DURING THE REPORTING PERIOD?
■
Capital asset prices increased over the reporting period as investors reacted positively to the slowing pace of inflation and sustained economic
growth. The US Federal Reserve moved to lower the federal funds rate by 50 basis points at its September meeting and by another 25 basis
points at its November meeting. (One basis point equals 0.01%.) Equities responded favorably to the moves, especially interest-rate-sensitive
areas of the market. Health care stocks (as represented by the S&P Composite 1500 Health Care Index (Index)) generally underperformed the
overall equity market (as represented by the S&P 500 Index).
■
The Fund’s holdings within pharmaceuticals (especially Bristol-Myers Squibb Co. and Verona Pharma plc), biotechnology (led by Arcutis
Biotherapeutics Inc. and Crinetics Pharmaceuticals Inc.), and medtech (driven by DexCom Inc. and Boston Scientific Corp.) were the largest
contributors to the Fund’s solid performance and its significant outperformance relative to the Index.
■
On the negative side, stock selection in health care providers & services (especially Humana Inc. and UnitedHealth Group Inc.), along with an
underweight in medtech relative to the Index, detracted the most.
HOW HAS THE FUND PERFORMED OVER THE PAST 10 YEARS?
The Fund’s past performance is not a good predictor of the Fund’s future performance.
The returns do not reflect the deduction of
taxes that a shareholder would pay on Fund distributions or redemption of Fund shares.
Visit
pgim.com/investments/mutual-funds/prospectuses-fact-sheets
or call (800) 225-1852 or (973) 367-3529 from outside the US for more recent performance data.
The line graph reflects a hypothetical $10,000 investment in Class Z shares and assumes that all recurring fees (including management fees)
were deducted and dividends and distributions were reinvested. Without waiver of fees and/or expense reimbursements, if any, the returns would
have been lower.
Cumulative Performance: November 30, 2014 to November 30, 2024 Initial Investment of $10,000 |
Average Annual Total Returns as of 11/30/2024 |
| | | |
| | | |
| | | |
S&P Composite 1500 Health Care Index | | | |
WHAT ARE SOME KEY FUND STATISTICS AS OF 11/30/2024?
| |
| |
Total advisory fees paid for the year | |
Portfolio turnover rate for the year | |
WHAT ARE SOME CHARACTERISTICS OF THE FUND’S HOLDINGS AS OF 11/30/2024?
| |
| |
| |
| |
| |
Life Sciences Tools & Services | |
Affiliated Mutual Fund - Short Term Investment (2.1% represents investments purchased with collateral from securities on loan) | |
| |
| |
| |
Liabilities in excess of other assets | |
| |
You can find additional information at
pgim.com/investments/mutual-funds/prospectuses-fact-sheets
or by scanning the QR code below,
including the Fund’s prospectus, financial information, fund holdings, and proxy voting information. You can also request this information by
contacting us at (800) 225-1852 or (973) 367-3529 from outside the US.
To receive your fund documents online, go to
pgim.com/investments/resource/edelivery
and enroll.
PGIM Jennison Health Sciences Fund
PGIM Jennison Health Sciences Fund
ANNUAL SHAREHOLDER REPORT – November 30, 2024
This annual shareholder report contains important information about the Class R6 shares of PGIM Jennison Health Sciences Fund (the “Fund”)
for the period of December 1, 2023 to November 30, 2024.
You can find additional information about the Fund at
pgim.com/investments/mutual-funds/prospectuses-fact-sheets
. You can also request
this information by contacting us at (800) 225-1852 or (973) 367-3529 from outside the US.
WHAT WERE THE FUND COSTS FOR THE LAST YEAR?
(Based on a hypothetical $10,000 investment)
| Costs of a $10,000 investment | Costs paid as a percentage of a $10,000 investment |
PGIM Jennison Health Sciences Fund—Class R6 | | |
WHAT AFFECTED THE FUND’S PERFORMANCE DURING THE REPORTING PERIOD?
■
Capital asset prices increased over the reporting period as investors reacted positively to the slowing pace of inflation and sustained economic
growth. The US Federal Reserve moved to lower the federal funds rate by 50 basis points at its September meeting and by another 25 basis
points at its November meeting. (One basis point equals 0.01%.) Equities responded favorably to the moves, especially interest-rate-sensitive
areas of the market. Health care stocks (as represented by the S&P Composite 1500 Health Care Index (Index)) generally underperformed the
overall equity market (as represented by the S&P 500 Index).
■
The Fund’s holdings within pharmaceuticals (especially Bristol-Myers Squibb Co. and Verona Pharma plc), biotechnology (led by Arcutis
Biotherapeutics Inc. and Crinetics Pharmaceuticals Inc.), and medtech (driven by DexCom Inc. and Boston Scientific Corp.) were the largest
contributors to the Fund’s solid performance and its significant outperformance relative to the Index.
■
On the negative side, stock selection in health care provid
er
s & services (especially Humana Inc. and UnitedHealth Group Inc.), along with an
underweight in medtech relative to the Index, detracted the mo
st.
HOW HAS THE FUND PERFORMED OVER THE PAST 10 YEARS?
The Fund’s past performance is not a good predictor of the Fund’s future performance.
The returns do not reflect the deduction of
taxes that a shareholder would pay on Fund distributions or redemption of Fund shares.
Visit
pgim.com/investments/mutual-funds/prospectuses-fact-sheets
or call (800) 225-1852 or (973) 367-3529 from outside the US for more recent performance data.
The line graph reflects a hypothetical $10,000 investment in Class R6 shares and assumes that all recurring fees (including management fees)
were deducted and dividends and distributions were reinvested. Without waiver of fees and/or expense reimbursements, if any, the returns would
have been lower.
Cumulative Performance: January 27, 2016 to November 30, 20 24 Initial Investment of $10,000 |
Average Annual Total Returns as of 11/30/2024 |
| | | |
| | | |
| | | |
S&P Composite 1500 Health Care Index | | | |
Since Inception returns are provided for the
share
class since it has less than 10 fiscal years of returns. Since Inception returns for the Indexes are measured from the closest
month-end to the class’s inception d
ate.
WHAT ARE SOME KEY FUND STATISTICS AS OF 11/30/2
0
24?
| |
| |
Total advisory fees paid for the year | |
Portfolio turnover rate for the year | |
WHAT ARE SOME CHARACTERISTICS OF THE FUND’S HOLDINGS AS OF 11/30/2024?
| |
| |
| |
| |
| |
Life Sciences Tools & Services | |
Affiliated Mutual Fund - Short Term Investment (2.1% represents investments purchased with collateral from securities on loan) | |
| |
| |
| |
Liabilities in excess of other assets | |
| |
You can find additional information at
pgim.com/investments/mutual-funds/prospectuses-fact-sheets
or by scanning the QR code below,
including the Fund’s prospectus, financial information, fund holdings, and proxy voting information. You can also request this information by
contacting us at (800) 225-1852 or (973) 367-3529 from outside the US.
To receive your fund documents online, go to
pgim.com/investments/resource/edelivery
and enroll.
PGIM Jennison Health Sciences Fund
PGIM Jennison Utility Fund
ANNUAL SHAREHOLDER REPORT – November 30, 2024
This annual shareholder report contains important information about the Class A shares of PGIM Jennison Utility Fund (the “Fund”) for the period
of December 1, 2023 to November 30, 2024.
You can find additional information about the Fund at
pgim.com/investments/mutual-funds/prospectuses-fact-sheets
. You can also request
this information by contacting us at (800) 225-1852 or (973) 367-3529 from outside the US.
WHAT WERE THE FUND COSTS FOR THE LAST YEAR?
(Based on a hypothetical $10,000 investment)
| Costs of a $10,000 investment | Costs paid as a percentage of a $10,000 investment |
PGIM Jennison Utility Fund—Class A | | |
WHAT AFFECTED THE FUND’S PERFORMANCE DURING THE REPORTING PERIOD?
■
Capital asset prices increased over the reporting period as investors reacted positively to the slowing pace of inflation and sustained economic
growth. The US Federal Reserve moved to lower the federal funds rate by 50 basis points at its September meeting and by another 25 basis
points at its November meeting. (One basis point equals 0.01%.) Equities responded favorably to the moves, particularly interest-rate-sensitive
sectors of the market. Utility stocks (as represented by the S&P 500 Utilities Index (Index)) outperformed the overall equity market (as
represented by the S&P 500 Index).
■
Within utilities, positions in independent power producers and renewables (led by Vistra Corp. and Talen Energy Corp.) and out-of-Index
exposure to water utilities contributed positively to the Fund’s performance relative to the Index. Energy sector names (primarily Targa
Resources Corp.) further bolstered relative results.
■
On the negative side, security selection in electric utilities and multi-utili
ti
es, along with exposure to out-of-Index names in communications,
HOW HAS THE FUND PERFORMED OVER THE PAST 10 YEARS?
The Fund’s past performance is not a good predictor of the Fund’s future performance.
The returns do not reflect the deduction of
taxes that a shareholder would pay on Fund distributions or redemption of Fund shares.
Visit
pgim.com/investments/mutual-funds/prospectuses-fact-sheets
or call (800) 225-1852 or (973) 367-3529 from outside the US for more recent performance data.
The line graph reflects a hypothetical $10,000 investment in Class A shares and assumes that all recurring fees (including management fees)
were deducted and dividends and distribution
s were rein
vested. Without waiver of fees and/or expense reimbursements, if any, the returns would
have been lower.
Cumulative Performance: November 30, 2014 to November 30, 2024 Initial Investment of $10,000 |
The line graph reflects the return on the Fund's Class A shares with sales charges.
Average Annual Total Returns as of 11/30/2024 |
| | | |
Class A with sales charges | | | |
Class A without sales charges | | | |
| | | |
| | | |
WHAT ARE SOME KEY FUND STATISTICS AS OF 11/30/20
2
4?
| |
| |
Total advisory fees paid for the year | |
Portfolio turnover rate for the year | |
WHAT ARE SOME CHARACTERISTICS OF THE FUND’S HOLDINGS AS OF 11/30/202
4?
| |
| |
| |
Independent Power Producers & Energy Traders | |
Oil & Gas Storage & Transportation | |
| |
| |
Affiliated Mutual Fund - Short Term Investment (0.7% represents investments purchased with collateral from securities on loan) | |
| |
Liabilities in excess of other assets | |
| |
You can find additional information at
pgim.com/investments/mutual-funds/prospectuses-fact-sheets
or by scanning the QR code below,
including the Fund’s prospectus, financial information, fund holdings, and proxy voting information. You can also request this information by
contacting us at (800) 225-1852 or (973) 367-3529 from outside the US.
To receive your fund documents online, go to
pgim.com/investments/resource/edelivery
and enroll.
PGIM Jennison Utility Fund
PGIM Jennison Utility Fund
ANNUAL SHAREHOLDER REPORT – November 30, 2024
This annual shareholder report contains important information about the Class C shares of PGIM Jennison Utility Fund (the “Fund”) for the period
of December 1, 2023 to November 30, 2024.
You can find additional information about the Fund at
pgim.com/investments/mutual-funds/prospectuses-fact-sheets
. You can also request
this information by contacting us at (800) 225-1852 or (973) 367-3529 from outside the US.
WHAT WERE THE FUND COSTS FOR THE LAST YEAR?
(Based on a hypothetical $10,000 investment)
| Costs of a $10,000 investment | Costs paid as a percentage of a $10,000 investment |
PGIM Jennison Utility Fund—Class C | | |
WHAT AFFECTED THE FUND’S PERFORMANCE
DURING
THE REPORTING PERIOD?
■
Capital asset prices increased over the reporting period as investors reacted positively to the slowing pace of inflation and sustained economic
growth. The US Federal Reserve moved to lower the federal funds rate by 50 basis points at its September meeting and by another 25 basis
points at its November meeting. (One basis point equals 0.01%.) Equities responded favorably to the moves, particularly interest-rate-sensitive
sectors of the market. Utility stocks (as represented by the S&P 500 Utilities Index (Index)) outperformed the overall equity market (as
represented by the S&P 500 Index).
■
Within utilities, positions in independent power producers and renewables (led by Vistra Corp. and Talen Energy Corp.) and out-of-Index
exposure to water utilities contributed positively to the Fund’s performance relative to the Index. Energy sector names (primarily Targa
Resources Corp.) further bolstered relative results.
■
On the negative side, security selection in electric utilities and multi-utilities, along with exposure to out-of-Index names in communications,
detracted the most.
HOW HAS THE FUND PERFORMED OVER THE PAST 10 YEARS?
The Fund’s past performance is not a good predictor of the Fund’s future performance.
The returns do not reflect the deduction of
taxes that a shareholder would pay on Fund distributions or redemption of Fund shares.
Visit
pgim.com/investments/mutual-funds/prospectuses-fact-sheets
or call (800) 225-1852 or (973) 367-3529 from outside the US for more recent performance data.
The line graph reflects a hypothetical $10,000 investment in Class C shares and assumes that all recurring fees (including management fees)
were deducted and dividends and distributions were reinvested. Without waiver of fees and/or expense reimbursements, if any, the returns would
have been lower.
Cumulative Performance: November 30, 2014 to November 30, 202 4 Initial Investment of $10,000 |
Average Annual Total Returns as of 11/30/2024 |
| | | |
Class C with sales charges | | | |
Class C without sales charges | | | |
| | | |
| | | |
WHAT ARE SOME KEY FUND STATISTICS AS OF 11/30/2024?
| |
| |
Total advisory fees paid for the year | |
Portfolio turnover rate for the year | |
WHAT ARE SOME CHARACTERISTICS OF THE FUND’S HOLDINGS AS OF 11/30/202
4?
| |
| |
| |
Independent Power Producers & Energy Traders | |
Oil & Gas Storage & Transportation | |
| |
| |
Affiliated Mutual Fund - Short Term Investment (0.7% represents investments purchased with collateral from securities on loan) | |
| |
Liabilities in excess of other assets | |
| |
You can find additional information at
pgim.com/investments/mutual-funds/prospectuses-fact-sheets
or by scanning the QR code below,
including the Fund’s prospectus, financial information, fund holdings, and proxy voting information. You can also request this information by
contacting us at (800) 225-1852 or (973) 367-3529 from outside the US.
To receive your fund documents online, go to
pgim.com/investments/resource/edelivery
and enroll.
PGIM Jennison Utility Fund
PGIM Jennison Utility Fund
ANNUAL SHAREHOLDER REPORT – November 30, 2024
This annual shareholder report contains important information about the Class R shares of PGIM Jennison Utility Fund (the “Fund”) for the period
of December 1, 2023 to November 30, 2024.
You can find additional information about the Fund at
pgim.com/investments/mutual-funds/prospectuses-fact-sheets
. You can also request
this information by contacting us at (800) 225-1852 or (973) 367-3529 from outside the US.
WHAT WERE THE FUND COSTS FOR THE LAST YEAR?
(Based on a hypothetical $10,000 investment)
| Costs of a $10,000 investment | Costs paid as a percentage of a $10,000 investment |
PGIM Jennison Utility Fund—Class R | | |
WHAT AFFECTED THE FUND’S PERFORMANCE DURING THE REPORTING PERIOD?
■
Capital asset prices increased over the reporting period as investors reacted positively to the slowing pace of inflation and sustained economic
growth. The US Federal Reserve moved to lower the federal funds rate by 50 basis points at its September meeting and by another 25 basis
points at its November meeting. (One basis point equals 0.01%.) Equities responded favorably to the moves, particularly interest-rate-sensitive
sectors of the market. Utility stocks (as represented by the S&P 500 Utilities Index (Index)) outperformed the overall equity market (as
represented by the S&P 500 Index).
■
Within utilities, positions in independent power producers and renewables (led by Vistra Corp. and Talen Energy Corp.) and out-of-Index
exposure to water utilities contributed positively to the Fund’s performance relative to the Index. Energy sector names (primarily Targa
Resources Corp.) further bolstered relative results.
■
On the negative side, security selection in electric utilities and multi-utilities, along with exposure to out-of-Index names in communications,
detracted the most.
HOW HAS THE
FUND
PERFORMED
OVER THE PAST 10 YEARS?
The Fund’s past performance is not a good predictor of the Fund’s future performance.
The returns do not reflect the deduction of
taxes that a shareholder would pay on Fund distributions or redemption of Fund shares.
Visit
pgim.com/investments/mutual-funds/prospectuses-fact-sheets
or call (800) 225-1852 or (973) 367-3529 from outside the US for more recent performance data.
The line graph reflects a hypothetical $10,000 investment in Class R shares and assumes that all recurring fees (including management fees)
were deducted and dividends and distributions were reinvested. Without waiver of fees and/or expense reimbursements, if any, the returns would
have been lower.
Cumulative Performance: November 30, 2014 to November 30, 2024 Initial Investment of $10,000 |
Average Annual Total Returns as of 11/30/2024 |
| | | |
| | | |
| | | |
| | | |
WHAT ARE SOME KEY FUND STATISTICS AS OF 11/30/2024?
| |
| |
Total advisory fees paid for the year | |
Portfolio turnover rate for the year | |
WHAT ARE SOME CHARACTERISTICS OF THE FUND’S HOLDINGS AS OF 11/30/2024?
| |
| |
| |
Independent Power Producers & Energy Traders | |
Oil & Gas Storage & Transportation | |
| |
| |
Affiliated Mutual Fund - Short Term Investment (0.7% represents investments purchased with collateral from securities on loan) | |
| |
Liabilities in excess of other assets | |
| |
You can find additional information at
pgim.com/investments/mutual-funds/prospectuses-fact-sheets
or by scanning the QR code below,
including the Fund’s prospectus, financial information, fund holdings, and proxy voting information. You can also request this information by
contacting us at (800) 225-1852 or (973) 367-3529 from outside the US.
To receive your fund documents online, go to
pgim.com/investments/resource/edelivery
and enroll.
PGIM Jennison Utility Fund
PGIM Jennison Utility Fund
ANNUAL SHAREHOLDER REPORT – November 30, 2024
This annual shareholder report contains important information about the Class Z shares of PGIM Jennison Utility Fund (the “Fund”) for the period
of December 1, 2023 to November 30, 2024.
You can find additional information about the Fund at
pgim.com/investments/mutual-funds/prospectuses-fact-sheets
. You can also request
this information by contacting us at (800) 225-1852 or (973) 367-3529 from outside the US.
WHAT WERE THE FUND COSTS FOR THE LAST YEAR?
(Based on a hypothetical $10,000 investment)
| Costs of a $10,000 investment | Costs paid as a percentage of a $10,000 investment |
PGIM Jennison Utility Fund—Class Z | | |
WHAT AFFECTED THE FUND’S PERFORMANCE DURING THE REPORTING PERIOD?
■
Capital asset prices increased over the reporting period as investors reacted positively to the slowing pace of inflation and sustained economic
growth. The US Federal Reserve moved to lower the federal funds rate by 50 basis points at its September meeting and by another 25 basis
points at its November meeting. (One basis point equals 0.01%.) Equities responded favorably to the moves, particularly interest-rate-sensitive
sectors of the market. Utility stocks (as represented by the S&P 500 Utilities Index (Index)) outperformed the overall equity market (as
represented by the S&P 500 Index).
■
Within utilities, positions in independent power producers and renewables (led by Vistra Corp. and Talen Energy Corp.) and out-of-Index
exposure to water utilities contributed positively to the Fund’s performance relative to the Index. Energy sector names (primarily Targa
Resources Corp.) further bolstered relative results.
■
On the negative side, security selection in electric utilities and multi-utilities, along with exposure to out-of-Index names in communications,
detracted the most.
HOW HAS THE FUND PERFORMED OVER THE PAST 10 YEARS?
The Fund’s past performance is not a good predictor of the Fund’s future performance.
The returns do not reflect the deduction of
taxes that a shareholder would pay on Fund distributions or redemption of Fund shares.
Visit
pgim.com/investments/mutual-funds/prospectuses-fact-sheets
or call (800) 225-1852 or (973) 367-3529 from outside the US for more recent performance data.
The line graph reflects a hypothetical $10,000 investment in Class Z shares and assumes that all recurring fees (including management fees)
were deducted and dividends and distributions were reinvested. Without waiver of fees and/or expense reimbursements, if any, the returns would
have been lower.
Cumulative Performance: November 30, 2014 to November 30, 2024 Initial Investment of $10,000 |
Average Annual Total Returns as of 11/30/2024 |
| | | |
| | | |
| | | |
| | | |
WHAT ARE SOME KEY FUND STATISTICS AS OF 11/30/2024?
| |
| |
Total advisory fees paid for the year | |
Portfolio turnover rate for the year | |
WHAT ARE SOME
CHARACTERISTICS
OF THE FUND’S
HOLDINGS
AS OF 11/30/2024?
| |
| |
| |
Independent Power Producers & Energy Traders | |
Oil & Gas Storage & Transportation | |
| |
| |
Affiliated Mutual Fund - Short Term Investment (0.7% represents investments purchased with collateral from securities on loan) | |
| |
Liabilities in excess of other assets | |
| |
You can find additional information at
pgim.com/investments/mutual-funds/prospectuses-fact-sheets
or by scanning the QR code below,
including the Fund’s prospectus, financial information, fund holdings, and proxy voting information. You can also request this information by
contacting us at (800) 225-1852 or (973) 367-3529 from outside the US.
To receive your fund documents online, go to
pgim.com/investments/resource/edelivery
and enroll.
PGIM Jennison Utility Fund
PGIM Jennison Utility Fund
ANNUAL SHAREHOLDER REPORT – November 30, 2024
This annual shareholder report contains important information about the Class R6 shares of PGIM Jennison Utility Fund (the “Fund”) for the
period of December 1, 2023 to November 30, 2024.
You can find additional information about the Fund at
pgim.com/investments/mutual-funds/prospectuses-fact-sheets
. You can also request
this information by contacting us at (800) 225-1852 or (973) 367-3529 from outside the US.
WHAT WERE THE FUND COSTS FOR THE LAST YEAR?
(Based on a hypothetical $10,000 investment)
| Costs of a $10,000 investment | Costs paid as a percentage of a $10,000 investment |
PGIM Jennison Utility Fund—Class R6 | | |
WHAT AFFECTED THE FUND’S PERFORMANCE DURING THE REPORTING PERIOD?
■
Capital asset prices increased over the reporting period as investors reacted positively to the slowing pace of inflation and sustained economic
growth. The US Federal Reserve moved to lower the federal funds rate by 50 basis points at its September meeting and by another 25 basis
points at its November meeting. (One basis point equals 0.01%.) Equities responded favorably to the moves, particularly interest-rate-sensitive
sectors of the market. Utility stocks (as represented by the S&P 500 Utilities Index (Index)) outperformed the overall equity market (as
represented by the S&P 500 Index).
■
Within utilities, positions in independent power producers and renewables (led by Vistra Corp. and Talen Energy Corp.) and out-of-Index
exposure to water utilities contributed positively to the Fund’s performance relative to the Index. Energy sector names (primarily Targa
Resources Corp.) further bolstered relative results.
■
On the negative side, security selection in electric utilities and multi-utilities, along with exposure to out-of-Index names in communications,
detracted the most.
HOW HAS THE FUND PERFORMED OVER THE PAST 10 YEARS?
The Fund’s past performance is not a good predictor of the Fund’s future performance.
The returns do not reflect the deduction of
taxes that a shareholder would pay on Fund distributions or redemption of Fund shares.
Visit
pgim.com/investments/mutual-funds/prospectuses-fact-sheets
or call (800) 225-1852 or (973) 367-3529 from outside the US for more recent performance data.
The line graph reflects a hypothetical $10,000 investment in Class R6 shares and assumes that all recurring fees (including management fees)
were deducted and dividends and distributions were reinvested. Without waiver of fees and/or expense reimbursements, if any, the returns
would
have been lower.
Cumulative Performance: January 26, 2018 to November 30, 2024 Initial Investment of $10,000 |
Average Annual Total Returns as of 11/30/2024 |
| | | |
| | | |
| | | |
| | | |
Since Inception returns are provided for the share class since it has less than 10 fiscal years of
returns
. Since Inception returns for the Indexes are measured from the closest
month-end to the class’s inception date.
WHAT ARE SOME KEY FUND STATISTICS AS OF 11/30/2024?
| |
| |
Total advisory fees paid for the year | |
Portfolio turnover rate for the year | |
WHAT ARE SOME CHARACTERISTICS OF THE FUND’S
HOLDINGS
AS OF 11/30/2024?
| |
| |
| |
Independent Power Producers & Energy Traders | |
Oil & Gas Storage & Transportation | |
| |
| |
Affiliated Mutual Fund - Short Term Investment (0.7% represents investments purchased with collateral from securities on loan) | |
| |
Liabilities in excess of other assets | |
| |
You can find additional information at
pgim.com/investments/mutual-funds/prospectuses-fact-sheets
or by scanning the QR code below,
including the Fund’s prospectus, financial information, fund holdings, and proxy voting information. You can also request this information by
contacting us at (800) 225-1852 or (973) 367-3529 from outside the US.
To receive your fund documents online, go to
pgim.com/investments/resource/edelivery
and enroll.
PGIM Jennison Utility Fund
| | (b) | Copy of each notice transmitted to stockholders in reliance on Rule 30e-3 under the Act (17 CFR 270.30e-3) that contains disclosures specified by paragraph (c)(3) of that rule – Not applicable. |
Item 2 – Code of Ethics – See Exhibit (a)
As of the end of the period covered by this report, the registrant has adopted a code of ethics (the “Section 406 Standards for Investment Companies – Ethical Standards for Principal Executive and Financial Officers”) that applies to the registrant’s Principal Executive Officer, Principal Financial Officer and Principal Accounting Officer.
The registrant hereby undertakes to provide any person, without charge, upon request, a copy of the code of ethics. To request a copy of the code of ethics, contact the registrant 800-225-1852, and ask for a copy of the Section 406 Standards for Investment Companies - Ethical Standards for Principal Executive and Financial Officers.
Item 3 – Audit Committee Financial Expert –
The registrant’s Board has determined that Ms. Grace C. Torres, member of the Board’s Audit Committee is an “audit committee financial expert,” and that she is “independent,” for purposes of this item.
Item 4 – Principal Accountant Fees and Services –
For the fiscal years ended November 30, 2024 and November 30, 2023, PricewaterhouseCoopers LLP (“PwC”), the Registrant’s principal accountant, billed the Registrant $79,967 and $74,730, respectively, for professional services rendered for the audit of the Registrant’s annual financial statements or services that are normally provided in connection with statutory and regulatory filings.
For the fiscal years ended November 30, 2024 and November 30, 2023: none.
For the fiscal years ended November 30, 2024 and November 30, 2023: none.
For the fiscal years ended November 30, 2024 and November 30, 2023: none.
(e) (1) Audit Committee Pre-Approval Policies and Procedures
THE PGIM MUTUAL FUNDS
AUDIT COMMITTEE POLICY
on
Pre-Approval of Services Provided by the Independent
Accountants
The Audit Committee of each PGIM Mutual Fund is charged with the responsibility to monitor the independence of the Fund’s independent accountants. As part of this responsibility, the Audit Committee must pre-approve the independent accounting firm’s engagement to render audit and/or permissible non-audit services, as required by law. In evaluating a proposed engagement of the independent accountants, the Audit Committee will assess the effect that the engagement might reasonably be expected to have on the accountant’s independence. The Committee’s evaluation will be based on:
| | • | | a review of the nature of the professional services expected to be provided, |
| | • | | a review of the safeguards put into place by the accounting firm to safeguard independence, and |
| | • | | periodic meetings with the accounting firm. |
Policy for Audit and Non-Audit Services Provided to the Funds
On an annual basis, the scope of audits for each Fund, audit fees and expenses, and audit-related and non-audit services (and fees proposed in respect thereof) proposed to be performed by the Fund’s independent accountants will be presented by the Treasurer and the independent accountants to the Audit Committee for review and, as appropriate, approval prior to the initiation of such services.
Such presentation shall be accompanied by confirmation by both the Treasurer and the independent accountants that the proposed non-audit services will not adversely affect the independence of the independent accountants. Such proposed non-audit services shall be described in sufficient detail to enable the Audit Committee to assess the appropriateness of such services and fees, and the compatibility of the provision of such services with the auditor’s independence. The Committee shall receive periodic reports on the progress of the audit and other services which are approved by the Committee or by the Committee Chair pursuant to authority delegated in this Policy.
The categories of services enumerated under “Audit Services”, “Audit-related Services”, and “Tax Services” are intended to provide guidance to the Treasurer and the independent accountants as to those categories of services which the Committee believes are generally consistent with the independence of the independent accountants and which the Committee (or the Committee Chair) would expect upon the presentation of specific proposals to pre-approve. The enumerated categories are not intended as an exclusive list of audit, audit-related or tax services, which the Committee (or the Committee Chair) would consider for pre-approval.
Audit Services
The following categories of audit services are considered to be consistent with the role of the Fund’s independent accountants:
| | • | | Annual Fund financial statement audits |
| | • | | Seed audits (related to new product filings, as required) |
| | • | | SEC and regulatory filings and consents |
Audit-related Services
The following categories of audit-related services are considered to be consistent with the role of the Fund’s independent accountants:
| | • | | Accounting consultations |
| | • | | Fund merger support services |
| | • | | Agreed Upon Procedure Reports |
| | • | | Other Internal Control Reports |
Individual audit-related services that fall within one of these categories (except for fund merger support services) and are not presented to the Audit Committee as part of the annual pre-approval process are subject to an authorized pre-approval by the Audit Committee so long as the estimated fee for those services does not exceed $30,000. Any services provided under such pre-approval will be reported to the Audit Committee at its next regular meeting. Should the amount of such services exceed $30,000 any additional fees will be subject to pre-approval by the Committee Chair (or any other Committee member on whom this responsibility has been delegated). Fees related to fund merger support services are subject to a separate authorized pre-approval by the Audit Committee with fees determined on a per occurrence and merger complexity basis.
Tax Services
The following categories of tax services are considered to be consistent with the role of the Fund’s independent accountants:
| | • | | Tax compliance services related to the filing or amendment of the following: |
| | • | | Federal, state and local income tax compliance; and, |
| | • | | Sales and use tax compliance |
| | • | | Timely RIC qualification reviews |
| | • | | Tax distribution analysis and planning |
| | • | | Tax authority examination services |
| | • | | Tax appeals support services |
| | • | | Accounting methods studies |
| | • | | Fund merger support services |
| | • | | Tax consulting services and related project |
Individual tax services that fall within one of these categories and are not presented to the Audit Committee as part of the annual pre-approval process are subject to an authorized pre-approval by the Audit Committee so long as the estimated fee for those services does not exceed $30,000. Any services provided under such pre-approval will be reported to the Audit Committee at its next regular meeting. Should the amount of such services exceed $30,000 any additional fees will be subject to pre-approval by the Committee Chair (or any other Committee member on whom this responsibility has been delegated).
Other Non-Audit Services
Certain non-audit services that the independent accountants are legally permitted to render will be subject to pre-approval by the Committee or by one or more Committee members to whom the Committee has delegated this authority and who will report to the full Committee any pre-approval decisions made pursuant to this Policy. Non-audit services presented for pre-approval pursuant to this paragraph will be accompanied by a confirmation from both the Treasurer and the independent accountants that the proposed services will not adversely affect the independence of the independent accountants.
Proscribed Services
The Fund’s independent accountants will not render services in the following categories of non-audit services:
| | • | | Bookkeeping or other services related to the accounting records or financial statements of the Fund |
| | • | | Financial information systems design and implementation |
| | • | | Appraisal or valuation services, fairness opinions, or contribution-in-kind reports |
| | • | | Internal audit outsourcing services |
| | • | | Management functions or human resources |
| | • | | Broker or dealer, investment adviser, or investment banking services |
| | • | | Legal services and expert services unrelated to the audit |
| | • | | Any other service that the Public Company Accounting Oversight Board determines, by regulation, is impermissible. |
Pre-approval of Non-Audit Services Provided to Other Entities Within the PGIM Fund Complex
Certain non-audit services provided to PGIM Investments LLC or any of its affiliates that also provide ongoing services to the PGIM Mutual Funds will be subject to pre-approval by the Audit Committee. The only non-audit services provided to these entities that will require pre-approval are those related directly to the operations and financial reporting of the Funds. Individual projects that are not presented to the Audit Committee as part of the annual pre-approval process will be subject to pre-approval by the Committee Chair (or any other Committee member on whom this responsibility has been delegated) so long as the estimated fee for those services does not exceed $30,000. Services presented for pre-approval pursuant to this paragraph will be accompanied by a confirmation from both the Treasurer and the independent accountants that the proposed services will not adversely affect the independence of the independent accountants.
Although the Audit Committee will not pre-approve all services provided to PGIM Investments LLC and its affiliates, the Committee will receive an annual report from the Fund’s independent accounting firm showing the aggregate fees for all services provided to PGIM Investments and its affiliates.
| (e) (2) | Percentage of services described in each of paragraphs (b) through (d) of this Item that were approved by the audit committee pursuant to paragraph (c)(7)(i)(C) of Rule 2-01 of Regulation S-X – |
| | | | |
| | Fiscal Year Ended November 30, 2024 | | Fiscal Year Ended November 30, 2023 |
| 4(b) | | Not applicable. | | Not applicable. |
| 4(c) | | Not applicable. | | Not applicable. |
| 4(d) | | Not applicable. | | Not applicable. |
| (f) | Percentage of hours expended attributable to work performed by other than full time employees of principal accountant if greater than 50%. |
The percentage of hours expended on the principal accountant’s engagement to audit the registrant’s financial statements for the most recent fiscal year that were attributed to work performed by persons other than the principal accountant’s full-time, permanent employees was 0%.
The aggregate non-audit fees billed by the Registrant’s principal accountant for services rendered to the registrant’s investment adviser and any entity controlling, controlled by, or under common control with the investment adviser that provides ongoing services to the registrant for the fiscal years ended November 30, 2024 and November 30, 2023 was $0 and $0, respectively.
| (h) | Principal Accountant’s Independence |
Not applicable as the Registrant’s principal accountant has not provided non-audit services to the registrant’s investment adviser and any entity controlling, controlled by, or under common control with the investment adviser that provides ongoing services to the registrant that were not pre-approved pursuant to Rule 2-01(c)(7)(ii) of Regulation S-X.
Item 5 – Audit Committee of Listed Registrants – Not applicable.
| Item 6 – | Investments – The registrant’s Schedule of Investments is included in the financial statements filed under Item 7 of this Form. |
Items 7 – 11 (Refer to Report below)

PRUDENTIAL SECTOR FUNDS, INC.
PGIM Jennison Financial Services Fund
PGIM Jennison Health Sciences Fund
PGIM Jennison Utility Fund
FINANCIAL STATEMENTS AND OTHER INFORMATION
NOVEMBER 30, 2024

| | | | |
| Table of Contents | | Financial Statements and Other Information | | November 30, 2024 |
Form N-CSR Item 7 - Financial Statements and Financial Highlights for Open-End Management Investment Companies.
Glossary
The following abbreviations are used in the Funds’ descriptions:
144A—Security was purchased pursuant to Rule 144A under the Securities Act of 1933 and, pursuant to the requirements of Rule 144A, may not be resold except to qualified institutional buyers.
ADR—American Depositary Receipt
MLP—Master Limited Partnership
REITs—Real Estate Investment Trust
SOFR—Secured Overnight Financing Rate
1
PGIM Jennison Financial Services Fund
Schedule of Investments
as of November 30, 2024
| | | | | | | | |
| | |
| Description | | Shares | | | Value | |
| | |
LONG-TERM INVESTMENTS 99.4% | | | | | | | | |
| | |
COMMON STOCKS | | | | | | | | |
| | |
Asset Management & Custody Banks 11.5% | | | | | | | | |
| | |
AllianceBernstein Holding, MLP | | | 58,852 | | | $ | 2,134,562 | |
Ares Management Corp. (Class A Stock) | | | 16,207 | | | | 2,864,263 | |
Bridge Investment Group Holdings, Inc. (Class A Stock) | | | 140,377 | | | | 1,388,329 | |
KKR & Co., Inc. | | | 87,545 | | | | 14,258,454 | |
| | | | | | | | |
| | |
| | | | | | | 20,645,608 | |
| | |
Consumer Finance 1.9% | | | | | | | | |
| | |
American Express Co. | | | 11,393 | | | | 3,471,219 | |
| | |
Diversified Banks 20.6% | | | | | | | | |
| | |
Bank of America Corp. | | | 178,797 | | | | 8,494,646 | |
JPMorgan Chase & Co. | | | 69,721 | | | | 17,410,728 | |
NU Holdings Ltd. (Brazil) (Class A Stock)* | | | 267,529 | | | | 3,352,138 | |
PNC Financial Services Group, Inc. (The) | | | 36,512 | | | | 7,839,857 | |
| | | | | | | | |
| | |
| | | | | | | 37,097,369 | |
| | |
Financial Exchanges & Data 3.7% | | | | | | | | |
| | |
Moody’s Corp. | | | 13,161 | | | | 6,580,237 | |
| | |
Homebuilding 0.7% | | | | | | | | |
| | |
PulteGroup, Inc. | | | 9,271 | | | | 1,254,088 | |
| | |
Insurance Brokers 6.7% | | | | | | | | |
| | |
Marsh & McLennan Cos., Inc. | | | 32,187 | | | | 7,506,974 | |
Ryan Specialty Holdings, Inc. | | | 61,291 | | | | 4,621,341 | |
| | | | | | | | |
| | |
| | | | | | | 12,128,315 | |
| | |
Investment Banking & Brokerage 8.6% | | | | | | | | |
| | |
Goldman Sachs Group, Inc. (The) | | | 16,873 | | | | 10,268,402 | |
Houlihan Lokey, Inc. | | | 14,533 | | | | 2,748,045 | |
Marex Group PLC (United Kingdom) | | | 81,751 | | | | 2,393,669 | |
| | | | | | | | |
| | |
| | | | | | | 15,410,116 | |
| | |
Life & Health Insurance 4.8% | | | | | | | | |
| | |
MetLife, Inc. | | | 97,260 | | | | 8,581,250 | |
| | |
Mortgage REITs 1.3% | | | | | | | | |
| | |
Ladder Capital Corp., REIT | | | 199,061 | | | | 2,360,863 | |
See Notes to Financial Statements.
2
PGIM Jennison Financial Services Fund
Schedule of Investments (continued)
as of November 30, 2024
| | | | | | | | |
| | |
| Description | | Shares | | | Value | |
| | |
COMMON STOCKS (Continued) | | | | | | | | |
| | |
Other Diversified Financial Services 3.8% | | | | | | | | |
| | |
Apollo Global Management, Inc. | | | 38,693 | | | $ | 6,772,436 | |
| | |
Property & Casualty Insurance 8.6% | | | | | | | | |
| | |
Chubb Ltd. | | | 28,527 | | | | 8,236,601 | |
Progressive Corp. (The) | | | 27,077 | | | | 7,280,464 | |
| | | | | | | | |
| | |
| | | | | | | 15,517,065 | |
| | |
Regional Banks 11.7% | | | | | | | | |
| | |
East West Bancorp, Inc. | | | 22,896 | | | | 2,511,233 | |
Eastern Bankshares, Inc. | | | 106,041 | | | | 1,976,604 | |
Enterprise Financial Services Corp. | | | 28,572 | | | | 1,731,178 | |
First Bancorp | | | 35,344 | | | | 1,671,771 | |
First Interstate BancSystem, Inc. (Class A Stock) | | | 44,451 | | | | 1,554,452 | |
Pinnacle Financial Partners, Inc. | | | 22,336 | | | | 2,839,129 | |
Truist Financial Corp. | | | 145,884 | | | | 6,955,749 | |
Wintrust Financial Corp. | | | 13,216 | | | | 1,823,940 | |
| | | | | | | | |
| | |
| | | | | | | 21,064,056 | |
| | |
Reinsurance 2.3% | | | | | | | | |
| | |
RenaissanceRe Holdings Ltd. (Bermuda) | | | 14,549 | | | | 4,163,196 | |
| | |
Transaction & Payment Processing Services 13.2% | | | | | | | | |
| | |
Adyen NV (Netherlands), 144A* | | | 1,956 | | | | 2,846,985 | |
Mastercard, Inc. (Class A Stock) | | | 17,917 | | | | 9,548,686 | |
Visa, Inc. (Class A Stock) | | | 36,243 | | | | 11,419,444 | |
| | | | | | | | |
| | |
| | | | | | | 23,815,115 | |
| | | | | | | | |
| | |
TOTAL LONG-TERM INVESTMENTS
(cost $88,974,618) | | | | | | | 178,860,933 | |
| | | | | | | | |
See Notes to Financial Statements.
Prudential Sector Funds 3
PGIM Jennison Financial Services Fund
Schedule of Investments (continued)
as of November 30, 2024
| | | | | | | | |
| | |
| Description | | Shares | | | Value | |
| | |
SHORT-TERM INVESTMENT 0.6% | | | | | | | | |
| | |
AFFILIATED MUTUAL FUND | | | | | | | | |
PGIM Core Government Money Market Fund (7-day effective yield 4.753%)
(cost $1,186,527)(wb) | | | 1,186,527 | | | $ | 1,186,527 | |
| | | | | | | | |
| | |
TOTAL INVESTMENTS 100.0% | | | | | | | | |
(cost $90,161,145) | | | | | | | 180,047,460 | |
Liabilities in excess of other assets (0.0)% | | | | | | | (59,644 | ) |
| | | | | | | | |
| | |
NET ASSETS 100.0% | | | | | | $ | 179,987,816 | |
| | | | | | | | |
See the Glossary for a list of the abbreviation(s) used in the annual report.
| * | Non-income producing security. |
| (wb) | Represents an investment in a Fund affiliated with the Manager. |
Fair Value Measurements:
Various inputs are used in determining the value of the Fund’s investments. These inputs are summarized in the three broad levels listed below.
Level 1—unadjusted quoted prices generally in active markets for identical securities.
Level 2—quoted prices for similar securities, interest rates and yield curves, prepayment speeds, foreign currency exchange rates and other observable inputs.
Level 3—unobservable inputs for securities valued in accordance with Board approved fair valuation procedures.
The following is a summary of the inputs used as of November 30, 2024 in valuing such portfolio securities:
| | | | | | | | | | | | |
| | | Level 1 | | | Level 2 | | | Level 3 | |
| | | |
Investments in Securities | | | | | | | | | | | | |
Assets | | | | | | | | | | | | |
Long-Term Investments | | | | | | | | | | | | |
Common Stocks | | | | | | | | | | | | |
Asset Management & Custody Banks | | $ | 20,645,608 | | | | $— | | | | $— | |
Consumer Finance | | | 3,471,219 | | | | — | | | | — | |
Diversified Banks | | | 37,097,369 | | | | — | | | | — | |
Financial Exchanges & Data | | | 6,580,237 | | | | — | | | | — | |
Homebuilding | | | 1,254,088 | | | | — | | | | — | |
Insurance Brokers | | | 12,128,315 | | | | — | | | | — | |
Investment Banking & Brokerage | | | 15,410,116 | | | | — | | | | — | |
Life & Health Insurance | | | 8,581,250 | | | | — | | | | — | |
Mortgage REITs | | | 2,360,863 | | | | — | | | | — | |
Other Diversified Financial Services | | | 6,772,436 | | | | — | | | | — | |
Property & Casualty Insurance | | | 15,517,065 | | | | — | | | | — | |
See Notes to Financial Statements.
4
PGIM Jennison Financial Services Fund
Schedule of Investments (continued)
as of November 30, 2024
| | | | | | | | | | | | |
| | | Level 1 | | | Level 2 | | | Level 3 | |
| | | |
Investments in Securities (continued) | | | | | | | | | | | | |
Assets (continued) | | | | | | | | | | | | |
Long-Term Investments (continued) | | | | | | | | | | | | |
Common Stocks (continued) | | | | | | | | | | | | |
Regional Banks | | $ | 21,064,056 | | | | $— | | | | $— | |
Reinsurance | | | 4,163,196 | | | | — | | | | — | |
Transaction & Payment Processing Services | | | 23,815,115 | | | | — | | | | — | |
Short-Term Investment | | | | | | | | | | | | |
Affiliated Mutual Fund | | | 1,186,527 | | | | — | | | | — | |
| | | | | | | | | | | | |
| | | |
Total | | $ | 180,047,460 | | | | $— | | | | $— | |
| | | | | | | | | | | | |
The sector classification of investments and liabilities in excess of other assets shown as a percentage of net assets as of November 30, 2024 were as follows:
| | | | |
Diversified Banks | | | 20.6 | % |
Transaction & Payment Processing Services | | | 13.2 | |
Regional Banks | | | 11.7 | |
Asset Management & Custody Banks | | | 11.5 | |
Property & Casualty Insurance | | | 8.6 | |
Investment Banking & Brokerage | | | 8.6 | |
Insurance Brokers | | | 6.7 | |
Life & Health Insurance | | | 4.8 | |
Other Diversified Financial Services | | | 3.8 | |
Financial Exchanges & Data | | | 3.7 | |
Reinsurance | | | 2.3 | |
Consumer Finance | | | 1.9 | |
| | | | |
Mortgage REITs | | | 1.3 | % |
Homebuilding | | | 0.7 | |
Affiliated Mutual Fund | | | 0.6 | |
| | | | |
| |
| | | 100.0 | |
Liabilities in excess of other assets | | | (0.0 | )* |
| | | | |
| |
| | | 100.0 | % |
| | | | |
See Notes to Financial Statements.
Prudential Sector Funds 5
PGIM Jennison Financial Services Fund
Statement of Assets & Liabilities
as of November 30, 2024
| | | | | | | | | | |
Assets | | | | | | | | | | |
| | | |
Investments at value: | | | | | | | | | | |
Unaffiliated investments (cost $88,974,618) | | | | $ | 178,860,933 | | | | | |
Affiliated investments (cost $1,186,527) | | | | | 1,186,527 | | | | | |
Dividends receivable | | | | | 172,881 | | | | | |
Receivable for Fund shares sold | | | | | 69,659 | | | | | |
Tax reclaim receivable | | | | | 450 | | | | | |
Prepaid expenses | | | | | 1,746 | | | | | |
| | | | | | | | | | |
Total Assets | | | | | 180,292,196 | | | | | |
| | | | | | | | | | |
Liabilities | | | | | | | | | | |
| | | |
Management fee payable | | | | | 103,427 | | | | | |
Payable for Fund shares purchased | | | | | 86,673 | | | | | |
Distribution fee payable | | | | | 36,201 | | | | | |
Audit fee payable | | | | | 26,656 | | | | | |
Custodian and accounting fee payable | | | | | 14,042 | | | | | |
Transfer agent fee payable | | | | | 13,897 | | | | | |
Shareholders’ reports fee payable | | | | | 10,624 | | | | | |
Affiliated transfer agent fee payable | | | | | 5,381 | | | | | |
Accrued expenses and other liabilities | | | | | 5,359 | | | | | |
Directors’ fees payable | | | | | 2,120 | | | | | |
| | | | | | | | | | |
Total Liabilities | | | | | 304,380 | | | | | |
| | | | | | | | | | |
| | | |
Net Assets | | | | $ | 179,987,816 | | | | | |
| | | | | | | | | | |
| | | | | | | | | | | |
| | | |
Net assets were comprised of: | | | | | | | | | | |
Common stock, at par | | | | $ | 68,011 | | | | | |
Paid-in capital in excess of par | | | | | 78,623,702 | | | | | |
Total distributable earnings (loss) | | | | | 101,296,103 | | | | | |
| | | | | | | | | | |
| | | |
Net assets, November 30, 2024 | | | | $ | 179,987,816 | | | | | |
| | | | | | | | | | |
See Notes to Financial Statements.
6
PGIM Jennison Financial Services Fund
Statement of Assets & Liabilities (continued)
as of November 30, 2024
| | | | | | | | |
| | |
Class A | | | | | | | | |
| | |
Net asset value and redemption price per share,
($111,128,526 ÷ 4,213,468 shares of common stock issued and outstanding) | | $ | 26.37 | | | | | |
Maximum sales charge (5.50% of offering price) | | | 1.53 | | | | | |
| | | | | | | | |
| | |
Maximum offering price to public | | $ | 27.90 | | | | | |
| | | | | | | | |
| | |
Class C | | | | | | | | |
| | |
Net asset value, offering price and redemption price per share,
($7,777,612 ÷ 349,212 shares of common stock issued and outstanding) | | $ | 22.27 | | | | | |
| | | | | | | | |
| | |
Class R | | | | | | | | |
| | |
Net asset value, offering price and redemption price per share,
($9,263,445 ÷ 353,831 shares of common stock issued and outstanding) | | $ | 26.18 | | | | | |
| | | | | | | | |
| | |
Class Z | | | | | | | | |
| | |
Net asset value, offering price and redemption price per share,
($50,163,878 ÷ 1,824,455 shares of common stock issued and outstanding) | | $ | 27.50 | | | | | |
| | | | | | | | |
| | |
Class R6 | | | | | | | | |
| | |
Net asset value, offering price and redemption price per share,
($1,654,355 ÷ 60,086 shares of common stock issued and outstanding) | | $ | 27.53 | | | | | |
| | | | | | | | |
See Notes to Financial Statements.
Prudential Sector Funds 7
PGIM Jennison Financial Services Fund
Statement of Operations
Year Ended November 30, 2024
| | | | |
| |
Net Investment Income (Loss) | | | | |
| |
Income | | | | |
Unaffiliated dividend income | | $ | 2,548,743 | |
Affiliated dividend income | | | 43,267 | |
Affiliated income from securities lending, net | | | 236 | |
| | | | |
| |
Total income | | | 2,592,246 | |
| | | | |
| |
Expenses | | | | |
Management fee | | | 1,084,306 | |
Distribution fee(a) | | | 409,729 | |
Transfer agent’s fees and expenses (including affiliated expense of $44,025)(a) | | | 172,566 | |
Registration fees(a) | | | 62,669 | |
Professional fees | | | 51,336 | |
Custodian and accounting fees | | | 42,349 | |
Audit fee | | | 26,656 | |
Shareholders’ reports | | | 25,878 | |
Directors’ fees | | | 11,450 | |
Miscellaneous | | | 32,418 | |
| | | | |
| |
Total expenses | | | 1,919,357 | |
| |
Less: Fee waiver and/or expense reimbursement(a) | | | (9,192 | ) |
| |
Distribution fee waiver(a) | | | (19,516 | ) |
| | | | |
| |
Net expenses | | | 1,890,649 | |
| | | | |
| |
Net investment income (loss) | | | 701,597 | |
| | | | |
| |
Realized And Unrealized Gain (Loss) On Investment And Foreign Currency Transactions | | | | |
| |
Net realized gain (loss) on: | | | | |
Investment transactions (including affiliated of $1,246) | | | 11,115,420 | |
Foreign currency transactions | | | (1,877 | ) |
| | | | |
| |
| | | 11,113,543 | |
| | | | |
| |
Net change in unrealized appreciation (depreciation) on: | | | | |
Investments (including affiliated of $(656)) | | | 49,728,815 | |
Foreign currencies | | | (14 | ) |
| | | | |
| |
| | | 49,728,801 | |
| | | | |
| |
Net gain (loss) on investment and foreign currency transactions | | | 60,842,344 | |
| | | | |
| |
Net Increase (Decrease) In Net Assets Resulting From Operations | | $ | 61,543,941 | |
| | | | |
| (a) | Class specific expenses and waivers were as follows: |
| | | | | | | | | | | | | | | | | | | | |
| | | Class A | | Class C | | Class R | | Class Z | | Class R6 | |
Distribution fee | | | 279,360 | | | | 71,821 | | | | 58,548 | | | | — | | | | — | |
Transfer agent’s fees and expenses | | | 109,101 | | | | 10,095 | | | | 11,593 | | | | 40,925 | | | | 852 | |
Registration fees | | | 18,812 | | | | 7,081 | | | | 9,112 | | | | 17,993 | | | | 9,671 | |
Fee waiver and/or expense reimbursement | | | — | | | | — | | | | — | | | | — | | | | (9,192) | |
Distribution fee waiver | | | — | | | | — | | | | (19,516 | ) | | | — | | | | — | |
See Notes to Financial Statements.
8
PGIM Jennison Financial Services Fund
Statements of Changes in Net Assets
| | | | | | | | |
| |
| | | Year Ended
November 30, | |
| | |
| | | 2024 | | | 2023 | |
Increase (Decrease) in Net Assets | | | | | | | | |
| | |
Operations | | | | | | | | |
Net investment income (loss) | | $ | 701,597 | | | $ | 1,217,286 | |
Net realized gain (loss) on investment and foreign currency transactions | | | 11,113,543 | | | | 6,668,320 | |
Net change in unrealized appreciation (depreciation) on investments and foreign currencies | | | 49,728,801 | | | | (2,855,006 | ) |
| | | | | | | | |
Net increase (decrease) in net assets resulting from operations | | | 61,543,941 | | | | 5,030,600 | |
| | | | | | | | |
| | |
Dividends and Distributions | | | | | | | | |
Distributions from distributable earnings | | | | | | | | |
Class A | | | (5,135,296 | ) | | | (2,201,260 | ) |
Class C | | | (438,885 | ) | | | (242,221 | ) |
Class R | | | (426,745 | ) | | | (212,509 | ) |
Class Z | | | (1,782,995 | ) | | | (739,923 | ) |
Class R6 | | | (60,566 | ) | | | (120,487 | ) |
| | | | | | | | |
| | | (7,844,487 | ) | | | (3,516,400 | ) |
| | | | | | | | |
| | |
Fund share transactions (Net of share conversions) | | | | | | | | |
Net proceeds from shares sold | | | 23,686,949 | | | | 10,390,492 | |
Net asset value of shares issued in reinvestment of dividends and distributions | | | 7,654,822 | | | | 3,436,057 | |
Cost of shares purchased | | | (29,408,385 | ) | | | (31,151,294 | ) |
| | | | | | | | |
Net increase (decrease) in net assets from Fund share transactions | | | 1,933,386 | | | | (17,324,745 | ) |
| | | | | | | | |
Total increase (decrease) | | | 55,632,840 | | | | (15,810,545 | ) |
| | |
Net Assets: | | | | | | | | |
| | |
Beginning of year | | | 124,354,976 | | | | 140,165,521 | |
| | | | | | | | |
| | |
End of year | | $ | 179,987,816 | | | $ | 124,354,976 | |
| | | | | | | | |
See Notes to Financial Statements.
Prudential Sector Funds 9
PGIM Jennison Financial Services Fund
Financial Highlights
| | | | | | | | | | | | | | | | | | | | |
| | | | | | |
| Class A Shares | | | | | | | | | | | | | | | |
| | | Year Ended November 30, | |
| | | | | | |
| | | 2024 | | | 2023 | | | 2022 | | | 2021 | | | 2020 | |
| | | | | | |
Per Share Operating Performance(a): | | | | | | | | | | | | | | | | | | | | |
Net Asset Value, Beginning of Year | | | $18.50 | | | | $18.10 | | | | $22.44 | | | | $16.46 | | | | $15.93 | |
Income (loss) from investment operations: | | | | | | | | | | | | | | | | | | | | |
Net investment income (loss) | | | 0.10 | | | | 0.17 | | | | 0.12 | | | | 0.05 | | | | 0.07 | |
Net realized and unrealized gain (loss) on investment and foreign currency transactions | | | 8.93 | | | | 0.68 | | | | (2.39 | ) | | | 6.00 | | | | 0.55 | |
Total from investment operations | | | 9.03 | | | | 0.85 | | | | (2.27 | ) | | | 6.05 | | | | 0.62 | |
Less Dividends and Distributions: | | | | | | | | | | | | | | | | | | | | |
Dividends from net investment income | | | (0.17 | ) | | | (0.01 | ) | | | (0.14 | ) | | | (0.07 | ) | | | (0.09 | ) |
Distributions from net realized gains | | | (0.99 | ) | | | (0.44 | ) | | | (1.93 | ) | | | - | | | | - | |
Total dividends and distributions | | | (1.16 | ) | | | (0.45 | ) | | | (2.07 | ) | | | (0.07 | ) | | | (0.09 | ) |
Net asset value, end of year | | | $26.37 | | | | $18.50 | | | | $18.10 | | | | $22.44 | | | | $16.46 | |
Total Return(b): | | | 51.64 | % | | | 5.05 | % | | | (10.81 | )% | | | 36.90 | % | | | 3.87 | % |
| | | | | | | | | | | | | | | | | | | | |
| | | | | | |
| Ratios/Supplemental Data: | | | | | | | | | | | | | | | |
Net assets, end of year (000) | | | $111,129 | | | | $81,951 | | | | $89,050 | | | | $106,999 | | | | $74,696 | |
Average net assets (000) | | | $93,120 | | | | $79,863 | | | | $92,152 | | | | $99,402 | | | | $69,614 | |
Ratios to average net assets(c): | | | | | | | | | | | | | | | | | | | | |
Expenses after waivers and/or expense reimbursement | | | 1.32 | % | | | 1.38 | % | | | 1.34 | % | | | 1.29 | % | | | 1.39 | % |
Expenses before waivers and/or expense reimbursement | | | 1.32 | % | | | 1.38 | % | | | 1.34 | % | | | 1.29 | % | | | 1.39 | % |
Net investment income (loss) | | | 0.48 | % | | | 1.01 | % | | | 0.65 | % | | | 0.25 | % | | | 0.48 | % |
Portfolio turnover rate(d) | | | 24 | % | | | 20 | % | | | 34 | % | | | 39 | % | | | 38 | % |
| (a) | Calculated based on average shares outstanding during the year. |
| (b) | Total return does not consider the effects of sales loads. Total return is calculated assuming a purchase of a share on the first day and a sale on the last day of each year reported and includes reinvestment of dividends and distributions, if any. Total returns may reflect adjustments to conform to GAAP. |
| (c) | Does not include expenses of the underlying funds in which the Fund invests. |
| (d) | The Fund’s portfolio turnover rate is calculated in accordance with regulatory requirements, without regard to transactions involving short-term investments, certain derivatives and in-kind transactions (if any). If such transactions were included, the Fund’s portfolio turnover rate may be higher. |
See Notes to Financial Statements.
10
PGIM Jennison Financial Services Fund
Financial Highlights (continued)
| | | | | | | | | | | | | | | | | | | | |
| | | | | | |
| Class C Shares | | | | | | | | | | | | | | | |
| | | Year Ended November 30, | |
| | | | | | |
| | | 2024 | | | 2023 | | | 2022 | | | 2021 | | | 2020 | |
| | | | | | |
Per Share Operating Performance(a): | | | | | | | | | | | | | | | | | | | | |
Net Asset Value, Beginning of Year | | | $15.81 | | | | $15.65 | | | | $19.79 | | | | $14.57 | | | | $14.13 | |
Income (loss) from investment operations: | | | | | | | | | | | | | | | | | | | | |
Net investment income (loss) | | | (0.06 | )(b) | | | 0.03 | | | | (0.02 | )(b) | | | (0.09 | )(b) | | | (0.03 | )(b) |
Net realized and unrealized gain (loss) on investment and foreign currency transactions | | | 7.58 | | | | 0.57 | | | | (2.09 | ) | | | 5.31 | | | | 0.47 | |
Total from investment operations | | | 7.52 | | | | 0.60 | | | | (2.11 | ) | | | 5.22 | | | | 0.44 | |
Less Dividends and Distributions: | | | | | | | | | | | | | | | | | | | | |
Dividends from net investment income | | | (0.07 | ) | | | - | | | | (0.10 | ) | | | - | | | | (- | )(c) |
Distributions from net realized gains | | | (0.99 | ) | | | (0.44 | ) | | | (1.93 | ) | | | - | | | | - | |
Total dividends and distributions | | | (1.06 | ) | | | (0.44 | ) | | | (2.03 | ) | | | - | | | | (- | )(c) |
Net asset value, end of year | | | $22.27 | | | | $15.81 | | | | $15.65 | | | | $19.79 | | | | $14.57 | |
Total Return(d): | | | 50.49 | % | | | 4.21 | % | | | (11.53 | )% | | | 35.83 | % | | | 3.14 | % |
| | | | | | | | | | | | | | | | | | | | |
| | | | | | |
| Ratios/Supplemental Data: | | | | | | | | | | | | | | | |
Net assets, end of year (000) | | | $7,778 | | | | $6,810 | | | | $9,061 | | | | $13,028 | | | | $11,366 | |
Average net assets (000) | | | $7,182 | | | | $7,101 | | | | $10,341 | | | | $13,144 | | | | $11,917 | |
Ratios to average net assets(e): | | | | | | | | | | | | | | | | | | | | |
Expenses after waivers and/or expense reimbursement | | | 2.12 | % | | | 2.17 | % | | | 2.14 | % | | | 2.03 | % | | | 2.14 | % |
Expenses before waivers and/or expense reimbursement | | | 2.12 | % | | | 2.17 | % | | | 2.14 | % | | | 2.03 | % | | | 2.14 | % |
Net investment income (loss) | | | (0.31 | )% | | | 0.21 | % | | | (0.14 | )% | | | (0.47 | )% | | | (0.26 | )% |
Portfolio turnover rate(f) | | | 24 | % | | | 20 | % | | | 34 | % | | | 39 | % | | | 38 | % |
| (a) | Calculated based on average shares outstanding during the year. |
| (b) | The per share amount of net investment income (loss) does not directly correlate to the amounts reported in the Statement of Operations due to class specific expenses. |
| (c) | Amount rounds to zero. |
| (d) | Total return does not consider the effects of sales loads. Total return is calculated assuming a purchase of a share on the first day and a sale on the last day of each year reported and includes reinvestment of dividends and distributions, if any. Total returns may reflect adjustments to conform to GAAP. |
| (e) | Does not include expenses of the underlying funds in which the Fund invests. |
| (f) | The Fund’s portfolio turnover rate is calculated in accordance with regulatory requirements, without regard to transactions involving short-term investments, certain derivatives and in-kind transactions (if any). If such transactions were included, the Fund’s portfolio turnover rate may be higher. |
See Notes to Financial Statements.
Prudential Sector Funds 11
PGIM Jennison Financial Services Fund
Financial Highlights (continued)
| | | | | | | | | | | | | | | | | | | | |
| | | | | | |
| Class R Shares | | | | | | | | | | | | | | | |
| | | Year Ended November 30, | |
| | | | | | |
| | | 2024 | | | 2023 | | | 2022 | | | 2021 | | | 2020 | |
| | | | | | |
Per Share Operating Performance(a): | | | | | | | | | | | | | | | | | | | | |
Net Asset Value, Beginning of Year | | | $18.38 | | | | $18.02 | | | | $22.36 | | | | $16.42 | | | | $15.89 | |
Income (loss) from investment operations: | | | | | | | | | | | | | | | | | | | | |
Net investment income (loss) | | | 0.03 | | | | 0.13 | | | | 0.07 | | | | (- | )(b)(c) | | | 0.03 | |
Net realized and unrealized gain (loss) on investment and foreign currency transactions | | | 8.89 | | | | 0.67 | | | | (2.38 | ) | | | 5.98 | | | | 0.54 | |
Total from investment operations | | | 8.92 | | | | 0.80 | | | | (2.31 | ) | | | 5.98 | | | | 0.57 | |
Less Dividends and Distributions: | | | | | | | | | | | | | | | | | | | | |
Dividends from net investment income | | | (0.13 | ) | | | - | | | | (0.10 | ) | | | (0.04 | ) | | | (0.04 | ) |
Distributions from net realized gains | | | (0.99 | ) | | | (0.44 | ) | | | (1.93 | ) | | | - | | | | - | |
Total dividends and distributions | | | (1.12 | ) | | | (0.44 | ) | | | (2.03 | ) | | | (0.04 | ) | | | (0.04 | ) |
Net asset value, end of year | | | $26.18 | | | | $18.38 | | | | $18.02 | | | | $22.36 | | | | $16.42 | |
Total Return(d): | | | 51.24 | % | | | 4.78 | % | | | (11.05 | )% | | | 36.47 | % | | | 3.66 | % |
| | | | | | | | | | | | | | | | | | | | |
| | | | | | |
| Ratios/Supplemental Data: | | | | | | | | | | | | | | | |
Net assets, end of year (000) | | | $9,263 | | | | $7,107 | | | | $8,735 | | | | $11,121 | | | | $9,087 | |
Average net assets (000) | | | $7,806 | | | | $7,486 | | | | $9,105 | | | | $10,866 | | | | $9,490 | |
Ratios to average net assets(e): | | | | | | | | | | | | | | | | | | | | |
Expenses after waivers and/or expense reimbursement | | | 1.65 | % | | | 1.63 | % | | | 1.60 | % | | | 1.56 | % | | | 1.64 | % |
Expenses before waivers and/or expense reimbursement | | | 1.90 | % | | | 1.88 | % | | | 1.85 | % | | | 1.81 | % | | | 1.89 | % |
Net investment income (loss) | | | 0.15 | % | | | 0.76 | % | | | 0.39 | % | | | (0.01 | )% | | | 0.24 | % |
Portfolio turnover rate(f) | | | 24 | % | | | 20 | % | | | 34 | % | | | 39 | % | | | 38 | % |
| (a) | Calculated based on average shares outstanding during the year. |
| (b) | The per share amount of net investment income (loss) does not directly correlate to the amounts reported in the Statement of Operations due to class specific expenses. |
| (c) | Amount rounds to zero. |
| (d) | Total return is calculated assuming a purchase of a share on the first day and a sale on the last day of each year reported and includes reinvestment of dividends and distributions, if any. Total returns may reflect adjustments to conform to GAAP. |
| (e) | Does not include expenses of the underlying funds in which the Fund invests. |
| (f) | The Fund’s portfolio turnover rate is calculated in accordance with regulatory requirements, without regard to transactions involving short-term investments, certain derivatives and in-kind transactions (if any). If such transactions were included, the Fund’s portfolio turnover rate may be higher. |
See Notes to Financial Statements.
12
PGIM Jennison Financial Services Fund
Financial Highlights (continued)
| | | | | | | | | | | | | | | | | | | | |
| | | | | | |
| Class Z Shares | | | | | | | | | | | | | | | |
| | | Year Ended November 30, | |
| | | | | | |
| | | 2024 | | | 2023 | | | 2022 | | | 2021 | | | 2020 | |
| | | | | | |
Per Share Operating Performance(a): | | | | | | | | | | | | | | | | | | | | |
Net Asset Value, Beginning of Year | | | $19.23 | | | | $18.80 | | | | $23.23 | | | | $17.03 | | | | $16.47 | |
Income (loss) from investment operations: | | | | | | | | | | | | | | | | | | | | |
Net investment income (loss) | | | 0.16 | | | | 0.23 | | | | 0.18 | | | | 0.12 | | | | 0.12 | |
Net realized and unrealized gain (loss) on investment and foreign currency transactions | | | 9.32 | | | | 0.70 | | | | (2.48 | ) | | | 6.19 | | | | 0.57 | |
Total from investment operations | | | 9.48 | | | | 0.93 | | | | (2.30 | ) | | | 6.31 | | | | 0.69 | |
Less Dividends and Distributions: | | | | | | | | | | | | | | | | | | | | |
Dividends from net investment income | | | (0.22 | ) | | | (0.06 | ) | | | (0.20 | ) | | | (0.11 | ) | | | (0.13 | ) |
Distributions from net realized gains | | | (0.99 | ) | | | (0.44 | ) | | | (1.93 | ) | | | - | | | | - | |
Total dividends and distributions | | | (1.21 | ) | | | (0.50 | ) | | | (2.13 | ) | | | (0.11 | ) | | | (0.13 | ) |
Net asset value, end of year | | | $27.50 | | | | $19.23 | | | | $18.80 | | | | $23.23 | | | | $17.03 | |
Total Return(b): | | | 52.09 | % | | | 5.35 | % | | | (10.57 | )% | | | 37.25 | % | | | 4.22 | % |
| | | | | | | | | | | | | | | | | | | | |
| | | | | | |
| Ratios/Supplemental Data: | | | | | | | | | | | | | | | |
Net assets, end of year (000) | | | $50,164 | | | | $27,528 | | | | $27,930 | | | | $35,907 | | | | $29,391 | |
Average net assets (000) | | | $35,355 | | | | $24,793 | | | | $30,795 | | | | $36,604 | | | | $34,346 | |
Ratios to average net assets(c): | | | | | | | | | | | | | | | | | | | | |
Expenses after waivers and/or expense reimbursement | | | 1.05 | % | | | 1.09 | % | | | 1.05 | % | | | 1.00 | % | | | 1.09 | % |
Expenses before waivers and/or expense reimbursement | | | 1.05 | % | | | 1.09 | % | | | 1.05 | % | | | 1.00 | % | | | 1.09 | % |
Net investment income (loss) | | | 0.73 | % | | | 1.29 | % | | | 0.95 | % | | | 0.56 | % | | | 0.80 | % |
Portfolio turnover rate(d) | | | 24 | % | | | 20 | % | | | 34 | % | | | 39 | % | | | 38 | % |
| (a) | Calculated based on average shares outstanding during the year. |
| (b) | Total return is calculated assuming a purchase of a share on the first day and a sale on the last day of each year reported and includes reinvestment of dividends and distributions, if any. Total returns may reflect adjustments to conform to GAAP. |
| (c) | Does not include expenses of the underlying funds in which the Fund invests. |
| (d) | The Fund’s portfolio turnover rate is calculated in accordance with regulatory requirements, without regard to transactions involving short-term investments, certain derivatives and in-kind transactions (if any). If such transactions were included, the Fund’s portfolio turnover rate may be higher. |
See Notes to Financial Statements.
Prudential Sector Funds 13
PGIM Jennison Financial Services Fund
Financial Highlights (continued)
| | | | | | | | | | | | | | | | | | | | |
| | | | | | |
| Class R6 Shares | | | | | | | | | | | | | | | |
| | | Year Ended November 30, | |
| | | | | | |
| | | 2024 | | | 2023 | | | 2022 | | | 2021 | | | 2020 | |
| | | | | | |
Per Share Operating Performance(a): | | | | | | | | | | | | | | | | | | | | |
Net Asset Value, Beginning of Year | | | $19.26 | | | | $18.82 | | | | $23.24 | | | | $17.05 | | | | $16.48 | |
Income (loss) from investment operations: | | | | | | | | | | | | | | | | | | | | |
Net investment income (loss) | | | 0.17 | | | | 0.22 | | | | 0.19 | | | | 0.10 | | | | 0.13 | |
Net realized and unrealized gain (loss) on investment and foreign currency transactions | | | 9.32 | | | | 0.73 | | | | (2.48 | ) | | | 6.21 | | | | 0.58 | |
Total from investment operations | | | 9.49 | | | | 0.95 | | | | (2.29 | ) | | | 6.31 | | | | 0.71 | |
Less Dividends and Distributions: | | | | | | | | | | | | | | | | | | | | |
Dividends from net investment income | | | (0.23 | ) | | | (0.07 | ) | | | (0.20 | ) | | | (0.12 | ) | | | (0.14 | ) |
Distributions from net realized gains | | | (0.99 | ) | | | (0.44 | ) | | | (1.93 | ) | | | - | | | | - | |
Total dividends and distributions | | | (1.22 | ) | | | (0.51 | ) | | | (2.13 | ) | | | (0.12 | ) | | | (0.14 | ) |
Net asset value, end of year | | | $27.53 | | | | $19.26 | | | | $18.82 | | | | $23.24 | | | | $17.05 | |
Total Return(b): | | | 52.17 | % | | | 5.46 | % | | | (10.51 | )% | | | 37.25 | % | | | 4.30 | % |
| | | | | | | | | | | | | | | | | | | | |
| | | | | | |
| Ratios/Supplemental Data: | | | | | | | | | | | | | | | |
Net assets, end of year (000) | | | $1,654 | | | | $959 | | | | $5,389 | | | | $8,350 | | | | $12 | |
Average net assets (000) | | | $1,111 | | | | $1,430 | | | | $9,380 | | | | $4,471 | | | | $10 | |
Ratios to average net assets(c): | | | | | | | | | | | | | | | | | | | | |
Expenses after waivers and/or expense reimbursement | | | 1.00 | % | | | 1.01 | %(d) | | | 1.00 | % | | | 1.00 | % | | | 1.00 | % |
Expenses before waivers and/or expense reimbursement | | | 1.83 | % | | | 1.60 | % | | | 1.06 | % | | | 1.15 | % | | | 77.93 | % |
Net investment income (loss) | | | 0.77 | % | | | 1.26 | % | | | 1.03 | % | | | 0.45 | % | | | 0.86 | % |
Portfolio turnover rate(e) | | | 24 | % | | | 20 | % | | | 34 | % | | | 39 | % | | | 38 | % |
| (a) | Calculated based on average shares outstanding during the year. |
| (b) | Total return is calculated assuming a purchase of a share on the first day and a sale on the last day of each year reported and includes reinvestment of dividends and distributions, if any. Total returns may reflect adjustments to conform to GAAP. |
| (c) | Does not include expenses of the underlying funds in which the Fund invests. |
| (d) | Includes interest expense on borrowings from the Syndicated Credit Agreement and certain non-reoccurring expenses of 0.01% which are being excluded from the Fund’s contractual waiver, if applicable, for the year ended November 30, 2023. |
| (e) | The Fund’s portfolio turnover rate is calculated in accordance with regulatory requirements, without regard to transactions involving short-term investments, certain derivatives and in-kind transactions (if any). If such transactions were included, the Fund’s portfolio turnover rate may be higher. |
See Notes to Financial Statements.
14
PGIM Jennison Health Sciences Fund
Schedule of Investments
as of November 30, 2024
| | | | | | | | |
| | |
| Description | | Shares | | | Value | |
| | |
LONG-TERM INVESTMENTS 98.1% | | | | | | | | |
| | |
COMMON STOCKS | | | | | | | | |
| | |
Biotechnology 38.2% | | | | | | | | |
| | |
Alnylam Pharmaceuticals, Inc.* | | | 62,659 | | | $ | 15,857,113 | |
Amgen, Inc. | | | 244,947 | | | | 69,288,158 | |
AnaptysBio, Inc.*(a) | | | 109,714 | | | | 2,738,462 | |
Apellis Pharmaceuticals, Inc.* | | | 1,029,036 | | | | 34,915,192 | |
Apogee Therapeutics, Inc.*(a) | | | 112,496 | | | | 5,079,194 | |
Arcutis Biotherapeutics, Inc.*(a) | | | 2,735,010 | | | | 35,664,530 | |
Argenx SE (Netherlands), ADR* | | | 128,436 | | | | 79,187,216 | |
Blueprint Medicines Corp.* | | | 147,990 | | | | 14,263,276 | |
Cabaletta Bio, Inc.*(a) | | | 1,378,804 | | | | 5,267,031 | |
Crinetics Pharmaceuticals, Inc.* | | | 908,386 | | | | 51,959,679 | |
Dyne Therapeutics, Inc.* | | | 614,985 | | | | 18,824,691 | |
Gilead Sciences, Inc. | | | 528,309 | | | | 48,910,847 | |
Ideaya Biosciences, Inc.* | | | 472,844 | | | | 12,937,012 | |
Insmed, Inc.* | | | 401,806 | | | | 30,199,739 | |
Krystal Biotech, Inc.* | | | 74,411 | | | | 14,690,220 | |
Kymera Therapeutics, Inc.* | | | 362,033 | | | | 16,961,246 | |
Mineralys Therapeutics, Inc.* | | | 526,315 | | | | 6,721,043 | |
Neurocrine Biosciences, Inc.* | | | 310,068 | | | | 39,301,119 | |
Newamsterdam Pharma Co. NV (Netherlands)*(a) | | | 489,125 | | | | 9,709,131 | |
Tourmaline Bio, Inc.*(a) | | | 347,498 | | | | 9,048,848 | |
Travere Therapeutics, Inc.* | | | 393,263 | | | | 7,397,277 | |
Vaxcyte, Inc.* | | | 388,884 | | | | 36,687,317 | |
Vera Therapeutics, Inc.* | | | 408,636 | | | | 20,329,641 | |
Vertex Pharmaceuticals, Inc.* | | | 150,218 | | | | 70,321,552 | |
Xenon Pharmaceuticals, Inc. (Canada)* | | | 407,083 | | | | 17,353,948 | |
| | | | | | | | |
| | |
| | | | | | | 673,613,482 | |
| | |
Health Care Services 4.2% | | | | | | | | |
| | |
Cigna Group (The) | | | 114,765 | | | | 38,767,617 | |
CVS Health Corp. | | | 603,618 | | | | 36,126,537 | |
| | | | | | | | |
| | |
| | | | | | | 74,894,154 | |
| | |
Health Care Equipment 12.8% | | | | | | | | |
| | |
Boston Scientific Corp.* | | | 812,823 | | | | 73,690,533 | |
Dexcom, Inc.* | | | 249,034 | | | | 19,422,162 | |
Edwards Lifesciences Corp.* | | | 487,173 | | | | 34,759,794 | |
Inari Medical, Inc.* | | | 505,622 | | | | 26,251,894 | |
See Notes to Financial Statements.
Prudential Sector Funds 15
PGIM Jennison Health Sciences Fund
Schedule of Investments (continued)
as of November 30, 2024
| | | | | | | | |
| | |
| Description | | Shares | | | Value | |
| | |
COMMON STOCKS (Continued) | | | | | | | | |
| | |
Health Care Equipment (cont’d.) | | | | | | | | |
| | |
Intuitive Surgical, Inc.* | | | 106,375 | | | $ | 57,655,250 | |
Tandem Diabetes Care, Inc.* | | | 426,135 | | | | 13,052,515 | |
| | | | | | | | |
| | |
| | | | | | | 224,832,148 | |
| | |
Health Care Supplies 1.6% | | | | | | | | |
| | |
Align Technology, Inc.* | | | 37,591 | | | | 8,750,057 | |
Cooper Cos., Inc. (The)* | | | 180,072 | | | | 18,810,321 | |
| | | | | | | | |
| | |
| | | | | | | 27,560,378 | |
| | |
Life Sciences Tools & Services 4.5% | | | | | | | | |
| | |
Agilent Technologies, Inc. | | | 133,842 | | | | 18,466,181 | |
Lonza Group AG (Switzerland) | | | 21,980 | | | | 13,179,286 | |
Maravai LifeSciences Holdings, Inc. (Class A Stock)* | | | 1,698,100 | | | | 9,628,227 | |
QIAGEN NV* | | | 691,388 | | | | 30,026,981 | |
Stevanato Group SpA (Italy)(a) | | | 398,185 | | | | 7,975,645 | |
| | | | | | | | |
| | |
| | | | | | | 79,276,320 | |
| | |
Managed Health Care 5.6% | | | | | | | | |
| | |
UnitedHealth Group, Inc. | | | 162,333 | | | | 99,055,597 | |
| | |
Pharmaceuticals 31.2% | | | | | | | | |
| | |
AstraZeneca PLC (United Kingdom), ADR | | | 854,038 | | | | 57,750,050 | |
Bristol-Myers Squibb Co. | | | 1,356,947 | | | | 80,358,401 | |
Eli Lilly & Co. | | | 275,727 | | | | 219,299,469 | |
Longboard Pharmaceuticals, Inc.*(a) | | | 290,166 | | | | 17,404,157 | |
Novo Nordisk A/S (Denmark), ADR | | | 655,469 | | | | 70,004,089 | |
Phathom Pharmaceuticals, Inc.*(a) | | | 1,781,345 | | | | 15,800,530 | |
Tarsus Pharmaceuticals, Inc.* | | | 382,765 | | | | 20,076,024 | |
UCB SA (Belgium) | | | 182,608 | | | | 35,809,807 | |
Verona Pharma PLC (United Kingdom), ADR*(a) | | | 842,079 | | | | 33,371,591 | |
| | | | | | | | |
| | |
| | | | | | | 549,874,118 | |
| | | | | | | | |
| | |
TOTAL LONG-TERM INVESTMENTS
(cost $1,067,214,659) | | | | | | | 1,729,106,197 | |
| | | | | | | | |
See Notes to Financial Statements.
16
PGIM Jennison Health Sciences Fund
Schedule of Investments (continued)
as of November 30, 2024
| | | | | | | | |
| | |
| Description | | Shares | | | Value | |
| | |
SHORT-TERM INVESTMENTS 4.4% | | | | | | | | |
| | |
AFFILIATED MUTUAL FUNDS | | | | | | | | |
| | |
PGIM Core Government Money Market Fund (7-day effective yield 4.753%)(wb) | | | 40,306,576 | | | $ | 40,306,576 | |
PGIM Institutional Money Market Fund (7-day effective yield 4.848%)
(cost $37,566,880; includes $37,409,320 of cash collateral for securities on loan)(b)(wb) | | | 37,587,792 | | | | 37,565,240 | |
| | | | | | | | |
| | |
TOTAL SHORT-TERM INVESTMENTS
(cost $77,873,456) | | | | | | | 77,871,816 | |
| | | | | | | | |
| | |
TOTAL INVESTMENTS 102.5%
(cost $1,145,088,115) | | | | | | | 1,806,978,013 | |
Liabilities in excess of other assets (2.5)% | | | | | | | (43,521,837 | ) |
| | | | | | | | |
| | |
NET ASSETS 100.0% | | | | | | $ | 1,763,456,176 | |
| | | | | | | | |
See the Glossary for a list of the abbreviation(s) used in the annual report.
| * | Non-income producing security. |
| (a) | All or a portion of security is on loan. The aggregate market value of such securities, including those sold and pending settlement, is $36,786,255; cash collateral of $37,409,320 (included in liabilities) was received with which the Fund purchased highly liquid short-term investments. In the event of significant appreciation in value of securities on loan on the last business day of the reporting period, the Fund may reflect a collateral value that is less than the market value of the loaned securities and such shortfall is remedied the following business day. |
| (b) | Represents security, or portion thereof, purchased with cash collateral received for securities on loan and includes dividend reinvestment. |
| (wb) | Represents an investment in a Fund affiliated with the Manager. |
Fair Value Measurements:
Various inputs are used in determining the value of the Fund’s investments. These inputs are summarized in the three broad levels listed below.
Level 1—unadjusted quoted prices generally in active markets for identical securities.
Level 2—quoted prices for similar securities, interest rates and yield curves, prepayment speeds, foreign currency exchange rates and other observable inputs.
Level 3—unobservable inputs for securities valued in accordance with Board approved fair valuation procedures.
See Notes to Financial Statements.
Prudential Sector Funds 17
PGIM Jennison Health Sciences Fund
Schedule of Investments (continued)
as of November 30, 2024
The following is a summary of the inputs used as of November 30, 2024 in valuing such portfolio securities:
| | | | | | | | | | | | | | | | | | | | |
| | | Level 1 | | | Level 2 | | | Level 3 | |
Investments in Securities | | | | | | | | | | | | | | | | | | | | |
Assets | | | | | | | | | | | | | | | | | | | | |
Long-Term Investments | | | | | | | | | | | | | | | | | | | | |
Common Stocks | | | | | | | | | | | | | | | | | | | | |
Biotechnology | | $ | 673,613,482 | | | $ | — | | | | | | | $ | — | | | | | |
Health Care Services | | | 74,894,154 | | | | — | | | | | | | | — | | | | | |
Health Care Equipment | | | 224,832,148 | | | | — | | | | | | | | — | | | | | |
Health Care Supplies | | | 27,560,378 | | | | — | | | | | | | | — | | | | | |
Life Sciences Tools & Services | | | 66,097,034 | | | | 13,179,286 | | | | | | | | — | | | | | |
Managed Health Care | | | 99,055,597 | | | | — | | | | | | | | — | | | | | |
Pharmaceuticals | | | 514,064,311 | | | | 35,809,807 | | | | | | | | — | | | | | |
Short-Term Investments | | | | | | | | | | | | | | | | | | | | |
Affiliated Mutual Funds | | | 77,871,816 | | | | — | | | | | | | | — | | | | | |
| | | | | | | | | | | | | | | | | | | | |
| | | | | |
Total | | $ | 1,757,988,920 | | | $ | 48,989,093 | | | | | | | $ | — | | | | | |
| | | | | | | | | | | | |
Sector Classification:
The sector classification of investments and liabilities in excess of other assets shown as a percentage of net assets as of November 30, 2024 were as follows:
| | | | |
Biotechnology | | | 38.2 | % |
Pharmaceuticals | | | 31.2 | |
Health Care Equipment | | | 12.8 | |
Managed Health Care | | | 5.6 | |
Life Sciences Tools & Services | | | 4.5 | |
Affiliated Mutual Funds (2.1% represents investments purchased with collateral from securities on loan) | | | 4.4 | |
| | | | |
Health Care Services | | | 4.2 | % |
Health Care Supplies | | | 1.6 | |
| | | | |
| | | 102.5 | |
Liabilities in excess of other assets | | | (2.5 | ) |
| | | | |
| |
| | | 100.0 | % |
| | | | |
Financial Instruments/Transactions—Summary of Offsetting and Netting Arrangements:
The Fund entered into financial instruments/transactions during the reporting period that are either offset in accordance with current requirements or are subject to enforceable master netting arrangements or similar agreements that permit offsetting. The information about offsetting and related netting arrangements for financial instruments/transactions where the legal right to set-off exists is presented in the summary below.
See Notes to Financial Statements.
18
PGIM Jennison Health Sciences Fund
Schedule of Investments (continued)
as of November 30, 2024
Offsetting of financial instrument/transaction assets and liabilities:
| | | | | | | | |
| Description | | Gross Market Value of Recognized Assets/(Liabilities) | | | | Collateral Pledged/(Received)(1) | | Net Amount |
Securities on Loan | | $36,786,255 | | | | $(36,786,255) | | $— |
| (1) | Collateral amount disclosed by the Fund is limited to the market value of financial instruments/transactions. |
See Notes to Financial Statements.
Prudential Sector Funds 19
PGIM Jennison Health Sciences Fund
Statement of Assets & Liabilities
as of November 30, 2024
| | | | |
Assets | | | | |
| |
Investments at value, including securities on loan of $36,786,255: | | | | |
Unaffiliated investments (cost $1,067,214,659) | | $ | 1,729,106,197 | |
Affiliated investments (cost $77,873,456) | | | 77,871,816 | |
Receivable for Fund shares sold | | | 2,117,792 | |
Tax reclaim receivable | | | 1,155,423 | |
Dividends receivable | | | 903,672 | |
Prepaid expenses | | | 13,944 | |
| | | | |
| |
Total Assets | | | 1,811,168,844 | |
| | | | |
| |
Liabilities | | | | |
| |
Payable to broker for collateral for securities on loan | | | 37,409,320 | |
Payable for investments purchased | | | 6,364,498 | |
Payable for Fund shares purchased | | | 2,191,977 | |
Management fee payable | | | 1,046,171 | |
Accrued expenses and other liabilities | | | 481,188 | |
Distribution fee payable | | | 189,896 | |
Affiliated transfer agent fee payable | | | 21,491 | |
Directors’ fees payable | | | 8,127 | |
| | | | |
| |
Total Liabilities | | | 47,712,668 | |
| | | | |
| |
Net Assets | | $ | 1,763,456,176 | |
| | | | |
| |
| | | | |
| |
Net assets were comprised of: | | | | |
Common stock, at par | | $ | 381,291 | |
Paid-in capital in excess of par | | | 920,872,842 | |
Total distributable earnings (loss) | | | 842,202,043 | |
| | | | |
| |
Net assets, November 30, 2024 | | $ | 1,763,456,176 | |
| | | | |
See Notes to Financial Statements.
20
PGIM Jennison Health Sciences Fund
Statement of Assets & Liabilities (continued)
as of November 30, 2024
| | | | | | | | |
Class A | | | | | | | | |
| | |
Net asset value and redemption price per share, ($719,096,447 ÷ 17,302,872 shares of common stock issued and outstanding) | | $ | 41.56 | | | | | |
Maximum sales charge (5.50% of offering price) | | | 2.42 | | | | | |
| | | | | | | | |
Maximum offering price to public | | $ | 43.98 | | | | | |
| | | | | | | | |
| | |
Class C | | | | | | | | |
| | |
Net asset value, offering price and redemption price per share, ($18,106,054 ÷ 963,131 shares of common stock issued and outstanding) | | $ | 18.80 | | | | | |
| | | | | | | | |
| | |
Class R | | | | | | | | |
| | |
Net asset value, offering price and redemption price per share, ($6,806,820 ÷ 176,051 shares of common stock issued and outstanding) | | $ | 38.66 | | | | | |
| | | | | | | | |
| | |
Class Z | | | | | | | | |
| | |
Net asset value, offering price and redemption price per share, ($982,912,792 ÷ 18,988,127 shares of common stock issued and outstanding) | | $ | 51.76 | | | | | |
| | | | | | | | |
| | |
Class R6 | | | | | | | | |
| | |
Net asset value, offering price and redemption price per share, ($36,534,063 ÷ 698,940 shares of common stock issued and outstanding) | | $ | 52.27 | | | | | |
| | | | | | | | |
See Notes to Financial Statements.
Prudential Sector Funds 21
PGIM Jennison Health Sciences Fund
Statement of Operations
Year Ended November 30, 2024
| | | | |
| |
Net Investment Income (Loss) | | | | |
| |
Income | | | | |
Unaffiliated dividend income (net of $133,226 foreign withholding tax) | | $ | 14,710,918 | |
Affiliated dividend income | | | 2,786,201 | |
Income from securities lending, net (including affiliated income of $494,777) | | | 601,819 | |
| | | | |
| |
Total income | | | 18,098,938 | |
| | | | |
| |
Expenses | | | | |
Management fee | | | 12,933,949 | |
Distribution fee(a) | | | 2,448,518 | |
Transfer agent’s fees and expenses (including affiliated expense of $172,331)(a) | | | 1,630,663 | |
Custodian and accounting fees | | | 120,972 | |
Registration fees(a) | | | 96,085 | |
Shareholders’ reports | | | 79,403 | |
Professional fees | | | 49,896 | |
Directors’ fees | | | 32,644 | |
Audit fee | | | 26,656 | |
Miscellaneous | | | 40,505 | |
| | | | |
| |
Total expenses | | | 17,459,291 | |
| |
Less: Distribution fee waiver(a) | | | (18,271 | ) |
| | | | |
| |
Net expenses | | | 17,441,020 | |
| | | | |
| |
Net investment income (loss) | | | 657,918 | |
| | | | |
| |
Realized And Unrealized Gain (Loss) On Investment And Foreign Currency Transactions | | | | |
| |
Net realized gain (loss) on: | | | | |
Investment transactions (including affiliated of $19,043) | | | 191,786,368 | |
Foreign currency transactions | | | (70,819 | ) |
| | | | |
| |
| | | 191,715,549 | |
| | | | |
| |
Net change in unrealized appreciation (depreciation) on: | | | | |
Investments (including affiliated of $(27,883)) | | | 162,472,532 | |
Foreign currencies | | | (1,659 | ) |
| | | | |
| |
| | | 162,470,873 | |
| | | | |
| |
Net gain (loss) on investment and foreign currency transactions | | | 354,186,422 | |
| | | | |
| |
Net Increase (Decrease) In Net Assets Resulting From Operations | | $ | 354,844,340 | |
| | | | |
| (a) | Class specific expenses and waivers were as follows: |
| | | | | | | | | | | | | | | | | | | | | | | | | |
| | | Class A | | Class C | | Class R | | Class Z | | Class R6 |
Distribution fee | | | | 2,216,635 | | | | | 177,070 | | | | | 54,813 | | | | | — | | | | | — | |
Transfer agent’s fees and expenses | | | | 583,853 | | | | | 22,244 | | | | | 10,169 | | | | | 1,010,504 | | | | | 3,893 | |
Registration fees | | | | 26,383 | | | | | 14,938 | | | | | 6,984 | | | | | 32,142 | | | | | 15,638 | |
Distribution fee waiver | | | | — | | | | | — | | | | | (18,271 | ) | | | | — | | | | | — | |
See Notes to Financial Statements.
22
PGIM Jennison Health Sciences Fund
Statements of Changes in Net Assets
| | | | | | | | |
| |
| | | Year Ended
November 30, | |
| | |
| | | 2024 | | | 2023 | |
Increase (Decrease) in Net Assets | | | | | | | | |
| | |
Operations | | | | | | | | |
Net investment income (loss) | | $ | 657,918 | | | $ | (686,525 | ) |
Net realized gain (loss) on investment and foreign currency transactions | | | 191,715,549 | | | | 106,491,312 | |
Net change in unrealized appreciation (depreciation) on investments and foreign currencies | | | 162,470,873 | | | | (19,674,594 | ) |
| | | | | | | | |
Net increase (decrease) in net assets resulting from operations | | | 354,844,340 | | | | 86,130,193 | |
| | | | | | | | |
| | |
Dividends and Distributions | | | | | | | | |
Distributions from distributable earnings | | | | | | | | |
Class A | | | (35,574,316 | ) | | | (12,695,948 | ) |
Class C | | | (1,647,071 | ) | | | (611,825 | ) |
Class R | | | (375,455 | ) | | | (135,986 | ) |
Class Z | | | (33,631,815 | ) | | | (12,151,965 | ) |
Class R6 | | | (3,589,159 | ) | | | (1,214,011 | ) |
| | | | | | | | |
| | | (74,817,816 | ) | | | (26,809,735 | ) |
| | | | | | | | |
| | |
Fund share transactions (Net of share conversions) | | | | | | | | |
Net proceeds from shares sold | | | 256,493,142 | | | | 149,629,292 | |
Net asset value of shares issued in reinvestment of dividends and distributions | | | 68,865,313 | | | | 24,702,551 | |
Cost of shares purchased | | | (396,902,081 | ) | | | (351,025,796 | ) |
| | | | | | | | |
Net increase (decrease) in net assets from Fund share transactions | | | (71,543,626 | ) | | | (176,693,953 | ) |
| | | | | | | | |
Total increase (decrease) | | | 208,482,898 | | | | (117,373,495 | ) |
| | |
Net Assets: | | | | | | | | |
| | |
Beginning of year | | | 1,554,973,278 | | | | 1,672,346,773 | |
| | | | | | | | |
| | |
End of year | | $ | 1,763,456,176 | | | $ | 1,554,973,278 | |
| | | | | | | | |
See Notes to Financial Statements.
Prudential Sector Funds 23
PGIM Jennison Health Sciences Fund
Financial Highlights
| | | | | | | | | | | | | | | | | | | | | | | | | |
| | | | | | |
| Class A Shares | | | | | | | | | | |
| | |
| | | Year Ended November 30, |
| | | | | | |
| | | 2024 | | 2023 | | 2022 | | 2021 | | 2020 |
| | | | | | |
| Per Share Operating Performance(a): | | | | | | | | | | | | | | | | | | | | | | | | | |
| Net Asset Value, Beginning of Year | | | | $35.60 | | | | | $34.41 | | | | | $50.57 | | | | | $56.98 | | | | | $44.29 | |
| Income (loss) from investment operations: | | | | | | | | | | | | | | | | | | | | | | | | | |
| Net investment income (loss) | | | | (0.04 | )(b) | | | | (0.07 | ) | | | | (0.11 | ) | | | | (0.36 | ) | | | | (0.27 | ) |
| Net realized and unrealized gain (loss) on investment and foreign currency transactions | | | | 7.91 | | | | | 1.88 | | | | | (2.02 | ) | | | | 5.65 | | | | | 14.39 | |
| Total from investment operations | | | | 7.87 | | | | | 1.81 | | | | | (2.13 | ) | | | | 5.29 | | | | | 14.12 | |
| Less Dividends and Distributions: | | | | | | | | | | | | | | | | | | | | | | | | | |
| Distributions from net realized gains | | | | (1.91 | ) | | | | (0.62 | ) | | | | (14.03 | ) | | | | (11.70 | ) | | | | (1.43 | ) |
| Net asset value, end of year | | | | $41.56 | | | | | $35.60 | | | | | $34.41 | | | | | $50.57 | | | | | $56.98 | |
| Total Return(c): | | | | 23.24 | % | | | | 5.34 | % | | | | (6.62 | )% | | | | 9.66 | % | | | | 32.85 | % |
| | | | | | | | | | | | | | | | | | | | | | | | | | |
| | | | | | |
| Ratios/Supplemental Data: | | | | | | | | | | |
| Net assets, end of year (000) | | | | $719,096 | | | | | $671,190 | | | | | $715,299 | | | | | $928,654 | | | | | $905,865 | |
| Average net assets (000) | | | | $738,878 | | | | | $695,563 | | | | | $757,365 | | | | | $983,670 | | | | | $777,602 | |
| Ratios to average net assets(d): | | | | | | | | | | | | | | | | | | | | | | | | | |
| Expenses after waivers and/or expense reimbursement | | | | 1.13 | % | | | | 1.15 | % | | | | 1.14 | % | | | | 1.12 | % | | | | 1.14 | % |
| Expenses before waivers and/or expense reimbursement | | | | 1.13 | % | | | | 1.15 | % | | | | 1.14 | % | | | | 1.12 | % | | | | 1.14 | % |
| Net investment income (loss) | | | | (0.11 | )% | | | | (0.20 | )% | | | | (0.32 | )% | | | | (0.68 | )% | | | | (0.58 | )% |
| Portfolio turnover rate(e) | | | | 79 | % | | | | 64 | % | | | | 83 | % | | | | 77 | % | | | | 45 | % |
| (a) | Calculated based on average shares outstanding during the year. |
| (b) | The per share amount of net investment income (loss) does not directly correlate to the amounts reported in the Statement of Operations due to class specific expenses. |
| (c) | Total return does not consider the effects of sales loads. Total return is calculated assuming a purchase of a share on the first day and a sale on the last day of each year reported and includes reinvestment of dividends and distributions, if any. Total returns may reflect adjustments to conform to GAAP. |
| (d) | Does not include expenses of the underlying funds in which the Fund invests. |
| (e) | The Fund’s portfolio turnover rate is calculated in accordance with regulatory requirements, without regard to transactions involving short-term investments, certain derivatives and in-kind transactions (if any). If such transactions were included, the Fund’s portfolio turnover rate may be higher. |
See Notes to Financial Statements.
24
PGIM Jennison Health Sciences Fund
Financial Highlights (continued)
| | | | | | | | | | | | | | | | | | | | | | | | | |
| | | | | | |
| Class C Shares | | | | | | | | | | |
| | |
| | | Year Ended November 30, |
| | | | | | |
| | | 2024 | | 2023 | | 2022 | | 2021 | | 2020 |
| | | | | | |
| Per Share Operating Performance(a): | | | | | | | | | | | | | | | | | | | | | | | | | |
| Net Asset Value, Beginning of Year | | | | $17.26 | | | | | $17.14 | | | | | $32.23 | | | | | $40.50 | | | | | $32.10 | |
| Income (loss) from investment operations: | | | | | | | | | | | | | | | | | | | | | | | | | |
| Net investment income (loss) | | | | (0.17 | )(b) | | | | (0.17 | ) | | | | (0.20 | ) | | | | (0.50 | ) | | | | (0.42 | ) |
| Net realized and unrealized gain (loss) on investment and foreign currency transactions | | | | 3.62 | | | | | 0.91 | | | | | (0.86 | ) | | | | 3.93 | | | | | 10.25 | |
| Total from investment operations | | | | 3.45 | | | | | 0.74 | | | | | (1.06 | ) | | | | 3.43 | | | | | 9.83 | |
| Less Dividends and Distributions: | | | | | | | | | | | | | | | | | | | | | | | | | |
| Distributions from net realized gains | | | | (1.91 | ) | | | | (0.62 | ) | | | | (14.03 | ) | | | | (11.70 | ) | | | | (1.43 | ) |
| Net asset value, end of year | | | | $18.80 | | | | | $17.26 | | | | | $17.14 | | | | | $32.23 | | | | | $40.50 | |
| Total Return(c): | | | | 22.23 | % | | | | 4.44 | % | | | | (7.37 | )% | | | | 8.78 | % | | | | 31.93 | % |
| | | | | | | | | | | | | | | | | | | | | | | | | | |
| | | | | | |
| Ratios/Supplemental Data: | | | | | | | | | | |
| Net assets, end of year (000) | | | | $18,106 | | | | | $15,309 | | | | | $17,239 | | | | | $22,824 | | | | | $42,813 | |
| Average net assets (000) | | | | $17,707 | | | | | $16,133 | | | | | $18,679 | | | | | $28,249 | | | | | $45,302 | |
| Ratios to average net assets(d): | | | | | | | | | | | | | | | | | | | | | | | | | |
| Expenses after waivers and/or expense reimbursement | | | | 1.96 | % | | | | 1.98 | % | | | | 1.97 | % | | | | 1.90 | % | | | | 1.85 | % |
| Expenses before waivers and/or expense reimbursement | | | | 1.96 | % | | | | 1.98 | % | | | | 1.97 | % | | | | 1.90 | % | | | | 1.85 | % |
| Net investment income (loss) | | | | (0.94 | )% | | | | (1.03 | )% | | | | (1.14 | )% | | | | (1.47 | )% | | | | (1.27 | )% |
| Portfolio turnover rate(e) | | | | 79 | % | | | | 64 | % | | | | 83 | % | | | | 77 | % | | | | 45 | % |
| (a) | Calculated based on average shares outstanding during the year. |
| (b) | The per share amount of net investment income (loss) does not directly correlate to the amounts reported in the Statement of Operations due to class specific expenses. |
| (c) | Total return does not consider the effects of sales loads. Total return is calculated assuming a purchase of a share on the first day and a sale on the last day of each year reported and includes reinvestment of dividends and distributions, if any. Total returns may reflect adjustments to conform to GAAP. |
| (d) | Does not include expenses of the underlying funds in which the Fund invests. |
| (e) | The Fund’s portfolio turnover rate is calculated in accordance with regulatory requirements, without regard to transactions involving short-term investments, certain derivatives and in-kind transactions (if any). If such transactions were included, the Fund’s portfolio turnover rate may be higher. |
See Notes to Financial Statements.
Prudential Sector Funds 25
PGIM Jennison Health Sciences Fund
Financial Highlights (continued)
| | | | | | | | | | | | | | | | | | | | | | | | | |
| | | | | | |
| Class R Shares | | | | | | | | | | |
| | |
| | | Year Ended November 30, |
| | | | | | |
| | | 2024 | | 2023 | | 2022 | | 2021 | | 2020 |
| | | | | | |
| Per Share Operating Performance(a): | | | | | | | | | | | | | | | | | | | | | | | | | |
| Net Asset Value, Beginning of Year | | | | $33.36 | | | | | $32.39 | | | | | $48.53 | | | | | $55.28 | | | | | $43.16 | |
| Income (loss) from investment operations: | | | | | | | | | | | | | | | | | | | | | | | | | |
| Net investment income (loss) | | | | (0.17 | )(b) | | | | (0.17 | ) | | | | (0.22 | ) | | | | (0.50 | ) | | | | (0.43 | ) |
| Net realized and unrealized gain (loss) on investment and foreign currency transactions | | | | 7.38 | | | | | 1.76 | | | | | (1.89 | ) | | | | 5.45 | | | | | 13.98 | |
| Total from investment operations | | | | 7.21 | | | | | 1.59 | | | | | (2.11 | ) | | | | 4.95 | | | | | 13.55 | |
| Less Dividends and Distributions: | | | | | | | | | | | | | | | | | | | | | | | | | |
| Distributions from net realized gains | | | | (1.91 | ) | | | | (0.62 | ) | | | | (14.03 | ) | | | | (11.70 | ) | | | | (1.43 | ) |
| Net asset value, end of year | | | | $38.66 | | | | | $33.36 | | | | | $32.39 | | | | | $48.53 | | | | | $55.28 | |
| Total Return(c): | | | | 22.76 | % | | | | 5.02 | % | | | | (6.96 | )% | | | | 9.30 | % | | | | 32.38 | % |
| | | | | | | | | | | | | | | | | | | | | | | | | | |
| | | | | | |
| Ratios/Supplemental Data: | | | | | | | | | | |
| Net assets, end of year (000) | | | | $6,807 | | | | | $6,687 | | | | | $7,173 | | | | | $9,659 | | | | | $10,288 | |
| Average net assets (000) | | | | $7,308 | | | | | $7,016 | | | | | $7,689 | | | | | $10,707 | | | | | $8,952 | |
| Ratios to average net assets(d): | | | | | | | | | | | | | | | | | | | | | | | | | |
| Expenses after waivers and/or expense reimbursement | | | | 1.48 | % | | | | 1.48 | % | | | | 1.50 | % | | | | 1.44 | % | | | | 1.49 | % |
| Expenses before waivers and/or expense reimbursement | | | | 1.73 | % | | | | 1.73 | % | | | | 1.75 | % | | | | 1.69 | % | | | | 1.74 | % |
| Net investment income (loss) | | | | (0.46 | )% | | | | (0.53 | )% | | | | (0.68 | )% | | | | (1.00 | )% | | | | (0.93 | )% |
| Portfolio turnover rate(e) | | | | 79 | % | | | | 64 | % | | | | 83 | % | | | | 77 | % | | | | 45 | % |
| (a) | Calculated based on average shares outstanding during the year. |
| (b) | The per share amount of net investment income (loss) does not directly correlate to the amounts reported in the Statement of Operations due to class specific expenses. |
| (c) | Total return is calculated assuming a purchase of a share on the first day and a sale on the last day of each year reported and includes reinvestment of dividends and distributions, if any. Total returns may reflect adjustments to conform to GAAP. |
| (d) | Does not include expenses of the underlying funds in which the Fund invests. |
| (e) | The Fund’s portfolio turnover rate is calculated in accordance with regulatory requirements, without regard to transactions involving short-term investments, certain derivatives and in-kind transactions (if any). If such transactions were included, the Fund’s portfolio turnover rate may be higher. |
See Notes to Financial Statements.
26
PGIM Jennison Health Sciences Fund
Financial Highlights (continued)
| | | | | | | | | | | | | | | | | | | | | | | | | |
| | | | | | |
| Class Z Shares | | | | | | | | | | |
| | |
| | | Year Ended November 30, |
| | | | | | |
| | | 2024 | | 2023 | | 2022 | | 2021 | | 2020 |
| | | | | | |
| Per Share Operating Performance(a): | | | | | | | | | | | | | | | | | | | | | | | | | |
| Net Asset Value, Beginning of Year | | | | $43.77 | | | | | $42.04 | | | | | $58.61 | | | | | $64.17 | | | | | $49.56 | |
| Income (loss) from investment operations: | | | | | | | | | | | | | | | | | | | | | | | | | |
| Net investment income (loss) | | | | 0.08 | | | | | 0.04 | (b) | | | | (0.01 | ) | | | | (0.24 | ) | | | | (0.15 | ) |
| Net realized and unrealized gain (loss) on investment and foreign currency transactions | | | | 9.82 | | | | | 2.31 | | | | | (2.53 | ) | | | | 6.38 | | | | | 16.19 | |
| Total from investment operations | | | | 9.90 | | | | | 2.35 | | | | | (2.54 | ) | | | | 6.14 | | | | | 16.04 | |
| Less Dividends and Distributions: | | | | | | | | | | | | | | | | | | | | | | | | | |
| Distributions from net realized gains | | | | (1.91 | ) | | | | (0.62 | ) | | | | (14.03 | ) | | | | (11.70 | ) | | | | (1.43 | ) |
| Net asset value, end of year | | | | $51.76 | | | | | $43.77 | | | | | $42.04 | | | | | $58.61 | | | | | $64.17 | |
| Total Return(c): | | | | 23.56 | % | | | | 5.66 | % | | | | (6.37 | )% | | | | 9.97 | % | | | | 33.24 | % |
| | | | | | | | | | | | | | | | | | | | | | | | | | |
| | | | | | |
| Ratios/Supplemental Data: | | | | | | | | | | |
| Net assets, end of year (000) | | | | $982,913 | | | | | $779,039 | | | | | $846,631 | | | | | $1,105,132 | | | | | $1,208,728 | |
| Average net assets (000) | | | | $921,773 | | | | | $812,335 | | | | | $897,541 | | | | | $1,247,474 | | | | | $1,018,567 | |
| Ratios to average net assets(d): | | | | | | | | | | | | | | | | | | | | | | | | | |
| Expenses after waivers and/or expense reimbursement | | | | 0.86 | % | | | | 0.86 | % | | | | 0.86 | % | | | | 0.84 | % | | | | 0.85 | % |
| Expenses before waivers and/or expense reimbursement | | | | 0.86 | % | | | | 0.86 | % | | | | 0.86 | % | | | | 0.84 | % | | | | 0.85 | % |
| Net investment income (loss) | | | | 0.15 | % | | | | 0.09 | % | | | | (0.03 | )% | | | | (0.40 | )% | | | | (0.29 | )% |
| Portfolio turnover rate(e) | | | | 79 | % | | | | 64 | % | | | | 83 | % | | | | 77 | % | | | | 45 | % |
| (a) | Calculated based on average shares outstanding during the year. |
| (b) | The per share amount of net investment income (loss) does not directly correlate to the amounts reported in the Statement of Operations due to class specific expenses. |
| (c) | Total return is calculated assuming a purchase of a share on the first day and a sale on the last day of each year reported and includes reinvestment of dividends and distributions, if any. Total returns may reflect adjustments to conform to GAAP. |
| (d) | Does not include expenses of the underlying funds in which the Fund invests. |
| (e) | The Fund’s portfolio turnover rate is calculated in accordance with regulatory requirements, without regard to transactions involving short-term investments, certain derivatives and in-kind transactions (if any). If such transactions were included, the Fund’s portfolio turnover rate may be higher. |
See Notes to Financial Statements.
Prudential Sector Funds 27
PGIM Jennison Health Sciences Fund
Financial Highlights (continued)
| | | | | | | | | | | | | | | | | | | | | | | | | |
| | | | | | |
| Class R6 Shares | | | | | | | | | | |
| | |
| | | Year Ended November 30, |
| | | | | | |
| | | 2024 | | 2023 | | 2022 | | 2021 | | 2020 |
| | | | | | |
| Per Share Operating Performance(a): | | | | | | | | | | | | | | | | | | | | | | | | | |
| Net Asset Value, Beginning of Year | | | | $44.15 | | | | | $42.36 | | | | | $58.91 | | | | | $64.40 | | | | | $49.70 | |
| Income (loss) from investment operations: | | | | | | | | | | | | | | | | | | | | | | | | | |
| Net investment income (loss) | | | | 0.13 | | | | | 0.08 | (b) | | | | 0.02 | (b) | | | | (0.21 | ) | | | | (0.09 | ) |
| Net realized and unrealized gain (loss) on investment and foreign currency transactions | | | | 9.90 | | | | | 2.33 | | | | | (2.54 | ) | | | | 6.42 | | | | | 16.22 | |
| Total from investment operations | | | | 10.03 | | | | | 2.41 | | | | | (2.52 | ) | | | | 6.21 | | | | | 16.13 | |
| Less Dividends and Distributions: | | | | | | | | | | | | | | | | | | | | | | | | | |
| Distributions from net realized gains | | | | (1.91 | ) | | | | (0.62 | ) | | | | (14.03 | ) | | | | (11.70 | ) | | | | (1.43 | ) |
| Net asset value, end of year | | | | $52.27 | | | | | $44.15 | | | | | $42.36 | | | | | $58.91 | | | | | $64.40 | |
| Total Return(c): | | | | 23.65 | % | | | | 5.76 | % | | | | (6.28 | )% | | | | 10.06 | % | | | | 33.33 | % |
| | | | | | | | | | | | | | | | | | | | | | | | | | |
| | | | | | |
| Ratios/Supplemental Data: | | | | | | | | | | |
| Net assets, end of year (000) | | | | $36,534 | | | | | $82,748 | | | | | $86,005 | | | | | $111,912 | | | | | $18,058 | |
| Average net assets (000) | | | | $90,612 | | | | | $81,436 | | | | | $92,150 | | | | | $78,211 | | | | | $22,365 | |
| Ratios to average net assets(d): | | | | | | | | | | | | | | | | | | | | | | | | | |
| Expenses after waivers and/or expense reimbursement | | | | 0.77 | % | | | | 0.77 | % | | | | 0.77 | % | | | | 0.76 | % | | | | 0.79 | % |
| Expenses before waivers and/or expense reimbursement | | | | 0.77 | % | | | | 0.77 | % | | | | 0.77 | % | | | | 0.76 | % | | | | 0.79 | % |
| Net investment income (loss) | | | | 0.26 | % | | | | 0.18 | % | | | | 0.06 | % | | | | (0.34 | )% | | | | (0.17 | )% |
| Portfolio turnover rate(e) | | | | 79 | % | | | | 64 | % | | | | 83 | % | | | | 77 | % | | | | 45 | % |
| (a) | Calculated based on average shares outstanding during the year. |
| (b) | The per share amount of net investment income (loss) does not directly correlate to the amounts reported in the Statement of Operations due to class specific expenses. |
| (c) | Total return is calculated assuming a purchase of a share on the first day and a sale on the last day of each year reported and includes reinvestment of dividends and distributions, if any. Total returns may reflect adjustments to conform to GAAP. |
| (d) | Does not include expenses of the underlying funds in which the Fund invests. |
| (e) | The Fund’s portfolio turnover rate is calculated in accordance with regulatory requirements, without regard to transactions involving short-term investments, certain derivatives and in-kind transactions (if any). If such transactions were included, the Fund’s portfolio turnover rate may be higher. |
See Notes to Financial Statements.
28
PGIM Jennison Utility Fund
Schedule of Investments
as of November 30, 2024
| | | | | | | | |
| | |
| Description | | Shares | | | Value | |
| | |
LONG-TERM INVESTMENTS 98.6% | | | | | | | | |
| | |
COMMON STOCKS | | | | | | | | |
| | |
Electric Utilities 52.9% | | | | | | | | |
| | |
Alliant Energy Corp. | | | 551,989 | | | $ | 34,885,705 | |
American Electric Power Co., Inc. | | | 957,566 | | | | 95,622,541 | |
Constellation Energy Corp. | | | 788,732 | | | | 202,357,082 | |
Duke Energy Corp. | | | 428,027 | | | | 50,100,560 | |
Edison International | | | 874,647 | | | | 76,750,274 | |
Entergy Corp. | | | 1,215,914 | | | | 189,889,289 | |
Evergy, Inc. | | | 1,576,841 | | | | 101,911,234 | |
Exelon Corp. | | | 1,830,435 | | | | 72,412,009 | |
FirstEnergy Corp.(a) | | | 1,469,982 | | | | 62,547,734 | |
NextEra Energy, Inc. | | | 4,915,102 | | | | 386,671,074 | |
PG&E Corp. | | | 8,911,261 | | | | 192,750,575 | |
PPL Corp. | | | 4,221,090 | | | | 147,442,674 | |
Southern Co. (The) | | | 1,498,637 | | | | 133,573,516 | |
Xcel Energy, Inc.(a) | | | 1,616,251 | | | | 117,275,173 | |
| | | | | | | | |
| | |
| | | | | | | 1,864,189,440 | |
| | |
Gas Utilities 1.7% | | | | | | | | |
| | |
Atmos Energy Corp. | | | 232,292 | | | | 35,150,425 | |
Chesapeake Utilities Corp. | | | 202,801 | | | | 26,719,032 | |
| | | | | | | | |
| | |
| | | | | | | 61,869,457 | |
| | |
Independent Power Producers & Energy Traders 7.9% | | | | | | | | |
| | |
Talen Energy Corp.*(a) | | | 426,637 | | | | 91,475,239 | |
Vistra Corp. | | | 1,162,892 | | | | 185,876,657 | |
| | | | | | | | |
| | |
| | | | | | | 277,351,896 | |
| | |
Multi-Utilities 30.2% | | | | | | | | |
| | |
Ameren Corp. | | | 1,480,390 | | | | 139,734,012 | |
CenterPoint Energy, Inc. | | | 4,395,936 | | | | 143,395,432 | |
CMS Energy Corp. | | | 1,894,895 | | | | 132,093,131 | |
Dominion Energy, Inc. | | | 1,261,170 | | | | 74,093,738 | |
DTE Energy Co. | | | 558,481 | | | | 70,245,740 | |
NiSource, Inc. | | | 3,935,049 | | | | 149,886,016 | |
Public Service Enterprise Group, Inc. | | | 1,797,440 | | | | 169,498,592 | |
Sempra | | | 1,962,613 | | | | 183,837,960 | |
| | | | | | | | |
| | |
| | | | | | | 1,062,784,621 | |
See Notes to Financial Statements.
Prudential Sector Funds 29
PGIM Jennison Utility Fund
Schedule of Investments (continued)
as of November 30, 2024
| | | | | | | | |
| | |
| Description | | Shares | | | Value | |
| | |
COMMON STOCKS (Continued) | | | | | | | | |
| | |
Oil & Gas Storage & Transportation 4.1% | | | | | | | | |
| | |
Cheniere Energy, Inc. | | | 381,318 | | | $ | 85,419,045 | |
Targa Resources Corp. | | | 294,706 | | | | 60,208,436 | |
| | | | | | | | |
| | |
| | | | | | | 145,627,481 | |
| | |
Renewable Electricity 1.8% | | | | | | | | |
| | |
Drax Group PLC (United Kingdom) | | | 7,488,217 | | | | 63,598,051 | |
| | | | | | | | |
| | |
TOTAL LONG-TERM INVESTMENTS
(cost $2,038,536,050) | | | | | | | 3,475,420,946 | |
| | | | | | | | |
| | |
SHORT-TERM INVESTMENTS 1.7% | | | | | | | | |
| | |
AFFILIATED MUTUAL FUNDS | | | | | | | | |
PGIM Core Government Money Market Fund (7-day effective yield 4.753%)(wb) | | | 37,958,903 | | | | 37,958,903 | |
PGIM Institutional Money Market Fund (7-day effective yield 4.848%)
(cost $23,014,068; includes $22,965,771 of cash collateral for securities on loan)(b)(wb) | | | 23,027,885 | | | | 23,014,068 | |
| | | | | | | | |
| | |
TOTAL SHORT-TERM INVESTMENTS
(cost $60,972,971) | | | | | | | 60,972,971 | |
| | | | | | | | |
| | |
TOTAL INVESTMENTS 100.3%
(cost $2,099,509,021) | | | | | | | 3,536,393,917 | |
Liabilities in excess of other assets (0.3)% | | | | | | | (12,253,608 | ) |
| | | | | | | | |
| | |
NET ASSETS 100.0% | | | | | | $ | 3,524,140,309 | |
| | | | | | | | |
See the Glossary for a list of the abbreviation(s) used in the annual report.
| * | Non-income producing security. |
| (a) | All or a portion of security is on loan. The aggregate market value of such securities, including those sold and pending settlement, is $22,462,841; cash collateral of $22,965,771 (included in liabilities) was received with which the Fund purchased highly liquid short-term investments. In the event of significant appreciation in value of securities on loan on the last business day of the reporting period, the Fund may reflect a collateral value that is less than the market value of the loaned securities and such shortfall is remedied the following business day. |
| (b) | Represents security, or portion thereof, purchased with cash collateral received for securities on loan and includes dividend reinvestment. |
| (wb) | Represents an investment in a Fund affiliated with the Manager. |
See Notes to Financial Statements.
30
PGIM Jennison Utility Fund
Schedule of Investments (continued)
as of November 30, 2024
Fair Value Measurements:
Various inputs are used in determining the value of the Fund’s investments. These inputs are summarized in the three broad levels listed below.
Level 1—unadjusted quoted prices generally in active markets for identical securities.
Level 2—quoted prices for similar securities, interest rates and yield curves, prepayment speeds, foreign currency exchange rates and other observable inputs.
Level 3—unobservable inputs for securities valued in accordance with Board approved fair valuation procedures.
The following is a summary of the inputs used as of November 30, 2024 in valuing such portfolio securities:
| | | | | | | | | | | | | | | | | | | | | | | | |
| | | Level 1 | | | | | Level 2 | | | | | Level 3 | |
Investments in Securities | | | | | | | | | | | | | | | | | | | | | | | | |
Assets | | | | | | | | | | | | | | | | | | | | | | | | |
Long-Term Investments | | | | | | | | | | | | | | | | | | | | | | | | |
Common Stocks | | | | | | | | | | | | | | | | | | | | | | | | |
Electric Utilities | | $ | 1,864,189,440 | | | | | $ | — | | | | | | | | | | $— | | | | | |
Gas Utilities | | | 61,869,457 | | | | | | — | | | | | | | | | | — | | | | | |
Independent Power Producers & Energy Traders | | | 277,351,896 | | | | | | — | | | | | | | | | | — | | | | | |
Multi-Utilities | | | 1,062,784,621 | | | | | | — | | | | | | | | | | — | | | | | |
Oil & Gas Storage & Transportation | | | 145,627,481 | | | | | | — | | | | | | | | | | — | | | | | |
Renewable Electricity | | | — | | | | | | 63,598,051 | | | | | | | | | | — | | | | | |
Short-Term Investments | | | | | | | | | | | | | | | | | | | | | | | | |
| Affiliated Mutual Funds | | | 60,972,971 | | | | | | — | | | | | | | | | | — | | | | | |
| | | | | | | | | | | | | | | | | | | | | | | | |
Total | | $ | 3,472,795,866 | | | | | $ | 63,598,051 | | | | | | | | | | $— | | | | | |
| | | | | | | | | | | | | | | | |
Sector Classification:
The sector classification of investments and liabilities in excess of other assets shown as a percentage of net assets as of November 30, 2024 were as follows:
| | | | |
Electric Utilities | | | 52.9 | % |
Multi-Utilities | | | 30.2 | |
Independent Power Producers & Energy Traders | | | 7.9 | |
Oil & Gas Storage & Transportation | | | 4.1 | |
Renewable Electricity | | | 1.8 | |
Gas Utilities | | | 1.7 | |
Affiliated Mutual Funds (0.7% represents investments purchased with collateral from securities on loan) | | | 1.7 | |
| | | | |
| | | 100.3 | |
Liabilities in excess of other assets | | | (0.3 | ) |
| | | | |
| |
| | | 100.0 | % |
| | | | |
See Notes to Financial Statements.
Prudential Sector Funds 31
PGIM Jennison Utility Fund
Schedule of Investments (continued)
as of November 30, 2024
Financial Instruments/Transactions—Summary of Offsetting and Netting Arrangements:
The Fund entered into financial instruments/transactions during the reporting period that are either offset in accordance with current requirements or are subject to enforceable master netting arrangements or similar agreements that permit offsetting. The information about offsetting and related netting arrangements for financial instruments/transactions where the legal right to set-off exists is presented in the summary below.
Offsetting of financial instrument/transaction assets and liabilities:
| | | | | | | | |
| Description | | Gross Market Value of Recognized Assets/(Liabilities) | | | | Collateral Pledged/(Received)(1) | | Net
Amount |
Securities on Loan | | $22,462,841 | | | | $(22,462,841) | | $— |
| (1) | Collateral amount disclosed by the Fund is limited to the market value of financial instruments/transactions. |
See Notes to Financial Statements.
32
PGIM Jennison Utility Fund
Statement of Assets & Liabilities
as of November 30, 2024
| | | | |
Assets | | | | |
| |
Investments at value, including securities on loan of $22,462,841: | | | | |
Unaffiliated investments (cost $2,038,536,050) | | $ | 3,475,420,946 | |
Affiliated investments (cost $60,972,971) | | | 60,972,971 | |
Foreign currency, at value (cost $986,637) | | | 944,161 | |
Dividends receivable | | | 11,020,596 | |
Foreign capital gains tax benefit accrued | | | 987,121 | |
Receivable for Fund shares sold | | | 743,781 | |
Tax reclaim receivable | | | 742,096 | |
Prepaid expenses | | | 22,604 | |
| | | | |
Total Assets | | | 3,550,854,276 | |
| | | | |
| |
Liabilities | | | | |
| |
Payable to broker for collateral for securities on loan | | | 22,965,771 | |
Payable for Fund shares purchased | | | 1,316,651 | |
Management fee payable | | | 1,166,992 | |
Distribution fee payable | | | 773,163 | |
Accrued expenses and other liabilities | | | 371,470 | |
Affiliated transfer agent fee payable | | | 113,321 | |
Directors’ fees payable | | | 6,599 | |
| | | | |
Total Liabilities | | | 26,713,967 | |
| | | | |
| |
Net Assets | | $ | 3,524,140,309 | |
| | | | |
| |
| | | | |
| |
Net assets were comprised of: | | | | |
Common stock, at par | | $ | 2,003,692 | |
Paid-in capital in excess of par | | | 1,846,700,692 | |
Total distributable earnings (loss) | | | 1,675,435,925 | |
| | | | |
| |
Net assets, November 30, 2024 | | $ | 3,524,140,309 | |
| | | | |
See Notes to Financial Statements.
Prudential Sector Funds 33
PGIM Jennison Utility Fund
Statement of Assets & Liabilities (continued)
as of November 30, 2024
| | | | |
| |
Class A | | | | |
| |
Net asset value and redemption price per share, ($2,961,767,892 ÷ 168,465,068 shares of common stock issued and outstanding) | | $ | 17.58 | |
Maximum sales charge (5.50% of offering price) | | | 1.02 | |
| | | | |
Maximum offering price to public | | $ | 18.60 | |
| | | | |
| |
Class C | | | | |
| |
Net asset value, offering price and redemption price per share, ($48,227,201 ÷ 2,772,139 shares of common stock issued and outstanding) | | $ | 17.40 | |
| | | | |
| |
Class R | | | | |
| |
Net asset value, offering price and redemption price per share, ($90,925,991 ÷ 5,181,311 shares of common stock issued and outstanding) | | $ | 17.55 | |
| | | | |
| |
Class Z | | | | |
| |
Net asset value, offering price and redemption price per share, ($380,767,453 ÷ 21,543,916 shares of common stock issued and outstanding) | | $ | 17.67 | |
| | | | |
| |
Class R6 | | | | |
| |
Net asset value, offering price and redemption price per share, ($42,451,772 ÷ 2,406,730 shares of common stock issued and outstanding) | | $ | 17.64 | |
| | | | |
See Notes to Financial Statements.
34
PGIM Jennison Utility Fund
Statement of Operations
Year Ended November 30, 2024
| | | | |
| |
Net Investment Income (Loss) | | | | |
| |
Income | | | | |
Unaffiliated dividend income (net of $524,134 foreign withholding tax) | | $ | 77,135,062 | |
Affiliated dividend income | | | 1,271,385 | |
Affiliated income from securities lending, net | | | 15,510 | |
| | | | |
Total income | | | 78,421,957 | |
| | | | |
| |
Expenses | | | | |
Management fee | | | 12,917,840 | |
Distribution fee(a) | | | 8,621,354 | |
Transfer agent’s fees and expenses (including affiliated expense of $1,036,795)(a) | | | 2,444,799 | |
Custodian and accounting fees | | | 192,822 | |
Shareholders’ reports | | | 111,939 | |
Registration fees(a) | | | 89,193 | |
Professional fees | | | 59,249 | |
Directors’ fees | | | 49,324 | |
Audit fee | | | 26,655 | |
Miscellaneous | | | 66,422 | |
| | | | |
| |
Total expenses | | | 24,579,597 | |
Less: Distribution fee waiver(a) | | | (195,522 | ) |
| | | | |
| |
Net expenses | | | 24,384,075 | |
| | | | |
| |
Net investment income (loss) | | | 54,037,882 | |
| | | | |
| |
Realized And Unrealized Gain (Loss) On Investment And Foreign Currency Transactions | | | | |
| |
Net realized gain (loss) on: | | | | |
Investment transactions (including affiliated of $11,097) (net of foreign capital gains taxes $(998,147)) | | | 253,288,801 | |
Foreign currency transactions | | | (287,580 | ) |
| | | | |
| | | 253,001,221 | |
| | | | |
Net change in unrealized appreciation (depreciation) on: | | | | |
Investments (net of change in foreign capital gains taxes $987,121) | | | 725,106,694 | |
Foreign currencies | | | (79,134 | ) |
| | | | |
| | | 725,027,560 | |
| | | | |
Net gain (loss) on investment and foreign currency transactions | | | 978,028,781 | |
| | | | |
Net Increase (Decrease) In Net Assets Resulting From Operations | | $ | 1,032,066,663 | |
| | | | |
| (a) | Class specific expenses and waivers were as follows: |
| | | | | | | | | | | | | | | | | | | | | | | | | |
| | | Class A | | Class C | | Class R | | Class Z | | Class R6 |
Distribution fee | | | | 7,615,349 | | | | | 419,440 | | | | | 586,565 | | | | | — | | | | | — | |
Transfer agent’s fees and expenses | | | | 1,943,492 | | | | | 53,945 | | | | | 114,354 | | | | | 327,786 | | | | | 5,222 | |
Registration fees | | | | 23,312 | | | | | 16,282 | | | | | 14,165 | | | | | 23,841 | | | | | 11,593 | |
Distribution fee waiver | | | | — | | | | | — | | | | | (195,522 | ) | | | | — | | | | | — | |
See Notes to Financial Statements.
Prudential Sector Funds 35
PGIM Jennison Utility Fund
Statements of Changes in Net Assets
| | | | | | | | |
| |
| | | Year Ended
November 30, | |
| | |
| | | 2024 | | | 2023 | |
Increase (Decrease) in Net Assets | | | | | | | | |
| | |
Operations | | | | | | | | |
Net investment income (loss) | | $ | 54,037,882 | | | $ | 59,995,755 | |
Net realized gain (loss) on investment and foreign currency transactions | | | 253,001,221 | | | | 187,168,364 | |
Net change in unrealized appreciation (depreciation) on investments and foreign currencies | | | 725,027,560 | | | | (530,353,526 | ) |
| | | | | | | | |
Net increase (decrease) in net assets resulting from operations | | | 1,032,066,663 | | | | (283,189,407 | ) |
| | | | | | | | |
| | |
Dividends and Distributions | | | | | | | | |
Distributions from distributable earnings | | | | | | | | |
Class A | | | (217,181,051 | ) | | | (227,286,737 | ) |
Class C | | | (3,446,673 | ) | | | (4,087,644 | ) |
Class R | | | (6,597,565 | ) | | | (7,321,462 | ) |
Class Z | | | (27,888,993 | ) | | | (36,399,599 | ) |
Class R6 | | | (2,739,834 | ) | | | (3,497,323 | ) |
| | | | | | | | |
| | | (257,854,116 | ) | | | (278,592,765 | ) |
| | | | | | | | |
| | |
Fund share transactions (Net of share conversions) | | | | | | | | |
Net proceeds from shares sold | | | 175,927,248 | | | | 160,067,481 | |
Net asset value of shares issued in reinvestment of dividends and distributions | | | 249,657,703 | | | | 269,458,520 | |
Cost of shares purchased | | | (561,577,498 | ) | | | (610,080,129 | ) |
| | | | | | | | |
| | |
Net increase (decrease) in net assets from Fund share transactions | | | (135,992,547 | ) | | | (180,554,128 | ) |
| | | | | | | | |
| | |
Total increase (decrease) | | | 638,220,000 | | | | (742,336,300 | ) |
| | |
Net Assets: | | | | | | | | |
| | |
Beginning of year | | | 2,885,920,309 | | | | 3,628,256,609 | |
| | | | | | | | |
| | |
End of year | | $ | 3,524,140,309 | | | $ | 2,885,920,309 | |
| | | | | | | | |
See Notes to Financial Statements.
36
PGIM Jennison Utility Fund
Financial Highlights
| | | | | | | | | | | | | | | | | | | | | | | | | |
| | | | | | |
| Class A Shares | | | | | | | | | | |
| | |
| | | Year Ended November 30, |
| | | | | | |
| | | 2024 | | 2023 | | 2022 | | 2021 | | 2020 |
| | | | | | |
| Per Share Operating Performance(a): | | | | | | | | | | | | | | | | | | | | | | | | | |
| Net Asset Value, Beginning of Year | | | | $13.80 | | | | | $16.31 | | | | | $17.01 | | | | | $15.97 | | | | | $15.72 | |
| Income (loss) from investment operations: | | | | | | | | | | | | | | | | | | | | | | | | | |
| Net investment income (loss) | | | | 0.26 | | | | | 0.27 | | | | | 0.21 | | | | | 0.17 | | | | | 0.24 | |
| Net realized and unrealized gain (loss) on investment and foreign currency transactions | | | | 4.76 | | | | | (1.52 | ) | | | | 1.37 | | | | | 1.16 | | | | | 0.86 | |
| Total from investment operations | | | | 5.02 | | | | | (1.25 | ) | | | | 1.58 | | | | | 1.33 | | | | | 1.10 | |
| Less Dividends and Distributions: | | | | | | | | | | | | | | | | | | | | | | | | | |
| Dividends from net investment income | | | | (0.24 | ) | | | | (0.24 | ) | | | | (0.22 | ) | | | | (0.21 | ) | | | | (0.23 | ) |
| Distributions from net realized gains | | | | (1.00 | ) | | | | (1.02 | ) | | | | (2.06 | ) | | | | (0.08 | ) | | | | (0.62 | ) |
| Total dividends and distributions | | | | (1.24 | ) | | | | (1.26 | ) | | | | (2.28 | ) | | | | (0.29 | ) | | | | (0.85 | ) |
| Net asset value, end of year | | | | $17.58 | | | | | $13.80 | | | | | $16.31 | | | | | $17.01 | | | | | $15.97 | |
| Total Return(b): | | | | 39.58 | % | | | | (8.05 | )% | | | | 10.14 | % | | | | 8.46 | % | | | | 7.47 | % |
| | | | | | | | | | | | | | | | | | | | | | | | | | |
| | | | | | |
| Ratios/Supplemental Data: | | | | | | | | | | |
| Net assets, end of year (in millions) | | | | $2,962 | | | | | $2,431 | | | | | $2,954 | | | | | $2,888 | | | | | $2,878 | |
| Average net assets (in millions) | | | | $2,538 | | | | | $2,618 | | | | | $2,918 | | | | | $2,895 | | | | | $2,815 | |
| Ratios to average net assets(c): | | | | | | | | | | | | | | | | | | | | | | | | | |
| Expenses after waivers and/or expense reimbursement | | | | 0.82 | % | | | | 0.85 | % | | | | 0.83 | % | | | | 0.82 | % | | | | 0.83 | % |
| Expenses before waivers and/or expense reimbursement | | | | 0.82 | % | | | | 0.85 | % | | | | 0.83 | % | | | | 0.82 | % | | | | 0.83 | % |
| Net investment income (loss) | | | | 1.78 | % | | | | 1.88 | % | | | | 1.35 | % | | | | 1.06 | % | | | | 1.61 | % |
| Portfolio turnover rate(d) | | | | 47 | % | | | | 49 | % | | | | 56 | % | | | | 38 | % | | | | 28 | % |
| (a) | Calculated based on average shares outstanding during the year. |
| (b) | Total return does not consider the effects of sales loads. Total return is calculated assuming a purchase of a share on the first day and a sale on the last day of each year reported and includes reinvestment of dividends and distributions, if any. Total returns may reflect adjustments to conform to GAAP. |
| (c) | Does not include expenses of the underlying funds in which the Fund invests. |
| (d) | The Fund’s portfolio turnover rate is calculated in accordance with regulatory requirements, without regard to transactions involving short-term investments, certain derivatives and in-kind transactions (if any). If such transactions were included, the Fund’s portfolio turnover rate may be higher. |
See Notes to Financial Statements.
Prudential Sector Funds 37
PGIM Jennison Utility Fund
Financial Highlights (continued)
| | | | | | | | | | | | | | | | | | | | |
| | | | | | |
| Class C Shares | | | | | | | | | | | | | | | |
| | |
| | | Year Ended November 30, | |
| | | | | | |
| | | 2024 | | | 2023 | | | 2022 | | | 2021 | | | 2020 | |
| | | | | | |
| Per Share Operating Performance(a): | | | | | | | | | | | | | | | | | | | | |
| Net Asset Value, Beginning of Year | | | $13.68 | | | | $16.18 | | | | $16.92 | | | | $15.89 | | | | $15.63 | |
| Income (loss) from investment operations: | | | | | | | | | | | | | | | | | | | | |
| Net investment income (loss) | | | 0.14 | | | | 0.16 | | | | 0.09 | | | | 0.05 | | | | 0.13 | |
| Net realized and unrealized gain (loss) on investment and foreign currency transactions | | | 4.72 | | | | (1.51 | ) | | | 1.34 | | | | 1.16 | | | | 0.87 | |
| Total from investment operations | | | 4.86 | | | | (1.35 | ) | | | 1.43 | | | | 1.21 | | | | 1.00 | |
| Less Dividends and Distributions: | | | | | | | | | | | | | | | | | | | | |
| Dividends from net investment income | | | (0.14 | ) | | | (0.13 | ) | | | (0.11 | ) | | | (0.10 | ) | | | (0.12 | ) |
| Distributions from net realized gains | | | (1.00 | ) | | | (1.02 | ) | | | (2.06 | ) | | | (0.08 | ) | | | (0.62 | ) |
| Total dividends and distributions | | | (1.14 | ) | | | (1.15 | ) | | | (2.17 | ) | | | (0.18 | ) | | | (0.74 | ) |
| Net asset value, end of year | | | $17.40 | | | | $13.68 | | | | $16.18 | | | | $16.92 | | | | $15.89 | |
| Total Return(b): | | | 38.51 | % | | | (8.72 | )% | | | 9.19 | % | | | 7.72 | % | | | 6.71 | % |
| | | | | | |
| | | | | | | | | | | | | | | | | | | | | |
| | | | | | |
| Ratios/Supplemental Data: | | | | | | | | | | | | | | | |
| Net assets, end of year (in millions) | | | $48 | | | | $42 | | | | $59 | | | | $55 | | | | $61 | |
| Average net assets (in millions) | | | $42 | | | | $48 | | | | $57 | | | | $56 | | | | $63 | |
| Ratios to average net assets(c): | | | | | | | | | | | | | | | | | | | | |
| Expenses after waivers and/or expense reimbursement | | | 1.61 | % | | | 1.63 | % | | | 1.60 | % | | | 1.59 | % | | | 1.59 | % |
| Expenses before waivers and/or expense reimbursement | | | 1.61 | % | | | 1.63 | % | | | 1.60 | % | | | 1.59 | % | | | 1.59 | % |
| Net investment income (loss) | | | 0.99 | % | | | 1.11 | % | | | 0.58 | % | | | 0.31 | % | | | 0.87 | % |
| Portfolio turnover rate(d) | | | 47 | % | | | 49 | % | | | 56 | % | | | 38 | % | | | 28 | % |
| (a) | Calculated based on average shares outstanding during the year. |
| (b) | Total return does not consider the effects of sales loads. Total return is calculated assuming a purchase of a share on the first day and a sale on the last day of each year reported and includes reinvestment of dividends and distributions, if any. Total returns may reflect adjustments to conform to GAAP. |
| (c) | Does not include expenses of the underlying funds in which the Fund invests. |
| (d) | The Fund’s portfolio turnover rate is calculated in accordance with regulatory requirements, without regard to transactions involving short-term investments, certain derivatives and in-kind transactions (if any). If such transactions were included, the Fund’s portfolio turnover rate may be higher. |
See Notes to Financial Statements.
38
PGIM Jennison Utility Fund
Financial Highlights (continued)
| | | | | | | | | | | | | | | | | | | | |
| | | | | | |
| Class R Shares | | | | | | | | | | | | | | | |
| | |
| | | Year Ended November 30, | |
| | | | | | |
| | | 2024 | | | 2023 | | | 2022 | | | 2021 | | | 2020 | |
| | | | | | |
| Per Share Operating Performance(a): | | | | | | | | | | | | | | | | | | | | |
| Net Asset Value, Beginning of Year | | | $13.79 | | | | $16.29 | | | | $17.00 | | | | $15.95 | | | | $15.70 | |
| Income (loss) from investment operations: | | | | | | | | | | | | | | | | | | | | |
| Net investment income (loss) | | | 0.21 | | | | 0.23 | | | | 0.17 | | | | 0.13 | | | | 0.20 | |
| Net realized and unrealized gain (loss) on investment and foreign currency transactions | | | 4.76 | | | | (1.51 | ) | | | 1.36 | | | | 1.16 | | | | 0.86 | |
| Total from investment operations | | | 4.97 | | | | (1.28 | ) | | | 1.53 | | | | 1.29 | | | | 1.06 | |
| Less Dividends and Distributions: | | | | | | | | | | | | | | | | | | | | |
| Dividends from net investment income | | | (0.21 | ) | | | (0.20 | ) | | | (0.18 | ) | | | (0.16 | ) | | | (0.19 | ) |
| Distributions from net realized gains | | | (1.00 | ) | | | (1.02 | ) | | | (2.06 | ) | | | (0.08 | ) | | | (0.62 | ) |
| Total dividends and distributions | | | (1.21 | ) | | | (1.22 | ) | | | (2.24 | ) | | | (0.24 | ) | | | (0.81 | ) |
| Net asset value, end of year | | | $17.55 | | | | $13.79 | | | | $16.29 | | | | $17.00 | | | | $15.95 | |
| Total Return(b): | | | 39.23 | % | | | (8.30 | )% | | | 9.81 | % | | | 8.24 | % | | | 7.14 | % |
| | | | | | |
| | | | | | | | | | | | | | | | | | | | | |
| | | | | | |
| Ratios/Supplemental Data: | | | | | | | | | | | | | | | |
| Net assets, end of year (in millions) | | | $91 | | | | $76 | | | | $97 | | | | $84 | | | | $82 | |
| Average net assets (in millions) | | | $78 | | | | $86 | | | | $90 | | | | $84 | | | | $84 | |
| Ratios to average net assets(c): | | | | | | | | | | | | | | | | | | | | |
| Expenses after waivers and/or expense reimbursement | | | 1.11 | % | | | 1.11 | % | | | 1.09 | % | | | 1.10 | % | | | 1.11 | % |
| Expenses before waivers and/or expense reimbursement | | | 1.36 | % | | | 1.36 | % | | | 1.34 | % | | | 1.35 | % | | | 1.36 | % |
| Net investment income (loss) | | | 1.49 | % | | | 1.62 | % | | | 1.05 | % | | | 0.78 | % | | | 1.34 | % |
| Portfolio turnover rate(d) | | | 47 | % | | | 49 | % | | | 56 | % | | | 38 | % | | | 28 | % |
| (a) | Calculated based on average shares outstanding during the year. |
| (b) | Total return is calculated assuming a purchase of a share on the first day and a sale on the last day of each year reported and includes reinvestment of dividends and distributions, if any. Total returns may reflect adjustments to conform to GAAP. |
| (c) | Does not include expenses of the underlying funds in which the Fund invests. |
| (d) | The Fund’s portfolio turnover rate is calculated in accordance with regulatory requirements, without regard to transactions involving short-term investments, certain derivatives and in-kind transactions (if any). If such transactions were included, the Fund’s portfolio turnover rate may be higher. |
See Notes to Financial Statements.
Prudential Sector Funds 39
PGIM Jennison Utility Fund
Financial Highlights (continued)
| | | | | | | | | | | | | | | | | | | | |
| | | | | | |
| Class Z Shares | | | | | | | | | | | | | | | |
| | |
| | | Year Ended November 30, | |
| | | | | | |
| | | 2024 | | | 2023 | | | 2022 | | | 2021 | | | 2020 | |
| | | | | | |
| Per Share Operating Performance(a): | | | | | | | | | | | | | | | | | | | | |
| Net Asset Value, Beginning of Year | | | $13.87 | | | | $16.38 | | | | $17.08 | | | | $16.02 | | | | $15.74 | |
| Income (loss) from investment operations: | | | | | | | | | | | | | | | | | | | | |
| Net investment income (loss) | | | 0.30 | | | | 0.31 | | | | 0.25 | | | | 0.22 | | | | 0.28 | |
| Net realized and unrealized gain (loss) on investment and foreign currency transactions | | | 4.78 | | | | (1.52 | ) | | | 1.37 | | | | 1.17 | | | | 0.89 | |
| Total from investment operations | | | 5.08 | | | | (1.21 | ) | | | 1.62 | | | | 1.39 | | | | 1.17 | |
| Less Dividends and Distributions: | | | | | | | | | | | | | | | | | | | | |
| Dividends from net investment income | | | (0.28 | ) | | | (0.28 | ) | | | (0.26 | ) | | | (0.25 | ) | | | (0.27 | ) |
| Distributions from net realized gains | | | (1.00 | ) | | | (1.02 | ) | | | (2.06 | ) | | | (0.08 | ) | | | (0.62 | ) |
| Total dividends and distributions | | | (1.28 | ) | | | (1.30 | ) | | | (2.32 | ) | | | (0.33 | ) | | | (0.89 | ) |
| Net asset value, end of year | | | $17.67 | | | | $13.87 | | | | $16.38 | | | | $17.08 | | | | $16.02 | |
| Total Return(b): | | | 39.88 | % | | | (7.75 | )% | | | 10.40 | % | | | 8.84 | % | | | 7.96 | % |
| | | | | | |
| | | | | | | | | | | | | | | | | | | | | |
| | | | | | |
| Ratios/Supplemental Data: | | | | | | | | | | | | | | | |
| Net assets, end of year (in millions) | | | $381 | | | | $309 | | | | $467 | | | | $314 | | | | $323 | |
| Average net assets (in millions) | | | $319 | | | | $380 | | | | $402 | | | | $325 | | | | $308 | |
| Ratios to average net assets(c): | | | | | | | | | | | | | | | | | | | | |
| Expenses after waivers and/or expense reimbursement | | | 0.56 | % | | | 0.57 | % | | | 0.55 | % | | | 0.56 | % | | | 0.57 | % |
| Expenses before waivers and/or expense reimbursement | | | 0.56 | % | | | 0.57 | % | | | 0.55 | % | | | 0.56 | % | | | 0.57 | % |
| Net investment income (loss) | | | 2.04 | % | | | 2.19 | % | | | 1.59 | % | | | 1.32 | % | | | 1.85 | % |
| Portfolio turnover rate(d) | | | 47 | % | | | 49 | % | | | 56 | % | | | 38 | % | | | 28 | % |
| (a) | Calculated based on average shares outstanding during the year. |
| (b) | Total return is calculated assuming a purchase of a share on the first day and a sale on the last day of each year reported and includes reinvestment of dividends and distributions, if any. Total returns may reflect adjustments to conform to GAAP. |
| (c) | Does not include expenses of the underlying funds in which the Fund invests. |
| (d) | The Fund’s portfolio turnover rate is calculated in accordance with regulatory requirements, without regard to transactions involving short-term investments, certain derivatives and in-kind transactions (if any). If such transactions were included, the Fund’s portfolio turnover rate may be higher. |
See Notes to Financial Statements.
40
PGIM Jennison Utility Fund
Financial Highlights (continued)
| | | | | | | | | | | | | | | | | | | | |
| | | | | | |
| Class R6 Shares | | | | | | | | | | | | | | | |
| | |
| | | Year Ended November 30, | |
| | | | | | |
| | | 2024 | | | 2023 | | | 2022 | | | 2021 | | | 2020 | |
| | | | | | |
| Per Share Operating Performance(a): | | | | | | | | | | | | | | | | | | | | |
| Net Asset Value, Beginning of Year | | | $13.84 | | | | $16.35 | | | | $17.05 | | | | $16.00 | | | | $15.75 | |
| Income (loss) from investment operations: | | | | | | | | | | | | | | | | | | | | |
| Net investment income (loss) | | | 0.30 | | | | 0.30 | | | | 0.29 | | | | 0.21 | | | | 0.28 | |
| Net realized and unrealized gain (loss) on investment and foreign currency transactions | | | 4.78 | | | | (1.50 | ) | | | 1.34 | | | | 1.18 | | | | 0.87 | |
| Total from investment operations | | | 5.08 | | | | (1.20 | ) | | | 1.63 | | | | 1.39 | | | | 1.15 | |
| Less Dividends and Distributions: | | | | | | | | | | | | | | | | | | | | |
| Dividends from net investment income | | | (0.28 | ) | | | (0.29 | ) | | | (0.27 | ) | | | (0.26 | ) | | | (0.28 | ) |
| Distributions from net realized gains | | | (1.00 | ) | | | (1.02 | ) | | | (2.06 | ) | | | (0.08 | ) | | | (0.62 | ) |
| Total dividends and distributions | | | (1.28 | ) | | | (1.31 | ) | | | (2.33 | ) | | | (0.34 | ) | | | (0.90 | ) |
| Net asset value, end of year | | | $17.64 | | | | $13.84 | | | | $16.35 | | | | $17.05 | | | | $16.00 | |
| Total Return(b): | | | 40.03 | % | | | (7.69 | )% | | | 10.49 | % | | | 8.85 | % | | | 7.81 | % |
| | | | | | |
| | | | | | | | | | | | | | | | | | | | | |
| | | | | | |
| Ratios/Supplemental Data: | | | | | | | | | | | | | | | |
| Net assets, end of year (in millions) | | | $42 | | | | $28 | | | | $51 | | | | $66 | | | | $6 | |
| Average net assets (in millions) | | | $35 | | | | $29 | | | | $71 | | | | $38 | | | | $4 | |
| Ratios to average net assets(c): | | | | | | | | | | | | | | | | | | | | |
| Expenses after waivers and/or expense reimbursement | | | 0.49 | % | | | 0.50 | % | | | 0.46 | % | | | 0.48 | % | | | 0.52 | % |
| Expenses before waivers and/or expense reimbursement | | | 0.49 | % | | | 0.50 | % | | | 0.46 | % | | | 0.48 | % | | | 0.63 | % |
| Net investment income (loss) | | | 2.09 | % | | | 2.09 | % | | | 1.80 | % | | | 1.21 | % | | | 1.83 | % |
| Portfolio turnover rate(d) | | | 47 | % | | | 49 | % | | | 56 | % | | | 38 | % | | | 28 | % |
| (a) | Calculated based on average shares outstanding during the year. |
| (b) | Total return is calculated assuming a purchase of a share on the first day and a sale on the last day of each year reported and includes reinvestment of dividends and distributions, if any. Total returns may reflect adjustments to conform to GAAP. |
| (c) | Does not include expenses of the underlying funds in which the Fund invests. |
| (d) | The Fund’s portfolio turnover rate is calculated in accordance with regulatory requirements, without regard to transactions involving short-term investments, certain derivatives and in-kind transactions (if any). If such transactions were included, the Fund’s portfolio turnover rate may be higher. |
See Notes to Financial Statements.
Prudential Sector Funds 41
Notes to Financial Statements
Prudential Sector Funds, Inc. (the “Registered Investment Company” or “RIC”) is registered under the Investment Company Act of 1940, as amended (“1940 Act”), as an open-end management investment company. The RIC is organized as a Maryland Corporation. These financial statements relate to the following series of the RIC: PGIM Jennison Financial Services Fund, PGIM Jennison Health Sciences Fund and PGIM Jennison Utility Fund (each, a “Fund” and collectively, the “Funds”). PGIM Jennison Health Sciences Fund is a diversified fund for purposes of the 1940 Act and PGIM Jennison Financial Services Fund and PGIM Jennison Utility Fund are non-diversified funds for the purposes of the 1940 Act.
The Funds have the following investment objectives:
| | |
| | |
| Fund | | Investment Objective(s) |
PGIM Jennison Financial Services Fund (“Jennison Financial Services”) | | Long-term capital appreciation. |
PGIM Jennison Health Sciences Fund (“Jennison Health Sciences”) | | Long-term capital appreciation. |
PGIM Jennison Utility Fund (“Jennison Utility”) | | To seek total return through a combination of capital appreciation and current income. |
The Funds follow the investment company accounting and reporting guidance of the Financial Accounting Standards Board (“FASB”) Accounting Standard Codification (“ASC”) Topic 946 Financial Services — Investment Companies. The following is a summary of significant accounting policies followed by the Funds in the preparation of their financial statements. The policies conform to U.S. generally accepted accounting principles (“GAAP”). The Funds consistently follow such policies in the preparation of their financial statements.
Securities Valuation: The Funds hold securities and other assets and liabilities that are fair valued as of the close of each day (generally, 4:00 PM Eastern time) the New York Stock Exchange (“NYSE”) is open for trading. As described in further detail below, the Funds’ investments are valued daily based on a number of factors, including the type of investment and whether market quotations are readily available. The RIC’s Board of Directors (the “Board”) has approved the Funds’ valuation policies and procedures for security valuation and designated PGIM Investments LLC (“PGIM Investments” or the “Manager”) as the “Valuation Designee,” as defined by Rule 2a-5(b) under the 1940 Act, to perform the fair value determination relating to all Funds investments. Pursuant to the Board’s oversight, the
42
Valuation Designee has established a Valuation Committee to perform the duties and responsibilities of the Valuation Designee under Rule 2a-5. The valuation procedures permit the Funds to utilize independent pricing vendor services, quotations from market makers, and alternative valuation methods when market quotations are either not readily available or not deemed representative of fair value. Fair value is the estimated price that would be received to sell an asset or paid to transfer a liability in an orderly transaction between market participants on the measurement date.
For the fiscal reporting year-end, securities and other assets and liabilities were fair valued at the close of the last U.S. business day. Trading in certain foreign securities may occur when the NYSE is closed (including weekends and holidays). Because such foreign securities trade in markets that are open on weekends and U.S. holidays, the values of some of the Funds’ foreign investments may change on days when investors cannot purchase or redeem Fund shares.
Various inputs determine how the Funds’ investments are valued, all of which are categorized according to the three broad levels (Level 1, 2, or 3) detailed in the Schedule of Investments and referred to herein as the “fair value hierarchy” in accordance with FASB ASC Topic 820 Fair Value Measurement.
Common or preferred stocks, exchange-traded funds (“ETFs”) and derivative instruments, if applicable, that are traded on a national securities exchange are valued at the last sale price as of the close of trading on the applicable exchange where the security principally trades. Securities traded via NASDAQ are valued at the NASDAQ official closing price. To the extent these securities are valued at the last sale price or NASDAQ official closing price, they are classified as Level 1 in the fair value hierarchy. In the event that no sale or official closing price on a valuation date exists, these securities are generally valued at the mean between the last reported bid and ask prices, or at the last bid price in the absence of an ask price. These securities are classified as Level 2 in the fair value hierarchy.
Foreign equities traded on foreign securities exchanges are generally valued using pricing vendor services that provide model prices derived using adjustment factors based on information such as local closing price, relevant general and sector indices, currency fluctuations, depositary receipts, and futures, as applicable. Securities valued using such model prices are classified as Level 2 in the fair value hierarchy. The models generate an evaluated adjustment factor for each security, which is applied to the local closing price to adjust it for post closing market movements up to the time each Fund is valued. Utilizing that evaluated adjustment factor, the vendor provides an evaluated price for each security. If the vendor does not provide an evaluated price, securities are valued in accordance with exchange-traded common and preferred stock valuation policies discussed above.
Investments in open-end funds (other than ETFs) are valued at their net asset values as of the close of the NYSE on the date of valuation. These securities are classified as Level 1 in the fair value hierarchy since they may be purchased or sold at their net asset values on the date of valuation.
43
Notes to Financial Statements (continued)
Securities and other assets that cannot be priced according to the methods described above are valued based on policies and procedures approved by the Board. In the event that unobservable inputs are used when determining such valuations, the securities will be classified as Level 3 in the fair value hierarchy. Altering one or more unobservable inputs may result in a significant change to a Level 3 security’s fair value measurement.
When determining the fair value of securities, some of the factors influencing the valuation include: the nature of any restrictions on disposition of the securities; assessment of the general liquidity of the securities; the issuer’s financial condition and the markets in which it does business; the cost of the investment; the size of the holding and the capitalization of the issuer; the prices of any recent transactions or bids/offers for such securities or any comparable securities; and any available analyst media or other reports or information deemed reliable by the Valuation Designee regarding the issuer or the markets or industry in which it operates. Using fair value to price securities may result in a value that is different from a security’s most recent closing price and from the price used by other unaffiliated mutual funds to calculate their net asset values.
Foreign Currency Translation: The books and records of the Funds are maintained in U.S. dollars. Foreign currency amounts are translated into U.S. dollars on the following basis:
(i) market value of investment securities, other assets and liabilities — at the exchange rate as of the valuation date;
(ii) purchases and sales of investment securities, income and expenses — at the rates of exchange prevailing on the respective dates of such transactions.
Although the net assets of the Funds are presented at the foreign exchange rates and market values at the close of the period, the Funds do not generally isolate that portion of the results of operations arising as a result of changes in the foreign exchange rates from the fluctuations arising from changes in the market prices of long-term portfolio securities held at the end of the period. Similarly, the Funds do not isolate the effect of changes in foreign exchange rates from the fluctuations arising from changes in the market prices of long-term portfolio securities sold during the period. Accordingly, holding period unrealized and realized foreign currency gains (losses) are included in the reported net change in unrealized appreciation (depreciation) on investments and net realized gains (losses) on investment transactions on the Statements of Operations.
Additionally, net realized gains (losses) on foreign currency transactions represent net foreign exchange gains (losses) from the disposition of holdings of foreign currencies, currency gains (losses) realized between the trade and settlement dates on investment transactions, and the difference between the amounts of interest, dividends and foreign
44
withholding taxes recorded on the Funds’ books and the U.S. dollar equivalent amounts actually received or paid. Net unrealized currency gains (losses) arise from valuing foreign currency denominated assets and liabilities (other than investments) at period end exchange rates.
Master Netting Arrangements: The RIC, on behalf of each Fund, is subject to various Master Agreements, or netting arrangements, with select counterparties. These are agreements which a subadviser may have negotiated and entered into on behalf of all or a portion of each Fund. A master netting arrangement between each Fund and the counterparty permits each Fund to offset amounts payable by each Fund to the same counterparty against amounts to be received and by the receipt of collateral from the counterparty by each Funds to cover each Fund’s exposure to the counterparty. However, there is no assurance that such mitigating factors are easily enforceable. In addition to master netting arrangements, the right to set-off exists when all the conditions are met such that each of the parties owes the other determinable amounts, the reporting party has the right to set-off the amount owed with the amount owed by the other party, the reporting party intends to set-off and the right of set-off is enforceable by law.
Securities Lending: Certain Funds lend their portfolio securities to banks and broker-dealers. The loans are secured by collateral at least equal to the market value of the securities loaned. Collateral pledged by each borrower is invested in an affiliated money market fund and is marked to market daily, based on the previous day’s market value, such that the value of the collateral exceeds the value of the loaned securities. In the event of significant appreciation in value of the securities on loan on the last business day of the reporting period, the financial statements may reflect a collateral value that is less than the market value of the loaned securities. Such shortfall is remedied as described above. Loans are subject to termination at the option of the borrower or the Funds. Upon termination of the loan, the borrower will return to the Funds securities identical to the loaned securities. The remaining open loans of the securities lending transactions are considered overnight and continuous. Should the borrower of the securities fail financially, the Funds have the right to repurchase the securities in the open market using the collateral.
The Funds recognize income, net of any rebate and securities lending agent fees, for lending their securities in the form of fees or interest on the investment of any cash received as collateral. The borrower receives all interest and dividends from the securities loaned and such payments are passed back to the lender in amounts equivalent thereto, which are reflected in interest income or unaffiliated dividend income based on the nature of the payment on the Statement of Operations. The Funds also continue to recognize any unrealized gain (loss) in the market price of the securities loaned and on the change in the value of the collateral invested that may occur during the term of the loan. In addition, realized gain (loss) is recognized on changes in the value of the collateral invested upon liquidation of the collateral. Net earnings from securities lending are disclosed in the Statement of Operations.
45
Notes to Financial Statements (continued)
Equity and Mortgage Real Estate Investment Trusts (collectively “REITs”): Certain Funds invested in REITs, which report information on the source of their distributions annually. Based on current and historical information, a portion of distributions received from REITs during the period is estimated to be dividend income, capital gain or return of capital and recorded accordingly. When material, these estimates are adjusted periodically when the actual source of distributions is disclosed by the REITs.
Securities Transactions and Net Investment Income: Securities transactions are recorded on the trade date. Realized gains (losses) from investment and currency transactions are calculated on the specific identification method. Dividend income is recorded on the ex-date, or for certain foreign securities, when the Funds become aware of such dividends. Expenses are recorded on an accrual basis, which may require the use of certain estimates by management that may differ from actual expense amounts. Net investment income or loss (other than class specific expenses and waivers, which are allocated as noted below) and unrealized and realized gains (losses) are allocated daily to each class of shares based upon the relative proportion of adjusted net assets of each class at the beginning of the day. Class specific expenses and waivers, where applicable, are charged to the respective share classes. Such class specific expenses and waivers include distribution fees and distribution fee waivers, shareholder servicing fees, transfer agent’s fees and expenses, registration fees and fee waivers and/or expense reimbursements, as applicable.
Taxes: It is each Fund’s policy to continue to meet the requirements of the Internal Revenue Code applicable to regulated investment companies and to distribute all of its taxable net investment income and capital gains, if any, to its shareholders. Therefore, no federal income tax provision is required. Withholding taxes on foreign dividends, interest and capital gains, if any, are recorded, net of reclaimable amounts, at the time the related income is earned.
Dividends and Distributions: Dividends and distributions to shareholders, which are determined in accordance with federal income tax regulations and which may differ from GAAP, are recorded on the ex-date. Permanent book/tax differences relating to income and gain (loss) are reclassified between total distributable earnings (loss) and paid-in capital in excess of par, as appropriate. The chart below sets forth the expected frequency of dividend and capital gains distributions to shareholders. Various factors may impact the frequency of dividend distributions to shareholders, including but not limited to adverse market conditions or portfolio holding-specific events.
46
| | |
| | |
| Expected Distribution Schedule to Shareholders* | | Frequency |
| |
Each Fund other than Jennison Utility: | | |
| |
Net Investment Income | | Annually |
| |
Short-Term Capital Gains | | Annually |
Long-Term Capital Gains | | Annually |
| | |
| |
Jennison Utility: | | |
Net Investment Income | | Quarterly |
| |
Short-Term Capital Gains | | Annually |
Long-Term Capital Gains | | Annually |
| * | Under certain circumstances, each Fund may make more than one distribution of short-term and/or long-term capital gains during a fiscal year. |
Estimates: The preparation of financial statements requires management to make estimates and assumptions that affect the reported amounts and disclosures in the financial statements. Actual results could differ from those estimates.
The RIC, on behalf of each Fund, has entered into management agreements with the Manager pursuant to which it has responsibility for all investment advisory services, including supervision of the subadviser’s performance of such services, and for rendering administrative services.
The Manager has entered into subadvisory agreements with Jennison Associates LLC (“Jennison” or the “subadviser”). The Manager pays for the services of Jennison.
Fees payable under the management agreement are computed daily and paid monthly. For the reporting period ended November 30, 2024, the contractual and effective management fee rates were as follows:
| | | | |
| | | |
| Fund | | Management Fee | | Effective Management Fee, before any waiver and/or expense reimbursements |
| | |
Jennison Financial Services | | 0.75% to $1 billion of average daily net assets; 0.70% over $1 billion of average daily net assets. | | 0.75% |
| | |
Jennison Health Sciences | | 0.75% to $1 billion of average daily net assets; 0.70% over $1 billion of average daily net assets. | | 0.73 |
47
Notes to Financial Statements (continued)
| | | | |
| | | |
| Fund | | Management Fee | | Effective Management Fee, before any waiver and/or expense reimbursements |
| | |
Jennison Utility | | 0.60% to $250 million of average daily net assets; 0.50% on next $500 million of average daily net assets; 0.45% on next $750 million of average daily net assets; 0.40% on next $500 million of average daily net assets; 0.35% on next $2 billion of average daily net assets; 0.325% on next $2 billion of average daily net assets; 0.30% over $6 billion of average daily net assets. | | 0.43% |
The Manager has contractually agreed, through March 31, 2026, to limit transfer agency, shareholder servicing, sub-transfer agency, and blue sky fees, as applicable. This contractual expense limitation excludes interest, brokerage, taxes (such as income and foreign withholding taxes, stamp duty and deferred tax expenses), acquired fund fees and expenses, extraordinary expenses, and certain other Fund expenses such as dividend and interest expense and broker charges on short sales.
Where applicable, the Manager agrees to waive management fees or shared operating expenses on any share class to the same extent that it waives such expenses on any other share class. In addition, total annual fund operating expenses for Class R6 shares will not exceed total annual fund operating expenses for Class Z shares. Fees and/or expenses waived and/or reimbursed by the Manager for the purpose of preventing the expenses from exceeding a certain expense ratio limit may be recouped by the Manager within the same fiscal year during which such waiver and/or reimbursement is made if such recoupment can be realized without exceeding the expense limit in effect at the time of the waiver/reimbursement and/or recoupment for that fiscal year, as applicable. The expense limitations attributable to each class are as follows:
| | |
| | |
| Fund | | Class Expense Limitation |
| |
Jennison Financial Services - Class A | | —% |
| |
Jennison Financial Services - Class C | | — |
| |
Jennison Financial Services - Class R | | — |
| |
Jennison Financial Services - Class Z | | — |
| |
Jennison Financial Services - Class R6 | | 1.00 |
| |
Jennison Health Sciences - Class A | | — |
| |
Jennison Health Sciences - Class C | | — |
| |
Jennison Health Sciences - Class R | | — |
| |
Jennison Health Sciences - Class Z | | — |
48
| | | | |
| | |
| Fund | | Class Expense Limitation |
Jennison Health Sciences - Class R6 | | | 0.82 | % |
| |
Jennison Utility - Class A | | | — | |
| |
Jennison Utility - Class C | | | — | |
| |
Jennison Utility - Class R | | | — | |
| |
Jennison Utility - Class Z | | | — | |
Jennison Utility - Class R6 | | | 0.52 | |
The RIC, on behalf of each Fund, has a distribution agreement with Prudential Investment Management Services LLC (“PIMS”), which acts as the distributor of the Class A, Class C, Class R, Class Z and Class R6 shares of each Fund. Each Fund compensates PIMS for distributing and servicing each Fund’s Class A, Class C and Class R shares, pursuant to the plans of distribution (the “Distribution Plans”), regardless of expenses actually incurred by PIMS.
Pursuant to the Distribution Plans, each Fund compensates PIMS for distribution related activities at an annual rate based on average daily net assets per class. PIMS has contractually agreed through March 31, 2026 to limit such fees on certain classes based on daily net assets. The distribution fees are accrued daily and payable monthly.
Each Fund’s annual gross and net distribution rates, where applicable, are as follows:
| | | | | | | | |
| | | |
| Fund | | Gross Distribution Fee | | Net Distribution Fee |
Jennison Financial Services - Class A | | | 0.30 | % | | | 0.30 | % |
Jennison Financial Services - Class C | | | 1.00 | | | | 1.00 | |
Jennison Financial Services - Class R | | | 0.75 | | | | 0.50 | |
Jennison Financial Services - Class Z | | | N/A | | | | N/A | |
Jennison Financial Services - Class R6 | | | N/A | | | | N/A | |
Jennison Health Sciences - Class A | | | 0.30 | | | | 0.30 | |
Jennison Health Sciences - Class C | | | 1.00 | | | | 1.00 | |
Jennison Health Sciences - Class R | | | 0.75 | | | | 0.50 | |
Jennison Health Sciences - Class Z | | | N/A | | | | N/A | |
Jennison Health Sciences - Class R6 | | | N/A | | | | N/A | |
Jennison Utility - Class A | | | 0.30 | | | | 0.30 | |
Jennison Utility - Class C | | | 1.00 | | | | 1.00 | |
Jennison Utility - Class R | | | 0.75 | | | | 0.50 | |
Jennison Utility - Class Z | | | N/A | | | | N/A | |
Jennison Utility - Class R6 | | | N/A | | | | N/A | |
The RIC, on behalf of each Fund, has entered into brokerage commission recapture agreements with certain registered broker-dealers. Under the brokerage commission recapture program, a portion of the commission is returned to the Fund on whose behalf the trades were made. Commission recapture is paid solely to the Fund generating the applicable trades. Such amounts are included within realized gain (loss) on investment transactions presented in the Statement of Operations. For the reporting period ended November 30, 2024, brokerage commissions recaptured under these agreements was as
49
Notes to Financial Statements (continued)
follows:
| | | | |
| | |
| Fund | | Amount | |
Jennison Financial Services | | $ | 1,617 | |
Jennison Health Sciences | | | 35,718 | |
Jennison Utility | | | 22,588 | |
For the year ended November 30, 2024, PIMS received front-end sales charges (“FESL”) resulting from sales of certain class shares and contingent deferred sales charges (“CDSC”) imposed upon redemptions by certain shareholders. From these fees, PIMS paid such sales charges to broker-dealers, who in turn paid commissions to salespersons and incurred other distribution costs. The sales charges are as follows where applicable:
| | | | | | | | |
| | | |
| Fund | | FESL | | | CDSC | |
| | |
Jennison Financial Services - Class A | | $ | 81,506 | | | $ | — | |
Jennison Financial Services - Class C | | | — | | | | 408 | |
| | |
Jennison Health Sciences - Class A | | | 311,856 | | | | 260 | |
Jennison Health Sciences - Class C | | | — | | | | 2,265 | |
| | |
Jennison Utility - Class A | | | 712,442 | | | | 46 | |
Jennison Utility - Class C | | | — | | | | 1,506 | |
PGIM Investments, PIMS and Jennison are indirect, wholly-owned subsidiaries of Prudential Financial, Inc. (“Prudential”).
| 4. | Other Transactions with Affiliates |
Prudential Mutual Fund Services LLC (“PMFS”), an affiliate of PGIM Investments and an indirect, wholly-owned subsidiary of Prudential, serves as each Fund’s transfer agent and shareholder servicing agent. Transfer agent’s fees and expenses in the Statement of Operations include certain out-of-pocket expenses paid to non-affiliates, where applicable.
The Funds may invest their overnight sweep cash in the PGIM Core Government Money Market Fund (the “Core Government Fund”), a series of the Prudential Government Money Market Fund, Inc., and their securities lending cash collateral in the PGIM Institutional Money Market Fund (the “Money Market Fund”), a series of Prudential Investment Portfolios 2, each registered under the 1940 Act and managed by PGIM Investments. PGIM Investments and/or its affiliates are paid fees or reimbursed for providing their services to the Core Government Fund and the Money Market Fund. In addition to the realized and unrealized gains on investments in the Core Government Fund and the Money Market Fund, earnings from such investments are disclosed on the Statement of Operations as “Affiliated dividend income” and “Affiliated income from securities lending, net”, respectively.
The Funds may enter into certain securities purchase or sale transactions under Board approved Rule 17a-7 procedures. Rule 17a-7 is an exemptive rule under the 1940 Act that,
50
subject to certain conditions, permits purchase and sale transactions among affiliated investment companies, or between an investment company and a person that is affiliated solely by reason of having a common (or affiliated) investment adviser, common directors/trustees, and/or common officers. For the year ended November 30, 2024, no Rule 17a-7 transactions were entered into by the Funds.
The aggregate cost of purchases and proceeds from sales of portfolio securities (excluding short-term investments and U.S. Government securities) for the year ended November 30, 2024, were as follows:
| | | | | | | | |
| | | |
| Fund | | Cost of Purchases | | | Proceeds from Sales | |
Jennison Financial Services | | $ | 34,457,467 | | | $ | 39,224,218 | |
Jennison Health Sciences | | | 1,352,365,162 | | | | 1,494,994,465 | |
Jennison Utility | | | 1,404,768,739 | | | | 1,758,416,929 | |
A summary of the cost of purchases and proceeds from sales of shares of affiliated mutual funds for the year ended November 30, 2024, is presented as follows:
Jennison Financial Services
| | | | | | | | | | | | | | | | | | | | | | |
| | | | | | | | |
Value, Beginning of Year | | Cost of
Purchases | | Proceeds from Sales | | Change in Unrealized Gain (Loss) | | Realized Gain
(Loss) | | | Value, End of Year | | | Shares, End of Year | | | Income | |
| | | | |
Short-Term Investments - Affiliated Mutual Funds: | | | | | | | | | | | | | | | | |
| |
PGIM Core Government Money Market Fund (7-day effective yield 4.753%)(1)(wb) | | | | | |
| $1,299,911 | | $30,617,127 | | $30,730,511 | | $ — | | | $ — | | | | $1,186,527 | | | | 1,186,527 | | | | $43,267 | |
| |
PGIM Institutional Money Market Fund (7-day effective yield 4.848%)(1)(b)(wb) | | | | | |
| 6,603,853 | | 2,490,735 | | 9,095,178 | | (656) | | | 1,246 | | | | — | | | | — | | | | 236 | (2) |
| $7,903,764 | | $33,107,862 | | $39,825,689 | | $(656) | | | $1,246 | | | | $1,186,527 | | | | | | | | $43,503 | |
Jennison Health Sciences
| | | | | | | | | | | | | | | | | | | | | | | | | | | | |
| | | | | | | | |
Value, Beginning of Year | | Cost of Purchases | | | Proceeds from Sales | | | Change in Unrealized Gain (Loss) | | | Realized Gain (Loss) | | | Value, End of Year | | | Shares, End of Year | | | Income | |
| | | | |
Short-Term Investments - Affiliated Mutual Funds: | | | | | | | | | | | | | | | | | |
| |
PGIM Core Government Money Market Fund (7-day effective yield 4.753%)(1)(wb) | | | | | |
| $85,531,293 | | | $1,057,053,787 | | | | $1,102,278,504 | | | | $ — | | | | $ — | | | | $40,306,576 | | | | 40,306,576 | | | | $2,786,201 | |
| |
PGIM Institutional Money Market Fund (7-day effective yield 4.848%)(1)(b)(wb) | | | | | |
| 12,611,382 | | | 477,597,775 | | | | 452,635,077 | | | | (27,883 | ) | | | 19,043 | | | | 37,565,240 | | | | 37,587,792 | | | | 494,777 | (2) |
| $98,142,675 | | | $1,534,651,562 | | | | $1,554,913,581 | | | | $(27,883 | ) | | | $19,043 | | | | $77,871,816 | | | | | | | | $3,280,978 | |
51
Notes to Financial Statements (continued)
Jennison Utility
| | | | | | | | | | | | | | | | | | | | | | |
| | | | | | | | |
Value, Beginning of Year | | | Cost of Purchases | | Proceeds from Sales | | Change in Unrealized Gain (Loss) | | Realized Gain
(Loss) | | Value, End of Year | | | Shares, End of Year | | | Income | |
| | | |
| | Short-Term Investments - Affiliated Mutual Funds: | | | | | | | | | | | | |
|
| | PGIM Core Government Money Market Fund (7-day effective yield 4.753%)(1)(wb) | |
| | $13,936,425 | | | $1,035,722,407 | | $1,011,699,929 | | $— | | $ — | | | $37,958,903 | | | | 37,958,903 | | | | $1,271,385 | |
|
| | PGIM Institutional Money Market Fund (7-day effective yield 4.848%)(1)(b)(wb) | |
| | 54,525 | | | 233,713,465 | | 210,765,019 | | — | | 11,097 | | | 23,014,068 | | | | 23,027,885 | | | | 15,510 | (2) |
| | $13,990,950 | | | $1,269,435,872 | | $1,222,464,948 | | $— | | $11,097 | | | $60,972,971 | | | | | | | | $1,286,895 | |
| (1) | The Fund did not have any capital gain distributions during the reporting period. |
| (2) | The amount, or a portion thereof, represents the affiliated securities lending income shown on the Statement of Operations. |
| (b) | Represents security, or portion thereof, purchased with cash collateral received for securities on loan and includes dividend reinvestment. |
| (wb) | Represents an investment in a Fund affiliated with the Manager. |
| 6. | Distributions and Tax Information |
Distributions to shareholders, which are determined in accordance with federal income tax regulations and which may differ from GAAP, are recorded on the ex-date. In order to present total distributable earnings (loss) and paid-in capital in excess of par on the Statement of Assets and Liabilities that more closely represent their tax character, certain adjustments have been made to total distributable earnings (loss) and paid-in capital in excess of par for the Funds indicated below.
For the year ended November 30, 2024, the adjustments were as follows:
| | | | | | | | |
| | | |
| Fund | | Total Distributable Earnings (Loss) | | Paid-in Capital in Excess of Par |
Jennison Financial Services | | | $ — | | | | $ — | |
Jennison Health Sciences (a) | | | (5,006,113 | ) | | | 5,006,113 | |
Jennison Utility (b) | | | 6,621 | | | | (6,621 | ) |
| (b) | Non deductible expense. |
For the year ended November 30, 2024, the tax character of dividends paid as reflected in the Statement of Changes in Net Assets were as follows:
| | | | | | | | |
| | | | | |
| Fund | | Ordinary Income | | Long-Term Capital Gains | | Tax Return of Capital | | Total Dividends and Distributions |
Jennison Financial Services | | $ 1,184,094 | | $ 6,660,393 | | $— | | $ 7,844,487 |
52
| | | | | | | | |
| | | | | |
| Fund | | Ordinary Income | | Long-Term Capital Gains | | Tax Return of Capital | | Total Dividends and Distributions |
Jennison Health Sciences | | $ — | | $ 74,817,816 | | $— | | $ 74,817,816 |
Jennison Utility | | 50,376,864 | | 207,477,252 | | — | | 257,854,116 |
For the year ended November 30, 2023, the tax character of dividends paid as reflected in the Statement of Changes in Net Assets were as follows:
| | | | | | | | | | |
| | | | | |
| Fund | | Ordinary Income | | Long-Term Capital Gains | | | Tax Return of Capital | | Total Dividends and Distributions |
Jennison Financial Services | | $ 163,025 | | | $ 3,353,375 | | | $— | | $ 3,516,400 |
Jennison Health Sciences | | — | | | 26,809,735 | | | — | | 26,809,735 |
Jennison Utility | | 52,438,098 | | | 226,154,667 | | | — | | 278,592,765 |
For the year ended November 30, 2024, the Funds indicated below had the following amounts of accumulated undistributed earnings on a tax basis:
| | | | |
| | | |
| Fund | | Undistributed Ordinary Income | | Undistributed Long-Term Capital Gains |
Jennison Financial Services | | $ 1,625,569 | | $ 10,038,381 |
Jennison Health Sciences | | 49,199,083 | | 151,314,723 |
Jennison Utility | | 23,045,749 | | 246,925,299 |
The United States federal income tax basis of the Funds’ investments and the net unrealized appreciation as of November 30, 2024 were as follows:
| | | | | | | | |
| | | | | |
| Fund | | Tax Basis | | Gross Unrealized Appreciation | | Gross Unrealized Depreciation | | Net Unrealized Appreciation |
Jennison Financial Services | | $ 90,415,259 | | $ 90,821,104 | | $ (1,188,903) | | $ 89,632,201 |
Jennison Health Sciences | | 1,165,296,009 | | 706,639,261 | | (64,957,257) | | 641,682,004 |
Jennison Utility | | 2,131,810,078 | | 1,438,143,106 | | (33,559,267) | | 1,404,583,839 |
The difference between GAAP and tax basis were primarily attributable to deferred losses on wash sales and investments in passive foreign investment companies.
The Manager has analyzed the Funds’ tax positions taken on federal, state and local income tax returns for all open tax years and has concluded that no provision for income tax is required in the Funds’ financial statements for the current reporting period. Since tax authorities can examine previously filed tax returns, the Funds’ U.S. federal and state tax returns for each of the four fiscal years up to the most recent fiscal year ended November 30, 2024 are subject to such review.
Each Fund offers Class A, Class C, Class R, Class Z and Class R6 shares. Class A shares are sold with a maximum front-end sales charge of 5.50%. Investors who purchase $1 million or more of Class A shares and sell these shares within 12 months of purchase are subject to a
53
Notes to Financial Statements (continued)
CDSC of 1%, although they are not subject to an initial sales charge. The Class A CDSC is waived for certain retirement and/or benefit plans. A special exchange privilege is also available for shareholders who qualified to purchase Class A shares at net asset value. Class C shares are sold with a CDSC of 1% on sales made within 12 months of purchase. Class C shares will automatically convert to Class A shares on a monthly basis approximately eight years (ten years prior to January 22, 2021) after purchase. Class R, Class Z and Class R6 shares are not subject to any sales or redemption charges and are available exclusively for sale to a limited group of investors.
Under certain circumstances, an exchange may be made from specified share classes of each Fund to one or more other share classes of each Fund as presented in the table of transactions in shares of beneficial interest, below.
The RIC is authorized to issue 2,000,000,000 shares of common stock, $0.01 par value per share. The authorized shares of each Fund are currently classified and designated as follows:
| | | | |
| | |
| Fund | | Number of Shares |
Jennison Financial Services - Class A | | | 50,000,000 | |
Jennison Financial Services - Class B | | | 5,000,000 | |
Jennison Financial Services - Class C | | | 40,000,000 | |
Jennison Financial Services - Class R | | | 75,000,000 | |
Jennison Financial Services - Class Z | | | 90,000,000 | |
Jennison Financial Services - Class T | | | 50,000,000 | |
Jennison Financial Services - Class R6 | | | 90,000,000 | |
Jennison Health Sciences - Class A | | | 75,000,000 | |
Jennison Health Sciences - Class B | | | 10,000,000 | |
Jennison Health Sciences - Class C | | | 30,000,000 | |
Jennison Health Sciences - Class R | | | 50,000,000 | |
Jennison Health Sciences - Class Z | | | 150,000,000 | |
Jennison Health Sciences - Class T | | | 70,000,000 | |
Jennison Health Sciences - Class R6 | | | 130,000,000 | |
Jennison Utility - Class A | | | 500,000,000 | |
Jennison Utility - Class B | | | 10,000,000 | |
Jennison Utility - Class C | | | 75,000,000 | |
Jennison Utility - Class R | | | 75,000,000 | |
Jennison Utility - Class Z | | | 100,000,000 | |
Jennison Utility - Class T | | | 250,000,000 | |
Jennison Utility - Class R6 | | | 75,000,000 | |
The Funds currently do not have any Class B or Class T shares outstanding.
As of November 30, 2024, Prudential, through its affiliated entities, including affiliated funds
54
(if applicable), owned shares of each Fund as follows:
| | | | | | | | |
| | | |
| Fund | | Number of Shares | | | Percentage of Outstanding Shares | |
Jennison Financial Services–Class R6 | | | 778 | | | | 1.3% | |
Jennison Health Sciences–Class Z | | | 19,651 | | | | 0.1 | |
Jennison Utility–Class A | | | 481 | | | | 0.1 | |
Jennison Utility–Class Z | | | 35,299 | | | | 0.2 | |
At the reporting period end, the number of shareholders holding greater than 5% of the Funds are as follows:
| | | | | | | | |
| | | |
| Fund | | Number of Shareholders | | | Percentage of Outstanding Shares | |
Affiliated: | | | | | | | | |
Jennison Financial Services | | | — | | | | —% | |
Jennison Health Sciences | | | — | | | | — | |
Jennison Utility | | | — | | | | — | |
Unaffiliated: | | | | | | | | |
Jennison Financial Services | | | 5 | | | | 61.9 | |
Jennison Health Sciences | | | 7 | | | | 64.7 | |
Jennison Utility | | | 3 | | | | 26.9 | |
Transactions in shares of common stock were as follows:
Jennison Financial Services
| | | | | | | | |
| | | |
Share Class | | Shares | | | Amount | |
| | |
Class A | | | | | | | | |
Year ended November 30, 2024: | | | | | | | | |
Shares sold | | | 216,431 | | | $ | 4,597,098 | |
Shares issued in reinvestment of dividends and distributions | | | 272,738 | | | | 4,966,568 | |
Shares purchased | | | (743,359 | ) | | | (15,465,298 | ) |
Net increase (decrease) in shares outstanding before conversion | | | (254,190 | ) | | | (5,901,632 | ) |
Shares issued upon conversion from other share class(es) | | | 68,842 | | | | 1,459,109 | |
Shares purchased upon conversion into other share class(es) | | | (31,728 | ) | | | (698,244 | ) |
Net increase (decrease) in shares outstanding | | | (217,076 | ) | | $ | (5,140,767 | ) |
| | |
Year ended November 30, 2023: | | | | | | | | |
Shares sold | | | 176,948 | | | $ | 2,997,941 | |
Shares issued in reinvestment of dividends and distributions | | | 131,480 | | | | 2,129,983 | |
Shares purchased | | | (826,181 | ) | | | (14,027,521 | ) |
Net increase (decrease) in shares outstanding before conversion | | | (517,753 | ) | | | (8,899,597 | ) |
Shares issued upon conversion from other share class(es) | | | 60,238 | | | | 1,029,274 | |
Shares purchased upon conversion into other share class(es) | | | (33,169 | ) | | | (569,558 | ) |
Net increase (decrease) in shares outstanding | | | (490,684 | ) | | $ | (8,439,881 | ) |
55
Notes to Financial Statements (continued)
| | | | | | | | |
| | | |
Share Class | | Shares | | | Amount | |
| | |
Class C | | | | | | | | |
Year ended November 30, 2024: | | | | | | | | |
Shares sold | | | 46,261 | | | $ | 801,264 | |
Shares issued in reinvestment of dividends and distributions | | | 28,333 | | | | 438,885 | |
Shares purchased | | | (63,808 | ) | | | (1,117,383 | ) |
Net increase (decrease) in shares outstanding before conversion | | | 10,786 | | | | 122,766 | |
Shares purchased upon conversion into other share class(es) | | | (92,297 | ) | | | (1,644,620 | ) |
Net increase (decrease) in shares outstanding | | | (81,511 | ) | | $ | (1,521,854 | ) |
| | |
Year ended November 30, 2023: | | | | | | | | |
Shares sold | | | 65,725 | | | $ | 962,421 | |
Shares issued in reinvestment of dividends and distributions | | | 17,358 | | | | 242,137 | |
Shares purchased | | | (151,344 | ) | | | (2,195,211 | ) |
Net increase (decrease) in shares outstanding before conversion | | | (68,261 | ) | | | (990,653 | ) |
Shares purchased upon conversion into other share class(es) | | | (80,104 | ) | | | (1,172,484 | ) |
Net increase (decrease) in shares outstanding | | | (148,365 | ) | | $ | (2,163,137 | ) |
| | |
Class R | | | | | | | | |
Year ended November 30, 2024: | | | | | | | | |
Shares sold | | | 47,634 | | | $ | 1,016,871 | |
Shares issued in reinvestment of dividends and distributions | | | 23,538 | | | | 426,744 | |
Shares purchased | | | (103,901 | ) | | | (2,142,338 | ) |
Net increase (decrease) in shares outstanding | | | (32,729 | ) | | $ | (698,723 | ) |
| | |
Year ended November 30, 2023: | | | | | | | | |
Shares sold | | | 23,433 | | | $ | 392,407 | |
Shares issued in reinvestment of dividends and distributions | | | 13,167 | | | | 212,509 | |
Shares purchased | | | (134,765 | ) | | | (2,266,571 | ) |
Net increase (decrease) in shares outstanding | | | (98,165 | ) | | $ | (1,661,655 | ) |
| | |
Class Z | | | | | | | | |
Year ended November 30, 2024: | | | | | | | | |
Shares sold | | | 722,451 | | | $ | 16,413,940 | |
Shares issued in reinvestment of dividends and distributions | | | 93,083 | | | | 1,762,059 | |
Shares purchased | | | (461,998 | ) | | | (10,033,808 | ) |
Net increase (decrease) in shares outstanding before conversion | | | 353,536 | | | | 8,142,191 | |
Shares issued upon conversion from other share class(es) | | | 46,430 | | | | 1,045,147 | |
Shares purchased upon conversion into other share class(es) | | | (6,869 | ) | | | (168,776 | ) |
Net increase (decrease) in shares outstanding | | | 393,097 | | | $ | 9,018,562 | |
56
| | | | | | | | |
| | | |
Share Class | | Shares | | | Amount | |
| | |
Year ended November 30, 2023: | | | | | | | | |
Shares sold | | | 325,836 | | | $ | 5,875,901 | |
Shares issued in reinvestment of dividends and distributions | | | 43,508 | | | | 730,941 | |
Shares purchased | | | (463,183 | ) | | | (8,071,964 | ) |
Net increase (decrease) in shares outstanding before conversion | | | (93,839 | ) | | | (1,465,122 | ) |
Shares issued upon conversion from other share class(es) | | | 40,691 | | | | 722,047 | |
Shares purchased upon conversion into other share class(es) | | | (1,164 | ) | | | (20,153 | ) |
Net increase (decrease) in shares outstanding | | | (54,312 | ) | | $ | (763,228 | ) |
| | |
Class R6 | | | | | | | | |
Year ended November 30, 2024: | | | | | | | | |
Shares sold | | | 35,365 | | | $ | 857,776 | |
Shares issued in reinvestment of dividends and distributions | | | 3,196 | | | | 60,566 | |
Shares purchased | | | (28,269 | ) | | | (649,558 | ) |
Net increase (decrease) in shares outstanding before conversion | | | 10,292 | | | | 268,784 | |
Shares issued upon conversion from other share class(es) | | | 2,858 | | | | 68,885 | |
Shares purchased upon conversion into other share class(es) | | | (2,859 | ) | | | (61,501 | ) |
Net increase (decrease) in shares outstanding | | | 10,291 | | | $ | 276,168 | |
| | |
Year ended November 30, 2023: | | | | | | | | |
Shares sold | | | 9,011 | | | $ | 161,822 | |
Shares issued in reinvestment of dividends and distributions | | | 7,172 | | | | 120,487 | |
Shares purchased | | | (253,410 | ) | | | (4,590,027 | ) |
Net increase (decrease) in shares outstanding before conversion | | | (237,227 | ) | | | (4,307,718 | ) |
Shares issued upon conversion from other share class(es) | | | 606 | | | | 10,874 | |
Net increase (decrease) in shares outstanding | | | (236,621 | ) | | $ | (4,296,844 | ) |
| | |
Jennison Health Sciences | | | | | | | | |
| | | |
Share Class | | Shares | | | Amount | |
| | |
Class A | | | | | | | | |
Year ended November 30, 2024: | | | | | | | | |
Shares sold | | | 591,450 | | | $ | 23,339,211 | |
Shares issued in reinvestment of dividends and distributions | | | 979,653 | | | | 33,827,434 | |
Shares purchased | | | (3,070,559 | ) | | | (122,125,605 | ) |
Net increase (decrease) in shares outstanding before conversion | | | (1,499,456 | ) | | | (64,958,960 | ) |
Shares issued upon conversion from other share class(es) | | | 150,939 | | | | 6,126,447 | |
Shares purchased upon conversion into other share class(es) | | | (200,387 | ) | | | (8,054,352 | ) |
Net increase (decrease) in shares outstanding | | | (1,548,904 | ) | | $ | (66,886,865 | ) |
57
Notes to Financial Statements (continued)
| | | | | | | | |
Share Class | | Shares | | | Amount | |
| | |
Year ended November 30, 2023: | | | | | | | | |
Shares sold | | | 895,368 | | | $ | 31,645,853 | |
Shares issued in reinvestment of dividends and distributions | | | 362,014 | | | | 12,084,042 | |
Shares purchased | | | (3,006,064 | ) | | | (104,556,655 | ) |
Net increase (decrease) in shares outstanding before conversion | | | (1,748,682 | ) | | | (60,826,760 | ) |
Shares issued upon conversion from other share class(es) | | | 166,277 | | | | 5,754,225 | |
Shares purchased upon conversion into other share class(es) | | | (353,838 | ) | | | (12,474,182 | ) |
Net increase (decrease) in shares outstanding | | | (1,936,243 | ) | | $ | (67,546,717 | ) |
| | |
Class C | | | | | | | | |
Year ended November 30, 2024: | | | | | | | | |
Shares sold | | | 319,818 | | | $ | 5,823,363 | |
Shares issued in reinvestment of dividends and distributions | | | 102,026 | | | | 1,605,886 | |
Shares purchased | | | (225,400 | ) | | | (4,050,827 | ) |
Net increase (decrease) in shares outstanding before conversion | | | 196,444 | | | | 3,378,422 | |
Shares purchased upon conversion into other share class(es) | | | (120,460 | ) | | | (2,193,314 | ) |
Net increase (decrease) in shares outstanding | | | 75,984 | | | $ | 1,185,108 | |
| | |
Year ended November 30, 2023: | | | | | | | | |
Shares sold | | | 121,740 | | | $ | 2,071,815 | |
Shares issued in reinvestment of dividends and distributions | | | 36,693 | | | | 598,466 | |
Shares purchased | | | (150,176 | ) | | | (2,544,483 | ) |
Net increase (decrease) in shares outstanding before conversion | | | 8,257 | | | | 125,798 | |
Shares purchased upon conversion into other share class(es) | | | (127,088 | ) | | | (2,148,554 | ) |
Net increase (decrease) in shares outstanding | | | (118,831 | ) | | $ | (2,022,756 | ) |
| | |
Class R | | | | | | | | |
Year ended November 30, 2024: | | | | | | | | |
Shares sold | | | 37,049 | | | $ | 1,367,776 | |
Shares issued in reinvestment of dividends and distributions | | | 11,646 | | | | 375,455 | |
Shares purchased | | | (73,059 | ) | | | (2,708,684 | ) |
Net increase (decrease) in shares outstanding | | | (24,364 | ) | | $ | (965,453 | ) |
| | |
Year ended November 30, 2023: | | | | | | | | |
Shares sold | | | 26,271 | | | $ | 864,089 | |
Shares issued in reinvestment of dividends and distributions | | | 4,334 | | | | 135,986 | |
Shares purchased | | | (51,654 | ) | | | (1,707,653 | ) |
Net increase (decrease) in shares outstanding | | | (21,049 | ) | | $ | (707,578 | ) |
58
| | | | | | | | |
| | | |
| Share Class | | Shares | | | Amount | |
| | |
Class Z | | | | | | | | |
Year ended November 30, 2024: | | | | | | | | |
Shares sold | | | 4,281,626 | | | $ | 212,140,150 | |
Shares issued in reinvestment of dividends and distributions | | | 687,067 | | | | 29,475,158 | |
Shares purchased | | | (4,000,923 | ) | | | (197,460,745 | ) |
Net increase (decrease) in shares outstanding before conversion | | | 967,770 | | | | 44,154,563 | |
Shares issued upon conversion from other share class(es) | | | 441,034 | | | | 22,310,200 | |
Shares purchased upon conversion into other share class(es) | | | (217,522 | ) | | | (11,348,679 | ) |
Net increase (decrease) in shares outstanding | | | 1,191,282 | | | $ | 55,116,084 | |
| | |
Year ended November 30, 2023: | | | | | | | | |
Shares sold | | | 2,241,606 | | | $ | 95,830,532 | |
Shares issued in reinvestment of dividends and distributions | | | 260,698 | | | | 10,670,366 | |
Shares purchased | | | (4,963,298 | ) | | | (211,691,074 | ) |
Net increase (decrease) in shares outstanding before conversion | | | (2,460,994 | ) | | | (105,190,176 | ) |
Shares issued upon conversion from other share class(es) | | | 294,920 | | | | 12,760,389 | |
Shares purchased upon conversion into other share class(es) | | | (173,798 | ) | | | (7,465,056 | ) |
Net increase (decrease) in shares outstanding | | | (2,339,872 | ) | | $ | (99,894,843 | ) |
| | |
Class R6 | | | | | | | | |
Year ended November 30, 2024: | | | | | | | | |
Shares sold | | | 275,363 | | | $ | 13,822,642 | |
Shares issued in reinvestment of dividends and distributions | | | 82,730 | | | | 3,581,380 | |
Shares purchased | | | (1,395,820 | ) | | | (70,556,220 | ) |
Net increase (decrease) in shares outstanding before conversion | | | (1,037,727 | ) | | | (53,152,198 | ) |
Shares issued upon conversion from other share class(es) | | | 121,608 | | | | 6,540,942 | |
Shares purchased upon conversion into other share class(es) | | | (259,341 | ) | | | (13,381,244 | ) |
Net increase (decrease) in shares outstanding | | | (1,175,460 | ) | | $ | (59,992,500 | ) |
| | |
Year ended November 30, 2023: | | | | | | | | |
Shares sold | | | 448,217 | | | $ | 19,217,003 | |
Shares issued in reinvestment of dividends and distributions | | | 29,430 | | | | 1,213,691 | |
Shares purchased | | | (715,070 | ) | | | (30,525,931 | ) |
Net increase (decrease) in shares outstanding before conversion | | | (237,423 | ) | | | (10,095,237 | ) |
Shares issued upon conversion from other share class(es) | | | 81,453 | | | | 3,573,178 | |
Net increase (decrease) in shares outstanding | | | (155,970 | ) | | $ | (6,522,059 | ) |
59
Notes to Financial Statements (continued)
Jennison Utility
| | | | | | | | |
| | | |
| Share Class | | Shares | | | Amount | |
| | |
Class A | | | | | | | | |
Year ended November 30, 2024: | | | | | | | | |
Shares sold | | | 2,962,955 | | | $ | 43,557,810 | |
Shares issued in reinvestment of dividends and distributions | | | 16,028,857 | | | | 210,374,419 | |
Shares purchased | | | (25,979,282 | ) | | | (366,101,291 | ) |
Net increase (decrease) in shares outstanding before conversion | | | (6,987,470 | ) | | | (112,169,062 | ) |
Shares issued upon conversion from other share class(es) | | | 374,350 | | | | 5,388,648 | |
Shares purchased upon conversion into other share class(es) | | | (1,030,157 | ) | | | (14,943,479 | ) |
Net increase (decrease) in shares outstanding | | | (7,643,277 | ) | | $ | (121,723,893 | ) |
| | |
Year ended November 30, 2023: | | | | | | | | |
Shares sold | | | 3,109,600 | | | $ | 44,383,720 | |
Shares issued in reinvestment of dividends and distributions | | | 14,985,692 | | | | 219,957,507 | |
Shares purchased | | | (22,662,280 | ) | | | (320,420,299 | ) |
Net increase (decrease) in shares outstanding before conversion | | | (4,566,988 | ) | | | (56,079,072 | ) |
Shares issued upon conversion from other share class(es) | | | 627,334 | | | | 9,078,985 | |
Shares purchased upon conversion into other share class(es) | | | (1,115,880 | ) | | | (15,991,010 | ) |
Net increase (decrease) in shares outstanding | | | (5,055,534 | ) | | $ | (62,991,097 | ) |
| | |
Class C | | | | | | | | |
Year ended November 30, 2024: | | | | | | | | |
Shares sold | | | 379,156 | | | $ | 5,540,644 | |
Shares issued in reinvestment of dividends and distributions | | | 260,032 | | | | 3,362,774 | |
Shares purchased | | | (642,631 | ) | | | (8,977,763 | ) |
Net increase (decrease) in shares outstanding before conversion | | | (3,443 | ) | | | (74,345 | ) |
Shares purchased upon conversion into other share class(es) | | | (285,029 | ) | | | (4,047,710 | ) |
Net increase (decrease) in shares outstanding | | | (288,472 | ) | | $ | (4,122,055 | ) |
| | |
Year ended November 30, 2023: | | | | | | | | |
Shares sold | | | 510,594 | | | $ | 7,284,567 | |
Shares issued in reinvestment of dividends and distributions | | | 269,027 | | | | 3,931,675 | |
Shares purchased | | | (739,196 | ) | | | (10,331,751 | ) |
Net increase (decrease) in shares outstanding before conversion | | | 40,425 | | | | 884,491 | |
Shares purchased upon conversion into other share class(es) | | | (613,411 | ) | | | (8,810,913 | ) |
Net increase (decrease) in shares outstanding | | | (572,986 | ) | | $ | (7,926,422 | ) |
60
| | | | | | | | |
| | | |
| Share Class | | Shares | | | Amount | |
| | |
Class R | | | | | | | | |
Year ended November 30, 2024: | | | | | | | | |
Shares sold | | | 375,192 | | | $ | 5,567,025 | |
Shares issued in reinvestment of dividends and distributions | | | 504,313 | | | | 6,597,565 | |
Shares purchased | | | (1,218,751 | ) | | | (17,118,933 | ) |
Net increase (decrease) in shares outstanding | | | (339,246 | ) | | $ | (4,954,343 | ) |
| | |
Year ended November 30, 2023: | | | | | | | | |
Shares sold | | | 393,844 | | | $ | 5,636,621 | |
Shares issued in reinvestment of dividends and distributions | | | 498,726 | | | | 7,321,462 | |
Shares purchased | | | (1,357,454 | ) | | | (19,017,168 | ) |
Net increase (decrease) in shares outstanding | | | (464,884 | ) | | $ | (6,059,085 | ) |
| | |
Class Z | | | | | | | | |
Year ended November 30, 2024: | | | | | | | | |
Shares sold | | | 7,174,533 | | | $ | 104,473,464 | |
Shares issued in reinvestment of dividends and distributions | | | 2,012,070 | | | | 26,587,794 | |
Shares purchased | | | (10,504,564 | ) | | | (149,119,504 | ) |
Net increase (decrease) in shares outstanding before conversion | | | (1,317,961 | ) | | | (18,058,246 | ) |
Shares issued upon conversion from other share class(es) | | | 1,054,722 | | | | 15,489,430 | |
Shares purchased upon conversion into other share class(es) | | | (444,780 | ) | | | (6,878,987 | ) |
Net increase (decrease) in shares outstanding | | | (708,019 | ) | | $ | (9,447,803 | ) |
| | |
Year ended November 30, 2023: | | | | | | | | |
Shares sold | | | 5,906,271 | | | $ | 84,516,200 | |
Shares issued in reinvestment of dividends and distributions | | | 2,358,732 | | | | 34,753,821 | |
Shares purchased | | | (15,425,975 | ) | | | (220,039,673 | ) |
Net increase (decrease) in shares outstanding before conversion | | | (7,160,972 | ) | | | (100,769,652 | ) |
Shares issued upon conversion from other share class(es) | | | 1,094,365 | | | | 15,781,850 | |
Shares purchased upon conversion into other share class(es) | | | (170,797 | ) | | | (2,420,358 | ) |
Net increase (decrease) in shares outstanding | | | (6,237,404 | ) | | $ | (87,408,160 | ) |
| | |
Class R6 | | | | | | | | |
Year ended November 30, 2024: | | | | | | | | |
Shares sold | | | 1,161,040 | | | $ | 16,788,305 | |
Shares issued in reinvestment of dividends and distributions | | | 206,519 | | | | 2,735,151 | |
Shares purchased | | | (1,342,746 | ) | | | (20,260,007 | ) |
Net increase (decrease) in shares outstanding before conversion | | | 24,813 | | | | (736,551 | ) |
Shares issued upon conversion from other share class(es) | | | 361,601 | | | | 5,653,922 | |
Shares purchased upon conversion into other share class(es) | | | (37,518 | ) | | | (661,824 | ) |
Net increase (decrease) in shares outstanding | | | 348,896 | | | $ | 4,255,547 | |
61
Notes to Financial Statements (continued)
| | | | | | | | |
| | | |
| Share Class | | Shares | | | Amount | |
| | |
Year ended November 30, 2023: | | | | | | | | |
Shares sold | | | 1,278,415 | | | $ | 18,246,373 | |
Shares issued in reinvestment of dividends and distributions | | | 237,138 | | | | 3,494,055 | |
Shares purchased | | | (2,767,089 | ) | | | (40,271,238 | ) |
Net increase (decrease) in shares outstanding before conversion | | | (1,251,536 | ) | | | (18,530,810 | ) |
Shares issued upon conversion from other share class(es) | | | 168,839 | | | | 2,361,446 | |
Net increase (decrease) in shares outstanding | | | (1,082,697 | ) | | $ | (16,169,364 | ) |
The RIC, on behalf of each Fund, along with other affiliated registered investment companies (the “Participating Funds”), is a party to a Syndicated Credit Agreement (“SCA”) with a group of banks. The purpose of the SCA is to provide an alternative source of temporary funding for capital share redemptions. The table below provides details of the current SCA in effect at the reporting period-end as well as the prior SCA.
| | | | | | |
| | | | |
| | | Current SCA | | | | Prior SCA |
Term of Commitment | | 9/27/2024 – 9/25/2025 | | | | 9/29/2023 – 9/26/2024 |
Total Commitment | | $1,200,000,000 | | | | $1,200,000,000 |
Annualized Commitment Fee on the Unused Portion of the SCA | | 0.15% | | | | 0.15% |
Annualized Interest Rate on Borrowings | | 1.00% plus the higher of (1) the effective federal funds rate, (2) the daily SOFR rate plus 0.10% or (3) zero percent | | | | 1.00% plus the higher of (1) the effective federal funds rate, (2) the daily SOFR rate plus 0.10% or (3) zero percent |
Certain affiliated registered investment companies that are parties to the SCA include portfolios that are subject to a predetermined mathematical formula used to manage certain benefit guarantees offered under variable annuity contracts. The formula may result in large scale asset flows into and out of these portfolios. Consequently, these portfolios may be more likely to utilize the SCA for purposes of funding redemptions. It may be possible for those portfolios to fully exhaust the committed amount of the SCA, thereby requiring the Manager to allocate available funding per a Board-approved methodology designed to treat the Participating Funds in the SCA equitably.
Each Fund indicated below utilized the SCA during the year ended November 30, 2024. The average balance outstanding is for the number of days each Fund utilized the credit
62
facility.
| | | | | | | | | | | | | | | | |
| | | | | | |
| Fund | | Average Balance Outstanding | | Weighted Average Interest Rates | | Number of Days Outstanding | | Maximum Balance Outstanding | | Balance Outstanding at November 30, 2024 |
Jennison Financial Services | | $ | 1,271,857 | | | | 6.42 | % | | 7 | | $ | 3,032,000 | | | $— |
Jennison Health Sciences | | | 2,089,000 | | | | 5.67 | | | 3 | | | 2,089,000 | | | — |
Jennison Utility | | | 1,709,250 | | | | 6.43 | | | 4 | | | 2,835,000 | | | — |
| 9. | Risks of Investing in the Funds |
Each Fund’s principal risks include, but are not limited to, some or all of the risks discussed below. For further information on the risks applicable to any given Fund, please refer to the Prospectus and Statement of Additional Information of that Fund.
| | | | | | |
| | | | |
| Risks | | Jennison
Financial
Services | | Jennison
Health
Sciences | | Jennison
Utility |
Credit | | – | | – | | X |
Currency | | X | | X | | X |
Economic and Market Events | | X | | X | | X |
Equity and Equity-Related Securities | | X | | X | | X |
Financial Services Related Companies | | X | | – | | – |
Foreign Securities | | X | | X | | X |
Geographic Concentration | | – | | – | | X |
Growth Style | | – | | X | | – |
Health Sciences Sector | | – | | X | | – |
Increase in Expenses | | X | | X | | X |
Initial Public Offerings | | X | | X | | X |
Large Shareholder and Large Scale Redemption | | X | | X | | X |
Management | | X | | X | | X |
Market Capitalization | | – | | X | | X |
Market Disruption and Geopolitical | | X | | X | | X |
Market | | X | | X | | X |
Non-Diversified Investment Company | | X | | – | | X |
Utility Sector | | – | | – | | X |
Credit Risk: This is the risk that the issuer, the guarantor, or the insurer of a fixed income security, or the counterparty to a contract may be unable or unwilling to make timely principal and interest payments or to otherwise honor its obligations. Additionally, fixed income securities could lose value due to a loss of confidence in the ability of the issuer, guarantor, insurer, or counterparty to pay back debt. The lower the credit quality of a bond, the more sensitive it is to credit risk.
63
Notes to Financial Statements (continued)
Currency Risk: The Fund’s net asset value could decline as a result of changes in exchange rates, which could adversely affect the Fund’s investments in currencies, or in securities that trade in, and receive revenues related to, currencies, or in derivatives that provide exposure to currencies. Certain foreign countries may impose restrictions on the ability of issuers of foreign securities to make payment of principal and interest or dividends to investors located outside the country, due to blockage of foreign currency exchanges or otherwise.
Economic and Market Events Risk: Events in the U.S. and global financial markets, including actions taken by the U.S. Federal Reserve or foreign central banks to stimulate or stabilize economic growth or the functioning of the securities markets, or otherwise reduce inflation, may at times result in unusually high market volatility, which could negatively impact performance. Governmental efforts to curb inflation often have negative effects on the level of economic activity. Relatively reduced liquidity in credit and fixed income markets could adversely affect issuers worldwide.
Equity and Equity-Related Securities Risk: Equity and equity-related securities may be subject to changes in value, and their values may be more volatile than those of other asset classes. In addition to an individual security losing value, the value of the equity markets or a sector in which the Fund invests could go down. Different parts of a market can react differently to adverse issuer, market, regulatory, political and economic developments.
Financial Services Related Companies Risk: The Fund concentrates its investments in securities of financial services related companies. Financial services related companies are subject to extensive government regulation and can be significantly affected by the availability and cost of capital funds, changes in interest rates, the rate of corporate and consumer debt defaults, price competition, cyberattacks and technology malfunctions and failures and other financial services related factors. The profitability of financial services companies, therefore, may be adversely affected under certain circumstances and in certain market cycles. Because financial services companies are vulnerable to these factors and cycles, a large portion of the Fund’s investments may lose value during such periods.
Foreign Securities Risk: Investments in securities of non-U.S. issuers (including those denominated in U.S. dollars) may involve more risk than investing in securities of U.S. issuers. Foreign political, economic and legal systems, especially those in developing and emerging market countries, may be less stable and more volatile than in the United States. Foreign legal systems generally have fewer regulatory requirements than the U.S. legal system, particularly those of emerging markets. In general, less information is publicly available with respect to non-U.S. companies than U.S. companies. Non-U.S. companies generally are not subject to the same accounting, auditing, and financial reporting standards as are U.S. companies. Additionally, the changing value of foreign currencies and changes in exchange rates could also affect the value of the assets the Fund holds and the Fund’s
64
performance. Certain foreign countries may impose restrictions on the ability of issuers of foreign securities to make payment of principal and interest or dividends to investors located outside the country, due to blockage of foreign currency exchanges or otherwise. Investments in emerging markets are subject to greater volatility and price declines.
In addition, the Fund’s investments in non-U.S. securities may be subject to the risks of nationalization or expropriation of assets, imposition of currency exchange controls or restrictions on the repatriation of non-U.S. currency, confiscatory taxation and adverse diplomatic developments. Special U.S. tax considerations may apply.
Geographic Concentration Risk: The Fund’s performance may be closely tied to the market, economic, political, regulatory or other conditions in the countries or regions in which the Fund invests. This can result in more pronounced risks based upon conditions that impact one or more countries or regions more or less than other countries or regions.
Growth Style Risk: The Fund’s growth style may subject the Fund to above-average fluctuations as a result of seeking higher than average capital growth. Historically, growth stocks have performed best during later stages of economic expansion and value stocks have performed best during periods of economic recovery. Since the Fund follows a growth investment style, there is the risk that the growth investment style may be out of favor for long periods of time. At times when the style is out of favor, the Fund may underperform the market in general, its benchmark and other mutual funds.
Health Sciences Sector Risk: Investments in health sciences companies are subject to a number of risks, including the adverse impact of legislative actions and government regulations. These actions and regulations can affect the approval process for patents, medical devices, procedures and drugs, the funding of research and medical care programs, and the operation and licensing of facilities and personnel. Health sciences companies are affected by patent considerations, intense competition, pricing pressure, rapid technology change and obsolescence, changes in the demand for and costs of medical products and services, regulatory requirements of various federal and state agencies, product liability claims and other market developments. In addition, some of these companies are relatively small and have thinly traded securities, may not yet offer products or may offer a single product, and may have persistent losses during a new product’s transition from development to production, or erratic revenue patterns. The stock prices of these companies are very volatile, particularly when their products are up for regulatory approval and/or under regulatory scrutiny.
Increase in Expenses Risk: Your actual cost of investing in the Fund may be higher than the expenses shown in the Fund’s prospectus expense table for a variety of reasons. For example, expense ratios may be higher than those shown if average net assets decrease. Net assets are more likely to decrease and Fund expense ratios are more likely to increase when markets are volatile. Active and frequent trading of Fund securities can increase expenses.
65
Notes to Financial Statements (continued)
Initial Public Offerings Risk: The volume of IPOs and the levels at which the newly issued stocks trade in the secondary market are affected by the performance of the stock market overall. If IPOs are brought to the market, availability may be limited and if the Fund desires to acquire shares in such an offering, it may not be able to buy any shares at the offering price, or if it is able to buy shares, it may not be able to buy as many shares at the offering price as it would like. The prices of securities involved in IPOs are often subject to greater and more unpredictable price changes than more established stocks. Such unpredictability can have a dramatic impact on the Fund’s performance (higher or lower) and any assumptions by investors based on the affected performance may be unwarranted. In addition, as Fund assets grow, the impact of IPO investments on performance will decline, which could reduce total returns.
Large Shareholder and Large Scale Redemption Risk: Certain individuals, accounts, funds (including funds affiliated with the Manager) or institutions, including the Manager and its affiliates, may from time to time own or control a substantial amount of the Fund’s shares. There is no requirement that these entities maintain their investment in the Fund. There is a risk that such large shareholders or that the Fund’s shareholders generally may redeem all or a substantial portion of their investments in the Fund in a short period of time, which could have a significant negative impact on the Fund’s NAV, liquidity, and brokerage costs. Large redemptions could also result in tax consequences to shareholders and impact the Fund’s ability to implement its investment strategy. The Fund’s ability to pursue its investment objective after one or more large scale redemptions may be impaired and, as a result, the Fund may invest a larger portion of its assets in cash or cash equivalents.
Management Risk: Actively managed funds are subject to management risk. The subadviser will apply investment techniques and risk analyses in making investment decisions for the Fund, but the subadviser’s judgments about the attractiveness, value or market trends affecting a particular security, industry or sector or about market movements may be incorrect. Additionally, the investments selected for the Fund may underperform the markets in general, the Fund’s benchmark and other funds with similar investment objectives.
Market Capitalization Risk: The Fund may invest in companies of any market capitalization. Generally, the stock prices of small- and mid-cap companies are less stable than the prices of large-cap stocks and may present greater risks. Large capitalization companies as a group could fall out of favor with the market, causing the Fund to underperform compared to investments that focus on smaller capitalized companies.
Market Disruption and Geopolitical Risks: Market disruption can be caused by economic, financial or political events and factors, including but not limited to, international wars or conflicts (including Russia’s military invasion of Ukraine and the Israel-Hamas war),
66
geopolitical developments (including trading and tariff arrangements, sanctions and cybersecurity attacks), instability in regions such as Asia, Eastern Europe and the Middle East, terrorism, natural disasters and public health epidemics (including the outbreak of COVID-19 globally).
The extent and duration of such events and resulting market disruptions cannot be predicted, but could be substantial and could magnify the impact of other risks to the Fund. These and other similar events could adversely affect the U.S. and foreign financial markets and lead to increased market volatility, reduced liquidity in the securities markets, significant negative impacts on issuers and the markets for certain securities and commodities and/or government intervention. They may also cause short- or long-term economic uncertainties in the United States and worldwide. As a result, whether or not the Fund invests in securities of issuers located in or with significant exposure to the countries directly affected, the value and liquidity of the Fund’s investments may be negatively impacted. Further, due to closures of certain markets and restrictions on trading certain securities, the value of certain securities held by the Fund could be significantly impacted, which could lead to such securities being valued at zero.
Market Risk: Securities markets may be volatile and the market prices of the Fund’s securities may decline. Securities fluctuate in price based on changes in an issuer’s financial condition and overall market and economic conditions. If the market prices of the securities owned by the Fund fall, the value of your investment in the Fund will decline.
Non-Diversified Investment Company Risk: The Fund is non-diversified for purposes of the 1940 Act. This means that the Fund may invest a greater percentage of its assets in the securities of a single company or other issuer than a diversified fund. Investing in a non-diversified fund involves greater risk than investing in a diversified fund because a loss resulting from the decline in value of any one security may represent a greater portion of the total assets of a non-diversified fund.
Utility Sector Risk: The Fund is subject to risks of the utility industry, such as changing commodity prices, government regulation stipulating rates charged by utilities, increased tariffs, changes in tax laws, interest and exchange rate fluctuations, liabilities for environmental damage and changes in the cost of providing specific utility services, due to its concentration in utility securities. The utilities industry is also subject to potential terrorist attacks, natural disasters and severe weather conditions, as well as regulatory and operational burdens associated with the operation and maintenance of nuclear facilities. When interest rates go up, the value of securities issued by utility companies historically has gone down. Although the average dividend yield of utility industry stocks has been higher than those of other companies, the total return of utility securities has historically underperformed those of industrial companies. In most countries and localities, the utility industry is regulated by governmental entities, which can increase costs and delays for new projects and make it difficult to pass increased costs on to consumers. In certain areas, deregulation of utilities has resulted in increased competition and reduced profitability for certain companies, and increased the risk that a particular company will become bankrupt
67
Notes to Financial Statements (continued)
or fail completely. Reduced profitability, as well as new uses for or additional need of funds (such as for expansion, operations or stock buybacks), could result in reduced dividend payout rates for utility companies. In addition, utility companies face the risk of increases in the cost and reduced availability of fuel (such as oil, coal, natural gas or nuclear energy) and potentially high interest costs for borrowing to finance new projects. Energy conservation and changes in climate policy may also have a significant adverse impact on the revenues and expenses of utility companies. As a sector fund, the Fund’s holdings can vary significantly from broad market indexes and the performance of the Fund can deviate from the performance indexes.
68
Report of Independent Registered Public Accounting Firm
To the Board of Directors of Prudential Sector Funds, Inc. and Shareholders of PGIM Jennison Financial Services Fund, PGIM Jennison Health Sciences Fund and PGIM Jennison Utility Fund
Opinions on the Financial Statements
We have audited the accompanying statements of assets and liabilities, including the schedules of investments, of PGIM Jennison Financial Services Fund, PGIM Jennison Health Sciences Fund and PGIM Jennison Utility Fund (constituting The Prudential Sector Funds, Inc., hereafter collectively referred to as the “Funds”) as of November 30, 2024, the related statements of operations for the year ended November 30, 2024, the statements of changes in net assets for each of the two years in the period ended November 30, 2024, including the related notes, and the financial highlights for each of the five years in the period ended November 30, 2024 (collectively referred to as the “financial statements”). In our opinion, the financial statements present fairly, in all material respects, the financial position of each of the Funds as of November 30, 2024, the results of each of their operations for the year then ended, the changes in each of their net assets for each of the two years in the period ended November 30, 2024 and each of the financial highlights for each of the five years in the period ended November 30, 2024 in conformity with accounting principles generally accepted in the United States of America.
Basis for Opinions
These financial statements are the responsibility of the Funds’ management. Our responsibility is to express an opinion on the Funds’ financial statements based on our audits. We are a public accounting firm registered with the Public Company Accounting Oversight Board (United States) (PCAOB) and are required to be independent with respect to the Funds in accordance with the U.S. federal securities laws and the applicable rules and regulations of the Securities and Exchange Commission and the PCAOB.
We conducted our audits of these financial statements in accordance with the standards of the PCAOB. Those standards require that we plan and perform the audit to obtain reasonable assurance about whether the financial statements are free of material misstatement, whether due to error or fraud.
Our audits included performing procedures to assess the risks of material misstatement of the financial statements, whether due to error or fraud, and performing procedures that respond to those risks. Such procedures included examining, on a test basis, evidence regarding the amounts and disclosures in the financial statements. Our audits also included evaluating the accounting principles used and significant estimates made by management, as well as evaluating the overall presentation of the financial statements. Our procedures included confirmation of securities owned as of November 30, 2024 by correspondence with the custodian, transfer agent and brokers; when replies were not received from brokers, we performed other auditing procedures. We believe that our audits provide a reasonable basis for our opinions.
/s/PricewaterhouseCoopers LLP
New York, New York
January 22, 2025
We have served as the auditor of one or more investment companies in the PGIM Retail Funds complex since 2020.
69
Other Information
Form N-CSR Item 8 - Changes in and Disagreements with Accountants for Open-End Management Investment Companies - None.
Form N-CSR Item 9 - Proxy Disclosures for Open-End Management Investment Companies - None.
Form N-CSR Item 10 - Remuneration Paid to Directors, Officers, and Others of Open-End Management Investment Companies - Included within the Statement of Operations of the financial statements filed under Item 7 of this Form.
Form N-CSR Item 11 - Statement Regarding Basis for Approval of Investment Advisory Contract.
Approval of Advisory Agreements
PGIM Jennison Financial Services Fund
The Board of Directors (the “Board”) of PGIM Jennison Financial Services Fund (the “Fund”)1 consists of ten individuals, eight of whom are not “interested persons” of the Fund, as defined in the Investment Company Act of 1940, as amended (the “1940 Act”) (the “Independent Directors”). The Board is responsible for the oversight of the Fund and its operations, and performs the various duties imposed on the directors of investment companies by the 1940 Act. The Independent Directors have retained independent legal counsel to assist them in connection with their duties. The Chair of the Board is an Independent Director. The Board has established five standing committees: the Audit Committee, the Nominating and Governance Committee, the Compliance Committee and two Investment Committees. Each committee is chaired by, and composed of, Independent Directors.
Annual Approval of the Fund’s Advisory Agreements
As required under the 1940 Act, the Board determines annually whether to renew the Fund’s management agreement with PGIM Investments LLC (“PGIM Investments”) and the Fund’s subadvisory agreement with Jennison Associates LLC (“Jennison”). In considering the renewal of the agreements, the Board, including all of the Independent Directors, met on May 28 and June 4-6, 2024 (the “Board Meeting”) and approved the renewal of the agreements through July 31, 2025 after concluding that the renewal of the agreements was in the best interests of the Fund and its shareholders.
In advance of the meetings, the Board requested and received materials relating to the agreements, and had the opportunity to ask questions and request further information in connection with its consideration. Among other things, the Board considered comparative fee information from PGIM Investments and Jennison. Also, the Board considered comparisons with other mutual funds in relevant peer universes and peer groups, as is further discussed below.
In approving the agreements, the Board, including the Independent Directors advised by independent legal counsel, considered the factors it deemed relevant, including the nature, quality and extent of services provided by PGIM Investments and the subadviser, the performance of the Fund, the profitability of PGIM Investments and its affiliates, expenses and fees, and the potential for economies of scale that may be shared with the Fund and its shareholders as the Fund’s assets grow. In their deliberations, the Directors did not identify any single factor which alone was responsible for the Board’s decision to approve an agreement with respect to the Fund. In connection with its deliberations, the Board
| 1 | PGIM Jennison Financial Services Fund is a series of Prudential Sector Funds, Inc. |
PGIM Jennison Financial Services Fund
Approval of Advisory Agreements (continued)
considered information provided by PGIM Investments throughout the year at regular and special Board meetings, presentations from portfolio managers and other information, as well as information furnished at or in advance of the Board Meeting.
The Directors determined that the overall arrangements between the Fund and PGIM Investments, which serves as the Fund’s investment manager pursuant to a management agreement, and between PGIM Investments and Jennison, which serves as the Fund’s subadviser pursuant to the terms of a subadvisory agreement with PGIM Investments, are in the best interests of the Fund and its shareholders in light of the services performed, fees charged and such other matters as the Directors considered relevant in the exercise of their business judgment. The Board considered the approval of the agreements for the Fund as part of its consideration of agreements for multiple funds, but its approvals were made on a fund-by-fund basis.
The material factors and conclusions that formed the basis for the Directors’ reaching their determinations to approve the continuance of the agreements are separately discussed below.
Nature, Quality and Extent of Services
The Board received and considered information regarding the nature, quality and extent of services provided to the Fund by PGIM Investments and Jennison. The Board noted that Jennison is affiliated with PGIM Investments. The Board considered the services provided by PGIM Investments, including but not limited to the oversight of the subadviser for the Fund, as well as the provision of accounting oversight, fund recordkeeping, compliance and other services to the Fund, such as PGIM Investments’ role as administrator for the Fund’s liquidity risk management program and as valuation designee. With respect to PGIM Investments’ oversight of the subadviser, the Board noted that PGIM Investments’ Strategic Investment Research Group (“SIRG”), which is a business unit of PGIM Investments, is responsible for monitoring and reporting to PGIM Investments’ senior management on the performance and operations of the subadviser. The Board also considered that PGIM Investments pays the salaries of all of the officers and interested Directors of the Fund who are part of Fund management. The Board also considered the investment subadvisory services provided by Jennison, including investment research and security selection, as well as adherence to the Fund’s investment restrictions and compliance with applicable Fund policies and procedures. The Board considered PGIM Investments’ evaluation of the subadviser, as well as PGIM Investments’ recommendation, based on its review of the subadviser, to renew the subadvisory agreement.
The Board considered the qualifications, backgrounds and responsibilities of PGIM Investments’ senior management responsible for the oversight of the Fund and Jennison, and also considered the qualifications, backgrounds and responsibilities of the Jennison
Visit our website at pgim.com/investments
portfolio managers who are responsible for the day-to-day management of the Fund’s portfolio. The Board was provided with information pertaining to PGIM Investments’ and Jennison’s organizational structure, senior management, investment operations, and other relevant information pertaining to PGIM Investments and Jennison. The Board also noted that it received favorable compliance reports from the Fund’s Chief Compliance Officer (“CCO”) as to each of PGIM Investments and Jennison.
The Board concluded that it was satisfied with the nature, extent and quality of the investment management services provided by PGIM Investments and the subadvisory services provided to the Fund by Jennison, and that there was a reasonable basis on which to conclude that the Fund benefits from the services provided by PGIM Investments and Jennison under the management and subadvisory agreements.
Costs of Services and Profits Realized by PGIM Investments
The Board was provided with information on the profitability of PGIM Investments and its affiliates in serving as the Fund’s investment manager. The Board discussed with PGIM Investments the methodology utilized in assembling the information regarding profitability and considered its reasonableness. The Board recognized that it is difficult to make comparisons of profitability from fund management contracts because comparative information is not generally publicly available and is affected by numerous factors, including the structure of the particular adviser, the types of funds it manages, its business mix, numerous assumptions regarding allocations of direct and indirect costs, and the adviser’s capital structure and cost of capital. However, the Board considered that the cost of services provided by PGIM Investments during the year ended December 31, 2023 exceeded the management fees received by PGIM Investments, resulting in an operating loss to PGIM Investments. Taking these factors into account, the Board concluded that the profitability of PGIM Investments and its affiliates in relation to the services rendered was not unreasonable.
Economies of Scale
The Board received and discussed information concerning economies of scale that PGIM Investments may realize as the Fund’s assets grow beyond current levels. The Board noted that the management fee schedule for the Fund includes breakpoints, which have the effect of decreasing the fee rate as assets increase. During the course of time, the Board has considered information regarding the launch date of the Fund, the management fees of the Fund compared to those of similarly managed funds and PGIM Investments’ investment in the Fund over time .The Board noted that economies of scale can be shared with the Fund in other ways, including low management fees from inception, additional technological and personnel investments to enhance shareholder services, and maintaining existing expense structures in the face of a rising cost environment. The Board also
PGIM Jennison Financial Services Fund
Approval of Advisory Agreements (continued)
considered PGIM Investments’ assertion that it continually evaluates the management fee schedule of the Fund and the potential to share economies of scale through breakpoints or fee waivers as asset levels increase.
The Board recognized the inherent limitations of any analysis of economies of scale, stemming largely from the Board’s understanding that most of PGIM Investments’ costs are not specific to individual funds, but rather are incurred across a variety of products and services.
Other Benefits to PGIM Investments and Jennison
The Board considered potential ancillary benefits that might be received by PGIM Investments and Jennison and their affiliates as a result of their relationship with the Fund. The Board concluded that potential benefits to be derived by PGIM Investments included transfer agency fees received by the Fund’s transfer agent (which is affiliated with PGIM Investments), and benefits to its reputation as well as other intangible benefits resulting from PGIM Investments’ association with the Fund. The Board concluded that the potential benefits to be derived by Jennison included its ability to use soft dollar credits, as well as the potential benefits consistent with those generally resulting from an increase in assets under management, specifically, potential access to additional research resources and benefits to its reputation. The Board concluded that the benefits derived by PGIM Investments and Jennison were consistent with the types of benefits generally derived by investment managers and subadvisers to mutual funds.
Performance of the Fund / Fees and Expenses
The Board considered certain additional factors and made related conclusions relating to the historical performance of the Fund for the one-, three-, five- and ten-year periods ended December 31, 2023.
The Board also considered the Fund’s actual management fee, as well as the Fund’s net total expense ratio, for the fiscal year ended November 30, 2023. The Board considered the management fee for the Fund as compared to the management fee charged by PGIM Investments to other funds and the fee charged by other advisers to comparable mutual funds in a peer group. The actual management fee represents the fee rate actually paid by Fund shareholders and includes any fee waivers or reimbursements. The net total expense ratio for the Fund represents the actual expense ratio incurred by Fund shareholders.
The mutual funds included in the peer universe, which was used to consider performance, and the peer group, which was used to consider fees and expenses, were objectively determined by Broadridge, an independent provider of mutual fund data. In certain circumstances, PGIM Investments also provided supplemental peer universe or peer group information, for reasons addressed with the Board. The comparisons placed the Fund in
Visit our website at pgim.com/investments
various quartiles over various periods, with the first quartile being the best 25% of the mutual funds (for performance, the best performing mutual funds and, for expenses, the lowest cost mutual funds).
The section below summarizes key factors considered by the Board and the Board’s conclusions regarding the Fund’s performance, fees and overall expenses. The table sets forth net performance comparisons (which reflect the impact on performance of fund expenses, or any subsidies, expense caps or waivers that may be applicable) with the peer universe, actual management fees with the peer group (which reflect the impact of any subsidies or fee waivers), and net total expenses with the peer group, each of which were key factors considered by the Board.
| | | | | | | | |
| | | | | |
Net Performance | | 1 Year | | 3 Years | | 5 Years | | 10 Years |
| | 1st Quartile | | 3rd Quartile | | 1st Quartile | | 3rd Quartile |
| |
Actual Management Fees: 1st Quartile |
| |
Net Total Expenses: 2nd Quartile |
| · | | The Board noted that the Fund outperformed its benchmark over the one- and five- year periods, and underperformed over the other periods. |
| · | | The Board and PGIM Investments agreed to retain the Fund’s existing contractual expense cap, which (exclusive of certain fees and expenses) limits transfer agency, shareholder servicing, sub-transfer agency and blue sky fees to the extent that such fees cause total annual operating expenses for Class R6 shares to exceed 1.00% through March 31, 2025. |
| · | | In addition, PGIM Investments will waive management fees or shared operating expenses on any share class to the same extent that it waives such expenses on any other share class and has agreed that total annual fund operating expenses for Class R6 shares will not exceed total annual fund operating expenses for Class Z shares. |
| · | | The Board concluded that, in light of the above, it would be in the best interests of the Fund and its shareholders to continue to renew the agreements. |
| · | | The Board concluded that the management fees (including subadvisory fees) and total expenses were reasonable in light of the services provided |
* * *
After full consideration of these factors, the Board concluded that approval of the agreements was in the best interests of the Fund and its shareholders.
PGIM Jennison Financial Services Fund
Approval of Advisory Agreements
PGIM Jennison Health Sciences Fund
The Fund’s Board of Directors
The Board of Directors (the “Board”) of PGIM Jennison Health Sciences Fund (the “Fund”)1 consists of ten individuals, eight of whom are not “interested persons” of the Fund, as defined in the Investment Company Act of 1940, as amended (the “1940 Act”) (the “Independent Directors”). The Board is responsible for the oversight of the Fund and its operations, and performs the various duties imposed on the directors of investment companies by the 1940 Act. The Independent Directors have retained independent legal counsel to assist them in connection with their duties. The Chair of the Board is an Independent Director. The Board has established five standing committees: the Audit Committee, the Nominating and Governance Committee, the Compliance Committee and two Investment Committees. Each committee is chaired by, and composed of, Independent Directors.
Annual Approval of the Fund’s Advisory Agreements
As required under the 1940 Act, the Board determines annually whether to renew the Fund’s management agreement with PGIM Investments LLC (“PGIM Investments”) and the Fund’s subadvisory agreement with Jennison Associates LLC (“Jennison”). In considering the renewal of the agreements, the Board, including all of the Independent Directors, met on May 28 and June 4-6, 2024 (the “Board Meeting”) and approved the renewal of the agreements through July 31, 2025, after concluding that the renewal of the agreements was in the best interests of the Fund and its shareholders.
In advance of the meetings, the Board requested and received materials relating to the agreements, and had the opportunity to ask questions and request further information in connection with its consideration. Among other things, the Board considered comparative fee information from PGIM Investments and Jennison. Also, the Board considered comparisons with other mutual funds in relevant peer universes and peer groups, as is further discussed below.
In approving the agreements, the Board, including the Independent Directors advised by independent legal counsel, considered the factors it deemed relevant, including the nature, quality and extent of services provided by PGIM Investments and the subadviser, the performance of the Fund, the profitability of PGIM Investments and its affiliates, expenses and fees, and the potential for economies of scale that may be shared with the Fund and its shareholders as the Fund’s assets grow. In their deliberations, the Directors did not identify
| 1 | PGIM Jennison Health Sciences Fund is a series of Prudential Sector Funds, Inc. |
Visit our website at pgim.com/investments
any single factor which alone was responsible for the Board’s decision to approve an agreement with respect to the Fund. In connection with its deliberations, the Board considered information provided by PGIM Investments throughout the year at regular and special Board meetings, presentations from portfolio managers and other information, as well as information furnished at or in advance of the Board Meeting.
The Directors determined that the overall arrangements between the Fund and PGIM Investments, which serves as the Fund’s investment manager pursuant to a management agreement, and between PGIM Investments and Jennison, which serves as the Fund’s subadviser pursuant to the terms of a subadvisory agreement with PGIM Investments, are in the best interests of the Fund and its shareholders in light of the services performed, fees charged and such other matters as the Directors considered relevant in the exercise of their business judgment. The Board considered the approval of the agreements for the Fund as part of its consideration of agreements for multiple funds, but its approvals were made on a fund-by-fund basis.
The material factors and conclusions that formed the basis for the Directors’ reaching their determinations to approve the continuance of the agreements are separately discussed below.
Nature, Quality and Extent of Services
The Board received and considered information regarding the nature, quality and extent of services provided to the Fund by PGIM Investments and Jennison. The Board noted that Jennison is affiliated with PGIM Investments. The Board considered the services provided by PGIM Investments, including but not limited to the oversight of the subadviser for the Fund, as well as the provision of accounting oversight, fund recordkeeping, compliance and other services to the Fund, such as PGIM Investments’ role as administrator for the Fund’s liquidity risk management program and as valuation designee. With respect to PGIM Investments’ oversight of the subadviser, the Board noted that PGIM Investments’ Strategic Investment Research Group (“SIRG”), which is a business unit of PGIM Investments, is responsible for monitoring and reporting to PGIM Investments’ senior management on the performance and operations of the subadviser. The Board also considered that PGIM Investments pays the salaries of all of the officers and interested Directors of the Fund who are part of Fund management. The Board also considered the investment subadvisory services provided by Jennison, including investment research and security selection, as well as adherence to the Fund’s investment restrictions and compliance with applicable Fund policies and procedures. The Board considered PGIM Investments’ evaluation of the subadviser, as well as PGIM Investments’ recommendation, based on its review of the subadviser, to renew the subadvisory agreement.
PGIM Jennison Health Sciences Fund
Approval of Advisory Agreements (continued)
The Board considered the qualifications, backgrounds and responsibilities of PGIM Investments’ senior management responsible for the oversight of the Fund and Jennison, and also considered the qualifications, backgrounds and responsibilities of Jennison’s portfolio managers who are responsible for the day-to-day management of the Fund’s portfolio. The Board was provided with information pertaining to PGIM Investments’ and Jennison’s organizational structure, senior management, investment operations, and other relevant information pertaining to both PGIM Investments and Jennison. The Board also noted that it received favorable compliance reports from the Fund’s Chief Compliance Officer (“CCO”) as to both PGIM Investments and Jennison.
The Board concluded that it was satisfied with the nature, extent and quality of the investment management services provided by PGIM Investments and the subadvisory services provided to the Fund by Jennison, and that there was a reasonable basis on which to conclude that the Fund benefits from the services provided by PGIM Investments and Jennison under the management and subadvisory agreements.
Costs of Services and Profits Realized by PGIM Investments
The Board was provided with information on the profitability of PGIM Investments and its affiliates in serving as the Fund’s investment manager. The Board discussed with PGIM Investments the methodology utilized in assembling the information regarding profitability and considered its reasonableness. The Board recognized that it is difficult to make comparisons of profitability from fund management contracts because comparative information is not generally publicly available and is affected by numerous factors, including the structure of the particular adviser, the types of funds it manages, its business mix, numerous assumptions regarding allocations of direct and indirect costs, and the adviser’s capital structure and cost of capital. Taking these factors into account, the Board concluded that the profitability of PGIM Investments and its affiliates in relation to the services rendered was not unreasonable.
Economies of Scale
The Board received and discussed information concerning economies of scale that PGIM Investments may realize as the Fund’s assets grow beyond current levels. The Board noted that the management fee schedule for the Fund includes breakpoints, which have the effect of decreasing the fee rate as assets increase. During the course of time, the Board has considered information regarding the launch date of the Fund, the management fees of the Fund compared to those of similarly managed funds, and PGIM Investments’ investment in the Fund over time. The Board noted that economies of scale can be shared with the Fund in other ways, including low management fees from inception, additional technological and personnel investments to enhance shareholder services, and maintaining existing expense structures in the face of a rising cost environment. The Board also
Visit our website at pgim.com/investments
considered PGIM Investments’ assertion that it continually evaluates the management fee schedule of the Fund and the potential to share economies of scale through breakpoints or fee waivers as asset levels increase.
The Board recognized the inherent limitations of any analysis of economies of scale, stemming largely from the Board’s understanding that most of PGIM Investments’ costs are not specific to individual funds, but rather are incurred across a variety of products and services.
Other Benefits to PGIM Investments and Jennison
The Board considered potential ancillary benefits that might be received by PGIM Investments, Jennison and their affiliates as a result of their relationship with the Fund. The Board concluded that potential benefits to be derived by PGIM Investments included transfer agency fees received by the Fund’s transfer agent (which is affiliated with PGIM Investments), benefits to its reputation as well as other intangible benefits resulting from PGIM Investments’ association with the Fund. The Board concluded that the potential benefits to be derived by Jennison included its ability to use soft dollar credits, as well as the potential benefits consistent with those generally resulting from an increase in assets under management, specifically, potential access to additional research resources and benefits to its reputation. The Board concluded that the benefits derived by PGIM Investments and Jennison were consistent with the types of benefits generally derived by investment managers and subadvisers to mutual funds.
Performance of the Fund / Fees and Expenses
The Board considered certain additional factors and made related conclusions relating to the historical performance of the Fund for the one-, three-, five- and ten-year periods ended December 31, 2023.
The Board also considered the Fund’s actual management fee, as well as the Fund’s net total expense ratio, for the fiscal year ended November 30, 2023. The Board considered the management fee for the Fund as compared to the management fee charged by PGIM Investments to other funds and the fee charged by other advisers to comparable mutual funds in a peer group. The actual management fee represents the fee rate actually paid by Fund shareholders and includes any fee waivers or reimbursements. The net total expense ratio for the Fund represents the actual expense ratio incurred by Fund shareholders.
The mutual funds included in the peer universe, which was used to consider performance, and the peer group, which was used to consider expenses and fees, were objectively determined by Broadridge, an independent provider of mutual fund data. In certain circumstances, PGIM Investments also provided supplemental peer universe or peer group information for reasons addressed with the Board. The comparisons placed the Fund in
PGIM Jennison Health Sciences Fund
Approval of Advisory Agreements (continued)
various quartiles over various periods, with the first quartile being the best 25% of the mutual funds (for performance, the best performing mutual funds and, for expenses, the lowest cost mutual funds).
The section below summarizes key factors considered by the Board and the Board’s conclusions regarding the Fund’s performance, fees and overall expenses. The table sets forth net performance comparisons (which do not reflect the impact on performance of fund expenses, or any subsidies, expense caps or waivers that may be applicable) with the peer universe, actual management fees with the peer group (which reflect the impact of any subsidies or fee waivers), and net total expenses with the peer group, each of which were key factors considered by the Board.
| | | | | | | | |
| | | | | |
Net Performance | | 1 Year | | 3 Years | | 5 Years | | 10 Years |
| | 1st Quartile | | 2nd Quartile | | 1st Quartile | | 1st Quartile |
| |
Actual Management Fees: 2nd Quartile |
| |
Net Total Expenses: 2nd Quartile |
| · | | The Board noted that the Fund outperformed its benchmark index over the one- and five- year periods, and underperformed over the other periods. |
| · | | The Board and PGIM Investments agreed to retain the Fund’s existing contractual expense cap, which (exclusive of certain fees and expenses) caps transfer agency, shareholder servicing, sub-transfer agency and blue sky fees to the extent that such fees cause annual fund operating expenses for Class R6 shares to exceed 0.82% through March 31, 2025. |
| · | | In addition, PGIM Investments will waive management fees or shared operating expenses on any share class to the same extent that it waives such expenses on any other share class and has agreed that total annual fund operating expenses for Class R6 shares will not exceed total annual fund operating expenses for Class Z shares. |
| · | | The Board concluded that, in light of the above, it would be in the best interests of the Fund and its shareholders to renew the agreements. |
| · | | The Board concluded that the management fees (including subadvisory fees) and total expenses were reasonable in light of the services provided. |
* * *
After full consideration of these factors, the Board concluded that approval of the agreements was in the best interests of the Fund and its shareholders.
Visit our website at pgim.com/investments
Approval of Advisory Agreements
PGIM Jennison Utility Fund
The Fund’s Board of Directors
The Board of Directors (the “Board”) of PGIM Jennison Utility Fund (the “Fund”)1 consists of ten individuals, eight of whom are not “interested persons” of the Fund, as defined in the Investment Company Act of 1940, as amended (the “1940 Act”) (the “Independent Directors”). The Board is responsible for the oversight of the Fund and its operations, and performs the various duties imposed on the directors of investment companies by the 1940 Act. The Independent Directors have retained independent legal counsel to assist them in connection with their duties. The Chair of the Board is an Independent Director. The Board has established five standing committees: the Audit Committee, the Nominating and Governance Committee, the Compliance Committee and two Investment Committees. Each committee is chaired by, and composed of, Independent Directors.
Annual Approval of the Fund’s Advisory Agreements
As required under the 1940 Act, the Board determines annually whether to renew the Fund’s management agreement with PGIM Investments LLC (“PGIM Investments”) and the Fund’s subadvisory agreement with Jennison Associates LLC (“Jennison”). In considering the renewal of the agreements, the Board, including all of the Independent Directors, met on May 28 and June 4-6, 2024 (the “Board Meeting”) and approved the renewal of the agreements through July 31, 2025, after concluding that the renewal of the agreements was in the best interests of the Fund and its shareholders.
In advance of the meetings, the Board requested and received materials relating to the agreements, and had the opportunity to ask questions and request further information in connection with its consideration. Among other things, the Board considered comparative fee information from PGIM Investments and Jennison. Also, the Board considered comparisons with other mutual funds in relevant peer universes and peer groups, as is further discussed below.
In approving the agreements, the Board, including the Independent Directors advised by independent legal counsel, considered the factors it deemed relevant, including the nature, quality and extent of services provided by PGIM Investments and the subadviser, the performance of the Fund, the profitability of PGIM Investments and its affiliates, expenses and fees, and the potential for economies of scale that may be shared with the Fund and its shareholders as the Fund’s assets grow. In their deliberations, the Directors did not identify any single factor which alone was responsible for the Board’s decision to approve an
| 1 | PGIM Jennison Utility Fund is a series of Prudential Sector Funds, Inc. |
PGIM Jennison Utility Fund
Approval of Advisory Agreements (continued)
agreement with respect to the Fund. In connection with its deliberations, the Board considered information provided by PGIM Investments throughout the year at regular and special Board meetings, presentations from portfolio managers and other information, as well as information furnished at or in advance of the Board Meeting.
The Directors determined that the overall arrangements between the Fund and PGIM Investments, which serves as the Fund’s investment manager pursuant to a management agreement, and between PGIM Investments and Jennison, which serves as the Fund’s subadviser pursuant to the terms of a subadvisory agreement with PGIM Investments, are in the best interests of the Fund and its shareholders in light of the services performed, fees charged and such other matters as the Directors considered relevant in the exercise of their business judgment. The Board considered the approval of the agreements for the Fund as part of its consideration of agreements for multiple funds, but its approvals were made on a fund-by-fund basis.
The material factors and conclusions that formed the basis for the Directors’ reaching their determinations to approve the continuance of the agreements are separately discussed below.
Nature, Quality and Extent of Services
The Board received and considered information regarding the nature, quality and extent of services provided to the Fund by PGIM Investments and Jennison. The Board noted that Jennison is affiliated with PGIM Investments. The Board considered the services provided by PGIM Investments, including but not limited to the oversight of the subadviser for the Fund, as well as the provision of accounting oversight, fund recordkeeping, compliance and other services to the Fund, such as PGIM Investments’ role as administrator for the Fund’s liquidity risk management program and as valuation designee. With respect to PGIM Investments’ oversight of the subadviser, the Board noted that PGIM Investments’ Strategic Investment Research Group (“SIRG”), which is a business unit of PGIM Investments, is responsible for monitoring and reporting to PGIM Investments’ senior management on the performance and operations of the subadviser. The Board also considered that PGIM Investments pays the salaries of all of the officers and interested Directors of the Fund who are part of Fund management. The Board also considered the investment subadvisory services provided by Jennison, including investment research and security selection, as well as adherence to the Fund’s investment restrictions and compliance with applicable Fund policies and procedures. The Board considered PGIM Investments’ evaluation of the subadviser, as well as PGIM Investments’ recommendation, based on its review of the subadviser, to renew the subadvisory agreement.
The Board considered the qualifications, backgrounds and responsibilities of PGIM Investments’ senior management responsible for the oversight of the Fund and Jennison,
Visit our website at pgim.com/investments
and also considered the qualifications, backgrounds and responsibilities of Jennison’s portfolio managers who are responsible for the day-to-day management of the Fund’s portfolio. The Board was provided with information pertaining to PGIM Investments’ and Jennison’s organizational structure, senior management, investment operations, and other relevant information pertaining to both PGIM Investments and Jennison. The Board also noted that it received favorable compliance reports from the Fund’s Chief Compliance Officer (“CCO”) as to both PGIM Investments and Jennison.
The Board concluded that it was satisfied with the nature, extent and quality of the investment management services provided by PGIM Investments and the subadvisory services provided to the Fund by Jennison, and that there was a reasonable basis on which to conclude that the Fund benefits from the services provided by PGIM Investments and Jennison under the management and subadvisory agreements.
Costs of Services and Profits Realized by PGIM Investments
The Board was provided with information on the profitability of PGIM Investments and its affiliates in serving as the Fund’s investment manager. The Board discussed with PGIM Investments the methodology utilized in assembling the information regarding profitability and considered its reasonableness. The Board recognized that it is difficult to make comparisons of profitability from fund management contracts because comparative information is not generally publicly available and is affected by numerous factors, including the structure of the particular adviser, the types of funds it manages, its business mix, numerous assumptions regarding allocations of direct and indirect costs, and the adviser’s capital structure and cost of capital. Taking these factors into account, the Board concluded that the profitability of PGIM Investments and its affiliates in relation to the services rendered was not unreasonable.
Economies of Scale
The Board received and discussed information concerning economies of scale that PGIM Investments may realize as the Fund’s assets grow beyond current levels. The Board noted that the management fee schedule for the Fund includes breakpoints, which have the effect of decreasing the fee rate as assets increase. During the course of time, the Board has considered information regarding the launch date of the Fund, the management fees of the Fund compared to those of similarly managed funds and PGIM Investments’ investment in the Fund over time. The Board noted that economies of scale can be shared with the Fund in other ways, including low management fees from inception, additional technological and personnel investments to enhance shareholder services, and maintaining existing expense structures in the face of a rising cost environment. The Board also considered PGIM Investments’ assertion that it continually evaluates the management fee
PGIM Jennison Utility Fund
Approval of Advisory Agreements (continued)
schedule of the Fund and the potential to share economies of scale through breakpoints or fee waivers as asset levels increase.
The Board recognized the inherent limitations of any analysis of economies of scale, stemming largely from the Board’s understanding that most of PGIM Investments’ costs are not specific to individual funds, but rather are incurred across a variety of products and services.
Other Benefits to PGIM Investments and Jennison
The Board considered potential ancillary benefits that might be received by PGIM Investments, Jennison and their affiliates as a result of their relationship with the Fund. The Board concluded that potential benefits to be derived by PGIM Investments included transfer agency fees received by the Fund’s transfer agent (which is affiliated with PGIM Investments), benefits to its reputation as well as other intangible benefits resulting from PGIM Investments’ association with the Fund. The Board concluded that the potential benefits to be derived by Jennison included its ability to use soft dollar credits, as well as the potential benefits consistent with those generally resulting from an increase in assets under management, specifically, potential access to additional research resources and benefits to its reputation. The Board concluded that the benefits derived by PGIM Investments and Jennison were consistent with the types of benefits generally derived by investment managers and subadvisers to mutual funds.
Performance of the Fund / Fees and Expenses
The Board considered certain additional factors and made related conclusions relating to the historical performance of the Fund for the one-, three-, five- and ten-year periods ended December 31, 2023.
The Board also considered the Fund’s actual management fee, as well as the Fund’s net total expense ratio, for the fiscal year ended November 30, 2023. The Board considered the management fee for the Fund as compared to the management fee charged by PGIM Investments to other funds and the fee charged by other advisers to comparable mutual funds in a peer group. The actual management fee represents the fee rate actually paid by Fund shareholders and includes any fee waivers or reimbursements. The net total expense ratio for the Fund represents the actual expense ratio incurred by Fund shareholders.
The mutual funds included in the peer universe, which was used to consider performance, and the peer group, which was used to consider fees and expenses, were objectively determined by Broadridge, an independent provider of mutual fund data. In certain circumstances, PGIM Investments also provided supplemental peer universe or peer group information for reasons addressed with the Board. The comparisons placed the Fund in
Visit our website at pgim.com/investments
various quartiles over various periods, with the first quartile being the best 25% of the mutual funds (for performance, the best performing mutual funds and, for expenses, the lowest cost mutual funds).
The section below summarizes key factors considered by the Board and the Board’s conclusions regarding the Fund’s performance, fees and overall expenses. The table sets forth net performance comparisons (which reflect the impact on performance of fund expenses, or any subsidies, expense caps or waivers that may be applicable) with the peer universe, actual management fees with the peer group (which reflect the impact of any subsidies or fee waivers), and net total expenses with the peer group, each of which were key factors considered by the Board.
| | | | | | | | |
| | | | | |
Net Performance | | 1 Year | | 3 Years | | 5 Years | | 10 Years |
| | 2nd Quartile | | 2nd Quartile | | 1st Quartile | | 2nd Quartile |
| |
Actual Management Fees: 1st Quartile |
| |
Net Total Expenses: 1st Quartile |
| · | | The Board noted that the Fund outperformed its benchmark index over the one-, three-, and five- year periods and underperformed over the ten-year period. |
| · | | The Board and PGIM Investments agreed to retain the Fund’s existing contractual expense cap, which (exclusive of certain fees and expenses) limits transfer agency, shareholder servicing, sub-transfer agency and blue sky fees to the extent that such fees cause annual fund operating expenses to exceed 0.52% for Class R6 shares through March 31, 2025. |
| · | | In addition, PGIM Investments will waive management fees or shared operating expenses on any share class to the same extent that it waives such expenses on any other share class and has agreed that total annual fund operating expenses for Class R6 shares will not exceed total annual fund operating expenses for Class Z shares. |
| · | | The Board concluded that, in light of the above, it would be in the best interests of the Fund and its shareholders to renew the agreements. |
| · | | The Board concluded that the management fees (including subadvisory fees) and total expenses were reasonable in light of the services provided. |
* * *
After full consideration of these factors, the Board concluded that approval of the agreements was in the best interests of the Fund and its shareholders.
PGIM Jennison Utility Fund
| Item 12 – | Disclosure of Proxy Voting Policies and Procedures for Closed-End Management Investment Companies – Not applicable. |
| Item 13 – | Portfolio Managers of Closed-End Management Investment Companies – Not applicable. |
| Item 14 – | Purchases of Equity Securities by Closed-End Management Investment Company and Affiliated Purchasers – Not applicable. |
| Item 15 – | Submission of Matters to a Vote of Security Holders – There have been no material changes to the procedures by which shareholders may recommend nominees to the registrant’s board of directors. |
| Item 16 – | Controls and Procedures |
| | (a) | It is the conclusion of the registrant’s principal executive officer and principal financial officer that the effectiveness of the registrant’s current disclosure controls and procedures (such disclosure controls and procedures having been evaluated within 90 days of the date of this filing) provide reasonable assurance that the information required to be disclosed by the registrant has been recorded, processed, summarized and reported within the time period specified in the Commission’s rules and forms and that the information required to be disclosed by the registrant has been accumulated and communicated to the registrant’s principal executive officer and principal financial officer in order to allow timely decisions regarding required disclosure. |
| | (b) | There has been no significant change in the registrant’s internal control over financial reporting (as defined in Rule 30a-3(d) under the Act (17 CFR 270.30a-3(d))) that occurred during the period covered by this report that has materially affected, or is reasonably likely to materially affect, the registrant’s internal control over financial reporting. |
| Item 17 – | Disclosure of Securities Lending Activities for Closed-End Management Investment Companies – Not applicable. |
Item 18 – Recovery of Erroneously Awarded Compensation – Not applicable.
| | (a)(2) | Policy required by the listing standards adopted pursuant to Rule 10D-1 under the Securities Exchange Act of 1934 – Not applicable. |
| | (a)(4) | Any written solicitation to purchase securities under Rule 23c-1 under the Investment Company Act of 1940 – Not applicable. |
| | (a)(5) | Change in the registrant’s independent public accountant – Not applicable. |
SIGNATURES
Pursuant to the requirements of the Securities Exchange Act of 1934 and the Investment Company Act of 1940, the registrant has duly caused this report to be signed on its behalf by the undersigned, thereunto duly authorized.
| | |
Registrant: | | Prudential Sector Funds, Inc. |
| |
By: | | /s/ Andrew R. French |
| | Andrew R. French |
| | Secretary |
| |
Date: | | January 22, 2025 |
Pursuant to the requirements of the Securities Exchange Act of 1934 and the Investment Company Act of 1940, this report has been signed below by the following persons on behalf of the registrant and in the capacities and on the dates indicated.
| | |
By: | | /s/ Stuart S. Parker |
| | Stuart S. Parker |
| | President and Principal Executive Officer |
| |
Date: | | January 22, 2025 |
| |
By: | | /s/ Christian J. Kelly |
| | Christian J. Kelly |
| | Chief Financial Officer (Principal Financial Officer) |
| |
Date: | | January 22, 2025 |