UNITED STATES
SECURITIES AND EXCHANGE COMMISSION
Washington, D.C. 20549
FORM N-CSR
CERTIFIED SHAREHOLDER REPORT OF REGISTERED MANAGEMENT
INVESTMENT COMPANIES
Investment Company Act file number 811-03174
Touchstone Tax-Free Trust
(Exact name of registrant as specified in charter)
303 Broadway, Suite 1100
Cincinnati, Ohio 45202-4203
(Address of principal executive offices) (Zip code)
Jill T. McGruder
303 Broadway, Suite 1100
Cincinnati, Ohio 45202-4203
(Name and address of agent for service)
Registrant's telephone number, including area code: 800-638-8194
Date of fiscal year end: June 30
Date of reporting period: June 30, 2014
Form N-CSR is to be used by management investment companies to file reports with the Commission not later than 10 days after the transmission to stockholders of any report that is required to be transmitted to stockholders under Rule 30e-1 under the Investment Company Act of 1940 (17 CFR 270.30e-1). The Commission may use the information provided on Form N-CSR in its regulatory, disclosure review, inspection, and policymaking roles.
A registrant is required to disclose the information specified by Form N-CSR, and the Commission will make this information public. A registrant is not required to respond to the collection of information contained in Form N-CSR unless the Form displays a currently valid Office of Management and Budget ("OMB") control number. Please direct comments concerning the accuracy of the information collection burden estimate and any suggestions for reducing the burden to Secretary, Securities and Exchange Commission, 100 F Street, NE, Washington, DC 20549. The OMB has reviewed this collection of information under the clearance requirements of 44 U.S.C. § 3507.
Item 1. Reports to Stockholders.
The Report to Shareholders is attached herewith.
June 30, 2014
Annual Report
Touchstone Tax-Free Trust
Touchstone Ohio Tax-Free Bond Fund
Touchstone Ohio Tax-Free Money Market Fund
Touchstone Tax-Free Money Market Fund

Table of Contents
This report identifies the Funds' investments on June 30, 2014. These holdings are subject to change. Not all investments in each Fund performed the same, nor is there any guarantee that these investments will perform as well in the future. Market forecasts provided in this report may not occur.
Letter from the President
Dear Shareholder:
We are pleased to provide you with the Touchstone Tax-Free Trust Annual Report. Inside you will find key financial information for the 12 months ended June 30, 2014.
During the period, growth in the U.S. remained subdued, although the unemployment rate declined. Inflation increased, but the U.S. Federal Reserve Board (Fed) did not express concern about sustained inflation growth. Fed policy remained accommodative to keeping interest rates low. However, during the first half of the fiscal year rates rose at the announcement that the Fed would begin tapering its bond purchase program. Economic conditions weakened during the second half of the year due to severe weather. The weaker economy coupled with poor growth in Europe calmed the bond market and interest rates declined over the period.
The municipal market experienced both highs and lows over the course of the fiscal year. In the first half of the period, higher interest rates, credit concerns and negative cash flows from municipal mutual funds led to weak performance. In the second half of the period, however, as Treasury rates dropped from the end of 2013, factors that included improved municipal credit quality, higher taxes, limited new municipal issuance and increased demand for taxable-equivalent yields combined to make municipals strong relative performers for the first six months of 2014. As a result, for the fiscal year overall, the U.S. municipal bond market posted positive performance.
The Touchstone Ohio Tax-Free Bond Fund seeks the highest level of interest income exempt from federal income and Ohio personal income taxes consistent with the protection of capital. It invests primarily in high-quality long-term Ohio municipal bonds and seeks the appropriate alignment of risk and return in an attempt to provide the most favorable opportunity to maximize risk-adjusted performance.
Touchstone’s tax-free money market funds seek current tax-free income combined with liquidity and stability. The Funds seek the highest level of interest income exempt from Federal (and in some cases, state) income tax, consistent with protection of capital by primarily investing in high-quality, short-term municipal obligations.
We believe that focusing on the long-term composition of your investment portfolio is essential to balancing risk and return. We recommend that you work with your financial professional on a regular basis to assess and adjust your asset allocation and diversification strategy as needed to help keep your financial goals on track.
We greatly appreciate your continued support. Thank you for including Touchstone as part of your investment plan.
Sincerely,

Jill T. McGruder
President
Touchstone Tax-Free Trust
Management's Discussion of Fund Performance (Unaudited)
Touchstone Ohio Tax-Free Bond Fund
Sub-Advised by Fort Washington Investment Advisors
Investment Philosophy
The Touchstone Ohio Tax-Free Bond Fund seeks the highest level of interest income exempt from federal income and Ohio personal income taxes, consistent with the protection of capital. It invests primarily in high-quality, long-term Ohio Municipal obligations.
Fund Performance
The Touchstone Ohio Tax-Free Bond Fund (Class A Shares) outperformed its benchmark, the Barclays Municipal Bond Index, for the 12-month period ended June 30, 2014. The Fund’s total return was 6.41 percent (calculated excluding the maximum sales charge) while the total return of the benchmark was 6.14 percent.
Market Environment
During the period, the U.S. economy failed to reach estimated expectations and overall growth remained subpar. Employment continued to be a relative bright spot while the unemployment rate declined. Although inflation increased near the end of the period, the U.S. Federal Reserve Board (Fed) did not express concern that this will lead to a sustained higher level of inflation. The Fed’s quantitative easing (QE) policy remained accommodative; however, interest rates rose temporarily when then Fed Chair, Ben Bernanke, mentioned that the Fed may begin to taper bond purchases. The wind down began in December 2013, when the Fed started reducing purchases by $10 billion per month; it is expected the program will end in the fall of 2014. Nevertheless, U.S. Treasury yields ended the period with minimal change.
For the fiscal year, performance of the municipal market was mixed. Higher interest rates, credit concerns exacerbated by the City of Detroit’s bankruptcy and negative cash flows from municipal mutual funds led to weak performance during the last two quarters of 2013. However, in the first two quarters of 2014, declining interest rates and increasing relative valuations helped municipal bonds post strong total return performance.
Portfolio Review
Fund performance was positively impacted by its shorter-than-benchmark duration during the first half of the year when interest rates rose sharply. As interest rates declined in the second half of the fiscal year, the Fund’s shorter duration detracted from relative performance. Sector allocations to Health Care and Education bonds contributed to performance for the period.
In managing the Fund, we seek a target duration less than the benchmark. To achieve this goal, we emphasized high-quality bonds in the 20-year maturity range. This range is preferred as we believe it allows the Fund to capture most of the yield available along the yield curve while reducing portfolio duration and volatility relative to longer-term securities.
Outlook
Our focus will remain on buying high-quality Ohio municipal bonds that we believe offer the best combination of tax-free yield and total return. Currently, we believe the 15- to 20-year maturity range offers attractive opportunities. In addition, we favor higher coupon bonds which, when combined with our maturity preference, results in a Fund with a shorter duration than the benchmark. Historically, this strategy has worked well.
We believe the bond market will remain challenging as it tries to determine the impact from the wind down of the Fed’s aggressive monetary policy. While the Fed is not expected to raise short-term interest rates in the near future, we believe the reduction of its QE measures later in 2014 is likely to have a negative impact on bonds, which could increase interest rates and push bond prices lower. We believe potential disruptions in the
Management's Discussion of Fund Performance (Unaudited) (Continued)
municipal market could have a negative impact on the sector, but may also provide opportunities to purchase higher-quality bonds at higher yield levels.
Credit quality within the municipal sector remains steady, with revenues improving at a moderate pace. Problems in Puerto Rico that could cause potential disruptions in the market began to resurface late in the period. New legislation passed by the Puerto Rican government caused rating agencies to downgrade Puerto Rico’s general obligation (GO) debt to junk status earlier in the year. The new legislation allowing public finance companies more self-sufficiency has brought additional downgrades for nearly every issuer within Puerto Rico. There is concern about the possibility of more broad-based defaults as the government works through restructuring plans for the public finance corporations. Although this has had no impact on the broader municipal market thus far, we believe there is potential it could evolve into a larger problem. We will monitor these developments closely even though the Fund does not and has not held any Puerto Rican debt.
Management's Discussion of Fund Performance (Unaudited) (Continued)
Comparison of the Change in Value of a $10,000 Investment in
the Touchstone Ohio Tax-Free Bond Fund - Class A* and the
Barclays Municipal Bond Index
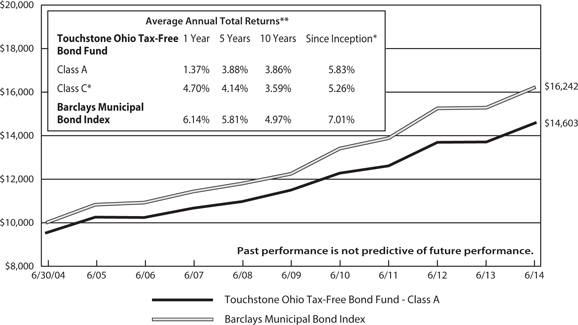
*The chart above represents performance of Class A shares only, which will vary from the performance of Class C shares based on the difference in loads and fees paid by shareholders in the different classes. Class A and Class C shares commenced operations on April 1, 1985, and November 1, 1993, respectively. Class C shares performance was calculated using the historical performance of Class A shares for the periods prior to November 1, 1993. The returns have been restated for sales charges and for fees applicable to Class C shares.
**The average annual total returns shown above are adjusted for maximum applicable sales charges. The maximum offering price per share of Class A shares is equal to the net asset value (“NAV”) per share plus a sales load equal to 4.99% of the NAV (or 4.75% of the offering price). Class C shares are subject to a contingent deferred sales charge (“CDSC”) of 1.00% that will be assessed on an amount equal to the lesser of (1) the NAV at the time of purchase of the shares being redeemed or (2) the NAV of such shares being redeemed if redeemed within a one-year period from date of purchase.
The performance of the above Fund does not reflect the deduction of taxes that a shareholder would pay on Fund distributions or the redemption of Fund shares.
Note to Chart
The Barclays Municipal Bond Index is a widely recognized unmanaged Index of municipal bonds with maturities of at least one year.
Tabular Presentation of Portfolios of Investments (Unaudited)
June 30, 2014
The tables below provide each Fund’s investments by credit quality and security type. We hope it will be useful to shareholders as it summarizes key information about each Fund’s investments.
| Touchstone Ohio Tax-Free Bond Fund | | | | |
| Credit Quality* | | | (% of Investment Securities) | |
| AAA/Aaa | | | 4.7 | % |
| AA/Aa | | | 51.5 | |
| A/A | | | 39.8 | |
| BBB/Baa | | | 4.0 | |
| Total | | | 100.0 | % |
| | | | | |
| Portfolio Allocation | | | (% of Net Assets) | |
| Fixed Rate Revenue and | | | | |
| General Obligation Bonds | | | 96.8 | % |
| Variable Rate | | | | |
| Demand Notes | | | 2.8 | |
| Other Assets/Liabilities (net) | | | 0.4 | |
| Total | | | 100.0 | % |
| Touchstone Ohio Tax-Free Money Market Fund | | | | |
| Credit Quality | | | (% of Investment Securities) | |
| A-1/P-1/MIG1/SP1-+ | | | 85.9 | % |
| FW1** | | | 14.1 | |
| Total | | | 100.0 | % |
| | | | | |
| Portfolio Allocation | | | (% of Net Assets) | |
| Variable Rate Demand Notes | | | 78.3 | % |
| Fixed Rate Revenue and | | | | |
| General Obligation Bonds | | | 22.5 | |
| Other Assets/Liabilities (net) | | | (0.8 | ) |
| Total | | | 100.0 | % |
| Touchstone Tax-Free Money Market Fund | | | | |
| Credit Quality | | | (% of Investment Securities) | |
| A-1/P-1/MIG1/SP1-+ | | | 88.7 | % |
| FW1** | | | 11.3 | |
| Total | | | 100.0 | % |
| | | | | |
| Portfolio Allocation | | | (% of Net Assets) | |
| Variable Rate Demand Notes | | | 69.9 | % |
| Fixed Rate Revenue and | | | | |
| General Obligation Bonds | | | 31.3 | |
| Other Assets/Liabilities (net) | | | (1.2 | ) |
| Total | | | 100.0 | % |
* Credit quality may be rated by Standard & Poor's, Moody's and Fitch. If all three agencies rate the bond, the middle or common rating is used; if two of the agencies rate the bond, the lower rating is used; if one agency rates the bond, that rating is used, if none of the agencies rate the bond, the bond will be classified as not-rated.
** Equivalent to Standard & Poor's and Moody's highest short-term ratings of A-1 and P-1, respectively, based upon independent research conducted by Fort Washington Investment Advisors, Inc.
Portfolio of Investments
Touchstone Ohio Tax-Free Bond Fund – June 30, 2014
| Principal | | | | | Interest | | | Maturity | | Market | |
| Amount | | | | | Rate | | | Date | | Value | |
| | | | | | | | | | | | |
| | | | | Fixed Rate Revenue and General Obligation Bonds — 96.8% | | | | | | | | | | |
| $ | 865,000 | | | Fairfield Co OH LTGO Ser 2005 Pre-refunded @ $100 | | | 5.000 | % | | 06/01/15 | | $ | 903,467 | |
| | 1,000,000 | | | Oregon OH CSD UTGO Ser 2005 Pre-refunded @ $100 | | | 5.000 | | | 06/01/15 | | | 1,043,990 | |
| | 170,000 | | | Warren OH Wtr Wks Rev | | | 5.500 | | | 11/01/15 | | | 174,644 | |
| | 250,000 | | | Buckeye Valley OH LSD UTGO Ser A | | | 6.850 | | | 12/01/15 | | | 262,548 | |
| | 415,000 | | | Columbus-Polaris OH Hsg Corp. Pre-refunded @ $100 | | | 7.400 | | | 01/01/16 | | | 451,744 | |
| | 1,000,000 | | | Univ of Cincinnati OH Recpts Ser A Pre-refunded @ $100 | | | 4.750 | | | 06/01/16 | | | 1,071,940 | |
| | 1,000,000 | | | Little Miami OH LSD (Sch Impt) UTGO Pre-refunded @ $100 | | | 5.000 | | | 12/01/16 | | | 1,111,450 | |
| | 750,000 | | | Cleveland OH LTGO Ser A Pre-refunded @ $100 | | | 5.000 | | | 10/01/17 | | | 795,068 | |
| | 1,000,000 | | | Kings OH LSD (Sch Impt) UTGO Pre-refunded @ $100 | | | 5.000 | | | 12/01/17 | | | 1,144,960 | |
| | 500,000 | | | New Albany OH Cmnty Auth Ser C | | | 5.000 | | | 10/01/24 | | | 569,015 | |
| | 2,000,000 | | | Canal Winchester OH LSD UTGO | | | 4.750 | | | 12/01/24 | | | 2,195,240 | |
| | 1,040,000 | | | Franklin Co OH Hosp Rev Impt (The Childrens Hosp Proj.) Ser C | | | 5.000 | | | 05/01/25 | | | 1,077,055 | |
| | 1,500,000 | | | Richland Co OH Hosp Facs Rev (Medcentral Health Sys Oblig) | | | 5.125 | | | 11/15/26 | | | 1,555,875 | |
| | 1,090,000 | | | Fairborn OH CSD (Sch Impt) UTGO | | | 5.000 | | | 12/01/26 | | | 1,174,671 | |
| | 1,000,000 | | | Lakewood OH CSD (Sch Impt) UTGO | | | 5.000 | | | 12/01/26 | | | 1,117,650 | |
| | 1,500,000 | | | OH St Hgr Edl Fac (Univ Dayton) | | | 5.000 | | | 12/01/26 | | | 1,643,430 | |
| | 2,000,000 | | | OH St Hosp Fac Rev (Cleveland Clinic Hlth) Ser B | | | 5.125 | | | 01/01/28 | | | 2,234,020 | |
| | 1,000,000 | | | OH St Hgr Edl Fac Comm (Xavier Univ) Ser C | | | 5.750 | | | 05/01/28 | | | 1,157,820 | |
| | 830,000 | | | Columbus OH CSD (Sch Facs Constr & Impt) UTGO | | | 5.000 | | | 12/01/28 | | | 920,578 | |
| | 1,185,000 | | | Delaware OH LTGO | | | 5.000 | | | 12/01/28 | | | 1,285,749 | |
| | 865,000 | | | Licking Heights OH LSD UTGO | | | 6.400 | | | 12/01/28 | | | 1,186,910 | |
| | 1,500,000 | | | Reynoldsburg OH CSD (Sch Facs Constr & Impt) UTGO | | | 5.250 | | | 12/01/28 | | | 1,686,000 | |
| | 650,000 | | | Greene Co OH Hosp Fac Rev (Kettering Health Network) | | | 5.125 | | | 04/01/29 | | | 683,839 | |
| | 1,000,000 | | | Montgomery Co OH Rev (Catholic Hlth Initiatives) Ser B | | | 5.250 | | | 05/01/29 | | | 1,148,050 | |
| | 345,000 | | | Univ of Toledo OH Ser B | | | 5.000 | | | 06/01/29 | | | 378,289 | |
| | 1,000,000 | | | Cleveland OH Income Tax Rev (Sub Lien Brdgs & Roadways) Ser B | | | 5.000 | | | 10/01/29 | | | 1,101,260 | |
| | 1,000,000 | | | Franklin Co OH Hosp Rev Impt (Nationwide Childrens Hosp) | | | 4.750 | | | 11/01/29 | | | 1,068,770 | |
| | 1,000,000 | | | Columbus OH CSD (Sch Facs Constr & Impt) UTGO | | | 4.500 | | | 12/01/29 | | | 1,085,970 | |
| | 895,000 | | | Milton Union OH Exempted Village SD (Sch Impt) | | | 4.875 | | | 12/01/29 | | | 961,651 | |
| | 320,000 | | | Brookfield OH LSD (Sch Facs Impt) UTGO | | | 5.000 | | | 01/15/30 | | | 349,162 | |
| | 500,000 | | | Hamilton Co OH Hosp Facs Rev (UC Hlth) | | | 5.000 | | | 02/01/30 | | | 553,280 | |
| | 1,000,000 | | | Hamilton Co OH Student Rev (Stratford Heights Proj) | | | 5.000 | | | 06/01/30 | | | 1,071,170 | |
| | 1,000,000 | | | Green OH Cmnty Learning Ctr | | | 4.000 | | | 12/01/30 | | | 1,036,870 | |
| | 500,000 | | | Butler Co OH Hosp Facs (Kettering Health Network Oblig) | | | 5.250 | | | 04/01/31 | | | 543,369 | |
| | 1,000,000 | | | Wright OH St Univ (Gen Recpts) Ser A | | | 5.000 | | | 05/01/31 | | | 1,089,080 | |
| | 1,500,000 | | | Cincinnati OH CSD (Sch Impt) LTGO | | | 5.000 | | | 06/01/31 | | | 1,674,270 | |
| | 750,000 | | | Middleburg Heights OH Hosp Rev (Facs Southwest Gen) | | | 5.125 | | | 08/01/31 | | | 788,790 | |
| | 1,000,000 | | | Mount Healthy OH CSD (Sch Impt) UTGO | | | 5.000 | | | 12/01/31 | | | 1,086,350 | |
| | 1,000,000 | | | Kent OH St Univ Rev (Gen Recpts) Ser A | | | 4.500 | | | 05/01/32 | | | 1,070,030 | |
| | 1,000,000 | | | Hamilton Co OH Hlthcare Facs (Christ Hosp Proj) | | | 5.250 | | | 06/01/32 | | | 1,095,380 | |
| | 1,300,000 | | | Cincinnati OH Wtr Sys Rev Ser B | | | 5.000 | | | 12/01/32 | | | 1,434,290 | |
| | 1,000,000 | | | Cuyahoga Co OH COP (Convention Hotel Proj) | | | 5.000 | | | 12/01/32 | | | 1,105,260 | |
| | 1,000,000 | | | Hamilton Co OH Swr Sys Rev Impt (Greater Cincinnati Met) Ser A | | | 5.000 | | | 12/01/32 | | | 1,094,620 | |
| | 1,060,000 | | | OH St EDR (Enterprise Bd Fd) Ser 7 | | | 4.750 | | | 12/01/32 | | | 1,127,957 | |
| | 1,000,000 | | | Toledo OH CSD (Sch Facs Impt) UTGO | | | 5.000 | | | 12/01/32 | | | 1,130,490 | |
| | 2,000,000 | | | Cincinnati OH EDR (U Square The Loop Proj.) | | | 5.000 | | | 11/01/33 | | | 2,195,040 | |
| | 250,000 | | | Lakewood OH CSD (Sch Facs Impt) UTGO Ser A | | | 5.000 | | | 11/01/33 | | | 277,065 | |
| | 625,000 | | | Hamilton Co OH Hosp Facs Rev (Cincinnati Childrens Hosp) Ser S | | | 5.000 | | | 05/15/34 | | | 694,356 | |
| | | | | Total Fixed Rate Revenue and General Obligation Bonds | | | | | | | | $ | 50,608,482 | |
Touchstone Ohio Tax-Free Bond Fund (Continued)
| Principal | | | | | Interest | | | Maturity | | Market | |
| Amount | | | | | Rate | | | Date | | Value | |
| | | | | | | | | | | | |
| | | | | Variable Rate Demand Notes(A) — 2.8% | | | | | | | | | | |
| $ | 1,000,000 | | | OH St Air Quality Dev Auth (Poll Control Firstenenergy) | | | 2.250 | % | | 08/01/29 | | $ | 1,013,330 | |
| | 415,000 | | | Allen Co OH Hosp Facs Rev (Catholic Healthcare) Ser C (LOC: Union Bank NA) | | | 0.040 | | | 06/01/34 | | | 414,999 | |
| | | | | Total Variable Rate Demand Notes | | | | | | | | $ | 1,428,329 | |
| | | | | | | | | | | | | | | |
| | | | | Total Investment Securities —99.6% | | | | | | | | | | |
| | | | | (Cost $48,374,860) | | | | | | | | $ | 52,036,811 | |
| | | | | | | | | | | | | | | |
| | | | | Other Assets in Excess of Liabilities — 0.4% | | | | | | | | | 234,871 | |
| | | | | | | | | | | | | | | |
| | | | | Net Assets — 100.0% | | | | | | | | $ | 52,271,682 | |
| (A) | Demand Feature - Maturities shown are the final maturities, not the date on which principal could be recovered through the demand feature. |
Other Information:
The inputs or methodology used for valuing securities may not be an indication of the risk associated with investing in those securities. For more information on valuation inputs, and their aggregation into the levels used in the table below, please refer to the security valuation section in the accompanying Notes to Financial Statements.
| Valuation inputs at Reporting Date: | |
| Description | | Level 1 | | | Level 2 | | | Level 3 | | | Total | |
| Municipal Bonds | | $ | — | | | $ | 52,036,811 | | | $ | — | | | $ | 52,036,811 | |
See accompanying Notes to Portfolios of Investments and Notes to Financial Statements.
Portfolio of Investments
Touchstone Ohio Tax-Free Money Market Fund – June 30, 2014
| Principal | | | | | Interest | | | Maturity | | | |
| Amount | | | | | Rate | | | Date | | Value | |
| | | | | | | | | | | | |
| | | | | Variable Rate Demand Notes(A) — 78.3% | | | | | | | | | | |
| $ | 4,075,000 | | | OH St (Infra Impt) UTGO Ser B | | | 0.050 | % | | 08/01/17 | | $ | 4,075,000 | |
| | 280,000 | | | Hamilton Co OH Econ Dev Rev (The General Protestant) (LOC: PNC Bank NA) | | | 0.150 | | | 12/01/17 | | | 280,000 | |
| | 4,000,000 | | | DE Co OH Port Auth Eco (Columbus Zoological Pk) Ser 2006 (LOC: JP Morgan Chase Bank NA) | | | 0.070 | | | 08/01/18 | | | 4,000,000 | |
| | 2,000,000 | | | OH St (Infra Impt) UTGO Ser B | | | 0.030 | | | 08/01/21 | | | 2,000,000 | |
| | 1,055,000 | | | OH St Univ (The) | | | 0.060 | | | 12/01/21 | | | 1,055,000 | |
| | 1,635,000 | | | Hamilton Co OH Econ Dev Rev (Samuel W Bell Home Proj) (LOC: U.S. Bank NA) | | | 0.060 | | | 04/01/22 | | | 1,635,000 | |
| | 2,290,000 | | | Columbiana Co OH Rev (East Liverpool Area) Ser Y (LOC: PNC Bank NA) | | | 0.070 | | | 10/01/23 | | | 2,290,000 | |
| | 2,290,000 | | | Port Gtr Cincinnati OH Dev Auth Rev (Cincinnati Zoo) (LOC: U.S. Bank NA) | | | 0.220 | | | 11/01/23 | | | 2,290,000 | |
| | 800,000 | | | Cleveland OH Arpt Sys Rev Ser D (LOC: Bank of America NA) | | | 0.080 | | | 01/01/24 | | | 800,000 | |
| | 2,100,000 | | | Butler Co OH Hlthcare Facs Rev (Colonial Sr Svcs Inc Proj) (LOC: U.S. Bank NA) | | | 0.060 | | | 07/01/24 | | | 2,100,000 | |
| | 1,000,000 | | | OH St (Common Schs) UTGO Ser A | | | 0.030 | | | 03/15/25 | | | 1,000,000 | |
| | 3,000,000 | | | OH St Wtr Dev Auth Rev (Multi Modal Wtr Dev Timken) Ser 2014 (LOC: Northern Trust Company) | | | 0.080 | | | 11/01/25 | | | 3,000,000 | |
| | 430,000 | | | Port Gtr Cincinnati OH Dev Auth Rev (Cincinnati Zoo Proj) (LOC: U.S. Bank NA) | | | 0.220 | | | 11/01/25 | | | 430,000 | |
| | 3,000,000 | | | OH St Air Quality Dev Auth Rev (OH Valley Elec Corp) Ser A (LOC: Bank of Nova Scotia) | | | 0.050 | | | 02/01/26 | | | 3,000,000 | |
| | 4,600,000 | | | OH St Air Quality Dev Auth Rev (OH Valley Elec Corp) Ser C (LOC: Bank of Tokyo-Mitsubishi UFJ) | | | 0.060 | | | 02/01/26 | | | 4,600,000 | |
| | 5,355,000 | | | Columbus OH (San Swr) UTGO Ser 1 | | | 0.030 | | | 12/01/26 | | | 5,355,000 | |
| | 810,000 | | | Stark Co OH Port Auth Hlthcare Facs Rev (Canton Sch) (LOC: PNC Bank NA) | | | 0.130 | | | 02/01/27 | | | 810,000 | |
| | 1,800,000 | | | OH St Univ (The) | | | 0.040 | | | 12/01/27 | | | 1,800,000 | |
| | 6,345,000 | | | Hamilton Co OH Econ Dev Rev (St Xavier H.S. Proj) (LOC: PNC Bank NA) | | | 0.060 | | | 04/01/28 | | | 6,345,000 | |
| | 2,020,000 | | | Hamilton Co OH Hosp Facs Rev (Children's Hosp Med Ctr) (LOC: JP Morgan Chase Bank NA) | | | 0.060 | | | 05/15/28 | | | 2,020,000 | |
| | 900,000 | | | Franklin Co OH Hosp Rev (Sub Doctors Ohiohealth) Ser B (LOC: PNC Bank N.A.) | | | 0.060 | | | 12/01/28 | | | 900,000 | |
| | 900,000 | | | Blue Ash OH EDR (Ursuline Academy Proj) (LOC: PNC Bank NA) | | | 0.060 | | | 06/01/31 | | | 900,000 | |
| | 2,300,000 | | | OH St Hgr Edl Fac Rev (Case Western Reserve University Proj) Ser A (SPA: Wells Fargo Bank NA) | | | 0.020 | | | 10/01/31 | | | 2,300,000 | |
| | 4,400,000 | | | OH St Hgr Edu Fac Rev (Case Western Reserve University Proj) Ser A (SPA: Wells Fargo Bank NA) | | | 0.020 | | | 10/01/31 | | | 4,400,000 | |
| | 1,100,000 | | | Columbus OH Swr Rev Ser B | | | 0.030 | | | 06/01/32 | | | 1,100,000 | |
| | 1,620,000 | | | Cambridge OH Hosp Facs Rev (Southeastern Ohio Regl Med) (LOC: PNC Bank NA) | | | 0.070 | | | 12/01/32 | | | 1,620,000 | |
| | 355,000 | | | OH St Hgr Edl Fac Rev (Marietta College Proj) (LOC: JP Morgan Chase Bank NA) | | | 0.070 | | | 12/01/32 | | | 355,000 | |
| | 5,500,000 | | | Cleveland OH Wtrwks Rev Ser Q (LOC: Bank of NY Mellon) | | | 0.050 | | | 01/01/33 | | | 5,500,000 | |
| | 3,030,000 | | | Hamilton Co OH Hlthcare Fac (Children's Home Cincinnati) (LOC: U.S. Bank NA) | | | 0.060 | | | 03/01/33 | | | 3,030,000 | |
| | 3,400,000 | | | OH St Air Quality Dev Auth (Poll Firstenergy Nucle) Ser B (LOC: Bank of Nova Scotia) | | | 0.040 | | | 10/01/33 | | | 3,400,000 | |
| | 4,500,000 | | | Franklin Co OH Hosp Rev (Nationwide Hosp) Ser D (SPA: Bank Of NY Mellon) | | | 0.050 | | | 11/01/33 | | | 4,500,000 | |
| | 1,730,000 | | | Columbus OH Regl Arpt Auth Rev (Cap Fdg OASBO Pg) Ser A (LOC: U.S. Bank NA) | | | 0.050 | | | 03/01/34 | | | 1,730,000 | |
| | 6,520,000 | | | Allen Co OH Hosp Facs Rev (Catholic Healthcare) Ser C (LOC: Union Bank NA) | | | 0.040 | | | 06/01/34 | | | 6,520,000 | |
| | 3,050,000 | | | Akron Bath Copley Joint Township OH (Hosp Facs Summa Hlth Sys) Ser B (LOC: JP Morgan Chase Bank NA) | | | 0.060 | | | 11/01/34 | | | 3,050,000 | |
| | 1,781,000 | | | Hamilton OH MFH Rev (Affordable Housing) Ser B (LOC: FHLB) | | | 0.170 | | | 01/01/35 | | | 1,781,000 | |
| | 2,550,000 | | | Butler Co OH Capital Funding (CCAO Low Cost Cap) Ser A (LOC: U.S. Bank NA) | | | 0.050 | | | 06/01/35 | | | 2,550,000 | |
| | 1,700,000 | | | OH St Univ (The) Ser B (LIQ: Wells Fargo Bank N.A) | | | 0.030 | | | 06/01/35 | | | 1,700,000 | |
| | 2,000,000 | | | OH St Univ (The) Ser E | | | 0.060 | | | 06/01/35 | | | 2,000,000 | |
| | 700,000 | | | Columbus OH Regl Arpt Auth Cap (OASBO Expaned Asset Sr Ser) (LOC: U.S. Bank NA) | | | 0.050 | | | 07/01/35 | | | 700,000 | |
| | 4,610,000 | | | Butler Co OH Port Auth Econ (Impt Great Miami Vy) (LOC: JP Morgan Chase Bank NA) | | | 0.080 | | | 09/01/37 | | | 4,610,000 | |
| | 4,805,000 | | | Lancaster OH Port Auth Gas Rev (SPA: Royal Bank of Canada) | | | 0.060 | | | 05/01/38 | | | 4,805,000 | |
Touchstone Ohio Tax-Free Money Market Fund (Continued)
| Principal | | | | | Interest | | | Maturity | | | |
| Amount | | | | | Rate | | | Date | | Value | |
| | | | | | | | | | | | |
| | | | | Variable Rate Demand Notes(A) — 78.3% (Continued) | | | | | | | | | | |
| $ | 2,300,000 | | | OH St Hgr Edl Fac Comm ((Hosp Cleveland Clinic Hlth Sys)) (LIQ: Bank of NY Mellon Trust) (LIQ: Wells Fargo N.A.) | | | 0.010 | % | | 01/01/39 | | $ | 2,300,000 | |
| | 4,400,000 | | | OH St Hgr Edl Fac Commis Hosp (Cleveland Clinic Hlth Sys) (LIQ: Bank of NY Mellon Trust) | | | 0.030 | | | 01/01/39 | | | 4,400,000 | |
| | 5,800,000 | | | Montgomery Co OH Rev (Miami VY Hosp) Ser B (SPA: Barclays Bank PLC) | | | 0.020 | | | 11/15/39 | | | 5,800,000 | |
| | 800,000 | | | Centerville OH Hlthcare Rev (Bethany Lutheran Vlg Proj) Ser B (LOC: PNC Bank NA) | | | 0.060 | | | 11/01/40 | | | 800,000 | |
| | 2,500,000 | | | Franklin Co OH Hosp Rev (Impt Nationwide Hosp Proj) Ser B | | | 0.030 | | | 11/01/40 | | | 2,500,000 | |
| | | | | Total Variable Rate Demand Notes | | | | | | | | $ | 122,136,000 | |
| | | | | | | | | | | | | | | |
| | | | | Fixed Rate Revenue and General Obligation Bonds — 22.5% | | | | | | | | | | |
| | 150,000 | | | Columbus OH LTGO Ser 2 | | | 5.000 | | | 07/01/14 | | | 150,000 | |
| | 100,000 | | | Columbus OH UTGO Ser 1 | | | 5.000 | | | 07/01/14 | | | 99,999 | |
| | 100,000 | | | Columbus OH (Ltd Tax) LTGO Ser 2 Pre-refunded @ $100 | | | 5.000 | | | 07/01/14 | | | 100,000 | |
| | 1,180,000 | | | Kirtland OH (BANS Var Purp) LTGO | | | 1.000 | | | 07/02/14 | | | 1,180,013 | |
| | 2,900,000 | | | Williams Co OH (BANS Bldg Impt) UTGO | | | 1.250 | | | 07/31/14 | | | 2,901,783 | |
| | 1,700,000 | | | American Muni Pwr, Inc. OH (BANS Elec Sys Impt) | | | 1.000 | | | 08/07/14 | | | 1,700,173 | |
| | 380,000 | | | Miami OH Univ (Gen Recpts) | | | 3.000 | | | 09/01/14 | | | 381,769 | |
| | 100,000 | | | Miami Univ OH | | | 4.000 | | | 09/01/14 | | | 100,620 | |
| | 125,000 | | | Miami Univ OH (St Univ Ohio) | | | 5.000 | | | 09/01/14 | | | 125,963 | |
| | 145,000 | | | OH St (Infrastructure Impt) UTGO Ser A | | | 5.000 | | | 09/01/14 | | | 146,146 | |
| | 420,000 | | | New Albany OH Cmnty Auth Cmnty Ser C | | | 3.000 | | | 10/01/14 | | | 422,835 | |
| | 1,000,000 | | | Hamilton OH (BANS Various Purpose) LTGO | | | 1.000 | | | 10/02/14 | | | 1,001,012 | |
| | 1,850,000 | | | Dayton OH CSD UTGO Ser B | | | 1.250 | | | 10/15/14 | | | 1,855,088 | |
| | 2,000,000 | | | American Muni Pwr-Ohio, Inc. OH (BANS) | | | 1.000 | | | 10/23/14 | | | 2,001,253 | |
| | 675,000 | | | Dayton OH CSD (Sch Facs Construction & Im) UTGO Ser A | | | 0.000 | | | 11/01/14 | | | 674,402 | |
| | 500,000 | | | Lakewood OH CSD (Sch Facs Impt) UTGO Ser A | | | 2.000 | | | 11/01/14 | | | 502,994 | |
| | 200,000 | | | Lakewood OH CSD (Sch Facs Impt) UTGO Ser B | | | 2.000 | | | 11/01/14 | | | 201,193 | |
| | 500,000 | | | OH St Hgr Edl Fac Commis (Denison Univ Proj) | | | 2.000 | | | 11/01/14 | | | 502,820 | |
| | 145,000 | | | OH St Hgr Edl Fac Commis (Denison Univ Proj) Pre-refunded @ $100 | | | 4.500 | | | 11/01/14 | | | 147,061 | |
| | 100,000 | | | OH St Hgr Edl Fac Commis (Denison Univ Proj) Pre-refunded @ $100 | | | 5.000 | | | 11/01/14 | | | 101,564 | |
| | 175,000 | | | OH St Hgr Edl Fac Rev (Denison Univ Proj) | | | 4.500 | | | 11/01/14 | | | 177,479 | |
| | 100,000 | | | Montgomery Co OH Rev (Miami Valley Hosp) Ser A Pre-refunded @ $100 | | | 6.000 | | | 11/15/14 | | | 102,131 | |
| | 100,000 | | | Montgomery Co OH Rev (Miami Valley Hosp) Ser A Pre-refunded @ $100 | | | 6.250 | | | 11/15/14 | | | 102,225 | |
| | 1,315,000 | | | American Muni Pwr, Inc. OH (BANS Elec Sys Impt City of Bow) | | | 1.125 | | | 11/19/14 | | | 1,315,891 | |
| | 1,145,000 | | | Pataskala OH (BANS) LTGO Ser B | | | 1.500 | | | 11/19/14 | | | 1,149,976 | |
| | 1,000,000 | | | Pataskala OH (BANS Various Purpose) LTGO Ser A | | | 1.650 | | | 11/19/14 | | | 1,005,239 | |
| | 100,000 | | | Butler Co OH (Ltd Tax Purp) LTGO | | | 4.000 | | | 12/01/14 | | | 101,538 | |
| | 100,000 | | | Chillico OH CSD (The) (Sch Impt) UTGO Pre-refunded @ $100 | | | 5.000 | | | 12/01/14 | | | 101,973 | |
| | 100,000 | | | Cincinnati OH Wtr Sys Rev Ser A | | | 4.000 | | | 12/01/14 | | | 101,564 | |
| | 150,000 | | | Cuyahoga Co OH (Cap Impt) LTGO Pre-refunded @ $100 | | | 5.000 | | | 12/01/14 | | | 152,981 | |
| | 125,000 | | | Cuyahoga Falls OH LTGO | | | 2.250 | | | 12/01/14 | | | 126,039 | |
| | 100,000 | | | Lakewood OH CSD (Sch Impt) UTGO | | | 4.500 | | | 12/01/14 | | | 101,752 | |
| | 500,000 | | | Lakewood OH CSD (Sch Impt) UTGO Pre-refunded @ $100 | | | 5.250 | | | 12/01/14 | | | 510,505 | |
| | 125,000 | | | New Albany OH Plain Local Sch (Ref Various Purpose) UTGO | | | 2.000 | | | 12/01/14 | | | 125,911 | |
| | 460,000 | | | OH St Univ (The) (Unrefunded) Ser A | | | 5.000 | | | 12/01/14 | | | 469,077 | |
| | 1,485,000 | | | Toledo OH CSD (Sch Facs Impt) UTGO | | | 2.000 | | | 12/01/14 | | | 1,495,857 | |
| | 1,870,000 | | | Cuyahoga Falls OH (BANS Various Purpose) LTGO | | | 1.000 | | | 12/04/14 | | | 1,875,978 | |
| | 150,000 | | | OH St Major New State Infras Ser 2005-1 | | | 5.000 | | | 12/15/14 | | | 153,212 | |
| | 1,665,000 | | | Mason OH (BANS Bldg Acq & Impt) LTGO | | | 1.250 | | | 12/16/14 | | | 1,672,562 | |
| | 525,000 | | | OH St Hosp Fac Rev (Cleveland Clinic Hlth) Ser B | | | 5.000 | | | 01/01/15 | | | 537,432 | |
| | 200,000 | | | OH St Hgr Edl Fac Commis (Univ Hosp Hlth Sys) Ser 2009 A Pre-refunded @ $100 | | | 6.750 | | | 01/15/15 | | | 206,950 | |
Touchstone Ohio Tax-Free Money Market Fund (Continued)
| Principal | | | | | Interest | | | Maturity | | | |
| Amount | | | | | Rate | | | Date | | Value | |
| | | | | | | | | | | | |
| | | | | Fixed Rate Revenue and General Obligation Bonds — 22.5% (Continued) | | | | | | | | | | |
| $ | 100,000 | | | OH St Hgr Edl Fac Commis (Univ Hosp Hlth Sys) Ser 2009 A Pre-refunded @ $100 | | | 7.000 | % | | 01/15/15 | | $ | 103,610 | |
| | 2,500,000 | | | North Royalton OH (BANS Muni Bldg Construction & Impt) LTGO | | | 1.000 | | | 04/08/15 | | | 2,512,448 | |
| | 811,000 | | | Maple Heights OH CSD (BANS) LTGO | | | 1.250 | | | 04/09/15 | | | 815,674 | |
| | 100,000 | | | Centerville OH CSD (Sch Impt) UTGO Pre-refunded @ $100 | | | 4.000 | | | 06/01/15 | | | 103,356 | |
| | 270,000 | | | OH St Univ Ser A Pre-refunded @ $100 | | | 5.000 | | | 06/01/15 | | | 281,599 | |
| | 2,600,000 | | | Lake Co OH Cmnty Clg Dist (TANS) LTGO | | | 1.000 | | | 06/04/15 | | | 2,607,785 | |
| | 1,455,000 | | | Euclid OH (BANS Various Purpose) Special Tax | | | 1.125 | | | 06/11/15 | | | 1,461,753 | |
| | 1,415,000 | | | Kirtland OH (BANS Various Purpose) LTGO | | | 1.000 | | | 06/30/15 | | | 1,423,419 | |
| | | | | Total Fixed Rate Revenue and General Obligation Bonds | | | | | | | | $ | 35,192,604 | |
| | | | | | | | | | | | | | | |
| | | | | Total Investment Securities —100.8% | | | | | | | | | | |
| | | | | (Cost $157,328,604) | | | | | | | | $ | 157,328,604 | |
| | | | | | | | | | | | | | | |
| | | | | Liabilities in Excess of Other Assets — (0.8%) | | | | | | | | | (1,243,112 | ) |
| | | | | | | | | | | | | | | |
| | | | | Net Assets — 100.0% | | | | | | | | $ | 156,085,492 | |
| (A) | Demand Feature - Maturities shown are the final maturities, not the date on which principal could be recovered through the demand feature. |
Other Information:
The inputs or methodology used for valuing securities may not be an indication of the risk associated with investing in those securities. For more information on valuation inputs, and their aggregation into the levels used in the table below, please refer to the security valuation section in the accompanying Notes to Financial Statements.
| Valuation inputs at Reporting Date: | |
| Description | | Level 1 | | | Level 2 | | | Level 3 | | | Total | |
| Municipal Bonds | | $ | — | | | $ | 157,328,604 | | | $ | — | | | $ | 157,328,604 | |
See accompanying Notes to Portfolios of Investments and Notes to Financial Statements.
Portfolio of Investments
Touchstone Tax-Free Money Market Fund – June 30, 2014
| Principal | | | | | Interest | | | Maturity | | | |
| Amount | | | | | Rate | | | Date | | Value | |
| | | | | | | | | | | | |
| | | | | Variable Rate Demand Notes(A) — 69.9% | | | | | | | | | | |
| $ | 750,000 | | | Lincoln Co WY Poll Control Rev (Exxon Proj) Ser A | | | 0.010 | % | | 11/01/14 | | $ | 750,000 | |
| | 210,000 | | | Franklin Co OH IDR (Ohio Girl Scout Council Proj) (LOC: PNC Bank N.A.) | | | 0.420 | | | 09/01/18 | | | 210,000 | |
| | 1,005,000 | | | Coshocton Co OH Hosp Facs Rev (Mem Hosp Proj) (LOC: JP Morgan Chase NA) | | | 0.050 | | | 03/01/19 | | | 1,005,000 | |
| | 1,150,000 | | | Summit Co OH IDR (S A Comunale Inc. Proj) (LOC: PNC Bank NA) | | | 0.110 | | | 06/01/19 | | | 1,150,000 | |
| | 750,000 | | | Lawrenceburg IN PCR (Ind Mich Pwr Co) (LOC: Bank of Nova Scotia) | | | 0.050 | | | 10/01/19 | | | 750,000 | |
| | 355,000 | | | Jackson WI IDR (J 5 Enterprise LLC Proj) Ser A (LOC: BMO Harris Bank NA) | | | 0.410 | | | 05/01/20 | | | 355,000 | |
| | 195,000 | | | Lancaster NE IDR (Garner Inds Inc) Ser B (LOC: Wells Fargo Bank NA) | | | 0.350 | | | 11/01/20 | | | 195,000 | |
| | 275,000 | | | S.W. IL Dev Auth (Deli Star Ventures Proj) (LOC: BMO Harris Bank NA) | | | 0.410 | | | 07/01/21 | | | 275,000 | |
| | 1,175,000 | | | IA St Fin Auth Small Busines Rev (Terrace Ctr Assoc L.P.) (LOC: Wells Fargo Bank NA) | | | 0.160 | | | 03/01/22 | | | 1,175,000 | |
| | 600,000 | | | Hamilton Co OH Hosp Facs Rev (Beechwood Home Proj) (LOC: PNC Bank NA) | | | 0.080 | | | 07/01/22 | | | 600,000 | |
| | 1,000,000 | | | Columbia AL IDB Poll (AL Pwr Co Proj) Ser E | | | 0.080 | | | 10/01/22 | | | 1,000,000 | |
| | 1,200,000 | | | Pima Co AZ IDA (Tucscon Elec) (LOC: Bank of NY Mellon Trust) | | | 0.080 | | | 12/01/22 | | | 1,200,000 | |
| | 835,000 | | | Milwaukee WI Redev Auth (Fred Usinger Inc Proj) (LOC: M&I Marshall & Ilsley) | | | 0.260 | | | 12/01/23 | | | 835,000 | |
| | 1,300,000 | | | Cuyahoga Co OH Arpt Fac (Corporate Wings Proj) (LOC: Privatebank And Trust) | | | 0.260 | | | 04/01/25 | | | 1,300,000 | |
| | 1,020,000 | | | Springfield MO IDA (Dmp Pptys LLC Proj) (LOC: Guaranty Bank) | | | 0.160 | | | 08/01/25 | | | 1,020,000 | |
| | 1,000,000 | | | Saint Charles Co MO IDA (Patriot Machine Inc Proj) (LOC: U.S. Bank NA) | | | 0.190 | | | 06/01/27 | | | 1,000,000 | |
| | 1,120,000 | | | Lexington-Fayette KY Urban Cnty (Eastland Parkway) (LOC: Traditional Bank, Inc.) | | | 0.210 | | | 09/01/27 | | | 1,120,000 | |
| | 500,000 | | | Lexington-Fayette KY Urban Cnty (Liberty Ridge) (LOC: Traditional Bank Inc) | | | 0.310 | | | 12/01/27 | | | 500,000 | |
| | 870,000 | | | Hendersonville TN IDB (Windsor Park Proj) (LIQ: FNMA) | | | 0.080 | | | 02/15/28 | | | 870,000 | |
| | 300,000 | | | MS St Business Fin Co (Chevron Usa Inc Proj) Ser A | | | 0.030 | | | 12/01/30 | | | 300,000 | |
| | 200,000 | | | OH St Hgr Edu Fac Rev (Case Western Reserve University Proj) Ser A (SPA: Wells Fargo Bank NA) | | | 0.020 | | | 10/01/31 | | | 200,000 | |
| | 1,100,000 | | | Columbus OH Swr Rev Ser B | | | 0.030 | | | 06/01/32 | | | 1,100,000 | |
| | 700,000 | | | Duval Cnty FL HFA (Glades Apts Proj.) (LOC: FHLMC) | | | 0.060 | | | 10/01/32 | | | 700,000 | |
| | 755,000 | | | Crawfordsville IN MF HSG Rev (Autumn Woods Phase II) Ser B (LOC: FHLB) | | | 0.240 | | | 01/01/33 | | | 755,000 | |
| | 670,000 | | | Allen Co OH Hosp Facs Rev (Catholic Healthcare) Ser C (LOC: Union Bank NA) | | | 0.040 | | | 06/01/34 | | | 670,000 | |
| | 1,000,000 | | | VT St Edl & Hlth Bldg (North Country Hosp Proj) Ser A (LOC: TD Banknorth NA) | | | 0.020 | | | 10/01/34 | | | 1,000,000 | |
| | 1,000,000 | | | New York NY UTGO Ser I6 (LOC: Bank Of NY Mellon Trust) | | | 0.030 | | | 04/01/36 | | | 1,000,000 | |
| | 1,050,000 | | | Palm Beach Co FL Rev (Henry Morrison Flagler Proj) (LOC: Northern Trust Company) | | | 0.060 | | | 11/01/36 | | | 1,050,000 | |
| | 5,000 | | | Sarasota Co FL Public Hosp (Sarasota Mem Hosp) Ser A (LOC: Northern Trust Company) | | | 0.010 | | | 07/01/37 | | | 5,000 | |
| | 925,000 | | | MA St Dev Fin Agy Rev (Seven Hills Fndtn) Ser A (LOC: TD Banknorth NA) | | | 0.050 | | | 09/01/38 | | | 925,000 | |
| | 1,000,000 | | | IL St Fin Auth Rev (Lake Forest College Proj) (LOC: Northern Trust Company) | | | 0.060 | | | 10/01/38 | | | 1,000,000 | |
| | 400,000 | | | Chatom AL IDB (Powersouth Energy Coop Proj) Ser A (SPA: National Rural Utilities Finance) | | | 0.500 | | | 11/15/38 | | | 400,000 | |
| | 620,000 | | | NY St Dorm Auth Rev (FFT Senior Cmntys Inc) (LOC: HSBC Bank USA NA) | | | 0.050 | | | 07/01/39 | | | 620,000 | |
| | | | | Total Variable Rate Demand Notes | | | | | | | | $ | 25,035,000 | |
| | | | | | | | | | | | | | | |
| | | | | Fixed Rate Revenue and General Obligation Bonds — 31.3% | | | | | | | | | | |
| | 150,000 | | | Broward Co FL Sch Brd COP Ser C Pre-refunded @ $100 | | | 5.250 | | | 07/01/14 | | | 150,000 | |
| | 115,000 | | | Compton Cmnty Clg Dist UTGO Ser A Pre-refunded @ $100 | | | 5.000 | | | 07/01/14 | | | 115,000 | |
| | 305,000 | | | GA St UTGO Ser D Pre-refunded @ $100 | | | 5.000 | | | 07/01/14 | | | 305,000 | |
| | 155,000 | | | GA St UTGO Ser C Pre-refunded @ $100 | | | 5.500 | | | 07/01/14 | | | 155,000 | |
| | 100,000 | | | MD St Hlth & Hgr Edl (Civista Med Ctr) Pre-refunded @ $100 | | | 5.000 | | | 07/01/14 | | | 100,000 | |
| | 100,000 | | | Modesto CA Irr Dist (Cap Impts) COP Ser A Pre-refunded @ $100 | | | 5.000 | | | 07/01/14 | | | 100,000 | |
| | 100,000 | | | San Francisco CA Bay Area Rapid Trans Dist Pre-refunded @ $100 | | | 4.500 | | | 07/01/14 | | | 100,000 | |
| | 100,000 | | | San Francisco CA Bay Area Rapid Trans Dist Pre-refunded @ $100 | | | 4.625 | | | 07/01/14 | | | 100,000 | |
| | 100,000 | | | Cobb Co GA Dev Auth Univ Fac (Kennesaw St Univ Hsg) Pre-refunded @ $100 | | | 5.250 | | | 07/15/14 | | | 100,190 | |
| | 600,000 | | | Williams Co OH (BANS Bldg Impt) UTGO | | | 1.250 | | | 07/31/14 | | | 600,369 | |
| | 500,000 | | | Bay Area CA Infrastructure Fin (St Pmt Acceleration Nts) Pre-refunded @ $100 | | | 5.000 | | | 08/01/14 | | | 502,021 | |
| | 100,000 | | | Ionia Co MI (Wtr & Swr Impt) LTGO Pre-refunded @ $100 | | | 3.800 | | | 08/01/14 | | | 100,292 | |
Touchstone Tax-Free Money Market Fund (Continued)
| Principal | | | | | Interest | | | Maturity | | | |
| Amount | | | | | Rate | | | Date | | Value | |
| | | | | | | | | | | | |
| | | | | Fixed Rate Revenue and General Obligation Bonds — 31.3% (Continued) | | | | | | | | | | |
| $ | 300,000 | | | Los Rios CA Cmnty Clg Dist (Election 2002) UTGO Ser C Pre-refunded @ $102 | | | 4.250 | % | | 08/01/14 | | $ | 306,964 | |
| | 100,000 | | | MA St Wtr Poll Abat Ser A | | | 5.000 | | | 08/01/14 | | | 100,395 | |
| | 100,000 | | | Orange Co FL Sch Brd COP Ser A Pre-refunded @ $100 | | | 5.000 | | | 08/01/14 | | | 100,401 | |
| | 100,000 | | | Tracy CA Jt Unif Sch Dist (Election 2006) UTGO Pre-refunded @ $100 | | | 4.500 | | | 08/01/14 | | | 100,351 | |
| | 315,000 | | | AMP, Inc. OH (BANS Elec Sys) Revenue Notes | | | 1.000 | | | 08/07/14 | | | 315,032 | |
| | 200,000 | | | IL St Fin Auth Rev (Northwestern Mem Hosp) Ser A Pre-refunded @ $100 | | | 5.500 | | | 08/15/14 | | | 201,266 | |
| | 295,000 | | | IL St Fin Auth Rev (Northwestern Mem Hosp) Ser B Pre-refunded @ $100 | | | 6.000 | | | 08/15/14 | | | 297,077 | |
| | 100,000 | | | MA St Sch Bldg Auth Rev Ser A | | | 5.000 | | | 08/15/14 | | | 100,579 | |
| | 500,000 | | | NY NY UTGO Ser C1 Pre-refunded @ $100 | | | 4.000 | | | 08/15/14 | | | 502,284 | |
| | 200,000 | | | AZ St Univ (Research Infrastructure Proj) COP Pre-refunded @ $100 | | | 5.250 | | | 09/01/14 | | | 201,659 | |
| | 405,000 | | | Pittsburgh PA Sch Dist UTGO Ser A | | | 3.000 | | | 09/01/14 | | | 406,866 | |
| | 125,000 | | | Watts Bar TN Utility Dist Wtrw Pre-refunded @ $100 | | | 4.625 | | | 09/01/14 | | | 125,910 | |
| | 125,000 | | | TX St Univ Sys Fing Rev (Unrefunded) Pre-refunded @ $100 | | | 5.000 | | | 09/15/14 | | | 126,192 | |
| | 100,000 | | | Covington TN UTGO | | | 3.550 | | | 10/01/14 | | | 100,817 | |
| | 190,000 | | | Harris Co TX (Unrefunded Bal Ref Perm Impt) LTGO Ser A Pre-refunded @ $100 | | | 5.250 | | | 10/01/14 | | | 192,374 | |
| | 100,000 | | | Jea FL St Johns River Pwr Park (Issue Three) Ser 3 Pre-refunded @ $100 | | | 5.500 | | | 10/01/14 | | | 101,285 | |
| | 240,000 | | | Saint Johns Co FL Sales Tax Ser A Pre-refunded @ $100 | | | 5.250 | | | 10/01/14 | | | 242,911 | |
| | 100,000 | | | SC St Transprtn Infrastructure Ser A Pre-refunded @ $100 | | | 5.250 | | | 10/01/14 | | | 101,250 | |
| | 215,000 | | | Spring Grove PA Area Sch Dist LTGO Ser B Pre-refunded @ $100 | | | 4.500 | | | 10/01/14 | | | 217,291 | |
| | 100,000 | | | Tallahassee FL Capital Bonds Pre-refunded @ $100 | | | 5.000 | | | 10/01/14 | | | 101,183 | |
| | 250,000 | | | Hamilton OH (BANS Various Purpose) LTGO | | | 1.000 | | | 10/02/14 | | | 250,253 | |
| | 200,000 | | | AMP-Ohio, Inc. OH (BANS) Revenue Notes | | | 1.000 | | | 10/23/14 | | | 200,125 | |
| | 100,000 | | | Palm Beach Co FL Public Impt (Biomedical Resh Park Proj) Ser A Pre-refunded @ $100 | | | 4.375 | | | 11/01/14 | | | 101,375 | |
| | 300,000 | | | Montgomery Co PA Hgr Edu & Hlth Sys (Catholic Hlth East) Ser C Pre-refunded @ $100 | | | 5.375 | | | 11/15/14 | | | 305,781 | |
| | 100,000 | | | OR St Dept Of Transprtn Hwy Ser B Pre-refunded @ $100 | | | 5.250 | | | 11/15/14 | | | 101,860 | |
| | 100,000 | | | Greenville Co SC Sch Dist IN (Bldg Equity Sooner Tomorrow) Pre-refunded @ $100 | | | 5.000 | | | 12/01/14 | | | 101,921 | |
| | 100,000 | | | King Cnty WA Sch Dist #411 ISS UTGO Ser B Pre-refunded @ $100 | | | 5.250 | | | 12/01/14 | | | 102,048 | |
| | 100,000 | | | Newport Beach CA Rev (Hoag Memorial Hosp Presb) Ser A Pre-refunded @ $100 | | | 4.625 | | | 12/01/14 | | | 101,800 | |
| | 250,000 | | | Volusia Co FL Tour Dev Tax Rev Pre-refunded @ $100 | | | 5.000 | | | 12/01/14 | | | 254,935 | |
| | 140,000 | | | Atlanta GA Arpt Passenger Fac (Sub Lien Gen) Ser J Pre-refunded @ $100 | | | 5.000 | | | 01/01/15 | | | 143,294 | |
| | 120,000 | | | Chicago IL (Proj & Ref ) UTGO | | | 5.500 | | | 01/01/15 | | | 123,056 | |
| | 100,000 | | | Crow Wing Co (Cap Impt) UTGO Ser A Pre-refunded @ $100 | | | 5.000 | | | 02/01/15 | | | 102,772 | |
| | 100,000 | | | KY St Infrastructure Aut (Wastewtr & Drinking Wtr) Ser A | | | 5.000 | | | 02/01/15 | | | 102,771 | |
| | 150,000 | | | Woodbridge Twp NJ (Gen Impt) UTGO Pre-refunded @ $100 | | | 4.100 | | | 02/01/15 | | | 153,363 | |
| | 100,000 | | | Allen TX Indep Sch Dist UTGO | | | 5.000 | | | 02/15/15 | | | 102,957 | |
| | 100,000 | | | Highland Park TX Indep Sch Dis UTGO Pre-refunded @ $100 | | | 5.000 | | | 02/15/15 | | | 102,954 | |
| | 350,000 | | | NJ St Econ Dev Auth (Sch Facs Constr) Ser L Pre-refunded @ $100 | | | 5.000 | | | 03/01/15 | | | 360,926 | |
| | 415,000 | | | TX St (Unrefunded Transptrn Commn Mob) UTGO Pre-refunded @ $100 | | | 5.000 | | | 04/01/15 | | | 429,650 | |
| | 500,000 | | | Springboro OH (BANS) LTGO | | | 1.000 | | | 04/02/15 | | | 502,436 | |
| | 500,000 | | | North Royalton OH (BANS Muni Bldg Construction) LTGO | | | 1.000 | | | 04/08/15 | | | 502,490 | |
| | 400,000 | | | Lake Co OH Cmnty Clg Dist (TANS) LTGO | | | 1.000 | | | 06/04/15 | | | 401,198 | |
| | 300,000 | | | Euclid OH (BANS Various Purpose) Special Tax | | | 1.125 | | | 06/11/15 | | | 301,392 | |
| | | | | Total Fixed Rate Revenue and General Obligation Bonds | | | | | | | | $ | 11,219,316 | |
| | | | | | | | | | | | | | | |
| | | | | Total Investment Securities —101.2% | | | | | | | | | | |
| | | | | (Cost $36,254,316) | | | | | | | | | 36,254,316 | |
| | | | | | | | | | | | | | | |
| | | | | Liabilities in Excess of Other Assets — (1.2%) | | | | | | | | | (419,693 | ) |
| | | | | | | | | | | | | | | |
| | | | | Net Assets — 100.0% | | | | | | | | $ | 35,834,623 | |
Touchstone Tax-Free Money Market Fund (Continued)
| (A) | Demand Feature - Maturities shown are the final maturities, not the date on which principal could be recovered through the demand feature. |
Other Information:
The inputs or methodology used for valuing securities may not be an indication of the risk associated with investing in those securities. For more information on valuation inputs, and their aggregation into the levels used in the table below, please refer to the security valuation section in the accompanying Notes to Financial Statements.
| Valuation Inputs at Reporting Date: | |
| Description | | Level 1 | | | Level 2 | | | Level 3 | | | Total | |
| Municipal Bonds | | $ | — | | | $ | 36,254,316 | | | $ | — | | | $ | 36,254,316 | |
See accompanying Notes to Portfolios of Investments and Notes to Financial Statements.
Notes to Portfolios of Investments
June 30, 2014
Floating and variable rate demand notes (“put bonds”) earn interest at a coupon rate which fluctuates at specified intervals, usually daily, monthly or semi-annually. The maturity dates shown in the Portfolio of Investments are the final maturity dates. The interest rates shown in the Portfolio of Investments are the coupon rates in effect at June 30, 2014.
Put bonds may be redeemed at the discretion of the holder on specified dates prior to maturity. Mandatory put bonds are automatically redeemed at a specified put date unless action is taken by the holder to prevent redemption.
Bonds denoted as pre-refunded are anticipated to be redeemed prior to their scheduled maturity. The dates indicated in the Portfolio of Investments are the stipulated pre-refunded dates.
Portfolio Abbreviations:
AMP – American Municipal Power
BANS – Bond Anticipation Notes
CCAO – County Commissioner's Association of Ohio
COP – Certificates of Participation
CSD – City School District
EDR – Economic Development Revenue
FHLB – Federal Home Loan Bank
FHLMC – Federal Home Loan Mortgage Corporation
FNMA – Federal National Mortgage Association
HFA – Housing Finance Authority/Agency
IDA – Industrial Development Authority/Agency
IDB – Industrial Development Board
IDR – Industrial Development Revenue
LIQ – Liquidity Facility
LLC – Limited Liability Company
LOC – Letter of Credit
LSD – Local School District
LTGO – Limited Tax General Obligation
MFH – Multi-Family Housing
OASBO – Ohio Association of School Business Officials
PCR – Pollution Control Revenue
PLC - Public Limited Company
SD – School District
SPA – Stand-by Purchase Agreement
TANS – Tax Anticipation Notes
UTGO – Unlimited Tax General Obligation
Portfolio Composition
June 30, 2014 (Unaudited)
As of June 30, 2014, the Touchstone Ohio Tax-Free Bond Fund and the Touchstone Ohio Tax-Free Money Market Fund were invested exclusively in debt obligations issued by the State of Ohio and its political subdivisions, agencies, authorities and instrumentalities and by other issuers, the interest from which is exempt from Ohio personal income tax. As of June 30, 2014, 37.2% of the portfolio securities of the Touchstone Tax-Free Money Market Fund were invested in the State of Ohio, 6.3% in the State of Missouri, 6.3% in the State of Florida, 4.6% in the State of Indiana, 4.0% in the State of Alabama, 3.9% in the State of Wisconsin, 3.9% in the State of Illinois, 3.8% in the State of New York, 3.4% in the Commonwealth of Kentucky, 3.3% in the State of Texas, 3.2% in the State of Vermont, 2.7% in the State of Arizona, 2.5% in the State of Washington, 2.4% in the Commonwealth of Massachusetts, 2.2% in the State of Iowa, 2.1% in the State of Colorado, 1.8% in the State of California, 1.8% in the State of Tennessee, 1.0% in the State of Georgia, 0.7% in the District of Columbia, 0.7% in the Commonwealth of Virginia, 0.6% in the State of Michigan, 0.5% in the State of South Carolina, 0.4% in the State of Nebraska, 0.3% in the State of Kansas, 0.2% in the State of Maryland and 0.2% in the State of North Carolina.
The Touchstone Ohio Tax-Free Bond Fund and the Touchstone Ohio Tax-Free Money Market Fund are each non-diversified Funds under the Investment Company Act of 1940. Thus, the Funds may invest in fewer issuers than those of a diversified fund. As of June 30, 2014, there were no investments of 10% or greater in any one issuer held by either Fund.
The Touchstone Ohio Tax-Free Money Market Fund and the Touchstone Tax-Free Money Market Fund each invest in municipal securities maturing in 397 days or less and having a short-term rating in one of the top two ratings categories by at least two nationally recognized statistical rating organizations (or by one such organization if a security is rated by only that organization) or, if unrated, are determined by the Funds’ advisor, under the supervision of the Board of Trustees of the Trust, to be of comparable quality.
The percentage of investments for each Fund as of June 30, 2014 classified by security type, was as follows:
| | | Ohio Tax-Free | | | Ohio Tax-Free | | | Tax-Free | |
| | | Bond | | | Money Market | | | Money Market | |
| | | Fund | | | Fund | | | Fund | |
| General Obligations | | | 29.7 | % | | | 15.0 | % | | | 6.5 | % |
| Prerefunded/Escrowed to Maturity | | | 12.5 | % | | | 1.3 | % | | | 21.9 | % |
| Variable Rate Demand Notes | | | 2.7 | % | | | 77.6 | % | | | 69.1 | % |
| Certificate of Participation | | | 2.1 | % | | | 0.0 | % | | | 0.0 | % |
| Special Tax | | | 0.0 | % | | | 0.9 | % | | | 0.8 | % |
| Fixed Rate Revenue Bonds | | | 53.0 | % | | | 5.2 | % | | | 1.7 | % |
| Total Investments | | | 100.0 | % | | | 100.0 | % | | | 100.0 | % |
This page intentionally left blank.
Statements of Assets and Liabilities
June 30, 2014
| | | Touchstone | | | Touchstone | | | Touchstone | |
| | | Ohio | | | Ohio | | | Tax-Free | |
| | | Tax-Free | | | Tax-Free | | | Money | |
| | | Bond | | | Money Market | | | Market | |
| | | Fund | | | Fund | | | Fund | |
| Assets | | | | | | | | | | | | |
| Investments securities | | | | | | | | | | | | |
| At amortized cost or at original cost for Touchstone Ohio Tax-Free Bond Fund | | $ | 48,374,860 | | | $ | 157,328,604 | | | $ | 36,254,316 | |
| Investments, at market value | | | 52,036,811 | | | | 157,328,604 | | | | 36,254,316 | |
| Cash | | | 32,065 | | | | 4,457 | | | | 49,717 | |
| Interest receivable | | | 345,639 | | | | 226,380 | | | | 151,697 | |
| Receivable for capital shares sold | | | 10,059 | | | | 12,458 | | | | 6,500 | |
| Receivable from Investment Advisor | | | — | | | | — | | | | 5,959 | |
| Prepaid expenses | | | 4,653 | | | | 8,069 | | | | 5,571 | |
| Total Assets | | | 52,429,227 | | | | 157,579,968 | | | | 36,473,760 | |
| | | | | | | | | | | | | |
| Liabilities | | | | | | | | | | | | |
| Dividends payable | | | 42,072 | | | | 770 | | | | — | |
| Payable for capital shares redeemed | | | 41,356 | | | | 18,859 | | | | 7,183 | |
| Payable for investments purchased | | | — | | | | 1,423,419 | | | | 590,878 | |
| Payable to Investment Advisor | | | 23,004 | | | | 11,223 | | | | — | |
| Payable to other affiliates | | | 11,177 | | | | 432 | | | | 5,263 | |
| Payable to Trustees | | | 3,190 | | | | 3,190 | | | | 3,190 | |
| Payable for professional services | | | 19,940 | | | | 20,914 | | | | 19,786 | |
| Other accrued expenses and liabilities | | | 16,806 | | | | 15,669 | | | | 12,837 | |
| Total Liabilities | | | 157,545 | | | | 1,494,476 | | | | 639,137 | |
| | | | | | | | | | | | | |
| Net Assets | | $ | 52,271,682 | | | $ | 156,085,492 | | | $ | 35,834,623 | |
| | | | | | | | | | | | | |
| Net assets consist of: | | | | | | | | | | | | |
| Paid-in capital | | $ | 48,673,479 | | | $ | 156,088,954 | | | $ | 35,838,007 | |
| Accumulated net investment loss | | | (24,103 | ) | | | (351 | ) | | | — | |
| Accumulated net realized losses on investments | | | (39,645 | ) | | | (3,111 | ) | | | (3,384 | ) |
| Net unrealized appreciation on investments | | | 3,661,951 | | | | — | | | | — | |
| Net Assets | | $ | 52,271,682 | | | $ | 156,085,492 | | | $ | 35,834,623 | |
See accompanying Notes to Financial Statements.
Statements of Assets and Liabilities (Continued)
| | | Touchstone | | | Touchstone | | | Touchstone | |
| | | Ohio | | | Ohio | | | Tax-Free | |
| | | Tax-Free | | | Tax-Free | | | Money | |
| | | Bond | | | Money Market | | | Market | |
| | | Fund | | | Fund | | | Fund | |
| Pricing of Class A Shares | | | | | | | | | | | | |
| Net assets applicable to Class A shares | | $ | 44,938,776 | | | $ | 64,580,118 | | | $ | 12,957,092 | |
| Shares of beneficial interest outstanding | | | | | | | | | | | | |
| (unlimited number of shares authorized, no par value) | | | 3,819,861 | | | | 64,575,861 | | | | 12,961,949 | |
| Net asset value price per share* | | $ | 11.76 | | | $ | 1.00 | | | $ | 1.00 | |
| Maximum offering price per share | | $ | 12.35 | | | $ | — | | | $ | — | |
| | | | | | | | | | | | | |
| Pricing of Class C Shares | | | | | | | | | | | | |
| Net assets applicable to Class C shares | | $ | 7,332,906 | | | $ | — | | | $ | — | |
| Shares of beneficial interest outstanding | | | | | | | | | | | | |
| (unlimited number of shares authorized, no par value) | | | 622,474 | | | | — | | | | — | |
| Net asset value, offering price per share** | | $ | 11.78 | | | $ | — | | | $ | — | |
| | | | | | | | | | | | | |
| Pricing of Class S Shares | | | | | | | | | | | | |
| Net assets applicable to Class S shares | | $ | — | | | $ | — | | | $ | 22,877,531 | |
| Shares of beneficial interest outstanding | | | | | | | | | | | | |
| (unlimited number of shares authorized, no par value) | | | — | | | | — | | | | 22,886,383 | |
| Net asset value, offering price and redemption price per share | | $ | — | | | $ | — | | | $ | 1.00 | |
| | | | | | | | | | | | | |
| Pricing of Institutional Class Shares | | | | | | | | | | | | |
| Net assets applicable to Institutional Class shares | | $ | — | | | $ | 91,505,374 | | | $ | — | |
| Shares of beneficial interest outstanding | | | | | | | | | | | | |
| (unlimited number of shares authorized, no par value) | | | — | | | | 91,500,110 | | | | — | |
| Net asset value, offering price and redemption price per share | | $ | — | | | $ | 1.00 | | | $ | — | |
* There is no sales load on subscriptions of $1 million or more. Redemptions that were part of $1 million subscriptions may be subject to a contingent deferred sales load if redeemed within a one-year period from the date of purchase.
** Redemption price per share varies by length of time shares are held.
See accompanying Notes to Financial Statements.
Statements of Operations
For the Year Ended June 30, 2014
| | | Touchstone | | | Touchstone | | | Touchstone | |
| | | Ohio | | | Ohio | | | Tax-Free | |
| | | Tax-Free | | | Tax-Free | | | Money | |
| | | Bond | | | Money Market | | | Market | |
| | | Fund | | | Fund | | | Fund | |
| Investment Income | | | | | | | | | | | | |
| Interest | | $ | 2,179,618 | | | $ | 270,202 | | | $ | 82,052 | |
| | | | | | | | | | | | | |
| Expenses | | | | | | | | | | | | |
| Investment advisory fees | | | 255,096 | | | | 841,654 | | | | 214,211 | |
| Administration fees | | | 82,850 | | | | 285,829 | | | | 69,613 | |
| Compliance fees and expenses | | | 1,669 | | | | 1,669 | | | | 1,669 | |
| Custody fees | | | 2,871 | | | | 8,153 | | | | 5,683 | |
| Professional fees | | | 22,691 | | | | 31,542 | | | | 22,659 | |
| Transfer Agent fees, Class A | | | 16,517 | | | | 22,082 | | | | 4,260 | |
| Transfer Agent fees, Class C | | | 3,532 | | | | — | | | | — | |
| Transfer Agent fees, Class S | | | — | | | | — | | | | 17,594 | |
| Transfer Agent fees, Institutional Class | | | — | | | | 43 | | | | — | |
| Registration fees, Class A | | | 7,594 | | | | 11,588 | | | | 10,472 | |
| Registration fees, Class C | | | 5,241 | | | | — | | | | — | |
| Registration fees, Class S | | | — | | | | — | | | | 4,957 | |
| Registration fees, Institutional Class | | | — | | | | 5,210 | | | | — | |
| Reports to Shareholders, Class A | | | 7,148 | | | | 9,178 | | | | 5,218 | |
| Reports to Shareholders, Class C | | | 6,250 | | | | — | | | | — | |
| Reports to Shareholders, Class S | | | — | | | | — | | | | 9,291 | |
| Reports to Shareholders, Institutional Class | | | — | | | | 7,146 | | | | — | |
| Distribution expenses, Class A | | | 110,792 | | | | 178,088 | | | | 33,321 | |
| Distribution expenses, Class C | | | 67,023 | | | | — | | | | — | |
| Distribution expenses, Class S | | | — | | | | — | | | | 103,299 | |
| Trustee fees | | | 13,005 | | | | 12,996 | | | | 13,007 | |
| Other expenses | | | 21,255 | | | | 18,726 | | | | 11,038 | |
| Total Expenses | | | 623,534 | | | | 1,433,904 | | | | 526,292 | |
| Fees waived and/or reimbursed by the Advisor and/or Affiliates | | | (139,604 | ) | | | (1,181,264 | ) | | | (448,499 | ) |
| Net Expenses | | | 483,930 | | | | 252,640 | | | | 77,793 | |
| | | | | | | | | | | | | |
| Net Investment Income | | | 1,695,688 | | | | 17,562 | | | | 4,259 | |
| | | | | | | | | | | | | |
| Realized and Unrealized Gains on Investments | | | | | | | | | | | | |
| Net realized gains on investments | | | 98,641 | | | | — | | | | — | |
| Net change in unrealized appreciation (depreciation) on investments | | | 1,289,582 | | | | — | | | | — | |
| Net Realized and Unrealized Gain on Investments | | | 1,388,223 | | | | — | | | | — | |
| Change in Net Assets Resulting from Operations | | $ | 3,083,911 | | | $ | 17,562 | | | $ | 4,259 | |
See accompanying Notes to Financial Statements.
Statements of Changes in Net Assets
| | | Touchstone | |
| | | Ohio Tax-Free | |
| | | Bond Fund | |
| | | For the | | | For the | |
| | | Year | | | Year | |
| | | Ended | | | Ended | |
| | | June 30, 2014 | | | June 30, 2013 | |
| From Operations | | | | | | | | |
| Net investment income | | $ | 1,695,688 | | | $ | 1,865,473 | |
| Net realized gains (losses) on investments | | | 98,641 | | | | 139,014 | |
| Net change in unrealized appreciation (depreciation) on investments | | | 1,289,582 | | | | (1,910,620 | ) |
| Change in Net Assets from Operations | | | 3,083,911 | | | | 93,867 | |
| | | | | | | | | |
| Distributions to Shareholders from: | | | | | | | | |
| Net investment income, Class A | | | (1,515,111 | ) | | | (1,684,236 | ) |
| Net investment income, Class C | | | (178,576 | ) | | | (179,334 | ) |
| Net investment income, Class S | | | — | | | | — | |
| Net investment income, Institutional Class | | | — | | | | — | |
| Net realized gains, Class A | | | (132,491 | ) | | | (301,631 | ) |
| Net realized gains, Class C | | | (19,648 | ) | | | (41,263 | ) |
| Total Distributions | | | (1,845,826 | ) | | | (2,206,464 | ) |
| | | | | | | | | |
| Net Decrease from Share Transactions (A) | | | (2,747,110 | ) | | | (1,848,885 | ) |
| | | | | | | | | |
| Total Decrease in Net Assets | | | (1,509,025 | ) | | | (3,961,482 | ) |
| | | | | | | | | |
| Net Assets | | | | | | | | |
| Beginning of period | | | 53,780,707 | | | | 57,742,189 | |
| End of period | | $ | 52,271,682 | | | $ | 53,780,707 | |
| Accumulated Net Investment Loss | | $ | (24,103 | ) | | $ | (26,103 | ) |
| (A) | For details on share transactions by class, see Statements of Changes in Net Assets - Capital Stock Activity on pages 24-25. |
See accompanying Notes to Financial Statements.
Statements of Changes in Net Assets (Continued)
| Touchstone | | | Touchstone | |
| Ohio Tax-Free | | | Tax-Free | |
| Money Market Fund | | | Money Market Fund | |
| For the | | | For the | | | For the | | | For the | |
| Year | | | Year | | | Year | | | Year | |
| Ended | | | Ended | | | Ended | | | Ended | |
| June 30, 2014 | | | June 30, 2013 | | | June 30, 2014 | | | June 30, 2013 | |
| | | | | | | | | | | |
| $ | 17,562 | | | $ | 18,870 | | | $ | 4,259 | | | $ | 4,037 | |
| | — | | | | — | | | | — | | | | (39 | ) |
| | — | | | | — | | | | — | | | | — | |
| | 17,562 | | | | 18,870 | | | | 4,259 | | | | 3,998 | |
| | | | | | | | | | | | | | | |
| | | | | | | | | | | | | | | |
| | (7,075 | ) | | | (8,195 | ) | | | (1,306 | ) | | | (1,441 | ) |
| | — | | | | — | | | | — | | | | — | |
| | — | | | | — | | | | (2,953 | ) | | | (2,596 | ) |
| | (10,486 | ) | | | (10,675 | ) | | | — | | | | — | |
| | — | | | | — | | | | — | | | | — | |
| | — | | | | — | | | | — | | | | — | |
| | (17,561 | ) | | | (18,870 | ) | | | (4,259 | ) | | | (4,037 | ) |
| | | | | | | | | | | | | | | |
| | (10,038,585 | ) | | | (6,955,904 | ) | | | (3,798,414 | ) | | | (151,419 | ) |
| | | | | | | | | | | | | | | |
| | (10,038,584 | ) | | | (6,955,904 | ) | | | (3,798,414 | ) | | | (151,458 | ) |
| | | | | | | | | | | | | | | |
| | | | | | | | | | | | | | | |
| | 166,124,076 | | | | 173,079,980 | | | | 39,633,037 | | | | 39,784,495 | |
| $ | 156,085,492 | | | $ | 166,124,076 | | | $ | 35,834,623 | | | $ | 39,633,037 | |
| $ | (351 | ) | | $ | (352 | ) | | $ | — | | | $ | (1 | ) |
Statements of Changes in Net Assets - Capital Stock Activity
| | | Touchstone | |
| | | Ohio Tax-Free | |
| | | Bond Fund | |
| | | For the Year | | | For the Year | |
| | | Ended | | | Ended | |
| | | June 30, 2014 | | | June 30, 2013 | |
| | | Shares | | | Dollars | | | Shares | | | Dollars | |
| Class A | | | | | | | | | | | | | | | | |
| Proceeds from shares sold | | | 295,046 | | | $ | 3,403,775 | | | | 373,219 | | | $ | 4,485,408 | |
| Reinvestment of distributions | | | 103,168 | | | | 1,185,918 | | | | 116,605 | | | | 1,402,624 | |
| Cost of shares redeemed | | | (659,240 | ) | | | (7,522,933 | ) | | | (688,859 | ) | | | (8,196,758 | ) |
| Change from Class A Share Transactions | | | (261,026 | ) | | | (2,933,240 | ) | | | (199,035 | ) | | | (2,308,726 | ) |
| Class C | | | | | | | | | | | | | | | | |
| Proceeds from shares sold | | | 88,833 | | | | 1,030,070 | | | | 102,873 | | | | 1,238,447 | |
| Reinvestment of distributions | | | 11,584 | | | | 133,392 | | | | 11,841 | | | | 142,658 | |
| Cost of shares redeemed | | | (85,592 | ) | | | (977,332 | ) | | | (77,296 | ) | | | (921,264 | ) |
| Change from Class C Share Transactions | | | 14,825 | | | | 186,130 | | | | 37,418 | | | | 459,841 | |
| Class S | | | | | | | | | | | | | | | | |
| Proceeds from shares sold | | | — | | | | — | | | | — | | | | — | |
| Reinvestment of distributions | | | — | | | | — | | | | — | | | | — | |
| Cost of shares redeemed | | | — | | | | — | | | | — | | | | — | |
| Change from Class S Share Transactions | | | — | | | | — | | | | — | | | | — | |
| Institutional Class | | | | | | | | | | | | | | | | |
| Proceeds from shares sold | | | — | | | | — | | | | — | | | | — | |
| Reinvestment of distributions | | | — | | | | — | | | | — | | | | — | |
| Cost of shares redeemed | | | — | | | | — | | | | — | | | | — | |
| Change from Institutional Class Share Transactions | | | — | | | | — | | | | — | | | | — | |
| Net Decrease from Share Transactions | | | (246,201 | ) | | $ | (2,747,110 | ) | | | (161,617 | ) | | $ | (1,848,885 | ) |
See accompanying Notes to Financial Statements.
Statements of Changes in Net Assets - Capital Stock Activity (Continued)
| Touchstone | | | Touchstone | |
| Ohio Tax-Free | | | Tax-Free | |
| Money Market Fund | | | Money Market Fund | |
| For the Year | | | For the Year | | | For the Year | | | For the Year | |
| Ended | | | Ended | | | Ended | | | Ended | |
| June 30, 2014 | | | June 30, 2013 | | | June 30, 2014 | | | June 30, 2013 | |
| Shares | | | Dollars | | | Shares | | | Dollars | | | Shares | | | Dollars | | | Shares | | | Dollars | |
| | | | | | | | | | | | | | | | | | | | | | | |
| | 92,647,241 | | | $ | 92,647,241 | | | | 119,641,807 | | | $ | 119,641,807 | | | | 2,926,726 | | | $ | 2,926,726 | | | | 2,436,605 | | | $ | 2,436,605 | |
| | 7,061 | | | | 7,061 | | | | 8,163 | | | | 8,163 | | | | 1,305 | | | | 1,305 | | | | 1,404 | | | | 1,404 | |
| | (108,415,868 | ) | | | (108,415,868 | ) | | | (115,393,911 | ) | | | (115,393,911 | ) | | | (3,240,666 | ) | | | (3,240,666 | ) | | | (4,032,547 | ) | | | (4,032,547 | ) |
| | (15,761,566 | ) | | | (15,761,566 | ) | | | 4,256,059 | | | | 4,256,059 | | | | (312,635 | ) | | | (312,635 | ) | | | (1,594,538 | ) | | | (1,594,538 | ) |
| | | | | | | | | | | | | | | | | | | | | | | | | | | | | | | |
| | — | | | | — | | | | — | | | | — | | | | — | | | | — | | | | — | | | | — | |
| | — | | | | — | | | | — | | | | — | | | | — | | | | — | | | | — | | | | — | |
| | — | | | | — | | | | — | | | | — | | | | — | | | | — | | | | — | | | | — | |
| | — | | | | — | | | | — | | | | — | | | | — | | | | — | | | | — | | | | — | |
| | | | | | | | | | | | | | | | | | | | | | | | | | | | | | | |
| | — | | | | — | | | | — | | | | — | | | | 52,623,013 | | | | 52,623,013 | | | | 51,658,323 | | | | 51,658,323 | |
| | — | | | | — | | | | — | | | | — | | | | 2,913 | | | | 2,913 | | | | 2,593 | | | | 2,593 | |
| | — | | | | — | | | | — | | | | — | | | | (56,111,705 | ) | | | (56,111,705 | ) | | | (50,217,797 | ) | | | (50,217,797 | ) |
| | — | | | | — | | | | — | | | | — | | | | (3,485,779 | ) | | | (3,485,779 | ) | | | 1,443,119 | | | | 1,443,119 | |
| | | | | | | | | | | | | | | | | | | | | | | | | | | | | | | |
| | 172,238,589 | | | | 172,238,589 | | | | 216,567,513 | | | | 216,567,513 | | | | — | | | | — | | | | — | | | | — | |
| | 34 | | | | 34 | | | | 73 | | | | 73 | | | | — | | | | — | | | | — | | | | — | |
| | (166,515,642 | ) | | | (166,515,642 | ) | | | (227,779,549 | ) | | | (227,779,549 | ) | | | — | | | | — | | | | — | | | | — | |
| | 5,722,981 | | | | 5,722,981 | | | | (11,211,963 | ) | | | (11,211,963 | ) | | | — | | | | — | | | | — | | | | — | |
| | (10,038,585 | ) | | $ | (10,038,585 | ) | | | (6,955,904 | ) | | $ | (6,955,904 | ) | | | (3,798,414 | ) | | $ | (3,798,414 | ) | | | (151,419 | ) | | $ | (151,419 | ) |
Financial Highlights
Touchstone Ohio Tax-Free Bond Fund — Class A
Selected Data for a Share Outstanding Throughout Each Period
| | | Year Ended June 30, | |
| | | 2014 | | | 2013 | | | 2012 | | | 2011 | | | 2010 | |
| Net asset value at beginning of period | | $ | 11.47 | | | $ | 11.90 | | | $ | 11.36 | | | $ | 11.55 | | | $ | 11.22 | |
| Income (loss) from investment operations: | | | | | | | | | | | | | | | | | | | | |
| Net investment income | | | 0.39 | | | | 0.39 | | | | 0.41 | | | | 0.42 | | | | 0.42 | |
| Net realized and unrealized gains (losses) on investments | | | 0.33 | | | | (0.36 | ) | | | 0.55 | | | | (0.10 | ) | | | 0.33 | |
| Total from investment operations | | | 0.72 | | | | 0.03 | | | | 0.96 | | | | 0.32 | | | | 0.75 | |
| Distributions from: | | | | | | | | | | | | | | | | | | | | |
| Net investment income | | | (0.39 | ) | | | (0.39 | ) | | | (0.41 | ) | | | (0.42 | ) | | | (0.42 | ) |
| Realized capital gains | | | (0.04 | ) | | | (0.07 | ) | | | (0.01 | ) | | | (0.09 | ) | | | — | |
| Total distributions | | | (0.43 | ) | | | (0.46 | ) | | | (0.42 | ) | | | (0.51 | ) | | | (0.42 | ) |
| Net asset value at end of period | | $ | 11.76 | | | $ | 11.47 | | | $ | 11.90 | | | $ | 11.36 | | | $ | 11.55 | |
| Total return(A) | | | 6.41 | % | | | 0.13 | % | | | 8.60 | % | | | 2.85 | % | | | 6.77 | % |
| Ratios and supplemental data: | | | | | | | | | | | | | | | | | | | | |
| Net assets at end of period (000's) | | $ | 44,939 | | | $ | 46,803 | | | $ | 50,946 | | | $ | 47,991 | | | $ | 53,947 | |
| Ratio to average net assets: | | | | | | | | | | | | | | | | | | | | |
| Net expenses | | | 0.85 | % | | | 0.85 | % | | | 0.85 | % | | | 0.85 | % | | | 0.85 | % |
| Gross expenses | | | 1.10 | % | | | 1.09 | % | | | 1.12 | % | | | 1.15 | % | | | 1.15 | % |
| Net investment income | | | 3.42 | % | | | 3.25 | % | | | 3.51 | % | | | 3.67 | % | | | 3.66 | % |
| Portfolio turnover rate | | | 25 | % | | | 24 | % | | | 33 | % | | | 26 | % | | | 33 | % |
Touchstone Ohio Tax-Free Bond Fund — Class C
Selected Data for a Share Outstanding Throughout Each Period
| | | Year Ended June 30, | |
| | | 2014 | | | 2013 | | | 2012 | | | 2011 | | | 2010 | |
| Net asset value at beginning of period | | $ | 11.48 | | | $ | 11.92 | | | $ | 11.37 | | | $ | 11.57 | | | $ | 11.23 | |
| Income (loss) from investment operations: | | | | | | | | | | | | | | | | | | | | |
| Net investment income | | | 0.31 | | | | 0.30 | | | | 0.32 | | | | 0.34 | | | | 0.34 | |
| Net realized and unrealized gains (losses) on investments | | | 0.34 | | | | (0.37 | ) | | | 0.56 | | | | (0.11 | ) | | | 0.34 | |
| Total from investment operations | | | 0.65 | | | | (0.07 | ) | | | 0.88 | | | | 0.23 | | | | 0.68 | |
| Distributions from: | | | | | | | | | | | | | | | | | | | | |
| Net investment income | | | (0.31 | ) | | | (0.30 | ) | | | (0.32 | ) | | | (0.34 | ) | | | (0.34 | ) |
| Realized capital gains | | | (0.04 | ) | | | (0.07 | ) | | | (0.01 | ) | | | (0.09 | ) | | | — | |
| Total distributions | | | (0.35 | ) | | | (0.37 | ) | | | (0.33 | ) | | | (0.43 | ) | | | (0.34 | ) |
| Net asset value at end of period | | $ | 11.78 | | | $ | 11.48 | | | $ | 11.92 | | | $ | 11.37 | | | $ | 11.57 | |
| Total return(A) | | | 5.70 | % | | | (0.70 | )% | | | 7.87 | % | | | 1.99 | % | | | 6.06 | % |
| Ratios and supplemental data: | | | | | | | | | | | | | | | | | | | | |
| Net assets at end of period (000's) | | $ | 7,333 | | | $ | 6,978 | | | $ | 6,797 | | | $ | 6,169 | | | $ | 6,459 | |
| Ratio to average net assets: | | | | | | | | | | | | | | | | | | | | |
| Net expenses | | | 1.60 | % | | | 1.60 | % | | | 1.60 | % | | | 1.60 | % | | | 1.60 | % |
| Gross expenses | | | 2.01 | % | | | 1.99 | % | | | 2.07 | % | | | 2.06 | % | | | 1.96 | % |
| Net investment income | | | 2.67 | % | | | 2.50 | % | | | 2.76 | % | | | 2.92 | % | | | 2.91 | % |
| Portfolio turnover rate | | | 25 | % | | | 24 | % | | | 33 | % | | | 26 | % | | | 33 | % |
| (A) | Total returns shown exclude the effect of applicable sales loads. If these charges were included, the returns would be lower. |
See accompanying Notes to Financial Statements.
Financial Highlights (Continued)
Touchstone Ohio Tax-Free Money Market Fund — Class A
Selected Data for a Share Outstanding Throughout Each Period
| | | Year Ended June 30, | |
| | | 2014 | | | 2013 | | | 2012 | | | 2011 | | | 2010 | |
| Net asset value at beginning of period | | $ | 1.000 | | | $ | 1.000 | | | $ | 1.000 | | | $ | 1.000 | | | $ | 1.000 | |
| Income (loss) from investment operations: | | | | | | | | | | | | | | | | | | | | |
| Net investment income | | | — | (A) | | | — | (A) | | | — | (A) | | | — | (A) | | | — | (A) |
| Net realized gains (losses) on investments | | | — | | | | — | | | | (— | )(A) | | | (— | )(A) | | | — | (A) |
| Total from investment operations | | | — | (A) | | | — | (A) | | | — | (A) | | | — | (A) | | | — | (A) |
| Distributions from: | | | | | | | | | | | | | | | | | | | | |
| Net investment income | | | (— | )(A) | | | (— | )(A) | | | (— | )(A) | | | (— | )(A) | | | (— | )(A) |
| Realized capital gains | | | — | | | | — | | | | — | | | | (— | )(A) | | | — | |
| Total distributions | | | (— | )(A) | | | (— | )(A) | | | (— | )(A) | | | (— | )(A) | | | (— | )(A) |
| Net asset value at end of period | | $ | 1.000 | | | $ | 1.000 | | | $ | 1.000 | | | $ | 1.000 | | | $ | 1.000 | |
| Total return | | | 0.01 | % | | | 0.01 | % | | | 0.01 | % | | | 0.01 | % | | | 0.04 | % |
| Ratios and supplemental data: | | | | | | | | | | | | | | | | | | | | |
| Net assets at end of period (000's) | | $ | 64,580 | | | $ | 80,342 | | | $ | 76,086 | | | $ | 76,640 | | | $ | 105,251 | |
| Ratio to average net assets: | | | | | | | | | | | | | | | | | | | | |
| Net expenses | | | 0.14 | % | | | 0.24 | % | | | 0.29 | % | | | 0.40 | % | | | 0.62 | %(B) |
| Gross expenses | | | 0.99 | % | | | 0.98 | % | | | 1.00 | % | | | 1.01 | % | | | 0.99 | % |
| Net investment income | | | 0.01 | % | | | 0.01 | % | | | 0.00 | %(A) | | | 0.01 | % | | | 0.04 | % |
Touchstone Ohio Tax-Free Money Market Fund — Institutional Class
Selected Data for a Share Outstanding Throughout Each Period
| | | Year Ended June 30, | |
| | | 2014 | | | 2013 | | | 2012 | | | 2011 | | | 2010 | |
| Net asset value at beginning of period | | $ | 1.000 | | | $ | 1.000 | | | $ | 1.000 | | | $ | 1.000 | | | $ | 1.000 | |
| Income (loss) from investment operations: | | | | | | | | | | | | | | | | | | | | |
| Net investment income | | | — | (A) | | | — | (A) | | | — | (A) | | | — | (A) | | | 0.002 | |
| Net realized gains (losses) on investments | | | — | | | | — | | | | (— | )(A) | | | (— | )(A) | | | — | (A) |
| Total from investment operations | | | — | (A) | | | — | (A) | | | — | (A) | | | — | (A) | | | 0.002 | |
| Distributions from: | | | | | | | | | | | | | | | | | | | | |
| Net investment income | | | (— | )(A) | | | (— | )(A) | | | (— | )(A) | | | (— | )(A) | | | (0.002 | ) |
| Realized capital gains | | | — | | | | — | | | | — | | | | (— | )(A) | | | — | |
| Total distributions | | | (— | )(A) | | | (— | )(A) | | | (— | )(A) | | | (— | )(A) | | | (0.002 | ) |
| Net asset value at end of period | | $ | 1.000 | | | $ | 1.000 | | | $ | 1.000 | | | $ | 1.000 | | | $ | 1.000 | |
| Total return | | | 0.01 | % | | | 0.01 | % | | | 0.01 | % | | | 0.01 | % | | | 0.15 | % |
| Ratios and supplemental data: | | | | | | | | | | | | | | | | | | | | |
| Net assets at end of period (000's) | | $ | 91,505 | | | $ | 85,782 | | | $ | 96,994 | | | $ | 118,765 | | | $ | 148,626 | |
| Ratio to average net assets: | | | | | | | | | | | | | | | | | | | | |
| Net expenses | | | 0.14 | % | | | 0.24 | % | | | 0.28 | % | | | 0.40 | % | | | 0.51 | %(C) |
| Gross expenses | | | 0.69 | % | | | 0.71 | % | | | 0.70 | % | | | 0.72 | % | | | 0.71 | % |
| Net investment income | | | 0.01 | % | | | 0.01 | % | | | 0.01 | % | | | 0.01 | % | | | 0.16 | % |
| (A) | Amount rounds to less than $0.0005 per share or 0.005%. |
| (B) | Absent money market insurance, the ratio of net expenses to average net assets would have been 0.61% for the year ended June 30, 2010. |
| (C) | Absent money market insurance, the ratio of net expenses to average net assets would have been 0.50% for the year ended June 30, 2010. |
See accompanying Notes to Financial Statements.
Financial Highlights (Continued)
Touchstone Tax-Free Money Market Fund — Class A
Selected Data for a Share Outstanding Throughout Each Period
| | | Year Ended June 30, | |
| | | 2014 | | | 2013 | | | 2012 | | | 2011 | | | 2010 | |
| Net asset value at beginning of period | | $ | 1.000 | | | $ | 1.000 | | | $ | 1.000 | | | $ | 1.000 | | | $ | 1.000 | |
| Income (loss) from investment operations: | | | | | | | | | | | | | | | | | | | | |
| Net investment income | | | — | (A) | | | — | (A) | | | — | (A) | | | — | (A) | | | — | (A) |
| Net realized gains (losses) on investments | | | — | | | | (— | )(A) | | | (— | )(A) | | | (— | )(A) | | | — | (A) |
| Total from investment operations | | | — | (A) | | | — | (A) | | | — | (A) | | | — | (A) | | | — | (A) |
| Distributions from: | | | | | | | | | | | | | | | | | | | | |
| Net investment income | | | (— | )(A) | | | (— | )(A) | | | (— | )(A) | | | (— | )(A) | | | (— | )(A) |
| Net asset value at end of period | | $ | 1.000 | | | $ | 1.000 | | | $ | 1.000 | | | $ | 1.000 | | | $ | 1.000 | |
| Total return | | | 0.01 | % | | | 0.01 | % | | | 0.01 | % | | | 0.01 | % | | | 0.03 | % |
| Ratios and supplemental data: | | | | | | | | | | | | | | | | | | | | |
| Net assets at end of period (000's) | | $ | 12,957 | | | $ | 13,270 | | | $ | 14,864 | | | $ | 16,366 | | | $ | 17,405 | |
| Ratio to average net assets: | | | | | | | | | | | | | | | | | | | | |
| Net expenses | | | 0.18 | % | | | 0.30 | % | | | 0.33 | % | | | 0.52 | % | | | 0.77 | %(B) |
| Gross expenses | | | 1.19 | % | | | 1.18 | % | | | 1.24 | % | | | 1.18 | % | | | 1.22 | % |
| Net investment income | | | 0.01 | % | | | 0.01 | % | | | 0.01 | % | | | 0.01 | % | | | 0.04 | % |
Touchstone Tax-Free Money Market Fund — Class S
Selected Data for a Share Outstanding Throughout Each Period
| | | Year Ended June 30, | |
| | | 2014 | | | 2013 | | | 2012 | | | 2011 | | | 2010 | |
| Net asset value at beginning of period | | $ | 1.000 | | | $ | 1.000 | | | $ | 1.000 | | | $ | 1.000 | | | $ | 1.000 | |
| Income (loss) from investment operations: | | | | | | | | | | | | | | | | | | | | |
| Net investment income | | | — | (A) | | | — | (A) | | | — | (A) | | | — | (A) | | | — | (A) |
| Net realized gains (losses) on investments | | | — | | | | (— | )(A) | | | (— | )(A) | | | (— | )(A) | | | — | (A) |
| Total from investment operations | | | — | (A) | | | — | (A) | | | — | (A) | | | — | (A) | | | — | (A) |
| Distributions from: | | | | | | | | | | | | | | | | | | | | |
| Net investment income | | | (— | )(A) | | | (— | )(A) | | | (— | )(A) | | | (— | )(A) | | | (— | )(A) |
| Net asset value at end of period | | $ | 1.000 | | | $ | 1.000 | | | $ | 1.000 | | | $ | 1.000 | | | $ | 1.000 | |
| Total return | | | 0.01 | % | | | 0.01 | % | | | 0.01 | % | | | 0.01 | % | | | 0.01 | % |
| Ratios and supplemental data: | | | | | | | | | | | | | | | | | | | | |
| Net assets at end of period (000's) | | $ | 22,878 | | | $ | 26,363 | | | $ | 24,920 | | | $ | 30,943 | | | $ | 34,777 | |
| Ratio to average net assets: | | | | | | | | | | | | | | | | | | | | |
| Net expenses | | | 0.18 | % | | | 0.30 | % | | | 0.33 | % | | | 0.52 | % | | | 0.79 | %(C) |
| Gross expenses | | | 1.25 | % | | | 1.27 | % | | | 1.30 | % | | | 1.26 | % | | | 1.50 | % |
| Net investment income | | | 0.01 | % | | | 0.01 | % | | | 0.01 | % | | | 0.01 | % | | | 0.01 | % |
| (A) | Amount rounds to less than $0.0005 per share. |
| (B) | Absent money market insurance, the ratio of net expenses to average net assets would have been 0.76% for the year ended June 30, 2010. |
| (C) | Absent money market insurance, the ratio of net expenses to average net assets would have been 0.78% for the year ended June 30, 2010. |
See accompanying Notes to Financial Statements.
Notes to Financial Statements
June 30, 2014
1. Organization
The Touchstone Tax-Free Trust (the “Trust”) is registered under the Investment Company Act of 1940, as amended (the “1940 Act”), as an open-end management investment company. The Trust was established as a Massachusetts business trust pursuant to a Declaration of Trust dated April 13, 1981. The Trust consists of the following three funds (individually, a “Fund”, and collectively, the “Funds”):
Touchstone Ohio Tax-Free Bond Fund (“Ohio Tax-Free Bond Fund”)
Touchstone Ohio Tax-Free Money Market Fund (“Ohio Tax-Free Money Market Fund”)
Touchstone Tax-Free Money Market Fund (“Tax-Free Money Market Fund”)
The Tax-Free Money Market Fund is an open-end, diversified, management investment company. The Ohio Tax-Free Bond Fund and the Ohio Tax-Free Money Market Fund are each an open-end, non-diversified, management investment company.
The Declaration of Trust permits the Trust to issue an unlimited number of shares of beneficial interest of each Fund. The Funds are registered to offer the following classes of shares: Class A shares, Class C shares, Class S shares and Institutional Class shares. Currently, each Fund offers Class A shares while Class C, Class S and Institutional Class shares are offered only by Ohio Tax-Free Bond Fund, Tax-Free Money Market Fund and Ohio Tax-Free Money Market Fund, respectively. The assets of each Fund are segregated, and a shareholder’s interest is limited to the Fund in which shares are held. The Funds’ prospectus provides a description of each Fund’s investment goals, policies, and strategies along with information on the classes of shares currently being offered.
2. Significant Accounting Policies
The following is a summary of the Funds’ significant accounting policies:
Security valuation and fair value measurements— All investments in securities are recorded at their estimated fair value. The Funds define the term “market value”, as used throughout this report, as the estimated fair value. The Funds use various methods to measure fair value of their portfolio securities on a recurring basis. Generally accepted accounting principles in the United States (“U.S. GAAP”) establish a hierarchy that prioritizes inputs to valuation methods. These inputs are summarized in the three broad levels listed below:
| · | Level 1 – | quoted prices in active markets for identical securities |
| | | |
| · | Level 2 – | other significant observable inputs (including quoted prices for similar securities, interest rates, prepayment speeds, credit risk, etc.) |
| | | |
| · | Level 3 – | significant unobservable inputs (including a Fund’s own assumptions in determining the fair value of investments) |
The inputs or methodology used for valuing securities are not necessarily an indication of the risk associated with investing in those securities. For example, money market instruments are valued using amortized cost, in accordance with rules under the 1940 Act. Generally, amortized cost approximates the current fair value of a security, but since the value is not obtained from a quoted price in an active market, such securities are reflected as Level 2.
The aggregate value by input level, as of June 30, 2014, for each Fund’s investments, as well as a reconciliation of assets for which significant unobservable inputs (Level 3) were used in determining value, if applicable, is included in each Fund’s Portfolio of Investments, which also includes a breakdown of the Fund’s investments by portfolio allocation. The Funds did not hold any Level 3 categorized securities during the year ended June 30, 2014.
Notes to Financial Statements (Continued)
All transfers in and out of the levels are recognized at the value at the end of the period. During the year ended June 30, 2014, there were no transfers between Levels 1, 2 and 3 for all Funds.
Investments held by the Touchstone Ohio Tax-Free Money Market Fund and Touchstone Tax-Free Money Market Fund are valued under the amortized cost method which approximates current market value in accordance with Rule 2a-7 under the 1940 Act. Under this method, investments are valued at cost when purchased and thereafter, a constant proportionate accretion of discounts and amortization of premiums are recorded until the maturity of the security.
Debt securities for which market quotations are readily available are valued at their most recent evaluated bid prices as obtained from one or more of the major market makers for such securities by an independent pricing service and are categorized in Level 2. Debt securities for which market quotations are not readily available are valued at their most recent evaluated bid by an independent pricing service using other significant observable inputs (including quoted prices for similar securities, interest rates, prepayment speeds, credit risk, etc.) and are categorized in Level 2. Money market instruments and other debt securities with a remaining maturity of less than 60 days are valued at amortized cost, which approximates market value and are categorized in Level 2. While this method provides consistency in valuation (and may only be used if it approximates market value), it may result in periods during which value, as determined by amortized cost, is higher or lower than the price that would be received if the Fund sold the investment. Securities for which market quotations, the NASDAQ Official Closing Price, or other significant observable inputs are not readily available are fair valued as determined by or under the direction of the Board of Trustees (the “Board”) and are categorized in Level 3. Shares of open-end mutual funds in which the Funds invest are valued at their respective net asset values (“NAV”) as reported by the underlying Funds and are categorized in Level 1.
Level 2 Valuation— Securities mainly traded on a non-U.S. exchange are generally valued according to the preceding closing values on that exchange. However, if an event that may change the value of a security occurs after the time that the closing value on the non-U.S. exchange was determined, but before the close of regular trading on the New York Stock Exchange (“NYSE”), the security may be priced based on fair value. This may cause the value of the security, if held on the books of a Fund, to be different from the closing value on the non-U.S. exchange and may affect the calculation of that Fund’s net asset value (“NAV”).
Level 3 Valuation— Securities held by the Funds that do not have readily available market quotations, significant observable inputs or securities for which the available market quotations are not reliable, are priced at their fair value using procedures approved by the Funds’ Board.
The Funds may use fair value pricing under the following circumstances, among others:
| · | If the value of a security has been materially affected by events occurring before the Funds’ pricing time but after the close of the primary markets on which the security is traded. |
| · | If the exchange on which a portfolio security is principally traded closes early or if trading in a particular portfolio security was halted during the day and did not resume prior to the Funds’ NAV calculation. |
| · | If a security is so thinly traded that reliable market quotations are unavailable due to infrequent trading. |
| · | If the validity of market quotations is not reliable. |
When-Issued or delayed delivery transactions— Each Fund may purchase or sell securities on a when-issued or delayed delivery basis. These transactions involve a commitment by the Fund to purchase or sell securities for a predetermined price or yield, with payment and delivery taking place beyond the customary settlement period. When delayed delivery purchases are outstanding, the Fund will set aside liquid assets in an amount sufficient to meet the purchase price. When purchasing a security on a delayed delivery basis, the Fund assumes the rights and risks of ownership of the security, including the risk of price and yield fluctuations, and takes
Notes to Financial Statements (Continued)
such fluctuations into account when determining NAV. The Fund may dispose of or renegotiate a delayed delivery transaction after it is entered into, and may sell when-issued securities before they are delivered, which may result in a capital gain or loss. When the Fund has sold a security on a delayed delivery basis, the Fund does not participate in future gains and losses with respect to the security.
Share valuation— The NAV per share of each class of shares of each Fund is calculated daily by dividing the total value of a Fund’s assets attributable to that class, less liabilities attributable to that class, by the number of outstanding shares of that class.
The maximum offering price per share of each class of shares of the Ohio Tax-Free Money Market Fund and the Tax-Free Money Market Fund is equal to the NAV per share. The maximum offering price per share of Class A shares of the Ohio Tax-Free Bond Fund is equal to the NAV per share plus a sales load equal to 4.99% of the NAV (or 4.75% of the offering price). There is no sales load on purchases of $1 million or more of Class A shares of the Ohio Tax-Free Bond Fund. The maximum offering price per share of Class C shares of the Ohio Tax-Free Bond Fund is equal to the NAV per share.
The redemption price per share of each class of shares of the Funds is generally equal to the NAV per share. However, Class A redemptions that were part of a no load $1 million subscription may be subject to a contingent deferred sales charge (“CDSC”) of up to 1.00% and Class C shares of the Ohio Tax Free Bond Fund are subject to a CDSC of 1.00% that will be assessed on an amount equal to the lesser of (1) the NAV at the time of purchase of the shares being redeemed or (2) the NAV of such shares being redeemed if redeemed within a one-year period from the date of purchase.
Investment income—Interest income from securities is recorded on the basis of interest accrued, premium amortized and discount accreted. Market discounts, original issue discount (“OID”) and market premiums on debt securities are accreted/amortized to interest income over the life of the security with a corresponding adjustment in the cost basis of that security.
Distributions to shareholders— Each Fund intends to distribute to its shareholders substantially all of its income and capital gains. Each Fund declares distributions from net investment income on a daily basis and distributes as a dividend to shareholders on a monthly basis. Each Fund makes distributions of capital gains, if any, at least annually, net of applicable capital loss carryforwards. Income distributions and capital gain distributions are determined in accordance with income tax regulations.
Allocations— Investment income earned, realized capital gains and losses, and unrealized appreciation and depreciation for a Fund are allocated daily to each class of shares based upon its proportionate share of total net assets of the Fund. Class-specific expenses are charged directly to the class incurring the expense. Common expenses, which are not attributable to a specific class, are allocated daily to each class of shares based upon their proportionate share of total net assets of the Fund. Expenses not directly billed to a Fund are allocated proportionally among all the Funds in the Trust, and if applicable, Touchstone Investment Trust, Touchstone Strategic Trust, Touchstone Variable Series Trust, Touchstone Institutional Funds Trust and Touchstone Funds Group Trust (collectively with the Trust, “Touchstone Funds Complex”), daily in relation to net assets of each Fund or another reasonable measure.
Security transactions— Security transactions are reflected for financial reporting purposes as of the trade date. Realized gains and losses on sales of portfolio securities are calculated using the identified cost basis.
Notes to Financial Statements (Continued)
Estimates— The preparation of financial statements in conformity with U.S. GAAP requires management to make estimates and assumptions that affect the reported amounts of assets and liabilities and disclosure of contingent assets and liabilities at the date of the financial statements and the reported amounts of income and expenses during the reporting period. Actual results could differ from those estimates.
3. Investment Transactions
Investment transactions (excluding short-term investments and U.S. Government securities) were as follows for the year ended June 30, 2014:
| | | Ohio Tax-Free | |
| | | Bond Fund | |
| Purchases of investment securities | | $ | 12,627,026 | |
| Proceeds from sales and maturities | | $ | 16,185,029 | |
There were no purchases or proceeds from sales and maturities of U.S. Government securities, by the Ohio Tax-Free Bond Fund for the year ended June 30, 2014.
4. Transactions with Affiliates and Other Related Parties
Certain officers of the Trust are also officers of Touchstone Advisors, Inc. (the “Advisor”), Touchstone Securities, Inc. (the “Underwriter”), or BNY Mellon Investment Servicing (U.S.) Inc. (“BNY Mellon”), the Sub-Administrator and Transfer Agent to the Funds. Such officers receive no compensation from the Trust. The Advisor and the Underwriter are each wholly-owned, indirect subsidiaries of Western & Southern Financial Group, Inc. (“Western & Southern”).
On behalf of the Funds, the Advisor pays each Independent Trustee a quarterly retainer plus additional retainers to the Lead Independent Trustee and the chairs of each standing committee. Interested Trustees do not receive compensation from the Funds. Each Independent Trustee will also receive compensation for each board meeting and committee meeting attended. Each standing committee chair will receive additional compensation for each committee meeting that he or she oversees. The Advisor is reimbursed by the Funds for the Independent Trustees’ compensation and out-of-pocket expenses relating to their services. The Funds accrued Trustee - related expenses of $39,008 for the year ended June 30, 2014.
Management & Expense Limitation Agreements
The Advisor provides general investment supervisory services for the Funds, under terms of an advisory agreement (the “Advisory Agreement”). Under the Advisory Agreement, each Fund pays the Advisor a fee, which is computed and accrued daily and paid monthly, at an annual rate based on average daily net assets of each Fund as shown in the table below.
| 0.50% of the first $100 million |
| 0.45% of the next $100 million |
| 0.40% of the next $100 million |
| 0.375% of such assets in excess of $300 million |
The Advisor has entered into investment sub-advisory agreements with Fort Washington Investment Advisors, Inc. (the “Sub-Advisor”). The Sub-Advisor is a wholly-owned, indirect subsidiary of Western & Southern. The Advisor, not the Funds, pays sub-advisory fees to the Sub-Advisor.
The Advisor entered into an expense limitation agreement (the “Expense Limitation Agreement”) to contractually limit operating expenses of the Funds, excluding: dividend and interest expenses on short sales; interest; taxes;
Notes to Financial Statements (Continued)
brokerage commissions; other expenditures which are capitalized in accordance with GAAP; the cost of “Acquired Fund Fees and Expenses”, if any; and other extraordinary expenses not incurred in the ordinary course of business. The maximum operating expense limit in any year with respect to the Funds is based on a percentage of the average daily net assets of the Funds. The Advisor has agreed to separately waive class-level expenses, advisory fees, administration fees, and to reimburse expenses in order to maintain the following expense limitations for the Funds:
| | | | | | | | | | | | Institutional | |
| | | Class A | | | Class C | | | Class S | | | Class | |
| Ohio Tax-Free Bond Fund | | | 0.85 | % | | | 1.60 | % | | | — | | | | — | |
| Ohio Tax-Free Money Market Fund | | | 0.75 | % | | | — | | | | — | | | | 0.50 | % |
| Tax-Free Money Market Fund | | | 0.89 | % | | | — | | | | 0.90 | % | | | — | |
These expense limitations will remain in effect for all Funds until at least October 29, 2014.
For the Ohio Tax-Free Money Market Fund and Tax-Free Money Market Fund, in addition to the above expense caps, the Advisor and/or Distributor have voluntarily agreed to temporarily waive all or a portion of their fees, to the extent necessary to maintain each Funds’ yield. There is no guarantee that the Advisor and/or Distributor will continue to waive such fees in the future.
During the year ended June 30, 2014, the Advisor or its affiliates waived investment advisory fees and administration fees or reimbursed expenses, including 12b-1 fees, of the Funds as follows:
| | | | | | | | | Other | | | | |
| | | Investment | | | | | | Operating | | | | |
| | | Advisory | | | Administration | | | Expenses | | | | |
| Fund | | Fees Waived | | | Fees Waived | | | Reimbursed | | | Total | |
| Ohio Tax-Free Bond Fund | | $ | — | | | $ | — | | | $ | 139,604 | | | $ | 139,604 | |
| Ohio Tax-Free Money Market Fund | | $ | 25,714 | | | | 285,829 | | | | 869,721 | | | $ | 1,181,264 | |
| Tax-Free Money Market Fund | | $ | — | | | | — | | | | 448,499 | | | $ | 448,499 | |
Effective October 29, 2012, under the terms of the Expense Limitation Agreement, the Advisor is entitled to recover, subject to approval by the Funds’ Board, such amounts waived or reimbursed for a period of up to three years from the year in which the Advisor reduced its compensation or assumed expenses for the Funds. No recoupment will occur unless a Fund’s operating expenses are below the expense limitation amount in effect at the time of the waiver or reimbursement.
As of June 30, 2014, the Advisor may seek recoupment of previously waived fees and reimbursed expenses as follows:
| | | Expiration | | | Expiration | | | | |
| | | June 30, | | | June 30, | | | | |
| Fund | | 2016 | | | 2017 | | | Total | |
| Ohio Tax-Free Bond Fund | | $ | — | | | $ | 1,535 | | | $ | 1,535 | |
| Ohio Tax Free Money Market Fund | | | 285,217 | | | | 319,360 | | | | 604,577 | |
| Tax-Free Money Market Fund | | | 93,066 | | | | 6,384 | | | | 99,450 | |
The Advisor did not recoup any amounts it previously waived or reimbursed during the year ended June 30, 2014.
ADMINISTRATION AGREEMENT
The Advisor entered into an Administration Agreement with the Trust, whereby the Advisor is responsible for: supplying executive and regulatory compliance services; supervising the preparation of tax returns; coordinating the preparation of reports to shareholders and reports to, and filings with, the Securities and Exchange Commission (the “SEC”) and state securities authorities, as well as materials for meetings of the Board; calculating the daily
Notes to Financial Statements (Continued)
NAV per share; and maintaining the financial books and records of each Fund. For its services, the Advisor receives an annual fee of 0.20% on the first $6 billion of the aggregate average daily net assets of the Touchstone Fund Complex (excluding Touchstone Institutional Money Market Fund, Touchstone Institutional Funds Trust, and Touchstone Variable Series Trust); 0.16% of the next $4 billion of aggregate average daily net assets; and 0.12% of the aggregate average daily net assets over $10 billion. The fee is allocated among the funds of the Touchstone Fund Complex (excluding Touchstone Institutional Money Market Fund, Touchstone Institutional Funds Trust, and Touchstone Variable Series Trust) on the basis of relative daily net assets.
The Advisor has engaged BNY Mellon as the Sub-Administrator to the Trust. BNY Mellon provides administrative and accounting services to the Trust and is compensated directly by the Advisor, not the Trust.
TRANSFER AGENT AGREEMENT
Under the terms of the Transfer Agent Agreement between the Trust and BNY Mellon, BNY Mellon maintains the records of each shareholder’s account, answers shareholders’ inquiries concerning their accounts, processes purchases and redemptions of each Fund’s shares, acts as dividend and distribution disbursing agent, and performs other shareholder service functions. For these services, BNY Mellon receives a monthly fee per shareholder account from each Fund. In addition, each Fund pays BNY Mellon out-of-pocket expenses incurred by BNY Mellon, including, but not limited to, postage and supplies.
The Funds may reimburse the Advisor for fees paid to intermediaries such as banks, broker-dealers, financial advisors or other financial institutions for sub-transfer agency, sub-administration and other services provided to investors whose shares of record are held in omnibus, other group accounts, retirement plans or accounts traded through registered securities clearing agents. These fees may vary based on, for example, the nature of services provided, but generally range up to 0.15% of the assets of the class serviced or maintained by the intermediary or up to $17 per sub-account maintained by the intermediary. The Funds will only reimburse the Advisor up to $17 per sub-account maintained by the intermediary.
PLANS OF DISTRIBUTION AND SHAREHOLDER SERVICING FEE ARRANGEMENTS
The Trust has adopted distribution plans pursuant to Rule 12b-1 under the 1940 Act for each class of shares it offers that is subject to 12b-1 distribution fees. The plans allow each Fund to pay distribution and other fees for the sale and distribution of its shares and for services provided to shareholders. The fees charged to the Funds are limited to the actual expenses incurred. Under the Class A plan, each Fund offering Class A shares pays an annual fee of up to 0.25% of average daily net assets that are attributable to Class A shares. Under the Class C plan, each Fund offering Class C shares pays an annual fee of up to 1.00% of average daily net assets that are attributable to Class C shares (of which up to 0.75% is a distribution fee and up to 0.25% is a shareholder servicing fee).
Under the Class S plan, each Fund offering Class S shares pays an annual fee of up to 1.00% of average daily net assets that are attributable to Class S shares (of which up to 0.75% is distribution fee and up to 0.25% is a shareholder servicing fee). The Fund currently limits the amount to 0.35% of average daily net assets attributable to such shares.
UNDERWRITING AGREEMENT
The Underwriter is the Funds’ principal underwriter and, as such, acts as exclusive agent for distribution of the Funds’ shares. Under the terms of the Underwriting Agreement between the Trust and the Underwriter, the Underwriter earned $905 from underwriting and broker commissions on the sale of Class A shares of the
Notes to Financial Statements (Continued)
Ohio Tax-Free Bond Fund during the year ended June 30, 2014. In addition, the Underwriter collected CDSC on the redemption of Class C shares of the Ohio Tax-Free Bond Fund of $61 during the year ended June 30, 2014.
5. Federal Tax Information
Federal income tax— It is each Fund’s policy to continue to comply with the special provisions of the Internal Revenue Code applicable to regulated investment companies. As provided therein, in any fiscal year in which a Fund so qualifies and distributes at least 90% of its investment company taxable income, the Fund (but not the shareholders) will be relieved of federal income tax on the income distributed. It is the Fund’s policy to distribute all of its taxable and tax-exempt income and accordingly, no provision for income taxes has been made.
In order to avoid imposition of the excise tax applicable to regulated investment companies, it is also each Fund’s intention to declare and pay as dividends in each calendar year at least 98% of its investment company taxable income (earned during the calendar year) and 98.2% of its net realized capital gains (earned during the twelve months ending October 31) plus undistributed amounts from prior years.
The tax character of distributions paid are as follows:
| | | Ohio Tax-Free | | | Ohio Tax-Free | |
| | | Bond Fund | | | Money Market Fund | |
| | | 2014 | | | 2013 | | | 2014 | | | 2013 | |
| From tax exempt income | | $ | 1,692,638 | | | $ | 1,868,279 | | | $ | 17,512 | | | $ | 18,996 | |
| From ordinary income | | | 1,566 | | | | 1,517 | | | | — | | | | — | |
| From long-term capital gains | | | 152,138 | | | | 342,894 | | | | — | | | | — | |
| Total distributions | | $ | 1,846,342 | | | $ | 2,212,690 | | | $ | 17,512 | | | $ | 18,996 | |
| | | Tax-Free | |
| | | Money Market Fund | |
| | | 2014 | | | 2013 | |
| From tax exempt income | | $ | 4,260 | | | $ | 4,040 | |
| From long-term capital gains | | | — | | | | — | |
| Total distributions | | $ | 4,260 | | | $ | 4,040 | |
The following information is computed on a tax basis for each item as of June 30, 2014:
| | | | | | Ohio Tax-Free | | | | |
| | | Ohio Tax-Free | | | Money Market | | | Tax-Free Money | |
| | | Bond Fund | | | Fund | | | Market Fund | |
| Tax cost of portfolio investments | | $ | 48,374,860 | | | $ | 157,328,604 | | | $ | 36,254,316 | |
| Gross unrealized appreciation | | $ | 3,664,659 | | | $ | — | | | $ | — | |
| Gross unrealized depreciation | | | (2,708 | ) | | | — | | | | — | |
| Net unrealized appreciation | | | 3,661,951 | | | | — | | | | — | |
| Accumulated capital and other losses | | | — | | | | (3,111 | ) | | | (3,384 | ) |
| Post-October and Qualified Late-Year losses | | | (39,645 | ) | | | — | | | | — | |
| Undistributed tax exempt income | | | 17,969 | | | | 419 | | | | — | |
| Undistributed capital gains | | | — | | | | — | | | | — | |
| Other temporary differences | | | (42,072 | ) | | | (770 | ) | | | — | |
| Accumulated earnings (deficit) | | $ | 3,598,203 | | | $ | (3,462 | ) | | $ | (3,384 | ) |
Notes to Financial Statements (Continued)
As of June 30, 2014, the Funds had the following capital loss carryforwards for federal income tax purposes:
| | | Short Term | | | No | | | No | | | | |
| | | Expiring on | | | Expiration | | | Expiration | | | | |
| Fund | | 2017 | | | Short-Term* | | | Long-Term* | | | Total | |
| Ohio Tax-Fee Money Market Fund | | $ | — | | | $ | 3,111 | | | $ | — | | | $ | 3,111 | |
| Tax-Free Money Market Fund | | | 670 | | | | 2,714 | | | | — | | | | 3,384 | |
*The Regulated Investment Company Modernization Act of 2010 (the “Act”) was enacted on December 22, 2010. The Act made changes to several tax rules impacting the Funds. The provisions of the Act are effective for each fiscal year end for the Funds beginning July 1, 2011. Although the Act provides several benefits, including the unlimited carryover of future capital losses, there may be a greater likelihood that all or a portion of each Fund’s pre-enactment capital loss carryovers may expire without being utilized due to the fact that post-enactment capital losses must be utilized before pre-enactment capital loss carryovers may be utilized. Under the Act, new capital losses may now be carried forward indefinitely, and retain the character of the original loss as compared with pre-enactment law, where capital losses could be carried forward for eight years, and carried forward as short-term capital losses, irrespective of the character of the original loss.
The capital loss carryforwards may be utilized in future years to offset net realized capital gains, if any, prior to distributing such gains to shareholders.
The Funds have analyzed their tax positions taken on federal income tax returns for all open tax years (tax years ended June 30, 2011 through 2014) and have concluded that no provision for income tax is required in their financial statements.
Certain reclassifications, the result of permanent differences between financial statements and income tax reporting requirements, have been made to the components of capital. These reclassifications have no impact on the net assets or NAV per share of the Funds and are designed to present the Funds’ capital accounts on a tax basis. The following reclassification, which are primarily attributable to redesignation of dividends paid, have been made to the following Funds for the year ended June 30, 2014.
| | | | | | Accumulated | | | Accumulated | |
| | | Paid-In | | | Net Realized | | | Net Investment | |
| | | Capital | | | Losses | | | Loss | |
| Touchstone Ohio Tax-Free Bond | | $ | — | | | $ | 1 | | | $ | (1 | ) |
| Touchstone Tax-Free Money Market Fund | | $ | (1 | ) | | $ | — | | | $ | 1 | |
6. Commitments and Contingencies
The Funds indemnify the Trust’s officers and Trustees for certain liabilities that might arise from their performance of their duties to the Funds. Additionally, in the normal course of business, the Funds enter into contracts that contain a variety of representations and warranties and which provide general indemnifications. The Funds’ maximum exposure under these arrangements is unknown, as this would involve future claims that may be made against the Funds. However, based on experience, the Funds expect the risk of loss to be remote.
7. Risks Associated with Concentration
Certain Funds invest a high percentage of their assets in specific sectors of the market in order to achieve a potentially greater investment return. As a result, these Funds may be more susceptible to economic, political, and regulatory developments in a particular sector of the market, positive or negative, and may experience increased volatility on the Fund’s NAV and magnified effect on the total return.
8. Risks Associated with Credit
An issuer may be unable to make timely payments of either principal or interest. This may cause the issuer’s securities to decline in value. Credit risk is particularly relevant to those Funds that invest a significant amount of their assets in junk bonds or lower-rated securities.
Notes to Financial Statements (Continued)
9. Risks Associated with Interest Rate Changes
As interest rates rise, the value of fixed-income securities a Fund owns will likely decrease. The price of debt securities is generally linked to the prevailing market interest rates. In general, when interest rates rise, the price of debt securities falls, and when interest rates fall, the price of debt securities rises. The price volatility of a debt security also depends on its maturity. Longer-term securities are generally more volatile, so the longer the average maturity or duration of these securities, the greater their price risk. Duration is a measure of the expected life, taking into account any prepayment or call features of the security, that is used to determine the price sensitivity of the security for a given change in interest rates. Specifically, duration is the change in the value of a fixed-income security that will result from a 1% change in interest rates, and generally is stated in years. For example, as a general rule a 1% rise in interest rates means a 1% fall in value for every year of duration. Maturity, on the other hand, is the date on which a fixed-income security becomes due for payment of principal. There may be less governmental intervention in the securities markets in the near future. The negative impact on fixed income securities if interest rates increase as a result could negatively impact a Fund’s net asset value.
10. Subsequent Events
Subsequent events occurring after the date of this report have been evaluated for potential impact to this report through the date the financial statements were issued. There were no subsequent events that necessitated recognition or disclosure in the Funds’ financial statements.
Report of Independent Registered Public Accounting Firm
To the Board of Trustees and Shareholders of
Touchstone Tax-Free Trust
We have audited the accompanying statements of assets and liabilities, including the portfolios of investments, of Touchstone Tax-Free Trust (comprising, respectively, the Touchstone Ohio Tax-Free Bond, Touchstone Ohio Tax-Free Money Market, and Touchstone Tax-Free Money Market Funds) (the “Funds”) as of June 30, 2014, and the related statements of operations for the year then ended, the statements of changes in net assets for each of the two years in the period then ended, and the financial highlights for each of the five years in the period then ended. These financial statements and financial highlights are the responsibility of the Funds’ management. Our responsibility is to express an opinion on these financial statements and financial highlights based on our audits.
We conducted our audits in accordance with the standards of the Public Company Accounting Oversight Board (United States). Those standards require that we plan and perform the audits to obtain reasonable assurance about whether the financial statements are free of material misstatement. We were not engaged to perform an audit of the Funds’ internal control over financial reporting. Our audits included consideration of internal control over financial reporting as a basis for designing audit procedures that are appropriate in the circumstances, but not for the purpose of expressing an opinion on the effectiveness of the Funds’ internal control over financial reporting. Accordingly, we express no such opinion. An audit also includes examining, on a test basis, evidence supporting the amounts and disclosures in the financial statements, assessing the accounting principles used and significant estimates made by management, and evaluating the overall financial statement presentation. Our procedures included confirmation of securities owned as of June 30, 2014, by correspondence with the custodian and brokers. We believe that our audits provide a reasonable basis for our opinion.
In our opinion, the financial statements and financial highlights referred to above present fairly, in all material respects, the financial position of each of the respective funds constituting the Touchstone Tax-Free Trust at June 30, 2014, the results of their operations for the year then ended, the changes in their net assets for each of the two years in the period then ended, and the financial highlights for each of the five years in the period then ended, in conformity with U.S. generally accepted accounting principles.

Cincinnati, Ohio
August 22, 2014
Other Items (Unaudited)
Supplemental Tax Information
The information set forth below is for each Fund’s fiscal year as required by federal income tax laws. Shareholders, however, must report distributions on a calendar year basis for income tax purposes, which may include distributions for portions of two fiscal years of a Fund. Accordingly, the information needed by shareholders for income tax purposes will be sent to them in January of each year. Please consult your tax advisor for proper treatment of this information.
The Touchstone Ohio Tax-Free Bond Fund designated $152,138 as capital gain dividends paid during the most-recent fiscal year.
Of the dividends paid from net investment income during the most-recent fiscal year, the following percentages were designated as exempt interest dividends for federal income tax purposes.
Exempt Interest Dividends
| Touchstone Ohio Tax-Free Bond Fund | | | 99.9 | % |
| Touchstone Ohio Tax-Free Money Market Fund | | | 100.0 | % |
| Touchstone Tax-Free Money Market Fund | | | 100.0 | % |
Proxy Voting Guidelines and Proxy Voting Record
The Sub-Advisor is responsible for exercising the voting rights associated with the securities purchased and held by the Fund. A description of the policies and procedures that the Sub-Advisor uses in fulfilling this responsibility is available as an appendix to the most recent Statement of Additional Information, which can be obtained without charge by calling toll free 1.800.543.0407 or by visiting the Touchstone website at www.touchstoneinvestments.com or on the Securities and Exchange Commission’s (the “Commission”) website at www.sec.gov. Information regarding how those proxies were voted during the most recent twelve-month period ended June 30 is also available without charge by calling toll free 1.800.543.0407 or on the Commission’s website at www.sec.gov.
Quarterly Portfolio Disclosure
The Trust files a complete listing of portfolio holdings for each Fund as of the end of the first and third quarters of each fiscal year on Form N-Q. The complete listing (i) is available on the Commission’s website; (ii) may be reviewed and copied at the Commission’s Public Reference Room in Washington, DC; and (iii) will be made available to shareholders upon request by calling 1.800.543.0407 or by visiting the Touchstone website at www.touchstoneinvestments.com. Information on the operation of the Public Reference Room may be obtained by calling 1.800.SEC.0330.
Schedule of Shareholder Expenses
As a shareholder of the Funds, you incur two types of costs: (1) transaction costs, including reinvested dividends or other distributions; and (2) ongoing costs, including investment advisory fees; distribution (12b-1) fees; and other Fund expenses. This example is intended to help you understand your ongoing costs (in dollars) of investing in the Funds and to compare these costs with the ongoing costs of investing in other mutual funds.
The example is based on an investment of $1,000 invested at the beginning of the period and held for the entire period January 1, 2014 through June 30, 2014.
Actual Expenses
The first line of the table below for each share class of a Fund provides information about actual account values and actual expenses. You may use the information in this line, together with the amount you invested, to estimate the expenses that you paid over the period. Simply divide your account value by $1,000 (for example, an $8,600
Other Items (Unaudited) (Continued)
account value divided by $1,000 = 8.6), then multiply the result by the number in the first line under the heading entitled “Expenses Paid During the Six Months Ended June 30, 2014” to estimate the expenses you paid on your account during this period.
Hypothetical Example for Comparison Purposes
The second line of the table below for each share class of a Fund provides information about hypothetical account values and hypothetical expenses based on the Funds’ actual expense ratio and an assumed rate of return of 5% per year before expenses, which is not the Funds’ actual return. The hypothetical account values and expenses may not be used to estimate the actual ending account balance or expenses you paid for the period. You may use this information to compare the ongoing costs of investing in the Funds and other funds. To do so, compare this 5% hypothetical example with the 5% hypothetical examples that appear in the shareholder reports of the other funds.
Please note that the expenses shown in the table are meant to highlight your ongoing costs only and do not reflect any transactional costs, such as sales charges (loads), redemption fees, or exchange fees. Therefore, the second line of the table below is useful in comparing ongoing costs only, and will not help you determine the relative total costs of owning different funds. In addition, if these transactional costs were included, your costs would have been higher.
| | | | | | | | | | | | Expenses | |
| | | Net Expense | | | Beginning | | | Net Expense | | | Paid During | |
| | | Ratio | | | Account | | | Ratio | | | the Six Months | |
| | | Annualized | | | Value | | | Annualized | | | Ended | |
| | | June 30, | | | January 1, | | | June 30, | | | June 30, | |
| | | 2014 | | | 2014 | | | 2014 | | | 2014* | |
| Touchstone Ohio Tax-Free Bond Fund | | | | | | | | | | | | | | | | |
| Class A | | Actual | | | 0.85 | % | | $ | 1,000.00 | | | $ | 1,054.40 | | | $ | 4.33 | |
| Class A | | Hypothetical | | | 0.85 | % | | $ | 1,000.00 | | | $ | 1,020.58 | | | $ | 4.26 | |
| | | | | | | | | | | | | | | | | | | |
| Class C | | Actual | | | 1.60 | % | | $ | 1,000.00 | | | $ | 1,050.40 | | | $ | 8.13 | |
| Class C | | Hypothetical | | | 1.60 | % | | $ | 1,000.00 | | | $ | 1,016.86 | | | $ | 8.00 | |
| | | | | | | | | | | | | | | | | | | |
| Touchstone Ohio Tax-Free Money Market Fund | | | | | | | | | | | | | | | | |
| Class A | | Actual | | | 0.14 | % | | $ | 1,000.00 | | | $ | 1,000.10 | | | $ | 0.69 | |
| Class A | | Hypothetical | | | 0.14 | % | | $ | 1,000.00 | | | $ | 1,024.10 | | | $ | 0.70 | |
| | | | | | | | | | | | | | | | | | | |
| Institutional Class | | Actual | | | 0.14 | % | | $ | 1,000.00 | | | $ | 1,000.10 | | | $ | 0.69 | |
| Institutional Class | | Hypothetical | | | 0.14 | % | | $ | 1,000.00 | | | $ | 1,024.10 | | | $ | 0.70 | |
| | | | | | | | | | | | | | | | | | | |
| Touchstone Tax-Free Money Market Fund | | | | | | | | | | | | | | | | |
| Class A | | Actual | | | 0.19 | % | | $ | 1,000.00 | | | $ | 1,000.10 | | | $ | 0.94 | |
| Class A | | Hypothetical | | | 0.19 | % | | $ | 1,000.00 | | | $ | 1,023.85 | | | $ | 0.95 | |
| | | | | | | | | | | | | | | | | | | |
| Class S | | Actual | | | 0.19 | % | | $ | 1,000.00 | | | $ | 1,000.10 | | | $ | 0.94 | |
| Class S | | Hypothetical | | | 0.19 | % | | $ | 1,000.00 | | | $ | 1,023.85 | | | $ | 0.95 | |
| * | Expenses are equal to the Fund's annualized expense ratio, multiplied by the average account value over the period, multiplied by 181/365 (to reflect one-half year period). |
Management of the Trust (Unaudited)
Listed below is required information regarding the Trustees and principal officers of the Trust. The Trust’s Statement of Additional Information includes additional information about the Trustees and is available, without charge, upon request by calling 1.800.543.0407 or by visiting the Touchstone website at www.touchstoneinvestments.com.
| Interested Trustees1: |
| | | | | | | | | Number | | |
| | | | | | | | | of Funds | | |
| | | | | | | | | Overseen | | |
| | | | | Term of | | | | in the | | |
| Name | | Position(s) | | Office2 And | | | | Touchstone | | Other |
| Address | | Held with | | Length of | | Principal Occupation(s) | | Fund | | Directorships |
| Age | | Trust | | Time Served | | During Past 5 Years | | Complex3 | | Held During the Past 5 Years4 |
Jill T. McGruder Touchstone Advisors, Inc. 303 Broadway Suite 1100 Cincinnati, OH 45202 Year of Birth: 1955 | | Trustee and President | | Until retirement at age 75 or until she resigns or is removed Trustee since 1999 | | President and CEO of IFS Financial Services, Inc. (a holding company) from 1999 to the present. | | 48 | | Director of LaRosa’s, Inc. (a restaurant chain) from 1999 to the present, IFS Financial Services, Inc. (a holding company) from 1999 to the present, Integrity and National Integrity Life Insurance Co. from 2005 to the present, Touchstone Securities (the Trust’s distributor) from 1999 to the present, Touchstone Advisors (the Trust’s investment advisor and administrator) from 1999 to the present, W&S Brokerage Services ( a brokerage company) from 1999 to the present and W&S Financial Group Distributors (a distribution company) from 1999 to the present. |
| Independent Trustees: |
Phillip R. Cox c/o Touchstone Advisors, Inc. 303 Broadway Suite 1100 Cincinnati, OH 45202 Year of Birth: 1947 | | Trustee | | Until retirement at age 75 or until he resigns or is removed Trustee since 1999 | | President and Chief Executive Officer of Cox Financial Corp. (a financial services company) from 1971 to the present. | | 48 | | Director of Cincinnati Bell (a communications company) from 1994 to the present, Bethesda Inc. (a hospital) from 2005 to the present, Timken Co. (a manufacturing company) from 2004 to the present, Diebold, Inc. (a technology solutions company) from 2004 to the present. |
William C. Gale c/o Touchstone Advisors, Inc. 303 Broadway Suite 1100 Cincinnati, OH 45202 Year of Birth: 1952 | | Trustee | | Until retirement at age 75 or until he resigns or is removed Trustee since 2013 | | Senior Vice President and Chief Financial Officer of Cintas Corporation (a business services company) from 1995 to present. | | 48 | | None. |
Susan J. Hickenlooper, CFA c/o Touchstone Advisors, Inc. 303 Broadway Suite 1100 Cincinnati, OH 45202 Year of Birth: 1946 | | Trustee | | Until retirement at age 75 or until she resigns or is removed Trustee since 2009 | | Financial Analyst for Impact 100 (Charitable Organization) from 2012 to present. | | 48 | | Trustee of Cincinnati Parks Foundation (a charitable organization) from 2000 to present and Trustee of Episcopal Retirement Homes Foundation from 1998-2011. |
Management of the Trust (Unaudited) (Continued)
Independent Trustees (Continued):
| | | | | | | | | Number | | |
| | | | | | | | | of Funds | | |
| | | | | | | | | Overseen | | |
| | | | | Term of | | | | in the | | |
| Name | | Position(s) | | Office2 And | | | | Touchstone | | Other |
| Address | | Held with | | Length of | | Principal Occupation(s) | | Fund | | Directorships |
| Age | | Trust | | Time Served | | During Past 5 Years | | Complex3 | | Held During the Past 5 Years4 |
Kevin A. Robie
c/o Touchstone Advisors, Inc.
303 Broadway
Suite 1100
Cincinnati, OH 45202
Year of Birth: 1956 | | Trustee | | Until retirement at age 75 or until Management at Soin International he resigns or is removed Trustee since 2013 | | Vice President of Portfolio LLC (a multinational holding company) from 2004 to the present. | | 48 | | Director of Buckeye EcoCare, Inc. (a lawn care company) from 2013 to the present, Trustee of Dayton Region New Market Fund, LLC (a private fund) from 2010 to present, Trustee of the Entrepreneurs Center, Inc. (a small business incubator) from 2006 to the present and Director of Interventional Imaging, Inc. (a medical device company) from 2004 to 2011. |
Edward J. VonderBrink
c/o Touchstone Advisors, Inc.
303 Broadway
Suite 1100 Cincinnati, OH 45202
Year of Birth: 1944 | | Trustee | | Until retirement at age 75 or until he resigns or is removed Trustee since 2013 | | Consultant, VonderBrink Consulting LLC from 2000 to the present. | | 48 | | Director of Streamline Health Solutions, Inc. (healthcare IT) from 2006 to the present, Mercy Health Foundation from 2007 to the present. |
| 1 | Ms. McGruder, as a director of the Advisor and the Trust's Distributor, and an officer of affiliates of the Advisor and the Trust's Distributor, is an “interested person” of the Trust within the meaning of Section 2(a)(19) of the 1940 Act. |
| 2 | Each Trustee is elected to serve until the age of 75 or until he or she sooner resigns or is removed. |
| 3 | As of June 30, 2014, The Touchstone Fund Complex consisted of 13 series of Touchstone Funds Group Trust, 4 series of Touchstone Investment Trust, 1 series of Touchstone Institutional Funds Trust, 17 series of the Touchstone Strategic Trust, 3 series of Touchstone Tax-Free Trust, and 10 variable annuity series of Touchstone Variable Series Trust. |
| 4 | Each Trustee is also a Trustee of Touchstone Funds Group Trust, Touchstone Strategic Trust, Touchstone Investment Trust, Touchstone Institutional Funds Trust, and Touchstone Variable Series Trust. |
Management of the Trust (Unaudited) (Continued)
The following is a list of the Officers of the Trusts, the length of time served, and principal occupations for the past five years.
Principal Officers:
| | | | | Term of | | |
| Name | | Position(s) | | Office And | | |
| Address | | Held with | | Length of | | Principal Occupation(s) |
| Age | | Trust3 | | Time Served | | During the Past 5 Years |
Jill T. McGruder1 Year of Birth: 1955 | | President and Trustee | | Until resignation, removal or disqualification President since 2006 | | See biography above. |
Steven M. Graziano1 Year of Birth: 1954 | | Vice President | | Until resignation, removal or disqualification Vice President since 2009 | | President of Touchstone Advisors, Inc. |
Timothy D. Paulin1 Year of Birth: 1963 | | Vice President | | Until resignation, removal or disqualification Vice President since 2010 | | Senior Vice President of Investment Research and Product Management of Touchstone Advisors, Inc.; Director of Product Design of Klein Decisions, Inc. 2003-2010. |
Timothy S. Stearns1 Year of Birth: 1963 | | Chief Compliance Officer | | Until resignation, removal or disqualification Chief Compliance Officer since September 2013 | | Chief Compliance Officer of Touchstone Advisors, Inc., Senior Vice President and Chief Compliance and Ethics Officer of Envestnet Asset Management, Inc. (2009 to 2013) and Chief Compliance Officer, Americas and Compliance Director, Asia of Franklin Templeton Investments (1997 to 2009). |
Terrie A. Wiedenheft1 Year of Birth: 1962 | | Controller and Treasurer | | Until resignation, removal or disqualification Controller and Treasurer since 2006 | | Senior Vice President, Chief Financial Officer and Chief Operations Officer of IFS Financial Services, Inc. (a holding company). |
Elizabeth R. Freeman2 Year of Birth: 1962 | | Secretary | | Until resignation, removal or disqualification Secretary since 2011 | | Managing Director and Senior Counsel at BNY Mellon Investment Servicing (US) Inc. |
| 1 | The address of Touchstone Advisors, Inc. is 303 Broadway, Suite 1100, Cincinnati, OH 45202. |
| 2 | Timothy S. Stearns replaced Mr. Moser as the Chief Compliance Officer of the Trust on August 22, 2013. |
| 3 | The address of BNY Mellon Investment Servicing (US) Inc. is 201 Washington Street, Boston, MA 02108. |
| 4 | Each officer also holds the same office with Touchstone Funds Group Trust, Touchstone Instituational Funds Trust, Touchstone Investment Trust, Touchstone Strategic Trust, and Touchstone Variable Series Trust. |
This page intentionally left blank.
This page intentionally left blank.
This page intentionally left blank.
PRIVACY PROTECTION POLICY
We Respect Your Privacy
Thank you for your decision to invest with us. Touchstone and its affiliates have always placed a high value on the trust and confidence our clients place in us. We believe that confidence must be earned and validated through time. In today’s world, when technology allows the sharing of information at light speeds, trust must be reinforced by our sincere pledge to take the steps necessary to ensure that the information you share with us is treated with respect and confidentiality.
Our Pledge to Our Clients
| · | We collect only the information we need to service your account and administer our business. |
| · | We are committed to keeping your information confidential and we place strict limits and controls on the use and sharing of your information. |
| · | We make every effort to ensure the accuracy of your information. |
We Collect the Following Nonpublic Personal Information About You:
| · | Information we receive from you on or in applications or other forms, correspondence, or conversations, including, but not limited to, your name, address, phone number, social security number, assets, income and date of birth; and |
| · | Information about your transactions with us, our affiliates, or others, including, but not limited to, your account number and balance, payment history, parties to transactions, cost basis information, and other financial information. |
Categories of Information We Disclose and Parties to Whom We Disclose
We do not disclose any nonpublic personal information about our current or former clients to nonaffiliated third parties, except as required or permitted by law.
We Place Strict Limits and Controls on the Use and Sharing of Your Information
| · | We restrict access to nonpublic personal information about you to authorized employees who need the information to administer your business. |
| · | We maintain physical, electronic and procedural safeguards that comply with federal standards to protect this information. |
| · | We do not disclose any nonpublic personal information about our current or former clients to anyone, except as required or permitted by law or as described in this document. |
| · | We will not sell your personal information to anyone. |
We May Provide Information to Service Your Account
Sometimes it is necessary to provide information about you to various companies such as transfer agents, custodians, broker-dealers and marketing service firms to facilitate the servicing of your account. These organizations have a legitimate business need to see some of your personal information in order for us to provide service to you. We may disclose to these various companies the information that we collect as described above. We require that these companies, including our own subsidiaries and affiliates, strictly maintain the confidentiality of this information and abide by all applicable laws. Companies within our corporate family that may receive this information are financial service providers and insurance companies. We do not permit these associated companies to sell the information for their own purposes, and we never sell our customer information.
This policy is applicable to the following affiliated companies: Touchstone Funds Group Trust, Touchstone Investment Trust, Touchstone Strategic Trust, Touchstone Tax-Free Trust, Touchstone Variable Series Trust, Touchstone Institutional Funds Trust, Touchstone Securities, Inc.,* and W&S Brokerage Services, Inc.
* Touchstone Securities, Inc. serves as the underwriter to the Touchstone Funds.
A Member of Western & Southern Financial Group®
The Privacy Protection Policy is not part of the Annual Report.


Touchstone Investments
Distributor
Touchstone Securities, Inc.*
303 Broadway
Cincinnati, Ohio 45202-4203
800.638.8194
www.touchstoneinvestments.com
Investment Advisor
Touchstone Advisors, Inc.*
303 Broadway
Cincinnati, Ohio 45202-4203
Transfer Agent
BNY Mellon Investment Servicing (US) Inc.
4400 Computer Drive
Westborough, MA 01581
Shareholder Service
800.543.0407
* A Member of Western & Southern Financial Group
TSF-58-TTFT-AR-1406
Item 2. Code of Ethics.
| (a) | The registrant, as of the end of the period covered by this report, has adopted a code of ethics that applies to the registrant’s principal executive officer, principal financial officer, principal accounting officer or controller, or persons performing similar functions, regardless of whether these individuals are employed by the registrant or a third party. |
| (c) | There have been no amendments, during the period covered by this report, to a provision of the code of ethics that applies to the registrant’s principal executive officer, principal financial officer, principal accounting officer or controller, or persons performing similar functions, regardless of whether these individuals are employed by the registrant or a third party, and that relates to any element of the code of ethics description. |
| (d) | The registrant has not granted any waivers, including an implicit waiver, from a provision of the code of ethics that applies to the registrant’s principal executive officer, principal financial officer, principal accounting officer or controller, or persons performing similar functions, regardless of whether these individuals are employed by the registrant or a third party, that relates to one or more of the items set forth in paragraph (b) of this item’s instructions. |
Item 3. Audit Committee Financial Expert.
The registrant’s Board of Trustees has determined that the registrant has at least one audit committee financial expert serving on its audit committee. Mr. William Gale is the registrant’s audit committee financial expert and is an independent trustee within the meaning of the Investment Company Act of 1940, as amended (the “1940 Act”).
Item 4. Principal Accountant Fees and Services.
Audit Fees
| (a) | The Audit fees totaled $46,725 and $46,725 in fiscal 2014 and 2013, respectively, including fees associated with the annual audits and filings of Form N-1A and Form N-SAR. |
Audit-Related Fees
| (b) | There were no audit-related fees for the 2014 and 2013 fiscal years. |
Tax Fees
| (c) | The aggregate fees billed in each of the last two fiscal years for professional services rendered by the principal accountant for tax compliance, tax advice, and tax planning are $11,655 for 2014 and $11,655 for 2013. |
Fees for both 2013 and 2014 relate to the preparation of federal income and excise tax returns and review of capital gains distribution calculations.
All Other Fees
| (d) | There were no fees for all other services in each of the last two fiscal years for products and services provided by the principal accountant, other than the services reported in paragraphs (a) through (c) of this Item for 2014 and 2013. |
| (e)(1) | Disclose the audit committee's pre-approval policies and procedures described in paragraph (c)(7) of Rule 2-01 of Regulation S-X. |
The Audit Committee’s pre-approval policies describe the types of audit, audit-related, tax and other services that have the general pre-approval of the Audit Committee. The pre-approval policies provide that annual audit service fees, tax services not specifically granted pre-approval, services exceeding pre-approved cost levels and other services that have not received general pre-approval will be subject to specific pre-approval by the Audit Committee. The pre-approval policies further provide that the Committee may grant general pre-approval to other audit services (statutory audits and services associated with SEC registration statements, periodic reports and other documents filed with the SEC or other documents issued in connection with securities offerings), audit-related services (accounting consultations related to accounting, financial reporting or disclosure matters not classified as “audit services,” assistance with understanding and implementing new accounting and financial reporting guidance from rulemaking authorities, agreed-upon or expanded audit procedures related to accounting and/or billing records required to respond to or comply with financial, accounting or regulatory reporting matters and assistance with internal control reporting requirements under Form N-SAR and Form N-CSR), tax services that have historically been provided by the auditor that the Committee believes would not impair the independence of the auditor and are consistent with the SEC’s rules on auditor independence and permissible non-audit services classified as “all other services” that are routine and recurring services.
| (e)(2) | All of the services described in paragraphs (b) through (d) of Item 4 were approved by the Audit Committee. |
| (f) | The percentage of hours expended on the principal accountant's engagement to audit the registrant's financial statements for the most recent fiscal year that were attributed to work performed by persons other than the principal accountant's full-time, permanent employees was less than fifty percent. |
| (g) | The aggregate non-audit fees billed by the registrant's accountant for services rendered to the registrant, and rendered to the registrant's investment adviser (not including any sub-adviser whose role is primarily portfolio management and is subcontracted with or overseen by another investment adviser), and any entity controlling, controlled by, or under common control with the adviser that provides ongoing services to the registrant for each of the last two fiscal years of the registrant was $11,655 for 2014 and $11,655 for 2013. |
| (h) | The registrant's audit committee of the board of directors has considered whether the provision of non-audit services that were rendered to the registrant's investment adviser (not including any sub-adviser whose role is primarily portfolio management and is subcontracted with or overseen by another investment adviser), and any entity controlling, controlled by, or under common control with the investment adviser that provides ongoing services to the registrant that were not pre-approved pursuant to paragraph (c)(7)(ii) of Rule 2-01 of Regulation S-X is compatible with maintaining the principal accountant's independence. |
Item 5. Audit Committee of Listed Registrants.
Not applicable.
Item 6. Investments.
| (a) | Schedule of Investments in securities of unaffiliated issuers as of the close of the reporting period is included as part of the report to shareholders filed under Item 1 of this form. |
Item 7. Disclosure of Proxy Voting Policies and Procedures for Closed-End Management Investment Companies.
Not applicable.
Item 8. Portfolio Managers of Closed-End Management Investment Companies.
Not applicable.
Item 9. Purchases of Equity Securities by Closed-End Management Investment Company and Affiliated Purchasers.
Not applicable.
Item 10. Submission of Matters to a Vote of Security Holders.
There have been no material changes to the procedures by which the shareholders may recommend nominees to the registrant’s board of trustees, where those changes were implemented after the registrant last provided disclosure in response to the requirements of Item 407(c)(2)(iv) of Regulation S-K (17 CFR 229.407) (as required by Item 22(b)(15) of Schedule 14A (17 CFR 240.14a-101)), or this Item.
Item 11. Controls and Procedures.
| (a) | The registrant’s principal executive and principal financial officers, or persons performing similar functions, have concluded that the registrant’s disclosure controls and procedures (as defined in Rule 30a-3(c) under the Investment Company Act of 1940, as amended (the “1940 Act”) (17 CFR 270.30a-3(c))) are effective, as of a date within 90 days of the filing date of the report that includes the disclosure required by this paragraph, based on their evaluation of these controls and procedures required by Rule 30a-3(b) under the 1940 Act (17 CFR 270.30a-3(b)) and Rules 13a-15(b) or 15d-15(b) under the Securities Exchange Act of 1934, as amended (17 CFR 240.13a-15(b) or 240.15d-15(b)). |
| (b) | There were no changes in the registrant’s internal control over financial reporting (as defined in Rule 30a-3(d) under the 1940 Act (17 CFR 270.30a-3(d)) that occurred during the registrant’s second fiscal quarter of the period covered by this report that has materially affected, or is reasonably likely to materially affect, the registrant’s internal control over financial reporting. |
Item 12. Exhibits.
| (a)(1) | Code of ethics, or any amendment thereto, that is the subject of disclosure required by Item 2 is attached hereto. |
| | |
| (a)(2) | Certifications pursuant to Rule 30a-2(a) under the 1940 Act and Section 302 of the Sarbanes-Oxley Act of 2002 are attached hereto. |
| | |
| (a)(3) | Not applicable. |
| | |
| (b) | Certifications pursuant to Rule 30a-2(b) under the 1940 Act and Section 906 of the Sarbanes-Oxley Act of 2002 are attached hereto. |
(12.other) Not applicable.
SIGNATURES
Pursuant to the requirements of the Securities Exchange Act of 1934 and the Investment Company Act of 1940, the registrant has duly caused this report to be signed on its behalf by the undersigned, thereunto duly authorized.
(Registrant) Touchstone Tax-Free Trust
By (Signature and Title)* /s/ Jill T. McGruder
Jill T. McGruder, President
(principal executive officer)
Date 08/22/14
Pursuant to the requirements of the Securities Exchange Act of 1934 and the Investment Company Act of 1940, this report has been signed below by the following persons on behalf of the registrant and in the capacities and on the dates indicated.
By (Signature and Title)* /s/ Jill T. McGruder
Jill T. McGruder, President
(principal executive officer)
Date 08/22/14
By (Signature and Title)* /s/ Terrie A. Wiedenheft
Terrie A. Wiedenheft, Controller and Treasurer
(principal financial officer)
Date 08/22/14
* Print the name and title of each signing officer under his or her signature.