Engelhard Response to BASF Offer
COMMITTED TO MAXIMIZING SHAREHOLDER VALUE

FORWARD-LOOKING STATEMENT
Forward-Looking Statements. This document contains forward-looking statements
within the meaning of the Private Securities Litigation Reform Act of 1995. These
statements relate to analyses and other information that are based on forecasts of future
results and estimates of amounts not yet determinable. These statements also relate to
future prospects, developments and business strategies. These forward-looking
statements are identified by their use of terms and phrases such as “anticipate,”
“believe,” “could,” “estimate,” “expect,” “intend,” “may,” “plan,” “predict,” “project,” “will”
and similar terms and phrases, including references to assumptions. These forward-
looking statements involve risks and uncertainties, internal and external, that may cause
the Company’s actual future activities and results of operations to be materially different
from those suggested or described in this document. These risks, uncertainties and
contingencies include those set forth in Engelhard’s Annual Report on Form 10-K, and
other factors detailed from time to time in its other filings with the SEC, including the
Company’s third quarter 10Q.
Investors are cautioned not to place undue reliance upon these forward-looking
statements, which speak only as of their dates. The Company disclaims any obligation to
update or revise any forward-looking statements, whether as a result of new information,
future events or otherwise, also see Appendix.
1

SUMMARY OF PRINCIPAL EVENTS
JH calls BP to schedule meeting. Purpose of meeting is not disclosed by JH
JH makes unsolicited proposal to acquire Engelhard. The two CEOs agree to discuss the proposal
the following week
Engelhard retains Merrill Lynch & Co. as its financial advisor and Cahill Gordon & Reindel LLP as
its legal counsel
BP advises JH that a Board meeting is scheduled for December 29 at which the BASF offer will be
discussed
Engelhard Board meeting held. Response options are discussed. Board determines it will be
prepared to explore a sale if price is preemptive; $37 per share deemed not preemptive
BP communicates Engelhard Board position to JH
JH indicates to BP he had additional conversations with his board on value and concluded other
competing buyers unlikely, and on this basis $37 per share is a fair price
JH then indicates BASF would increase price to $38 per share if Engelhard holds a due diligence
meeting and information provided supports such a price increase
JH indicates to BP that BASF has not factored in value for potential synergies in arriving at its price
Engelhard Board holds telephonic meeting and reviews JH’s position and concludes $38 per share
is not compelling enough to warrant due diligence and the provision of non-public information
BASF announces it intends to make a hostile offer to acquire Engelhard at $37 per share
BASF files a Tender Offer Statement (the “BASF Offer”) with the SEC communicating its proposed
strategy to acquire Engelhard
Engelhard Board determines the BASF Offer is inadequate and not in the best interests of
Engelhard stockholders
The Board is working to identify and explore alternatives to seek to maximize stockholder value
above the BASF Offer
December 14, 2005
December 21, 2005
December 22, 2005
December 26, 2005
December 29, 2005
December 30, 2005
January 3, 2006
January 20, 2006
Current
_______Date________
____________________ Event________________________
January 9, 2006
January 2, 2006
Note: BP and JH refers to Mr. Barry W. Perry, the Chairman and Chief Executive Officer of Engelhard, and Dr. J ürgen Hambrecht, the Chairman of the Board of Executive Directors of
BASF, respectively.
2

BOARD RESPONSE TO THE BASF OFFER
THE REASONS FOR THE REJECTION
1)
The Offer does not reflect the stand-alone value of Engelhard
2)
The Offer is opportunistic
3)
The Offer does not reflect sharing of significant potential synergy value of a
combination
4)
The Offer represents a low control premium versus precedent transactions
5)
The Offer values Engelhard at a price below recent trading levels
6)
The exploration of alternatives to maximize value could deliver higher value
than the Offer
7)
The Offer is financially inadequate
3

OFFER DOES NOT FULLY REFLECT STAND-ALONE VALUE OF
ENGELHARD
The Board believes the Offer does not fully reflect the value of the Company’s
businesses, including its strong market positions and future growth prospects
The Board believes the Company has positioned itself to take advantage of
attractive growth opportunities which include:
The Board believes these growth opportunities have not been fully factored into
the long-term EPS growth expectations
EPS Growth Comparison (’06E - ’10E)
Wall Street Equity Research Average 10.5% (1)
Engelhard Management Operating Plan (2) ~ 16.5%
Heavy-Duty Diesel
Personal Care and Cosmetics
Energy and Fuel Materials
Pricing and sustainable
productivity gains
(1) Source: First Call Wall Street research average as of January 18, 2006.
(2) Developed in strategic planning process August, 2005. See Appendix for key assumptions.
4
5
Differential
-4.1x
Average
Differential
2005 Average
2004 Average
2003 Average
-1.5x
-0.2x
-1.1x
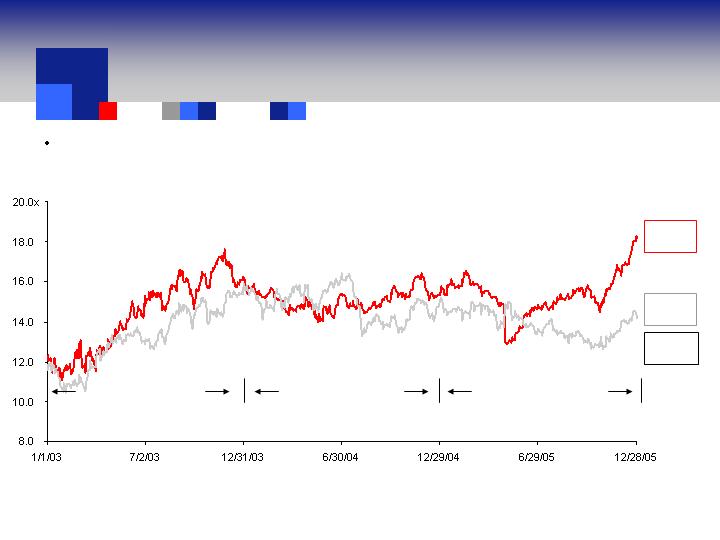
P/E Multiple – Forward 12 months (1)
Engelhard
14.1x
Johnson
Matthey
18.2x
(1) Source: Factset.
The BASF Offer was made at a time when Engelhard’s P/E multiple was at one of its
lowest relative points in 3 years compared to Johnson Matthey
OFFER IS OPPORTUNISTIC
6
Differential
-1.6x
Average
Differential
2005 Average
2004 Average
2003 Average
1.0x
4.6x
2.7x
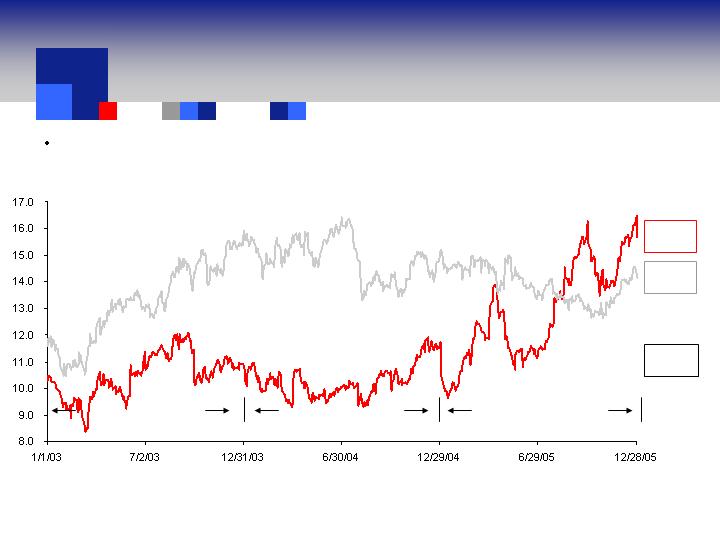
P/E Multiple – Forward 12 months (1)
Engelhard
14.1x
Umicore
15.7x
(1) Source: Factset.
The BASF Offer was made at a time when Engelhard’s P/E multiple was at one of its
lowest relative points in 3 years compared to Umicore
OFFER IS OPPORTUNISTIC
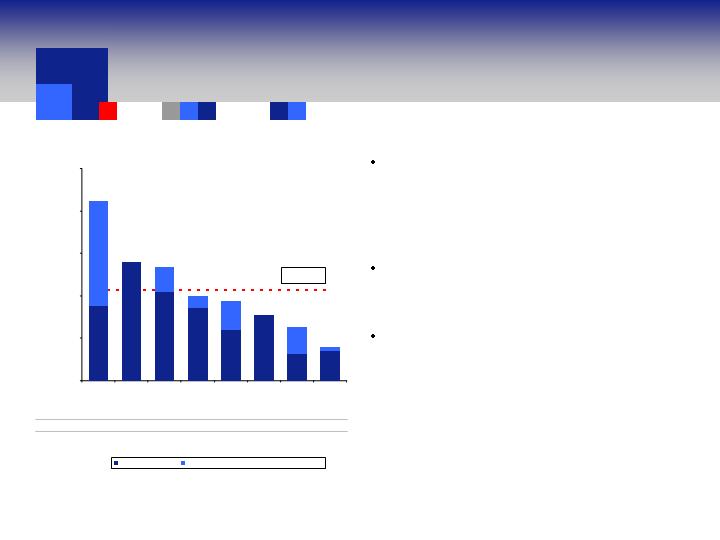
OFFER DOES NOT REFLECT SHARING OF SIGNIFICANT
POTENTIAL SYNERGY VALUE
BASF indicated privately that it did not
factor synergies into its price due to
uncertainties in achieving synergies in M&A
situations (2)
BASF stated publicly it only sees “modest
synergies”
The Board believes the synergy
opportunity available to BASF is significant
based on management estimates and a
review of precedent transactions
Announced Cost Savings as % of Sales (1)
(1) Represents average of total realized (or revised target) synergies as a % of sales. For recent transactions (Crompton/Great Lakes Chemical and Lubrizol/Noveon), represents revised target synergies.
(2) See Summary of Principal Events, page 2.
7
Additional Realized (or Revised Target) Synergies
Announced Synergies
Noveon
Lubrizol /
/ Witco
& Knowles
Crompton
Morton
Hass /
Rohm and
Chemical
Lakes
/ Great
Crompton
Dearborn
Betz-
Hercules /
Lilly
Valspar /
Allen
Boake
IFF / Bush
Carbide
Union
Dow /
25.0%
20.0%
15.0%
10.0%
5.0%
0.0%
0.5%
3.5%
3.2%
3.5%
1.4%
2.9%
12.4%
3.1%
5.9%
8.6%
10.4%
8.8%
Acquiror /
Target
Date Aug-99 Sep-00 Jun-00 Jul-98 Mar-05 Feb-99 Jun-99 Apr-04
Transaction
Value ($M) $11,670 $974 $975 $2,957 $1,800 $4,857 $2,029 $1,840
Mean: 10.7%
4.0%
6.3%
7.7%
9.4%
10.0%
13.3%
14.0%
21.2%
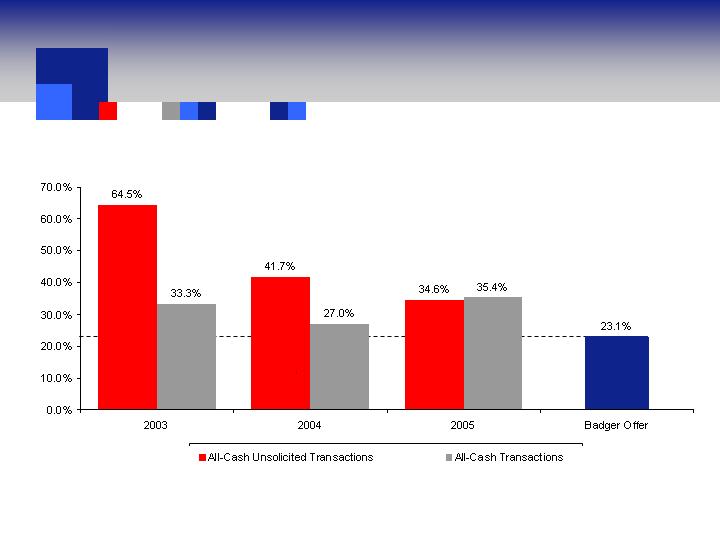
OFFER REPRESENTS A LOW CONTROL PREMIUM VERSUS
PRECEDENT TRANSACTIONS
BASF Offer represents a premium of 22.7% and 23.1% for 1-day and 4-weeks prior to
announcement (1)
Source: SDC Platinum.
(1) January 3, 2006 is the day on which the BASF offer was publicly announced.
(2) Represents average premium offered in transactions above $1 billion versus target share price 4 weeks prior to announcement, for deals completed in 2003, 2004 and 2005.
Excludes premiums of announcements subsequently withdrawn.
(3) Based on Engelhard closing share price of $30.06 on December 6, 2005, 4 weeks prior to BASF’s unsolicited proposal.
8
(3)
(2)
(2)
EXPLORATION OF ALTERNATIVES TO MAXIMIZE VALUE COULD
DELIVER HIGHER VALUE THAN OFFER
Your Board is focused on aggressively exploring strategic alternatives to
maximize stockholder value
This strategy may include a sale of the entire company
The Board has retained Merrill Lynch & Co. to assist in the review of these
alternatives
The Board believes that alternatives to the Offer could provide stockholders
with greater value
The Board believes that tendering into
the Offer before the Board and its advisors have had
the opportunity to fully explore alternatives could
interfere with the ability of the Board to effect a
financially superior alternative
9

STAND-ALONE BUSINESS HIGHLIGHTS
Engelhard is one of the largest surface and materials science companies in the world
The Company has made significant investments in recent years in both organic
growth initiatives and strategic acquisitions
Engelhard has demonstrated a strong commitment to R&D
Engelhard has streamlined its business portfolio and used the proceeds to invest in
higher-margin businesses
Over the last several years, Engelhard has exited legacy precious-metal
fabrication businesses
Engelhard is expected to benefit from numerous global trends over the next several
years which include:
Significant increase in demand projected for sophisticated emission-control
technologies as more stringent regulatory guidelines take effect globally
Worldwide growing demand for energy, energy-related materials and
environmentally friendly fuels
10
11
29%
$100
43%
$150
21%
$75
7%
$25
15%
$675
2%
$75
23%
$1,000
16%
$725
44%
$1,950
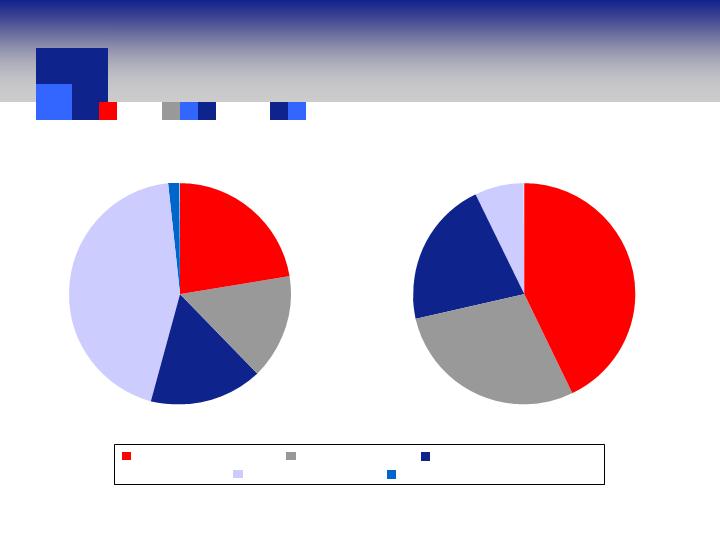
Appearance & Performance Tech.
Environmental Technologies
Process Technologies
Materials Services
Ventures
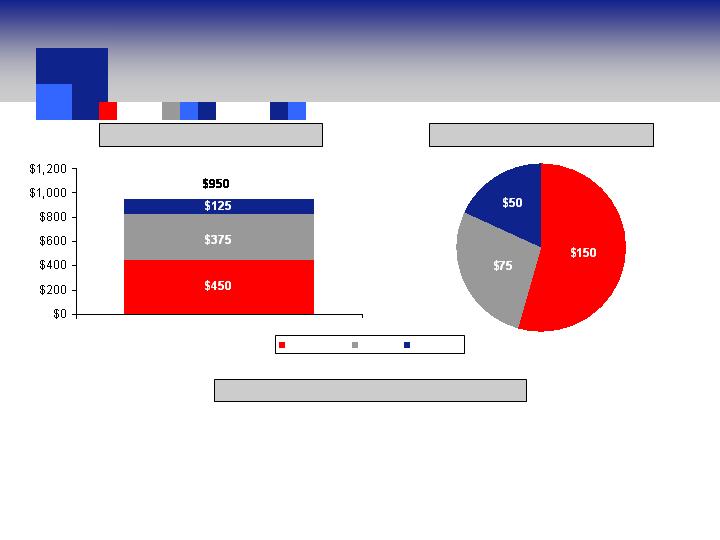
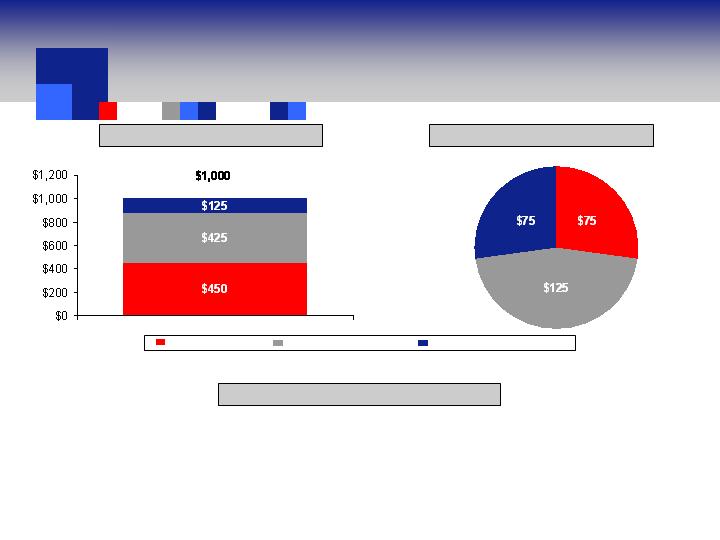
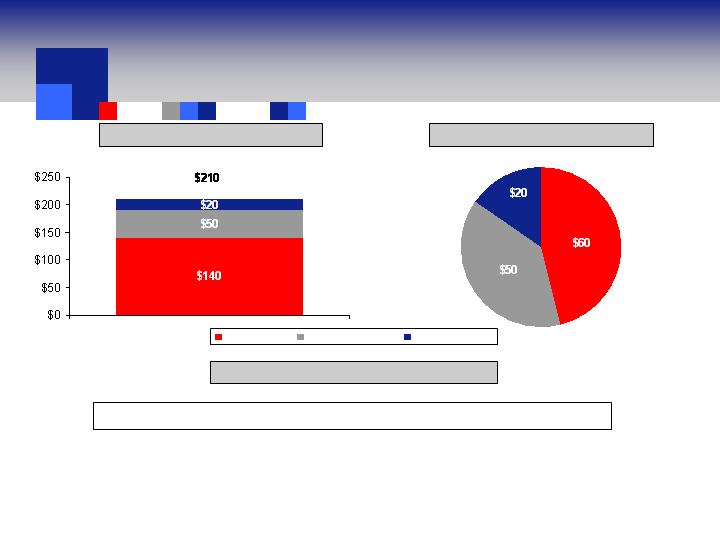
OVERVIEW OF THE BUSINESS SEGMENTS
Engelhard technology platforms enable growth in expanding markets
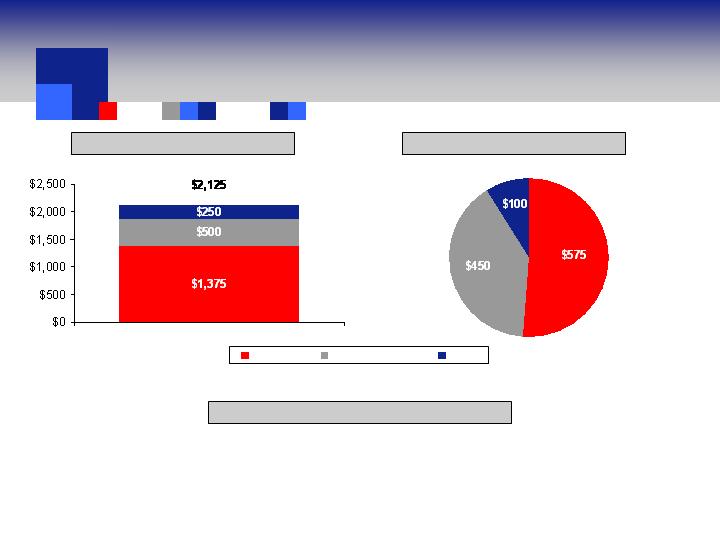
2005E Sales: $4,425mm (1)
2005E Operating Earnings: $350mm (1) (2)
Note: Dollars in millions, rounded to the nearest $25 million.
(1) 2005E financial information is based on Wall Street equity research, and in addition incorporates Ventures, which is based on guidance from Engelhard Management.
(2) Operating earnings does not include unallocated corporate expense.
12
$1,000
$2,125
$950
$1,000
$1,950
$2,425
$675
$725
$200
$75
16%
7%
7%
4%
22%
$0
$1,000
$2,000
$3,000
$4,000
$5,000
$6,000
$7,000
$8,000
2005E
2010E
'05E-'10E CAGR
0.0%
10.0%
20.0%
30.0%
40.0%
50.0%
60.0%
$4,425
$6,700
9%
(3)
$3.95
(4)
$1.94
EPS
10.6%
7.9%
Oper. Earnings Margin
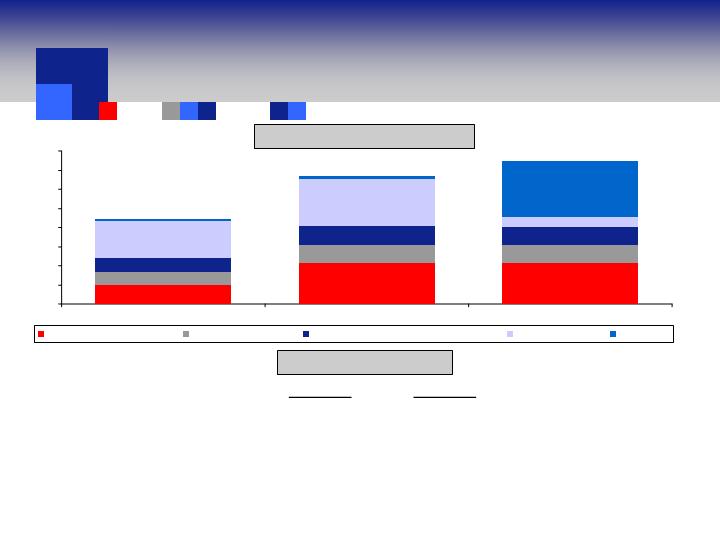
$6,700
$4,425
Sales
2010E
2005E
Ventures
Materials Services
Appearance & Performance Technologies
Process Technologies
Environmental Technologies
(1)
2005E financial information is based on Wall Street equity research and Ventures data as per Engelhard management guidance. 2010E financial information based on
Engelhard Management Operating Plan estimates developed in August, 2005. See Appendix for key assumptions. All financial information rounded to the nearest $25mm.
(2) Financial numbers includes Ventures segment (reported in the Company’s “All Other” category).
(3) Operating earnings does not include unallocated corporate expense.
(4) Source: First Call as of January 23, 2006.
Key Financial Targets (2)
$’s in Millions
Engelhard 5 Year Sales Target (1)
5-YEAR GROWTH AND MARGIN TARGETS
FINANCIAL GOALS / EXPECTATIONS
2006 (1)
Double digit earnings growth from Technology Segments
$100+ million free cash flow
13% return on average total capital
Maintain financial flexibility
2006-2010 (1)
EPS growth of approximately 16.5%
Over 300 Bps Operating Margin improvement
Revenues 8% CAGR
Cumulative Free Cash Flow $500+ million
ROAC 14%-15%
(1) Based on Engelhard Management Operating Plan estimates developed August, 2005. See Appendix for key assumptions.
13
ENVIRONMENTAL TECHNOLOGIES
OVERVIEW
Marketing Cost-effective
Compliance
Global presence; diverse
markets & customers
Increasingly stringent
environmental regulations
Technology-driven
products and processes
Sales $1,000 $2,125
’06E - ’10E Operating
Earnings Growth
Note: Dollars in millions. All financial information rounded to nearest $25 million and includes pass-through of substrates for
medium and heavy-duty diesel.
(1) 2005E financial information is based on Wall Street equity research.
(2) 2010E financial information is based on Engelhard Management Operating Plan estimates developed August, 2005.
See Appendix for key assumptions.
2005E (1)
2010E (2)
Low teens
14
Note: Above 2010E financial information based on Engelhard Management Operating Plan estimates developed August, 2005. See Appendix for key assumptions.
Numbers rounded to the nearest $25mm.
(1) Other includes retrofit, motorcycle, other mobile sources, stationary and EMS.
(2) Percentage numbers are 2005E-2010E CAGR of the respective market.
ENVIRONMENTAL TECHNOLOGIES -
FINANCIAL TARGETS
$1,125
Incremental Sales from ’05E to ’10E (2)
2010E Sales Target
2010E Operating Earnings Target of $250 million
Other (1)
Heavy Duty Diesel
Automotive
58%
11%
11%
15
ENVIRONMENTAL TECHNOLOGIES – GROWTH OPPORTUNITIES
Increasingly stringent regulations around the world
Approximately 70% operating earnings growth in the heavy-duty diesel market (1)
Technology leadership position
Specific strengths in engine and catalyst technology
Expansion into a broad range of developing markets and geographies
Sustainable productivity gains
Great levels of compliance with existing regulations
Engelhard’s base global auto-catalyst business expected to grow at more than 5%,
excluding medium- and heavy-duty diesel
(1) Based on Engelhard Management Operating Plan estimates developed August, 2005. See Appendix for key assumptions.
Environmental Technologies will be a significant driver of growth
16
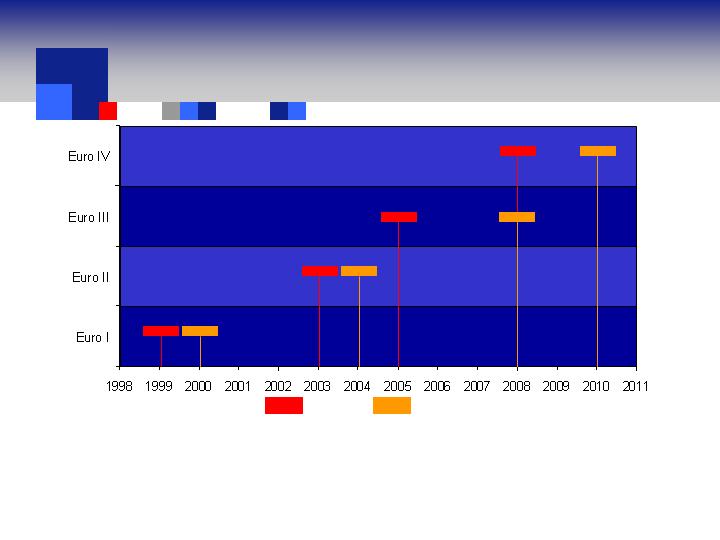
ENVIRONMENTAL TECHNOLOGIES – GROWTH OPPORTUNITIES
INCREASINGLY STRINGENT REGULATIONS
Overview of Upcoming Regulations Calendar
Changes in regulation should fuel double-digit operating earnings growth from 2005 to 2010 for
the segment (1)
17
(1) Based on Engelhard Management Operating Plan estimates developed August, 2005. See Appendix for key assumptions.
Regulation Event
Segment Impact
Timing
U.S. Diesel
Market
Medium
-
and Heavy
-
Duty Diesel
Off
-
road Diesel
Medium
-
and Heavy
-
Duty
Diesel
Locomotive and Marine
January 2007
January 2008
January 2010
January 2011
European Diesel
Market
(Euro IV
& Euro V)
Heavy
-
Duty Diesel
–
New models
Heavy
-
Duty Diesel
–
All models
Diesel and Gas Auto
Light
-
Duty Diesel
October 2005
October 2006
January 2008
January 2010
China Diesel
Market
(Euro III & IV)
Light
-
Duty Diesel
Mid 2007 &
Mid 2010
ENVIRONMENTAL TECHNOLOGIES – GROWTH OPPORTUNITIES
EXPANSION INTO DEVELOPING MARKETS AND GEOGRAPHICS
Beijing
Shanghai
Guangzhou
National
Chinese auto market is expected to grow at 20% annually with
Engelhard having a market share of 30% (1)
(1) Source: Based on Engelhard Management Operating Plan estimates developed August, 2005. See Appendix for key assumptions.
18
PROCESS TECHNOLOGIES
OVERVIEW
Marketing Process
Productivity
Technology/market
development
Environmental regulations
Value Pricing
Sales $675 $950
’06E - ’10E Operating
Earnings Growth
2005E (1)
2010E (2)
Mid teens
Note: Dollars in millions. All dollar amounts rounded to the nearest $25 million.
(1) 2005E financial information is based on Wall Street equity research.
(2) 2010E financial information is based on Engelhard Management Operating Plan estimates developed August, 2005.
See Appendix for key assumptions.
19
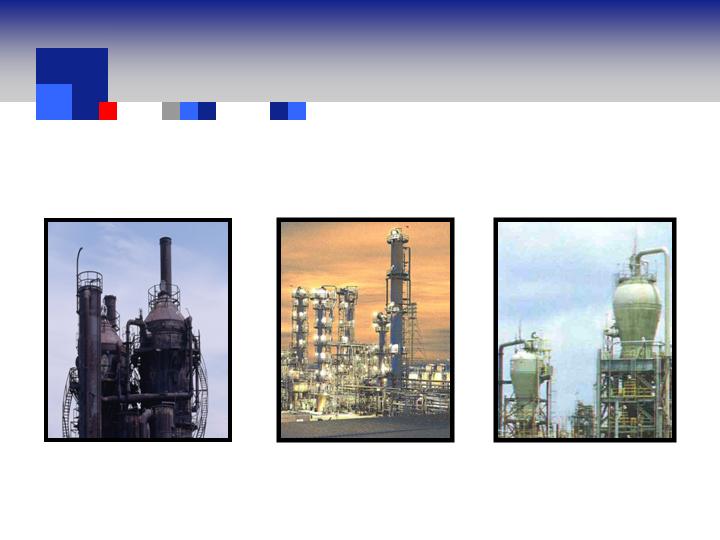
Markets Served
Polyolefins
Refining
Chemical
PROCESS TECHNOLOGIES
20
PROCESS TECHNOLOGIES – GROWTH OPPORTUNITIES
Growth initiatives include:
Increased product offerings to previously unserved refining markets including diesel, distillate and
petrochemical feedstock markets
Continued expansion of the gas-to-liquids market with Fischer-Tropsch and Syngas technology;
continue to leverage those technologies in the emerging gas economy
Expansion into various unserved petrochemical markets based on current commercial agreements
Increased synergies from leveraging DMS technology platform to expand FCC
Leverage Lynx polyolefins success in polyethylene catalyst market
Process Technologies is poised to achieve double-digit operating earnings
growth in 2006 to 2010 (1)
(1) Based on Engelhard Management Operating Plan estimates developed August, 2005. See Appendix for key assumptions.
21
PROCESS TECHNOLOGIES -
FINANCIAL TARGETS
2010E Sales Target
$275
Incremental Sales from ’05E to ’10E (2)
Note: Above financial information based on Engelhard Management Operating Plan estimates developed August, 2005. See Appendix for key assumptions. Numbers
rounded to the nearest $25mm.
(1) Precious Metals revenues included in Chemicals.
(2) Percentage numbers are 2005E-2010E CAGR of the respective market.
Chemicals (1)
Refining
Polyolefins
8%
5%
11%
2010E Operating Earnings Target of $200 million
22
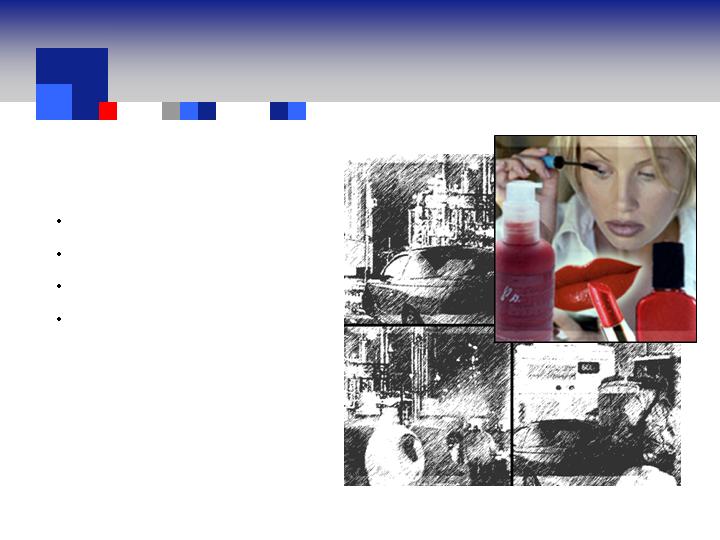
APPEARANCE & PERFORMANCE TECHNOLOGIES
OVERVIEW
Enabling Marketing of
Enhanced Image &
Functionality
Develop markets
Leverage assets
Enrich product mix
Pricing and sustainable
productivity gains
Sales $725 $1,000
’06E - ’10E
Operating
Earnings Growth
2005E (1)
2010E (2)
Double-digit
Note: Dollars in millions and rounded to the nearest $25 million.
(1) 2005E financial information is based on Wall Street equity research.
(2) 2010E financial information is based on Engelhard Management Operating Plan estimates developed August, 2005.
See Appendix for key assumptions.
23
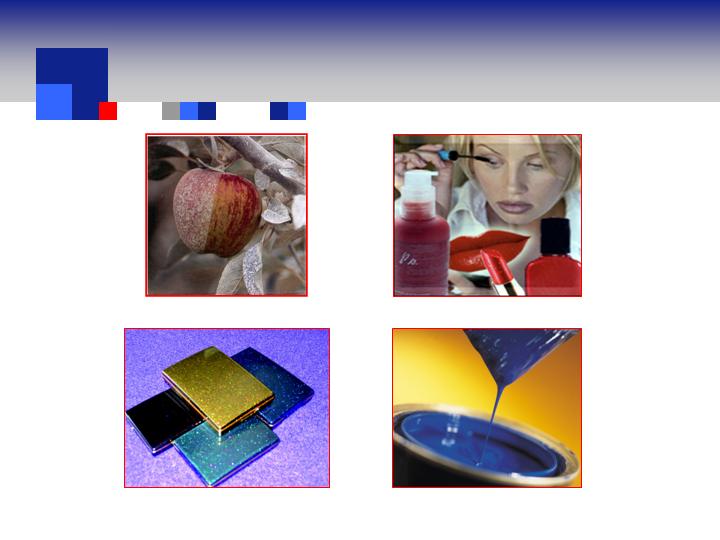
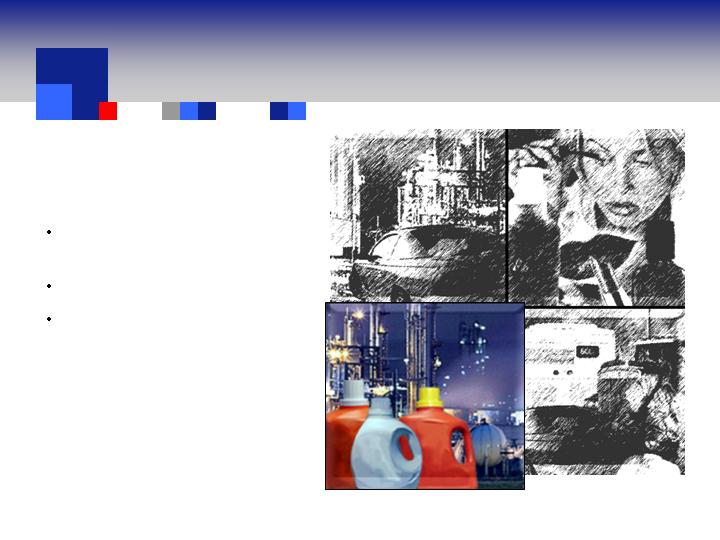
DIVERSE MARKET BASE
Personal Care and Cosmetics
Surround® Crop Protectant
Plastics and Packaging
Paints and Coatings
24
APPEARANCE & PERFORMANCE TECHNOLOGIES –
GROWTH OPPORTUNITIES
Worldwide leadership position in personal care and cosmetics
Expected to achieve double-digit operating earnings growth supported by technology leadership and
strong customer relationships
Growth strategy in personal care meets increased demand from baby boomers
Globalization
Continued growth in world market, especially China
Significant margin improvement in kaolin market
Improved product mix – less dependence on paper
Decreased paper market exposure from 70% in 2000 to 30% in 2006
Kaolin is an important value driver in leveraging Engelhard’s DMS technology platform
Cash-flow generation including tax benefit
Strength in paints and coatings market augmented by penetration in agriculture and construction materials
Differentiation: Offerings allow customization, create self-appeal, improved appearance and functionality
Growth initiatives supported by stable productivity gains and pricing
Appearance & Performance Technologies is positioned for double-digit
growth
25
APPEARANCE & PERFORMANCE TECHNOLOGIES –
FINANCIAL TARGETS
Incremental Sales from ’05E to ’10E (2)
2010E Sales Target
$275
Note: Above financial information based on Engelhard Management Operating Plan estimates developed August, 2005. See Appendix for key assumptions.
Numbers rounded to the nearest $25mm.
(1)
Specialty Minerals includes kaolin and attapulgite.
(2)
Percentage numbers are 2005E-2010E CAGR of the respective market.
Specialty Minerals (1)
Effects Materials and Colors
Personal Care Materials
7%
20%
4%
2010E Operating Earnings Target of $175 million
26
VENTURES – GROWTH OPPORTUNITIES
Drive to become the global leading supplier of non-carbon separation and
purification technologies to the gas, fuel and water markets that generate $200
million in revenues in 2010
Oil and gas well stimulation materials allow for earnings growth, given supply
shortages and strong exploration and production activities
Increased cost of fossil fuels will provide growth opportunities in alternative
energy sources including fuel cells, photovoltaics, biofuels and battery materials
Ventures systematically develops adjacent space opportunities that
leverage attractive markets and new technologies
27
VENTURES –
FINANCIAL TARGETS
Incremental Sales from ’05E to ’10E (2)
2010E Sales Target
$130
Note: Above financial information based on Engelhard Management Operating Plan estimates developed August, 2005. See Appendix for key assumptions.
Numbers rounded to the nearest $10mm.
(1) Energy Materials includes Proppants and Fuel Cell.
(2)
Percentage numbers are 2005E-2010E CAGR of the respective market.
Alumina/Silica
Energy Materials (1)
Water Treatment
12%
NA
NA
Programs commercialized to date will yield $14 million in operating earnings in 2006
2010E Operating Earnings Target of $40 million
28
MATERIALS SERVICES
OVERVIEW
Enabling Technology
Businesses
$2- $3 million operating
income per quarter; with
upside
High returns on invested
capital
Source of cash
Risk management
Enabler for catalyst sales
Sales $1,950 $2,425
2010E (2)
2005E (1)
Note: Dollars in millions and rounded to the nearest $25 million.
(1) 2005E financial information is based on Wall Street equity research.
(2) 2010E financial information is based on Engelhard Management Operating Plan estimates developed August, 2005. See Appendix for key assumptions.
29

MATERIALS SERVICES – CORE STRENGTHS
Experienced management team with knowledge in specific markets
Assay Services
Inventory management
Logistics and security
Precious-metal-based solutions
Refining and recycling
30

CONCLUSION
After careful consideration, including a thorough review of the BASF Offer with
the Company’s legal and financial advisors, the Board unanimously determined
that the BASF Offer is inadequate and not in the best interests of Engelhard
stockholders (other than BASF and its affiliates)
Engelhard’s business plan, fueled by several different value opportunities, is
expected to generate earnings growth and return on capital in the mid-teens
over the next several years
This growth opportunity is something the Wall Street community has only
begun to appreciate
The BASF Offer, from a variety of value metrics, undervalues the upside in the
Company share price
Tendering into the Offer before the Board and its advisors have had the
opportunity to fully explore alternatives could interfere with the ability of the
Board to effect a financially superior alternative
31

Appendix
32

FORWARD-LOOKING STATEMENT
REGARDING FUTURE PERFORMANCE
The Company does not as a matter of course make detailed public projections as to future performance or earnings. The
projections were not prepared with a view to public disclosure or compliance with the published guidelines of the SEC or the
guidelines established by the American Institute of Certified Public Accountants regarding projections or forecasts. The
projections do not purport to present operations in accordance with accounting principles generally accepted in the U.S. The
Company’s independent accountants have not examined, compiled or otherwise applied procedures to the projections and,
accordingly, do not express an opinion or any other form of assurance with respect to the projections. The Company’s
internal financial forecasts are prepared solely for internal use and capital budgeting and other management decisions and
are subjective in many respects and thus susceptible to interpretations and periodic revisions based on actual experience and
business developments.
The projections also reflect numerous assumptions made by management of the Company with respect to industry
performance, general business, economic, market and financial conditions and other matters, all of which are difficult to
predict and many of which are beyond the Company’s control. Accordingly, there can be no assurance that the assumptions
made in preparing the projections will prove accurate. It is expected that there will be differences between actual and
projected results, and actual results may be materially greater or less than those contained in the projections. The inclusion
of the projections herein should not be regarded as an indication that the Company or its affiliates or representatives
considered or considers the projections herein should be relied upon as such.
Neither the Company nor any of its affiliates or representatives have made or makes any representations to any person
regarding the ultimate performance of the Company compared to the information contained in the projections and none of
them intends to update or otherwise revise the projections to reflect circumstances existing after the date when made or to
reflect the occurrence of future events even in the event that any or all of the assumptions underlying the projections shown
to be in error.
33

KEY ASSUMPTIONS
Environmental Technologies
Light Duty Vehicles
• Light duty vehicle builds will grow globally at 2% over the plan period, from 62 million vehicles in 2005 to 68 million by 2010, driven primarily by increasing living standards in
emerging markets.
• N. America with strictest regulation and largest engines averages almost three catalysts per vehicle. Europe, with increasing penetration rates of catalyzed soot filters (CSF) will
increase to slightly over two catalysts per vehicle. Tightening regulatory standards in developing countries will bring the average in these regions up to one catalyst per vehicle.
• Increasingly strict regulatory standards and fluctuating precious metal pricing will require more advanced technology with related value pricing.
• Net effect of the above is that the global market for light duty emission control catalysts will grow at a 5% CAGR, from $1.5B in 2005 to $1.9B by 2010. Of the $1.9B in 2010,
$1.4B relates to gasoline with the remaining $0.5B relating to light-duty diesel, primarily in Europe.
• Gasoline:
1. Global segment will grow from 103M catalysts in 2005 to 115M by 2010, a 2.2% CAGR, with an average catalyst manufacturing charge of $12/catalyst.
2. N. America and Europe will show minimal growth with Japan and Korea flat. Most of the growth will come from emerging markets, led by China.
3. Stricter regulations will be adopted in the emerging markets over the plan period. China and India will begin Euro 3 this year and Euro 4 by 2008-10. Brazil will adopt a US Tier
2 program in 2009. Russia will begin to implement Euro 2 this year and Euro 3 by 2008.
• Light-duty Diesel:
1. Europe, which accounts for 75% of the market, will grow from 9.4M vehicles in 2005 to almost 12M by 2010, a 5% CAGR. A large percentage of the remaining 25% is
produced in Japan and Korea for export into Europe.
2. The biggest driver for this growth is the diesel penetration rate growing from 46% this year to 50% by 2010.
3. The catalyst market for light-duty diesels in Europe is currently forecasted to be almost $400M by the end of 2010. The largest growth opportunity is the accelerated adoption
rate of CSF’s.
4. Euro 4, which began phasing in 2004 (2005 new platforms) has not been filter (CSF) forcing. However, several European countries became aware that ambient air quality
standards were being exceeded in urban areas, primarily due to particulate matter. Driving restrictions on unfiltered vehicles were discussed as a possible solution which
prompted OEM’s to “voluntarily” install filters.
5. Awareness of particulate matter has forced the EU to accelerate the adoption of Euro 5 for light-duty diesel (now projected for 2009). Euro 5 reduces particulate emissions by
80% vs. Euro 4 and will be filter forcing for a majority of diesel vehicles.
6. Grow EC’s market share in Europe from 24% to 35% by 2008.
Note: Based on Engelhard Management Operating Plan estimates developed August, 2005.
34

KEY ASSUMPTIONS
Environmental Technologies (Cont’d)
Heavy-Duty Diesel
• HDD engine demand will increase only 1% per year, from 1.6M engines in 2005 to 1.7M engines in 2010 in the U.S., Europe and Japan.
• However, tightening regulations will increase the catalyst market from 1.4M units in 2005 to 5M units in 2010.
• Revenues (ex-PGM/ex-substrate) are projected to grow from $100M in 2005 to $330M in 2010.
• For On-Road, US 2007 & 2010, Euro 4 & 5 and Japan 2005 & 2009 are “On Track” for implementation.
• Successful fleet testing of US07 emission systems in 2006.
• Non-vanadium SCR will be required in US, Europe and Japan.
• European tax incentive programs will drive early adoption of CSF’s.
• New off-road regulations begin in 2008 and are not included in revenues or earnings estimates.
Stationary Source
• The Food Service market will grow from $3M in 2005 to $10M in 2010 driven by pending charbroiler regulations (2007). Addresses fine particulate control and health and safety
benefits for ventless ovens.
• Successful development of differentiated mercury sorbent technology for coal-fired power plants assumed for 2008-2010.
Temperature Sensing
• Market will grow from $225M in 2005 to $300M in 2010, a CAGR of 6%.
• EC will improve on its 8% market share through three growth strategies:
1. Accelerate optical thermometry commercialization by penetrating new markets.
2. Continue Asia geographic expansion.
3. Add wafer thermocouple technology to complete EC temperature measurement portfolio.
Note: Based on Engelhard Management Operating Plan estimates developed August, 2005.
35

KEY ASSUMPTIONS
Process Technologies
Chemicals
• Gas Economy catalyst market forecast to approximate $350M in 2006 with a CAGR of 15%.
• Additional Gas Economy catalyst growth from:
1. Planned expansion from current “gas-to-liquids” (GTL) customer.
2. Leveraging Fischer-Tropsch catalyst technology to other major GTL players.
3. Leverage our syngas position from Nanjing acquisition.
• Successful entry into unserved petrochemical markets, including ethane based styrene, ethane based acetic acid, propane based acrylic acid and propane based propylene
oxide, based on current commercial agreements.
• Growth rates for catalyst markets for oleochemicals, petrochemicals and fine chemicals range from 2% to 10%.
Petroleum Refining
• FCC Additives growth approximating 22%:
1. Underlying market growth of 10%.
2. Additional growth from the expansion into environmental and gasoline conversion additive technologies to meet increasing global demands of propylene and petrochemical
feedstocks and regulatory compliance.
• Entry into new refining market areas by leveraging EC technology through prospective licensing agreements, including hydrocracking, deep catalytic cracking and reforming.
• FCC market growth only projected at 2% with additional income from productivity gains.
• Natural gas price used was $7.25 per MMBTU. Adverse variances are expected to be substantially covered by surcharges and other pricing actions.
Polyolefins
• Polypropylene growth approximating 26%:
1. Assumed growth of 7% in proprietary catalyst representing underlying market growth of 5-6% and remaining growth through differentiation and acceleration of our technology
development into the packaging and film markets.
2. Growth in volume from new licenses.
• Continuation of entry into polyethylene market.
Note: Based on Engelhard Management Operating Plan estimates developed August, 2005.
36

KEY ASSUMPTIONS
Appearance and Performance Technologies
Personal Care Materials
• 7% growth per year in delivery systems for personal care through 2009. In the case of commodity vitamins (30% of market) where we don’t participate, the rate is 5%. For more
specialized actives, such as unique extracts from plants, the growth rate is closer to 10%.
• Additional revenues/earnings from expanding the product offerings globally from the acquisitions made in the U.S. and France in 2004 and 2005.
• Additional earnings from optimizing synergies in technology, manufacturing and sales as we continue to integrate the two acquisitions.
Effects
• Market for effects pigments in cosmetics and personal care will grow at 7% per year. The market growth rate for industrial applications will be 4-5%. Growth in the automotive
market will be lower.
• Expanding our innovation track into new programs beyond mica and borosilicate glass, bismuth and film by focusing R&D on technology platforms and away from line extensions
will add $15M to revenues.
• Cost reductions will add $10M to earnings by 2010.
• Faster innovation and an applications lab in China will work to counter Chinese competition. As well as paying attention to costs.
Kaolin
• Recover $10M in revenue and $4M in earnings from strikes in Finland and Canada.
• $24M in revenue in 2010 from Décor Growth Program (decorative laminate paper market with substitution for TiO2).
• Crop Protectants (Surround) will add $28M of revenues and $10M of earnings by 2010.
• Cost reduction initiatives will add $12M in earnings.
• Natural gas price used was $7.25 per MMBTU. Adverse variances are expected to be substantially covered by surcharges and other pricing actions.
Note: Based on Engelhard Management Operating Plan estimates developed August, 2005.
37

KEY ASSUMPTIONS
Ventures
Alumina business acquired in 2005 accounts for $12M of 2010 operating earnings with modest growth rates.
• Frac Sand accounts for $9M of 2010 operating earnings and depends mostly on continued demand from the energy sector.
• Aseptrol/Water Treatment are slated to generate $7M of operating earnings related to health requirements.
• Nothing included in revenues and earnings for Ceramic Proppants and Battery Materials programs.
Corporate
• Share buy-back programs, enabled by operating cash flows, will offset the dilutive impact of employee benefit plans. Diluted shares outstanding
for Operating Plan period are 122 million.
• The average effective tax rate for the Operating Plan period is 23%, with the 2010 period at 24%.
• Equity earnings from the Company’s equity method joint ventures, which primarily serve the Japanese and Korean automotive catalyst markets,
have conservatively been held constant throughout the plan period, despite a 25% CAGR over the past three years.
Note: Based on Engelhard Management Operating Plan estimates developed August, 2005.
38