Table of Contents
As filed with the Securities and Exchange Commission on February 26, 2016
UNITED STATES
SECURITIES AND EXCHANGE COMMISSION
WASHINGTON, D.C. 20549
FORM 20-F
(Mark One)
o | REGISTRATION STATEMENT PURSUANT TO SECTION 12(b) OR 12(g) OF THE SECURITIES EXCHANGE ACT OF 1934 |
| |
OR |
| |
x | ANNUAL REPORT PURSUANT TO SECTION 13 OR 15(d) OF THE SECURITIES EXCHANGE ACT OF 1934
For the fiscal year ended December 31, 2015 |
| |
OR |
| |
o | TRANSITION REPORT PURSUANT TO SECTION 13 OR 15(d) OF THE SECURITIES EXCHANGE ACT OF 1934 |
| |
OR |
| |
o | SHELL COMPANY REPORT PURSUANT TO SECTION 13 OR 15(d) OF THE SECURITIES EXCHANGE ACT OF 1934 |
Date of event requiring this shell company report . . . . . . . . . . . . . . . . . . .
For the transition period from to
Commission file number : 001-8382
AKTIEBOLAGET SVENSK EXPORTKREDIT |
(Exact name of Registrant as specified in its charter) |
|
(SWEDISH EXPORT CREDIT CORPORATION) |
(Translation of Registrant’s name into English) |
|
Kingdom of Sweden |
(Jurisdiction of incorporation or organization) |
|
Klarabergsviadukten 61-63, Stockholm, Sweden |
(Address of principal executive offices) |
|
contact person: |
Susanna Rystedt, Swedish Export Credit Corporation, P.O.Box 194, SE-101 23 Stockholm Email: Susanna.Rystedt@sek.se Phone 46-8-613 85 64, Fax 46-8-20 38 94 (1) |
Securities registered or to be registered pursuant to Section 12(b) of the Act:(2)
Title of each class | | Name of each exchange on which registered |
ELEMENTSSM Linked to the SPECTRUM Large Cap U.S. Sector Momentum Index developed by BNP Paribas due August 8, 2022 | | NYSE ARCA, Inc. |
| | |
ELEMENTSSM Linked to the Rogers International Commodity Index® — Agriculture Total ReturnSM due October 24, 2022 | | NYSE ARCA, Inc. |
| | |
ELEMENTSSM Linked to the Rogers International Commodity Index® — Energy Total ReturnSM due October 24, 2022 | | NYSE ARCA, Inc. |
| | |
ELEMENTSSM Linked to the Rogers International Commodity Index® — Metals Total ReturnSM due October 24, 2022 | | NYSE ARCA, Inc. |
| | |
ELEMENTSSM Linked to the Rogers International Commodity Index® — Total ReturnSM due October 24, 2022 | | NYSE ARCA, Inc. |
| | |
ELEMENTSSM Linked to the MLCX Biofuels Index (Exchange Series) — Total Return due February 13, 2023 | | NYSE ARCA, Inc. |
| | |
ELEMENTSSM Linked to the MLCX Grains Index — Total Return due February 14, 2023 | | NYSE ARCA, Inc. |
Securities registered or to be registered pursuant to Section 12(g) of the Act:
Table of Contents
Securities for which there is a reporting obligation pursuant to Section 15(d) of the Act:
Indicate the number of outstanding shares of each of the issuer’s classes of capital or common stock as of the close of the period covered by the annual report:
Indicate by check mark if the registrant is a well-known seasoned issuer, as defined in Rule 405 of the Securities Act.
x Yes o No
If this report is an annual or transition report, indicate by check mark if the registrant is not required to file reports pursuant to Section 13 or 15(d) of the Securities Exchange Act of 1934.
o Yes x No
Note — Checking the box above will not relieve any registrant required to file reports pursuant to Section 13 or 15(d) of the Securities Exchange Act of 1934 from their obligations under those Sections.
Indicate by check mark whether the registrant: (1) has filed all reports required to be filed by Section 13 or 15(d) of the Securities Exchange Act of 1934 during the preceding 12 months (or for such shorter period that the registrant was required to file such reports), and (2) has been subject to such filing requirements for the past 90 days:
x Yes o No
Indicate by check mark whether the registrant is a large accelerated filer, an accelerated filer, or a non-accelerated filer. See definition of “accelerated filer and large accelerated filer” in Rule 12b-2 of the Exchange Act. (Check one):
Large accelerated filer o | | Accelerated filer o | | Non-accelerated filer x |
Indicate by check mark which basis of accounting the registrant has used to prepare the financial statements included in this filing:
U.S. GAAP o | | International Financial Reporting Standards as issued
by the International Accounting Standards Board x | | Other o |
If “Other” has been checked in response to the previous question indicate by check mark which financial statement item the registrant has elected to follow.
o Item 17 o Item 18
If this is an annual report, indicate by check mark whether the registrant is a shell company (as defined in Rule 12b-2 of the Exchange Act).
o Yes x No
(APPLICABLE ONLY TO ISSUERS INVOLVED IN BANKRUPTCY PROCEEDINGS DURING THE PAST FIVE YEARS)
Indicate by check mark whether the registrant has filed all documents and reports required to be filed by Sections 12, 13 or 15(d) of the Securities Exchange Act of 1934 subsequent to the distribution of securities under a plan confirmed by a court.
o Yes o No
Table of Contents
INTRODUCTORY NOTES
In this annual report on Form 20-F (the “annual report”), unless otherwise specified, all amounts are expressed in Swedish kronor (“Skr”). See Item 3, “Key Information”, for a description of historical exchange-rates and other matters relating to the Swedish kronor.
In this annual report, unless otherwise indicated, all descriptions and financial information relate to the consolidated group consisting of Aktiebolaget Svensk Exportkredit (publ) (Swedish Export Credit Corporation) (the “Parent Company”), including the “State Support System” (the “S-system”), which is described in detail herein, and the Parent Company’s wholly-owned subsidiary Venantius AB (including its wholly-owned subsidiary VF Finans AB) (the “Subsidiary” and together with the Parent Company, “SEK”, the “Consolidated Group” or the “Group”). In certain instances, information relating to the S-system on a stand-alone basis is provided separately. The Consolidated Financial Statements of SEK included in Item 18 (the “Consolidated Financial Statements”) comprise the financial statements of the Parent Company and the Subsidiaries. In certain cases, comparable figures for earlier financial periods are reported in parentheses after the relevant figure for the current period. For example, “(2014: Skr 10 million)” means that the relevant figure for 2014, or as of December 31, 2014, as the context requires, was Skr 10 million.
As used herein, the words “we”, “our”, “us” and “ours” refer to the Parent Company or to the Group, as the context requires.
The Parent Company is a “public company” within the meaning of the Swedish Companies Act (2005:551). A Swedish company, even if its shares are not listed on an exchange and are not publicly traded, may choose to declare itself a “public company”. Only public companies are allowed to raise funds from the public through the issuance of debt instruments. A public company is required to add the notation “publ” to its name, unless it is evident from the company’s name that the company is a public company.
Additional information about SEK, including investor presentations and the Annual Report for the financial year 2015, is available at www.sek.se. Information available on or accessibly through SEK’s website is not incorporated herein by reference.
FORWARD-LOOKING STATEMENTS
This annual report contains forward-looking statements. We have based these forward-looking statements on our current expectations and projections about future events. These statements include but are not limited to:
· statements regarding financial projections and estimates and their underlying assumptions;
· statements regarding plans, objectives and expectations relating to future operations and services;
· statements regarding the impact of regulatory initiatives on SEK’s operations;
· statements regarding general industry and macroeconomic growth rates and SEK’s performance relative to them; and
· statements regarding future performance.
Forward-looking statements generally are identified by the words “expect”, “anticipate”, “believe”, “intend”, “estimate”, “should”, and similar expressions.
Forward-looking statements are based on current plans, estimates and projections, and therefore readers should not place undue reliance on them. Forward-looking statements speak only as of the date they are made, and SEK undertakes no obligation to update any forward-looking statement in light of new information or future events, although SEK intends to continue to meet its ongoing disclosure obligations under the U.S. securities laws (such as the obligations to file annual reports on Form 20-F and reports on Form 6-K) and under other applicable laws. Forward-looking statements involve inherent risks and uncertainties, most of which are difficult to predict and generally beyond SEK’s control. Readers are cautioned that a number of important factors could cause actual results or outcomes to differ materially from those expressed in, or implied by, forward-looking statements. These factors include, among others, the following:
1
Table of Contents
· Disruptions in the financial markets or economic recessions may have an adverse effect on SEK’s ability to repay its debt;
· SEK is exposed to credit risk even in normal economic circumstances. Disruptions in the financial markets or economic recessions may further negatively affect the credit quality of borrowers and cause other risk to counterparties, which may cause credit losses or affect the value of assets;
· Reduced access to international capital markets for the financing of SEK’s operations, or less favorable financing terms, may have negative impacts on SEK’s profitability and its ability to fulfill its obligations;
· SEK may experience negative changes in the value of its assets or liabilities and may incur other losses related to volatile and illiquid market conditions;
· SEK’s hedging strategies may not prevent losses;
· Fluctuations in foreign currency exchange-rates could harm SEK’s business;
· Increasing competition may adversely affect SEK’s income and business;
· SEK is exposed to significant operational risk;
· Changes in law or regulation may adversely affect SEK’s business;
· Risk related to financial reporting and other deficiencies in internal control over financial reporting and disclosure processes could result in errors, affect operating results and cause investors to lose confidence in our reported results;
· Developments in emerging market countries may adversely affect the Group’s business;
· Negative interest rates may have an impact on SEK’s profitability and
· Natural disasters, social and political unrest and other factors beyond SEK’s control may disrupt financial markets and economic conditions in markets that SEK relies on.
PART I
ITEM 1. IDENTITY OF DIRECTORS, SENIOR MANAGEMENT AND ADVISORS
Not required as this 20-F is filed as an Annual Report.
ITEM 2. OFFER STATISTICS AND EXPECTED TIMETABLE
Not required as this 20-F is filed as an Annual Report.
2
Table of Contents
ITEM 3. KEY INFORMATION
A Selected Financial Data
The following selected consolidated financial data should be read in conjunction with our Consolidated Financial Statements and related notes. The consolidated statement of comprehensive income data for the years ended December 31, 2015, 2014, 2013, 2012 and 2011 and the consolidated statement of financial position data as of December 31, 2015, 2014, 2013, 2012 and 2011 have been derived from SEK’s Consolidated Financial Statements prepared in accordance with International Financial Reporting Standards as issued by the International Accounting Standard Board (IASB) (herein “IFRS”).
While complying with IFRS, SEK also complies with additional requirements of the Swedish Annual Accounts Act for Credit Institutions and Securities Companies (1995:1559) (ÅRKL), the Recommendation RFR1. Supplementary Accounting Principles for Groups, issued by the Swedish Financial Reporting Board (RFR) and the accounting regulations of Finansinspektionen (the Swedish FSA) (FFFS 2008:25).
The following information should be read in conjunction with the more detailed discussion contained in Item 5 “Operating and Financial Review and Prospects”.
| | Year Ended December 31, | |
(In Skr mn, unless otherwise stated) | | 2015 | | 2014 | | 2013 | | 2012(1) | | 2011(1) | |
CONSOLIDATED STATEMENT OF COMPREHENSIVE INCOME DATA | | | | | | | | | | | |
| | | | | | | | | | | |
Net interest revenues | | 1,662 | | 1,578 | | 1,555 | | 1,880 | | 1,871 | |
Operating income | | 2,056 | | 2,078 | | 1,958 | | 1,392 | | 2,500 | |
Operating profit (A) | | 1,535 | | 1,629 | | 1,408 | | 824 | | 1,889 | |
Net profit (after taxes) | | 1,187 | | 1,260 | | 1,090 | | 709 | | 1,400 | |
Dividend per share (Skr) (B) | | 89.22 | | 94.74 | | 81.96 | | 53.29 | | 105.26 | |
Total comprehensive income (C) | | 1,049 | | 1,494 | | 823 | | 868 | | 1,663 | |
Ratios of earnings to fixed charges (D) | | 2.31 | | 1.74 | | 1.54 | | 1.23 | | 1.47 | |
(1) Adjusted, please see Item C below
(A) Operating profit equals operating income minus personnel expenses, other administrative expenses, depreciation and impairment of non-financial assets and net credit losses. See the Consolidated Statement of Comprehensive Income.
(B) The dividend for the year ended December 31, 2015 is to be proposed to the Annual General Meeting which will be held in April 2016, and is subject to approval at that meeting.
(C) For the years 2012 and 2011 total comprehensive income was amended in 2013 due to the implementation of IAS 19R.
(D) For the purpose of calculating ratios of earnings to fixed charges, earnings consist of net profit for the year, plus taxes and fixed charges. Fixed charges consist of SEK’s interest expenses, including borrowing costs. See also Exhibit 7.1 Statement of Ratios of Earnings to Fixed Charges.
3
Table of Contents
| | December 31, | |
(In Skr mn, unless otherwise stated) | | 2015 | | 2014 | | 2013 | | 2012 (1) | | 2011 (1) | |
CONSOLIDATED STATEMENT OF FINANCIAL POSITION DATA | | | | | | | | | | | |
| | | | | | | | | | | |
Total loans outstanding (E) | | 205,097 | | 218,222 | | 201,477 | | 192,907 | | 195,600 | |
Total assets | | 280,411 | | 325,166 | | 306,554 | | 313,136 | | 319,702 | |
Total debt | | 235,644 | | 284,137 | | 270,822 | | 275,650 | | 276,420 | |
of which subordinated | | 2,088 | | 1,945 | | 1,607 | | 3,013 | | 3,174 | |
Equity (F) | | 16,828 | | 16,157 | | 14,990 | | 14,380 | | 13,932 | |
of which share capital | | 3,990 | | 3,990 | | 3,990 | | 3,990 | | 3,990 | |
Number of shares | | 3,990,000 | | 3,990,000 | | 3,990,000 | | 3,990,000 | | 3,990,000 | |
Total liabilities and equity | | 280,411 | | 325,166 | | 306,554 | | 313,136 | | 319,702 | |
(1) Adjusted, please see item F below
(E) Loans outstanding consist of loans due from commercial and financial institutions including loans in the form of interest bearing securities. Certain deposits with banks and states are not a part of total loans, although they are included in the items Loans to Credit Institutions and Loans to the Public in the statement of financial position. For a reconciliation of loans outstanding, see Note 11 to the Consolidated Financial Statements.
(F) For the years 2012 and 2011 equity was amended in 2013 due to the implementation of IAS 19R.
B Foreign Exchange-rates
The Group’s presentation currency is the Swedish kronor (“Skr”). The following tables set forth, for the periods and dates indicated, information concerning the noon buying rates for cable transfers in Swedish kronor, expressed in Skr per $1.00, as certified for customs purposes by the Federal Reserve Bank of New York.
Calendar Year | | High | | Low | | Average (A) | | Period End | |
2015 | | 8.8390 | | 7.8117 | | 8.4477 | | 8.3524 | |
2014 | | 7.8117 | | 6.3392 | | 6.9339 | | 7.8117 | |
2013 | | 6.8360 | | 6.2940 | | 6.5221 | | 6.5084 | |
2012 | | 7.2850 | | 6.5005 | | 6.7747 | | 6.5156 | |
2011 | | 6.9759 | | 6.0050 | | 6.4941 | | 6.9234 | |
2010 | | 8.0593 | | 6.5145 | | 7.2053 | | 6.7571 | |
(A) The average of the exchange-rates on the last day of each month during the period
Calendar Month 2015 | | High | | Low | |
September | | 8.4607 | | 8.1810 | |
October | | 8.5365 | | 8.1152 | |
November | | 8.7395 | | 8.5162 | |
December | | 8.7025 | | 8.3459 | |
Calendar Month 2016 | | High | | Low | |
January | | 8.6024 | | 8.5057 | |
February 1st until February 19th | | 8.5749 | | 8.344 | |
4
Table of Contents
The noon buying rate on February 19, 2016 was $1.00 = Skr 8.4426
No representation is made that Swedish krona amounts have been, could have been or could be converted into U.S. dollars at the foregoing rates on any of the dates indicated.
C Risk Factors
Disruptions in the financial markets or economic recessions may have an adverse effect on SEK’s ability to repay its debt.
SEK’s financial performance, as represented in its statement of financial position and of comprehensive income, may be adversely affected by a number of factors, many of which are outside the Group’s control. Disruptions in the international financial markets and the worldwide recession that we witnessed a few years ago had both direct and indirect effects on SEK’s profitability, asset quality, and its ability to finance its operations. Such future disruptions or global recessions may reduce the Group’s ability to repay its debt.
In addition, certain economies around the world are currently in recession and some major countries are experiencing slow growth. The decline in commodity prices are also to a large extent an effect of slower growth in the world, particularly the slowdown in growth taking place in China. This, or any return to recessive conditions in any significant market that has recently emerged from recession, may ultimately impact the industrial development of commercial or industrial entities in countries around the world, which could also affect the business volumes, profitability or asset qualities of the Group. There can be no certainty that measures taken by various governments and monetary authorities will succeed in re-establishing, on a sustainable basis, the conditions necessary for economic growth. Therefore, uncertainty remains as to the future global economic outlook, and many countries’ economies could experience long periods of slow growth or recurring recessions.
Additionally, even in the absence of slow economic growth or recessions, other economic circumstances — including, but not limited to, volatility in energy prices, contractions in infrastructure spending, fluctuations in market interest or exchange-rates, and concerns over the financial health of sovereign governments and their instrumentalities — may have negative consequences for the companies and industries that the Group provides financing to (as well as the financial condition of SEK’s financial counterparties) and could, in addition to the other factors cited above, have material adverse effects on the Group’s business prospects, financial condition or ability to fulfill its debt obligations.
SEK is exposed to credit risk even in normal economic circumstances. Disruptions in the financial markets or economic recessions may further negatively affect the credit quality of borrowers and cause other to risk counterparties, which may cause credit losses or affect the value of assets.
Risks arising from the credit quality of borrowers and counterparties and the recoverability of loans and amounts due from counterparties in derivative transactions are inherent in SEK’s businesses. Consequently, SEK may incur credit losses or delinquency in debt repayments even in normal economic circumstances. Financial market disruptions or economic recessions may further affect SEK’s customers and counterparties, negatively affecting their ability to fulfill their obligations. Market and economic disruptions may affect, among other things, business and consumer spending, bankruptcy rates and asset prices, creating a greater likelihood of impact on an increased number of SEK’s customers or counterparties credit demand or that they may become delinquent in their loans or other obligations to SEK. SEK has, in the recent past, been forced to write down the value of some of its assets as a result of disruptions in the financial markets, and SEK may be forced to do so again in future periods. Such disruptions may affect the recoverability and value of SEK’s assets and may necessitate an increase in SEK’s provisions for delinquent and defaulted debt and other provisions, which could in turn have a material adverse effect on SEK’s business and/or its ability to repay its debts.
5
Table of Contents
Reduced access to international capital markets for the financing of SEK’s operations, or less favorable financing terms, may have negative impacts on SEK’s profitability and its ability to fulfill its obligations.
In order to finance its operations, SEK is dependent on the international capital markets, where it competes with other issuers to obtain financing. Although SEK has been able to successfully finance its operations to date, factors outside SEK’s control may have material adverse effects on the Group’s continued ability to obtain such financing or could cause the cost of such financing to increase. Continuing market turmoil and ongoing recessions in certain major countries have made it very difficult for many issuers to obtain financing, especially for debt instruments with longer maturities. Continued market disruptions may make such borrowing more expensive and difficult to obtain, consequently reducing the Group’s profitability and/or its ability to fulfill its obligations. In addition, in the wake of the financial disruptions from 2008 and onwards, there have been proposals of new stricter regulations under the Basel regime with regard to capital adequacy and liquidity coverage. These stricter regulations (many of which have already come into force, while others are expected to become effective in the near future) will mean that, in general, financial institutions will need to have larger own funds in relation to their risk-weighted assets as well as have better matched borrowing in relation to their obligations. Furthermore, tighter rules on which assets can be defined as liquidity reserves as well as stricter requirements on clearing of derivatives are important parts of the regulations. Compliance with such new rules may increase the costs of borrowing for all financial institutions, including SEK.
A key factor affecting the cost and availability of financing is SEK’s credit rating. Although the Group currently has favorable credit ratings from various credit rating agencies, those credit ratings depend on many factors, some of which are outside of SEK’s control. Credit rating agencies are also increasing their scrutiny of all issuers, particularly financial institutions. Significant factors in determining SEK’s credit ratings or that otherwise could affect its ability to raise financing include its ownership structure, asset quality, liquidity profile, short- and long-term financial prospects, risk exposures, capital ratios, and prudential measures, as well as government support and SEK’s public policy role. In particular, the public policy role of SEK and corresponding level of government support might receive greater scrutiny from the rating agencies in the near future, as similar institutions within the Nordic region have recently experienced dramatic changes in their government’s definition of their public policy role. Notwithstanding regular confirmation from SEK’s owner (the Swedish State) of its continued support for SEK’s current public policy role, the risk that this view could change in the future cannot be entirely disregarded. Deterioration in any one of these factors or in any combination of these factors may lead rating agencies to downgrade SEK’s credit ratings. If the Group were to experience a downgrade in its credit ratings, it would likely become necessary to offer increased interest margins in the capital markets in order to obtain financing, which would likely substantially lower the Group’s profit margins and earnings, harm its overall liquidity and negatively affect its business and its ability to fulfill its obligations.
SEK may experience negative changes in the value of its assets or liabilities and may incur other losses related to volatile and illiquid market conditions.
Market volatility, illiquid market conditions and disruptions in the credit markets have during certain periods made it difficult to value certain of SEK’s assets and liabilities. For example, SEK is exposed to changes in fair value due to changes in credit spreads on its own debt and due to changes in currency basis spread, which it has not hedged, and such changes in fair value can have a negative impact on SEK’s results as reported under IFRS, even though SEK historically has not experienced any material realized losses related to such exposures. Subsequent valuations, in light of factors then prevailing, may result in significant changes in the value of such assets or liabilities in future periods. In addition, at the time of any sale of any such assets, the prices SEK ultimately realizes will depend on the demand and liquidity in the market at that time and may be materially lower than such assets’ current fair value. Any of these factors could require SEK to negatively change the carrying amount of such assets or liabilities, which may have an adverse effect on the Group’s financial condition in future periods.
SEK’s hedging strategies may not prevent losses.
SEK uses hedging instruments in an attempt to manage interest rate, currency, credit, basis and other market-related risks. If any of the variety of instruments and strategies the Group uses to hedge its exposure to these various types of risk is not effective, the Group may incur losses, impairing its ability to timely repay or refinance its debts. In addition, there can be no assurance that the Group will continue to be able to hedge risks related to current or future assets or liabilities in accordance with its current policies in an efficient manner or at all. Disruptions such as market crises and economic recessions may put a strain on the availability and effectiveness of hedging instruments or strategies and could have an adverse effect on SEK’s financial condition and its ability to fulfill its obligations.
6
Table of Contents
Fluctuations in foreign currency exchange-rates could harm SEK’s business.
As an international lending institution, the Group is subject to some exchange-rate risk. The adequacy of the Group’s financial resources may be impacted by changes in currency exchange-rates that affect the value in Swedish currency of the Group’s foreign-currency obligations. The values of a majority of the items presented in the statement of financial position are subject to fluctuations as a result of changes in the exchange-rate between the Swedish krona and other currencies, such as the U.S. dollar/Swedish krona and the euro/Swedish krona exchange-rates. Even though the Group carefully monitors and hedges its foreign currency exposures, changes in currency exchange-rates adverse to the Group could harm SEK’s business, its profitability and its ability to repay its debts. Furthermore, SEK does not hedge its exposure towards currency exchange-rate effects related to unrealized changes in the fair value of its assets and liabilities. Also, any strengthening of the Swedish krona against other currencies may reduce demand for the products sold overseas by SEK’s Swedish clients and thus reduce demand for its loans from end-purchasers of such products, or cause such clients to experience increased difficulty in repaying their loans to SEK. Such eventualities could therefore have an adverse effect on SEK’s financial condition and its ability to fulfill its obligations. As part of its ordinary business activities, SEK has a material amount of euro-denominated assets reported in its statement of financial position as well as euro-denominated debt. Because of uncertainty surrounding the capacity of Eurozone countries’ ability to handle the financial problems many of these countries are currently experiencing, the euro may fluctuate against the Swedish krona or any other currency in which SEK has assets or liabilities. SEK might therefore be harmed by such fluctuations in exchange-rates. Recent developments in Russia have had a negative impact on SEK’s customers, while recent developments in Greece have only had indirect effects through their impact on financial markets.
Increasing competition may adversely affect SEK’s income and business.
Competition in the Group’s business is based on service, product innovation, product features, price, commission structures, financial strength and name recognition. The Group competes with a large number of other credit institutions, including domestic and foreign banks, as well as with the direct or indirect financing programs of exporters themselves. Some of these institutions offer a broader array of products or have more competitive pricing or greater financial resources with which to compete than does SEK. Increasing competition may have significant negative effects on the Group’s financial performance if the Group is unable to match the products and services of its competitors or has to lower its prices or rates in order to compete for customer business, investments or financing. Such changes could have material adverse effects on SEK’s business and its ability to repay its debts.
SEK is exposed to significant operational risk.
Broadly, operational risk can arise from fraud, errors by employees, failure to document transactions properly or to obtain proper internal authorizations, equipment failures, natural disasters, and information security failures or the failure of external systems such as, for example, those of SEK’s suppliers or counterparties. SEK’s businesses are dependent on the ability to process complex transactions efficiently and accurately. Failure to address operational risk may lead to additional costs, losses or damages to SEK’s reputation which may negatively affect customers’ and investors’ confidence, and thus SEK’s business, financial performance and/or ability to repay its debt. If, for example, SEK failed to properly comply with its obligations under financial guarantee contracts or other credit risk reducing arrangements or if the contracts were not properly drafted, this could result in SEK not being able to effectively seek recourse to such guarantees or other arrangements in the event the relevant borrower was unable to repay its debt to SEK.
There is also a risk that SEK’s reputation will be damaged if SEK fails to comply with current legislation and best practices or in any other way fails to meet its commitments, including those that are not explicit. Although operational risks can be reduced by properly documented processes, adequate systems, a culture of sensitivity to risk, compliance with regulations, effective corporate governance and other factors supporting internal control, such procedures may not be effective in controlling each single operational risk SEK faces. A significant failure in managing our operational risk could materially and adversely affect SEK’s business, financial condition, results of operation and/or ability to repay its debt.
7
Table of Contents
Changes in law or regulation may adversely affect SEK’s business
SEK’s business is subject to regulation and regulatory oversight. Any significant regulatory development could affect the manner in which SEK conducts its business and SEK’s results of operations.
SEK is subject to financial services laws, regulations, administrative actions and policies in each location in which SEK operates. Financial regulators around the world have responded to the recent crisis by proposing significant changes to the regulatory regime applicable to financial service companies such as SEK’s. Changes to the current system of supervision and regulation, or any failure to comply with applicable rules (and particularly those in Sweden) could materially and adversely affect SEK’s business, financial condition or results of operation and/or ability to repay its debt.
In December 2010, the Basel Committee on Banking Supervision presented an extensive new package of rules known as Basel III, intended to supersede the previous Basel II standard. As of January 1, 2014, new rules according to Basel III came into force within the European Union by means of the Capital Requirements Regulation (CRR) and the Capital Requirements Directive (CRD IV). The CRR is directly applicable legislation in the European Union. The rules of the CRD IV must be transposed into national law, and the new Swedish laws Credit Institutions and Securities Companies (Special Supervision) Act (2014:968) and the capital Buffers Act (2014:966) were enacted and came into effect as of August 2, 2014. In some cases the new rules are subject to transitional arrangements, while in other cases binding rules are still not finalized. The areas in which rules have yet to be finalized include, but are not limited to (i) the minimum requirements on leverage, particularly the minimum leverage ratio of 3.0 percent which is intended to apply from 2018 and which may be increased following the evaluation period and (ii) minimum requirements on net stable funding, for which the final rules are yet to be finalized, and which are expected to apply from 2018 as well. As for regulations regarding deduction from own funds related to prudent valuation, the final regulatory technical standard has been approved for adoption on February 17, 2016, and could therefore significantly affect the reduction needed to be made from own funds with regard to prudent valuation of financial instruments, even though SEK already in 2015 has applied the standard in accordance with the final draft of the regulatory technical standard. On numerous topics the regulations will be further specified by means of binding technical standards or amended according to stated intentions. The implications of such changes are, as yet, not fully known. Furthermore, the new regulations have introduced a higher level of discretion for national supervisory authorities to impose further capital requirements and such decisions may adversely affect SEK. Finally, the Basel Committee on Banking Supervision continuously releases amendments or revisions to the Basel III standard. Such initiatives, following implementation within the European Union, may also adversely affect SEK.
In addition, the European Market Infrastructure Regulation (EMIR) regarding OTC-derivates, central counterparties and trade repositories, came into effect on August 16, 2012. EMIR will impose, in some cases, mandatory central clearing of derivatives. The future clearing obligations according to EMIR will also gradually widen, and the regulation will be further supplemented by means of binding technical standards. During 2016, additional part of the regulation will come into effect related to central clearing of certain OTC-derivatives. SEK are defined as an institution in category 2 in this context, and in November 2015 it was decided that institutions in category 2 will be obliged to clear certain OTC-derivatives from December 2016 for such transactions that was entered into from May 2016. This new regulation may affect SEK’s business by increasing costs and putting restraints on the way SEK can conduct its business with regard to derivatives, if those derivatives are not cleared through a central clearing house. EMIR may thus have a negative impact on cash flows, posting of collaterals, counterparty exposure and financial reporting.
Furthermore, from March 2017, it will be compulsory for SEK to post variation margin on non-cleared derivatives. This may result in significantly higher amount of negative cash flows than under the present regulatory environment.
The Bank Recovery and Resolution Directive (BRRD) entered into force in the European Economic Area as of January 1, 2015. The BRRD has been fully implemented in Swedish law through the Swedish Resolution Act 2016 (2015:1016) as of February 1, 2016. During 2015 part of BRRD was implemented through regulation by Finansinspektionen (the Swedish FSA) which required the establishment of a contingency borrowing plan by SEK. As from 2016 all the requirements in accordance with BRRD have been implemented through legislation in Sweden. Pursuant to BRRD, SEK is subject to minimum requirement for own funds and eligible liabilities, which is a parallel requirement to CRR. The minimum requirement is to be determined individually for each institution by the national resolution authority, which in Sweden is Riksgäldskontoret (the Swedish National Debt Office). SEK has not yet been informed by Swedish National Debt Office which minimum requirement that is applicable to SEK, however it is not probable that the requirements will have an significant impact on minimum requirements on SEK’s capitalization.
The introduction of a debt write-down tool in accordance with BRRD may lead to debt instruments that could be written down or converted into share capital possibly being priced differently and the risk of a write-down being priced in, even though the principle under the regulation is that investors should not be worse off than under an ordinary bankruptcy process. Resolution action should be taken only where necessary in the public interest and any interference with rights of shareholders and creditors which results from resolution action should be compatible with the Charter of Fundamental Rights of the European Union (the Charter). In particular, where creditors within the same class are treated differently in the context of resolution action, such distinctions should be justified in the public interest and proportionate to the risks being addressed and should be neither directly nor indirectly discriminatory on the grounds of nationality. The effect of the introduction of this debt write-down tool on total capital and financing costs, as well as other possible effects, is however, still difficult to assess.
8
Table of Contents
For risk classification and quantification of credit risk, SEK uses an internal ratings-based (IRB) approach, the IRB Foundation Approach. The Swedish FSA has previously, however, granted the company certain exemptions from the IRB approach. For exposures covered by the exemptions the standardized approach is applied rather than the IRB approach. SEK has permanent exemptions for exposures to Swedish central and regional governments, as well as permanent exemptions for some non-material exposures. For exposures to central and regional governments outside Sweden and to multilateral development banks, SEK has an exemption until December 31, 2015. During 2015 the Swedish FSA has revised it views and will not prolong such exemptions. Therefore, SEK has asked the Swedish FSA for permission to apply an IRB approach for those exposures exempted until December 31, 2015 and until such permission has been granted to prolong the time-limited exemptions. Pillar 1 capital requirements for the exposures covered by the application could increase significantly when an IRB approach is applied.
On May 22, 2015, European Banking Authority (EBA) issued guidelines on the management of interest rate risk arising from non-trading activities, or interest risk in the banking book (IRRBB), which came into force on January 1, 2016. The guidelines require a significant higher degree of sophistication with regard to measuring of interest rate risk then previously that may result in increase in capital requirements related to market risk.
Other pending regulations that could also have a negative impact on SEK include IFRS 9, which will replace IAS 39 with regard to accounting rules for financial instruments. The implementation of IFRS 9 may lead to higher costs for SEK.
Risk related to financial reporting and other deficiencies in internal control over financial reporting and disclosure processes could result in errors, affect operating results and cause investors to lose confidence in our reported results.
SEK’s external reporting of financial and non-financial data is reliant on the Group’s internal control over financial reporting including the integrity of systems and people. Failure to report data accurately and in compliance with external standards could result in regulatory action, legal liability and damage to the Group´s reputation. For additional information on SEK’s internal control over financial reporting see Item 15.
Developments in emerging market countries may adversely affect the Group’s business.
The Group operates in a number of emerging markets and its exposure to such markets has increased in recent years, as the number and importance of investment and trade links between Sweden and emerging markets has increased. Economic and political developments in emerging markets, including economic crises or political instability, may have material adverse effects on the Group’s business prospects, results of operations and/or ability to repay its debt.
9
Table of Contents
Negative interest rates may have an impact on SEK’s profitability.
Negative interest rates may result in lower net interest income and might negatively affect the value of assets and liabilities. For example, negative interest rates may render hedges less effective if interest rate is to be paid on the hedge while there is no compensation on the hedged item. Furthermore, increased prepayments on loans and lower spread between rates on assets and liabilities might also have a negative impact on net interest income. Finally, negative interest rates leads to valuation risk due to potential changes in market practice for how to incorporate negative interest rates in the valuation.
Natural disasters, social and political unrest and other factors beyond SEK’s control may disrupt financial markets and economic conditions in markets that SEK relies on.
In order to finance its operations, SEK is dependent on the international capital markets, where it competes with other issuers to obtain financing. Although this has not been the case to date, natural disasters, such as the 2011 earthquake and tsunami in Japan, and/or social and political unrest, such as that seen in a number of Eurozone countries in recent years as well as in Ukraine and Russia recently, may have material adverse effects on the Group’s continued ability to obtain such financing or could cause the cost of such financing to increase.
10
Table of Contents
ITEM 4. INFORMATION ON THE GROUP AND THE PARENT COMPANY
A History and Development
Aktiebolaget Svensk Exportkredit (Swedish Export Credit Corporation) is a “public company” under the Swedish Companies Act (2005:551). It is wholly owned by the Swedish State through the Ministry of Enterprise and Innovation (“Sweden” or the “State”).
The Parent Company was founded in 1962 in order to strengthen the competitiveness of the Swedish export industry by meeting a need for long-term lending for both exporters and their foreign customers. SEK’s objective is to engage in financing activities in accordance with the Swedish Banking and Financing Business Act and, in connection therewith, to promote the development of Swedish commerce and industry as well as otherwise engaging in Swedish and international financing activities on commercial terms. The duration of the Parent Company is indefinite.
The address of the Parent Company’s principal executive office is AB Svensk Exportkredit (Swedish Export Credit Corporation), Klarabergsviadukten 61-63, Stockholm, Sweden; and the Parent Company’s telephone number is +46-8-613-83 00. The Parent Company’s authorized representative in the United States is Business Sweden; Business Sweden’s contact information is as follows:
Business Sweden New York
The News Building,
220 E 42nd Street
Suite 409A,
New York, NY 10017
Tel. No.: (212) 507-9001
usa@business-sweden.se
B Business Overview
SEK provides financial solutions for the Swedish export industry with the aim of promoting the development and international competitiveness of Swedish industry and trade. Its business activities are focused on lending to Swedish exporters and their customers through corporate lending, export lending, structured financing, project financing, trade financing and leasing. SEK offers its financial solutions to corporations and financial institutions as well as domestic and international investors. SEK extends loans on commercial terms at prevailing fixed or floating market interest rates in “SEK exclusive of the S-system”, as well as loans on State-supported terms at fixed interest rates that may be lower than prevailing fixed market rates in the “State Support System” (the “S-system”). The S-system is administered on behalf of the State by SEK in return for compensation.
SEK’s mission has developed over the years since SEK began its operations in 1962. From its roots in export loans, SEK’s product range over time has expanded. However, SEK is still a niche operator in the financial market. SEK works mainly with lending and as a result SEK acts as a complement to banks which are active in Sweden. SEK’s unique position means that SEK works cooperatively with banks and other financial institutions. Over the years, SEK has been active in the creation of new financial solutions. SEK’s niche specialization in long-term export-related financing, combined with its financial capacity and flexible organization, are key factors in the management of its operations. SEK’s borrowing activities in the international capital markets have given SEK expertise in financial instruments.
SEK believes that its relationships with domestic, Nordic and other international investors and partners strengthen its ability to develop financial solutions which meet its customers’ requirements. This network of relationships enables SEK to participate in co-financing arrangements.
In 2015, SEK’s new lending to Swedish exporters and their customers amounted to Skr 104.6 billion (2014: Skr 57.1 billion), of which end-customer finance amounted to Skr 85.3 billion (2014: Skr 33.9 billion) and the volume of corporate lending was Skr 19.3 billion (2014: Skr 23.2 billion).
11
Table of Contents
The main reason behind the extraordinarily high volume of new lending was our signing of the financing agreement, in the third quarter, for Brazil’s purchase of the Gripen fighter aircraft from Saab. This is SEK’s largest ever lending transaction and comprises a loan from SEK corresponding to a total of Skr 41.9 billion.
In summer 2015, demand from Swedish exporters for SEK’s lending increased and continued in the same vein for the entire second half of 2015. SEK’s assessment is that the underlying reason is a combination of rising concern in capital markets around the world and a general increase in Swedish exporters’ activity due to improved economic conditions, particularly in Europe. During 2015, SEK has not only received numerous inquiries, primarily concerning export credits, but also closed many business deals. Another explanation for the increase in new lending is that SEK now reaches more Swedish companies than ever before. Since the start of 2015, SEK’s services have become available to medium-sized exporters, and SEK have dedicated separate resources to assist this group. Several companies have discovered the added value of having another source of financing as a complement to their bank or banks.
We are continuing the development of our initiatives in sustainable financing. In 2015, we issued our first green bond for a total of USD 500 million. Our new lending to green projects totalled Skr 988 million in 2015. The underlying projects of the total green portfolio help to reduce carbon dioxide emissions in the world and reflect the Swedish environmental expertise. During the year, we approved loans to five large international projects with characterized by potentially high sustainability risks. These were all subject to our in-depth examination and assessed as meeting OECD guidelines for social and environmental issues. We updated our Sustainable Business Policy to include the Equator Principles as a reference for examining and financing projects. We initiated a project to develop our responsibility for human rights in conjunction with export credits. To improve capital efficiency and because of extremely low margins on liquidity investments, we reduced the size of the liquidity portfolio during the year. However, we continue to have healthy new lending capacity, sufficient to be able to secure long-term financing for Swedish exporters.
During 2015, SEK had a credit facility with the Swedish National Debt Office of Skr 80 billion, in order to further enhance the ability to promote the Swedish export industry. SEK has not yet utilized the credit facility. In December 2015, the Swedish parliament decided that the credit facility for 2016 should amount to Skr 125 billion. The credit facility is only available for loans covered by the State’s export credit support (CIRR).
The Board of Directors has resolved to propose at the Annual General Meeting that a total dividend of Skr 356 million (2014: Skr 378 million) be paid in accordance with company’s dividend policy.
SEK has not made any material capital expenditure, nor engaged in any other material divestitures or acquisitions (including interests in other companies) during the three financial years preceding the date of this report.
Competition
SEK is the only institution authorized by the Swedish State to grant export financing loans under the S-system. With support from the State, SEK helps Swedish export companies compete with other export companies within OECD member countries which have similar support from their respective domestic export credit agencies, which also provide government-supported export credits. SEK’s lending exclusive of the S-system, faces competition from other Swedish and foreign financial institutions, as well as from direct and indirect financing programs of exporters themselves.
The following table summarizes SEK’s loans outstanding, including the S-system and debt outstanding as of December 31, 2015 and 2014:
| | At December 31, | |
Skr mn | | 2015 | | 2014 | |
Total loans outstanding(A) | | 205,097 | | 218,222 | |
Total debt outstanding (B) | | 235,644 | | 284,137 | |
12
Table of Contents
(A) Loans outstanding consist of loans due from commercial and financial institutions including loans in the form of interest bearing securities. For a reconciliation of loans outstanding, see Note 11 to the Consolidated Financial Statements.
(B) Includes subordinated debt of Skr 2,088 million and Skr 1,945 million as of December 31, 2015 and 2014, respectively.
Lending Operations — General
The following table sets forth certain data regarding the Group’s lending operations, including the S-system, during the two-year period ending December 31, 2015:
| | Year ended December 31, | |
Skr mn | | 2015 | | 2014 | |
Offers of long-term loans accepted | | 104,583 | | 57,118 | |
Total loan disbursements | | -56,404 | | -57,495 | |
Total loan repayments | | 70,777 | | 65,171 | |
Total net increase/ (decrease) in loans outstanding | | -13,125 | | 16,745 | |
Loans outstanding | | 205,097 | | 218,222 | |
Loan commitments outstanding but undisbursed | | 63,438 | | 16,028 | |
(A) If a loan has been accepted by the borrower it can be disbursed immediately. However, disbursement may be delayed due to a number of factors. In some cases, an accepted loan may never be disbursed, including as a result of changes in the commercial and financial institutions’ need for the funds. Currency exchange-rate effects also affect the amount of loan commitments that will result in loans outstanding. Therefore, the volume of loans accepted does not equal the volume of loan disbursements as presented in the Statement of Cash Flows in the Consolidated Financial Statements for a single financial year. Loans accepted but not yet disbursed are presented under the heading “Commitments” as “Committed undisbursed loans”.
Total loans outstanding by type of loan:
Skr mn | | 2015 | | 2014 | | 2013 | | 2012 | | 2011 | |
End-customer finance | | 118,284 | | 128,165 | | 155,137 | | 103,973 | | 101,142 | |
Corporate lending | | 86,813 | | 90,057 | | 46,340 | | 88,934 | | 94,458 | |
Total | | 205,097 | | 218,222 | | 201,477 | | 192,907 | | 195,600 | |
Most of the loans granted by SEK are granted to purchasers of Swedish exports. Measured by revenues, the largest markets for the export of goods from Sweden are in Western Europe. However, exports to other markets, including less developed markets, are also important. Accordingly, the need for export financing may be related to transactions involving buyers in many different countries, with varying levels of creditworthiness. Pursuant to its credit risk exposure policy, SEK is selective in accepting such risk exposure. This policy seeks to ensure that SEK is neither dependent on the creditworthiness of individual buyers of Swedish goods and services, nor on the countries in which they are domiciled, but rather on the creditworthiness of individual counterparties to which SEK accepts credit risk exposure. For additional information on SEK’s approach to risk, see Note 26 and Note 29 to the Consolidated Financial Statements.
SEK relies to a large extent on guarantees in its lending. The guarantors are principally made up of government export credit agencies, such as the Swedish Exports Credit Guarantee Board (EKN), the Export Import Bank of the United States (USEXIM), the Exports Credits Guarantee Department of the United Kingdom (ECGD), Compagnie Financière pour la Commerce Exterieure (Coface) of France and Euler Hermes Kreditversicherungs AG of Germany, as well as financial institutions and, to a lesser extent, non-financial corporations. Credit risk is allocated to a guarantor in accordance with SEK’s policy and therefore, when disclosing net credit risk exposures, the majority of SEK’s guaranteed credit exposure is shown as exposure to sovereign counterparties. At year-end 2015, government export credit agencies guaranteed a total of Skr 160,0 billion (year-end 2014: Skr 173.5 billion), or 49.0 percent (year-end 2014: 46.9 percent) of SEK’s total credit exposures. Skr 106.2 billion (year-end 2014: Skr 118.8 billion) covered corporate exposures, Skr 1.9 billion (year-end 2014: Skr 2.6 billion) covered exposures to financial institutions, Skr 0.6 billion (year-end 2014: Skr 0.6 billion) covered exposures to regional governments and Skr 51.3 billion (year-end 2014: Skr 51.5 billion) covered sovereign exposures.
13
Table of Contents
The following tables show SEK’s gross and net credit exposures, respectively, to counterparties by geography and type of counterparty (taking into account applicable guarantees but not collateral) as of December 31, 2015 and 2014.
Gross exposure by region and exposure class, as of December 31, 2015
Skr billion | | Middle
East/Africa | | Asia excl.
Japan | | Japan | | North
America | | Oceania | | Latin
America | | Sweden | | West
European
countries
excl. Sweden | | Central- East
European
countries | | Total | |
Central governments | | 2.2 | | 9.9 | | — | | 1.3 | | — | | 42.8 | | 1.2 | | 2.2 | | — | | 59.6 | |
Regional governments | | 0.6 | | — | | — | | — | | — | | — | | 5.6 | | 1.1 | | 0.0 | | 7.3 | |
Multilateral development banks | | — | | — | | — | | — | | — | | — | | — | | 0.0 | | — | | 0.0 | |
Financial institutions | | 2.5 | | 4.7 | | 0.0 | | 4.7 | | 2.2 | | 2.1 | | 13.4 | | 17.6 | | 0.4 | | 47.6 | |
Corporates | | 20.1 | | 19.9 | | 3.8 | | 26.6 | | 0.3 | | 12.5 | | 67.7 | | 48.7 | | 11.3 | | 210.9 | |
Securitization positions | | — | | — | | — | | — | | — | | — | | — | | 0.8 | | — | | 0.8 | |
Total | | 25.4 | | 34.5 | | 3.8 | | 32.6 | | 2.5 | | 57.4 | | 87.9 | | 70.4 | | 11.7 | | 326.2 | |
Gross exposure by region and exposure class, as of December 31, 2014
Skr billion | | Middle
East/Africa | | Asia excl.
Japan | | Japan | | North
America | | Oceania | | Latin
America | | Sweden | | West
European
countries
excl. Sweden | | Central- East
European
countries | | Total | |
Central governments | | 2.2 | | 8.4 | | — | | 0.4 | | — | | 43.0 | | 7.9 | | 4.8 | | 0.0 | | 66.7 | |
Regional governments | | 0.7 | | — | | — | | — | | — | | — | | 11.8 | | 0.5 | | — | | 13.0 | |
Multilateral development banks | | — | | — | | — | | — | | — | | — | | — | | 0.3 | | — | | 0.3 | |
Financial institutions | | 1.5 | | 3.6 | | 0.2 | | 12.5 | | 4.0 | | 2.0 | | 14.2 | | 23.5 | | 0.4 | | 61.9 | |
Corporates | | 17.6 | | 22.5 | | 14.0 | | 27.0 | | 0.5 | | 12.1 | | 70.2 | | 45.2 | | 12.9 | | 222.0 | |
Securitization positions | | — | | — | | — | | 1.1 | | 1.2 | | — | | — | | 4.1 | | — | | 6.4 | |
Total | | 22.0 | | 34.5 | | 14.2 | | 41.0 | | 5.7 | | 57.1 | | 104.1 | | 78.4 | | 13.3 | | 370.3 | |
Item 4B Net exposure
Net exposure by region and exposure class, as of December 31, 2015
Skr billion | | Middle
East/Africa | | Asia excl.
Japan | | Japan | | North
America | | Oceania | | Latin
America | | Sweden | | West
European
countries
excl. Sweden | | Central- East
European
countries | | Total | |
Central governments | | — | | 4.9 | | — | | 5.9 | | — | | 0.8 | | 137.6 | | 20.3 | | 3.1 | | 172.6 | |
Regional governments | | — | | — | | — | | — | | — | | — | | 12.7 | | 1.3 | | — | | 14.0 | |
Multilateral development banks | | — | | — | | — | | — | | — | | — | | — | | 0.0 | | — | | 0.0 | |
Financial institutions | | 2.5 | | 4.6 | | 0.5 | | 3.9 | | 2.2 | | 2.1 | | 8.6 | | 27.2 | | 0.4 | | 52.0 | |
Corporates | | 1.1 | | 1.4 | | 0.5 | | 5.5 | | — | | 1.8 | | 60.0 | | 16.3 | | 0.2 | | 86.8 | |
Securitization positions | | — | | — | | — | | — | | — | | — | | — | | 0.8 | | — | | 0.8 | |
Total | | 3.6 | | 10.9 | | 1 | | 15.3 | | 2.2 | | 4.7 | | 218.9 | | 65.9 | | 3.7 | | 326.2 | |
Net exposure by region and exposure class, as of December 31, 2014
Skr billion | | Middle
East/Africa | | Asia excl.
Japan | | Japan | | North
America | | Oceania | | Latin
America | | Sweden | | West
European
countries
excl. Sweden | | Central- East
European
countries | | Total | |
Central governments | | — | | 3.5 | | — | | 4.4 | | — | | 0.8 | | 155.7 | | 23.9 | | 2.6 | | 190.9 | |
Regional governments | | — | | — | | — | | — | | — | | — | | 18.5 | | 2.4 | | — | | 20.9 | |
Multilateral development banks | | — | | — | | — | | — | | — | | — | | — | | 0.3 | | — | | 0.3 | |
Financial institutions | | 1.4 | | 3.3 | | 0.3 | | 11.5 | | 4.0 | | 1.9 | | 9.1 | | 35.6 | | 0.4 | | 67.5 | |
Corporates | | 0.7 | | 0.9 | | 2.3 | | 5.6 | | 0.1 | | 1.0 | | 58.9 | | 14.4 | | 0.5 | | 84.4 | |
Securitization positions | | — | | — | | — | | 1 | | 1.2 | | — | | — | | 4.1 | | — | | 6.3 | |
Total | | 2.1 | | 7.7 | | 2.6 | | 22.5 | | 5.3 | | 3.7 | | 242.2 | | 80.7 | | 3.5 | | 370.3 | |
SEK has no exposure to subprime, Alt-A, negative amortizing or other loans that it would characterize as high-risk lending, including loans which have been modified or would otherwise qualify as distressed debt, other than the limited amount of such assets disclosed in Note 9 to the Consolidated Financial Statements.
14
Table of Contents
Provisions for incurred impairment losses are made if and when SEK determines that it is probable that the obligor under a loan, or another financial asset held, and any existing guarantee or collateral, will fail to cover SEK’s full claim. Such determinations are made for each individual loan or asset. Objective evidence consists of significant financial difficulties affecting the issuer or debtor, outstanding or delayed payments or other observable factors, which suggest a measurable decrease in expected future cash flows. If there is objective evidence that an impairment loss on loans or other financial assets has been incurred, the amount of the loss is measured as the difference between the asset’s carrying amount and the present value of estimated future cash flows discounted at the financial asset’s original effective interest rate. The amount of the loss is recognized in profit or loss.
After such individual determinations have been made and if there is no objective evidence for impairment of an individually assessed financial asset, regardless of whether the asset is individually material or not, SEK includes the asset in a group of financial assets with similar credit risk characteristics and determines collectively any need for impairment of such assets. The need for impairment is related to loan losses which have been incurred as of the balance sheet date but have not yet been identified as individual loan losses. The reserve related to such impairment not linked to a specific counterparty is based on internal assessments of the credit quality of SEK’s assets, as manifested in, among other things, the credit ratings of counterparties, as determined either externally by a credit rating agency or internally in accordance with SEK’s own model for credit rating. If there is objective evidence for a general downward trend with regard to such rating this could constitute evidence for a need for an additional provision.
The following tables show SEK’s net credit losses and changes in reserves of financial assets, respectively, for the periods indicated.
Net credit losses
| | For the Year Ended December 31, | |
Skr mn | | 2015 | | 2014 | | 2013 | | 2012 | | 2011 | |
Credit losses | | -33 | | -30 | | -68 | | -72 | | -125 | |
Reversal of previous write-downs | | 279 | | 378 | | 22 | | 37 | | 14 | |
Net impairments and reversals | | 246 | | 348 | | -46 | | -35 | | -111 | |
Established losses | | -211 | | -277 | | -3 | | -2 | | -4 | |
Recovered credit losses | | 1 | | 2 | | 10 | | 14 | | 4 | |
Net credit losses | | 36 | | 73 | | -39 | | -23 | | -111 | |
of which related to loans(1) | | 35 | | 11 | | -32 | | -48 | | -78 | |
related to liquidity placements(1) | | 1 | | 62 | | -7 | | 25 | | -33 | |
(1)For the definition of loans and liquidity investments, see Note 11 to the Consolidated Financial Statements.
Changes in reserves of financial assets
| | For the Year Ended December 31, | |
Skr mn | | 2015 | | 2014 | | 2013 | | 2012 | | 2011 | |
Opening balance | | -464 | | -757 | | -711 | | -676 | | -565 | |
Reserves used to cover write-offs (charge-offs) | | -9 | | -5 | | — | | — | | — | |
Net impairments and reversals | | 246 | | 348 | | -46 | | -35 | | -111 | |
Currency effects | | -9 | | -50 | | 0 | | — | | — | |
Closing balance | | -236 | | -464 | | -757 | | -711 | | -676 | |
of which related to loans(1) | | -228 | | -236 | | -260 | | -221 | | -161 | |
of related to liquidity placements(1) | | -8 | | -228 | | -497 | | -490 | | -515 | |
(1) For the definition of loans and liquidity investments, see Note 11 to the Consolidated Financial Statements.
15
Table of Contents
SEK exclusive of the S-system
Outside of the S-system, (or in “SEK exclusive of the S-system,” as we refer to the business of SEK other than the S-system), SEK reports loans in the following categories:
Loan Types and Underwriting Policies
(a) Lending to Swedish exporters (corporate lending)
(b) Lending to international buyers of Swedish capital goods and services (end-customer finance)
· export credits;
· loans for the funding of export lease agreements;
· trade finance;
· project finance
SEK’s credit underwriting policies and requirements are similar regardless of loan type. The majority of our loans are guaranteed by export credit agencies or banks, or by credit default swaps issued by banks or other financial institutions.
SEK’s initial loan offer and subsequent commitment set forth the maximum principal amount of the loan, the currency in which the loan will be denominated, and the repayment and disbursement schedule.
Loans outstanding (exclusive of those under the S-system) as of the dates indicated were distributed among SEK’s various categories of loans as follows:
Loans outstanding (exclusive of the S-system) by type of loans:
| | As of December 31, | |
Skr mn | | 2015 | | 2014 | | 2013 | | 2012 | | 2011 | |
End-customer finance | | 74,207 | | 79,867 | | 111,890 | | 64,474 | | 66,915 | |
Corporate lending | | 86,813 | | 90,057 | | 46,340 | | 88,934 | | 94,458 | |
Total | | 161,020 | | 169,924 | | 158,230 | | 153,408 | | 161,373 | |
Interest Rates
Outside the S-system, export financing is extended at prevailing market rates of interest. The Group normally makes loan offers at a quoted interest rate that is subject to change prior to acceptance of the loan offer (a non-binding offer). When a borrower accepts a non-binding loan offer, the interest rate is normally set at the then-prevailing market rate (which might have changed since the loan commitment was made), and a binding loan commitment arises. Binding offers can also be provided and are offers with a higher degree of commitment to the customer with regard to disbursement of the loan than non-binding offers, regardless of whether the interest rate is fixed or not.
16
Table of Contents
Guarantees and Credit Default Swaps
If a guarantee or credit default swap is entered into for risk-mitigating purposes, the instrument protects a pre-defined amount of SEK’s exposure with respect to the principal amount of the underlying loan (and in some cases interest) as long as the issuer of the guarantee or credit default swap is financially sound. The amount so protected is ordinarily 75%-100% of the principal amount. Most of the counterparties against whom SEK accepts net exposures are rated by one or more of the internationally recognized rating agencies. For export loans, where the ultimate borrower may have relatively low creditworthiness, guarantees from export credit agencies (“ECAs”) and banks are normally used.
Loan Maturities
SEK was founded in 1962 in order to strengthen the competitiveness of the Swedish export industry by meeting a perceived need for long-term loans for both exporters and their foreign customers. SEK’s historical role and competitive advantage (and one that continues today) has therefore been in the provision of long-term financing in order to promote the Swedish export industry. Since many of the projects the export industry engages in are long-term projects, both with regard to disbursement periods and repayment periods, SEK’s loans often have longer terms than those of normal commercial loan products offered by commercial banks. However, SEK also meets its customers’ needs by providing short-term financing when required. SEK’s loan maturities therefore range from very short-term loans (with terms of three to six months) through loans for as long as 20 or 30 years.
Offers granted by the Group for loans that borrowers accepted (exclusive of those under the S-system) were distributed among SEK’s various categories of loans as follows as of December 31, 2015 and December 31, 2014.
Offers accepted, type of loan
Skr billion | | 2015 | | 2014 | |
End-customer finance | | 34.5 | | 28.2 | |
Corporate lending | | 19.3 | | 23.2 | |
Total | | 53.8 | | 51.4 | |
Of the total volume of offers accepted during 2015, Skr 3.4 billion (2014: Skr 2.8 billion) had not been disbursed at the end of the respective reporting period. If a loan has been accepted by the borrower it can be disbursed immediately. However, disbursement may be delayed due to a number of factors. In some cases, an accepted loan may never be disbursed, including as a result of changes in the customer’s need for the funds. Currency exchange-rate effects also affect the amount of loan commitments that will result in loans outstanding.
Currency
SEK extends loans in different currencies, depending on the needs of its borrowers. Before the Group makes any loan commitment, it ensures that the currency in which the loan is to be funded is expected to be available for the entire loan period at an interest rate (taking into account the costs of foreign exchange derivatives) that, as of the day the commitment is made, results in a margin that the Group deems sufficient. The Group borrows, on an aggregate basis, at maturities corresponding to or exceeding those of prospective loans. The Group may accordingly decide not to hedge particular loan commitments for movements in interest rate risk until sometime after they are made. Interest rate risks associated with such unhedged commitments are monitored closely and may not exceed interest rate risk limits established by the Parent Company’s Board of Directors. SEK’s policies are described in Note 29 to the Consolidated Financial Statements.
17
Table of Contents
The following table shows the currency breakdown of loan offers accepted for loans with maturities exceeding one year for each year in the two-year period ending December 31, 2015.
| | Percentage of loan offers accepted | |
Currency in which loan is denominated | | 2015 | | 2014 | |
Swedish kronor | | 34 | % | 22 | % |
Euros | | 14 | % | 20 | % |
U.S. dollars | | 47 | % | 51 | % |
Other | | 5 | % | 7 | % |
Total | | 100 | % | 100 | % |
S-system
The S-system was established by the Swedish State on July 1, 1978, as a State-sponsored export-financing program designed to maintain the competitive position of Swedish exporters of durable goods and services in world markets. With respect to the financing of services, this could relate, for example, to services provided by the exporter to a customer in connection with the export of goods.
After a trial period, in April 1984 the Swedish Parliament extended the S-system indefinitely. The S-system today comprises the normal export-financing program at CIRR (Commercial Interest Reference Rate) rates and a concessionary loan program (with a foreign aid element), as more fully described below. Pursuant to arrangements established in 1978 and amended from time to time thereafter, the Group administers the S-system on behalf of the State in return for compensation based mainly on outstanding loan volumes.
SEK’s net compensation for administrating the S-system is recognized as part of interest revenues in the statement of comprehensive income. Pursuant to a resolution adopted by the sole shareholder at the Annual General Meeting in April 2012, the difference between interest revenues and net commission revenues related to lending and liquid assets under the S-system, on the one hand, and interest expenses related to borrowing, all other financing costs and any net foreign exchange losses incurred by SEK under the S-system, on the other hand, are reimbursed by (or paid to) the Swedish State.
SEK treats the S-system as a separate operation for accounting purposes. Although the deficits (or surpluses) of programs under the S-system are reimbursed by (or paid to) the State, any loan losses that may be incurred under such programs are not reimbursed by the State. Accordingly, SEK has to obtain appropriate credit support for these loans as well. All of the lending under the S-system is reported on SEK’s statement of financial position. SEK has consequently presented the operations of the S-system in the statement of comprehensive income as the amount of net commission received, accounted for as interest income rather than presenting the gross amounts collected and paid in accordance with the agreement with the Swedish State. In general, loans under the program are made with State guarantees administered by the EKN. All such loans granted by SEK must also undergo SEK’s customary approval process.
The following table sets forth the volumes of offers accepted, undisbursed loans at year end, new loans disbursed and loans outstanding at year-end under the various programs in the S-system for each year in the two-year period ended December 31, 2015.
The volume of offers accepted in the S-system increased significantly during 2015 as compared to 2014. This is mainly related to one large transaction executed during 2015. Of the total amount of outstanding loans, loans in the S-system amounted to Skr 44.1 billion (year-end 2014: Skr 48.3 billion), representing a decrease of 9 percent from year-end 2014. The decrease of credits in the S-system is partly due to currency exchange-rate effects because of the strengthening of the USD against the Swedish krona during 2015.
18
Table of Contents
| | Concessionary Loan Program | | CIRR-loans | | Total | |
Skr mn | | 2015 | | 2014 | | 2015 | | 2014 | | 2015 | | 2014 | |
Offers accepted | | — | | — | | 50,825 | | 5,668 | | 50,825 | | 5,668 | |
Not disbursed loans at year-end | | 40 | | 47 | | 54,598 | | 7,482 | | 54,638 | | 7,529 | |
New loans disbursed | | 16 | | 10 | | 6,027 | | 7,610 | | 6,043 | | 7,620 | |
Loans outstanding at year-end | | 949 | | 921 | | 43,128 | | 47,377 | | 44,077 | | 48,298 | |
The following table sets forth the volume of loans outstanding in the S-system by type of loan as of December 31 in each of the years indicated.
Loans outstanding in the S-system by type of loans
Skr mn | | 2015 | | 2014 | | 2013 | | 2012 | | 2011 | |
End-customer finance | | 44,077 | | 48,298 | | 43,247 | | 39,499 | | 34,227 | |
Corporate lending | | — | | — | | — | | — | | — | |
Total | | 44,077 | | 48,298 | | 43,247 | | 39,499 | | 34,227 | |
Loan Types and Underwriting Policies
Within the S-system, SEK extends loans only for the medium- and long-term financing of durable goods exports. S-system lending includes financing in cooperation with intergovernmental organizations and foreign ECAs. SEK’s credit underwriting policies and requirements for S-system loans are similar regardless of loan type. The majority of these loans are also guaranteed by export credit agencies. SEK’s initial loan offer and subsequent commitment set forth the maximum principal amount of a loan, the currency in which the loan will be denominated, the repayment schedule and the disbursement schedule.
Interest Rates
Because Sweden is a member of the Organization for Economic Cooperation and Development (the “OECD”), the S-system is designed to comply with the Arrangement on Guidelines for Officially Supported Export Credits of the OECD (the “OECD Consensus”). The OECD Consensus establishes minimum interest rates, required down payments and maximum loan periods for government-supported export loan programs.
SEK offers S-system financing at commercial interest reference rates (“CIRR”) established by the OECD in accordance with the OECD Consensus. The CIRR rates for new loans are subject to periodic review and adjustment by the OECD. The OECD Consensus stipulates that loan offers may remain valid for a period of not more than 120 days. EU rules and Swedish regulations state that the commercial contract must be signed within such 120 day period. Thereafter, the CIRR rate can be locked in for a maximum period of six months in order for the loan agreement to be finalized. No commitment fee is charged by SEK for CIRR loans. The arranging/agent bank, generally a commercial bank, receives compensation of 0.25 percent per annum, based on the outstanding loan amount, to cover its costs for arranging and managing loans.
SEK participates with government agencies in an export-financing program (the “Concessionary Credit Program”) financed by the Swedish State to promote exports to certain developing countries, incorporating a foreign aid element of at least 35 percent. SEK has a portfolio of such credits but Sweden is no longer providing new Concessionary Credits under the program. Terms varied according to the per capita income of the importing country.
The aid element is reflected in the form of lower rates of interest and/or deferred repayment schedules, and the Swedish government reimburses SEK through the S-system for the costs incurred as a result of SEK’s participation in such program as well as costs if any in the CIRR financing.
19
Table of Contents
Guarantees
In general, loans under the S-system are guaranteed by the EKN. If a guarantee is entered into for risk-mitigating purposes it protects a pre-defined amount of SEK’s exposure with respect to principal (and in some cases interest) as long as the issuer of the guarantee is financially sound. All credits granted by SEK within the S-system must also undergo SEK’s customary credit approval process.
Loan Maturities
Under the S-system, loan maturities generally range from one year up to 20-30 years.
Credit Support for Outstanding Loans
The Group’s policies with regard to counterparty exposures are described in detail in Note 29 to the Consolidated Financial Statements.
The following table illustrates the counterparties for the Group’s outstanding loans and guarantees as of December 31, 2015 and December 31, 2014. Although most loans fall into more than one category for any given loan, this table reflects only the counterparty (either borrower or guarantor) that SEK believes to be the stronger in terms of creditworthiness.
| | 2015 | | 2014 | |
Loan credit exposure to Swedish State guarantees via EKN(A) | | 34 | % | 39 | % |
Loan credit exposure to Swedish credit institutions(B) | | 3 | % | 3 | % |
Loan credit exposure to foreign bank groups or governments(C) | | 25 | % | 20 | % |
Loan credit exposure to Swedish counterparties, primarily corporations(D) | | 24 | % | 24 | % |
Loan credit exposure to municipalities | | 4 | % | 4 | % |
Loan credit exposure to other foreign counterparties, primarily corporations | | 10 | % | 10 | % |
Total | | 100 | % | 100 | % |
See “— Lending Operations — General” for information on the geographical distribution of borrowers.
(A) EKN guarantees are in substance insurance against losses caused by the default of a foreign borrower or buyer in meeting its contractual obligations in connection with the purchase of Swedish goods or services. In the case of a foreign private borrower or buyer, coverage is for “commercial” and, in most cases, “political” risks. Coverage for “commercial” risk refers to losses caused by events such as the borrower’s or buyer’s insolvency or failure to make required payments within a certain time period (usually six months). Coverage for “political” risk refers to losses caused by events such as a moratorium, revolution or war in the importing country or the imposition of import or currency control measures in such country. Disputed claims must be resolved by a court judgment or arbitral award, unless otherwise agreed by EKN. In the table above only the particular amount of any given total loan that is guaranteed is listed as such. The amount of any such loan that is not covered by the relevant guarantee is excluded. EKN is a State agency whose obligations are backed by the full faith and credit of Sweden.
(B) As of December 31, 2015, loans in this category amounting to approximately 1 percent (2014: 1 percent) of total loans were obligations of the four largest commercial bank groups in Sweden including guarantees in the form of bank guarantees or credit derivatives. The remaining 2 percent (2014: 2 percent) of total loans represented loans to various financial institutions and minor commercial banks in Sweden including guarantees in the form of bank guarantees or credit derivatives.
20
Table of Contents
(C) As of December 31, 2015, principally obligations of other Nordic, Western European or North American bank groups, together with obligations of Western European governments including guarantees in the form of bank guarantees or credit derivatives.
(D) As of December 31, 2015, approximately 10 percent (2014: 9 percent) of the total loan credit exposure represented loans to the 20 largest Swedish corporations.
See also Note 26 to the Consolidated Financial Statements.
Disclosure pursuant to Section 13(r) of the Securities Exchange Act of 1934
SEK has not entered into any new business in or with Iran since 2005.
However, it remains one of a number of minority sub-participants via assignment in a single legacy Euro-denominated financing arrangement dating back to 2005 that is led by a major European bank and guaranteed by a European government export credit agency. The purpose of the financing arrangement was to finance the acquisition by the National Petrochemical Company (“NPC”) of Iran of certain equipment exported from Germany. The obligations of NPC under the arrangement are secured by the assignment of certain receivables from oil products exported by NPC and its trading subsidiaries to buyers, mostly in Asia. No funds under the arrangement (which has a contractual maturity of 2019) have been provided to NPC since 2010.
SEK’s only relationship to this legacy financing arrangement is as a holder (by means of an assignment by the lead bank) of a sub-participation interest representing less than 10% of the total facility. SEK’s acquisition of this minority sub-participation interest in 2005 did not violate the provisions of any sanctions or related regulatory regimes applicable to SEK at that time. SEK is not (and never has been) a party to the contractual arrangements with NPC, has never had any contact with NPC, nor has it ever had any involvement in the contractual arrangements related to, or in the physical settlement of, the oil product exports mentioned above.
During 2015, SEK’s sub-participation in this single legacy financing arrangement generated gross revenues of Euro 32,143.27 and net interest revenues of Euro 13,564.41. These amounts represent less than 0.03 percent of SEK’s gross revenues and net interest revenues for the year. SEK is actively exploring the possibility of exiting the arrangement through assignment of its minority sub-participation interest to another participant bank.
C Organizational Structure
SEK organizes its activities in one Lending function which serves all customers with all products within SEK’s product range. The Lending function is responsible for all customer relations contacts and cooperates with a Credit function and a Treasury group. SEK also maintains a risk control unit and a compliance function as well as staff and support functions.
Risk Control, Compliance and Internal Audit
SEK maintains a risk control unit and a compliance function which operate independently of the business areas. See also Note 29 to the Consolidated Financial Statements. In November 2011, upon the recommendation of the Audit Committee, SEK’s Board of Directors decided, that the independent internal audit function would be outsourced to an external company beginning in 2012. SEK’s Board of Directors has appointed KPMG to be responsible for the independent internal audit function and they have commenced their assignment in January 2012. Their assignment has been prolonged for 2013, 2014 and 2015 as well. The company’s goal in appointing an external party in order to perform the internal audit is to benefit from significant competence and experience in auditing SEK’s compliance with applicable regulations, particularly those regarding capital adequacy and the company’s internal risk model. SEK’s Risk and Compliance Committee, of which the Chief Executive Officer (CEO) is the chairman, has overall responsibility to establish the internal rules for the internal control of the financial reporting and follow-up compliance with the internal control regulations.
21
Table of Contents
Swedish Government Supervision
Supervision by the Finansinspektionen (the Swedish FSA)
SEK operates as a credit market institution within the meaning of the Swedish Banking and Financing Business Act (2004:297) (the “Act”). As such, it is, individually and on a consolidated basis, subject to supervision and regulation by Finansinspektionen (the Swedish FSA) which licenses and monitors the activities of credit market institutions to ensure their compliance with the Act and the regulations linked to it and such institutions’ corporate charters.
Among other things, the Swedish FSA requires SEK to submit reports on a daily, monthly, quarterly, semiannual and annual basis and may conduct periodic inspections. The Swedish FSA also may (but currently does not) appoint an external auditor to participate with SEK’s independent auditors in examining the Group’s and the Parent Company’s financial statements and the management of the Group.
In 2011, the Swedish FSA initiated an industry-wide inquiry into financial institutions’ reporting of the financial instruments they hold and certain aspects of their handling of market risk. SEK cooperated with this inquiry and SEK has had a dialogue with the Swedish FSA since, and has regularly informed about the timetable and improvements achieved within this area. In February 2015, the Swedish FSA informed SEK that it expected SEK to enhance its reporting of market risk furthermore and to address certain related issues. During 2015 a program to further improve the risk management capabilities within this area has been initiated. The work is planned to be finalized in 2016.
The Swedish National Audit Office may audit the activities that are conducted by the Swedish State in the form of limited companies, if the State as owner has a controlling influence over the activities. The State has such controlling influence over the activities of the Parent Company, which is a limited company. The National Audit Office appointed Authorized Public Accountant Filip Cassel as the auditor for SEK for the period from the 2010 Annual General Meeting up to and including the 2014 Annual General Meeting, with Authorized Public Accountant Anders Herjevik as the alternate for the same period. However, in April 2012 this appointment was terminated due to the fact that Mr. Cassel retired. The Swedish National Audit Office has not appointed a successor to Mr. Cassel.
As a credit market institution, SEK is also subject to prudential regulations relating, to among other areas, its capital adequacy, its maximal exposure to any group of interconnected clients and its liquidity position.
Prudential requirements
As of January 1, 2014, the revised capital adequacy rules of the Basel Committee on Banking Regulation and Supervisory Practices at the Bank for International Settlements (the “Basel Committee”), referred to as Basel III, came into force within the European Union. Basel III was introduced by a legislative package consisting of the Capital Requirements Regulation (CRR)(3) and the Capital Requirements Directive (CRD IV)(4). CRR is directly applicable in Sweden and contains detailed requirements in respect to capital adequacy, liquidity, large exposures, leverage ratio and supervisory reporting. CRD IV was incorporated into Swedish legislation as of August 2, 2014 and covers areas such as principles for prudential supervision, internal assessments of risk and capital, corporate governance, capital buffers, sanctions and remuneration.
The current regulations introduced by CRR and CRD IV replace regulations of the previous revision of the Basel accord, Basel II, which had been the prevailing standard since 2007, as it was incorporated into EU and Swedish legislation. On several topics Basel II rules are however still partially or completely in force, due to transistional periods in CRR or CRD IV. CRR, as amended, and CRD IV, as incorporated into national legislation, apply to credit institutions, including SEK, within Sweden and the European Union.
(3) Regulation (EU) no 575/2013 of the European Parliament and of the Council of 26 June 2013 on prudential requirements for credit institutions and investment firms and amending Regulation (EU) no 648/2012
(4) Directive 2013/36/EU of the European Parliament and of the Council of 26 June 2013 on access to the activity of credit institutions and the prudential supervision of credit institutions and investment firms, amending Directive 2002/87/EC and repealing directives 2006/48/EC and 2006/49/EC
22
Table of Contents
The main structure of Basel III, as well as the previous standard according to Basel II, consists of three “Pillars”, as follows:
(i) Pillar 1 deals with minimum capital requirements for credit risks, credit valuation adjustment risks and market risks as well as for operational risks, based on explicit calculation rules. Under Pillar 1, an institution must at all times have Own funds that in size and composition are sufficient to meet those minimum capital requirements. The capital requirements and the Own funds are calculated in accordance with the CRR (until year-end 2014: Capital Adequacy Act (2006:1371) and the Swedish FSA’s regulations and general guidelines regarding capital adequacy and large exposures (FFFS 2007:1)). The stricter minimum requirements that were introduced with the CRR are subject to transitional arrangements, however the Swedish FSA has chosen to, in most cases, require institutions to comply with those rules immediately according to their respective regulations regarding prudential requirements and capital buffers (FFFS 2014:12). Pillar 1 allows institutions to choose between various alternatives based on their level of development; with regard to credit risks, the standardized approach is the simplest approach. It is similar to the approach required by Basel I, but contains more risk weights, all of which are established by national authorities. Institutions can expand upon the supervisory authorities’ risk weights by using risk assessments from recognized credit rating agencies such as Moody’s, Standard & Poor’s and Fitch. The next level of sophistication under Pillar 1 regarding credit risk is called the Foundation IRB approach (internal ratings-based approach). Under the Foundation IRB approach, the risk weights, and therefore the capital requirements, are partially based on institutions’ internal risk classifications. The Swedish FSA approved SEK’s application to be allowed to use a Foundation IRB approach in February 2007. SEK’s permission to base its capital requirement for credit risk on the IRB approach covers a large proportion of the company’s exposures. Certain exposures are, by permission from the Swedish FSA, exempted from application of the IRB approach, and then the standardized approach is applied instead. SEK has permanent exemptions for exposures to Swedish central and regional governments. SEK was also in 2014 granted a permanent exemption, which superseded a previous temporary but otherwise equivalent exemption, from the IRB approach regarding exposures in the Customer Finance business area. This permanent exemption is subject to the prerequisite that the exposures covered will not have a significant impact on the risk profile of SEK. Also, SEK has time-limited exemptions until December 31, 2015 for its exposures to central and regional governments outside Sweden and to multilateral development banks. SEK has applied to the Swedish FSA for approval of an IRB approach for those exposures with time-limited exemptions. SEK has also applied for a temporary prolongation of the time-limited exemptions until an IRB approach for the affected exposures is approved. Minimum capital requirements for these exposures will increase when, subject to approval from the Swedish FSA, an IRB approach is applied.
(ii) Pillar 2 concerns national supervisory authorities’ evaluation of risks and describes requirements on institutions’ processes for risk and capital management. It also establishes the supervisory authorities’ functions and powers. Further, under Pillar 2 each financial institution must identify risks and assess risk management from a wider perspective, to supplement the capital requirements calculated within the scope of Pillar 1. This Internal Capital Adequacy and Liquidity Assessment Process (ICAAP) also takes into account qualitative risks. SEK annually assesses the development of its future capital and liquidity requirements and available capital primarily in connection with the three-year business plan being updated.
(iii) Pillar 3 concerns, and places requirements on, openness and transparency and how institutions, in a broad sense, should report their operations to the market and the public. The disclosure of capital and risk management must follow the requirements of the CRR and some additional regulations issued in Sweden, most notably the above mentioned FFFS 2014:12 (until year-end 2014: the Swedish FSA’s regulations and general guidelines regarding public disclosure of information concerning capital adequacy and risk management (FFFS 2007:5)). SEK reported in accordance with Pillar 3 for the first time in the Annual Report for 2007. Since 2008, SEK has also published a separate report in accordance with Pillar 3:”Capital Adequacy and Risk Management Report, Pillar 3”.
As mentioned above, CRR also introduces new liquidity standards: liquidity coverage ratio (LCR) and net stable funding ratio (NSFR). LCR requires that a bank holds enough high quality liquid assets to cover their projected net cash outflows in a 30-day stress scenario. The EU Commission has published a delegated act on LCR. The detailed LCR rules came into force on 1 October 2015 with phase-in of 60% in 2015, 70% in 2016, 80% in 2017 and 100% in 2018. In Sweden, the Swedish FSA has progressed faster in liquidity regulations and implemented a tougher LCR requirement already in the beginning of 2013. NSFR requires that a bank maintain a stable borrowing profile in relation to the composition of their assets and off-balance sheet activities under both normal and stressed conditions. Minimum requirements will however not come into force until 2018.
23
Table of Contents
The principal measure of capital adequacy, according to previous (Basel II) and current (Basel III as it is implemented with the CRR) standards, is a capital to risk exposure amount ratio, which compares the Own funds, as defined in the CRR, to the total of risk-weighted exposures, that is assets and off-balance sheet items measured according to the risk level. According to CRR, Own funds consist of three components with different level of quality from a loss absorption perspective. The highest quality is the Common Equity Tier 1 capital, which includes equity capital after certain adjustments and deductions. The next level is the Additional Tier 1 capital which, subject to detailed requirements, consists of some kinds of highly subordinated, perpetual debt or hybrid capital. Tier 1 capital is the sum of Common Equity Tier 1 capital and Additional Tier 1 capital. Tier 2 capital constitutes the third component and consists of, subject to detailed requirements, some kinds of subordinated debt that among other things must have an original maturity no less than five years. The measure on Common Equity Tier 1 capital was formally introduced with the CRR. Most items previously deducted from total Own funds will according to CRR be deducted directly from Common Equity Tier 1 capital. One of the key purposes of the Basel III standards is to improve the quality of the Own funds of financial institutions and to increase transparency standards regarding the different components that comprise the Own funds. The introduction of Basel III with CRR have imposed a narrower definition of Tier 1 capital with stricter requirements on included instrument and an overall focus on Common Equity Tier 1 capital. Also, the CRR introduced stricter capital requirements related to exposures to financial institutions and a new capital requirement for credit valuation adjustment risks, covering additional risks related to derivatives positions.
The minimum total capital ratio requirement under Pillar 1 is 8.0 percent, a requirement that not has changed with the CRR. However, the CRR introduced additional requirements on the higher quality components of capital, with a minimum requirement of 4.5 percent and 6.0 percent relating to Common Equity Tier 1 capital and Tier 1 capital, respectively. These additional requirements are subject to transitional arrangements according to CRR, but the Swedish FSA has opted to require financial institutions, including SEK, to fulfill them already as of January 1, 2014. In addition to these minimum ratios there are capital buffers requirements that SEK must meet with Common Equity Tier 1 capital with the result, as of December 31, 2015, that SEK’s actual Common Equity Capital Ratio must exceed 7.7 percent (year-end 2014: 7.0 percent). Failure to meet the additional buffer requirements triggers among other things restrictions on distributions. SEK’s policy is to maintain Own funds well in excess of the regulatory minimum requirements.
The Common Equity Tier 1 capital ratio is a new metric that became a required disclosure as of January 1, 2014. This ratio, as it has been disclosed prior to January 1, 2014 has been based on a definition where Common Equity Tier 1 capital consists of Tier 1 capital excluding additional Tier 1 capital (in the form of perpetual subordinated debt). As of January 1, 2014 and henceforth the Common Equity Tier 1 capital is calculated according to CRR, in some cases subject to transitional arrangements. SEK’s Common Equity Tier 1 capital ratio was 21.6 percent as of December 31, 2015 (year-end 2014: 16.9 percent). As of December 31, 2015, SEK’s total capital ratio was 24.5 percent (2014: 19.2 percent), while its Tier 1 capital ratio was 21.6 percent (2014: 16.9 percent). Contributing factors to the increase in the capital ratios are revised risk parameters, reduced exposures from liquidity investments and increases in Own funds due to increased retained earnings. See Note 25 to the Consolidated Financial Statements for further details on the capital adequacy and capital buffers of SEK.
In August, 2013 SEK exercised its right to redeem outstanding perpetual subordinated debt totaling USD 350 million, instruments that up to that time had been included in Additional Tier 1 capital. The reason for the early redemption of these debentures is that, due to regulatory changes that were to be (and subsequently also were) introduced with the CRR, they would not qualify as Tier 1 capital and therefore they would not fulfill an effective function in the company’s capital structure going forward. In November 2013, a Tier 2-eligible bond amounting to USD 250 million with a maturity of 10 years and a redemption option after 5 years was issued.
For further information on prudential regulations, and forthcoming changes regarding these, see Note 29 to the Consolidated Financial Statements.
Large exposures
According to the CRR (until year-end 2014: the Swedish FSA’s regulation FFFS 2007:1), a large exposure refers to an exposure that accounts for at least 10 percent of an institution’s eligible capital, which effectively for SEK is the total of Own funds. The aggregate amount of SEK’s large exposures as of December 31, 2015 was 236.7 percent of SEK’s total Own funds, and consisted of risk-weighted exposures to 18 different counterparties, or counterparty groups, of which the majority relate to combined exposures for which more than one counterparty is responsible for the same payments (year-end 2014: 342 percent and 25 different counterparties or counterparty groups).
24
Table of Contents
In order to monitor large exposures, SEK has defined internal limits, which are monitored daily, along with other limits.
AB SEK Securities
The Parent Company’s wholly owned subsidiary AB SEK Securities was merged into the Parent Company on December 5, 2014. The subsidiary was previously licensed to conduct a securities business and as such was regulated by the Swedish FSA under the Securities Operations Act. The Parent Company has obtained the same license and is thus now subject to the same regulations and conditions, which follows from such a license. Among other things, the Swedish FSA requires a licensee to submit reports on a regular basis and may request to conduct periodic inspections. The Swedish FSA had the option to appoint (but did not) an external auditor for the subsidiary. Furthermore, AB SEK Securities was also subject to regulation of its capital adequacy and limits on credit to any single customer pursuant to the CRR, as amended, as the Parent Company is now and was before the merger.
D Property, Plant and Equipment
SEK’s current headquarters, which occupy approximately 4,490 square meters of office space in central Stockholm, are leased.
ITEM 4A. UNRESOLVED STAFF COMMENTS
None.
ITEM 5. OPERATING AND FINANCIAL REVIEW AND PROSPECTS
A Operating Results
A major part of SEK’s operating profit derives from net interest revenues, which are earned mainly on loans to customers, but also to a lesser extent on liquidity investments. Funding for these assets comes from equity and from securities issued in international capital markets. Accordingly, the key determinants of SEK’s operating profit are: the interest rate on interest-bearing assets, the interest rate of issued securities, the outstanding volume of interest-bearing assets and the proportion of assets financed by equity. The relative proportions of assets funded by debt and equity are also crucial.
SEK issues debt instruments with terms that may be fixed, floating or linked to various indices. SEK’s strategy is to economically hedge these terms at floating rates with the aim of matching the terms of its debt-financed assets. The quality of SEK’s operating profit, its relatively stable credit ratings and SEK’s public role have enabled SEK to achieve borrowing at levels that are competitive within the market.
In addition to net interest revenues, another key influence on SEK’s operating earnings has been changes in the fair value of certain assets, liabilities and derivatives reported at fair value. The factors that mainly impact unrealized changes in fair value are credit spreads on own debt and basis spreads. The credit spread on own debt is related to the creditworthiness SEK’s investors believe that SEK has. Basis spread is the deviation in the nominal interest rate between two currencies in a currency interest rate swap that depends on the difference between the base interest rate of the currencies.
25
Table of Contents
Operating profit for 2015 amounted to Skr 1,535 million (2014: Skr 1,629 million), a decrease of 6 percent compared to the previous year. The decrease was mainly attributable to lower net results of financial transactions.
Critical Accounting Policies and Estimates
When applying the Group’s accounting policies, management makes judgments and estimates that have a significant effect on the amounts recognized in the financial statements. These estimates are based on past experience and assumptions that the company believes are fair and reasonable. These estimates and the judgments behind them affect the reported amounts of assets, liabilities and off-balance sheet items, as well as income and expenses in the financial statements presented. Actual outcomes can differ from the estimates and the assumptions made. Please see below for items for which critical estimates have been made. SEK assesses that the judgments made related to the following critical accounting policies are the most significant:
· The functional currency of the Parent Company;
· The selection of the appropriate valuation techniques when prices from active markets are not available for derivatives and other financial instruments carried at fair value; and
· The judgment that SEK should be regarded as an agent with respect to the S-system.
Furthermore, SEK has identified the following key sources of estimation uncertainty when applying IFRS:
· Provisions for probable credit losses;
· Estimates of fair values when quoted market prices are not available; and
· Valuation of derivatives without observable market prices.
The functional currency of the Parent Company
SEK has determined that the Swedish krona (Skr) is its functional currency under IFRS. This judgment bears the risk of a change if the net exposure in any currency will increase significantly, and SEK’s statement of financial position as a consequence will become mainly denominated in other currency than the Swedish krona. In the past the net result of currency exchange-rate effects has not been of a material amount in relation to total assets and liabilities in foreign currency. Due to the economic substance of SEK’s policy of holding assets financed by liabilities denominated in, or hedged into, the same currency, this is not reasonably likely to change in the future. See Note 1 to the Consolidated Financial Statements for more information and Note 26 to the Consolidated Financial Statements for information on SEK’s positions in foreign currency.
The selection of the appropriate valuation techniques when prices from active markets are not available for derivatives and other financial instruments carried at fair value
When reporting the amounts of its assets, liabilities and derivatives, as well as its revenues and expenses, assumptions and estimates must be made in assessing the fair value of financial instruments and derivatives, especially where unquoted or illiquid securities or other debt instruments are involved. SEK makes judgments regarding what the most appropriate valuation techniques are for the different financial instruments based on their categories. In all cases, the decision is based on a professional assessment pursuant to SEK’s accounting and valuation policies. If the conditions underlying these assumptions and estimates were to change, the amounts reported could be different. The use of a valuation model demands a validation and thereafter an approval. See Note 26 to the Consolidated Financial Statements for disclosure of change in value of assets and liabilities if the market interest rate rises or falls by one percentage point and see Note 13 to the Consolidated Financial Statements for disclosure of change in value of assets and liabilities if non-observable parameters are changed.
The judgment that SEK should be regarded as an agent with respect to the S-system
SEK has determined that the S-system should be considered to be an assignment where SEK acts as an agent on behalf of the Swedish State rather than being the principal in the individual transactions. This assessment has been made based on a number of factors such as the following: (i) although it does in form, SEK does not in substance bear risks and make decisions associated with ownership; (ii) SEK does not have discretion in establishing prices; and (iii) SEK receives compensation in the form of a fixed commission. SEK has consequently presented the economic activities of the S-system on a net basis in the statement of comprehensive income, recording the net commission received, rather than the gross amounts collected, in accordance with the instruction from the State. The underlying factors that the assessment has been arisen from the instruction of the State. If the instruction from the State would change, the judgment might change. If SEK were regarded as a principal with respect to the S-system, all revenues and expenses in the S-system would be revenues and expenses of SEK. However, the net effect on SEK’s operating profit would be unchanged. See more information regarding the S-system in Note 24 and Note 1 (d)(i) to the Consolidated Financial Statements.
26
Table of Contents
Provisions for probable credit losses
Provisions for probable credit losses are made if and when SEK determines that it is probable that the obligor under a loan or another asset held by SEK, in each case together with existing guarantees and collateral, will fail to cover SEK’s full claim. If the judgment underlying this determination were to change, this could result in a material change in provisions for probable credit losses.
Impairment is recognized as the difference between the carrying value of a loan and the discounted value of SEK’s best estimate of future cash repayments. This estimate takes into account a number of factors related to the obligor. The actual amounts of future cash flows and the dates they are received may differ from these estimates and consequently actual losses incurred may differ from those recognized in the financial statements. If, for example, the actual amount of total future cash flow were 10 percent higher or lower than the estimate, this would affect operating profit for the financial year ended December 31, 2015 by Skr 20-30 million (2014: Skr 40-50 million; 2013: Skr 70-80 million) and equity by Skr 16-24 million (2014: Skr 31-39 million; 2013: Skr 55-65 million) at that date. A higher total future cash flow would affect operating profit and equity positively, and a lower total future cash flow would affect operating profit and equity negatively. Historically the estimates have been reasonably accurate, which can also be seen in the historical Net credit losses.
Estimates of fair value when quoted market prices are not available
If a transaction is classified as an asset or liability at fair value through profit or loss, fair value must include any impact of credit spreads. When quoted market prices are not available for such instruments, certain assumptions must be made about the credit spread of either the counterparty or one’s own credit spread, depending on whether the instrument is an asset or a liability.
Developments in the financial markets have to some extent affected the prices at which SEK’s debt is issued. These changes, which are different in different markets, have been included in the calculation of fair value for these liabilities. The models used include both directly observable and implied market parameters.
If the assumption related to the valuation of assets classified at fair value through profit or loss were changed such that the average credit spread applied to such assets were 0.10 percent higher or lower than the average spread actually used in the calculations, this would affect operating profit for the fiscal year ended December 31, 2015 by approximately Skr 5-15 million (2014: Skr 5-15 million; 2013: Skr 5-15 million) and equity, at such date, by approximately Skr 100-110 million (2014: Skr 150-160 million; 2013: Skr 110-120 million). A higher credit spread would affect operating profit and equity negatively, and a lower credit spread would affect operating profit and equity positively.
If the assumption related to the valuation of liabilities classified at fair value through profit or loss were changed such that the average credit spread applied to such liabilities were 0.10 percent higher or lower than the average spread actually used in the calculations, this would affect operating profit for the fiscal year ended December 31, 2015 by approximately Skr 150-250 million (2014: Skr 200-300 million; 2013: Skr 200-300 million) and equity, at such date, by approximately Skr 100-200 million (2014: Skr 150-250 million; 2013: Skr 150-250 million). A higher credit spread would affect operating profit and equity positively, and a lower credit spread would affect operating profit and equity negatively.
SEK issues debt instruments in many financial markets. A large portion of these are hybrid instruments with embedded derivatives. SEK’s policy is to hedge the risks in these instruments using derivatives with corresponding structures in order to obtain effective economic hedges. The entire hybrid debt instrument is then classified as a financial liability measured at fair value. As there are typically no market quotes for this group of transactions, valuation models are used to calculate fair value. The gross value of these instruments and derivatives which effectively hedge each other requires complex judgments regarding the most appropriate valuation technique, assumptions and estimates. If other valuation models or assumption were used, or if assumptions changed, this could produce other valuation results. Excluding the impact on valuation of credit spreads on SEK’s own debt and basis spreads, such changes in fair value would generally offset each other.
27
Table of Contents
If these assumptions were to be changed, this could result in a material change in the fair value of these instruments. For further information see the table “Sensitivity analysis — level 3 assets and liabilities” in Note 13 to the Consolidated Financial Statements.
Valuation of derivatives without observable market prices
A large part of SEK’s portfolio of senior securities issued and related derivatives is in the form of structured products, in which the fair value of certain embedded derivatives (though not bifurcated) sometimes requires sophisticated models in order to value these instruments. If the assumptions used in these models were to change, it could result in a material change in the fair value of these instruments. Since SEK only enters into market-matched hedge relationships (economic or accounting hedges), a potential material effect on profit or loss or equity would result only if there were changes in the credit spreads or basis spread.
SEK uses derivative instruments to mitigate and reduce risks attributable to financial assets and liabilities. In order to mitigate counterparty risk, i.e. the form of credit risk generated from derivative transactions, SEK enters into such transactions only with counterparties with good creditworthiness. Moreover, SEK endeavors to enter into ISDA Master Agreements with Credit Support Annexes with its counterparties. This means that the highest allowed risk level is established in advance, regardless of what changes in market value may occur. Derivatives are valued at fair value with reference to listed market prices where available. If market prices are not available, valuation models are used instead. SEK uses a model to adjust the fair value of the net exposure for changes in SEK’s or a counterparty’s creditworthiness. The models use directly observable market parameters if such are available.
Please see more information regarding valuation techniques in Note 13 to the Consolidated Financial Statements, and for more information regarding Critical accounting policies and estimates see Note 1 to the Consolidated Financial Statements.
Recent Accounting Pronouncements Issued and Other Accounting Related Announcements
SEK has adopted the following amendments to standards and interpretations from IASB as from January 1, 2015, but have no material impact on SEK’s financial reporting:
Amendments to IAS 19 — Defined Benefit Plans: Employee Contributions:
IFRS — Annual Improvements cycle 2010-2012.
IFRS — Annual Improvements cycle 2011-2013.
The following new standards and changes in standards and interpretations not yet adopted are considered to be particularly relevant to SEK: For additional information on new standards, see Note 1(a) to the Consolidated Financial Statements.
IFRS 9 Financial Instruments. 2014, IASB issued IFRS 9 which is replacing IAS 39 Financial Instruments: Recognition and Measurement. The standard includes requirements for recognition, classification and measurement, impairment, derecognition and general hedge accounting. The standard has been issued in phases, with the 2014 version replacing all previous versions. New rules on the classification and measurement of financial assets reduce the number of valuation categories and instead focus on the company’s business model with respect to how its financial assets are used and whether contractual cash flows represent only nominal amounts and interest. The rules for financial liabilities are essentially unchanged compared with IAS 39. The biggest change is that fair value movements due to own credit risk in financial liabilities that have irrevocably been designated as at fair value should be recognized in other comprehensive income rather than in profit or loss. IFRS 9 also introduces credit loss model where expected losses are taken into account. The new model takes a three-stage approach based on whether significant changes in credit risk have occurred. The new general rules on hedge accounting allow entities to better reflect risk management activities in financial reports. SEK has started the process of evaluating the potential effect of this standard, but has not yet formed any conclusions regarding the effects on SEK’s financial statements, capital adequacy or large exposures. At present, SEK has no intention of adopting the standard early. IFRS 9 is mandatorily effective from January 1, 2018, with early adoption permitted.
28
Table of Contents
IFRS 16 Leases. In January 2016, the IASB published the new accounting standard for leases, includes changes for lessees. All leases (with the exception of short-term leases and smaller leases) are to be recognized as right-of-use assets which are subject to depreciation and with liabilities appearing in the lessee’s balance sheet, and the lease payments are recognized as repayment and interest expense. Lessor accounting remains essentially unchanged. Further disclosures are also required. SEK’s preliminary assessment is that the standard will not have any material impact on SEK’s financial statements, capital adequacy or large exposures. The standard is effective from January 1, 2019.
Assets and Business Volume
Total Assets
SEK’s total assets amounted to Skr 280.4 billion on December 31, 2015 (year-end 2014: Skr 325.2 billion), a decrease of 14 percent compared to same period of the previous year. The decrease is mainly due to decreased liquidity investments as part of a more efficient use of capital. The liquidity investments amounted to Skr 58.7 billion on December 31, 2015 (year-end 2014: Skr 86.6 billion).
The combined amount of loans outstanding and loans committed though not yet disbursed amounted to Skr 268.5 billion as of December 31, 2015 (year-end 2014: Skr 234.3 billion), an increase of 15 percent from year-end 2014. The increase is mainly attributable to the financing agreement signed with Brazil regarding its purchase of Gripen fighter planes from Saab. Of the combined amount as of December 31, 2015, Skr 205.1 billion represented outstanding loans, a decrease of 6 percent from year-end 2014 (year-end 2014: Skr 218.2 billion). Of the total amount of outstanding loans, loans in the S-system amounted to Skr 44.1 billion (year-end 2014: Skr 48.3 billion), representing a decrease of 9 percent from year-end 2014.
Business Volume
SEK’s new lending to Swedish exporters and their customers in 2015 amounted to Skr 104.6 billion (2014: Skr 57.1 billion).
The volume of new end-customer finance for the full year was Skr 85.3 billion (2014: Skr 33.9 billion). Skr 50.8 billion of total end-customer finance for the year relates to S-system credits (2014: Skr 5.7 billion). The volume of new corporate lending was Skr 19.3 billion (2014: Skr 23.2 billion).
As of December 31, 2015, the aggregate amount of outstanding offers amounted to Skr 57.1 billion, a decrease of 27 percent since year-end 2014 (year-end 2014: Skr 78.4 billion). Skr 48.4 billion (year-end 2014: Skr 74.5 billion) of outstanding offers were derived from the S-system. Skr 2.3 billion (year-end 2014: Skr 50.9 billion) of outstanding offers are binding offers and Skr 54.9 billion (year-end 2014: Skr 27.5 billion) are non-binding offers. Binding offers are included in commitments.
29
Table of Contents
New customer financing
(Skr billion)
| | Year ending December 31, | |
Skr billion | | 2015 | | 2014 | | 2013 | |
Customer financing of which: | | | | | | | |
- End-customer finance | | 85.3 | | 33.9 | | 39.0 | |
- Corporate lending | | 19.3 | | 23.2 | | 16.7 | |
Total | | 104.6 | | 57.1 | | 55.7 | |
Of which Skr 53.4 billion (2014: Skr 7.3 billion and 2013: Skr 12.1 billion) had not been disbursed at period end.
Counterparty Risk Exposures
There has been no significant change in the composition of SEK’s counterparty exposure except that the primary part of SEK´s securitizations positions was sold during the second quarter. Of the total counterparty exposure as of December 31, 2015, 52.9 percent (year-end 2014: 51.6 percent) was to states; 26.6 percent (year-end 2014: 22.8 percent) was to companies; 16.0 percent (year-end 2014: 18.3 percent) was to multilateral development banks and financial institutions; 4.3 percent (year-end 2014: 5.6 percent) was to regional governments; and 0.2 percent (year-end 2014: 1.7 percent) was to asset-backed securities. Total exposures amounted to Skr 326.2 billion on December 31, 2015 (year end 2014: Skr 370.3 billion), the decrease compared to the same period of the previous year is mainly attributable to the decreased liquidity investments and reduced volumes in total loans outstanding, loans committed though not yet dusbursed and binding offers. The financing agreement regarding Gripen planes was part of the previous year´s exposures as a binding offer. SEK’s exposure to derivative counterparties is significantly limited compared to the amount of derivatives reported among SEK’s assets because the derivatives are subject to collateral agreements. See the table “Capital requirements in accordance with Pillar 1” in Note 25 to the Consolidated Financial Statements.
Other exposures and risks
SEK’s hedging transactions are expected to be effective in offsetting changes in fair value attributable to hedged risks. The determination of the gross value of certain items in the statements of financial position, particularly derivatives and issued unsubordinated securities, which effectively hedge each other, requires complex judgments regarding the most appropriate valuation technique, assumptions and estimates.
If different valuation models or assumptions were used, or if assumptions changed, a different result may arise. Excluding the impact on the valuation of spreads on SEK’s own debt and basis spreads (which can be significant), such changes in fair value would generally offset each other, with little impact on the value of net assets.
SEK maintains a conservative policy with regard to market exposures, interest rate risks, currency risks and operational risks. For quantitative and qualitative information about risks and exposures, see Note 26 and Note 29 to the Consolidated Financial Statements.
Results of Operations
Net Interest Revenues
2015 compared to 2014
Net interest revenues amounted to Skr 1,662 million (2014: Skr 1,578 million), an increase of 5 percent compared to the previous year. This increase was driven primarily by higher average lending volumes and lower borrowing costs. The decreased borrowing costs are a result of improved borrowing terms and lower financing needs, mainly attributable to decreased liquidity investments. Changes in currency exchange-rates had a positive effect on net interest revenues. Lower market interest rates had a negative impact on net interest revenues and are the main reason for the large decline in interest income and interest cost gross.
30
Table of Contents
Interest-bearing assets decreased compared with the previous year and amounted on average to Skr 284.3 billion (2014: Skr 296.6 billion). The amount of total loans increased compared with the previous year and amounted on average to Skr 211.7 billion (2014: Skr 209.8 billion). Liquidity investments decreased as part of a more efficient use of capital and amounted on average to Skr 72.7 billion (2014: Skr 86.8 billion).
Borrowing volume decreased to an average of Skr 257.9 billion (2014: Skr 275.7 billion). The average margin on assets, compared with the previous year, has been affected positively due to the fact that the proportion of loans as part of the interest-bearing assets has increased and the margin of liquidity investments has improved. The margin on lending has been stable.
2014 compared to 2013
Net interest revenues amounted to Skr 1,578 million (2013: Skr 1,555 million), an increase of 1 percent. The average volume in the lending portfolio increased and the margins also increased somewhat compared to the previous year.
Interest-bearing assets increased compared with the previous year and amounted on average to Skr 296.6 billion (2013: Skr 284.5 billion). The amount of total loans increased compared with the previous year and amounted on average to Skr 209.8 billion (2013: Skr 197.2 billion). Liquidity investments amounted on average to Skr 86.8 billion (2013: Skr 87.3 billion).
Borrowing volume increased to an average of Skr 275.7 billion (2013: Skr 270.9 billion). While the margin on liquidity decreased during 2014 compared to 2013, margins on lending were stable and a slight reduction on the proportion of liquidity investments of assets compensated. Hence, the margins on assets were stable between 2013 and 2014.
Commission earned and commission incurred
2015 compared to 2014
Commission earned and commission incurred amounted to Skr -6 million (2014: Skr -6 million). Commission earned amounted to Skr 2 million (2014: Skr 4 million). Commission incurred amounted to Skr -8 million (2014: Skr -10 million).
2014 compared to 2013
Commission earned and commission incurred amounted to Skr -6 million (2013: Skr -5 million). Commissions earned amounted to Skr 4 million (2013: Skr 9 million). Commissions incurred amounted to Skr —10 million (2013: Skr —14 million). The decrease in commissions earned was due to decreased capital market commissions from the securities business in SEK Securities. The wholly owned subsidiary SEK Securities was merged into SEK on December 5, 2014. Through the merger AB SEK Securities’ assets and liabilities were taken over by SEK. AB SEK Securities had permission from the Swedish FSA to conduct security operations. The Parent Company authorization to conduct securities business operations, received on June 12, 2014, was transferred to SEK through the merger. The decrease in commission expenses incurred was primarily due to lower bank fees.
Net Results of Financial Transactions
2015 compared to 2014
Net results of financial transactions amounted to Skr 400 million (2014: Skr 506 million). This decrease, in comparison to the previous year, was attributable to a positive result from the settlement of the litigation with Lehman Brothers, which was reported in the previous year and to a negative result from the sale of securitizations assets during the second quarter of 2015. The decrease in net results of financial transactions was offset by the change in the fair value of debt, attributable to changes in SEK´s credit spread, which resulted in a positive impact on operating profit compared to last year.
2014 compared to 2013
The net results of financial transactions amounted to Skr 506 million (2013: Skr 408 million). The improved result was mainly due to results from the settlement of the litigation with Lehman Brothers amounting to Skr 317 million (see the paragraph directly below) and increased results from the early redemption of loans. This was offset by the fact that results were negatively impacted by changes in fair value attributable to changes in SEK’s credit risk and that in the previous year, profits from SEK’s repurchase of its subordinated debt and the closing of related hedging instruments amounted to Skr 375 million.
31
Table of Contents
In April 2012, the Swiss company Lehman Brothers Finance AG (in liquidation, with PricewaterhouseCoopers as appointed liquidators) (“LBF”) filed a lawsuit against SEK with the Stockholm District Court. In June 2014, the dispute was finally settled and in September 2014, SEK received certain distributions from other entities in the former Lehman Brothers group, that, in total, affected net results of financial transactions positively by Skr 317 million (see Note 4 to the Consolidated Financial Statements).
SEK’s general business model is to hold financial instruments measured at fair value to maturity. The unrealized fair value changes that arise, mainly attributable to changes in credit spreads on SEK’s own debt and basis spread, are recognized in net results of financial transactions and will, over time, not affect the result as the changes in unrealized market value will return to zero if the instruments are held to maturity. Realized gains and losses will occur if SEK repurchases own debt or if lending is prematurely terminated and related hedging instruments are closed out.
Personnel Expenses
2015 compared to 2014
Personnel expenses totalled Skr -295 million (2014: Skr -313 million), a decrease of 6 percent compared to the previous year. The decrease was mainly attributable to a decreased provision to the employee incentive scheme. There was also a reversal of prior provisions for the employee incentive scheme related to 2014 of Skr 6 million (2014: Skr - million).
No estimated cost for the employee incentive scheme was required to be recorded during 2015.
The outcome of the scheme is based on net interest revenues and net commissions less costs, and may not exceed two months’ salary. For 2015, the scheme covered all permanent employees with the exception of the CEO, other senior executives and employees working in risk- and compliance functions. The amount to be paid decreases if the risk exposure amount exceeds intended levels for the period.
2014 compared to 2013
Personnel expenses totaled Skr -313 million (2013: Skr —290 million) an increase of 8 percent compared to the previous year. The increase in personnel expenses was due to a reserve made to the employee incentive scheme, which was not the case in 2013.
The cost for the employee incentive scheme amounted to Skr -26 million (2013: Skr 0 million) charged to profit. The outcome of the employee incentive scheme is based on net interest revenues and net commissions less costs, and may not exceed two months’ salary. In 2014, the scheme applied to all permanent employees, with the exception of Senior Executives, Head of Financial Control, Head of Internal Control and Head of Risk Control as well as any other employees that the Board of Directors have decided to exclude. The amount to be paid decreases if the risk exposure amount exceeds intended levels for the year.
Peter Yngwe has left his position as CEO in April 2014 in accordance with the Board of Directors’ decision. Catrin Fransson assumed her position as CEO at the time of SEK’s Annual General Meeting in April 2014. Catrin Fransson’s terms of employment follow the state’s guidelines for leading officials.
Other administrative expenses
2015 compared to 2014
Other administrative expenses amounted to Skr -164 million (2014: Skr -166 million), a decrease of 1 percent compared to the previous year.
2014 compared to 2013
Other administrative expenses amounted to Skr -166 million (2013: Skr -185 million), a decrease of 10 percent compared to the previous year. The decrease in other administrative expenses is mainly due to cost-reducing actions that have been taken through the reduction of the number of consultants and their replacement with employed staff.
32
Table of Contents
Depreciation and impairment of Non-financial Assets
2015 compared to 2014
Depreciation and impairment totalled Skr -98 million (2014: Skr -43 million), an increase of 128 percent compared to the previous year. An impairment of capitalized IT investments has been made and amounted to Skr -55 million, after an assessment of the assets’ value.
2014 compared to 2013
Depreciation totaled Skr -43 million (2013: Skr -36 million), an increase of 19 percent. The increase was mainly due to an increased depreciation base for IT development-projects.
Net Credit Losses
2015 compared to 2014
Net credit losses for 2015 amounted to Skr 36 million (2014: Skr 73 million). During the fourth quarter of 2015 a provision of Skr -33 million was made due to a bad debt. During the second quarter of 2015 a reversal of a previous provision was made to the portfolio-based reserve (i.e., the reserve not attributable to a specific counterparty) of Skr 70 million. The reversal of the reserve is due to the fact that securitization assets were sold during the second quarter and that the risk parameters for credit risk have been revised in calculating the reserve as of June 30, 2015. The portfolio based reserve was at the end of 2015 Skr 170 million (2014: Skr 240 million).
2014 compared to 2013
Net credit losses for 2014 amounted to Skr 73 million (2013: Skr -39 million). The positive result was due to reversed reserves applicable to both a previously impaired debt that had been sold during the period and the two Collateralized Debt Obligations (“CDOs”) which were impaired previously due to a dramatically downgraded rating. One of these CDOs has been liquidated, with SEK having received final settlement while for the other CDO a reserve has partly been reversed in connection with an amortization that was received in the fourth quarter (see Note 9 and 26 to the Consolidated Financial Statements). During 2014, an additional provision of Skr -30 million was made to the portfolio based reserve (i.e. the reserve not attributable to a specific counterparty) (2013: Skr -10 million). After this provision, the reserve amounts to Skr 240 million (year-end 2013: Skr 210 million). The increase of the reserve is mainly attributable to corporate exposures with lower ratings.
Operating Profit
2015 compared to 2014
Operating profit amounted to Skr 1,535 million (2014: Skr 1,629 million), a decrease of 6 percent compared to the previous year. The decrease is mainly attributable to lower net results of financial transactions. Operating profit, excluding net results of financial transactions, amounted to Skr 1,135 million (2014: Skr 1,123 million), an increase of 1 percent compared to the previous year.
2014 compared to 2013
Operating profit amounted to Skr 1,629 million (2013: Skr 1,408 million), an increase of 16 percent compared to the previous year. The increase was mainly attributable to reversals of previous reserves for credit losses and an increase in net results of financial transactions. In net results of financial transactions, a result amounting to Skr 317 million (2013: Skr 0 million) is included due to a settlement of the litigation with Lehman Brothers
Net Profit
2015 compared to 2014
Net profit for the year amounted to Skr 1,187 million (2014: Skr 1,260 million).
33
Table of Contents
2014 compared to 2013
Net profit for the year amounted to Skr 1,260 million (2013: Skr 1,090 million).
B Liquidity, Capital Resources and Borrowing
Liquidity
SEK’s policy for liquidity and borrowing risk requires that for all credit commitments — outstanding credits as well as agreed, but undisbursed credits — there must be borrowing available through maturity. For CIRR credits, which SEK manages on behalf of the Swedish State, when evaluating whether it has positive availability the company counts its credit facility with the Swedish National Debt Office as available borrowing, despite the fact that no funds have been drawn under this facility. As a consequence, SEK continues to have a high level of liquid assets and a low borrowing risk. The aggregate volume of funds and equity exceeded the aggregate volume of loans outstanding and loans committed during each future time period. Accordingly, SEK considers all loan commitments to be funded through maturity. See also the chart titled “Development Over Time of SEK’s Available Funds” in Note 29 to the Consolidated Financial Statements.
Contractual Commitments
The following table sets forth the maturity analysis of SEK’s debt and other obligations as of December 31, 2015. Repayments subject to notice for liabilities and hedging derivatives are treated as if notice were to be given immediately, whether it is SEK or the counterparty that has the right to demand early redemption. Assets with repayments subject to notice for assets are assumed to occur on the maturity date. The table below includes interest.
Maturity Profile of Financial Liabilities
At December 31, 2015
| | Cash flow due by Period | |
Skr million | | Total
Cash flow | | Less than
1 month | | 1-3 months | | 3-12 months | | 1-5 years | | After 5 years | |
Senior debt | | -259,800 | | -6,023 | | -22,144 | | -56,610 | | -128,725 | | -46,298 | |
Borrowing from credit institutions | | -5,248 | | -382 | | -4,866 | | — | | — | | — | |
Borrowing from the public | | -61 | | — | | — | | -61 | | — | | — | |
Senior securities issued | | -254,491 | | -5,641 | | -17,278 | | -56,549 | | -128,725 | | -46,298 | |
Derivatives | | -10,625 | | -95 | | -807 | | -2,772 | | -4,835 | | -2,116 | |
Subordinated securities issued (1) | | -2,088 | | — | | — | | — | | — | | -2,088 | |
Total | | -272,513 | | -6,118 | | -22,951 | | -59,382 | | -133,560 | | -50,502 | |
(1) Dated Subordinated Instrument which was issued in 2013 with the approval of the Swedish FSA (Nominal USD 250 million).
In addition to the financial liabilities summarized in the table above, SEK also has committed but still undisbursed loans outstanding. If a loan is accepted by the borrower it can be disbursed immediately. However, disbursements may be delayed due to a number of factors. In some cases, accepted loans may never be disbursed, including as a result of changes in the customer’s need for the funds. As of December 31, 2015 the aggregate amount of outstanding offers amounted to Skr 57 billion (year-end 2014: Skr 78 billion). Skr 48 billion (year-end 2014: Skr 75 billion) of outstanding loan offers derived from the S-system. During 2012, SEK changed its approach to providing offers. The revised method means that binding or non-binding offers are provided. Binding offers are reported as commitments. Skr 2 billion of outstanding offers consists of binding offers (year-end 2014: Skr 51 billion) and Skr 55 billion (year-end 2014: Skr 27 billion) consists of non-binding offers. Loan offers are not included in the table below.
34
Table of Contents
Loan Commitments Not Disbursed
The table below presents the period in which the undisbursed loans are expected to be disbursed.
At December 31, 2015
| | Amount of Loans | |
Skr mn | | Total | | Less Than
1 month | | 1-3
months | | 3-12
months | | 1-5 years | | After 5
years | |
Loan Commitments Not Disbursed | | 63,438 | | — | | 5,726 | | 12,001 | | 19,507 | | 26,204 | |
In addition to the instruments in the statement of financial position and committed undisbursed loans, SEK has outstanding binding offers of Skr 2.3 billion as well as additional available funds consisting of a credit facility with the Swedish National Debt Office of Skr 125 billion which can be used within the Swedish State’s export credit support system.
Maturity Profile of Financial Assets (Loans and Derivatives)
The following table sets forth the maturity analysis of loans and derivatives outstanding as of December 31, 2015.
At December 31, 2015
| | Cash flow due by Period | |
Skr million | | Total
Cash flow | | Less than
1 month | | 1-3 months | | 3-12 months | | 1-5 years | | After 5 years | |
Loans in the form of interest-bearing securities | | 52,295 | | 494 | | 1,520 | | 7,882 | | 27,389 | | 15,010 | |
Loans to credit institutions | | 31,015 | | 595 | | 14,493 | | 2,163 | | 7,414 | | 6,350 | |
Loans to the public | | 153,099 | | 3,672 | | 7,410 | | 23,958 | | 84,285 | | 33,774 | |
Loans | | 236,409 | | 4,761 | | 23,423 | | 34,003 | | 119,088 | | 55,134 | |
Derivatives | | 15,925 | | 408 | | 385 | | 1,426 | | 6,256 | | 7,450 | |
Total | | 252,334 | | 5,169 | | 23,808 | | 35,429 | | 125,344 | | 62,584 | |
Borrowing
SEK’s volume of new borrowing in 2015 amounted to the equivalent of approximately Skr 47.0 billion (2014: Skr 52.2 billion). Borrowing markets have been negatively impacted by several macroeconomic factors. In particular, the slowdown in China, the geopolitical situation in Russia and the Middle East, the collapse of oil prices and uncertainty regarding whether the US Federal Reserve would raise interest rates, and the pace of any further increases moving forward. USD cash flows from developing countries across the globe caused market turbulence, which had a negative impact on borrowing markets. SEK’s repurchase of own debt amounted to Skr 10.0 billion (2014: Skr 8.1 billion) and early redemption of borrowing totaled Skr 31.0 billion (2014: Skr 17.8 billion). The borrowing market has generally been highly liquid over the year. SEK’s borrowing over the course of the year took place in a total of 12 different currencies across a number of different geographic markets. Japan and North America were the largest borrowing markets in 2015, but SEK also undertook significant new borrowing in Europe outside the Nordic countries.
35
Table of Contents
Senior and Subordinated debt
The table below shows SEK´s senior and subordinated debt as of December 31, 2015.
| | As of December 31, | |
Skr mn | | 2015 | | 2014 | |
Senior debt | | 233,556 | | 282,192 | |
Subordinated debt | | 2,088 | | 1,945 | |
Total debt | | 235,644 | | 284,137 | |
of which reported at fair value | | 58,926 | | 82,262 | |
As of December 31, 2015, this debt consisted of bonds sold publicly or in private placements in various countries around the world pursuant to a number of different debt issuance programs. SEK has not undertaken any large, syndicated issuances to satisfy its liquidity needs since the borrowing needs have been met with bonds that are structured to meet the specific investment needs of individual investors or small groups of investors. Currently, SEK has the following borrowing programs in place:
As of December 31, 2015
Funding programs in millions | | Issued
Currency | | Value outstanding in
issued currency mn(1) | | Value outstanding in (Skr)(1) | |
Medium-term note programs: | | | | | | | |
Unlimited Euro Medium-Term Note Programme | | USD | | 14,037 | | 117,239 | |
Unlimited SEC-registered U.S. Medium-Term Note Program | | USD | | 11,888 | | 99,295 | |
Unlimited Swedish Medium-Term Note Program | | SKR | | 247 | | 247 | |
Skr 8,000,000,000 Swedish Medium-Term Note Program | | SKR | | 105 | | 105 | |
Unlimited MTN/STN AUD Debt Issuance Programme | | AUD | | 303 | | 1,842 | |
Commercial paper programs: | | | | | | | |
USD 3,000,000,000 U.S. Commercial Paper Program | | USD | | 400 | | 3,340 | |
USD 4,000,000,000 Euro-Commercial Paper Program | | USD | | 150 | | 1,251 | |
(1)Amortized cost excluding fair value adjustments
Debt Maturities
The following table illustrates our debt maturity profile for different types of senior and subordinated debt.
Repayments are assumed to occur on the maturity date and reflect nominal amounts.
Debt Maturities:
Skr million | | 2016 | | 2017 | | 2018 | | 2019 | | 2020 | | Thereafter | | Total | |
| | | | | | | | | | | | | | | |
Senior debt | | 61,870 | | 58,144 | | 32,672 | | 17,102 | | 22,074 | | 41,694 | | 233,556 | |
of which fixed-rate | | 29,096 | | 27,225 | | 30,726 | | 12,694 | | 13,249 | | 10,910 | | 123,900 | |
of which variable-rate | | 12,663 | | 25,522 | | 0 | | 1,187 | | 0 | | 908 | | 40,280 | |
of which formula-based | | 20,111 | | 5,397 | | 1,946 | | 3,221 | | 8,825 | | 29,876 | | 69,376 | |
| | 0 | | 0 | | 0 | | 0 | | 0 | | 0 | | 0 | |
Subordinated debt | | 0 | | 0 | | 0 | | 0 | | 0 | | 2,088 | | 2,088 | |
of which fixed rate | | 0 | | 0 | | 0 | | 0 | | 0 | | 2,088 | | 2,088 | |
of which variable rate | | 0 | | 0 | | 0 | | 0 | | 0 | | 0 | | 0 | |
Total debt | | 61,870 | | 58,144 | | 32,672 | | 17,102 | | 22,074 | | 43,782 | | 235,644 | |
36
Table of Contents
The following table illustrates our outstanding senior debt by category as of December 31, 2015.
Senior Debt by Category:
| | As of December 31, | |
Skr million | | 2015 | | 2014 | |
Fixed-rate(1) | | 123,900 | | 166,699 | |
Variable-rate (1) | | 40,280 | | 39,360 | |
Formula-based (1) | | 69,376 | | 76,133 | |
of which interest rate-linked | | 32,406 | | 29,238 | |
of which currency-linked | | 20,733 | | 30,682 | |
of which equity-linked | | 16,072 | | 15,326 | |
of which commodity-linked | | 141 | | 797 | |
of which credit-linked | | 24 | | 90 | |
Total senior debt | | 233,556 | | 282,192 | |
(1) As of December 31, 2015 the interest rate ranges for fixed-rate senior debt and variable-rate senior debt were 0 percent to 9 percent (2014: 0 percent to 17 percent) per annum and 0 percent to 1 percent (2014: 0 percent to 1 percent) per annum, respectively. The wide range of interest rates reflects the fact that the debt is issued in many different currencies and with different maturities. Due to the exceptionally low general interest levels in 2015 SEK has also experienced negative variable interest rates on its borrowing especially that denominated in Swiss Franc and Japanese Yen.
SEK’s economic hedges are expected to be effective in offsetting changes in fair values attributable to hedged risks. Certain assets and liabilities in such hedges require complex judgments regarding the most appropriate valuation models and assumptions. The gross values of certain assets and liabilities (primarily derivative and senior securities issued by SEK), which effectively hedge each other, are affected by this complexity. If different valuation models or assumptions were employed instead of those used in the valuations in this report, or if assumptions were changed, this could produce different results regarding the gross value of such securities issued and hedging derivatives. Changes in the fair value of derivatives will usually be offset by changes in fair value of securities issued, and the connected change in the fair value will thus not have a material effect on either results or equity except the impact on valuation of credit spreads on SEK’s own debt and basis spreads.
The outstanding volume of debt with remaining maturities of one year or less decreased somewhat during 2015. As of December 31, 2015, outstanding debt with remaining maturities of one year or less amounted to Skr 62 billion, compared with Skr 72 billion as of December 31, 2014.
C Trend Information
SEK’s future development is based on a number of factors, some of which are difficult to predict and generally beyond the company’s control. These factors include:
· Changes in general economic business conditions including changes in the competitive situation in one or more financial markets
· Changes and volatility in currency exchange-rates, interest rates and other market factors affecting the value of SEK’s assets and liabilities
· Changes in government policy and regulations, as well as in political and social conditions
· Natural disasters, political unrest or other events beyond our control may impact one or more financial markets or general business conditions
37
Table of Contents
For additional information on the trends affecting SEK and the risks it faces, see the discussions under “Business Volume” above and the “Risk Factors” in Item 3.
D Certain Off-Balance Sheet Arrangements
During 2015, SEK had a credit facility with the Swedish National Debt Office of Skr 80 billion (2014: Skr 80 billion). SEK has not yet utilized the credit facility. In December 2015, the Swedish parliament decided that the credit facility for 2016 should amount to Skr 125 billion. The credit facility is only available for loans covered by the State’s export credit support (CIRR).
ITEM 6. DIRECTORS, SENIOR MANGEMENT AND EMPLOYEES
The Board of Directors of the Parent Company (the “Board of Directors”) is responsible for the management of the Parent Company.
The Parent Company’s Articles of Association currently provide that the Board of Directors shall consist of six to eight directors. The State, as holder of all the shares, elects the directors. The Chairman of the Board of Directors is appointed at each Annual General Meeting. The Board of Directors may appoint a Vice Chairman of the Board of Directors.
The Board of Directors meets at least six times a year.
The members of the Board of Directors are elected at each Annual General Meeting to serve for the period until the end of the next Annual General Meeting. An Annual General Meeting is required to be held not later than June 30 of each year.
Certain information with respect to the Parent Company’s directors and executive officers is set forth below. Unless otherwise indicated, such information is given as of the date of this report.
38
Table of Contents
A Members of the Board of Directors
Board of Directors and Executive Officers
Name | | Age(1) | | Position(1) | |
Lars Linder-Aronson | | 62 | | Chairman of the Board and Director | |
Cecilia Ardström | | 50 | | Director | |
Jan Belfrage | | 71 | | Director | |
Susanne Lithander(2) | | 54 | | Director | |
Lotta Mellström | | 45 | | Director | |
Ulla Nilsson | | 68 | | Director | |
Jan Roxendal | | 62 | | Director | |
Teppo Tauriainen | | 54 | | Director | |
Catrin Fransson | | 53 | | Chief Executive Officer | |
Karl Johan Bernerfalk | | 43 | | General Counsel | |
Theresa Hamilton Burman(3) | | 53 | | Chief Credit Officer | |
Stefan Friberg(4) | | 47 | | Chief Risk Officer | |
Johan Henningsson | | 50 | | Head of Sustainability | |
Per Jedefors(5) | | 66 | | Chief Risk Officer | |
Jane Lundgren Ericsson | | 50 | | Head of Lending | |
Sirpa Rusanen | | 51 | | Head of Human Resources | |
Susanna Rystedt | | 51 | | Chief Administrative Officer | |
Edvard Unsgaard | | 41 | | Head of Communication | |
Per Åkerlind | | 53 | | Head of Treasury & Capital Management & Executive Vice President | |
(1) As of December 31, 2015
(2) From January 20, 2015
(3) From August 3, 2015
(4) From May 15, 2015
(5) Resigned April 30, 2015
All directors are elected at the Annual General Meeting for a term of one year, which expires at the next Annual General Meeting.
Mr. Linder-Aronson was appointed director in May 2011. He is the Chairman of the Board of Betson AB and director of Facility Labs AB and Morco Förvaltning AB. He has previously served as President of Enskilda Securities and Vice President of Skandinaviska Enskilda Banken.
Ms. Ardström was appointed director in May 2011. She currently holds the position of Chief Financial Officer and Head of Kapitalförvaltning Länsförsäkringar AB. She has served as a CIO and Head of Asset Management of Folksamgruppen. Head of Treasury of the Tele2 Group, director of Tryggstiftelsen, AP7 and for companies that are part of the Folksam Group and theTele2 group. She is also director of Humlegården Holding AB (I-III), Länsförsäkringar Fondförvaltning AB and Stiftelsen Länsbörsen.
Mr. Belfrage was appointed director in April 2010. He served in various executive capacities at Crédit Agricole, Citigroup Nordic Countries, Citigroup Sweden, AGA AB, and AB SKF.
39
Table of Contents
Mrs. Lithander, was appointed director in January, 2015. Mrs. Lithander is currently CFO at BillerudKorsnäs AB, having previously served as VP Finance, Projects at SCA Group, CEO at Mercuri International Group and as VP Head of Advisory Services at Ericsson, BU Global Services. Mrs. Lithander also serves as a director of Eltel AB.
Ms. Mellström was appointed director in May 2011. She has served as Senior Investment Manager and Special Adviser at the Swedish Ministry of Finance’s division for state-owned companies since 2001, and also serves as a director of Swedavia AB. Previously, she worked as a management consultant at Resco AB, controller at Sydkraft Försäljning AB (now E.ON Sverige), controller and acting CFO at Adranz Sweden AB (now Bombardier Transportation), project controller at ABB Network Partners AB and management trainee at ABB AB.
Ms. Nilsson was appointed director in July 2011. She has served in a number of senior positions with Skandinaviska Enskilda Banken AB, including as Global Head of SEB Futures in London, Chairman of Enskilda Futures Limited in London, Head of Fixed Income Trading in Sweden, Head of Trading and Capital Markets in Singapore and Head of Treasury in Luxembourg. Prior to joining SEB, Ms. Nilsson worked at Skånska Banken. Ms. Nilsson also serves as a director of Swedish Chamber International.
Mr. Roxendal was appointed director in 2007. He was then President of Gambro AB. Previously, he has served as President and Group Head of Intrum Justitia AB and as an executive vice president in the ABB Group and as Chief Executive Officer of ABB Financial Services. He is chairman of the board of mySafety Group AB, Swedish Export Credits Guarantee Board (EKN), Flexenclosure AB and Roxtra AB and a director of Catella AB.
Mr. Tauriainen was appointed director in October 2014. He is currently the Head of the Americas Department of the Swedish Ministry for Foreign Affairs, having previously served as the Ministry’s Head of the Department of International Trade. Mr. Tauriainen also served as the Swedish Ambassador to Singapore and Canada.
Executive Officers
Ms. Fransson has been Chief Executive Officer since April 2014. Prior to that she held several positions within Swedbank between 2000 and 2013; member of group executive committee (2004-2013), Head of Group Products (2013), Head of Retail Banking Sweden (2010-2012), Head of Customer Offerings & Products (2007-2010), Region Manager — Northern Region (2004-2007), CRM Manager (2000-2002), and several positions at Föreningssparbanken; Area Manager Stockholm (2003-2004) and various management positions (1997-2000).
Mr. Bernerfalk has been Executive Director, General Counsel since 2015. Previously he was Head of Legal Lending since 2007. Prior to that he served as legal counsel of SBAB and served as legal counsel (advokat) with leading Swedish law firms.
Ms. Hamilton Burman has been Chief Credit Officer since August 2015. Previously she held several positions within Swedbank e.g. Regional Credit Manager, Head of Corporate Banking, Head of Credit analysis. In addition she has been a director representing Swedbank in several of its subsidiaries such as Swedbank Financial Services AB, Swedbank Card Services AB and some partly owned saving banks and the credit bureau UC AB.
Mr. Friberg has been Executive Director, Chief Risk Officer since May 2015. Previously he held the position as Head of Group Risk Control at SEB from 2008. Prior to that he served as Head of Credit Portfolio Management, SEB from 2006. Prior to that he held various positions in Trading within SEB and Nordea, primarily in Derivatives Trading, since 1996.
Mr. Henningsson has been Executive Director, Head of Sustainability since January 2015 and has served as Head of Sustainability since 2010. Previously he was a Director at SEK Financial Advisors (2006-2009). Prior to that, he served, among other professions, as Head of Corporate Sales at ABN Amro Bank Stockholm Branch and Head of Treasury Management at N&G Financial Management.
Mr. Jedefors has been Executive Director, Chief Risk Officer since September 2, 2011. Prior to that, he held executive positions between 2000-2011 within the European Investment Bank’s Credit department and served as Director General of the bank’s Risk Management Directorate. Prior to the positions within the European Investment Bank, Mr. Jedefors served at the World Bank in Washington D.C as Program Manager for the support of the restructuring of the South Korean financial sector between 1999 and 2000, held various executive positions at Skandinaviska Enskilda Banken (SEB) between 1981-1999 and, prior to that, as a Senior Manager within McKinsey & Company in Stockholm and Copenhagen between 1977-1981. Mr Jedefors retired from his position as CRO on April 28, 2015.
40
Table of Contents
Ms. Lundgren Ericsson has been Executive Director, Head of Lending since January 2015. Prior to that she was Deputy Chief Operating Officer (2011-2014), Executive Director since April 2005 and served as Chief Executive Officer, AB SEK Securities (2002-2014). Previously she served as SEK’s Head of Legal and Transaction Management, beginning in 1993 and held the position for 7 years.
Ms. Rusanen has been Executive Director, Head of Human Resources since 2005. Prior to that, she served as Human Resource Manager at Ericsson, beginning in 1997.
Ms. Rystedt has been Executive Director, Chief Administrative Officer since March 2009. Prior to that, she served as Head of Business Development & IT at SEB Life beginning in 2005. From 2002 to 2005, she served as Head of IT at SEB Trygg Liv, and before that she served in other capacities at SEB Trygg Liv and Enskilda Securities and as a member of the Group Staff within the SEB Group, beginning in 1990.
Mr. Unsgaard has been Executive Director, Head of Communications since 2015 and has served as the Head of Communications since 2012. Prior to that Mr. Unsgaard served as press secretary for the Prime Minister Mr. Fredrik Reinfeldt (2006-2010). He has also been political correspondent for the Swedish Radio Ekot (2000-2006).
Mr. Åkerlind has been Head of Treasury & Capital Management and Executive Vice President, since 2015. Prior to that he served as Executive Director, Chief Operating Officer since January 2011. Prior to that he was Executive Director, CFO and Head of Capital Markets since June 2002. Prior to that he served as Executive Director, Treasurer and Head of Debt Capital Markets beginning in 1997. Prior to that he served in various capacities within the Debt Capital Markets group, beginning in 1990.
B Compensation of Directors and Officers
The aggregate remuneration of all directors and executive officers as a group paid or accrued in 2015 was Skr 23 million (2014 Skr 21 million; 2013: Skr 19 million), all of which was in the form of salaries in the case of executive officers, and in the case of directors consisted of fees. In addition, severance pay of Skr 8 million including pay roll taxes was reserved as of December 31, 2013. The employees of the Group, including its executive officers, are covered by various national social service programs to which the Group contributes. The Group also maintains a pension plan with an insurance company to which the Group contributed approximately Skr 6 million in 2015 (2014: Skr 6 million; 2013: Skr 6 million) on behalf of all executive officers as a group.
In 2015, the Chairman of the Board of Directors received Skr 0.6 million (2014: Skr 0.6 million; 2013: Skr 0.5 million; and each other director received between Skr 0.0 million and Skr 0.3 million (2014: Skr 0.0 million and Skr 0.3 million; 2013: between Skr 0.0 million and Skr 0.2 million) in remuneration. Since April 29, 2010, remuneration is not paid from the company to the representatives on the Board who are employed by the owner, the Swedish State.
The CEO’s Catrin Fransson remuneration and other benefits in 2015 totaled Skr 4.5 million (2014: Skr 3.2 million; 2013: Skr - million). The CEO did not receive any variable compensation. The CEO’s retirement age is 65.
The prior Chief Executive Officer’s Peter Yngwe left his position as of April 28, 2014 at the time of SEK´s Annual General Meeting in accordance with the Board of Director’s decision. Peter Yngwe received a severance pay in accordance with state guidelines for senior executives, corresponding to 18 months´ salary. Severance pay will be paid monthly and a deduction is made in the event of other income. The full cost, including payroll taxes, was expensed during 2013 and the provision amounted to Skr 8.4 million.
Remuneration to other executive officers of the Parent Company in 2015 totaled Skr 16.5 million (2014: Skr 14.5 million; 2013: Skr 13.6 million); of which Skr - million (2014: Skr — million; 2013: Skr - million) represented variable remuneration. Certain key executive officers of the Parent Company (including those listed above) have employment contracts providing for certain compensation during a period of, at the most, 18 months’ salary, in the event such contracts are terminated by the Parent Company, subject to deduction for any salary received in new employment. None of the directors have contracts with SEK providing for benefits upon termination of service.
41
Table of Contents
See also Note 5 to the Consolidated Financial Statements.
C Board Practices
Activities and Division of Responsibility within the Board of Directors
The Board of Directors establishes rules of procedure every year. The rules of procedure govern such matters as reporting to the Board of Directors, the frequency and form of Board meetings, and delegation and assessment of the work of the Board of Directors and the CEO. Besides the appointment of the CEO, the tasks of the Board of Directors are to draw up business plans and budgets, to make decisions on objectives and guidelines for the business, to make certain lending- and borrowing-related decisions, approve major investments and significant changes to the company organization, and to establish central policies and instructions. In addition to this, the Board monitors financial developments and has ultimate responsibility for internal control, compliance and risk management.
In addition, the Board is responsible for a well thought-out and firmly established policy and strategy for dealing with respect for the environment, social responsibility, human rights, corruption and equal opportunities and diversity.
The Chairman of the Board leads the work of the Board of Directors and is responsible for ensuring that the other members of the Board are provided with the necessary information.
When required, the Chairman of the Board participates in important meetings and represents the company in ownership matters. The tasks of the Chairman of the Board of Directors conform to applicable legislation and the rules of procedure of the Board of Directors. The Board performs an annual assessment of the performance by the Board itself and by the management. Auditors are invited to participate at meetings of the Board at least once a year. The auditors appointed by the annual general meeting have attended several of the Board’s meetings. The General Counsel has acted as secretary to the Board of Directors.
The Board has established a credit committee (the body that deals with credit-related matters), a finance and risk committee (the body that deals with other financial matters besides those relating to credits as well as risk issues), an audit committee (the body that deals with the company’s financial reporting, internal control, etc.) and a remuneration committee (the body that deals with certain remuneration matters). Besides the Board committees and the work for which the Chairman is responsible, work is not divided within the Board of Directors.
Appointing the Board of Directors and Auditors
The nomination procedure for Board members complies with the government’s owner policy and is conducted and coordinated by the Division for Corporate Governance and Analysis at the Swedish Ministry of Enterprise and Innovation. A working group analyzes the skills requirements based on the composition of the Board as well as the operations, status and future challenges of the company. Any recruitment needs are then established and the recruitment process initiated. The selection of Board members is derived from a broad recruitment base. SEK carries out a suitability assessment of Board members and senior executives pursuant to the regulatory framework issued by the European Banking Authority (EBA). The assessment of potential new Board members is based on the owner having identified the candidate in question according to a job specification. The owner is informed of the outcome following the assessment. When the procedure is complete, the nominations are disclosed publicly in accordance with the provisions of the Code.
In April 2015, Ernst & Young AB were appointed as external auditors, with Erik Åström as principally responsible auditor, by the Annual General Meeting for a period of one year.
42
Table of Contents
Review of Board Activities
The Board is responsible for the organization and the administration of SEK’s affairs. The Board must continually assess SEK’s financial position and ensure that SEK is structured in such a way that its accounting, management of funds and SEK’s other financial circumstances are governed by satisfactory controls. The Board adopts the operating targets and strategies for the operations and issues general internal regulations in policies and instructions. The Board ensures that an efficient system is in place to monitor and control SEK’s operations. In addition, the Board is tasked with appointing, and dismissing if necessary, the CEO and Chief Risk Officer and deciding on remuneration of these individuals and other members of executive management. The Board’s work following the rules of procedure adopted every year at the statutory Board meeting and the Board’s annual plan. The Board of Directors met on 15 occasions in 2015. The CEO attends all Board meetings except those addressing matters in which there is a conflict of interest, such as when evaluating the CEO’s work.
Policy documents | | Issued by |
The Board’s rules of Procedure | | The Board of Directors |
Authorization and Delegation Rules | | The Board of Directors |
Financial Reporting Instruction | | The Board of Directors |
Code of Conduct | | The Board of Directors |
Sustainable Business Policy | | The Board of Directors |
Policy on Combating Money Laundering and Terrorist Financing | | The Board of Directors |
Internal Governance and Control Policy | | The Board of Directors |
Risk Policy | | The Board of Directors |
Finance Policy | | The Board of Directors |
Credit Policy | | The Board of Directors |
Instruction for the CEO | | The Board of Directors |
Instruction for the Chief Risk Officer, CRO | | The Board of Directors |
Instruction for the Internal Audit function | | The Board of Directors |
Instruction for the Compliance function | | The Board of Directors |
Credit Instruction | | The Credit Committee |
Internal Risk Classification Methodology | | The Credit Committee |
Financing Strategy | | The Finance and Risk Committee |
Liquidity Strategy | | The Finance and Risk Committee |
43
Table of Contents
IN 2015 THE BOARD OF DIRECTORS DETERMINED OR DEALT WITH MATTERS
AS FOLLOWS:
Board work in 2015 |
| | | | | | |
January | | February | | March | | April |
| | | | | | |
· | | · Year-end report annual report · Annual reports from Internal audit and regulatory compliance · Review of 2014 Board evaluation · Review of SEK’s management of market risks. | | · Decision on divesting securitization portfolio · Internal capital adequacy assessment · Project decisions · Notice of Annual General Meeting · Appointment of new Chief Risk Officer | | · Statutory Board meeting · Interim report · Payment from Incentive system · Decision on salary and benefits for CEO and senior executives · Decision on extending existing leases |
| | | | | | |
May | | June | | July | | August |
| | | | | | |
· Strategy meeting · Decision on divesting Singapore office · Decisions on IT investments | | | | · Interim report · Financing of JAS Gripen | | |
| | | | | | |
September | | October | | November | | December |
| | | | | | |
· Adoption of training plan for the Board · Project decisions | | · Interim report · Decisions on recovery plan · Review of outcome of employee survey | | · Visit to customers in Gothenburg · Issue of several new and revised governing documents | | · Business plan · Notice of Extraordinary General Meeting on January 21, 2016 to decide the new capital target |
QUALITY ASSURANCE OF FINANCIAL REPORTING
The Board of Directors is responsible for ensuring that the company’s financial statements are prepared in accordance with legislation, applicable accounting standards and other requirements. The quality of the financial reporting is ensured, among other things, initially by the Audit Committee and then by the Board of Directors reading and submitting points of view for proposals on interim reports and annual reports prior to decisions by the Board. Board meetings address matters of material importance to financial reporting and, prior to each meeting, reports on financial performance are submitted to the Board following a standardized format. The Board and the company’s auditors communicate in a number of ways. At Board meetings that addressed the company’s financial reporting, the auditors participated in connection with the presentation of financial reports. The Board also receives summary audit reports. Each year, the Audit Committee reviews the audit plan and the result of the audit.
EVALUATION OF THE WORK OF THE BOARD OF DIRECTORS AND THE SENIOR EXECUTIVES
Ongoing assessments are conducted over the course of the fiscal year through dialogue between the Chairman and other members of the Board. In addition, a separate assessment of the Board and senior executive’s work is carried out once a year under the leadership of the Chairman. In 2015, this assessment was also carried out with external assistance, and the results of the assessment were reported to the Board and, by the Board’s Chairman, to the owner.. An evaluation is also performed by the owner in conjunction with the nomination of Board members.
THE BOARD COMMITTEES
The Board established the following committees. The Board’s rules of procedure include establishing annual instructions for all of its committees. The minutes from each committee are reported at Board meetings by the respective committee’s chairman. The members of each committee and their attendance at committee meetings are set out below.
CREDIT COMMITTEE
The Board established a Credit Committee to ensure the Board’s involvement in decision-making regarding credit risks. The Committee prepares matters relating to credits and credit decisions that are of fundamental or otherwise significant importance to the company, and also makes decisions regarding credits in accordance with the delegation rules determined by the Board. At the request of the Board, the Committee has issued a credit instruction under which decision-making powers regarding certain credits have been delegated to the company’s Credit Committee. The members of the Credit Committee since the statutory Board meeting on April 28, 2015 are: Jan Belfrage (Chairman), Ulla Nilsson, Jan Roxendal and Teppo Tauriainen.
44
Table of Contents
FINANCE AND RISK COMMITTEE
The Board has established a separate Finance and Risk Committee to ensure that the company can identify, measure, manage, report internally and have control over the risks to which it is or can be expected to be exposed. The Committee’s duties include preparing matters on behalf of the Board regarding general policies, strategies and risk appetite in all risk and capital-related issues, as well as regarding overall issues concerning the company’s financial operations. The Committee has the power to set limits for such risk and capital-related matters that the Board delegates to the Committee to determine, and to establish measurement methods and limits concerning market and liquidity risk, in addition to models for valuing financial instruments. The members of the Finance and Risk Committee since the statutory Board meeting on April 28, 2015 are: Cecilia Ardström (Chairman), Lars Linder-Aronson and Ulla Nilsson.
REMUNERATION COMMITTEE
The Remuneration Committee prepares matters relating to employment terms and conditions, salaries, pensions and other benefits for the CEO and the management, and general issues relating to salaries, pensions and other benefits. The Board of Directors has established a remuneration policy. The Remuneration Committee also formulates proposals on salaries for other individuals in management positions for whom the Board determines the terms of remuneration. Furthermore, the Committee evaluates compliance with the Annual General Meeting’s resolutions on remuneration and prepares matters regarding the employee incentive scheme. The members of the Remuneration Committee since the statutory Board meeting on April 28, 2015 are: Lars Linder-Aronson (Chairman), Susanne Lithander and Lotta Mellström.
AUDIT COMMITTEE
The Board has established an Audit Committee to address the Board’s quality assurance of the company’s financial reporting. The Committee’s duties include preparation of the Board’s work to assure the quality of the company’s financial reporting, staying informed about internal control compliance and regularly meeting the company’s auditor to keep informed about the focus and scope of the audit, as well as to discuss coordination between the external and the internal audits and the view of the company’s risks. The Committee formulates comprehensive instructions for the company’s auditing work. The members of the Audit Committee since the statutory Board meeting on April 28, 2015 are: Jan Roxendal (Chairman), Susanne Lithander and Lotta Mellström. Attendance frequency at meetings of the Board of Directors and its Committees in 2015.
| | Total | | Board of
Directors | | Remuneration
Committee | | Finance
and Risk
committee | | Credit
committee | | Audit
Committee | |
No. of meetings | | 53 | | 15 | | 8 | | 9 | | 14 | | 7 | |
Lars Linder-Aronson | | 36 | | 15 | | 8 | | 9 | | 4 | (1) | | |
Cecilia Ardström | | 26 | | 15 | | | | 9 | | | | 2 | (2) |
Jan Belfrage | | 27 | | 14 | | | | | | 13 | | | |
Susanne Lithander | | 16 | | 9 | | 5 | | | | | | 2 | (3) |
Lotta Mellström | | 30 | | 15 | | 8 | | | | | | 7 | |
Ulla Nilsson | | 35 | | 12 | | | | 9 | | 14 | | | |
Jan Roxendal | | 36 | | 14 | | | | 4 | (4) | 11 | | 7 | |
Teppo Tauriainen | | 25 | | 14 | | | | | | 11 | | | |
(1) Pertains to part of the year. Lars Linder-Aronson stepped down from the Credit Committee on April 28, 2015.
(2) Pertains to part of the year. Cecilia Ardström stepped down from the Audit Committeeon April 28, 2015.
(3) Pertains to part of the year. Susanne Lithander was elected a member of the Audit Committee on April 28, 2015.
(4) Pertains to part of the year. Jan Roxendal was elected a member of the Credit Committee and stepped down from the Finance and Risk Committee on April 28, 2015.
45
Table of Contents
D Employee Relations
During the course of 2015, the number of employees averaged 251 (2014: 243; 2013: 243), of whom 115 (2014: 111, 2013:112) were female and 136 (2014: 132; 2013: 131) were male. The total number of employees at year-end was 263 (year-end 2014: 241). The total number of employees is small in relation to the volume of lending because the number of lending transactions is relatively small and the administration and documentation of loans are in many cases handled by the banks participating in the transactions. The Group has not experienced any strikes or labor disputes and considers its employee relations to be strong.
Members of the Board of Directors, the CEO, and other executive officers have no share ownership in the Parent Company or Subsidiaries and no options have been granted to them with respect to the Parent Company’s shares. There are no arrangements for involving the employees in the capital of the Parent Company, including any arrangement that involves the issue or grant of options or shares or securities of the Parent Company.
ITEM 7. MAJOR SHAREHOLDERS AND RELATED PARTY TRANSACTIONS
A Major Shareholders
The total amount of shares is now 3,990,000. Since June 30, 2003, the Swedish State has been the sole (100%) owner of SEK. The State owns all of the shares.
The following table sets forth the share ownership of the Parent Company:
Shareholder | | | | Ownership % | | Number of shares | |
Kingdom of Sweden | | Appr. | | 100.00 | | 3,990,000 | |
Ownership and governance
SEK is owned by the Swedish State. The State exerts its influence at the Parent Company’s general meetings and through representation on the Board of Directors.
The governance of SEK is divided between the shareholder, the Board of Directors and the CEO, in accordance with the Swedish Companies Act, the Articles of Association, and the Board of Directors’ procedural rules. The Board of Directors appoints the CEO, who conducts ongoing management in accordance with the Board of Directors’ guidelines and instructions.
The State as shareholder has decided that State-owned companies should observe the Swedish Corporate Governance Code.
46
Table of Contents
B Transactions with related parties
SEK defines related parties for the Consolidated Group as:
· the shareholder, i.e. the Swedish State
· companies and organizations that are controlled through a common owner, the Swedish State
· key management personnel
· other related parties
The Swedish State owns 100 percent of the Parent Company’s share capital. By means of direct guarantees extended by the Swedish National Debt Office, and the Swedish Export Credits Guarantee Board, EKN, 36 percent of the Group’s outstanding loans as of December 31, 2015, were guaranteed by the State (year-end 2014: 39 percent). SEK administers, for compensation, the State’s export credit support system, and the State’s concessionary credit program (together referred to as the “S-system”). See Note 1(d) and Note 27 to the Consolidated Financial Statements.
In order to further enhance the ability of SEK to promote the Swedish export industry, on February 5, 2009, the government decided to provide SEK with access to a credit facility during 2009 amounting to Skr 100 billion via the Swedish National Debt Office, an action that was approved by the parliament .In 2010, the parliament authorized the government to sell government guarantees to SEK on market terms, for new borrowing during 2010 of up to Skr 250 billion. This was a prolongation of the decision made in 2009, in order to further enhance the ability of SEK to promote the Swedish export industry. In January 2011 and 2012, both the credit facility and the ability to purchase state guarantees were extended on the same terms for 2011 and 2012, respectively. In December 2012, the government decided to further extend the ability to purchase state guarantees and the credit facility during 2013 up to a maximum amount of Skr 100 billion. Of the total amount agreed for 2013 Skr 80 billion was intended for state supported loans (CIRR) and Skr 20 billion for commercial export financing.
In December 2013, the Swedish Parliament decided that the credit facility for 2014 would amount to Skr 80 billion and only be available for loans covered by the State’s export credit support (CIRR). The Swedish Parliament also reauthorized the government to enable SEK to purchase state guarantees on commercial terms for new borrowing of up to Skr 250 billion. In December 2014 the credit facility was prolonged on the same terms for 2015. The Swedish parliament also decided not to prolong the government’s previous authority to enable SEK to purchase state guarantees on commercial terms for new borrowing of up to Skr 250 billion. In December 2015 the credit facility were extended for 2016, though the facility amount has changed to Skr 125 billion. SEK has never utilized the credit facility or its previous ability to purchase state guarantees.
SEK enters into transactions in the ordinary course of business with entities that are partially or wholly owned or controlled by the State. SEK also extends export credits (in the form of direct or pass-through loans) to entities related to the State. Transactions with such parties are conducted on the same terms (including as to interest rates and repayment schedules) as transactions with unrelated parties.
Key management personnel include the following persons:
· The Board of Directors
· The Chief Executive Officer
· Other members in the Executive Committee
For information about remuneration and other benefits to key management personnel, see Note 5 to the Consolidated Financial Statements.
Other related parties include close family members of key management personnel as well as companies which are controlled by key management personnel or controlled by close family members to key management personnel.
See also Note 27 to the Consolidated Financial Statements for further details on related-party transactions.
47
Table of Contents
ITEM 8. FINANCIAL INFORMATION
A Consolidated Financial Statements and Other Financial Statements
See Item 18, “Financial Statements”.
Legal Proceedings
There is no material pending or, to the Group’s knowledge, threatened, legal or governmental proceedings to which the Group is or would be a party or to which any of its property is or would be subject.
Dividend Policy
The Board of Directors resolved on February 23, 2016, to propose at the Annual General Meeting to be held on April 26, 2016 that a dividend in the aggregate amount of Skr 356 million (or Skr 89,22 per share) be paid to the sole shareholder, the Swedish State, in relation to financial year 2015.
The Annual General Meeting held on April 28, 2015 decided that a dividend in the aggregate amount of Skr 378 million (or Skr 94.74 per share) was to be paid to the sole shareholder, the Swedish State, in relation to financial year 2014.
The Annual General Meeting held on April 28, 2014 decided that a dividend in the aggregate amount of Skr 327 million (or Skr 81.96 per share) was to be paid to the sole shareholder, the Swedish State, in relation to financial year 2013.
| | Inrelation to respective years | |
Skr mn | | 2015 | | 2014 | | 2013 | |
Dividend | | 356 | | 378 | | 327 | |
For additional details regarding equity, see the Consolidated Statement of Equity.
B Significant Changes
Except as otherwise disclosed in this report, there has been no significant change in our financial position since December 31, 2015.
ITEM 9. THE OFFER AND LISTING
A Nature of Trading Market
The Parent Company’s shares, all of which are owned by the State, are not listed on any exchange in Sweden or outside Sweden.
All issues of the SEK’s U.S. Medium-Term Notes listed on securities exchanges in the United States are set forth on the cover of this Report. Certain global issues of such notes are listed on European exchanges. In particular, the
5.125% Global Notes due March 1, 2017, is listed on the London Stock Exchange, while SEK’s
0.625% Global Notes due May 31, 2016,
2.125% Global Notes due July 13, 2016,
Floating Rate Global Notes due January 23, 2017,
1.750% Global Notes due May 30, 2017,
Floating Rate Global Notes due June 12, 2017
48
Table of Contents
Floating Rate Global Notes due September 28, 2017
Floating Rate Global Notes due November 10, 2017
1.125% Global Notes due April 5, 2018,
Floating Rate Global Notes due January 14, 2019
1.875% Global Notes due June 17, 2019,
1.875% Global Notes due June 23, 2020 and
1.750% Global Notes due August 28, 2020,
are listed on the Official List of the Irish Stock Exchange.
Other issues of SEK’s Medium Term Notes are traded in the over-the-counter market.
ITEM 10. ADDITIONAL INFORMATION
A The Share Capital
The share capital of the Parent Company shall be not less than Skr 1,500 million and not more than Skr 6,000 million. No shareholder is obliged to make additional capital contributions to the Parent Company solely as a result of it being a shareholder.
Shareholders’ rights may only be changed by a majority (and in certain cases a qualified majority) of the shares represented at a general meeting of the shareholders. However, all resolutions passed at a general meeting of the shareholders are subject to mandatory provisions of Swedish law (for practical purposes, primarily the Swedish Companies Act). In particular, there are rules protecting minority shareholders and there is a general principle that all shares and shareholders shall be treated equally.
Annual General Meeting
The Annual General Meeting is held once a year within six months after the end of the preceding fiscal year. Notices convening an Annual General Meeting or any other general meeting called to resolve upon any amendment of the Articles of Association, shall be issued not earlier than six weeks and not later than four weeks prior to the meeting. Notices convening a general meeting, in cases other than those set forth in the preceding sentence, shall be issued not earlier than six weeks and not later than three weeks prior to the meeting. Each person entitled to vote at an Annual General Meeting shall have the right to vote all the shares owned and represented by him. There are no restrictions on the rights of non-Swedish nationals to own shares or vote their shares at the Annual General Meeting.
Swedish law provides that, in matters other than elections, resolutions are passed by a simple majority of the votes cast, except that (among other exceptions):
· A resolution to amend the Articles of Association (except as described in the following paragraphs) requires a majority of at least two-thirds of the votes cast as well as at least two-thirds of the shares represented at the meeting;
· A resolution to amend the Articles of Association that reduces any existing shareholder’s rights to profits or other assets, restricts the transferability of issued shares or alters the legal relationship between issued shares, normally requires the unanimous approval of the shareholders present or represented at the meeting and representing at least nine-tenths of all shares issued; and
· A resolution to amend the Articles of Association for the purpose of limiting the number of shares which a shareholder may vote at an annual general meeting normally requires the approval of shareholders representing at least two-thirds of the votes cast and at least nine-tenths of the shares represented at the meeting.
In elections, the person receiving the most votes is deemed to have been elected.
49
Table of Contents
B Memorandum and Articles of Association
Set forth below is a brief summary of certain significant provisions of the Parent Company’s Articles of Association and Swedish law. This description does not purport to be complete and is qualified by reference to the Articles of Association, which are incorporated by reference, as an exhibit to this annual report.
Registration
The Parent Company’s registry number with the Swedish Company Registry (Sw. Bolagsregistret) of the Swedish Companies Registration Office (Sw. Bolagsverket) is 556084-0315.
Purpose
Under Article 3 of the Articles of Association, the Parent Company’s objective is to engage, on commercial grounds, in Swedish and international financing activities in accordance with the Banking and Financing Business Act (2004:297) in order to promote activities of Swedish interest, directly or indirectly related to Swedish export industry including Swedish infrastructure, and further to otherwise strengthen the internationalization and competitiveness of the Swedish industry. The Parent Company’s financing activities include, but are not limited to: (i) borrowing funds, for example by accepting deposits from the general public or issuing bonds or other comparable debt instruments, (ii) granting and intermediating loans, for example in the form of loans secured by charges over real property or claims, (iii) issuing guarantees and assuming similar obligations, (iv) holding of and conduct trading in securities, and (v) to engage in securities operations in accordance with the Swedish Securities Market Act (2007:528).
Certain Powers of Directors
Under the Swedish Companies Act (2005:551), the Board of Directors is ultimately responsible for the Parent Company’s organization and the management of its affairs.
A resolution of the Board of Directors requires the approval of a majority of the members of the Board. However, the Board of Directors may delegate the authority to borrow and lend funds on behalf of the Parent Company to the CEO or another employee, acting singly or jointly, provided that such financing transaction does not contravene any fundamental policy of the Parent Company and is not otherwise of great significance to the Parent Company. There are no legal requirements applicable to any member of the Board of Directors requiring the ownership of shares in the Parent Company, or requiring retirement at a certain age.
Although the Articles of Association do not address voting by directors on matters in which they are interested, under the Swedish Companies Act, a director may not take part in the Board of Directors’ deliberations with respect to any of the following:
1. Agreements between such director and the Parent Company;
2. Agreements between the Parent Company and third parties, where such director has a material interest in the matter that may conflict with the interests of the Parent Company; or
3. Agreements between the Parent Company and a legal entity that such director himself, or together with someone else, may represent.
Under the Swedish Companies Act, the Parent Company may not lend funds to shareholders or directors.
Under Swedish law, the CEO and at least half of the Board of Directors must be resident in a European Economic Area country unless exempted by the Swedish Companies Registration Office. Under Swedish law, a director’s term of office may not be more than four years, but the Parent Company’s Articles of Association require one-year terms. A director may, however, serve any number of consecutive terms. Directors elected at a general meeting of the shareholders may be removed from office at another general meeting of the shareholders, and vacancies on the Board, except when filled by a deputy director, may only be filled by a resolution of shareholders. Each year, if not otherwise stipulated in the Parent Company’s Articles of Association, one director is elected Chairman of the Board of Directors by resolution of the Board of Directors (unless elected by the shareholders) at the first meeting following his or her appointment.
50
Table of Contents
C Material Contracts
The Parent Company is a party to certain material contracts, as defined in the Instructions to Item 10c of Form 20-F. Such contracts are either filed with this annual report or incorporated by reference herein. Please see Item 19 herein.
D Exchange Controls and Other Limitations Affecting Security Holders
There are currently no Swedish exchange control laws or laws restricting the import or export of capital. No approvals are necessary under Swedish law to enable the Group at the times and in the manner provided in the Group’s debt securities and the indentures or other instruments pursuant to which such securities have been issued, to acquire and transfer out of Sweden all the amounts necessary to pay in full the principal of and/or interest on such securities, and any additional amounts payable with respect thereto, and no external approval would be required for any prepayment of such securities.
Under Swedish law and the Parent Company’s Articles of Association, there are no limitations on the right of non-resident or foreign owners to hold debt securities issued by the Parent Company.
E Swedish Taxation
The following summary outlines certain Swedish tax consequences relating to holders of SEK’s debt securities that are not considered to be Swedish residents for Swedish tax purposes, if not otherwise stated. The summary is based on the laws of the Kingdom of Sweden as currently in effect and is intended to provide general information only. The summary does not address inter alia situations where debt securities are held in an investment savings account (Sw. investeringssparkonto), the tax consequences in connection with any impairment of the debt securities, or the rules regarding reporting obligations for, among others, payers of interest. Investors should consult their professional tax advisors regarding the Swedish tax and other tax consequences (including the applicability and effect of tax treaties for the avoidance of double taxation) of acquiring, owning and disposing of debt securities in their particular circumstances.
Holders not tax resident in Sweden
Payments of any principal amount or any amount that is considered to be interest for Swedish tax purposes to the holder of any debt security should not be subject to Swedish income tax, provided that such a holder (i) is not resident in Sweden for Swedish tax purposes (ii) does not have a permanent establishment in Sweden to which the debt securities are effectively connected.
However, broadly speaking, provided that the value of or the return on the debt securities relates to securities taxed as shares, private individuals who have been residents of Sweden for tax purposes due to a habitual abode in Sweden or a stay in Sweden for six consecutive months at any time during the calendar year of disposal or redemption or the ten calendar years preceding the year of disposal or redemption are liable for capital gains taxation in Sweden upon disposal or redemption of such debt securities. In a number of cases though, the applicability of this rule is limited by the applicable tax treaty for the avoidance of double taxation.
Swedish withholding tax, or Swedish tax deduction, is not imposed on payments of any principal amount or any amount that is considered to be interest for Swedish tax purposes, except for certain payments of interest (and other returns on debt securities) to a private individual (or an estate of a deceased individual) who is resident in Sweden for Swedish tax purposes (see “Holders tax resident in Sweden” below).
51
Table of Contents
Holders tax resident in Sweden
In general, for Swedish corporations and private individuals (and estates of deceased individuals) with residence in Sweden for Swedish tax purposes, all capital income (for example income that is considered to be interest for Swedish tax purposes and capital gains on debt securities) will be taxable. Specific tax consequences may be applicable to certain categories of corporations, for example life insurance companies. Moreover, specific tax consequences may be applicable if, and to the extent that, a holder of debt securities realizes a capital loss on the debt securities and to any currency exchange gains or losses.
If amounts that are deemed as interest for Swedish tax purposes are paid by Euroclear Sweden AB or by another legal entity domiciled in Sweden, including a Swedish branch of a non-Swedish corporation, to a private individual (or an estate of a deceased individual) with residence in Sweden for Swedish tax purposes, Swedish preliminary taxes are normally withheld by Euroclear Sweden AB or the legal entity on such payments. Swedish preliminary taxes should normally also be withheld on other returns on debt securities (but not capital gains), if the return is paid out together with such a payment of interest referred to above.
F Documents on Display
The Parent Company files reports and other information with the SEC. For a fee, members of the public may request copies of these documents by writing to the SEC. Such documents may also be read and copied at the SEC’s public reference room in Washington, D.C.:
100 F Street, N. E.
Washington, D.C. 20549
Please call the SEC at 1-800-SEC-0330 for further information on its public reference rooms, including those in New York and Chicago. The Parent Company’s filings are also available on the SEC’s website at http://www.sec.gov.
G Supplemental Statistical Measure
In its Swedish corporate reports and in certain presentations to financial analysts, SEK discloses a supplemental statistical measure of its business performance, which we refer to in such reports and presentations as operating profit excluding net results of financial transactions , and which we refer to herein as “operating profit excluding net results of financial transactions”. This is not an IFRS financial measure, although it is calculated from our consolidated operating profit as calculated under IFRS. The supplemental statistical measure operating profit excluding net results of financial transactions is replacing the earlier used operating profit excluding unrealized changes in fair value. The management believes the new supplemental statistical measure is easier to understand for a user of our financial reports as it can be derived directly from the Consolidated Statement of Comprehensive Income, but more importantly it is a better indicator of the performance of SEK’s business in the long run as it also excludes realized gains or losses on financial assets and financial liabilities that are of a more occasional nature.
SEK’s management considers — and SEK believes that its sole shareholder, the Swedish State, considers — operating profit excluding net results of financial transactions to be a useful supplemental measure in evaluating the performance of SEK’s business over the long term, because it excludes net results of financial transactions that arises from changes in the fair value of financial assets, financial liabilities and related derivatives, regardless of the gains or losses are realized or unrealized.
Because operating profit excluding net results of financial transactions ignores such changes in fair value (which may significantly affect SEK’s performance as measured pursuant to IFRS), this relatively stable statistical measure is also used by SEK for internal performance reporting (in respect of business portfolios and individual managers), and for budgeting and forecasting purposes. Operating profit excluding net results of financial transactions is used as a key measure for internal earnings budgeting, because market volatility affects our IFRS operating profit significantly but affects our operating profit excluding net results of financial transactions only marginally. Operating profit excluding net results of financial transactions is the primary basis for calculating the amount of variable remuneration payable under the Group’s employee incentive scheme to all permanent employees with the exception of the CEO, other senior executives and employees working in risk- and compliance functions.
52
Table of Contents
While strongly cautioning that operating profit excluding net results of financial transactions should not be considered in isolation as a measure of SEK’s profitability and is not a substitute for the most directly comparable IFRS measure (which is operating profit), SEK believes that it is important to disclose its operating profit excluding net results of financial transactions in its reports filed with the SEC so as to communicate equivalent information to all of the Group’s investors worldwide, and so as to make investors aware of our management’s use of a non-IFRS measure in the steering and planning of our business. Please note, however, that SEK’s management generally considers the Group’s operating profit calculated in accordance with IFRS, alongside its operating profit excluding net results of financial transactions, in making important business decisions.
2015 compared to 2014.
Operating profit excluding net results of financial transactions amounted to Skr 1,135 million in the year ended December 31, 2015, an increase of 1 percent as compared to the year ended December 31, 2014 (when operating profit excluding net results of financial transactions in fair value amounted to Skr 1,123 million).
2014 compared to 2013.
Operating profit excluding net results of financial transactions amounted to Skr 1,123 million in the year ended December 31, 2014, an increase of 12 percent as compared to the year ended December 31, 2013 (when operating profit excluding net results of financial transactions in fair value amounted to Skr 1,000 million). Compared to the previous year, the increase in operating profit excluding net results of financial transactions was mainly attributable to reversals of previous reserves for credit losses.
Operating profit excluding net results of financial transactions
| | For the year ended December 31, | |
Skr mn | | 2015 | | 2014 | | 2013 | |
Operating profit | | 1,535 | | 1,629 | | 1,408 | |
| | | | | | | |
Net results of financial transactions | | 400 | | 506 | | 408 | |
| | | | | | | |
Operating profit excluding net results of financial transactions | | 1,135 | | 1,123 | | 1,000 | |
Changes in the fair values of financial assets available-for-sale and loans and receivables as well as other financial liabilities have been accounted for through profit and loss when such assets are subject to fair value hedge accounting in terms of changes in fair value related to the hedged risk. See Note 12 to the Consolidated Financial Statements for information on the portion of those assets or liabilities that are subject to fair value hedge accounting.
Operating profit excluding net results of financial transactions represents operating profit, calculated in accordance with IFRS, less changes in the fair values of financial assets, changes in the fair values of financial liabilities and related derivatives, as well as realized gains or losses that may arises if SEK repurchases own debt or if loan are prematurely dissolved and the related hedging instruments are closed. The main reason why we exclude changes in the fair values of derivatives related to our financial assets and liabilities in presenting operating profit excluding net results of financial transactions is because we believe it is useful to present a measure that values derivatives used for hedging purposes and the items that they are used to hedge on the same basis. As can be expected for any company engaged in international trade financing, SEK is an extensive user of derivatives, which we use only for the purpose of hedging financial risk (and not for trading or speculative purposes). Under IFRS, a derivative is always required to be carried at fair value on a company’s balance sheet while the underlying asset or liability that the derivative serves to hedge is, for one reason or another, required to be carried at amortized cost. There are practical reasons why hedge accounting or the fair-value option may be difficult to apply to the underlying asset or liability, which gives rise to the mixed measurement of derivatives and such underlying assets or liabilities. Therefore, we believe that operating profit excluding net results of financial transactions is a useful alternative statistical measure, in part because it helps us understand our business results under a consistent valuation methodology for derivatives and the underlying assets and liabilities they hedge.
53
Table of Contents
The reason why we exclude the changes in the fair values of our financial assets in calculating our operating profit excluding unrealized changes in fair value is that we have the ability and absolute intention to hold them to maturity, and thus believe it is useful to present a supplemental statistical measure that does not “mark-to-market” such assets. The reason why we exclude the changes in the fair values of financial liabilities from operating profit excluding net results of financial transactions is that we believe it is useful to present a measure that does not include adjustments in the value of such liabilities related to our own credit spread (under IFRS, a credit deterioration at SEK may produce an unrealized gain).
Operating profit excluding net results of financial transactions is a non-IFRS statistical measure and should not be relied upon for any purpose by investors or considered to constitute a substitute or replacement for any IFRS financial measure, including our operating profit.
ITEM 11. QUANTITATIVE AND QUALITATIVE DISCLOSURES ABOUT MARKET RISKS
All information about Quantitative and Qualitative Disclosures about Market Risks are included in Note 28 to the Consolidated Financial Statements.
ITEM 12. DESCRIPTION OF SECURITIES OTHER THAN EQUITY SECURITIES
Not applicable.
54
Table of Contents
PART II
ITEM 13. DEFAULTS, DIVIDEND ARREARAGES AND DELINQUENCIES
None.
ITEM 14. MATERIAL MODIFICATIONS TO THE RIGHTS OF SECURITY HOLDERS AND USE OF PROCEEDS
None.
55
Table of Contents
ITEM 15. CONTROLS AND PROCEDURES
A Disclosure Controls and Procedures
Management, including our Chief Executive Officer, Head of Treasury and Capital Management & Executive Vice President and Chief Administrative Officer have evaluated the effectiveness of our disclosure controls and procedures (as defined in Rule 13a-15(e) under the Exchange Act) as of December 31, 2015. The Group’s disclosure controls and procedures are designed to ensure that information required to be disclosed in the reports the Parent Company files or submits under the Exchange Act is recorded, processed, summarized and reported within the time periods specified in the applicable rules and forms, and that it is accumulated and communicated to the Parent Company’s management, including the Chief Executive Officer, Head of Treasury and Capital Management & Executive Vice President, Chief Administrative Officer, as appropriate to allow timely decisions regarding required disclosure.
Based upon that evaluation, management, including the Chief Executive Officer, Head of Treasury and Capital Management & Executive Vice Presidentand, Chief Administrative Officer concluded that the Group’s internal control over financial reporting described in Management’s Report on Internal Control over Financial Reporting below, and the Group’s disclosure controls and procedures were effective as of December 31, 2015.
B Management’s Report on Internal Control over Financial Reporting
Management, including our Chief Executive Officer, Head of Treasury and Capital Management & Executive Vice President and Chief Administrative Officer, is responsible for establishing and maintaining adequate internal control over financial reporting. Internal control over financial reporting is a process designed to provide reasonable assurance regarding the reliability of financial reporting and the preparation of its financial statements for external purposes in accordance with IFRS.
Internal control over financial reporting includes policies and procedures that (i) pertain to the maintenance of records that, in reasonable detail, accurately and fairly reflect the transactions and dispositions of the assets of the Group; (ii) provide reasonable assurance that transactions are recorded as necessary to permit the preparation of financial statements in accordance with IFRS; (iii) provide reasonable assurance that receipts and expenditures are being made only in accordance with the authorization of management and directors of the Group; and (iv) provide reasonable assurance regarding prevention or timely detection of unauthorized acquisition, use or disposition of the Group’s assets that could have a material effect on the financial statements.
Due to its inherent limitations, internal control over financial reporting may not prevent or detect misstatements. Also, projections of any evaluation of effectiveness of future periods are subject to the risk that controls may become inadequate because of changes in conditions, or that the degree of compliance with policies and procedures may deteriorate.
Management, including, Chief Executive Officer, Head of Treasury and Capital Management & Executive Vice President and Chief Administrative Officer assessed the effectiveness of our internal control over financial reporting as of December 31, 2015, based on criteria set forth in “Internal Control - Integrated Framework” issued in 2013 by the Committee of Sponsoring Organizations of the Tread way Commission, and using the information contained in the Interpretive Release No.33-8810, “Commission Guidance Regarding Management’s Report on Internal Control over Financial Reporting”, issued by the Securities and Exchange Commission. Management concluded that, as of December 31, 2015, our internal control over financial reporting was effective based on these criteria.
C Changes in Internal Control over Financial Reporting
There have been no changes in the Group’s internal control over financial reporting that occurred during the year ended December 31, 2015 that have materially affected, or are reasonably likely to materially affect, our internal control over financial reporting.
56
Table of Contents
ITEM 16A. AUDIT COMMITTEE FINANCIAL EXPERT
The Audit Committee of the Parent Company’s Board of Directors was established in January 2008. This committee, whose members are Jan Roxendal (Chairman), Susanne Lithander and Lotta Mellström, has a mandate to, among other things, supervise the Group’s financial reporting and review the work of its independent auditors. While the members of the Audit Committee have varying degrees of financial and accounting experience, the committee has not concluded that any of its members is an “audit committee financial expert” within the meaning of the regulations adopted under the Sarbanes-Oxley Act of 2002.
The Parent Company has not found it necessary to designate an audit committee financial expert because the Group is under the supervision of Finansinspektionen (the Swedish FSA). Accordingly, SEK believes that there is the opportunity for meaningful independent review of its financial statements by qualified experts (at the Swedish FSA), in addition to the independent review performed by the Parent Company’s external auditor.
ITEM 16B. CODE OF ETHICS
The Group has in place ethical guidelines that apply to all employees including all executive officers. The guidelines are consistent with, and also in some respects more restrictive than, applicable Swedish regulations. The ethical guidelines are designed to deter wrongdoing and promote:
· honest and ethical conduct, including the ethical handling of actual and apparent conflicts of interest between personal and professional relationships; and
· compliance with applicable governmental laws, rules and regulations.
Although these ethical guidelines do not meet the definition of “code of ethics” in the regulations adopted pursuant to the Sarbanes-Oxley Act of 2002, primarily because they do not specifically address matters relating to the Parent Company’s disclosure in reports and documents filed with the SEC and in other public communications, the Parent Company believes that its ethical guidelines are sufficient to regulate the conduct of SEK’s executive officers, including its principal executive officer, its principal financial officer and its principal accounting officer. The guidelines have also been specifically designed to comply with relevant Swedish regulations and guidelines (including the Swedish Governance Code), which is why SEK has not attempted to alter them to comply with the Sarbanes-Oxley Act of 2002.
The Code of ethics is available on our website, www.sek.se.
ITEM 16C. PRINCIPAL ACCOUNTANT FEES AND SERVICES
The following table sets forth, for the years ending December 31, 2015 and 2014, the fees billed from the Parent Company’s independent auditors, Ernst & Young for 2015 and 2014.
Skr mn | | 2015 | | 2014 | |
Ernst & Young | | | | | |
| | | | | |
Audit fee(1) | | 11 | | 12 | |
Audit related fee(2) | | 0 | | 0 | |
Tax related fee(3) | | 0 | | 0 | |
Total | | 11 | | 12 | |
57
Table of Contents
(1) Fees related to audit of annual financial statements, reviews of interim financial statements, attestation services that are provided in connection with statutory, regulatory and stock exchange filings or engagements and services provided in connection with issuances of debt.
(2) Fees charged for assurance and related services that are related to the performance of audit or review of the financial statements.
(3) Fees for professional services rendered by the principal independent auditors for tax compliance and tax advice.
In the financial statements remuneration to auditors is mainly included in Other administrative expenses.
See also Item 16G herein for information about corporate governance as it relates to the external auditors of the Parent Company.
ITEM 16D. EXEMPTION FROM THE LISTING STANDARDS FOR AUDIT COMMITTEES
Prior to 2008, the Board of Directors as a whole comprised the Parent Company’s audit committee for purposes of Rule 10A-3 under the Securities Exchange Act of 1934. In January 2008, the Board of Directors established a separate Audit Committee; which currently has three directors as members. See Item 6 “Directors, Senior Management and Employees — Board Practices — Committees — Audit Committee.” Each of the members of the Board of Directors, and thus the Audit Committee, is a representative or designee of the Swedish State. As its sole shareholder, the Swedish State is an affiliate of the Parent Company. However, no member of the Board of Directors is an Executive Officer of the Parent Company. Thus, although no member of the Board of Directors or the Audit Committee satisfies the non-affiliate requirement of the independence standard for audit committee members described in Rule 10A-3 (b) (1) (ii) (B) under the Securities Exchange Act of 1934, the Parent Company relies, as to each member of the Board of Directors and the Audit Committee, on the exemption from this requirement for foreign governmental representatives described in Rule 10A-3(b) (1) (iv) (E). The Parent Company does not believe that its reliance on the above exemption materially adversely affected the ability of the Audit Committee to act independently and to satisfy its duties.
ITEM 16E. PURCHASES OF EQUITY SECURITIES BY THE ISSUER AND AFFILIATED PURCHASERS.
None.
ITEM 16F. CHANGE IN REGISTRANT’S CERTIFYING ACCOUNTANT
Not applicable.
ITEM 16G. CORPORATE GOVERNANCE
As a result of the listing of certain of its debt securities on NYSE ARCA, SEK is subject to Rule 10A-3 under the Exchange Act. Rule 10A-3, with which SEK complies fully, sets out certain requirements with respect to the independence of audit committee members and with respect to audit committees’ duties, powers and responsibilities. Rule 10A-3 contains certain exemptions for foreign issuers, however, and SEK avails itself of certain of these exemptions. In particular: (i) as noted in Item 16D above, it relies on Section (b)(1)(iv)(E) of the Rule (applicable to audit committee members that are representatives or designees of a foreign government, which all of SEK’s audit committee members are) to satisfy the independence requirement set forth in Section (b)(1)(ii)(B) of the Rule; and (ii) it relies on the “Instructions” accompanying the Rule, which provide that, to the extent that a foreign issuer’s home-country legal requirements conflict with the prescriptions of the Rule concerning the duties, powers or responsibilities of audit committees (i.e., due to the assignment of such duties, powers or responsibilities to another corporate body under local law), it is sufficient to allocate to the audit committee advisory powers, or powers and/or responsibilities concerning the making of proposals to the relevant decision-making body. Regarding the foregoing, Section (b) (2) of the Rule states that an issuer’s audit committee should be directly responsible for the appointment, compensation, retention and oversight of external auditors. Under Swedish law, these powers are reserved to the Parent Company’s shareholder. Thus, the charter for SEK’s audit committee gives the committee an advisory role (to the shareholder) with respect to the aforesaid (but does not make the committee directly responsible).
58
Table of Contents
PART III
ITEM 17. FINANCIAL STATEMENTS
Not applicable.
ITEM 18. FINANCIAL STATEMENTS
The Group’s Consolidated Financial Statements prepared in accordance with Item 18 of Form 20-F begin on page F-1 of this annual report.
Consolidated Financial Statements
59
Table of Contents
ITEM 19. EXHIBITS
1.1 Articles of Association of the Registrant in effect as of the date of this annual report (filed as Exhibit 1.1 to the Company’s Annual Report on 20-F (No. 001-08382) for the year ended December 31, 2014 and incorporated herein by reference).
2.1 Indenture, dated as of August 15, 1991, between the Company and J.P. Morgan Trust Company, National Association (as successor in interest to the First National Bank of Chicago) as Trustee, providing for the issuance of debt securities, in one or more series, by the Company (filed as Exhibit 4(a) to the Company’s Report of Foreign Issuer on Form 6-K (No. 001-08382) dated September 30, 1991 and incorporated herein by reference).
2.2 First Supplemental Indenture dated as of June 2, 2004 between the Company and J.P. Morgan Trust Company, National Association (filed as Exhibit 4(b) to the Company’s Registration Statement on Form F-3 (No. 333-131369) dated January 30, 2006 and incorporated herein by reference).
2.3 Second Supplemental Indenture, dated as of January 30, 2006, between the Company and J.P. Morgan Trust Company, National Association (filed as Exhibit 4(c) to the Company’s Registration Statement on Form F-3 (No. 333-131369) dated January 30, 2006 and incorporated herein by reference).
2.4 Third Supplemental Indenture, dated as of October 23, 2008, relating to the Debt Securities (filed as Exhibit 4 to the Company’s Report of Foreign Issuer on Form 6-K dated October 23, 2008 (No. 001-08382) and incorporated herein by reference).
2.5 Fiscal Agency Agreement dated March 27, 2015 relating to an unlimited aggregate principal amount of debt securities authorized to be issued under the Company’s Program for the Continuous Issuance of Debt Instruments (filed herewith).
2.6 Deed of Covenant dated April 4, 2014 relating to an unlimited aggregate principal amount of securities of SEK authorized to be issued under the Company’s Program for the Continuous Issuance of Debt Instruments (filed as Exhibit 2.6 to the Company’s Annual Report on 20-F (No. 001-08382) for the year ended December 31, 2014, and incorporated herein by reference).
2.7 Fourth Supplemental Indenture, dated as of March 8, 2010, relating to the Debt Securities (filed as Exhibit 4(f) to the Company’s Post-Effective Amendment (No. 333-156118) to the Company’s Registration Statement on Form F-3, filed by the Company on March 10, 2010 and filed as Exhibit 2.8 to the Company’s Annual Report on Form 20-F (No. 001-08382) for the year ended December 31, 2009, filed by the Company on March 31, 2010 and incorporated herein by reference).
2.8 English-language summary of the Terms and Conditions dated 22 February 2012 relating to an unlimited principal amount of debt securities authorized to be issued under the Company´s Swedish MTN Programme (filed as Exhibit 2.9 to the Company’s Annual Report on Form 20-F (No.001-08382) for the year ended December 31, 2011, filed by the Company on March 19, 2012 and incorporated herein by reference).
2.9 ASX Austraclear Registry and IPA Services Agreement dated 14 October 2009 relating to an unlimited principal amount of debt securities authorized to be issued under the Company´s Australian Dollar Debt Issue Programme (filed as Exhibit 2.10 to the Company’s Annual Report on Form 20-F (No. 001-08382) for the year ended December 31, 2009, filed by the Company on March 31, 2010 and incorporated herein by reference).
2.10 Second Note Deed Poll dated 19 March, 2014 relating to an unlimited principal amount of debt securities authorized to be issued under the Company´s Australian Dollar Debt Issue Program (filed as Exhibit 2.11 to the Company’s Annual Report on Form 20-F (No. 001-08382) for the year ended December 31, 2009, filed by the Company on March 31, 2010 and incorporated herein by reference).
60
Table of Contents
7.1 Statement of Calculation of Ratios of Earnings to Fixed Charges (filed herewith).
8.1 List of Subsidiaries (filed herewith).
12.1 Certifications pursuant to Rule 13a-14(a) or Rule 15d-14(a) under the Securities Exchange Act of 1934 (filed herewith).
13.1 Certifications pursuant to 18 U.S.C. Section 1350, as adopted Pursuant to Section 906 of the Sarbanes-Oxley Act of 2002 (filed herewith).
14.1 Consent of Independent Registered Public Accounting Firm (filed herewith).
Pursuant to Instruction 2(b) (i) in the “Instructions as to Exhibits” in Form 20-F, various instruments defining the rights of holders of long-term debt securities issued by the Company are not being filed herewith because such debt securities are not registered with the Commission and the total amount of debt securities authorized under each such instrument does not exceed 10% of the total assets of the Company. The Company hereby agrees to furnish a copy of any such instrument to the Commission upon request.
61
Table of Contents
AB SVENSK EXPORTKREDIT (Swedish Export Credit Corporation)
Report of Independent Registered Public Accounting Firm
AB SVENSK EXPORTKREDIT (Swedish Export Credit Corporation)
To the Board of Directors and shareholder of
AB Svensk Exportkredit:
We have audited the accompanying consolidated statements of financial position of AB Svensk Exportkredit (Swedish Export Credit Corporation) (the “Company”) as of December 31, 2015 and 2014, and the related consolidated statements of comprehensive income, of changes in equity and cash flows for each of the three years in the period ended December 31, 2015. These consolidated financial statements are the responsibility of the Company’s management. Our responsibility is to express an opinion on these consolidated financial statements based on our audits.
We conducted our audits in accordance with the standards of the Public Company Accounting Oversight Board (United States). Those standards require that we plan and perform the audit to obtain reasonable assurance about whether the financial statements are free of material misstatement. We were not engaged to perform an audit of the Company’s internal controls over financial reporting. Our audits included consideration of internal control over financial reporting as a basis for designing audit procedures that are appropriate in the circumstances, but not for the purpose of expressing an opinion on the effectiveness of the Company’s internal control over financial reporting. Accordingly, we express no such opinion. An audit also includes examining, on a test basis, evidence supporting the amounts and disclosures in the financial statements, assessing the accounting principles used and significant estimates made by management and evaluating the overall financial statement presentation. We believe that our audits provide a reasonable basis for our opinion.
In our opinion, the financial statements referred to above present fairly, in all material respects, the consolidated financial position of AB Svensk Exportkredit at December 31, 2015 and 2014, and the consolidated results of its operations and its cash flows for each of the three years in the period ended December 31, 2015, in conformity with International Financial Reporting Standards as issued by the International Accounting Standards Board.
Ernst & Young AB
Stockholm, Sweden
February 26, 2016
F-1
Table of Contents
CONSOLIDATED STATEMENT OF COMPREHENSIVE INCOME
Skr mn | | Note | | 2015 | | 2014 | | 2013 | |
Interest revenues | | | | 2,835 | | 3,774 | | 4,158 | |
Interest expenses | | | | -1,173 | | -2,196 | | -2,603 | |
Net interest revenues | | 2 | | 1,662 | | 1,578 | | 1,555 | |
Net fee and commission expense | | 3 | | -6 | | -6 | | -5 | |
Net results of financial transactions | | 4 | | 400 | | 506 | | 408 | |
Total operating income | | | | 2,056 | | 2,078 | | 1,958 | |
Personnel expenses | | 5 | | -295 | | -313 | | -290 | |
Other administrative expenses | | 6 | | -164 | | -166 | | -185 | |
Depreciation and impairment of non-financial assets | | 7 | | -98 | | -43 | | -36 | |
Total operating expenses | | | | -557 | | -522 | | -511 | |
Operating profit before net credit losses | | | | 1,499 | | 1,556 | | 1,447 | |
Net credit losses | | 9 | | 36 | | 73 | | -39 | |
Operating profit | | | | 1,535 | | 1,629 | | 1,408 | |
Tax expenses | | 10 | | -348 | | -369 | | -318 | |
Net profit(1) | | | | 1,187 | | 1,260 | | 1,090 | |
| | | | | | | | | |
Other comprehensive income related to: | | | | | | | | | |
Items to be reclassified to profit or loss | | | | | | | | | |
Available-for-sale securities (2) | | | | -8 | | 26 | | 4 | |
Derivatives in cash-flow hedges (2) | | | | -217 | | 316 | | -407 | |
Tax on items to be reclassified to profit or loss | | 10 | | 49 | | -75 | | 89 | |
Net items to be reclassified to profit or loss | | | | -176 | | 267 | | -314 | |
Items not to be reclassified to profit or loss | | | | | | | | | |
Revaluation of defined benefit plans | | | | 49 | | -43 | | 60 | |
Tax on items not to be reclassified to profit or loss | | 10 | | -11 | | 10 | | -13 | |
Net items not to be reclassified to profit or loss | | | | 38 | | -33 | | 47 | |
Total other comprehensive income | | | | -138 | | 234 | | -267 | |
Total comprehensive income (1) | | | | 1,049 | | 1,494 | | 823 | |
Skr | | | | | | | | | |
Basic and diluted earnings per share(3) | | | | 297 | | 316 | | 273 | |
(1)The entire profit is attributable to the shareholder of the Parent Company.
(2)See the Consolidated Statement of changes in equity.
(3)The average number of shares in 2015 amounts to 3,990,000 (2014: 3,990,000, 2013: 3,990,000)
The accompanying notes are an integral part of these statements.
F-2
Table of Contents
CONSOLIDATED STATEMENTS OF FINANCIAL POSITION
Skr mn | | Note | | December 31, 2015 | | Decenber 31, 2014 | |
Assets | | | | | | | |
Cash and cash equivalents | | 11,12 | | 2,258 | | 7,099 | |
Treasuries/government bonds | | 11,12 | | 2,006 | | 3,458 | |
Other interest-bearing securities except loans | | 11,12 | | 40,831 | | 66,398 | |
Loans in the form of interest-bearing securities | | 11,12 | | 48,107 | | 53,140 | |
Loans to credit institutions | | 9,11,12 | | 29,776 | | 25,510 | |
Loans to the public | | 8,9,11,12 | | 140,806 | | 149,240 | |
Derivatives | | 14 | | 12,672 | | 16,017 | |
Property, plant, equipment and intangible assets | | 7 | | 129 | | 161 | |
Other assets | | 16 | | 1,854 | | 2,053 | |
Prepaid expenses and accrued revenues | | 17 | | 1,972 | | 2,090 | |
Total assets | | | | 280,411 | | 325,166 | |
| | | | | | | |
Liabilities and equity | | | | | | | |
Borrowing from credit institutions | | 12,18 | | 5,283 | | 8,290 | |
Borrowing from the public | | 12,18 | | 61 | | 63 | |
Senior securities issued | | 12,18 | | 228,212 | | 273,839 | |
Derivatives | | 14 | | 23,631 | | 18,886 | |
Other liabilities | | 19 | | 1,637 | | 3,054 | |
Accrued expenses and prepaid revenues | | 20 | | 1,912 | | 2,014 | |
Deferred tax liabilities | | 10 | | 720 | | 821 | |
Provisions | | 5,21 | | 39 | | 97 | |
Subordinated securities issued | | 12,22 | | 2,088 | | 1,945 | |
Total liabilities | | | | 263,583 | | 309,009 | |
| | | | | | | |
Share capital | | | | 3,990 | | 3,990 | |
Reserves | | | | 227 | | 403 | |
Retained earnings | | | | 12,611 | | 11,764 | |
Total equity | | 23 | | 16,828 | | 16,157 | |
| | | | | | | |
Total liabilities and equity | | | | 280,411 | | 325,166 | |
| | | | | | | |
Collateral provided etc. | | | | | | | |
Cash collateral under the security agreements for derivative contracts | | | | 13,592 | | 9,668 | |
Interest-bearing securities: | | | | | | | |
Subject to lending | | | | — | | 113 | |
| | | | | | | |
Contingent assets and liabilities | | | | | | | |
Guarantee commitments, credits | | | | 5 | | 8 | |
Guarantee commitments, other | | | | 4,076 | | 4,287 | |
| | | | | | | |
Commitments | | | | | | | |
Committed undisbursed loans | | | | 63,438 | | 16,028 | |
Other commitments | | | | — | | — | |
Binding offers | | | | 2,273 | | 50,896 | |
F-3
Table of Contents
CONSOLIDATED STATEMENT OF CHANGES IN EQUITY
| | | | | | Reserves | | | |
Skr mn | | Equity | | Share capital | | Hedge
reserve | | Fair value
reserve | | Retained earnings | |
Opening balance of equity 2013 | | 14,380 | | 3,990 | | 469 | | -19 | | 9,940 | |
Net profit for the year | | 1,090 | | | | | | | | 1,090 | |
Other comprehensive income related to: | | | | | | | | | | | |
Items to be reclassified to profit or loss | | | | | | | | | | | |
Available-for-sale securities | | 4 | | | | | | 4 | | | |
Derivatives in cash flow hedges | | -127 | | | | -127 | | | | | |
Reclassified to profit or loss | | -279 | | | | -279 | | | | | |
Tax on items to be reclassified to profit or loss | | 88 | | | | 89 | | -1 | | | |
Items not to be reclassified to profit or loss | | | | | | | | | | | |
Revaluation of defined benefit plans | | 60 | | | | | | | | 60 | |
Tax on items not to be reclassified to profit or loss | | -13 | | | | | | | | -13 | |
Total other comprehensive income | | -267 | | | | -317 | | 3 | | 47 | |
Total comprehensive income | | 823 | | | | -317 | | 3 | | 1,137 | |
Dividend | | -213 | | | | | | | | -213 | |
Closing balance of equity 2013(1) | | 14,990 | | 3,990 | | 152 | | -16 | | 10,864 | |
| | | | | | | | | | | |
Net profit for the year | | 1,260 | | | | | | | | 1,260 | |
Other comprehensive income related to: | | | | | | | | | | | |
Items to be reclassified to profit or loss | | | | | | | | | | | |
Available-for-sale securities | | 26 | | | | | | 26 | | | |
Derivatives in cash flow hedges | | 611 | | | | 611 | | | | | |
Reclassified to profit or loss | | -295 | | | | -295 | | | | | |
Tax on items to be reclassified to profit or loss | | -75 | | | | -70 | | -5 | | | |
Items not to be reclassified to profit or loss | | | | | | | | | | | |
Revaluation of defined benefit plans | | -43 | | | | | | | | -43 | |
Tax on items not to be reclassified to profit or loss | | 10 | | | | | | | | 10 | |
Total other comprehensive income | | 234 | | | | 246 | | 21 | | -33 | |
Total comprehensive income | | 1,494 | | | | 246 | | 21 | | 1,227 | |
Dividend | | -327 | | | | | | | | -327 | |
Closing balance of equity 2014(1),(2) | | 16,157 | | 3,990 | | 398 | | 5 | | 11,764 | |
| | | | | | | | | | | |
Net profit for the year | | 1,187 | | | | | | | | 1,187 | |
Other comprehensive income related to: | | | | | | | | | | | |
Items to be reclassified to profit or loss | | | | | | | | | | | |
Available-for-sale securities | | -8 | | | | | | -8 | | | |
Derivatives in cash flow hedges | | | | | | | | | | | |
Reclassified to profit or loss | | -217 | | | | -217 | | | | | |
Tax on items to be reclassified to profit or loss | | 49 | | | | 47 | | 2 | | | |
Items not to be reclassified to profit or loss | | | | | | | | | | | |
Revaluation of defined benefit plans | | 49 | | | | | | | | 49 | |
Tax on items not to be reclassified to profit or loss | | -11 | | | | | | | | -11 | |
Total other comprehensive income | | -138 | | | | -170 | | -6 | | 38 | |
Total comprehensive income | | 1,049 | | | | -170 | | -6 | | 1,225 | |
Dividend | | -378 | | | | | | | | -378 | |
Closing balance of equity 2015(1),(2) | | 16,828 | | 3,990 | | 228 | | -1 | | 12,611 | |
(1) The entire equity is attributable to the shareholder of the Parent Company.
(2) See Note 23 to the Consolidated Financial Statements.
F-4
Table of Contents
CONSOLIDATED STATEMENT OF CASH FLOWS
Skr mn | | 2015 | | 2014 | |
Operating activities | | | | | |
Operating profit (1) | | 1,535 | | 1,629 | |
Adjustments to convert operating profit to cash flow: | | | | | |
Provision for credit losses - net | | -36 | | -89 | |
Depreciation | | 98 | | 43 | |
Exchange rate differences | | 22 | | -5 | |
Unrealized changes in fair value | | -396 | | -57 | |
Other | | 18 | | 284 | |
Income tax paid | | -580 | | -308 | |
Total adjustments to convert operating profit to cash flow | | -874 | | -132 | |
Disbursements of loans | | -56,404 | | -57,495 | |
Repayments of loans | | 70,777 | | 65,171 | |
Net change in bonds and securities held | | 28,448 | | 10,576 | |
Derivatives relating to loans | | 469 | | 946 | |
Other changes — net | | 469 | | 29 | |
Cash flow from operating activities | | 44,420 | | 20,724 | |
Investing activities | | | | | |
Capital expenditures | | -66 | | -52 | |
Cash flow from investing activities | | -66 | | -52 | |
Financing activities | | | | | |
Proceeds from issuance of short-term senior debt | | 16,312 | | 12,929 | |
Proceeds from issuance of long-term senior debt | | 53,043 | | 52,387 | |
Repayments of debt | | -74,546 | | -67,688 | |
Repurchase and early redemption of own long-term debt | | -41,006 | | -25,833 | |
Derivatives relating to debts | | -2,540 | | 6,274 | |
Dividend paid | | -378 | | -327 | |
Cash flow from financing activities | | -49,115 | | -22,258 | |
Net cash flow for the year | | -4,761 | | -1,586 | |
Exchange rate differences on cash and cash equivalents | | -80 | | 348 | |
Cash and cash equivalents at beginning of the period | | 7,099 | | 8,337 | |
Cash and cash equivalents at end of the period (2) | | 2,258 | | 7,099 | |
of which cash at banks | | 294 | | 373 | |
of which cash equivalents | | 1,964 | | 6,726 | |
(1) Interest payments received and expenses paid
Interest payments received | | 2,990 | | 4,410 | |
Interest expenses paid | | 1,273 | | 2,609 | |
(2) Cash and cash equivalents include, in this context, cash at banks that can be immediately converted into cash and short-term deposits for which the time to maturity does not exceed three months from trade date. See Note 4.
F-5
Table of Contents
NOTES TO THE CONSOLIDATED FINANCIAL STATEMENTS
All amounts are in Skr million, unless otherwise indicated.
Introductory Note
REPORTING ENTITY
AB Svensk Exportkredit (“SEK” or “the Parent Company”) is a company domiciled in Sweden. The address of the company’s registered office is Klarabergsviadukten 61—63, P.O. Box 194, SE-101 23 Stockholm, Sweden. The Consolidated Group as of December 31, 2015 encompasses SEK and its wholly owned subsidiary Venantius AB, including the latter’s wholly owned subsidiary VF Finans AB (“the Subsidiaries”). These are together referred to as the “Consolidated Group” or “the Group”. The wholly owned subsidiary AB SEK Securities was merged into SEK on December 5, 2014. The merger resulted in SEK acquiring the assets and assuming the liabilities of AB SEK Securities. AB SEK Securities was licensed by the Swedish Financial Supervisory Authority to conduct securities trading. Its operations have been transferred to the Parent Company and SEK, has been licensed to conduct this type of business since June 12, 2014. Venantius AB is no longer engaged in any active business.
BASIS OF PRESENTATION
(i) Statement of compliance
SEK has applied International Financial Reporting Standards (IFRS) as issued by the International Accounting Standards Board (IASB). Additional standards, consistent with IFRS, are imposed by the Swedish Annual Accounts Act for Credit Institutions and Securities Companies (1995:1559) (ÅRKL), Recommendation RFR 1, Supplementary Accounting Principles for Groups, issued by the Swedish Financial Reporting Board (RFR) and the accounting regulations of the Financial Supervisory Authority (FFFS 2008:25), all of which have been complied with in preparing the consolidated financial statements, of which these notes form part. SEK also follows the Swedish Government’s general guidelines regarding external reporting in accordance with its corporate governance policy and guidelines for state-owned companies. The consolidated financial statements were approved for issuance by SEK’s Board of Directors (the Board of Directors) on February 23, 2016. The Group’s statements of comprehensive income and financial position are subject to the decision of SEK’s shareholder, at the annual general meeting to be held on April 26, 2016.
(ii) Basis of measurement
The consolidated financial statements have been prepared on a historical cost basis, except for the following;
· derivative financial instruments are measured at fair value,
· financial instruments at fair value through profit or loss are measured at fair value,
· available-for-sale financial assets are measured at fair value, and
· hedged items in fair-value hedges are recorded at amortized cost, adjusted for changes in fair value with regard to the hedged risks.
(iii) Functional and presentation currency
SEK has determined that the Swedish krona (Skr) is the functional currency of the Parent Company and the presentation currency of the Consolidated Group. This determination is based on several factors, the significant factors being that SEK’s equity is denominated in Swedish kronor, its performance is evaluated based on a result expressed in Swedish kronor, and that a large portion of expenses, especially personnel expenses, other expenses and its taxes, are denominated in Swedish kronor. SEK manages its foreign currency risk by hedging certain of the exposures between the Swedish kronor and other currencies.
(iv) Going concern
SEK’s Board of Directors and management have made an assessment of SEK’s ability to continue as a going concern and are satisfied that SEK has the resources to continue in business for the foreseeable future. Furthermore, the Board of Directors and management are not aware of any material uncertainties that may cast significant doubt upon SEK’s ability to continue as a going concern. Therefore, the financial statements continue to be prepared on a going-concern basis.
F-6
Table of Contents
Note 1. Significant accounting policies
The accounting policies set out below have been applied consistently to all periods presented in these consolidated financial statements, unless otherwise stated.
TABLE OF CONTENTS
(a) Changes to accounting policies and presentation, and new standards and interpretations yet to be adopted
The accounting policies, bases of calculation and presentation are unchanged compared with the 2014 Annual Report, except for a change in segment reporting. A new assessment of the company’s operating segments under IFRS 8 was carried out based in part on the changes implemented to increase organizational efficiency and in part on changes made to operational follow-up. SEK now has one segment, lending, and therefore, no segment reporting is presented. Previously, SEK reported under two segments: corporate lending and end-customer finance. In addition to the above changes, certain amounts reported in prior periods have been reclassified to conform to the current presentation. The following amendments published by the IASB entered force January 1, 2015, but have no material impact on SEK’s financial reporting:
Amendments to IAS 19 — Defined Benefit Plans: Employee Contributions:
IFRS — Annual Improvements cycle 2010-2012.
IFRS — Annual Improvements cycle 2011-2013.
The following new standards and changes in standards and interpretations not yet adopted are considered to be relevant to SEK:
IFRS 9 Financial Instruments. In 2014, IASB issued IFRS 9 which is replacing IAS 39 Financial Instruments: Recognition and Measurement. The standard includes requirements for recognition, classification and measurement, impairment, derecognition and general hedge accounting. New rules on the classification and measurement of financial assets reduce the number of valuation categories and instead focus on the company’s business model with respect to how its financial assets are used and whether contractual cash flows represent only nominal amounts and interest. The rules for financial liabilities are essentially unchanged compared with IAS 39. The largest change is that fair value movements due to the company´s own credit risk in financial liabilities that have been irrevocably designated at fair value should be recognized in other comprehensive income, rather than in profit or loss. IFRS 9 also introduces a credit loss model where expected losses are taken into account. The new model takes a three-stage approach based on whether significant changes in credit risk have occurred. The new general rules on hedge accounting allow entities to better reflect risk management activities in financial reports. SEK has begun the process of evaluating the potential effect of this standard, but has not yet determined any conclusions regarding its effects on SEK’s financial statements, capital adequacy or large exposures. At present, SEK has no intention of adopting the standard early. IFRS 9 is mandatorily effective from January 1, 2018, with early adoption permitted.
F-7
Table of Contents
IFRS 15 Revenue from Contracts with Customers. In 2014, IASB issued IFRS 15 which establishes the principles for reporting useful information on the nature, amount, timing and uncertainty of revenue and cash flows arising from a contract with a customer. The standard introduces a five-step model with recognition and measurement requirements and new disclosure requirements. The standard is not expected to have any material impact on SEK’s financial statements, capital adequacy or large exposures. The standard is applicable from January 1, 2018.
IFRS 16 — Leases. In January 2016, the IASB published the new accounting standard for leases; includes changes for lessees. All leases (with the exception of short-term leases and smaller leases) are to be recognized as right-of-use assets which are subject to depreciation and with liabilities appearing in the lessee’s balance sheet, and the lease payments are recognized as repayment and interest expense. Lessor accounting remains essentially unchanged. Further disclosures are also required. SEK’s preliminary assessment is that the standard will not have any material impact on SEK’s financial statements, capital adequacy or large exposures. The standard is effective from January 1, 2019.
There are no other IFRS or IFRS IC interpretations, or amendments, that are not yet applicable that would be expected to have a material impact on SEK’s financial statements, capital adequacy or large exposures.
The Swedish Annual Accounts Act for Credit Institutions and Securities Companies (ÅRKL) and Finansinspektionen (the Swedish F S A’s) regulations and general guidelines for annual reports in credit institutions and securities companies (FFFS 2008:25). The new EU directive regarding annual accounts and consolidated accounts has been implemented in ÅRKL and FFFS 2008:25. The changes have only minor impact on the disclosures in the annual accounts and interim reports. The new legislation and the amended regulations enter force January 1, 2016.
(b) Basis of consolidation
Subsidiaries are entities controlled by the Group. Control exists when the Group has the power to govern the financial and operating policies of an entity so as to obtain benefits from its activities. The consolidated financial statements have been prepared using the purchase method. The financial statements of subsidiaries are included in the consolidated financial statements from the date that control commences until the date that control ceases. The accounting policies of subsidiaries are consistent with Group policies. Intra-group transactions and balances, and any unrealized income and expenses arising from intra-group transactions, are eliminated in preparing the consolidated financial statements. The basis for consolidation under prudential regulations, such as the capital requirements under the Capital Requirements Regulation (CRR), does not differ from the basis for consolidation for accounting purposes. No subsidiary is an Institute under the definitions in the CRR; thus the prudential regulations do not apply to subsidiaries on an individual basis. No current or future material restrictions to prompt transfer of own funds or repayment of liabilities among the parent or its subsidiaries has been identified.
(c) Segment reporting
Segments are identified based on internal reporting to the Chief Executive Officer (CEO) who serves as the chief operating decision maker. SEK has one segment, lending, which under the company’s mission from its owner is tasked with ensuring access to financial solutions for the Swedish export industry on commercial and sustainable terms. Accordingly, no segment reporting has been prepared. Disclosures regarding the geographic breakdown and revenue per product group are presented in notes 2 and 3 to the Consolidated Financial Statements.
(d) Recognition of operating income and expenses
(i) Net interest revenue
Interest revenues and interest expenses related to all financial assets and liabilities, regardless of classification, are recognized in net interest income. The reporting of all interest income and interest expenses is made on a gross basis, with the exception of interest income and interest expenses related to derivative instruments, which are reported on a net basis. Interest for derivatives used to hedge borrowing, in hedge accounting or economic hedges, is presented as interest expense, regardless of whether the contracts’ net interest is positive or negative. Interest for derivatives used to hedge assets, in hedge accounting or economic hedges, is presented as interest income, regardless of whether the contracts’ net interest is positive or negative. Interest income and interest expenses are calculated and recognized based on the effective interest rate method or based on a method that results in interest income or interest expenses that are a reasonable approximation of the result that would be obtained using the effective interest method as the basis for the calculation. Charges considered as an integrated part of the effective interest rate for a financial instrument are included in the effective interest rate (usually fees received as compensation for risk). The effective interest rate is equivalent to the rate used to discount contractual future cash flows to the carrying amount of the financial asset or liability. In addition to interest revenue and interest expense, the stability fund fee and guarantee commissions that are comparable to interest are recognized in net interest revenue as an interest expense.
F-8
Table of Contents
The state-supported system (“S-system”). SEK’s net compensation for administrating the S-system is recognized as part of interest revenues in the statement of comprehensive income. SEK administers, in return for compensation, the Swedish State’s export credit support system, and the State’s related aid credit program (together referred to as the “S-system”). Pursuant to the instruction from the State, the State reimburses SEK for all interest differentials, financing costs and net foreign exchange losses under the S-system. SEK has determined that the S-system should be considered an assignment whereby SEK acts as an agent on behalf of the Swedish State, rather than being the principal in the individual transactions. This assessment has been made based on a number of factors, such as the following: (i) although it does in form, SEK does not in substance bear the risks and benefits associated with ownership; (ii) SEK does not have discretion in establishing prices; and (iii) SEK receives compensation in the form of a fixed commission. Accordingly, interest income, interest expense and other costs settled with the State are not accounted for in SEK’s statement of comprehensive income. The State’s settlements are made on a quarterly basis. Unrealized fair value changes on derivatives related to the S-system are presented net as a claim from the State under other assets. Assets and liabilities related to the S-system are included in the statement of financial position for the Consolidated Group as SEK bears the credit risk for the lending and acts as contractor for lending and borrowing.
(ii) Net fee and commission expense
Commissions earned and commissions incurred are presented as Net fee and commission expense in the consolidated statement of comprehensive income. The gross amount of commissions earned and commissions incurred are disclosed in the notes to the financial statements. The recognition of commission income depends on the purpose for which the fee is received. Fees are either recognized as revenue when services are provided or amortized over the period of a specific business transaction. Commissions incurred are transaction-based, and are recognized in the period in which the services are received. Guarantee commissions that are comparable to interest and fees that comprise integrated components of financial instruments, and therefore included in the effective interest rate, are not recognized as commission and are instead included under net interest revenue.
(iii) Net result of financial transactions
Net results of financial transactions include realized gains and losses related to all financial instruments and unrealized gains and losses related to all financial instruments carried at fair value in the statement of financial position, except when fair-value changes are recorded in other comprehensive income. Gains and losses comprise gains and losses related to currency exchange -rate effects, interest rate changes, changes in credit spreads on SEK’s own debt, changes in basis-spreads and changes in the creditworthiness of the counterparty to the financial contract. The item also includes market value changes attributable to hedged risks in fair-value hedges and inefficiency in cash-flow hedges. Realized gains and losses from financial instruments measured at amortized cost, such as interest rate compensation received and realized gains/losses from buy-back of issued own debt, is recognized directly under “Net results of financial transactions”.
(e) Foreign currency transactions
Monetary assets and liabilities in foreign currencies have been translated into the functional currency (Swedish krona) at the exchange-rates applicable on the last day of each relevant reporting period. Revenues and costs in foreign currencies are translated into Swedish kronor at the current exchange-rate as of the respective date of accrual. Any changes in the exchange-rates between the relevant currencies and the Swedish krona relating to the period between the date of accrual and the date of settlement are reported as currency exchange-rate effects. Currency exchange-rate effects are included as one component of “Net results of financial transactions”. Currency exchange-rate effects on the nominal amounts of financial assets and liabilities measured at fair value are recognized as currency exchange-rate effects, however, the change in fair value that arises due to other components is not separated.
(f) Financial instruments
(i) Recognition and derecognition in the statement of financial position
The recognition of financial instruments in, and their derecognition from, the statement of financial position is based on the trade dates for securities bought, as well as for securities issued and for derivatives. All other financial instruments are recognized and derecognized in the statement of financial position on their respective settlement date. The difference between the carrying amount of a financial liability or an asset (or part of a financial liability or an asset) that is extinguished or transferred to another party and the consideration paid is recognized in the statement of total income as one component of “Net results of financial transactions”.
F-9
Table of Contents
(ii) Measurement on initial recognition
When financial instruments are initially recognized, they are measured at fair value plus, in the case of a financial assets or financial liabilities not carried at fair value through profit or loss, transaction costs that are directly attributable to the acquisition or issuance of the financial asset or financial liability.
(iii) Offsetting
Financial assets and liabilities are offset and presented in the statement of financial position when the Group has a legal right to offset the amounts and intends either to settle on a net basis or to realize the asset and settle the liability simultaneously. Refer to Note 14 to the Consolidated Financial Statements for further information about the offsetting of financial assets and financial liabilities
(iv) Classification of financial assets and liabilities
Financial assets are categorized into three categories for valuation purposes: loans and receivables, financial assets at fair value through profit or loss and available-for-sale financial assets. Financial liabilities are categorized into two categories for valuation purposes: financial liabilities at fair value through profit or loss and other financial liabilities.
Loans and receivables.
This category is used for loans and loans in the form of interest bearing securities that are not listed in an active market. Transactions in the category of loans and receivables are measured at amortized cost, using the effective interest rate method. The balance sheet items: Cash and cash equivalents, Loans to credit institutions, Loans to the public and the greater part of Loans in the form of interest bearing securities are included in this category. When one, or multiple, derivatives are used to hedge a currency and/or interest rate exposure relating to a loan or receivable, fair-value hedge accounting is applied. Furthermore, cash flow hedge accounting can be applied for certain transactions classified as loans and receivables, such as when SEK wishes to hedge against variability in the cash flow from these assets.
Financial assets at fair value through profit or loss. There are two main subcategories in the category of financial assets at fair value through profit or loss: financial assets designated upon initial recognition at fair value through profit or loss; and assets held-for-trading. Where two or more derivatives hedge both interest rate and credit exposures in a financial asset, such transactions may be classified irrevocably as a financial asset at fair value through profit or loss. Making such designations eliminates or significantly reduces an accounting mismatch that would otherwise arise from measuring assets or liabilities or recognizing the gains or losses on them on different bases. Derivatives are always classified as financial assets or liabilities at fair value through profit or loss, except when they are subject to hedge accounting. No assets were classified as held-for-trading other than derivatives held for economic hedging in accordance with IAS39.
Available-for-sale financial assets. Assets that are classified as available-for-sale securities are carried at fair value, with changes in fair value recognized in other comprehensive income. If assets are sold, changes in fair value are transferred from other comprehensive income to profit or loss.
Financial liabilities at fair value through profit or loss. There are two main subcategories in the category of financial liabilities at fair value through profit or loss: financial liabilities designated upon initial recognition at fair value through profit or loss; and liabilities held-for-trading. Senior securities issued by SEK containing embedded derivatives are in their entirety irrevocably classified as financial liabilities at fair value through profit or loss. Derivatives are always classified as financial assets or liabilities at fair value through profit or loss, except when they are subject to hedge accounting. No liabilities were classified as held-for-trading other than derivatives held for economic hedging in accordance with IAS39.
Other financial liabilities. All senior securities issued by SEK other than those classified as financial liabilities at fair value through profit or loss are classified as other financial liabilities and measured at amortized cost, using the effective interest rate method. Where one or more derivative is hedging currency, interest rate, and/or other exposures, fair-value hedge accounting is applied. Subordinated debt is classified within other financial liabilities and is subject to fair-value hedge accounting. When applying fair-value hedge accounting on subordinated debt, hedging of the subordinated debt is made for the time period corresponding to the derivative’s time to maturity when the maturities do not coincide.
(v) Presentation of certain financial instruments in the statement of financial position
The presentation of financial instruments in the statement of financial position differs in certain respects from the categorization of financial instruments made for valuation purposes. Loans in the form of interest-bearing securities comprise loans granted to customers that are contractually documented in the form of interest-bearing securities, as opposed
F-10
Table of Contents
to bilateral loan agreements, which are classified in the statement of financial position either as loans to credit institutions or loans to the public. All other financial assets, which are not classified in the statement of financial position as loans in the form of interest-bearing securities, are classified as either cash and cash equivalents, treasuries/government bonds or other interest-bearing securities except loans.
(vi) Presentation of certain financial instruments
Derivatives. In the ordinary course of its business, SEK uses, and is a party to, different types of derivatives for the purpose of hedging or eliminating SEK’s interest-rate, currency-exchange-rate and other exposures. Derivatives are always classified as financial assets or liabilities at fair value through profit or loss, except in connection with hedge accounting. Where SEK decides to categorize a financial asset or liability at fair value through profit or loss, the purpose is always to avoid the mismatch that would otherwise arise from the fact that the changes in the value of the derivative, measured at fair value, would not match the changes in value of the underlying asset or liability, measured at amortized cost.
Guarantees. SEK is holder of financial guarantee contracts in connection with certain loans. Such guarantees are ordinarily accounted for as guarantees in accordance with SEK’s established accounting policy and therefore are not recorded in the statement of financial position (except for the deferred costs of related guarantee fees paid in advance for future periods). In limited situations, the relevant risk-mitigating instruments do not fulfill the requirements to be considered guarantees and are therefore recorded as derivatives and valued at fair value through profit or loss. When SEK classifies a risk-mitigating instrument as a financial guarantee, SEK always owns the specific asset whose risk the financial guarantee mitigates and the potential amount that SEK can receive from the counterparty under the guarantee represents only the actual loss incurred by SEK related to its holding. Premiums on financial guarantees are allocated over the period and recognized as an interest expense in net interest revenue.
Embedded derivatives. In the ordinary course of its business, SEK issues or acquires financial assets or financial liabilities that contain embedded derivatives. When financial assets or liabilities contain embedded derivatives, where the financial characteristics and risks of the instrument’s unique components are not related, the entire instrument is irrevocably classified as financial assets or financial liabilities measured at fair value through profit or loss, and thus does not separate the embedded derivatives.
Leasing assets. SEK, in the ordinary course of its business, acquires leases which are classified as finance leases (as opposed to operating leases). When making such a classification, all aspects of the leasing contract, including third-party guarantees, are taken into account. Financial leases are reported as receivables from the lessees in the category of loans and receivables. Any lease payment that is received from a lessee is divided into two components for the purposes of measurement; one component constituting an amortization of the loan and the other component recorded as interest revenues.
Committed undisbursed loans and binding offers. Committed undisbursed loans and binding offers, disclosed under the heading Commitments below the statement of financial position, are measured as the undiscounted future cash flow concerning loan disbursements related to loans committed but not yet disbursed at the period end date, as well as binding offers.
Repurchase agreements and securities lending. Repurchase agreements are reported as financial transactions in the statement of financial position. Securities or other assets sold subject to repurchase agreements and securities or other assets lent to other parties are reported under the heading Collateral provided below the statement of financial position. Cash received from the relevant counterparties is recognized in the statement of financial position as borrowing. Cash advanced to the counterparties is recognized in the statement of financial position under “loans to credit institutions” or “loans to the public”.
Reacquired debt. SEK reacquires its own debt instruments from time to time. Gains or losses that SEK realizes when reacquiring own debt instruments are accounted for in the statement of comprehensive income as one component of Net results of financial transactions.
(vii) Hedge accounting
SEK applies hedge accounting in cases where derivatives are used to create economic hedging and the hedge relationship is eligible for hedge accounting. The method used for hedge accounting is either fair-value hedge accounting or cash flow hedge accounting. In order to be able to apply hedge accounting, the hedging relationships must be highly effective in offsetting changes in fair values attributable to the hedged risks, both at inception of the hedge and on an ongoing basis. If the hedge efficiency does not fall within established boundaries, the hedge relationship is ended.
F-11
Table of Contents
Fair-value hedge accounting. Fair-value hedge accounting is used for transactions in which one or several derivatives hedge interest rate risk that has arisen from a fixed-rate financial asset or liability. When applying fair-value hedging, the hedged item is revalued at fair value with regard to the risk being hedged. SEK defines the risk being hedged in fair-value hedge accounting as the risk of a change in fair value with regard to a chosen reference rate (referred to as interest rate risk). The hedging instrument may consist of one or several derivatives exchanging fixed interest for floating interest in the same currency (interest rate derivatives) or one or several instruments exchanging fixed interest in one currency for floating interest in another currency (interest and currency derivatives) in which case the currency risk is a part of the fair value hedge.
If a fair-value hedge relationship no longer fulfills the requirements for hedge accounting, the hedged item ceases to be measured at fair value with regard to the risk being hedged and is measured at amortized cost, and the previously recorded fair-value changes for the hedged item are amortized over the remaining maturity of the previously hedged item.
Cash flow hedge accounting. Cash flow hedge accounting is used for transactions in which one or several derivatives hedge risk for variability in the cash flows from a floating-rate financial asset or liability. When hedging cash flows, the hedged asset or liability is measured at amortized cost and changes in fair value in the hedging instrument are reported in other comprehensive income. When the hedged cash flow is reported in operating profit, the fair-value changes in the hedging instrument are reclassified from other comprehensive income to operating profit. SEK defines the risk hedged in a cash flow hedge as the risk of variability of cash flows with regard to a chosen reference rate (referred to as cash flow risk). The hedging instrument may consist of one or several derivatives exchanging floating interest for fixed interest in the same currency (interest rate derivatives) or one or several instruments exchanging floating interest in one currency for fixed interest in another currency (interest and currency derivatives).
If a cash flow hedge relationship no longer fulfills the requirements for hedge accounting, the hedging instrument is sold, or if the designation is revoked and accumulated gains or losses related to the hedge have been recorded in equity, such gains or losses remain in equity and are amortized through other comprehensive to profit over the remaining maturity of the previously hedged item.
(viii) Principles for determination of fair value of financial instruments
The best evidence of fair value is quoted prices in an active market.
Fair-value measurements are categorized using a fair-value hierarchy. The financial instruments carried at fair value in the statement of financial position have been categorized under the three levels of the fair-value hierarchy according to IFRS that reflect the significance of inputs. The categorization of these instruments is based on the lowest level input that is significant to the fair-value measurement in its entirety.
SEK uses the following hierarchy for determining and disclosing the fair value of financial instruments, based on valuation techniques:
Level 1: quoted (unadjusted) prices in active markets for identical assets or liabilities;
Level 2: valuation models for which all inputs with a significant effect on the recorded fair value are observable, either directly or indirectly; and
Level 3: techniques that use inputs with a significant effect on the recorded fair value that are not based on observable market data.
SEK recognizes transfers between levels of the fair value hierarchy in the beginning of the reporting period in which the change has occurred.
For all classes of financial instruments (assets and liabilities), fair value is established by using internally established valuation models, externally established valuation models and quotations furnished by external parties. If the market for a financial instrument is not active, fair value is established by using a valuation technique. The objective of using a valuation technique is to establish what the transaction price would have been at the measurement date in an arm’s length exchange based on normal business terms and conditions. Valuation techniques include using recent arm’s length market transactions between knowledgeable, willing parties, if available, reference to the current fair value of another instrument that is substantially the same, discounted cash flow analysis and option pricing models. Periodically, the valuation techniques are calibrated and tested for validity using prices from observable current market transactions in the same instruments or based on any available observable market data.
In calculating fair value, SEK seeks to use observable market quotes (market data) to best reflect the market’s view on prices. These market quotes are used, directly or indirectly, in quantitative models for the calculation of fair value.
F-12
Table of Contents
Examples of the indirect use of market data are:
· the derivation of discount curves from observable market data, which is interpolated to calculate the non-observable data points, and
· quantitative models, which are used to calculate the fair value of a financial instrument, where the model is calibrated so that available market data can be used to recreate observable market prices on similar instruments.
In some cases, due to low liquidity in the market, there is no access to observable market data. In these cases, SEK follows market practice by basing its valuations on:
· historically observed market data. One example is when there are no observable market data as of that day’s date, the previous day’s market data is used in the valuation,
· similar observable market data. One example is if there are no observable market prices for a bond it can be valued through a credit curve based on observable prices on instruments with the same credit risk.
For observable market data, SEK uses third-party information based on purchased contracts (such as Reuters and Bloomberg). This type of information can be divided into two groups, with the first group consisting of directly observable prices and the second of market data calculated from the observed prices.
Examples from the first group are — for various currencies and maturities — currency rates, stock prices, share index levels, swap prices, future prices, basis spreads and bond prices. The discount curves that SEK uses, which are a cornerstone of valuation at fair value, are constructed from observable market data.
Examples from the second group are the standard forms of quotes, such as call options in the foreign exchange market quoted through volatility which is calculated so that the “Black-Scholes model” recreates observable prices. Further examples from this group are — for various currencies and maturities — currency volatility, swap volatility, cap/floor volatilities, stock volatility, dividend schedules for equity and credit default swap spreads. SEK continuously ensures the high quality of market data, and a thorough validation of market data is exercised quarterly in connection with the financial reporting.
For transactions that cannot be valued based on observable market data, the use of non-observable market data is necessary. Examples of non-observable market data are discount curves created using observable market data that are extrapolated to calculate non-observable interest rates, correlations between different underlying market parameters and volatilities at long maturities. Correlations that are non-observable market data are calculated from time-series of observable market data. When extrapolated market data such as interest rates are used they are calculated by setting the last observable node as a constant for longer maturities. Non-observable market data such as SEK’s own creditworthiness are assessed by recent SEK’s issuances of securities, or if no continuous flow of new transactions exist, spreads against other similar issuers, in those cases in which observable prices in the secondary market are unavailable.
The valuation models applied by SEK comply with accepted methods for pricing financial instruments. Fair value adjustments are applied by SEK when there are additional factors that market participants take into account and that are not captured by the valuation model. Management assesses the level of fair value adjustments to reflect counterparty risk, SEK’s own creditworthiness and non-observable parameters, where relevant.
New models involving significant change from the previously approved models must be authorized by the Board’s Finance and Risk Committee. In addition, all models for the valuation of financial instruments must receive annual approval from the Board’s Finance and Risk Committee. The use of a valuation model demands a validation and thereafter an approval. The validation is conducted by Risk Control to ensure an independent control. Analysis of significant non observable market data, fair value adjustments and significant changes in fair values of level-3-instruments are reviewed on quarterly basis by plausibility checks. The valuation result is analyzed and approved by persons responsible for valuation and accounting, and discussed with the Audit Committee quarterly in connection with SEK’s interim reports.
(ix) Determination of fair value of certain types of financial instruments
Derivative instruments. Derivative instruments are carried at fair value, and fair value is calculated based upon internally established valuations, external valuation models, quotations furnished by external parties or market quotations. When calculating fair value for derivative instruments, the impact on the fair value of the instrument related to credit risk (own or counterparty) is based on publicly quoted prices on credit default swaps of the counterparty or SEK, if such prices are available.
F-13
Table of Contents
Issued debt instruments. When calculating the fair value of issued debt instruments, the effect on the fair value of SEK’s own credit risk is assessed based on internally established models founded on observations from different markets. The models used include both observable and non-observable parameters for valuation.
Issued debt instruments that are hybrid instruments with embedded derivatives. SEK issues debt instruments in many financial markets. A large portion of these are hybrid instruments with embedded derivatives. SEK’s policy is to hedge the risks in these instruments using derivatives in order to obtain effective economic hedges. The entire hybrid debt instruments are irrevocably classified as financial liabilities measured at fair value through profit or loss, and thus do not separate the embedded derivatives. As there are no quoted market prices for these instruments, valuation models are used to calculate fair value. The gross value of these instruments and derivatives which effectively hedge each other requires complex judgments regarding the most appropriate valuation techniques, assumptions and estimates. If different valuation models or assumption were used, or if assumptions changed, this could produce different valuation results. Excluding the impact on valuation of credit spreads on SEK’s own debt and basis spreads, such changes in fair value would generally offset each other.
(x) Impairment of financial assets
SEK monitors loans and receivables and other assets for impairment as described below. Loans and other financial assets are identified as impaired if there is objective evidence of impairment and an impairment test indicates a loss.
Provisions for incurred impairment losses. Provisions for incurred impairment losses, mainly in the category loans and receivables, are recorded if and when SEK determines it is probable that the counterparty to a loan or another financial asset held by SEK, along with existing guarantees and collateral, will fail to cover SEK’s full claim. Such determinations are made for each individual loan or other financial asset. Objective evidence consists of the issuer or debtor suffering significant financial difficulties, outstanding or delayed payments or other observable facts which suggest a measurable decrease in expected future cash flow. If there is objective evidence that an impairment loss on a loan or other financial asset has been incurred, the amount of the loss is measured as the difference between the asset’s carrying amount and the present value of estimated future cash flows (excluding future credit losses that have not been incurred) discounted to the relevant period end date at the financial asset’s original effective interest rate. The amount of the loss is recognized in profit or loss.
After an individual determination has been made, and if there is no objective evidence for impairment of an individually assessed financial asset, regardless of whether the asset is individually material or not, the company includes the asset in a group of financial assets with similar credit risk characteristics and determines, collectively, the need for the impairment of such assets based on quantitative and qualitative analyses. The need for impairment is related to loan losses that have occurred as of a period-end date but which have not yet been identified as individual loan losses.
Impairment of an asset is made to a reserve account which, in the consolidated statement of financial position, reduces the line item to which it relates.
Charge-offs are recorded when it is evident that it is highly unlikely that any remaining part of SEK’s claim on a counterparty will be reimbursed within the foreseeable future and when there exists no guarantee or collateral covering the claim. Charge-offs may also be made once bankruptcy proceedings have been concluded and a final loss can be established, taking into account the value of any assets held by the bankruptcy estate and SEK’s share of these assets.
Recoveries are recorded only if there is virtual certainty of collection, such as in the aftermath of a bankruptcy proceeding when the payment due to be paid to SEK has been finally determined by a court of competent jurisdiction.
When a loan is classified as impaired, is past due or is otherwise non-performing, the interest is accounted for in the same manner as the principal amount. Thus, the interest related to any portion of a loan that is expected to be repaid in the future is recorded in earnings, discounted at the original effective interest rate, while the interest related to any portion of a loan that is not expected to be collected in accordance with the relevant loan agreement will not be recorded in earnings.
Restructured loan receivables pertain to loan receivables where SEK has granted concessions to the borrower as a result of the borrower’s deteriorated financial position. Following the restructure, normally, the loan receivable is no longer considered doubtful if the obligation is being met in compliance with the new terms and conditions. Concessions granted in connection with loan restructuring are regarded as credit losses.
F-14
Table of Contents
If and when a decline in the fair value of an available-for-sale financial asset has been recognized in other comprehensive income and there is objective evidence that the asset is impaired, the cumulative loss that has been recognized is removed from other comprehensive income and recognized in profit or loss, even though the financial asset has not been derecognized in the statement of financial position.
(g) Tangible assets
Items of property and equipment are measured at cost, less accumulated depreciation and accumulated impairment losses. Costs include expenditures that are directly attributable to the acquisition of the asset. When parts of an item of property or equipment have different useful lives, they are accounted for as separate items (major components) of property and equipment. Office equipment, buildings and equipment relating to the building are depreciated using the straight-line method over their estimated useful lives. Land is not depreciated. Average useful lives, depreciation methods and residual values are evaluated and reconsidered on a yearly basis. No depreciation is carried out from the time that an asset is classified as an asset held-for-sale.
(h) Intangible assets
Intangible assets comprise mainly the capitalized portion of investments in IT systems. Expenses that are directly attributable to large investments in the development of IT systems are recognized as intangible assets if they are expected to generate future economic benefits. The capitalized portion of investments in IT systems includes expenses related to the intangible asset, such as consulting fees and expenses for Group personnel who have contributed to producing the intangible asset. Each intangible asset is depreciated using the straight-line method over an estimated useful life from the date the asset is available for use. Average useful lives are evaluated and reconsidered on a yearly basis. An annual impairment test is performed on intangible assets not yet used.
(i) Employee benefits
SEK sponsors both defined benefit and defined contribution pension plans.
Defined contribution plans
A defined contribution plan is a post-employment benefit plan under which an entity (SEK, in this case) pays fixed contributions into a separate entity and will have no legal or constructive obligation to pay further amounts. Obligations for contributions to defined contribution pension plans are recognized as an employee benefit expense in profit or loss at the rate at which they are accrued by employees providing services to the entity during a period. Prepaid contributions are recognized as an asset to the extent that a cash refund or a reduction in future payments is available.
Defined benefit plans
Defined benefit plans are post-employment benefit plans other than defined contribution plans.
The net obligation in respect of defined benefit plans is calculated separately for each plan by estimating the amount of future benefits that employees have earned in return for their service in the current and prior periods. This benefit is discounted to determine its present value and the fair value of any plan assets is deducted.
The cost for defined benefit plans is calculated using the “projected unit credit method”, which distributes the cost of a plan over a covered employee’s service period. The calculation is performed annually by independent actuaries. The obligations are valued at the present value of the expected future disbursements, taking into consideration assumptions such as expected future pay increases, rate of inflation, and mortality rates. The discount rate used is the equivalent of the interest rate for Swedish mortgage bonds, with a remaining term approximating that of the actual commitments. Changes in actuarial assumptionsand experience-based adjustments generate actuarial gains or losses.. These actuarial gains and losses are reported together with the difference between actual and expected return on pension assets in other comprehensive income as incurred. Service cost, gains / losses from changes in plans, and the interest net of pension assets and liabilities are recognized in profit or loss.
The companies of the Group participate in various public pension plans covering all employees. Sufficient information is available to allow the calculation of SEK’s share of the defined-benefit liabilities, assets and the costs for these plans. The future costs of the plans may change accordingly if the underlying assumptions of the plans change. In addition to this, there are individual pension solutions for two former employees that are being disbursed. These have been accounted for in the same way as the company’s other pension obligations.
F-15
Table of Contents
(j) Equity
Equity in the Consolidated Group consists of the following items: share capital; reserves; retained earnings; and net profit. Reserves consist of the following items: reserve for fair-value changes in respect of available-for-sale securities (fair value reserve) and reserve for fair-value changes in respect of derivatives in cash-flow hedges (hedge reserve).
(k) Income tax
Income tax on the profit or loss for the year comprises current and deferred taxes. Current tax is tax expected to be payable on taxable income for the financial year. Deferred tax includes deferred tax in the untaxed reserves of the individual Group companies and deferred taxes on other taxable temporary differences. Deferred taxes on taxable temporary differences are calculated with an expected tax rate of 22.0 percent (2014: 22.0 percent 2013: 22.0 percent). Deferred taxes are calculated on all taxable temporary differences, regardless of whether a given temporary difference is recognized in the income statement or through other comprehensive income.
(l) Earnings per share
Earnings per share are calculated as net profit divided by the average number of shares. There is no dilution of shares.
(m) Statement of Cash Flows
The Statement of Cash Flows shows inflows and outflows of cash and cash equivalents during the year. SEK’s Statement of Cash Flows has been prepared in accordance with the indirect method, whereby operating profit is adjusted for effects of non-cash transactions such as depreciation and loan losses. The cash flows are classified by operating, investing and financing activities. Cash and cash equivalents include, in this context, cash at banks where amounts can be immediately converted into cash and short-term deposits where the time to maturity does not exceed three months from trade date. See Note 11 to the Consolidated Financial Statements.
(n) Critical accounting policies, judgments and estimates
When applying the Group’s accounting policies, management makes judgments and estimates that have a significant effect on the amounts recognized in the financial statements. These estimates are based on past experience and assumptions that the company believes are fair and reasonable. These estimates and the judgments behind them affect the reported amounts of assets, liabilities and off-balance sheet items, as well as income and expenses in the financial statements presented. Actual outcomes can later differ from the estimates and the assumptions made. Please see below for items for which critical estimates have been made. SEK assesses that the judgments made related to the following critical accounting policies are the most significant:
· The functional currency of the Parent Company,
· The selection of the appropriate valuation techniques when prices from active markets are not available for derivatives and other financial instruments carried at fair value,
· The judgment that SEK should be regarded as an agent with respect to the S-system
Furthermore, SEK has identified the following key sources of estimation uncertainty when applying IFRS:
· Provisions for probable credit losses,
· Estimates of fair values when quoted market prices are not available,
· Valuation of derivatives without observable market prices
The functional currency of the Parent Company
SEK has determined that the Swedish krona (Skr) is its functional currency under IFRS. Large portions of its assets, liabilities and related derivatives are denominated in foreign currencies. Under IFRS, both assets and liabilities are translated at closing exchange-rates and the differences between historical book values and current values are recognized as currency exchange-rate effects in the statement of comprehensive income. These differences largely offset each other, causing the net result not to be of a material amount in relation to total assets and liabilities in foreign currency. This reflects the economic substance of SEK’s policy of holding assets financed by liabilities denominated in, or hedged into, the same currency. See Note 26 to the Consolidated Financial Statements for information on SEK’s positions in foreign currency.
F-16
Table of Contents
The selection of the appropriate valuation techniques when prices from active markets are not available for derivatives and other financial instruments carried at fair value
When reporting the amounts of its assets, liabilities and derivatives, as well as its revenues and expenses, assumptions and estimates must be made in assessing the fair value of financial instruments and derivatives, especially where unquoted or illiquid securities or other debt instruments are involved. SEK makes judgments regarding what the most appropriate valuation techniques are for the different financial instruments based on their categories. In all cases, the decision is based on a professional assessment pursuant to SEK’s accounting and valuation policies. If the conditions underlying these assumptions and estimates were to change, the amounts reported could be different. When financial instruments are carried at fair value, fair value is calculated through the use of market quotations, pricing models, valuations established by external parties and discounted cash flows. The majority of SEK’s financial instruments are not publicly traded, and quoted market prices are not readily available. Other pricing models or assumptions could produce different valuation results. Furthermore, the estimated fair value of a financial instrument may, under certain market conditions, differ significantly from the amount that could be realized if the security were sold immediately. See Note 13 to the Consolidated Financial Statements for disclosure of change in value of assets and liabilities if non-observable parameters are changed.
The judgment that SEK should be regarded as an agent with respect to the S-system
SEK has determined that the S-system should be considered to be an assignment where SEK acts as an agent on behalf of the Swedish State rather than being the principal in the individual transactions. This assessment has been made based on a number of factors, such as the following: (i) although it does in form, SEK does not in substance bear risks and make decisions associated with ownership; (ii) SEK does not have discretion in establishing prices; and (iii) SEK receives compensation in the form of a fixed commission. SEK has consequently presented the economic activities of the S-system on a net basis in the statement of comprehensive income, recording the net commission received, rather than the gross amounts collected, in accordance with the instruction from the State. If SEK were regarded as a principal with respect to the S-system, all revenues and expenses in the S-system would be revenues and expenses of SEK. However, the net effect on SEK’s operating profit would be unchanged. See more information regarding the S-system in Note 25 and Note 1 (d)(i) to the Consolidated Financial Statements.
Provisions for probable credit losses
Provisions for probable credit losses are made if and when SEK determines that it is probable that the obligor under a loan or another asset held by SEK, in each case together with existing guarantees and collateral, will fail to cover SEK’s full claim. If the judgment underlying this determination were to change, this could result in a material change in provisions for probable credit losses.
Impairment is recognized as the difference between the carrying value of a loan and the discounted value of SEK’s best estimate of future cash repayments. This estimate takes into account a number of factors related to the obligor. The actual amounts of future cash flows and the dates they are received may differ from these estimates and consequently actual losses incurred may differ from those recognized in the financial statements. If, for example, the actual amount of total future cash flow were 10 percent higher or lower than the estimate, this would affect operating profit for the financial year ended December 31, 2015 by Skr 20-30 million (2014: Skr 40—50 million) and equity by Skr 16-24 million (2014: Skr 31-39 million) at that date. A higher total future cash flow would affect operating profit and equity positively, and a lower total future cash flow would affect operating profit and equity negatively.
Estimates of fair value when quoted market prices are not available
When an asset or liability is reported at fair value, fair value must include any impact of credit spreads. When quoted market prices are not available for such instruments, certain assumptions must be made about the credit spread of either the counterparty or one’s own credit spread, depending on whether the instrument is an asset or a liability.
Developments on the financial markets have to some extent affected the prices at which SEK’s debt is issued. These changes, which are different in different markets, have been included in the calculation of fair value for these liabilities. The models used include both directly observable and implied market parameters.
If the assumption related to the valuation of assets classified at fair value were changed such that the average credit spread applied to such assets were 0.10 percent higher or lower than the average spread actually used in the calculations, this would affect operating profit for the fiscal year ended December 31, 2015 by approximately Skr 5-15 million (2014: Skr 5-15 million) and equity, at such date, by approximately Skr 100-110 million (2014: Skr 150-160 million). A higher credit spread would affect operating profit and equity negatively, and a lower credit spread would affect operating profit and equity positively.
F-17
Table of Contents
If the assumption related to the valuation of liabilities classified at fair value were changed such that the average credit spread applied to such liabilities were 0.10 percent higher or lower than the average spread actually used in the calculations, this would affect operating profit for the fiscal year ended December 31, 2015 by approximately Skr 150-250 million (2014: Skr 200-300 million) and equity, at such date, by approximately Skr 100-200 million (2014: Skr 150-250 million). A higher credit spread would affect operating profit and equity positively, and a lower credit spread would affect operating profit and equity negatively.
SEK issues debt instruments in many financial markets. A large portion of these are hybrid instruments with embedded derivatives. SEK’s policy is to hedge the risks in these instruments using derivatives with corresponding structures in order to obtain effective economic hedges. The entire hybrid debt instruments are classified as financial liabilities measured at fair value. As there mostly are no market quotes for this group of transactions, valuation models are used to calculate fair value. The gross value of these instruments and derivatives which effectively hedge each other requires complex judgments regarding the most appropriate valuation technique, assumptions and estimates. If other valuation models or assumption were used, or if assumptions changed, this could produce other valuation results. Excluding the impact on valuation of credit spreads on SEK’s own debt and basis spreads, such changes in fair value would generally offset each other.
If these assumptions were to be changed, this could result in a material change in the fair value of these instruments. For further information see Note 13 to the Consolidated Financial Statements, table Sensitivity analysis - level 3 assets and liabilities.
Valuation of derivatives without observable market prices
A large part of SEK’s portfolio of senior securities issued and related derivatives is in the form of structured products, in which the fair value of certain embedded derivatives (though not bifurcated) sometimes requires sophisticated models in order to value these instruments. If the assumptions used in these models were to change, this could result in a material change in the fair value of these instruments. Since SEK only enters into market-matched hedge relationships (economic or accounting hedges), a potential material effect on profit or loss or equity would result only if there were changes in the credit spreads or basis spread.
SEK uses derivative instruments to mitigate and reduce risks attributable to financial assets and liabilities. In order to mitigate counterparty risk, i.e. the form of credit risk generated from derivative transactions, SEK enters into such transactions only with counterparties with good creditworthiness. Moreover, SEK endeavors to enter into ISDA Master Agreements with Credit Support Annexes with its counterparties. This means that the highest allowed risk level is established in advance, regardless of what changes in market value may occur. Derivatives are valued at fair value with reference to listed market prices where available. If market prices are not available, valuation models are used instead. SEK uses a model to adjust the fair value of the net exposure for changes in SEK’s or the counterparty’s creditworthiness. The models use directly observable market parameters if such are available.
Note 2. Net interest revenues
| | Consolidated Group | |
Skr mn | | 2015 | | 2014 | | 2013 | |
Interest revenues were related to: | | | | | | | |
Loans to credit institutions | | 544 | | 595 | | 742 | |
Loans to the public | | 2,663 | | 3,086 | | 3,253 | |
Interest-bearing securities | | 395 | | 577 | | 643 | |
Impaired financial assets | | 0 | | 5 | | 1 | |
Derivatives | | -767 | | -489 | | -481 | |
Total interest revenues | | 2,835 | | 3,774 | | 4,158 | |
Total interest expenses | | -1,173 | | -2,196 | | -2,603 | |
Net interest revenues | | 1,662 | | 1,578 | | 1,555 | |
F-18
Table of Contents
| | Consolidated Group | |
Skr mn | | 2015 | | 2014 | | 2013 | |
Interest revenues were related to: | | | | | | | |
Available-for-sale financial assets | | 225 | | 387 | | 184 | |
Financial assets at fair value through profit or loss | | -5 | | 204 | | 27 | |
Derivatives used for hedge accounting | | -470 | | -412 | | -205 | |
Loans and receivables | | 3,085 | | 3,595 | | 4,152 | |
Total interest revenues | | 2,835 | | 3,774 | | 4,158 | |
| | | | | | | |
Interest expenses were related to: | | | | | | | |
Financial liabilities at fair value through profit or loss | | -683 | | -818 | | -1,110 | |
Derivatives used for hedge accounting | | 2,484 | | 2,416 | | 2,461 | |
Other financial liabilities | | -2,974 | | -3,794 | | -3,954 | |
Total interest expenses | | -1,173 | | -2,196 | | -2,603 | |
| | | | | | | |
Net interest revenues | | 1,662 | | 1,578 | | 1,555 | |
Interest revenues geographical areas | | Consolidated Group | |
Skr mn | | 2015 | | 2014 | | 2013 | |
Sweden | | 1,353 | | 2,039 | | 2,428 | |
Europe except Sweden | | 511 | | 824 | | 802 | |
Countries outside of Europe | | 971 | | 911 | | 928 | |
Total | | 2,835 | | 3,774 | | 4,158 | |
Interest revenues per productgroup | | Consolidated Group | |
Skr mn | | 2015 | | 2014 | | 2013 | |
Corporate ledning | | 1,517 | | 2,216 | | 2,514 | |
End-customer financing(1) | | 978 | | 1,018 | | 994 | |
Liquidity | | 340 | | 540 | | 650 | |
Total | | 2,835 | | 3,774 | | 4,158 | |
(1) In interest revenues for End-customer financing Skr 123 million (2014: Skr 117 million; 2013: Skr 105 million) represent remuneration from the S-system (see Note 24 to the Consolidated Financial Statements).
F-19
Table of Contents
Note 3. Net fee and commission expense
| | Consolidated Group | |
Skr mn | | 2015 | | 2014 | | 2013 | |
Fee and commissions earned were related to(1): | | | | | | | |
Capital market commissions | | — | | — | | 6 | |
Financial consultants’ commissions | | 0 | | — | | 2 | |
Other commissions earned | | 2 | | 4 | | 1 | |
Total | | 2 | | 4 | | 9 | |
| | | | | | | |
Commissions incurred were related to(1): | | | | | | | |
Depot and bank fees | | -6 | | -7 | | -11 | |
Brokerage | | -2 | | -3 | | -3 | |
Financial consultants’ commissions | | — | | — | | 0 | |
Other commissions incurred | | 0 | | — | | — | |
Total | | -8 | | -10 | | -14 | |
Net fee and commission expense | | -6 | | -6 | | -5 | |
(1) Skr -3 million (2014: Skr -3 million; 2013: Skr -5 million) includes financial assets and liabilities not measured at fair value through profit or loss
Fee and commission earned geographical areas | | Consolidated Group | |
Skr mn | | 2015 | | 2014 | | 2013 | |
Sweden | | 1 | | 4 | | 8 | |
Europe except Sweden | | 0 | | 0 | | 1 | |
Countries outside of Europe | | 1 | | 0 | | — | |
Total | | 2 | | 4 | | 9 | |
Fee and commission earned per productgroup | | Consolidated Group | |
Skr mn | | 2015 | | 2014 | | 2013 | |
Corporate ledning | | — | | — | | 9 | |
End-customer financing | | 2 | | 4 | | — | |
Total | | 2 | | 4 | | 9 | |
F-20
Table of Contents
Note 4. Net results of financial transactions
| | Consolidated Group | |
Skr mn | | 2015 | | 2014 | | 2013 | |
Net results of financial transactions were related to: | | | | | | | |
Derecognition of financial instruments not measured at fair value through profit or loss | | | | | | | |
Available-for-sale financial assets | | — | | — | | — | |
Loans and receivables | | -42 | (1) | 147 | | 2 | |
Other financial liabilities | | — | | — | | 487 | (2) |
Financial assets or liabilities at fair value through profit or loss: | | | | | | | |
Designated upon initial recognition (FVO) | | 4,526 | (3) | -2,846 | | -5,435 | |
Held-for-trading(4) | | -4,324 | (3) | 3,031 | (5),(6) | 5,339 | (6) |
Financial instruments under fair-value hedge accounting: | | | | | | | |
Net results of the hedging instrument | | -290 | (3) | 844 | | -3,292 | |
Net results of the hedged item | | 536 | | -641 | | 3,294 | |
Ineffectiveness of cash-flow hedges that have been reported in the profit or loss(7) | | — | | 7 | | 12 | |
Currency exchange-rate effects on all assets and liabilities excl. currency exchange-rate effects related to revaluation at fair value | | -6 | | -36 | | 1 | |
Total net result of financial transactions | | 400 | | 506 | | 408 | |
(1) During 2015, SEK’s holdings of asset-backed securities were terminated, which affected the net results of financial transactions negatively by Skr 130 million.
(2) A gain amounting to Skr 375 million was recorded in 2013 from the repurchase of SEK’s subordinated debt
(3) During the fourth quarter 2015, SEK made a change in assumption in the valuation of certain transactions. The change in assumptions resulted in a negative impact on operating income.
(4) No assets or liabilities are classified as held-for-trading other than derivatives held for economic hedging in accordance with IAS 39.
(5) In April 2012, the Swiss company Lehman Brothers Finance AG (in liquidation, with PricewaterhouseCoopers as appointed liquidators) (“LBF”) filed a lawsuit against SEK with the Stockholm District Court.
In June 2014, the dispute was finally settled and in September 2014, SEK received certain distributions from other entities in the former Lehman Brothers group that, in total, affected the Net result of financial transactions positively by Skr 317 million.
(6) During 2014, SEK adopted new interest rate curves in order to better account for market differences in the pricing of three- and six-month flows. The improved methodology resulted in a positive impact on operating income. During 2013, an improved method related to valuation of funding transactions was implemented, which had a negative impact on operating income.
(7) During 2014, derivatives designated as hedging instruments in cash -flow hedges were terminated and the hedging designations were discontinued. The close out of the hedging instruments did not affect Net results of financial transactions.
SEK’s general business model is to hold financial instruments measured at fair value to maturity. The net fair value changes that occur, mainly related to changes in credit spreads on SEK’s own debt and basis-spreads, and recognized in net results of financial transactions, could be significant in a single reporting period. However, it will not affect earnings over time since the changes in the instrument’s market value will be zero if it is held to maturity. Realized gains or losses could occur if SEK repurchases own debt or if lending is repaid early and related hedging instruments are closed prematurely.
F-21
Table of Contents
Note 5. Personnel expenses
| | Consolidated Group | |
Skr mn | | 2015 | | 2014 | | 2013 | |
| | | | | | | |
Salaries and remuneration to the Board of Directors and the Cheif Executive Officers | | -6 | | -7 | | -8 | |
Severance salary related to the Cheif Executive Officer | | — | | — | | -8 | (1) |
Salaries and remuneration to Senior Executives | | -17 | | -14 | | -12 | |
Salaries and remuneration to other employees | | -141 | | -161 | | -139 | |
Pensions | | -62 | | -59 | | -58 | |
Social insurance | | -56 | | -59 | | -51 | |
Other personnel expenses | | -13 | | -13 | | -14 | |
Total personnel expenses | | -295 | | -313 | | -290 | |
(1) Peter Yngwe left his position as CEO on April 28th, 2014. The full cost of his severance including payroll taxes was Skr 8 million, which corresponded to 18 months’ salary and was expensed in 2013. Severance pay is paid monthly and deductions are made in the event of other income.
The combined total of the remuneration to senior executives, excluding the CEO of the Parent Company, amounted to Skr 17 million (2014: Skr 14 million). Of the remuneration to senior executives, Skr 16 million (2014: Skr 14 million) is pensionable. Of the remuneration to the CEO of the Parent Company, Skr 4 million (2014: Skr 5 million)(1) is pensionable. For all employees, excluding the CEO, SEK follows collective agreements between BAO and trade unions.
As of the 1st of January 2015 Karl-Johan Bernerfalk (General Counsel), Johan Henningsson (Head of Sustainability) and Edvard Unsgaard (Head of Communications) joined the Executive management. Marie Lindstedt (Head of Compliance), Dan Kohlberg (IT-Manager) and Sven-Olof Söderlund (Head of Corporate Governance) are as of the 1st of January 2015 co-opt.
(1) Partially includes former CEO Peter Yngwe.
F-22
Table of Contents
Remuneration and other benefits to the Board of Directors and Senior
Executives in the Consolidated Group
2015
Skr thousand | | Fee,
includes
committee
fee | | Fixed
remuneration(1) | | Other
benefits(2) | | Pension fee(3) | | Total | |
Chairman of the Board of Directors: | | | | | | | | | | | |
Lars Linder-Aronson(4) | | -614 | | — | | — | | — | | -614 | |
Other members of the Board of Directors: | | | | | | | | | | | |
Cecilia Ardström | | -218 | | — | | — | | — | | -218 | |
Jan Belfrage | | -217 | | — | | — | | — | | -217 | |
Lotta Mellström(5) | | — | | — | | — | | — | | — | |
Ulla Nilsson | | -236 | | — | | — | | — | | -236 | |
Jan Roxendal(4) | | -327 | | — | | — | | — | | -327 | |
Teppo Tauriainen(5) | | — | | — | | — | | — | | — | |
Susanne Lithander, from January 20, 2015 | | -209 | | — | | — | | — | | -209 | |
Senior Executives: | | | | | | | | | | | |
Catrin Fransson, Chief Executive Officer (CEO) | | — | | -4,379 | | -75 | | -1,295 | | -5,749 | (6) |
Karl Johan Bernerfalk, General Counsel | | — | | -1,281 | | -10 | | -412 | | -1,703 | |
Teresa Hamilton Burman, Chief Credit Officer (CCO), from August 3, 2015 | | | | -910 | | -5 | | -186 | | -1,101 | |
Stefan Friberg, Chief Risk Officer (CRO), from May 15, 2015 | | — | | -1,688 | | -8 | | -282 | | -1,978 | |
Johan Henningsson, Head of Sustainability | | — | | -1,139 | | -10 | | -366 | | -1,515 | |
Per Jedefors, Chief Risk Officer (CRO), resigned with pension April 30, 2015 | | — | | -1,390 | | -28 | | -228 | | -1,646 | |
Jane Lundgren-Ericsson, Head of Lending | | — | | -2,286 | | -50 | | -606 | | -2,942 | |
Sirpa Rusanen, Head of Human Resources | | — | | -1,266 | | -85 | | -473 | | -1,824 | |
Susanna Rystedt, Chief Administrative Officer (CAO) | | — | | -2,055 | | -91 | | -642 | | -2,788 | |
Edvard Unsgaard, Head of Communication | | — | | -1,000 | | -11 | | -297 | | -1,308 | |
Per Åkerlind, Head of Treasury and Capital Management and Executive Vice President | | — | | -3,134 | | -86 | | -1,103 | | -4,323 | |
Summa | | -1,821 | | -20,528 | | -459 | | -5,890 | | -28,698 | |
Remuneration and other benefits to the Board of Directors and Senior
Executives in the Consolidated Group
2014
Skr thousand | | Fee,
includes
committee
fee | | Fixed
remuneration(1) | | Other
benefits(2) | | Pension fee(3) | | Total | |
Chairman of the Board of Directors: | | | | | | | | | | | |
Lars Linder-Aronson(4) | | -593 | | — | | — | | — | | -593 | |
Other members of the Board of Directors: | | | | | | | | | | | |
Cecilia Ardström | | -210 | | — | | — | | — | | -210 | |
Jan Belfrage | | -189 | | — | | — | | — | | -189 | |
Lotta Mellström(5) | | — | | — | | — | | — | | — | |
Ulla Nilsson | | -208 | | — | | — | | — | | -208 | |
Jan Roxendal(4) | | -289 | | — | | — | | — | | -289 | |
Åke Svensson, avgick 2014-02-19 | | -59 | | — | | — | | — | | -59 | |
Teppo Tauriainen(5), from October 7, 2014 | | — | | — | | — | | — | | — | |
Eva Walder(5), resigned October 7, 2014 | | — | | — | | — | | — | | — | |
Senior Executives: | | | | | | | | | | | |
Catrin Fransson, Chief Executive Officer (CEO), from April 28, 2014 | | — | | -3,145 | | -75 | | -932 | | -4,152 | (6) |
Peter Yngwe, Chief Executive Officer (CEO), resigned April 28, 2014 | | — | | -1,704 | (7) | -39 | | -481 | | -2,224 | (8) |
Per Jedefors, Chief Risk Officer (CRO) | | — | | -2,983 | | -108 | | -897 | | -3,988 | |
Jane Lundgren-Ericsson, Head of Lending | | — | | -2,128 | | -61 | | -644 | | -2,833 | |
Sirpa Rusanen, Head of Human Resources | | — | | -1,203 | | -113 | | -429 | | -1,745 | |
Susanna Rystedt, Chief Administrative Officer (CAO) | | — | | -1,948 | | -112 | | -606 | | -2,666 | |
Sven-Olof Söderlund, Chief Corporate Governance Officer (CCGO) | | | | -2,577 | (7) | -100 | | -827 | | -3,504 | |
Per Åkerlind, Head of Treasury and Capital Management and Executive Vice President | | — | | -3,037 | | -110 | | -1,090 | | -4,237 | |
Summa | | -1,548 | | -18,725 | | -718 | | -5,906 | | -26,897 | |
(1) Predetermined salary or other compensation such as holiday pay and allowances.
F-23
Table of Contents
(2) Other benefits consist of for example car allowances and subsistence benefit.
(3) Includes premiums for insurance covering sickness benefit for prolonged illness and other public risk insurance as a result of collective pension agreements.
(4) Since May 1, 2013 remuneration is invoiced from their private companies in accordance with the state guidelines.
(5) Since April 29, 2010, remuneration is not paid from the company to the representatives on the Board, who are employed by the owner, the Swedish Government.
(6) The retirement age of the CEO , Catrin Fransson is 65 years and the pension fee is 30 percent of her fixed salary.
(7) Includes payments of saved vacation leave.
(8) The previous CEO , Peter Yngwe had the retirement age of 65 years and the pension fee was 30 percent of his fixed salary.
(9) In addition, severance pay of Skr 6 million excluding payroll taxes was reserved as of December 31, 2013
2013 Remuneration and other benefits to the Board of Directors and Senior
Executives in the Consolidated Group, Skr thousand | | Fee,
includes
committee
fee | | Fixed
remuneration(1) | | Other
benefits(2) | | Pension fee(3) | | Total | |
Chairman of the Board of Directors: | | | | | | | | | | | |
Lars Linder-Aronson | | -482 | | — | | — | | — | | -482 | |
Other members of the Board of Directors: | | | | | | | | | | | |
Cecilia Ardström | | -180 | | — | | — | | — | | -180 | |
Jan Belfrage | | -165 | | — | | — | | — | | -165 | |
Lotta Mellström(5) | | — | | — | | — | | — | | — | |
Ulla Nilsson | | -182 | | — | | — | | — | | -182 | |
Jan Roxendal | | -232 | | — | | — | | — | | -232 | |
Åke Svensson | | -174 | | — | | — | | — | | -174 | |
Eva Walder(5) | | — | | — | | — | | — | | — | |
Senior Executives: | | | | | | | | | | | |
Peter Yngwe, Chief Executive Officer (CEO) | | — | | -4,197 | (9) | -117 | | -1,464 | | -5,778 | (8) |
Per Jedefors, Chief Risk Officer (CRO) | | — | | -2,914 | | -104 | | -894 | | -3,913 | |
Jane Lundgren Ericsson, Deputy Chief Operating Officer (dCOO) and Chief Executive Officer (CEO) for AB SEK Securities | | | | -1,904 | | -52 | | -641 | | -2,597 | |
Sirpa Rusanen, Head of Human Resources | | — | | -1,183 | | -120 | | -420 | | -1,723 | |
Susanna Rystedt, Chief Administrative Officer (CAO) | | — | | -1,843 | | -102 | | -602 | | -2,547 | |
Sven-Olof Söderlund, Chief Corporate Governance Officer (CCGO) | | | | -2,210 | | -106 | | -824 | | -3,140 | |
Per Åkerlind, Chief Operating Officer (COO) | | — | | -2,937 | | -109 | | -1,069 | | -4,115 | |
Total | | -1,415 | | -17,188 | | -710 | | -5,914 | | -25,227 | |
The Swedish FSA’s regulations (FFFS 2011:1) regarding remuneration systems in credit institutions, investment firms and fund management companies apply to SEK. SEK further applies the government’s guidelines on terms of employment for senior executives at state-owned companies. In accordance with these set of rules, SEKs board of directors proposed a set of guidelines related to salary and remuneration to the senior executives of SEK. The proposal was later accepted by the annual general meeting 2015. The guidelines stipulate that salary and remuneration to the senior executives of SEK should be fair and reasonable. They should also be competitive, capped and, as appropriate contribute to good ethical principles and corporate culture. Remuneration should not be higher than at comparable companies,and should be reasonable. Guidelines for remuneration to senior executives are determined by the Annual General Meeting. Remuneration to senior executives consists of fixed salary, pension and other benefits. Pension terms for senior executives should be in the form of defined contribution plans.
SEK’s remuneration system is designed to promote a sound and effective risk management and does not encourage excessive risk-taking. Remuneration to employees is mainly determined at fixed amounts. SEK’s Board of Directors’ Remuneration Committee (the “Remuneration Committee”) prepares proposals to the Board of Directors relating to decisions on remuneration policy for the Company, on total remuneration for the CEO, for other members of senior executives, for the head of Compliance, and for other employees reporting directly to the Chief Executive Officer, on terms and conditions for and outcome of the Company’s employee incentive scheme (EIS). The Remuneration Committee also prepares and handles overall issues relating to remuneration (salaries, pension and other benefits), measures aimed at following-up the application of SEK’s remuneration policy, and issues relating to succession planning. Further, the Remuneration Committee prepares overall instructions for remuneration issues that it deems necessary. The Remuneration Committee also ensures that the relevant department for control, together with the Remuneration Committee, annually reviews and evaluates the company’s remuneration systems and also reviews whether such systems comply with the company’s remuneration policy and relevant instructions regarding remuneration. The outcome is presented to the Board of Directors in a separate report on the same day as the annual report is submitted. The Remuneration Committee has met eight times this year.
F-24
Table of Contents
Since the year 2011, the Company has only one system for variable remuneration, the employee incentive scheme (EIS). The EIS applies to all permanent employees, with exception of senior executives (except for three newly apointed senior executives, where deferred remuneration related to 2014 is included), employees within the Risk Department and employees within the Compliance Department.
The purpose of the EIS is to contribute to attracting and retaining staff, to promote the achievement of the company’s long-term objectives, and to encourage cooperation between different parts of the company in order to progress towards common objectives.
If pre-tax profit (excluding net results of financial transactions and any costs for the EIS, but after reversal of any non-operational items) (“Base Profit”) exceeds the predetermined Base Profit, the employees to whom the EIS applies receive a share of the excess amount, however, not more than an amount equal to two months’ salary, including payroll taxes. However, outcome under EIS is on condition that operating profit, including the costs for EIS, is positive. The Base Profit is determined by the Board of Directors. Risk adjustment takes place based on the Company’s total risks. By construction, the variable remuneration will never exceed 17 percent of the fixed remuneration. The final decision on the amount to be paid out under the EIS is taken by the Board of Directors.
SEK’s remuneration policy is designed in such a way that the Company may decide that remuneration that is subject to deferred disbursement may be withheld, in part or full, if it subsequently transpires that the performance criteria have not been fulfilled or if the employee has breached certain internal rules. The same applies if disbursement would not be justifiable by the Company’s financial situation. Further, the outcome may also be adjusted if credit losses, or recoveries of credit losses, have occurred after the relevant income year, but are deemed to be attributable to the said income year. For all employees to whom EIS applies, the disbursement plan states that 40 percent of the outcome will be disbursed in April in the year following the income year to which the remuneration relates, and 20 percent will be disbursed in April in each of the subsequent three years.
In order to be able to identify, measure, manage, report and have control over the risks associated with the company’s business, the company ensures that its remuneration system promotes a sound and effective risk management. As part of its strategic analysis and planning, the company undertakes an annual process for internal capital and liquidity assessment. The aim of this process is to identify and compile, in a comprehensive way, the company’s risks and to evaluate its risk management, need for capital and need for liquidity. Accordingly, in this process, amongst others, the appropriateness of the company’s risk management is evaluated. As part of this evaluation, an analysis is conducted with the purpose of identifying employees, whose work duties have a material impact on SEK’s risk profile, including risks related to the company’s remuneration policy and remuneration system. The outcome of this analysis is taken into account when designing the remuneration systems in order to promote a sound and efficient risk management and to restrict excessive risk-taking.
The number of employees that receive remuneration of Euro 1 million or more per financial year is zero. No new agreements containing variable remunerations have been established during the year.
The CEO, Catrin Fransson, is covered by the Guidelines for Terms of Employment for Senior Executives in State-owned Companies (adopted April 20, 2009). SEK pays a defined-contribution pension insurance amounting to 30 percent of the CEO’s pensionable salary. The retirement age for the CEO is 65.
For the CEO, SEK pays premiums for insurance for sickness benefits for prolonged illness, other collective risk insurance corresponding to those applicable under the BTP plan, health care insurance under Skandia Privatvård Plus and travel insurance. Other benefits payable to the CEO include car and per diem allowances. The CEO is entitled to 6 months’ notice prior to termination initiated by SEK and, furthermore, is entitled to severance pay corresponding to 18 months’ salary. A deduction is made for any income arising from new employment.
The retirement age is 65 for all senior executives. The pension terms, conditions for termination of employment and other terms of employment for the senior executives follow the current Guidelines for Terms of Employment for Senior Executives in Stateowned Companies (adopted April 20, 2009), where the BTP plan is included as an approved, collectively bargained, defined-benefit pension plan. Pension provisions for senior executives in SEK are limited to 30 percent of pensionable income for retirement and survivors’ pension. Due to SEK’s implementation of a defined-benefit pension plan, the BTP plan, resulting from a collective agreement between the Banking Institutions Employers’ Organization (BAO) and the Financial Sector Union of Sweden, covering employees in the banking and finance industries, the contribution for retirement and survivor´s pension can exceed 30 percent.
F-25
Table of Contents
For all the senior executives, SEK pays premiums for insurance for sickness benefits for prolonged illness, other collective risk insurance arising out of applicable collective agreements as well as travel insurance and health insurance. Other benefits include car and per diem allowances.
Per Åkerlind and Sven-Olof Söderlund have notice periods of six months should termination be initiated by SEK and, furthermore, are entitled to severance pay corresponding to 18 months’ salary. A deduction is made for any income arising from new employment. For other senior executives, the notice period upon termination initiated by SEK follows collective agreements. Upon resignation by the employee, the notice period is three or six months.
Peter Yngwe left his position as CEO April 28, 2014. Severance has been paid monthly and deductions have been made in the event of other income earned.
Pensions
The employees at SEK have a collectively bargained pension plan through the BTP plan, which is the most significant pension plan for salaried bank employees in Sweden. The BTP plan is funded by means of insurance with the insurance company SPP and SEB.
The total pension cost for defined benefit and defined contribution obligations are shown below
Skr mn | | 2015 | | 2014 | | 2013 | |
Service cost | | -7 | | -5 | | -8 | |
Interest cost, net | | -2 | | -1 | | -1 | |
Pension cost for defined benefit pensions, incl. payroll tax | | -9 | | -6 | | -9 | |
Pension cost for defined contribution pension incl. payroll tax | | -53 | | -53 | | -49 | |
Pension cost recognized in personnel costs | | -62 | | -59 | | -58 | |
| | | | | | | |
Actuarial gains and (losses) on defined benefit obligation during period | | 60 | | -57 | | 65 | |
Return above expected return, gains and (losses) on plan assets | | -7 | | 14 | | -4 | |
Change in the effect of the asset ceiling excluding interest | | -4 | | — | | — | |
Revaluation of defined benefit plans | | 49 | | -43 | | 61 | |
The following table specifies the net value of defined benefit pension obligations
Skr mn | | 2015 | | 2014 | | 2013 | |
Defined benefit obligations | | 215 | | 267 | | 207 | |
Plan assets | | -202 | | -201 | | -181 | |
Restriction to net defined benefit asset due to the asset ceiling | | 4 | | — | | — | |
Provision for pensions, net obligation (see Note 21 to the Consolidated Financial Statements) | | 17 | | 66 | | 26 | |
The following table shows the development of defined benefit obligations
Skr mn | | 2015 | | 2014 | | 2013 | |
Defined benefit obligation, opening balance | | 267 | | 207 | | 264 | |
Service cost | | 7 | | 5 | | 8 | |
Interest cost | | 7 | | 7 | | 7 | |
Pension Payments incl. special payroll tax | | -7 | | -7 | | -7 | |
Other adjustments | | — | | -2 | | — | |
Actuarial (gains) and losses, effect due to changed demographic assumptions | | — | | 6 | | 0 | |
Actuarial (gains) and losses, effect due to changed financial assumptions | | -51 | | 54 | | -65 | |
Actuarial (gains) and losses, effect due to experience based outcome | | -8 | | -3 | | 0 | |
Defined benefit obligation, closing balance | | 215 | | 267 | | 207 | |
F-26
Table of Contents
The following table shows the development of plan assets related to defined benefit obligation
Skr mn | | 2015 | | 2014 | | 2013 | |
Fair value of plan assets, opening balance | | 201 | | 181 | | 178 | |
Expected return on plan assets | | 5 | | 6 | | 6 | |
Contributions by the employer(1) | | 8 | | 8 | | 8 | |
Benefits paid(2) | | -5 | | -6 | | -6 | |
Other adjustments | | — | | -2 | | — | |
Return on plan assets excluding interest income | | -7 | | 14 | | -5 | |
Fair value of plan assets, closing balance | | 202 | | 201 | | 181 | |
(1) Expected contribution from the employer in the following year is Skr 8 million (2014: Skr 8 million; 2013: Skr 8 million) excluding payroll tax.
(2) Expected compensation paid in the following year is Skr 7 million (2014: Skr 7 million; 2013 Skr 6 million).
The following table shows the distribution of plan assets related to defined benefit obligation
Skr mn | | 2015 | | 2014 | | 2013 | |
Domestic equity investments | | 4 | | 12 | | 22 | |
Foreign equity investments | | 12 | | 12 | | — | |
Domestic government bonds | | 63 | | 65 | | 54 | |
Domestic corporate bonds | | 63 | | 56 | | 54 | |
Mortgage bonds | | 48 | | 46 | | 42 | |
Properties | | 12 | | 10 | | 9 | |
| | 202 | | 201 | | 181 | |
The following table displays principal actuarial assumptions used end of year
% | | 2015 | | 2014 | | 2013 | |
Discount rate(1) | | 3.4 | | 2.5 | | 3.6 | |
Assumption of early pension withdrawal | | 20.0 | | 20.0 | | 20.0 | |
Expected salary increase | | 2.0 | | 3.5 | | 3.5 | |
Expected inflation | | 1.6 | | 1.6 | | 1.6 | |
Expected lifetime(2) | | DUS14 | | DUS14 | | FFFS2007:31 | |
Expected turnover | | 5.0 | | 5.0 | | 4.0 | |
Sensitivity analysis of essential assumptions
| | Negative outcome | | Positive outcome | |
(1) Discount rate | | -1 | % | 2.4 | % | +1 | % | 4.4 | % |
Defined benefit obligation | | | | 265 | | | | 178 | |
Service cost | | | | 6 | | | | 3 | |
Interest cost | | | | 6 | | | | 8 | |
| | | | | | | | | |
(2) Expected lifetime | | +1 year | | | | -1 year | | | |
Defined benefit obligation | | | | 224 | | | | 207 | |
Service cost | | | | 4 | | | | 4 | |
Interest cost | | | | 8 | | | | 7 | |
Net reconciliation of pension liabilities
Skr mn | | 2015 | | 2014 | | 2013 | |
Pension liabilities, opening balance | | 66 | | 26 | | 86 | |
Net periodic pension cost | | 9 | | 6 | | 9 | |
Contributions by the employer | | -8 | | -7 | | -7 | |
Net pension payments | | -1 | | -2 | | -2 | |
Revaluations recognized in other comprehensive income | | -49 | | 43 | | -60 | |
Pension liabilities, closing balance | | 17 | | 66 | | 26 | |
F-27
Table of Contents
Net interest is calculated using the discount rate of pension obligations, based on the net surplus or net deficit in the defined benefit plan.
Pension expense in 2015 for defined benefit pensions amounts to Skr 9 million (2014: Skr 6 million and 2013: Skr 9 million).
As of December 31, 2015, the expected weighted average remaining service time for active employees was 19.4 years, (2014: 20.8 years) the expected weighted average duration for the present value was 22.7 years (2014: 21.6 years) and the average salary for active employees was Skr 0.8 million (2014: Skr 0.7 million).
Discount rate
Swedish government bonds were previously used as the basis for calculating pension liabilities. Since January 1, 2013 the calculation has instead been based on the estimated interest curve of Swedish mortgage bonds, as this market is regarded as liquid enough to be used for this purpose. The discount rate is based on market expectations at the end of the accounting period, using bonds with the same duration as the pension liability.
Expected early retirement
According to the transitional rule for § 8 in the BTP-plan, the calculation includes the assumption that 20 percent of the employees use the possibility for early retirement. The earliest retirement age is 61 for employees born 1956 or earlier. Employees born 1967 or later have no right to retire before age 65.
Expected return on plan assets
Expected return on plan assets is equal to the discount rate as regulated in IAS 19.
Expected salary increase
The assumption of salary increase is based on SEK’s assessment.
Expected inflation
The expected inflation is in line with Swedish inflation-linked bonds.
Expected employee turnover
Expected employee turnover is based on SEK’s assessment of the long-term expected company staff attrition during one year.
Average number of employees | | 2015 | | 2014 | | 2013 | | 2012 | |
Women | | 115 | | 111 | | 112 | | 109 | |
Men | | 136 | | 132 | | 131 | | 122 | |
Total average number of employees | | 251 | | 243 | | 243 | | 231 | |
of which geographically located in Sweden | | 250 | | 242 | | 241 | | 230 | |
of which geographically located in Singapore | | 1 | | 1 | | 2 | | 1 | |
Number of employees at year-end | | 2015 | | 2014 | | 2013 | | 2012 | |
Women | | 124 | | 110 | | 114 | | 114 | |
Men | | 139 | | 131 | | 135 | | 121 | |
Total number of employees | | 263 | | 241 | | 249 | | 235 | |
of which geographically located in Sweden | | 262 | | 240 | | 247 | | 233 | |
of which geographically located in Singapore | | 1 | | 1 | | 2 | | 2 | |
of which full-time employees | | 257 | | 236 | | 244 | | 227 | |
of which part-time employees | | 6 | | 5 | | 5 | | 8 | |
of which permanent employees | | 254 | | 237 | | 240 | | 228 | |
of which temporary employees | | 9 | | 4 | | 9 | | 7 | |
of which managers | | 32 | | 39 | | 43 | | 43 | |
of which non-management | | 231 | | 202 | | 206 | | 192 | |
F-28
Table of Contents
Employees by age distribution | | 2015 | | 2014 | | 2013 | | 2012 | |
Total number of employees | | 263 | | 241 | | 249 | | 235 | |
of which under the age of 30 years | | 22 | | 19 | | 24 | | 22 | |
of which between 30 and 39 years | | 73 | | 68 | | 80 | | 75 | |
of which between 40 and 49 years | | 90 | | 91 | | 87 | | 87 | |
of which over 50 years | | 78 | | 63 | | 58 | | 51 | |
Employee turnover | | 2015 | | 2014 | | 2013 | | 2012 | |
Number of employees who left employment | | 17 | | 22 | | 16 | | 16 | |
of which women | | 5 | | 10 | | 5 | | 8 | |
of which men | | 12 | | 12 | | 11 | | 8 | |
of which under the age of 30 years | | 2 | | 2 | | 1 | | 1 | |
of which between 30 and 50 years | | 11 | | 14 | | 13 | | 9 | |
of which over 50 years | | 4 | | 6 | | 2 | | 6 | |
of which geographically located in Sweden | | 17 | | 21 | | 16 | | 16 | |
of which geographically located in Singapore | | 0 | | 1 | | — | | — | |
Health | | 2015 | | 2014 | | 2013 | | 2012 | |
Absence due to sickness | | 3.1 | % | 2.5 | % | 2.5 | % | 2.6 | % |
Percentage of employees that use SEK’s fitness allowance | | 79.0 | % | 93.0 | % | 93.0 | % | 84.0 | % |
Equality and diversity | | 2015 | | 2014 | | 2013 | | 2012 | |
Allocation of women/men on the Board of Directors | | 50/50 | | 43/57 | | 50/50 | | 50/50 | |
Allocation of women/men in SEK’s executive management | | 50/50 | | 57/43 | | 43/57 | | 43/57 | |
Allocation of women/men in management positions | | 38/62 | | 41/59 | | 44/56 | | 39/61 | |
Allocation of women/men at SEK in total | | 47/53 | | 46/54 | | 46/54 | | 48/52 | |
Allocation of employees with foreign/swedish background1 | | 30/70 | | 29/71 | | 29/71 | | 28/72 | |
(1) Percentage of employees that state they are raised in another country or have at least one parent born in another country.
Employee development | | 2015 | | 2014 | | 2013 | | 2012 | |
Percentage of employees who had a performance review (percent) | | 98 | | 92 | | 93 | | 87 | |
Average number of training days per employee (all employees are white-collar workers) | | 2 | | 2 | | 2 | | 5 | |
Note 6. Other administrative expenses
| | Consolidated Group | |
Skr mn | | 2015 | | 2014 | | 2013 | |
Travel expenses and marketing | | -9 | | -11 | | -12 | |
IT and information system (fees incl.) | | -79 | | -80 | | -74 | |
Other fees | | -40 | | -41 | | -65 | |
Premises(1) | | -27 | | -27 | | -27 | |
Other | | -9 | | -7 | | -7 | |
Total other administrative expenses | | -164 | | -166 | | -185 | |
(1)SEK is a partner in rental agreements of office space in Stockholm, Gothenburg and Singapore.
Cost of operating leases
| | Consolidated Group | |
Skr mn | | 2015 | | 2014 | | 2013 | |
Leases | | -26 | | -26 | | -26 | |
The primary cost relates to SEK’s office premises.
F-29
Table of Contents
Future minimum rentals payable under non-cancellable operating leases are as follows
| | Consolidated Group | |
Skr mn | | December 31, 2015 | | December 31, 2014 | | December 31, 2013 | |
Within 1 year | | -26 | | -26 | | -26 | |
Between 1 and 5 years | | -145 | | -23 | | -49 | |
More than 5 years | | — | | — | | — | |
Total future minimum rentals payable under non-cancellable operating leases Remuneration to auditors | | -171 | | -49 | | -75 | |
| | Consolidated Group | |
Skr mn | | 2015 | | 2014 | | 2013 | |
Ernst & Young: | | | | | | | |
Audit fee(1) | | -11 | | -12 | | -12 | |
Audit related fee(2) | | 0 | | 0 | | 0 | |
Tax related fee(3) | | 0 | | 0 | | 0 | |
Total | | -11 | | -12 | | -12 | |
(1) Fees related to audit of annual financial statements, reviews of interim financial statements, attestation services that are provided in connection with statutory, regulatory and stock exchange filings or engagements and services provided in connection with issuances of debt.
(2) Fees charged for assurance and related services that are related to the performance of audit or review of the financial statements.
(3) Fees for professional services rendered by the principal independent auditors for tax compliance and tax advice.
In the financial statements remuneration to auditors is mainly included in Other administrative expenses.
F-30
Table of Contents
Note 7. Tangible and intangible assets
| | Consolidated Group | |
Skr mn | | December 31, 2015 | | December 31, 2014 | |
| | | | | |
Buildings(1) | | | | | |
Acquisition cost at the beginning of the year/accumulated acquisitions | | — | | 1 | |
Sales or disposals of the year | | — | | -1 | |
Accumulated depreciation at the beginning of the year | | — | | -1 | |
Depreciation of the year | | — | | 0 | |
Reversed depreciation due to sale or disposals | | — | | 1 | |
Accumulated depreciation | | — | | 0 | |
Book value | | — | | — | |
| | | | | |
Land(1) | | | | | |
Acquisition cost at the beginning of the year/accumulated acquisitions | | — | | 0 | |
Book value | | — | | — | |
| | | | | |
Office and building equipment | | | | | |
Acquisition cost at the beginning of the year | | 83 | | 77 | |
Sales or disposals of the year | | -1 | | -3 | |
Acquisitions of the year | | 8 | | 9 | |
Accumulated acquisitions | | 90 | | 83 | |
| | | | | |
Accumulated depreciation at the beginning of the year | | -57 | | -46 | |
Reversed depreciation due to sale or disposals | | 1 | | 2 | |
Depreciation during the year | | -13 | | -13 | |
Accumulated depreciation | | -69 | | -57 | |
Book value | | 21 | | 26 | |
| | | | | |
Intangible assets(2) | | | | | |
Acquisition cost at beginning of the year | | 314 | | 268 | |
Sales or disposals of the year | | 0 | | 0 | |
Acquisitions of the year | | 59 | | 46 | |
Accumulated acquisitions | | 373 | | 314 | |
| | | | | |
Accumulated depreciation at the beginning of the year | | -179 | | -149 | |
Impairment | | -55 | | — | |
Sales or disposals of the year | | 0 | | 0 | |
Depreciation of the year | | -30 | | -30 | |
Accumulated depreciation | | -264 | | -179 | |
Book value | | 109 | | 135 | |
| | | | | |
Net book value | | | | | |
Property, land and equipment | | 21 | | 26 | |
Intangible assets | | 109 | | 135 | |
Total net book value | | 130 | | 161 | |
| | | | | |
Depreciation and impairment during the year according to the Consolidated Statement of Comprehensive Income | | -98 | | -43 | |
F-31
Table of Contents
(1) Holiday Homes in Sälen were sold in December 2014, which generated a capital gain of Skr 1.6 million.
(2) Intangible assets consist of the capitalized portion of investments in IT systems. The average useful life for intangible assets is 5 years.
Note 8. Leasing
Financial leases - Lessors
All SEK’s leasing transactions are classified as financial leases. When making such classification all aspects regarding the leasing contract, including third party guarantees, are taken into account.
A reconciliation between the gross investment in the leases and the present value of minimum lease payments receivable at the end of the reporting period can be found below. Future lease payments receivable will mature in the following periods:
| | Consolidated Group | |
| | December 31, 2015 | | December 31, 2014 | |
Skr mn | | Gross
investment | | Present
value of
minimum
lease
payments | | Gross
investment | | Present
value of
minimum
lease
payments | |
No later than one year | | 131 | | 111 | | 746 | | 719 | |
Later than one year and no later than five years | | 305 | | 268 | | 278 | | 232 | |
Later than five years | | 46 | | 43 | | 77 | | 71 | |
Total | | 482 | | 422 | | 1,101 | | 1,022 | |
| | | | | | | | | |
Unearned finance income | | — | | 60 | | — | | 79 | |
Unguaranteed residual value | | — | | — | | — | | — | |
Total | | 482 | | 482 | | 1,101 | | 1,101 | |
All lease agreements are classified as Loans and receivables. The leases are included in the line item “Loans to the public” in the statement of financial position.
F-32
Table of Contents
Note 9. Impairment and past-due receivables
| | Consolidated Group | |
Skr mn | | 2015 | | 2014 | | 2013 | |
Credit losses(1) | | -33 | (2) | -30 | | -68 | |
Reversal of previous impairment(1),(3) | | 279 | (5) | 378 | (4) | 22 | |
Net impairment and reversals | | 246 | | 348 | | -46 | |
Established losses(3) | | -211 | (5) | -277 | (4) | -3 | |
Recovered credit losses | | 1 | | 2 | | 10 | |
Net credit losses | | 36 | | 73 | | -39 | |
of which related to loans(7) | | 35 | | 11 | | -32 | |
of which related to liquidity placements(7) | | 1 | | 62 | | -7 | |
| | | | | | | |
Reserve of impairment of financial assets | | | | | | | |
Opening balance | | -464 | | -757 | | -711 | |
Reserves used to cover write-offs (charge-offs)(1) | | -9 | | -5 | | — | |
Net impairment and reversals | | 246 | | 348 | | -46 | |
Currency effects(8) | | -9 | | -50 | | 0 | |
Closing balance | | -236 | | -464 | | -757 | |
of which related to loans(7) | | -228 | | -236 | | -260 | |
of which related to liquidity placements (7) | | -8 | | -228 | | -497 | |
(1) The amount for 2015 includes a reversal of Skr 70 million related to bad debts not linked to a specific counterparty (2014: A provision of Skr 30 million; 2013: Skr 10 million). As a result, the reserve for bad debts not linked to a specific counterparty now amounts to Skr 170 million (year-end 2014: Skr 240 million; year-end 2013: Skr 210 million). The reversal of the reserve was due to the sale of positions in the securitization transactions during 2015 and a change in the calculation of the risk parameters for credit risk in the calculation of the reserve. SEK establishes the reserve according to a methodology based on both quantitative and qualitative analysis of all exposures accounted for at amortized cost.
(2) A provision of Skr 33 million was made during 2015 in order to cover expected future credit loss.
(3) SEK has previously had two assets in the form of CDOs, which are first-priority-tranches with end-exposure to the U.S. sub-prime market, see footnotes 4 and 5 below.
(4) Underlying assets, concerning one of these CDOs, were liquidated during 2014 and the final payment for the CDO has been obtained. The reserve Skr 268 million related to the CDO was dissolved, the established loss amounted to Skr 259 million.
(5) The other CDO was sold during 2015, as such the corresponding reserve was dissolved. A reversal of Skr 206 million (2014:Skr 4 million;2013:Skr 3 million) was recorded during 2015 and the established loss amounted to Skr 211 million (2014:Skr - million; 2013: Skr - million). During 2014 part of the reserve was reversed in connection with an amortization. Consequently the reserve for this CDO was dissolved (year-end 2014: Skr 189 million). Gross book value before impairment was Skr 222 million 2014.
(6) SEK has had a restructured receivable where final settlement occurred during 2014. The result of the final settlement came to a reversal of Skr 46 million, and an established loss of Skr 18 million in 2014.
(7) See Note 11 to the Consolidated Financial Statements for definitions.
(8) Currency effects are reported within Net results of financial transactions (see further Note 4 to the Consolidated Financial Statements).
F-33
Table of Contents
Past-due receivables
Receivables past due have been recorded to reflect the amounts expected to actually be received at settlement.
| | Consolidated Group | |
Skr mn | | 2015 | | 2014 | |
Past-due receivables: | | | | | |
Aggregate amount of principal and interest less than, or equal to, 90 days past-due | | 387 | | 5 | |
Aggregate amount of principal and interest more than 90 days past-due(1),(2) | | 358 | | 11 | |
Principal amount not past-due on such receivables(2) | | 4,923 | | 144 | |
(1) Of the aggregate amount of principal and interest past due, Skr 97 million (year-end 2014: Skr 10 million) was due for payment more than three but less than, or equal to, six months before the end of the reporting period, Skr 64 million (year-end 2014: Skr 1 million) was due for payment more than six but less than, or equal to, nine months before the end of the reporting period and Skr 197 million (year-end 2014: Skr 0 million) was due for payment more than nine months before the end of the reporting period.
(2) As of 2015, SEK has two large unsettled amounts, which represent the main part of total loans outstanding. The first unsettled loan in question, which is under renegotiation, is fully covered by adequate guarantees and therefore no loan loss reserve has been made. The second unsettled loan developed during 2015 is to a large extent covered by adequate guarantees why expected future credit loss is limited in relation to the amount stated in Past-Due Receivables above. The credit loss reserve for the second unsettled loan is Skr 33 million.
F-34
Table of Contents
Note 10. Taxes
| | Consolidated Group | |
Skr mn | | 2015 | | 2014 | | 2013 | |
| | | | | | | |
Income tax | | | | | | | |
Adjustment previous year | | 0 | | 1 | | 0 | |
Current tax | | -348 | | -291 | | -278 | |
Deferred tax | | 0 | | -79 | | -40 | |
Total income tax | | -348 | | -369 | | -318 | |
| | | | | | | |
Income tax related to other comprehensive income | | | | | | | |
Tax on items to be reclassified to profit or loss | | | | | | | |
Current tax | | -63 | | -6 | | -1 | |
Deferred tax | | 112 | | -69 | | 90 | |
Tax on items not to be reclassified to profit or loss | | | | | | | |
Deferred tax | | -11 | | 10 | | -14 | |
Income tax related to other comprehensive income | | 38 | | -65 | | 75 | |
| | | | | | | |
Reconciliation of effective tax rate | | | | | | | |
The Swedish corporate tax rate, % | | 22.0 | | 22.0 | | 22.0 | |
Profit before taxes | | 1,535 | | 1,629 | | 1,408 | |
| | | | | | | |
National tax based on profit before taxes | | -338 | | -358 | | -310 | |
Tax effects of: | | | | | | | |
Non-deductible expenses | | -2 | | -1 | | -2 | |
Imputed interest on tax allocation reserve | | -5 | | -10 | | -6 | |
Other | | -3 | | 0 | | 0 | |
Total tax | | -348 | | -369 | | -318 | |
Effective tax expense in % | | 22.7 | | 22.7 | | 22.6 | |
| | Consolidated Group | |
Skr mn | | 2015 | | 2014 | |
Deferred tax assets concerning: | | | | | |
Temporary differences, related to pensions | | 1 | | 12 | |
Other temporary differences | | 0 | | 0 | |
Total deferred tax assets | | 1 | | 12 | |
| | | | | |
Deferred tax liabilities concerning: | | | | | |
Untaxed reserves | | 721 | | 721 | |
Temporary differences, financial instruments - Cash flow hedges | | — | | 112 | |
Total deferred tax liabilities | | 721 | | 833 | |
Net deferred tax liabilities (+) / tax assets (-) | | 720 | | 821 | |
No deductible loss carry forwards existed per December 31, 2015 or December 31, 2014.
F-35
Table of Contents
Change in deferred taxes | | Consolidated Group | |
Skr mn | | 2015 | | 2014 | |
Opening balance | | 821 | | 683 | |
Change through profit or loss | | 0 | | 79 | |
Change in other comprehensive income | | -101 | | 59 | |
Total | | 720 | | 821 | |
Note 11. Loans and liquidity investments
SEK treats loans in the form of interest-bearing securities as a part of SEK’s total loans. SEK’s total loans and liquidity investments are calculated as follows:
| | Consolidated Group | |
Skr mn | | December 31,
2015 | | December 31,
2014 | |
Loans: | | | | | |
Loans in the form of interest-bearing securities | | 48,107 | | 53,140 | |
Loans to credit institutions | | 29,776 | | 25,510 | |
Loans to the public | | 140,806 | | 149,240 | |
Less: | | | | | |
Cash collateral under the security agreements for derivative contracts | | -13,592 | | -9,668 | |
Deposits with time to maturity exceeding three months | | 0 | | 0 | |
Total loans | | 205,097 | | 218,222 | |
| | | | | |
Liquidity placements: | | | | | |
Cash and cash equivalents (1) | | 2,257 | | 7,099 | |
Cash collateral under the security agreements for derivative contracts | | 13,592 | | 9,668 | |
Deposits with time to maturity exceeding three months | | 0 | | 0 | |
Treasuries/government bonds | | 2,006 | | 3,458 | |
Other interest-bearing securities except loans | | 40,831 | | 66,398 | |
Total liquidity placements | | 58,686 | | 86,623 | |
| | | | | |
of which | | | | | |
issued by public authorities | | 15,456 | | 41,502 | |
quoted on an exchange | | 71,641 | | 87,289 | |
(1) Cash and cash equivalents include, in this context, cash at banks where amounts can be immediately converted into cash and short-term deposits where the time to maturity does not exceed three months from trade date.
Regarding reserves, impairment and recovery see Note 9 to the Consolidated Financial Statements. Interest-bearing securities not carried at fair value and that exceed or fall short of the amount contractually required to be settled at maturity are reported below with the amount that exceeds or falls short of the nominal amount.
| | Consolidated Group | |
Skr mn | | December 31,
2015 | | December 31,
2014 | |
Sum of amounts exceeding nominal | | 14 | | 8 | |
Sum of amounts falling below nominal | | -36 | | -28 | |
F-36
Table of Contents
Volume Development, Lending
| | Consolidated Group | | | | of which S-system | | | |
| | Total | | | | | | Total | | Total | |
| | | | | | CIRR-
loans | | Concessionary
loans | | | | | |
Skr mn | | 2015 | | 2014 | | 2015 | | 2015 | | 2015 | | 2014 | |
Offers of long-term loans accepted | | 104,583 | | 57,118 | | 50,825 | | — | | 50,825 | | 5,668 | |
Undisbursed loans at year-end | | 63,438 | | 16,028 | | 54,598 | | 40 | | 54,638 | | 7,529 | |
Loans outstanding at year-end | | 205,097 | | 218,222 | | 43,128 | | 949 | | 44,077 | | 48,298 | |
Outstanding loans as per loan type
| | Consolidated Group | | of which the S-system | |
Skr mn | | December 31,
2015 | | December 31,
2014 | | December 31, 2015 | | December 31,
2014 | |
Total lending for export of capital products | | 135,908 | | 144,285 | | 44,077 | | 48,298 | |
Other lending related to export | | 61,545 | | 66,504 | | — | | — | |
Lending related to infrastructure | | 7,644 | | 7,433 | | — | | — | |
Total lending | | 205,097 | | 218,222 | | 44,077 | | 48,298 | |
Outstanding loans as per business area
| | Consolidated Group | | of which the S-system | |
Skr mn | | December 31,
2015 | | December 31,
2014 | | December 31, 2015 | | December 31,
2014 | |
End-customer finance | | 118,284 | | 128,165 | | 44,077 | | 48,298 | |
Corporate lending | | 86,813 | | 90,057 | | — | | — | |
Total lending | | 205,097 | | 218,222 | | 44,077 | | 48,298 | |
Note 12 Classification of financial assets and liabilities
Financial assets by accounting category
| | December 31, 2015 | |
| | Financial assets at fair
value through profit or loss | | Derivatives used
for hedge
accounting | | Available-
for-sale | | Loans and
receivables(1) | | Total | |
Skr mn | | Held-for-trading(2) | | Designated
upon initial
recognition
(FVO)(3) | | | | | | | | | |
Cash and cash equivalents | | — | | — | | — | | — | | 2,258 | | 2,258 | |
Treasuries/government bonds | | — | | — | | — | | 2,006 | | — | | 2,006 | |
Other interest-bearing securities except loans(4) | | — | | 1,568 | | — | | 38,061 | | 1,202 | | 40,831 | |
Loans in the form of interest-bearing securities | | — | | 728 | | — | | — | | 47,379 | | 48,107 | |
Loans to credit institutions | | | | | | | | | | 29,776 | | 29,776 | |
Loans to the public | | — | | — | | — | | — | | 140,806 | | 140,806 | |
Derivatives(5) | | 6,213 | | — | | 6,459 | | — | | — | | 12,672 | |
Total financial assets | | 6,213 | | 2,296 | | 6,459 | | 40,067 | | 221,421 | | 276,456 | |
F-37
Table of Contents
Financial liabilities by accounting category
| | December 31, 2015 | |
| | Financial liabilities at fair value
through profit or loss | | Derivatives
used for
hedge
accounting | | Other
financial
liabilities(6) | | Total | |
Skr mn | | Held-for-
trading(2) | | Designated
upon initial
recognition
(FVO)(7) | | | | | | | |
Borrowing from credit institutions | | — | | — | | — | | 5,283 | | 5,283 | |
Borrowing from the public | | — | | — | | — | | 61 | | 61 | |
Senior securities issued(8) | | — | | 58,926 | | — | | 169,286 | | 228,212 | |
Derivatives(5) | | 17,628 | | — | | 6,003 | | — | | 23,631 | |
Subordinated securities issued | | — | | — | | — | | 2,088 | | 2,088 | |
Total financial liabilities | | 17,628 | | 58,926 | | 6,003 | | 176,718 | | 259,275 | |
Financial assets by accounting category
| | December 31, 2014 | |
| | Financial assets at fair
value through profit or loss | | Derivatives used
for hedge
accounting | | Available-
for-sale | | Loans and
receivables(1) | | Total | |
Skr mn | | Held-for-
trading(2) | | Designated
upon initial
recognition
(FVO)(3) | | | | | | | | | |
Cash and cash equivalents | | — | | — | | — | | — | | 7,099 | | 7,099 | |
Treasuries/government bonds | | — | | — | | — | | 3,458 | | — | | 3,458 | |
Other interest-bearing securities except loans(4) | | — | | 1,670 | | — | | 57,320 | | 7,408 | | 66,398 | |
Loans in the form of interest-bearing securities | | — | | 1,358 | | — | | — | | 51,782 | | 53,140 | |
Loans to credit institutions | | — | | — | | — | | — | | 25,510 | | 25,510 | |
Loans to the public | | — | | — | | — | | — | | 149,240 | | 149,240 | |
Derivatives(5) | | 9,042 | | — | | 6,975 | | — | | — | | 16,017 | |
Total financial assets | | 9,042 | | 3,028 | | 6,975 | | 60,778 | | 241,039 | | 320,862 | |
Financial liabilities by accounting category
| | December 31, 2014 | |
| | Financial liabilities at fair value
through profit or loss | | Derivatives
used for
hedge
accounting | | Other
financial
liabilities(6) | | Total | |
Skr mn | | Held-for-
trading(2) | | Designated
upon initial
recognition
(FVO)(7) | | | | | | | |
Borrowing from credit institutions | | — | | — | | — | | 8,290 | | 8,290 | |
Borrowing from the public | | — | | — | | — | | 63 | | 63 | |
Senior securities issued(8) | | — | | 82,262 | | — | | 191,577 | | 273,839 | |
Derivatives(5) | | 13,319 | | — | | 5,567 | | — | | 18,886 | |
Subordinated securities issued | | — | | — | | — | | 1,945 | | 1,945 | |
Total financial liabilities | | 13,319 | | 82,262 | | 5,567 | | 201,875 | | 303,023 | |
(1) Of loans and receivables, 9 percent (year-end 2014: 9 percent) are subject to fair-value hedge accounting. The remaining 91 percent (year-end 2014: 91 percent) are not subject to hedge accounting and are therefore valued at amortized cost. During 2014, the derivatives designated as hedging instruments in cash-flow hedges were terminated and the hedging designation were discontinued.
F-38
Table of Contents
(2) The derivatives held for economic hedging, is classified as held-for-trading in accordance with IAS39.
(3) The amount of cumulative change in the fair value of financial assets attributable to changes in credit risk was Skr 0 million (2014: Skr 3 million), which decreased the value of financial assets. The change during 2015 amounted to Skr -3 million (2014: Skr 25 million; 2013: Skr -5) which decreased the value of financial assets and affected operating profit negatively.
(4) During 2015 most of the Asset Backed Securities were sold. The remaining assets have been reclassified from loans and receivables to available-for-sale.
(5) The derivatives fair value originating from credit risk amounted to Skr -23 million as of December 31, 2015, (year-end 2014: Skr -19 million). The change for the period January 1 to December 31, 2015, amounted to Skr -4 million (2014: Skr -12 million; 2013: Skr -7 million), which negatively affected operating profit. This valuation was made on the counterparty level.
(6) Of other financial liabilities, 72 percent (year-end 2014: 71 percent) are subject to fair-value hedge accounting, the remaining 28 percent (year-end 2014: 29 percent) are not subject to hedge accounting and are therefore valued at amortized cost.
(7) Accumulated changes in the fair value of financial liabilities attributable to changes in SEK’s credit spread amounted to Skr -384 million (year-end 2014: Skr —471 million), which represents a cumulative increase in the book value of liabilities. For the period January 1 to December 31, 2015, the credit risk component decreased by Skr 87 million, which decreased the value of financial liabilities and affected operating profit positively. For the period January 1 to December 31, 2014, the credit risk component increased by Skr 150 million, which increased the value of financial liabilities and affected operating profit negatively. (2013: decreased with Skr 433).
(8) Repayments of long-term debt amounting to approximately Skr -74.5 billion (2014: Skr -67.7 billion; 2013: Skr -59.8 billion) were effectuated and SEK’s own debt repurchase and early redemption amounted to approximately Skr -41.0 billion (2014: Skr -25.8 billion; 2013: Skr -44.8 billion).
Reclassification
As of July 1, 2008, and October 1, 2008, SEK reclassified certain assets, moving those assets to the category “loans and receivables” from the category “assets available-for-sale”. The reason for the reclassification was that those assets had been illiquid due to the extraordinary market conditions which existed during late 2008 owing to the global financial crisis, and SEK assessed itself to be able to hold the assets to maturity. Therefore there was no need for impairment of such assets. The reclassified assets consist of interest-bearing fixed rate bonds. At the time of the reclassification, the expected cash flows of the reclassified assets were equal to the contractual amounts, including principal and interest.
Had not SEK chosen the reclassification option, other comprehensive income would have decreased by Skr -5 million for the period January 1 to December 31, 2015. (2014: Skr -4 million; 2013: Skr -18 million).
Skr mn | | December 31, 2015 | | December 31, 2014 | |
Reclassified financial assets | | Nominal value | | Book value | | Fair value | | Nominal value | | Book value | | Fair value | |
Loans in the form of interest-bearing securities | | 420 | | 439 | | 440 | | 533 | | 569 | | 576 | |
F-39
Table of Contents
Note 13 Financial assets and liabilities at fair value
| | December 31, 2015 | |
Consolidated Group | | Book value | | Fair value | | Surplus value (+)
/Deficit value (-) | |
Skr mn | | |
Cash and cash equivalents | | 2,258 | | 2,258 | | 0 | |
Treasuries/governments bonds | | 2,006 | | 2,006 | | 0 | |
Other interest-bearing securities except loans | | 40,831 | | 40,874 | | 43 | |
Loans in the form of interest-bearing securities | | 48,107 | | 48,982 | | 875 | |
Loans to credit institutions | | 29,776 | | 29,771 | | -5 | |
Loans to the public | | 140,806 | | 142,619 | | 1,813 | (1) |
Derivatives | | 12,672 | | 12,672 | | 0 | |
Total financial assets | | 276,456 | | 279,182 | | 2,726 | |
| | | | | | | |
Borrowing from credit institutions | | 5,283 | | 5,267 | | -16 | |
Borrowing from the public | | 61 | | 61 | | 0 | |
Senior securities issued | | 228,212 | | 229,128 | | 916 | |
Derivatives | | 23,631 | | 23,631 | | 0 | |
Subordinated securities issued | | 2,088 | | 2,077 | | -11 | |
Total financial liabilities | | 259,275 | | 260,164 | | 889 | |
| | December 31, 2014 | |
Consolidated Group | | | | | | Surplus value (+) | |
Skr mn | | Book value | | Fair value | | /Deficit value (-) | |
Cash and cash equivalents | | 7,099 | | 7,099 | | 0 | |
Treasuries/governments bonds | | 3,458 | | 3,458 | | 0 | |
Other interest-bearing securities except loans | | 66,398 | | 66,292 | | -106 | |
Loans in the form of interest-bearing securities | | 53,140 | | 54,664 | | 1,524 | |
Loans to credit institutions | | 25,510 | | 25,533 | | 23 | |
Loans to the public | | 149,240 | | 151,543 | | 2,303 | (1) |
Derivatives | | 16,017 | | 16,017 | | 0 | |
Total financial assets | | 320,862 | | 324,606 | | 3,744 | |
| | | | | | | |
Borrowing from credit institutions | | 8,290 | | 8,350 | | 60 | |
Borrowing from the public | | 63 | | 63 | | 0 | |
Senior securities issued | | 273,839 | | 275,249 | | 1,410 | |
Derivatives | | 18,886 | | 18,886 | | 0 | |
Subordinated securities issued | | 1,945 | | 1,937 | | -8 | |
Total financial liabilities | | 303,023 | | 304,485 | | 1,462 | |
(1) Skr 1,452 million of the surplus value (year-end 2014: Skr 1,662 million) is related to CIRR loans within the S-system. See note 24 to the Consolidated Financial Statements for more information regarding the S-system.
The majority of financial liabilities and some of the financial assets in the statement of financial position are accounted for at full fair value or at a value that represents fair value for the components hedged in a hedging relationship. However, loans and receivables and other financial liabilities which are neither subject to hedge accounting nor carried at fair value using fair value option, are accounted for at amortized cost.
Determining fair value of financial instruments
The best evidence of fair value is quoted prices in an active market. The majority of SEK’s financial instruments are not publicly traded, and quoted market values are not readily available.
Fair value measurements are categorized using a fair value hierarchy. The financial instruments have been categorized under the three levels of the IFRS fair value hierarchy that reflects the significance of inputs. The categorization of these instruments is based on the lowest level of input that is significant to the fair value measurement in its entirety.
F-40
Table of Contents
SEK uses the following hierarchy for determining and disclosing the fair value of financial instruments based on valuation techniques:
Level 1: quoted (unadjusted) prices in active markets for identical assets or liabilities;
Level 2: other techniques for which all inputs which have a significant effect on the recorded fair value are observable, either directly or indirectly; and
Level 3: techniques which use inputs which have a significant effect on the recorded fair value that are not based on observable market data.
For more information on determining the fair value of financial transactions, see Note 1 to the Consolidated Financial Statements.
In the process of estimating or deriving fair values for items accounted for at amortized cost, certain assumptions have been made. In those cases where quoted market values for the relevant items are available, such market values have been used.
The table below shows the fair values of the items carried at amortized cost or fair value. They are distributed according to the fair value hierarchy.
Financial assets reported at amortized cost in fair value hierarchy
Consolidated Group | | December 31, 2015 | |
Loans and accounts receivable | | Fair value | | Book value | |
Skr mn | | Level 1 | | Level 2 | | Level 3 | | Total | | Total | |
Cash and cash equivalents | | 2,258 | | — | | — | | 2,258 | | 2,258 | |
Treasuries/governments bonds | | — | | — | | — | | — | | — | |
Other interest-bearing securities except loans | | — | | 1,245 | | — | | 1,245 | | 1,202 | |
Loans in the form of interest-bearing securities | | 1,833 | | 46,421 | | — | | 48,254 | | 47,379 | |
Loans to credit institutions | | — | | 29,771 | | — | | 29,771 | | 29,776 | |
Loans to the public | | — | | 142,619 | | — | | 142,619 | | 140,806 | |
Total financial assets in fair value hierarchy | | 4,091 | | 220,056 | | — | | 224,147 | | 221,421 | |
Financial liabilities reported at amortized cost in fair value hierarchy
Consolidated Group | | December 31, 2015 | |
Other financial liabilities | | Fair value | | Book value | |
Skr mn | | Level 1 | | Level 2 | | Level 3 | | Total | | Total | |
Borrowing from credit institutions | | — | | 5,267 | | — | | 5,267 | | 5,283 | |
Borrowing from the public | | — | | 61 | | — | | 61 | | 61 | |
Senior securities issued | | — | | 170,202 | | — | | 170,202 | | 169,286 | |
Subordinated securities issued | | — | | 2,077 | | — | | 2,077 | | 2,088 | |
Total financial liabilities in fair value hiearchy | | — | | 177,607 | | — | | 177,607 | | 176,718 | |
Financial assets reported at amortized cost in fair value hierarchy
Consolidated Group | | December 31, 2014 |
Loans and accounts receivable | | Fair value | | Book value | |
Skr mn | | Level 1 | | Level 2 | | Level 3 | | Total | | Total | |
Cash and cash equivalents | | 7,099 | | — | | — | | 7,099 | | 7,099 | |
Treasuries/governments bonds | | — | | — | | — | | — | | — | |
Other interest-bearing securities except loans | | 489 | | 6,813 | | — | | 7,302 | | 7,408 | |
Loans in the form of interest-bearing securities | | 2,303 | | 51,003 | | — | | 53,306 | | 51,782 | |
Loans to credit institutions | | — | | 25,533 | | — | | 25,533 | | 25,510 | |
Loans to the public | | — | | 151,543 | | — | | 151,543 | | 149,240 | |
Total financial assets in fair value hierarchy | | 9,891 | | 234,892 | | — | | 244,783 | | 241,039 | |
F-41
Table of Contents
Financial liabilities reported at amortized cost in fair value hierarchy
Consolidated Group | | December 31, 2014 | |
Other financial liabilities | | Fair value | | Book value | |
Skr mn | | Level 1 | | Level 2 | | Level 3 | | Total | | Total | |
Borrowing from credit institutions | | — | | 8,350 | | — | | 8,350 | | 8,290 | |
Borrowing from the public | | — | | 63 | | — | | 63 | | 63 | |
Senior securities issued | | — | | 192,987 | | — | | 192,987 | | 191,577 | |
Subordinated securities issued | | — | | 1,937 | | — | | 1,937 | | 1,945 | |
Total financial liabilities in fair value hiearchy | | — | | 203,337 | | — | | 203,337 | | 201,875 | |
Financial assets reported at fair value in fair value hierarchy
| | December 31, 2015 | |
Consolidated Group | | Financial assets at fair value through profit or loss | | Available-for-sale | |
Skr mn | | Level 1 | | Level 2 | | Level 3 | | Total | | Level 1 | | Level 2 | | Level 3 | | Total | |
Cash and cash equivalents | | — | | — | | — | | — | | — | | — | | — | | — | |
Treasuries/governments bonds | | — | | — | | — | | — | | 2,006 | | — | | — | | 2,006 | |
Other interest-bearing securities except loans | | 1,191 | | 116 | | 261 | | 1,568 | | 1,244 | | 36,817 | | — | | 38,061 | |
Loans in the form of interest-bearing securities | | 271 | | 457 | | — | | 728 | | — | | — | | — | | — | |
Loans to credit institutions | | — | | — | | — | | — | | — | | — | | — | | — | |
Loans to the public | | — | | — | | — | | — | | — | | — | | — | | — | |
Derivatives | | 13 | | 10,771 | | 1,888 | | 12,672 | | — | | — | | — | | — | |
Total financial assets in fair value hierarchy | | 1,475 | | 11,344 | | 2,149 | | 14,968 | | 3,250 | | 36,817 | | — | | 40,067 | |
Financial liabilities reported at fair value in fair value hierarchy
| | December 31, 2015 | |
Consolidated Group | | Financial liabilities at fair value through profit or loss | |
Skr mn | | Level 1 | | Level 2 | | Level 3 | | Total | |
Borrowing from credit institutions | | — | | — | | — | | — | |
Borrowing from the public | | — | | — | | — | | — | |
Senior securities issued | | — | | 20,217 | | 38,709 | | 58,926 | |
Derivatives | | 23 | | 19,169 | | 4,439 | | 23,631 | |
Subordinated securities issued | | — | | — | | — | | — | |
Total financial liabilities in fair value hiearchy | | 23 | | 39,386 | | 43,148 | | 82,557 | |
During the period January to December 2015 no assets or liabilities were transferred from Level 1 to Level 2. Transfers to Level 3 of both assets and liabilities totalled Skr 236 million due to non-observable market data.
Financial assets reported at fair value in fair value hierarchy
| | December 31, 2014 | |
Consolidated Group | | Financial assets at fair value through profit or loss
or through other comprehensive income | | Available-for-Sale | |
Skr mn | | Level 1 | | Level 2 | | Level 3 | | Total | | Level 1 | | Level 2 | | Level 3 | | Total | |
Cash and cash equivalents | | — | | — | | — | | — | | — | | — | | — | | — | |
Treasuries/governments bonds | | — | | — | | — | | — | | 3,458 | | — | | — | | 3,458 | |
Other interest-bearing securities except loans | | 1,291 | | 113 | | 266 | | 1,670 | | 1,321 | | 55,999 | | — | | 57,320 | |
Loans in the form of interest-bearing securities | | 855 | | 503 | | — | | 1,358 | | — | | — | | — | | — | |
Loans to credit institutions | | — | | — | | — | | — | | — | | — | | — | | — | |
Loans to the public | | — | | — | | — | | — | | — | | — | | — | | — | |
Derivatives | | 12 | | 12,439 | | 3,566 | | 16,017 | | — | | — | | — | | — | |
Total financial assets in fair value hierarchy | | 2,158 | | 13,055 | | 3,832 | | 19,045 | | 4,779 | | 55,999 | | — | | 60,778 | |
F-42
Table of Contents
Financial liabilities reported at fair value in fair value hierarchy
| | December 31, 2014 | |
Consolidated Group | | Financial liabilities at fair value through profit or loss or through other comprehensive income | |
Skr mn | | Level 1 | | Level 2 | | Level 3 | | Total | |
Borrowing from credit institutions | | — | | — | | — | | — | |
Borrowing from the public | | — | | — | | — | | — | |
Senior securities issued | | — | | 27,504 | | 54,756 | | 82,260 | |
Derivatives | | 44 | | 15,624 | | 3,218 | | 18,886 | |
Subordinated securities issued | | — | | — | | — | | — | |
Total financial liabilities in fair value hiearchy | | 44 | | 43,128 | | 57,974 | | 101,146 | |
During 2014 no assets or liabilities were transferred between Level 1 and Level 2. Transfers to Level 3 of liabilities totalled Skr 8 million as a result of observable market data no longer being available.
Financial assets at fair value in level 3
| | 2015 | |
| | | | | | | | | | | | Gains (+) and
losses (-) | | Gains and losses
in | | | | Of which
unrealized
gains (+) and
losses (-) | |
Consolidated Group | | January 1, | | | | Settlements & | | | | Transfers | | through profit | | comprehensive | | December | | through profit | |
Skr mn | | 2015 | | Purchases | | sales | | Transfers to level 3 | | from level 3 | | or loss (1) | | income | | 31, 2015 | | or loss | |
Other interest-bearing securities except loans | | 266 | | 261 | | -260 | | 0 | | — | | -7 | | — | | 261 | | -5 | |
Derivatives | | 3,566 | | 113 | | -2,060 | | 22 | | — | | 247 | | — | | 1,888 | | -857 | |
Total financial assets at fair value in level 3 | | 3,832 | | 374 | | -2,320 | | 22 | | — | | 240 | | — | | 2,149 | | -862 | |
Financial liabilities at fair value in level 3
| | 2015 | |
| | | | | | | | | | | | | | | | | | | |
| | | | | | | | | | | | Gains (-) and
losses (+) | | Gains and losses
in | | | | Of which
unrealized
gains (-) and
losses (+) | |
Consolidated Group | | January 1, | | | | Settlements & | | | | Transfers | | through profit | | comprehensive | | December | | through profit | |
Skr mn | | 2015 | | Issues | | buy-backs | | Transfers to level 3 | | from level 3 | | or loss (1) | | income | | 31, 2015 | | or loss | |
Senior securities issued | | 54,756 | | 11,970 | | -30,443 | | 214 | | — | | 2,211 | | — | | 38,709 | | -2,520 | |
Derivatives | | 3,218 | | 1,099 | | -1,081 | | — | | — | | 1,202 | | — | | 4,439 | | 1,526 | |
Total financial liabilities at fair value in level 3 | | 57,974 | | 13,069 | | -31,524 | | 214 | | — | | 3,413 | | — | | 43,148 | | -994 | |
Financial assets at fair value in level 3
| | 2014 | |
| | | | | | | | | | | | Gains (+) and
losses (-) | | Gains and losses
in | | | | Of which
unrealized
gains (+) and
losses (-) | |
Consolidated Group | | January 1, | | | | Settlements & | | | | Transfers | | through profit | | comprehensive | | December | | through profit | |
Skr mn | | 2014 | | Purchases | | sales | | Transfers to level 3 | | from level 3 | | or loss (1) | | income | | 31, 2014 | | or loss | |
Other interest-bearing securities except loans | | 262 | | — | | — | | — | | — | | 4 | | — | | 266 | | 5 | |
Derivatives | | 3,631 | | -20 | | -1,453 | | — | | — | | 1,408 | | — | | 3,566 | | 3,114 | |
Total financial assets at fair value in level 3 | | 3,893 | | -20 | | -1,453 | | — | | — | | 1,412 | | — | | 3,832 | | 3,119 | |
Financial liabilities at fair value in level 3
| | 2015 | |
| | | | | | | | | | | | | | | | | | | |
| | | | | | | | | | | | Gains (-) and
losses (+) | | Gains and losses
in | | | | Of which
unrealized
gains (-) and
losses (+) | |
Consolidated Group | | January 1, | | | | Settlements & | | | | Transfers | | through profit | | comprehensive | | December | | through profit | |
Skr mn | | 2015 | | Issues | | buy-backs | | Transfers to level 3 | | from level 3 | | or loss (1) | | income | | 31, 2015 | | or loss | |
Senior securities issued | | 55,393 | | 11,419 | | -24,316 | | 8 | | — | | 12,252 | | — | | 54,756 | | 3,803 | |
Derivatives | | 3,508 | | 920 | | -460 | | — | | — | | -750 | | — | | 3,218 | | -23 | |
Total financial liabilities at fair value in level 3 | | 58,901 | | 12,339 | | -24,776 | | 8 | | — | | 11,502 | | — | | 57,974 | | 3,780 | |
(1) Gains and losses through profit or loss, including the impact of exchange-rates is reported as net results of financial transactions. The unrealized fair value changes for assets and liabilities held as of December 31, 2015 amount to Skr 0.1 billion profit (year-end 2014: Skr 0.7 billion loss) and are reported as net results of financial transactions
F-43
Table of Contents
Uncertainty of valuation of Level 3 instruments
As the estimation of the parameters included in the models to calculate the market value of level-3-instruments is associated with subjectivity and uncertainty, SEK has, in accordance with IFRS 13, conducted an analysis of the difference in fair value of level-3-instruments using other reasonably possible parameter values. Option models and discounted cash flows are used to value the instruments in level 3. For level-3-instruments with a longer duration where extrapolated discount curves are used, a sensitivity analysis has been conducted with regards to the interest. The revaluation of the portfolio is made by an interest rate shift of +/– 10 basis points. For the level-3-instruments that are significantly affected by different types of correlations, which are not based on observable market data, a revaluation has been made by shifting the correlations. The base for this sensitivity analysis is therefore revaluation of the relevant part of the portfolio, where the correlations have been adjusted by +/– 10 percentage points. After the revaluation is performed, the max/min value for each transaction is singled out. For level-3- instruments that are significantly affected by non-observable market data such as SEK’s own creditworthiness, a revaluation has been made by shifting the credit curve. The revaluation is made by shifting the funding spreads by +/- 10 basis points, which has been assessed as a reasonable change of SEK’s funding spread. The analysis shows the impact of the non-observable market data on the market value. In addition to this, the market value will be affected by observable market data.
The result of the analysis corresponds with SEK’s business model where issued securities are linked with a hedging derivative. This means that an increase or decrease in fair value of the issued security, excluding SEK’s own credit spread, is offset by an equally large increase or decrease of fair value in the derivative due to the underlying market data in the security which is also used to evaluate the derivative.
F-44
Table of Contents
Sensitivity analysis - level 3 assets
| | December 31, 2015 | |
Skr mn | | Fair value | | Unobservable
input | | Range of
estimates for
unobservable
input(1) | | Valuation method | | Sensitivity
max | | Sensitivity
min | |
| | | | | | | | | | | | | |
Interest rate | | 261 | | Credit spreads | | 10BP - (10BP) | | Discounted cash flow | | 0 | | 0 | |
| | | | | | | | | | | | | |
Sum other interest-bearing securities except loans | | 261 | | | | | | | | 0 | | 0 | |
| | | | | | | | | | | | | |
Equity | | 178 | | Correlation | | 00.41 - (0.74) | | Option Model | | 0 | | 0 | |
| | | | | | | | | | | | | |
Interest rate | | 1,015 | | Correlation | | 00.18 - (0.20) | | Option Model | | -178 | | 173 | |
| | | | | | | | | | | | | |
FX | | 695 | | Correlation | | 00.71 - (0.74) | | Option Model | | 7 | | -9 | |
| | | | | | | | | | | | | |
Other | | 0 | | Correlation | | 00.70 - (0.14) | | Option Model | | -1 | | 1 | |
| | | | | | | | | | | | | |
Sum derivatives | | 1,888 | | | | | | | | -172 | | 165 | |
Sum Assets | | 2,149 | | | | | | | | -172 | | 165 | |
Sensitivity analysis - level 3 liabilities
| | December 31, 2015 | |
Skr mn | | Fair value | | Unobservable
input | | Range of
estimates for
unobservable
input(1) | | Valuation method | | Sensitivity
max | | Sensitivity
min | |
| | | | | | | | | | | | | |
Equity | | -10,655 | | Correlation | | 0.41 - (0.74) | | Option Model | | 5 | | -6 | |
| | | | Credit spreads | | 10BP - (10BP) | | Discounted cash flow | | 18 | | -18 | |
Interest rate | | -23,865 | | Correlation | | 0.18 - (0.20) | | Option Model | | 181 | | -174 | |
| | | | Credit spreads | | 10BP - (10BP) | | Discounted cash flow | | 110 | | -110 | |
FX | | -4,049 | | Correlation | | 0.71 - (0.74) | | Option Model | | -52 | | 49 | |
| | | | Credit spreads | | 10BP - (10BP) | | Discounted cash flow | | 91 | | -91 | |
Other | | -140 | | Correlation | | 0.70- (0.14) | | Option Model | | 1 | | -1 | |
| | | | Credit spreads | | 10BP - (10BP) | | Discounted cash flow | | 5 | | -5 | |
| | | | | | | | | | | | | |
Sum senior securities issued | | -38,709 | | | | | | | | 359 | | -356 | |
| | | | | | | | | | | | | |
Equity | | -1,175 | | Correlation | | 0.41 - (0.74) | | Option Model | | -5 | | 6 | |
| | | | | | | | | | | | | |
Interest rate | | -2 | | Correlation | | 0.18 - (0.20) | | Option Model | | -1 | | 2 | |
| | | | | | | | | | | | | |
FX | | -3,104 | | Correlation | | 0.71 - (0.74) | | Option Model | | 44 | | -39 | |
| | | | | | | | | | | | | |
Other | | -158 | | Correlation | | 0.70- (0.14) | | Option Model | | 0 | | 0 | |
| | | | | | | | | | | | | |
Sum derivatives | | -4,439 | | | | | | | | 38 | | -31 | |
Sum Liabilities | | -43,148 | | | | | | | | 397 | | -387 | |
| | | | | | | | | | | | | |
Total effect on profit or loss(2) | | | | | | | | | | 225 | | -222 | |
(1) Represents the range of correlations that SEK has determined market participants would use when pricing the instruments. The structures are represented both in the bond and in the derivative hedging the bond. The sensitivity analysis is based on a consistent shift in interval for correlation between 0.1 and -0.1. The correlation is expressed as a value between 1 and -1, where 0 indicates no relationship, 1 indicates maximum positive relationship and -1 indicates maximum negative relationship, the maximum correlation in the range of unobservable inputs can thus be from 1 to -1. . The table presents the scenario analysis of the effect on Level 3 instruments, with maximum positive and negative changes.
F-45
Table of Contents
(2) Of the total impact on profit or loss the sensitivity effect from SEK’s own credit spread was Skr 224 million at maximum scenario and Skr -224 million at minimal scenario.
Sensitivity analysis - level 3 assets
| | December 31, 2014 | |
Skr mn | | Fair value | | Unobservable
input | | Range of
estimates for
unobservable
input(1) | | Valuation method | | Sensitivity
max | | Sensitivity
min | |
| | | | | | | | | | | | | |
Interest rate | | 266 | | Credit spreads | | 10BP - (10BP) | | Discounted cash flow | | -1 | | 1 | |
| | | | | | | | | | | | | |
Sum other interest-bearing securities except loans | | 266 | | | | | | | | -1 | | 1 | |
| | | | | | | | | | | | | |
Equity | | 372 | | Correlation | | 0.76 - (0.46) | | Option Model | | 0 | | 0 | |
| | | | | | | | | | | | | |
Interest rate | | 2,064 | | Correlation | | 0.11 - (0.20) | | Option Model | | -186 | | 169 | |
| | | | | | | | | | | | | |
FX | | 1,120 | | Correlation | | 0.77 - (0.59) | | Option Model | | 21 | | -20 | |
| | | | | | | | | | | | | |
Other | | 10 | | Correlation | | 0.87 - (0.59) | | Option Model | | 0 | | 1 | |
| | | | | | | | | | | | | |
Sum derivatives | | 3,566 | | | | | | | | -165 | | 150 | |
Sum Assets | | 3,832 | | | | | | | | -166 | | 151 | |
Sensitivity analysis - level 3 liabilities
| | December 31, 2014 | |
Skr mn | | Fair value | | Unobservable
input | | Range of
estimates for
unobservable
input(1) | | Valuation method | | Sensitivity
max | | Sensitivity
min | |
| | | | | | | | | | | | | |
Equity | | -9,919 | | Correlation | | 0.76 - (0.46) | | Option Model | | 3 | | -2 | |
| | | | Credit spreads | | 10BP - (10BP) | | Discounted cash flow | | 9 | | -9 | |
Interest rate | | -28,214 | | Correlation | | 0.11 - (0.20) | | Option Model | | 188 | | -170 | |
| | | | Credit spreads | | 10BP - (10BP) | | Discounted cash flow | | 124 | | -124 | |
FX | | -16,245 | | Correlation | | 0.77 - (0.59) | | Option Model | | -63 | | 63 | |
| | | | Credit spreads | | 10BP - (10BP) | | Discounted cash flow | | 84 | | -84 | |
Other | | -377 | | Correlation | | 0.87 - (0.59) | | Option Model | | 0 | | -1 | |
| | | | Credit spreads | | 10BP - (10BP) | | Discounted cash flow | | 12 | | -12 | |
| | | | | | | | | | | | | |
Sum senior securities issued | | -54,755 | | | | | | | | 357 | | -339 | |
| | | | | | | | | | | | | |
Equity | | -1,201 | | Correlation | | 0.76 - (0.46) | | Option Model | | -2 | | 1 | |
| | | | | | | | | | | | | |
Interest rate | | -3 | | Correlation | | 0.11 - (0.20) | | Option Model | | -6 | | 5 | |
| | | | | | | | | | | | | |
FX | | -1,892 | | Correlation | | 0.77 - (0.59) | | Option Model | | 39 | | -41 | |
| | | | | | | | | | | | | |
Other | | -123 | | Correlation | | 0.87 - (0.59) | | Option Model | | 0 | | 0 | |
| | | | | | | | | | | | | |
Sum derivatives | | -3,219 | | | | | | | | 31 | | -35 | |
Sum Liabilities | | -57,974 | | | | | | | | 388 | | -374 | |
| | | | | | | | | | | | | |
Total effect on profit or loss(2) | | | | | | | | | | 222 | | -223 | |
F-46
Table of Contents
(1) Represents the range of correlations that SEK has determined market participants would use when pricing the instruments. The structures are represented both in the bond and in the derivative hedging the bond. The sensitivity analysis is based on a consistent shift in interval for correlation between 0.1 and -0.1. The correlation is expressed as a value between 1 and -1, where 0 indicates no relationship, 1 indicates maximum positive relationship and -1 indicates maximum negative relationship, the maximum correlation in the range of unobservable inputs can thus be from 1 to -1. The table presents the scenario analysis of the effect on Level 3 instruments, with maximum positive and negative changes.
(2) Of the total impact on profit or loss the sensitivity effect from SEK’s own credit spread was Skr 228 million at maximum scenario and Skr -228 million at minimal scenario.
Note 14. Derivatives
Consolidated Group | | December 31, 2015 | | December 31, 2014 | |
Derivatives by categories | | Assets | | Liabilities | | Nominal | | Assets | | Liabilities | | Nominal | |
Skr mn | | Fair value | | Fair value | | amounts | | Fair value | | Fair value | | amounts | |
Interest rate-related contracts | | 5,582 | | 8,225 | | 221,515 | | 6,421 | | 7,730 | | 204,820 | |
Currency-related contracts | | 6,548 | | 13,745 | | 116,290 | | 8,759 | | 9,349 | | 151,933 | |
Equity-related contracts | | 542 | | 1,497 | | 16,089 | | 819 | | 1,416 | | 15,453 | |
Contracts related to commodities, credit risk, etc. | | — | | 164 | | 1,978 | | 18 | | 391 | | 3,674 | |
Total derivatives | | 12,672 | | 23,631 | | 355,872 | | 16,017 | | 18,886 | | 375,880 | |
Consolidated Group | | December 31, 2015 | | December 31, 2014 | |
of which derivatives used for economic hedges,
accounted for as held-for-trading under IAS39 | | Assets | | Liabilities | | Nominal | | Assets | | Liabilities | | Nominal | |
Skr mn | | Fair value | | Fair value | | amounts | | Fair value | | Fair value | | amounts | |
Interest rate-related contracts | | 3,535 | | 6,296 | | 114,279 | | 3,834 | | 5,295 | | 88,546 | |
Currency-related contracts | | 2,136 | | 9,671 | | 71,631 | | 4,371 | | 6,218 | | 98,075 | |
Equity-related contracts | | 542 | | 1,497 | | 16,089 | | 819 | | 1,416 | | 15,453 | |
Contracts related to commodities, credit risk, etc. | | — | | 164 | | 1,978 | | 18 | | 390 | | 3,674 | |
Total derivatives | | 6,213 | | 17,628 | | 203,977 | | 9,042 | | 13,319 | | 205,748 | |
Consolidated Group | | December 31, 2015 | | December 31, 2014 | |
of which derivatives used for hedge
accounting (1) | | Assets | | Liabilities | | Nominal | | Assets | | Liabilities | | Nominal | |
Skr mn | | Fair value | | Fair value | | amounts | | Fair value | | Fair value | | amounts | |
Interest rate-related contracts | | 2,047 | | 1,929 | | 107,236 | | 2,587 | | 2,436 | | 116,274 | |
Currency-related contracts | | 4,412 | | 4,074 | | 44,659 | | 4,388 | | 3,131 | | 53,858 | |
Equity-related contracts | | — | | — | | — | | — | | — | | — | |
Contracts related to commodities, credit risk, etc. | | — | | — | | — | | — | | — | | — | |
Total derivatives | | 6,459 | | 6,003 | | 151,895 | | 6,975 | | 5,567 | | 170,132 | |
| | | | | | | | | | | | | |
1 Of which cash-flow hedges | | — | | — | | — | | — | | — | | — | |
1 Of which fair-value hedges | | 6,459 | | 6,003 | | 151,895 | | 6,975 | | 5,567 | | 170,132 | |
F-47
Table of Contents
Consolidated Group | | December 31, 2015 | |
Derivatives used as fair-value hedge | | | | 1 month < | | 3 months < | | 1 year < | | | |
Skr mn | | < 1 month | | 3 months | | 1 year | | 5 years | | > 5 years | |
Cash inflows (assets) | | 47 | | 238 | | 700 | | 3,428 | | 459 | |
Cash outflows (liabilities) | | 8 | | 56 | | -977 | | -1,526 | | -869 | |
Net cash inflow | | 55 | | 294 | | -277 | | 1,902 | | -410 | |
Consolidated Group | | December 31, 2014 | |
Derivatives used as fair-value hedge | | | | 1 month < | | 3 months < | | 1 year < | | | |
Skr mn | | < 1 month | | 3 months | | 1 year | | 5 years | | > 5 years | |
Cash inflows (assets) | | 81 | | 510 | | 2,231 | | 4,183 | | 1,003 | |
Cash outflows (liabilities) | | -85 | | -203 | | -574 | | -1,806 | | -1,146 | |
Net cash inflow | | -4 | | 307 | | 1,657 | | 2,377 | | -143 | |
Cash-flow hedges reclassified to profit or loss during the year
Skr mn | | 2015 | | 2014 | | 2013 | |
Interest income | | 217 | | 294 | | 279 | |
Interest expense | | — | | — | | — | |
Total | | 217 | | 294 | | 279 | |
In accordance with SEK’s policies with regard to counterparty, interest rate, currency exchange-rate, and other exposures, SEK uses, and is a party to, different kinds of derivative instruments, mostly various interest rate-related and currency exchange-rate-related contracts. These contracts are carried at fair value in the statements of financial position on a contract-by-contract basis.
SEK uses derivatives (primarily) to hedge risk exposure inherent in financial assets and liabilities. Derivatives are measured at fair value by using market quoted rates where available. If market quotes are not available, valuation models are used. SEK uses models to adjust the net exposure fair value for changes in counterparties’ credit quality. The models used include both directly observable and non-observable market parameters.
Some credit default swap contracts are derivatives and are accordingly classified as financial assets or liabilities at fair value through profit or loss, whereas others are classified as financial guarantees and therefore carried at amortized cost. As of December 31, 2015, the total nominal amount of financial guarantees documented as derivatives and classified as financial guarantees was Skr 2,975 million (year-end 2014: Skr 4,854 million).
The majority of SEK’s derivative contracts are what are known as OTC (over the counter) derivatives, i.e. derivative contracts that are not transacted on an exchange. SEK’s derivative transactions that are not transacted on an exchange are entered into under ISDA Master Netting Agreements. In general, under such agreements the amounts owed by each counterparty in respect of all transactions outstanding in the same currency under the agreement are aggregated into a single net amount payable by one party to the other. In certain circumstances, for example when a credit event such as a default occurs and all outstanding transactions under the agreement are terminated, the termination value is assessed and only a single net amount is due or payable in settlement of all transactions. SEK endeavors to only enter into derivatives transactions with counterparties in jurisdictions where such netting is enforceable when such events occur.
The above ISDA arrangements do not meet the criteria for offsetting in the statement of financial position. This is because such agreements create a right of set-off of recognized amounts that is enforceable only following an event of default, insolvency or bankruptcy of SEK or the counterparties. In addition, SEK and its counterparties do not intend to settle on a net basis or to realize the assets and settle the liabilities simultaneously.
The ISDA Master Netting Agreements are complemented by supplementary agreements providing for the collateralization of counterparty exposure. SEK receives and accepts collateral in the form of cash. Such collateral is subject to the standard industry terms of ISDA Credit Support Annex.
The disclosures set out in the tables below include financial assets and financial liabilities that are subject to an enforceable master netting arrangement or similar agreement that cover similar financial instruments. SEK only enters into derivative transactions that are subject to enforceable master netting agreements or similar agreements. SEK has no financial assets or liabilities that are offset in the statement of financial position.
F-48
Table of Contents
Financial assets subject to offsetting, enforceable master netting arrangements and similar agreements
| | December 31, 2015 | | December 31, 2014 | |
Skr mn | | Derivatives | | Derivatives | |
Gross amounts of recognized financial assets | | 12,672 | | 16,017 | |
Amounts offset in the statement of financial position | | — | | — | |
Net amounts of financial assets presented in the statement of finacial position | | 12,672 | | 16,017 | |
Amounts subject to an enforceable master netting arrangement or similar agreement not offset in the statement of financial position related to: | | | | | |
Financial instruments | | -8,733 | | -8,585 | |
Cash collateral received | | -3,558 | | -6,762 | |
Net amount | | 381 | | 670 | |
Financial liabilities subject to offsetting, enforceable master netting arrangements and similar agreements
| | December 31, 2015 | | December 31, 2014 | |
Skr mn | | Derivatives | | Derivatives | |
Gross amounts of recognized financial liabilities | | 23,631 | | 18,886 | |
Amounts offset in the statement of financial position | | — | | — | |
Net amounts of financial liabilities presented in the statement of finacial position | | 23,631 | | 18,886 | |
Amounts subject to an enforceable master netting arrangement or similar agreement not offset in the statement of financial position related to: | | | | | |
Financial instruments | | -8,733 | | -8,585 | |
Cash collateral paid | | -9,614 | | -7,125 | |
Net amount | | 5,284 | | 3,176 | |
Note 15. Shares
Venantius AB is domiciled in Stockholm, Sweden, and is wholly owned by AB Svensk Exportkredit. The net profit for the year amounts to Skr 1 million (2014: Skr 2 million; 2013: Skr 8 million).
Shares in subsidiaries
Skr mn | | December 31, 2015 | | December 31, 2014 | |
| Book
value | | Number of
shares | | Book
value | | Number of
shares | |
Venantius AB (reg no 556449-5116) | | 17 | | 5,000,500 | | 17 | | 5,000,500 | |
F-49
Table of Contents
Note 16. Other assets
| | Consolidated Group | |
| | December 31, | | December 31, | |
Skr mn | | 2015 | | 2014 | |
Realized claim against the State | | 13 | | 12 | |
Unrealized claim against the State for revaluation of derivatives of the S-system | | 974 | | 1,153 | |
Current tax claim | | — | | 2 | |
Cash receivables, funding operations | | 797 | | 658 | |
Other | | 70 | | 228 | |
Total | | 1,854 | | 2,053 | |
Note 17. Prepaid expenses and accrued revenues
| | Consolidated Group | |
Skr mn | | December 31,
2015 | | December 31,
2014 | |
Interest revenues accrued | | 1,932 | | 2,057 | |
Prepaid expenses and other accrued revenues | | 40 | | 33 | |
Total | | 1,972 | | 2,090 | |
Note 18. Debt
DEBT AS PER CATEGORIES
| | Consolidated Group | |
| | December 31, 2015 | |
Skr mn | | Total debt
excluding
senior
securities
issued | | Total senior
securities issued | | Total | |
| | | | | | | |
Exchange-rate related contracts | | — | | 58,049 | | 58,049 | |
Interest rate related contracts | | 5,283 | | 153,926 | | 159,209 | |
Equity related contracts | | — | | 16,072 | | 16,072 | |
Contracts related to raw materials, credit risk etc | | 61 | | 165 | | 226 | |
Total debt outstanding | | 5,344 | | 228,212 | | 233,556 | |
| | | | | | | |
Of which denominated in: | | | | | | | |
Swedish Kronor | | | | | | 3,244 | |
Other currencies | | | | | | 230,312 | |
F-50
Table of Contents
| | Consolidated Group | |
| | December 31, 2014 | |
Skr mn | | Total debt
excluding
senior
securities
issued | | Total senior
securities issued | | Total | |
| | | | | | | |
Exchange-rate related contracts | | — | | 80,675 | | 80,675 | |
Interest rate related contracts | | 8,353 | | 160,728 | | 169,081 | |
Equity related contracts | | — | | 15,326 | | 15,326 | |
Contracts related to raw materials, credit risk etc | | — | | 17,110 | | 17,110 | |
Total debt outstanding | | 8,353 | | 273,839 | | 282,192 | |
| | | | | | | |
Of which denominated in: | | | | | | | |
Swedish Kronor | | | | | | 5,358 | |
Other currencies | | | | | | 276,834 | |
Contracts have been categorized based on the contracts’ main properties. If all properties were taken into account, a transaction could be contained in several categories.
SEK has the following major borrowing programs in place:
Skr mn | | Value outstanding (1) | |
Borrowing programs | | December 31, 2015 | | December 31, 2014 | |
Medium-term note programs: | | | | | |
Unlimited Euro Medium-Term Note Programme | | 117,239 | | 150,558 | |
Unlimited SEC-registered U.S. Medium-Term Note Programme | | 99,295 | | 98,252 | |
Unlimited Swedish Medium-Term Note Programme | | 247 | | 319 | |
Skr 8,000,000,000 Swedish Medium-Term Note Programme | | 105 | | 1,340 | |
Unlimited MTN/STN AUD Debt Issuance Programme | | 1,842 | | 1,425 | |
Commercial paper programs: | | | | | |
USD 3,000,000,000 U.S. Commercial Paper Programme | | 3,340 | | 4,761 | |
USD 4,000,000,000 Euro-Commercial Paper Programme | | 1,251 | | 5,388 | |
(1) Amortized cost excluding fair value adjustments.
Note 19. Other liabilities
| | Consolidated Group | |
| | December 31, | | December 31, | |
Skr mn | | 2015 | | 2014 | |
Cash payables, debt purchases | | 1,354 | | 2,672 | |
Other | | 283 | | 382 | |
Total | | 1,637 | | 3,054 | |
F-51
Table of Contents
Note 20. Accrued expenses and prepaid revenues
| | Consolidated Group | |
| | December 31, | | December 31, | |
Skr mn | | 2015 | | 2014 | |
Interest expenses accrued | | 1,768 | | 1,867 | |
Other accrued expenses and prepaid revenues | | 144 | | 147 | |
Total | | 1,912 | | 2,014 | |
Note 21. Provisions
| | Consolidated Group | |
| | December 31, | | December 31, | |
Skr mn | | 2015 | | 2014 | |
Pension liabilities (see Note 5) | | 17 | | 66 | |
Long term employee benefit | | 13 | | 21 | |
Termination reserve | | 9 | | 10 | |
Total | | 39 | | 97 | |
Note 22. Subordinated debt securities
| | Consolidated Group | |
| | December 31, | | December 31, | |
Skr mn | | 2015 | | 2014 | |
Fixed Rate Resettable Dated Subordinated Instruments(1) | | 2,088 | | 1,945 | |
Total subordinated debt outstanding | | 2,088 | | 1,945 | |
| | | | | |
Of which denominated in: | | | | | |
Swedish kronor | | — | | — | |
Foreign currencies | | 2,088 | | 1,945 | |
(1) Nominal value USD 250 million fixed rate resettable dated subordinated instruments (ISIN XS0992306810) due November 14, 2023 (the dated subordinated instruments) were issued by SEK, 556084-0315, under the regulatory framework in effect on November 14th, 2013 (the issue date) at a price of 99.456 percent of aggregate nominal amount. English law applies to the dated subordinated instruments.
SEK’s dated subordinated instruments will bear interest (i) from (and including) the issue date, to (but excluding) November 14, 2018 (the optional redemption date (call)) at the rate of 2.875 percent per annum payable semi-annually in arrears on May 14 and November 14 in each year commencing on May 14, 2014 and ending on November 14, 2018 and (ii) from (and including) the optional redemption date (call) to (but excluding) November 14, 2023 (the maturity date) at a rate of 1.45 percent per annum above the applicable swap rate for USD swap transactions with a maturity of five years determined in accordance with market convention and payable semi-annually in arrears on May 14 and November 14 in each year commencing on May 14, 2019 and ending on the maturity date.
Unless previously redeemed or purchased and cancelled, SEK’s dated subordinated instruments will be redeemed at their principal amount on the maturity date. Subject to certain conditions as provided in the applicable terms and conditions, the dated subordinated instruments may be redeemed at the option of SEK in whole, but not in part, (i) on the optional redemption date (call), (ii) at any time for certain withholding tax reasons or (iii) at any time upon the occurrence of a capital event (as defined in the applicable terms and conditions), in each case at their principal amount together with interest accrued to (but excluding) the date of redemption. Redemption is subject to the prior consent of the Swedish F S A.
Total interest cost during 2015 related to subordinated debt amounts to Skr 51 million (2014:Skr 59 million) of which Skr 8 million (2014:Skr 7 million) represents accrued interest.
The accrued interest related to the subordinated debt, has been included in the item “Accrued expenses and prepaid revenues”.
F-52
Table of Contents
Subordinated debt means debt for which, in the event of the obligor being declared bankrupt, the holder would be repaid after other creditors, but before shareholders.
Note 23. Equity
| | Consolidated Group | |
Skr mn | | December 31,
2015 | | December 31,
2014 | |
Share capital | | 3,990 | | 3,990 | |
Reserves | | | | | |
Hedge reserve | | 228 | | 398 | |
Fair value reserve | | -1 | | 5 | |
Retained earnings | | 12,611 | | 11,764 | |
| | | | | |
Total Equity | | 16,828 | | 16,157 | |
The total number of shares is 3,990,000 with a quoted value of Skr 1,000.
The hedge reserve comprises the cumulative effective portion of hedging derivatives in connection with cash flow hedges and is reported in other comprehensive income. The hedge reserve is reported net after-tax.
The fair value reserve is displayed as after-tax difference between fair value and amortized cost recognized through other comprehensive income related to available-for-sale securities. In the cases in which an asset available-for-sale is included in a hedge relationship, the reserve includes the difference between the fair value and the amortized cost value revalued at fair value with regard to the risk being hedged. The difference normally consists of the cumulative change in the credit spread. After reclassification as of July 1, 2008, the fair value reserves are amortized over the remaining life of these reclassified assets. From 2009 new assets in the category available-for-sale have been acquired. Of the reserve represented interestbearing securities with positive changes in fair value amounted to Skr 25 million (year-end 2014: Skr 16 million), Skr -22 million, (year-end 2014: Skr -13 million) represented interest-bearing securities with negative changes in fair value and Skr 0 million (year-end 2014: Skr 0 million) remained from the reclassification in 2008.
The entire equity is attributable to the shareholder of the Parent Company.
According to the Swedish Annual Accounts Act for Credit Institutions and Securities Companies, the non-distributable capital for the Consolidated Group at year-end amounted to Skr 6,744 million (year-end 2014: Skr 6,746 million) and distributable capital amounted to Skr 10,084 million (year-end 2014: Skr 9,411 million).
For information on the objectives, policies and processes for managing capital, see Note 29 to the Consolidated Financial Statements.
Note 24. S-system
SEK administers, for a compensation of 0.25 percent on outstanding loans in the Swedish State’s export credit support system, and the State’s related aid credit program (together the “S-system”). In accordance with its assignment in an owner’s instruction to the company issued by the Swedish State, SEK manages the granting of loans in the S-system. The remuneration from the S-system to SEK in accordance with the owner’s instruction, which amounted to Skr 123 million for the period (2014: Skr 117 million; 2013: Skr 105 million), is shown as a part of interest revenues in the statement of comprehensive income for SEK. ). The assets and liabilities of the S-system are included in SEK’s statement of financial position. CIRR loans (Commercial Interest Reference Rate) represent one of the two loan types in the S-system, the other being concessionary loans. The net result in the S-system for 2015 amounted to Skr 112 million (2014: Skr 53 million; 2013: Skr 209 million), of which the net result for the CIRR loans represented Skr 164 million (2014: Skr 100 million; 2013: Skr 254 million).
F-53
Table of Contents
Statement of comprehensive income for the S-system
Skr mn | | 2015 | | 2014 | | 2013 | |
Interest revenues | | 1,222 | | 1,112 | | 1,119 | |
Interest expenses | | -1,001 | | -972 | | -903 | |
Net interest revenues | | 221 | | 140 | | 216 | |
Interest compensation | | 13 | | 32 | | 95 | |
Remuneration to SEK | | -123 | | -117 | | -105 | |
Foreign exchange-rate effects | | 1 | | -2 | | 3 | |
Reimbursement to (-) / from (+) the State | | -112 | | -53 | | -209 | |
Net result | | 0 | | 0 | | 0 | |
Statement of financial position for the S-system (included in SEK’s statements of financial position)
Skr mn | | December 31,
2015 | | December 31,
2014 | | | |
Cash and cash equivalents | | 1 | | 25 | | | |
Loans | | 44,077 | | 48,298 | | | |
Derivatives | | 213 | | 75 | | | |
Other assets | | 1,133 | | 1,211 | | | |
Prepaid expenses and accrued revenues | | 328 | | 302 | | | |
Total assets | | 45,752 | | 49,911 | | | |
| | | | | | | |
Liabilities | | 44,215 | | 48,271 | | | |
Derivatives | | 1,186 | | 1,230 | | | |
Accrued expenses and prepaid revenues | | 351 | | 410 | | | |
Equity | | — | | — | | | |
Total liabilities and equity | | 45,752 | | 49,911 | | | |
| | | | | | | |
Commitments | | | | | | | |
Committed undisbursed loans | | 54,638 | | 7,528 | | | |
Binding offers | | 2,273 | | 49,833 | | | |
Results under the S-System by type of loan
| | CIRR loans | | Concessionary loans | |
Skr mn | | 2015 | | 2014 | | 2013 | | 2015 | | 2014 | | 2013 | |
Net interest revenues | | 271 | | 185 | | 259 | | -50 | | -45 | | -43 | |
Interest compensation | | 13 | | 32 | | 95 | | — | | — | | — | |
Remuneration to SEK | | -120 | | -115 | | -103 | | -2 | | -2 | | -2 | |
Foreign exchange-rate effects | | 0 | | -2 | | 3 | | — | | — | | — | |
Total | | 164 | | 100 | | 254 | | -52 | | -47 | | -45 | |
F-54
Table of Contents
Note 25. Capital Adequacy
The total capital ratio of SEK as a consolidated group1, calculated according to the capital requirements regulation (CRR)2 which came into effect on January 1, 2014, was as of December 31, 2015 24.5 percent (year-end 2014: 19.2 percent). The Tier 1 capital ratio was 21.6 percent (year-end 2014: 16.9 percent) and the Common Equity Tier 1 capital ratio was 21.6 percent (year-end 2014: 16.9 percent). As of December 31, 2015, the Basel I floor increased the total capital requirement resulting in a total capital ratio of 23.4 percent (year-end 2014: 19.2 percent). The capital requirement according to the internal ratings based approach (IRB) for exposures to corporate and financial institutions has decreased due to changes in the risk parameters during 2015. The Common Equity Tier 1 capital ratio is 1.9 percentage points higher due to the above stated changes. For further information on capital adequacy, risks, and CRR see Note 29 to the Consolidated Financial Statements.
(1) In this note the term “Consolidated group” corresponds to “the consolidated situation”, as defined by CRR. See Note 1(b) to the Consolidated Financial Statements for details.
(2) Regulation (EU) No 575/2013 of the European Parliament and of the Council of June 26, 2013 on prudential requirements for credit institutions and investment firms and amending Regulation (EU) No 648/2012.
Own funds - Adjusting items
| | Consolidated Group | |
Skr mn | | December 31,
2015 | | December 31,
2014 | |
Share capital | | 3,990 | | 3,990 | |
Retained earnings | | 11,404 | | 10,522 | |
Accumulated other comprehensive income and other reserves | | 247 | | 385 | |
Independently reviewed profit net of any foreseeable charge or dividend | | 830 | | 882 | |
Common Equity Tier 1 (CET1) capital before regulatory adjustments(1) | | 16,471 | | 15,779 | |
Additional value adjustments due to prudent valuation(2) | | -429 | | -560 | |
Intangible assets | | -109 | | -135 | |
Fair value reserves related to gains or losses on cash flow hedges | | -228 | | -386 | |
Gains or losses on liabilities valued at fair value resulting from changes in own credit standing | | 290 | | 366 | |
Exposure amount of securitization positions which qualify for a risk-weight of 1.250% (3) | | — | | -216 | |
Regulatory adjustments relating to unrealized gains pursuant to CRR Article 468 | | — | | -62 | |
Total regulatory adjustments | | -476 | | -993 | |
Total Common Equity Tier-1 capital | | 15,995 | | 14,786 | |
Additional Tier 1 capital | | — | | — | |
Total Tier-1 capital | | 15,995 | | 14,786 | |
Tier 2-eligible subordinated debt | | 2,088 | | 1,953 | |
Credit risk adjustments(4) | | 9 | | 51 | |
Total Tier 2 capital(5) | | 2,097 | | 2,004 | |
Total Own funds | | 18,092 | | 16,790 | |
Total Own funds according to Basel I floor | | 18,083 | | 16,739 | |
(1) For a detailed description of the instruments constituting equity, see Note 23 to the Consolidated Financial Statements.
(2) In accordance with CRR, securitized assets with a risk weight of 1250 percent are deducted from own funds, as an alternative to calculating risk exposure amounts for those assets. The deducted amount is the net book value for such assets.
(3) In accordance with FFFS 2014:12, unrealized gains on assets classified as available for sale are not deducted from own funds from January 1, 2015.
(4) For a detailed description of the instruments constituting Tier 2-eligible subordinated debt, see Note 22 to the Consolidated Financial Statements.
(5) Expected loss amount calculated according to the IRB-approach is a gross deduction from own funds. The gross deduction is decreased by impairment related to exposures for which expected loss is calculated. Excess amounts of such impairment will increase own funds. This increase is limited to 0.6 percent of SEK’s risk exposure amount according to the IRB-approach related to exposures to corporates and financial institutions. As of December 31, 2015, the limitation rule had no effect (year-end 2014: no effect).
F-55
Table of Contents
Capital Requirements in Accordance with Pillar 1
| | Consolidated Group | |
| | December 31, 2015 | | December 31, 2014 | |
Skr mn | | EAD(1) | | Risk
exposure
amount | | Required
capital | | EAD | | Risk
exposure
amount | | Required
capital | |
Credit risk standardized method | | | | | | | | | | | | | |
Central governments | | 141,235 | | 760 | | 61 | | 158,666 | | 736 | | 59 | |
Regional governments | | 13,999 | | — | | — | | 20,891 | | — | | — | |
Multilateral development banks | | 24 | | — | | — | | 319 | | — | | — | |
Corporates | | 1,441 | | 1,441 | | 115 | | 1,207 | | 1,207 | | 96 | |
Total credit risk standardized method | | 156,699 | | 2,201 | | 176 | | 181,083 | | 1,943 | | 155 | |
| | | | | | | | | | | | | |
Credit risk IRB method | | | | | | | | | | | | | |
Financial institutions(2) | | 51,805 | | 16,437 | | 1,315 | | 67,293 | | 24,186 | | 1,935 | |
Corporates(3) | | 81,575 | | 46,990 | | 3,760 | | 79,344 | | 49,042 | | 3,923 | |
Securitization positions | | 756 | | 241 | | 19 | | 6,308 | | 3,643 | | 291 | |
Assets without counterparty | | 129 | | 129 | | 10 | | 134 | | 134 | | 11 | |
Total credit risk IRB method | | 134,265 | | 63,797 | | 5,104 | | 153,079 | | 77,005 | | 6,160 | |
| | | | | | | | | | | | | |
Credit valuation adjustment risk | | n.a. | | 2,403 | | 192 | | n.a. | | 3,340 | | 267 | |
Foreign exchange-rate risks | | n.a. | | 1,570 | | 126 | | n.a. | | 1,529 | | 123 | |
Commodities risk | | n.a. | | 19 | | 1 | | n.a. | | 27 | | 2 | |
Operational risk | | n.a. | | 3,969 | | 318 | | n.a. | | 3,473 | | 278 | |
Total | | 290,964 | | 73,959 | | 5,917 | | 334,162 | | 87,317 | | 6,985 | |
| | | | | | | | | | | | | |
Adjustment according to Basel I floor | | n.a. | | 3,262 | | 261 | | n.a. | | — | | — | |
Total incl Basel I floor | | n.a. | | 77,221 | | 6,178 | | n.a. | | 87,317 | | 6,985 | |
(1) Exposure at default (EAD) shows the size of the outstanding exposure at default.
(2) Of which counterparty risk in derivatives: EAD 4,138 million (year-end 2014: Skr 5,699 million), Risk exposure amount of Skr 1,656 million (year-end 2014: Skr 2,844 million) and Capital requirement of Skr 132 million (year-end 2014: Skr 228 million).
(3) Of which related to specialized lending: EAD Skr 4,085 million (year-end 2014: Skr 2,834 million), Risk exposure amount of Skr 2,806 million (yearend 2014: Skr 1,984 million) and Capital requirement of Skr 224 million (year-end 2014: 159 million).
Credit risk by PD grade
The tables illustrate the exposure at default (EAD), the portion of the exposure that will be lost in the event of a default (LGD) and the probability of default or cancellation of payments by counterparty (PD) for the exposure classes where PD is estimated internally. Average PD is calculated without consideration of PD floors. Average PD and LGD are weighted by EAD, average risk weight is the quotient of risk exposure amount and EAD. The amounts reported concern the Consolidated Group, the amounts for the Parent Company are essentially the same.
F-56
Table of Contents
| | December 31, 2015 | | December 31, 2014 | |
Consolidated Group
Skr mn | | AAA
to AA-
0.01-
0.04% | | A+
to A–
0.05–
0.12% | | BBB+
to BBB–
0.17–
0.35% | | BB+
to B–
0.58–
8.68% | | CCC to D
28.52–
100% | | AAA
to AA-
0.02%-
0.05% | | A+
to A–
0.07–
0.15% | | BBB+
to BBB–
0.21–
0.44% | | BB+
to B–
0.79–
10.05% | | CCC to D
28.98–
100% | |
Financial institutions | | | | | | | | | | | | | | | | | | | | | |
EAD | | 13,072 | | 34,287 | | 2,004 | | 2,442 | | — | | 21,138 | | 40,848 | | 4,964 | | 228 | | — | |
Average PD in % | | 0.04 | | 0.08 | | 0.22 | | 0.58 | | — | | 0.05 | | 0.10 | | 0.33 | | 0.79 | | — | |
Average LGD in % | | 41.3 | | 40.9 | | 45.0 | | 45.0 | | — | | 42.4 | | 42.1 | | 45.0 | | 45.0 | | — | |
Average risk weight in % | | 21.6 | | 28.6 | | 64.9 | | 102.3 | | — | | 25.9 | | 35.9 | | 75.3 | | 115.2 | | — | |
Corporates | | | | | | | | | | | | | | | | | | | | | |
EAD | | 3,614 | | 16,073 | | 36,940 | | 20,784 | | 79 | | 4,621 | | 17,051 | | 35,200 | | 19,588 | | 50 | |
Average PD in % | | 0.04 | | 0.11 | | 0.22 | | 0.94 | | 79.71 | | 0.04 | | 0.14 | | 0.31 | | 1.06 | | 28.98 | |
Average LGD in % | | 45.0 | | 45.0 | | 45.0 | | 45.0 | | 45.0 | | 45.0 | | 45.0 | | 45.0 | | 45.0 | | 45.0 | |
Average risk weight in % | | 18.6 | | 33.8 | | 52.1 | | 93.2 | | 74.8 | | 19.2 | | 37.6 | | 58.1 | | 97.9 | | 263.7 | |
Credit risks
For risk classification and quantification of credit risk, SEK uses an internal ratings-based (IRB) approach. The Swedish Financial Supervisory Authority has approved SEK’s IRB approach. Specifically, SEK applies the Foundation Approach. Under the Foundation Approach, the company determines the probability of default within one year (PD) of each of its counterparties, while the remaining parameters are established in accordance with CRR. Certain exposures are, by permission from the Swedish Financial Supervisory Authority, exempted from application of the IRB approach, and, instead, the standardized approach is applied. SEK has permanent exemptions for exposures to Swedish central and regional governments, as well as permanent exemptions for some non-material exposures. Also, SEK has time-limited exemptions until December 31, 2015 for its exposures to central and regional governments outside Sweden and to multilateral development banks. SEK has applied to the Swedish Financial Supervisory Authority for approval of an IRB approach for those exposures with time-limited exemptions. SEK has also applied for a temporary prolongation of the time-limited exemptions until an IRB approach for the affected exposures is approved. Minimum capital requirements for these exposures will increase when an IRB approach is applied. Counterparty risk exposure amounts in derivatives are calculated in accordance with the mark-to-market method.
Credit valuation adjustment risk
Credit valuation adjustment risk shall be calculated for all OTC derivative contracts, except for credit derivatives used as credit protection and transactions with a qualifying central counterparty. SEK calculates this capital requirement according to the standardized method.
Foreign exchange-rate risks
Foreign exchange-rate risk is calculated according to the standardized approach, whereas the scenario approach is used for calculating the gamma and volatility risks.
Commodities risk
Capital requirements for commodity risk are calculated in accordance with the simplified approach under the standardised approach. The scenario approach is used for calculating the gamma and volatility risks.
Operational risks
Capital requirement for operational risk is calculated according to the standardized approach. The company’s operations are divided into business areas as defined in the CRR. The capital requirement for each area is calculated by multiplying a factor depending on the business area by an income indicator. The factors applicable for SEK are 15 percent and 18 percent. The income indicators consist of the average operating income for the past three financial years for each business area.
Transitional rules
CRR states that the previously applicable transitional rules, i.e. the Basel I floor, will continue to apply until 2017. According to the transitional rules, the capital requirement should be calculated in parallel on the basis of the Basel I rules. To the extent that the Basel-I-based capital requirement, reduced to 80 percent, exceeds the capital requirement based on CRR, the capital requirement under the above mentioned Basel I-based rules should constitute the minimum capital requirement. Other transitional arrangements concerning CRR have no significant effect on SEK.
F-57
Table of Contents
Capital Adequacy Analysis (Pillar 1)
| | Consolidated Group | |
| | December 31, 2015 | | December 31, 2014 | |
Capital ratios excl. of buffer requirements(1) | | | | | |
Common Equity Tier 1 capital ratio | | 21.6 | % | 16.9 | % |
Tier 1 capital ratio | | 21.6 | % | 16.9 | % |
Total capital ratio | | 24.5 | % | 19.2 | % |
Institution specific Common Equity Tier 1 capital requirement incl. of buffers(2) | | 7.7 | % | 7.0 | % |
of which Capital conservation buffer | | 2.5 | % | 2.5 | % |
of which Countercyclical buffer | | 0.7 | % | — | |
of which Systemic risk buffer | | — | | — | |
Common Equity Tier 1 capital available to meet institution specific requirement(3) | | 20.1 | % | 15.4 | % |
Total capital ratio according to transitional rules(4) | | 23.4 | % | 19.2 | % |
(1) Capital ratios excl. of buffer requirements are the quotients of the relevant capital measure and the total risk exposure amount. The minimum requirements according to CRR, which without regard to transitional period already have come into force in Sweden, are 4.5 percent, 6.0 percent and 8.0 percent for Common Equity Tier 1 capital, Tier 1 capital and total Own Funds, respectively.
(2) Inclusive of the minimum requirement of 4.5 percent, expressed as a percentage of total risk exposure amount.
(3) Common Equity Tier 1 capital, as a percentage of the total risk exposure amount, available to meet the institution specific Common Equity Tier 1 capital requirement. SEK does not have any additional Tier 1 capital, hence Common Equity Tier 1 capital is required to meet the difference between the minimum requirements on Tier 1 capital and Common Equity Tier 1 capital with the result that this indicator is 1.5 percentage points less than the Common Equity Tier 1 capital ratio
(4) Refers to the so called Basel I floor. The minimum requirement is 8.0 percent.
SEK shall meet capital buffer requirements with Common Equity Tier 1 capital. SEK has not been classified as a systemically important institution. The capital buffer requirements for systemically important institutions that will come into force January 1, 2016 will hence not apply to SEK. There is no systemic risk buffer applicable for SEK that is active at the moment. A countercyclical buffer rate of 1.0 percent shall be applied to exposures located in Sweden as of September 13, 2015 and going forward. As of December 31, 2015 the capital requirement related to relevant exposures in Sweden is 65 percent (year-end 2014: 61 percent) of the total relevant capital requirement regardless of location, this fraction is also the weight applied on the Swedish buffer rate when calculating SEK’s countercyclical capital buffer. The Swedish countercyclical buffer rate will increase to 1.5 percent as of June 27, 2016. Buffer rates activated in other countries may have effects on SEK, but as most capital requirements from relevant credit exposures are related to Sweden the potential effect is limited. As of December 31, 2015, the contribution to SEK’s countercyclical buffer from buffer rates in other countries was 0.01 percentage points (year-end 2014: no effect).
Leverage Ratio
Skr mn (if not mentioned otherwise) | | December 31, 2015 | | December 31, 2014 | |
Exposure measure for the leverage ratio | | | | | |
On-balance sheet exposures | | 256,889 | | 299,374 | |
Off-balance sheet exposures | | 39,161 | | 37,187 | |
Total exposure measure | | 296,050 | | 336,561 | |
Leverage ratio | | 5.4 | % | 4.4 | % |
A leverage ratio measure has been introduced by the CRR and, starting in 2015, must be disclosed at least annually. Currently, there is no minimum requirement as to what a company’s leverage ratio should be. The leverage ratio is defined as the quotient of the Tier 1 capital and an exposure measure. The definition of the leverage ratio was changed as of January 19, 2015. The exposure measure consists of assets and off-balance sheet credit risk exposures, the latter of which are weighted with a factor depending on the type of exposure. Special treatment is given to for, inter alia, derivatives. The changes to the definition have also been reflected in the leverage ratio as of December 31, 2014.
F-58
Table of Contents
Internally assessed capital requirement
Skr mn (if not mentioned otherwise) | | December 31, 2015 | | December 31, 2014 | |
Credit risk | | 7,944 | | 9,099 | |
Operational risk | | 318 | | 315 | |
Market risk | | 1,447 | | 1,693 | |
Other risk | | 238 | | — | |
Total internal capital requirement | | 9,947 | | 11,107 | |
Internal capital requirement as percentage of Commont Equity Tier 1 capital | | 55.0 | % | 66.2 | % |
SEK regularly conducts an internal capital adequacy assessment process, during which the company determines how much capital is needed in order to cover its risks. The result of SEK’s assessment of capital adequacy is presented above. For more information regarding the internal capital adequacy assessment process and its methods, please see Note 29 to the Consolidated Financial Statements.
Note 26. Risk information
For further risk information, see Note 29 to the Consolidated Financial Statements. The consolidated situation of SEK, as defined by the CRR, does not differ from the consolidation for acconting purposes. The table of credit quality as per category in the statement of financial position and the table illustrating the link between statement of financial position categories and exposures according to CRR contain book values. Other tables show amounts in accordance with the capital adequacy calculations, however before application of credit conversion factors.
Credit risk
The table below shows the maximum exposure to credit risk. The amounts are nominal values except for derivatives which are reported at book values.
| | December 31 , 2015 | |
| | Maximum exposure to Credit Risk | |
Consolidated Group
Skr mn | | Financial assets at
fair value through
profit or loss | | Assets available
for sale | | Loans and
receivables | |
Cash and cash equivalents | | — | | — | | 2,258 | |
Treasuries/government bonds | | — | | 2,005 | | — | |
Other interest-bearing securities except loans | | 1,481 | | 37,965 | | 1,210 | |
Loans in the form of interest-bearing securities | | 708 | | — | | 46,773 | |
Loans to credit institutions | | — | | — | | 29,750 | |
Loans to the public | | — | | — | | 203,622 | |
Derivatives | | 12,672 | | — | | — | |
Total financial assets | | 14,861 | | 39,970 | | 283,613 | |
F-59
Table of Contents
| | December 31, 2014 | |
| | Maximum exposure to Credit Risk | |
Consolidated Group
Skr mn | | Financial assets at
fair value through
profit or loss | | Assets available
for sale | | Loans and
receivables | |
Cash and cash equivalents | | — | | — | | 7,099 | |
Treasuries/government bonds | | — | | 3,454 | | — | |
Other interest-bearing securities except loans | | 1,521 | | 57,093 | | 7,632 | |
Loans in the form of interest-bearing securities | | 1,289 | | — | | 51,085 | |
Loans to credit institutions | | — | | — | | 26,895 | |
Loans to the public | | — | | — | | 162,892 | |
Derivatives | | 16,017 | | — | | — | |
Total financial assets | | 18,827 | | 60,547 | | 255,603 | |
Maximum exposure to credit risk for “Loans to credit institutions” and “Loans to the public” includes undisbursed loans at year-end, entered at nominal value.
The table below displays the credit quality after risk mitigation (net) as per category in the statement of financial position. The amounts are book values. SEK uses guarantees, credit default swaps and insurance as credit risk protection see also Note 29 to the Consolidated Financial Statements.
Consolidated Group | | December 31, 2015 | |
Skr mn | | AAA | | AA+ to A- | | BBB+ to BBB- | | BB+ to B- | | CCC to D | | Book Value | |
Cash and cash equivalents | | — | | 2,258 | | — | | — | | — | | 2,258 | |
Treasuries/government bonds | | 1,586 | | 420 | | — | | — | | — | | 2,006 | |
Other interest-bearing securities except loans | | 7,550 | | 32,384 | | 897 | | — | | — | | 40,831 | |
Loans in the form of interest-bearing securities | | 3,804 | | 15,862 | | 22,469 | | 5,972 | | — | | 48,107 | |
Loans to credit institutions | | 9,403 | | 17,133 | | 760 | | 2,480 | | — | | 29,776 | |
Loans to the public | | 78,698 | | 29,415 | | 17,631 | | 15,005 | | 57 | | 140,806 | |
Derivatives | | — | | 12,091 | | 581 | | — | | — | | 12,672 | |
Total financial assets | | 101,041 | | 109,563 | | 42,338 | | 23,457 | | 57 | | 276,456 | |
Committed undisbursed loans | | 59,227 | | 1,980 | | 1,025 | | 1,206 | | — | | 63,438 | |
Consolidated Group | | December 31, 2014 | |
Skr mn | | AAA | | AA+ to A- | | BBB+ to BBB- | | BB+ to B- | | CCC to D | | Book Value | |
Cash and cash equivalents | | 6,250 | | 849 | | — | | — | | — | | 7,099 | |
Treasuries/government bonds | | 2,267 | | 1,191 | | — | | — | | — | | 3,458 | |
Other interest-bearing securities except loans | | 17,328 | | 46,711 | | 1,453 | | 873 | | 33 | | 66,398 | |
Loans in the form of interest-bearing securities | | 9,572 | | 15,086 | | 22,744 | | 5,738 | | — | | 53,140 | |
Loans to credit institutions | | 9,981 | | 8,276 | | 7,025 | | 228 | | — | | 25,510 | |
Loans to the public | | 84,924 | | 34,494 | | 16,442 | | 13,355 | | 25 | | 149,240 | |
Derivatives | | — | | 13,135 | | 2,883 | | — | | — | | 16,017 | |
Total financial assets | | 130,322 | | 119,742 | | 50,547 | | 20,194 | | 58 | | 320,862 | |
Committed undisbursed loans | | 12,863 | | 1,783 | | 588 | | 794 | | — | | 16,028 | |
The credit quality of financial assets is evaluated by use of internal or external rating.
The table below illustrates the link between the statement of financial position categories and net exposures according to CRR.
F-60
Table of Contents
| | December 31, 2015 | |
Consolidated Group
Skr bn | | Book value | | Adjustment
from Book
value to
Exposure | | Central
governments | | Regional
governments | | Multilateral
development
banks | | Financial
institutions | | Corporates | | Securitization
positions | |
Treasuries/government bonds | | 2.0 | | 0.0 | | 2.0 | | — | | — | | — | | — | | — | |
Other interest-bearing securities except loans | | 40.8 | | 0.2 | | 4.5 | | 6.4 | | — | | 27.7 | | 1.6 | | 0.8 | |
Loans in the form of interest-bearing securities | | 48.1 | | 0.1 | | 4.4 | | — | | 0.0 | | 5.6 | | 38.2 | | — | |
Loans to credit institutions including cash and cash equivalents(1) | | 32.1 | | -13.6 | | 3.6 | | 6.5 | | — | | 8.3 | | 0.1 | | — | |
Loans to the public | | 140.8 | | 1.7 | | 95.4 | | 1.1 | | — | | 5.5 | | 40.5 | | — | |
Derivatives | | 12.7 | | -8.5 | | — | | — | | — | | 4.2 | | — | | — | |
Total financial assets | | 276.5 | | -20.1 | | 109.9 | | 14.0 | | 0.0 | | 51.3 | | 80.4 | | 0.8 | |
Contingent assets and liabilities and Commitments | | 69.8 | | — | | 62.7 | | — | | — | | 0.8 | | 6.3 | | — | |
Total | | 346.3 | | -20.1 | | 172.6 | | 14.0 | | 0.0 | | 52.1 | | 86.7 | | 0.8 | |
| | December 31, 2014 | | | | | | | | | | | | | | | |
Consolidated Group
Skr bn | | Book value | | Adjustment
from Book
value to
Exposure | | Central
governments | | Regional
governments | | Multilateral
development
banks | | Financial
institutions | | Corporates | | Securitization
positions | |
Treasuries/government bonds | | 3.5 | | 0.0 | | 3.5 | | — | | — | | — | | — | | — | |
Other interest-bearing securities except loans | | 66.4 | | -0.1 | | 3.0 | | 12.6 | | 0.3 | | 41.7 | | 2.4 | | 6.3 | |
Loans in the form of interest-bearing securities | | 53.1 | | -0.7 | | 10.2 | | — | | 0.0 | | 7.7 | | 34.5 | | — | |
Loans to credit institutions including cash and cash equivalents(1) | | 32.7 | | -10.2 | | 10.3 | | 6.4 | | — | | 5.4 | | 0.4 | | — | |
Loans to the public | | 149.2 | | -0.5 | | 99.4 | | 1.9 | | — | | 6.2 | | 41.2 | | — | |
Derivatives | | 16.0 | | -10.3 | | — | | — | | — | | 5.7 | | — | | — | |
Total financial assets | | 320.9 | | -21.8 | | 126.4 | | 20.9 | | 0.3 | | 66.7 | | 78.5 | | 6.3 | |
Contingent assets and liabilities and Commitments | | 71.2 | | — | | 64.5 | | — | | — | | 0.8 | | 5.9 | | — | |
Total | | 392.1 | | -21.8 | | 190.9 | | 20.9 | | 0.3 | | 67.5 | | 84.4 | | 6.3 | |
(1) Skr 13.6 billion (2014: Skr 9.7 billion) of the book value for Loans to credit institutions is cash collateral provided by SEK.
(2) Contingent assets and liabilities and Commitments, except cash collateral.
Reduction in derivative exposures from applying netting under current ISDA Master Agreements according to CRR regarding counterparty risk in derivative transactions amounts to Skr 3.9 billion (2014: Skr 7.2 billion). For further information regarding counterparty risk in derivative transactions under CRR, see Note 29 to the Consolidated Financial Statements.
Total credit exposures Consolidated Group
Amounts expressing net exposures are reported after taking into consideration effects of guarantees and credit default swaps. Amounts expressing gross exposures are reported without taking into consideration effects of guarantees and credit default swaps. Both of these amounts are calculated in accordance with capital adequacy calculations, but before the application of credit conversion factors. In tables showing the geographic distribution of exposures, North America excludes Central America.
F-61
Table of Contents
Total net exposures
| | Loans and interest-bearing
securities | | Undisbursed loans,
derivatives, etc | | Total | |
Skr bn
Classified by type of | | December 31,
2015 | | December 31,
2014 | | December 31,
2015 | | December 31,
2014 | | December 31,
2015 | | December 31,
2014 | |
exposure class | | Amount | | % | | Amount | | % | | Amount | | % | | Amount | | % | | Amount | | % | | Amount | | % | |
Central governments | | 109.9 | | 43.6 | | 126.5 | | 42.5 | | 62.7 | | 84.6 | | 64.4 | | 88.8 | | 172.6 | | 52.9 | | 190.9 | | 51.6 | |
Regional governments | | 14.0 | | 5.6 | | 20.9 | | 7.0 | | — | | — | | — | | — | | 14.0 | | 4.3 | | 20.9 | | 5.6 | |
Multilateral development banks | | 0.0 | | 0.0 | | 0.3 | | 0.1 | | — | | — | | — | | — | | 0.0 | | 0.0 | | 0.3 | | 0.1 | |
Financial institutions | | 47.0 | | 18.5 | | 61.0 | | 20.5 | | 5.0 | | 7.0 | | 6.5 | | 9.0 | | 52.0 | | 16.0 | | 67.5 | | 18.2 | |
Corporates | | 80.6 | | 32.0 | | 82.8 | | 27.8 | | 6.2 | | 8.4 | | 1.6 | | 2.2 | | 86.8 | | 26.6 | | 84.4 | | 22.8 | |
Securitization positions | | 0.8 | | 0.3 | | 6.3 | | 2.1 | | — | | — | | — | | — | | 0.8 | | 0.2 | | 6.3 | | 1.7 | |
Total | | 252.3 | | 100.0 | | 297.8 | | 100.0 | | 73.9 | | 100.0 | | 72.5 | | 100.0 | | 326.2 | | 100.0 | | 370.3 | | 100.0 | |
Credit exposures allocation between IRB-approach and the standardized approach
| | December 31, 2015 | | December 31, 2014 | |
Skr bn | | Net exposures | | Share % | | Net exposures | | Share % | |
Standardized approach | | | | | | | | | |
Central governments | | 172.6 | | 52.9 | | 190.9 | | 51.6 | |
Regional governments | | 14.0 | | 4.3 | | 20.9 | | 5.6 | |
Multilateral development banks | | 0.0 | | 0.0 | | 0.3 | | 0.1 | |
Corporates | | 1.4 | | 0.4 | | 1.2 | | 0.3 | |
Sum Standardized approach | | 188.0 | | 57.6 | | 213.3 | | 57.6 | |
IRB method | | | | | | | | | |
Financial institutions | | 52.0 | | 16.0 | | 67.5 | | 18.2 | |
Corporates | | 85.4 | | 26.2 | | 83.2 | | 22.5 | |
Securitization positions | | 0.8 | | 0.2 | | 6.3 | | 1.7 | |
Sum IRB method | | 138.2 | | 42.4 | | 157.0 | | 42.4 | |
Total | | 326.2 | | 100.0 | | 370.3 | | 100.0 | |
F-62
Table of Contents
Credit exposures by region and exposure class
Gross exposure by region and exposure class, as of December 31, 2015
Skr bn | | Middle
East/
Africa | | Asia excl.
Japan | | Japan | | North
America | | Oceania | | Latin
America | | Sweden | | West
European
countries
excl.
Sweden | | Central-
East
European
countries | | Total | |
Central governments | | 2.2 | | 9.9 | | — | | 1.3 | | — | | 42.8 | | 1.2 | | 2.2 | | — | | 59.6 | |
Regional governments | | 0.6 | | — | | — | | — | | — | | — | | 5.6 | | 1.1 | | 0.0 | | 7.3 | |
Multilateral development banks | | — | | — | | — | | — | | — | | — | | — | | 0.0 | | — | | 0.0 | |
Financial institutions | | 2.5 | | 4.7 | | 0.0 | | 4.7 | | 2.2 | | 2.1 | | 13.4 | | 17.6 | | 0.4 | | 47.6 | |
Corporates | | 20.1 | | 19.9 | | 3.8 | | 26.6 | | 0.3 | | 12.5 | | 67.7 | | 48.7 | | 11.3 | | 210.9 | |
Securitization positions | | — | | — | | — | | — | | — | | — | | — | | 0.8 | | — | | 0.8 | |
Total | | 25.4 | | 34.5 | | 3.8 | | 32.6 | | 2.5 | | 57.4 | | 87.9 | | 70.4 | | 11.7 | | 326.2 | |
Gross exposure by region and exposure class, as of December 31, 2014
Skr bn | | Middle
East/
Africa | | Asia excl.
Japan | | Japan | | North
America | | Oceania | | Latin
America | | Sweden | | West
European
countries
excl.
Sweden | | Central-
East
European
countries | | Total | |
Central governments | | 2.2 | | 8.4 | | — | | 0.4 | | — | | 43.0 | | 7.9 | | 4.8 | | 0.0 | | 66.7 | |
Regional governments | | 0.7 | | — | | — | | — | | — | | — | | 11.8 | | 0.5 | | — | | 13.0 | |
Multilateral development banks | | — | | — | | — | | — | | — | | — | | — | | 0.3 | | — | | 0.3 | |
Financial institutions | | 1.5 | | 3.6 | | 0.2 | | 12.5 | | 4.0 | | 2.0 | | 14.2 | | 23.5 | | 0.4 | | 61.9 | |
Corporates | | 17.6 | | 22.5 | | 14.0 | | 27.0 | | 0.5 | | 12.1 | | 70.2 | | 45.2 | | 12.9 | | 222.0 | |
Securitization positions | | — | | — | | — | | 1.1 | | 1.2 | | — | | — | | 4.1 | | — | | 6.4 | |
Total | | 22.0 | | 34.5 | | 14.2 | | 41.0 | | 5.7 | | 57.1 | | 104.1 | | 78.4 | | 13.3 | | 370.3 | |
Net exposure by region and exposure class, as of December 31, 2015
Skr bn | | Middle
East/
Africa | | Asia excl.
Japan | | Japan | | North
America | | Oceania | | Latin
America | | Sweden | | West
European
countries
excl.
Sweden | | Central-
East
European
countries | | Total | |
Central governments | | — | | 4.9 | | — | | 5.9 | | — | | 0.8 | | 137.6 | | 20.3 | | 3.1 | | 172.6 | |
Regional governments | | — | | — | | — | | — | | — | | — | | 12.7 | | 1.3 | | — | | 14.0 | |
Multilateral development banks | | — | | — | | — | | — | | — | | — | | — | | 0.0 | | — | | 0.0 | |
Financial institutions | | 2.5 | | 4.6 | | 0.5 | | 3.9 | | 2.2 | | 2.1 | | 8.6 | | 27.2 | | 0.4 | | 52.0 | |
Corporates | | 1.1 | | 1.4 | | 0.5 | | 5.5 | | — | | 1.8 | | 60.0 | | 16.3 | | 0.2 | | 86.8 | |
Securitization positions | | — | | — | | — | | — | | — | | — | | — | | 0.8 | | — | | 0.8 | |
Total | | 3.6 | | 10.9 | | 1.0 | | 15.3 | | 2.2 | | 4.7 | | 218.9 | | 65.9 | | 3.7 | | 326.2 | |
F-63
Table of Contents
Net exposure by region and exposure class, as of December 31, 2014
Skr bn | | Middle
East/
Africa | | Asia excl.
Japan | | Japan | | North
America | | Oceania | | Latin
America | | Sweden | | West
European
countries
excl.
Sweden | | Central-
East
European
countries | | Total | |
Central governments | | — | | 3.5 | | — | | 4.4 | | — | | 0.8 | | 155.7 | | 23.9 | | 2.6 | | 190.9 | |
Regional governments | | — | | — | | — | | — | | — | | — | | 18.5 | | 2.4 | | — | | 20.9 | |
Multilateral development banks | | — | | — | | — | | — | | — | | — | | — | | 0.3 | | — | | 0.3 | |
Financial institutions | | 1.4 | | 3.3 | | 0.3 | | 11.5 | | 4.0 | | 1.9 | | 9.1 | | 35.6 | | 0.4 | | 67.5 | |
Corporates | | 0.7 | | 0.9 | | 2.3 | | 5.6 | | 0.1 | | 1.0 | | 58.9 | | 14.4 | | 0.5 | | 84.4 | |
Securitization positions | | — | | — | | — | | 1.0 | | 1.2 | | — | | — | | 4.1 | | — | | 6.3 | |
Total | | 2.1 | | 7.7 | | 2.6 | | 22.7 | | 5.3 | | 3.7 | | 242.2 | | 80.7 | | 3.5 | | 370.3 | |
Effect of credit risk mitigation by exposure class and type of protection
The tables below displays by gross exposure class the amounts subject to, or not subject to, credit risk mitigation where guarantees or credit default swaps has been accounted for in the capital adequacy calculations. Credit insurance issued by insurance companies is included in guarantees. Protected amounts are displayed by the exposure class of the issuer of the protection and by the type of protection. The tables hence displays those types of credit risk mitigation that transforms gross exposures to net exposures.
Effect of credit risk mitigation, as of December 31, 2015
| | Gross exposures by exposure class | |
Skr bn | | Central
governments | | Regional
governments | | Multilateral
development
banks | | Financial
institutions | | Corporates | | Securitization
positions | | Total | |
Amounts related to credit risk mitigation issued by | | | | | | | | | | | | | | | |
Central governments | | 51.3 | | 0.6 | | — | | 1.9 | | 110.5 | | — | | 164.3 | |
of which guarantees by the Swedish Export Credit Agency | | 49.9 | | 0.6 | | — | | 1.5 | | 84.3 | | — | | 136.3 | |
of which guarantees by other export credit agencies | | 1.4 | | — | | — | | 0.4 | | 21.9 | | — | | 23.7 | |
of which other guarantees | | — | | — | | — | | — | | 4.3 | | — | | 4.3 | |
Regional governments | | — | | 0.0 | | — | | 6.7 | | 0.6 | | — | | 7.3 | |
Financial institutions | | 0.0 | | 0.0 | | — | | 0.0 | | 13.0 | | — | | 13.0 | |
of which credit default swaps | | — | | — | | — | | — | | 4.0 | | — | | 4.0 | |
of which other guarantees | | — | | 0.0 | | — | | 0.0 | | 9.0 | | — | | 9.0 | |
Corporates | | 0.0 | | 0.1 | | — | | 0.0 | | 2.0 | | — | | 2.1 | |
of which credit insurance from insurance companies | | — | | — | | — | | — | | 1.3 | | — | | 1.3 | |
of which other guarantees | | — | | 0.1 | | — | | 0.0 | | 0.7 | | — | | 0.7 | |
Total mitigated exposures | | 51.3 | | 0.7 | | — | | 8.6 | | 126.1 | | — | | 186.7 | |
Non-mitigated exposures(1) | | 8.3 | | 6.7 | | 0.0 | | 38.9 | | 84.8 | | 0.8 | | 139.5 | |
Total | | 59.6 | | 7.4 | | 0.0 | | 47.5 | | 210.9 | | 0.8 | | 326.2 | |
(1) Exposures where the issuer of the credit risk mitigation belongs to the same group as the counterpart of the protected exposure has been included in “Non-mitigated exposures”. Those amounts are for corporate exposures Skr 17.6 billion and for financial institutions Skr 1.3 billion.
F-64
Table of Contents
Effect of credit risk mitigation, as of December 31, 2014
| | Gross exposures by exposure class | |
Skr bn | | Central
governments | | Regional
governments | | Multilateral
development
banks | | Financial
institutions | | Corporates | | Securitization
positions | | Total | |
Amounts related to credit risk mitigation issued by | | | | | | | | | | | | | | | |
Central governments | | 51.5 | | 0.6 | | — | | 2.6 | | 122.8 | | — | | 177.5 | |
of which guarantees by the Swedish Export Credit Agency | | 50.0 | | 0.6 | | — | | 1.9 | | 95.4 | | — | | 147.9 | |
of which guarantees by other export credit agencies | | 1.5 | | — | | — | | 0.7 | | 23.4 | | — | | 25.6 | |
of which other guarantees | | — | | — | | — | | — | | 4.0 | | — | | 4.0 | |
Regional governments | | 1.7 | | 0.0 | | — | | 6.6 | | 0.2 | | — | | 8.5 | |
Financial institutions | | 0.1 | | — | | — | | 0.2 | | 15.1 | | — | | 15.4 | |
of which credit default swaps | | — | | — | | — | | — | | 5.8 | | — | | 5.8 | |
of which other guarantees | | 0.1 | | — | | — | | 0.2 | | 9.3 | | — | | 9.6 | |
Corporates | | — | | 0.1 | | — | | 0.4 | | 1.7 | | — | | 2.2 | |
of which credit insurance from insurance companies | | — | | — | | — | | — | | 0.9 | | — | | 0.9 | |
of which other guarantees | | — | | 0.1 | | — | | 0.4 | | 0.8 | | — | | 1.3 | |
Total mitigated exposures | | 53.3 | | 0.7 | | — | | 9.8 | | 139.8 | | — | | 203.6 | |
Non-mitigated exposures(1) | | 13.5 | | 12.3 | | 0.3 | | 52.1 | | 82.2 | | 6.3 | | 166.7 | |
Total | | 66.8 | | 13.0 | | 0.3 | | 61.9 | | 222.0 | | 6.3 | | 370.3 | |
(1) Exposures where the issuer of the credit risk mitigation belongs to the same group as the counterpart of the protected exposure has been included in “Non-mitigated exposures”. Those amounts are for corporate exposures Skr 18,4 bn and for financial institutions Skr 1,5 bn.
Gross exposures European countries, excluding Sweden by exposure classes, as of December 31, 2015
Skr bn | | Central
governments | | Regional
governments | | Multilateral
development
banks | | Financial
institutions | | Corporates | | Securitization
positions | | Total | |
Spain | | — | | — | | — | | 0.2 | | 17.5 | | — | | 17.7 | |
The Netherlands | | — | | — | | — | | 5.4 | | 3.2 | | — | | 8.6 | |
United Kingdom | | — | | — | | — | | 3.4 | | 5.1 | | — | | 8.5 | |
Russia | | — | | — | | — | | — | | 7.9 | | — | | 7.9 | |
Finland | | — | | 0.3 | | — | | 0.4 | | 6.8 | | — | | 7.5 | |
Denmark | | — | | 0.7 | | — | | 1.8 | | 2.9 | | — | | 5.4 | |
France | | — | | — | | — | | 1.7 | | 3.7 | | — | | 5.4 | |
Luxembourg | | 1.4 | | — | | 0.0 | | 0.0 | | 1.9 | | — | | 3.3 | |
Poland | | — | | — | | — | | — | | 3.1 | | — | | 3.1 | |
Norway | | — | | — | | — | | 2.0 | | 1.1 | | — | | 3.1 | |
Italy | | — | | — | | — | | — | | 2.4 | | — | | 2.4 | |
Switzerland | | — | | — | | — | | 1.2 | | 1.1 | | — | | 2.3 | |
Germany | | 0.4 | | 0.1 | | — | | 1.6 | | 0.1 | | — | | 2.2 | |
Ireland | | — | | — | | — | | — | | 1.2 | | 0.8 | | 2.0 | |
Iceland | | — | | — | | — | | — | | 1.2 | | — | | 1.2 | |
Austria | | 0.4 | | — | | — | | — | | 0.0 | | — | | 0.4 | |
Latvia | | — | | — | | — | | 0.3 | | — | | — | | 0.3 | |
Portugal | | — | | — | | — | | — | | 0.2 | | — | | 0.2 | |
Hungary | | — | | — | | — | | — | | 0.1 | | — | | 0.1 | |
Greece | | — | | — | | — | | — | | 0.1 | | — | | 0.1 | |
Ukraine | | — | | — | | — | | — | | 0.1 | | — | | 0.1 | |
Other countries | | — | | 0.0 | | — | | 0.1 | | 0.2 | | — | | 0.3 | |
Total | | 2.2 | | 1.1 | | 0.0 | | 18.1 | | 59.9 | | 0.8 | | 82.1 | |
F-65
Table of Contents
Gross exposures European countries, excluding Sweden by exposure classes, as of December 31, 2014
Skr bn | | Central
governments | | Regional
governments | | Multilateral
development
banks | | Financial
institutions | | Corporates | | Securitization
positions | | Total | |
Spain | | — | | — | | — | | 0.2 | | 13.4 | | 0.8 | | 14.4 | |
United Kingdom | | — | | — | | — | | 5.4 | | 6.0 | | 0.4 | | 11.8 | |
The Netherlands | | — | | — | | — | | 5.8 | | 3.7 | | 0.2 | | 9.7 | |
Russia | | — | | — | | — | | — | | 9.6 | | — | | 9.6 | |
Finland | | — | | 0.5 | | — | | 1.6 | | 7.4 | | — | | 9.5 | |
France | | 1.2 | | — | | — | | 1.9 | | 4.1 | | — | | 7.2 | |
Denmark | | 0.2 | | — | | — | | 1.8 | | 2.7 | | — | | 4.7 | |
Ireland | | — | | — | | — | | 0.3 | | 1.5 | | 2.5 | | 4.3 | |
Germany | | 2.4 | | — | | — | | 0.9 | | 0.2 | | — | | 3.5 | |
Norway | | — | | — | | — | | 2.2 | | 1.0 | | — | | 3.2 | |
Luxembourg | | 1.0 | | — | | 0.3 | | 0.0 | | 1.9 | | — | | 3.2 | |
Poland | | — | | — | | — | | — | | 2.7 | | — | | 2.7 | |
Switzerland | | — | | — | | — | | 1.7 | | 0.4 | | — | | 2.1 | |
Italy | | — | | — | | — | | — | | 1.4 | | — | | 1.4 | |
Austria | | — | | — | | — | | 1.3 | | 0.0 | | — | | 1.3 | |
Iceland | | — | | — | | — | | — | | 1.1 | | — | | 1.1 | |
Latvia | | — | | — | | — | | 0.3 | | 0.3 | | — | | 0.6 | |
Portugal | | — | | — | | — | | — | | 0.2 | | 0.2 | | 0.4 | |
Cyprus | | — | | — | | — | | — | | 0.4 | | — | | 0.4 | |
Greece | | — | | — | | — | | — | | 0.1 | | — | | 0.1 | |
Ukraine | | — | | — | | — | | — | | 0.1 | | — | | 0.1 | |
Other countries | | 0.0 | | — | | — | | 0.2 | | 0.2 | | — | | 0.4 | |
Total | | 4.8 | | 0.5 | | 0.3 | | 23.6 | | 58.4 | | 4.1 | | 91.7 | |
Net exposures European countries, excluding Sweden by exposure classes, as of December 31, 2015
Skr bn | | Central
governments | | Regional
governments | | Multilateral
development
banks | | Financial
institutions | | Corporates | | Securitization
positions | | Total | |
France | | 10.9 | | — | | — | | 4.4 | | 0.0 | | — | | 15.3 | |
United Kingdom | | 1.3 | | — | | — | | 4.7 | | 3.2 | | — | | 9.2 | |
Finland | | 1.1 | | 0.5 | | — | | 0.8 | | 5.8 | | — | | 8.2 | |
Germany | | 3.7 | | 0.1 | | — | | 2.7 | | 1.0 | | — | | 7.5 | |
The Netherlands | | — | | — | | — | | 5.6 | | 1.4 | | — | | 7.0 | |
Denmark | | 0.1 | | 0.7 | | — | | 3.3 | | 2.5 | | — | | 6.6 | |
Norway | | 0.6 | | — | | — | | 3.4 | | 0.3 | | — | | 4.3 | |
Poland | | 3.1 | | — | | — | | — | | — | | — | | 3.1 | |
Luxembourg | | 1.4 | | — | | 0.0 | | 0.0 | | 0.8 | | — | | 2.2 | |
Switzerland | | — | | — | | — | | 1.4 | | 0.6 | | — | | 2.0 | |
Ireland | | — | | — | | — | | — | | 0.3 | | 0.8 | | 1.1 | |
Iceland | | 0.6 | | — | | — | | — | | 0.2 | | — | | 0.8 | |
Spain | | — | | — | | — | | 0.4 | | 0.1 | | — | | 0.5 | |
Austria | | 0.4 | | — | | — | | 0.1 | | — | | — | | 0.5 | |
Belgium | | — | | — | | — | | 0.4 | | 0.0 | | — | | 0.4 | |
Latvia | | — | | — | | — | | 0.3 | | — | | — | | 0.3 | |
Portugal | | 0.2 | | — | | — | | — | | — | | — | | 0.2 | |
Estonia | | — | | — | | — | | 0.1 | | — | | — | | 0.1 | |
Italy | | 0.0 | | — | | — | | — | | 0.0 | | — | | 0.0 | |
Greece | | — | | — | | — | | — | | — | | — | | — | |
Other countries | | — | | — | | — | | — | | 0.3 | | — | | 0.3 | |
Total | | 23.4 | | 1.3 | | 0.0 | | 27.6 | | 16.5 | | 0.8 | | 69.6 | |
F-66
Table of Contents
Net exposures European countries, excluding Sweden by exposure classes, as of December 31, 2014
Skr bn | | Central
governments | | Regional
governments | | Multilateral
development
banks | | Financial
institutions | | Corporates | | Securitization
positions | | Total | |
France | | 12.6 | | — | | — | | 6.1 | | — | | — | | 18.7 | |
United Kingdom | | 1.8 | | — | | — | | 8.6 | | 2.7 | | 0.4 | | 13.5 | |
Germany | | 4.7 | | 1.7 | | — | | 2.2 | | 1.1 | | — | | 9.7 | |
Finland | | 1.4 | | 0.7 | | — | | 2.1 | | 4.9 | | — | | 9.1 | |
The Netherlands | | — | | — | | — | | 5.8 | | 1.1 | | 0.2 | | 7.1 | |
Denmark | | 0.4 | | — | | — | | 3.3 | | 2.2 | | — | | 5.9 | |
Norway | | 0.7 | | — | | — | | 3.5 | | 0.3 | | — | | 4.5 | |
Ireland | | — | | — | | — | | — | | 0.5 | | 2.5 | | 3.0 | |
Poland | | 2.7 | | — | | — | | — | | — | | — | | 2.7 | |
Switzerland | | — | | — | | — | | 2.0 | | 0.4 | | — | | 2.4 | |
Spain | | — | | — | | — | | 0.3 | | 1.0 | | 0.8 | | 2.1 | |
Austria | | — | | — | | — | | 1.4 | | — | | — | | 1.4 | |
Luxembourg | | 1.0 | | — | | 0.3 | | 0.0 | | 0.0 | | — | | 1.3 | |
Iceland | | 0.6 | | — | | — | | — | | 0.2 | | — | | 0.8 | |
Latvia | | — | | — | | — | | 0.3 | | 0.3 | | — | | 0.6 | |
Italy | | 0.4 | | — | | — | | — | | 0.0 | | — | | 0.4 | |
Portugal | | 0.2 | | — | | — | | — | | — | | 0.2 | | 0.4 | |
Belgium | | — | | — | | — | | 0.3 | | — | | — | | 0.3 | |
Greece | | — | | — | | — | | — | | — | | — | | — | |
Other countries | | — | | — | | — | | 0.1 | | 0.2 | | — | | 0.3 | |
Total | | 26.5 | | 2.4 | | 0.3 | | 36.0 | | 14.9 | | 4.1 | | 84.2 | |
Net exposures to counterparties in Ireland, Italy, Portugal and Spain amounted to Skr 1.9 billion at December 31, 2015 (year-end 2014: Skr 5.9 billion). SEK does not have any net exposures to counterparties in Greece. Gross exposures to counterparties in Greece amounted to Skr 0.1 billion as of December 31, 2015 (year-end 2014: Skr 0.1 billion). Gross exposures to counterparties in Ukraine amounted to Skr 0.1 billion as of December 31, 2015 (year-end 2014: Skr 0.1 billion). These gross exposures are guaranteed in full by counterparties in other countries. Gross exposures to counterparties in the Russian Federation amounted to Skr 7.9 billion as of December 31, 2015 (year-end 2014: Skr 9.6 billion. Net exposure to counterparties in the Russian Federation amounted to Skr 0.1 billion as of December 31, 2015 (year-end 2014: Skr 0.1 billion).
Corporate exposures by industry (GICS)
| | December 31, 2015 | | December 31, 2014 | |
Skr bn | | Gross exposure | | Net exposure | | Gross exposure | | Net exposure | |
IT and telecom | | 73.6 | | 8.4 | | 83.1 | | 9.4 | |
Industrials | | 49.1 | | 33.9 | | 46.1 | | 32.9 | |
Financials | | 22.3 | | 7.2 | | 23.7 | | 5.7 | |
Materials | | 22.9 | | 14.7 | | 27.0 | | 12.8 | |
Consumer goods | | 15.9 | | 12.2 | | 16.4 | | 12.5 | |
Utilities | | 14.8 | | 4.1 | | 13.7 | | 5.0 | |
Health Care | | 6.2 | | 5.4 | | 5.9 | | 5.1 | |
Energy | | 5.6 | | 0.9 | | 5.7 | | 1.0 | |
Other | | 0.5 | | 0.0 | | 0.4 | | 0.0 | |
Total | | 210.9 | | 86.8 | | 222.0 | | 84.4 | |
Asset-Backed Securities held
The tables below include current aggregated information regarding SEK’s total net exposures (after effects related to risk-coverage) related to asset-backed securities held and to current creditworthiness. Ratings in the table are stated as the second lowest of the credit ratings from Standard & Poor’s, Moody’s and Fitch. When only two credit ratings are available the lowest is stated. All of these assets represent first-priority tranches, and they have all been credit rated ‘AAA’/’Aaa’ by Standard & Poor’s or Moody’s at acquisition.
F-67
Table of Contents
Net exposures
Skr mn | | December 31 2015 | | December 31 2014 | |
‘AAA’ | | 756 | | 3,744 | |
‘AA+’ | | — | | 4 | |
‘AA’ | | — | | 206 | |
‘AA-’ | | — | | 152 | |
‘A+’ | | — | | 111 | |
‘A’ | | — | | 419 | |
‘A-’ | | — | | 143 | |
‘BBB+’ | | — | | 163 | |
‘BBB’ | | — | | — | |
‘BBB-’ | | — | | 425 | |
‘BB+’ | | — | | 150 | |
‘BB’ | | — | | 387 | |
‘B+’ | | — | | 174 | |
CDO rated ‘CCC’ | | — | | 33 | |
Total | | 756 | | 6,111 | |
Market risk
The positions that SEK secure, relating to market risk, can be positions that are not valued at fair value in the statement of financial position in accordance with IFRS. Thus, the financial risk estimated by SEK may differ from the changes in value recognized in operating profit or in other comprehensive income. SEK assumes a one-percentage-point change in the market rate, as a parallel shift, for the sensitivity analyses relating to interest rate risk. SEK assesses a reasonable assumption that the average change in market rates will not exceed one percentage point over the next year. Negative interest rates are allowed in the sensitivity calculations since 2015. Negative interest rates were not allowed in the sensitivity calculations in 2014.
Change in value if the market interest rate rises by one percentage point
The impact on the value of assets and liabilities, including derivatives, when market interest rates rise by one percentage point (+1%).
Consolidated Group
| | 2015 | | 2014 | |
Skr mn | | Total | | of which financial
instruments measured
at fair value
through profit or
loss | | of which financial
instruments measured
at fair value
through comprehensive
income | | Total | | of which financial
instruments
measured at fair
value through profit
or loss | | of which financial
instruments measured
at fair value
through comprehensive
income | |
Foreign currency | | 68 | | 306 | | -58 | | -3 | | 347 | | -65 | |
Swedish Skr | | 4 | | 93 | | -10 | | 12 | | 107 | | -23 | |
| | 72 | | 399 | | -68 | | 9 | | 454 | | -88 | |
Change in value if the market interest rate declines by one percentage point
The impact on the value of assets and liabilities, including derivatives, when market interest rates decline by one percentage point (-1%).
F-68
Table of Contents
Consolidated Group
| | 2015 | | 2014 | |
Skr mn | | Total | | of which financial
instruments measured
at fair value
through profit or
loss | | of which financial
instruments measured
at fair value
through comprehensive
income | | Total | | of which financial
instruments
measured at fair
value through profit
or loss | | of which financial
instruments measured
at fair value
through comprehensive
income | |
Foreign currency | | -62 | | -280 | | 68 | | 48 | | -74 | | 17 | |
Swedish Skr | | 79 | | -93 | | 21 | | -12 | | -29 | | 5 | |
| | 17 | | -373 | | 89 | | 36 | | -103 | | 22 | |
Assets, liabilities and derivatives denominated in foreign currencies
Assets, liabilities and derivatives denominated in foreign currencies (i.e. currencies other than Swedish kronor) have been converted to Swedish kronor at the year-end exchange-rates between such currencies and Swedish kronor. The relevant exchange-rates for the currencies representing the largest portions of the Consolidated Group in the statement of financial position reported assets and liabilities are presented in table below (expressed in Swedish kronor per unit of each foreign currency). The portion at year-end represents portion of aggregated volumes of assets and liabilities denominated in foreign currency. Foreign currency positions at year-end represent the net of all assets and liabilities in the statement of financial position in each currency. The amounts are book values.
| | December 31, 2015 | | December 31, 2014 | |
| | | | Portion at | | Foreign currency | | | | Portion at | | Foreign currency | |
Currency | | Exchange-rate | | year-end, % | | position | | Exchange-rate | | year-end, % | | position | |
| | | | | | | | | | | | | |
SKR | | 1 | | 93 | | n.a. | | 1 | | 92 | | n.a. | |
EUR | | 9.1350 | | 3 | | -539 | | 9.5155 | | 3 | | -522 | |
USD | | 8.3524 | | 1 | | 252 | | 7.8117 | | 0 | | -48 | |
JPY | | 0.06935 | | 1 | | -136 | | 0.06536 | | 2 | | -270 | |
CHF | | 8.4287 | | 1 | | 203 | | 7.9123 | | 1 | | 227 | |
MXN | | 0.4832 | | 0 | | -74 | | 0.5291 | | 0 | | -79 | |
Others | | — | | 1 | | -223 | | — | | 2 | | -340 | |
Total foreign currency position | | | | 100 | | -517 | | | | 100 | | -1,032 | |
The FX risk is limited to the accrued net income in foreign currency and is hedged regularly. In accordance with SEK’s policies for risk management, foreign currency positions related to unrealized fair value changes are not hedged. At year-end, foreign currency positions excluding unrealized changes in fair value amounted to Skr 2 million (year-end 2014: Skr 14 million).
| | December 31,
2015 | | December 31,
2014 | |
Skr mn | | Consolidated Group | | Consolidated Group | |
Total assets | | 280,411 | | 325,166 | |
of which denominated in foreign currencies | | 226,981 | | 291,899 | |
Total liabilities | | 263,583 | | 309,009 | |
of which denominated in foreign currencies | | 227,498 | | 292,931 | |
F-69
Table of Contents
Liquidity risk
Contractual flows
| | As of 31 December 2015 | |
Consolidated Group
Skr mn | | Maturity <
1 month | | Maturity 1
month < 3
months | | Maturity 3
months < 1
year | | Maturity 1
year < 5
years | | Maturity > 5
years | | Sum Cash
Flow | | Discount
effect | | Book value | |
Financial Assets | | | | | | | | | | | | | | | | | |
Cash and cash equivalents | | 2,258 | | — | | — | | — | | — | | 2,258 | | — | | 2,258 | |
Treasuries/government bonds | | — | | 1 | | 2,016 | | — | | — | | 2,017 | | -11 | | 2,006 | |
Other interest-bearing securities except loans | | 3,291 | | 10,820 | | 14,257 | | 12,933 | | — | | 41,301 | | -470 | | 40,831 | |
Loans in the form of interest-bearing securities | | 494 | | 1,520 | | 7,882 | | 27,389 | | 15,010 | | 52,295 | | -4,188 | | 48,107 | |
Loans to credit institutions | | 595 | | 14,493 | | 2,163 | | 7,414 | | 6,350 | | 31,015 | | -1,239 | | 29,776 | |
Loans to the public | | 3,672 | | 7,410 | | 23,958 | | 84,285 | | 33,774 | | 153,099 | | -12,293 | | 140,806 | |
Derivatives | | 408 | | 385 | | 1,426 | | 6,256 | | 7,450 | | 15,925 | | -3,253 | | 12,672 | |
Total | | 10,718 | | 34,629 | | 51,702 | | 138,277 | | 62,584 | | 297,910 | | -21,454 | | 276,456 | |
| | As of 31 December 2015 | |
Consolidated Group
Skr mn | | Maturity <
1 month | | Maturity 1
month < 3
months | | Maturity 3
months < 1
year | | Maturity 1
year < 5
years | | Maturity > 5
years | | Sum Cash
Flow | | Discount
effect | | Book value | |
Financial Liabilities | | | | | | | | | | | | | | | | | |
Borrowing from credit institutions | | -382 | | -4,866 | | — | | — | | — | | -5,248 | | -35 | | 5,283 | |
Borrowing from the public | | — | | — | | -61 | | — | | — | | -61 | | — | | 61 | |
Senior securities issued | | -5,641 | | -17,278 | | -56,549 | | -128,725 | | -46,298 | | -254,491 | | 26,279 | | 228,212 | |
Derivatives | | -95 | | -807 | | -2,772 | | -4,835 | | -2,116 | | -10,625 | | -13,006 | | 23,631 | |
Subordinated securities issued | | — | | — | | — | | — | | -2,088 | | -2,088 | | — | | 2,088 | |
Total | | -6,118 | | -22,951 | | -59,382 | | -133,560 | | -50,502 | | -272,513 | | 13,238 | | 259,275 | |
| | | | | | | | | | | | | | | | | |
Commitments | | | | | | | | | | | | | | | | | |
Committed undisbursed loans | | 0 | | -5,517 | | -11,112 | | -10,493 | | 27,122 | | 0 | | | | 63,438 | |
| | | | | | | | | | | | | | | | | |
Cash flow surplus (+) / deficit (-) | | 4,600 | | 6,161 | | -18,792 | | -5,776 | | 39,204 | | 25,397 | | | | | |
| | | | | | | | | | | | | | | | | |
Accumulated cash flow surplus (+) / deficit (-) | | 4,600 | | 10,761 | | -8,031 | | -13,807 | | 25,397 | | 25,397 | | | | | |
In addition to the instruments in the statement of financial position and committed undisbursed loans, SEK has outstanding binding offers of Skr 2.3 billion as well as additional available funds consisting of a credit facility with the Swedish National Debt Office of Skr 80 billion, which can be used within the Swedish State’s export credit support system. In December 2015, the Swedish parliament decided that the credit facility for 2016 should amount to Skr 125 billion. With regard to liabilities with maturity between three months and five years, SEK has the intention to refinance these through borrowing on the financial markets. Repayments subject to notice for liabilities and hedging derivatives are treated as if notice were to be given immediately, whether it is SEK or the counterparty that has the right to demand early redemption. Assets with repayments subject to notice are assumed to occur on the maturity date. “Subordinated securities issued” which consists of a Dated Subordinated Instrument, were assumed be repaid at the time of the first redemption date. The scenario for liabilities and hedging derivatives is not likely to be the real outcome. Differences between book values and future cash flows for financial assets and financial liabilities are reported in the column “Discount effect”. Cash flows for cash collaterals are assumed to have the same maturity profile as related derivatives. Items other than financial instruments with an approximate expected recovery time within less than 12 months: other assets; prepaid expenses and accrued revenues, other liabilities; and accrued expenses and prepaid revenues. All other balance sheet items, other than financial instruments, have an approximate expected recovery time of 12 months or more. For information regarding liquidity risk, see Note 29 to the Consolidated Financial Statements. The amounts above include interest, except for committed undisbursed loans.
F-70
Table of Contents
| | As of 31 December 2014 | |
Consolidated Group
Skr mn | | Maturity
< 1 month | | Maturity
1 month
< 3 months | | Maturity
3 months
< 1 year | | Maturity
1 year
< 5 years | | Maturity
> 5 years | | Sum Cash
Flow | | Discount
effect | | Book
value | |
Financial Assets | | | | | | | | | | | | | | | | | |
Cash and cash equivalents | | 7,099 | | — | | — | | — | | — | | 7,099 | | — | | 7,009 | |
Treasuries/government bonds | | 2,381 | | 874 | | 235 | | — | | — | | 3,490 | | -32 | | 3,458 | |
Other interest-bearing securities except loans | | 2,797 | | 9,460 | | 32,773 | | 20,923 | | 1,217 | | 67,170 | | -772 | | 66,398 | |
Loans in the form of interest-bearing securities | | 553 | | 280 | | 5,352 | | 34,064 | | 16,936 | | 57,185 | | -4,045 | | 53,140 | |
Loans to credit institutions | | 418 | | 748 | | 11,035 | | 7,955 | | 6,820 | | 26,976 | | -1,466 | | 25,510 | |
Loans to the public | | 5,568 | | 7,740 | | 24,978 | | 90,556 | | 42,154 | | 170,996 | | -21,756 | | 149,240 | |
Derivatives | | 1,508 | | 3,144 | | 2,258 | | 6,174 | | 9,000 | | 22,084 | | -6,067 | | 16,017 | |
Total | | 20,324 | | 22,246 | | 76,631 | | 159,672 | | 76,127 | | 355,000 | | -34,138 | | 320,772 | |
| | As of 31 December 2014 | |
Consolidated Group
Skr mn | | Maturity
< 1 month | | Maturity
1 month
< 3 months | | Maturity
3 months
< 1 year | | Maturity
1 year
< 5 years | | Maturity
> 5 years | | Sum Cash
Flow | | Discount
effect | | Book
value | |
Financial Liabilities | | | | | | | | | | | | | | | | | |
Borrowing from credit institutions | | 430 | | — | | -8,716 | | — | | — | | -8,286 | | -4 | | 8,290 | |
Borrowing from the public | | 0 | | — | | 0 | | -63 | | — | | -63 | | 0 | | 63 | |
Senior securities issued | | -9,890 | | -26,672 | | -59,656 | | -153,685 | | -55,360 | | -305,263 | | 31,424 | | 273,839 | |
Derivatives | | -143 | | -673 | | -675 | | -3,463 | | -3,142 | | -8,096 | | -10,790 | | 18,886 | |
Subordinated securities issued | | — | | — | | -63 | | -2,114 | | — | | -2,177 | | 232 | | 1,945 | |
Total | | -9,603 | | -27,345 | | -69,110 | | -159,325 | | -58,502 | | -323,885 | | 20,862 | | 303,023 | |
| | | | | | | | | | | | | | | | | |
Commitments | | | | | | | | | | | | | | | | | |
Committed undisbursed loans | | -375 | | -1,205 | | -10,013 | | -4,268 | | 15,861 | | 0 | | | | 16,028 | |
| | | | | | | | | | | | | | | | | |
Cash flow surplus (+) / deficit (-) | | 10,346 | | -6,304 | | -2,492 | | -3,921 | | 33,486 | | 31,115 | | | | | |
| | | | | | | | | | | | | | | | | |
Accumulated cash flow surplus (+) / deficit (-) | | 10,346 | | 4,042 | | 1,550 | | -2,371 | | 31,115 | | 31,115 | | | | | |
Note 27. Transactions with related parties
SEK defines related parties to the Consolidated Group as:
· the shareholder, i.e. the Swedish State
· companies and organizations that are controlled through a common owner, the Swedish State
· key management personnel
· other related parties
The Swedish State owns 100 percent of the company’s share capital. By means of direct guarantees extended by the Swedish National Debt Office and the Swedish Export Credits Guarantee Board, EKN, 36 percent (2014: 39 percent; 2013: 44 percent) of the company’s outstanding loans on December 31, 2015 were guaranteed by the State. The remuneration for guarantees during 2015 amounted to Skr 75 million (2014: Skr 150 million; 2013: Skr 203 million). SEK administers, for compensation, the Swedish State’s export credit support system, and the State’s related concessionary credit program (together referred to as the “S-system”, see Note 1(d) and Note 24 to the Consolidated Financial Statements.
During 2015 SEK had a Skr 80 billion (2014: Skr 80 billion; 2013: Skr 80 billion) credit facility with the Swedish National Debt Office which was entirely related to the State’s export credit support (CIRR). In December 2015, the credit facility was extended for 2016, though the facility amount has changed to Skr 125 billion. SEK has not yet utilized the credit facility.
SEK enters into transactions in the ordinary course of business with entities that are partially or wholly-owned or controlled by the State. SEK also extends export credits (in the form of direct or pass-through loans) to entities related to the State. Transactions with such parties are conducted on the same terms (including interest rates and repayment schedules) as transactions with unrelated parties.
F-71
Table of Contents
Key management personnel include the following positions:
· The Board of Directors
· The Chief Executive Officer
· Other members of the Executive Committee
For information about remuneration and other benefits to key management personnel see Note 5 to the Consolidated Financial Statements.
Other related parties include close family members of key management personnel as well as companies which are controlled by key management personnel or controlled by close family members to key management personnel.
The following table further summarizes the Consolidated Group’s transactions with its related parties:
| | 2015 | |
| | The shareholder, i.e.
the Swedish State | | Companies and
organizations
controlled through a
common owner, the
Swedish State | | Total | |
Skr mn | | Assets/
liabilities | | Interest
income/
Interest
expense | | Assets/
liabilities | | Interest
income/
Interest
expense | | Assets/
liabilities | | Interest
income/
Interest
expense | |
Treasuries/government bonds | | 250 | | 0 | | — | | — | | 250 | | 0 | |
Other interest-bearing securities except loans | | — | | — | | 633 | | 8 | | 633 | | 8 | |
Loans in the form of interest-bearing securities | | — | | — | | 1,700 | | 20 | | 1,700 | | 20 | |
Loans to credit institutions | | — | | — | | 2,291 | | 23 | | 2,291 | | 23 | |
Loans to the public | | — | | — | | 866 | | 9 | | 866 | | 9 | |
Due from the State | | 987 | | — | | — | | — | | 987 | | — | |
Total | | 1,237 | | 0 | | 5,490 | | 60 | | 6,727 | | 60 | |
Borrowing from credit institutions | | — | | — | | — | | — | | — | | — | |
Borrowing from the public | | — | | — | | — | | — | | — | | — | |
Senior securities issued | | — | | — | | — | | — | | — | | — | |
Other liabilities | | 164 | | — | | — | | — | | 164 | | — | |
Total | | 164 | | — | | — | | — | | 164 | | — | |
F-72
Table of Contents
| | 2014 | |
| | The shareholder, i.e.
the Swedish State | | Companies and
organizations
controlled through a
common owner, the
Swedish State | | Total | |
Skr mn | | Assets/
liabilities | | Interest
income/
Interest
expense | | Assets/
liabilities | | Interest
income/
Interest
expense | | Assets/
liabilities | | Interest
income/
Interest
expense | |
Treasuries/government bonds | | 1,640 | | 4 | | — | | — | | 1,640 | | 4 | |
Other interest-bearing securities except loans | | — | | — | | 523 | | 5 | | 523 | | 5 | |
Loans in the form of interest-bearing securities | | — | | — | | 1,700 | | 35 | | 1,700 | | 35 | |
Loans to credit institutions | | — | | — | | 1,949 | | 18 | | 1,949 | | 18 | |
Loans to the public | | — | | — | | 753 | | 7 | | 753 | | 7 | |
Due from the State | | 1,165 | | — | | — | | — | | 1,165 | | — | |
Total | | 2,805 | | 4 | | 4,925 | | 65 | | 7,730 | | 69 | |
Borrowing from credit institutions | | — | | — | | — | | — | | — | | — | |
Borrowing from the public | | — | | — | | — | | — | | — | | — | |
Senior securities issued | | — | | — | | — | | — | | — | | — | |
Other liabilities | | 100 | | — | | — | | — | | 100 | | — | |
Total | | 100 | | — | | — | | — | | 100 | | — | |
| | 2013 | |
| | The shareholder, i.e.
the Swedish State | | Companies and
organizations that are
controlled through a
common owner, the
Swedish State | | Total | |
Skr mn | | Assets/
Liabilities | | Interest
income/
Interest
expense | | Assets/
Liabilities | | Interest
income/
Interest
expense | | Assets/
Liabilities | | Interest
income/
Interest
expense | |
Treasuries/government bonds | | 3,840 | | 3 | | — | | — | | 3,840 | | 3 | |
Other interest-bearing securities except credits | | — | | — | | 2,177 | | 15 | | 2,177 | | 15 | |
Credits in the form of interest-bearing securities | | — | | — | | 1,700 | | 44 | | 1,700 | | 44 | |
Credits to credit institutions | | — | | — | | 1,889 | | 19 | | 1,889 | | 19 | |
Credits to the public | | — | | — | | 456 | | 13 | | 456 | | 13 | |
Due from the State | | 953 | | — | | — | | — | | 953 | | — | |
Total | | 4,793 | | 3 | | 6,222 | | 91 | | 11,015 | | 94 | |
Borrowing from credit institutions | | — | | — | | — | | — | | — | | — | |
Borrowing from the public | | — | | — | | — | | — | | — | | — | |
Senior securities issued | | — | | — | | — | | — | | — | | — | |
Other liabilities | | 254 | | — | | — | | — | | 254 | | — | |
Total | | 254 | | — | | — | | — | | 254 | | — | |
Note 28. Events after the reporting period
No events with significant impact on the information in this report have occurred after the end of the reporting period. At the Extraordinary General Meeting on January 21, 2016, a new capital target for SEK was decided. The capital target is that SEK’s total capital ratio under normal circumstances shall exceed the capital requirement communicated by the Swedish FSA with 1 to 3 percentage points. According to the result of the Swedish FSA’s supervisory review and evaluation process shall SEK have a total capital ratio of 16.3 percent during 2015. SEK’s total capital ratio as of December 31, 2015 was 24.5 percent.
F-73
Table of Contents
Note 29. Risk and Capital Management
Risk and capital management
Introduction This section of the Annual Report describes significant aspects of SEK’s risk and capital management. For detailed descriptions, including quantitative information concerning SEK’s capital adequacy and credit risk exposure, as well as certain aspects of liquidity and market risks, refer to Note 25 Capital adequacy and Note 26 Risk information. For supplementary and more detailed information on risk-related matters, which SEK is required to publish under the applicable regulations, including the Capital Requirements Regulation (CRR), refer to the separate document, “SEK - Capital Adequacy and Risk Management Report - Pillar 3 2015,” published on SEK’s website. Events in 2015 SEK’s capital adequacy improved in 2015. At the end of the year, the total capital ratio amounted to 24.5 percent (2014: 19.2 percent). The Tier 1 capital ratio and the Common Equity Tier 1 capital ratio both amounted to 21.6 percent (2014:16.9 percent). SEK’s total own funds expanded, primarily due to an increase in accumulated earnings, in parallel with a decline in the capital requirement under | | the IRB approach for exposures to companies and institutions through adjustment of the risk parameters in 2015, and through a decrease in total exposures. The reduction in the risk parameters was attributable to improvements in default statistics over the last few years. SEK has divested the majority of securitization positions and also reduced the volume of its liquidity investments. These actions have decreased credit-risk exposures to securitizations, governments, regional governments and financial institutions. Divestments of securitizations and the decrease in liquidity investments also reduced the company’s exposure to market risk. This applies primarily in terms of exposure to changes in credit spread risk. The risk level in terms of operational risks is within the risk appetite. Losses deriving from incidents remain low, at Skr 0.8 million in 2015 (2014: Skr 0.4 million). SEK’s liquidity was stable during the year and the external requirements for the liquidity coverage ratio (LCR) and the internal requirement that all credit commitments be financed throughout the entire period to maturity were fulfilled. |
F-74
Table of Contents
Core risk management principles · SEK must be selective in its choice of counterparties and clients in order to ensure a strong credit rating. · SEK only lends funds to clients who have successfully undergone SEK’s procedure for gaining understanding of the customer and its business relations (know your customer), and thus has a business structure that complies with SEK’s mission of promoting the Swedish export industry. · The business operations are limited to products and positions that the company has approved and has procedures for, whose risks can be measured and evaluated and where the company, at a minimum, complies with international sustainability risk guidelines. · SEK’s business strategy entails that we secure financing which has, at least, the same maturities as the funds that we lend. Risk governance The Board of Directors has ultimate responsibility for SEK’s organizational structure and the administration of SEK’s affairs, including overseeing and monitoring risk exposure and risk management and ensuring satisfactory internal control of compliance with laws and other regulations to which SEK’s business activities are subject. The Board determines the overall risk governance by taking decisions on such matters as risk appetite and risk strategy. These decisions are taken annually in connection with the business plan to ensure that risk management, use of capital and business strategies correspond with each other. The Board also decides on risk policies and on matters concerning credit granting of a large magnitude. The Board has established the Finance and Risk Committee (FRC), which assists the Board in overall issues regarding governance and monitoring of risk-taking, risk management and use of capital. The FRC also decides on certain limits, primarily involving market risk. The Board’s Credit Committee (CC) is the Board’s working body for matters within SEK involving loans and loan limit decisions, and for matters of fundamental significance or generally of great importance to SEK, and also makes decisions concerning loans in accordance with the delegation of authority decided by the Board. The Board’s Audit Committee (AC) assists the Board with SEK’s financial reporting, matters involving internal control and the corporate governance report. SEK’s CEO is responsible for day-to-day management of business operations. The CEO has established committees that are tasked with following up matters, serving as consultative bodies for the CEO in matters decided by the CEO and preparing matters ahead of decisions by the Board. The Risk and Compliance Committee deals with risk, capital, compliance and audit matters and evaluates the effects of new regulations. The Committee monitors SEK’s risk exposure, use of capital and reports issued by control functions. Following consultation with the Committee, the CEO issues Governing Documents regarding delegation of responsibility and management of the types of risk arising in SEK. The Credit Committee (CC) is responsible | | for lending and credit risk management issues within SEK. As part of its mandate, and based on the division of authority determined by the Board, the Credit Committee is authorized to make decisions involving credit. SEK has organized risk management and risk control in accordance with the principle of three lines of defense in the form of clear-cut separation of responsibility between the commercial and support operations that own the risks, the control functions that independently identify and monitor the risks and an internal audit, which reviews these matters and reports directly to the Board. Division of responsibility for risk, liquidity
and capital management in the company |
| First line of defense |
| | | |
| · Business and support functions. | | · Credit and sustainability analyses. |
| · Day-to-day management of risk, capital and liquidity in compliance with risk appetite and strategy as well as applicable laws and rules. | | · Daily control and follow-up of credit, market and liquidity risk. |
| | | |
| Second line of defense |
| | | |
| · Independent risk control and compliance functions. | | · Risk, liquidity and capital reporting. |
| · Identification, quantification, monitoring and control of risks and risk management. | | · Maintain an efficient risk management framework and internal control framework. |
| | | · Compliance monitoring and reporting. |
| |
| Third line of defense |
| | | |
| · Independent internal audit. · Review and evaluation of the efficiency and integrity of risk management. | | · Performance of audit activities in line with the audit plan adopted by the Board. · Direct reporting to the Board. |
| | | |
| Risk management process SEK must identify, measure, manage, report and control those risks with which the business is associated and, to this end, ensure that it has satisfactory internal control. SEK’s risk management process consists of the following key elements: · Risk identification. At any given time, SEK must be aware of the risks to which it is exposed. Risks are identified, primarily in new transactions, in external changes in SEK’s operating environment or internally in, for example, products, processes, systems and through annual risk analyses that include all aspects of SEK. Both forward-looking and historical analyses and testing are performed. · Measurement. The size of the risks is measured on a daily basis in respect of significant measurable risks or are assessed qualitatively as frequently as necessary. For those risks that are not directly measurable, SEK evaluates the risk according to models that are based on SEK’s risk appetite for the respective risk |
F-75
Table of Contents
class, specifying appropriate scales of probability and consequence. · Governance. SEK aims to oversee the development of business, actively utilize risk-reduction capabilities and control the development of risks over time to ensure that the business activities are kept within the risk appetite and limits. SEK also carries out planning and draws up documentation to ensure the continuity of business-critical processes and systems and that planning is carried out for crisis management. Exercises and training regarding the management of situations that require crisis and/or continuity planning are performed continuously. · Reporting. SEK reports on the current risk situation, on the use of capital and on related matters to the CEO, the Finance and Risk Committee and the Board, at least once each quarter. · Control and monitoring. SEK checks and monitors compliance with limits, risk appetite, capital target, risk management and internal and external regulations to ensure that risk exposures are kept at an acceptable level for SEK and that risk management is effective and appropriate. | | Capital target SEK’s capital target is one of the Board’s most important governance parameters. The capital target serves two purposes: · The primary purpose is to ensure that SEK’s capital is adequate to support the strategy underlying the business plan and that capital adequacy always exceeds the regulatory requirements, even in the event of deep economic declines. · An additional purpose is to maintain capital at a level that supports a high credit rating, which is necessary to secure access to long-term financing on favorable terms. A new capital target was adopted for SEK at the Extraordinary General Meeting on January 21, 2016. The capital target states that under normal conditions, SEK’s total capital ratio is to exceed the Swedish FSA’s capital adequacy requirement by 1 to 3 percentage points. As a result of the Swedish FSA’s review and evaluation process, SEK must have a total capital ratio of 16.3 percent in 2015. At December 31, 2015, the total capital ratio was 24.5 percent. |
| | |
SEK’s risk framework | | |
| | |
Effective risk management and control in SEK are based on a sound risk culture, a shared approach and a strong control environment. SEK emphasizes the importance of high risk awareness among personnel and an understanding of the importance of preventive risk management to, thereby, keep risk exposure within the determined level. SEK also has a risk framework (see diagram below) encompassing all of SEK’s operations, all of its risks and all relevant personnel. The structure of the risk framework is ultimately governed by SEK’s mission from its owner, the Swedish government, and SEK’s business model. | | The capital target constitutes the outer boundary for SEK’s strategy. Within the confines of the capital target, risk appetite is stated, which is expressed by risk class and comprises the risk to which the Board is prepared to expose SEK in order to achieve its strategic objectives. Risk governance is specified in the form of a risk strategy, a risk policy, in SEK’s risk culture, and in instructions, processes and limits. These Governing Documents describe the risk management process and define what activities and operations are included in the process, and how they should be performed. The Governing Documents also indicate how responsibility is structured in terms of the execution, monitoring of and compliance with risk management. |
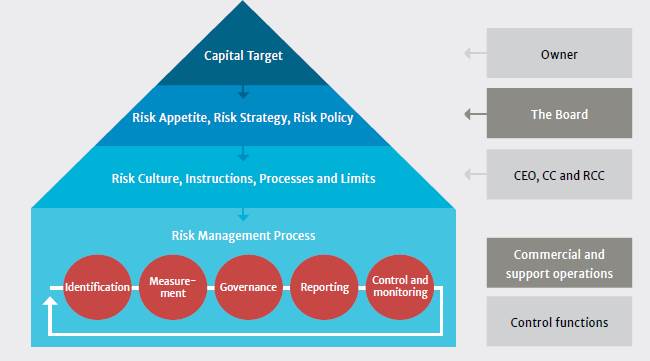
F-76
Table of Contents
SEK’s risks and its risk management
SEK’s mission is to ensure access to financial solutions for the Swedish export industry on commercial and sustainable terms. Different types of risk occur as part of operations, primarily credit risk. The following table provides an overview of the risks SEK is exposed to and how these risks are managed.
Risk class | | Risk profile |
| | |
Credit risk Credit risk is the risk of the loss that could occur if a borrower or party in another agreement cannot meet its obligations under the contracted terms and conditions.
Credit risk also includes counterparty risk, concentration risk and settlement risk. | | SEK’s credit risk portfolio maintains a high credit quality. The portfolio is exposed to a concentration risk due to SEK’s mission. The net risk is principally limited to counterparties with high credit ratings, such as state export credit agencies (ECAs), major Swedish exporters and banks and insurance companies. SEK invests its liquidity in high-credit-quality securities, primarily with short maturities. |
| | |
Market risk Market risk is the risk of losses or changes in future net interest income arising due to changes in, for example, interest rates, exchange rates, commodity prices or share prices. Market risk includes price risk in connection with sales of assets or the closing of exposures. | | SEK’s business model leads to exposure primarily to spread risk, interest-rate risk and currency risk. SEK’s largest net exposures are to changes in spread risk, mainly to credit spreads associated with assets and liabilities and cross-currency basis swap spreads. |
| | |
Liquidity and refinancing risk Liquidity and refinancing risk is the risk, within a defined period of time, of SEK not being able to refinance its existing assets or being unable to meet increased liquidity requirements. Liquidity risk also includes the risk of having to borrow funds at an unfavorable interest rate or needing to sell assets at unfavorable prices in order to meet its payment commitments. | | SEK has secured borrowing for all of its credit commitments, including those committed but as yet undisbursed. In addition, the size of SEK’s liquidity investments allows new lending to continue at a normal pace, even during times of stress. |
| | |
Operational risk Operational risk is the risk of losses resulting from inadequate or faulty internal processes or systems, human error, or from external events. Operational risk also includes legal risk and compliance risk. | | Operational risks arise naturally in all parts of the business. Improvements are in progress regarding processes and methods for market risk. The vast majority of incidents that have occurred were minor events that are rectified promptly within the relevant function. |
| | |
Business risk Business risk is the risk of an unexpected decline in revenue due to a decrease in volumes and/or falling margins. | | SEK’s earnings tend to increase in stressed situations when the financial sector’s overall lending capacity declines. It is also in these situations that it is considered most likely that SEK could potentially encounter substantial credit losses. Accordingly, the negative earnings effect of increased credit losses tends to be offset by increased earnings over time. |
F-77
Table of Contents
Risk appetite metrics | | Risk management |
| | |
- Concentration, individual clients - Concentration, rating category - Expected loss | | Lending must be responsible and based on in-depth knowledge of SEK’s counterparties, furthermore, lending must also take place in accordance with SEK’s mission based on the owner instruction. Lending must be based on the counterparty’s repayment capacity. SEK’s credit risks are limited by the risk-based selection of counterparties and are managed, inter alia, by the use of guarantees and other types of collateral. Lending is also limited through SEK’s use of a standard lending policy whereby, for example, guiding principles for risk levels and lending terms are specified. SEK endeavors to achieve a diversified lending portfolio. Concentrations that naturally result from SEK’s mission are accepted, although risk mitigation solutions are used to partly reduce concentration risks. |
| | |
- Scenario-based stress tests - Total interest-rate sensitivity - NII risk and risk to NII from cross-currency basis swaps - Follow-up of prudent valuation adjustments | | The core of SEK’s market risk strategy is to borrow funds by issuing bonds which, regardless of the market risk exposures in the bonds, are hedged by being swapped to a floating interest rate. Borrowed funds are used either immediately for lending, mainly at a floating rate of interest, or swapped to a floating rate, or used to ensure sufficient liquidity. The aim is to hold assets and liabilities to maturity. |
| | |
Risk appetite ratios: - LCR - NSFR - Maturities matched balance sheet including prefinanced reserve for new lending transactions | | SEK must have diversified borrowing to ensure that borrowing is available through maturity for all credit commitments - loans outstanding as well as committed undisbursed loans. The size of SEK’s liquidity investments must ensure that new lending can take place even during times of financial stress. |
| | |
- Losses from operational risk - Monitoring of the highest value risks - Breaches of internal policies or external regulations | | SEK works continuously to manage operational risk, primarily by means of efficient internal controls, by performing risk analyses prior to changes, by focusing on continuous improvements and through contingency planning. Costs to reduce risk exposures must be in proportion to the effect that such measures have. |
| | |
- Concentration in income from a limited number of clients | | Business risk is identified through risk analyses and is monitored and prevented as deemed necessary. Costs to reduce risk exposures must be in proportion to the effect that such measures have. |
F-78
Table of Contents
Risk class | | Risk profile |
| | |
Strategic risk (business environment risk) Strategic risk is the risk of lower revenue due to adverse business decisions, improper implementation of decisions or the lack of adequate response to changes in the regulatory and business environment. Strategic risk focuses on large-scale and structural risk factors. | | SEK’s strategic risks mainly arise from structural changes in competition, which could lead to limited lending opportunities for SEK, and from regulatory reforms from two perspectives: (i) the impact of these reforms on SEK’s business model and (ii) the requirements on the organization resulting from increased regulatory complexity. |
| | |
Reputational risk Reputational risk is the risk of a negative reputation and/or reduced revenue due to external reports about SEK or about the sector in general. | | The main factors considered to affect the reputation of the SEK brand are credit losses, transactions that could be perceived to lack Swedish interests or the perception that SEK has breached applicable regulations, for example with regard to sustainability. |
| | |
Sustainability risk Sustainability risk is the risk that SEK’s operations directly or indirectly impact their surroundings in respect of money laundering, environmental issues, anticorruption, human rights, labor conditions and business ethics. | | SEK is primarily exposed to sustainability risks when lending. A high sustainability risk could arise from the financing of major projects or from operations in high-risk countries in terms of corruption or human rights violations. |
F-79
Table of Contents
Risk appetite metrics | | Risk management |
| | |
- Strategic decisions in line with SEK’s strategy - Monitoring of strategic investments | | Strategic risk is identified through risk analyses and is monitored and prevented as deemed necessary. Costs to reduce risk exposures must be in proportion to the effect that such measures have. |
| | |
- Follow-up of the reputational impact from transactions | | Reputational risk is mitigated actively through a number of activities, including ongoing analysis of media coverage, stakeholder dialogues and risk analyses. SEK’s communication plan describes the principles for both long-term and short-term management of reputational risk. |
| | |
- Transactions in compliance with national and international regulations and guidelines in the area - Follow-up of transactions | | Sustainability risks are managed according to a risk-based approach. In the event of a high sustainability risk, an in-depth sustainability review is conducted and, where necessary, requirements set that measures be implemented to counteract the adverse environmental and societal impact. Requirements are based on national laws and international principles in the areas of money laundering, the environment, anticorruption, human rights, labor conditions and business ethics. |
F-80
Table of Contents
Credit risk
Credit risk is the risk of the loss that could be incurred if a borrower or party in another agreement cannot meet its obligations under the agreement’s terms and conditions. Credit risk also includes counterparty risk, concentration risk and settlement risk. SEK’s credit risks are limited using a risk-based selection of counterparties and are further mitigated by the use of guarantees, netting agreements, collateral and credit derivatives. SEK’s appetite for credit risk is significantly greater than its appetite for other risks.
Risk management
The Risk Policy issued by the Board and the Credit Instruction issued by the Board’s Credit Committee are the foundations upon which SEK’s credit risk management is based. These governing documents constitute the framework for the level of credit risk that SEK can accept and describe the decision-making structure and credit-decision mandate, the credit process, fundamental principles for loan limits and the management of problem loans. Account managers in Lending have overall responsibility for relations with all of SEK’s clients. They have ultimate responsibility for commercial, credit and sustainability risks and their impact on SEK’s income statement and balance sheet. Their responsibility includes assessing clients’ financing needs, structuring business transactions, conducting credit assessments aided by credit analysts, and the management of limits and exposure. Their responsibility also encompasses ensuring that existing limits are reviewed continuously, at least once
Limit and credit decision procedure |
|
The Board |
|
Matters related to credit and credit decisions that are of fundamental significance or in some other way of major importance to SEK. |
|
The Board’s Credit Committee |
|
Decisions concerning limits or credit that exceed the Credit Committee’s decision-making mandate, new country limits, country limits transgressing the norm. |
|
Credit Committee |
|
Decisions concerning limits or credit within the Credit Committee’s decision-making mandate, annualization of country limits within the norm, credit-risk-related waivers and new liquidity limits. |
|
Subject to authorization |
Decisions on credit proposals within the limit and within the norm are subject to authorization as described in the credit instruction, which was adopted by the Board’s Credit Committee. |
|
Rating Committee |
|
Decisions on internal risk ratings. Decisions of the Rating Committee cannot be amended by any other decision-making authority. |
annually. Credit analysts within Credit are responsible for continuous analyses of counterparties and, at least once annually, prepare decisions concerning internal risk ratings. The credit analysts also perform independent credit assessments of current business proposals. Credit is part of SEK’s first line of defence and the Chief Credit Officer reports directly to the CEO. Credit is also responsible for managing the credit process. Risk, which is part of SEK’s second line of defence, supervises and validates SEK’s internal risk ratings and monitors and checks compliance with credit decisions and that limits are not exceeded.
SEK utilizes limits to restrict credit risks to a specified level. Limits express the highest permissible exposure to a counterparty for specific tenors and for various types of exposures, such as corporate lending, guarantees, counterparty risk in derivative contracts or liquidity investments. Exposures must be encompassed within the limits that have been decided for the particular counterparties. All limits are reviewed at least once annually.
Normative credit policy |
|
To provide guidance in respect of lending and the setting of limits with an acceptable risk level, SEK has established a Normative Credit Policy (the Norm), which clarifies in five areas the quality requirements that a loan or a limit has to fulfill in terms of transaction structure and risk: |
|
1. Operational criteria |
|
2. Risk level |
|
3. Lending terms |
|
4. Know your customer (KYC) |
|
5. Sustainability risks |
Exposures assessed as problem loans, meaning those for which SEK assesses that there is a high probability that the undertaking according to the original agreement will not be fulfilled, are analyzed in greater detail and more frequently. The intention is to identify at an early stage exposures subject to an elevated risk of loss and to adapt the exposure and ensure that the risk rating reflects the actual risk associated with the particular counterparty. It is the responsibility of account managers and credit analysts to continuously monitor exposures assessed as problem loans and report them to the Credit Committee and the Board’s Credit Committee.
Internal Ratings Based (IRB) approach
SEK uses, and has permission to use, a foundation IRB approach to measure the credit risk inherent in exposures to a majority of SEK’s counterparties. This means that for these exposures SEK uses its own estimates of the probability of default (PD) risk parameter which, per counterparty, reflects the assigned internal rating. Other risk parameters, including loss given default (LGD) and credit conversion factors (CCF), are determined by the Capital Requirements Regulation (CRR). Using these parameters and the gross amount of the credit-risk exposure, it is possible to calculate the size of the outstanding exposure at default (EAD) and statistically expected loss (EL). These risk parameters are used in the Basel formula to calculate the unexpected loss (UL), which also constitutes the capital requirement for the relevant credit-risk exposure. SEK’s IRB system encompasses both operational and analytical aspects. Key operational aspects of the process include where in SEK the risk rating is conducted and decided, and how the responsibility for follow-up, validation and control is allocated in the organization. The analytical aspect applies to how risk is measured and assessed. This includes how the concept of loss is defined and measured and the models used for the risk rating and the calculation of risk. SEK’s IRB system comprises all the various methods, working and decision-making processes, control mechanisms, guidelines, IT systems and processes and procedures that support risk rating and the quantification of credit risk.
Decisions concerning internal risk ratings for a counter-party are taken by SEK’s Rating Committee. The decision data used consists of analyses and risk assessments prepared by credit analysts active in Credit, in accordance with SEK’s established methodology. Committee members are appointed by the Board’s Credit Committee on the basis of competence and experience, and the majority of the members represent SEK’s non-business-generating functions.
The purpose of SEK’s internal ratings is to assess the credit risk of individual counterparties over a business cycle. The methodology is based on both qualitative and quantitative factors. Within SEK, the rating of risk is mainly based on the assessments of credit analysts. By using various methodologies for analyzing companies, financial institutions, insurance companies and national
and regional governments, individual counterparties are assigned an internal rating. The objective is to use a rating scale for all counterparties to be able to price and quantify risk over time, and thus keep risks at the desired level. The risk rating is the basis of a ranking system, which entails that risk rating is largely a matter of relative valuation. The aim of the rating is not to assess an exact probability of default, but to place a counterparty in a category comprising equivalent counterparties from a risk perspective. SEK maps its internal rating scale against Standard & Poor’s rating scale and uses Standard & Poor’s default statistics as a basis for SEK’s own calculations, with the aim of achieving consistent estimates of probability of default with adequate safety margins.
All of SEK’s counterparties are assigned an internal risk rating, apart from those cases where the Swedish FSA has granted SEK exemption from the IRB approach. SEK’s permission from the Swedish FSA to use a Foundation Internal Ratings-Based Approach, and thus to calculate capital requirements for credit risk in accordance with this, encompasses exposures to companies, including insurance companies and financial institutions. The Swedish FSA has permitted SEK to apply certain exceptions from the IRB approach. The exempted exposures, for which the Standardized Approach is used instead, are as follows:
· Export credits guaranteed by the Swedish Export Credits Guarantee Board (EKN) and exposures to the Swedish government and Swedish regional governments or county councils.
· Export credits guaranteed by export credit agencies in the OECD (valid through December 31, 2015).
· Exposures to foreign governments, foreign regional governments and multilateral development banks (valid through December 31, 2015).
· Exposures in the Customer Finance business area (valid as long as these exposures are of minor importance in terms of scope and risk profile).
· Guarantees for the benefit of small and medium-sized companies (valid as long as these exposures are of minor importance in terms of scope and risk profile).
SEK applied for permission from the Swedish FSA to apply the IRB approach for exposures encompassed by time-limited exceptions when these expire, and until such time as permits are granted, to temporarily extend the time-limited exceptions.
Monitoring and control
SEK’s risk and product rating, and risk estimates comprise a central feature of the reporting of credit risk to the Board, the Risk and Compliance Committee and the Credit Committee. The Chief Executive Officer and the Chief Risk Officer inform the Board of all significant changes concerning SEK’s IRB system.
Validation is a key factor for quality assurance of SEK’s IRB system and Risk is responsible for performing validation at least once annually.
Credit protection
SEK limits its credit risk by means of a methodical and risk-based selection of counterparties. The credit risk is further reduced through the use of various credit risk hedging, in the form of guarantees, netting agreements, collateral and credit derivatives.
In its lending transactions, SEK mainly utilizes guarantees. The guarantors are predominantly government export credit agencies in the OECD, of which the Swedish Export Credits Guarantee Board (EKN) is the largest. Guarantees are also received from financial institutions and, to a lesser extent, non-financial corporations and insurance companies. Since the credit risk is allocated to a guarantor, SEK’s guaranteed credit-risk exposure in reports of its net credit risk exposure largely consists of exposure to government counterparties. To a lesser extent, credit protection is achieved through purchases of credit default swaps (CDS).
The counterparty risk associated with derivative contracts is always documented using ISDA Master Agreements, which also entail a netting agreement, with the support of collateral agreements in the form of a credit support annex (CSA). Approved collateral under the collateral agreements signed by SEK always take the form of liquid assets.
SEK also uses various types of collateral to reduce credit risks pertaining to certain types of credit granting. When a credit decision is taken, assessment primarily concerns the borrower’s credit rating and future repayment capacity. Collateral, where it is considered relevant, is a core element of the credit assessment and credit decision. While collateral can be significant for individual cases, it has limited impact on the total lending portfolio.
Concentration risks and large exposures
SEK’s exposures are analyzed and reported regularly in respect of risk concentration based on (i) the size of individual commitments, (ii) domicile and (iii) sector. The analysis refers to both direct exposure and indirect exposure from, for example, credit derivatives. The concentration risks mentioned above are reflected in SEK’s calculation of economic capital for credit risks, which leads to a higher capital requirement compared with the minimum capital requirement. When calculating capital requirements, the minimum capital requirement does not take concentration risks into account. For further information about concentration risks, see the section on internal capital adequacy assessment.
A large exposure whose value, after the exceptions applied in certain cases or reduction factors, corresponding
to at least 10 percent of an institution’s own funds, is defined as a large exposure according to the CRR. The aggregate amount of SEK’s large exposures at December 31, 2015 was 236.7 percent (2014: 341.6 percent) of SEK’s total own funds and consisted of risk-weighted exposures to 18 (2014: 25) different counterparties or counterparty groups. A non-permitted exposure is one whose value exceeds 25 percent of total own funds. At December 31, 2015, SEK had no non-permitted exposures (2014: o). For the purpose of monitoring and checking large exposures, SEK has defined internal limits, which impose further limitations on the size of such exposures in addition to those stated in the CRR.
Counterparty risk in derivative contracts
Counterparty risk in derivative contracts - which is a type of credit risk - arises when derivatives are used to manage risks. To limit this risk, SEK enters into such transactions solely with counterparties with strong credit ratings. Risk is further reduced by SEK’s entering into ISDA Master Agreements (ISDAs), with associated collateral agreements, with its counterparties before entering into derivative contracts. These bilateral collateral agreements mean that the highest permitted risk levels, in relation to each individual counterparty, are agreed in advance. The formulation of these agreements is designed to ensure that agreed risk levels (known as threshold amounts) are not exceeded, regardless of market value changes that may occur. ISDA and CSA agreements are reviewed continuously to be able to renegotiate the terms as necessary. For counterparty exposures that exceed the threshold amounts under the relevant CSAs due to market value changes, settlement is demanded so that the counterparty exposure is reduced to the pre-agreed level. The positive gross value of all derivative contracts in the balance sheet as of December 31, 2015 was Skr 12.7 billion (2014: Skr 16.0 billion). After netting on the basis of the current CSAs (by counterparty), but excluding cash collateral, the exposure was Skr 3.9 billion (2014: Skr 7.4 billion), i.e. Skr 8.7 billion (2014: Skr 8.6 billion) less than the gross exposure. Taking into account cash collateral and regulatory add-ons under the CRR mark-to-market method, the exposure amount for counterparty risk for capital adequacy purposes was Skr 4.1 billion (2014: Skr 5.7 billion). The majority of SEK’s derivative contracts are what are known as OTC (over the counter) derivatives, i.e. derivative contracts that are not settled on a stock exchange. At the end of 2015, SEK’s OTC derivative contracts were not yet subject to mandatory central clearing. For further information on OTC derivatives, see “New regulations”.
Table of Contents
Market risk
Market risk is the risk of loss or changes in future earnings due to changes in, for example, interest rates, exchange rates, commodity prices or share prices. Market risk includes price risk in connection with sales of assets or the closing of exposures.
Risk management SEK’s Board establishes SEK’s market risk appetite and strategy. In addition, instructions established by the CEO regulate SEK’s management of market risks. The Board’s Finance and Risk Committee makes decisions on limit structures, which clearly define and limit the permissible exposure to net market risk. The Chief Risk Officer decides on the methodology for determining how market risks are to be calculated and proposes changes in limit structures in connection with reviews of risk appetite and limits. All instructions are re-established annually. Market risk exposures are measured and reported on a daily basis to the CEO, and the Board’s Finance and Risk Committee at its scheduled meetings. The Risk Control function measures, monitors and reports on SEK’s market risk exposures on a daily basis. Cases where limits are exceeded are escalated without delay to the CEO and the Board’s Finance and Risk Committee. SEK borrows funds by issuing bonds or other debt instruments which, regardless of the market risk exposures in the bonds, are hedged by being swapped to a floating interest rate. Borrowed funds are used either immediately for lending, mainly at floating interest rates, or swapped to a floating rate, or to ensure that SEK has adequate liquidity in the form of liquidity investments and liquidity reserves. Investments of liquidity must be made at a floating or fixed interest rates for up to one year. The aim is to hold assets and liabilities to maturity. Since SEK’s appetite for market risk resulting from unmatched cash flows is low, the remaining open interest-rate and foreign-exchange risks that arise from the remaining unmatched flows between the renegotiation of interest rates in various currencies is hedged against changes in foreign exchange rates and current interest rates. The duration of available borrowing matches that of lending and the maturity profile of liquidity investments is adapted to ensure that funds are available for all accepted undisbursed lending. Unrealized changes in fair value affect the value of SEK’s assets and liabilities and impact the volatility of both earnings and SEK’s own funds. SEK’s largest net exposures that affect earnings and own funds are to changes in spread risks, mainly to credit spreads in assets and liabilities and to cross-currency basis swap spreads. Spread risks are kept at an acceptable level for the company through governance and control. This includes set limits for exposures and daily monitoring of limits. | | Measurement The following describes how SEK calculates and limits market risk internally. For the impact on earnings and other comprehensive income due to the interest-rate risk, see Note 26. Additional factors, such as different sensitivity calculations regarding the effect on economic value, earnings, equity and own funds, as well as more stress tests, are measured and reported but are not subject to limits. The government-supported S-system has been excluded since the government compensates SEK for all interest-rate differentials, borrowing costs and net foreign-exchange losses within the S-system (see Note 1). Risks in the S-system are measured and monitored regularly, and reported to the CEO, and to the Board’s Finance and Risk Committee at scheduled meetings. Aggregated risk measure The aggregated risk measure is based on analyses of 106 scenarios that each have a monthly risk horizon. The scenarios are updated each month and comprise historical movements in risk factors from the entire period from the end of 2006 to 2015. SEK’s aggregated risk measure estimates the impact on SEK’s equity by applying extreme historically observed movements in terms of market factors that affect the volatility of SEK’s equity. The exposure, which is based on the worst case scenario, is evaluated using SEK’s portfolio sensitivities to interest-rate risk, cross-currency basis swap price risk, credit spread risk in assets, credit spread risk in SEK’s own debt and currency risk. The limit is also based on the worst case scenario, which at the close of 2015 was based on market movements from June 2012. The risk at year-end 2015 amounted to Skr 624 million (2014: Skr 633 million). The limit is set at Skr 1,300 million (2014: Skr 1,300 million). During 2015, SEK improved its aggregated risk measure by increasing the number of scenarios and risk factors, mainly attributable to the credit spread risk in assets. Risk-specific measures The aggregated risk measure and stress tests are complemented with risk-specific measures, including specific interest-rate-risk measures, spread-risk measures and currency-risk measures. The measurement and limiting of interest-rate risk in SEK is divided into two categories: · Interest-rate risk regarding changes in the economic value of SEK’s portfolio (EVE) · Interest-rate risk regarding changes in future net interest income (NII). |
F-84
Table of Contents
Market risk, type | | Definition | | Risk profile* |
| | | | |
Interest-rate risk regarding changes in the economic value of SEK’s portfolio (EVE) | | The interest-rate risk regarding changes in economic value is calculated by means of a 100 basis point parallel shift in the yield curve and a 50 basis point twist in all yield curves. For each stress test the risk per currency is totaled in absolute terms. | | The risk pertains to SEK’s overall business profile, particularly the balance between interest-bearing assets and liabilities in terms of volume and fixed interest terms. The risk measurement captures the long-term impact of changes in interest rates. The risk amounted to Skr 124 million (2014: Skr 108 million) at the end of 2015. At the end of 2015, the interest-rate price risk limit amounted to Skr 600 million (2014: Skr 250 million). |
| | | | |
Interest-rate risk regarding changes in future net interest income (NII) | | The net interest revenue risk within one year is calculated as the impact on net interest revenue for the coming year if new financing and investment must take place following a positive interest-rate shift of 100 basis points. For each stress test, the risk per currency is totaled in absolute terms. | | The risk pertains to SEK’s overall business profile, particularly the balance between interest-bearing assets and liabilities in terms of volume and fixed interest terms for the next twelve months. The risk measurement captures the short-term impact of changes in interest rates. At the end of 2015, the risk amounted to Skr 202 million (2014: Skr 194 million) and the interest-rate price risk limit amounted to Skr 250 million (2014: Skr 275 million). |
| | | | |
Credit spread risk in assets | | Credit spread risk in assets is calculated as a potential impact on SEK’s equity, in the form of unrealized gains or losses, as a result of changes in the credit spreads on assets for those assets measured at fair value. Credit spread risk in assets measures the instantaneous change in value that arises from a 100 basis-point shift in credit spreads for all assets measured at fair value. | | The risk is attributable to bonds in liquidity investments, including liquidity reserves, credit derivatives that hedge the credit risk in a number of bonds, and securitizations. At the end of 2015, the credit spread risk in assets was a negative amount of Skr 279 million (2014: negative Skr 479 million), and the limit for credit spread risk in assets amounted to Skr 550 million (2014: Skr 700 million). |
| | | | |
Credit spread risk in own debt | | Credit spread risk in own debt can have a potential impact on SEK’s equity, in the form of unrealized gains or losses, as a result of changes in present value after all of SEK’s credit spreads have been shifted by 20 basis points. | | The risk is attributable to SEK’s structured debt measured at fair value. At the end of 2015, the credit spread risk in liabilities was Skr 603 million (2014: Skr 645 million), and the limit for credit spread risk in liabilities amounted to Skr 1,000 million (2014: Skr 1,200 million). |
| | | | |
Cross-currency basis swap price risk | | The cross-currency basis swap price risk measures a potential impact on SEK’s equity, in the form of unrealized gains or losses, as a result of changes in cross-currency basis spreads. The cross-currency basis swap price risk is measured, using sensitivities, as the change in present value after an increase in cross-currency basis spreads by a varying number of points (varying by currency in accordance with a standardized method based on volatility). | | The risk is attributable to cross-currency basis swaps used by SEK to hedge the currency risk in the portfolio. At the end of 2015, the cross-currency basis swap price risk amounted to Skr 227 million (2014: Skr 372 million) and the limit for cross-currency basis swap price risk amounted to Skr 600 million (2014: Skr 550 million). |
| | | | |
Risk to NII from cross-currency basis swaps | | The 12-month risk to NII from cross-currency basis swaps is measured as the impact on SEK’s future earnings resulting from an assumed cost increase (varying by currency in accordance with a standardized method based on volatility) for transfers between currencies for which cross-currency basis swaps are used. For each stress test, the risk per currency is totaled in absolute terms. | | The risk is attributable to cases where borrowing and lending are not matched in terms of currency and, therefore, the future cost of converting borrowing to the desired currency is dependent on cross-currency basis spreads. The risk is primarily attributable to Swedish kronor, because SEK has a deficit of Swedish kronor and borrows funds in other currencies, which are swapped into Swedish kronor. At the end of 2015, the risk amounted to Skr 34 million (2014: Skr 41 million) and the limit for the risk to NII from cross-currency basis swaps amounted to Skr 150 million (2014: Skr 75 million). |
* All risk metrics pertain to pre-tax effects.
F-85
Table of Contents
Market risk, type | | Definition | | Risk profile* |
| | | | |
Currency risk | | The risk is calculated as the change in value of all foreign currency positions at an assumed 10 percentage-point change in the exchange rate between the respective currency and the Swedish krona. | | The foreign exchange position excluding unrealized changes in fair value is reported separately since SEK’s hedging strategy entails that only foreign exchange positions excluding unrealized changes in fair value are to be hedged. The foreign exchange position mainly arises on an ongoing basis due to differences between revenues and costs (net interest margins) in foreign currency. Currency risk excluding unrealized changes in fair value is kept low by matching assets and liabilities in terms of currencies or through the use of derivatives. In addition, accrued gains/losses in foreign currency are regularly converted to Swedish kronor. At the end of 2015, the risk amounted to Skr 2 million (2014: Skr 2 million) and the limit for currency risk was Skr 15 million (2014: Skr 15 million). |
| | | | |
Other risks (equities, commodities and volatility risks) | | These are calculated with the aid of stress tests of underlying equity indexes or volatility. | | SEK’s equities and commodities risks, as well as FX volatility risks, only arise from structured borrowing. The structured borrowing is hedged by being swapped to floating interest rates. While all structured cash flows are matched through a hedging swap, there could be an impact on earnings. This is because measurement of the bond takes account of SEK’s own credit spread, while the swap is not affected by this credit spread, and also because of changes in expected maturity for the structured borrowing. Interest-rate volatility risk also arises from other transactions with early redemption options. These risks are calculated and limited. At the end of 2015, these risks and limits were low. |
Stress tests SEK conducts regular stress tests by applying extreme movements in market factors that have been historically observed in the market place (historical scenarios) and extreme movements that could happen in the future (hypothetical or forward-looking scenarios). Analyses of this type provide management with insight into the potential impact on SEK’s operations of significant movements in individual risk factors, or of broader market scenarios, and continuously ensure that the risk measurement is effective. | | |
| | |
Risks that impact SEK’s own funds 
| | Risks that impact SEK’s equity - linked to unrealized changes in value 
|
F-86
Table of Contents
Liquidity and refinancing risk
Liquidity and refinancing risk is defined as the risk of SEK not being able to refinance its outstanding loans and committed undisbursed loans, or being unable to meet increased liquidity requirements. Liquidity risk also includes the risk of having to borrow funds at unfavorable interest rates or needing to sell assets at unfavorable prices to meet payment commitments.
Trend for SEK’s available funds at December 31, 2015

Risk management The management of SEK’s liquidity and refinancing risk is regulated by Governing Documents established by the Board’s Finance and Risk Committee. SEK’s policy governing liquidity and refinancing risk requires that borrowing through maturity must be available for all credit commitments - loans outstanding as well as committed undisbursed loans. For CIRR loans, which SEK manages on behalf of the Swedish government, SEK’s loan facility with the Swedish National Debt Office is also regarded as available borrowing. The credit facility, granted by the government via the Swedish National Debt Office, amounts to Skr 125 billion (2014: Skr 80 billion) and may only be used to finance CIRR loans. The credit facility is valid from January 1, 2016 through December 31, 2016 and entitles SEK to receive financing over the maturities of the underlying CIRR loans. No funds have been drawn under this credit facility. This means that no refinancing risk is permitted, as shown in the chart “Trend for SEK’s available funds”. Borrowed funds not yet used to finance credits must be invested in interest-bearing securities; see also the Liquidity investments section. Liquidity and refinancing risk is measured and reported regularly to the relevant manager, the Risk and Compliance Committee, the CEO and the Board and its committees. | | Measurement In the short term, liquidity risk is monitored mainly through measurement of the liquidity coverage ratio (LCR), which shows SEK’s highly liquid assets in relation to its net cash outflows for the next 30 calendar days. Cash-flow forecasts of up to one year are prepared regularly according to various scenarios. Long-term, structural liquidity risk is monitored primarily through measurement of the net stable funding ratio (NSFR) and as described in the preceding section, Risk management. Liquidity investments To meet SEK’s policy governing liquidity and refinancing risk, undisbursed borrowed funds must be invested in interest-bearing securities, known as liquidity investments. In turn, the management of SEK’s liquidity investments is regulated by the Liquidity Strategy established by the Board’s Finance and Risk Committee. The size of the liquidity portfolio is adapted to cover outflows, outside of the CIRR system, attributable to: 1) committed undisbursed loans, 2) collateral agreements with derivative counterparties, 3) outflows attributable to short-term borrowing transactions and 4) budgeted new lending. At year-end 2015, the volume of committed undisbursed loans amounted to Skr 63.4 billion (2014: Skr 16.0 billion), of which Skr 54.6 billion (2014: Skr 7.5 billion) was attributable to the S-system. SEK’s liquidity investments |
F-87
Table of Contents
include a liquidity buffer of Skr 15.0 billion (2014: Skr 15.0 billion), which is intended to cover any outflows under SEK’s collateral agreements with its derivative counter-parties in order to mutually control counterparty risks. The pre-financing buffer takes account of borrowing transactions amounting at least to an equivalent of USD 500 million and maturing within six months. At year-end 2015, the pre-financing buffer was Skr 8.6 billion (2014: Skr 3.9 billion). Finally, liquidity investments include capacity for SEK’s estimated new lending requirements. Budgeted new lending amounted to Skr 46.5 billion. New lending capacity is measured as the number of months that SEK is able to conduct planned new lending without access to new borrowing. This capacity aims to provide at least four months’ (2014: four months’) new lending. At year-end 2015, new lending capacity amounted to Skr 11.1 billion (2014: Skr 40.6 billion), which corresponds to four months’ (2014:16 months’) new lending. The maturity profile of the liquidity investments must reflect the net maturity of borrowing and lending. Investments must be made in assets of good credit quality. Such investments should take into account the liquidity of the investment under normal market conditions and the investment’s currency must comply with established guidelines. SEK intends to hold these assets to maturity and only divest them should circumstances so demand. At year-end 2015, the volume of the liquidity investments amounted to Skr 58.7 billion (2014: Skr 86.6 billion), which represented a significant year-on-year change. During the year, SEK decreased its liquidity investments to utilize capital more efficiently. The following charts provide a breakdown of the liquidity investments by exposure type, maturity and rating as of December 31, 2015. Liquidity investments by exposure type as of December 31, 2015 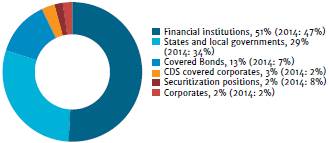
| | Liquidity investments by maturity (“M”) 
Liquidity investments by rating based on net exposure 
Borrowing SEK’s borrowing strategy is regulated in the Financing Strategy Policy, which is established by the Board’s Finance and Risk Committee. The aims of the Financing Strategy include ensuring that SEK’s borrowing is well-diversified in terms of markets, investors, counterparties and currencies. With regard to maturity, no refinancing risk is allowed; see the preceding Risk management section. Short-term borrowing For the purpose of ensuring access to funding, SEK has revolving borrowing programs for maturities of less than one year. These include a US Commercial Paper program (UCP) of USD 3.0 billion (2014: USD 3.0 billion) and a European Commercial Paper program (ECP) corresponding to USD 4.0 billion (2014: USD 4.0 billion). At the end of 2015, SEK had utilized USD 400 million (2014: USD 610 million) under the UCP program and EUR o million (2014: EUR 320 million) and USD 150 million (2014: USD 300 million) under the ECP program. SEK also has a swingline facility that functions as a back-up facility for SEK’s revolving borrowing program for maturities of less than one year. |
F-88
Table of Contents
Long-term borrowing To secure access to substantial volumes of borrowing, and to ensure that insufficient liquidity or investment appetite among individual borrowing sources does not constitute an obstacle to operations, SEK issues bonds with different structures, currencies and maturities. SEK also issues bonds in many different geographic markets. The following charts illustrate some aspects of the diversification of SEK’s borrowing. The first chart shows the breakdown of long-term borrowing by structure type, while the second chart shows a breakdown by market of long-term borrowing. Total long-term borrowing by structure type at December 31, 2015 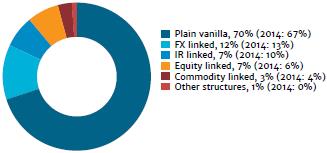
Total long-term borrowing by market at December 31, 2015 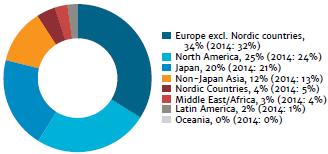
Contingency plan SEK has a contingency plan for the management of liquidity crises that has been issued by Per Åkerlind, Executive Vice President and Head of Treasury & Capital Management. The plan describes what constitutes a liquidity crisis according to SEK and what measures SEK intends to take if such a crisis is deemed to have occurred. The plan also describes the decision-making structure during a liquidity crisis. An internal and external communication plan is also included. The contingency plan is also closely linked to the results of the scenario analyses that are performed regularly. These scenarios aim to increase SEK’s preparedness and ensure that SEK can cope with situations such as the partial or complete cessation of various borrowing sources. The scenarios cover company-specific and market-related problems, both individually and in combination. | | |
F-89
Table of Contents
Operational risk
Operational risk is the risk of losses resulting from inadequate or faulty processes or systems, human error or from external events. Operational risk also includes legal risk and compliance risk.
Risk management
Responsibility and internal governance
Operational risk exists in potentially all functions within SEK, which means that the managers of all the various SEK functions have a responsibility for effective management of operational risk within their own function. In order to support operational risk management, SEK works in compliance with policy documents in accordance with SEK’s framework for operational risk. Responsibility for monitoring, analysis and reporting of operational risk lies with the Risk Control function, as does responsibility for monitoring the appropriateness and effectiveness of operational risk management. The Risk and Compliance Committee is SEK’s committee tasked with monitoring operational risk. Reporting is provided by the Risk Control function to the Risk and Compliance Committee and the Board’s Finance and Risk Committee.
Identification and governance
SEK places a strong focus on preventive measures relating to operational risk. Of particular importance in this are risk analyses utilizing appropriate scenarios, both on an ongoing basis in the event of changes and annually recurring. Ongoing analysis of changes may relate to the introduction of a new product or a new IT system, changes to a process or a major change such as a reorganization. SEK performs annual risk analyses, coordinated with business
planning and the internal capital adequacy assessment, as part of strategic planning. Action plans are developed to manage identified risks, which are then monitored as part of the responsibility of the respective heads of functions. The Risk Control function carries out an aggregated monitoring and analysis of the risks and action plans. The most significant risks are then monitored and analyzed individually.
When an operational risk event, or incident, occurs, an analysis is carried out to determine the cause. Measures are then implemented and followed up to prevent a recurrence.
Measurement
SEK measures and reports operational risk levels each quarter. SEK’s conclusion regarding the risk level is based on an assessment of four main components. In brief, these are:
(i) the number of risks assessed as high risk, if any,
(ii) the scope of losses resulting from incidents over the past four quarters,
(iii) whether incidents have occurred and, if so, the number that fall outside SEK’s risk appetite for incidents over the last four quarters, and
(iv) whether SEK has efficient internal controls on financial reporting in accordance with SOX Section 404.
Table of Contents
Sustainability risk
Sustainability risk is the risk that SEK’s operations directly or indirectly impact their surroundings negatively in respect of money laundering, environmental issues, anticorruption, human rights, labor conditions and business ethics.
Risk management
Sustainability risks are managed according to a risk-based approach and SEK only engages in transactions for which we have conducted know your customer activities. SEK’s measures to manage sustainability risks when lending are subject to national and international regulations and guidelines, along with the government’s owner policy and SEK’s owner instruction pertaining to the following areas: money laundering, environmental issues, anticorruption, human rights and labor conditions. SEK is tasked with imposing adequate requirements in the operations and projects the company finances in order to mitigate negative environmental and societal impacts.
The international guidelines that SEK applies are:
· The OECD’s conventions and guidelines on anticorruption measures
· The UN Guiding Principles on Business and Human Rights
· The ILO’s core conventions
· The UN Convention on the Rights of the Child
· The OECD’s Recommendation of the Council on Common Approaches for Officially Supported Export Credits and Environmental and Social Due Diligence
· The Equator Principles
· The OECD’s Principles and Guidelines to Promote Sustainable Lending
Measurement and checks
Potential sustainability risks at counterparty, country and project level are identified and classified for each new loan.
· Counterparty risk - Checks and risk classification are conducted as part of know your customer, including ownership and checks against international sanction lists, as well as whether the counterparty has been involved in significant sustainability-related incidents.
· Country risk - Countries are classified according to the risk of human rights violations, corruption, money laundering and terrorist financing.
· Project risk - Projects and project-related financing are classified based on their potential societal and environmental impact according to the OECD’s
framework for export credits. Category A projects have a potentially material impact, category B projects potentially have some impact, and category C projects have little or no potential impact.
Elevated sustainability risk
The sustainability risk is considered to be elevated in the following cases:
· Category A and B projects
· Projects or operations with a high risk of corruption or human rights violations
· Areas affected by conflict
· The mining and arms sectors
· Exporters or their end customers who are internationally blacklisted or have been involved in a significant incident
In-depth sustainability review
An in-depth sustainability review is performed in cases of elevated sustainability risk. The extent and form of the review depends on the scope of the financing, the level of the identified risks and SEK’s ability to influence the situation. Where necessary, social and environmental conditions are included in loan agreements, and site visits may be included as part of an evaluation. In the case of deviations from international standards or other deficient management of sustainability risks, the counterparty is required to take measures to rectify this. Monitoring during the tenor of the loan is conducted via continuous incident searches and checks of compliance with the agreement’s sustainability clauses.
Loans granted to major projects in 2015
SEK granted loans to the following projects in 2015. One of the projects pertained to a performance bond and one of the category B projects was not reported due to reasons related bank secrecy.
Category A projects
· A pulp mill in Finland
· A wind farm in Chile
Category B projects
· A paper machine in Turkey
· A hospital in the UK
Table of Contents
New regulations
This section addresses new regulations that will have a material impact on risk and capital management and that have either become effective but not yet been applied or are subject to an active legislation process within the EU.
Credit risk
For risk classification and quantification of credit risk, SEK applies the foundation IRB approach to internal risk classification. However, the Swedish FSA has permitted SEK to make certain exceptions from the IRB approach, in which case the Standardized Approach is used to calculate the capital requirement. For exposures to the Swedish government, Swedish regional governments and a number of additional non-significant exposures, the exceptions are permanent. For exposures to foreign governments, foreign regional governments and multilateral development banks, the exceptions apply through December 31, 2015. During 2015, SEK applied to the Swedish FSA for permission to apply the IRB approach for these exposures when the time-limited exceptions expire and, until such time as permits are granted, to temporarily extend the time-limited exceptions. The minimum capital requirements for those exposures impacted by the application will increase in connection with a switch to the IRB approach.
Market risk
On May 22, 2015, the EBA, the European regulatory agency, issued guidelines concerning the management of interest-rate risk arising from non-trading activities, or the interest-rate risk in the banking book (IRRBB), which became effective on January 1, 2016. The guidelines comprise the following areas: Scenarios and stress testing, measurement assumptions, methods for measuring interest-rate risk, governance of interest-rate risk and capital identification, calculation and allocation designed to cover interest-rate risk. These guidelines require significantly more sophisticated methods for measuring interest-rate risk compared with the past. SEK has implemented the new guidelines and, initially, they have not resulted in higher capital requirements for market risk.
Counterparty risk
The European Market Infrastructure Regulation (EMIR), which relates to OTC derivatives, central clearing coun-terparties and trade repositories, became effective in 2012. Since then, various parts of the regulation have been rolled out. During 2016, additional parts of the regulation, applying to the central clearing of certain types of OTC derivatives, will start to apply. SEK has been defined as belonging to Category 2 in this respect and it was decided in November 2015 that, from December 2016, institutions in Category 2 will be required to clear certain OTC derivatives for any such derivatives entered into from May 2016. If the derivatives are cleared, this will impact on cash flows, pledging of collateral, counterparty risk and financial reporting.
As of March 2017, it will also be obligatory for SEK to pledge collateral to cover the variation margin on non-cleared derivative contracts. However, since the detailed regulation governing this has not yet been adopted, it is currently not possible to determine whether it will lead to material differences in terms of cash flows compared with the governing agreements on the pledging of collateral under the current regulations.
Liquidity risk
In respect of the liquidity coverage ratio (LCR) under the Capital Requirements Regulation (CRR), a minimum ratio of 60 percent was introduced on October 1, 2015. This minimum ratio will gradually be raised to 100 percent, effective January 1, 2018. In Sweden, certain national regulatory requirements concerning minimum ratios have already become effective.
The net stable funding ratio (NSFR) under the CRR is already reported to the supervisory authority. However, the minimum requirements will not become effective until 2018.
Banking Recovery and Resolution Directive (BRRD)
The BRRD has been implemented in full in Swedish legislation, effective February 1, 2016. During 2015, parts of the BRRD were implemented by means of regulations issued by the Swedish FSA, under which SEK is required to establish recovery plans. As of 2016, all BRRD requirements have been introduced in Sweden by means of legislation. Pursuant to the BRRD, SEK is thus subject to minimum requirements for its own funds and for eligible own funds, which is a parallel requirement to CRR. The minimum requirements must be established individually for each institution by the resolution authority, which in Sweden is the Swedish National Debt Office. The Swedish National Debt Office has yet to inform SEK about the minimum requirement that will be applied to SEK. SEK will pay an annual resolution fee, which will amount to approximately 0.09 percent of certain outstanding debt. The resolution fee will replace the currently applicable stability fund fee, amounting to 0.036 percent of certain outstanding debt. During 2016, the fee will be subject to transition rules.
IFRS 9
IFRS 9 Financial Instruments, which covers classification and measurement, impairment and general hedge accounting was issued by the IASB in 2014. IFRS 9 must be implemented from fiscal years beginning on January 1, 2018, but earlier adoption is permitted. SEK has initiated the process of evaluating the potential effects of the new standard, but has not yet arrived at any conclusions.
Table of Contents
Internal capital adequacy assessment
In SEK’s assessment, SEK has own funds that comfortably exceed both the internally estimated need of own funds and the total capital requirement calculated by the Swedish FSA.
The internal capital adequacy assessment process (ICAAP) is an integral part of SEK’s strategic planning, whereby the Board decides SEK’s risk appetite and approves the capital target. The capital target is adopted by the general meeting of shareholders. The purposes of the ICAAP are to ensure that SEK has sufficient capital to meet the regulatory requirements under both normal and stressed financial conditions and to support SEK’s high credit rating. The capital kept by SEK must be sufficient in relation to the risks that SEK is or can be exposed to. The capital adequacy assessment is based on SEK’s internal assessments of the risks and their development, as well as assessments of risk measurement models, risk governance and risk management. It is integrated into business planning and forms the foundation for SEK’s strategy for maintaining an adequate amount of capital. Capital adequacy assessments are conducted at least for the forthcoming three-year period in the business plan.
In conjunction with its internal capital adequacy assessment process, an in-depth liquidity analysis is performed. During the planning period, the liquidity requirement and its composition are evaluated to ensure the company has adequate liquidity to implement the business plan and meet the regulatory requirements.
SEK’s assessment is that the macroeconomic climate represents the foremost source of the risks to its earnings and financial stability. To arrive at an adequate capitalization level that also applies under strained financial conditions, an analysis is conducted of how the capitalization is affected by stress in global financial markets, as well as of other factors that impact SEK’s business model and net risk exposure. The stressed macroeconomic scenario that is used for the planning period, 2016-2018, is based on a deepened crisis in Europe. The impact of the stress on SEK is applied to the business plan, following which management arrives at actions that could be taken in such a situation to continue to maintain an adequate level of capital.
When SEK performs the internal capital adequacy assessment, it applies methods other than those used for calculating the minimum capital requirement. The assessment is based on SEK’s internal calculation of economic capital. Economic capital is a calculation that captures the risks that are specific to SEK’s operations. In addition to risks that are included in the minimum
capital requirement, SEK also analyzes concentration risk, additional market risks, operational risks and pension risk. The internally assessed capital requirement was Skr 9,947 million (2014: Skr 11,107 million) at December 31, 2015, of which Skr 7,944 million (2014: 9,099 million) was attributable to credit risk, Skr 318 million (2014: Skr 315 million) to operational risk, SEK 1,447 million (2014: Skr 1,693 million) to market risk, Skr 192 million (2014: -) to credit valuation adjustment risk and SEK 46 million (2014: -) to pension risk. This may be compared with the minimum capital requirement, which was Skr 6,178 million (2014: Skr 6,985 million) at December 31, 2015, of which Skr 5,280 million (2014: 6,316 million) was attributable to credit risk, Skr 192 million (2014: Skr 267 million) to credit valuation adjustment risk, Skr 318 million (2014: Skr 278 million) to operational risk, Skr 126 million (2014: Skr 122 million) to foreign exchange risk, SEK 1 million (2014: Skr 2 million) to commodities risk and Skr 261 million (2014: Skr 0 million) to Basel 1 requirements.
For credit risk, economic capital is based on a quantitative approach whereby Value at Risk (VaR) is calculated at a confidence level of 99.9 percent. This quantitative estimate is performed using a simulation-based tool that produces a probability distribution of the value of the credit portfolio over a defined time horizon (usually one year). The methodology used in the VaR quantification is based on the CreditMetrics model. This quantitative approach is also complemented by a comparative analysis of the capital requirement under Pillar l and economic capital, as well as by qualitative assessments. The primary aim of the analysis is to assess whether the total capital requirements under Pillar 2 should be set higher than the capital requirement calculated under Pillar 1. Factors that result in a higher capital requirement in the overall internal assessment than in the capital requirement under Pillar 1 are name concentration, geographic and sector concentration and SEK’s use of a more conservative assumption for correlation than that used under Pillar 1.
In addition to the internal capital adequacy assessment, SEK also performs an estimation of the Swedish FSA’s assessment of SEK’s total capital requirement as performed in the review and evaluation process. The capital requirement specified by the Swedish FSA constitutes a minimum requirement for the size of SEK’s own funds.
Table of Contents
SIGNATURES
The registrant hereby certifies that it meets all requirements for filing on Form 20-F and that it has duly caused and authorized the undersigned to sign this annual report on its behalf.
| AKTIEBOLAGET SVENSK EXPORTKREDIT (publ) |
| (Swedish Export Credit Corporation) |
| (Registrant) |
| |
| |
| By | /s/ Catrin Fransson |
| | Catrin Fransson, Chief Executive Officer |
| |
| |
Stockholm, Sweden | |
February 26, 2016 | |
Table of Contents
EXHIBIT INDEX
Exhibits | | |
| | |
1.1 | | Articles of Association of the Registrant in effect as of the date of this annual report (filed as Exhibit 1.1 to the Company’s Annual Report on 20-F (No. 001-08382) for the year ended December 31, 2014, and incorporated herein by reference). |
| | |
2.1 | | Indenture, dated as of August 15, 1991, between the Company and J.P. Morgan Trust Company, National Association (as successor in interest to the First National Bank of Chicago) as Trustee, providing for the issuance of debt securities, in one or more series, by the Company (filed as Exhibit 4(a) to the Company’s Report of Foreign Issuer on Form 6-K (No. 001-08382) dated September 30, 1991 and incorporated herein by reference). |
| | |
2.2 | | First Supplemental Indenture dated as of June 2, 2004 between the Company and J.P. Morgan Trust Company, National Association (filed as Exhibit 4(b) to the Company’s Registration Statement on Form F-3 (No. 333-131369) dated January 30, 2006 and incorporated herein by reference). |
| | |
2.3 | | Second Supplemental Indenture, dated as of January 30, 2006, between the Company and J.P. Morgan Trust Company, National Association (filed as Exhibit 4(c) to the Company’s Registration Statement on Form F-3 (No. 333-131369) dated January 30, 2006 and incorporated herein by reference). |
| | |
2.4 | | Third Supplemental Indenture, dated as of October 23, 2008, relating to the Debt Securities (filed as Exhibit 4 to the Company’s Report of Foreign Issuer on Form 6-K dated October 23, 2008 (No. 001-08382) and incorporated herein by reference). |
| | |
2.5 | | Fiscal Agency Agreement dated March 27, 2015 relating to an unlimited aggregate principal amount of debt securities authorized to be issued under the Company’s Program for the Continuous Issuance of Debt Instruments (filed herewith). |
| | |
2.6 | | Deed of Covenant dated April 4, 2014 relating to an unlimited aggregate principal amount of securities of SEK authorized to be issued under the Company’s Program for the Continuous Issuance of Debt Instruments (filed as Exhibit 2.6 to the Company’s Annual Report on 20-F (No. 001-08382) for the year ended December 31, 2014, and incorporated herein by reference). |
| | |
2.7 | | Fourth Supplemental Indenture, dated as of March 8, 2010, relating to the Debt Securities (filed as Exhibit 4(f) to the Company’s Post-Effective Amendment (No. 333-156118) to the Company’s Registration Statement on Form F-3, filed by the Company on March 10, 2010 and filed as Exhibit 2.8 to the Company’s Annual Report on Form 20-F (No. 001-08382) for the year ended December 31, 2009, filed by the Company on March 31, 2010 and incorporated herein by reference). |
| | |
2.8 | | English-language summary of the Terms and Conditions dated 22 February 2012 relating an unlimited principal amount of debt securities authorized to be issued under the Company´s Swedish MTN Programme (filed as Exhibit 2.9 to the Company’s Annual Report on Form 20-F (No.001-08382) for the year ended December 31, 2011, filed by the Company on March 19, 2012 and incorporated herein by reference). |
| | |
2.9 | | ASX Austraclear Registry and IPA Services Agreement dated 14 October 2009 relating to an unlimited principal amount of debt securities authorized to be issued under the Company´s Australian Dollar Debt Issue Programme (filed as Exhibit 2.10 to the Company’s Annual Report on Form 20-F (No. 001-08382) for the year ended December 31, 2009, filed by the Company on March 31, 2010 and incorporated herein by reference). |
| | |
2.10 | | Second Note Deed Poll dated 19 March 2014 relating to an unlimited principal amount of debt securities authorized to be issued under the Company´s Australian Dollar Debt Issue Program (filed as Exhibit 2.11 to the Company’s Annual Report on Form 20-F (No. 001-08382) for the year ended December 31, 2009, filed by the Company on March 31, 2010 and incorporated herein by reference). |
| | |
7.1 | | Statement of Calculation of Ratios of Earnings to Fixed Charges (filed herewith). |
Table of Contents
8.1 | | List of Subsidiaries (filed herewith). |
| | |
12.1 | | Certifications pursuant to Rule 13a-14(a) or Rule 15d-14(a) under the Securities Exchange Act of 1934 (filed herewith). |
| | |
13.1 | | Certifications pursuant to 18 U.S.C. Section 1350, as adopted Pursuant to Section 906 of the Sarbanes-Oxley Act of 2002 (filed herewith). |
| | |
14.1 | | Consent of Independent Registered Public Accounting Firm (filed herewith). |
Pursuant to Instruction 2(b) (i) in the “Instructions as to Exhibits” in Form 20-F, various instruments defining the rights of holders of long-term debt securities issued by the Company are not being filed herewith because such debt securities are not registered with the Commission and the total amount of debt securities authorized under each such instrument does not exceed 10% of the total assets of the Company. The Company hereby agrees to furnish a copy of any such instrument to the Commission upon request.