FORM 6-K
SECURITIES AND EXCHANGE COMMISSION
Washington, D.C. 20549
Report of Foreign Private Issuer
Dated July 17, 2018
Pursuant to Rule 13a-16 or 15d-16 of
the Securities Exchange Act of 1934
Aktiebolaget Svensk Exportkredit
Swedish Export Credit Corporation
(Translation of Registrant’s Name into English)
Klarabergsviadukten
61-63
SE-101 23 Stockholm
Sweden
(Address of Principal Executive Offices)
Indicate by check mark whether the registrant files or will file annual reports under cover Form 20-F or Form 40-F.
| Form 20-F x | Form 40-F o |
Indicate by check mark if the registrant is submitting the Form 6-K in paper as permitted by Regulation S-T Rule 101(b)(1): N/A
Indicate by check mark if the registrant is submitting the Form 6-K in paper as permitted by Regulation S-T Rule 101(b)(7): N/A
Indicate by check mark whether by furnishing the information contained in this Form, the registrant is also thereby furnishing the information to the Commission pursuant to Rule 12g3-2(b) under the Securities Exchange Act of 1934.
| Yes o | No x |
If “Yes” is marked, indicate below the file number assigned to the registrant in connection with Rule 12g3-2(b): N/A
Incorporation by Reference
This Report on Form 6-K, including the exhibits hereto, is hereby incorporated by reference, in its entirety, into the registration statement on Form F-3 (File No. 333-221336) of Aktiebolaget Svensk Exportkredit (publ) (“SEK”).
This Report comprises the following:
1. Registrant’s report for the fourth quarter of 2017. |
|
SIGNATURE
Pursuant to the requirements of the Securities Exchange Act of 1934, the Registrant has duly caused this Report to be signed on its behalf by the undersigned, thereunto duly authorized.
Dated: July 17, 2018
| AB Svensk Exportkredit | |
|
| |
| (Swedish Export Credit Corporation) | |
|
| |
| By: | /s/ Catrin Fransson |
|
|
|
|
| Catrin Fransson, Chief Executive Officer |
| AB Svensk Exportkredit Swedish Export Credit Corporation |
Summary
Net interest revenues, quarterly

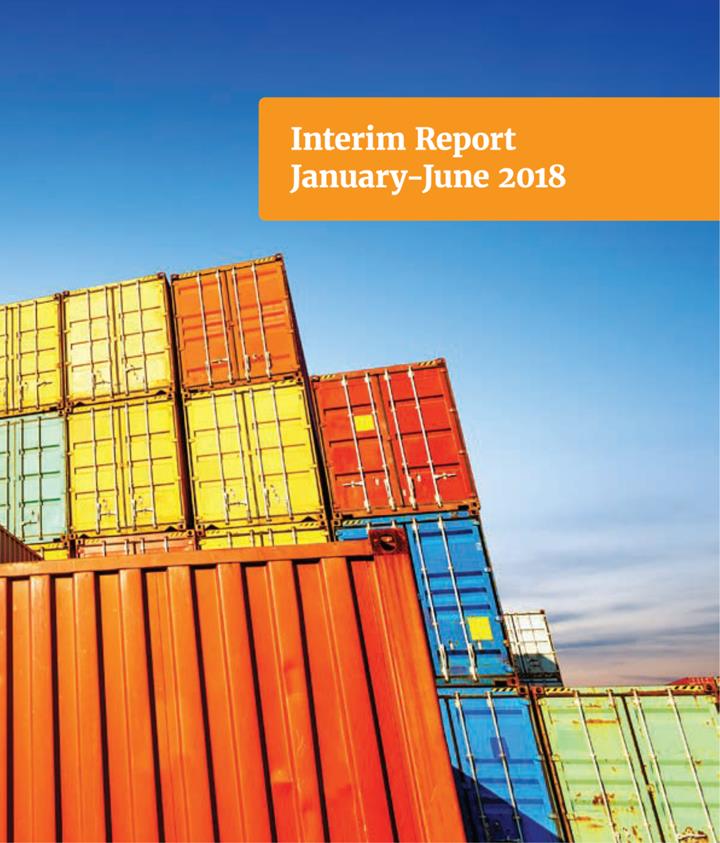
Operating profit, quarterly
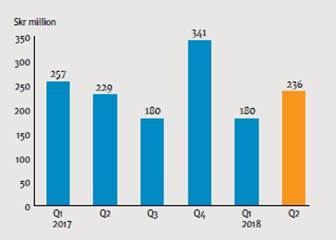
After-tax return on equity, quarterly
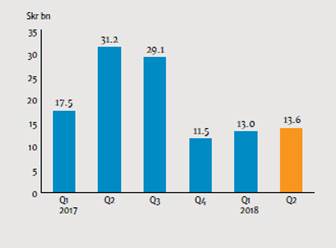
Total capital ratio, quarterly

January-June 2018
(Compared to January-June 2017)
· Net interest revenues Skr 728 million (1H17: Skr 852 million)
· Operating profit Skr 416 million (1H17: Skr 486 million)
· Net profit Skr 312 million (1H17: Skr 371 million)
· New lending Skr 26.6 billion (1H17: Skr 48.7 billion)
· Basic and diluted earnings per share Skr 78 (1H17: Skr 93)
· After-tax return on equity 3.5 percent (1H17: 4.3 percent)
Second quarter of 2018
(Compared to the second quarter of 2017)
· Net interest revenues Skr 346 million (2Q17: Skr 422 million)
· Operating profit Skr 236 million (2Q17: Skr 229 million)
· Net profit Skr 176 million (2Q17: Skr 175 million)
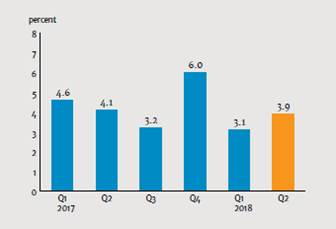
· New lending Skr 13.6 billion (2Q17: Skr 31.2 billion)
· Basic and diluted earnings per share Skr 44 (2Q17: Skr 44)
· After-tax return on equity 3.9 percent (2Q17: 4.1 percent)
Equity and balances
(Compared to December 2017)
· Total capital ratio 20.2 percent (year-end 2017: 23.0 percent)
· Total assets Skr 293.8 billion (year-end 2017: Skr 264.4 billion)
· Loans, outstanding and undisbursed Skr 272.8 billion
(year-end 2017: Skr 268.0 billion)
Statement by the CEO
Strong finances for Swedish exporters
Activity levels are high in the Swedish export industry. Export order intakes and employment have risen and, according to SEK’s most recent Export Credit Trends Survey, financial conditions are at their strongest since measurement started in 2013.
Despite a higher export order intake, exporters believe that the need for export financing remains unchanged. Around one third of the companies surveyed have noted that their customers had improved access to financing, which means that the customers are not seeking export financing to the same extent as previously.
The Export Credit Trends Survey shows that the availability of finance to exporters through the banks and capital markets is relatively unchanged. However, exporters noted rising costs for such financing.
The positive trend for Swedish exports was not fully reflected in SEK’s lending. New lending for the first six months of the year was lower than in the prior year period at Skr 26.6 billion (1H17: Skr 48.7 billion). The decrease mainly resulted from healthy access to financing in the market and to the strengthening of companies’ finances.
Efforts to attract new clients were successful in the first six months. The focus on medium-sized companies has been the primary driver in generating new business and new clients.
Year-on-year, net interest revenues declined in the first six months of the year to Skr 728 million (1H17: Skr 852 million). Net interest revenues were negatively impacted by a higher resolution fee and higher borrowing costs.
Operating profit for the first six months of the year was down year-on-year at Skr 416 million (1H17: Skr 486 million).
SEK remains well-prepared to assist the Swedish export industry with finacial solutions and to thereby strengthen Swedish exporters’ competitiveness.
“Exporters’ financial positions are very robust. Despite higher order intakes, the need for financing remains unchanged.”
|
|
|
|
| |
|
| |
| Catrin Fransson, CEO | |
|
| |
|
| |
|
| |
|
|

Operations
New lending, quarterly
SEK’s markets for new lending
Jan-Jun 2018

New clients and broadened business
Efforts to solicit new clients in the first half of 2018 were successful, primarily because the focus on medium-sized companies has resulted in business with several new clients. SEK has also broadened its business with many existing clients who now utilize a larger portion of SEK’s offerings. There is healthy access to finance in the market, from both financial institutions and the capital markets. This impacted new lending, which was down year-on-year. Total new lending amounted to Skr 26.6 billion (1H17: Skr 48.7 billion).
New lending
Skr bn |
| Jan-Jun 2018 |
| Jan-Jun 2017 |
| Jan-Dec 2017 |
|
Lending to Swedish exporters1 |
| 8.4 |
| 13.0 |
| 21.6 |
|
Lending to exporters’ customers2 |
| 18.2 |
| 35.7 |
| 67.7 |
|
Total |
| 26.6 |
| 48.7 |
| 89.3 |
|
CIRR loan as percentage of new financial transactions |
| 5 | % | 33 | % | 41 | % |
1 Of which Skr 1.2 billion (1H17: Skr 0.1 billion; year-end 2017: Skr 0.7 billion) had not been disbursed at period end.
2 Of which Skr 2.9 billion (1H17: Skr 15.8 billion; year-end 2017: Skr 35.1 billion) had not been disbursed at period end.

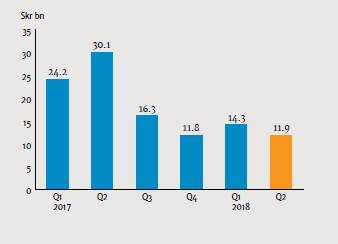
New borrowing, quarterly
Long-term borrowing
SEK’s markets for new borrowing
Jan-Jun 2018
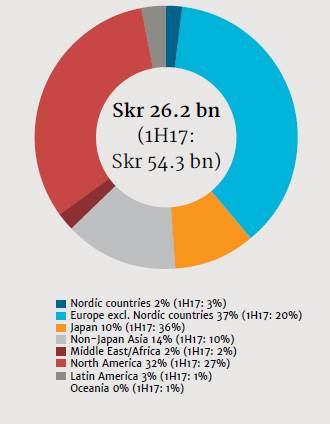
Focus on public financing transactions
As a consequence of adapting to the new MiFID II regulations, SEK did not issue any structured debt in the Japanese market in the first five months of 2018. This borrowing restarted in June. Moreover, SEK completed several public financing transactions, including a three-year, USD 1 billion benchmark bond. SEK continues to maintain high liquidity for new lending and is well prepared to meet the future financing needs of the Swedish export industry.
SEK’s borrowing
Skr bn |
| Jan-Jun 2018 |
| Jan-Jun 2017 |
| Jan-Dec 2017 |
|
New long-term borrowings |
| 26.2 |
| 54.3 |
| 82.4 |
|
Outstanding senior debt |
| 248.5 |
| 249.3 |
| 224.8 |
|
Repurchase and redemption of own debt |
| 5.5 |
| 12.2 |
| 38.7 |
|

Comments on the consolidated financial accounts
First six months of 2018
Operating profit for the first six months amounted to Skr 416 million (1H17: Skr 486 million). Net profit amounted to Skr 312 million (1H17: Skr 371 million).
Net interest revenues
Net interest revenues for the first six months of 2018 amounted to Skr 728 million (1H17: Skr 852 million), a decrease of 15 percent compared to the same period in the previous year. Net interest revenues were affected negatively by a higher resolution fee of Skr 133 million (1H17: Skr 97 million), which SEK is required to pay to a fund to support the recovery of credit institutions, effects from a divested investment portfolio, as well as by higher borrowing costs and lower average liquidity investments. In 2018, the resolution fee amounts to 0.125 percent (2017: 0.09 percent) of the calculation basis, which essentially corresponds to SEK’s debt-financed assets less the CIRR-loans. In 2019, the resolution fee will go back to 0.09 percent.
Skr bn, average |
| Jan-Jun |
| Jan-Jun |
| Change |
|
Total loans |
| 202.9 |
| 206.5 |
| -2 | % |
Liquidity investments |
| 60.5 |
| 70.8 |
| -15 | % |
Interest-bearing assets |
| 263.5 |
| 277.3 |
| -5 | % |
Interest-bearing liabilities |
| 238.8 |
| 253.3 |
| -6 | % |
Net results of financial transactions
Net results of financial transactions for the first six months of 2018 amounted to Skr -32 million (1H17: Skr -30 million). The result was mainly due to unrealized losses in fair value of assets in the liquidity portfolio and on derivatives. This was offset by realized gains related to repurchase of SEK’s own debt.
Operating expenses
Skr mn |
| Jan-Jun |
| Jan-Jun |
| Change |
|
Personnel expenses |
| -157 |
| -168 |
| -7 | % |
Other administrative expenses |
| -123 |
| -122 |
| 1 | % |
Depreciation and impairment of non-financial assets |
| -17 |
| -23 |
| -26 | % |
Total operating expenses |
| -297 |
| -313 |
| -5 | % |
Operating expenses decreased somewhat compared to the same period in the previous year, due to decreased personnel expenses and depreciation and impairment of non-financial assets. No provision was made for the individual variable remuneration (1H17: Skr 5 million). Beginning in 2017, SEK introduced a system for individual variable remuneration for permanent employees with customer or business responsibility, with the exception of members of the executive management team. In 2018, the cost for this remuneration could amount to a maximum of Skr 12 million.
Net credit losses
Net credit losses for the first six months of 2018 amounted to Skr 30 million (1H17: Skr -10 million). The positive result was mainly due to the changed macroeconomic forecasting scenarios and risk factors in accordance with IFRS 9 procedures, but also due to redeemed credits. See Note 4. Loss allowances as of June 30, 2018 amounted to Skr -116 million compared to Skr -137 million as of January 1, 2018, of which exposures in stage 3 amounted to Skr -67 million (January 1, 2018 Skr -66 million).
Other comprehensive income
Other comprehensive income before tax for the first six months of 2018 amounted to Skr 141 million (1H17: Skr -98 million), mainly due to a reversal of a previous reserve for parameter uncertainty related to credit spreads on SEK’s own debt.
April-June 2018
Operating profit for the second quarter of 2018 amounted to Skr 236 million (2Q17: Skr 229 million). Net profit amounted to Skr 176 million (2Q17: Skr 175 million).
Net interest revenues
Net interest revenues for the second quarter of 2018 amounted to Skr 346 million (2Q17: Skr 422 million), a decrease of 18 percent compared to the same period in the previous year. Net interest revenues were affected negatively by a higher resolution fee of Skr 63 million (2Q17: Skr 48 million), which SEK is required to pay to a fund to support the recovery of credit institutions, effects from a divested investment portfolio, as well as higher borrowing costs.
Skr bn, average |
| Apr-Jun |
| Apr-Jun |
| Change |
|
Total loans |
| 205.4 |
| 208.7 |
| -2 | % |
Liquidity investments |
| 66.6 |
| 69.3 |
| -4 | % |
Interest-bearing assets |
| 272.0 |
| 278.0 |
| -2 | % |
Interest-bearing liabilities |
| 247.7 |
| 255.3 |
| -3 | % |
Net results of financial transactions
Net results of financial transactions for the second quarter of 2018 amounted to Skr 27 million (2Q17: Skr -36 million). The result was mainly due to gains related to repurchase of SEK’s own debt.
Operating expenses
Skr mn |
| Apr-Jun |
| Apr-Jun |
| Change |
|
Personnel expenses |
| -78 |
| -89 |
| -12 | % |
Other administrative expenses |
| -67 |
| -62 |
| 8 | % |
Depreciation and impairment of non-financial assets |
| -9 |
| -12 |
| -25 | % |
Total operating expenses |
| -154 |
| -163 |
| -6 | % |
Operating expenses decreased somewhat compared to the same period in the previous year, due to decreased personnel expenses and depreciation and impairment of non-financial assets. No provision was made for the individual variable remuneration (2Q17: Skr 2 million).
Net credit losses
Net credit losses for the second quarter of 2018 amounted to Skr 25 million (2Q17: Skr 13 million). The positive result was mainly due to the changed macroeconomic forecasting scenarios and risk factors in accordance with IFRS 9 procedures, but also due to redeemed credits. See Note 4.
Statement of Financial Position
Total assets and liquidity investments
Liquidity investments and outstanding loans increased compared to the end of 2017, mainly due to disbursements of loans and new funding placed in liquidity.
Skr bn |
|
June 30, |
|
December 31, |
| Change |
|
Total assets |
| 293.8 |
| 264.4 |
| 11 | % |
Liquidity investments |
| 65.3 |
| 55.7 |
| 17 | % |
Outstanding loans |
| 210.8 |
| 195.1 |
| 8 | % |
of which loans in the CIRR-system |
| 64.9 |
| 49.1 |
| 32 | % |
Total exposures amounted to Skr 338.6 billion on June 30, 2018 (year-end 2017: Skr 327.2 billion). SEK’s exposures to central and regional governments and corporates have increased while exposures to financial institutions have decreased. See Note 10.
Liabilities and equity
As of June 30, 2018, the aggregate volume of available funds and shareholders’ equity exceeded the aggregate volume of loans outstanding and loans committed at all maturities. Accordingly, SEK considers all of its outstanding commitments to be covered through maturity.
In 2018, SEK has a credit facility in place with the Swedish National Debt Office of up to Skr 125 billion. To date, SEK has not utilized the credit facility. The credit facility can only be utilized for loans covered by the officially supported export credits system (CIRR).
Capital adequacy
The total capital ratio was 20.2 percent (year-end 2017: 23.0 percent). The decrease in total capital ratio is mainly due to Tier 2 capital no longer being included in the capital ratio calculations (see “Other events” below). SEK maintains strong capitalization in relation to the capital target, with a total capital ratio that exceeds the total capital adequacy requirement of Finansinspektionen (the Swedish FSA) by 4.1 percentage points, and healthy liquidity.
Percent |
| June 30, 2018 |
| December 31, 2017 |
|
Common Equity Tier 1 capital ratio |
| 20.2 |
| 20.6 |
|
Tier 1 capital ratio |
| 20.2 |
| 20.6 |
|
Total capital ratio |
| 20.2 |
| 23.0 |
|
Leverage ratio |
| 5.5 |
| 5.9 |
|
Liquidity coverage ratio (LCR) |
| 680 |
| 169 |
|
Net stable funding ratio (NSFR) |
| 140 |
| 140 |
|
Rating
|
| Skr |
| Foreign currency |
|
Moody’s |
| Aa1/Stable |
| Aa1/Stable |
|
Standard & Poor’s |
| AA+/Stable |
| AA+/Stable |
|
Other events
On November 14, 2013, SEK issued the following Tier 2 instrument: “USD 250,000,000 Fixed Rate Resettable Dated Subordinated Instruments due 14 November 2023” (EMTN 5487). In June 2018, SEK received permission from the Swedish FSA to call EMTN 5487 on November 14, 2018 in accordance with its terms. In the autumn of 2018, the Board of directors of SEK will decide whether SEK will exercise its right to call EMTN 5487. As a result of the permission from the Swedish FSA, SEK has reduced the level of own funds by the outstanding principal amount of the EMTN 5487, which is the equivalent of USD 250,000,000. If the board of directors of SEK decides not to call EMTN 5487, the outstanding principal amount of the EMTN 5487 will be reinstated to own funds and to Tier 2 capital.
During the second quarter of 2018 the winding-down of SEK’s subsidiary Venantius AB, including its wholly-owned subsidiary VF Finans AB, was completed. The winding-down did not have any material effect on the results, assets or liabilities of the Group, which as of June 30, 2018 encompasses SEK and its newly-formed, wholly-owned, non-active subsidiary, SEKETT AB.
Risk factors and the macro environment
Various risks arise as part of SEK’s operations. SEK’s primary exposure is to credit risk, but the company is also exposed to market, liquidity, refinancing, operational and sustainability risks. For a more detailed description of SEK’s risk factors, refer to the Risk and Capital Management section in SEK’s 2017 Annual Report.
The Swedish economy continues to post relatively strong growth and, in the first quarter of 2018, Sweden’s GDP grew at a rate of 3.3 percent on an annualized basis. This sustained period of growth, which started as far back as 2013, has proven to be durable.
Sweden’s unemployment rate was 6.1 percent (May 2018). The consumer price index (May 2018) rose 1.9 percent on an annualized basis and the repo rate remained fixed at negative 0.5 percent. According to Statistics Sweden (SCB), in the first quarter of 2018, Swedish exports decreased 0.2 percent compared with the last quarter in 2017. Exports of goods increased 0.1 percent and exports of services declined 0.9 percent.
Growth in the rest of the world remains healthy and is expected to further support global trade. However, there are significant uncertainties and risks, and in particular, threats to the global trading system could jeopardize growth going forward.
Financial targets
Profitability target | A return on equity of at least 6 percent over time. |
Dividend policy | Payment of an ordinary dividend of 30 percent of the profit for the year. |
Capital target | Under normal conditions, SEK’s total capital ratio is to exceed the Swedish FSA’s total capital adequacy requirement by 1 to 3 percentage points. Currently, the capital target means that the total capital ratio should amount to 17-19 percent. |
Key performance indicators (Unaudited except for Jan-Dec 2017)
Skr mn (if not otherwise indicated) |
| Apr-Jun |
| Jan–Mar |
| Apr-Jun |
| Jan-Jun |
| Jan–Jun |
| Jan-Dec |
|
New lending |
| 13,568 |
| 13,033 |
| 31,181 |
| 26,601 |
| 48,721 |
| 89,305 |
|
of which to Swedish exporters |
| 3,718 |
| 4,633 |
| 5,745 |
| 8,351 |
| 13,060 |
| 21,643 |
|
of which to exporters’ customers |
| 9,850 |
| 8,400 |
| 25,436 |
| 18,250 |
| 35,661 |
| 67,662 |
|
CIRR-loans as a percentage of new lending |
| 1 | % | 8 | % | 50 | % | 5 | % | 33 | % | 41 | % |
Loans, outstanding and undisbursed |
| 272,805 |
| 267,670 |
| 266,470 |
| 272,805 |
| 266,470 |
| 268,034 |
|
|
|
|
|
|
|
|
|
|
|
|
|
|
|
New long-term borrowings |
| 11,868 |
| 14,294 |
| 30,095 |
| 26,162 |
| 54,297 |
| 82,441 |
|
Outstanding senior debt |
| 248,493 |
| 242,653 |
| 249,323 |
| 248,493 |
| 249,323 |
| 224,833 |
|
|
|
|
|
|
|
|
|
|
|
|
|
|
|
After-tax return on equity |
| 3.9 | % | 3.1 | % | 4.1 | % | 3.5 | % | 4.3 | % | 4.5 | % |
|
|
|
|
|
|
|
|
|
|
|
|
|
|
Common Equity Tier 1 capital ratio |
| 20.2 | % | 19.9 | % | 19.1 | % | 20.2 | % | 19.1 | % | 20.6 | % |
Tier 1 capital ratio |
| 20.2 | % | 19.9 | % | 19.1 | % | 20.2 | % | 19.1 | % | 20.6 | % |
Total capital ratio |
| 20.2 | % | 22.3 | % | 21.5 | % | 20.2 | % | 21.5 | % | 23.0 | % |
Leverage ratio |
| 5.5 | % | 5.6 | % | 5.5 | % | 5.5 | % | 5.5 | % | 5.9 | % |
Liquidity coverage ratio (LCR) |
| 680 | % | 241 | % | 639 | % | 680 | % | 639 | % | 169 | % |
Net stable funding ratio (NSFR) |
| 140 | % | 147 | % | 145 | % | 140 | % | 145 | % | 140 | % |
See definitions on page 30.
CONSOLIDATED STATEMENT OF COMPREHENSIVE INCOME IN SUMMARY
(UNAUDITED EXCEPT FOR JAN-DEC 2017)
Skr mn |
| Note |
| Apr-Jun |
| Jan–Mar |
| Apr-Jun |
| Jan-Jun |
| Jan–Jun |
| Jan-Dec |
|
Interest revenues |
|
|
| 1,257 |
| 1,056 |
| 987 |
| 2,313 |
| 1,873 |
| 3,896 |
|
Interest expenses |
|
|
| -911 |
| -674 |
| -565 |
| -1,585 |
| -1,021 |
| -2,213 |
|
Net interest revenues |
| 2 |
| 346 |
| 382 |
| 422 |
| 728 |
| 852 |
| 1,683 |
|
|
|
|
|
|
|
|
|
|
|
|
|
|
|
|
|
Net fee and commission expense |
|
|
| -8 |
| -5 |
| -7 |
| -13 |
| -13 |
| -28 |
|
Net results of financial transactions |
| 3 |
| 27 |
| -59 |
| -36 |
| -32 |
| -30 |
| -102 |
|
Total operating income |
|
|
| 365 |
| 318 |
| 379 |
| 683 |
| 809 |
| 1,553 |
|
|
|
|
|
|
|
|
|
|
|
|
|
|
|
|
|
Personnel expenses |
|
|
| -78 |
| -79 |
| -89 |
| -157 |
| -168 |
| -320 |
|
Other administrative expenses |
|
|
| -67 |
| -56 |
| -62 |
| -123 |
| -122 |
| -232 |
|
Depreciation and impairment of non-financial assets |
|
|
| -9 |
| -8 |
| -12 |
| -17 |
| -23 |
| -45 |
|
Total operating expenses |
|
|
| -154 |
| -143 |
| -163 |
| -297 |
| -313 |
| -597 |
|
|
|
|
|
|
|
|
|
|
|
|
|
|
|
|
|
Operating profit before net credit losses |
|
|
| 211 |
| 175 |
| 216 |
| 386 |
| 496 |
| 956 |
|
|
|
|
|
|
|
|
|
|
|
|
|
|
|
|
|
Net credit losses |
| 4 |
| 25 |
| 5 |
| 13 |
| 30 |
| -10 |
| 51 |
|
Operating profit |
|
|
| 236 |
| 180 |
| 229 |
| 416 |
| 486 |
| 1,007 |
|
|
|
|
|
|
|
|
|
|
|
|
|
|
|
|
|
Tax expenses |
|
|
| -60 |
| -44 |
| -55 |
| -104 |
| -115 |
| -235 |
|
Net profit1 |
|
|
| 176 |
| 136 |
| 175 |
| 312 |
| 371 |
| 772 |
|
|
|
|
|
|
|
|
|
|
|
|
|
|
|
|
|
Other comprehensive income related to: |
|
|
|
|
|
|
|
|
|
|
|
|
|
|
|
Items to be reclassified to profit or loss |
|
|
|
|
|
|
|
|
|
|
|
|
|
|
|
Available-for-sale securities2 |
|
|
| — |
| — |
| -20 |
| — |
| -28 |
| -33 |
|
Derivatives in cash flow hedges2 |
|
|
| -7 |
| -6 |
| -28 |
| -13 |
| -57 |
| -91 |
|
Tax on items to be reclassified to profit or loss |
|
|
| 2 |
| 1 |
| 11 |
| 3 |
| 19 |
| 27 |
|
Net items to be reclassified to profit or loss |
|
|
| -5 |
| -5 |
| -37 |
| -10 |
| -66 |
| -97 |
|
|
|
|
|
|
|
|
|
|
|
|
|
|
|
|
|
Items not to be reclassified to profit or loss |
|
|
|
|
|
|
|
|
|
|
|
|
|
|
|
Own credit risk2 |
|
|
| 113 |
| 71 |
| — |
| 184 |
| — |
| — |
|
Revaluation of defined benefit plans2 |
|
|
| -19 |
| -11 |
| -17 |
| -30 |
| -13 |
| -4 |
|
Tax on items not to be reclassified to profit or loss |
|
|
| -21 |
| -13 |
| 4 |
| -34 |
| 3 |
| 1 |
|
Net items not to be reclassified to profit or loss |
|
|
| 73 |
| 47 |
| -13 |
| 120 |
| -10 |
| -3 |
|
Total other comprehensive income |
|
|
| 68 |
| 42 |
| -50 |
| 110 |
| -76 |
| -100 |
|
Total comprehensive income1 |
|
|
| 244 |
| 178 |
| 125 |
| 422 |
| 295 |
| 672 |
|
1 The entire profit is attributable to the shareholder of the Parent Company.
2 See the Consolidated Statement of Changes in Equity.
Skr |
|
|
|
|
|
|
|
|
|
|
|
|
|
|
|
Basic and diluted earnings per share3 |
|
|
| 44 |
| 34 |
| 44 |
| 78 |
| 93 |
| 193 |
|
3 Net profit divided by average number of shares, which amounts to 3,990,000 for each period.
CONSOLIDATED STATEMENT OF FINANCIAL POSITION
(UNAUDITED EXCEPT DECEMBER 2017)
Skr mn |
| Note |
| June 30, 2018 |
| December 31, 2017 |
|
Assets |
|
|
|
|
|
|
|
Cash and cash equivalents |
| 5 |
| 5,348 |
| 1,231 |
|
Treasuries/government bonds |
| 5 |
| 3,505 |
| 4,382 |
|
Other interest-bearing securities except loans |
| 5 |
| 43,644 |
| 39,807 |
|
Loans in the form of interest-bearing securities |
| 4, 5 |
| 40,060 |
| 41,125 |
|
Loans to credit institutions |
| 4, 5 |
| 24,951 |
| 23,198 |
|
Loans to the public |
| 4, 5 |
| 158,548 |
| 141,111 |
|
Derivatives |
| 5, 6 |
| 10,795 |
| 7,803 |
|
Property, plant, equipment and intangible assets |
|
|
| 82 |
| 88 |
|
Other assets |
|
|
| 4,317 |
| 3,556 |
|
Prepaid expenses and accrued revenues |
|
|
| 2,504 |
| 2,091 |
|
Total assets |
|
|
| 293,754 |
| 264,392 |
|
|
|
|
|
|
|
|
|
Liabilities and equity |
|
|
|
|
|
|
|
Borrowing from credit institutions |
| 5 |
| 3,939 |
| 2,317 |
|
Senior securities issued |
| 5 |
| 244,554 |
| 222,516 |
|
Derivatives |
| 5, 6 |
| 21,001 |
| 16,480 |
|
Other liabilities |
|
|
| 1,204 |
| 826 |
|
Accrued expenses and prepaid revenues |
|
|
| 2,419 |
| 2,063 |
|
Deferred tax liabilities |
|
|
| 553 |
| 531 |
|
Provisions |
|
|
| 70 |
| 45 |
|
Subordinated securities issued |
| 5 |
| 2,236 |
| 2,040 |
|
Total liabilities |
|
|
| 275,976 |
| 246,818 |
|
|
|
|
|
|
|
|
|
Share capital |
|
|
| 3,990 |
| 3,990 |
|
Reserves |
|
|
| -278 |
| 30 |
|
Retained earnings |
|
|
| 14,066 |
| 13,554 |
|
Total equity |
|
|
| 17,778 |
| 17,574 |
|
|
|
|
|
|
|
|
|
Total liabilities and equity |
|
|
| 293,754 |
| 264,392 |
|
CONSOLIDATED STATEMENT OF CHANGES IN EQUITY IN SUMMARY
(UNAUDITED EXCEPT FOR JAN-DEC 2017)
|
|
|
|
|
|
| Reserves |
|
|
| ||||||
Skr mn |
| Equity |
|
| Share |
| Hedge |
| Fair value |
| Own credit |
| Defined |
| Retained |
|
Opening balance of equity January 1, 2017 |
| 17,136 |
|
| 3,990 |
| 96 |
| 35 |
|
|
| -1 |
| 13,016 |
|
Net profit Jan-Jun, 2017 |
| 371 |
|
|
|
|
|
|
|
|
|
|
|
| 371 |
|
Other comprehensive income Jan-Jun, 2017 |
| -76 |
|
|
|
| -44 |
| -22 |
|
|
| -10 |
|
|
|
Total comprehensive income Jan-Jun, 2017 |
| 295 |
|
|
|
| -44 |
| -22 |
|
|
| -10 |
| 371 |
|
Dividend |
| -234 |
|
|
|
|
|
|
|
|
|
|
|
| -234 |
|
Closing balance of equity June 30, 20171 |
| 17,197 |
|
| 3,990 |
| 52 |
| 13 |
|
|
| -11 |
| 13,153 |
|
Opening balance of equity January 1, 2017 |
| 17,136 |
|
| 3,990 |
| 96 |
| 35 |
|
|
| -1 |
| 13,016 |
|
Net profit Jan-Dec, 2017 |
| 772 |
|
|
|
|
|
|
|
|
|
|
|
| 772 |
|
Other comprehensive income Jan-Dec, 2017 |
| -100 |
|
|
|
| -71 |
| -26 |
|
|
| -3 |
|
|
|
Total comprehensive income Jan-Dec, 2017 |
| 672 |
|
|
|
| -71 |
| -26 |
|
|
| -3 |
| 772 |
|
Dividend |
| -234 |
|
|
|
|
|
|
|
|
|
|
|
| -234 |
|
Closing balance of equity December 31, 20171 |
| 17,574 |
|
| 3,990 |
| 25 |
| 9 |
|
|
| -4 |
| 13,554 |
|
Effects of the implementation of IFRS 92 |
| 14 |
|
|
|
|
|
| -9 |
| -409 |
|
|
| 432 |
|
Adjusted opening balance of equity January 1, 2018 |
| 17,588 |
|
| 3,990 |
| 25 |
| — |
| -409 |
| -4 |
| 13,986 |
|
Net profit Jan-Jun, 2018 |
| 312 |
|
|
|
|
|
|
|
|
|
|
|
| 312 |
|
Other comprehensive income Jan-Jun, 2018 |
| 110 |
|
|
|
| -10 |
|
|
| 144 |
| -24 |
|
|
|
Total comprehensive income Jan-Jun, 2018 |
| 422 |
|
|
|
| -10 |
|
|
| 144 |
| -24 |
| 312 |
|
Dividend |
| -232 |
|
|
|
|
|
|
|
|
|
|
|
| -232 |
|
Closing balance of equity June 30, 20181 |
| 17,778 |
|
| 3,990 |
| 15 |
| — |
| -265 |
| -28 |
| 14,066 |
|
1 The entire equity is attributable to the shareholder of the Parent Company.
2 The effects of IFRS 9 differ from the effects presented in Note 1b in SEK’s 2017 Annual Report. The difference is related to the calculation of accumulated gains and losses that arise from changes in SEK’s own credit risk, and do not have any net effect on equity.
STATEMENT OF CASH FLOWS IN THE CONSOLIDATED GROUP IN SUMMARY
(UNAUDITED EXCEPT FOR JAN-DEC 2017)
Skr mn |
| Jan-Jun 2018 |
| Jan-Jun 2017 |
| Jan-Dec 2017 |
|
Operating activities |
|
|
|
|
|
|
|
Operating profit |
| 416 |
| 486 |
| 1,007 |
|
Adjustments for non-cash items in operating profit |
| 290 |
| 144 |
| 274 |
|
Income tax paid |
| -183 |
| -182 |
| -365 |
|
Changes in assets and liabilities from operating activities |
| -6,648 |
| -1,556 |
| 8,534 |
|
Cash flow from operating activities |
| -6,125 |
| -1,108 |
| 9,450 |
|
|
|
|
|
|
|
|
|
Investing activities |
|
|
|
|
|
|
|
Capital expenditures |
| -11 |
| — |
| -10 |
|
Cash flow from investing activities |
| -11 |
| — |
| -10 |
|
|
|
|
|
|
|
|
|
Financing activities |
|
|
|
|
|
|
|
Change in senior debt |
| 1,022 |
| 4,852 |
| -9,919 |
|
Derivatives, net |
| 9,061 |
| -3,882 |
| -4,931 |
|
Dividend paid |
| -232 |
| -234 |
| -234 |
|
Cash flow from financing activities |
| 9,851 |
| 736 |
| -15,084 |
|
|
|
|
|
|
|
|
|
Cash flow for the period |
| 3,715 |
| -372 |
| -5,644 |
|
Cash and cash equivalents at beginning of the period |
| 1,231 |
| 7,054 |
| 7,054 |
|
Cash flow for the period |
| 3,715 |
| -372 |
| -5,644 |
|
Exchange-rate differences on cash and cash equivalents |
| 402 |
| -227 |
| -179 |
|
Cash and cash equivalents at end of the period1 |
| 5,348 |
| 6,455 |
| 1,231 |
|
1 Cash and cash equivalents include, in this context, cash at banks that can be immediately converted into cash and short-term deposits for which the time to maturity does not exceed three months from trade date.
NOTES
Note 1. Applied accounting principles and impacts from changes in accounting principles
Note 2. Net interest revenues
Note 3. Net results of financial transactions
Note 4. Impairments
Note 5. Financial assets and liabilities at fair value
Note 6. Derivatives
Note 7. CIRR-system
Note 8. Pledged assets and contingent liabilities
Note 9. Capital adequacy
Note 10. Exposures
Note 11. Transactions with related parties
Note 12. Events after the reporting period
All amounts are in Skr million, unless otherwise indicated. All figures concern the Consolidated Group, unless otherwise indicated.
Note 1. Applied accounting principles and impacts from changes in accounting principles
This condensed interim report is presented in accordance with International Accounting Standard (IAS) 34, Interim Financial Reporting. The Group’s consolidated accounts have been prepared in accordance with the International Financial Reporting Standards (IFRS) as issued by the International Accounting Standards Board (IASB) together with the interpretations from IFRS Interpretations Committee (IFRS IC). The IFRS standards applied by SEK are all endorsed by the European Union (EU). The accounting also follows the additional standards imposed by the Annual Accounts Act for Credit Institutions and Securities Companies (1995:1559) (ÅRKL) and the regulation and general guidelines issued by Finansinspektionen (the Swedish FSA), “Annual Reports in Credit Institutions and Securities Companies” (FFFS 2008:25). In addition to this, the supplementary accounting rules for groups (RFR 1) issued by the Swedish Financial Reporting Board have been applied. SEK also follows the state’s general guidelines regarding external reporting in accordance with its corporate governance policy and guidelines for state-owned companies.
During the second quarter of 2018, the winding-down of the subsidiary Venantius AB, including its wholly-owned subsidiary VF Finans AB, was completed. The winding-down did not have any material effect on the Group’s results, assets or liabilities. The Consolidated Group as of June 30, 2018 encompasses SEK and its newly-formed, wholly-owned, non-active subsidiary, SEKETT AB. These are jointly referred to as the “Consolidated Group” or the “Group”.
The accounting policies, methods of computation and presentation of the Consolidated Group are, in all material aspects, the same as those used for the 2017
annual financial statements except for the application of the new and amended standards from IASB that entered into force beginning January 1, 2018. This interim report does not include all the disclosures required in the annual financial statements, and should be read in conjunction with the company’s annual financial statements as of December 31, 2017.
As of January 1, 2018, SEK began applying IFRS 9 Financial Instruments, which replaced the previous regulatory framework IAS 39 Financial Instruments: Recognition and Measurement. The impact of the transition to IFRS 9 on SEK is summarized as follows:
· As of January 1, 2018, SEK assessed its liquidity investments, which were previously classified as available-for-sale assets. The conclusion of the assessment was that liquidity investments are included in a portfolio where the business model entails measurement at fair value and, accordingly, they are recognized at fair value through profit or loss (FVTPL). Liquidity investments that were previously classified at fair value pursuant to the fair value option (FVO) are also classified at FVTPL. Certain fixed-rate liquidity investments were previously subject to hedge accounting and, as of January 1, 2018, these hedge accounting relationships have been terminated since liquidity investments are now measured at FVTPL.
· SEK’s lending meets the conditions for the solely payments of principal and interest (SPPI) tests and uses a business model that aims to collect contractual cash flows, which means SEK’s lending is measured at amortized cost.
· Gains and losses that arise from changes in SEK’s own credit risk on liabilities designated at fair value are recognized in the reserve for own credit risk under Other comprehensive income and are not reclassified to profit or loss in the financial statements of the Group.
· The principle applied for the impairment of exposures has changed from an approach based on incurred credit loss events under IAS 39 to an approach based on expected credit losses (ECL). IFRS 9 requires that all assets measured at amortized cost, including credit commitments and financial guarantees, are to be tested for any impairment,
which differs from IAS 39, where collective provisions are not made for off-balance-sheet items or available-for-sale financial assets. Loss allowances (ECL) is expected to mean lower initial impairment amounts but higher volatility over time.
· As of December 31, 2017, the transition to IFRS 9 had a total impact on the Group’s equity of Skr 14 million. IFRS 9 has no material impact on the Group’s capital adequacy and large exposure ratios. SEK is not restating comparative periods. Comparative information for 2017 is reported pursuant to IAS 39 and is not comparable with the information presented for 2018 under IFRS 9. Differences arising from the introduction of IFRS 9 are recognized directly in retained earnings as of January 1, 2018. Beginning January 1, 2018, SEK has also begun applying IFRS 9 for hedge accounting. Additional information on new accounting policies associated with IFRS 9 and quantitative transition information can be found in Note 1b to the Consolidated Financial Statements in SEK’s 2017 Annual Report.
As of January 1, 2018, SEK began applying the new standard IFRS 15 Revenue from Contracts with Customers. IFRS 15 is
not applicable to financial instruments or leasing agreements. IFRS 15 had a minor effect on SEK’s financial reporting during the first half of 2018.
Future changes to IFRS
In January 2016, the IASB issued the new accounting standard IFRS 16 Leases, with changes for lessees. All leases (with the exception of short-term and low-value leases) are to be recognized as right-of-use assets subject to depreciation with corresponding liabilities in the lessee’s balance sheet, and the lease payments recognized as repayments and interest expenses. Lessor accounting remains essentially unchanged. Additional disclosures are also required. SEK’s preliminary assessment is that the standard will primarily affect SEK’s recognition of operational leases for rental premises, which is not expected to have any material impact on SEK’s financial statements or capital adequacy or large exposure ratios. The standard will be applicable beginning January 1, 2019. There are no other IFRS or IFRS IC interpretations that are not yet applicable that are expected to have a material impact on SEK’s financial statements, capital adequacy or large exposure ratios.
Note 2. Net interest revenues
Skr mn |
| Apr-Jun |
| Jan–Mar |
| Apr-Jun |
| Jan-Jun |
| Jan–Jun |
| Jan-Dec |
|
Interest revenues |
|
|
|
|
|
|
|
|
|
|
|
|
|
Loans to credit institutions |
| 344 |
| 242 |
| 198 |
| 586 |
| 360 |
| 789 |
|
Loans to the public |
| 624 |
| 572 |
| 589 |
| 1,196 |
| 1,124 |
| 2,265 |
|
Loans in the form of interest-bearing securities |
| 170 |
| 159 |
| 160 |
| 329 |
| 325 |
| 629 |
|
Interest-bearing securities excluding loans in the form of interest-bearing securities |
| 123 |
| 124 |
| 95 |
| 247 |
| 202 |
| 458 |
|
Derivatives |
| -43 |
| -74 |
| -87 |
| -117 |
| -204 |
| -372 |
|
Administrative remuneration CIRR-system1 |
| 39 |
| 32 |
| 32 |
| 71 |
| 64 |
| 125 |
|
Other assets |
| 0 |
| 1 |
| 0 |
| 1 |
| 2 |
| 2 |
|
Total interest revenues2 |
| 1,257 |
| 1,056 |
| 987 |
| 2,313 |
| 1,873 |
| 3,896 |
|
|
|
|
|
|
|
|
|
|
|
|
|
|
|
Interest expenses |
|
|
|
|
|
|
|
|
|
|
|
|
|
Interest expenses |
| -848 |
| -604 |
| -517 |
| -1,452 |
| -924 |
| -2,020 |
|
Resolution fee |
| -63 |
| -70 |
| -48 |
| -133 |
| -97 |
| -193 |
|
Total interest expenses |
| -911 |
| -674 |
| -565 |
| -1,585 |
| -1,021 |
| -2,213 |
|
Net interest revenues |
| 346 |
| 382 |
| 422 |
| 728 |
| 852 |
| 1,683 |
|
1 Including administrative remuneration for concessionary loans of Skr 1 million during the period January-June 2018 (1H17:Skr 1 million).
2 Interest revenues calculated using the effective interest method amounted to Skr 1,959 million during the period January - June 2018 (1H17: Skr 1,595 million).
Note 3. Net results of financial transactions
Skr mn |
| Apr-Jun |
| Jan–Mar |
| Apr-Jun |
| Jan-Jun |
| Jan–Jun |
| Jan-Dec |
|
Derecognition of financial instruments not measured at fair value through profit or loss |
| 5 |
| 0 |
| 3 |
| 5 |
| 3 |
| -1 |
|
Financial assets or liabilities at fair value through profit or loss1 |
| 38 |
| -39 |
| -38 |
| -1 |
| -51 |
| -48 |
|
Financial instruments under fair-value hedge accounting |
| -11 |
| -21 |
| -1 |
| -32 |
| 19 |
| -53 |
|
Currency exchange-rate effects on all assets and liabilities excl. currency exchange-rate effects related to revaluation at fair value |
| -5 |
| 1 |
| 0 |
| -4 |
| -1 |
| 0 |
|
Total net results of financial transactions2 |
| 27 |
| -59 |
| -36 |
| -32 |
| -30 |
| -102 |
|
1 SEK classifies IFRS 9 liquidity investments as financial assets valued at fair value, which means that unrealized gains and losses are also recognized in net results of financial transactions. Due to IFRS 9 market value changes, arising from changes in credit spread on SEK’s own debt, are not reported in net results of financial transactions, but in other comprehensive income.
2 Difference between Parent Company and Consolidated group for the period Jan-Jun 2018 is due to different accounting principles regarding changes in SEK’s own credit risk, see Note 1.
SEK’s general business model is to hold financial instruments measured at fair value to maturity. The net market value changes are mainly attributable to changes in credit spread on own debt, which, due to IFRS 9, are reported in other comprehensive income, and basis spreads, which is reported in net results of financial transactions. The changes could be significant in a single reporting period, but will not affect earnings over time since the lifetime cumulative changes in the instrument’s market value will net to zero if it is held to maturity and is a performing instrument. When financial instruments are not held to maturity, realized gains and losses can occur, as in
cases where SEK repurchases its own debt, or where lending is repaid early and the related hedging instruments are terminated prematurely. The effects reported in the following line items of net results of financial transactions in the table above include realized as well as unrealized changes in fair value: “Derecognition of financial instruments not measured at fair value through profit or loss”, “Financial assets or liabilities at fair value through profit or loss” and “Financial instruments under fair-value hedge accounting”. “Financial assets or liabilities at fair value through profit or loss” and “Financial instruments under fair-value hedge accounting”.
Note 4. Impairments
Skr mn |
| Apr-Jun |
| Jan–Mar |
| Apr-Jun |
| Jan-Jun |
| Jan–Jun |
| Jan-Dec |
|
Impairment of financial assets |
| 25 |
| 5 |
| — |
| 30 |
| -27 |
| -59 |
|
Reversal of previous write-downs |
| — |
| — |
| 13 |
| — |
| 17 |
| 110 |
|
Net impairment and reversals |
| 25 |
| 5 |
| 13 |
| 30 |
| -10 |
| 51 |
|
|
|
|
|
|
|
|
|
|
|
|
|
|
|
Established losses |
| — |
| — |
| — |
| — |
| -47 |
| -47 |
|
Reserves applied to cover established credit losses |
| — |
| — |
| — |
| — |
| 47 |
| 46 |
|
Recovered credit losses |
| 0 |
| 0 |
| — |
| 0 |
| — |
| 1 |
|
Net credit losses |
| 25 |
| 5 |
| 13 |
| 30 |
| -10 |
| 51 |
|
|
|
|
|
|
|
|
|
|
|
|
|
|
|
Loss Allowance |
|
|
|
|
|
|
|
|
|
|
|
|
|
Opening balance |
| -135 |
| -155 |
| -230 |
| -155 |
| -254 |
| -254 |
|
Adjustments to opening balance due to IFRS 9 |
| — |
| 18 |
|
|
| 18 |
|
|
|
|
|
Reserves applied to cover established credit losses |
| — |
| — |
| — |
| — |
| 47 |
| 46 |
|
Net impairment and reversals |
| 25 |
| 5 |
| 13 |
| 30 |
| -10 |
| 51 |
|
Exchange-rate differences |
| -6 |
| -3 |
| — |
| -9 |
| 0 |
| 2 |
|
Closing balance |
| -116 |
| -135 |
| -217 |
| -116 |
| -217 |
| -155 |
|
Loss Allowance, January-June 2018
|
| Stage 1 |
| Stage 2 |
| Stage 3 |
|
|
|
Skr mn |
| Individually measured allowances |
| Total |
| ||||
Opening balance |
| -38 |
| -33 |
| -66 |
| -137 |
|
Increases due to origination and acquisition |
| -6 |
| 0 |
| 0 |
| -6 |
|
Net remeasurement of loss allowance |
| 13 |
| 6 |
| 4 |
| 23 |
|
Transfer to stage 1 |
| 0 |
| 0 |
| — |
| 0 |
|
Transfer to stage 2 |
| 0 |
| 0 |
| 0 |
| 0 |
|
Transfer to stage 3 |
| 0 |
| 0 |
| 0 |
| 0 |
|
Decreases due to derecognition |
| 4 |
| 9 |
| 0 |
| 13 |
|
Decrease in allowance account due to write-offs |
| — |
| — |
| — |
| — |
|
Exchange-rate differences |
| -3 |
| -1 |
| -5 |
| -9 |
|
Closing balance |
| -30 |
| -19 |
| -67 |
| -116 |
|
of which lending |
| -29 |
| -19 |
| -65 |
| -113 |
|
of which off balance |
| -1 |
| 0 |
| -2 |
| -3 |
|
Note 5. Financial assets and liabilities at fair value
|
| June 30, 2018 |
| ||||
Skr mn |
| Book value |
| Fair value |
| Surplus value (+)/ |
|
Cash and cash equivalents |
| 5,348 |
| 5,348 |
| — |
|
Treasuries/governments bonds |
| 3,505 |
| 3,505 |
| — |
|
Other interest-bearing securities except loans |
| 43,644 |
| 43,644 |
| — |
|
Loans in the form of interest-bearing securities |
| 40,060 |
| 41,220 |
| 1,160 |
|
Loans to credit institutions |
| 24,951 |
| 25,086 |
| 135 |
|
Loans to the public |
| 158,548 |
| 163,112 |
| 4,564 |
|
Derivatives |
| 10,795 |
| 10,795 |
| — |
|
Total financial assets |
| 286,851 |
| 292,710 |
| 5,859 |
|
|
|
|
|
|
|
|
|
Borrowing from credit institutions |
| 3,939 |
| 3,939 |
| — |
|
Senior securities issued |
| 244,554 |
| 246,311 |
| 1,757 |
|
Derivatives |
| 21,001 |
| 21,001 |
| — |
|
Subordinated securities issued |
| 2,236 |
| 2,245 |
| 9 |
|
Total financial liabilities |
| 271,730 |
| 273,496 |
| 1,766 |
|
|
| December 31, 2017 |
| ||||
Skr mn |
| Book value |
| Fair value |
| Surplus value (+)/ |
|
Cash and cash equivalents |
| 1,231 |
| 1,231 |
| — |
|
Treasuries/governments bonds |
| 4,382 |
| 4,382 |
| — |
|
Other interest-bearing securities except loans |
| 39,807 |
| 39,807 |
| — |
|
Loans in the form of interest-bearing securities |
| 41,125 |
| 42,352 |
| 1,227 |
|
Loans to credit institutions |
| 23,198 |
| 23,451 |
| 253 |
|
Loans to the public |
| 141,111 |
| 144,935 |
| 3,824 |
|
Derivatives |
| 7,803 |
| 7,803 |
| — |
|
Total financial assets |
| 258,657 |
| 263,961 |
| 5,304 |
|
|
|
|
|
|
|
|
|
Borrowing from credit institutions |
| 2,317 |
| 2,317 |
| — |
|
Senior securities issued |
| 222,516 |
| 223,465 |
| 949 |
|
Derivatives |
| 16,480 |
| 16,480 |
| — |
|
Subordinated securities issued |
| 2,040 |
| 2,047 |
| 7 |
|
Total financial liabilities |
| 243,353 |
| 244,309 |
| 956 |
|
Determination of fair value
The determination of fair value is described in SEK’s 2017 Annual Report, see Note 1a (h) (viii) Principles for determination of fair value of financial instruments and (ix) Determination of fair value of certain types of financial instruments.
Financial assets in fair value hierarchy
|
| Financial assets at fair value through |
|
| Available-for-sale under IAS 391 |
| ||||||||||||
Skr mn |
| Level 1 |
| Level 2 |
| Level 3 |
| Total |
|
| Level 1 |
| Level 2 |
| Level 3 |
| Total |
|
Treasuries/governments bonds |
| — |
| 3,505 |
| — |
| 3,505 |
|
|
|
|
|
|
|
|
|
|
Other interest-bearing securities except loans |
| — |
| 43,644 |
| — |
| 43,644 |
|
|
|
|
|
|
|
|
|
|
Derivatives |
| — |
| 8,706 |
| 2,089 |
| 10,795 |
|
|
|
|
|
|
|
|
|
|
Total, June 30, 2018 |
| — |
| 55,855 |
| 2,089 |
| 57,944 |
|
|
|
|
|
|
|
|
|
|
|
|
|
|
|
|
|
|
|
|
|
|
|
|
|
|
|
|
|
Total, December 31, 2017 |
| — |
| 5,942 |
| 1,974 |
| 7,916 |
|
| 4,382 |
| 39,694 |
| — |
| 44,076 |
|
1 Due to the transition to IFRS 9, the financial assets classified as available-for-sale under IAS 39 are now classified as “Financial assets at fair value through profit or loss” .
Financial liabilities in fair value hierarchy
|
| Financial liabilities at fair value through profit or loss |
| ||||||
Skr mn |
| Level 1 |
| Level 2 |
| Level 3 |
| Total |
|
Senior securities issued |
| — |
| 20,964 |
| 42,224 |
| 63,188 |
|
Derivatives |
| — |
| 16,243 |
| 4,758 |
| 21,001 |
|
Subordinated securities issued |
| — |
| — |
| — |
| — |
|
Total, June 30, 2018 |
| — |
| 37,207 |
| 46,982 |
| 84,189 |
|
|
|
|
|
|
|
|
|
|
|
Total, December 31, 2017 |
| — |
| 34,086 |
| 45,815 |
| 79,901 |
|
There were no transfers made between levels during the period January-June 2018 (year-end 2017: Skr - million).
Financial assets and liabilities at fair value in Level 3, June 30, 2018
Skr mn |
| January 1, |
| Purchases |
| Settlements |
| Transfers |
| Transfers |
| Gains (+) |
| Gains (+) |
| Exchange- |
| June 30, |
|
Other interest-bearing securities except loans |
| — |
| — |
| — |
| — |
| — |
| — |
| — |
| — |
| — |
|
Senior securities issued |
| -42,995 |
| -2,432 |
| 4,923 |
| — |
| — |
| 2,139 |
| 117 |
| -3,976 |
| -42,224 |
|
Derivatives, net |
| -846 |
| 1 |
| -10 |
| — |
| — |
| -2,002 |
| — |
| 188 |
| -2,669 |
|
Net assets and liabilities, 2018 |
| -43,841 |
| -2,431 |
| 4,913 |
| — |
| — |
| 137 |
| 117 |
| -3,788 |
| -44,893 |
|
Financial assets and liabilities at fair value in Level 3, December 31, 2017
Skr mn |
| January 1, |
| Purchases |
| Settlements |
| Transfers |
| Transfers |
| Gains (+) |
| Exchange- |
| December 31, |
|
Other interest-bearing securities except loans |
| 257 |
| — |
| -250 |
| — |
| — |
| -6 |
| -1 |
| — |
|
Senior securities issued |
| -48,217 |
| -19,077 |
| 24,627 |
| — |
| — |
| 1,044 |
| -1,372 |
| -42,995 |
|
Derivatives, net |
| -2,404 |
| 3 |
| -4,342 |
| — |
| — |
| -1,202 |
| 7,099 |
| -846 |
|
Net assets and liabilities, 2017 |
| -50,364 |
| -19,074 |
| 20,035 |
| — |
| — |
| -164 |
| 5,726 |
| -43,841 |
|
1 Gains and losses through profit or loss, including the impact of exchange-rates, is reported as net interest revenues and net results of financial transactions. The unrealized fair value changes for assets and liabilities, including the impact of exchange-rates, held as of June 30, 2018, amounted to a Skr 115 million gain (year-end 2017: Skr 768 million loss) and are reported as net results of financial transactions.
Uncertainty of valuation of Level 3 instruments
As the estimation of the parameters included in the models to calculate the market value of Level 3 instruments is associated with subjectivity and uncertainty, SEK has, in accordance with IFRS 13, conducted an analysis of the difference in fair value of Level 3 instruments using other established parameter values. Option models and discounted cash flows are used to value the Level 3 instruments. For Level 3 instruments with a longer duration where extrapolated discount curves are used, a sensitivity analysis has been conducted with regards to the interest. The revaluation of the portfolio is made using an interest rate shift of +/– 10 basis points. For the Level 3 instruments that are significantly affected by different types of correlations, which are not based on observable market data, a revaluation has been made by shifting the correlations. The basis for this sensitivity analysis is therefore the revaluation of the relevant part of the portfolio, where the correlations have been
adjusted by +/– 10 percentage points. After the revaluation is performed, the max/min value for each transaction is identified. For Level 3 instruments that are significantly affected by non-observable market data, such as SEK’s own creditworthiness, a revaluation has been made by shifting the credit curve. The revaluation is made by shifting the credit spreads by +/– 10 basis points, which has been assessed as a reasonable change in SEK’s credit spread. The analysis shows the impact of the non-observable market data on the market value. In addition, the market value will be affected by observable market data.
The result of the analysis corresponds with SEK’s business model where issued securities are linked with a matched hedging derivative. The underlying market data is used to evaluate the issued security as well as to evaluate the fair value in the derivative. This means that a change in fair value of the issued security, excluding SEK’s own credit spread, is offset by an equally large change in fair value in the derivative.
Sensitivity analysis — level 3 assets and liabilities
|
| June 30, 2018 |
| ||||||||||
Assets and liabilities |
| Fair Value |
| Unobservable |
| Range of estimates |
| Valuation method |
| Sensitivity |
| Sensitivity |
|
Interest rate |
| 0 |
| Credit spreads |
| 10BP - (10BP) |
| Discounted cash flow |
| 0 |
| 0 |
|
Sum other interest-bearing securities except loans |
| 0 |
|
|
|
|
|
|
| 0 |
| 0 |
|
|
|
|
|
|
|
|
|
|
|
|
|
|
|
Equity |
| -370 |
| Correlation |
| 0.70 - (0.03) |
| Option Model |
| 1 |
| -1 |
|
Interest rate |
| 964 |
| Correlation |
| 0.14 - (0.08) |
| Option Model |
| -94 |
| 91 |
|
FX |
| -3,095 |
| Correlation |
| 0.90 - (0.82) |
| Option Model |
| 24 |
| -21 |
|
Other |
| -168 |
| Correlation |
| 0.60 - 0.04 |
| Option Model |
| 0 |
| 0 |
|
Sum derivatives, net |
| -2,669 |
|
|
|
|
|
|
| -69 |
| 69 |
|
|
|
|
|
|
|
|
|
|
|
|
|
|
|
Equity |
| -697 |
| Correlation |
| 0.70 - (0.03) |
| Option Model |
| -1 |
| 1 |
|
|
|
|
| Credit spreads |
| 10BP - (10BP) |
| Discounted cash flow |
| 13 |
| -13 |
|
Interest rate |
| -41,396 |
| Correlation |
| 0.14 - (0.08) |
| Option Model |
| 98 |
| -95 |
|
|
|
|
| Credit spreads |
| 10BP - (10BP) |
| Discounted cash flow |
| 110 |
| -107 |
|
FX |
| -32 |
| Correlation |
| 0.90 - (0.82) |
| Option Model |
| -25 |
| 22 |
|
|
|
|
| Credit spreads |
| 10BP - (10BP) |
| Discounted cash flow |
| 99 |
| -99 |
|
Other |
| -99 |
| Correlation |
| 0.60 - 0.04 |
| Option Model |
| 0 |
| 0 |
|
|
|
|
| Credit spreads |
| 10BP - (10BP) |
| Discounted cash flow |
| 4 |
| -4 |
|
Sum senior securities issued |
| -42,224 |
|
|
|
|
|
|
| 298 |
| -295 |
|
Total effect on total comprehensive income2 |
|
|
|
|
|
|
|
|
| 229 |
| -226 |
|
|
|
|
|
|
|
|
|
|
|
|
|
|
|
Other interest-bearing securities except loans, December 31, 2017 |
| 0 |
|
|
|
|
|
|
| 0 |
| 0 |
|
Derivatives, net, December 31, 2017 |
| -846 |
|
|
|
|
|
|
| -167 |
| 155 |
|
Senior securities issued, December 31, 2017 |
| -42,995 |
|
|
|
|
|
|
| 381 |
| -366 |
|
Total effect on total comprehensive income, December 31, 20172 |
|
|
|
|
|
|
|
|
| 214 |
| -211 |
|
1 Represents the range of correlations that SEK has determined market participants would use when pricing the instruments. The structures are represented both in the security and the derivative hedging the bond. The sensitivity analysis is based on a shift in the interval for correlation between 0.1 and –0.1. The correlation is expressed as a value between 1 and –1, where 0 indicates no relationship, 1 indicates maximum positive relationship and -1 indicates maximum negative relationship. The maximum correlation in the range of unobservable inputs can thus be from 1 to –1. The table presents the scenario analysis of the effect on Level 3 instruments, with maximum positive and negative changes.
2 Of the total impact on total comprehensive income, the sensitivity effect of SEK’s own credit spread was Skr 226 million (year-end 2017: Skr 211 million) under a maximum scenario and Skr -223 million (year-end 2017: Skr -208 million) under a minimum scenario.
Fair value related to credit risk
|
| Fair value originating from credit risk |
| The period’s change in fair value |
| ||||
Skr mn |
| June 30, 2018 |
| December 31, 2017 |
| Jan–Jun 2018 |
| Jan–Jun 2017 |
|
CVA/DVA, net1 |
| -15 |
| -8 |
| -7 |
| 10 |
|
OCA2 |
| -339 |
| -578 |
| 185 |
| -86 |
|
1 Credit value adjustment (CVA) and Debt value adjustment (DVA) reflects how the counterparties’ credit risk as well as SEK’s own credit rating affects the fair value of derivatives.
2 Own credit adjustment (OCA) reflects how the changes in SEK’s credit rating affects the fair value of financial liabilities measured at fair value through profit and loss.Changes in creditworthiness is, as of January 1, 2018 presented in other comprehensive income according to IFRS 9. The effect of IFRS 9 differs from the closing balance as of December 31, 2017. The difference is related to the calculation of accumulated gains and losses that arise from changes in SEK’s own credit risk, and do not have any net effect on equity.
Note 6. Derivatives
Derivatives by categories
|
| June 30, 2018 |
| December 31, 2017 |
| ||||||||
Skr mn |
| Assets |
| Liabilities |
| Nominal |
| Assets |
| Liabilities |
| Nominal |
|
Interest rate-related contracts |
| 5,023 |
| 11,260 |
| 268,731 |
| 3,781 |
| 9,132 |
| 245,788 |
|
Currency-related contracts |
| 5,476 |
| 8,925 |
| 159,758 |
| 3,772 |
| 6,879 |
| 139,614 |
|
Equity-related contracts |
| 296 |
| 648 |
| 10,882 |
| 250 |
| 303 |
| 13,246 |
|
Contracts related to commodities, credit risk, etc. |
| — |
| 168 |
| -1,920 |
| — |
| 166 |
| -1,183 |
|
Total derivatives |
| 10,795 |
| 21,001 |
| 437,451 |
| 7,803 |
| 16,480 |
| 397,465 |
|
In accordance with SEK’s policies with regard to counterparty, interest rate, currency exchange, and other exposures, SEK uses, and is a party to, different kinds of derivative instruments, mostly various interest rate-related and currency
exchange-related contracts primarily to hedge risk exposure inherent in financial assets and liabilities. These contracts are carried at fair value in the statements of financial position on a contract-by-contract basis.
Note 7. CIRR-system
Pursuant to the company’s assignment as stated in its owner instruction issued by the Swedish government, SEK administers credit granting in the Swedish system for officially supported export credits (CIRR-system). SEK receives compensation from the Swedish government in the form of an administrative fee, which is calculated based on the principal amount outstanding.
All assets and liabilities related to the CIRR-system are included in the consolidated statement of financial position and in the Parent Company’s balance sheet since SEK bears the credit risk for the lending and acts as the counterparty for lending and borrowing. Unrealized revaluation effects on derivatives related to the CIRR-system are recognized on a net basis under Other assets.
SEK has determined that the CIRR-system should be considered an assignment whereby SEK acts as an agent on behalf of the Swedish government, rather than being the principal in individual transactions. Accordingly, interest income, interest expense and other costs pertaining to CIRR-system assets and liabilities are not recognized in SEK’s statement of comprehensive income.
The administrative compensation received by SEK from the Swedish government is recognized as part of interest income
in SEK’s statement of comprehensive income since the commission received in compensation is equivalent to interest. Any income for SEK that arises from its credit arranger role is recognized in SEK’s statement of comprehensive income under net interest revenues. Net credit losses are shown in the statement of comprehensive income for SEK as SEK bears the credit risk for the lending. Refer also to Note 1a (f) in SEK’s 2017 Annual Report.
The administrative fee paid by the state to SEK as compensation is recognized in the CIRR-system as administrative compensation to SEK. Arrangement fees to SEK are recognized together with other arrangement fees as interest expenses. Refer to the following tables.
In addition to the CIRR-system, SEK administers the Swedish government’s previous concessionary credit program according to the same principles as the CIRR-system. No new lending is being offered under the concessionary credit program. As of June 30, 2018, concessionary loans outstanding amounted to Skr 745 million (year-end 2017: Skr 754 million) and operating profit for the program amounted to Skr -21 million for the first half of 2018 (1H17: Skr -22 million). The administrative compensation to SEK amounted to Skr -1 million (1H17: Skr -1 million).
Statement of Comprehensive Income for the CIRR-system
Skr mn |
| Apr-Jun |
| Jan–Mar |
| Apr-Jun |
| Jan-Jun |
| Jan–Jun |
| Jan-Dec |
|
Interest revenues |
| 395 |
| 338 |
| 339 |
| 733 |
| 671 |
| 1,343 |
|
Interest expenses |
| -344 |
| -316 |
| -262 |
| -660 |
| -526 |
| -1,115 |
|
Net interest revenues |
| 51 |
| 22 |
| 77 |
| 73 |
| 145 |
| 228 |
|
|
|
|
|
|
|
|
|
|
|
|
|
|
|
Interest compensation |
| 19 |
| 0 |
| 12 |
| 19 |
| 14 |
| 26 |
|
Exchange-rate differences |
| 7 |
| 2 |
| -3 |
| 9 |
| -4 |
| -6 |
|
Profit before compensation to SEK |
| 77 |
| 24 |
| 86 |
| 101 |
| 155 |
| 248 |
|
Administrative remuneration to SEK |
| -38 |
| -32 |
| -31 |
| -70 |
| -63 |
| -123 |
|
Operating profit CIRR-system |
| 39 |
| -8 |
| 55 |
| 31 |
| 92 |
| 125 |
|
Reimbursement to (–) / from (+) the State |
| -39 |
| 8 |
| -55 |
| -31 |
| -92 |
| -125 |
|
Statement of Financial Position for the CIRR-system (included in SEK’s statement of financial position)
Skr mn |
| June 30, 2018 |
| December 31, 2017 |
|
Cash and cash equivalents |
| -54 |
| 10 |
|
Loans |
| 64,865 |
| 49,124 |
|
Derivatives |
| 1,647 |
| 522 |
|
Other assets |
| 3,091 |
| 3,472 |
|
Prepaid expenses and accrued revenues |
| 485 |
| 364 |
|
Total assets |
| 70,034 |
| 53,492 |
|
|
|
|
|
|
|
Liabilities |
| 65,045 |
| 49,252 |
|
Derivatives |
| 4,542 |
| 3,789 |
|
Accrued expenses and prepaid revenues |
| 447 |
| 451 |
|
Total liabilities |
| 70,034 |
| 53,492 |
|
|
|
|
|
|
|
Commitments |
|
|
|
|
|
Committed undisbursed loans |
| 56,758 |
| 69,166 |
|
Binding offers |
| 1,315 |
| 628 |
|
Note 8. Pledged assets and contingent liabilities
Skr mn |
| June 30, 2018 |
| December 31, 2017 |
|
Collateral provided |
|
|
|
|
|
Cash collateral under the security agreements for derivative contracts |
| 12,795 |
| 10,314 |
|
|
|
|
|
|
|
Contingent liabilities1 |
|
|
|
|
|
Guarantee commitments |
| 3,190 |
| 3,360 |
|
|
|
|
|
|
|
Commitments1 |
|
|
|
|
|
Committed undisbursed loans |
| 62,041 |
| 72,914 |
|
Binding offers |
| 1,445 |
| 1,211 |
|
1 For expected credit losses in guarantee commitments, committed undisbursed loans and binding offers see Note 4.
Note 9. Capital adequacy
Capital adequacy analysis
|
| June 30, 2018 |
| December 31, 2017 |
|
Capital ratios excl. of buffer requirements1 |
|
|
|
|
|
Common Equity Tier 1 capital ratio |
| 20.2 | % | 20.6 | % |
Tier 1 capital ratio |
| 20.2 | % | 20.6 | % |
Total capital ratio2 |
| 20.2 | % | 23.0 | % |
Institution-specific Common Equity Tier 1 capital requirement incl. buffers3 |
| 8.4 | % | 8.4 | % |
of which minimum Common Equity Tier 1 requirement |
| 4.5 | % | 4.5 | % |
of which Capital conservation buffer |
| 2.5 | % | 2.5 | % |
of which Countercyclical Buffer |
| 1.4 | % | 1.4 | % |
of which Systemic Risk Buffer |
| — |
| — |
|
Common Equity Tier 1 capital available to meet buffers4 |
| 14.2 | % | 14.6 | % |
Total capital ratio according to Basel I floor |
| n.a. |
| 21.9 | % |
1 Capital ratios excl. of buffer requirements are the quotients of the relevant capital measure and the total risk exposure amount. The minimum requirements according to CRR (Regulation (EU) No 575/2013 of the European Parliament and of the Council of June 26, 2013 on prudential requirements for credit institutions and investment firms and amending Regulation (EU) No 648/2012) have fully come into force in Sweden without regard to the transitional period. The minimum requirements are 4.5 percent, 6.0 percent and 8.0 percent related to Common Equity Tier 1 capital, Tier 1 capital and total Own Funds respectively.
2 The reduction in Total capital ratio is mainly due to the fact that the Tier 2 capital is no longer included in Own funds. See footnote 1 in the table “Own funds - Adjusting items” below.
3 Expressed as a percentage of total risk exposure amount.
4 Common Equity Tier 1 capital ratio as reported less minimum requirement of 4.5 percent (excluding buffer requirements) and less 1.5 percent, consisting of Common Equity Tier 1 used to meet the Tier 1 requirements, since SEK does not have any Additional Tier 1 capital.
For further information on capital adequacy and risks, see the section entitled “Risk and capital management” in SEK’s 2017 Annual Report.
Own funds — Adjusting items
Skr mn |
| June 30, 2018 |
| December 31, 2017 |
|
Share capital |
| 3,990 |
| 3,990 |
|
Retained earnings |
| 13,754 |
| 12,782 |
|
Accumulated other comprehensive income and other reserves |
| -278 |
| 30 |
|
Independently reviewed profit net of any foreseeable charge or dividend |
| 218 |
| 540 |
|
Common Equity Tier 1 (CET1) capital before regulatory adjustments |
| 17,684 |
| 17,342 |
|
Additional value adjustments due to prudent valuation |
| -475 |
| -396 |
|
Intangible assets |
| -54 |
| -66 |
|
Fair value reserves related to gains or losses on cash flow hedges |
| -15 |
| -25 |
|
Gains or losses on liabilities valued at fair value resulting from changes in own credit standing |
| 259 |
| 446 |
|
Negative amounts resulting from the calculation of expected loss amounts |
| -129 |
| -65 |
|
Total regulatory adjustments to Common Equity Tier 1 capital |
| -414 |
| -106 |
|
Total Common Equity Tier 1 capital |
| 17,270 |
| 17,236 |
|
Additional Tier 1 capital |
| — |
| — |
|
Total Tier 1 capital |
| 17,270 |
| 17,236 |
|
Tier 2-eligible subordinated debt1 |
| — |
| 2,049 |
|
Credit risk adjustments2 |
| — |
| — |
|
Total Tier 2 capital |
| — |
| 2,049 |
|
Total Own funds |
| 17,270 |
| 19,285 |
|
Total Own funds according to Basel I floor |
| n.a. |
| 19,350 |
|
1 SEK has received permission from its competent authority (Swedish FSA) to call itsTier 2 eligible subordinated debt instrument in accordance with its terms. As a result of the permission from Swedish FSA, SEK were required to reduce the level of own funds by the outstanding principal amount of the instrument. If the Board of directors of SEK decides not to call the instrument , the outstanding principal amount of the instrument will be reinstated to own funds and Tier 2 capital.
2 Expected loss amount calculated according to the IRB approach is a gross deduction from Own funds. The gross deduction is decreased by impairment related to exposure ratios for which expected loss is calculated. Excess amounts of such impairment will increase Own funds. This increase is limited to 0.6 percent of SEK’s risk exposure amount according to the IRB approach related to exposures to central governments, corporates and financial institutions. As of June 30, 2018, the limitation rule has not had any effect (year-end 2017: no effect).
Minimum capital requirements exclusive of buffer
|
| June 30, 2018 |
| December 31, 2017 |
| ||||||||
Skr mn |
| EAD1 |
| Risk exposure |
| Minimum |
| EAD1 |
| Risk exposure |
| Minimum |
|
Credit risk standardized method |
|
|
|
|
|
|
|
|
|
|
|
|
|
Corporates |
| 1,539 |
| 1,539 |
| 123 |
| 1,316 |
| 1,316 |
| 105 |
|
Total credit risk standardized method |
| 1,539 |
| 1,539 |
| 123 |
| 1,316 |
| 1,316 |
| 105 |
|
|
|
|
|
|
|
|
|
|
|
|
|
|
|
Credit risk IRB method |
|
|
|
|
|
|
|
|
|
|
|
|
|
Central Governments |
| 173,572 |
| 9,881 |
| 791 |
| 161,429 |
| 9,331 |
| 747 |
|
Financial institutions2 |
| 31,135 |
| 9,463 |
| 757 |
| 38,163 |
| 12,688 |
| 1,015 |
|
Corporates 3 |
| 113,882 |
| 57,953 |
| 4,636 |
| 104,630 |
| 53,763 |
| 4,301 |
|
Assets without counterparty |
| 114 |
| 114 |
| 9 |
| 121 |
| 121 |
| 10 |
|
Total credit risk IRB method |
| 318,703 |
| 77,411 |
| 6,193 |
| 304,343 |
| 75,903 |
| 6,073 |
|
|
|
|
|
|
|
|
|
|
|
|
|
|
|
Credit valuation adjustment risk |
| n.a. |
| 2,056 |
| 164 |
| n.a. |
| 1,989 |
| 159 |
|
Foreign exchange risk |
| n.a. |
| 1,006 |
| 81 |
| n.a. |
| 1,326 |
| 106 |
|
Commodities risk |
| n.a. |
| 11 |
| 1 |
| n.a. |
| 13 |
| 1 |
|
Operational risk |
| n.a. |
| 3,284 |
| 263 |
| n.a. |
| 3,284 |
| 263 |
|
Total |
| 320,242 |
| 85,307 |
| 6,825 |
| 305,659 |
| 83,831 |
| 6,707 |
|
Adjustment according to Basel I floor |
| n.a. |
| n.a. |
| n.a. |
| n.a. |
| 4,503 |
| 360 |
|
Total incl. Basel I floor |
| n.a. |
| n.a. |
| n.a. |
| n.a. |
| 88,334 |
| 7,067 |
|
1 Exposure at default (EAD) shows the size of the outstanding exposure at default.
2 Of which counterparty risk in derivatives: EAD Skr 4,396 million (year-end 2017: Skr 4,131 million), Risk exposure amount of Skr 1,622 million (year-end 2017: Skr 1,574 million) and Capital requirement of Skr 130 million (year-end 2017: Skr 126 million).
3 Of which related to specialized lending: EAD Skr 3,715 million (year-end 2017: Skr 2,478 million), Risk exposure amount of Skr 2,438 million (year-end 2017: Skr 1,643 million) and Capital requirement of Skr 195 million (year-end 2017: Skr 131 million).
Credit risk
For risk classification and quantification of credit risk, SEK uses the IRB approach. Specifically, SEK applies the Foundation Approach. Under the Foundation Approach, the company determines the probability of default within one year (PD) for each of its counterparties, while the remaining parameters are established in accordance with CRR. The Swedish FSA has approved SEK’s IRB approach. Certain exposures are, by permission from the Swedish FSA, exempted from application of the IRB approach, and, instead, the standardized approach is applied. Counterparty risk exposure amounts in derivatives are calculated in accordance with the mark-to-market method.
Credit valuation adjustment risk
Credit valuation adjustment risk is calculated for all over-the-counter derivative contracts, except for credit derivatives used as credit protection and transactions with a qualifying central counterparty. SEK calculates this capital requirement according to the standardized method.
Foreign exchange risk
Foreign exchange risk is calculated according to the standardized approach, whereas the scenario approach is used for calculating the gamma and volatility risks.
Commodities risk
Capital requirements for commodity risk are calculated in accordance with the simplified approach under the standardized approach. The scenario approach is used for calculating the gamma and volatility risks.
Operational risk
Capital requirement for operational risk is calculated according to the standardized approach. The company’s operations are divided into business areas as defined in the CRR. The capital requirement for each area is calculated by multiplying a factor depending on the business area by an income indicator. The factors applicable for SEK are 15 percent and 18 percent. The income indicators consist of the average operating income for the past three financial years for each business area.
Transitional rules
On January 1, 2018, capital requirements and reporting applicable to the Basel I floor ceased to apply. The Basel I floor constituted a minimum capital requirement introduced as a transitional rule in 2007 that was valid until 2017.
Capital buffer requirements
SEK expects to meet capital buffer requirements with Common Equity Tier 1 capital. The mandatory capital conservation buffer is 2.5 percent. The countercyclical buffer rate that is applied to exposures located in Sweden was increased from 1.5 percent to 2.0 percent as of March 19, 2017. As of June 30, 2018, the capital requirement related to relevant exposures in Sweden is 68 percent (year-end 2017: 67 percent) of the total relevant capital requirement regardless of location; this fraction is also the weight applied on the Swedish buffer rate when calculating SEK’s countercyclical capital buffer. Buffer rates applicable in other countries may have effects on SEK, but as most capital requirements for SEK’s relevant credit exposures are related to Sweden, the potential effect is limited. As of June 30, 2018, the contribution to SEK’s countercyclical buffer from buffer rates in other countries was 0.07 percentage points (year-end 2017: 0.05 percentage points). SEK has not been classified as a systemically important institution by any financial regulatory authority. The capital buffer requirements for systemically important institutions that came into force January 1, 2016 therefore do not apply to SEK.
Leverage Ratio
Skr mn |
| June 30, 2018 |
| December 31, 2017 |
|
Exposure measure for the leverage ratio |
|
|
|
|
|
On-balance sheet exposures |
| 271,799 |
| 249,244 |
|
Off-balance sheet exposures |
| 39,500 |
| 42,168 |
|
Total exposure measure |
| 311,299 |
| 291,412 |
|
Leverage ratio |
| 5.5 | % | 5.9 | % |
The leverage ratio is defined by CRR as the quotient of the Tier 1 capital and an exposure measure. Currently there is no minimum requirement for the leverage ratio.
Internally assessed economic capital excl. buffer
Skr mn |
| June 30, 2018 |
| December 31, 2017 |
|
Credit risk |
| 7,064 |
| 6,898 |
|
Operational risk |
| 142 |
| 142 |
|
Market risk |
| 1,118 |
| 1,573 |
|
Other risks |
| 175 |
| 170 |
|
Capital planning buffer |
| 1,966 |
| 2,005 |
|
Total |
| 10,465 |
| 10,788 |
|
SEK regularly conducts an internal capital adequacy assessment process, during which the company determines how much capital is needed in order to cover its risks. The result of SEK’s assessment of capital adequacy is presented above. For more information regarding the internal capital adequacy assessment process and its methods, please see the Risk and Capital management section of SEK’s 2017 Annual Report.
Note 10. Exposures
Net exposures are reported after taking into consideration effects of guarantees and credit default swaps. Amounts are calculated in accordance with capital adequacy calculations, but before the application of credit conversion factors.
Total net exposures
Skr bn |
| Credits & interest-bearing securitites |
| Undisbursed credits, |
| Total |
| ||||||||||||||||||
Classified by type of |
| June 30, 2018 |
| December 31, 2017 |
| June 30, 2018 |
| December 31, 2017 |
| June 30, 2018 |
| December 31, 2017 |
| ||||||||||||
counterparty |
| Amount |
| % |
| Amount |
| % |
| Amount |
| % |
| Amount |
| % |
| Amount |
| % |
| Amount |
| % |
|
Central governments |
| 110.0 |
| 41.1 |
| 97.1 |
| 39.6 |
| 58.0 |
| 81.6 |
| 70.0 |
| 85.1 |
| 168.0 |
| 49.6 |
| 167.1 |
| 51.1 |
|
Regional governments |
| 19.8 |
| 7.4 |
| 11.4 |
| 4.7 |
| — |
| — |
| — |
| — |
| 19.8 |
| 5.8 |
| 11.4 |
| 3.5 |
|
Multilateral development banks |
| 0.1 |
| 0.0 |
| 0.0 |
| 0.0 |
| 0.0 |
| 0.0 |
| — |
| — |
| 0.1 |
| 0.0 |
| 0.0 |
| 0.0 |
|
Public Sector Entity |
| 0.2 |
| 0.1 |
| 0.4 |
| 0.2 |
| — |
| — |
| — |
| — |
| 0.2 |
| 0.1 |
| 0.4 |
| 0.1 |
|
Financial institutions |
| 25.8 |
| 9.6 |
| 32.7 |
| 13.3 |
| 5.7 |
| 8.0 |
| 5.9 |
| 7.2 |
| 31.5 |
| 9.3 |
| 38.6 |
| 11.8 |
|
Corporates |
| 111.6 |
| 41.8 |
| 103.4 |
| 42.2 |
| 7.4 |
| 10.4 |
| 6.3 |
| 7.7 |
| 119.0 |
| 35.2 |
| 109.7 |
| 33.5 |
|
Total |
| 267.5 |
| 100.0 |
| 245.0 |
| 100.0 |
| 71.1 |
| 100.0 |
| 82.2 |
| 100.0 |
| 338.6 |
| 100.0 |
| 327.2 |
| 100.0 |
|
Net exposure by region and exposure class, as of June 30, 2018
Skr bn |
| Middle |
| Asia excl. |
| Japan |
| North |
| Oceania |
| Latin |
| Sweden |
| West |
| Central- |
| Total |
|
Central governments |
| — |
| 0.7 |
| 2.6 |
| 2.3 |
| — |
| 0.9 |
| 146.3 |
| 12.0 |
| 3.2 |
| 168.0 |
|
Regional governments |
| — |
| — |
| — |
| — |
| — |
| — |
| 19.5 |
| 0.3 |
| — |
| 19.8 |
|
Multilateral development banks |
| — |
| — |
| — |
| — |
| — |
| — |
| — |
| 0.1 |
| — |
| 0.1 |
|
Public Sector Entity |
| — |
| — |
| — |
| — |
| — |
| — |
| — |
| 0.2 |
| — |
| 0.2 |
|
Financial institutions |
| — |
| 2.5 |
| 0.4 |
| 6.4 |
| 1.2 |
| 0.4 |
| 6.8 |
| 13.5 |
| 0.3 |
| 31.5 |
|
Corporates |
| 4.6 |
| 3.2 |
| 2.6 |
| 4.2 |
| — |
| 3.3 |
| 79.7 |
| 21.3 |
| 0.1 |
| 119.0 |
|
Total |
| 4.6 |
| 6.4 |
| 5.6 |
| 12.9 |
| 1.2 |
| 4.6 |
| 252.3 |
| 47.4 |
| 3.6 |
| 338.6 |
|
Net exposure by region and exposure class, as of December 31, 2017
Skr bn |
| Middle |
| Asia excl. |
| Japan |
| North |
| Oceania |
| Latin |
| Sweden |
| West |
| Central- |
| Total |
|
Central governments |
| — |
| 0.7 |
| 4.0 |
| 2.4 |
| — |
| 0.9 |
| 145.1 |
| 10.9 |
| 3.1 |
| 167.1 |
|
Regional governments |
| — |
| — |
| — |
| — |
| — |
| — |
| 11.2 |
| 0.2 |
| — |
| 11.4 |
|
Multilateral development banks |
| — |
| — |
| — |
| — |
| — |
| — |
| — |
| 0.0 |
| — |
| 0.0 |
|
Public Sector Entity |
| — |
| — |
| — |
| — |
| — |
| — |
| — |
| 0.4 |
| — |
| 0.4 |
|
Financial institutions |
| — |
| 3.0 |
| 0.5 |
| 9.6 |
| 1.2 |
| 1.1 |
| 6.9 |
| 16.0 |
| 0.3 |
| 38.6 |
|
Corporates |
| 4.9 |
| 3.6 |
| 1.7 |
| 2.9 |
| — |
| 3.3 |
| 72.2 |
| 21.0 |
| 0.1 |
| 109.7 |
|
Total |
| 4.9 |
| 7.3 |
| 6.2 |
| 14.9 |
| 1.2 |
| 5.3 |
| 235.4 |
| 48.5 |
| 3.5 |
| 327.2 |
|
Net exposure European countries, excluding Sweden
Skr bn |
| June 30, 2018 |
| December 31, 2017 |
|
France |
| 10.7 |
| 10.3 |
|
United Kingdom |
| 7.7 |
| 7.7 |
|
Norway |
| 6.2 |
| 6.2 |
|
Finland |
| 6.2 |
| 7.1 |
|
Denmark |
| 3.9 |
| 4.8 |
|
Germany |
| 3.3 |
| 4.7 |
|
Poland |
| 3.2 |
| 3.1 |
|
Spain |
| 2.5 |
| 2.6 |
|
The Netherlands |
| 2.5 |
| 2.6 |
|
Switzerland |
| 1.0 |
| 0.5 |
|
Luxembourg |
| 1.0 |
| 0.4 |
|
Austria |
| 0.9 |
| 0.1 |
|
Belgium |
| 0.8 |
| 0.9 |
|
Ireland |
| 0.4 |
| 0.4 |
|
Latvia |
| 0.2 |
| 0.2 |
|
Iceland |
| 0.2 |
| 0.2 |
|
Italy |
| 0.1 |
| 0.1 |
|
Russia |
| 0.1 |
| 0.1 |
|
Estonia |
| 0.1 |
| 0.1 |
|
Hungary |
| 0.0 |
| 0.0 |
|
Total |
| 51.0 |
| 52.1 |
|
Note 11. Transactions with related parties
Transactions with related parties are described in Note 28 in SEK’s 2017 Annual Report. No material changes have taken place in relation to transactions with related parties compared to the descriptions in SEK’s 2017 Annual Report.
Note 12. Events after the reporting period
No events with significant impact on the information in this report have occurred after the end of the reporting period.
The Board of Directors and the Chief Executive Officer confirm that this Interim report provides a fair overview of the Parent Company’s and the Consolidated Group’s operations and their respective financial position and results, and describes material risks and uncertainties facing the Parent Company and other companies in the Consolidated Group.
Stockholm, July 17, 2018
AB SVENSK EXPORTKREDIT
SWEDISH EXPORT CREDIT CORPORATION
Lars Linder-Aronson |
| Cecilia Ardström |
| Anna Brandt |
Chairman of the Board |
| Director of the Board |
| Director of the Board |
Reinhold Geijer |
| Hans Larsson |
| Eva Nilsagård |
Director of the Board |
| Director of the Board |
| Director of the Board |
Ulla Nilsson |
| Hélène Westholm |
Director of the Board |
| Director of the Board |
Catrin Fransson
Chief Executive Officer
SEK has established the following expected dates for the publication of financial information and other related matters:
October 23, 2018 | Interim Report for the period January 1, 2018 – September 30, 2018 |
January 31, 2019 | Year-end Report for the period January 1, 2018 – December 31, 2018 |
The report contains information that SEK will disclose pursuant to the Securities Markets Act and/or the Financial Instruments Trading Act. The information was submitted for publication on July 17, 2018 14:00 (CEST).
Additional information about SEK, including investor presentations and SEK’s 2017 Annual Report, is available at www.sek.se. Information available on or accessible through SEK’s website is not incorporated herein by reference.
Definitions
Alternative performance measures (see *)
Alternative performance measures (APMs) are key performance indicators that are not defined under IFRS or in the Capital Requirements Directive IV (CRD IV) or in regulation (EU) No. 575/2013 on prudential requirements for credit institutions and investment firms (CRR). SEK has chosen to present these, either because they are in common use within the industry or because they accord with SEK’s assignment from the Swedish government. The APMs are used internally to monitor and manage operations, and are not considered to be directly comparable with similar key performance indicators presented by other companies. For additional information regarding the APMs, refer to www.sek.se.
*After-tax return on equity
Net profit, expressed as a percentage per annum of the current year’s average equity (calculated using the opening and closing balances for the report period).
*Average interest-bearing assets
The total of cash and cash equivalents, treasuries/government bonds, other interest-bearing securities except loans, loans in the form of interest-bearing securities, loans to credit institutions and loans to the public. Calculated using the opening and closing balances for the report period.
*Average interest-bearing liabilities
The total of outstanding senior debt and subordinated securities issued. Calculated using the opening and closing balances for the report period.
Basic and diluted earnings per share (Skr)
Net profit divided by the average number of shares, which amounted to 3,990,000 for each period.
*CIRR loans as percentage of new lending
The proportion of officially supported export credits (CIRR) of new lending.
CIRR-system
The CIRR-system comprises of the system of officially supported export credits (CIRR).
Common Equity Tier 1 capital ratio
The capital ratio is the quotient of total common equity tier 1 capital and the total risk exposure amount.
Large companies
Companies with an annual turnover of more than Skr 5 billion.
Leverage ratio
Tier 1 capital expressed as a percentage of the exposure measured under CRR (refer to Note 9).
Liquidity coverage ratio (LCR)
The liquidity coverage ratio is a liquidity metric that shows SEK’s highly liquid assets in relation to the company’s net cash outflows for the next 30 calendar days. An LCR of 100 percent means that the company’s liquidity reserve is of sufficient size to enable the company to manage stressed liquidity outflows over a period of 30 days. Unlike the Swedish FSA’s rules, the EU rules take into account the outflows that correspond to the need to pledge collateral for derivatives that would arise as a result of the effects of a negative market scenario.
Loans
Lending pertains to all credit facilities provided in the form of interest-bearing securities, and credit facilities granted by traditional documentation. SEK considers these amounts to be useful measurements of SEK’s lending volumes. Accordingly, comments on lending volumes in this report pertain to amounts based on this definition.
*Loans, outstanding and undisbursed
The total of loans in the form of interest-bearing securities, loans to credit institutions, loans to the public and loans, outstanding and undisbursed. Deduction is made for cash collateral under the security agreements for derivative contracts and deposits with time to maturity exceeding three months (see the Statement of Financial Position and Note 8).
Medium-sized companies
Companies with an annual turnover between Skr 500 million and Skr 5 billion, inclusive.
Net stable funding ratio (NSFR)
This ratio measures stable funding in relation to the company’s illiquid assets over a one-year, stressed scenario in accordance with Basel III.
*New lending
New lending includes all new committed loans, irrespective of tenor. Not all new lending is reported in the Consolidated Statement of Financial Position and the Consolidated Statement of Cash Flows since certain portions comprise committed undisbursed loans (see Note 8). The amounts reported for committed undisbursed loans may change when presented in the Consolidated Statement of Financial Position due to changes in exchange rates, for example.
*New long-term borrowings
New borrowings with maturities exceeding one year, for which the amounts are based on the trade date.
*Outstanding senior debt
The total of borrowing from credit institutions, borrowing from the public and senior securities issued.
Own credit risk
Net fair value change due to credit risk on financial liabilities designated as at fair value through profit or loss.
Repurchase and redemption of own debt
The amounts are based on the trade date.
Swedish exporters
SEK’s clients that directly or indirectly promote Swedish export.
Tier 1 capital ratio
The capital ratio is the quotient of total tier 1 capital and the total risk exposure amount.
Total capital ratio
The capital ratio is the quotient of total Own funds and the total risk exposure amount.
Unless otherwise stated, amounts in this report are in millions (mn) of Swedish kronor (Skr), abbreviated “Skr mn” and relate to the group consisting of the Parent Company and its consolidated subsidiary (together, the “Group” or the “Consolidated Group”). AB Svensk Exportkredit (SEK), is a Swedish corporation with the identity number 556084-0315, and with its registered office in Stockholm, Sweden. SEK is a public limited liability company as defined in the Swedish Companies Act. In some instances, under Swedish law, a public company is obliged to add “(publ.)” to its company name.
About SEK
About SEK, AB Svensk Exportkredit
SEK was founded back in 1962 and is currently owned by the Swedish state. Around 260 employees are based at the head office in Stockholm. In addition, SEK has an office in Gothenburg that is shared with the Swedish Export Credits Guarantee Board (EKN) and Business Sweden.
SEK’s mission | Our mission is to ensure access to financial solutions for the Swedish export industry on commercial and sustainable terms. The mission includes making available the officially supported CIRR system, in other words, fixed-interest export credits. |
|
|
SEK’s vision | Our vision is to strengthen the competitiveness of the Swedish export industry and, thereby to help create employment and sustainable growth in Sweden. |
|
|
SEK’s core values | We are governed by our core values: Solution orientation, Collaboration and Professionalism. |
|
|
SEK’s clients | Our clients can be found in the Swedish export industry. We finance companies with operations that are linked to Swedish interests and exports. Clients are found among large to medium-sized companies and their foreign buyers of Swedish products and services. |
|
|
SEK’s partnerships | Through Team Sweden, we have close partnerships with other export promotion agencies in Sweden such as EKN, Business Sweden, Almi and Swedfund. Our international network is substantial and we also work together with numerous Swedish and international banks. |