UNITED STATES
SECURITIES AND EXCHANGE COMMISSION
Washington, D.C. 20549
FORM 6-K
Report of Foreign Private Issuer
Pursuant to Rule 13a-16 or 15d-16 under
the Securities Exchange Act of 1934
Dated July 15, 2022.
Commission File Number
001-08382
Aktiebolaget Svensk Exportkredit
Swedish Export Credit Corporation
(Translation of Registrant’s Name into English)
Fleminggatan 20
P.O. Box 194
SE-112 26 Stockholm
Sweden
(Address of Principal Executive Offices)
Indicate by check mark whether the registrant files or will file annual reports under cover Form 20-F or Form 40-F.
| |
Form 20-F ☒ | Form 40-F ☐ |
Indicate by check mark if the registrant is submitting the Form 6-K in paper as permitted by Regulation S-T Rule 101(b)(1): N/A
Indicate by check mark if the registrant is submitting the Form 6-K in paper as permitted by Regulation S-T Rule 101(b)(7): N/A
Indicate by check mark whether by furnishing the information contained in this Form, the registrant is also thereby furnishing the information to the Commission pursuant to Rule 12g3-2(b) under the Securities Exchange Act of 1934.
| |
Yes ☐ | No ☒ |
If “Yes” is marked, indicate below the file number assigned to the registrant in connection with Rule 12g3-2(b): N/A
Incorporation by Reference
This Report on Form 6-K, including the exhibits hereto, is hereby incorporated by reference, in its entirety, into the registration statement on Form F-3 (File No. 333-249829) of Aktiebolaget Svensk Exportkredit (publ) (“SEK”).
This Report comprises the following:
1. |
| Registrant’s report for the second quarter of 2022. |
| | |
Exhibit 99.2 | | Table of unaudited consolidated capitalization of the Registrant. |
| | |
101.INS | | XBRL Instance Document. |
| | |
101.SCH | | XBRL Taxonomy Extension Schema Document. |
| | |
101.CAL | | XBRL Taxonomy Extension Calculation Linkbase Document. |
| | |
101.DEF | | XBRL Taxonomy Extension Definition Linkbase Document. |
| | |
101.LAB | | XBRL Taxonomy Extension Labels Linkbase Document. |
| | |
101.PRE | | XBRL Taxonomy Extension Presentation Linkbase Document. |
1
SIGNATURE
Pursuant to the requirements of the Securities Exchange Act of 1934, the Registrant has duly caused this Report to be signed on its behalf by the undersigned, thereunto duly authorized.
Dated: July 15, 2022
| AB Svensk Exportkredit | |
|
| |
| (Swedish Export Credit Corporation) | |
|
| |
| By: | /s/ Magnus Montan |
|
|
|
|
| Magnus Montan, Chief Executive Officer |
3
| AB Svensk Exportkredit |

January-June 2022
(Compared to the period January-June 2021)
● | Net interest income Skr 990 million (1H21: Skr 953 million) |
● | Operating profit Skr 361 million (1H21: Skr 603 million) |
● | Net profit Skr 287 million (1H21: Skr 479 million) |
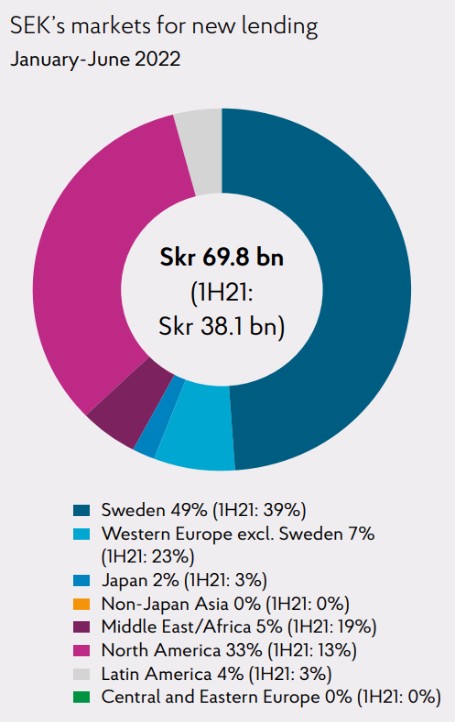
● | New lending Skr 69.8 billion (1H21: Skr 38.1 billion) |
● | New green lending1 Skr 6.4 billion (1H21: -) |
● | New green borrowing Skr 9.0 billion (1H21: 4.0 billion) |
● | Basic and diluted earnings per share Skr 72 (1H21: Skr 120) |
● | After-tax return on equity 2.8 percent (1H21: 4.8 percent) |
April-June 2022
(Compared to the period April-June 2021)
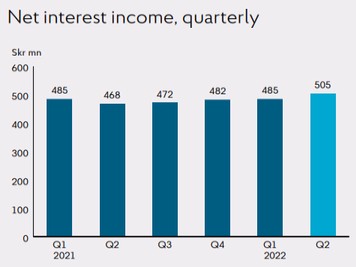
● | Net interest income Skr 505 million (2Q21: Skr 468 million) |
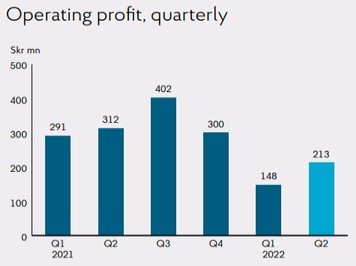
● | Operating profit Skr 213 million (2Q21: Skr 312 million) |
● | Net profit Skr 171 million (2Q21: Skr 248 million) |
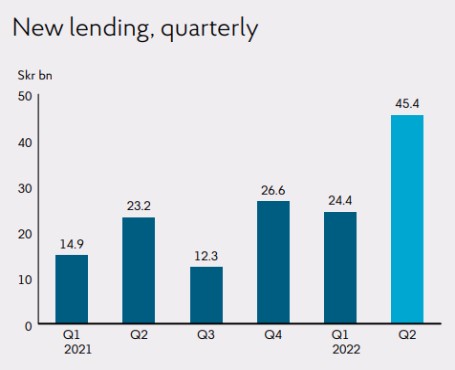
● | New lending Skr 45.4 billion (2Q21: Skr 23.2 billion) |
● | New green lending1 Skr 5.5 billion (2Q21: -) |
● | New green borrowing Skr 7.5 billion (2Q21: 1.6 billion) |
● | Basic and diluted earnings per share Skr 43 (2Q21: Skr 62) |
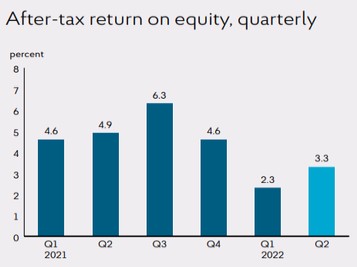
● | After-tax return on equity 3.3 percent (2Q21: 4.9 percent) |
Equity and balances
(Compared to December 31, 2021)
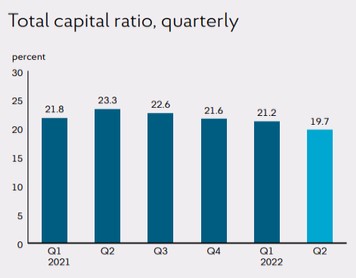
● | Total capital ratio 19.7 percent (year-end 2021: 21.6 percent) |
● | Total assets Skr 360.9 billion (year-end 2021: Skr 333.6 billion) |
● | Loans, outstanding and undisbursed Skr 330.8 billion (year-end 2021: Skr 291.1 billion) |
1 | New key performance indicator to which there is no comparative historical information. |
SEK plays an increasingly important role in times of economic turbulence
Russia’s invasion of Ukraine and the subsequent war between the two countries, which has now been ongoing for four months, continued to impact the world economy in significant ways in the second quarter. Human suffering and refugee flows caused by the war continue to increase and we join the international community in condemning the invasion.
SEK provides stable financing to Sweden’s export industry and we remain strong in these troubled times. Our business is expanding amidst increased uncertainty and a deteriorating macroeconomic outlook. In this year’s second quarter, we posted strong net interest income of Skr 505 million and a high volume of new lending at Skr 45.4 billion. Year-on-year, net interest income increased 8 percent despite a negative risk tax effect of Skr 27 million, and new lending increased 96 percent. We have noted a substantial increase in demand for working capital finance from Swedish exporters as well as demand for export credits, relating primarily to Swedish exports in the telecom sector. To meet the increased demand for financing, we raised EUR 700 million during the quarter through a green bond offering under our new sustainability bond framework. Our strong position as an issuer in the global market helps provide Sweden’s export industry with access to stable and secure financing despite difficult market conditions.
For the second quarter, we posted a return on equity after tax of 3.3 percent and a net profit of Skr 171 million. The lower net profit compared to the first six months of the previous year is the result of unrealized valuation effects of financial instruments, which have had a negative impact on the net result of financial transactions. The negative valuation effects are expected to decrease as the instruments mature.
Following a strong first quarter, we posted net interest income of Skr 990 million for the first six months, up 4 percent compared to the first half of 2021. At the same time, we reached a new lending volume for the first six months of Skr 69.8 billion, up 83 percent on the first half of 2021. Taking into account the negative impact of unrealized valuation effects of financial instruments, return on equity after tax in the first half of the year was 2.8 percent.
We are strongly capitalized with good liquidity and we remain ready to continue to meet Sweden’s export industry’s financing needs during a period of increased uncertainty and turbulent capital markets.
| ||
Magnus Montan Chief Executive Officer |

High demand for financing from SEK
SEK’s mission to provide financing solutions for Sweden’s export industry becomes increasingly important in times of great uncertainty. The high new lending volumes noted in the first quarter continued through the second quarter. SEK achieved a higher new lending volume for the first six months of 2022 amounting to Skr 69.8 billion, up 83 percent year-on-year. From a historical perspective, these high lending volumes can only be compared with new lending volumes in the first six months of 2009 (the financial crisis) and 2020 (COVID-19 pandemic). The company posted growth of nearly 11 percent in its total lending in the first six months of the year.
The high new lending volumes stem both from high demand for working capital finance from Swedish exporters as well as from major export credits to the United States and Africa. In the United States, SEK has supported exports of telecom equipment from Ericsson. In Africa, SEK has, together with the Swedish Export Credit Agency (EKN) and international banks, financed a major maternity clinic at a hospital in Ghana’s capital, Accra. The financing is a result of the investments in major international projects conducted by the Swedish government’s Team Sweden initiative and which, in this case, led to increased exports for some 40 Swedish exporters.
SEK’s focus on increasing its client portfolio and on being able to offer access to Sweden’s export credit system to more Swedish companies has been highly successful in the first six months of the year. SEK achieved a 4.8 percent increase in the number of clients, which is in line with this year’s target of a 10 percent increase.
| | | | | | |
SEK's new lending | ||||||
Skr bn |
| Jan-Jun 2022 |
| Jan-Jun 2021 |
| Jan-Dec 2021 |
Lending to Swedish exporters1 |
| 27.5 |
| 10.7 |
| 25.1 |
Lending to exporters’ customers2 |
| 42.3 |
| 27.4 |
| 51.9 |
Total |
| 69.8 |
| 38.1 |
| 77.0 |
of which green lending3 | | 9% | | — | | 15% |
of which CIRR-loans |
| 21% | | 24% | | 15% |
1 | Of which Skr 6.1 billion (1H21: Skr 0.7 billion; year-end 2021: Skr 2.6 billion) had not been disbursed at period end. |
2 | Of which Skr 14.1 billion (1H21: Skr 11.1 billion; year-end 2021: Skr 18.6 billion) had not been disbursed at period end. |
3 | New key performance indicator to which there is no comparative historical information. |

| |
Interim report January–June 2022 | Page 4 of 29 |

Successful EUR issue under new sustainability framework
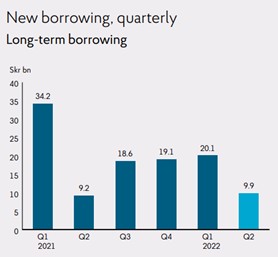
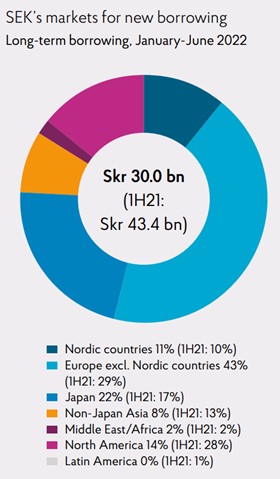
The operating environment continues to be characterized by uncertainty and demand for financing from SEK is increasing. SEK has a good reputation in the global markets and has had good access to financing in the first six months of 2022. Despite difficult market conditions, SEK has been able to meet the increased demand for financing and to remain a stable and secure financing partner for Sweden’s export industry. In the year’s first quarter, SEK substantially increased its short-term borrowing and continued to maintain a regular presence in the short-term borrowing market through the second quarter, albeit with slightly lower volumes. SEK’s new long-term borrowing, with maturities of at least one year, amounted to Skr 30 billion in the first six months of the year and new short-term borrowing totaled Skr 31 billion in the same period.
The company therefore has high liquidity for new lending and is well prepared to continue to meet the future financing needs of Sweden’s export industry, even during these turbulent times characterized by highly volatile financial markets and reduced market liquidity.
In June of this year, SEK conducted a public offering of a EUR 700 million five-year fixed-rate green bond. The bond was issued under SEK’s sustainability bond framework, which is an umbrella framework for green, social and sustainability bonds linked to the United Nations Sustainable Development Goals. The offering was well-received by investors.
SEK’s focus on increasing the share of green lending generates additional possibilities for issuing green bonds. The EUR-denominated green bond, together with the additional green bonds SEK has issued in the Swedish market in the first six months of 2022, resulted in a total volume of new green borrowing of Skr 9 billion in the first six months of 2022, up Skr 5 billion compared to the same period in 2021.
| | | | | | |
SEK's borrowing | ||||||
Skr bn |
| Jan-Jun 2022 |
| Jan-Jun 2021 |
| Jan-Dec 2021 |
New long-term borrowing |
| 30.0 |
| 43.4 |
| 81.1 |
New short-term borrowing | | 31.3 | | 1.8 | | 6.4 |
New green borrowing | | 9.0 | | 4.0 | | 6.1 |
Outstanding senior debt |
| 315.4 |
| 281.2 |
| 295.0 |
Repurchase and redemption of own debt |
| 1.0 |
| 0.8 |
| 1.5 |

| |
Interim report January–June 2022 | Page 5 of 29 |
January-June 2022
Operating profit amounted to Skr 361 million (1H21: Skr 603 million). Net profit amounted to Skr 287 million (1H21: Skr 479 million). The lower net profit compared with the same period in the previous year is explained by unrealized valuation effects of financial instruments which had a negative effect on the net results of financial transactions.
Net interest income
Net interest income amounted to Skr 990 million (1H21: Skr 953 million), representing an increase of 4 percent compared to the same period in the previous year. During the period, a weaker Swedish krona contributed to higher interest income. On January 1, 2022, a new risk tax on credit institutions was introduced in Sweden. Net interest income was negatively affected by the risk tax of Skr 54 million.
The table below shows average interest-bearing assets and liabilities.
| | | | | | |
|
| Jan-Jun |
| Jan-Jun |
| |
Skr bn, average | | 2022 | | 2021 | | Change |
Total lending |
| 250.1 |
| 226.7 |
| 10% |
Liquidity investments |
| 68.0 |
| 63.0 |
| 8% |
Interest-bearing assets |
| 329.4 |
| 306.9 |
| 7% |
Interest-bearing liabilities |
| 305.2 |
| 284.3 |
| 7% |
Net results of financial transactions
Net results of financial transactions amounted to Skr -262 million (1H21: Skr -8 million). The first half of 2022 was volatile with large movement in the market. The results are mainly attributable to unrealized value changes of financial instruments driven by cross-currency basis spreads, increased credit spreads in the liquidity portfolio and increased interest rates. The negative valuation effects are expected to decrease as the instruments mature.
Operating expenses
Operating expenses amounted to Skr -335 million (1H21: Skr -326 million), an increase of 3 percent compared to the same period in the previous year. The increase in operating expenses is mainly due to increased personnel and depreciation costs. No provision was made for the individual variable remuneration program (1H21: Skr 4 million).
Net credit losses
Net credit losses amounted to Skr -17 million (1H21: Skr 1 million). Net credit losses were mainly attributable to increased provisions for expected credit losses for exposures in stage 1 and stage 3, offset by decreased provisions for expected credit losses for exposures in stage 2, as well as recovered credit losses.
SEK’s IFRS 9 model is based on a business cycle parameter. The business cycle parameter reflects the general risk of default in each
probability of default (PD) segment and should reflect the general risk of default in the economy, see Note 4. Due to the current macroeconomic uncertainty, SEK has made an overall adjustment according to management’s assessment.
Loss allowances as of June 30, 2022, amounted to Skr -198 million compared to Skr -164 million as of December 31, 2021, of which exposures in stage 3 amounted to Skr -56 million (year-end 2021: Skr -48 million).
The provision ratio amounted to 0.06 percent (year-end 2021: 0.06 percent).
Taxes
Tax costs amounted to Skr -74 million (1H21: Skr -124 million), and the effective tax rate amounted to 20.5 percent (1H21: 20.6 percent).
Other comprehensive income (OCI)
Other comprehensive income before tax amounted to Skr 110 million (1H21: Skr 15 million). The outcome is explained by a positive result related to the changes in own credit risk due to increased credit spreads, as well as a positive result related to the revaluation of defined benefit plans that were affected by a higher discount rate.
April-June 2022
Operating profit amounted to Skr 213 million (2Q21: Skr 312 million). Net profit amounted to Skr 171 million (2Q21: Skr 248 million). The lower net profit compared with the same period in the previous year is explained by unrealized valuation effects of financial instruments which had a negative effect on the net results of financial transactions, as well as increased provisions for expected credit losses.
Net interest income
Net interest income amounted to Skr 505 million (2Q21: Skr 468 million), representing an increase of 8 percent compared to the same period in the previous year. During the second quarter, a weaker Swedish krona contributed to higher interest income. Net interest income was negatively affected by the new risk tax of Skr 27 million.
The table below shows average interest-bearing assets and liabilities.
| | | | | | |
|
| Apr-Jun |
| Apr-Jun |
| |
Skr bn, average | | 2022 | | 2021 | | Change |
Total lending |
| 254.7 |
| 229.0 |
| 11% |
Liquidity investments |
| 67.4 |
| 71.6 |
| -6% |
Interest-bearing assets |
| 332.4 |
| 312.2 |
| 6% |
Interest-bearing liabilities |
| 305.6 |
| 292.9 |
| 4% |
Net results of financial transactions
Net results of financial transactions amounted to Skr -92 million (2Q21: Skr 9 million). The second quarter was volatile and characterized by substantial movement in the financial markets. The results are primarily attributable to unrealized value changes of financial instruments driven by cross-currency basis spreads, increased credit spreads in the liquidity portfolio and increased interest rates. The negative valuation effects are expected to decrease as the instruments mature.
Operating expenses
Operating expenses amounted to Skr -173 million (2Q21: Skr -171 million), representing an increase of 1 percent compared to the same period in the previous year. The increase in operating expenses is mainly due to increased personnel costs. No provision was made for the individual variable remuneration program (2Q21: Skr 2 million).
Net credit losses
Net credit losses amounted to Skr -19 million (2Q21: Skr 13 million). Net credit losses were attributable to increased provisions for expected credit losses for exposures in stage 1 and stage 3, offset by decreased provisions for expected credit losses for exposures in stage 2, as well as recovered credit losses.
SEK’s IFRS 9 model is based on a business cycle parameter. The business cycle parameter reflects the general risk of default in each probability of default (PD) segment and should reflect the general risk of default in the economy, see Note 4. Due to the current macroeconomic uncertainty, SEK has made an overall adjustment according to management’s assessment.
Taxes
Tax costs amounted to Skr -42 million (2Q21: Skr -64 million), and the effective tax rate amounted to 19.7 percent (2Q21: 20.5 percent).
Other comprehensive income (OCI)
Other comprehensive income before tax amounted to Skr 10 million (2Q21: Skr 2 million). This outcome is explained by a positive result related to the revaluation of defined benefit plans that was affected by a higher discount rate, offset by a negative result related to the changes in own credit risk due to decreased credit spreads.
Statement of Financial Position
Total assets and liquidity investments
Total assets increased 8 percent compared to the end of 2021.
| | | | | | |
|
| June 30, |
| December 31, |
| |
Skr bn | | 2022 | | 2021 | | Change |
Total assets |
| 360.9 |
| 333.6 |
| 8% |
Liquidity investments |
| 68.0 |
| 67.9 |
| 0% |
Total lending |
| 263.0 |
| 237.2 |
| 11% |
of which green | | 22.9 | | 18.0 | | 27% |
of which CIRR-loans |
| 95.0 |
| 87.9 |
| 8% |
SEK’s total net exposures, after risk mitigation, amounted to Skr 422.9 billion as of June 30, 2022 (year-end 2021: Skr 372.5 billion). Credit exposures have increased to states, which is mainly due to new lending in the form of larger export credits that are guaranteed by EKN.
Liabilities and equity
As of June 30, 2022, the aggregate volume of available funds and shareholders’ equity exceeded the aggregate volume of loans outstanding and loans committed at all maturities. SEK considers all of its outstanding commitments to be covered through maturity.
SEK has a credit facility in place with the Swedish National Debt Office of up to Skr 175 billion. The credit facility can be utilized when the Swedish export industry’s demand for financing is particularly high.
Capital adequacy
As of June 30, 2022, SEK’s total own funds amounted to Skr 20.1 billion (year-end 2021: Skr 19.9 billion). The total capital ratio was 19.7 percent (year-end 2021: 21.6 percent), representing a margin of 4.0 percentage points above SEK’s estimate of Finansinspektionen’s (the “Swedish FSA”) requirement of 15.7 percent as of June 30, 2022. The corresponding Common Equity Tier 1 capital estimated requirement was 10.6 percent. Given that SEK’s own funds are comprised solely of Common Equity Tier 1 capital, this total capital ratio represents a margin of 9.1 percentage points above the requirement. Overall, SEK is strongly capitalized and has healthy liquidity.
| |
Interim report January–June 2022 | Page 7 of 29 |
| | | | |
|
| June 30, |
| December 31, |
Percent | | 2022 | | 2021 |
Common Equity Tier 1 capital ratio |
| 19.7 |
| 21.6 |
Tier 1 capital ratio |
| 19.7 |
| 21.6 |
Total capital ratio |
| 19.7 |
| 21.6 |
Leverage ratio |
| 8.5 |
| 9.3 |
Liquidity coverage ratio (LCR) |
| 597 |
| 463 |
Net stable funding ratio (NSFR) |
| 122 |
| 139 |
Rating
| | | | |
|
| Skr |
| Foreign currency |
Moody’s |
| Aa1/Stable |
| Aa1/Stable |
Standard & Poor’s |
| AA+/Stable |
| AA+/Stable |
Other events
At SEK’s annual general meeting on March 24, 2022, Lars LinderAronson stepped down from his position as Chairman of the Board of Directors of SEK (the “Board”) and Lennart Jacobsen was elected as new Chairman of the Board. Hans Larsson stepped down from his position as member of the Board, and three new members were elected: Håkan Berg, Katarina Ljungqvist and Paula da Silva. A resolution was passed at the annual general meeting to adopt the income statement and balance sheet in SEK’s Annual Report 2021 on Form 20-F, and to appropriate distributable funds pursuant to the Board’s proposal.
SEK’s Deputy CEO Per Åkerlind is retiring and no new Deputy CEO will be appointed.
During the first half of the year, the Head of Sustainability and new Chief Information Officer positions were filled. Further changes in SEK’s executive management will take effect after the summer when SEK’s Chief Risk Officer will leave the company, and the new Chief Human Resources and Head of International Financing will take up their respective positions.
The macro environment
In the first quarter of 2022, Sweden’s GDP increased 0.8 percent compared with the previous quarter. Exports rose 1.0 percent, with exports both of services and of goods contributing to the increase. Unemployment amounted to 7.6 percent at the end of the first quarter of 2022, down 1.5 percentage points compared to the first quarter of 2021. The rate of inflation in May 2022 was 7.2 percent, which represented an increase from April 2022 when the rate of inflation was 6.4 percent. The inflation rate is increasing significantly due to sharply rising food prices. The Riksbank (Sweden’s Central Bank) has raised the repo rate on two occasions in 2022 by a total of 75 basis points and further hikes to the repo rate are expected. High inflation together with significantly increasing energy prices and continued disruptions in logistics and distribution chains contribute to expectations of continued interest rate hikes. A higher repo rate positively impacts SEK’s net interest income. The company anticipates that higher market interest rates will have a limited impact on its clients and, therefore, a limited indirect impact on SEK.
SEK believes that there is a higher-than-normal level of risk factors in the financial markets that affect the company. SEK believes that information security threats, particularly cyber security, have increased, partly as a consequence of Sweden supporting Ukraine against Russia’s invasion. Some increase in the spread of COVID-19 and local outbreaks entail an increased likelihood of continued disruptions in some supply chains. Russia’s invasion of Ukraine in February has escalated into a full-scale war causing substantial human suffering. Moreover, the war is fueling inflation and the overall likelihood of a recession has increased. The war has little direct financial impact on SEK. The company has very low lending in Russia and no lending in Ukraine or Belarus. However, the high level of uncertainty may have a more long-term effect on our customers and, therefore, on SEK.
The western world has gradually escalated sanctions against Russia and continues to support Ukraine with military and protective equipment, and contributes direct economic support to Ukraine’s armed forces. The long-term humanitarian and socioeconomic effects of Russia’s invasion of Ukraine are expected to be significant and the prevailing geopolitical security tension occasioned by the conflict could continue for a long time.
| |
Interim report January–June 2022 | Page 8 of 29 |
Risk factors
Various risks arise as part of SEK’s operations, primarily credit risks, but also market, liquidity, refinancing, operational and sustainability risks. For a more detailed description of these risks, refer to the separate risk report Capital Adequacy and Risk Management Report Pillar 3 2021 and Note 30 to the annual financial statements included in SEK’s 2021 Annual Report on Form 20-F, as well as the “Risk Factors” section in SEK’s 2021 Annual Report on Form 20-F.
The following risk factor supplement the “Risk Factors” section in SEK’s 2021 Annual Report on Form 20-F.
The ongoing military action between Russia and Ukraine could adversely affect our business, financial condition and results of operations.
As a financial institution which lends money to customers globally, our business could be materially adversely affected by unfavorable global and local economic and market conditions, as well as geopolitical events and other developments in Europe, the United States, Asia and elsewhere around the world. The ongoing Russian military action against Ukraine could lead to significant market and other disruptions, including significant volatility in commodity prices and supply of energy resources, instability in financial markets, supply chain interruptions, political and social instability, changes in consumer or purchaser preferences as well as an increase in cyberattacks and espionage.
The United States, European Union, United Kingdom and other jurisdictions have imposed, and may further impose, financial and economic sanctions and export controls against Russia, Belarus, the Crimea Region of Ukraine, the so-called Donetsk People’s Republic and the so-called Luhansk People’s Republic. The Russian authorities, in retaliation against new international sanctions and as part of measures to stabilize and support the volatile Russian financial and currency markets, have in turn imposed significant currency control measures aimed at restricting the outflow of foreign currency and capital from Russia, imposed various restrictions on transacting with non-Russian parties, banned exports of various products and other economic and financial restrictions. The situation in Ukraine is rapidly evolving, and the United States, the European Union, the United Kingdom and other jurisdictions may implement additional sanctions, export controls or other measures against Russia, Belarus and other countries, regions, officials, individuals or industries in the respective territories. Such sanctions and other measures, as well as the existing and potential further responses from Russia or other countries to such sanctions, tensions and military actions, could adversely affect the global economy and financial markets, which could, in turn, adversely affect our business.
These developments may have consequences for the companies and industries that SEK provides financing to as well as the financial condition of SEK’s financial counterparties and could, in addition to the other factors cited above, have material adverse effects on SEK’s business prospects, financial condition or ability to fulfil its debt obligations.
| |
Interim report January–June 2022 | Page 9 of 29 |
Financial targets
Profitability target | A return on equity after tax of at least 5 percent. | |
Dividend policy | Payment of an ordinary dividend of 20-40 percent of the profit for the year. | |
Capital target | SEK’s total capital ratio is to exceed the Swedish FSA’s requirement by 2 to 4 percentage points and SEK’s Common Equity Tier 1 capital ratio is to exceed the Swedish FSA’s requirement by at least 4 percentage points. Currently, the capital targets mean that the total capital ratio should amount to 17.7-19.7 percent and the Common Equity Tier 1 capital ratio should amount to 14.6 percent, based on SEK’s estimation of the Swedish FSA’s requirements as of June 30, 2022. | |
Key performance indicators (unaudited)
| | | | | | | | | | | | |
|
| Apr-Jun |
| Jan-Mar |
| Apr-Jun |
| Jan-Jun |
| Jan-Jun |
| Jan-Dec |
Skr mn (if not otherwise indicated) | | 2022 | | 2022 | | 2021 | | 2022 | | 2021 | | 2021 |
New lending |
| 45,403 |
| 24,376 |
| 23,199 |
| 69,779 |
| 38,067 |
| 76,988 |
of which to Swedish exporters |
| 22,223 |
| 5,299 |
| 8,593 | | 27,522 |
| 10,684 |
| 25,075 |
of which to exporters’ customers |
| 23,180 |
| 19,077 |
| 14,606 | | 42,257 |
| 27,383 |
| 51,913 |
of which green as a percentage of new lending1 | | 12% | | 4% | | — | | 9% | | — | | 15% |
of which CIRR-loans as a percentage of new lending |
| 26% | | 10% | | 28% | | 21% | | 24% | | 15% |
Total lending | | 263,031 | | 246,459 | | 221,742 | | 263,031 | | 221,742 | | 237,224 |
of which green1 | | 8.7% | | 7.8% | | — | | 8.7% | | — | | 7.5% |
of which social1 | | 0.1% | | — | | — | | 0.1% | | — | | — |
of which sustainability-linked1 | | 1.5% | | 1.1% | | — | | 1.5% | | — | | 0.5% |
Loans, outstanding and undisbursed |
| 330,819 |
| 301,808 | | 281,382 | | 330,819 | | 281,382 | | 291,095 |
| | | | | | | | | | | | |
Customer growth1 | | 4.2% | | 0.6% | | — | | 4.8% | | — | | 10.7% |
| | | | | | | | | | | | |
New long-term borrowings |
| 9,906 |
| 20,111 |
| 9,287 | | 30,017 | | 43,440 | | 81,103 |
New short-term borrowings | | 10,099 | | 21,204 | | 707 | | 31,303 | | 1,755 | | 6,409 |
New green borrowings | | 7,501 | | 1,500 | | 1,600 | | 9,001 | | 4,000 | | 6,100 |
Outstanding senior debt |
| 315,378 |
| 295,753 |
| 281,195 | | 315,378 | | 281,195 | | 295,000 |
| | | | | | | | | | | | |
After-tax return on equity |
| 3.3% | | 2.3% | | 4.9% | | 2.8% | | 4.8% | | 5.1% |
| | | | | | | | | | | | |
Common Equity Tier 1 capital ratio |
| 19.7% | | 21.2% | | 23.3% | | 19.7% | | 23.3% | | 21.6% |
Tier 1 capital ratio |
| 19.7% | | 21.2% | | 23.3% | | 19.7% | | 23.3% | | 21.6% |
Total capital ratio |
| 19.7% | | 21.2% | | 23.3% | | 19.7% | | 23.3% | | 21.6% |
Leverage ratio |
| 8.5% | | 9.2% | | 9.3% | | 8.5% | | 9.3% | | 9.3% |
Liquidity coverage ratio (LCR) |
| 597% | | 1,161% | | 637% | | 597% | | 637% | | 463% |
Net stable funding ratio (NSFR) |
| 122% | | 141% | | 144% | | 122% | | 144% | | 139% |
Risk exposure amount | | 101,898 | | 94,307 | | 84,533 | | 101,898 | | 84,533 | | 92,140 |
1 | New key performance indicators to which there is no comparative historical information. |
See definitions on page 28.
| |
Interim report January–June 2022 | Page 10 of 29 |
Condensed Consolidated Statement of Comprehensive Income (unaudited)
| | | | | | | | | | | | | | |
| | | | Apr–Jun | | Jan–Mar | | Apr–Jun | | Jan-Jun | | Jan-Jun | | Jan-Dec |
Skr mn |
| Note |
| 2022 |
| 2022 |
| 2021 |
| 2022 |
| 2021 |
| 2021 |
Interest income | | | | 994 |
| 685 |
| 678 | | 1,679 | | 1,338 |
| 2,719 |
Interest expenses | | | | -489 |
| -200 |
| -210 | | -689 | | -385 |
| -812 |
Net interest income |
| 2 | | 505 |
| 485 |
| 468 | | 990 | | 953 |
| 1,907 |
| | | | | | | | | | | | | | |
Net fee and commission expense |
| | | -8 |
| -7 |
| -7 | | -15 | | -17 |
| -29 |
Net results of financial transactions |
| 3 | | -92 |
| -170 |
| 9 | | -262 | | -8 |
| 56 |
Total operating income | | | | 405 |
| 308 |
| 470 | | 713 | | 928 |
| 1,934 |
| | | | | | | | | | | | | | |
Personnel expenses |
| | | -102 |
| -92 |
| -98 | | -194 | | -187 |
| -359 |
Other administrative expenses |
| | | -56 |
| -56 |
| -61 | | -112 | | -116 |
| -231 |
Depreciation and impairment of non-financial assets |
| | | -15 |
| -14 |
| -12 | | -29 | | -23 |
| -80 |
Total operating expenses | | | | -173 |
| -162 |
| -171 | | -335 | | -326 |
| -670 |
| | | | | | | | | | | | | | |
Operating profit before credit losses | | | | 232 |
| 146 |
| 299 | | 378 | | 602 |
| 1,264 |
| | | | | | | | | | | | | | |
Net credit losses |
| 4 | | -19 |
| 2 |
| 13 | | -17 | | 1 |
| 41 |
Operating profit | | | | 213 |
| 148 |
| 312 | | 361 | | 603 |
| 1,305 |
| | | | | | | | | | | | | | |
Tax expenses |
| | | -42 |
| -32 |
| -64 | | -74 | | -124 |
| -271 |
Net profit1 | | | | 171 |
| 116 |
| 248 | | 287 | | 479 |
| 1,034 |
| | | | | | | | | | | | | | |
Other comprehensive income related to: | | | | | | | | | | | | | | |
Items not to be reclassified to profit or loss | | | | | | | | | | | | | | |
Own credit risk | | | | -6 | | 70 | | -2 | | 64 | | -20 | | -24 |
Revaluation of defined benefit plans | | | | 16 |
| 30 |
| 4 | | 46 | | 35 |
| 24 |
Tax on items not to be reclassified to profit or loss |
| | | -3 |
| -21 |
| 0 | | -24 | | -3 |
| 0 |
Net items not to be reclassified to profit or loss | | | | 7 |
| 79 |
| 2 | | 86 | | 12 |
| 0 |
| | | | | | | | | | | | | | |
Total other comprehensive income | | | | 7 |
| 79 |
| 2 | | 86 | | 12 |
| 0 |
| | | | | | | | | | | | | | |
Total comprehensive income1 | | | | 178 |
| 195 |
| 250 | | 373 | | 491 |
| 1,034 |
| | | | | | | | | | | | | | |
Skr |
| |
| |
| |
| |
| |
|
|
| |
Basic and diluted earnings per share2 | | | | 43 | | 29 | | 62 | | 72 | | 120 | | 259 |
1 | The entire profit is attributable to the shareholder of the Parent Company. |
2 | Net profit divided by average number of shares, which amounts to 3,990,000 for each period. |
Consolidated Statement of Financial Position (unaudited)
| | | | | | |
| | | | June 30, | | December 31, |
Skr mn |
| Note |
| 2022 |
| 2021 |
Assets | | | | | | |
Cash and cash equivalents |
| 5 |
| 15,901 |
| 11,128 |
Treasuries/government bonds |
| 5 |
| 9,988 |
| 10,872 |
Other interest-bearing securities except loans |
| 5 |
| 42,142 |
| 45,881 |
Loans in the form of interest-bearing securities |
| 4, 5 |
| 50,352 |
| 46,578 |
Loans to credit institutions |
| 4, 5 |
| 24,791 |
| 20,775 |
Loans to the public |
| 4, 5 |
| 200,109 |
| 180,288 |
Derivatives |
| 5, 6 |
| 14,410 |
| 8,419 |
Tangible and intangible assets |
| |
| 342 |
| 331 |
Deferred tax asset | | | | — | | 11 |
Other assets |
| |
| 545 |
| 7,451 |
Prepaid expenses and accrued revenues |
| |
| 2,282 |
| 1,913 |
Total assets | | |
| 360,862 |
| 333,647 |
| | | | | | |
Liabilities and equity | | | | | | |
Borrowing from credit institutions |
| 5 |
| 11,816 |
| 5,230 |
Borrowing from the public |
| 5 |
| — |
| 10,000 |
Debt securities issued |
| 5 |
| 303,562 |
| 279,770 |
Derivatives |
| 5, 6 |
| 14,006 |
| 14,729 |
Other liabilities |
| |
| 8,460 |
| 1,167 |
Accrued expenses and prepaid revenues |
| |
| 2,234 |
| 1,875 |
Provisions |
| |
| 17 |
| 68 |
Total liabilities | | |
| 340,095 |
| 312,839 |
| | | | | | |
Share capital | | |
| 3,990 |
| 3,990 |
Reserves | | |
| -43 |
| -129 |
Retained earnings | | |
| 16,820 |
| 16,947 |
Total equity |
| |
| 20,767 |
| 20,808 |
| | | | | | |
Total liabilities and equity | | |
| 360,862 |
| 333,647 |
| |
Interim report January–June 2022 | Page 12 of 29 |
Condensed Consolidated Statement of Changes in Equity (unaudited)
| | | | | | | | | | | |
| | | | | | | Reserves | | | ||
| | | | | | | Own | | Defined | | Retained |
Skr mn |
| Equity | |
| Share capital |
| credit risk |
| benefit plans |
| earnings |
Opening balance of equity January 1, 2021 |
| 20,064 | | | 3,990 | | -84 | | -45 | | 16,203 |
Net profit Jan-Jun 2021 | | 479 | | | — | | — | | — | | 479 |
Other comprehensive income Jan-Jun 2021 |
| 12 | | | — | | -15 | | 27 |
| — |
Total comprehensive income Jan-Jun 2021 | | 491 | | | — | | -15 | | 27 | | 479 |
Dividend |
| -290 | | | — |
| — |
| — |
| -290 |
Closing balance of equity June 30, 20211 |
| 20,265 | | | 3,990 | | -99 | | -18 |
| 16,392 |
Opening balance of equity January 1, 2021 |
| 20,064 | |
| 3,990 |
| -84 |
| -45 |
| 16,203 |
Net profit Jan-Dec 2021 | | 1,034 | | | — | | — | | — | | 1,034 |
Other comprehensive income Jan-Dec 2021 | | 0 | | | — | | -18 | | 18 | | — |
Total comprehensive income Jan-Dec 2021 |
| 1,034 | | | — | | -18 | | 18 |
| 1,034 |
Dividend | | -290 | | | — | | — | | — | | -290 |
Closing balance of equity December 31, 20211 |
| 20,808 | | | 3,990 |
| -102 |
| -27 |
| 16,947 |
Opening balance of equity January 1, 2022 |
| 20,808 | | | 3,990 | | -102 | | -27 |
| 16,947 |
Net profit Jan-Jun 2022 |
| 287 | | | — | | — | | — |
| 287 |
Other comprehensive income Jan-Jun 2022 | | 86 | | | — | | 50 | | 36 | | — |
Total comprehensive income Jan-Jun 2022 |
| 373 | | | — |
| 50 |
| 36 |
| 287 |
Dividend |
| -414 | | | — | | — | | — |
| -414 |
Closing balance of equity June 30, 20221 |
| 20,767 | |
| 3,990 |
| -52 |
| 9 |
| 16,820 |
1 | The entire equity is attributable to the shareholder of the Parent Company. |
| |
Interim report January–June 2022 | Page 13 of 29 |
Condensed Statement of Cash Flows in the Consolidated Group (unaudited)
| | | | | | |
| | Jan-Jun | | Jan-Jun | | Jan-Dec |
Skr mn |
| 2022 |
| 2021 |
| 2021 |
Operating activities | | | | | | |
Operating profit |
| 361 |
| 603 |
| 1,305 |
Adjustments for non-cash items in operating profit | | 475 | | 111 | | 69 |
Income tax paid |
| -186 |
| -130 |
| -263 |
Changes in assets and liabilities from operating activities |
| -1,877 |
| 19,023 |
| 19,464 |
Cash flow from operating activities |
| -1,227 |
| 19,607 |
| 20,575 |
| | | | | | |
Investing activities | | | | | | |
Capital expenditures |
| -40 |
| -37 |
| -242 |
Cash flow from investing activities |
| -40 |
| -37 |
| -242 |
| | | | | | |
Financing activities | | | | | | |
Change in senior debt |
| 660 |
| -14,472 |
| -10,958 |
Derivatives, net |
| 4,853 |
| -2,748 |
| -1,523 |
Dividend paid |
| -414 |
| -290 |
| -290 |
Payment of lease liability | | -9 | | -13 | | -24 |
Cash flow from financing activities |
| 5,090 |
| -17,523 |
| -12,795 |
| | | | | | |
Cash flow for the period |
| 3,823 |
| 2,047 |
| 7,538 |
| | | | | | |
Cash and cash equivalents at beginning of the period |
| 11,128 |
| 3,362 |
| 3,362 |
Cash flow for the period | | 3,823 | | 2,047 | | 7,538 |
Exchange-rate differences on cash and cash equivalents |
| 950 |
| 140 |
| 228 |
Cash and cash equivalents at end of the period1 | | 15,901 |
| 5,549 |
| 11,128 |
1 | Cash and cash equivalents include, in this context, cash at banks that can be immediately converted into cash and short-term deposits for which the time to maturity does not exceed three months from trade date. |
| |
Interim report January–June 2022 | Page 14 of 29 |
Notes
Note 1. Accounting policies
Note 2. Net interest income
Note 3. Net results of financial transactions
Note 4. Impairments
Note 5. Financial assets and liabilities at fair value
Note 6. Derivatives
Note 7. CIRR-system
Note 8. Pledged assets and contingent liabilities
Note 9. Capital adequacy
Note 10. Exposures
Note 11. Reference interest rate reform
Note 12. Transactions with related parties
Note 13. Events after the reporting period
References to “SEK” or the “Parent Company” are to AB Svensk Exportkredit. References to “Consolidated Group” are to SEK and its consolidated subsidiary. All amounts are in Skr million, unless otherwise indicated. All figures relate to the Consolidated Group, unless otherwise indicated.
Note 1. Accounting policies
This condensed interim report is presented in accordance with International Accounting Standard (IAS) 34, Interim Financial Reporting. The Consolidated Group’s consolidated accounts have been prepared in accordance with the International Financial Reporting Standards (IFRS) as issued by the International Accounting Standards Board (IASB), together with the interpretations from IFRS Interpretations Committee (IFRS IC). The IFRS standards applied by SEK are all endorsed by the European Union (EU). The accounting also follows the additional standards imposed by the Annual Accounts Act for Credit Institutions and Securities Companies (1995:1559) (ÅRKL) and the regulation and general guidelines issued by Finansinspektionen (the Swedish FSA), “Annual Reports in Credit Institutions and Securities Companies” (FFFS 2008:25). In addition to this, the supplementary accounting rules for groups (RFR 1) issued by the Swedish Financial Reporting Board have been applied. SEK also follows the state’s principles for external reporting in accordance with its State Ownership Policy and principles for state-owned enterprises.
The accounting policies, methods of computation and presentation of the Consolidated Group are, in all material aspects, the same as those used for the 2021 annual financial statements included in SEK’s 2021 Annual Report on Form 20-F. SEK analyzes and assesses the application and impact of changes in financial reporting standards that are applied within the Group. Changes that are not mentioned are either not applicable to SEK or have been determined to not have a material impact on SEK’s financial reporting.
There are no IFRS or IFRS Interpretations Committee interpretations that are not yet applicable that are expected to have a material impact on SEK’s financial statements, capital adequacy or large -exposure ratios.
Note 2. Net interest income
| | | | | | | | | | | | |
| | Apr-Jun | | Jan–Mar | | Apr-Jun | | Jan-Jun | | Jan-Jun | | Jan-Dec |
Skr mn |
| 2022 |
| 2022 |
| 2021 |
| 2022 |
| 2021 |
| 2021 |
Interest income | | | | | | | | | | | | |
Loans to credit institutions | | 73 |
| 38 |
| 34 | | 111 | | 67 |
| 131 |
Loans to the public | | 1,082 |
| 984 |
| 919 | | 2,066 | | 1,839 |
| 3,782 |
Loans in the form of interest-bearing securities | | 207 | | 196 |
| 189 | | 403 | | 384 |
| 776 |
Interest-bearing securities excluding loans in the form of interest-bearing securities | | 40 | | 12 | | 12 | | 52 | | 31 | | 50 |
Derivatives | | -475 |
| -606 |
| -529 | | -1,081 | | -1,087 |
| -2,239 |
Administrative remuneration CIRR-system | | 58 | | 56 | | 48 | | 114 | | 93 | | 198 |
Other assets | | 9 | | 5 |
| 5 | | 14 | | 11 |
| 21 |
Total interest income1 | | 994 |
| 685 |
| 678 | | 1,679 | | 1,338 |
| 2,719 |
| | | | | | | | | | | | |
Interest expenses | | | | | | | | | | | | |
Interest expenses | | -443 | | -148 | | -191 | | -591 | | -341 | | -724 |
Resolution fee | | -19 | | -25 | | -19 | | -44 | | -44 | | -88 |
Risk tax | | -27 | | -27 | | — | | -54 | | — | | — |
Total interest expenses | | -489 |
| -200 |
| -210 | | -689 | | -385 |
| -812 |
Net interest income | | 505 |
| 485 |
| 468 | | 990 | | 953 |
| 1,907 |
1 | Interest income calculated using the effective interest method amounted to Skr 2,366 million during January-June 2022 (2Q21: Skr 2,087 million). |
| |
Interim report January–June 2022 | Page 15 of 29 |
Note 3. Net results of financial transactions
| | | | | | | | | | | | |
| | Apr-Jun | | Jan–Mar | | Apr-Jun | | Jan-Jun | | Jan-Jun | | Jan-Dec |
Skr mn |
| 2022 |
| 2022 |
| 2021 |
| 2022 |
| 2021 |
| 2021 |
Derecognition of financial instruments not measured at fair value through profit or loss | | 1 | | 0 | | 29 | | 1 | | 30 | | 33 |
Financial assets or liabilities at fair value through profit or loss | | -171 | | -151 | | -28 | | -322 | | -39 | | 13 |
Financial instruments under fair-value hedge accounting | | 85 | | -19 | | 7 | | 66 | | 3 | | 12 |
Currency exchange-rate effects on all assets and liabilities excl. currency exchange-rate effects related to revaluation at fair value |
| -7 |
| 0 |
| 1 |
| -7 | | -2 |
| -2 |
Total net results of financial transactions |
| -92 |
| -170 |
| 9 |
| -262 | | -8 |
| 56 |
Note 4. Impairments
| | | | | | | | | | | | |
| | Apr-Jun | | Jan–Mar | | Apr-Jun | | Jan-Jun | | Jan-Jun | | Jan-Dec |
Skr mn |
| 2022 |
| 2022 |
| 2021 |
| 2022 |
| 2021 |
| 2021 |
Expected credit losses, stage 1 | | -23 | | -9 | | 31 | | -32 | | 36 | | 60 |
Expected credit losses, stage 2 | | 3 | | 6 | | 8 | | 9 | | 18 | | 29 |
Expected credit losses, stage 3 | | -5 | | 2 | | -30 | | -3 | | -57 | | -46 |
Established losses |
| — |
| — |
| -3 | | — | | -3 | | -52 |
Reserves applied to cover established credit losses | | — | | — | | 3 | | — | | 3 | | 49 |
Recovered credit losses |
| 6 |
| 3 |
| 4 | | 9 | | 4 |
| 1 |
Net credit losses |
| -19 |
| 2 |
| 13 | | -17 | | 1 |
| 41 |
| | | | | | | | | | |
| | June 30, 2022 | | December 31, 2021 | ||||||
Skr mn |
| Stage 1 |
| Stage 2 |
| Stage 3 |
| Total |
| Total |
Loans, before expected credit losses |
| 222,369 |
| 38,474 |
| 2,379 |
| 263,222 |
| 237,381 |
Off-balance sheet exposures, before expected credit losses |
| 50,325 |
| 26,170 |
| 78 |
| 76,573 |
| 60,148 |
Total, before expected credit losses |
| 272,694 |
| 64,644 |
| 2,457 |
| 339,795 |
| 297,529 |
Loss allowance, loans |
| -115 |
| -20 |
| -56 |
| -191 |
| -157 |
Loss allowance, off-balance sheet exposures1 |
| -7 |
| 0 |
| — |
| -7 |
| -7 |
Total loss allowance |
| -122 |
| -20 |
| -56 |
| -198 |
| -164 |
Provision ratio (in percent) |
| 0.04 | | 0.03 | | 2.28 | | 0.06 | | 0.06 |
1 | Recognized under provision in Consolidated Statement of Financial Position. Off-balance sheet exposures consist of guarantee commitments, committed undisbursed loans and binding offers, see Note 8. |
The table above shows the book value of loans and nominal amounts for off-balance sheet exposures before expected credit losses for each stage as well as related loss allowance amounts, in order to place expected credit losses in relation to credit exposures. Overall, the credit portfolio has an extremely high credit quality and SEK often uses risk mitigation measures, primarily through guarantees from the Swedish Export Credit Agency (EKN) and other government export credit agencies in the Organisation for Economic Co-operation and Development (OECD), which explains the low provision ratio.
Loss Allowance
| | | | | | | | | | |
| | June 30, 2022 | | December 31, 2021 | ||||||
Skr mn |
| Stage 1 |
| Stage 2 |
| Stage 3 |
| Total |
| Total |
Opening balance January 1 | | -88 |
| -28 | | -48 | | -164 | | -249 |
Increases due to origination and acquisition | | -38 |
| 0 |
| — | | -38 |
| -65 |
Net remeasurement of loss allowance | | -10 |
| 7 |
| 6 |
| 3 |
| 21 |
Transfer to stage 1 | | -1 | | 1 |
| — |
| 0 |
| 0 |
Transfer to stage 2 | | 1 |
| -1 |
| — |
| 0 |
| -4 |
Transfer to stage 3 | | 1 |
| 2 |
| -9 |
| -6 |
| -19 |
Decreases due to derecognition | | 15 |
| 0 |
| 0 |
| 15 |
| 110 |
Decrease in allowance account due to write-offs | | — |
| — |
| — |
| — |
| 49 |
Exchange-rate differences1 | | -2 |
| -1 |
| -5 |
| -8 |
| -7 |
Closing balance | | -122 |
| -20 |
| -56 |
| -198 |
| -164 |
1 | Recognized under net results of financial transactions in Statement of Comprehensive Income. |
| |
Interim report January–June 2022 | Page 16 of 29 |
Provisions for expected credit losses (ECLs) are calculated using quantitative models based on inputs, assumptions and methods that are highly reliant on assessments. In particular, the following could heavily impact the level of provisions: the establishment of a material increase in credit risk, allowing for forward-looking macroeconomic scenarios, and the measurement of both ECLs over the next 12 months and lifetime ECLs. ECLs are based on objective assessments of what SEK expects to lose on the exposures given what was known on the reporting date and taking into account possible future events. The ECL is a probability-weighted amount that is determined by evaluating the outcome of several possible scenarios and where the data taken into consideration comprises information from previous conditions, current conditions and projections of future economic conditions. SEK’s method entails 3 scenarios being prepared for each probability of default curve: a base scenario, a downturn scenario, and an upturn scenario, where the scenarios are expressed in a business cycle parameter. The business cycle parameter reflects the general risk of default in each geographic segment. The parameter is standard normally distributed where zero indicates a neutral economy as the economy has been on average, historically. The business cycle parameters for the base scenario are between -0.29 and 0.29 for the various probability of default (PD) segments. The base scenarios have been weighted at 70 percent, the downturn scenarios have been weighted at 30 percent, and the upturn scenarios have been weighted at 0 percent between the different PD-segments. An improvement of the PD model has taken place during the first quarter of 2022, which means, among other things, that the difference between the base and downturn/upturn scenarios has increased and that new data sources are used.
Due to the current macroeconomic uncertainty, SEK has made an overall adjustment according to management’s overall assessment. This resulted in an increase of expected credit losses, which was calculated pursuant to SEK’s IFRS 9 model as of June 30, 2022.
Note 5. Financial assets and liabilities at fair value
| | | | | | |
| | June 30, 2022 | ||||
| | | | | | Surplus value (+)/ |
Skr mn |
| Book value |
| Fair value |
| Deficit value (–) |
Cash and cash equivalents |
| 15,901 |
| 15,901 |
| — |
Treasuries/governments bonds |
| 9,988 |
| 9,988 |
| — |
Other interest-bearing securities except loans |
| 42,142 |
| 42,142 |
| — |
Loans in the form of interest-bearing securities |
| 50,352 |
| 50,337 |
| -15 |
Loans to credit institutions |
| 24,791 |
| 24,730 |
| -61 |
Loans to the public |
| 200,109 |
| 198,542 |
| -1,567 |
Derivatives |
| 14,410 |
| 14,410 |
| — |
Total financial assets |
| 357,693 |
| 356,050 |
| -1,643 |
Borrowing from credit institutions |
| 11,816 |
| 11,816 |
| — |
Borrowing from the public |
| — |
| — |
| — |
Debt securities issued |
| 303,562 |
| 303,764 |
| 202 |
Derivatives |
| 14,006 |
| 14,006 |
| — |
Total financial liabilities |
| 329,384 |
| 329,586 |
| 202 |
| | | | | | |
| | December 31, 2021 | ||||
|
| |
| |
| Surplus value (+)/ |
Skr mn | | Book value | | Fair value | | Deficit value (–) |
Cash and cash equivalents |
| 11,128 |
| 11,128 |
| — |
Treasuries/governments bonds |
| 10,872 |
| 10,872 |
| — |
Other interest-bearing securities except loans |
| 45,881 |
| 45,881 |
| — |
Loans in the form of interest-bearing securities |
| 46,578 |
| 47,991 |
| 1,413 |
Loans to credit institutions |
| 20,775 |
| 20,993 |
| 218 |
Loans to the public |
| 180,288 |
| 186,436 |
| 6,148 |
Derivatives |
| 8,419 |
| 8,419 |
| — |
Total financial assets |
| 323,941 |
| 331,720 |
| 7,779 |
| | | | | | |
Borrowing from credit institutions |
| 5,230 |
| 5,230 |
| — |
Borrowing from the public |
| 10,000 | | 10,000 | | — |
Debt securities issued |
| 279,770 |
| 280,294 |
| 524 |
Derivatives |
| 14,729 |
| 14,729 |
| — |
Total financial liabilities |
| 309,729 |
| 310,253 |
| 524 |
| |
Interim report January–June 2022 | Page 17 of 29 |
Determination of fair value
The determination of fair value is described in the annual financial statements included in SEK’s 2021 Annual Report on Form 20-F, see Note 1 (h) (viii) Principles for determination of fair value of financial instruments and (ix) Determination of fair value of certain types of financial instruments.
Financial assets in fair value hierarchy
| | | | | | | | |
| | Financial assets at fair value through profit or loss | ||||||
Skr mn |
| Level 1 |
| Level 2 |
| Level 3 |
| Total |
Treasuries/governments bonds |
| 4,446 |
| 5,542 |
| — |
| 9,988 |
Other interest-bearing securities except loans |
| 23,353 |
| 18,789 |
| — |
| 42,142 |
Derivatives |
| — |
| 14,281 |
| 129 |
| 14,410 |
Total, June 30, 2022 | | 27,799 | | 38,612 | | 129 | | 66,540 |
Total, December 31, 2021 |
| 32,187 | | 32,499 | | 486 | | 65,172 |
Financial liabilities in fair value hierarchy
| | | | | | | | |
| | Financial liabilities at fair value through profit or loss | ||||||
Skr mn |
| Level 1 |
| Level 2 |
| Level 3 |
| Total |
Debt securities issued |
| — |
| 7,167 |
| 31,390 |
| 38,557 |
Derivatives | | — | | 7,789 | | 6,217 | | 14,006 |
Total, June 30, 2022 | | — | | 14,956 | | 37,607 | | 52,563 |
Total, December 31, 2021 |
| — |
| 18,967 |
| 35,078 |
| 54,045 |
There were 0 transfers between levels during the period (year-end 2021: a transfer of Skr -1 million for derivatives was made from level 2 to level 3, due to larger elements of assessment in the valuation).
Financial assets and liabilities at fair value in Level 3, 2022
| | | | | | | | | | | | | | | | | | |
| | | | | | | | | | | | | | Gains (+) and | | | | |
| | | | | | | | | | | | Gains (+) and | | losses (–) in | | | | |
| | | | | | | | | | Transfers | | losses (–) | | Other | | Exchange- | | |
| | January 1, | | | | Settlements & | | Transfers | | from | | through profit | | comprehensive | | rate | | June 30, |
Skr mn |
| 2022 |
| Purchases |
| sales |
| to Level 3 |
| Level 3 |
| or loss1 |
| income |
| differences |
| 2022 |
Debt securities issued |
| -32,555 |
| -6,028 |
| 6,496 |
| — |
| — |
| 1,676 |
| -30 | | -949 |
| -31,390 |
Derivatives, net |
| -2,037 |
| 0 |
| 96 |
| — |
| — |
| -442 |
| — | | -3,705 |
| -6,088 |
Net assets and liabilities |
| -34,592 |
| -6,028 |
| 6,592 |
| — |
| — |
| 1,234 |
| -30 | | -4,654 |
| -37,478 |
Financial assets and liabilities at fair value in Level 3, 2021
| | | | | | | | | | | | | | | | | | |
| | | | | | | | | | | | | | Gains (+) and | | | | |
| | | | | | | | | | | | Gains (+) and | | losses (–) in | | | | |
| | | | | | | | | | Transfers | | losses (–) | | Other | | Exchange- | | |
| | January 1, | | | | Settlements & | | Transfers | | from | | through profit | | comprehensive | | rate | | December 31, |
Skr mn |
| 2021 |
| Purchases |
| sales |
| to Level 3 |
| Level 3 |
| or loss1 |
| income |
| differences |
| 2021 |
Debt securities issued |
| -41,198 |
| -10,372 |
| 19,337 |
| — |
| — |
| 196 |
| -36 |
| -482 | | -32,555 |
Derivatives, net |
| -263 |
| 5 |
| -599 |
| -1 |
| — |
| 411 |
| — |
| -1,590 | | -2,037 |
Net assets and liabilities |
| -41,461 |
| -10,367 |
| 18,738 |
| -1 |
| — |
| 607 |
| -36 |
| -2,072 | | -34,592 |
1 | Gains and losses through profit or loss, including the impact of exchange-rates, is reported as net interest income and net results of financial transactions. The unrealized fair value changes for assets and liabilities, including the impact of exchange-rates, held as of June 30, 2022, amounted to a Skr 1,234 million gain (year-end 2021: Skr 594 million gain) and are reported as net results of financial transactions. |
| |
Interim report January–June 2022 | Page 18 of 29 |
Uncertainty of valuation of Level 3 instruments
As the estimation of parameters included in the models used to calculate the market value of Level 3 instruments is associated with subjectivity and uncertainty, SEK has conducted an analysis of the difference in fair value of Level 3 instruments using other established parameter values. Option models and discounted cash flows are used to value the Level 3 instruments. For the Level 3 instruments that are significantly affected by different types of correlations, which are not based on observable market data, a revaluation has been made by shifting the correlations. The correlation is expressed as a value between 1 and -1, where 0 indicates no relationship, 1 indicates a maximum positive relationship and -1 indicates a maximum negative relationship. The maximum correlation in the range of unobservable inputs can thus be from 1 to -1. In the analysis, the correlations have been adjusted by +/- 0.12, which represents the level SEK uses within its prudent valuation framework. For Level 3 instruments that are significantly affected by non-observable market data in the form of SEK’s own creditworthiness, a revaluation has been made by shifting the credit curve. The revaluation is made by shifting the credit spreads by +/- 10 basis points, which has been assessed as a reasonable change in SEK’s credit spread. The analysis shows the impact of the non-observable market data on the market value. In addition, the market value will be affected by observable market data.The result of the analysis corresponds with SEK’s business model where issued securities are linked with a matched hedging derivative. The underlying market data is used to evaluate the issued security as well as to evaluate the fair value in the derivative. This means that a change in fair value of the issued security, excluding SEK’s own credit spread, is offset by an equally large change in fair value in the derivative.
Sensitivity analysis – level 3 assets and liabilities
| | | | | | | | | | | | |
Assets and liabilities | | June 30, 2022 | ||||||||||
| | | | | | Range of estimates | | | | | | |
| | | | Unobservable | | for unobservable | | | | Sensitivity | | Sensitivity |
Skr mn |
| Fair Value |
| input |
| input |
| Valuation method |
| max |
| min |
| | | | | | | | | | | | |
Equity |
| -3,870 |
| Correlation |
| 0.12 - (0.12) |
| Option Model |
| -10 | | 10 |
Interest rate |
| 18 |
| Correlation |
| 0.12 - (0.12) |
| Option Model |
| 0 | | 0 |
FX |
| -2,139 |
| Correlation |
| 0.12 - (0.12) |
| Option Model |
| -44 | | 44 |
Other |
| -97 |
| Correlation |
| 0.12 - (0.12) |
| Option Model |
| 0 | | 0 |
Sum derivatives, net |
| -6,088 |
| | | | | |
| -54 | | 54 |
Equity |
| -12,304 |
| Correlation |
| 0.12 - (0.12) |
| Option Model |
| 10 | | -10 |
|
| |
| Credit spreads |
| 10BP - (10BP) |
| Discounted cash flow |
| 17 | | -17 |
Interest rate |
| -9,295 |
| Correlation |
| 0.12 - (0.12) |
| Option Model |
| 0 | | 0 |
|
| |
| Credit spreads |
| 10BP - (10BP) |
| Discounted cash flow |
| 89 | | -89 |
FX |
| -9,610 |
| Correlation |
| 0.12 - (0.12) |
| Option Model |
| 45 | | -45 |
|
| |
| Credit spreads |
| 10BP - (10BP) |
| Discounted cash flow |
| 36 | | -36 |
Other |
| -181 |
| Correlation |
| 0.12 - (0.12) |
| Option Model |
| 0 | | 0 |
|
| |
| Credit spreads |
| 10BP - (10BP) |
| Discounted cash flow |
| 1 | | -1 |
Sum debt securities issued |
| -31,390 |
| | | | | |
| 198 | | -198 |
Total effect on total comprehensive income | | | | | | | | | | 144 | | -144 |
| | | | | | | | | | | | |
Derivatives, net, December 31, 2021 | | -2,037 | | | | | | | | -59 | | 59 |
Debt securities issued, December 31, 2021 | | -32,555 | | | | | | | | 181 | | -181 |
Total effect on total comprehensive income, December 31, 2021 |
| |
|
|
|
|
|
|
| 122 |
| -122 |
The sensitivity analysis shows the effect that a shift in correlations or SEK’s own credit spread has on Level 3 instruments. The table presents maximum positive and negative change in fair value when correlations or SEK’s own credit spread is shifted by +/– 0.12 and +/- 10 basis points, respectively. When determining the total maximum/minimum effect on total comprehensive income the most adverse/favorable shift is chosen, considering the net exposure arising from the issued securities and the derivatives, for each correlation.
Fair value related to credit risk
| | | | | | | | |
| | Fair value originating from credit risk | | The period's change in fair value originating | ||||
| | (- liabilities increase/ + liabilities decrease) | | from credit risk (+ income/ - loss) | ||||
| | June 30, | | 31 December | | Jan-Jun | | Jan-Jun |
Skr mn |
| 2022 |
| 2021 |
| 2022 |
| 2021 |
CVA/DVA, net1 | | -56 | | -14 | | -42 | | 3 |
OCA2 | | -68 | | -132 | | 64 | | -19 |
1 | Credit value adjustment (CVA) and Debt value adjustment (DVA) reflects how the counterparties’ credit risk as well as SEK’s own credit rating affects the fair value of derivatives. |
2 | Own credit adjustment (OCA) reflects how the changes in SEK’s credit rating affects the fair value of financial liabilities measured at fair value through profit and loss. |
| |
Interim report January–June 2022 | Page 19 of 29 |
Note 6. Derivatives
Derivatives by category
| | | | | | | | | | | | |
| | June 30, 2022 | | December 31, 2021 | ||||||||
| | Assets | | Liabilities | | Nominal | | Assets | | Liabilities | | Nominal |
Skr mn |
| Fair value |
| Fair value |
| amounts |
| Fair value |
| Fair value |
| amounts |
Interest rate-related contracts |
| 2,067 |
| 6,503 |
| 418,806 |
| 3,192 |
| 9,464 |
| 361,160 |
Currency-related contracts |
| 12,269 |
| 2,785 |
| 166,739 |
| 5,218 |
| 3,518 |
| 157,362 |
Equity-related contracts |
| 2 |
| 3,872 |
| 13,818 |
| 2 |
| 895 |
| 9,801 |
Contracts related to commodities, credit risk, etc. |
| 72 |
| 846 |
| 9,192 |
| 7 |
| 852 |
| 3,521 |
Total derivatives |
| 14,410 |
| 14,006 |
| 608,555 |
| 8,419 |
| 14,729 |
| 531,844 |
In accordance with SEK’s policies with regard to counterparty, interest rate, currency exchange, and other exposures, SEK uses, and is a party to, different kinds of derivative instruments, mostly various interest rate-related and currency exchangerelated contracts, primarily to hedge risk exposure inherent in financial assets and liabilities. These contracts are carried at fair value in the statements of financial position on a contract-by-contract basis.
Note 7. CIRR-system
Pursuant to the company’s assignment as stated in its owner instruction issued by the Swedish government, SEK administers credit granting in the Swedish system for officially supported export credits (CIRR-system). SEK receives compensation from the Swedish government in the form of an administrative compensation, which is calculated based on the principal amount outstanding.
The administrative compensation paid by the state to SEK is recognized in the CIRR-system as administrative remuneration to SEK. Refer to the following tables of the statement of comprehensive income and statement of financial positions for the CIRR-system, presented as reported to the owner. Interest expenses includes interest expenses for loans between SEK and the CIRR-system which reflects the borrowing cost for the CIRR-system. Interest expenses for derivatives hedging CIRR-loans are also recognized as interest expenses, which differs from SEK’s accounting principles. Arrangement fees to SEK are recognized together with other arrangement fees as interest expenses.
In addition to the CIRR-system, SEK administers the Swedish government’s previous concessionary credit program according to the same principles as the CIRR-system. No new lending is being offered under the concessionary credit program. As of June 30, 2022, concessionary loans outstanding amounted to Skr 356 million (year-end 2021: Skr 315 million) and operating profit for the program amounted to Skr -9 million (2Q21: Skr -11 million) for the period January-June 2022. SEK’s administrative compensation for administrating the concessionary credit program amounted to Skr 424 thousand (2Q21: Skr 1 million).
Statement of Comprehensive Income for the CIRR-system
| | | | | | | | | | | | |
| | Apr-Jun | | Jan–Mar | | Apr-Jun | | Jan-Jun | | Jan-Jun | | Jan-Dec |
Skr mn |
| 2022 |
| 2022 | | 2021 | | 2022 |
| 2021 |
| 2021 |
Interest income |
| 556 |
| 557 | | 498 | | 1,113 |
| 985 |
| 2,105 |
Interest expenses |
| -517 |
| -513 | | -494 | | -1,030 |
| -1,014 |
| -2,061 |
Interest compensation |
| 2 |
| — | | 7 | | 2 |
| 7 |
| 7 |
Exchange-rate differences |
| 1 |
| 1 | | 0 | | 2 |
| -1 |
| -1 |
Profit before compensation to SEK | | 42 | | 45 | | 11 | | 87 | | -23 | | 50 |
Administrative remuneration to SEK | | -58 | | -56 | | -47 | | -114 | | -92 | | -197 |
Operating profit CIRR-system | | -16 | | -11 | | -36 | | -27 | | -115 | | -147 |
Reimbursement to (–) / from (+) the State |
| 16 |
| 11 | | 36 | | 27 |
| 115 |
| 147 |
| |
Interim report January–June 2022 | Page 20 of 29 |
Statement of Financial Position for the CIRR-system
| | | | |
| | June 30, | | December 31, |
Skr mn |
| 2022 |
| 2021 |
Cash and cash equivalents |
| 1 |
| 8 |
Loans |
| 95,031 |
| 87,872 |
Derivatives |
| 4,462 |
| 36 |
Other assets |
| 396 |
| 7,359 |
Prepaid expenses and accrued revenues |
| 723 |
| 470 |
Total assets |
| 100,613 |
| 95,745 |
| | | | |
Liabilities |
| 99,908 |
| 88,092 |
Derivatives |
| — |
| 7,060 |
Accrued expenses and prepaid revenues |
| 705 |
| 593 |
Total liabilities |
| 100,613 |
| 95,745 |
| | | | |
Commitments |
| |
| |
Committed undisbursed loans |
| 47,839 |
| 39,084 |
Binding offers |
| 3,536 |
| 1,510 |
Note 8. Pledged assets and contingent liabilities
| | | | |
| | June 30, | | December 31, |
Skr mn |
| 2022 |
| 2021 |
Collateral provided |
|
|
|
|
Cash collateral under the security agreements for derivative contracts |
| 12,221 |
| 10,417 |
Contingent liabilities1 |
|
|
|
|
Guarantee commitments |
| 4,939 |
| 4,767 |
Commitments1 |
|
|
|
|
Committed undisbursed loans |
| 67,788 |
| 53,871 |
Binding offers |
| 3,846 |
| 1,510 |
1 | For expected credit losses in guarantee commitments, committed undisbursed loans and binding offers, see Note 4. |
Note 9. Capital adequacy
The capital adequacy analysis relates to the parent company AB Svensk Exportkredit. The information is disclosed according to FFFS 2014:12 and FFFS 2008:25. For further information on capital adequacy and risks, see Note 30 to the annual financial statements included in SEK’s 2021 Annual Report on Form 20-F and see SEK’s 2021 Capital Adequacy and Risk Management (Pillar 3) Report.
Capital Adequacy Analysis
| | | | |
| | | | |
|
| June 30, 2022 |
| December 31, 2021 |
Capital ratios |
| percent1 |
| percent1 |
Common Equity Tier 1 capital ratio |
| 19.7 | | 21.6 |
Tier 1 capital ratio |
| 19.7 | | 21.6 |
Total capital ratio |
| 19.7 | | 21.6 |
1 | Capital ratios exclusive of buffer requirements are the quotients of the relevant capital measure and the total risk exposure amount. See tables Own funds – adjusting items and Minimum capital requirements exclusive of buffer. |
| |
Interim report January–June 2022 | Page 21 of 29 |
| | | | | | | | |
| | June 30, 2022 | | December 31, 2021 | ||||
Total risk-based capital requirement |
| Skr mn |
| percent1 |
| Skr mn |
| percent1 |
Capital base requirement of 8 percent2 | | 8,152 | | 8.0 | | 7,371 | | 8.0 |
of which Tier 1 requirement of 6 percent | | 6,114 | | 6.0 | | 5,528 | | 6.0 |
of which minimum requirement of 4.5 percent | | 4,585 | | 4.5 | | 4,146 | | 4.5 |
Pillar 2 capital requirements3 | | 3,740 | | 3.7 | | 3,382 | | 3.7 |
Common Equity Tier 1 capital available to meet buffer requirements4 | | 8,182 | | 8.0 | | 9,149 | | 9.9 |
Capital buffer requirements | | 2,591 | | 2.5 | | 2,333 | | 2.5 |
of which Capital conservation buffer |
| 2,547 |
| 2.5 | | 2,303 |
| 2.5 |
of which Countercyclical buffer |
| 44 |
| 0.0 | | 30 |
| 0.0 |
Pillar 2 guidance5 | | 1,528 | | 1.5 | | 1,382 | | 1.5 |
Total risk-based capital requirement including Pillar 2 guidance |
| 16,011 |
| 15.7 | | 14,468 |
| 15.7 |
1 | Expressed as a percentage of total risk exposure amount. |
2 | The minimum requirements according to CRR (Regulation (EU) No 575/2013 of the European Parliament and of the Council of June 26, 2013 on prudential requirements for credit institutions and investment firms and amending Regulation (EU) No 648/2012) have fully come into force in Sweden without regard to the transitional period. |
3 | Individual Pillar 2 requirement of 3.67 percent calculated on the total risk exposure amount, according to the decision from the latest Swedish FSA Supervisory Review and Evaluation Process (“SREP”) on September 29, 2021. |
4 | Common Equity Tier 1 capital available to meet buffer requirement after 8 percent minimum capital requirement (SEK covers all minimum requirements with CET1 capital, i.e., 4.5 percent, 1.5 percent and 2 percent) and after the Pillar 2 requirements (3.67 percent). The Pillar 2 requirement was not deducted in the previous year’s figure. |
5 | The Swedish FSA notified SEK on September 29, 2021, within the latest SREP, that in addition to the capital requirements according to Regulation (EU) no 575/2013 on prudential requirements, SEK should hold additional capital (Pillar 2 guidance) of 1.50 percent of the total risk-weighted exposure amount. The Pillar 2 guidance is not a binding requirement. |
| | | | |
|
| June 30, 2022 |
| December 31, 2021 |
Leverage ratio1 | | Skr mn | | Skr mn |
On-balance sheet exposures |
| 227,519 |
| 209,889 |
Off-balance sheet exposures |
| 8,814 |
| 5,309 |
Total exposure measure |
| 236,333 |
| 215,198 |
Leverage ratio2 |
| 8.5% | | 9.3% |
1 | The leverage ratio reflects the full impact of IFRS 9 as no transitional rules were utilized. |
2 | Defined by CRR as the quotient of the Tier 1 capital and an exposure measure. |
| | | | | | | | |
|
| June 30, 2022 |
| December 31, 2021 | ||||
Total Leverage ratio requirement |
| Skr mn |
| percent1 |
| Skr mn |
| percent1 |
Capital base requirement of 3 percent | | 7,090 | | 3.0 | | 6,456 | | 3.0 |
Pillar 2 guidance2 | | 354 | | 0.2 | | 323 | | 0.2 |
Total capital requirement relating to Leverage ratio including Pillar 2 guidance | | 7,444 | | 3.2 | | 6,779 | | 3.2 |
1 | Expressed as a percentage of total exposure amount. |
2 | The Swedish FSA has on September 29, 2021 notified SEK, within the latest SREP, that SEK may hold additional capital (Pillar 2 guidance) of 0.15 percent calculated on the total Leverage ratio exposure measure. The Pillar 2 guidance is not a binding requirement. |
Own funds – Adjusting items
| | | | |
| | June 30, | | December 31, |
Skr mn |
| 2022 |
| 2021 |
Share capital |
| 3,990 |
| 3,990 |
Retained earnings |
| 16,098 |
| 15,518 |
Accumulated other comprehensive income and other reserves |
| 343 |
| 323 |
Independently reviewed profit net of any foreseeable charge or dividend |
| 220 |
| 601 |
Common Equity Tier 1 (CET1) capital before regulatory adjustments |
| 20,651 |
| 20,432 |
Additional value adjustments due to prudent valuation |
| -428 |
| -395 |
Intangible assets1 |
| -70 |
| -99 |
Gains or losses on liabilities valued at fair value resulting from changes in own credit standing |
| 41 |
| 98 |
Negative amounts resulting from the calculation of expected loss amounts | | -103 | | -111 |
Total regulatory adjustments to Common Equity Tier 1 capital |
| -560 |
| -507 |
Total Common Equity Tier 1 capital |
| 20,091 |
| 19,925 |
Total Own funds |
| 20,091 |
| 19,925 |
1 | From December 31, 2020, SEK applies the amendments to Delegated Regulation (EU) No 241/2014 regarding deduction of software assets from Common Equity Tier 1 (CET1). The amendments introduce an exemption from the deduction of intangible assets from CET1 for prudently valued software assets of which the value is not negatively affected by resolution, insolvency or liquidation of the institution. |
| |
Interim report January–June 2022 | Page 22 of 29 |
Minimum capital requirements exclusive of buffer
| | | | | | | | | | | | |
| | June 30, 2022 | | December 31, 2021 | ||||||||
| | | | | | Minimum | | | | | | Minimum |
|
| |
| Risk exposure |
| capital |
| |
| Risk exposure |
| capital |
Skr mn | | EAD1 | | amount | | requirement | | EAD1 | | amount | | requirement |
Credit risk standardized method |
| | | | | |
|
|
|
|
|
|
Corporates |
| 3,123 |
| 3,087 |
| 247 |
| 2,990 |
| 2,990 |
| 239 |
Exposures in default | | 93 | | 93 | | 7 | | 74 | | 74 | | 6 |
Total credit risk standardized method |
| 3,216 |
| 3,180 |
| 254 |
| 3,064 |
| 3,064 |
| 245 |
Credit risk IRB method |
| | | | | | | | | | | |
Central Governments | | 224,007 | | 10,841 | | 867 | | 196,606 | | 9,673 | | 774 |
Financial institutions2 |
| 46,423 |
| 10,119 |
| 810 |
| 41,082 |
| 8,843 |
| 707 |
Corporates3 |
| 128,775 |
| 69,866 |
| 5,589 |
| 115,412 |
| 62,988 |
| 5,039 |
Assets without counterparty | | 437 | | 437 | | 35 | | 372 | | 372 | | 30 |
Total credit risk IRB method |
| 399,642 |
| 91,263 |
| 7,301 |
| 353,472 |
| 81,876 |
| 6,550 |
Credit valuation adjustment risk |
| n.a. |
| 3,048 |
| 244 |
| n.a. |
| 2,922 |
| 233 |
Foreign exchange risk |
| n.a. |
| 772 |
| 62 |
| n.a. |
| 645 |
| 52 |
Commodities risk |
| n.a. |
| 13 |
| 1 |
| n.a. |
| 11 |
| 1 |
Operational risk |
| n.a. |
| 3,622 |
| 290 |
| n.a. |
| 3,622 |
| 290 |
Total |
| 402,858 |
| 101,898 |
| 8,152 |
| 356,536 |
| 92,140 |
| 7,371 |
1 | Exposure at default (EAD) shows the size of the outstanding exposure at default. |
2 | Of which counterparty risk in derivatives: EAD Skr 7,710 million (year-end 2021: Skr 5,975 million), Risk exposure amount of Skr 2,491 million (year-end 2021: Skr 2,000 million) and Capital requirement of Skr 199 million (year-end 2021: Skr 160 million). |
3 | Of which related to specialized lending: EAD Skr 6,054 million (year-end 2021: 5,224 million), Risk exposure amount of Skr 4,275 million (year -end 2021: Skr 3,589 million) and Capital requirement of Skr 342 million (year-end 2021: Skr 287 million). |
Credit risk
For classification and quantification of credit risk, SEK uses the internal ratings-based (IRB) approach. Specifically, SEK applies the Foundation Approach. Under the Foundation Approach, the company determines the PD within one year for each of its counterparties, while the remaining parameters are established in accordance with CRR. Application of the IRB approach requires the Swedish FSA’s permission and is subject to ongoing supervision. Certain exposures are, by permission from the Swedish FSA, exempted from application of the IRB approach, and, instead, the standardized approach is applied. In 2020, SEK reviewed its credit risk processes in order to comply with new regulatory requirements, EBA Guidelines EBA/GL/2016/07 and Commission Delegated Regulation (EU) 2018/171, on the definition of default. As a result, SEK established a new internal definition of default, which was subsequently approved by the Swedish FSA and later, on January 1, 2021, implemented in the IRB approach for own funds requirements calculation. Counterparty risk exposure amounts in derivatives are calculated in accordance with the standardized approach for counterparty credit risk. SEK has been applying a new standardized approach for counterparty credit risk since June 30, 2021.
Credit valuation adjustment risk
Credit valuation adjustment risk is calculated for all over-the-counter derivative contracts, except for credit derivatives used as credit protection and transactions with a qualifying central counterparty. SEK calculates this capital requirement according to the standardized method.
Foreign exchange risk
Foreign exchange risk is calculated according to the standardized approach, whereas the scenario approach is used for calculating the gamma and volatility risks.
Commodities risk
Capital requirements for commodity risk are calculated in accordance with the simplified approach under the standardized approach. The scenario approach is used for calculating the gamma and volatility risks.
Operational risk
Capital requirement for operational risk is calculated according to the standardized approach. The company’s operations are divided into business areas as defined in the CRR. The capital requirement for each area is calculated by multiplying a factor depending on the business area by an income indicator. The factors applicable for SEK are 15 percent and 18 percent. The income indicators consist of the average operating income for the past three financial years for each business area.
Transitional rules
The capital adequacy ratios reflect the full impact of IFRS 9 as no transitional rules for IFRS 9 were utilized.
| |
Interim report January–June 2022 | Page 23 of 29 |
Capital buffer requirements
SEK expects to meet capital buffer requirements with Common Equity Tier 1 capital. The mandatory capital conservation buffer is 2.5 percent. The countercyclical buffer rate that is applied to exposures located in Sweden was lowered from 2.5 percent to 0 percent as of March 16, 2020. The reduction was made for preventive purposes, in order to counteract credit tightening due to the development and spread of COVID-19 and its effects on the economy. The Swedish FSA decided on September 29, 2021 to increase the countercyclical buffer rate to 1 percent, which will apply from September 29, 2022. On June 21, 2022, the Swedish FSA decided to further increase the countercyclical buffer rate to 2 percent, which will take effect on June 22, 2023. As of June 30, 2022, the capital requirement related to relevant exposures in Sweden was 71 percent (year-end 2021: 68 percent) of the total relevant capital requirement regardless of location; this fraction is also the weight applied on the Swedish buffer rate when calculating SEK’s countercyclical capital buffer. The countercyclical capital buffer as of June 30, 2022, for Sweden has been dissolved due to the reduction of the countercyclical buffer value to 0 percent. Buffer rates applicable in other countries may have effects on SEK, but as most capital requirements for SEK’s relevant credit exposures are related to Sweden, the potential effect is limited. As of June 30, 2022, the contribution to SEK’s countercyclical buffer from buffer rates in other countries was 0.04 percentage points (year-end 2021: 0.03 percentage points). SEK has not been classified as a systemically important institution by the Swedish FSA. The capital buffer requirements for systemically important institutions that came into force January 1, 2016, therefore do not apply to SEK.
Pillar 2 guidance
The Swedish FSA will in connection with the Supervisory Review and Evaluation Process (”SREP”) determine appropriate levels for the institution’s own funds. The Swedish FSA will then inform the institution of the differences between the appropriate levels and requirements under the Supervisory Regulation, the Buffer Act and the Pillar 2 requirements. These notifications are called Pillar 2 guidance. The Pillar 2 guidance covers both the risk-based capital requirement and the leverage ratio requirement.
Internally assessed economic capital
| | | | |
| | June 30, | | December 31, |
Skr mn |
| 2022 |
| 2021 |
Credit risk |
| 6,766 |
| 6,038 |
Operational risk |
| 225 |
| 225 |
Market risk |
| 1,155 |
| 1,247 |
Other risks |
| 244 |
| 234 |
Capital planning buffer | | 1,610 | | 1,610 |
Total |
| 10,000 |
| 9,354 |
SEK regularly conducts an internal capital adequacy assessment process, during which the company determines how much capital is needed in order to cover its risks. The result of SEK’s assessment of capital adequacy is presented above. For more information regarding the internal capital adequacy assessment process and its methods, please see Note 30 to the annual financial statements included in SEK’s 2021 Annual Report on Form 20-F.
Liquidity coverage
| | | | |
| | June 30, | | December 31, |
Skr bn, 12 month average |
| 2022 |
| 2021 |
Total liquid assets |
| 53.9 |
| 56.1 |
Net liquidity outflows1 |
| 8.5 |
| 10.1 |
Liquidity outflows | | 21.1 | | 21.2 |
Liquidity inflows |
| 14.2 |
| 12.2 |
Liquidity Coverage Ratio |
| 836% | | 695% |
1 | Net liquidity outflows is calculated as the net of liquidity outflows and capped liquidity inflows. Capped liquidity inflows is calculated in accordance with article 425 of CRR (EU 575/2013) and article 33 of the Commission Delegated Regulation (EU) 2015/61. |
Information on Liquidity Coverage Ratio (LCR) in accordance with article 447 of the CRR (EU 575/2013), calculated in accordance with the Commission Delegated Regulation (EU) 2015/61.
Net stable funding
| | | | |
|
| June 30, |
| December 31, |
Skr bn | | 2022 | | 2021 |
Available stable funding |
| 232.8 |
| 245.9 |
Requiring stable funding |
| 190.1 |
| 176.4 |
Net Stable Funding Ratio |
| 122% | | 139% |
Information on Net Stable Funding Ratio (NSFR) in accordance with article 447 of the CRR (EU 575/2013), calculated in accordance with the Commission Delegated Regulation (EU) 2015/61.
| |
Interim report January–June 2022 | Page 24 of 29 |
Note 10. Exposures
Net exposures are reported after taking into consideration effects of guarantees and credit default swaps. Amounts are calculated in accordance with capital adequacy calculations, but before the application of credit conversion factors.
Total net exposures by exposure class
| | | | | | | | | | | | | | | | | | | | | | | | |
| | Credits & interest-bearing | | Committed undisbursed loans, | | | | | | | | | ||||||||||||
| | securities | | derivatives, etc. | | Total | ||||||||||||||||||
| | June 30, 2022 | | December 31, 2021 | | June 30, 2022 | | December 31, 2021 | | June 30, 2022 | | December 31, 2021 | ||||||||||||
Skr bn |
| Amount |
| % |
| Amount |
| % |
| Amount |
| % |
| Amount |
| % |
| Amount |
| % |
| Amount |
| % |
Central-governments |
| 161.5 |
| 47.6 |
| 136.1 |
| 44.4 |
| 60.9 |
| 72.2 |
| 49.4 |
| 74.8 |
| 222.4 |
| 52.6 | �� | 185.5 |
| 49.8 |
Regional-governments |
| 12.0 |
| 3.5 |
| 14.3 |
| 4.7 |
| 0.9 |
| 1.1 |
| 1.0 |
| 1.5 |
| 12.9 |
| 3.1 |
| 15.3 |
| 4.1 |
Multilateral development banks |
| 1.6 |
| 0.5 |
| 3.0 |
| 1.0 |
| 0.0 |
| 0.0 |
| — |
| — |
| 1.6 |
| 0.4 |
| 3.0 |
| 0.8 |
Public Sector Entity | | 2.6 | | 0.8 | | 5.4 | | 1.7 | | — | | — | | — | | — | | 2.6 | | 0.6 | | 5.4 | | 1.4 |
Financial-institutions |
| 37.8 |
| 11.2 |
| 34.9 |
| 11.4 |
| 8.9 |
| 10.6 |
| 6.3 |
| 9.5 |
| 46.7 |
| 11.0 |
| 41.2 |
| 11.1 |
Corporates |
| 123.1 |
| 36.4 |
| 112.7 |
| 36.8 |
| 13.6 |
| 16.1 |
| 9.4 |
| 14.2 |
| 136.7 |
| 32.3 |
| 122.1 |
| 32.8 |
Total |
| 338.6 |
| 100.0 |
| 306.4 |
| 100.0 |
| 84.3 |
| 100.0 |
| 66.1 |
| 100.0 |
| 422.9 |
| 100.0 |
| 372.5 |
| 100.0 |
Net exposure by region and exposure class, as of June 30, 2022
| | | | | | | | | | | | | | | | | | |
| | | | | | | | | | | | | | West | | | | |
| | | | | | | | | | | | | | European | | Central- | | |
| | Middle | | | | | | | | | | | | countries | | and East | | |
| | East/ | | Asia excl. | | | | North | | Latin | | | | excl. | | European | | |
Skr bn |
| Africa |
| Japan |
| Japan |
| America |
| America |
| Sweden |
| Sweden |
| countries |
| Total |
Central governments |
| 0.0 |
| 0.4 |
| 2.7 |
| 1.2 |
| — |
| 200.8 |
| 15.0 |
| 2.3 |
| 222.4 |
Regional governments |
| — |
| — |
| — |
| — |
| — |
| 12.9 |
| 0.0 |
| — |
| 12.9 |
Multilateral development banks |
| — |
| — |
| — |
| — |
| — |
| — |
| 1.6 |
| — |
| 1.6 |
Public Sector Entity | | — | | — | | — | | — | | — | | — | | 2.6 | | — | | 2.6 |
Financial institutions |
| 0.1 |
| — |
| 2.4 |
| 2.0 |
| — |
| 17.4 |
| 24.7 |
| 0.1 |
| 46.7 |
Corporates |
| 0.2 |
| 1.0 |
| 3.3 |
| 5.4 |
| 3.4 |
| 96.2 |
| 25.9 |
| 1.3 |
| 136.7 |
Total |
| 0.3 |
| 1.4 |
| 8.4 |
| 8.6 |
| 3.4 | | 327.3 |
| 69.8 |
| 3.7 |
| 422.9 |
Net exposure by region and exposure class, as of December 31, 2021
| | | | | | | | | | | | | | | | | | |
| | | | | | | | | | | | | | West | | | |
|
| | | | | | | | | | | | | | European | | Central- | | |
| | Middle | | | | | | | | | | | | countries | | and East | | |
| | East/ | | Asia excl. | | | | North | | Latin | | | | excl. | | European | |
|
Skr bn |
| Africa |
| Japan |
| Japan |
| America |
| America |
| Sweden |
| Sweden |
| countries |
| Total |
Central governments |
| — |
| 0.4 |
| 2.0 |
| 2.0 |
| — |
| 161.5 |
| 17.0 |
| 2.6 |
| 185.5 |
Regional governments |
| — |
| — |
| — |
| — |
| — |
| 15.3 |
| 0.0 |
| — |
| 15.3 |
Multilateral development banks |
| — |
| — |
| — |
| — |
| — |
| — |
| 3.0 |
| — |
| 3.0 |
Public Sector Entity | | — | | — | | — | | — | | — | | — | | 5.4 | | — | | 5.4 |
Financial institutions |
| 0.0 |
| — |
| 2.4 |
| 4.9 |
| — |
| 15.1 |
| 18.6 |
| 0.2 |
| 41.2 |
Corporates |
| 1.4 |
| 1.2 |
| 3.3 |
| 5.7 |
| 3.3 |
| 82.7 |
| 23.1 |
| 1.4 |
| 122.1 |
Total |
| 1.4 |
| 1.6 |
| 7.7 |
| 12.6 |
| 3.3 | | 274.6 |
| 67.1 |
| 4.2 |
| 372.5 |
| |
Interim report January–June 2022 | Page 25 of 29 |
Net exposure to European countries, excluding Sweden
| | | | |
|
| June 30, |
| December 31, |
Skr bn | | 2022 | | 2021 |
Germany |
| 10.9 |
| 10.3 |
France |
| 10.5 |
| 7.8 |
United Kingdom | | 7.6 | | 7.0 |
Denmark |
| 6.9 |
| 5.4 |
Finland |
| 6.7 |
| 8.2 |
Austria |
| 5.5 |
| 6.0 |
Norway |
| 5.2 |
| 6.8 |
The Netherlands |
| 4.3 |
| 4.0 |
Luxembourg | | 3.2 | | 4.3 |
Spain | | 3.2 | | 2.3 |
Belgium |
| 2.9 |
| 2.9 |
Poland |
| 2.5 |
| 2.8 |
Portugal |
| 1.1 |
| 1.0 |
Ireland |
| 0.9 |
| 0.6 |
Switzerland |
| 0.6 |
| 0.4 |
Serbia |
| 0.4 |
| 0.4 |
Lithuania | | 0.3 | | 0.3 |
Italy |
| 0.2 |
| 0.1 |
Czech Republic | | 0.2 | | 0.2 |
Latvia |
| 0.1 |
| 0.1 |
Iceland |
| 0.1 |
| 0.1 |
Estonia |
| 0.1 |
| 0.1 |
Slovakia |
| 0.1 |
| 0.1 |
Total |
| 73.5 |
| 71.2 |
Note 11. Reference interest rate reform
Since the 2010s, there has been an ongoing reform to replace or amend benchmark interest rates such as LIBOR and other interbank offered rates (“IBOR”). SEK’s exposure that is directly affected by the reference interest rate reform is primarily its lending contracts with floating interest rates, its lending and borrowing contracts at fixed interest rates that are hedged to floating interest rates as well as swaps to floating interest rates. The main floating interest rate exposures relate to USD LIBOR, STIBOR and EURIBOR. LIBOR is the group of benchmark interest rates that currently has a timed settlement plan. GBP LIBOR, CHF LIBOR, EUR LIBOR, JPY LIBOR and USD LIBOR 1W and USD LIBOR 2M ceased on December 31, 2021. For USD LIBOR, the rest of the maturities will expire after June 30, 2023. Outstanding exposures with a reference interest rate of USD LIBOR and a maturity after June 2023 will be converted during the period up to June 30, 2023. Change of reference interest rate during the reform will be carried out with the intention that the change shall be financially neutral for each party. SEK has lending contracts and derivative contracts maturing after June 30, 2023 in USD LIBOR with a nominal amount of USD 1,711 million and USD 17,968 million, respectively. SEK has adhered to the 2020 ISDA Fallback Protocol, which sets a market standard for handling between counterparties the conversion of derivatives to a new reference interest rate during the reference interest rate reform. For lending contracts, conversion is handled by agreement. SEK has applied the relief under IFRS 9 Reform for new reference rates.
Note 12. Transactions with related parties
Transactions with related parties are described in Note 27 to the annual financial statements in SEK’s 2021 Annual Report on Form 20-F. During the first quarter of 2022, SEK repaid the drawdown of Skr 10 billion that was made from the credit facility with the Swedish National Debt Office during the first quarter of 2020. Beyond that, no material changes have taken place in relation to transactions with related parties compared to the description in SEK’s 2021 Annual Report on Form 20-F.
Note 13. Events after the reporting period
No events with significant impact on the information in this report have occurred after the end of the reporting period.
| |
Interim report January–June 2022 | Page 26 of 29 |
The Board of Directors and the Chief Executive Officer confirm that this interim report provides a fair overview of the Consolidated Group’s operations and financial position and result, and describes material risks and uncertainties facing the Consolidated Group.
Stockholm, July 15, 2022
AB SVENSK EXPORTKREDIT
SWEDISH EXPORT CREDIT CORPORATION
Lennart Jacobsen |
| Håkan Berg |
| |
| Chairman of the Board |
| Director of the Board |
|
Anna Brandt |
| Reinhold Geijer |
| Hanna Lagercrantz |
Director of the Board |
| Director of the Board |
| Director of the Board |
Katarina Ljungqvist | Eva Nilsagård | Paula da Silva | ||
Director of the Board | Director of the Board | Director of the Board |
Magnus Montan |
Chief Executive Officer |
SEK has established the following expected dates for the publication of financial information and other related matters:
October 28, 2022 |
| Interim report for the period January 1, 2022 - September 30, 2022 |
February 1, 2023 |
| Year-end report for the period January 1, 2022 - December 31, 2022 |
The report contains information that SEK will disclose pursuant to the Securities Markets Act and/or the Financial Instruments Trading Act. The information was submitted for publication on July 15, 2022, 15:00 (CEST).
Additional information about SEK, including investor presentations and SEK’s 2021 Annual Report on Form 20-F, is available at www.sek.se. Information available on or accessible through SEK’s website is not incorporated herein by reference.
Alternative performance measures (see *)
Alternative performance measures (APMs) are key performance indicators that are not defined under IFRS or in the Capital Requirements Directive IV (CRD IV) or in regulation (EU) No. 575/2013 on prudential requirements for credit institutions and investment firms (CRR). SEK has presented these, either because they are in common use within the industry or because they comply with SEK’s assignment from the Swedish government. The APMs are used internally to monitor and manage operations, and are not considered to be directly comparable with similar key performance indicators presented by other companies. For additional information regarding the APMs, refer to www.sek.se.
*After-tax return on equity
Net profit, expressed as a percentage per annum of the current year’s average equity (calculated using the opening and closing balances for the report period).
*Average interest-bearing assets
This item includes cash and cash equivalents, treasuries/government bonds, other interest-bearing securities except loans, loans in the form of interest-bearing securities, loans to credit institutions and loans to the public, and is calculated using the opening and closing balances for the reporting period.
*Average interest-bearing liabilities
This item includes borrowing from credit institutions, borrowing from the public and debt securities issued and is calculated using the opening and closing balances for the reporting period.
Basic and diluted earnings per share (Skr)
Net profit divided by the average number of shares, which amounted to 3,990,000 for each period.
*CIRR loans as percentage of new lending
The proportion of officially supported export credits (CIRR) of new lending.
CIRR-system
The CIRR-system comprises of the system of -officially supported export credits (CIRR).
Common Equity Tier 1 capital ratio
The capital ratio is the quotient of total common equity tier 1 capital and the total risk exposure amount.
Green bond
A green bond is a bond where the capital is earmarked for various forms of environmental projects.
Green lending and green loans
SEK’s green lending comprises green loans that promote the transition to a low-carbon economy. The classification is performed by sustainability analysts at SEK. The effects that the loan will give rise to, such as reduced emissions of greenhouse gases, are monitored and reported. The term green project is assigned the same meaning as the term green loan. Green loans are categorized under SEK’s framework for green bonds and green loans finance products or services that lead to significant and demonstrable progress toward the goal of sustainable development.
Leverage ratio
Tier 1 capital expressed as a percentage of the exposure measured under CRR (refer to Note 9).
Liquidity coverage ratio (LCR)
The liquidity coverage ratio is a liquidity metric that shows SEK’s highly -liquid assets in relation to the company’s net cash outflows for the next 30 calendar days. An LCR of 100 percent means that the company’s liquidity reserve is of sufficient size to enable the company to manage stressed liquidity outflows over a period of 30 days. Unlike the Swedish FSA’s rules, the EU rules take into account the outflows that correspond to the need to pledge collateral for derivatives that would arise as a result of the effects of a negative market scenario.
Loans
Lending pertains to all credit facilities provided in the form of interest-bearing securities, and credit facilities granted by traditional documentation. SEK considers these amounts to be useful measurements of SEK’s lending volumes. Accordingly, comments on lending volumes in this report pertain to amounts based on this definition.
*Loans, outstanding and undisbursed
The total of loans in the form of interest-bearing securities, loans to credit institutions, loans to the public and loans, outstanding and undisbursed. Deduction is made for cash collateral under the security agreements for derivative contracts and deposits with time to maturity exceeding three months (see the Statement of Financial Position and Note 8).
Net stable funding ratio (NSFR)
This ratio measures stable funding in relation to the company’s illiquid assets over a one-year, stressed scenario in accordance with CRRII.
*New lending
New lending includes all new committed loans, irrespective of tenor. Not all new lending is reported in the Consolidated Statement of Financial Position and the Consolidated Statement of Cash Flows since certain portions comprise committed undisbursed loans (see Note 8). The amounts reported for committed undisbursed loans may change when presented in the Consolidated Statement of Financial Position due to changes in exchange rates, for example.
*New long-term borrowings
New borrowings with maturities exceeding one year, for which the amounts are based on the trade date.
*Outstanding senior debt
The total of borrowing from credit institutions, borrowing from the public and debt securities issued.
Own credit risk
Net fair value change due to credit risk on financial liabilities designated as at fair value through profit or loss.
Repurchase and redemption of own debt
The amounts are based on the trade date.
Social loans
Social loans are offered to exporters and suppliers for projects, often in developing countries, whose aim is to improve social conditions.
Sustainability-linked loans
Sustainability-linked loans concern working capital connected to the borrower’s sustainability targets, for example, energy-efficiency enhancements, reduced transportation or reduced number of accidents. If the borrower reaches their targets, they are rewarded with a lower interest rate.
Swedish exporters
SEK’s clients that directly or indirectly promote Swedish export.
Tier 1 capital ratio
The capital ratio is the quotient of total tier 1 capital and the total risk exposure amount.
Total capital ratio
The capital ratio is the quotient of total Own funds and the total risk exposure amount.
Unless otherwise stated, amounts in this report are in millions (mn) of Swedish kronor (Skr), abbreviated “Skr mn” and relate to the group consisting of the Parent Company and its consolidated subsidiary (together, the “Group” or the “Consolidated Group”). AB Svensk Exportkredit (SEK), is a Swedish corporation with the identity number 556084-0315, and with its registered office in Stockholm, Sweden. SEK is a public limited liability company as defined in the Swedish Companies Act. In some instances, under Swedish law, a public company is obliged to add “(publ.)” to its company name.
| |
Interim report January–June 2022 | Page 28 of 29 |
About Swedish Export Credit Corporation (SEK)
SEK is owned by the Swedish state, and since 1962 has enabled growth for thousands of Swedish companies. To expand their production, make acquisitions, employ more people and enable selling goods and services to customers worldwide.
| |
SEK’s mission | Our mission is to ensure access to financial solutions for the Swedish export industry on commercial and sustainable terms. The mission includes making available fixed-interest export credits within the officially supported CIRR-system.
|
SEK’s vision | Our vision is a sustainable world through increased Swedish exports.
|
SEK’s core values | We are professionals, make the difficult easy and build sustainable relationships.
|
SEK’s clients | We finance exporters, their subcontractors and foreign clients. The target group is companies with annual sales exceeding Skr 200 million and that are linked to Swedish interests and exports.
|
SEK’s partnerships | Through Team Sweden, we have close partnerships with other export promotion agencies in Sweden such as Business Sweden and The Swedish Export Credit Agency (EKN). Our international network is substantial and we also work with numerous Swedish and international banks. |
| |
Interim report January–June 2022 | Page 29 of 29 |