UNITED STATES
SECURITIES AND EXCHANGE COMMISSION
Washington, D.C. 20549
FORM 6-K
Report of Foreign Private Issuer
Pursuant to Rule 13a-16 or 15d-16 under
the Securities Exchange Act of 1934
For the month of July, 2024
Commission File Number
001-08382
Aktiebolaget Svensk Exportkredit (publ)
Swedish Export Credit Corporation
(Translation of Registrant’s Name into English)
Fleminggatan 20
SE-112 26 Stockholm
Sweden
(Address of Principal Executive Offices)
Indicate by check mark whether the registrant files or will file annual reports under cover Form 20-F or Form 40-F.
| |
Form 20-F ☒ | Form 40-F ☐ |
Incorporation by Reference
This Report on Form 6-K, including the exhibits hereto, is hereby incorporated by reference, in its entirety, into the registration statement on Form F-3 (File No. 333-275269) of Aktiebolaget Svensk Exportkredit (publ) (“SEK”).
This Report comprises the following:
1. |
| Registrant’s report for the second quarter of 2024. |
| | |
Exhibit 99.2 | | Table of unaudited consolidated capitalization of the Registrant. |
| | |
101.INS | | XBRL Instance Document. |
| | |
101.SCH | | XBRL Taxonomy Extension Schema Document. |
| | |
101.CAL | | XBRL Taxonomy Extension Calculation Linkbase Document. |
| | |
101.DEF | | XBRL Taxonomy Extension Definition Linkbase Document. |
| | |
101.LAB | | XBRL Taxonomy Extension Labels Linkbase Document. |
| | |
101.PRE | | XBRL Taxonomy Extension Presentation Linkbase Document. |
1
2
SIGNATURE
Pursuant to the requirements of the Securities Exchange Act of 1934, the Registrant has duly caused this Report to be signed on its behalf by the undersigned, thereunto duly authorized.
Dated: July 16, 2024
| AB Svensk Exportkredit (publ) | |
| (Swedish Export Credit Corporation) | |
|
| |
| By: | /s/ Magnus Montan |
|
| Magnus Montan, Chief Executive Officer |
3
| AB Svensk Exportkredit |


January–June 2024
(Compared to the period January-June 2023)
● | Net interest income Skr 1,536 million (1H23: Skr 1,357 million) |
● | Operating profit Skr 794 million (1H23: Skr 646 million) |
● | Net profit Skr 630 million (1H23: Skr 513 million) |
● | Lending portfolio growth -2.3 percent (1H23: 5.2 percent) |
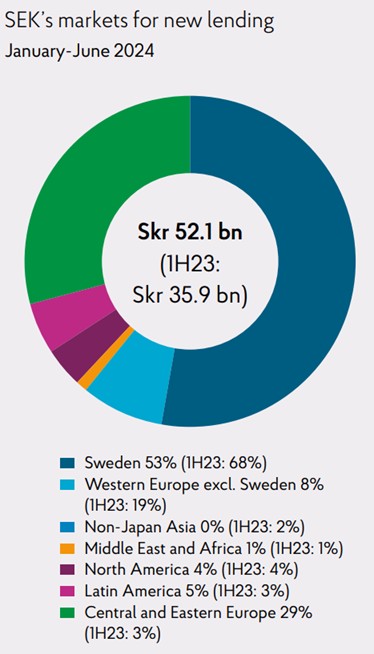
● | New lending Skr 52.1 billion (1H23: Skr 35.9 billion) |
● | Basic and diluted earnings per share Skr 158 (1H23: Skr 129) |
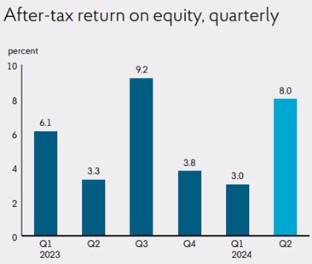
● | After-tax return on equity 5.5 percent (1H23: 4.7 percent) |
April–June 2024
(Compared to the period April-June 2023)
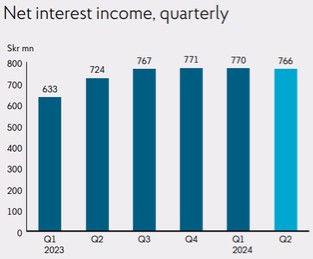
● | Net interest income Skr 766 million (2Q23: Skr 724 million) |
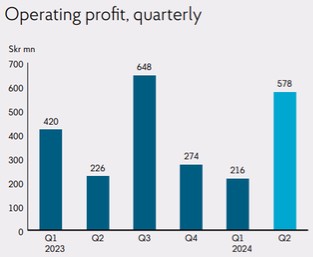
● | Operating profit Skr 578 million (2Q23: Skr 226 million) |
● | Net profit Skr 459 million (2Q23: Skr 179 million) |
● | Lending portfolio growth -2.4 percent (2Q23: 1.8 percent) |
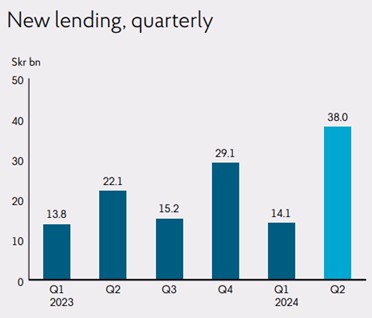
● | New lending Skr 38.0 billion (2Q23: Skr 22.1 billion) |
● | Basic and diluted earnings per share Skr 115 (2Q23: Skr 45) |
● | After-tax return on equity 8.0 percent (2Q23: 3.3 percent) |
Equity and balances
(Compared to December 31, 2023)
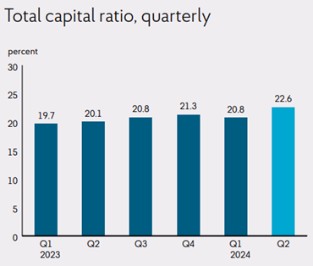
● | Total capital ratio 22.6 percent (year-end 2023: 21.3 percent) |
● | Total assets Skr 374.3 billion (year-end 2023: Skr 365.9 billion) |
● | Total lending portfolio Skr 276.7 billion (year-end 2023: Skr 283.3 billion) |
– | of which sustainability classified lending Skr 49.4 billion (year-end 2023: Skr 44.6 billion) |
● | Loans, outstanding and undisbursed Skr 343.8 billion (year-end 2023: Skr 338.3 billion) |
● | Outstanding senior debt Skr 327.2 billion (year-end 2023: Skr 317.7 billion) |
– | of which green borrowings Skr 28.8 billion (year-end 2023: Skr 23.7 billion) |

Historically high net interest income and strong net profit
SEK’s high level of activity in the first six months of the year has generated increased business volumes, both in terms of working capital finance for Swedish exporters and in terms of financing of Swedish companies’ export transactions. Higher margins resulted in historically high net interest income and also contributed to the strong net profit.
To date, 2024 has been characterized by continued turbulence in our operating environment, including as a result of ongoing armed conflicts and geopolitical tensions, which can negatively impact supply chains and create volatility in financial markets. Nevertheless, global stock markets and commodity prices have risen over the course of the year, and confidence in Sweden’s economic outlook has increased despite the relative weakness of the Swedish economy. Inflation has receded, and the Riksbank implemented its first rate cut in May and is forecasting up to three additional rate cuts this year. Lower interest rates in the second half of the year could boost the economy as well as Swedish companies financial positions and willingness to invest. Following a downturn in the second half of 2023, the corporate lending market in Sweden rose slightly in spring 2024.
SEK’s Export Credit Trends Survey, published in June 2024, indicates a brighter outlook among exporters. Despite challenges in the operating environment in recent years, Swedish exporters retain undiminished focus on the climate transition and seven out of ten companies are planning investments to reduce climate impact in their value chains.
SEK remains a positive force in the climate transition and increased its sustainability classified lending during the second quarter of 2024, making, for example, a “social loan” (i.e. a loan the purpose of which is to stimulate socially sustainable investments) to finance Swedish products and services used in connection with the construction of a hospital in Guyana. Total sustainability classified lending amounted to approximately Skr 49.4 billion, up from Skr 44.6 billion at year-end.
New lending for the first half of 2024 amounted to Skr 52.1 billion (1H23: Skr 35.9 billion), such increase largely driven by multiple new customers within our Mid Corporates business area and continued high demand in the defense sector. Net interest income totaled Skr 1,536 million (1H23: Skr 1,357 million), up 13 percent year-on-year. Higher margins in the lending portfolio, in part attributable to the increased share of working capital finance to Swedish exporters, have contributed to the high net interest income and strong net profit. Net profit for the first six months was Skr 630 million (1H23: Skr 513 million). The return on equity amounted to 8.0 percent for the second quarter and 5.5 percent for the period January-June.
SEK’s role as a long-term stable financial partner is of the greatest importance for many Swedish exporters and their customers. As we enter the second half of 2024, SEK is well capitalized, has good liquidity preparedness and a high level of activity, all of which are expected to contribute to the positive development of SEK’s business over the remainder of the year.
| ||
Magnus Montan Chief Executive Officer |

Higher pace for new lending
The second quarter of 2024 was characterized by active capital markets with good financing opportunities for companies. SEK’s high level of activity generated substantial business volumes during the quarter, which were up significantly year-on-year.
New lending amounted to Skr 38.0 billion (2Q23: Skr 22.1 billion) during the seconds quarter, with export credits and working capital finance to Swedish exporters both contributing to this number. The volume of new lending was a clear improvement compared to the first quarter of 2024 where new lending amounted to Skr 14.1 billion.
For the first six months of the year, new lending was Skr 52.1 billion, as compared with Skr 35.9 billion for the corresponding period last year.
SEK has continued to expand its client portfolio and, during the first half of the year, signed eight new clients, all falling within SEK’s Mid Corporates business area. This expansion of the client base denotes the important role that SEK plays for this customer segment. Several of the new transactions in which SEK has been involved were completed in close collaboration with Nordic banks. SEK’s complementary role as a financial partner has ensured client’s access to long-term financing, strengthening those companies’ competitiveness.
Overall, the lending portfolio has decreased marginally compared to year-end 2023 as a result of the strengthening of the Swedish krona and the decision of a number of clients to repay their loans early.
| | | | | | |
SEK’s lending | ||||||
Skr bn |
| Jan-Jun 2024 |
| Jan-Jun 2023 |
| Jan-Dec 2023 |
New lending to Swedish exporters1 |
| 20.6 |
| 17.0 |
| 29.8 |
New lending to exporters’ customers2 |
| 31.5 |
| 18.9 |
| 50.4 |
Total new lending |
| 52.1 |
| 35.9 |
| 80.2 |
of which CIRR-loans | | 16.0 | | — | | 5.5 |
Total lending portfolio3 |
| 276.7 | | 287.8 | | 283.3 |
1 | Of which Skr 1.8 billion (1H23: Skr 0.0 billion; year-end 2023: Skr 1.2 billion) had not been disbursed at period end. |
2 | Of which Skr 15.8 billion (1H23: Skr 0.9 billion; year-end 2023: Skr 9.5 billion) had not been disbursed at period end. |
3 | Balance at period end. |
| |
Interim report January–June 2024 | Page 4 of 28 |
Capital markets remain strong
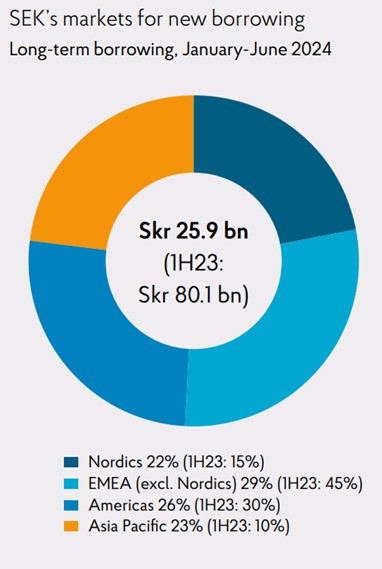
Demand for the SSA (supranational, sub-sovereign and agency) segment in international capital markets remains robust. SEK completed a number of smaller transactions in various currencies and with various maturities during the quarter.
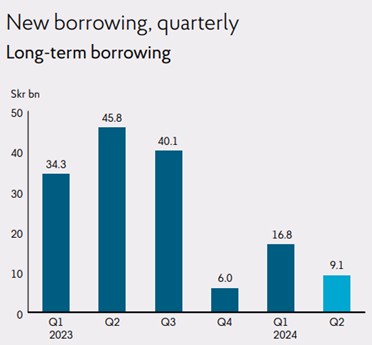
Due to a lower borrowing need in the second quarter of 2024, SEK raised borrowings of Skr 9.1 billion with maturities of more than one year compared with Skr 45.8 billion in the second quarter of 2023. SEK’s borrowing for the first half of 2024 totaled Skr 66.6 billion (1H23: Skr 102.1 billion).
| | | | | | |
SEK’s borrowing | ||||||
Skr bn |
| Jan-Jun 2024 |
| Jan-Jun 2023 |
| Jan-Dec 2023 |
New long-term borrowing |
| 25.9 |
| 80.1 |
| 126.2 |
New short-term borrowing | | 40.7 | | 22.0 | | 50.1 |
Outstanding senior debt1 |
| 327.2 |
| 348.1 |
| 317.7 |
Repurchase and redemption of own debt |
| 5.4 |
| 5.9 |
| 12.2 |
1 | Balance at period end. |
| |
Interim report January–June 2024 | Page 5 of 28 |
January-June 2024
Operating profit amounted to Skr 794 million (1H23: Skr 646 million). Net profit amounted to Skr 630 million (1H23: Skr 513 million). The increase in net profit compared to the same period in the previous year was primarily the result of higher net interest income and net results of financial transactions, offset in part by higher operating expenses and net credit losses.
Net interest income
Net interest income amounted to Skr 1,536 million (1H23: Skr 1,357 million), representing an increase of 13 percent compared to the same period in the previous year. Higher margins in the lending portfolio contributed to higher net interest income during the period.
The table below shows average interest-bearing assets and liabilities.
| | | | | | |
|
| Jan-Jun |
| Jan-Jun |
| |
Skr bn, average | | 2024 | | 2023 | | Change |
Total lending portfolio |
| 280.0 |
| 280.6 |
| 0% |
Liquidity investments |
| 67.0 |
| 79.5 |
| -16% |
Interest-bearing assets |
| 354.9 |
| 370.3 |
| -4% |
Interest-bearing liabilities |
| 322.5 |
| 337.2 |
| -4% |
Net results of financial transactions
Net results of financial transactions amounted to Skr -51 million (1H23: Skr -98 million). The results were primarily attributable to unrealized value changes of financial instruments caused by changes in cross-currency basis spreads.
SEK’s general business model is to hold financial instruments measured at fair value until maturity. Accordingly, the results of market value changes tend to net toward zero over time.
Operating expenses
Operating expenses amounted to Skr -387 million (1H23: Skr -354 million), representing an increase of 9 percent compared to the same period in the previous year. The increase is primarily attributable to increased personnel expenses largely due to consultant exchanges and fewer development costs being capitalized. A provision of Skr 4 million was made for the individual variable remuneration program (1H23: –).
Net credit losses
Net credit losses amounted to Skr -281 million (1H23: Skr -239 million). Net credit losses were mainly attributable to increased provisions for expected credit losses for two individual exposures in stage 3. During the period, SEK had established losses amounting to Skr 113 million attributable to one exposure that had previously been fully reserved. The loss was established in connection with a restructuring process. SEK assesses that the credit quality of its lending portfolio remains high.
Loss allowances as of June 30, 2024 amounted to Skr -983 million compared to Skr -795 million as of December 31, 2023, of which
exposures in stage 3 amounted to Skr -890 million (year-end 2023: Skr -567 million). The provision ratio amounted to 0.28 percent (year-end 2023: 0.23 percent).
SEK’s IFRS 9 model is based on a business cycle parameter. The business cycle parameter reflects the general risk of default in each probability of default (PD) segment and should reflect the general risk of default in the economy. Due to the current state of macroeconomic uncertainty, SEK has made an overall adjustment according to management’s assessment, see Note 4.
Taxes
Tax costs amounted to Skr -164 million (1H23: Skr -133 million), and the effective tax rate amounted to 20.7 percent (1H23: 20.6 percent).
Other comprehensive income (OCI)
Other comprehensive income before tax amounted to Skr 115 million (1H23: Skr -7 million). The result is mainly attributable to a positive result related to changes in own credit risk due to increased credit spreads on long maturities in euro.
April-June 2024
Operating profit amounted to Skr 578 million (2Q23: Skr 226 million). Net profit amounted to Skr 459 million (2Q23: Skr 179 million). The increase in net profit compared to the same period in the previous year was primarily the result of the positive outcome for net credit losses and higher net interest income.
Net interest income
Net interest income amounted to Skr 766 million (2Q23: Skr 724 million), representing an increase of 6 percent compared to the same period in the previous year. Higher margins in the lending portfolio contributed to higher net interest income during the period.
The table below shows average interest-bearing assets and liabilities.
| | | | | | |
|
| Apr-Jun |
| Apr-Jun |
| |
Skr bn, average | | 2024 | | 2023 | | Change |
Total lending portfolio |
| 280.1 |
| 285.3 |
| -2% |
Liquidity investments |
| 73.5 |
| 85.2 |
| -14% |
Interest-bearing assets |
| 358.3 |
| 379.5 |
| -6% |
Interest-bearing liabilities |
| 328.5 |
| 346.5 |
| -5% |
Net results of financial transactions
Net results of financial transactions amounted to Skr -16 million (2Q23: Skr -48 million), which primarily relates to unrealized value changes in short currency swaps.
Operating expenses
Operating expenses amounted to Skr -206 million (2Q23: Skr -181 million), representing an increase of 14 percent compared to the same period in the previous year. The increase is primarily attributable to increased personnel expenses largely due to consultant exchanges and fewer development costs being capitalized. A provision of Skr 4 million was made for the individual variable remuneration program (2Q23: –).
Net credit losses
Net credit losses amounted to Skr 46 million (2Q23: Skr -256 million). The positive result was mainly attributable to decreased provisions for expected credit losses in stage 1 amounting to Skr 36 million. This change was driven by more positive scenario weights in SEK’s IFRS 9 model for certain scenarios during this quarter.
SEK’s IFRS 9 model is based on a business cycle parameter. The business cycle parameter reflects the general risk of default in each probability of default (PD) segment and should reflect the general risk of default in the economy. Due to the current state of macroeconomic uncertainty, SEK has made an overall adjustment according to management’s assessment, see Note 4.
Taxes
Tax costs amounted to Skr -119 million (2Q23: Skr -47 million), and the effective tax rate amounted to 20.6 percent (2Q23: 20.8 percent).
Other comprehensive income (OCI)
Other comprehensive income before tax amounted to Skr 47 million (2Q23: Skr -27 million). This result is partly explained by a positive result of Skr 24 million obtained from derivatives in cash flow hedging with approaching maturities, and partly by positive results of Skr 22 million owing to changes in own credit risk due to increased credit spreads on long maturities in euro.
Statement of Financial Position
Total assets and liquidity investments
Total assets increased by 2 percent compared to year-end 2023. An increased volume of liquidity investments drove the increase in the company’s assets.
| | | | | | |
|
| June 30, |
| December 31, |
| |
Skr bn | | 2024 | | 2023 | | Change |
Total assets |
| 374.3 |
| 365.9 |
| 2% |
Liquidity investments |
| 77.4 |
| 56.6 |
| 37% |
Total lending portfolio |
| 276.7 |
| 283.3 |
| -2% |
of which sustainability classified | | 49.4 | | 44.6 | | 11% |
of which CIRR-loans |
| 97.4 |
| 101.4 |
| -4% |
Liabilities and equity
As of June 30, 2024, the aggregate volume of available funds and shareholders’ equity exceeded the aggregate volume of loans outstanding and loans committed at all maturities. SEK considers all of its outstanding commitments to be covered through maturity.
SEK has a credit facility in place with the Swedish National Debt Office of up to Skr 150 billion. The credit facility can be utilized when the Swedish export industry’s demand for financing is particularly high.
Capital adequacy
As of June 30, 2024, SEK’s total own funds amounted to Skr 22.8 billion (year-end 2023: Skr 22.3 billion). The total capital ratio was 22.6 percent (year-end 2023: 21.3 percent), representing a margin of 5.3 percentage points above SEK’s estimate of Finansinspektionen’s (the “Swedish FSA”) requirement of 17.3 percent as of June 30, 2024. The corresponding Common Equity Tier 1 capital estimated requirement was 12.2 percent. Given that SEK’s own funds are comprised solely of Common Equity Tier 1 capital, this total capital ratio represents a margin of 10.4 percentage points above the requirement. Overall, SEK is strongly capitalized.
| | | | |
|
| June 30, |
| December 31, |
Percent | | 2024 | | 2023 |
Common Equity Tier 1 capital ratio |
| 22.6 |
| 21.3 |
Tier 1 capital ratio |
| 22.6 |
| 21.3 |
Total capital ratio |
| 22.6 |
| 21.3 |
Leverage ratio |
| 8.7 |
| 9.3 |
Liquidity coverage ratio (LCR) |
| 670 |
| 494 |
Net stable funding ratio (NSFR) |
| 133 |
| 131 |
| |
Interim report January–June 2024 | Page 7 of 28 |
Rating
| | | | |
|
| Skr |
| Foreign currency |
Moody’s |
| Aa1/Stable |
| Aa1/Stable |
Standard & Poor’s |
| AA+/Stable |
| AA+/Stable |
Other events
At SEK’s annual general meeting held on March 26, 2024, Ms. Anna Brandt stepped down from her position as a member of the Board of Directors of SEK (the “Board”) after six years of service, and Mr. Carl Mellander was elected as a new member of the Board. Additionally, the Board passed a resolution at the annual general meeting to adopt the income statement and balance sheet in the Annual and Sustainability Report 2023, and to appropriate distributable funds pursuant to the Board’s proposal.
Effective April 25, 2024, SEK’s Chief Financial Officer (“CFO”), Mr. Stefan Friberg, left the Company and Mr. Jens Hedar, Head of Customer Relations, assumed the role as acting CFO. Also effective April 25, 2024, Ms. Maria Simonson, became acting Head of Customer Relations in addition to her role as Head of Sustainability.
The macro environment
In the first quarter of 2024, Sweden’s GDP increased 0.7 percent quarter-on-quarter. Exports increased 0.2 percent. Unemployment amounted to 8.2 percent at the end of May 2024, which was an increase compared to the end of February 2024. The rate of inflation in May 2024 was 2.3 percent, unchanged from April 2024.
In May 2024, the Riksbank lowered the policy rate by 0.25 percentage points to 3.75 percent, the first such cut in many years.
SEK believes that there is a higher-than-normal level of risk in the financial markets that can negatively affect the company, including as a result of ongoing armed conflicts and geopolitical tensions, which can negatively impact supply chains and create volatility in the financial markets. Russia’s war in Ukraine has a limited direct financial effect on SEK. Since before the outbreak of the war, the Company has had gross exposure of EUR 6.5 million to one Russian counterparty, which is 100 percent risk-covered. SEK has no exposure to Ukraine or Belarus. However, the high degree of uncertainty in the financial markets occasioned by Russia’s war in Ukraine as well as other ongoing military conflicts may have a more concrete and long-term detrimental effect on SEK’s customers and, accordingly, on SEK. The Western world has gradually escalated sanctions against Russia and continues to support Ukraine with military and protective equipment as well as with direct economic support to Ukraine’s armed forces. The long-term humanitarian and socioeconomic effects of Russia’s war in Ukraine are expected to be extensive, and the prevailing geopolitical tensions caused by the conflict could persist for a long time. Additionally, the ongoing armed conflict between Israel and Hamas also contributes to this state of uncertainty. Iran’s attack on Israel shows that a further escalation
of the conflict and the involvement of other countries and/or non-state actors in the region remain possible. Furthermore, the Houthi militia’s attacks on commercial ships in the Red Sea had a negative effect on trade flows with higher freight rates and shipping delays.
SEK believes that information security threats, particularly in relation to cybersecurity, have increased and remain more acute than before as a consequence of Sweden’s membership in NATO and support of Ukraine.
Risk factors
SEK’s operations are exposed to various types of risks, including primarily credit risks, but also market, liquidity, refinancing, operational and sustainability risks. For a more detailed description of these risks, refer to the separate risk report Capital Adequacy and Risk Management Report (Pillar 3) 2023 and Note 30 to the annual financial statements included in SEK’s 2023 Annual Report on Form 20-F, as well as the “Risk Factors” section in SEK’s 2023 Annual Report on Form 20-F.
| |
Interim report January–June 2024 | Page 8 of 28 |
Financial targets
Profitability target | A return on equity after tax of at least 5 percent. | |
Dividend policy | Payment of an ordinary dividend of 20-40 percent of the profit for the year. | |
Capital target | SEK’s total capital ratio is to exceed the Swedish FSA’s requirement by 2 to 4 percentage points and SEK’s Common Equity Tier 1 capital ratio is to exceed the Swedish FSA’s requirement by at least 4 percentage points. Currently, the capital targets mean that the total capital ratio should amount to 19.3-21.3 percent and the Common Equity Tier 1 capital ratio should amount to 16.2 percent, based on SEK’s estimation of the Swedish FSA’s requirements as of June 30, 2024. | |
Key performance indicators (unaudited)
| | | | | | | | | | | | |
|
| Apr-Jun |
| Jan-Mar |
| Apr-Jun |
| Jan-Jun |
| Jan-Jun |
| Jan-Dec |
Skr mn (if not otherwise indicated) | | 2024 | | 2024 | | 2023 | | 2024 | | 2023 | | 2023 |
New lending |
| 38,008 |
| 14,052 |
| 22,143 |
| 52,060 |
| 35,906 |
| 80,159 |
of which to Swedish exporters |
| 15,470 |
| 5,065 |
| 11,515 | | 20,535 |
| 16,960 |
| 29,788 |
of which to exporters’ customers |
| 22,538 |
| 8,987 |
| 10,628 | | 31,525 |
| 18,946 |
| 50,371 |
of which CIRR-loans | | 14,424 | | 1,528 | | — | | 15,952 | | — | | 5,539 |
Total lending portfolio1 | | 276,679 | | 283,541 | | 287,782 | | 276,679 | | 287,782 | | 283,303 |
of which green | | 35,667 | | 31,497 | | 29,250 | | 35,667 | | 29,250 | | 31,202 |
of which social | | 1,702 | | 1,631 | | 1,407 | | 1,702 | | 1,407 | | 1,482 |
of which sustainability-linked | | 12,009 | | 12,053 | | 12,285 | | 12,009 | | 12,285 | | 11,926 |
Loans, outstanding and undisbursed1 |
| 343,779 |
| 339,848 | | 346,288 | | 343,779 | | 346,288 | | 338,278 |
| | | | | | | | | | | | |
Customer growth | | 0% | | 1% | | 0% | | 1% | | 1% | | 3% |
| | | | | | | | | | | | |
New long-term borrowings |
| 9,122 |
| 16,799 |
| 45,757 | | 25,921 | | 80,067 | | 126,214 |
New short-term borrowings | | 19,359 | | 21,319 | | 1,528 | | 40,678 | | 21,980 | | 50,051 |
Outstanding senior debt1 | | 327,168 | | 329,811 | | 348,056 | | 327,168 | | 348,056 | | 317,736 |
of which green |
| 28,828 |
| 25,300 |
| 21,070 | | 28,828 | | 21,070 | | 23,652 |
| | | | | | | | | | | | |
After-tax return on equity |
| 8.0% | | 3.0% | | 3.3% | | 5.5% | | 4.7% | | 5.6% |
| | | | | | | | | | | | |
Common Equity Tier 1 capital ratio1 |
| 22.6% | | 20.8% | | 20.1% | | 22.6% | | 20.1% | | 21.3% |
Tier 1 capital ratio1 |
| 22.6% | | 20.8% | | 20.1% | | 22.6% | | 20.1% | | 21.3% |
Total capital ratio1 |
| 22.6% | | 20.8% | | 20.1% | | 22.6% | | 20.1% | | 21.3% |
Leverage ratio |
| 8.7% | | 8.8% | | 8.1% | | 8.7% | | 8.1% | | 9.3% |
Liquidity coverage ratio (LCR) |
| 670% | | 509% | | 329% | | 670% | | 329% | | 494% |
Net stable funding ratio (NSFR) |
| 133% | | 136% | | 128% | | 133% | | 128% | | 131% |
Risk exposure amount1 | | 100,921 | | 107,523 | | 106,527 | | 100,921 | | 106,527 | | 104,714 |
1 | Balance at period end. |
See definitions on page 27.
| |
Interim report January–June 2024 | Page 9 of 28 |
Condensed Consolidated Statement of Comprehensive Income (unaudited)
| | | | | | | | | | | | | | |
| | | | Apr–Jun | | Jan–Mar | | Apr–Jun | | Jan-Jun | | Jan-Jun | | Jan-Dec |
Skr mn |
| Note |
| 2024 |
| 2024 |
| 2023 |
| 2024 |
| 2023 |
| 2023 |
Interest income | | | | 4,981 |
| 5,079 |
| 4,724 | | 10,060 | | 8,767 |
| 19,438 |
Interest expenses | | | | -4,215 |
| -4,309 |
| -4,000 | | -8,524 | | -7,410 |
| -16,543 |
Net interest income |
| 2 | | 766 |
| 770 |
| 724 | | 1,536 | | 1,357 |
| 2,895 |
| | | | | | | | | | | | | | |
Net fee and commission expense |
| | | -12 |
| -11 |
| -13 | | -23 | | -20 |
| -51 |
Net results of financial transactions |
| 3 | | -16 |
| -35 |
| -48 | | -51 | | -98 |
| 21 |
Total operating income | | | | 738 |
| 724 |
| 663 | | 1,462 | | 1,239 |
| 2,865 |
| | | | | | | | | | | | | | |
Personnel expenses |
| | | -130 |
| -108 |
| -105 | | -238 | | -206 |
| -402 |
Other administrative expenses |
| | | -60 |
| -57 |
| -59 | | -117 | | -115 |
| -222 |
Depreciation and impairment of non-financial assets |
| | | -16 |
| -16 |
| -17 | | -32 | | -33 |
| -88 |
Total operating expenses | | | | -206 |
| -181 |
| -181 | | -387 | | -354 |
| -712 |
| | | | | | | | | | | | | | |
Operating profit before credit losses | | | | 532 |
| 543 |
| 482 | | 1,075 | | 885 |
| 2,153 |
| | | | | | | | | | | | | | |
Net credit losses |
| 4 | | 46 |
| -327 |
| -256 | | -281 | | -239 |
| -585 |
Operating profit | | | | 578 |
| 216 |
| 226 | | 794 | | 646 |
| 1,568 |
| | | | | | | | | | | | | | |
Tax expenses |
| | | -119 |
| -45 |
| -47 | | -164 | | -133 |
| -324 |
Net profit1 | | | | 459 |
| 171 |
| 179 | | 630 | | 513 |
| 1,244 |
| | | | | | | | | | | | | | |
Other comprehensive income related to: | | | | | | | | | | | | | | |
Items to be reclassified to profit or loss | | | | | | | | | | | | | | |
Derivatives in cash flow hedges | | | | 24 | | -8 | | -39 | | 16 | | -28 | | 63 |
Tax on items to be reclassified to profit or loss |
| | | -5 | | 2 | | 8 | | -3 | | 6 | | -13 |
Net items to be reclassified to profit or loss | | | | 19 | | -6 | | -31 | | 13 | | -22 | | 50 |
| | | | | | | | | | | | | | |
Items not to be reclassified to profit or loss | | | | | | | | | | | | | | |
Own credit risk | | | | 22 | | 75 | | 12 | | 97 | | 21 | | -23 |
Revaluation of defined benefit plans | | | | 1 |
| 1 |
| 0 | | 2 | | 0 |
| -6 |
Tax on items not to be reclassified to profit or loss |
| | | -5 |
| -15 |
| -2 | | -20 | | -4 |
| 6 |
Net items not to be reclassified to profit or loss | | | | 18 |
| 61 |
| 10 | | 79 | | 17 |
| -23 |
| | | | | | | | | | | | | | |
Total other comprehensive income | | | | 37 |
| 55 |
| -21 | | 92 | | -5 |
| 27 |
| | | | | | | | | | | | | | |
Total comprehensive income1 | | | | 496 |
| 226 |
| 158 | | 722 | | 508 |
| 1,271 |
| | | | | | | | | | | | | | |
Skr |
| |
| |
| |
| |
| |
|
|
| |
Basic and diluted earnings per share2 | | | | 115 | | 43 | | 45 | | 158 | | 129 | | 312 |
1 | The entire profit is attributable to the shareholder of the Parent Company. |
2 | Net profit divided by average number of shares, which amounts to 3,990,000 for each period. |
Consolidated Statement of Financial Position (unaudited)
| | | | | | |
| | | | June 30, | | December 31, |
Skr mn |
| Note |
| 2024 |
| 2023 |
Assets | | | | | | |
Cash and cash equivalents |
| 5 |
| 11,860 |
| 3,482 |
Treasuries/government bonds |
| 5 |
| 8,216 |
| 11,525 |
Other interest-bearing securities except loans |
| 5 |
| 57,358 |
| 41,561 |
Loans in the form of interest-bearing securities |
| 4, 5 |
| 49,447 |
| 51,227 |
Loans to credit institutions |
| 4, 5 |
| 12,846 |
| 19,009 |
Loans to the public |
| 4, 5 |
| 219,053 |
| 224,165 |
Derivatives |
| 5, 6 |
| 6,904 |
| 6,432 |
Shares | | | | 34 | | — |
Tangible and intangible assets |
| |
| 223 |
| 245 |
Deferred tax asset | | | | 9 | | 13 |
Other assets |
| |
| 444 |
| 276 |
Prepaid expenses and accrued revenues |
| |
| 7,893 |
| 7,994 |
Total assets | | |
| 374,287 |
| 365,929 |
| | | | | | |
Liabilities and equity | | | | | | |
Borrowing from credit institutions |
| 5, 7 |
| 3,660 |
| 3,628 |
Debt securities issued |
| 5, 7 |
| 323,508 |
| 314,108 |
Derivatives |
| 5, 6 |
| 7,267 |
| 12,637 |
Other liabilities |
| |
| 7,817 |
| 4,272 |
Accrued expenses and prepaid revenues |
| |
| 8,694 |
| 8,387 |
Provisions |
| |
| 21 |
| 51 |
Total liabilities | | |
| 350,967 |
| 343,083 |
| | | | | | |
Share capital | | |
| 3,990 |
| 3,990 |
Reserves | | |
| 5 |
| -87 |
Retained earnings | | |
| 19,325 |
| 18,943 |
Total equity |
| |
| 23,320 |
| 22,846 |
| | | | | | |
Total liabilities and equity | | |
| 374,287 |
| 365,929 |
| |
Interim report January–June 2024 | Page 11 of 28 |
Condensed Consolidated Statement of Changes in Equity (unaudited)
| | | | | | | | | | | | |
| | | | | | Reserves | | | ||||
| | | | | | Hedge | | Own | | Defined | | Retained |
Skr mn |
| Equity |
| Share capital |
| reserve |
| credit risk |
| benefit plans |
| earnings |
Opening balance of equity January 1, 2023 |
| 21,575 | | 3,990 | | -97 | | -23 | | 6 | | 17,699 |
Net profit Jan-Jun 2023 | | 513 | | | | | | | | | | 513 |
Other comprehensive income Jan-Jun 2023 |
| -5 | | | | -22 | | 17 | | 0 |
| |
Total comprehensive income Jan-Jun 2023 | | 508 | | — | | -22 | | 17 | | 0 | | 513 |
Dividend |
| — | | | | |
| |
| |
| — |
Closing balance of equity June 30, 20231 |
| 22,083 | | 3,990 | | -119 | | -6 | | 6 |
| 18,212 |
| | | | | | | | | | | | |
Opening balance of equity January 1, 2023 |
| 21,575 |
| 3,990 |
| -97 |
| -23 |
| 6 |
| 17,699 |
Net profit Jan-Dec 2023 | | 1,244 | | | | | | | | | | 1,244 |
Other comprehensive income Jan-Dec 2023 | | 27 | | | | 50 | | -18 | | -5 | | |
Total comprehensive income Jan-Dec 2023 |
| 1,271 | | — | | 50 | | -18 | | -5 |
| 1,244 |
Dividend | | — | | | | | | | | | | — |
Closing balance of equity December 31, 20231 |
| 22,846 | | 3,990 | | -47 |
| -41 |
| 1 |
| 18,943 |
| | | | | | | | | | | | |
Opening balance of equity January 1, 2024 |
| 22,846 | | 3,990 | | -47 | | -41 | | 1 |
| 18,943 |
Net profit Jan-Jun 2024 |
| 630 | | | | | | | | |
| 630 |
Other comprehensive income Jan-Jun 2024 | | 92 | | | | 13 | | 77 | | 2 | | |
Total comprehensive income Jan-Jun 2024 |
| 722 | | — | | 13 |
| 77 |
| 2 |
| 630 |
Dividend |
| -248 | | | | | | | | |
| -248 |
Closing balance of equity June 30, 20241 |
| 23,320 |
| 3,990 |
| -34 |
| 36 |
| 3 |
| 19,325 |
1 | The entire equity is attributable to the shareholder of the Parent Company. |
| |
Interim report January–June 2024 | Page 12 of 28 |
Condensed Statement of Cash Flows in the Consolidated Group (unaudited)
| | | | | | |
| | Jan-Jun | | Jan-Jun | | Jan-Dec |
Skr mn |
| 2024 |
| 2023 |
| 2023 |
Operating activities | | | | | | |
Operating profit |
| 794 |
| 646 |
| 1,568 |
Adjustments for non-cash items in operating profit | | 843 | | 892 | | 1,259 |
Income tax paid |
| -268 |
| -256 |
| -528 |
Changes in assets and liabilities from operating activities |
| 10,935 |
| -7,918 |
| 3,545 |
Cash flow from operating activities |
| 12,304 |
| -6,636 |
| 5,844 |
| | | | | | |
Investing activities | | | | | | |
Capital expenditures |
| -11 |
| -16 |
| -26 |
Cash flow from investing activities |
| -11 |
| -16 |
| -26 |
| | | | | | |
Financing activities | | | | | | |
Change in senior debt |
| -3,052 |
| 7,011 |
| -8,900 |
Derivatives, net |
| -735 |
| 1,438 |
| 2,868 |
Dividend paid |
| -248 |
| — |
| — |
Payment of lease liability | | -14 | | -14 | | -28 |
Cash flow from financing activities |
| -4,049 |
| 8,435 |
| -6,060 |
| | | | | | |
Cash flow for the period |
| 8,244 |
| 1,783 |
| -242 |
| | | | | | |
Cash and cash equivalents at beginning of the period |
| 3,482 |
| 4,060 |
| 4,060 |
Cash flow for the period | | 8,244 | | 1,783 | | -242 |
Exchange-rate differences on cash and cash equivalents |
| 134 |
| -6 |
| -336 |
Cash and cash equivalents at end of the period1 | | 11,860 |
| 5,837 |
| 3,482 |
1 | Cash and cash equivalents include, in this context, cash at banks that can be immediately converted into cash and short-term deposits for which the time to maturity does not exceed three months from trade date. |
| |
Interim report January–June 2024 | Page 13 of 28 |
Notes
Note 1. Accounting policies
Note 2. Net interest income
Note 3. Net results of financial transactions
Note 4. Impairments
Note 5. Financial assets and liabilities at fair value
Note 6. Derivatives
Note 7. Debt
Note 8. CIRR-system
Note 9. Pledged assets and contingent liabilities
Note 10. Capital adequacy and liquidity situation
Note 11. Exposures
Note 12. Transactions with related parties
Note 13. Events after the reporting period
References to “SEK” or the “Parent Company” are to AB Svensk Exportkredit. References to “Consolidated Group” are to SEK and its consolidated subsidiary. All amounts are in Skr million, unless otherwise indicated. All figures relate to the Consolidated Group, unless otherwise indicated.
Note 1. Accounting policies
This condensed interim report is presented in accordance with International Accounting Standard (IAS) 34, Interim Financial Reporting. The Consolidated Group’s consolidated accounts have been prepared in accordance with the International Financial Reporting Standards (IFRS) as issued by the International Accounting Standards Board (IASB), together with the interpretations from IFRS Interpretations Committee (IFRS IC). The IFRS standards applied by SEK are all endorsed by the European Union (EU). The accounting also follows the additional standards imposed by the Annual Accounts Act for Credit Institutions and Securities Companies (1995:1559) (ÅRKL) and the regulation and general guidelines issued by Finansinspektionen (the Swedish FSA), “Annual Reports in Credit Institutions and Securities Companies” (FFFS 2008:25). In addition to this, the supplementary accounting rules for groups (RFR 1) issued by the Swedish Financial Reporting Board have been applied. SEK also follows the state’s principles for external reporting in accordance with its State Ownership Policy and principles for state-owned enterprises.
The accounting policies, methods of computation and presentation of the Consolidated Group are, in all material aspects, the same as those used for the 2023 annual financial statements included in SEK’s 2023 Annual Report on Form 20-F. SEK analyzes and assesses the application and impact of changes in financial reporting standards that are applied within the Group. Changes that are not mentioned are either not applicable to SEK or have been determined to not have a material impact on SEK’s financial reporting.
There are no IFRS or IFRS Interpretations Committee interpretations that are not yet applicable that are expected to have a material impact on SEK’s financial statements, capital adequacy or large exposure ratios.
Note 2. Net interest income
| | | | | | | | | | | | |
| | Apr-Jun | | Jan–Mar | | Apr-Jun | | Jan-Jun | | Jan-Jun | | Jan-Dec |
Skr mn |
| 2024 |
| 2024 |
| 2023 |
| 2024 |
| 2023 |
| 2023 |
Interest income | | | | | | | | | | | | |
Loans to credit institutions | | 227 |
| 249 |
| 315 | | 476 | | 576 |
| 1,113 |
Loans to the public | | 2,506 |
| 2,522 |
| 2,180 | | 5,028 | | 4,134 |
| 9,181 |
Loans in the form of interest-bearing securities | | 604 | | 628 |
| 606 | | 1,232 | | 1,119 |
| 2,448 |
Interest-bearing securities excluding loans in the form of interest-bearing securities | | 672 | | 685 | | 701 | | 1,357 | | 1,299 | | 2,885 |
Derivatives | | 902 |
| 920 |
| 847 | | 1,822 | | 1,495 |
| 3,519 |
Administrative remuneration CIRR-system | | 64 | | 65 | | 66 | | 129 | | 127 | | 261 |
Other assets | | 6 | | 10 |
| 9 | | 16 | | 17 |
| 31 |
Total interest income1 | | 4,981 |
| 5,079 |
| 4,724 | | 10,060 | | 8,767 |
| 19,438 |
| | | | | | | | | | | | |
Interest expenses | | | | | | | | | | | | |
Interest expenses | | -4,152 | | -4,248 | | -3,939 | | -8,400 | | -7,288 | | -16,299 |
Resolution fee | | -26 | | -26 | | -24 | | -53 | | -47 | | -94 |
Risk tax | | -37 | | -35 | | -37 | | -71 | | -75 | | -150 |
Total interest expenses | | -4,215 |
| -4,309 |
| -4,000 | | -8,524 | | -7,410 |
| -16,543 |
Net interest income | | 766 |
| 770 |
| 724 | | 1,536 | | 1,357 |
| 2,895 |
1 | Interest income calculated using the effective interest method amounted to Skr 7,043 million during January-June 2024 (1H23: Skr 6,111 million). |
| |
Interim report January–June 2024 | Page 14 of 28 |
Note 3. Net results of financial transactions
| | | | | | | | | | | | |
| | Apr-Jun | | Jan–Mar | | Apr-Jun | | Jan-Jun | | Jan-Jun | | Jan-Dec |
Skr mn |
| 2024 |
| 2024 |
| 2023 |
| 2024 |
| 2023 |
| 2023 |
Derecognition of financial instruments not measured at fair value through profit or loss | | 1 | | 2 | | 2 | | 3 | | 4 | | 9 |
Financial assets or liabilities at fair value through profit or loss | | -36 | | -25 | | -54 | | -61 | | -93 | | 33 |
Financial instruments under fair-value hedge accounting | | 20 | | -7 | | 4 | | 13 | | -9 | | -23 |
Currency exchange-rate effects on all assets and liabilities excl. currency exchange-rate effects related to revaluation at fair value |
| -1 |
| -5 |
| 0 |
| -6 | | 0 |
| 2 |
Total net results of financial transactions |
| -16 |
| -35 |
| -48 |
| -51 | | -98 |
| 21 |
Note 4. Impairments
| | | | | | | | | | | | |
| | Apr-Jun | | Jan–Mar | | Apr-Jun | | Jan-Jun | | Jan-Jun | | Jan-Dec |
Skr mn |
| 2024 |
| 2024 |
| 2023 |
| 2024 |
| 2023 |
| 2023 |
Expected credit losses, stage 1 | | 36 | | 48 | | -3 | | 84 | | 1 | | -36 |
Expected credit losses, stage 2 | | 14 | | 40 | | 2 | | 54 | | 7 | | -40 |
Expected credit losses, stage 3 | | -7 | | -415 | | -256 | | -422 | | -249 | | -513 |
Established losses |
| — |
| -113 |
| — | | -113 | | — | | — |
Reserves applied to cover established credit losses | | — | | 113 | | — | | 113 | | — | | — |
Recovered credit losses |
| 3 |
| 0 |
| 1 | | 3 | | 2 |
| 4 |
Net credit losses |
| 46 |
| -327 |
| -256 | | -281 | | -239 |
| -585 |
| | | | | | | | | | |
| | June 30, 2024 | | December 31, 2023 | ||||||
Skr mn |
| Stage 1 |
| Stage 2 |
| Stage 3 |
| Total |
| Total |
Loans, before expected credit losses |
| 237,063 |
| 31,377 |
| 9,210 |
| 277,650 |
| 284,060 |
Off-balance sheet exposures, before expected credit losses |
| 50,646 |
| 19,420 |
| 5,223 |
| 75,289 |
| 62,446 |
Total, before expected credit losses |
| 287,709 |
| 50,797 |
| 14,433 |
| 352,939 |
| 346,506 |
Loss allowance, loans |
| -77 |
| -7 |
| -888 |
| -972 |
| -757 |
Loss allowance, off-balance sheet exposures1 |
| -8 |
| -1 |
| -2 |
| -11 |
| -38 |
Total loss allowance |
| -85 |
| -8 |
| -890 |
| -983 |
| -795 |
Provision ratio (in percent) |
| 0.03 | | 0.02 | | 6.17 | | 0.28 | | 0.23 |
1 | Recognized under provision in Consolidated Statement of Financial Position. Off-balance sheet exposures consist of guarantee commitments and committed undisbursed loans, see Note 9. |
The table above shows the book value of loans and nominal amounts for off-balance sheet exposures before expected credit losses for each stage as well as related loss allowance amounts, in order to place expected credit losses in relation to credit exposures. Overall, the credit portfolio has an extremely high credit quality and SEK often uses risk mitigation measures, primarily through guarantees from the Swedish Export Credit Agency (EKN) and other government export credit agencies in the Organisation for Economic Co-operation and Development (OECD), which explains the low provision ratio.
Loss Allowance
| | | | | | | | | | |
| | June 30, 2024 | | December 31, 2023 | ||||||
Skr mn |
| Stage 1 |
| Stage 2 |
| Stage 3 |
| Total |
| Total |
Opening balance January 1 | | -167 |
| -61 | | -567 | | -795 | | -223 |
Increases due to origination and acquisition | | -17 |
| -1 |
| — | | -18 |
| -137 |
Net remeasurement of loss allowance | | 78 |
| 0 |
| -96 |
| -18 |
| 15 |
Transfer to stage 1 | | 0 | | 0 |
| — |
| 0 |
| 0 |
Transfer to stage 2 | | 0 |
| 0 |
| — |
| 0 |
| -22 |
Transfer to stage 3 | | 1 |
| 3 |
| -331 |
| -327 |
| -491 |
Decreases due to derecognition | | 22 |
| 52 |
| 5 |
| 79 |
| 46 |
Decrease in allowance account due to write-offs | | — |
| — |
| 113 |
| 113 |
| — |
Exchange-rate differences1 | | -2 |
| -1 |
| -14 |
| -17 |
| 17 |
Closing balance | | -85 |
| -8 |
| -890 |
| -983 |
| -795 |
1 | Recognized under net results of financial transactions in Statement of Comprehensive Income. |
| |
Interim report January–June 2024 | Page 15 of 28 |
Provisions for expected credit losses (ECLs) are calculated using quantitative models based on inputs, assumptions and methods that are highly reliant on assessments. In particular, the following could heavily impact the level of provisions: the establishment of a material increase in credit risk, allowing for forward-looking macroeconomic scenarios, and the measurement of both ECLs over the next 12 months and lifetime ECLs. ECLs are based on objective assessments of what SEK expects to lose on the exposures given what was known on the reporting date and taking into account possible future events. The ECL is a probability-weighted amount that is determined by evaluating the outcome of several possible scenarios and where the data taken into consideration comprises information from previous conditions, current conditions and projections of future economic conditions. SEK’s method entails three scenarios being prepared for each probability of default curve: a base scenario, a downturn scenario, and an upturn scenario, where the scenarios are expressed in a business cycle parameter. The business cycle parameter reflects the general risk of default in each geographic segment. The parameter is standard normally distributed where zero indicates a neutral economy as the economy has been on average, historically. The business cycle parameters for the base scenario are between 0.0 and 0.7 for the various probability of default (PD) segments. The base scenarios have been weighted at 80 percent, the downturn scenarios have been weighted at 10 percent, and the upturn scenarios have been weighted at 10 percent between the different PD-segments.
Due to the current state of macroeconomic uncertainty, SEK has made an overall adjustment according to management’s overall assessment. This resulted in an increase of expected credit losses, which was calculated pursuant to SEK’s IFRS 9 model as of June 30, 2024.
Note 5. Financial assets and liabilities at fair value
| | | | | | |
| | June 30, 2024 | ||||
| | | | | | Surplus value (+)/ |
Skr mn |
| Book value |
| Fair value |
| Deficit value (–) |
Cash and cash equivalents |
| 11,860 |
| 11,860 |
| — |
Treasuries/governments bonds |
| 8,216 |
| 8,216 |
| — |
Other interest-bearing securities except loans |
| 57,358 |
| 57,358 |
| — |
Loans in the form of interest-bearing securities |
| 49,447 |
| 50,578 |
| 1,131 |
Loans to credit institutions |
| 12,846 |
| 13,054 |
| 208 |
Loans to the public |
| 219,053 |
| 218,587 |
| -466 |
Derivatives |
| 6,904 |
| 6,904 |
| — |
Shares | | 34 | | 34 | | — |
Total financial assets |
| 365,718 |
| 366,591 |
| 873 |
| | | | | | |
Borrowing from credit institutions |
| 3,660 |
| 3,660 |
| — |
Debt securities issued |
| 323,508 |
| 323,585 |
| 77 |
Derivatives |
| 7,267 |
| 7,267 |
| — |
Total financial liabilities |
| 334,435 |
| 334,512 |
| 77 |
| | | | | | |
| | December 31, 2023 | ||||
|
| |
| |
| Surplus value (+)/ |
Skr mn | | Book value | | Fair value | | Deficit value (–) |
Cash and cash equivalents |
| 3,482 |
| 3,482 |
| — |
Treasuries/governments bonds |
| 11,525 |
| 11,525 |
| — |
Other interest-bearing securities except loans |
| 41,561 |
| 41,561 |
| — |
Loans in the form of interest-bearing securities |
| 51,227 |
| 52,519 |
| 1,292 |
Loans to credit institutions |
| 19,009 |
| 19,260 |
| 251 |
Loans to the public |
| 224,165 |
| 223,759 |
| -406 |
Derivatives |
| 6,432 |
| 6,432 |
| — |
Shares | | — | | — | | — |
Total financial assets |
| 357,401 |
| 358,538 |
| 1,137 |
| | | | | | |
Borrowing from credit institutions |
| 3,628 |
| 3,628 |
| — |
Debt securities issued |
| 314,108 |
| 313,931 |
| -177 |
Derivatives |
| 12,637 |
| 12,637 |
| — |
Total financial liabilities |
| 330,373 |
| 330,196 |
| -177 |
Determination of fair value
The determination of fair value is described in the annual financial statements included in SEK’s 2023 Annual Report on Form 20-F, see Note 1 (f) (vii) Principles for determination of fair value of financial instruments and (viii) Determination of fair value of certain types of financial instruments.
| |
Interim report January–June 2024 | Page 16 of 28 |
Financial assets in fair value hierarchy
| | | | | | | | |
| | Financial assets at fair value | ||||||
Skr mn |
| Level 1 |
| Level 2 |
| Level 3 |
| Total |
Treasuries/governments bonds |
| — |
| 8,216 |
| — |
| 8,216 |
Other interest-bearing securities except loans |
| 19,727 |
| 37,631 |
| — |
| 57,358 |
Derivatives |
| — |
| 6,863 |
| 41 |
| 6,904 |
Shares | | 34 | | — | | — | | 34 |
Total, June 30, 2024 | | 19,761 | | 52,710 | | 41 | | 72,512 |
Total, December 31, 2023 |
| 18,191 | | 41,272 | | 55 | | 59,518 |
Financial liabilities in fair value hierarchy
| | | | | | | | |
| | Financial liabilities at fair value | ||||||
Skr mn |
| Level 1 |
| Level 2 |
| Level 3 |
| Total |
Debt securities issued |
| — |
| 14,551 |
| 3,986 |
| 18,537 |
Derivatives | | — | | 5,468 | | 1,799 | | 7,267 |
Total, June 30, 2024 | | — | | 20,019 | | 5,785 | | 25,804 |
Total, December 31, 2023 |
| — |
| 22,531 |
| 10,605 |
| 33,136 |
There were no transfers during the period (year-end 2023: transfers of Skr 11,291 million for debt securities issued and Skr -27 million for derivatives were made from level 3 to level 2).
Financial assets and liabilities at fair value in Level 3, 2024
| | | | | | | | | | | | | | | | | | |
| | | | | | | | | | | | | | Gains (+) and | | | | |
| | | | | | | | | | | | Gains (+) and | | losses (–) in | | | | |
| | | | | | | | | | Transfers | | losses (–) | | Other | | Exchange- | | |
| | January 1, | | | | Settlements & | | Transfers | | from | | through profit | | comprehensive | | rate | | June 30, |
Skr mn |
| 2024 |
| Purchases |
| sales |
| to Level 3 |
| Level 3 |
| or loss1 |
| income |
| differences |
| 2024 |
Debt securities issued |
| -8,271 |
| — |
| 4,111 |
| — |
| — |
| -104 |
| -10 | | 288 |
| -3,986 |
Derivatives, net |
| -2,279 |
| — |
| 1,001 |
| — |
| — |
| 105 |
| — | | -585 |
| -1,758 |
Net assets and liabilities |
| -10,550 |
| — |
| 5,112 |
| — |
| — |
| 1 |
| -10 | | -297 |
| -5,744 |
Financial assets and liabilities at fair value in Level 3, 2023
| | | | | | | | | | | | | | | | | | |
| | | | | | | | | | | | | | Gains (+) and | | | | |
| | | | | | | | | | | | Gains (+) and | | losses (–) in | | | | |
| | | | | | | | | | Transfers | | losses (–) | | Other | | Exchange- | | |
| | January 1, | | | | Settlements & | | Transfers | | from | | through profit | | comprehensive | | rate | | December 31, |
Skr mn |
| 2023 |
| Purchases |
| sales |
| to Level 3 |
| Level 3 |
| or loss1 |
| income |
| differences |
| 2023 |
Debt securities issued |
| -26,536 |
| -180 |
| 10,202 |
| -1,912 |
| 11,291 |
| -1,927 |
| -207 |
| 998 | | -8,271 |
Derivatives, net |
| -4,516 |
| — |
| 1,416 |
| — |
| -27 |
| 1,419 |
| — |
| -571 | | -2,279 |
Net assets and liabilities |
| -31,052 |
| -180 |
| 11,618 |
| -1,912 |
| 11,264 |
| -508 |
| -207 |
| 427 | | -10,550 |
1 | Gains and losses through profit or loss, including the impact of exchange rates, is reported as net interest income and net results of financial transactions. The unrealized fair value changes for assets and liabilities, including the impact of exchange rates, held as of June 30, 2024, amounted to a Skr -7 million loss (year-end 2023: Skr -27 million loss) and are reported as net results of financial transactions. |
| |
Interim report January–June 2024 | Page 17 of 28 |
Uncertainty of valuation of Level 3 instruments
As the estimation of parameters included in the models used to calculate the market value of Level 3 instruments is associated with subjectivity and uncertainty, SEK has conducted an analysis of the difference in fair value of Level 3 instruments using other established parameter values. Option models and discounted cash flows are used to value the Level 3 instruments. For the Level 3 instruments that are significantly affected by different types of correlations, which are not based on observable market data, a revaluation has been made by shifting the correlations. The correlation is expressed as a value between 1 and -1, where 0 indicates no relationship, 1 indicates a maximum positive relationship and -1 indicates a maximum negative relationship. The maximum correlation in the range of unobservable inputs can thus be from 1 to -1. In the analysis, the correlations have been adjusted by +/- 0.12, which represents the level SEK uses within its prudent valuation framework. For Level 3 instruments that are significantly affected by non-observable market data in the form of SEK’s own creditworthiness, a revaluation has been made by shifting the credit curve. The revaluation is made by shifting the credit spreads by +/- 10 basis points, which has been assessed as a reasonable change in SEK’s credit spread. The analysis shows the impact of the non-observable market data on the market value. In addition, the market value will be affected by observable market data.The result of the analysis corresponds with SEK’s business model where issued securities are linked with a matched hedging derivative. The underlying market data is used to evaluate the issued security as well as to evaluate the fair value in the derivative. This means that a change in fair value of the issued security, excluding SEK’s own credit spread, is offset by an equally large change in fair value in the derivative.
Sensitivity analysis – level 3 assets and liabilities
| | | | | | | | | | | | |
Assets and liabilities | | June 30, 2024 | ||||||||||
| | | | | | Range of estimates | | | | | | |
| | | | Unobservable | | for unobservable | | | | Sensitivity | | Sensitivity |
Skr mn |
| Fair Value |
| input |
| input |
| Valuation method |
| max |
| min |
| | | | | | | | | | | | |
Equity |
| -253 |
| Correlation |
| 0.12 – (0.12) |
| Option Model |
| 0 | | 0 |
Interest rate |
| 0 |
| Correlation |
| 0.12 – (0.12) |
| Option Model |
| 0 | | 0 |
FX |
| -1,362 |
| Correlation |
| 0.12 – (0.12) |
| Option Model |
| -20 | | 20 |
Other |
| -143 |
| Correlation |
| 0.12 – (0.12) |
| Option Model |
| 0 | | 0 |
Sum derivatives, net |
| -1,758 |
| | | | | |
| -20 | | 20 |
Equity |
| -196 |
| Correlation |
| 0.12 – (0.12) |
| Option Model |
| 0 | | 0 |
|
| |
| Credit spreads |
| 10BP – (10BP) |
| Discounted cash flow |
| 0 | | 0 |
Interest rate |
| 0 |
| Correlation |
| 0.12 – (0.12) |
| Option Model |
| 0 | | 0 |
|
| |
| Credit spreads |
| 10BP – (10BP) |
| Discounted cash flow |
| 0 | | 0 |
FX |
| -3,643 |
| Correlation |
| 0.12 – (0.12) |
| Option Model |
| 19 | | -19 |
|
| |
| Credit spreads |
| 10BP – (10BP) |
| Discounted cash flow |
| 15 | | -15 |
Other |
| -147 |
| Correlation |
| 0.12 – (0.12) |
| Option Model |
| 0 | | 0 |
|
| |
| Credit spreads |
| 10BP – (10BP) |
| Discounted cash flow |
| 0 | | 0 |
Sum debt securities issued |
| -3,986 |
| | | | | |
| 34 | | -34 |
Total effect on total comprehensive income | | | | | | | | | | 14 | | -14 |
| | | | | | | | | | | | |
Derivatives, net, December 31, 2023 | | -2,279 | | | | | | | | -22 | | 22 |
Debt securities issued, December 31, 2023 | | -8,271 | | | | | | | | 47 | | -47 |
Total effect on total comprehensive income, December 31, 2023 |
| |
|
|
|
|
|
|
| 25 |
| -25 |
The sensitivity analysis shows the effect that a shift in correlations or SEK’s own credit spread has on Level 3 instruments. The table presents maximum positive and negative change in fair value when correlations or SEK’s own credit spread is shifted by +/– 0.12 and +/- 10 basis points, respectively. When determining the total maximum/minimum effect on total comprehensive income the most adverse/favorable shift is chosen, considering the net exposure arising from the issued securities and the derivatives, for each correlation.
Fair value related to credit risk
| | | | | | | | |
| | Fair value originating from credit risk | | The period’s change in fair value originating | ||||
| | (- liabilities increase/ + liabilities decrease) | | from credit risk (+ income/ - loss) | ||||
| | June 30, | | December 31, | | Jan-Jun | | Jan-Jun |
Skr mn |
| 2024 |
| 2023 |
| 2024 |
| 2023 |
CVA/DVA, net1 | | -34 | | -39 | | 5 | | -2 |
OCA2 | | 42 | | -55 | | 97 | | 21 |
1 | Credit value adjustment (CVA) and Debt value adjustment (DVA) reflects how the counterparties’ credit risk as well as SEK’s own credit rating affects the fair value of derivatives. |
2 | Own credit adjustment (OCA) reflects how the changes in SEK’s credit rating affects the fair value of financial liabilities measured at fair value through profit and loss. |
| |
Interim report January–June 2024 | Page 18 of 28 |
Note 6. Derivatives
Derivatives by category
| | | | | | | | | | | | |
| | June 30, 2024 | | December 31, 2023 | ||||||||
| | Assets | | Liabilities | | Nominal | | Assets | | Liabilities | | Nominal |
Skr mn |
| Fair value |
| Fair value |
| amounts |
| Fair value |
| Fair value |
| amounts |
Interest rate-related contracts |
| 3,865 |
| 1,370 |
| 527,448 |
| 3,918 |
| 1,720 |
| 483,545 |
Currency-related contracts |
| 3,039 |
| 5,501 |
| 165,267 |
| 2,509 |
| 9,789 |
| 158,019 |
Equity-related contracts |
| — |
| 253 |
| 310 |
| 5 |
| 1,002 |
| 3,722 |
Contracts related to commodities, credit risk, etc. |
| — |
| 143 |
| 7,022 |
| — |
| 126 |
| 5,533 |
Total derivatives |
| 6,904 |
| 7,267 |
| 700,047 |
| 6,432 |
| 12,637 |
| 650,819 |
In accordance with SEK’s policies with regard to counterparty, interest rate, currency exchange, and other exposures, SEK uses, and is a party to, different kinds of derivative instruments, mostly various interest rate-related and currency exchange-related contracts, primarily to hedge risk exposure inherent in financial assets and liabilities. These contracts are carried at fair value in the statements of financial position on a contract-by-contract basis.
Note 7. Debt
Debt by category
| | | | |
|
| June 30, |
| December 31, |
Skr mn | | 2024 | | 2023 |
Currency-related contracts | | 5,206 | | 6,368 |
Interest rate-related contracts |
| 321,620 |
| 307,626 |
Equity-related contracts |
| 195 |
| 3,594 |
Contracts related to commodities, credit risk, etc. |
| 147 |
| 148 |
Total debt |
| 327,168 |
| 317,736 |
of which denominated in: |
|
|
|
|
Skr |
| 22,422 |
| 17,029 |
USD |
| 209,782 |
| 200,222 |
EUR |
| 61,246 |
| 61,325 |
AUD |
| 12,044 |
| 11,934 |
GBP |
| 9,654 |
| 9,304 |
JPY |
| 3,995 |
| 8,139 |
Other currencies |
| 8,025 |
| 9,783 |
The information is disclosed in accordance with FFFS 2014:21.
Note 8. CIRR-system
Pursuant to the company’s assignment as stated in its owner instruction issued by the Swedish government, SEK administers credit granting in the Swedish system for officially supported export credits (CIRR-system). SEK receives compensation from the Swedish government in the form of an administrative compensation, which is calculated based on the principal amount outstanding.
The administrative compensation paid by the state to SEK is recognized in the CIRR-system as administrative remuneration to SEK. Refer to the following tables of the statement of comprehensive income and statement of financial positions for the CIRR-system, presented as reported to the owner. Interest expenses include interest expenses for loans between SEK and the CIRR-system which reflects the borrowing cost for the CIRR-system. Interest expenses for derivatives hedging CIRR-loans are also recognized as interest expenses, which differs from SEK’s accounting principles. Arrangement fees to SEK are recognized together with other arrangement fees as interest expenses.
In addition to the CIRR-system, SEK administers the Swedish government’s previous concessionary credit program according to the same principles as the CIRR-system. No new lending is being offered under the concessionary credit program. As of June 30, 2024, concessionary loans outstanding amounted to Skr 123 million (year-end 2023: Skr 174 million) and operating profit for the program amounted to Skr -4 million (1H23: Skr -10 million) for the period January-June 2024. SEK’s administrative compensation for administrating the concessionary credit program amounted to Skr 0 million (1H23: Skr 0 million).
| |
Interim report January–June 2024 | Page 19 of 28 |
Statement of Comprehensive Income for the CIRR-system
| | | | | | | | | | | | |
| | Apr-Jun | | Jan–Mar | | Apr-Jun | | Jan-Jun | | Jan-Jun | | Jan-Dec |
Skr mn |
| 2024 |
| 2024 | | 2023 | | 2024 |
| 2023 |
| 2023 |
Interest income |
| 576 |
| 586 | | 577 | | 1,162 |
| 1,128 |
| 2,329 |
Interest expenses |
| -505 |
| -523 | | -485 | | -1,028 |
| -947 |
| -1,904 |
Interest compensation |
| — |
| — | | — | | — |
| — |
| — |
Exchange-rate differences |
| 0 |
| 1 | | 1 | | 1 |
| 1 |
| 1 |
Profit before compensation to SEK | | 71 | | 64 | | 93 | | 135 | | 182 | | 426 |
Administrative remuneration to SEK | | -64 | | -65 | | -66 | | -129 | | -127 | | -260 |
Operating profit CIRR-system | | 7 | | -1 | | 27 | | 6 | | 55 | | 166 |
Reimbursement to (–) / from (+) the State |
| -7 |
| 1 | | -27 | | -6 |
| -55 |
| -166 |
Statement of Financial Position for the CIRR-system
| | | | |
| | June 30, | | December 31, |
Skr mn |
| 2024 |
| 2023 |
Cash and cash equivalents |
| 0 |
| 1 |
Loans |
| 97,420 |
| 101,361 |
Derivatives |
| 5,077 |
| 4,334 |
Other assets |
| 228 |
| 179 |
Prepaid expenses and accrued revenues |
| 2,036 |
| 1,711 |
Total assets |
| 104,761 |
| 107,586 |
Liabilities |
| 103,116 |
| 105,642 |
Derivatives |
| 311 |
| 859 |
Accrued expenses and prepaid revenues |
| 1,334 |
| 1,085 |
Total liabilities |
| 104,761 |
| 107,586 |
Commitments |
| |
| |
Committed undisbursed loans |
| 50,212 |
| 36,505 |
Note 9. Pledged assets and contingent liabilities
| | | | |
| | June 30, | | December 31, |
Skr mn |
| 2024 |
| 2023 |
Collateral provided |
|
|
|
|
Cash collateral under the security agreements for derivative contracts |
| 4,668 |
| 11,098 |
Contingent liabilities1 |
|
|
|
|
Guarantee commitments |
| 8,189 |
| 7,471 |
Commitments1 |
|
|
|
|
Committed undisbursed loans |
| 67,100 |
| 54,975 |
1 | For expected credit losses in guarantee commitments and committed undisbursed loans, see Note 4. |
Note 10. Capital adequacy and liquidity situation
The capital adequacy analysis relates to the parent company AB Svensk Exportkredit. The information is disclosed according to FFFS 2014:12, FFFS 2008:25 and FFFS 2010:7. For further information on capital adequacy and risks, see Note 30 to the annual financial statements included in SEK’s 2023 Annual Report on Form 20-F and see SEK’s 2023 Capital Adequacy and Risk Management (Pillar 3) Report.
Capital Adequacy Analysis
| | | | |
| | | | |
|
| June 30, 2024 |
| December 31, 2023 |
Capital ratios |
| percent1 |
| percent1 |
Common Equity Tier 1 capital ratio |
| 22.6 | | 21.3 |
Tier 1 capital ratio |
| 22.6 | | 21.3 |
Total capital ratio |
| 22.6 | | 21.3 |
1 | Capital ratios exclusive of buffer requirements are the quotients of the relevant capital measure and the total risk exposure amount. See tables Own funds – adjusting items and Minimum capital requirements exclusive of buffer. |
| |
Interim report January–June 2024 | Page 20 of 28 |
| | | | | | | | |
| | June 30, 2024 | | December 31, 2023 | ||||
Total risk-based capital requirement |
| Skr mn |
| percent1 |
| Skr mn |
| percent1 |
Capital base requirement of 8 percent2 | | 8,074 | | 8.0 | | 8,377 | | 8.0 |
of which Tier 1 requirement of 6 percent | | 6,055 | | 6.0 | | 6,283 | | 6.0 |
of which minimum requirement of 4.5 percent | | 4,541 | | 4.5 | | 4,712 | | 4.5 |
Pillar 2 capital requirements3 | | 3,704 | | 3.7 | | 3,843 | | 3.7 |
Common Equity Tier 1 capital available to meet buffer requirements4 | | 11,031 | | 10.9 | | 10,084 | | 9.6 |
Capital buffer requirements | | 4,143 | | 4.1 | | 4,271 | | 4.1 |
of which Capital conservation buffer |
| 2,523 |
| 2.5 | | 2,618 |
| 2.5 |
of which Countercyclical buffer |
| 1,620 |
| 1.6 | | 1,653 |
| 1.6 |
Pillar 2 guidance5 | | 1,514 | | 1.5 | | 1,571 | | 1.5 |
Total risk-based capital requirement including Pillar 2 guidance |
| 17,435 |
| 17.3 | | 18,062 |
| 17.2 |
1 | Expressed as a percentage of total risk exposure amount. |
2 | The minimum requirements according to CRR (Regulation (EU) No 575/2013 of the European Parliament and of the Council of June 26, 2013, on prudential requirements for credit institutions and investment firms) and amending Regulation (EU) No 648/2012). |
3 | Individual Pillar 2 requirement of 3.67 percent calculated on the total risk exposure amount, according to the decision from the latest Swedish FSA Supervisory Review and Evaluation Process (“SREP”) on September 29, 2021. |
4 | Common Equity Tier 1 capital available to meet buffer requirement after 8 percent minimum capital requirement (SEK covers all minimum requirements with CET1 capital, that is 4.5 percent, 1.5 percent and 2 percent) and after the Pillar 2 requirements (3.67 percent). |
5 | The Swedish FSA notified SEK on September 29, 2021, within the latest SREP, that in addition to the capital requirements according to Regulation (EU) no 575/2013 on prudential requirements, SEK should hold additional capital (Pillar 2 guidance) of 1.50 percent of the total risk-weighted exposure amount. The Pillar 2 guidance is not a binding requirement. |
| | | | |
|
| June 30, 2024 |
| December 31, 2023 |
Leverage ratio1 | | Skr mn | | Skr mn |
On-balance sheet exposures |
| 252,636 |
| 232,462 |
Off-balance sheet exposures |
| 8,747 |
| 8,529 |
Total exposure measure |
| 261,383 |
| 240,991 |
Leverage ratio2 |
| 8.7% | | 9.3% |
1 | The leverage ratio reflects the full impact of IFRS 9 as no transitional rules were utilized. |
2 | Defined by CRR as the quotient of the Tier 1 capital and an exposure measure. |
| | | | | | | | |
|
| June 30, 2024 |
| December 31, 2023 | ||||
Total Leverage ratio requirement |
| Skr mn |
| percent1 |
| Skr mn |
| percent1 |
Capital base requirement of 3 percent | | 7,841 | | 3.0 | | 7,230 | | 3.0 |
Pillar 2 guidance2 | | 393 | | 0.2 | | 361 | | 0.2 |
Total capital requirement relating to Leverage ratio including Pillar 2 guidance | | 8,234 | | 3.2 | | 7,591 | | 3.2 |
1 | Expressed as a percentage of total exposure amount. |
2 | The Swedish FSA has on September 29, 2021, notified SEK, within the latest SREP, that SEK may hold additional capital (Pillar 2 guidance) of 0.15 percent calculated on the total Leverage ratio exposure measure. The Pillar 2 guidance is not a binding requirement. |
| |
Interim report January–June 2024 | Page 21 of 28 |
Own funds – Adjusting items
| | | | |
| | June 30, | | December 31, |
Skr mn |
| 2024 |
| 2023 |
Share capital |
| 3,990 |
| 3,990 |
Retained earnings |
| 18,382 |
| 17,403 |
Accumulated other comprehensive income and other reserves |
| 240 |
| 234 |
Independently reviewed profit net of any foreseeable charge or dividend |
| 454 |
| 972 |
Common Equity Tier 1 (CET1) capital before regulatory adjustments |
| 23,066 |
| 22,599 |
Additional value adjustments due to prudent valuation1 |
| -91 |
| -85 |
Intangible assets |
| -26 |
| -34 |
Fair value reserves related to gains or losses on cash flow hedges |
| 34 |
| 47 |
Gains or losses on liabilities valued at fair value resulting from changes in own credit standing |
| 26 |
| 28 |
Negative amounts resulting from the calculation of expected loss amounts | | -164 | | -221 |
Insufficient coverage for non-performing exposures | | -55 | | -12 |
Total regulatory adjustments to Common Equity Tier 1 capital |
| -276 |
| -277 |
Total Common Equity Tier 1 capital |
| 22,790 |
| 22,322 |
Total Own funds |
| 22,790 |
| 22,322 |
1 | During the fourth quarter of 2023, SEK switched accounting method from the core approach to the simplified approach for prudent valuation in accordance with Article 4 of the Delegated Regulation (EU) no 2016/101. |
Minimum capital requirements exclusive of buffer
| | | | | | | | | | | | |
| | June 30, 2024 | | December 31, 2023 | ||||||||
| | | | | | Minimum | | | | | | Minimum |
|
| |
| Risk exposure |
| capital |
| |
| Risk exposure |
| capital |
Skr mn | | EAD1 | | amount | | requirement | | EAD1 | | amount | | requirement |
Credit risk standardized method |
| | | | | |
|
|
|
|
|
|
Corporates |
| 4,767 |
| 4,756 |
| 381 |
| 4,219 |
| 4,206 |
| 337 |
Exposures in default | | 109 | | 126 | | 10 | | 77 | | 77 | | 6 |
Total credit risk standardized method |
| 4,876 |
| 4,882 |
| 391 |
| 4,296 |
| 4,283 |
| 343 |
Credit risk IRB method |
| | | | | | | | | | | |
Central Governments | | 235,442 | | 10,304 | | 825 | | 211,650 | | 9,416 | | 753 |
Financial institutions2 |
| 33,896 |
| 5,989 |
| 479 |
| 33,236 |
| 6,580 |
| 526 |
Corporates3 |
| 145,720 |
| 72,139 |
| 5,771 |
| 144,559 |
| 76,038 |
| 6,083 |
Assets without counterparty | | 367 | | 367 | | 29 | | 284 | | 284 | | 23 |
Total credit risk IRB method |
| 415,425 |
| 88,799 |
| 7,104 |
| 389,729 |
| 92,318 |
| 7,385 |
Credit valuation adjustment risk |
| n.a. |
| 1,974 |
| 158 |
| n.a. |
| 2,490 |
| 199 |
Foreign exchange risk |
| n.a. |
| 824 |
| 66 |
| n.a. |
| 1,174 |
| 94 |
Commodities risk |
| n.a. |
| 0 |
| 0 |
| n.a. |
| 7 |
| 1 |
Operational risk |
| n.a. |
| 4,442 |
| 355 |
| n.a. |
| 4,442 |
| 335 |
Total |
| 420,301 |
| 100,921 |
| 8,074 |
| 394,025 |
| 104,714 |
| 8,377 |
1 | Exposure at default (EAD) shows the size of the outstanding exposure at default. |
2 | Of which counterparty risk in derivatives: EAD Skr 6,106 million (year-end 2023: Skr 7,127 million), Risk exposure amount of Skr 1,574 million (year-end 2023: Skr 2,167 million) and Capital requirement of Skr 126 million (year-end 2023: Skr 173 million). |
3 | Of which related to specialized lending: EAD Skr 7,595 million (year-end 2023: Skr 7,315 million), Risk exposure amount of Skr 4,996 million (year-end 2023: Skr 5,757 million) and Capital requirement of Skr 400 million (year-end 2023: Skr 461 million). |
Credit risk
For classification and quantification of credit risk, SEK uses the internal ratings-based (IRB) approach. Specifically, SEK applies the Foundation Approach. Under the Foundation Approach, the company determines the PD within one year for each of its counterparties, while the remaining parameters are established in accordance with CRR. Application of the IRB approach requires the Swedish FSA’s permission and is subject to ongoing supervision. Certain exposures are, by permission from the Swedish FSA, exempted from application of the IRB approach, and, instead, the standardized approach is applied. Counterparty risk exposure amounts in derivatives are calculated in accordance with the standardized approach for counterparty credit risk.
Credit valuation adjustment risk
Credit valuation adjustment risk is calculated for all over-the-counter derivative contracts, except for credit derivatives used as credit protection and transactions with a qualifying central counterparty. SEK calculates this capital requirement according to the standardized approach.
| |
Interim report January–June 2024 | Page 22 of 28 |
Foreign exchange risk
Foreign exchange risk is calculated according to the standardized approach, whereas the scenario approach is used for calculating the gamma and volatility risks.
Commodities risk
Capital requirements for commodity risk are calculated in accordance with the simplified approach under the standardized approach. The scenario approach is used for calculating the gamma and volatility risks.
Operational risk
Capital requirement for operational risk is calculated according to the standardized approach. The company’s operations are divided into business areas as defined in the CRR. The capital requirement for each area is calculated by multiplying a factor depending on the business area by an income indicator. The factors applicable for SEK are 15 percent and 18 percent. The income indicators consist of the average operating income for the past three financial years for each business area.
Transitional rules
The capital adequacy ratios reflect the full impact of IFRS 9 as no transitional rules for IFRS 9 were utilized.
Capital buffer requirements
SEK expects to meet capital buffer requirements with Common Equity Tier 1 capital. The mandatory capital conservation buffer is 2.5 percent. The countercyclical buffer rate that is applied to exposures located in Sweden was increased from 1 percent to 2 percent as of June 22, 2023. As of June 30, 2024, the capital requirement related to relevant exposures in Sweden was 74 percent (year-end 2023: 73 percent) of the total relevant capital requirement regardless of location; this fraction is also the weight applied on the Swedish buffer rate when calculating SEK’s countercyclical capital buffer. Buffer rates applicable in other countries may have effects on SEK, but as most capital requirements for SEK’s relevant credit exposures are related to Sweden, the potential effect is limited. As of June 30, 2024, the contribution to SEK’s countercyclical buffer from buffer rates in other countries was 0.13 percentage points (year-end 2023: 0.13 percentage points). SEK has not been classified as a systemically important institution by the Swedish FSA. The capital buffer requirements for systemically important institutions that came into force on January 1, 2016, therefore do not apply to SEK.
Pillar 2 guidance
The Swedish FSA will in connection with the Supervisory Review and Evaluation Process (SREP) determine appropriate levels for the institution’s own funds. The Swedish FSA will then inform the institution of the differences between the appropriate levels and requirements under the Supervisory Regulation, the Buffer Act and the Pillar 2 requirements. These notifications are called Pillar 2 guidance. The Pillar 2 guidance covers both the risk-based capital requirement and the leverage ratio requirement.
Internally assessed economic capital
| | | | |
| | June 30, | | December 31, |
Skr mn |
| 2024 |
| 2023 |
Credit risk |
| 7,302 |
| 7,350 |
Operational risk |
| 434 |
| 434 |
Market risk |
| 1,053 |
| 1,065 |
Other risks |
| 158 |
| 199 |
Capital planning buffer | | 1,700 | | 1,700 |
Total |
| 10,647 |
| 10,748 |
SEK regularly conducts an internal capital adequacy assessment process, during which the company determines how much capital is needed in order to cover its risks. The result of SEK’s assessment of capital adequacy is presented above. For more information regarding the internal capital adequacy assessment process and its methods, see the Risk and Capital management section of SEK’s 2023 Annual Report on Form 20-F.
Liquidity Coverage Ratio
| | | | |
| | June 30, | | December 31, |
Skr bn, 12-month average |
| 2024 |
| 2023 |
Total liquid assets |
| 69.0 |
| 73.9 |
Net liquidity outflows1 |
| 15.1 |
| 16.4 |
Liquidity outflows | | 26.1 | | 29.3 |
Liquidity inflows |
| 11.8 |
| 13.9 |
Liquidity Coverage Ratio |
| 602% | | 605% |
1 | Net liquidity outflows are calculated as the net of liquidity outflows and capped liquidity inflows. Capped liquidity inflows are calculated in accordance with article 425 of CRR (EU 575/2013) and article 33 of the Commission Delegated Regulation (EU) 2015/61. |
Information on Liquidity Coverage Ratio (LCR) in accordance with article 447 of the CRR (EU 575/2013), calculated in accordance with the Commission Delegated Regulation (EU) 2015/61.
| |
Interim report January–June 2024 | Page 23 of 28 |
Net Stable Funding Ratio
| | | | |
|
| June 30, |
| December 31, |
Skr bn | | 2024 | | 2023 |
Available stable funding |
| 274.7 |
| 276.3 |
Requiring stable funding |
| 205.9 |
| 210.5 |
Net Stable Funding Ratio |
| 133% | | 131% |
Information on Net Stable Funding Ratio (NSFR) in accordance with article 447 of the CRR (EU 575/2013), calculated in accordance with the Commission Delegated Regulation (EU) 2015/61.
Liquidity reserve1
| | | | | | | | | | | | | | | | | | | | |
| | June 30, 2024 | | December 31, 2023 | ||||||||||||||||
Skr bn |
| Total |
| Skr |
| EUR |
| USD |
| Other |
| Total |
| Skr |
| EUR |
| USD |
| Other |
Securities issued or guaranteed by sovereigns, central banks or multilateral development banks |
| 24.8 |
| 8.0 |
| 6.7 |
| 10.1 |
| — |
| 24.1 |
| 8.0 |
| 3.9 |
| 11.9 |
| 0.3 |
Securities issued or guaranteed by municipalities or other public entities |
| 24.7 |
| 5.8 |
| 6.1 |
| 12.8 |
| — |
| 16.5 |
| 5.0 |
| 4.7 |
| 6.8 |
| — |
Covered bonds issued by other institutions |
| 12.8 |
| 12.8 |
| — |
| — |
| — |
| 12.7 |
| 12.7 |
| — |
| — |
| — |
Balances with National Debt Office |
| 9.5 |
| 9.5 |
| — |
| — |
| — |
| 1.0 |
| 1.0 |
| — |
| — |
| — |
Total liquidity reserve |
| 71.8 |
| 36.1 |
| 12.8 |
| 22.9 |
| — |
| 54.3 |
| 26.7 |
| 8.6 |
| 18.7 |
| 0.3 |
1 | The liquidity reserve is a part of SEK's liquidity investments. |
Information on Liquidity reserve is included in accordance with the Commission Delegated Regulation (EU) 2015/61.
Note 11. Exposures
Net exposures are reported after taking into consideration effects of guarantees and credit default swaps. Amounts are calculated in accordance with capital adequacy calculations, but before the application of credit conversion factors.
Total net exposures by exposure class
| | | | | | | | | | | | | | | | | | | | | | | | |
| | Credits & interest-bearing | | Committed undisbursed loans, | | | | | | | | | ||||||||||||
| | securities | | derivatives, etc. | | Total | ||||||||||||||||||
| | June 30, 2024 | | December 31, 2023 | | June 30, 2024 | | December 31, 2023 | | June 30, 2024 | | December 31, 2023 | ||||||||||||
Skr bn |
| Amount |
| % |
| Amount |
| % |
| Amount |
| % |
| Amount |
| % |
| Amount |
| % |
| Amount |
| % |
Central governments |
| 165.9 |
| 45.9 |
| 159.1 |
| 46.3 |
| 60.1 |
| 73.8 |
| 46.8 |
| 67.2 |
| 226.0 |
| 51.1 |
| 205.9 |
| 49.8 |
Regional governments |
| 17.6 |
| 4.9 |
| 11.9 |
| 3.5 |
| 0.6 |
| 0.7 |
| 0.7 |
| 1.0 |
| 18.2 |
| 4.1 |
| 12.6 |
| 3.0 |
Multilateral development banks |
| 5.4 |
| 1.5 |
| 5.0 |
| 1.4 |
| 0.0 |
| 0.0 |
| 0.0 |
| 0.0 |
| 5.4 |
| 1.2 |
| 5.0 |
| 1.2 |
Public Sector Entity | | 1.0 | | 0.3 | | — | | — | | — | | — | | — | | — | | 1.0 | | 0.2 | | — | | — |
Financial institutions |
| 27.6 |
| 7.6 |
| 25.8 |
| 7.5 |
| 6.4 |
| 7.9 |
| 7.5 |
| 10.8 |
| 34.0 |
| 7.7 |
| 33.3 |
| 8.1 |
Corporates |
| 144.0 |
| 39.8 |
| 141.8 |
| 41.3 |
| 14.3 |
| 17.6 |
| 14.6 |
| 21.0 |
| 158.3 |
| 35.7 |
| 156.4 |
| 37.9 |
Equity exposures | | 0.0 | | 0.0 | | — | | — | | — | | — | | — | | — | | 0.0 | | 0.0 | | — | | — |
Total |
| 361.5 |
| 100.0 |
| 343.6 |
| 100.0 |
| 81.4 |
| 100.0 |
| 69.6 |
| 100.0 |
| 442.9 |
| 100.0 |
| 413.2 |
| 100.0 |
Net exposure by region and exposure class, as of June 30, 2024
| | | | | | | | | | | | | | | | | | |
| | | | | | | | | | | | | | West | | | | |
| | | | | | | | | | | | | | European | | Central- | | |
| | Middle | | | | | | | | | | | | countries | | and East | | |
| | East/ | | Asia excl. | | | | North | | Latin | | | | excl. | | European | | |
Skr bn |
| Africa |
| Japan |
| Japan |
| America |
| America |
| Sweden |
| Sweden |
| countries |
| Total |
Central governments |
| 0.0 |
| 0.1 |
| — |
| 2.9 |
| — |
| 202.2 |
| 18.8 |
| 2.0 |
| 226.0 |
Regional governments |
| — |
| — |
| — |
| — |
| — |
| 17.9 |
| 0.2 |
| 0.1 |
| 18.2 |
Multilateral development banks |
| — |
| 0.6 |
| — |
| — |
| — |
| — |
| 4.8 |
| — |
| 5.4 |
Public Sector | | — | | — | | — | | — | | — | | — | | 1.0 | | — | | 1.0 |
Financial institutions |
| 0.1 |
| — |
| 0.0 |
| 2.4 |
| 0.0 |
| 18.2 |
| 13.3 |
| — |
| 34.0 |
Corporates |
| 0.2 |
| 0.9 |
| 2.5 |
| 7.4 |
| 3.6 |
| 105.5 |
| 37.2 |
| 1.0 |
| 158.3 |
Equity exposures | | 0.0 | | 0.0 | | 0.0 | | 0.0 | | 0.0 | | 0.0 | | 0.0 | | 0.0 | | 0.0 |
Total |
| 0.3 |
| 1.6 |
| 2.5 |
| 12.7 |
| 3.6 | | 343.8 |
| 75.3 |
| 3.1 |
| 442.9 |
| |
Interim report January–June 2024 | Page 24 of 28 |
Net exposure by region and exposure class, as of December 31, 2023
| | | | | | | | | | | | | | | | | | |
| | | | | | | | | | | | | | West | | | |
|
| | | | | | | | | | | | | | European | | Central- | | |
| | Middle | | | | | | | | | | | | countries | | and East | | |
| | East/ | | Asia excl. | | | | North | | Latin | | | | excl. | | European | |
|
Skr bn |
| Africa |
| Japan |
| Japan |
| America |
| America |
| Sweden |
| Sweden |
| countries |
| Total |
Central governments |
| 0.0 |
| 0.2 |
| 0.5 |
| 0.5 |
| — |
| 180.9 |
| 21.7 |
| 2.1 |
| 205.9 |
Regional governments |
| — |
| — |
| — |
| — |
| — |
| 11.2 |
| 1.3 |
| 0.1 |
| 12.6 |
Multilateral development banks |
| — |
| — |
| — |
| 1.0 |
| — |
| — |
| 4.0 |
| — |
| 5.0 |
Public Sector | | — | | — | | — | | — | | — | | — | | — | | — | | — |
Financial institutions |
| 0.1 |
| — |
| 0.1 |
| 1.8 |
| — |
| 18.3 |
| 13.0 |
| — |
| 33.3 |
Corporates |
| 0.6 |
| 0.8 |
| 2.4 |
| 6.7 |
| 3.7 |
| 98.0 |
| 43.3 |
| 0.9 |
| 156.4 |
Equity exposures | | — | | — | | — | | — | | — | | — | | — | | — | | — |
Total |
| 0.7 |
| 1.0 |
| 3.0 |
| 10.0 |
| 3.7 | | 308.4 |
| 83.3 |
| 3.1 |
| 413.2 |
Net exposure to European countries, excluding Sweden
| | | | |
|
| June 30, |
| December 31, |
Skr bn | | 2024 | | 2023 |
France |
| 16.5 |
| 16.1 |
Germany | | 13.1 | | 9.4 |
Luxembourg |
| 10.3 |
| 12.2 |
United Kingdom |
| 8.6 |
| 7.1 |
Denmark |
| 7.2 |
| 6.9 |
Finland |
| 5.5 |
| 11.4 |
Norway | | 3.7 | | 5.7 |
Belgium |
| 3.0 |
| 3.7 |
The Netherlands | | 2.3 | | 0.6 |
Poland |
| 2.1 |
| 2.2 |
Ireland |
| 1.7 |
| 2.2 |
Spain |
| 1.1 |
| 2.6 |
Portugal |
| 0.9 |
| 1.3 |
Switzerland |
| 0.7 |
| 0.6 |
Austria |
| 0.4 |
| 3.3 |
Serbia | | 0.3 | | 0.4 |
Lithuania |
| 0.2 |
| 0.1 |
Italy | | 0.2 | | 0.2 |
Czech Republic |
| 0.2 |
| 0.1 |
Estonia |
| 0.2 |
| 0.1 |
Latvia |
| 0.1 |
| 0.1 |
Iceland | | 0.1 | | 0.1 |
Slovakia |
| 0.0 |
| 0.1 |
Total |
| 78.4 |
| 86.5 |
Note 12. Transactions with related parties
Transactions with related parties are described in Note 27 to the annual financial statements in SEK’s 2023 Annual Report on Form 20-F. No material changes have taken place in relation to transactions with related parties compared to the description in SEK’s 2023 Annual Report on Form 20-F.
Note 13. Events after the reporting period
No events with significant impact on the information in this report have occurred after the end of the reporting period.
| |
Interim report January–June 2024 | Page 25 of 28 |
The Board of Directors and the Chief Executive Officer confirm that this interim report provides a fair overview of both the Parent Company and the Consolidated Group’s operations and their respective financial position and results and describes material risks and uncertainties facing the Parent Company and the Consolidated Group.
Stockholm, July 16, 2024
AB SVENSK EXPORTKREDIT
SWEDISH EXPORT CREDIT CORPORATION
Lennart Jacobsen |
| Håkan Berg |
| |
| Chairman of the Board |
| Director of the Board |
|
Paula da Silva |
| Reinhold Geijer |
| Hanna Lagercrantz |
Director of the Board |
| Director of the Board |
| Director of the Board |
Katarina Ljungqvist | Carl Mellander | Eva Nilsagård | ||
Director of the Board | Director of the Board | Director of the Board |
Magnus Montan |
Chief Executive Officer |
SEK has established the following expected dates for the publication of financial information and other related matters:
October 22, 2024 |
| Interim report for the period January 1, 2024 – September 30, 2024 |
January 24, 2025 |
| Interim report for the period January 1, 2024 – December 31, 2024 |
The report contains information that SEK will disclose pursuant to the Securities Markets Act and/or the Financial Instruments Trading Act. The information was submitted for publication on July 16, 2024, 15:00 (CEST).
Additional information about SEK, including investor presentations and SEK’s 2023 Annual Report on Form 20-F, is available at www.sek.se. Information available on or accessible through SEK’s website is not incorporated herein by reference.
Alternative performance measures (see *)
Alternative performance measures (APMs) are key performance indicators that are not defined under IFRS or in the Capital Requirements Directive IV (CRD IV) or in regulation (EU) No. 575/2013 on prudential requirements for credit institutions and investment firms (CRR). SEK has presented these, either because they are in common use within the industry or because they comply with SEK’s assignment from the Swedish government. The APMs are used internally to monitor and manage operations, and are not considered to be directly comparable with similar key performance indicators presented by other companies. For additional information regarding the APMs, refer to www.sek.se.
*After-tax return on equity
Net profit, expressed as a percentage per annum of the current year’s average equity (calculated using the opening and closing balances for the report period).
*Average interest-bearing assets
This item includes cash and cash equivalents, treasuries/government bonds, other interest-bearing securities except loans, loans in the form of interest-bearing securities, loans to credit institutions and loans to the public, and is calculated using the opening and closing balances for the reporting period.
*Average interest-bearing liabilities
This item includes borrowing from credit institutions, borrowing from the public and debt securities issued and is calculated using the opening and closing balances for the reporting period.
Basic and diluted earnings per share (Skr)
Net profit divided by the average number of shares, which amounted to 3,990,000 for each period.
*CIRR loans as percentage of new lending
The proportion of officially supported export credits (CIRR) of new lending.
CIRR-system
The CIRR-system comprises of the system of officially supported export credits (CIRR).
Common Equity Tier 1 capital ratio
The capital ratio is the quotient of total common equity tier 1 capital and the total risk exposure amount.
Green bond
A green bond is a bond where the capital is earmarked for various forms of environmental projects.
Green loans
SEK offers green loans that promote the transition to a climate-smart and environmentally sustainable economy. Green loans are categorized under SEK’s framework for green bonds. The purpose is to stimulate green investments that are environmentally sustainable and contribute to one or more of the six environmental objectives in the EU taxonomy.
Leverage ratio
Tier 1 capital expressed as a percentage of the exposure measured under CRR (refer to Note 10).
Liquidity coverage ratio (LCR)
The liquidity coverage ratio is a liquidity metric that shows SEK’s highly liquid assets in relation to the company’s net cash outflows for the next 30 calendar days. An LCR of 100 percent means that the company’s liquidity reserve is of sufficient size to enable the company to manage stressed liquidity outflows over a period of 30 days. Unlike the Swedish FSA’s rules, the EU rules take into account the outflows that correspond to the need to pledge collateral for derivatives that would arise as a result of the effects of a negative market scenario.
Loans
Lending pertains to all credit facilities provided in the form of interest-bearing securities, and credit facilities granted by traditional documentation. SEK considers these amounts to be useful measurements of SEK’s lending volumes. Accordingly, comments on lending volumes in this report pertain to amounts based on this definition.
*Loans, outstanding and undisbursed
The total of loans in the form of interest-bearing securities, loans to credit institutions, loans to the public and loans, outstanding and undisbursed. Deduction is made for cash collateral under the security agreements for derivative contracts and deposits with time to maturity exceeding three months (see the Statement of Financial Position and Note 9).
Net stable funding ratio (NSFR)
This ratio measures stable funding in relation to the company’s illiquid assets over a one-year, stressed scenario in accordance with CRRII.
*New lending
New lending includes all new committed loans, irrespective of tenor. Not all new lending is reported in the Consolidated Statement of Financial Position and the Consolidated Statement of Cash Flows since certain portions comprise committed undisbursed loans (see Note 9). The amounts reported for committed undisbursed loans may change when presented in the Consolidated Statement of Financial Position due to changes in exchange rates, for example.
*New long-term borrowings
New borrowings with maturities exceeding one year, for which the amounts are based on the trade date.
*Outstanding senior debt
The total of borrowing from credit institutions, borrowing from the public and debt securities issued.
Own credit risk
Net fair value change due to credit risk on financial liabilities designated as at fair value through profit or loss.
Repurchase and redemption of own debt
The amounts are based on the trade date.
Social loans
Social loans are categorized according to SEK’s “Sustainability bond framework”. The purpose is to stimulate investments that are socially sustainable, such as in healthcare, education, basic infrastructure, or food security.
Sustainability classified loans
Sustainability classified loans refer to green, social and sustainability-linked loans.
Sustainability-linked loans
Sustainability-linked loans consist of working capital finance that promote the borrower’s sustainability efforts, which in turn support environmental and socially sustainable economic activities and growth. SEK’s sustainability-linked loans are based on International Loan Market Association’s (LMA) Sustainability-Linked Loan Principles.
Swedish exporters
SEK’s clients that directly or indirectly promote Swedish export.
Tier 1 capital ratio
The capital ratio is the quotient of total tier 1 capital and the total risk exposure amount.
Total capital ratio
The capital ratio is the quotient of total Own funds and the total risk exposure amount.
Unless otherwise stated, amounts in this report are in millions (mn) of Swedish kronor (Skr), abbreviated “Skr mn” and relate to the group consisting of the Parent Company and its consolidated subsidiary (together, the “Group” or the “Consolidated Group”). AB Svensk Exportkredit (SEK), is a Swedish corporation with the identity number 556084-0315, and with its registered office in Stockholm, Sweden. SEK is a public limited liability company as defined in the Swedish Companies Act. In some instances, under Swedish law, a public company is obliged to add “(publ.)” to its company name.
| |
Interim report January–June 2024 | Page 27 of 28 |
About Swedish Export Credit Corporation (SEK)
SEK is owned by the Swedish state, and since 1962 has enabled growth for thousands of Swedish companies. To expand their production, make acquisitions, employ more people and enable selling goods and services to customers worldwide.
| |
SEK’s mission | SEK’s mission is to ensure access to financial solutions for the Swedish export industry on commercial and sustainable terms. SEK can finance the industry’s transition in Sweden and abroad. The mission includes making available fixed-interest export credits within the officially supported CIRR-system. |
| |
SEK’s vision | SEK’s vision is a sustainable world through increased Swedish exports. |
| |
SEK’s core values | We are a high performing team. Our mission and our ability to make an impact lead to pride and job satisfaction. We are Proactive Engaged Team players. |
| |
SEK’s clients | We finance exporters, their subcontractors and foreign clients. The target group is companies with annual sales exceeding Skr 500 million and that are linked to Swedish interests and exports.
|
| |
SEK’s partnerships | Through Team Sweden, we have close partnerships with other export promotion agencies in Sweden such as Business Sweden and The Swedish Export Credit Agency (EKN). Our international network is substantial and we also work with numerous Swedish and international banks. |
| |
Interim report January–June 2024 | Page 28 of 28 |