                                  United States
                       Securities and Exchange Commission
                             Washington, D.C. 20549

                                   Form N-CSR
   Certified Shareholder Report of Registered Management Investment Companies


                                    811-3181

                      (Investment Company Act File Number)


                      Federated Short-Term Municipal Trust
         _______________________________________________________________

               (Exact Name of Registrant as Specified in Charter)


                            Federated Investors Funds
                              5800 Corporate Drive
                       Pittsburgh, Pennsylvania 15237-7000


                                 (412) 288-1900
                         (Registrant's Telephone Number)


                           John W. McGonigle, Esquire
                            Federated Investors Tower
                               1001 Liberty Avenue
                       Pittsburgh, Pennsylvania 15222-3779
                     (Name and Address of Agent for Service)
                (Notices should be sent to the Agent for Service)


                        Date of Fiscal Year End: 6/30/03


               Date of Reporting Period: Fiscal year ended 6/30/03


Item 1. Reports to Stockholders
Federated Investors
World-Class Investment Manager
Federated Short-Term Municipal Trust
ANNUAL SHAREHOLDER REPORT
June 30, 2003
FINANCIAL HIGHLIGHTS
MANAGEMENT'S DISCUSSION OF FUND PERFORMANCE
FINANCIAL STATEMENTS
REPORT OF ERNST & YOUNG LLP, INDEPENDENT AUDITORS
BOARD OF TRUSTEES AND FUND OFFICERS
VOTING PROXIES ON FUND PORTFOLIO SECURITIES
NOT FDIC INSURED * MAY LOSE VALUE * NO BANK GUARANTEE
Financial Highlights--Institutional Shares
(For a Share Outstanding Throughout Each Period)
Year Ended June 30 | | 2003 | | | 2002 | | | 2001 | | | 2000 | 1 | | 1999 | |
Net Asset Value, Beginning of Period | | $10.35 | | | $10.27 | | | $10.03 | | | $10.20 | | | $10.29 | |
Income From Investment Operations: | | | | | | | | | | | | | | | |
Net investment income | | 0.31 | | | 0.39 | 2 | | 0.44 | | | 0.43 | | | 0.44 | |
Net realized and unrealized gain (loss) on investments and futures contracts | | 0.13 | | | 0.08 | 2 | | 0.24 | | | (0.17 | ) | | (0.09 | ) |
|
TOTAL FROM INVESTMENT OPERATIONS | | 0.44 | | | 0.47 | | | 0.68 | | | 0.26 | | | 0.35 | |
|
Less Distributions: | | | | | | | | | | | | | | | |
Distributions from net investment income | | (0.31 | ) | | (0.39 | ) | | (0.44 | ) | | (0.43 | ) | | (0.44 | ) |
|
Net Asset Value, End of Period | | $10.48 | | | $10.35 | | | $10.27 | | | $10.03 | | | $10.20 | |
|
Total Return3 | | 4.32 | % | | 4.63 | % | | 6.90 | % | | 2.65 | % | | 3.39 | % |
|
| | | | | | | | | | | | | | | |
Ratios to Average Net Assets: | | | | | | | | | | | | | | | |
|
Expenses | | 0.47 | % | | 0.47 | % | | 0.47 | % | | 0.47 | % | | 0.47 | % |
|
Net investment income | | 2.98 | % | | 3.75 | %2 | | 4.32 | % | | 4.29 | % | | 4.21 | % |
|
Expense waiver/reimbursement4 | | 0.36 | % | | 0.37 | % | | 0.40 | % | | 0.37 | % | | 0.37 | % |
|
Supplemental Data: | | | | | | | | | | | | | | | |
|
Net assets, end of period (000 omitted) | | $342,549 | | $211,835 | | $167,025 | | $172,051 | | $202,226 | |
|
Portfolio turnover | | 28 | % | | 33 | % | | 58 | % | | 31 | % | | 19 | % |
|
1 Beginning with the year ended June 30, 2000, the Fund was audited by Ernst & Young LLP. The previous year was audited by other auditors.
2 Effective July 1, 2001, the Fund adopted the provisions of the American Institute of Certified Public Accountants (AICPA) Audit and Accounting Guide for Investment Companies and began accreting discount/amortizing premium on long-term debt securities. For the year ended June 30, 2002, this change had no effect on the net investment income per share or net realized and unrealized gain on investments per share, or the ratio of net investment income to average net assets. Per share, ratios and supplemental data for the periods prior to July 1, 2001 have not been restated to reflect this change in presentation.
3 Based on net asset value, which does not reflect the sales charge or contingent deferred sales charge, if applicable.
4 This expense decrease is reflected in both the expense and the net investment income ratios shown above.
See Notes which are an integral part of the Financial Statements
Financial Highlights--Institutional Service Shares
(For a Share Outstanding Throughout Each Period)
Year Ended June 30 | | 2003 | | | 2002 | | | 2001 | | | 2000 | 1 | | 1999 | |
Net Asset Value, Beginning of Period | | $10.35 | | | $10.27 | | | $10.03 | | | $10.20 | | | $10.29 | |
Income From Investment Operations: | | | | | | | | | | | | | | | |
Net investment income | | 0.29 | | | 0.36 | 2 | | 0.41 | | | 0.41 | | | 0.41 | |
Net realized and unrealized gain (loss) on investments and futures contracts | | 0.13 | | | 0.08 | 2 | | 0.24 | | | (0.17 | ) | | (0.09 | ) |
|
TOTAL FROM INVESTMENT OPERATIONS | | 0.42 | | | 0.44 | | | 0.65 | | | 0.24 | | | 0.32 | |
|
Less Distributions: | | | | | | | | | | | | | | | |
Distributions from net investment income | | (0.29 | ) | | (0.36 | ) | | (0.41 | ) | | (0.41 | ) | | (0.41 | ) |
|
Net Asset Value, End of Period | | $10.48 | | | $10.35 | | | $10.27 | | | $10.03 | | | $10.20 | |
|
Total Return3 | | 4.06 | % | | 4.37 | % | | 6.64 | % | | 2.39 | % | | 3.13 | % |
|
| | | | | | | | | | | | | | | |
Ratios to Average Net Assets: | | | | | | | | | | | | | | | |
|
Expenses | | 0.72 | % | | 0.72 | % | | 0.72 | % | | 0.72 | % | | 0.72 | % |
|
Net investment income | | 2.75 | % | | 3.50 | %2 | | 4.08 | % | | 4.03 | % | | 3.97 | % |
|
Expense waiver/reimbursement4 | | 0.36 | % | | 0.37 | % | | 0.40 | % | | 0.37 | % | | 0.37 | % |
|
Supplemental Data: | | | | | | | | | | | | | | | |
|
Net assets, end of period (000 omitted) | | $24,230 | | $28,577 | | $21,851 | | $14,282 | | $21,767 | |
|
Portfolio turnover | | 28 | % | | 33 | % | | 58 | % | | 31 | % | | 19 | % |
|
1 Beginning with the year ended June 30, 2000, the Fund was audited by Ernst & Young LLP. The previous year was audited by other auditors.
2 Effective July 1, 2001, the Fund adopted the provisions of the AICPA Audit and Accounting Guide for Investment Companies and began accreting discount/amortizing premium on long-term debt securities. For the year ended June 30, 2002, this change had no effect on the net investment income per share or net realized and unrealized gain on investments per share, or the ratio of net investment income to average net assets. Per share, ratios and supplemental data for the periods prior to July 1, 2001 have not been restated to reflect this change in presentation.
3 Based on net asset value, which does not reflect the sales charge or contingent deferred sales charge, if applicable.
4 This expense decrease is reflected in both the expense and the net investment income ratios shown above.
See Notes which are an integral part of the Financial Statements
Management's Discussion of Fund Performance
FUND PERFORMANCE
For the 12-month reporting period ended June 30, 2003, Federated Short-Term Municipal Trust produced a total return of 4.32% for the Institutional Shares (IS) and 4.06% for the Institutional Service Shares (ISS), as tax exempt dividend income was enhanced by price appreciation due to falling interest rates.1 These returns handily exceeded the Lipper Short-Term Municipal Debt Funds average total return of 3.26% over the period.2 Over the one-year reporting period, the total returns for the IS shares and ISS shares were 7th and 12th, respectively, out of 48 funds in the Lipper Short-Term Municipal Debt Funds category. For the five-year and ten-year periods, the fund's IS shares ranked 7 out of 35 funds and 4 out of 12 funds, respectively. For the five-year period, the fund's ISS shares ranked 13 out of 35 funds.3 Compared to taxable investments, the fund's one-year returns were equivalent to taxable returns of 5.97% (IS) and 5.57% for (ISS) for investors in the 35% federal income tax bracket.
Nevertheless, the fund was managed predominately for tax exempt income,4 with a secondary goal of minimizing the fluctuation of principal value. Over the period, the fund produced income dividends exempt from federal regular income taxes of approximately $0.3115 per share (IS) and $0.2854 per share (ISS). The net asset value of the fund rose 13 cents to $10.48 per share.
The fund's 30-day net distribution yield on June 30, 2003 was 2.82% (IS) and 2.57% (ISS). The fund's 30-day SEC yield as of June 30, 2003 was 1.77% (IS) and 1.52% (ISS).5 These yields beat the 1.30% yield available on an AA-rated two-year maturity bond issued on June 30, 2003,6 illustrating the attractiveness of the fund's income stream.
1 Past performance is no guarantee of future results. Investment return and principal value will fluctuate, so that an investor's shares, when redeemed, may be worth more or less than their original cost. Current performance information is available at our website www.federatedinvestors.com or by calling 1-800-341-7400.
2 Lipper figures represent the average of the total returns reported by all the mutual funds designated by Lipper, Inc. as falling into the respective categories indicated. They do not reflect sales charges.
3 Lipper rankings are based on total return and do not take sales charges into account.
4 Income may be subject to the federal alternative minimum tax and state and local taxes.
5 The 30-day net distribution yield reflects actual distributions made to shareholders. It is calculated by dividing the monthly annualized dividend plus short-term capital gains, if any, by the average 30-day offering price. The 30-day current net yield is calculated by dividing the net investment income per share for the 30 days ended on the date of calculation by the maximum offering price per share on that date. The figure is compounded and annualized.
6 Source: Municipal Market Data
MARKET OVERVIEW
Interest rates continued to reflect significant volatility over the reporting period. The municipal yield curve became steeper, in conjunction with the treasury yield curve, as the Federal Reserve Board (the Fed) continued to reduce short-term interest rates. Concern about potential deflation and the inability of the U.S. economy to achieve a sustained recovery weighed heavily on the fixed income markets in May and June and lead to a general decline in interest rates across the yield curve. The one-, two- and five-year maturities, as represented by AAA- rated Municipal Market Data yields, declined by 65 basis points, 74 basis points and 92 basis points, respectively.
The ratio of municipal bond yields to Treasury bond yields stayed near historically cheap levels across the yield curve. The primary reasons included the absolute low level of interest rates, municipal bond issuance continuing at record levels and the potential for additional tax reform being discounted by the municipal bond market. Financial market volatility ran at approximately twice the normal historical trends. The reasons for this period of "hyper" price volatility included uncertainty about the economic outlook, the war with Iraq, and the uncertain impact on the global economy of the war on terror. Municipal credit quality continued to erode as personal income tax and sales tax revenues declined as a result of the U.S. economy's weakness, and the government's spending reductions proved difficult to implement.
Flows into municipal bond funds, including Federated Short-Term Municipal Trust, were consistently positive. The increased level of demand from both retail and institutional sources helped the municipal bond market perform well, relative to other fixed income asset classes. In an interest rate sensitive environment, bonds on the short end of the curve performed very well on a risk-adjusted basis relative to their longer-term counterparts; as the yield curve steepened, short-term bond yields fell.
FUND STRATEGY
During the 12-month reporting period, the fund attempted to maximize tax exempt income subject to interest rate and credit risk constraints so as to provide an above average after-tax total return relative to its peer group. The fund sought to accomplish this goal by taking advantage of relative value opportunities in sector and security selection, as well as portfolio structure.
Investment strategy integrated management's views on both the interest rate and credit cycles. Income was the primary driver of total return, as it has been in the past. Since the fund's inception in 1981, more than 98% of the total return of the fund was due to tax exempt income. Tax efficiency continued to be emphasized in fund management decisions.
With interest rates at or close to the lows for the cycle, strategy focused on yield curve and duration management and making selective purchases of lower investment grade (A, BBB) credits. The steepness of the yield curve along with wide credit spreads provided the opportunity for attractive risk-adjusted returns.
Sectors that reflected the fund's desire to add income value included higher-yielding, short-term bonds in the Healthcare, Electric and Gas Utilities, Paper, and Oil and Refining Industries. Revenue bonds with dedicated revenue streams were emphasized over general obligation debt, due to sales and income tax pressures.
At the end of the reporting period, the fund had over 78% of its assets in issues rated A or better. The average rating of the fund's portfolio was AA.7 For the first three months of the reporting period, the duration of the fund ranged from 1.65 to 2.40 years8 as the fund experienced rapid asset growth and investments concentrated in bonds with maturities between three and five years. In the final nine months of the reporting period, the fund began to move the duration inward as interest rates fell.
7 Credit ratings pertain only to the securities in the portfolio and do not protect fund shares against market risk.
8 Duration is a measure of a security's price sensitivity to changes in interest rates. Securities with longer durations are more sensitive to changes in interest rates than securities of shorter durations.
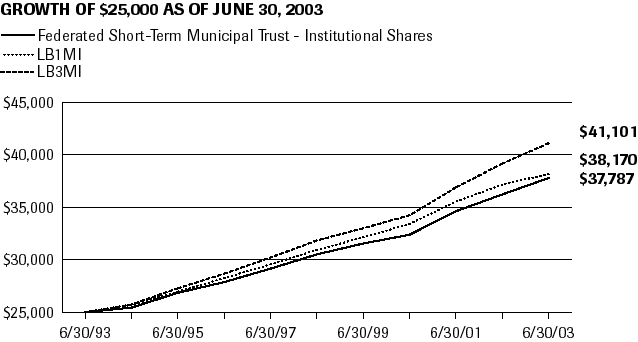
GROWTH OF A $25,000 INVESTMENT -- INSTITUTIONAL SHARES
The graph below illustrates the hypothetical investment of $25,0001 in the Federated Short-Term Municipal Trust (Institutional Shares) (the "Fund") from June 30, 1993 to June 30, 2003, compared to the Lehman Brothers 1-Year Municipal Index (LB1MI)2 and the Lehman Brothers 3-Year Municipal Index (LB3MI).2
Average Annual Total Return for the Period Ended 6/30/2003 | | |
1 Year | | 4.32% |
|
5 Years | | 4.37% |
|
10 Years | | 4.22% |
|
Past performance is no guarantee of future results. Returns shown do not reflect the deduction of taxes that a shareholder would pay on Fund distributions or the redemption of Fund shares. For after-tax returns, visit www.federatedinvestors.com. Investment return and principal value will fluctuate, so that an investor's shares, when redeemed, may be worth more or less than their original cost. Mutual funds are not obligations of or guaranteed by any bank and are not federally insured.
1 Represents a hypothetical investment of $25,000 in the Fund. The Fund's performance assumes the reinvestment of all dividends and distributions. The LB1MI and LB3MI have been adjusted to reflect reinvestment of dividends on securities in the indexes.
2 The LB1MI and LB3MI are not adjusted to reflect sales charges, expenses or other fees that the Securities and Exchange Commission (SEC) requires to be reflected in the Fund's performance. The LB1MI began performance on July 1, 1993. These indexes are unmanaged and investments cannot be made in an index.
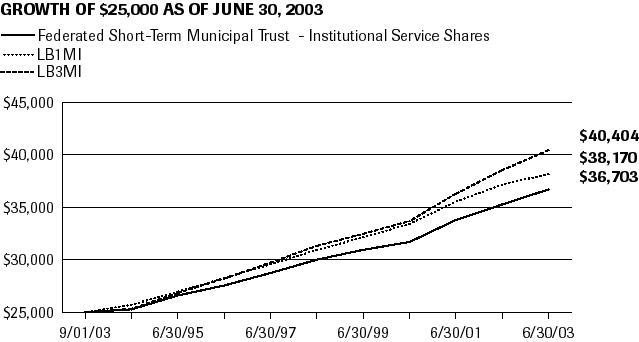
GROWTH OF A $25,000 INVESTMENT -- INSTITUTIONAL SERVICE SHARES
The graph below illustrates the hypothetical investment of $25,0001 in the Federated Short-Term Municipal Trust (Institutional Service Shares) (the "Fund") from September 1, 1993 (start of performance) to June 30, 2003, compared to the Lehman Brothers 1-Year Municipal Index (LB1MI)2, and the Lehman Brothers 3-Year Municipal Index (LB3MI).2
Average Annual Total Return for the Period Ended 6/30/2003 | | |
1 Year | | 4.06% |
|
5 Years | | 4.11% |
|
Start of Performance (9/1/1993) | | 3.98% |
|
Past performance is no guarantee of future results. Returns shown do not reflect the deduction of taxes that a shareholder would pay on Fund distributions or the redemption of Fund shares. For after-tax returns, visit www.federatedinvestors.com. Investment return and principal value will fluctuate, so that an investor's shares, when redeemed, may be worth more or less than their original cost. Mutual funds are not obligations of or guaranteed by any bank and are not federally insured.
1 Represents a hypothetical investment of $25,000 in the Fund. The Fund's performance assumes the reinvestment of all dividends and distributions. The LB1MI and LB3MI have been adjusted to reflect reinvestment of dividends on securities in the indexes.
2 The LB1MI and LB3MI are not adjusted to reflect sales charges, expenses or other fees that the SEC requires to be reflected in the Fund's performance. These indexes are unmanaged and investments cannot be made in an index.
Portfolio of Investments
June 30, 2003
Principal
Amount | | | | Credit
Rating | 1 | | Value |
| | | LONG-TERM MUNICIPALS--87.2%2 | | | | | |
| | | Alabama--4.1% | | | | | |
$ | 2,000,000 | | Alabama State Public School & College Authority, Revenue Bonds, 5.00%, 2/1/2007 | | AA/Aa3 | | $ | 2,215,020 |
| 3,040,000 | | Alabama State Public School & College Authority, Revenue Bonds, 5.00%, 2/1/2008 | | AA/Aa3 | | | 3,404,405 |
| 502,335 | 3 | Birmingham, AL, Fire Equipment Lease Obligation No. 2, 5.60%, 11/5/2004 | | NR | | | 523,177 |
| 2,760,000 | | DCH Health Care Authority, Health Care Facilities Revenue Bonds, 3.50%, 6/1/2005 | | A+/A1 | | | 2,837,446 |
| 860,000 | | Huntsville, AL Health Care Authority, Revenue Bonds, 4.75% (Huntsville Hospital System), 6/1/2004 | | NR/A2 | | | 883,478 |
| 1,190,000 | | Lauderdale County & Florence, AL Health Care Authority, Revenue Bonds Series 2000A), 5.50% (Coffee Health Group)/(MBIA INS), 7/1/2005 | | AAA/Aaa | | | 1,280,500 |
| 1,275,000 | | Lauderdale County & Florence, AL Health Care Authority, Revenue Bonds (Series 2000A), 5.50% (Coffee Health Group)/(MBIA INS), 7/1/2006 | | AAA/Aaa | | | 1,407,766 |
| 2,500,000 | | Mobile, AL IDB, (1994 Series A), 2.70% TOBs (International Paper Co.), Optional Tender 12/1/2003 | | BBB/Baa2 | | | 2,504,275 |
|
| | | TOTAL | | | | | 15,056,067 |
|
| | | Alaska--2.5% | | | | | |
| 3,000,000 | | Alaska State Housing Finance Corp., State Capital Project Revenue Bonds (Series 2001A), 5.00% (MBIA INS), 12/1/2006 | | AAA/Aaa | | | 3,330,120 |
| 1,260,000 | | Anchorage, AK, UT GO Bonds (Series B), 5.00% (FGIC INS), 12/1/2003 | | AAA/Aaa | | | 1,281,382 |
| 4,500,000 | | Valdez, AK Marine Terminal, (1994 Series A), 2.00% TOBs (Phillips Transportation Alaska, Inc.)/ (ConocoPhillips GTD), Optional Tender 1/1/2004 | | A/A3 | | | 4,514,625 |
|
| | | TOTAL | | | | | 9,126,127 |
|
| | | Arizona--3.0% | | | | | |
| 3,000,000 | | Arizona State Transportation Board, Transportation Excise Tax Revenue Bonds (Series 2000), 5.00% (Maricopa County, AZ Regional Area Road Fund), 7/1/2003 | | AA/Aa2 | | | 3,000,330 |
| 2,000,000 | | Maricopa County, AZ Pollution Control Corp., (Series 1994D), 1.75% TOBs (Arizona Public Service Co.), Optional Tender 4/5/2004 | | A-/A3 | | | 2,002,040 |
| 2,000,000 | | Maricopa County, AZ Pollution Control Corp., (Series 1994F), 1.75% TOBs (Arizona Public Service Co.), Optional Tender 4/5/2004 | | A-/A3 | | | 2,002,040 |
Principal
Amount | | | | Credit
Rating | 1 | | Value |
| | | LONG-TERM MUNICIPALS--continued2 | | | | | |
| | | Arizona--continued | | | | | |
$ | 2,000,000 | | Salt River Project, AZ Agricultural Improvement & Power District, Electric System Refunding Revenue Bonds (Series 2002D), 5.00%, 1/1/2007 | | AA/Aa2 | | $ | 2,211,640 |
| 1,000,000 | 3,4 | Yavapai, AZ IDA, Solid Waste Disposal Revenue Bonds, 3.65% TOBs (Waste Management, Inc.), Mandatory Tender 3/1/2006 | | BBB/Baa3 | | | 1,014,600 |
| 1,000,000 | 3,4 | Yavapai, AZ IDA, Solid Waste Disposal Revenue Bonds, 4.45% TOBs (Waste Management, Inc.), Mandatory Tender 3/1/2008 | | BBB/Baa3 | | | 1,026,450 |
|
| | | TOTAL | | | | | 11,257,100 |
|
| | | Arkansas--1.5% | | | | | |
| 1,000,000 | | Arkansas Development Finance Authority, Exempt Facilities Revenue Bonds, 3.50% TOBs (Waste Management, Inc.), Mandatory Tender 8/1/2003 | | BBB/NR | | | 1,000,830 |
| 530,000 | | Arkansas Development Finance Authority, SFM Revenue Bonds (Series 1997A-R), 6.50% (MBIA INS), 2/1/2011 | | AAA/NR | | | 532,703 |
| 640,000 | | Little Rock, AR Health Facilities Board, Healthcare Refunding Revenue Bonds (Series 2003), 4.25% (Baptist Medical Center, AR), 9/1/2006 | | A+/NR | | | 673,818 |
| 1,420,000 | | Pulaski County, AR, Hospital Refunding Revenue Bonds (Series 2002B), 4.00% (Arkansas Children's Hospital), 3/1/2005 | | A/A2 | | | 1,465,610 |
| 1,595,000 | | Pulaski County, AR, Hospital Refunding Revenue Bonds (Series 2002B), 4.75% (Arkansas Children's Hospital), 3/1/2008 | | A/A2 | | | 1,707,097 |
|
| | | TOTAL | | | | | 5,380,058 |
|
| | | California--2.1% | | | | | |
| 1,000,000 | | California State Department of Water Resources Power Supply Program, Power Supply Revenue Bonds (Series A), 5.50%, 5/1/2005 | | BBB+/A3 | | | 1,066,920 |
| 1,000,000 | | California State Department of Water Resources Power Supply Program, Revenue Bonds (Series 2002A), 5.50%, 5/1/2007 | | BBB+/A3 | | | 1,112,620 |
| 3,000,000 | | California State, Refunding UT GO Bonds, 5.00%, 2/1/2008 | | A/A2 | | | 3,291,360 |
| 1,000,000 | | California Statewide Communities Development Authority, Revenue Bonds (Series 2002C), 3.70% TOBs (Kaiser Permanente), Mandatory Tender 5/31/2005 | | A/A3 | | | 1,031,510 |
| 1,000,000 | | California Statewide Communities Development Authority, Revenue Bonds (Series 2002D), 4.35% TOBs (Kaiser Permanente), Mandatory Tender 2/1/2007 | | A/A3 | | | 1,061,720 |
|
| | | TOTAL | | | | | 7,564,130 |
|
Principal
Amount | | | | Credit
Rating | 1 | | Value |
| | | LONG-TERM MUNICIPALS--continued2 | | | | | |
| | | Colorado--1.5% | | | | | |
$ | 250,000 | | Colorado HFA, SFM Revenue Bond (Series C-1), 7.65%, 12/1/2025 | | NR/Aa2 | | $ | 257,420 |
| 50,000 | | Colorado HFA, Single Family Program Subordinate Bonds (Series 1998B), 4.625%, 11/1/2005 | | NR/A1 | | | 50,458 |
| 500,000 | | Colorado Health Facilities Authority, Hospital Refunding Revenue Bonds, 4.75% (Parkview Medical Center), 9/1/2003 | | NR/Baa1 | | | 502,290 |
| 640,000 | | Colorado Health Facilities Authority, Hospital Refunding Revenue Bonds, 5.00% (Parkview Medical Center), 9/1/2004 | | NR/Baa1 | | | 659,462 |
| 3,810,000 | | Countrydale, CO Metropolitan District, LT GO Refunding Bonds, 3.50% TOBs (Compass Bank, Birmingham LOC), Mandatory Tender 12/1/2007 | | NR/A1 | | | 3,915,613 |
|
| | | TOTAL | | | | | 5,385,243 |
|
| | | Delaware--1.8% | | | | | |
| 6,000,000 | | Delaware State, UT GO Bonds (Series 2002A), 5.00%, 7/1/2006 | | AAA/Aaa | | | 6,622,740 |
|
| | | District of Columbia--0.3% | | | | | |
| 1,130,000 | | District of Columbia, Revenue Bonds (Series 1999), 5.30% TOBs (819 7th Street LLC Issue)/(Branch Banking & Trust Co., Winston-Salem LOC), Mandatory Tender 10/1/2004 | | A+/NR | | | 1,161,651 |
|
| | | Florida--2.9% | | | | | |
| 1,000,000 | | Escambia County, FL Health Facilities Authority, Revenue Bonds (Series 2003A), 5.00% (Ascension Health Credit Group), 11/15/2008 | | AA/Aa2 | | | 1,109,570 |
| 740,000 | | Florida Housing Finance Corp., Homeowner Mortgage Revenue Bonds (Series 2), 4.75% (MBIA INS), 7/1/2019 | | AAA/Aaa | | | 773,885 |
| 1,300,000 | | Florida State Board of Education Capital Outlay, UT GO Bonds (Series 2001E), 5.00% (Florida State), 6/1/2004 | | AA+/Aa2 | | | 1,348,178 |
| 1,000,000 | | Highlands County, FL Health Facilities Authority, Hospital Revenue Bonds (Series 2002B), 3.50% (Adventist Health System), 11/15/2004 | | A/A3 | | | 1,026,180 |
| 2,000,000 | | Highlands County, FL Health Facilities Authority, Hospital Revenue Bonds, 3.35% TOBs (Adventist Health System), Mandatory Tender 9/1/2005 | | A/A3 | | | 2,043,800 |
| 500,000 | | Miami Beach, FL Health Facilities Authority, Hospital Revenue Bonds (Series 2001B), 5.50% TOBs (Mt. Sinai Medical Center, FL), Mandatory Tender 5/15/2005 | | BB/Ba3 | | | 484,190 |
| 1,885,000 | | Miami-Dade County, FL School District, Certificates of Participation (Series A), 5.25% (FSA INS), 10/1/2006 | | AAA/Aaa | | | 2,103,132 |
| 1,600,000 | | Palm Beach County, FL Health Facilities Authority, Hospital Refunding Revenue Bonds (Series 2001), 5.00% (BRCH Corporation Obligated Group), 12/1/2004 | | A/NR | | | 1,674,832 |
|
| | | TOTAL | | | | | 10,563,767 |
|
Principal
Amount | | | | Credit
Rating | 1 | | Value |
| | | LONG-TERM MUNICIPALS--continued2 | | | | | |
| | | Georgia--2.0% | | | | | |
$ | 2,000,000 | | Atlanta, GA Airport Revenue, Refunding General Revenue Bonds (Series 2003A), 5.00% (MBIA INS), 1/1/2008 | | AAA/Aaa | | $ | 2,235,640 |
| 1,640,000 | | Decatur County-Bainbridge, GA IDA, Revenue Bonds, 4.00% TOBs (John B. Sanifilippo & Son)/(Lasalle Bank, N.A. LOC), Mandatory Tender 6/1/2006 | | A+/NR | | | 1,716,834 |
| 3,000,000 | | Municipal Electric Authority of Georgia, Combustion Turbine Project Revenue Bonds (Series 2002A), 5.00% (MBIA INS), 11/1/2008 | | AAA/Aaa | | | 3,402,060 |
|
| | | TOTAL | | | | | 7,354,534 |
|
| | | Illinois--4.3% | | | | | |
| 2,500,000 | | Chicago, IL Transit Authority, Capital Grant Receipts Revenue Bonds (Series B), 5.00% (AMBAC INS), 6/1/2007 | | AAA/Aaa | | | 2,664,425 |
| 1,030,000 | | Illinois Health Facilities Authority, Revenue Bonds (Series 1998), 5.25% (Centegra Health System), 9/1/2003 | | A-/NR | | | 1,036,211 |
| 2,000,000 | | Illinois Health Facilities Authority, Revenue Refunding Bonds (Series A), 5.00% (Advocate Health Care Network), 8/15/2003 | | AA/Aa3 | | | 2,008,960 |
| 1,000,000 | | Illinois State, UT GO Bonds (First Series of December 2000), 5.50%, 12/1/2004 | | AA/Aa3 | | | 1,062,260 |
| 3,000,000 | | Illinois State, UT GO Bonds (First Series of July 2002), 5.00% (MBIA INS), 7/1/2007 | | AAA/Aaa | | | 3,348,840 |
| 2,000,000 | | Illinois State, UT GO Bonds (Series 2000), 5.25%, 8/1/2003 | | AA/Aa3 | | | 2,007,320 |
| 3,050,000 | | Will & Kendall Counties, IL Community Consolidated School District No. 202, UT GO Bonds, 5.50% (FSA INS), 12/30/2007 | | AAA/Aaa | | | 3,505,091 |
|
| | | TOTAL | | | | | 15,633,107 |
|
| | | Indiana--1.1% | | | | | |
| 1,000,000 | | Indiana Development Finance Authority, Refunding Revenue Bonds (Series 1998A), 4.75% TOBs (Southern Indiana Gas & Electric Co.), Mandatory Tender 3/1/2006 | | BBB+/Baa1 | | | 1,040,880 |
| 1,200,000 | | Indiana Health Facility Financing Authority, Health System Revenue Bonds (Series 2001), 5.00% (Sisters of St. Francis Health Services, Inc.), 11/1/2004 | | NR/Aa3 | | | 1,255,176 |
| 1,000,000 | | Indiana Health Facility Financing Authority, Revenue Bonds (Series 2002G), 5.50% (Ascension Health Credit Group), 11/15/2007 | | AA/Aa2 | | | 1,120,040 |
| 580,000 | | Indiana State HFA, SFM Revenue Bonds (Series C-3), 4.75%, 1/1/2029 | | NR/Aaa | | | 594,755 |
|
| | | TOTAL | | | | | 4,010,851 |
|
Principal
Amount | | | | Credit
Rating | 1 | | Value |
| | | LONG-TERM MUNICIPALS--continued2 | | | | | |
| | | Iowa--0.5% | | | | | |
$ | 1,880,000 | | Iowa Finance Authority, Iowa State Revolving Fund Revenue Bonds (Series 2001), 5.00%, 8/1/2004 | | AAA/Aaa | | $ | 1,961,686 |
|
| | | Kansas--1.5% | | | | | |
| 2,000,000 | | Burlington, KS, Refunding Revenue Bonds (Series 1998B), 4.75% TOBs (Kansas City Power And Light Co.), Mandatory Tender 10/1/2007 | | BBB/A2 | | | 2,104,840 |
| 1,000,000 | | Burlington, KS, Refunding Revenue Bonds (Series 1998C), 4.50% TOBs (Kansas City Power And Light Co.), Mandatory Tender 9/1/2003 | | BBB/A2 | | | 1,004,120 |
| 2,000,000 | | La Cygne, KS, Environmental Improvement Revenue Refunding Bonds (Series 1994), 3.90% TOBs (Kansas City Power And Light Co.), Mandatory Tender 9/1/2004 | | BBB/A1 | | | 2,037,460 |
| 165,000 | | Sedgwick & Shawnee Counties, KS, SFM Revenue Bonds, Mortgage-Backed Securities Program (Series 1998 A-1), 5.00% (GNMA Collateralized Home Mortgage Program COL), 6/1/2013 | | NR/Aaa | | | 174,195 |
| 50,000 | | Sedgwick & Shawnee Counties, KS, SFM Revenue Bonds (Series 2001B-1), 4.00% (GNMA Collateralized Home Mortgage Program GTD), 12/1/2013 | | NR/Aaa | | | 50,538 |
|
| | | TOTAL | | | | | 5,371,153 |
|
| | | Louisiana--3.8% | | | | | |
| 1,000,000 | | Calcasieu Parish, LA, IDB, PCR Refunding Bonds (Series 2001), 4.80% (Occidental Petroleum Corp.), 12/1/2006 | | BBB+/Baa2 | | | 1,080,820 |
| 2,200,000 | | Lake Charles, LA Harbor & Terminal District, Port Facilities Revenue Refunding Bond, Trunkline Lining Co. Project, 7.75% (PanEnergy Corp.), 8/15/2022 Callable @ 102 | | NR/Baa3 | | | 2,288,440 |
| 1,915,000 | | Louisiana Agricultural Finance Authority, Revenue Bonds, 5.20% (Louisiana-Pacific Corp.)/(Hibernia National Bank LOC), 5/1/2004 | | NR/A3 | | | 1,979,133 |
| 1,750,000 | | Louisiana Public Facilities Authority, Revenue Bonds (Series 2002), 5.00% (Ochsner Clinic Foundation Project)/(MBIA INS), 5/15/2008 | | NR/Aaa | | | 1,958,967 |
| 2,000,000 | | Louisiana State Offshore Terminal Authority, Deep Water Port Refunding Revenue Bonds (Series 2003D), 4.00% TOBs (Loop LLC), Mandatory Tender 9/1/2008 | | A/A3 | | | 2,091,140 |
| 2,500,000 | | St. Charles Parish, LA, PCR Refunding Bonds (Series 1999-C), 5.35% TOBs (Entergy Louisiana, Inc.), Mandatory Tender 10/1/2003 | | BBB-/Baa3 | | | 2,521,325 |
| 2,000,000 | | St. Charles Parish, LA, PCR Refunding Revenue Bonds (Series 1999A), 4.90% TOBs (Entergy Louisiana, Inc.), Mandatory Tender 6/1/2005 | | BBB-/Baa3 | | | 2,102,880 |
|
| | | TOTAL | | | | | 14,022,705 |
|
Principal
Amount | | | | Credit
Rating | 1 | | Value |
| | | LONG-TERM MUNICIPALS--continued2 | | | | | |
| | | Maryland--0.3% | | | | | |
$ | 1,000,000 | | Prince Georges County, MD, IDRB (Series 1993), 3.10% TOBs (International Paper Co.), Optional Tender 7/15/2003 | | BBB/Baa2 | | $ | 1,012,990 |
|
| | | Massachusetts--2.1% | | | | | |
| 1,500,000 | | Commonwealth of Massachusetts, Construction Loan LT GO Bonds (Series 2001C), 5.00%, 12/1/2010 | | AA-/Aa2 | | | 1,696,905 |
| 2,000,000 | | Commonwealth of Massachusetts, Construction Loan UT GO Bonds (Series 2002D), 5.25%, 8/1/2007 | | AA-/Aa2 | | | 2,246,680 |
| 2,495,000 | | Massachusetts HEFA, Revenue Bonds (Series 1999A), 5.25% (Caritas Christi Obligated Group), 7/1/2004 | | BBB/Baa3 | | | 2,525,115 |
| 1,060,000 | | Massachusetts HEFA, Revenue Bonds (Series C), 5.00% (Milton Hospital), 7/1/2004 | | BBB+/NR | | | 1,091,365 |
|
| | | TOTAL | | | | | 7,560,065 |
|
| | | Michigan--5.0% | | | | | |
| 1,250,000 | | Detroit, MI, Capital Improvement LT GO Bonds (Series 2002A), 5.00% (MBIA INS), 4/1/2007 | | AAA/Aaa | | | 1,388,962 |
| 1,000,000 | | Michigan Municipal Bond Authority, Refunding Revenue Bonds (Series 2002), 5.25% (Clean Water Revolving Fund), 10/1/2008 | | AAA/Aaa | | | 1,148,610 |
| 2,500,000 | | Michigan Municipal Bond Authority, Revenue Bonds, 5.25% (Clean Water Revolving Fund), 10/1/2007 | | AAA/Aaa | | | 2,845,475 |
| 1,450,000 | | Michigan Municipal Bond Authority, Revenue Bonds, 5.25% (Drinking Water Revolving Fund), 10/1/2007 | | AAA/Aaa | | | 1,646,562 |
| 4,000,000 | | Michigan Public Power Agency, Belle River Project Refunding Revenue Bonds (Series 2002A), 5.00%, 1/1/2005 | | AA/A1 | | | 4,218,640 |
| 1,250,000 | | Michigan Public Power Agency, Belle River Project Refunding Revenue Bonds (Series 2002A), 5.00% (MBIA INS), 1/1/2006 | | AAA/Aaa | | | 1,356,913 |
| 1,500,000 | | Michigan State Hospital Finance Authority, Hospital Refunding Revenue Bonds (Series 2003A), 5.00% (Henry Ford Health System, MI), 3/1/2007 | | A-/A1 | | | 1,624,560 |
| 1,005,000 | | Michigan State Hospital Finance Authority, Hospital Revenue & Refunding Bonds (Series 1998A), 4.70% (Hackley Hospital Obligated Group), 5/1/2004 | | NR/Baa1 | | | 1,024,849 |
| 1,265,000 | | Michigan State Hospital Finance Authority, Refunding Revenue Bonds (Series A), 5.50% (Trinity Healthcare Credit Group), 12/1/2003 | | AA-/Aa3 | | | 1,287,213 |
| 1,000,000 | | Michigan State Hospital Finance Authority, Refunding Revenue Bonds (Series A), 5.50% (Trinity Healthcare Credit Group), 12/1/2004 | | AA-/Aa3 | | | 1,057,090 |
| 820,000 | | Michigan State Hospital Finance Authority, Revenue & Refunding Bonds (Series 1998A), 4.40% (McLaren Health Care Corp.)/(Original Issue Yield: 4.45%), 6/1/2004 | | NR/A1 | | | 841,131 |
|
| | | TOTAL | | | | | 18,440,005 |
|
Principal
Amount | | | | Credit
Rating | 1 | | Value |
| | | LONG-TERM MUNICIPALS--continued2 | | | | | |
| | | Missouri--2.0% | | | | | |
$ | 895,000 | | Cape Girardeau County, MO IDA, Health Care Facilities Revenue Bonds (Series A), 4.50% (St. Francis Medical Center, MO), 6/1/2006 | | A/NR | | $ | 949,443 |
| 1,500,000 | | Missouri Highways & Transportation Commission, State Road Bonds (Series 2000A), 5.25%, 2/1/2005 | | AA/Aa2 | | | 1,594,605 |
| 1,500,000 | | Missouri Highways & Transportation Commission, State Road Bonds (Series 2000A), 5.25%, 2/1/2006 | | AA/Aa2 | | | 1,642,740 |
| 2,000,000 | | Missouri State HEFA, Revenue Bonds (Series 2002A), 5.00% (SSM Health Care Credit Group), 6/1/2007 | | AA-/NR | | | 2,191,640 |
| 1,000,000 | | Missouri State HEFA, (Series B), 3.00% RANs (Evangel University), 4/23/2004 | | NR | | | 1,006,760 |
|
| | | TOTAL | | | | | 7,385,188 |
|
| | | Nebraska--0.9% | | | | | |
| 1,500,000 | | Nebraska Public Power District, Contruction Notes, 3.50%, 12/1/2003 | | SP-1/MIG1 | | | 1,516,410 |
| 1,665,000 | | Nebraska Public Power District, General Revenue Bonds (Series 2002B), 4.00% (AMBAC INS), 1/1/2006 | | AAA/Aaa | | | 1,766,665 |
|
| | | TOTAL | | | | | 3,283,075 |
|
| | | Nevada--0.4% | | | | | |
| 1,500,000 | | Clark County, NV, IDRBs (Series 2003D), 3.35% TOBs (Southwest Gas Corp.), Mandatory Tender 9/1/2004 | | BBB-/Baa2 | | | 1,512,405 |
|
| | | New York--7.6% | | | | | |
| 1,000,000 | | Dutchess County, NY IDA, Revenue Bonds, 2.75% (Marist College), 7/1/2005 | | NR/Baa1 | | | 1,016,330 |
| 1,120,000 | | Dutchess County, NY IDA, Revenue Bonds, 3.55% (Marist College), 7/1/2008 | | NR/Baa1 | | | 1,152,883 |
| 1,110,000 | | Dutchess County, NY IDA, Revenue Bonds, 4.00% (Marist College), 7/1/2009 | | NR/Baa1 | | | 1,153,534 |
| 3,000,000 | | Long Island Power Authority, Electric System General Revenue Bonds (Series 2003A), 3.00%, 6/1/2004 | | A-/Baa1 | | | 3,041,610 |
| 2,000,000 | | Long Island Power Authority, Electric System General Revenue Bonds (Series 2003A), 4.50%, 6/1/2005 | | A-/Baa1 | | | 2,095,140 |
| 3,000,000 | | Metropolitan Transportation Authority, NY, Dedicated Tax Fund Revenue Bonds (Series 2002A), 5.00% (FSA INS), 11/15/2007 | | AAA/Aaa | | | 3,384,960 |
| 1,250,000 | | Metropolitan Transportation Authority, NY, Dedicated Tax Fund Revenue Bonds (Series 2002A), 5.25% (FSA INS), 11/15/2008 | | AAA/NR | | | 1,438,338 |
| 1,000,000 | | New York City, NY, UT GO Bonds (Series D), 5.00%, 8/1/2006 | | A/A2 | | | 1,084,890 |
Principal
Amount | | | | Credit
Rating | 1 | | Value |
| | | LONG-TERM MUNICIPALS--continued2 | | | | | |
| | | New York--continued | | | | | |
$ | 1,000,000 | | New York City, NY, UT GO Bonds (Series E), 5.00%, 8/1/2007 | | A/A2 | | $ | 1,096,430 |
| 2,000,000 | | New York City, NY, UT GO Bonds (Series 2002F), 5.25%, 8/1/2009 | | A/A2 | | | 2,229,740 |
| 900,000 | | New York State Dormitory Authority, Revenue Bonds (Series 2003), 3.00% (Kateri Residence)/(Allied Irish Banks PLC LOC), 7/1/2006 | | NR/Aa3 | | | 925,173 |
| 1,615,000 | | New York State Mortgage Agency, Homeowner Mortgage Revenue Bonds (Series 71), 4.75%, 10/1/2021 | | NR/Aa1 | | | 1,674,335 |
| 1,000,000 | | New York State Thruway Authority, Highway and Bridge Trust Fund Revenue Bd. (Series B-1), 5.50% (MBIA INS), 4/1/2004 | | AAA/Aaa | | | 1,034,230 |
| 2,000,000 | | New York State Thruway Authority, Local Highway & Bridge Service Contract Revenue Bonds (Series 2002), 5.00%, 4/1/2006 | | AA-/A3 | | | 2,184,340 |
| 2,000,000 | | New York State Thruway Authority, Local Highway & Bridge Service Contract Revenue Bonds (Series 2002), 5.00%, 4/1/2007 | | AA-/A3 | | | 2,220,800 |
| 2,000,000 | | Tobacco Settlement Financing Corp., NY, Asset-Backed Revenue Bonds (Series 2003A), 4.00% (New York State), 6/1/2006 | | AA-/NR | | | 2,100,360 |
|
| | | TOTAL | | | | | 27,833,093 |
|
| | | North Carolina--1.0% | | | | | |
| 1,000,000 | | North Carolina Eastern Municipal Power Agency, Revenue Refunding Bonds (Series C), 5.25% (Original Issue Yield: 5.40%), 1/1/2004 | | BBB/Baa3 | | | 1,018,360 |
| 490,000 | | North Carolina HFA, SFM Revenue Bonds (Series 1997TT), 4.90%, 9/1/2024 | | AA/Aa2 | | | 496,919 |
| 2,000,000 | | North Carolina Medical Care Commission, Healthcare Facilities Revenue Bonds (Series 2003A), 5.00% (Novant Health Obligated Group), 11/1/2007 | | AA-/Aa3 | | | 2,225,780 |
|
| | | TOTAL | | | | | 3,741,059 |
|
| | | Ohio--6.8% | | | | | |
| 1,000,000 | | Beavercreek, OH Local School District, Special Tax Anticipation Notes, 4.25%, 12/1/2004 | | NR | | | 1,037,250 |
| 3,000,000 | | Hamilton County, OH, Local Cooling Facilities Revenue Bonds (Series 1998), 4.90% TOBs (Trigen-Cinergy Solutions of Cincinnati LLC)/(Cinergy Corp. GTD), Mandatory Tender 6/1/2004 | | BBB/Baa2 | | | 3,039,630 |
Principal
Amount | | | | Credit
Rating | 1 | | Value |
| | | LONG-TERM MUNICIPALS--continued2 | | | | �� | |
| | | Ohio--continued | | | | | |
$ | 1,750,000 | | Knox County, OH, Hospital Facilities Revenue Refunding Bonds (Series 1998), 4.30% (Knox Community Hospital)/ (Radian Asset Assurance INS)/(Original Issue Yield: 4.40%), 6/1/2004 | | AA/NR | | $ | 1,796,357 |
| 1,500,000 | | Mahoning County, OH Hospital Facilities, Adjustable Rate Demand Health Care Facilities Revenue Refunding Bonds (Series 2002), 4.00% TOBs (Copeland Oaks Project)/(Sky Bank LOC), Mandatory Tender 3/31/2005 | | NR/A3 | | | 1,501,710 |
| 485,000 | | Ohio HFA, Residential Mortgage Revenue Bonds (Series 1997D-1), 4.85% (GNMA Collateralized Home Mortgage Program COL), 3/1/2015 | | NR/Aaa | | | 493,764 |
| 800,000 | | Ohio HFA, Residential Mortgage Revenue Bonds (Series 1998A-1), 4.60% (GNMA Collateralized Home Mortgage Program COL), 9/1/2026 | | AAA/Aaa | | | 804,472 |
| 2,250,000 | | Ohio State Air Quality Development Authority, Enviromental Refunding Revenue Bonds, 2.00% TOBs (MeadWestvaco Corp.), Mandatory Tender 11/1/2004 | | BBB/Baa2 | | | 2,251,688 |
| 2,000,000 | | Ohio State Air Quality Development Authority, Refunding Revenue Bonds (Series 2002A), 2.50% TOBs (Pennsylvania Power Co.), Mandatory Tender 7/1/2003 | | BBB-/Baa2 | | | 2,022,280 |
| 6,000,000 | | Ohio State Higher Education Capital Facilities UT GO Bonds (Series II-A), 5.00%, 12/1/2008 | | AA/Aa2 | | | 6,829,080 |
| 1,000,000 | | Ohio State Water Development Authority Pollution Control Facilities, Refunding Revenue Bonds (Series 1999B), 4.50% TOBs (Toledo Edison Co.), Mandatory Tender 9/1/2005 | | BBB-/Baa3 | | | 999,720 |
| 1,000,000 | | Ohio State Water Development Authority Pollution Control Facilities, Refunding Revenue Bonds (Series B), 4.40% TOBs (Ohio Edison Co.), Mandatory Tender 12/1/2003 | | BBB-/Baa2 | | | 1,007,510 |
| 1,000,000 | | Ohio State Water Development Authority, PCR Bonds (Series A), 3.40% TOBs (Cleveland Electric Illuminating Co.), Mandatory Tender 10/1/2004 | | BBB/Baa2 | | | 1,011,930 |
| 1,000,000 | | Ohio State Water Development Authority, Refunding Facility PCR Bonds, 2.25% TOBs (Ohio Edison Co.), Mandatory Tender 6/2/2005 | | BBB/Baa1 | | | 1,002,490 |
| 1,000,000 | | University of Cincinnati, OH, General Receipts Revenue Bonds (Series A), 5.50% (FGIC INS), 6/1/2006 | | AAA/Aaa | | | 1,112,670 |
|
| | | TOTAL | | | | | 24,910,551 |
|
| | | Oklahoma--1.3% | | | | | |
| 2,595,000 | | Oklahoma HFA, SFM Revenue Bonds (Series 1998D-2), 6.25% (GNMA Collateralized Home Mortgage Program COL), 9/1/2029 | | NR/Aaa | | | 2,807,608 |
| 2,000,000 | | Tulsa, OK International Airport, General Revenue Bonds, 5.00% (FGIC INS), 6/1/2004 | | AAA/Aaa | | | 2,069,660 |
|
| | | TOTAL | | | | | 4,877,268 |
|
Principal
Amount | | | | Credit
Rating | 1 | | Value |
| | | LONG-TERM MUNICIPALS--continued2 | | | | | |
| | | Oregon--0.8% | | | | | |
$ | 1,000,000 | | Clackamas County, OR Hospital Facilities Authority, Revenue Refunding Bonds (Series 2001), 5.00% (Legacy Health System), 5/1/2004 | | AA/Aa3 | | $ | 1,029,880 |
| 1,000,000 | | Clackamas County, OR Hospital Facilities Authority, Revenue Refunding Bonds (Series 2001), 5.00% (Legacy Health System), 5/1/2006 | | AA/Aa3 | | | 1,078,900 |
| 750,000 | | Port of Portland, OR, 3.00% TOBs (Union Pacific Railroad Co.)/(Union Pacific Corp. GTD), Optional Tender 12/1/2003 | | BBB/NR | | | 751,290 |
|
| | | TOTAL | | | | | 2,860,070 |
|
| | | Pennsylvania--4.8% | | | | | |
| 5,000,000 | | Montgomery County, PA IDA, PCR Refunding Bonds (Series 1999A), 5.20% TOBs (Peco Energy Co.), Mandatory Tender 10/1/2004 | | BBB+/A3 | | | 5,184,450 |
| 1,500,000 | | Pennsylvania EDFA, Resource Recovery Refunding Revenue Bonds (Series B), 6.75% (Northampton Generating), 1/1/2007 | | BBB-/NR | | | 1,558,995 |
| 200,000 | | Pennsylvania State Higher Education Facilities Authority, Revenue Bonds (Series 2001A), 5.75% (UPMC Health System), 1/15/2007 | | A/NR | | | 219,944 |
| 1,000,000 | | Pennsylvania State Higher Education Facilities Authority, Revenue Bonds (Series 2001A), 5.75% (UPMC Health System), 1/15/2008 | | A/NR | | | 1,107,960 |
| 2,000,000 | | Pennsylvania State Higher Education Facilities Authority, Revenue Bonds, 3.625% TOBs (Gannon University)/(PNC Bank, N.A. LOC), Mandatory Tender 5/1/2006 | | AA-/NR | | | 2,096,140 |
| 1,250,000 | | Pennsylvania State Turnpike Commission, Turnpike Refunding Revenue Bonds (Series 2001S), 5.50% (FGIC INS), 6/1/2006 | | AAA/Aaa | | | 1,391,600 |
| 2,000,000 | | Pennsylvania State University, Revenue Refunding Bonds, 5.00%, 3/1/2004 | | AA/Aa2 | | | 2,053,880 |
| 1,000,000 | | Pennsylvania State, Refunding UT GO Bonds, 5.125% (AMBAC INS)/(Original Issue Yield: 5.35%), 9/15/2011 | | AAA/Aaa | | | 1,120,430 |
| 1,237,396 | | Philadelphia, PA Municipal Authority, Equipment Revenue Bonds (Series 1997A), 5.297% (Philadelphia, PA Gas Works)/(AMBAC INS), 10/1/2004 | | AAA/Aaa | | | 1,297,757 |
| 1,000,000 | | Sayre, PA, Health Care Facilities Authority, Revenue Bonds (Series 2002A), 5.50% (Guthrie Healthcare System, PA), 12/1/2005 | | A-/NR | | | 1,075,800 |
| 440,000 | | Scranton-Lackawanna, PA Health & Welfare Authority, Revenue Bonds, 7.125% (Allied Services Rehabilitation Hospitals, PA), 7/15/2005 | | BB+ | | | 451,167 |
|
| | | TOTAL | | | | | 17,558,123 |
|
Principal
Amount | | | | Credit
Rating | 1 | | Value |
| | | LONG-TERM MUNICIPALS--continued2 | | | | | |
| | | Rhode Island--0.6% | | | | | |
$ | 600,000 | | Rhode Island State Health and Educational Building Corp., Hospital Financing Revenue Bonds (Series 2002), 5.00% (Lifespan Obligated Group), 8/15/2005 | | BBB/Baa2 | | $ | 626,268 |
| 650,000 | | Rhode Island State Health and Educational Building Corp., Hospital Financing Revenue Bonds (Series 2002), 5.25% (Lifespan Obligated Group), 8/15/2006 | | BBB/Baa2 | | | 689,761 |
| 700,000 | | Rhode Island State Health and Educational Building Corp., Hospital Financing Revenue Bonds (Series 2002), 5.50% (Lifespan Obligated Group), 8/15/2007 | | BBB/Baa2 | | | 752,003 |
|
| | | TOTAL | | | | | 2,068,032 |
|
| | | South Carolina--0.9% | | | | | |
| 1,000,000 | | Piedmont Municipal Power Agency, SC, Refunding Electric Revenue Bonds (Series 2002A), 5.00% (FGIC INS), 1/1/2004 | | AAA/Aaa | | | 1,019,420 |
| 1,000,000 | | Richland County, SC, Environmental Improvement Revenue Refunding Bonds (Series 2002A), 4.25% (International Paper Co.), 10/1/2007 | | BBB/Baa2 | | | 1,045,780 |
| 1,100,000 | | South Carolina State Public Service Authority, Revenue Bonds (Series D), 5.00% (Santee Cooper), 1/1/2007 | | AA-/Aa2 | | | 1,211,683 |
|
| | | TOTAL | | | | | 3,276,883 |
|
| | | South Dakota--0.6% | | | | | |
| 1,240,000 | | South Dakota State Health & Educational Authority, Refunding Revenue Bonds, 5.25% (Sioux Valley Hospital & Health System), 11/1/2005 | | A+/A1 | | | 1,330,061 |
| 890,000 | | South Dakota State Health & Educational Authority, Revenue Bonds, 5.25% (Westhills Village Retirement Community), 9/1/2009 | | A-/NR | | | 965,169 |
|
| | | TOTAL | | | | | 2,295,230 |
|
| | | Tennessee--3.7% | | | | | |
| 500,000 | | Clarksville, TN Natural Gas Acquisition Corp., Gas Refunding Revenue Bonds, 5.00% (Dominion Resources, Inc.), 11/1/2003 | | BBB+/NR | | | 505,285 |
| 1,000,000 | | Metropolitan Government Nashville & Davidson County, TN HEFA, Multifamily Housing Revenue Bonds, 5.20% TOBs (American Housing Corp.)/(FNMA LOC), Mandatory Tender 2/1/2006 | | AAA/NR | | | 1,083,350 |
| 1,995,000 | | Metropolitan Government Nashville & Davidson County, TN HEFA, Refunding Revenue Bonds (Series B), 4.50% (Vanderbilt University), 10/1/2005 | | AA/Aa2 | | | 2,135,548 |
| 2,085,000 | | Metropolitan Government Nashville & Davidson County, TN HEFA, Refunding Revenue Bonds (Series B), 4.50% (Vanderbilt University), 10/1/2006 | | AA/ Aa2 | | | 2,278,280 |
| 2,000,000 | | Metropolitan Government Nashville & Davidson County, TN HEFA, Revenue Bonds, 6.875% (Meharry Medical College)/(United States Treasury GTD)/(Original Issue Yield: 7.27%), 12/1/2024 | | AAA/Aaa | | | 2,202,040 |
Principal
Amount | | | | Credit
Rating | 1 | | Value |
| | | LONG-TERM MUNICIPALS--continued2 | | | | | |
| | | Tennessee--continued | | | | | |
$ | 2,000,000 | | Metropolitan Government Nashville & Davidson County, TN IDB, Revenue Bonds, 4.10% TOBs (Waste Management, Inc.), Mandatory Tender 8/1/2004 | | BBB/NR | | $ | 2,032,420 |
| 2,470,000 | | Sullivan County, TN Health Educational & Housing Facilities Board, Hospital Refunding Revenue Bonds, 4.00% (Wellmont Health System), 9/1/2005 | | BBB+/NR | | | 2,541,778 |
| 740,000 | | Sullivan County, TN Health Educational & Housing Facilities Board, Hospital Refunding Revenue Bonds, 5.00% (Wellmont Health System), 9/1/2007 | | BBB+/NR | | | 787,649 |
|
| | | TOTAL | | | | | 13,566,350 |
|
| | | Texas--8.3% | | | | | |
| 5,000,000 | | Austin, TX Water and Wastewater System, Refunding Revenue Bonds (Series 2002A), 5.25% (AMBAC INS), 11/15/2007 | | AAA/Aaa | | | 5,674,000 |
| 3,000,000 | | Brazos River Authority, TX, (Series 1995B), 5.05% TOBs (TXU Energy), Mandatory Tender 6/19/2006 | | BBB/Baa2 | | | 3,125,310 |
| 1,370,000 | | Gregg County, TX HFDC, Hospital Revenue Bonds (Series 2002A), 5.50% (Good Shepherd Medical Center), 10/1/2005 | | BBB/Baa2 | | | 1,443,542 |
| 2,000,000 | | Gulf Coast, TX Waste Disposal Authority, Environmental Facilities Refunding Revenue Bonds, 4.20% (Occidental Petroleum Corp.), 11/1/2006 | | BBB+/Baa2 | | | 2,105,040 |
| 2,265,000 | | Gulf Coast, TX Waste Disposal Authority, Revenue Bonds (Series 2002), 5.00% (Bayport Area System)/ (AMBAC INS), 10/1/2007 | | AAA/Aaa | | | 2,538,182 |
| 2,035,000 | | Lewisville, TX, Combination Contract Revenue & Special Assessment Bonds (Series 1997), 4.95% (United States Treasury GTD), 5/1/2021 | | NR | | | 2,059,949 |
| 3,000,000 | | Matagorda County, TX Navigation District Number One, PCR Refunding Bonds (Series 1999A), 3.75% TOBs (Central Power & Light Co.), Mandatory Tender 11/1/2003 | | BBB/Baa2 | | | 3,002,850 |
| 1,000,000 | | North Central Texas HFDC, Hospital Revenue Refunding Bonds (Series 2002), 4.00% (Children's Medical Center of Dallas)/(AMBAC INS), 8/15/2004 | | AAA/Aaa | | | 1,031,420 |
| 750,000 | | Sabine River Authority, TX, PCR Refunding Bonds (Series 2001C), 4.00% TOBs (TXU Energy), Mandatory Tender 11/1/2003 | | BBB/Baa2 | | | 754,275 |
| 750,000 | | San Antonio, TX Electric & Gas System, Refunding Revenue Bonds (Series 2002), 5.25%, 2/1/2008 | | AA+/Aa1 | | | 846,285 |
| 1,130,000 | | Tarrant County, TX Jr. College District, Refunding LT GO Bonds (Series 2001A), 4.75%, 2/15/2004 | | AAA/Aa1 | | | 1,156,758 |
| 6,000,000 | | Texas Turnpike Authority, Second Tier Bond Anticipation Notes (Series 2002), 5.00%, 6/1/2008 | | AA/Aa3 | | | 6,733,920 |
|
| | | TOTAL | | | | | 30,471,531 |
|
Principal
Amount | | | | Credit
Rating | 1 | | Value |
| | | LONG-TERM MUNICIPALS--continued2 | | | | | |
| | | Utah--1.0% | | | | | |
$ | 1,650,000 | | Alpine, UT School District, UT GO Bonds, 5.25% (Utah Qualified Local School Board Program GTD), 3/15/2006 | | NR/Aaa | | $ | 1,813,168 |
| 1,500,000 | | Utah Associated Municipal Power Systems, Revenue Bonds (Series 2003A), 5.00% (Payson Power Project)/(FSA INS), 4/1/2008 | | AAA/Aaa | | | 1,680,945 |
|
| | | TOTAL | | | | | 3,494,113 |
|
| | | Virginia--0.8% | | | | | |
| 1,000,000 | | Chesterfield County, VA IDA, PCR Bonds, 4.95% (Virginia Electric & Power Co.), 12/1/2007 | | BBB+/A3 | | | 1,044,940 |
| 2,000,000 | | Louisa, VA IDA, Solid Waste & Sewage Disposal Revenue Bonds (Series 2000A), 1.85% TOBs (Virginia Electric & Power Co.), Mandatory Tender 4/1/2004 | | BBB+/A3 | | | 2,011,360 |
|
| | | TOTAL | | | | | 3,056,300 |
|
| | | Washington--3.2% | | | | | |
| 1,155,000 | | Clark County, WA Public Utilities District No. 001, Generating System Revenue Refunding Bonds (Series 2000), 5.50% (FSA, INS), 1/1/2005 | | AAA/Aaa | | | 1,227,407 |
| 2,065,000 | | Clark County, WA Public Utilities District No. 001, Generating System Revenue Refunding Bonds (Series 2000), 5.50% (FSA INS), 1/1/2006 | | AAA/Aaa | | | 2,264,747 |
| 1,310,000 | | Spokane, WA, Refunding UT GO Bonds, 5.50% (MBIA INS), 12/15/2007 | | AAA/Aaa | | | 1,503,356 |
| 2,500,000 | | Washington State Public Power Supply System, Nuclear Project No. 2 Revenue Refunding Bond, (Series 1997B), 5.50% (Energy Northwest, WA), 7/1/2003 | | AA-/Aa1 | | | 2,500,300 |
| 2,000,000 | | Washington State, Refunding UT GO Bonds, 5.25%, 9/1/2005 | | AA+/Aa1 | | | 2,166,080 |
| 2,000,000 | | Washington State, Various Purpose Refunding UT GO Bonds (Series R-2003A), 3.50% (MBIA INS), 1/1/2007 | | AAA/Aaa | | | 2,106,900 |
|
| | | TOTAL | | | | | 11,768,790 |
|
| | | Wisconsin--0.7% | | | | | |
| 1,000,000 | | Pleasant Prairie, WI Water & Sewer System, Bond Anticipation Notes, 4.00%, 10/1/2007 | | NR/A3 | | | 1,048,950 |
| 1,500,000 | | Wisconsin State HEFA, Revenue Bonds (Series 2002A), 5.00% (Ministry Health Care)/(MBIA INS), 2/15/2005 | | AAA/Aaa | | | 1,582,080 |
|
| | | TOTAL | | | | | 2,631,030 |
|
Principal
Amount | | | | Credit
Rating | 1 | | Value |
| | | LONG-TERM MUNICIPALS--continued2 | | | | | |
| | | Wyoming--1.5% | | | | | |
$ | 2,150,000 | | Albany County, WY, Pollution Control Revenue Bonds (Series 1985), 3.00% TOBs (Union Pacific Railroad Co.)/ (Union Pacific Corp. GTD), Optional Tender 12/1/2003 | | BBB/NR | | $ | 2,153,698 |
| 3,500,000 | | Lincoln County, WY, PCR Refunding Bonds (Series 1991), 3.40% TOBs (Pacificorp), Mandatory Tender 6/1/2010 | | A/A3 | | | 3,501,015 |
|
| | | TOTAL | | | | | 5,654,713 |
|
| | | TOTAL LONG-TERM MUNICIPALS (IDENTIFIED COST $311,110,157) | | | | | 319,727,783 |
|
| | | SHORT-TERM MUNICIPALS--11.2%2 | | | | | |
| | | Arizona--0.9% | | | | | |
| 1,000,000 | | Maricopa County, AZ, IDA, 1.30% CP (American Water Capital Corp.), Mandatory Tender 9/2/2003 | | A-2/VMIG2 | | | 1,000,000 |
| 1,200,000 | | Prescott, AZ IDA, (Series A) Weekly VRDNs (Prescott Convention Center, Inc.)/(Household Finance Corp. GTD) | | A-1/NR | | | 1,200,000 |
| 1,200,000 | | Prescott, AZ IDA, (Series B) Weekly VRDNs (Prescott Convention Center, Inc.)/(Household Finance Corp. GTD) | | A-1/NR | | | 1,200,000 |
|
| | | TOTAL | | | | | 3,400,000 |
|
| | | California--1.0% | | | | | |
| 3,800,000 | | Riverside County, CA Public Financing Authority, (1985 Series A) Weekly VRDNs (Riverside County, CA)/ (Commerzbank AG, Frankfurt LOC) | | A-2/VMIG1 | | | 3,800,000 |
|
| | | Georgia--0.3% | | | | | |
| 1,000,000 | | Bibb County, GA Development Authority, (Series 1991IR-1) Weekly VRDNs (Temple-Inland, Inc.) | | A-2/NR | | | 1,000,000 |
|
| | | Illinois--1.6% | | | | | |
| 2,000,000 | | Chicago, IL, Gas Supply Revenue (Series 2000B), 1.15% CP (Peoples Gas Light & Coke Co.), Mandatory Tender 3/18/2004 | | A-2/VMIG1 | | | 2,000,000 |
| 4,000,000 | | Illinois Development Finance Authority, PCR, (Illinois Power Co.), (Series A), Weekly Auction Rate Notes (MBIA INS) | | AAA/Aaa | | | 4,000,000 |
|
| | | TOTAL | | | | | 6,000,000 |
|
| | | Indiana--3.8% | | | | | |
| 13,900,000 | | Indiana Health Facility Financing Authority, (Series 2000B) Daily VRDNs (Clarian Health Partners, Inc.)/(J.P. Morgan Chase Bank LIQ) | | A-1+/VMIG1 | | | 13,900,000 |
|
| | | Missouri--2.3% | | | | | |
| 4,350,000 | | Missouri State Environmental Improvement & Energy Authority, (AmerenUE), (Series 1998A), Auction Rate Notes | | A-2/VMIG1 | | | 4,350,000 |
| 1,000,000 | | Missouri State Environmental Improvement & Energy Authority, (AmerenUE), (Series 1998C), Auction Rate Notes | | A-2/VMIG1 | | | 1,000,000 |
Principal
Amount | | | | Credit
Rating | 1 | | Value |
| | | SHORT-TERM MUNICIPALS--continued2 | | | | | |
| | | Missouri--continued | | | | | |
$ | 2,625,000 | | Missouri State Environmental Improvement & Energy Authority, (AmerenUE), (Series 2000B), Auction Rate Notes | | A-2/VMIG1 | | $ | 2,625,000 |
| 425,000 | | Missouri State Environmental Improvement & Energy Authority, (AmerenUE), (Series 2000C), Auction Rate Notes | | A-2/VMIG1 | | | 425,000 |
|
| | | TOTAL | | | | | 8,400,000 |
|
| | | North Carolina--0.5% | | | | | |
| 1,700,000 | | Martin County, NC IFA, (Series 1993) Weekly VRDNs (Weyerhaeuser Co.) | | A-2/NR | | | 1,700,000 |
|
| | | Tennessee--0.3% | | | | | |
| 1,000,000 | | Carter County, TN IDB, (Series 1983) Weekly VRDNs (Inland Container Corp.)/(Temple-Inland, Inc. GTD) | | A-2/NR | | | 1,000,000 |
|
| | | Utah--0.3% | | | | | |
| 1,000,000 | | Emery County, UT, (Series 1994) Daily VRDNs (Pacificorp)/(AMBAC INS)/(Bank of Nova Scotia, Toronto LIQ) | | A-1+/VMIG1 | | | 1,000,000 |
|
| | | Washington--0.2% | | | | | |
| 800,000 | | Port Grays Harbor, WA Industrial Development Corp., Solid Waste Disposal Revenue Bonds (Series 1993) Weekly VRDNs (Weyerhaeuser Co.) | | A-2/NR | | | 800,000 |
|
| | | TOTAL SHORT-TERM MUNICIPALS (IDENTIFIED COST $41,000,000) | | | | | 41,000,000 |
|
| | | TOTAL INVESTMENTS--98.4% (IDENTIFIED COST $352,110,157)5 | | | | | 360,727,783 |
|
| | | OTHER ASSETS AND LIABILITIES-NET--1.6% | | | | | 6,051,164 |
|
| | | NET ASSETS--100% | | | | $ | 366,778,947 |
|
1 Please refer to the Appendix of the Statement of Additional Information for an explanation of the credit ratings. Current credit ratings are unaudited.
2 Securities that are subject to AMT represent 11.2% of the portfolio as calculated based upon total portfolio market value (unaudited).
3 Denotes a restricted security which is subject to restrictions on resale under federal securities laws. At June 30, 2003, these securities amounted to $2,564,227 which represents 0.7% of net assets. Included in these amounts are restricted securities which have been deemed liquid (amounted to $2,041,050 which represents 0.6% of net assets).
4 Denotes a restricted security that has been deemed liquid by criteria approved by the Fund's Board of Trustees.
5 The cost of investments for federal tax purposes amounts to $352,110,092.
Note: The categories of investments are shown as a percentage of total net assets at June 30, 2003.
The following acronyms are used throughout this portfolio:
AMBAC | - --American Municipal Bond Assurance Corporation |
AMT | - --Alternative Minimum Tax |
COL | - --Collateralized |
CP | - --Commercial Paper |
EDFA | - --Economic Development Financing Authority |
FGIC | - --Financial Guaranty Insurance Corporation |
FNMA | - --Federal National Mortgage Association |
FSA | - --Financial Security Assurance, Inc. |
GNMA | - --Government National Mortgage Association |
GO | - --General Obligation |
GTD | - --Guaranteed |
HEFA | - --Health and Education Facilities Authority |
HFA | - --Housing Finance Authority |
HFDC | - --Health Facility Development Corporation |
IDA | - --Industrial Development Authority |
IDB | - --Industrial Development Bond |
IDRB | - --Industrial Development Revenue Bond |
IFA | - --Industrial Finance Authority |
INS | - --Insured |
LIQ | - --Liquidity Agreement |
LOC | - --Letter of Credit |
LT | - --Limited Tax |
MBIA | - --Municipal Bond Insurance Association |
PCR | - --Pollution Control Revenue |
RANs | - --Revenue Anticipation Notes |
SFM | - --Single Family Mortgage |
TOBs | - --Tender Option Bonds |
UT | - --Unlimited Tax |
VRDNs | - --Variable Rate Demand Notes |
See Notes which are an integral part of the Financial Statements
Statement of Assets and Liabilities
June 30, 2003
Assets: | | | | | | | |
Total investments in securities, at value (identified cost $352,110,157) | | | | | $ | 360,727,783 | |
Cash | | | | | | 2,818 | |
Income receivable | | | | | | 3,702,666 | |
Receivable for investments sold | | | | | | 435,000 | |
Receivable for shares sold | | | | | | 6,646,543 | |
Prepaid expenses | | | | | | 12,335 | |
|
TOTAL ASSETS | | | | | | 371,527,145 | |
|
Liabilities: | | | | | | | |
Payable for investments purchased | | $ | 3,909,612 | | | | |
Payable for shares redeemed | | | 403,713 | | | | |
Income distribution payable | | | 417,060 | | | | |
Payable for transfer and dividend disbursing agent fees and expenses | | | 1,355 | | | | |
Payable for portfolio accounting fees | | | 11,451 | | | | |
Payable for shareholder services fees | | | 5,007 | | | | |
|
TOTAL LIABILITIES | | | | | | 4,748,198 | |
|
Net assets for 35,002,700 shares outstanding | | | | | $ | 366,778,947 | |
|
Net Assets Consist of: | | | | | | | |
Paid in capital | | | | | $ | 362,911,834 | |
Net unrealized appreciation of investments | | | | | | 8,617,626 | |
Accumulated net realized loss on investments and futures contracts | | | | | | (4,750,484 | ) |
Distributions in excess of net investment income | | | | | | (29 | ) |
|
TOTAL NET ASSETS | | | | | $ | 366,778,947 | |
|
Net Asset Value, Offering Price and Redemption Proceeds Per Share | | | | | | | |
Institutional Shares: | | | | | | | |
$342,549,414 ÷ 32,690,332 shares outstanding | | | | | | $10.48 | |
|
Institutional Service Shares: | | | | | | | |
$24,229,533 ÷ 2,312,368 shares outstanding | | | | | | $10.48 | |
|
See Notes which are an integral part of the Financial Statements
Statement of Operations
Year Ended June 30, 2003
Investment Income: | | | | | | | | | | | | |
Interest | | | | | | | | | | $ | 11,222,355 | |
|
Expenses: | | | | | | | | | | | | |
Investment adviser fee (Note 6) | | | | | | $ | 1,302,479 | | | | | |
Administrative personnel and services fee (Note 6) | | | | | | | 244,866 | | | | | |
Custodian fees | | | | | | | 15,038 | | | | | |
Transfer and dividend disbursing agent fees and expenses (Note 6) | | | | | | | 60,262 | | | | | |
Directors'/Trustees' fees | | | | | | | 11,780 | | | | | |
Auditing fees | | | | | | | 18,771 | | | | | |
Legal fees | | | | | | | 5,095 | | | | | |
Portfolio accounting fees (Note 6) | | | | | | | 115,170 | | | | | |
Distribution services fee--Institutional Service Shares (Note 6) | | | | | | | 82,649 | | | | | |
Shareholder services fee--Institutional Shares (Note 6) | | | | | | | 731,401 | | | | | |
Shareholder services fee--Institutional Service Shares (Note 6) | | | | | | | 82,649 | | | | | |
Share registration costs | | | | | | | 56,022 | | | | | |
Printing and postage | | | | | | | 36,202 | | | | | |
Insurance premiums | | | | | | | 1,733 | | | | | |
Miscellaneous | | | | | | | 6,481 | | | | | |
|
TOTAL EXPENSES | | | | | | | 2,770,598 | | | | | |
|
Waivers (Note 6): | | | | | | | | | | | | |
Waiver of investment adviser fee | | $ | (343,574 | ) | | | | | | | | |
Waiver of transfer and dividend disbursing agent fees and expenses | | | (9,015 | ) | | | | | | | | |
Waiver of distribution services fee--Institutional Service Shares | | | (82,649 | ) | | | | | | | | |
Waiver of shareholder services fee--Institutional Shares | | | (731,401 | ) | | | | | | | | |
|
TOTAL WAIVERS | | | | | | | (1,166,639 | ) | | | | |
|
Net expenses | | | | | | | | | | | 1,603,959 | |
|
Net investment income | | | | | | | | | | | 9,618,396 | |
|
Realized and Unrealized Gain (Loss) on Investments: | | | | | | | | | | | | |
Net realized loss on investments | | | | | | | | | | | (502,112 | ) |
Net change in unrealized appreciation of investments | | | | | | | | | | | 4,300,411 | |
|
Net realized and unrealized gain on investments | | | | | | | | | | | 3,798,299 | |
|
Change in net assets resulting from operations | | | | | | | | | | $ | 13,416,695 | |
|
See Notes which are an integral part of the Financial Statements
Statement of Changes in Net Assets
Year Ended June 30 | | | 2003 | | | | 2002 | |
Increase (Decrease) in Net Assets | | | | | | | | |
Operations: | | | | | | | | |
Net investment income | | $ | 9,618,396 | | | $ | 8,108,322 | |
Net realized loss on investments | | | (502,112 | ) | | | (315,236 | ) |
Net change in unrealized appreciation of investments | | | 4,300,411 | | | | 1,883,229 | |
|
CHANGE IN NET ASSETS RESULTING FROM OPERATIONS | | | 13,416,695 | | | | 9,676,315 | |
|
Distributions to Shareholders: | | | | | | | | |
Distributions from net investment income | | | | | | | | |
Institutional Shares | | | (8,707,429 | ) | | | (7,270,217 | ) |
Institutional Service Shares | | | (910,774 | ) | | | (838,177 | ) |
|
CHANGE IN NET ASSETS RESULTING FROM DISTRIBUTIONS TO SHAREHOLDERS | | | (9,618,203 | ) | | | (8,108,394 | ) |
|
Share Transactions: | | | | | | | | |
Proceeds from sale of shares | | | 303,072,427 | | | | 133,457,181 | |
Net asset value of shares issued to shareholders in payment of distributions declared | | | 4,367,634 | | | | 3,625,248 | |
Cost of shares redeemed | | | (184,871,307 | ) | | | (87,114,862 | ) |
|
CHANGE IN NET ASSETS RESULTING FROM SHARE TRANSACTIONS | | | 122,568,754 | | | | 49,967,567 | |
|
Change in net assets | | | 126,367,246 | | | | 51,535,488 | |
|
Net Assets: | | | | | | | | |
Beginning of period | | | 240,411,701 | | | | 188,876,213 | |
|
End of period (including distributions in excess of net investment income of $(29) and $(77), respectively) | | $ | 366,778,947 | | | $ | 240,411,701 | |
|
See Notes which are an integral part of the Financial Statements
Notes to Financial Statements
June 30, 2003
1. ORGANIZATION
Federated Short-Term Municipal Trust (the "Fund") is registered under the Investment Company Act of 1940, as amended (the "Act"), as a diversified, open-end management investment company. The Fund offers two classes of shares: Institutional Shares and Institutional Service Shares. The investment objective of the Fund is to provide dividend income which is exempt from federal regular income tax. The Fund pursues this investment objective by investing in a portfolio of tax exempt securities with a dollar-weighted average maturity of less than three years.
2. SIGNIFICANT ACCOUNTING POLICIES
The following is a summary of significant accounting policies consistently followed by the Fund in the preparation of its financial statements. These policies are in conformity with generally accepted accounting principles ("GAAP") in the United States of America.
Investment Valuations
Municipal bonds are valued by an independent pricing service, taking into consideration yield, liquidity, risk, credit quality, coupon, maturity, type of issue and any other factors or market data the pricing service deems relevant. Short-term securities are valued according to the mean between bid and asked prices provided by an independent pricing service. However, short-term securities with remaining maturities of 60 days or less at the time of purchase may be valued at amortized cost, which approximates fair market value.
Securities for which no quotations are readily available are valued at fair value as determined in good faith using methods approved by the Board of Trustees (the "Trustees").
Investment Income, Expenses and Distributions
Interest income and expenses are accrued daily. Dividend income and distributions to shareholders are recorded on the ex-dividend date. Non-cash dividends included in dividend income, if any, are recorded at fair value. The Fund offers multiple classes of shares, which differ in their respective distribution and service fees. All shareholders bear the common expenses of the Fund based on average daily net assets of each class, without distinction between share classes. Dividends are declared separately for each class. No class has preferential dividend rights; differences in per share dividend rates are generally due to differences in separate class expenses.
Premium and Discount Amortization
All premiums and discounts on fixed income securities are amortized/accreted for financial statement purposes.
Federal Taxes
It is the Fund's policy to comply with the Subchapter M provision of the Internal Revenue Code (the "Code") applicable to regulated investment companies and to distribute to shareholders each year substantially all of its income. Accordingly, no provision for federal tax is necessary.
When-Issued and Delayed Delivery Transactions
The Fund may engage in when-issued or delayed delivery transactions. The Fund records when-issued securities on the trade date and maintains security positions such that sufficient liquid assets will be available to make payment for the securities purchased. Securities purchased on a when-issued or delayed delivery basis are marked to market daily and begin earning interest on the settlement date. Losses may occur on these transactions due to changes in market conditions or the failure of counterparties to perform under the contract.
Restricted Securities
Restricted securities are securities that may only be resold upon registration under federal securities laws or in transactions exempt from such registration. In some cases, the issuer of restricted securities has agreed to register such securities for resale, at the issuer's expense either upon demand by the Fund or in connection with another registered offering of the securities. Many restricted securities may be resold in the secondary market in transactions exempt from registration. Such restricted securities may be determined to be liquid under criteria established by the Trustees. The Fund will not incur any registration costs upon such resales. The Fund's restricted securities are valued at the price provided by dealers in the secondary market or, if no market prices are available, at the fair value as determined in good faith using methods approved by the Trustees.
Additional information on the restricted illiquid security held at June 30, 2003, is as follows:
Security | | Acquisition
Date | | Acquisition
Cost |
Birmingham, AL, Fire Equipment Lease Obligation No. 2, 5.60%, 11/5/2004 | | 11/09/1999 | | $502,335 |
|
Use of Estimates
The preparation of financial statements in conformity with GAAP requires management to make estimates and assumptions that affect the amounts of assets, liabilities, expenses and revenues reported in the financial statements. Actual results could differ from those estimated.
Other
Investment transactions are accounted for on a trade date basis.
3. CHANGE IN ACCOUNTING POLICY
Effective July 1, 2001, the Fund adopted the provisions of the revised American Institute of Certified Public Accountants (AICPA) Audit and Accounting Guide for Investment Companies (the "Guide"). For financial statement purposes, the revised Guide requires the Fund to amortize premium and discount on all fixed income securities and to classify gains and losses realized on principal payments received on mortgage backed securities (pay-down gains and losses) as part of interest income.
Upon initial adoption, the Fund adjusted its cost of fixed income securities by the cumulative amount of amortization that would have been recognized had amortization been in effect from the purchase date of each holding with a corresponding reclassification between unrealized appreciation/depreciation on investments and undistributed net investment income. Adoption of these accounting principles does not affect the Fund's net asset value or distributions, but changes the classification of certain amounts between interest income and realized and unrealized gain/loss on the Statement of Operations. The cumulative effect to the Fund resulting from the adoption of premium and discount amortization as part of interest income on the financial statements is as follows:
| | As of 7/1/2001 | | For the Year Ended 6/30/2002 |
| | Cost of
Investments | | Undistributed Net
Investment Income | | Net
Investment
Income | | Net Unrealized
Appreciation/
(Depreciation) | | Net Realized
Gain/(Loss) |
Increase (Decrease) | | $60 | | $60 | | $4 | | $60 | | $(64) |
|
The Statements of Changes in Net Assets and Financial Highlights for prior periods have not been restated to reflect this change in presentation.
4. SHARES OF BENEFICIAL INTEREST
The Declaration of Trust permits the Trustees to issue an unlimited number of full and fractional shares of beneficial interest (without par value) for each class of shares.
Transactions in shares were as follows:
Year Ended June 30 | | 2003 | | | 2002 |
Institutional Shares: | | Shares | | | | Amount | | | Shares | | | Amount | | |
Shares sold | | 25,749,275 | | | $ | 268,423,722 | | | 10,227,717 | | $ | 105,457,839 | | |
Shares issued to shareholders in payment of distributions declared | |
359,948
| | | |
3,754,976
| | |
287,586
| | | 2,965,891 | | |
Shares redeemed | | (13,891,925 | ) | | | (144,993,444 | ) | | (6,310,639 | ) | | (65,033,764 | | ) |
|
NET CHANGE RESULTING FROM INSTITUTIONAL SHARE TRANSACTIONS | |
12,217,298
| | | $ |
127,185,254
| | |
4,204,664
| | $ |
43,389,966
| | |
|
| | | | | | | | | | | | | | |
Year Ended June 30 | | 2003 | | 2002 |
Institutional Service Shares: | | Shares | | | | Amount | | | Shares | | | Amount | | |
Shares sold | | 3,331,032 | | | $ | 34,648,705 | | | 2,714,933 | | $ | 27,999,342 | | |
Shares issued to shareholders in payment of distributions declared | |
58,777
| | | |
612,658
| | |
63,921
| | | 659,357 | | |
Shares redeemed | | (3,839,240 | ) | | | (39,877,863 | ) | | (2,145,316 | ) | | (22,081,098 | | ) |
|
NET CHANGE RESULTING FROM INSTITUTIONAL SERVICE SHARE TRANSACTIONS | |
(449,431
| ) | | $ |
(4,616,500
| ) | | 633,538 | | $ | 6,577,601 | | |
|
NET CHANGE RESULTING FROM SHARE TRANSACTIONS | |
11,767,867
| | | $ |
122,568,754
| | |
4,838,202
| | $ | 49,967,567 | | |
|
5. FEDERAL TAX INFORMATION
Income and capital gain distributions are determined in accordance with income tax regulations, which may differ from GAAP. These differences are primarily due to book and tax differences.
For the year ended June 30, 2003, permanent differences identified and reclassified among the components of net assets were as follows:
Paid-In Capital | | Undistributed
Net Investment
Income (Loss) | | | Accumulated
Net Realized
Gains (Losses) |
$(1,189,491) | | $(145 | ) | | $1,189,636 |
|
Net investment income, net realized gains (losses), and net assets were not affected by this reclassification.
The tax character of distributions reported on the Statement of Changes in Net Assets for the years ended June 30, 2003 and 2002, were as follows:
For the Year Ended June 30 | | 2003 | | 2002 |
Tax-exempt income | | $9,618,203 | | $8,108,394 |
|
As of June 30, 2003, the components of distributable earnings on a tax basis were as follows:
Undistributed tax-exempt income | | $ 417,032 |
|
Unrealized appreciation | | $8,617,691 |
|
Capital loss carryforward | | $ 4,747,122 |
|
At June 30, 2003, the cost of investments for federal tax purposes was $352,110,092. The net unrealized appreciation of investments for federal tax purposes was $8,617,691. This consists of net unrealized appreciation from investments for those securities having an excess of value over cost of $8,617,691.
The difference between book-basis and tax-basis unrealized appreciation/depreciation is attributable primarily to the amortization/accretion tax elections on fixed income securities.
At June 30, 2003, the Fund had a capital loss carryforward of $4,747,122 which will reduce the Fund's taxable income arising from future net realized gains on investments, if any, to the extent permitted by the Code and thus will reduce the amount of distributions to shareholders which would otherwise be necessary to relieve the Fund of any liability for federal tax. Pursuant to the Code, such capital loss carryforward will expire as follows:
Expiration Year | | Expiration Amount |
2004 | | $2,597,123 |
|
2005 | | $ 170,193 |
|
2008 | | $ 541,582 |
|
2009 | | $ 624,448 |
|
2010 | | $ 261,798 |
|
2011 | | $ 551,978 |
|
Under current tax regulations, capital losses realized after October 31 may be deferred and treated as occurring on the first day of the following fiscal year. As of June 30, 2003, for federal income tax purposes, post-October losses of $3,427 were deferred to July 1, 2003.
6. INVESTMENT ADVISER FEE AND OTHER TRANSACTIONS WITH AFFILIATES
Investment Adviser Fee
Federated Investment Management Company, the Fund's investment adviser (the "Adviser"), receives for its services an annual investment adviser fee equal to 0.40% of the Fund's average daily net assets. The Adviser will reimburse, to the extent of its adviser fee, the amount, if any, by which the Fund's aggregate annual operating expenses (excluding interest, taxes, brokerage commissions, expenses of registering and qualifying the Fund and its shares under federal and state laws and regulations, expenses of withholding taxes, distribution and shareholder services fees, and extraordinary expenses) exceed 0.45% of average daily net assets of the Fund.
Administrative Fee
Federated Services Company ("FServ"), under the Administrative Services Agreement, provides the Fund with administrative personnel and services. The fee paid to FServ is based on a scale that ranges from 0.150% to 0.075% of the average aggregate daily net assets of all funds advised by subsidiaries of Federated Investors, Inc., subject to a $125,000 minimum per portfolio and $30,000 per each additional class. FServ may voluntarily choose to waive any portion of its fee. FServ can modify or terminate this voluntary waiver at any time at its sole discretion.
Distribution Services Fee
The Fund has adopted a Distribution Plan (the "Plan") pursuant to Rule 12b-1 under the Act. Under the terms of the Plan, the Fund will compensate Federated Securities Corp. ("FSC"), the principal distributor, from the net assets of the Fund to finance activities intended to result in the sale of the Fund's Institutional Service Shares. The Plan provides that the Fund may incur distribution expenses of up to 0.25% of the average daily net assets of the Institutional Service Shares, annually, to compensate FSC. FSC may voluntarily choose to waive any portion of its fee. FSC can modify or terminate this voluntarily waiver at any time at its sole discretion.
Shareholder Services Fee
Under the terms of a Shareholder Services Agreement with Federated Shareholder Services Company ("FSSC"), the Fund will pay FSSC up to 0.25% of average daily net assets of the Fund for the period. The fee paid to FSSC is used to finance certain services for shareholders and to maintain shareholder accounts. FSSC may voluntarily choose to waive any portion of its fee. FSSC can modify or terminate this voluntary waiver at any time at its sole discretion.
Transfer and Dividend Disbursing Agent Fees and Expenses
FServ, through its subsidiary FSSC, serves as transfer and dividend disbursing agent for the Fund. The fee paid to FSSC is based on the size, type and number of accounts and transactions made by shareholders. FSSC may voluntarily choose to waive any portion of its fee. FSSC can modify or terminate this voluntary waiver at any time.
Portfolio Accounting Fees
FServ maintains the Fund's accounting records for which it receives a fee. The fee is based on the level of each Fund's average daily net assets for the period, plus out-of-pocket expenses. FServ may voluntarily choose to waive any portion of its fee. FServ can modify or terminate this voluntary waiver at any time at its sole discretion.
Interfund Transactions
During the year ended June 30, 2003, the Fund engaged in purchase and sale transactions with funds that have a common investment adviser (or affiliated investment advisers), common Directors/Trustees, and/or common Officers. These purchase and sale transactions complied with Rule 17a-7 under the Act and amounted to $316,500,000 and $259,002,138, respectively.
General
Certain of the Officers and Trustees of the Fund are Officers and Directors or Trustees of the above companies.
7. INVESTMENT TRANSACTIONS
Purchases and sales of investments, excluding long-term U.S. government securities and short-term obligations (and in-kind contributions), for the year ended June 30, 2003, were as follows:
Purchases | | $ | 185,982,945 |
|
Sales | | $ | 79,935,500 |
|
8. FEDERAL INC0ME TAX INFORMATION (UNAUDITED)
For the year ended June 30, 2003, the Fund did not designate any long-term capital gain dividends.
Report of Ernst & Young LLP, Independent Auditors
TO THE TRUSTEES AND SHAREHOLDERS OF
FEDERATED SHORT-TERM MUNICIPAL TRUST:
We have audited the accompanying statement of assets and liabilities, including the portfolio of investments, of Federated Short-Term Municipal Trust (the "Fund") as of June 30, 2003, and the related statement of operations for the year then ended, the statement of changes in net assets for each of the two years in the period then ended, and the financial highlights for each of the four years in the period then ended. These financial statements and financial highlights are the responsibility of the Fund's management. Our responsibility is to express an opinion on these financial statements and financial highlights based on our audits. The financial highlights for the year ended June 30, 1999 was audited by other auditors whose report, dated August 27, 1999, expressed an unqualified opinion on those financial highlights.
We conducted our audits in accordance with auditing standards generally accepted in the United States. Those standards require that we plan and perform the audit to obtain reasonable assurance about whether the financial statements and financial highlights are free of material misstatement. An audit includes examining, on a test basis, evidence supporting the amounts and disclosures in the financial statements. Our procedures included confirmation of securities owned as of June 30, 2003, by correspondence with the custodian and brokers, or by other appropriate auditing procedures where replies from brokers were not received. An audit also includes assessing the accounting principles used and significant estimates made by management, as well as evaluating the overall financial statement presentation. We believe that our audits provide a reasonable basis for our opinion.
In our opinion, the financial statements and financial highlights referred to above present fairly, in all material respects, the financial position of Federated Short-Term Municipal Trust at June 30, 2003, the results of its operations for the year then ended, the changes in its net assets for each of the two years in the period then ended, and the financial highlights for each of the four years in the period then ended, in conformity with accounting principles generally accepted in the United States.
Ernst & Young LLP
Boston, Massachusetts
August 8, 2003
Board of Trustees and Fund Officers (unaudited)
The Board is responsible for managing the Fund's business affairs and for exercising all the Fund's powers except those reserved for the shareholders. The following tables give information about each Board member and the senior officers of the Fund. Where required, the tables separately list Board members who are "interested persons" of the Fund (i.e., "Interested" Board members) and those who are not (i.e., "Independent" Board members). Unless otherwise noted, the address of each person listed is Federated Investors Tower, 1001 Liberty Avenue, Pittsburgh, PA. The Federated Fund Complex consists of 44 investment companies (comprising 138 portfolios). Unless otherwise noted, each Officer is elected annually. Unless otherwise noted, each Board member oversees all portfolios in the Federated Fund Complex; serves for an indefinite term; and also serves as a Board member of the following investment company complexes: Banknorth Funds--four portfolios; Golden Oak® Family of Funds--seven portfolios; Regions Morgan Keegan Select Funds--nine portfolios; Riggs Funds--eight portfolios; and WesMark Funds--five portfolios. The Fund's Statement of Additional Information includes additional information about Fund Trustees and is available, without charge and upon request, by calling 1-800-341-7400.
INTERESTED TRUSTEES BACKGROUND
| | |
|
Name
Birth Date
Address
Positions Held with Fund
Date Service Began | | Principal Occupation(s), Other Directorships Held and Previous Position(s) |
John F. Donahue*
Birth Date: July 28, 1924
CHAIRMAN AND TRUSTEE
Began serving: May 1981 | | Principal Occupations: Chairman and Director or Trustee of the Federated Fund Complex; Chairman and Director, Federated Investors, Inc. |
| | |
|
J. Christopher Donahue*
Birth Date: April 11, 1949
PRESIDENT AND TRUSTEE
Began serving: October 1999 | | Principal Occupations: Principal Executive Officer and President of the Federated Fund Complex; Director or Trustee of some of the Funds in the Federated Fund Complex; President, Chief Executive Officer and Director, Federated Investors, Inc. |
| | |
|
Lawrence D. Ellis, M.D.*
Birth Date: October 11, 1932
3471 Fifth Avenue
Suite 1111
Pittsburgh, PA
TRUSTEE
Began serving: August 1987 | | Principal Occupations: Director or Trustee of the Federated Fund Complex; Professor of Medicine, University of Pittsburgh; Medical Director, University of Pittsburgh Medical Center Downtown; Hematologist, Oncologist and Internist, University of Pittsburgh Medical Center.
Other Directorships Held: Member, National Board of Trustees, Leukemia Society of America.
Previous Positions: Trustee, University of Pittsburgh; Director, University of Pittsburgh Medical Center. |
| | |
|
* Family relationships and reasons for "interested" status: John F. Donahue is the father of J. Christopher Donahue; both are "interested" due to the positions they hold with Federated Investors, Inc. and its subsidiaries. Lawrence D. Ellis, M.D. is "interested" because his son-in-law is employed by the Fund's principal underwriter, Federated Securities Corp.
INDEPENDENT TRUSTEES BACKGROUND
| | |
|
Name
Birth Date
Address
Positions Held with Fund
Date Service Began | | Principal Occupation(s), Other Directorships Held and Previous Position(s) |
Thomas G. Bigley
Birth Date: February 3, 1934
15 Old Timber Trail
Pittsburgh, PA
TRUSTEE
Began serving: November 1994 | | Principal Occupation: Director or Trustee of the Federated Fund Complex.
Other Directorships Held: Director, Member of Executive Committee, Children's Hospital of Pittsburgh; Director, University of Pittsburgh.
Previous Position: Senior Partner, Ernst & Young LLP. |
| | |
|
John T. Conroy, Jr.
Birth Date: June 23, 1937
Grubb & Ellis/Investment
Properties Corporation
3838 North Tamiami Trail
Suite 402
Naples, FL
TRUSTEE
Began serving: November 1991 | | Principal Occupations: Director or Trustee of the Federated Fund Complex; Chairman of the Board, Investment Properties Corporation; Partner or Trustee in private real estate ventures in Southwest Florida.
Previous Positions: President, Investment Properties Corporation; Senior Vice President, John R. Wood and Associates, Inc., Realtors; President, Naples Property Management, Inc. and Northgate Village Development Corporation. |
| | |
|
Nicholas P. Constantakis
Birth Date: September 3, 1939
175 Woodshire Drive
Pittsburgh, PA
TRUSTEE
Began serving: October 1999 | | Principal Occupations: Director or Trustee of the Federated Fund Complex.
Other Directorships Held: Director, Michael Baker Corporation (engineering and energy services worldwide).
Previous Position: Partner, Andersen Worldwide SC. |
| | |
|
John F. Cunningham
Birth Date: March 5, 1943
353 El Brillo Way
Palm Beach, FL
TRUSTEE
Began serving: April 1999 | | Principal Occupation: Director or Trustee of the Federated Fund Complex.
Other Directorships Held: Chairman, President and Chief Executive Officer, Cunningham & Co., Inc. (strategic business consulting); Trustee Associate, Boston College.
Previous Positions: Director, Redgate Communications and EMC Corporation (computer storage systems); Chairman of the Board and Chief Executive Officer, Computer Consoles, Inc.; President and Chief Operating Officer, Wang Laboratories; Director, First National Bank of Boston; Director, Apollo Computer, Inc. |
| | |
|
Peter E. Madden
Birth Date: March 16, 1942
One Royal Palm Way
100 Royal Palm Way
Palm Beach, FL
TRUSTEE
Began serving: November 1991 | | Principal Occupation: Director or Trustee of the Federated Fund Complex; Management Consultant.
Other Directorships Held: Board of Overseers, Babson College.
Previous Positions: Representative, Commonwealth of Massachusetts General Court; President, State Street Bank and Trust Company and State Street Corporation (retired); Director, VISA USA and VISA International; Chairman and Director, Massachusetts Bankers Association; Director, Depository Trust Corporation; Director, The Boston Stock Exchange. |
| | |
|
| | |
|
Name
Birth Date
Address
Positions Held with Fund
Date Service Began | | Principal Occupation(s), Other Directorships Held and Previous Position(s) |
Charles F. Mansfield, Jr.
Birth Date: April 10, 1945
80 South Road
Westhampton Beach, NY
TRUSTEE
Began serving: April 1999 | | Principal Occupations: Director or Trustee of the Federated Fund Complex; Management Consultant; Executive Vice President, DVC Group, Inc. (marketing communications and technology) (prior to 9/1/00).
Previous Positions: Chief Executive Officer, PBTC International Bank; Partner, Arthur Young & Company (now Ernst & Young LLP); Chief Financial Officer of Retail Banking Sector, Chase Manhattan Bank; Senior Vice President, HSBC Bank USA (formerly, Marine Midland Bank); Vice President, Citibank; Assistant Professor of Banking and Finance, Frank G. Zarb School of Business, Hofstra University. |
| | |
|
John E. Murray, Jr., J.D., S.J.D.
Birth Date: December 20, 1932
Chancellor, Duquesne University
Pittsburgh, PA
TRUSTEE
Began serving: February 1995 | | Principal Occupations: Director or Trustee of the Federated Fund Complex; Chancellor and Law Professor, Duquesne University; Consulting Partner, Mollica & Murray.
Other Directorships Held: Director, Michael Baker Corp. (engineering, construction, operations and technical services).
Previous Positions: President, Duquesne University; Dean and Professor of Law, University of Pittsburgh School of Law; Dean and Professor of Law, Villanova University School of Law. |
| | |
|
Marjorie P. Smuts
Birth Date: June 21, 1935
4905 Bayard Street
Pittsburgh, PA
TRUSTEE
Began serving: February 1984 | | Principal Occupations: Director or Trustee of the Federated Fund Complex; Public Relations/Marketing Consultant/Conference Coordinator.
Previous Positions: National Spokesperson, Aluminum Company of America; television producer; President, Marj Palmer Assoc.; Owner, Scandia Bord. |
| | |
|
John S. Walsh
Birth Date: November 28, 1957
2604 William Drive
Valparaiso, IN
TRUSTEE
Began serving: April 1999 | | Principal Occupations: Director or Trustee of the Federated Fund Complex; President and Director, Heat Wagon, Inc. (manufacturer of construction temporary heaters); President and Director, Manufacturers Products, Inc. (distributor of portable construction heaters); President, Portable Heater Parts, a division of Manufacturers Products, Inc.
Previous Position: Vice President, Walsh & Kelly, Inc. |
| | |
|
OFFICERS
| | |
|
Name
Birth Date
Positions Held with Fund
Date Service Began | | Principal Occupation(s) and Previous Position(s) |
Edward C. Gonzales
Birth Date: October 22, 1930
EXECUTIVE VICE PRESIDENT
Began serving: June 1995 | | Principal Occupations: Executive Vice President of some of the Funds in the Federated Fund Complex; Vice Chairman, Federated Investors, Inc.; Trustee, Federated Administrative Services.
Previous Positions: President and Trustee or Director of some of the Funds in the Federated Fund Complex; CEO and Chairman, Federated Administrative Services. |
| | |
|
John W. McGonigle
Birth Date: October 26, 1938
EXECUTIVE VICE PRESIDENT
AND SECRETARY
Began serving: May 1981 | | Principal Occupations: Executive Vice President and Secretary of the Federated Fund Complex; Executive Vice President, Secretary and Director, Federated Investors, Inc. |
| | |
|
Richard J. Thomas
Birth Date: June 17, 1954
TREASURER
Began serving: November 1998 | | Principal Occupations: Principal Financial Officer and Treasurer of the Federated Fund Complex; Senior Vice President, Federated Administrative Services. |
| | |
|
Richard B. Fisher
Birth Date: May 17, 1923
VICE PRESIDENT
Began serving: November 1981 | | Principal Occupations: Vice Chairman or President of some of the Funds in the Federated Fund Complex; Vice Chairman, Federated Investors, Inc.; Chairman, Federated Securities Corp.
Previous Positions: President and Director or Trustee of some of the Funds in the Federated Fund Complex; Executive Vice President, Federated Investors, Inc. and Director and Chief Executive Officer, Federated Securities Corp. |
| | |
|
William D. Dawson III
Birth Date: March 3, 1949
CHIEF INVESTMENT OFFICER
Began serving: November 1998 | | Principal Occupations: Chief Investment Officer of this Fund and various other Funds in the Federated Fund Complex; Executive Vice President, Federated Investment Counseling, Federated Global Investment Management Corp., Federated Investment Management Company and Passport Research, Ltd.
Previous Positions: Executive Vice President and Senior Vice President, Federated Investment Counseling Institutional Portfolio Management Services Division; Senior Vice President, Federated Investment Management Company and Passport Research, Ltd. |
| | |
|
Jeff A. Kozemchak
Birth Date: January 15, 1960
VICE PRESIDENT
Began serving: November 1998 | | Jeff A. Kozemchak has been the Fund's Portfolio Manager since June 1996. He is Vice President of the Fund. Mr. Kozemchak joined Federated in 1987 and has been a Senior Portfolio Manager since 1996 and a Senior Vice President of the Fund's Adviser since 1999. He was a Portfolio Manager until 1996 and a Vice President of the Fund's Adviser from 1993 to 1998. Mr. Kozemchak is a Chartered Financial Analyst and received his M.S. in Industrial Administration from Carnegie Mellon University in 1987. |
| | |
|
Mutual funds are not bank deposits or obligations, are not guaranteed by any bank, and are not insured or guaranteed by the U.S. government, the Federal Deposit Insurance Corporation, the Federal Reserve Board, or any other government agency. Investment in mutual funds involves investment risk, including the possible loss of principal.
This report is authorized for distribution to prospective investors only when preceded or accompanied by the fund's prospectus, which contains facts concerning its objective and policies, management fees, expenses and other information.
VOTING PROXIES ON FUND PORTFOLIO SECURITIES
A description of the policies and procedures that the Fund uses to determine how to vote proxies relating to securities held in the Fund's portfolio is available, without charge and upon request, by calling 1-800-341-7400. This information is also available from the EDGAR database on the SEC's Internet site at http//www.sec.gov.
Federated Investors
World-Class Investment Manager
Federated Short-Term Municipal Trust
Federated Investors Funds
5800 Corporate Drive
Pittsburgh, PA 15237-7000
www.federatedinvestors.com
Contact us at 1-800-341-7400 or
www.federatedinvestors.com/contact
Federated Securities Corp., Distributor
Cusip 313907107
Cusip 313907206
Federated is a registered mark of Federated Investors, Inc. 2003 ©Federated Investors, Inc.
28588 (8/03)
Item 2.     Code of Ethics

            Not Applicable

Item 3.     Audit Committee Financial Expert

            Not Applicable

Item 4.     Principal Accountant Fees and Services

            Not Applicable

Item 5      Audit Committee of Listed Registrants

            Not Applicable

Item 6      [Reserved]

Item 7.     Disclosure of Proxy Voting Policies and Procedures for
            Closed-End Management Investment Companies

            Not Applicable

Item 8.     [Reserved]

Item 9.     Controls and Procedures

(a)  The   registrant's   President  and  Treasurer   have  concluded  that  the
     registrant's  disclosure  controls  and  procedures  (as  defined  in  rule
     30a-3(c)  under the Act) are  effective  in design  and  operation  and are
     sufficient to form the basis of the certifications required by Rule 30a-(2)
     under the Act, based on their evaluation of these  disclosure  controls and
     procedures within 90 days of the filing date of this report on Form N-CSR.

(b)  There were no changes in the  registrant's  internal control over financial
     reporting  (as defined in rule  30a-3(d)  under the Act),  or the  internal
     control over financial  reporting of its service  providers during the last
     fiscal  half  year  (the  registrant's  second  half year in the case of an
     annual report) that have materially  affected,  or are reasonably likely to
     materially  affect,  the  registrant's   internal  control  over  financial
     reporting.

Item 10.    Exhibits


SIGNATURES

Pursuant to the  requirements  of the  Securities  Exchange  Act of 1934 and the
Investment Company Act of 1940, the registrant has duly caused this report to be
signed on its behalf by the undersigned, thereunto duly authorized.

Registrant  Federated Short-Term Municipal Trust

By          /S/ Richard J. Thomas, Principal Financial Officer
                             (insert name and title)

Date        August 27, 2003


Pursuant to the  requirements  of the  Securities  Exchange  Act of 1934 and the
Investment  Company  Act of  1940,  this  report  has been  signed  below by the
following  persons on behalf of the  registrant and in the capacities and on the
dates indicated.


By          /S/ J. Christopher Donahue, Principal Executive Officer


Date        August 27, 2003


By          /S/ Richard J. Thomas, Principal Financial Officer


Date        August 27, 2003