UNITED STATES
SECURITIES AND EXCHANGE COMMISSION
Washington, D.C. 20549
FORM N-CSR
CERTIFIED SHAREHOLDER REPORT OF REGISTERED
MANAGEMENT INVESTMENT COMPANIES
Investment Company Act file number 811-02105
Fidelity Salem Street Trust
(Exact name of registrant as specified in charter)
245 Summer St., Boston, MA 02210
(Address of principal executive offices) (Zip code)
Cynthia Lo Bessette, Secretary
245 Summer St.
Boston, Massachusetts 02210
(Name and address of agent for service)
Registrant's telephone number, including area code:
617-563-7000
| |
Date of fiscal year end: | November 30 |
|
|
Date of reporting period: | May 31, 2022 |
Item 1.
Reports to Stockholders
Fidelity® Strategic Dividend & Income® Fund
Semi-Annual Report
May 31, 2022
Includes Fidelity and Fidelity Advisor share classes
Contents
To view a fund's proxy voting guidelines and proxy voting record for the 12-month period ended June 30, visit http://www.fidelity.com/proxyvotingresults or visit the Securities and Exchange Commission's (SEC) web site at http://www.sec.gov.
You may also call 1-800-544-8544 if you're an individual investing directly with Fidelity, call 1-800-835-5092 if you're a plan sponsor or participant with Fidelity as your recordkeeper or call 1-877-208-0098 on institutional accounts or if you're an advisor or invest through one to request a free copy of the proxy voting guidelines.
Standard & Poor's, S&P and S&P 500 are registered service marks of The McGraw-Hill Companies, Inc. and have been licensed for use by Fidelity Distributors Corporation.
Other third-party marks appearing herein are the property of their respective owners.
All other marks appearing herein are registered or unregistered trademarks or service marks of FMR LLC or an affiliated company. © 2022 FMR LLC. All rights reserved.
This report and the financial statements contained herein are submitted for the general information of the shareholders of the Fund. This report is not authorized for distribution to prospective investors in the Fund unless preceded or accompanied by an effective prospectus.
A fund files its complete schedule of portfolio holdings with the SEC for the first and third quarters of each fiscal year on Form N-PORT. Forms N-PORT are available on the SEC's web site at http://www.sec.gov. A fund's Forms N-PORT may be reviewed and copied at the SEC's Public Reference Room in Washington, DC. Information regarding the operation of the SEC's Public Reference Room may be obtained by calling 1-800-SEC-0330.
For a complete list of a fund's portfolio holdings, view the most recent holdings listing, semiannual report, or annual report on Fidelity's web site at http://www.fidelity.com, http://www.institutional.fidelity.com, or http://www.401k.com, as applicable.
NOT FDIC INSURED •MAY LOSE VALUE •NO BANK GUARANTEE
Neither the Fund nor Fidelity Distributors Corporation is a bank.
Early in 2020, the outbreak and spread of COVID-19 emerged as a public health emergency that had a major influence on financial markets, primarily based on its impact on the global economy and corporate earnings. On March 11, 2020, the World Health Organization declared the COVID-19 outbreak a pandemic, citing sustained risk of further global spread. The pandemic prompted a number of measures to limit the spread of COVID-19, including travel and border restrictions, quarantines, and restrictions on large gatherings. In turn, these resulted in lower consumer activity, diminished demand for a wide range of products and services, disruption in manufacturing and supply chains, and - given the wide variability in outcomes regarding the outbreak - significant market uncertainty and volatility. To help stem the turmoil, the U.S. government took unprecedented action - in concert with the U.S. Federal Reserve and central banks around the world - to help support consumers, businesses, and the broader economy, and to limit disruption to the financial system.
In general, the overall impact of the pandemic lessened in 2021, amid a resilient economy and widespread distribution of three COVID-19 vaccines granted emergency use authorization from the U.S. Food and Drug Administration (FDA) early in the year. Still, the situation remains dynamic, and the extent and duration of its influence on financial markets and the economy is highly uncertain, due in part to a recent spike in cases based on highly contagious variants of the coronavirus.
Extreme events such as the COVID-19 crisis are exogenous shocks that can have significant adverse effects on mutual funds and their investments. Although multiple asset classes may be affected by market disruption, the duration and impact may not be the same for all types of assets. Fidelity is committed to helping you stay informed amid news about COVID-19 and during increased market volatility, and we continue to take extra steps to be responsive to customer needs. We encourage you to visit us online, where we offer ongoing updates, commentary, and analysis on the markets and our funds.
The information in the following table is based on the combined Investments of the Fund and it's pro-Rata share of Investments in Fidelity's Central Funds.
Top Holdings (% of Fund's net assets) |
| (excluding cash equivalents) |
| Procter & Gamble Co. | 2.5 | |
| The Coca-Cola Co. | 2.2 | |
| Eli Lilly & Co. | 1.9 | |
| AbbVie, Inc. | 1.7 | |
| Bristol-Myers Squibb Co. | 1.6 | |
| Merck & Co., Inc. | 1.4 | |
| Amgen, Inc. | 1.4 | |
| Cisco Systems, Inc. | 1.4 | |
| PepsiCo, Inc. | 1.4 | |
| Comcast Corp. Class A | 1.3 | |
| | 16.8 | |
| |
| Market Sectors (% of Fund's net assets) |
| |
| Financials | 22.1 | |
| Real Estate | 15.6 | |
| Health Care | 13.5 | |
| Consumer Staples | 10.1 | |
| Information Technology | 8.4 | |
| Industrials | 6.6 | |
| Utilities | 5.8 | |
| Communication Services | 5.6 | |
| Energy | 5.1 | |
| Consumer Discretionary | 3.5 | |
| Materials | 1.8 | |
| |
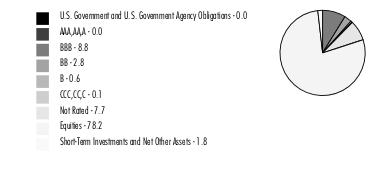
| Quality Diversification (% of Fund's net assets) |
| |
| |
Percentages shown as 0.0% may reflect amounts less than 0.05%. |
| |
| We have used ratings from Moody's Investors Service, Inc. Where Moody's® ratings are not available, we have used S&P® ratings. All ratings are as of the date indicated and do not reflect subsequent changes. |
Asset Allocation (% of Fund's net assets) |
|
Foreign investments - 10.4% |
|
Geographic Diversification (% of Fund's net assets) |
|
* Includes Short-Term investments and Net Other Assets (Liabilities). Percentages are based on country or territory of incorporation and are adjusted for the effect of futures contracts, if applicable. |
| |
An unaudited holdings listing for the fund, which presents direct holdings as well as the pro-rata share of any securities and other investments held indirectly through its investment in underlying Fidelity Central Funds, other than the Money Market Central Funds, is available at fidelity.com and/or institutional.fidelity.com, as applicable.
Showing Percentage of Net Assets
| Corporate Bonds - 9.3% |
| | | Principal Amount (a) | Value ($) |
| Convertible Bonds - 8.7% | | | |
| COMMUNICATION SERVICES - 1.1% | | | |
| Diversified Telecommunication Services - 0.0% | | | |
| Bandwidth, Inc. 0.25% 3/1/26 | | 73,000 | 51,794 |
| Radius Global Infrastructure, Inc. 2.5% 9/15/26 (b) | | 91,000 | 87,189 |
| | | | 138,983 |
| Entertainment - 0.2% | | | |
| Liberty Media Corp. 0.5% 12/1/50 (b) | | 461,000 | 558,502 |
| Live Nation Entertainment, Inc.: | | | |
| 2% 2/15/25 | | 101,000 | 114,130 |
| 2.5% 3/15/23 | | 1,239,000 | 1,801,692 |
| Spotify U.S.A., Inc. 0% 3/15/26 | | 1,000,000 | 810,000 |
| World Wrestling Entertainment, Inc. 3.375% 12/15/23 | | 1,318,000 | 3,575,075 |
| Zynga, Inc.: | | | |
| 0% 12/15/26 | | 1,969,000 | 1,964,210 |
| 0.25% 6/1/24 | | 2,095,000 | 2,459,877 |
| | | | 11,283,486 |
| Interactive Media & Services - 0.5% | | | |
| Eventbrite, Inc. 5% 12/1/25 | | 992,000 | 1,227,600 |
| fuboTV, Inc. 3.25% 2/15/26 | | 774,000 | 228,330 |
| IAC FinanceCo 2, Inc. 0.875% 6/15/26 (b) | | 1,332,000 | 1,511,249 |
| IAC FinanceCo 3, Inc. 2% 1/15/30 (b) | | 1,345,000 | 1,604,712 |
| IAC FinanceCo, Inc. 0.875% 10/1/22 (b) | | 951,000 | 1,692,040 |
| Liberty TripAdvisor Holdings, Inc. 0.5% 6/30/51 (b) | | 1,875,000 | 1,377,096 |
| Snap, Inc.: | | | |
| 0% 5/1/27 | | 4,040,000 | 2,960,836 |
| 0.125% 3/1/28(b) | | 3,300,000 | 2,409,000 |
| 0.25% 5/1/25 | | 718,000 | 717,282 |
| 0.75% 8/1/26 | | 1,690,000 | 1,683,387 |
| TripAdvisor, Inc. 0.25% 4/1/26 | | 812,000 | 643,423 |
| Twitter, Inc.: | | | |
| 0% 3/15/26 | | 2,169,000 | 1,957,523 |
| 0.25% 6/15/24 | | 7,012,000 | 6,997,976 |
| Ziff Davis, Inc. 1.75% 11/1/26 (b) | | 122,000 | 120,597 |
| | | | 25,131,051 |
| Media - 0.4% | | | |
| Cable One, Inc. 0% 3/15/26 | | 102,000 | 86,037 |
| DISH Network Corp.: | | | |
| 0% 12/15/25 | | 5,491,000 | 4,369,458 |
| 2.375% 3/15/24 | | 4,868,000 | 4,429,628 |
| 3.375% 8/15/26 | | 8,377,000 | 6,314,875 |
| Gannett Co., Inc. 4.75% 4/15/24 | | 1,250,000 | 1,031,983 |
| Grizzly Merger Sub 1 LLC 1.75% 9/30/46 (b) | | 2,159,000 | 3,011,805 |
| Liberty Broadband Corp.: | | | |
| 1.25% 9/30/50(b) | | 110,000 | 103,694 |
| 2.75% 9/30/50(b) | | 1,120,000 | 1,086,657 |
| Liberty Interactive LLC 1.75% 9/30/46 (b) | | 673,000 | 1,007,818 |
| Liberty Media Corp.: | | | |
| 1% 1/30/23 | | 554,000 | 938,199 |
| 1.375% 10/15/23 | | 83,000 | 105,576 |
| Magnite, Inc. 0.25% 3/15/26 | | 2,782,000 | 2,079,463 |
| TechTarget, Inc.: | | | |
| 0% 12/15/26(b) | | 120,000 | 99,180 |
| 0.125% 12/15/25 | | 355,000 | 430,635 |
| | | | 25,095,008 |
TOTAL COMMUNICATION SERVICES | | | 61,648,528 |
| | | | |
| CONSUMER DISCRETIONARY - 1.1% | | | |
| Auto Components - 0.1% | | | |
| LCI Industries 1.125% 5/15/26 | | 1,850,000 | 1,724,200 |
| Patrick Industries, Inc.: | | | |
| 1% 2/1/23 | | 1,742,000 | 1,746,355 |
| 1.75% 12/1/28(b) | | 2,940,000 | 2,559,638 |
| | | | 6,030,193 |
| Automobiles - 0.2% | | | |
| Arrival SA 3.5% 12/1/26 (b) | | 1,453,000 | 657,483 |
| Fisker, Inc. 2.5% 9/15/26 (b) | | 100,000 | 67,109 |
| Ford Motor Co. 0% 3/15/26 | | 7,378,000 | 7,687,876 |
| Lucid Group, Inc. 1.25% 12/15/26 (b) | | 120,000 | 80,631 |
| | | | 8,493,099 |
| Diversified Consumer Services - 0.1% | | | |
| 2U, Inc. 2.25% 5/1/25 | | 2,627,000 | 2,024,104 |
| Chegg, Inc.: | | | |
| 0% 9/1/26 | | 1,563,000 | 1,187,880 |
| 0.125% 3/15/25 | | 1,078,000 | 938,938 |
| | | | 4,150,922 |
| Hotels, Restaurants & Leisure - 0.4% | | | |
| Airbnb, Inc. 0% 3/15/26 | | 2,689,000 | 2,374,387 |
| Booking Holdings, Inc. 0.75% 5/1/25 | | 1,481,000 | 2,078,840 |
| Carnival Corp. 5.75% 4/1/23 | | 1,383,000 | 2,077,266 |
| Cracker Barrel Old Country Store, Inc. 0.625% 6/15/26 (b) | | 2,765,000 | 2,343,338 |
| DraftKings, Inc. 0% 3/15/28 | | 3,627,000 | 2,239,673 |
| Expedia, Inc. 0% 2/15/26 | | 90,000 | 91,042 |
| Marriott Vacations Worldwide Corp.: | | | |
| 0% 1/15/26 | | 100,000 | 102,938 |
| 1.5% 9/15/22 | | 75,000 | 80,100 |
| NCL Corp. Ltd.: | | | |
| 1.125% 2/15/27(b) | | 2,100,000 | 1,604,400 |
| 2.5% 2/15/27(b) | | 2,240,000 | 1,803,200 |
| 5.375% 8/1/25 | | 1,000,000 | 1,161,500 |
| Penn National Gaming, Inc. 2.75% 5/15/26 | | 876,000 | 1,374,882 |
| Royal Caribbean Cruises Ltd.: | | | |
| 2.875% 11/15/23 | | 1,409,000 | 1,422,386 |
| 4.25% 6/15/23 | | 3,045,000 | 3,243,630 |
| Shake Shack, Inc. 0% 3/1/28 | | 1,447,000 | 996,983 |
| The Cheesecake Factory, Inc. 0.375% 6/15/26 | | 854,000 | 692,747 |
| Vail Resorts, Inc. 0% 1/1/26 | | 100,000 | 92,688 |
| | | | 23,780,000 |
| Internet & Direct Marketing Retail - 0.2% | | | |
| Etsy, Inc.: | | | |
| 0.125% 10/1/26 | | 2,815,000 | 3,365,333 |
| 0.125% 9/1/27 | | 1,931,000 | 1,601,658 |
| 0.25% 6/15/28(b) | | 90,000 | 70,335 |
| The RealReal, Inc.: | | | |
| 1% 3/1/28 | | 4,042,000 | 2,157,361 |
| 3% 6/15/25 | | 2,012,000 | 1,256,906 |
| Wayfair LLC: | | | |
| 0.625% 10/1/25 | | 2,338,000 | 1,672,839 |
| 1.125% 11/1/24 | | 329,000 | 287,382 |
| Xometry, Inc. 1% 2/1/27 (b) | | 590,000 | 505,665 |
| | | | 10,917,479 |
| Leisure Products - 0.1% | | | |
| Callaway Golf Co. 2.75% 5/1/26 | | 1,522,000 | 2,166,948 |
| Peloton Interactive, Inc. 0% 2/15/26 | | 7,191,000 | 4,871,645 |
| | | | 7,038,593 |
| Specialty Retail - 0.0% | | | |
| American Eagle Outfitters, Inc. 3.75% 4/15/25 | | 59,000 | 93,552 |
| Burlington Stores, Inc. 2.25% 4/15/25 | | 75,000 | 81,469 |
| Dick's Sporting Goods, Inc. 3.25% 4/15/25 | | 447,000 | 1,132,586 |
| National Vision Holdings, Inc. 2.5% 5/15/25 | | 998,000 | 1,130,088 |
| | | | 2,437,695 |
| Textiles, Apparel & Luxury Goods - 0.0% | | | |
| Marathon Digital Holdings, Inc. 1% 12/1/26 (b) | | 1,012,000 | 396,078 |
| | | | |
TOTAL CONSUMER DISCRETIONARY | | | 63,244,059 |
| | | | |
| CONSUMER STAPLES - 0.2% | | | |
| Food & Staples Retailing - 0.0% | | | |
| Chefs' Warehouse Holdings 1.875% 12/1/24 | | 1,000,000 | 1,088,702 |
| | | | |
| Food Products - 0.1% | | | |
| Beyond Meat, Inc. 0% 3/15/27 | | 8,857,000 | 3,462,315 |
| | | | |
| Tobacco - 0.1% | | | |
| Turning Point Brands, Inc. 2.5% 7/15/24 | | 4,949,000 | 4,558,449 |
| | | | |
TOTAL CONSUMER STAPLES | | | 9,109,466 |
| | | | |
| ENERGY - 0.3% | | | |
| Oil, Gas & Consumable Fuels - 0.3% | | | |
| Antero Resources Corp. 4.25% 9/1/26 | | 211,000 | 2,071,493 |
| Arch Resources, Inc. 5.25% 11/15/25 | | 249,000 | 1,024,646 |
| CNX Resources Corp. 2.25% 5/1/26 | | 1,172,000 | 2,116,046 |
| EQT Corp. 1.75% 5/1/26 | | 1,657,000 | 5,343,825 |
| Pioneer Natural Resources Co. 0.25% 5/15/25 | | 2,149,000 | 5,802,300 |
| | | | 16,358,310 |
| FINANCIALS - 0.1% | | | |
| Capital Markets - 0.0% | | | |
| Coinbase Global, Inc. 0.5% 6/1/26 (b) | | 3,308,000 | 2,318,908 |
| | | | |
| Consumer Finance - 0.1% | | | |
| LendingTree, Inc. 0.5% 7/15/25 | | 1,000,000 | 740,000 |
| SoFi Technologies, Inc. 0% 10/15/26 (b) | | 2,980,000 | 2,083,020 |
| Upstart Holdings, Inc. 0.25% 8/15/26 (b) | | 104,000 | 65,455 |
| | | | 2,888,475 |
| Insurance - 0.0% | | | |
| HCI Group, Inc. 4.75% 6/1/42 (b) | | 90,000 | 91,980 |
| | | | |
| Mortgage Real Estate Investment Trusts - 0.0% | | | |
| Arbor Realty Trust, Inc. 4.75% 11/1/22 | | 510,000 | 513,315 |
| Blackstone Mortgage Trust, Inc. 5.5% 3/15/27 | | 100,000 | 97,450 |
| HAT Holdings I LLC/HAT Holdings II LLC 0% 5/1/25 (b) | | 90,000 | 87,681 |
| | | | 698,446 |
TOTAL FINANCIALS | | | 5,997,809 |
| | | | |
| HEALTH CARE - 1.0% | | | |
| Biotechnology - 0.2% | | | |
| Coherus BioSciences, Inc. 1.5% 4/15/26 | | 80,000 | 55,961 |
| Cytokinetics, Inc. 4% 11/15/26 | | 100,000 | 391,962 |
| Dynavax Technologies Corp. 2.5% 5/15/26 | | 100,000 | 141,813 |
| Exact Sciences Corp.: | | | |
| 0.375% 3/15/27 | | 1,417,000 | 1,138,028 |
| 0.375% 3/1/28 | | 1,777,000 | 1,331,639 |
| 1% 1/15/25 | | 1,218,000 | 1,219,827 |
| Global Blood Therapeutics, Inc. 1.875% 12/15/28 (b) | | 3,700,000 | 3,755,500 |
| Insmed, Inc. 0.75% 6/1/28 | | 100,000 | 82,950 |
| Natera, Inc. 2.25% 5/1/27 | | 578,000 | 724,065 |
| Neurocrine Biosciences, Inc. 2.25% 5/15/24 | | 1,475,000 | 1,907,625 |
| Sarepta Therapeutics, Inc. 1.5% 11/15/24 | | 1,860,000 | 2,313,375 |
| | | | 13,062,745 |
| Health Care Equipment & Supplies - 0.5% | | | |
| CONMED Corp. 2.625% 2/1/24 | | 1,068,000 | 1,483,986 |
| CryoPort, Inc. 0.75% 12/1/26 (b) | | 1,845,000 | 1,392,975 |
| DexCom, Inc.: | | | |
| 0.25% 11/15/25 | | 3,228,000 | 3,033,830 |
| 0.75% 12/1/23 | | 1,805,000 | 3,292,586 |
| Envista Holdings Corp. 2.375% 6/1/25 | | 1,879,000 | 3,958,114 |
| Glaukos Corp. 2.75% 6/15/27 | | 1,304,000 | 1,459,665 |
| Haemonetics Corp. 0% 3/1/26 | | 100,000 | 80,000 |
| Insulet Corp. 0.375% 9/1/26 | | 2,115,000 | 2,407,366 |
| Integra LifeSciences Holdings Corp. 0.5% 8/15/25 | | 1,458,000 | 1,502,927 |
| LivaNova U.S.A., Inc. 3% 12/15/25 | | 1,360,000 | 1,810,160 |
| Mesa Laboratories, Inc. 1.375% 8/15/25 | | 566,000 | 541,064 |
| Nevro Corp. 2.75% 4/1/25 | | 343,000 | 306,985 |
| Novocure Ltd. 0% 11/1/25 | | 890,000 | 791,127 |
| Omnicell, Inc. 0.25% 9/15/25 | | 959,000 | 1,195,394 |
| Tandem Diabetes Care, Inc. 1.5% 5/1/25 (b) | | 2,570,000 | 2,471,055 |
| Varex Imaging Corp. 4% 6/1/25 | | 100,000 | 129,874 |
| | | | 25,857,108 |
| Health Care Providers & Services - 0.2% | | | |
| 1Life Healthcare, Inc. 3% 6/15/25 | | 2,125,000 | 1,751,000 |
| Accolade, Inc. 0.5% 4/1/26 | | 3,666,000 | 2,325,169 |
| Brookdale Senior Living, Inc. 2% 10/15/26 (b) | | 2,132,000 | 2,190,630 |
| Guardant Health, Inc. 0% 11/15/27 | | 3,404,000 | 2,246,640 |
| Oak Street Health, Inc. 0% 3/15/26 | | 2,175,000 | 1,559,258 |
| | | | 10,072,697 |
| Health Care Technology - 0.0% | | | |
| Allscripts Healthcare Solutions, Inc. 0.875% 1/1/27 | | 500,000 | 701,750 |
| Health Catalyst, Inc. 2.5% 4/15/25 | | 724,000 | 641,193 |
| Teladoc Health, Inc. 1.25% 6/1/27 | | 504,000 | 388,080 |
| | | | 1,731,023 |
| Life Sciences Tools & Services - 0.1% | | | |
| Illumina, Inc. 0% 8/15/23 | | 58,000 | 56,463 |
| Inotiv, Inc. 3.25% 10/15/27 (b) | | 80,000 | 55,848 |
| Nanostring Technologies, Inc. 2.625% 3/1/25 | | 972,000 | 832,883 |
| NeoGenomics, Inc. 1.25% 5/1/25 | | 420,000 | 350,070 |
| Repligen Corp. 0.375% 7/15/24 | | 960,000 | 1,474,915 |
| | | | 2,770,179 |
| Pharmaceuticals - 0.0% | | | |
| Innoviva, Inc. 2.125% 3/15/28 (b) | | 80,000 | 70,550 |
| | | | |
TOTAL HEALTH CARE | | | 53,564,302 |
| | | | |
| INDUSTRIALS - 1.1% | | | |
| Aerospace & Defense - 0.2% | | | |
| Aerojet Rocketdyne Holdings, Inc. 2.25% 12/15/23 | | 2,622,000 | 4,079,832 |
| Parsons Corp. 0.25% 8/15/25 | | 5,936,000 | 6,071,934 |
| Virgin Galactic Holdings, Inc. 2.5% 2/1/27 (b) | | 100,000 | 71,500 |
| | | | 10,223,266 |
| Air Freight & Logistics - 0.0% | | | |
| Air Transport Services Group, Inc. 1.125% 10/15/24 | | 776,500 | 860,362 |
| Atlas Air Worldwide Holdings, Inc. 1.875% 6/1/24 | | 1,025,000 | 1,299,828 |
| | | | 2,160,190 |
| Airlines - 0.3% | | | |
| American Airlines Group, Inc. 6.5% 7/1/25 | | 2,925,000 | 3,914,419 |
| JetBlue Airways Corp. 0.5% 4/1/26 | | 3,700,000 | 2,923,000 |
| Southwest Airlines Co. 1.25% 5/1/25 | | 5,726,000 | 7,821,716 |
| | | | 14,659,135 |
| Construction & Engineering - 0.1% | | | |
| Granite Construction, Inc. 2.75% 11/1/24 | | 2,891,000 | 3,386,807 |
| | | | |
| Electrical Equipment - 0.2% | | | |
| Array Technologies, Inc. 1% 12/1/28 (b) | | 4,423,000 | 3,094,211 |
| Bloom Energy Corp. 2.5% 8/15/25 | | 1,726,000 | 2,208,935 |
| Plug Power, Inc. 3.75% 6/1/25 | | 577,000 | 2,192,369 |
| Stem, Inc. 0.5% 12/1/28 (b) | | 3,271,000 | 1,947,881 |
| Sunrun, Inc. 0% 2/1/26 | | 1,615,000 | 1,169,260 |
| | | | 10,612,656 |
| Machinery - 0.2% | | | |
| Chart Industries, Inc. 1% 11/15/24 (b) | | 766,000 | 2,312,426 |
| Desktop Metal, Inc. 6% 5/15/27 (b) | | 550,000 | 716,650 |
| John Bean Technologies Corp. 0.25% 5/15/26 | | 3,544,000 | 3,412,872 |
| Middleby Corp. 1% 9/1/25 | | 1,940,000 | 2,479,987 |
| The Greenbrier Companies, Inc. 2.875% 4/15/28 | | 3,190,000 | 3,182,025 |
| | | | 12,103,960 |
| Professional Services - 0.1% | | | |
| FTI Consulting, Inc. 2% 8/15/23 | | 1,195,000 | 2,010,229 |
| KBR, Inc. 2.5% 11/1/23 | | 2,060,000 | 4,073,650 |
| Upwork, Inc. 0.25% 8/15/26 (b) | | 109,000 | 82,596 |
| | | | 6,166,475 |
| Road & Rail - 0.0% | | | |
| Lyft, Inc. 1.5% 5/15/25 | | 74,000 | 67,673 |
| Uber Technologies, Inc. 0% 12/15/25 | | 74,000 | 62,789 |
| | | | 130,462 |
| Transportation Infrastructure - 0.0% | | | |
| Seaspan Corp. 3.75% 12/15/25 (b) | | 2,263,000 | 2,600,187 |
| | | | |
TOTAL INDUSTRIALS | | | 62,043,138 |
| | | | |
| INFORMATION TECHNOLOGY - 3.2% | | | |
| Communications Equipment - 0.0% | | | |
| Lumentum Holdings, Inc.: | | | |
| 0.25% 3/15/24 | | 1,309,000 | 1,945,829 |
| 0.5% 12/15/26 | | 1,359,000 | 1,467,930 |
| 0.5% 6/15/28(b) | | 90,000 | 80,944 |
| | | | 3,494,703 |
| Electronic Equipment & Components - 0.1% | | | |
| II-VI, Inc. 0.25% 9/1/22 | | 1,079,000 | 1,432,373 |
| Insight Enterprises, Inc. 0.75% 2/15/25 | | 1,766,000 | 2,622,189 |
| Par Technology Corp.: | | | |
| 1.5% 10/15/27 | | 73,000 | 61,320 |
| 2.875% 4/15/26 | | 750,000 | 871,170 |
| | | | 4,987,052 |
| IT Services - 0.6% | | | |
| Affirm Holdings, Inc. 0% 11/15/26 (b) | | 1,710,000 | 1,065,330 |
| Akamai Technologies, Inc.: | | | |
| 0.125% 5/1/25 | | 2,780,000 | 3,251,003 |
| 0.375% 9/1/27 | | 3,192,000 | 3,333,865 |
| BigCommerce Holdings, Inc. 0.25% 10/1/26 (b) | | 2,877,000 | 2,112,797 |
| Block, Inc.: | | | |
| 0% 5/1/26 | | 1,886,000 | 1,558,756 |
| 0.125% 3/1/25 | | 1,469,000 | 1,572,748 |
| 0.25% 11/1/27 | | 1,032,000 | 822,401 |
| 0.5% 5/15/23 | | 1,156,000 | 1,540,948 |
| Cloudflare, Inc.: | | | |
| 0% 8/15/26(b) | | 64,000 | 51,672 |
| 0.75% 5/15/25 | | 668,000 | 1,093,126 |
| Digitalocean Holdings, Inc. 0% 12/1/26 (b) | | 2,221,000 | 1,725,717 |
| Fastly, Inc. 0% 3/15/26 | | 5,707,000 | 4,223,180 |
| MongoDB, Inc. 0.25% 1/15/26 | | 2,244,000 | 2,972,536 |
| Okta, Inc.: | | | |
| 0.125% 9/1/25 | | 2,536,000 | 2,246,795 |
| 0.375% 6/15/26 | | 2,171,000 | 1,775,807 |
| Perficient, Inc. 0.125% 11/15/26 (b) | | 1,910,000 | 1,609,175 |
| Repay Holdings Corp. 0% 2/1/26 (b) | | 977,000 | 757,175 |
| Shift4 Payments, Inc. 0% 12/15/25 | | 119,000 | 107,769 |
| Shopify, Inc. 0.125% 11/1/25 | | 1,400,000 | 1,195,600 |
| Wix.com Ltd. 0% 8/15/25 | | 1,682,000 | 1,360,738 |
| | | | 34,377,138 |
| Semiconductors & Semiconductor Equipment - 0.4% | | | |
| Camtek Ltd. 0% 12/1/26 (b) | | 600,000 | 513,600 |
| Enphase Energy, Inc.: | | | |
| 0% 3/1/26 | | 100,000 | 97,003 |
| 0% 3/1/28 | | 100,000 | 97,802 |
| 0.25% 3/1/25 | | 791,000 | 1,877,926 |
| Microchip Technology, Inc.: | | | |
| 1.625% 2/15/27 | | 585,000 | 1,208,025 |
| 2.25% 2/15/37 | | 922,000 | 1,947,149 |
| onsemi: | | | |
| 0% 5/1/27 | | 3,073,000 | 4,037,179 |
| 1.625% 10/15/23 | | 1,421,000 | 4,172,271 |
| SMART Global Holdings, Inc. 2.25% 2/15/26 | | 100,000 | 135,814 |
| SolarEdge Technologies, Inc. 0% 9/15/25 | | 2,415,000 | 2,951,485 |
| Teradyne, Inc. 1.25% 12/15/23 | | 289,000 | 998,033 |
| Veeco Instruments, Inc. 3.75% 6/1/27 | | 90,000 | 159,210 |
| Wolfspeed, Inc.: | | | |
| 0.25% 2/15/28(b) | | 1,560,000 | 1,391,010 |
| 1.75% 5/1/26 | | 1,205,000 | 2,096,700 |
| | | | 21,683,207 |
| Software - 2.1% | | | |
| 8x8, Inc. 0.5% 2/1/24 | | 73,000 | 63,145 |
| Altair Engineering, Inc. 0.25% 6/1/24 | | 1,265,000 | 1,610,345 |
| Avalara, Inc. 0.25% 8/1/26 (b) | | 1,550,000 | 1,277,695 |
| Bentley Systems, Inc. 0.125% 1/15/26 | | 100,000 | 87,650 |
| Bill.Com Holdings, Inc.: | | | |
| 0% 12/1/25 | | 1,100,000 | 1,140,150 |
| 0% 4/1/27(b) | | 81,000 | 63,828 |
| BlackLine, Inc.: | | | |
| 0% 3/15/26 | | 2,050,000 | 1,685,100 |
| 0.125% 8/1/24 | | 1,486,000 | 1,732,120 |
| Box, Inc. 0% 1/15/26 | | 3,157,000 | 3,714,211 |
| Cerence, Inc. 3% 6/1/25 | | 559,000 | 648,999 |
| Ceridian HCM Holding, Inc. 0.25% 3/15/26 | | 4,001,000 | 3,296,824 |
| Confluent, Inc. 0% 1/15/27 (b) | | 2,372,000 | 1,756,151 |
| Coupa Software, Inc.: | | | |
| 0.125% 6/15/25 | | 3,793,000 | 3,269,566 |
| 0.375% 6/15/26 | | 7,419,000 | 5,839,060 |
| CyberArk Software Ltd. 0% 11/15/24 | | 2,233,000 | 2,473,121 |
| Datadog, Inc. 0.125% 6/15/25 | | 1,316,000 | 1,675,035 |
| DocuSign, Inc. 0% 1/15/24 | | 2,328,000 | 2,155,728 |
| Dropbox, Inc.: | | | |
| 0% 3/1/26 | | 797,000 | 705,345 |
| 0% 3/1/28 | | 811,000 | 705,570 |
| Dye & Durham Ltd. 3.75% 3/1/26 (b)(c) | CAD | 1,490,000 | 986,579 |
| Everbridge, Inc.: | | | |
| 0% 3/15/26 | | 2,317,000 | 1,985,669 |
| 0.125% 12/15/24 | | 1,106,000 | 976,137 |
| Five9, Inc. 0.5% 6/1/25 | | 2,560,000 | 2,548,480 |
| Guidewire Software, Inc. 1.25% 3/15/25 | | 1,087,000 | 1,052,107 |
| HubSpot, Inc. 0.375% 6/1/25 | | 1,240,000 | 1,703,760 |
| InterDigital, Inc. 3.5% 6/1/27 (b) | | 100,000 | 105,850 |
| LivePerson, Inc.: | | | |
| 0% 12/15/26 | | 6,680,000 | 4,963,908 |
| 0.75% 3/1/24 | | 1,765,000 | 1,581,440 |
| Mandiant, Inc.: | | | |
| 0.875% 6/1/24 | | 2,257,000 | 2,457,873 |
| 1.625% 6/1/35 | | 1,544,000 | 1,504,446 |
| New Relic, Inc. 0.5% 5/1/23 | | 2,216,000 | 2,139,548 |
| NortonLifeLock, Inc. 2% 8/15/22 | | 1,643,000 | 1,970,175 |
| Nutanix, Inc. 0% 1/15/23 | | 318,000 | 308,594 |
| Pagerduty, Inc. 1.25% 7/1/25 | | 645,000 | 642,743 |
| Palo Alto Networks, Inc.: | | | |
| 0.375% 6/1/25 | | 3,998,000 | 6,952,522 |
| 0.75% 7/1/23 | | 3,244,000 | 6,194,949 |
| Pegasystems, Inc. 0.75% 3/1/25 | | 653,000 | 534,211 |
| Progress Software Corp. 1% 4/15/26 | | 2,055,000 | 2,067,117 |
| Q2 Holdings, Inc. 0.75% 6/1/26 | | 1,720,000 | 1,578,960 |
| Rapid7, Inc.: | | | |
| 0.25% 3/15/27 | | 2,275,000 | 2,131,661 |
| 2.25% 5/1/25 | | 2,439,000 | 3,230,456 |
| RingCentral, Inc.: | | | |
| 0% 3/1/25 | | 2,104,000 | 1,798,920 |
| 0% 3/15/26 | | 2,876,000 | 2,223,148 |
| SailPoint Technologies Holding, Inc. 0.125% 9/15/24 | | 1,168,000 | 2,625,080 |
| Splunk, Inc.: | | | |
| 0.5% 9/15/23 | | 1,102,000 | 1,099,796 |
| 1.125% 9/15/25 | | 3,260,000 | 3,302,178 |
| 1.125% 6/15/27 | | 1,202,000 | 1,025,306 |
| Tyler Technologies, Inc. 0.25% 3/15/26 | | 3,415,000 | 3,351,823 |
| Unity Software, Inc. 0% 11/15/26 (b) | | 2,589,000 | 1,955,990 |
| Varonis Systems, Inc. 1.25% 8/15/25 | | 2,075,000 | 2,637,325 |
| Verint Systems, Inc. 0.25% 4/15/26 | | 762,000 | 770,164 |
| Veritone, Inc. 1.75% 11/15/26 (b) | | 1,164,000 | 770,568 |
| Workday, Inc. 0.25% 10/1/22 | | 3,565,000 | 4,012,408 |
| Workiva, Inc. 1.125% 8/15/26 | | 2,245,000 | 2,608,690 |
| Zendesk, Inc. 0.625% 6/15/25 | | 3,384,000 | 3,636,108 |
| Zscaler, Inc. 0.125% 7/1/25 | | 2,124,000 | 2,621,016 |
| | | | 115,955,348 |
TOTAL INFORMATION TECHNOLOGY | | | 180,497,448 |
| | | | |
| MATERIALS - 0.2% | | | |
| Chemicals - 0.1% | | | |
| Amyris, Inc. 1.5% 11/15/26 (b) | | 2,470,000 | 1,202,057 |
| Danimer Scientific, Inc. 3.25% 12/15/26 (b) | | 110,000 | 76,560 |
| Livent Corp. 4.125% 7/15/25 | | 522,000 | 1,952,019 |
| | | | 3,230,636 |
| Metals & Mining - 0.1% | | | |
| Allegheny Technologies, Inc. 3.5% 6/15/25 | | 60,000 | 114,030 |
| Endeavour Mining Corp. 3% 2/15/23 (b) | | 1,610,000 | 1,737,351 |
| MP Materials Corp. 0.25% 4/1/26 (b) | | 859,000 | 953,920 |
| SSR Mining, Inc. 2.5% 4/1/39 | | 2,061,000 | 2,592,738 |
| United States Steel Corp. 5% 11/1/26 | | 728,000 | 1,464,008 |
| | | | 6,862,047 |
TOTAL MATERIALS | | | 10,092,683 |
| | | | |
| REAL ESTATE - 0.3% | | | |
| Equity Real Estate Investment Trusts (REITs) - 0.3% | | | |
| Pebblebrook Hotel Trust 1.75% 12/15/26 | | 5,620,000 | 5,999,350 |
| Porch Group, Inc. 0.75% 9/15/26 (b) | | 8,182,000 | 4,638,171 |
| Summit Hotel Properties, Inc. 1.5% 2/15/26 | | 3,637,000 | 3,404,232 |
| Uniti Fiber Holdings, Inc. 4% 6/15/24 (b) | | 3,116,000 | 3,646,977 |
| | | | 17,688,730 |
| Real Estate Management & Development - 0.0% | | | |
| Opendoor Technologies, Inc. 0.25% 8/15/26 (b) | | 1,141,000 | 756,483 |
| Realogy Group LLC/Realogy Co-Issuer Corp. 0.25% 6/15/26 (b) | | 84,000 | 67,570 |
| Redfin Corp.: | | | |
| 0% 10/15/25 | | 692,000 | 426,878 |
| 0.5% 4/1/27 | | 1,255,000 | 692,760 |
| Zillow Group, Inc. 2.75% 5/15/25 | | 67,000 | 66,866 |
| | | | 2,010,557 |
TOTAL REAL ESTATE | | | 19,699,287 |
| | | | |
| UTILITIES - 0.1% | | | |
| Electric Utilities - 0.1% | | | |
| NRG Energy, Inc. 2.75% 6/1/48 | | 1,399,000 | 1,682,997 |
| | | | |
| Independent Power and Renewable Electricity Producers - 0.0% | | | |
| NextEra Energy Partners LP 0% 6/15/24 (b) | | 80,000 | 76,680 |
| Sunnova Energy International, Inc. 0.25% 12/1/26 (b) | | 80,000 | 64,000 |
| | | | 140,680 |
| Multi-Utilities - 0.0% | | | |
| CenterPoint Energy, Inc. 2.00% ZENS | | 23,475 | 1,182,436 |
| | | | |
TOTAL UTILITIES | | | 3,006,113 |
| | | | |
| TOTAL CONVERTIBLE BONDS | | | 485,261,143 |
| Nonconvertible Bonds - 0.6% | | | |
| COMMUNICATION SERVICES - 0.1% | | | |
| Media - 0.1% | | | |
| Gannett Holdings LLC 6% 11/1/26 (b) | | 4,965,000 | 4,505,738 |
| | | | |
| CONSUMER DISCRETIONARY - 0.0% | | | |
| Auto Components - 0.0% | | | |
| Luminar Technologies, Inc. 1.25% 12/15/26 (b) | | 100,000 | 76,650 |
| | | | |
| CONSUMER STAPLES - 0.1% | | | |
| Food & Staples Retailing - 0.0% | | | |
| Albertsons Companies LLC/Safeway, Inc./New Albertson's, Inc./Albertson's LLC 4.875% 2/15/30 (b) | | 1,080,000 | 1,007,008 |
| | | | |
| Tobacco - 0.1% | | | |
| Turning Point Brands, Inc. 5.625% 2/15/26 (b) | | 2,850,000 | 2,611,776 |
| | | | |
TOTAL CONSUMER STAPLES | | | 3,618,784 |
| | | | |
| ENERGY - 0.1% | | | |
| Oil, Gas & Consumable Fuels - 0.1% | | | |
| Calumet Specialty Products Partners LP/Calumet Finance Corp. 11% 4/15/25 (b) | | 4,010,000 | 4,043,744 |
| DCP Midstream Operating LP 5.85% 5/21/43 (b)(d) | | 1,000,000 | 877,500 |
| | | | 4,921,244 |
| FINANCIALS - 0.3% | | | |
| Banks - 0.0% | | | |
| JPMorgan Chase & Co. 3 month U.S. LIBOR + 1.000% 2.4113% 5/15/77 (d)(e) | | 4,500,000 | 3,488,400 |
| | | | |
| Diversified Financial Services - 0.2% | | | |
| ILFC E-Capital Trust I 3 month U.S. LIBOR + 1.550% 4.05% 12/21/65 (b)(d)(e) | | 14,050,000 | 10,959,000 |
| | | | |
| Insurance - 0.1% | | | |
| MetLife, Inc. 6.4% 12/15/66 (d) | | 5,000,000 | 5,137,500 |
| | | | |
TOTAL FINANCIALS | | | 19,584,900 |
| | | | |
| UTILITIES - 0.0% | | | |
| Multi-Utilities - 0.0% | | | |
| CMS Energy Corp. 4.75% 6/1/50 (d) | | 2,000,000 | 1,869,191 |
| Sempra Energy 4.125% 4/1/52 (d) | | 1,250,000 | 1,088,442 |
| | | | 2,957,633 |
| TOTAL NONCONVERTIBLE BONDS | | | 35,664,949 |
| TOTAL CORPORATE BONDS (Cost $528,733,563) | | | 520,926,092 |
| | | | |
| Common Stocks - 53.4% |
| | | Shares | Value ($) |
| COMMUNICATION SERVICES - 4.0% | | | |
| Diversified Telecommunication Services - 1.7% | | | |
| AT&T, Inc. | | 1,513,100 | 32,213,899 |
| Cellnex Telecom SA (b) | | 29,564 | 1,334,199 |
| Helios Towers PLC (f) | | 69,039 | 99,002 |
| Verizon Communications, Inc. | | 1,212,819 | 62,205,487 |
| | | | 95,852,587 |
| Entertainment - 0.1% | | | |
| Activision Blizzard, Inc. | | 36,800 | 2,865,984 |
| Media - 1.7% | | | |
| Charter Communications, Inc. Class A (f) | | 619 | 313,790 |
| Comcast Corp. Class A | | 1,708,039 | 75,631,967 |
| Gannett Co., Inc. (f) | | 907,363 | 3,565,937 |
| Interpublic Group of Companies, Inc. | | 284,400 | 9,166,212 |
| Shaw Communications, Inc. Class B | | 308,826 | 8,750,701 |
| | | | 97,428,607 |
| Wireless Telecommunication Services - 0.5% | | | |
| T-Mobile U.S., Inc. (f) | | 195,954 | 26,118,709 |
TOTAL COMMUNICATION SERVICES | | | 222,265,887 |
| CONSUMER DISCRETIONARY - 2.1% | | | |
| Hotels, Restaurants & Leisure - 1.4% | | | |
| McDonald's Corp. | | 277,378 | 69,957,505 |
| Super Group SGHC Ltd. (f) | | 1,055,795 | 7,390,565 |
| | | | 77,348,070 |
| Internet & Direct Marketing Retail - 0.0% | | | |
| eBay, Inc. | | 53,723 | 2,614,698 |
| Multiline Retail - 0.4% | | | |
| Dollar Tree, Inc. (f) | | 20,700 | 3,318,831 |
| Target Corp. | | 132,000 | 21,368,160 |
| | | | 24,686,991 |
| Specialty Retail - 0.2% | | | |
| Best Buy Co., Inc. | | 93,000 | 7,631,580 |
| Burlington Stores, Inc. (f) | | 15,000 | 2,524,500 |
| | | | 10,156,080 |
| Textiles, Apparel & Luxury Goods - 0.1% | | | |
| PVH Corp. | | 73,800 | 5,230,206 |
TOTAL CONSUMER DISCRETIONARY | | | 120,036,045 |
| CONSUMER STAPLES - 9.8% | | | |
| Beverages - 4.5% | | | |
| Diageo PLC | | 610,738 | 28,375,667 |
| Keurig Dr. Pepper, Inc. | | 757,852 | 26,327,778 |
| PepsiCo, Inc. | | 463,720 | 77,789,030 |
| The Coca-Cola Co. | | 1,929,947 | 122,320,041 |
| | | | 254,812,516 |
| Food & Staples Retailing - 0.8% | | | |
| Albertsons Companies, Inc. | | 215,400 | 6,580,470 |
| BJ's Wholesale Club Holdings, Inc. (f) | | 165,600 | 9,583,272 |
| Costco Wholesale Corp. | | 8,100 | 3,776,382 |
| Walmart, Inc. | | 169,500 | 21,802,785 |
| | | | 41,742,909 |
| Food Products - 1.0% | | | |
| Bunge Ltd. | | 53,100 | 6,282,792 |
| Mondelez International, Inc. | | 552,014 | 35,086,010 |
| Nestle SA (Reg. S) | | 115,544 | 14,133,022 |
| | | | 55,501,824 |
| Household Products - 2.5% | | | |
| Procter & Gamble Co. | | 949,860 | 140,465,282 |
| Personal Products - 0.1% | | | |
| Unilever PLC | | 157,500 | 7,609,058 |
| Tobacco - 0.9% | | | |
| Philip Morris International, Inc. | | 484,200 | 51,446,250 |
TOTAL CONSUMER STAPLES | | | 551,577,839 |
| ENERGY - 4.5% | | | |
| Energy Equipment & Services - 0.0% | | | |
| Tenaris SA sponsored ADR | | 50,771 | 1,692,705 |
| Oil, Gas & Consumable Fuels - 4.5% | | | |
| Antero Resources Corp. (f) | | 151,859 | 6,511,714 |
| Canadian Natural Resources Ltd. | | 24,181 | 1,603,926 |
| Canadian Natural Resources Ltd. | | 127,038 | 8,407,599 |
| Cenovus Energy, Inc. | | 271,411 | 6,288,593 |
| Cheniere Energy, Inc. | | 36,738 | 5,024,656 |
| ConocoPhillips Co. | | 101,188 | 11,369,484 |
| DCP Midstream Partners LP | | 200,789 | 7,210,333 |
| DHT Holdings, Inc. | | 3,164,055 | 18,857,768 |
| DT Midstream, Inc. | | 7,172 | 416,693 |
| Energy Transfer LP | | 1,019,056 | 11,882,193 |
| Enterprise Products Partners LP | | 8,639 | 236,881 |
| Enviva, Inc. | | 71,587 | 5,575,911 |
| Equitrans Midstream Corp. | | 59,079 | 464,952 |
| Euronav NV (g) | | 885,200 | 11,330,560 |
| Exxon Mobil Corp. | | 356,806 | 34,253,376 |
| Genesis Energy LP | | 492,700 | 6,030,648 |
| Golar LNG Ltd. (f) | | 13,894 | 351,935 |
| Hess Corp. | | 18,000 | 2,215,260 |
| Imperial Oil Ltd. | | 476,231 | 26,084,740 |
| MEG Energy Corp. (f) | | 162,454 | 2,834,613 |
| MPLX LP | | 78,656 | 2,591,715 |
| Occidental Petroleum Corp. | | 36,087 | 2,501,190 |
| ONEOK, Inc. | | 11,017 | 725,469 |
| PDC Energy, Inc. | | 46,974 | 3,717,522 |
| Phillips 66 Co. | | 108,924 | 10,980,628 |
| Plains All American Pipeline LP | | 726,038 | 8,269,573 |
| Suncor Energy, Inc. | | 455,534 | 18,327,964 |
| Targa Resources Corp. | | 121,172 | 8,726,807 |
| The Williams Companies, Inc. | | 35,158 | 1,302,955 |
| Valero Energy Corp. | | 117,538 | 15,232,925 |
| Western Midstream Partners LP | | 392,589 | 10,855,086 |
| | | | 250,183,669 |
TOTAL ENERGY | | | 251,876,374 |
| FINANCIALS - 5.5% | | | |
| Banks - 2.3% | | | |
| Bank of America Corp. | | 600,145 | 22,325,394 |
| Huntington Bancshares, Inc. | | 890,652 | 12,362,250 |
| JPMorgan Chase & Co. | | 139,600 | 18,459,308 |
| M&T Bank Corp. | | 120,057 | 21,606,658 |
| PNC Financial Services Group, Inc. | | 202,802 | 35,573,499 |
| Wells Fargo & Co. | | 435,012 | 19,910,499 |
| | | | 130,237,608 |
| Capital Markets - 0.9% | | | |
| BlackRock, Inc. Class A | | 74,011 | 49,519,280 |
| Consumer Finance - 0.4% | | | |
| Capital One Financial Corp. | | 162,090 | 20,724,827 |
| Insurance - 1.9% | | | |
| American Financial Group, Inc. | | 79,200 | 11,190,960 |
| Chubb Ltd. | | 187,036 | 39,518,836 |
| Hartford Financial Services Group, Inc. | | 230,836 | 16,737,918 |
| The Travelers Companies, Inc. | | 238,592 | 42,717,512 |
| | | | 110,165,226 |
TOTAL FINANCIALS | | | 310,646,941 |
| HEALTH CARE - 12.1% | | | |
| Biotechnology - 3.1% | | | |
| AbbVie, Inc. | | 662,637 | 97,652,815 |
| Amgen, Inc. | | 308,600 | 79,229,964 |
| | | | 176,882,779 |
| Health Care Providers & Services - 0.6% | | | |
| UnitedHealth Group, Inc. | | 65,904 | 32,739,789 |
| Life Sciences Tools & Services - 0.6% | | | |
| Danaher Corp. | | 128,270 | 33,840,191 |
| Pharmaceuticals - 7.8% | | | |
| AstraZeneca PLC sponsored ADR | | 463,524 | 30,815,076 |
| Bristol-Myers Squibb Co. | | 1,192,871 | 90,002,117 |
| Eli Lilly & Co. | | 341,033 | 106,893,384 |
| Johnson & Johnson | | 411,520 | 73,880,186 |
| Merck & Co., Inc. | | 872,181 | 80,266,817 |
| Roche Holding AG (participation certificate) | | 79,353 | 27,042,799 |
| Sanofi SA sponsored ADR | | 553,500 | 29,473,875 |
| | | | 438,374,254 |
TOTAL HEALTH CARE | | | 681,837,013 |
| INDUSTRIALS - 4.8% | | | |
| Aerospace & Defense - 1.5% | | | |
| Huntington Ingalls Industries, Inc. | | 59,694 | 12,563,199 |
| Lockheed Martin Corp. | | 88,700 | 39,037,757 |
| Northrop Grumman Corp. | | 56,502 | 26,441,241 |
| The Boeing Co. (f) | | 39,899 | 5,242,729 |
| | | | 83,284,926 |
| Air Freight & Logistics - 1.0% | | | |
| United Parcel Service, Inc. Class B | | 296,029 | 53,951,285 |
| Building Products - 0.3% | | | |
| Johnson Controls International PLC | | 297,590 | 16,221,631 |
| Commercial Services & Supplies - 0.1% | | | |
| GFL Environmental, Inc. | | 18,908 | 578,018 |
| Waste Connections, Inc. (United States) | | 5,898 | 752,231 |
| Waste Management, Inc. | | 47,500 | 7,529,225 |
| | | | 8,859,474 |
| Construction & Engineering - 0.0% | | | |
| Ferrovial SA | | 23,485 | 605,348 |
| VINCI SA | | 4,012 | 387,159 |
| | | | 992,507 |
| Electrical Equipment - 0.9% | | | |
| AMETEK, Inc. | | 43,700 | 5,308,239 |
| Babcock & Wilcox Enterprises, Inc. (f) | | 1,415,380 | 9,270,739 |
| Eaton Corp. PLC | | 256,703 | 35,579,036 |
| | | | 50,158,014 |
| Industrial Conglomerates - 0.3% | | | |
| General Electric Co. | | 62,475 | 4,891,168 |
| Hitachi Ltd. | | 125,300 | 6,501,382 |
| Siemens AG | | 45,800 | 6,045,737 |
| | | | 17,438,287 |
| Machinery - 0.1% | | | |
| ITT, Inc. | | 90,200 | 6,658,564 |
| Professional Services - 0.1% | | | |
| Clarivate Analytics PLC (f) | | 271,600 | 4,011,532 |
| Trading Companies & Distributors - 0.1% | | | |
| Watsco, Inc. | | 20,356 | 5,203,604 |
| Transportation Infrastructure - 0.4% | | | |
| Aena SME SA (b)(f) | | 95,252 | 14,531,540 |
| Aeroports de Paris SA (f) | | 3,194 | 477,134 |
| Flughafen Zuerich AG (f) | | 3,544 | 598,549 |
| Getlink SE | | 79,673 | 1,533,178 |
| Grupo Aeroportuario del Pacifico S.A.B. de CV sponsored ADR | | 4,602 | 692,049 |
| Grupo Aeroportuario Norte S.A.B. de CV ADR | | 11,442 | 660,890 |
| Transurban Group unit | | 193,958 | 2,000,217 |
| | | | 20,493,557 |
TOTAL INDUSTRIALS | | | 267,273,381 |
| INFORMATION TECHNOLOGY - 4.7% | | | |
| Communications Equipment - 1.4% | | | |
| Cisco Systems, Inc. | | 1,742,780 | 78,512,239 |
| IT Services - 0.5% | | | |
| Accenture PLC Class A | | 32,302 | 9,640,855 |
| Amdocs Ltd. | | 71,839 | 6,242,091 |
| Capgemini SA | | 36,600 | 7,092,193 |
| Visa, Inc. Class A | | 28,700 | 6,089,279 |
| | | | 29,064,418 |
| Semiconductors & Semiconductor Equipment - 0.9% | | | |
| NXP Semiconductors NV | | 116,600 | 22,126,016 |
| Taiwan Semiconductor Manufacturing Co. Ltd. sponsored ADR | | 293,207 | 27,942,627 |
| | | | 50,068,643 |
| Software - 1.0% | | | |
| Microsoft Corp. | | 131,467 | 35,741,933 |
| NortonLifeLock, Inc. | | 311,700 | 7,586,778 |
| Open Text Corp. | | 231,726 | 9,497,313 |
| Roper Technologies, Inc. | | 12,900 | 5,707,476 |
| | | | 58,533,500 |
| Technology Hardware, Storage & Peripherals - 0.9% | | | |
| Apple, Inc. | | 43,741 | 6,510,410 |
| FUJIFILM Holdings Corp. | | 60,100 | 3,310,267 |
| Samsung Electronics Co. Ltd. | | 518,953 | 28,152,777 |
| Seagate Technology Holdings PLC | | 121,900 | 10,321,273 |
| | | | 48,294,727 |
TOTAL INFORMATION TECHNOLOGY | | | 264,473,527 |
| MATERIALS - 1.6% | | | |
| Chemicals - 0.5% | | | |
| Linde PLC | | 63,318 | 20,558,088 |
| Nutrien Ltd. | | 74,976 | 7,327,180 |
| | | | 27,885,268 |
| Containers & Packaging - 0.9% | | | |
| Ball Corp. | | 101,600 | 7,202,424 |
| Crown Holdings, Inc. | | 212,932 | 22,238,618 |
| Packaging Corp. of America | | 136,932 | 21,536,665 |
| | | | 50,977,707 |
| Metals & Mining - 0.2% | | | |
| Lundin Mining Corp. | | 316,238 | 2,815,227 |
| Wheaton Precious Metals Corp. | | 203,600 | 8,408,953 |
| | | | 11,224,180 |
TOTAL MATERIALS | | | 90,087,155 |
| REAL ESTATE - 0.5% | | | |
| Equity Real Estate Investment Trusts (REITs) - 0.5% | | | |
| American Tower Corp. | | 48,385 | 12,392,850 |
| ARGAN SA | | 1,143 | 137,432 |
| Crown Castle International Corp. | | 3,286 | 623,190 |
| Digital Realty Trust, Inc. | | 1,964 | 274,155 |
| Equinix, Inc. | | 523 | 359,348 |
| Lamar Advertising Co. Class A | | 130,868 | 12,818,521 |
| Prologis (REIT), Inc. | | 1,189 | 151,574 |
| SBA Communications Corp. Class A | | 1,482 | 498,856 |
| Warehouses de Pauw | | 1,891 | 69,713 |
| | | | 27,325,639 |
| UTILITIES - 3.8% | | | |
| Electric Utilities - 2.3% | | | |
| Constellation Energy Corp. | | 143,732 | 8,922,883 |
| Enel SpA | | 145,507 | 945,378 |
| Exelon Corp. | | 282,262 | 13,873,177 |
| Iberdrola SA | | 85,798 | 1,016,579 |
| NextEra Energy, Inc. | | 921,757 | 69,767,787 |
| NRG Energy, Inc. | | 194,669 | 8,962,561 |
| ORSTED A/S (b) | | 5,803 | 654,053 |
| PG&E Corp. (f) | | 221,000 | 2,696,200 |
| Xcel Energy, Inc. | | 307,026 | 23,131,339 |
| | | | 129,969,957 |
| Independent Power and Renewable Electricity Producers - 0.2% | | | |
| Brookfield Renewable Partners LP | | 8,211 | 292,147 |
| EDP Renovaveis SA | | 13,252 | 324,937 |
| NextEra Energy Partners LP | | 3,687 | 264,174 |
| RWE AG | | 14,759 | 649,626 |
| The AES Corp. | | 9,245 | 203,760 |
| Vistra Corp. | | 388,000 | 10,231,560 |
| | | | 11,966,204 |
| Multi-Utilities - 1.3% | | | |
| Ameren Corp. | | 215,605 | 20,523,440 |
| Dominion Energy, Inc. | | 402,973 | 33,938,386 |
| WEC Energy Group, Inc. | | 155,151 | 16,301,716 |
| | | | 70,763,542 |
TOTAL UTILITIES | | | 212,699,703 |
| TOTAL COMMON STOCKS (Cost $2,168,903,303) | | | 3,000,099,504 |
| | | | |
| Preferred Stocks - 10.0% |
| | | Shares | Value ($) |
| Convertible Preferred Stocks - 2.6% | | | |
| COMMUNICATION SERVICES - 0.2% | | | |
| Media - 0.1% | | | |
| Paramount Global Series A 5.75% | | 38,670 | 1,950,605 |
| | | | |
| Wireless Telecommunication Services - 0.1% | | | |
| T-Mobile U.S., Inc. 5.25% (b)(f) | | 5,850 | 6,677,527 |
| | | | |
TOTAL COMMUNICATION SERVICES | | | 8,628,132 |
| | | | |
| CONSUMER DISCRETIONARY - 0.1% | | | |
| Auto Components - 0.1% | | | |
| Aptiv PLC Series A, 5.50% | | 23,400 | 2,869,348 |
| | | | |
| Internet & Direct Marketing Retail - 0.0% | | | |
| Chewy, Inc. 6.50% (b) | | 2,250 | 1,429,403 |
| | | | |
TOTAL CONSUMER DISCRETIONARY | | | 4,298,751 |
| | | | |
| FINANCIALS - 0.6% | | | |
| Banks - 0.6% | | | |
| Bank of America Corp. 7.25% | | 12,765 | 16,083,900 |
| Wells Fargo & Co. 7.50% | | 12,645 | 15,992,279 |
| | | | 32,076,179 |
| Capital Markets - 0.0% | | | |
| KKR & Co. LP Series C, 6.00% | | 29,300 | 2,009,101 |
| | | | |
TOTAL FINANCIALS | | | 34,085,280 |
| | | | |
| HEALTH CARE - 0.4% | | | |
| Health Care Equipment & Supplies - 0.3% | | | |
| Becton, Dickinson & Co. 6.50% | | 113,500 | 5,828,225 |
| Boston Scientific Corp. Series A, 5.50% | | 77,000 | 8,437,871 |
| | | | 14,266,096 |
| Health Care Technology - 0.0% | | | |
| Change Healthcare, Inc. 6.00% | | 22,000 | 1,707,420 |
| | | | |
| Life Sciences Tools & Services - 0.1% | | | |
| Danaher Corp. Series B, 5.00% | | 5,760 | 8,178,635 |
| | | | |
TOTAL HEALTH CARE | | | 24,152,151 |
| | | | |
| INDUSTRIALS - 0.2% | | | |
| Construction & Engineering - 0.1% | | | |
| Fluor Corp. 6.50% | | 4,200 | 5,919,440 |
| | | | |
| Machinery - 0.0% | | | |
| RBC Bearings, Inc. | | 32,100 | 3,107,568 |
| | | | |
| Professional Services - 0.1% | | | |
| Clarivate Analytics PLC 5.00% | | 52,900 | 3,181,935 |
| | | | |
TOTAL INDUSTRIALS | | | 12,208,943 |
| | | | |
| INFORMATION TECHNOLOGY - 0.3% | | | |
| IT Services - 0.0% | | | |
| Sabre Corp. Series A, 6.50% | | 700 | 69,419 |
| | | | |
| Semiconductors & Semiconductor Equipment - 0.3% | | | |
| Broadcom, Inc. Series A, 8.00% | | 9,050 | 16,411,510 |
| | | | |
TOTAL INFORMATION TECHNOLOGY | | | 16,480,929 |
| | | | |
| MATERIALS - 0.0% | | | |
| Metals & Mining - 0.0% | | | |
| ArcelorMittal SA 5.50% | | 39,200 | 3,005,072 |
| | | | |
| UTILITIES - 0.8% | | | |
| Electric Utilities - 0.6% | | | |
| American Electric Power Co., Inc. 6.125% | | 66,200 | 3,727,722 |
| NextEra Energy, Inc.: | | | |
| 4.872% | | 189,600 | 10,443,450 |
| 5.279% | | 120,900 | 5,889,039 |
| 6.219% | | 119,500 | 5,861,475 |
| PG&E Corp. | | 44,500 | 5,031,964 |
| Southern Co. 6.75% | | 37,500 | 2,111,765 |
| | | | 33,065,415 |
| Gas Utilities - 0.1% | | | |
| UGI Corp. 7.125% | | 39,900 | 3,928,953 |
| | | | |
| Independent Power and Renewable Electricity Producers - 0.1% | | | |
| The AES Corp. 6.875% | | 37,900 | 3,368,173 |
| | | | |
| Multi-Utilities - 0.0% | | | |
| Dominion Energy, Inc. 7.25% | | 1,100 | 111,837 |
| DTE Energy Co. 6.25% | | 48,400 | 2,539,527 |
| NiSource, Inc. 7.75% | | 800 | 94,240 |
| | | | 2,745,604 |
TOTAL UTILITIES | | | 43,108,145 |
| | | | |
| TOTAL CONVERTIBLE PREFERRED STOCKS | | | 145,967,403 |
| Nonconvertible Preferred Stocks - 7.4% | | | |
| COMMUNICATION SERVICES - 0.2% | | | |
| Diversified Telecommunication Services - 0.2% | | | |
| AT&T, Inc.: | | | |
| 4.75% | | 160,000 | 3,270,400 |
| 5.125% | | 85,000 | 1,836,850 |
| 5.35% | | 100,000 | 2,525,000 |
| BCE, Inc.: | | | |
| 2.954%(d) | | 72,900 | 962,509 |
| Series AM, Canadian Government Bond 5 Year Note Index + 2.090% 2.939%(d)(e) | | 68,700 | 936,929 |
| Series R | | 67,600 | 893,602 |
| | | | 10,425,290 |
| Wireless Telecommunication Services - 0.0% | | | |
| Telephone & Data Systems, Inc. 6.625% | | 8,100 | 191,458 |
| U.S. Cellular Corp. 6.25% | | 65,000 | 1,477,450 |
| | | | 1,668,908 |
TOTAL COMMUNICATION SERVICES | | | 12,094,198 |
| | | | |
| CONSUMER DISCRETIONARY - 0.1% | | | |
| Leisure Products - 0.1% | | | |
| Brunswick Corp.: | | | |
| 6.375% | | 20,000 | 527,000 |
| 6.50% | | 45,000 | 1,150,650 |
| 6.625% | | 30,000 | 807,000 |
| | | | 2,484,650 |
| Textiles, Apparel & Luxury Goods - 0.0% | | | |
| Fossil Group, Inc. 7.00% | | 65,400 | 1,485,234 |
| | | | |
TOTAL CONSUMER DISCRETIONARY | | | 3,969,884 |
| | | | |
| ENERGY - 0.1% | | | |
| Oil, Gas & Consumable Fuels - 0.1% | | | |
| Enbridge, Inc.: | | | |
| Canadian Government Bond 5 Year Note Index + 2.400% 3.415%(d)(e) | | 2,000 | 31,972 |
| Canadian Government Bond 5 Year Note Index + 2.570% 4.449%(d)(e) | | 13,400 | 203,725 |
| Canadian Government Bond 5 Year Note Index + 2.650% 5.086%(d)(e) | | 22,700 | 370,601 |
| Series F, Canadian Government Bond 5 Year Note Index + 2.510% 4.689%(d)(e) | | 33,400 | 527,862 |
| Series L, 5 year U.S. Treasury Index + 3.150% 4.959%(d)(e) | | 17,800 | 428,980 |
| Energy Transfer LP Series C, 7.375% (d) | | 60,000 | 1,297,800 |
| Global Partners LP Series B, 9.50% | | 60,000 | 1,590,000 |
| Pembina Pipeline Corp.: | | | |
| Series 15, 4.40%(d) | | 8,600 | 155,906 |
| Series 17, Canadian Government Bond 5 Year Note Index + 3.010% 4.821%(d)(e) | | 6,800 | 124,995 |
| Series 3, Canadian Government Bond 5 Year Note Index + 2.600% 4.478%(d)(e) | | 11,900 | 195,597 |
| Series 5, Canadian Government Bond 5 Year Note Index + 3.000% 4.573%(d)(e) | | 1,500 | 26,481 |
| Series 7, Canadian Government Bond 5 Year Note Index + 2.940% 4.38%(d)(e) | | 900 | 15,526 |
| TC Energy Corp. Canadian Government Bond 5 Year Note Index + 2.380% 3.903% (d)(e) | | 12,000 | 192,497 |
| | | | 5,161,942 |
| FINANCIALS - 5.4% | | | |
| Banks - 3.6% | | | |
| Bank of America Corp.: | | | |
| 4.25% | | 325,000 | 6,418,750 |
| 4.375% | | 315,200 | 6,266,176 |
| 5.00% | | 384,200 | 8,679,078 |
| Series GG, 6.00% | | 350,000 | 9,037,000 |
| Series HH, 5.875% | | 195,043 | 4,905,331 |
| Series KK, 5.375% | | 411,400 | 9,659,672 |
| Series PP, 4.125% | | 275,000 | 5,362,500 |
| Bank of Hawaii Corp. Series A, 4.625% | | 60,000 | 1,184,400 |
| Cullen/Frost Bankers, Inc. Series B 4.45% | | 50,000 | 1,050,000 |
| First Citizens Bancshares, Inc. | | 100,000 | 2,340,000 |
| First Citizens Bancshares, Inc. Series C | | 150,000 | 3,598,500 |
| First Republic Bank: | | | |
| 4.125% | | 150,000 | 2,757,000 |
| 4.50% | | 180,000 | 3,567,600 |
| 5.125% | | 20,000 | 449,000 |
| Series J, 4.70% | | 110,000 | 2,275,900 |
| Series L, 4.375% | | 225,000 | 4,263,750 |
| Series M, 4.00% | | 165,000 | 3,007,950 |
| First Tennessee Bank NA 3 month U.S. LIBOR + 0.850% 3.75% (b)(d)(e) | | 12,500 | 10,250,000 |
| JPMorgan Chase & Co.: | | | |
| 4.55% | | 540,000 | 11,167,200 |
| 4.625% | | 442,400 | 9,268,280 |
| 4.75% | | 200,000 | 4,356,000 |
| Series DD, 5.75% | | 434,100 | 11,026,140 |
| Series EE, 6.00% | | 196,000 | 5,123,440 |
| Series MM, 4.20% | | 356,400 | 7,085,232 |
| PNC Financial Services Group, Inc. Series P, 6.125% (d)(e) | | 145,086 | 3,631,503 |
| Regions Financial Corp. 4.45% | | 10,000 | 192,200 |
| Truist Financial Corp.: | | | |
| 4.75% | | 230,000 | 4,800,100 |
| Series O, 5.25% | | 39,000 | 904,410 |
| U.S. Bancorp: | | | |
| 4.50% | | 105,000 | 2,242,800 |
| Series K, 5.50% | | 52,191 | 1,323,042 |
| Series L, 3.75% | | 25,000 | 455,290 |
| Series M, 4.00% | | 155,000 | 2,955,850 |
| Wells Fargo & Co.: | | | |
| 4.25% | | 360,000 | 6,744,600 |
| 4.70% | | 350,000 | 7,147,000 |
| 5.85%(d) | | 453,751 | 10,768,872 |
| 6.625%(d) | | 200,000 | 5,158,000 |
| Series CC, 4.375% | | 325,000 | 6,201,000 |
| Series Y, 5.625% | | 170,000 | 4,159,900 |
| Series Z, 4.75% | | 591,400 | 12,283,378 |
| | | | 202,066,844 |
| Capital Markets - 0.7% | | | |
| B. Riley Financial, Inc.: | | | |
| 5.00% | | 80,000 | 1,907,200 |
| 5.25% | | 57,400 | 1,316,756 |
| 6.375% | | 53,300 | 1,345,825 |
| 6.50% | | 15,600 | 388,284 |
| Brookfield Asset Management, Inc.: | | | |
| Canadian Government Bond 5 Year Note Index + 1.800% 2.727%(d)(e) | | 800 | 11,625 |
| Canadian Government Bond 5 Year Note Index + 2.310% 3.471%(d)(e) | | 2,400 | 36,906 |
| Canadian Government Bond 5 Year Note Index + 2.630% 4.437%(d)(e) | | 600 | 10,483 |
| Charles Schwab Corp.: | | | |
| 4.45% | | 225,000 | 4,803,750 |
| 5.95% | | 28,000 | 710,640 |
| Morgan Stanley: | | | |
| 6.875%(d) | | 100,000 | 2,635,000 |
| Series E, 7.125%(d) | | 25,000 | 668,500 |
| Series I, 6.375%(d) | | 30,000 | 782,700 |
| Series K, 5.85%(d) | | 270,000 | 6,987,600 |
| Series L, 4.875% | | 75,000 | 1,682,250 |
| Series O, 4.50% | | 380,000 | 7,425,200 |
| Northern Trust Corp. Series E, 4.70% | | 110,000 | 2,500,300 |
| Oaktree Capital Group LLC: | | | |
| 6.55% | | 80,300 | 2,038,014 |
| Series A, 6.625% | | 65,197 | 1,636,445 |
| State Street Corp.: | | | |
| Series D, 5.90%(d) | | 60,700 | 1,504,146 |
| Series G, 5.35%(d) | | 20,000 | 508,400 |
| Stifel Financial Corp.: | | | |
| 5.20% | | 5,000 | 116,400 |
| Series D, 4.50% | | 27,900 | 562,743 |
| | | | 39,579,167 |
| Consumer Finance - 0.1% | | | |
| Capital One Financial Corp.: | | | |
| 4.25% | | 40,000 | 749,200 |
| 5.00% | | 15,000 | 324,300 |
| Series J, 5.00% | | 117,000 | 2,392,650 |
| Series L, 4.375% | | 12,000 | 224,040 |
| | | | 3,690,190 |
| Diversified Financial Services - 0.1% | | | |
| Apollo Global Management LLC: | | | |
| 6.375% | | 38,246 | 946,206 |
| Series B, 6.375% | | 30,000 | 770,100 |
| Carlyle Finance LLC 4.625% | | 133,646 | 2,692,967 |
| Equitable Holdings, Inc.: | | | |
| 4.30% | | 26,000 | 502,320 |
| Series A 5.25% | | 52,500 | 1,189,650 |
| | | | 6,101,243 |
| Insurance - 0.9% | | | |
| Allstate Corp.: | | | |
| 5.10% | | 347,743 | 8,404,948 |
| Series G, 5.625% | | 150,000 | 3,858,000 |
| Series I, 4.75% | | 100,000 | 2,437,000 |
| Athene Holding Ltd.: | | | |
| Series A, 6.35%(d) | | 135,000 | 3,542,400 |
| Series B, 5.625% | | 111,000 | 2,673,990 |
| Series C, 6.375%(d) | | 185,500 | 4,837,840 |
| Series D, 4.875% | | 340,000 | 7,078,800 |
| Hartford Financial Services Group, Inc. Series G, 6.00% | | 60,000 | 1,557,000 |
| MetLife, Inc.: | | | |
| 5.625% | | 115,000 | 2,955,500 |
| Series F 4.75% | | 271,100 | 6,316,630 |
| Power Financial Corp. BK CDA TREASURY BIL 3 MTH INDX + 1.600% 1.77% (d)(e) | | 23,400 | 287,678 |
| Prudential Financial, Inc. 4.125% | | 25,000 | 533,250 |
| RenaissanceRe Holdings Ltd. Series G, 4.20% | | 40,000 | 747,200 |
| W.R. Berkley Corp.: | | | |
| 4.125% | | 80,000 | 1,610,400 |
| 4.25% | | 75,000 | 1,491,750 |
| 5.10% | | 125,000 | 2,922,500 |
| 5.70% | | 39,071 | 987,324 |
| | | | 52,242,210 |
| Mortgage Real Estate Investment Trusts - 0.0% | | | |
| KKR Real Estate Finance Trust, Inc. 6.50% | | 40,000 | 974,000 |
| TPG RE Finance Trust, Inc. Series C, 6.25% | | 10,000 | 210,400 |
| Two Harbors Investment Corp. Series C, 7.25% (d) | | 20,000 | 450,000 |
| | | | 1,634,400 |
| Real Estate Management & Development - 0.0% | | | |
| Brookfield Properties Corp.: | | | |
| Canadian Government Bond 5 Year Note Index + 3.000% 4.161%(d)(e) | | 33,900 | 458,307 |
| Canadian Government Bond 5 Year Note Index + 3.160% 5.383%(d)(e) | | 14,000 | 225,244 |
| Series CC, Canadian Government Bond 5 Year Note Index + 5.180% 6.00%(d)(e) | | 9,500 | 187,769 |
| Series EE, 5.10%(d) | | 10,500 | 190,932 |
| Series R, Canadian Government Bond 5 Year Note Index + 3.480% 4.155%(d)(e) | | 20,900 | 296,435 |
| | | | 1,358,687 |
TOTAL FINANCIALS | | | 306,672,741 |
| | | | |
| INDUSTRIALS - 0.3% | | | |
| Aerospace & Defense - 0.1% | | | |
| Bombardier, Inc. Series 3, 3.983% | | 123,400 | 2,097,561 |
| | | | |
| Commercial Services & Supplies - 0.0% | | | |
| Pitney Bowes, Inc. 6.70% | | 12,300 | 268,140 |
| | | | |
| Electrical Equipment - 0.2% | | | |
| Babcock & Wilcox Enterprises, Inc.: | | | |
| 6.50% | | 60,000 | 1,404,000 |
| 8.125% | | 303,300 | 7,388,388 |
| Series A, 7.75% | | 148,000 | 3,692,600 |
| | | | 12,484,988 |
TOTAL INDUSTRIALS | | | 14,850,689 |
| | | | |
| REAL ESTATE - 0.5% | | | |
| Equity Real Estate Investment Trusts (REITs) - 0.5% | | | |
| Digitalbridge Group, Inc. Series I, 7.15% | | 14,400 | 339,984 |
| Pebblebrook Hotel Trust: | | | |
| 6.375% | | 54,000 | 1,168,290 |
| Series H, 5.70% | | 9,514 | 182,288 |
| Public Storage: | | | |
| 3.875% | | 67,833 | 1,304,788 |
| 3.95% | | 40,000 | 756,796 |
| 4.00% | | 160,000 | 3,067,200 |
| 4.00% | | 140,000 | 2,696,400 |
| Series F, 5.15% | | 30,298 | 755,632 |
| Series G, 5.05% | | 55,937 | 1,379,966 |
| Series H, 5.60% | | 11,300 | 298,094 |
| Series I, 4.875% | | 60,000 | 1,423,200 |
| Series J, 4.70% | | 65,000 | 1,483,300 |
| Series K, 4.75% | | 35,000 | 834,400 |
| Series L, 4.625% | | 130,000 | 2,941,900 |
| Series M, 4.125% | | 70,000 | 1,441,300 |
| Series O, 3.90% | | 35,000 | 659,750 |
| Series S, 4.10% | | 50,000 | 983,000 |
| Summit Hotel Properties, Inc.: | | | |
| Series E, 6.25% | | 20,500 | 450,795 |
| Series F, 5.875% | | 68,698 | 1,465,651 |
| Sunstone Hotel Investors, Inc.: | | | |
| Series H, 6.125% | | 20,000 | 451,600 |
| Series I, 5.70% | | 31,000 | 654,100 |
| Vornado Realty Trust Series O, 4.45% | | 16,300 | 302,202 |
| | | | 25,040,636 |
| Real Estate Management & Development - 0.0% | | | |
| Brookfield Property Partners LP 5.75% | | 60,800 | 1,191,680 |
| | | | |
TOTAL REAL ESTATE | | | 26,232,316 |
| | | | |
| UTILITIES - 0.8% | | | |
| Electric Utilities - 0.4% | | | |
| Alabama Power Co. Series A, 5.00% | | 35,000 | 868,700 |
| Brookfield Infrastructure Finance ULC 5.00% | | 40,000 | 821,600 |
| Duke Energy Corp.: | | | |
| 5.625% | | 85,000 | 2,187,050 |
| 5.75% | | 11,800 | 306,682 |
| Entergy Louisiana LLC 4.875% | | 10,618 | 259,610 |
| Entergy New Orleans LLC 5.50% | | 24,795 | 621,859 |
| Entergy, Inc.: | | | |
| 4.875% | | 8,000 | 191,760 |
| Series A, 5.375% | | 10,000 | 251,600 |
| Fortis, Inc. Series G, Canadian Government Bond 5 Year Note Index + 2.130% 3.883% (d)(e) | | 14,600 | 241,361 |
| Georgia Power Co. 5.00% | | 21,503 | 540,585 |
| NextEra Energy Capital Holdings, Inc. 5.65% | | 115,000 | 2,954,350 |
| Southern Co.: | | | |
| 4.20% | | 210,000 | 4,126,500 |
| 5.25% | | 186,487 | 4,557,742 |
| Series A, 4.95% | | 300,000 | 6,849,000 |
| | | | 24,778,399 |
| Independent Power and Renewable Electricity Producers - 0.1% | | | |
| Brookfield Renewable Partners LP 5.25% | | 125,000 | 2,795,000 |
| TransAlta Corp.: | | | |
| Canadian Government Bond 5 Year Note Index + 3.800% 4.988%(d)(e) | | 10,800 | 195,618 |
| Series E, Canadian Government Bond 5 Year Note Index + 3.650% 5.19%(d)(e) | | 11,300 | 215,127 |
| | | | 3,205,745 |
| Multi-Utilities - 0.3% | | | |
| Brookfield Infrastructure Partners LP: | | | |
| 5.125% | | 53,000 | 1,059,952 |
| Class A 5.00% | | 59,100 | 1,153,632 |
| CMS Energy Corp.: | | | |
| 5.625% | | 108,258 | 2,723,771 |
| 5.875% | | 59,330 | 1,518,848 |
| 5.875% | | 112,943 | 2,875,529 |
| DTE Energy Co.: | | | |
| 4.375% | | 65,000 | 1,324,700 |
| Series E, 5.25% | | 75,000 | 1,830,375 |
| Sempra Energy 5.75% | | 220,459 | 5,511,475 |
| | | | 17,998,282 |
TOTAL UTILITIES | | | 45,982,426 |
| | | | |
| TOTAL NONCONVERTIBLE PREFERRED STOCKS | | | 414,964,196 |
| TOTAL PREFERRED STOCKS (Cost $592,292,302) | | | 560,931,599 |
| | | | |
| Equity Funds - 14.8% |
| | | Shares | Value ($) |
Fidelity Real Estate Equity Central Fund (h) (Cost $702,869,064) | | 6,069,211 | 830,450,159 |
| | | | |
| Preferred Securities - 10.7% |
| | | Principal Amount (a) | Value ($) |
| ENERGY - 0.1% | | | |
| Oil, Gas & Consumable Fuels - 0.1% | | | |
| DCP Midstream Partners LP 7.375% (d)(i) | | 2,635,000 | 2,521,297 |
| Enbridge, Inc. 5.75% 7/15/80 (d) | | 500,000 | 485,705 |
| Energy Transfer LP: | | | |
| 6.25% (d)(i) | | 2,270,000 | 1,866,056 |
| 6.75% (d)(i) | | 500,000 | 443,717 |
| 7.125% (d)(i) | | 3,000,000 | 2,707,462 |
| Summit Midstream Partners LP 9.5% (d)(i) | | 191,000 | 155,072 |
| | | | 8,179,309 |
| FINANCIALS - 10.2% | | | |
| Banks - 7.7% | | | |
| Bank of America Corp.: | | | |
| 4.3% (d)(i) | | 2,500,000 | 2,305,581 |
| 4.375% (d)(i) | | 10,000,000 | 8,841,404 |
| 5.125% (d)(i) | | 15,500,000 | 15,410,568 |
| 5.2% (d)(i) | | 24,000,000 | 23,912,578 |
| 5.875% (d)(i) | | 18,400,000 | 17,732,125 |
| 6.1% (d)(i) | | 13,420,000 | 13,646,297 |
| 6.125% (d)(i) | | 16,000,000 | 16,287,726 |
| 6.25% (d)(i) | | 13,925,000 | 14,093,551 |
| 6.3% (d)(i) | | 5,000,000 | 5,166,186 |
| 6.5% (d)(i) | | 10,000,000 | 10,213,124 |
| Citigroup, Inc.: | | | |
| 3.875% (d)(i) | | 10,000,000 | 8,941,742 |
| 4% (d)(i) | | 5,500,000 | 5,010,947 |
| 4.15% (d)(i) | | 3,975,000 | 3,513,869 |
| 5% (d)(i) | | 6,550,000 | 6,095,336 |
| 5.35% (d)(i) | | 5,000,000 | 4,861,629 |
| 5.9% (d)(i) | | 6,605,000 | 6,689,220 |
| 5.95% (d)(i) | | 11,750,000 | 11,563,606 |
| 6.25% (d)(i) | | 3,500,000 | 3,574,940 |
| 6.3% (d)(i) | | 6,000,000 | 5,785,433 |
| Comerica, Inc. 5.625% (d)(i) | | 2,000,000 | 2,038,942 |
| Farm Credit Bank of Texas 5.7% (b)(d) | | 500,000 | 483,422 |
| JPMorgan Chase & Co.: | | | |
| 3 month U.S. LIBOR + 3.320% 4.2869% (d)(e)(i) | | 10,000,000 | 9,725,714 |
| 3.65% (d)(i) | | 18,500,000 | 16,518,188 |
| 4% (d)(i) | | 9,000,000 | 7,890,573 |
| 4.6% (d)(i) | | 21,670,000 | 19,731,635 |
| 4.625% (d)(i) | | 2,000,000 | 1,856,779 |
| 5% (d)(i) | | 17,815,000 | 16,836,173 |
| 5.15% (d)(i) | | 13,265,000 | 12,926,872 |
| 6% (d)(i) | | 12,000,000 | 11,990,746 |
| 6.1% (d)(i) | | 16,000,000 | 15,917,171 |
| 6.125% (d)(i) | | 7,000,000 | 6,929,406 |
| 6.75% (d)(i) | | 13,250,000 | 13,918,140 |
| M&T Bank Corp.: | | | |
| 3.5% (d)(i) | | 2,650,000 | 2,199,500 |
| 6.45% (d)(i) | | 1,000,000 | 1,018,580 |
| PNC Financial Services Group, Inc.: | | | |
| 3 month U.S. LIBOR + 3.670% 4.964% (d)(e)(i) | | 3,500,000 | 3,480,207 |
| 3.4% (d)(i) | | 9,750,000 | 8,211,212 |
| 4.85% (d)(i) | | 1,490,000 | 1,466,902 |
| 5% (d)(i) | | 3,730,000 | 3,538,715 |
| 6% (d)(i) | | 6,000,000 | 6,057,851 |
| Truist Financial Corp.: | | | |
| 4.8% (d)(i) | | 7,000,000 | 6,692,210 |
| 4.95% (d)(i) | | 4,050,000 | 4,139,302 |
| 5.05% (d)(i) | | 2,000,000 | 1,867,713 |
| 5.1% (d)(i) | | 7,100,000 | 6,939,982 |
| U.S. Bancorp: | | | |
| 3.7% (d)(i) | | 6,000,000 | 5,002,923 |
| 5.3% (d)(i) | | 1,500,000 | 1,393,613 |
| Wells Fargo & Co.: | | | |
| 3.9% (d)(i) | | 27,050,000 | 25,122,280 |
| 5.875% (d)(i) | | 15,000,000 | 15,331,731 |
| 5.9% (d)(i) | | 20,500,000 | 20,392,974 |
| | | | 433,265,318 |
| Capital Markets - 1.7% | | | |
| Bank of New York Mellon Corp.: | | | |
| 3.7% (d)(i) | | 4,675,000 | 4,219,632 |
| 3.75% (d)(i) | | 6,500,000 | 5,700,168 |
| 4.625% (d)(i) | | 7,150,000 | 6,583,402 |
| 4.7% (d)(i) | | 3,000,000 | 3,021,494 |
| Charles Schwab Corp.: | | | |
| 3 month U.S. LIBOR + 3.310% 3.838% (d)(e)(i) | | 250,000 | 247,426 |
| 3 month U.S. LIBOR + 4.820% 6.106% (d)(e)(i) | | 1,000,000 | 1,006,985 |
| 4% (d)(i) | | 15,500,000 | 14,175,962 |
| 4% (d)(i) | | 21,750,000 | 17,544,810 |
| 5% (d)(i) | | 4,670,000 | 4,424,052 |
| 5.375% (d)(i) | | 16,750,000 | 17,144,196 |
| Goldman Sachs Capital II 3 month U.S. LIBOR + 0.760% 4% (d)(e)(i) | | 4,694,000 | 3,474,603 |
| Goldman Sachs Group, Inc.: | | | |
| 3.65% (d)(i) | | 2,250,000 | 1,930,662 |
| 3.8% (d)(i) | | 4,000,000 | 3,395,187 |
| 4.125% (d)(i) | | 4,550,000 | 3,992,470 |
| Morgan Stanley: | | | |
| 5.3% (d)(i) | | 1,000,000 | 965,259 |
| 5.875% (d)(i) | | 1,000,000 | 1,009,320 |
| Northern Trust Corp. 4.6% (d)(i) | | 4,285,000 | 4,021,579 |
| State Street Corp. 3 month U.S. LIBOR + 3.590% 4.423% (d)(e)(i) | | 583,000 | 587,683 |
| | | | 93,444,890 |
| Consumer Finance - 0.6% | | | |
| Ally Financial, Inc.: | | | |
| 4.7% (d)(i) | | 19,500,000 | 16,485,665 |
| 4.7% (d)(i) | | 7,000,000 | 5,605,003 |
| American Express Co. 3.55% (d)(i) | | 12,000,000 | 10,297,544 |
| Capital One Financial Corp. 3.95% (d)(i) | | 3,000,000 | 2,593,095 |
| | | | 34,981,307 |
| Diversified Financial Services - 0.0% | | | |
| Equitable Holdings, Inc. 4.95% (d)(i) | | 750,000 | 744,509 |
| Insurance - 0.2% | | | |
| Allianz SE 3.2% (b)(d)(i) | | 3,000,000 | 2,391,702 |
| MetLife, Inc. 3.85% (d)(i) | | 6,300,000 | 5,897,790 |
| | | | 8,289,492 |
TOTAL FINANCIALS | | | 570,725,516 |
| INDUSTRIALS - 0.1% | | | |
| Industrial Conglomerates - 0.1% | | | |
| General Electric Co. 3 month U.S. LIBOR + 3.330% 4.156% (d)(e)(i) | | 3,630,000 | 3,325,097 |
| Trading Companies & Distributors - 0.0% | | | |
| Air Lease Corp. 4.65% (d)(i) | | 1,000,000 | 881,241 |
TOTAL INDUSTRIALS | | | 4,206,338 |
| UTILITIES - 0.3% | | | |
| Electric Utilities - 0.2% | | | |
| Duke Energy Corp. 4.875% (d)(i) | | 3,000,000 | 2,880,036 |
| Edison International: | | | |
| 5% (d)(i) | | 4,000,000 | 3,482,470 |
| 5.375% (d)(i) | | 3,500,000 | 3,132,124 |
| | | | 9,494,630 |
| Independent Power and Renewable Electricity Producers - 0.0% | | | |
| Vistra Corp.: | | | |
| 7% (b)(d)(i) | | 1,500,000 | 1,488,374 |
| 8% (b)(d)(i) | | 1,750,000 | 1,754,856 |
| | | | 3,243,230 |
| Multi-Utilities - 0.1% | | | |
| Dominion Energy, Inc. 4.65% (d)(i) | | 250,000 | 237,790 |
| Sempra Energy 4.875% (d)(i) | | 7,000,000 | 6,797,487 |
| | | | 7,035,277 |
TOTAL UTILITIES | | | 19,773,137 |
| TOTAL PREFERRED SECURITIES (Cost $646,747,205) | | | 602,884,300 |
| | | | |
| Money Market Funds - 1.9% |
| | | Shares | Value ($) |
| Fidelity Cash Central Fund 0.82% (j) | | 101,142,285 | 101,162,514 |
| Fidelity Securities Lending Cash Central Fund 0.82% (j)(k) | | 8,309,769 | 8,310,600 |
| TOTAL MONEY MARKET FUNDS (Cost $109,471,587) | | | 109,473,114 |
| | | | |
| TOTAL INVESTMENT IN SECURITIES - 100.1% (Cost $4,749,017,024) | 5,624,764,768 |
NET OTHER ASSETS (LIABILITIES) - (0.1)% | (6,672,428) |
| NET ASSETS - 100.0% | 5,618,092,340 |
| | |
Currency Abbreviations
Legend
| (a) | Amount is stated in United States dollars unless otherwise noted. |
| (b) | Security exempt from registration under Rule 144A of the Securities Act of 1933. These securities may be resold in transactions exempt from registration, normally to qualified institutional buyers. At the end of the period, the value of these securities amounted to $144,686,811 or 2.6% of net assets. |
| (d) | Coupon rates for floating and adjustable rate securities reflect the rates in effect at period end. |
| (e) | Coupon is indexed to a floating interest rate which may be multiplied by a specified factor and/or subject to caps or floors. |
| (g) | Security or a portion of the security is on loan at period end. |
| (h) | Affiliated fund that is generally available only to investment companies and other accounts managed by Fidelity Investments. A complete unaudited schedule of portfolio holdings for each Fidelity Central Fund is filed with the SEC for the first and third quarters of each fiscal year on Form N-PORT and is available upon request or at the SEC's website at www.sec.gov. An unaudited holdings listing for the Fund, which presents direct holdings as well as the pro-rata share of securities and other investments held indirectly through its investment in underlying non-money market Fidelity Central Funds, is available at fidelity.com and/or institutional.fidelity.com, as applicable. In addition, each Fidelity Central Fund's financial statements are available on the SEC's website or upon request. |
| (i) | Security is perpetual in nature with no stated maturity date. |
| (j) | Affiliated fund that is generally available only to investment companies and other accounts managed by Fidelity Investments. The rate quoted is the annualized seven-day yield of the fund at period end. A complete unaudited listing of the fund's holdings as of its most recent quarter end is available upon request. In addition, each Fidelity Central Fund's financial statements are available on the SEC's website or upon request. |
| (k) | Investment made with cash collateral received from securities on loan. |
Affiliated Central Funds
Fiscal year to date information regarding the Fund's investments in Fidelity Central Funds, including the ownership percentage, is presented below.
| Affiliate | Value, beginning of period ($) | Purchases ($) | Sales Proceeds ($) | Dividend Income ($) | Realized Gain (loss) ($) | Change in Unrealized appreciation (depreciation) ($) | Value, end of period ($) | %ownership, end of period |
| Fidelity Cash Central Fund 0.82% | 281,528,623 | 777,833,330 | 958,199,439 | 232,768 | - | - | 101,162,514 | 0.2% |
| Fidelity Real Estate Equity Central Fund | 973,846,445 | 51,402,686 | 124,950,189 | 9,386,819 | 13,304,046 | (83,152,829) | 830,450,159 | 56.5% |
| Fidelity Securities Lending Cash Central Fund 0.82% | 3,246,875 | 91,485,469 | 86,421,744 | 9,312 | - | - | 8,310,600 | 0.0% |
| Total | 1,258,621,943 | 920,721,485 | 1,169,571,372 | 9,628,899 | 13,304,046 | (83,152,829) | 939,923,273 | |
Amounts in the income column in the above table include any capital gain distributions from underlying funds, which are presented in the corresponding line item in the Statement of Operations, if applicable.
Amount for Fidelity Securities Lending Cash Central Fund represents the income earned on investing cash collateral, less rebates paid to borrowers and any lending agent fees associated with the loan, plus any premium payments received for lending certain types of securities.
Investment Valuation
The following is a summary of the inputs used, as of May 31, 2022, involving the Fund's assets and liabilities carried at fair value. The inputs or methodology used for valuing securities may not be an indication of the risk associated with investing in those securities. For more information on valuation inputs, and their aggregation into the levels used below, please refer to the Investment Valuation section in the accompanying Notes to Financial Statements.
| Valuation Inputs at Reporting Date: |
| Description | Total ($) | Level 1 ($) | Level 2 ($) | Level 3 ($) |
Investments in Securities: | | | | |
|
| Equities: | | | | |
Communication Services | 242,988,217 | 233,025,886 | 9,962,331 | - |
Consumer Discretionary | 128,304,680 | 124,005,929 | 4,298,751 | - |
Consumer Staples | 551,577,839 | 501,460,092 | 50,117,747 | - |
Energy | 257,038,316 | 257,038,316 | - | - |
Financials | 651,404,962 | 609,078,783 | 42,326,179 | - |
Health Care | 705,989,164 | 654,794,214 | 51,194,950 | - |
Industrials | 294,333,013 | 257,840,187 | 36,492,826 | - |
Information Technology | 280,954,456 | 261,163,260 | 19,791,196 | - |
Materials | 93,092,227 | 90,087,155 | 3,005,072 | - |
Real Estate | 53,557,955 | 53,557,955 | - | - |
Utilities | 301,790,274 | 256,066,119 | 45,724,155 | - |
|
| Corporate Bonds | 520,926,092 | - | 519,939,513 | 986,579 |
|
| Equity Funds | 830,450,159 | 830,450,159 | - | - |
|
| Preferred Securities | 602,884,300 | - | 602,884,300 | - |
|
| Money Market Funds | 109,473,114 | 109,473,114 | - | - |
| Total Investments in Securities: | 5,624,764,768 | 4,238,041,169 | 1,385,737,020 | 986,579 |
| Statement of Assets and Liabilities |
| | | | May 31, 2022 (Unaudited) |
| | | | | |
| Assets | | | | |
| Investment in securities, at value (including securities loaned of $7,879,680) - See accompanying schedule: | | $4,684,841,495 | | |
Unaffiliated issuers (cost $3,936,676,373) | | | |
Fidelity Central Funds (cost $812,340,651) | | 939,923,273 | | |
| | | | | |
| Total Investment in Securities (cost $4,749,017,024) | | | $ | 5,624,764,768 |
| Cash | | | | 520,337 |
| Foreign currency held at value (cost $5,672) | | | | 5,672 |
| Receivable for investments sold | | | | 42,597,319 |
| Receivable for fund shares sold | | | | 3,705,039 |
| Dividends receivable | | | | 9,625,699 |
| Interest receivable | | | | 1,877,379 |
| Distributions receivable from Fidelity Central Funds | | | | 111,564 |
| Prepaid expenses | | | | 943 |
| Other receivables | | | | 25,334 |
Total assets | | | | 5,683,234,054 |
| Liabilities | | | | |
| Payable for investments purchased | | $49,469,876 | | |
| Payable for fund shares redeemed | | 3,649,734 | | |
| Accrued management fee | | 2,415,789 | | |
| Distribution and service plan fees payable | | 472,201 | | |
| Other affiliated payables | | 770,343 | | |
| Other payables and accrued expenses | | 53,171 | | |
| Collateral on securities loaned | | 8,310,600 | | |
| Total Liabilities | | | | 65,141,714 |
| Net Assets | | | $ | 5,618,092,340 |
| Net Assets consist of: | | | | |
| Paid in capital | | | $ | 4,667,339,188 |
| Total accumulated earnings (loss) | | | | 950,753,152 |
| Net Assets | | | $ | 5,618,092,340 |
| | | | | |
| Net Asset Value and Maximum Offering Price | | | | |
| Class A : | | | | |
Net Asset Value and redemption price per share ($869,370,944 ÷ 53,288,619 shares) (a) | | | $ | 16.31 |
| Maximum offering price per share (100/94.25 of $16.31) | | | $ | 17.31 |
| Class M : | | | | |
Net Asset Value and redemption price per share ($311,293,440 ÷ 19,095,621 shares) (a) | | | $ | 16.30 |
| Maximum offering price per share (100/96.50 of $16.30) | | | $ | 16.89 |
| Class C : | | | | |
Net Asset Value and offering price per share ($202,810,124 ÷ 12,487,537 shares) (a) | | | $ | 16.24 |
| Strategic Dividend and Income : | | | | |
Net Asset Value , offering price and redemption price per share ($3,401,247,376 ÷ 206,686,262 shares) | | | $ | 16.46 |
| Class I : | | | | |
Net Asset Value , offering price and redemption price per share ($647,449,402 ÷ 39,485,278 shares) | | | $ | 16.40 |
| Class Z : | | | | |
Net Asset Value , offering price and redemption price per share ($185,921,054 ÷ 11,336,468 shares) | | | $ | 16.40 |
(a)Redemption price per share is equal to net asset value less any applicable contingent deferred sales charge. |
| Statement of Operations |
| | | | Six months ended May 31, 2022 (Unaudited) |
| Investment Income | | | | |
| Dividends | | | $ | 64,875,658 |
| Interest | | | | 4,567,648 |
| Income from Fidelity Central Funds (including $9,312 from security lending) | | | | 9,628,899 |
| Total Income | | | | 79,072,205 |
| Expenses | | | | |
| Management fee | $ | 15,161,172 | | |
| Transfer agent fees | | 4,010,557 | | |
| Distribution and service plan fees | | 3,010,121 | | |
| Accounting fees | | 556,498 | | |
| Custodian fees and expenses | | 24,174 | | |
| Independent trustees' fees and expenses | | 9,017 | | |
| Registration fees | | 88,914 | | |
| Audit | | 42,033 | | |
| Legal | | 4,039 | | |
| Miscellaneous | | 10,474 | | |
| Total expenses before reductions | | 22,916,999 | | |
| Expense reductions | | (86,150) | | |
| Total expenses after reductions | | | | 22,830,849 |
| Net Investment income (loss) | | | | 56,241,356 |
| Realized and Unrealized Gain (Loss) | | | | |
| Net realized gain (loss) on: | | | | |
| Investment Securities: | | | | |
| Unaffiliated issuers | | 66,032,978 | | |
| Fidelity Central Funds | | 13,304,046 | | |
| Foreign currency transactions | | (115,233) | | |
| Total net realized gain (loss) | | | | 79,221,791 |
| Change in net unrealized appreciation (depreciation) on: | | | | |
| Investment Securities: | | | | |
| Unaffiliated issuers | | (159,412,970) | | |
| Fidelity Central Funds | | (83,152,829) | | |
| Assets and liabilities in foreign currencies | | (34,508) | | |
| Total change in net unrealized appreciation (depreciation) | | | | (242,600,307) |
| Net gain (loss) | | | | (163,378,516) |
| Net increase (decrease) in net assets resulting from operations | | | $ | (107,137,160) |
| Statement of Changes in Net Assets |
| |
| | Six months ended May 31, 2022 (Unaudited) | | Year ended November 30, 2021 |
| Increase (Decrease) in Net Assets | | | | |
| Operations | | | | |
| Net investment income (loss) | $ | 56,241,356 | $ | 88,360,912 |
| Net realized gain (loss) | | 79,221,791 | | 387,293,053 |
| Change in net unrealized appreciation (depreciation) | | (242,600,307) | | 334,852,369 |
| Net increase (decrease) in net assets resulting from operations | | (107,137,160) | | 810,506,334 |
| Distributions to shareholders | | (420,908,408) | | (263,479,517) |
| Share transactions - net increase (decrease) | | 386,406,064 | | 564,028,562 |
| Total increase (decrease) in net assets | | (141,639,504) | | 1,111,055,379 |
| | | | | |
| Net Assets | | | | |
| Beginning of period | | 5,759,731,844 | | 4,648,676,465 |
| End of period | $ | 5,618,092,340 | $ | 5,759,731,844 |
| | | | | |
| | | | | |
| Fidelity Advisor® Strategic Dividend & Income® Fund Class A |
| |
| | Six months ended (Unaudited) May 31, 2022 | | Years ended November 30, 2021 | | 2020 | | 2019 | | 2018 | | 2017 |
Selected Per-Share Data | | | | | | | | | | | | |
| Net asset value, beginning of period | $ | 17.88 | $ | 16.11 | $ | 15.77 | $ | 15.18 | $ | 15.92 | $ | 14.63 |
| Income from Investment Operations | | | | | | | | | | | | |
Net investment income (loss) A,B | | .15 | | .25 | | .33 | | .34 | | .40 | | .37 |
| Net realized and unrealized gain (loss) | | (.42) | | 2.39 | | 1.01 | | 1.23 | | (.02) | | 1.61 |
| Total from investment operations | | (.27) | | 2.64 | | 1.34 | | 1.57 | | .38 | | 1.98 |
| Distributions from net investment income | | (.20) | | (.38) | | (.30) | | (.33) | | (.38) C | | (.38) C |
| Distributions from net realized gain | | (1.10) | | (.49) | | (.70) | | (.65) | | (.73) C | | (.31) C |
| Total distributions | | (1.30) | | (.87) | | (1.00) | | (.98) | | (1.12) D | | (.69) |
| Net asset value, end of period | $ | 16.31 | $ | 17.88 | $ | 16.11 | $ | 15.77 | $ | 15.18 | $ | 15.92 |
Total Return E,F,G | | (2.01)% | | 16.99% | | 9.04% | | 11.44% | | 2.50% | | 13.96% |
Ratios to Average Net Assets B,H,I | | | | | | | | | | | | |
| Expenses before reductions | | .97% J | | .97% | | .99% | | 1.00% | | 1.00% | | 1.01% |
| Expenses net of fee waivers, if any | | .96% J | | .97% | | .99% | | 1.00% | | 1.00% | | 1.01% |
| Expenses net of all reductions | | .96% J | | .97% | | .99% | | 1.00% | | 1.00% | | 1.01% |
| Net investment income (loss) | | 1.77% J | | 1.45% | | 2.20% | | 2.28% | | 2.62% | | 2.41% |
| Supplemental Data | | | | | | | | | | | | |
| Net assets, end of period (000 omitted) | $ | 869,371 | $ | 867,690 | $ | 666,152 | $ | 661,327 | $ | 559,334 | $ | 619,704 |
Portfolio turnover rate K | | 27% J | | 37% | | 55% | | 58% | | 49% | | 64% |
A Calculated based on average shares outstanding during the period.
B Net investment income (loss) is affected by the timing of the declaration of dividends by any underlying mutual funds or exchange-traded funds (ETFs). Net investment income (loss) of any such underlying funds is not included in the Fund's net investment income (loss) ratio.
C The amount shown reflects reclassifications related to book to tax differences that were made in the year shown.
D Total distributions per share do not sum due to rounding.
E Total returns for periods of less than one year are not annualized.
F Total returns would have been lower if certain expenses had not been reduced during the applicable periods shown.
G Total returns do not include the effect of the sales charges.
H Fees and expenses of any underlying mutual funds or exchange-traded funds (ETFs) are not included in the Fund's expense ratio. The Fund indirectly bears its proportionate share of these expenses. For additional expense information related to investments in Fidelity Central Funds, please refer to the "Investments in Fidelity Central Funds" note found in the Notes to Financial Statements section of the most recent Annual or Semi-Annual report.
I Expense ratios reflect operating expenses of the class. Expenses before reductions do not reflect amounts reimbursed, waived, or reduced through arrangements with the investment adviser, brokerage services, or other offset arrangements, if applicable, and do not represent the amount paid by the class during periods when reimbursements, waivers or reductions occur.
J Annualized
K Amount does not include the portfolio activity of any underlying mutual funds or exchange-traded funds (ETFs).
| Fidelity Advisor® Strategic Dividend & Income® Fund Class M |
| |
| | Six months ended (Unaudited) May 31, 2022 | | Years ended November 30, 2021 | | 2020 | | 2019 | | 2018 | | 2017 |
Selected Per-Share Data | | | | | | | | | | | | |
| Net asset value, beginning of period | $ | 17.86 | $ | 16.10 | $ | 15.76 | $ | 15.17 | $ | 15.90 | $ | 14.62 |
| Income from Investment Operations | | | | | | | | | | | | |
Net investment income (loss) A,B | | .13 | | .21 | | .29 | | .30 | | .36 | | .33 |
| Net realized and unrealized gain (loss) | | (.41) | | 2.38 | | 1.01 | | 1.23 | | (.01) | | 1.61 |
| Total from investment operations | | (.28) | | 2.59 | | 1.30 | | 1.53 | | .35 | | 1.94 |
| Distributions from net investment income | | (.18) | | (.34) | | (.26) | | (.29) | | (.35) C | | (.34) C |
| Distributions from net realized gain | | (1.10) | | (.49) | | (.70) | | (.65) | | (.73) C | | (.31) C |
| Total distributions | | (1.28) | | (.83) | | (.96) | | (.94) | | (1.08) | | (.66) D |
| Net asset value, end of period | $ | 16.30 | $ | 17.86 | $ | 16.10 | $ | 15.76 | $ | 15.17 | $ | 15.90 |
Total Return E,F,G | | (2.08)% | | 16.65% | | 8.77% | | 11.16% | | 2.31% | | 13.64% |
Ratios to Average Net Assets B,H,I | | | | | | | | | | | | |
| Expenses before reductions | | 1.21% J | | 1.22% | | 1.24% | | 1.25% | | 1.25% | | 1.26% |
| Expenses net of fee waivers, if any | | 1.21% J | | 1.22% | | 1.24% | | 1.25% | | 1.25% | | 1.26% |
| Expenses net of all reductions | | 1.21% J | | 1.22% | | 1.23% | | 1.25% | | 1.25% | | 1.26% |
| Net investment income (loss) | | 1.53% J | | 1.21% | | 1.96% | | 2.04% | | 2.37% | | 2.16% |
| Supplemental Data | | | | | | | | | | | | |
| Net assets, end of period (000 omitted) | $ | 311,293 | $ | 316,442 | $ | 275,209 | $ | 275,564 | $ | 247,182 | $ | 263,012 |
Portfolio turnover rate K | | 27% J | | 37% | | 55% | | 58% | | 49% | | 64% |
A Calculated based on average shares outstanding during the period.
B Net investment income (loss) is affected by the timing of the declaration of dividends by any underlying mutual funds or exchange-traded funds (ETFs). Net investment income (loss) of any such underlying funds is not included in the Fund's net investment income (loss) ratio.
C The amount shown reflects reclassifications related to book to tax differences that were made in the year shown.
D Total distributions per share do not sum due to rounding.
E Total returns for periods of less than one year are not annualized.
F Total returns would have been lower if certain expenses had not been reduced during the applicable periods shown.
G Total returns do not include the effect of the sales charges.
H Fees and expenses of any underlying mutual funds or exchange-traded funds (ETFs) are not included in the Fund's expense ratio. The Fund indirectly bears its proportionate share of these expenses. For additional expense information related to investments in Fidelity Central Funds, please refer to the "Investments in Fidelity Central Funds" note found in the Notes to Financial Statements section of the most recent Annual or Semi-Annual report.
I Expense ratios reflect operating expenses of the class. Expenses before reductions do not reflect amounts reimbursed, waived, or reduced through arrangements with the investment adviser, brokerage services, or other offset arrangements, if applicable, and do not represent the amount paid by the class during periods when reimbursements, waivers or reductions occur.
J Annualized
K Amount does not include the portfolio activity of any underlying mutual funds or exchange-traded funds (ETFs).
| Fidelity Advisor® Strategic Dividend & Income® Fund Class C |
| |
| | Six months ended (Unaudited) May 31, 2022 | | Years ended November 30, 2021 | | 2020 | | 2019 | | 2018 | | 2017 |
Selected Per-Share Data | | | | | | | | | | | | |
| Net asset value, beginning of period | $ | 17.80 | $ | 16.03 | $ | 15.69 | $ | 15.10 | $ | 15.83 | $ | 14.56 |
| Income from Investment Operations | | | | | | | | | | | | |
Net investment income (loss) A,B | | .09 | | .12 | | .21 | | .23 | | .28 | | .25 |
| Net realized and unrealized gain (loss) | | (.42) | | 2.38 | | 1.01 | | 1.22 | | (.01) | | 1.60 |
| Total from investment operations | | (.33) | | 2.50 | | 1.22 | | 1.45 | | .27 | | 1.85 |
| Distributions from net investment income | | (.13) | | (.24) | | (.19) | | (.21) | | (.26) C | | (.27) C |
| Distributions from net realized gain | | (1.10) | | (.49) | | (.70) | | (.65) | | (.73) C | | (.31) C |
| Total distributions | | (1.23) | | (.73) | | (.88) D | | (.86) | | (1.00) D | | (.58) |
| Net asset value, end of period | $ | 16.24 | $ | 17.80 | $ | 16.03 | $ | 15.69 | $ | 15.10 | $ | 15.83 |
Total Return E,F,G | | (2.36)% | | 16.12% | | 8.22% | | 10.61% | | 1.76% | | 13.05% |
Ratios to Average Net Assets B,H,I | | | | | | | | | | | | |
| Expenses before reductions | | 1.72% J | | 1.73% | | 1.75% | | 1.75% | | 1.76% | | 1.76% |
| Expenses net of fee waivers, if any | | 1.72% J | | 1.73% | | 1.74% | | 1.75% | | 1.76% | | 1.76% |
| Expenses net of all reductions | | 1.72% J | | 1.73% | | 1.74% | | 1.75% | | 1.75% | | 1.76% |
| Net investment income (loss) | | 1.02% J | | .70% | | 1.45% | | 1.53% | | 1.86% | | 1.66% |
| Supplemental Data | | | | | | | | | | | | |
| Net assets, end of period (000 omitted) | $ | 202,810 | $ | 233,431 | $ | 278,672 | $ | 316,896 | $ | 349,003 | $ | 422,221 |
Portfolio turnover rate K | | 27% J | | 37% | | 55% | | 58% | | 49% | | 64% |
A Calculated based on average shares outstanding during the period.
B Net investment income (loss) is affected by the timing of the declaration of dividends by any underlying mutual funds or exchange-traded funds (ETFs). Net investment income (loss) of any such underlying funds is not included in the Fund's net investment income (loss) ratio.
C The amount shown reflects reclassifications related to book to tax differences that were made in the year shown.
D Total distributions per share do not sum due to rounding.
E Total returns for periods of less than one year are not annualized.
F Total returns would have been lower if certain expenses had not been reduced during the applicable periods shown.
G Total returns do not include the effect of the contingent deferred sales charge.
H Fees and expenses of any underlying mutual funds or exchange-traded funds (ETFs) are not included in the Fund's expense ratio. The Fund indirectly bears its proportionate share of these expenses. For additional expense information related to investments in Fidelity Central Funds, please refer to the "Investments in Fidelity Central Funds" note found in the Notes to Financial Statements section of the most recent Annual or Semi-Annual report.
I Expense ratios reflect operating expenses of the class. Expenses before reductions do not reflect amounts reimbursed, waived, or reduced through arrangements with the investment adviser, brokerage services, or other offset arrangements, if applicable, and do not represent the amount paid by the class during periods when reimbursements, waivers or reductions occur.
J Annualized
K Amount does not include the portfolio activity of any underlying mutual funds or exchange-traded funds (ETFs).
| Strategic Dividend & Income® Fund |
| |
| | Six months ended (Unaudited) May 31, 2022 | | Years ended November 30, 2021 | | 2020 | | 2019 | | 2018 | | 2017 |
Selected Per-Share Data | | | | | | | | | | | | |
| Net asset value, beginning of period | $ | 18.02 | $ | 16.23 | $ | 15.88 | $ | 15.27 | $ | 16.01 | $ | 14.72 |
| Income from Investment Operations | | | | | | | | | | | | |
Net investment income (loss) A,B | | .18 | | .31 | | .37 | | .39 | | .44 | | .41 |
| Net realized and unrealized gain (loss) | | (.42) | | 2.40 | | 1.02 | | 1.24 | | (.02) | | 1.62 |
| Total from investment operations | | (.24) | | 2.71 | | 1.39 | | 1.63 | | .42 | | 2.03 |
| Distributions from net investment income | | (.22) | | (.43) | | (.34) | | (.37) | | (.43) C | | (.42) C |
| Distributions from net realized gain | | (1.10) | | (.49) | | (.70) | | (.65) | | (.73) C | | (.31) C |
| Total distributions | | (1.32) | | (.92) | | (1.04) | | (1.02) | | (1.16) | | (.74) D |
| Net asset value, end of period | $ | 16.46 | $ | 18.02 | $ | 16.23 | $ | 15.88 | $ | 15.27 | $ | 16.01 |
Total Return E,F | | (1.80)% | | 17.30% | | 9.35% | | 11.81% | | 2.78% | | 14.21% |
Ratios to Average Net Assets B,G,H | | | | | | | | | | | | |
| Expenses before reductions | | .68% I | | .68% | | .70% | | .71% | | .71% | | .73% |
| Expenses net of fee waivers, if any | | .67% I | | .68% | | .70% | | .71% | | .71% | | .73% |
| Expenses net of all reductions | | .67% I | | .68% | | .70% | | .71% | | .71% | | .73% |
| Net investment income (loss) | | 2.06% I | | 1.74% | | 2.49% | | 2.57% | | 2.91% | | 2.69% |
| Supplemental Data | | | | | | | | | | | | |
| Net assets, end of period (000 omitted) | $ | 3,401,247 | $ | 3,514,906 | $ | 2,751,272 | $ | 3,142,639 | $ | 2,903,986 | $ | 3,294,527 |
Portfolio turnover rate J | | 27% I | | 37% | | 55% | | 58% | | 49% | | 64% |
A Calculated based on average shares outstanding during the period.
B Net investment income (loss) is affected by the timing of the declaration of dividends by any underlying mutual funds or exchange-traded funds (ETFs). Net investment income (loss) of any such underlying funds is not included in the Fund's net investment income (loss) ratio.
C The amount shown reflects reclassifications related to book to tax differences that were made in the year shown.
D Total distributions per share do not sum due to rounding.
E Total returns for periods of less than one year are not annualized.
F Total returns would have been lower if certain expenses had not been reduced during the applicable periods shown.
G Fees and expenses of any underlying mutual funds or exchange-traded funds (ETFs) are not included in the Fund's expense ratio. The Fund indirectly bears its proportionate share of these expenses. For additional expense information related to investments in Fidelity Central Funds, please refer to the "Investments in Fidelity Central Funds" note found in the Notes to Financial Statements section of the most recent Annual or Semi-Annual report.
H Expense ratios reflect operating expenses of the class. Expenses before reductions do not reflect amounts reimbursed, waived, or reduced through arrangements with the investment adviser, brokerage services, or other offset arrangements, if applicable, and do not represent the amount paid by the class during periods when reimbursements, waivers or reductions occur.
I Annualized
J Amount does not include the portfolio activity of any underlying mutual funds or exchange-traded funds (ETFs).
| Fidelity Advisor® Strategic Dividend & Income® Fund Class I |
| |
| | Six months ended (Unaudited) May 31, 2022 | | Years ended November 30, 2021 | | 2020 | | 2019 | | 2018 | | 2017 |
Selected Per-Share Data | | | | | | | | | | | | |
| Net asset value, beginning of period | $ | 17.96 | $ | 16.18 | $ | 15.84 | $ | 15.23 | $ | 15.97 | $ | 14.69 |
| Income from Investment Operations | | | | | | | | | | | | |
Net investment income (loss) A,B | | .17 | | .30 | | .36 | | .38 | | .44 | | .41 |
| Net realized and unrealized gain (loss) | | (.41) | | 2.39 | | 1.02 | | 1.24 | | (.02) | | 1.61 |
| Total from investment operations | | (.24) | | 2.69 | | 1.38 | | 1.62 | | .42 | | 2.02 |
| Distributions from net investment income | | (.22) | | (.42) | | (.34) | | (.36) | | (.42) C | | (.42) C |
| Distributions from net realized gain | | (1.10) | | (.49) | | (.70) | | (.65) | | (.73) C | | (.31) C |
| Total distributions | | (1.32) | | (.91) | | (1.04) | | (1.01) | | (1.16) D | | (.74) D |
| Net asset value, end of period | $ | 16.40 | $ | 17.96 | $ | 16.18 | $ | 15.84 | $ | 15.23 | $ | 15.97 |
Total Return E,F | | (1.83)% | | 17.25% | | 9.28% | | 11.82% | | 2.76% | | 14.17% |
Ratios to Average Net Assets B,G,H | | | | | | | | | | | | |
| Expenses before reductions | | .71% I | | .72% | | .73% | | .74% | | .74% | | .75% |
| Expenses net of fee waivers, if any | | .71% I | | .72% | | .73% | | .74% | | .74% | | .75% |
| Expenses net of all reductions | | .71% I | | .72% | | .73% | | .74% | | .74% | | .75% |
| Net investment income (loss) | | 2.03% I | | 1.71% | | 2.46% | | 2.54% | | 2.88% | | 2.67% |
| Supplemental Data | | | | | | | | | | | | |
| Net assets, end of period (000 omitted) | $ | 647,449 | $ | 647,384 | $ | 537,336 | $ | 545,366 | $ | 510,226 | $ | 658,324 |
Portfolio turnover rate J | | 27% I | | 37% | | 55% | | 58% | | 49% | | 64% |
A Calculated based on average shares outstanding during the period.
B Net investment income (loss) is affected by the timing of the declaration of dividends by any underlying mutual funds or exchange-traded funds (ETFs). Net investment income (loss) of any such underlying funds is not included in the Fund's net investment income (loss) ratio.
C The amount shown reflects reclassifications related to book to tax differences that were made in the year shown.
D Total distributions per share do not sum due to rounding.
E Total returns for periods of less than one year are not annualized.
F Total returns would have been lower if certain expenses had not been reduced during the applicable periods shown.
G Fees and expenses of any underlying mutual funds or exchange-traded funds (ETFs) are not included in the Fund's expense ratio. The Fund indirectly bears its proportionate share of these expenses. For additional expense information related to investments in Fidelity Central Funds, please refer to the "Investments in Fidelity Central Funds" note found in the Notes to Financial Statements section of the most recent Annual or Semi-Annual report.
H Expense ratios reflect operating expenses of the class. Expenses before reductions do not reflect amounts reimbursed, waived, or reduced through arrangements with the investment adviser, brokerage services, or other offset arrangements, if applicable, and do not represent the amount paid by the class during periods when reimbursements, waivers or reductions occur.
I Annualized
J Amount does not include the portfolio activity of any underlying mutual funds or exchange-traded funds (ETFs).
| Fidelity Advisor® Strategic Dividend & Income® Fund Class Z |
| |
| | Six months ended (Unaudited) May 31, 2022 | | Years ended November 30, 2021 | | 2020 | | 2019 | | 2018 A |
Selected Per-Share Data | | | | | | | | | | |
| Net asset value, beginning of period | $ | 17.96 | $ | 16.18 | $ | 15.84 | $ | 15.24 | $ | 15.61 |
| Income from Investment Operations | | | | | | | | | | |
Net investment income (loss) B,C | | .18 | | .32 | | .38 | | .40 | | .09 |
| Net realized and unrealized gain (loss) | | (.41) | | 2.39 | | 1.01 | | 1.23 | | (.33) |
| Total from investment operations | | (.23) | | 2.71 | | 1.39 | | 1.63 | | (.24) |
| Distributions from net investment income | | (.23) | | (.45) | | (.36) | | (.38) | | (.13) |
| Distributions from net realized gain | | (1.10) | | (.49) | | (.70) | | (.65) | | - |
| Total distributions | | (1.33) | | (.93) D | | (1.05) D | | (1.03) | | (.13) |
| Net asset value, end of period | $ | 16.40 | $ | 17.96 | $ | 16.18 | $ | 15.84 | $ | 15.24 |
Total Return E,F | | (1.77)% | | 17.40% | | 9.43% | | 11.90% | | (1.57)% |
Ratios to Average Net Assets C,G,H | | | | | | | | | | |
| Expenses before reductions | | .59% I | | .59% | | .61% | | .61% | | .64% I |
| Expenses net of fee waivers, if any | | .59% I | | .59% | | .61% | | .61% | | .64% I |
| Expenses net of all reductions | | .59% I | | .59% | | .60% | | .61% | | .64% I |
| Net investment income (loss) | | 2.15% I | | 1.83% | | 2.59% | | 2.67% | | 3.57% I |
| Supplemental Data | | | | | | | | | | |
| Net assets, end of period (000 omitted) | $ | 185,921 | $ | 179,880 | $ | 140,035 | $ | 127,236 | $ | 28,937 |
Portfolio turnover rate J | | 27% I | | 37% | | 55% | | 58% | | 49% |
A For the period October 2, 2018 (commencement of sale of shares) through November 30, 2018.
B Calculated based on average shares outstanding during the period.
C Net investment income (loss) is affected by the timing of the declaration of dividends by any underlying mutual funds or exchange-traded funds (ETFs). Net investment income (loss) of any such underlying funds is not included in the Fund's net investment income (loss) ratio.
D Total distributions per share do not sum due to rounding.
E Total returns for periods of less than one year are not annualized.
F Total returns would have been lower if certain expenses had not been reduced during the applicable periods shown.
G Fees and expenses of any underlying mutual funds or exchange-traded funds (ETFs) are not included in the Fund's expense ratio. The Fund indirectly bears its proportionate share of these expenses. For additional expense information related to investments in Fidelity Central Funds, please refer to the "Investments in Fidelity Central Funds" note found in the Notes to Financial Statements section of the most recent Annual or Semi-Annual report.
H Expense ratios reflect operating expenses of the class. Expenses before reductions do not reflect amounts reimbursed, waived, or reduced through arrangements with the investment adviser, brokerage services, or other offset arrangements, if applicable, and do not represent the amount paid by the class during periods when reimbursements, waivers or reductions occur.
I Annualized
J Amount does not include the portfolio activity of any underlying mutual funds or exchange-traded funds (ETFs).
For the period ended May 31, 2022
1. Organization.
Fidelity Strategic Dividend & Income Fund (the Fund) is a fund of Fidelity Salem Street Trust (the Trust) and is authorized to issue an unlimited number of shares. The Trust is registered under the Investment Company Act of 1940, as amended (the 1940 Act), as an open-end management investment company organized as a Massachusetts business trust. The Fund offers Class A, Class M, Class C, Strategic Dividend and Income, Class I and Class Z shares, each of which has equal rights as to assets and voting privileges. Each class has exclusive voting rights with respect to matters that affect that class. Class C shares will automatically convert to Class A shares after a holding period of eight years from the initial date of purchase, with certain exceptions.
2. Investments in Fidelity Central Funds.
Funds may invest in Fidelity Central Funds, which are open-end investment companies generally available only to other investment companies and accounts managed by the investment adviser and its affiliates. The Schedule of Investments lists any Fidelity Central Funds held as an investment as of period end, but does not include the underlying holdings of each Fidelity Central Fund. An investing fund indirectly bears its proportionate share of the expenses of the underlying Fidelity Central Funds.
Based on its investment objective, each Fidelity Central Fund may invest or participate in various investment vehicles or strategies that are similar to those of the investing fund. These strategies are consistent with the investment objectives of the investing fund and may involve certain economic risks which may cause a decline in value of each of the Fidelity Central Funds and thus a decline in the value of the investing fund.
| Fidelity Central Fund | Investment Manager | Investment Objective | Investment Practices | Expense Ratio A |
| Fidelity Real Estate Equity Central Fund | Fidelity Management & Research Company LLC (FMR) | Seeks above-average income and long-term capital growth by investing primarily in equity securities of issuers in the real estate industry. | Restricted Securities | Less than .005% |
| Fidelity Money Market Central Funds | Fidelity Management & Research Company LLC (FMR) | Each fund seeks to obtain a high level of current income consistent with the preservation of capital and liquidity. | Short-term Investments | Less than .005% |
A Expenses expressed as a percentage of average net assets and are as of each underlying Central Fund's most recent annual or semi-annual shareholder report.
An unaudited holdings listing for the investing fund, which presents direct holdings as well as the pro-rata share of any securities and other investments held indirectly through its investment in underlying non-money market Fidelity Central Funds, is available at fidelity.com and/or institutional.fidelity.com, as applicable. A complete unaudited list of holdings for each Fidelity Central Fund is available upon request or at the Securities and Exchange Commission website at www.sec.gov. In addition, the financial statements of the Fidelity Central Funds which contain the significant accounting policies (including investment valuation policies) of those funds, and are not covered by the Report of Independent Registered Public Accounting Firm, are available on the Securities and Exchange Commission website or upon request.
3. Significant Accounting Policies.
The Fund is an investment company and applies the accounting and reporting guidance of the Financial Accounting Standards Board (FASB) Accounting Standards Codification Topic 946 Financial Services - Investment Companies. The financial statements have been prepared in conformity with accounting principles generally accepted in the United States of America (GAAP), which require management to make certain estimates and assumptions at the date of the financial statements. Actual results could differ from those estimates. Subsequent events, if any, through the date that the financial statements were issued have been evaluated in the preparation of the financial statements. The Fund's Schedule of Investments lists any underlying mutual funds or exchange-traded funds (ETFs) but does not include the underlying holdings of these funds. The following summarizes the significant accounting policies of the Fund:
Investment Valuation. Investments are valued as of 4:00 p.m. Eastern time on the last calendar day of the period. The Board of Trustees (the Board) has delegated the day to day responsibility for the valuation of the Fund's investments to the Fair Value Committee (the Committee) established by the Fund's investment adviser. In accordance with valuation policies and procedures approved by the Board, the Fund attempts to obtain prices from one or more third party pricing vendors or brokers to value its investments. When current market prices, quotations or currency exchange rates are not readily available or reliable, investments will be fair valued in good faith by the Committee, in accordance with procedures adopted by the Board. Factors used in determining fair value vary by investment type and may include market or investment specific events, changes in interest rates and credit quality. The frequency with which these procedures are used cannot be predicted and they may be utilized to a significant extent. The Committee oversees the Fund's valuation policies and procedures and reports to the Board on the Committee's activities and fair value determinations. The Board monitors the appropriateness of the procedures used in valuing the Fund's investments and ratifies the fair value determinations of the Committee.
The Fund categorizes the inputs to valuation techniques used to value its investments into a disclosure hierarchy consisting of three levels as shown below:
Level 1 - unadjusted quoted prices in active markets for identical investments
Level 2 - other significant observable inputs (including quoted prices for similar investments, interest rates, prepayment speeds, etc.)
Level 3 - unobservable inputs (including the Fund's own assumptions based on the best information available)
Valuation techniques used to value the Fund's investments by major category are as follows:
Equity securities, including restricted securities, for which market quotations are readily available, are valued at the last reported sale price or official closing price as reported by a third party pricing vendor on the primary market or exchange on which they are traded and are categorized as Level 1 in the hierarchy. In the event there were no sales during the day or closing prices are not available, securities are valued at the last quoted bid price or may be valued using the last available price and are generally categorized as Level 2 in the hierarchy. For foreign equity securities, when market or security specific events arise, comparisons to the valuation of American Depositary Receipts (ADRs), futures contracts, ETFs and certain indexes as well as quoted prices for similar securities may be used and would be categorized as Level 2 in the hierarchy. For equity securities, including restricted securities, where observable inputs are limited, assumptions about market activity and risk are used and these securities may be categorized as Level 3 in the hierarchy.
Debt securities, including restricted securities, are valued based on evaluated prices received from third party pricing vendors or from brokers who make markets in such securities. Corporate bonds and preferred securities are valued by pricing vendors who utilize matrix pricing which considers yield or price of bonds of comparable quality, coupon, maturity and type or by broker-supplied prices. When independent prices are unavailable or unreliable, debt securities may be valued utilizing pricing methodologies which consider similar factors that would be used by third party pricing vendors. Debt securities are generally categorized as Level 2 in the hierarchy but may be Level 3 depending on the circumstances.
Investments in open-end mutual funds, including the Fidelity Central Funds, are valued at their closing net asset value (NAV) each business day and are categorized as Level 1 in the hierarchy.
Changes in valuation techniques may result in transfers in or out of an assigned level within the disclosure hierarchy. The aggregate value of investments by input level as of May 31, 2022 is included at the end of the Fund's Schedule of Investments.
Foreign Currency. Certain Funds may use foreign currency contracts to facilitate transactions in foreign-denominated securities. Gains and losses from these transactions may arise from changes in the value of the foreign currency or if the counterparties do not perform under the contracts' terms.
Foreign-denominated assets, including investment securities, and liabilities are translated into U.S. dollars at the exchange rates at period end. Purchases and sales of investment securities, income and dividends received, and expenses denominated in foreign currencies are translated into U.S. dollars at the exchange rate in effect on the transaction date.
The effects of exchange rate fluctuations on investments are included with the net realized and unrealized gain (loss) on investment securities. Other foreign currency transactions resulting in realized and unrealized gain (loss) are disclosed separately.
Investment Transactions and Income. For financial reporting purposes, the Fund's investment holdings and NAV include trades executed through the end of the last business day of the period. The NAV per share for processing shareholder transactions is calculated as of the close of business of the New York Stock Exchange (NYSE), normally 4:00 p.m. Eastern time and includes trades executed through the end of the prior business day. Gains and losses on securities sold are determined on the basis of identified costand include proceeds received from litigation. Commissions paid to certain brokers with whom the investment adviser, or its affiliates, places trades on behalf of a fund include an amount in addition to trade execution, which may be rebated back to a fund. Any such rebates are included in net realized gain (loss) on investments in the Statement of Operations. Dividend income is recorded on the ex-dividend date, except for certain dividends from foreign securities where the ex-dividend date may have passed, which are recorded as soon as the Fund is informed of the ex-dividend date. Non-cash dividends included in dividend income, if any, are recorded at the fair market value of the securities received. Income and capital gain distributions from Fidelity Central Funds, if any, are recorded on the ex-dividend date. Certain distributions received by the Fund represent a return of capital or capital gain. The Fund determines the components of these distributions subsequent to the ex-dividend date, based upon receipt of tax filings or other correspondence relating to the underlying investment. These distributions are recorded as a reduction of cost of investments and/or as a realized gain. Interest income is accrued as earned and includes coupon interest and amortization of premium and accretion of discount on debt securities as applicable. Investment income is recorded net of foreign taxes withheld where recovery of such taxes is uncertain. Funds may file withholding tax reclaims in certain jurisdictions to recover a portion of amounts previously withheld. Any withholding tax reclaims income is included in the Statement of Operations in dividends. Any receivables for withholding tax reclaims are included in the Statement of Assets and Liabilities in dividends receivable.
Class Allocations and Expenses. Investment income, realized and unrealized capital gains and losses, common expenses of a fund, and certain fund-level expense reductions, if any, are allocated daily on a pro-rata basis to each class based on the relative net assets of each class to the total net assets of a fund. Each class differs with respect to transfer agent and distribution and service plan fees incurred, as applicable. Certain expense reductions may also differ by class, if applicable. For the reporting period, the allocated portion of income and expenses to each class as a percent of its average net assets may vary due to the timing of recording these transactions in relation to fluctuating net assets of the classes. Expenses directly attributable to a fund are charged to that fund. Expenses attributable to more than one fund are allocated among the respective funds on the basis of relative net assets or other appropriate methods. Expenses included in the accompanying financial statements reflect the expenses of that fund and do not include any expenses associated with any underlying mutual funds or exchange-traded funds. Although not included in a fund's expenses, a fund indirectly bears its proportionate share of these expenses through the net asset value of each underlying mutual fund or exchange-traded fund. Expense estimates are accrued in the period to which they relate and adjustments are made when actual amounts are known.
Income Tax Information and Distributions to Shareholders. Each year, the Fund intends to qualify as a regulated investment company under Subchapter M of the Internal Revenue Code, including distributing substantially all of its taxable income and realized gains. As a result, no provision for U.S. Federal income taxes is required. The Fund files a U.S. federal tax return, in addition to state and local tax returns as required. The Fund's federal income tax returns are subject to examination by the Internal Revenue Service (IRS) for a period of three fiscal years after they are filed. State and local tax returns may be subject to examination for an additional fiscal year depending on the jurisdiction.Foreign taxes are provided for based on the Fund's understanding of the tax rules and rates that exist in the foreign markets in which it invests.
Distributions are declared and recorded on the ex-dividend date. Income and capital gain distributions are declared separately for each class. Income and capital gain distributions are determined in accordance with income tax regulations, which may differ from GAAP.
Capital accounts within the financial statements are adjusted for permanent book-tax differences. These adjustments have no impact on net assets or the results of operations. Capital accounts are not adjusted for temporary book-tax differences which will reverse in a subsequent period.
Book-tax differences are primarily due to foreign currency transactions, passive foreign investment companies (PFIC), market discount, contingent interest, certain conversion ratio adjustments, equity-debt classifications, partnerships and losses deferred due to wash sales.
As of period end, the cost and unrealized appreciation (depreciation) in securities, and derivatives if applicable, for federal income tax purposes were as follows:
| Gross unrealized appreciation | $1,105,448,726 |
| Gross unrealized depreciation | (230,032,335) |
| Net unrealized appreciation (depreciation) | $875,416,391 |
| Tax cost | $4,749,348,377 |
Restricted Securities (including Private Placements). Funds may invest in securities that are subject to legal or contractual restrictions on resale. These securities generally may be resold in transactions exempt from registration or to the public if the securities are registered. Disposal of these securities may involve time-consuming negotiations and expense, and prompt sale at an acceptable price may be difficult. Information regarding restricted securities held at period end is included at the end of the Schedule of Investments, if applicable.
4. Purchases and Sales of Investments.
Purchases and sales of securities, other than short-term securities and in-kind transactions, as applicable, are noted in the table below.
| | Purchases ($) | Sales ($) |
| Fidelity Strategic Dividend & Income Fund | 980,698,868 | 758,013,747 |
5. Fees and Other Transactions with Affiliates.
Management Fee. Fidelity Management & Research Company LLC (the investment adviser) and its affiliates provide the Fund with investment management related services for which the Fund pays a monthly management fee. The management fee is the sum of an individual fund fee rate that is based on an annual rate of .30% of the Fund's average net assets and an annualized group fee rate that averaged .22% during the period. The group fee rate is based upon the monthly average net assets of a group of registered investment companies with which the investment adviser has management contracts. The group fee rate decreases as assets under management increase and increases as assets under management decrease. For the reporting period, the total annualized management fee rate was .52% of the Fund's average net assets.
Distribution and Service Plan Fees. In accordance with Rule 12b-1 of the 1940 Act, the Fund has adopted separate Distribution and Service Plans for each class of shares. Certain classes pay Fidelity Distributors Company LLC (FDC), an affiliate of the investment adviser, separate Distribution and Service Fees, each of which is based on an annual percentage of each class' average net assets. In addition, FDC may pay financial intermediaries for selling shares of the Fund and providing shareholder support services. For the period, the Distribution and Service Fee rates, total fees and amounts retained by FDC were as follows:
| | Distribution Fee | Service Fee | Total Fees | Retained by FDC |
| Class A | - % | .25% | $1,107,239 | $44,290 |
| Class M | .25% | .25% | 797,366 | 1,083 |
| Class C | .75% | .25% | 1,105,516 | 107,857 |
| | | | $3,010,121 | $153,230 |
Sales Load. FDC may receive a front-end sales charge of up to 5.75% for selling Class A shares and 3.50% for selling Class M shares, some of which is paid to financial intermediaries for selling shares of the Fund. Depending on the holding period, FDC may receive contingent deferred sales charges levied on Class A, Class M and Class C redemptions.The deferred sales charges are 1.00% for Class C shares, 1.00% for certain purchases of Class A shares and .25% for certain purchases of Class M shares.
For the period, sales charge amounts retained by FDC were as follows:
| | Retained by FDC |
| Class A | $136,582 |
| Class M | 11,367 |
Class C A | 2,380 |
| | $150,329 |
A When Class C shares are initially sold, FDC pays commissions from its own resources to financial intermediaries through which the sales are made.
Transfer Agent Fees. Fidelity Investments Institutional Operations Company LLC (FIIOC), an affiliate of the investment adviser, is the transfer, dividend disbursing and shareholder servicing agent for each class of the Fund. FIIOC receives account fees and asset-based fees that vary according to the account size and type of account of the shareholders of the respective classes of the Fund, except for Class Z. FIIOC receives an asset-based fee of Class Z's average net assets. FIIOC pays for typesetting, printing and mailing of shareholder reports, except proxy statements.
For the period, transfer agent fees for each class were as follows:
| | Amount | % of Class-Level Average Net Assets A |
| Class A | $737,648 | .17 |
| Class M | 258,308 | .16 |
| Class C | 191,047 | .17 |
| Strategic Dividend and Income | 2,250,185 | .13 |
| Class I | 536,381 | .16 |
| Class Z | 36,988 | .04 |
| | $4,010,557 | |
A Annualized
Accounting Fees. Fidelity Service Company, Inc. (FSC), an affiliate of the investment adviser, maintains the Fund's accounting records. The accounting fee is based on the level of average net assets for each month. For the period, the fees were equivalent to the following annualized rates:
| | % of Average Net Assets |
| Fidelity Strategic Dividend & Income Fund | .02 |
Brokerage Commissions. A portion of portfolio transactions were placed with brokerage firms which are affiliates of the investment adviser. Brokerage commissions are included in net realized gain (loss) and change in net unrealized appreciation (depreciation) in the Statement of Operations. The commissions paid to these affiliated firms were as follows:
| | Amount |
| Fidelity Strategic Dividend & Income Fund | $10,777 |
Interfund Trades. Funds may purchase from or sell securities to other Fidelity Funds under procedures adopted by the Board. The procedures have been designed to ensure these interfund trades are executed in accordance with Rule 17a-7 of the 1940 Act. Any interfund trades are included within the respective purchases and sales amounts shown in the Purchases and Sales of Investments note. Interfund trades during the period are noted in the table below.
| | Purchases ($) | Sales ($) | Realized Gain (Loss) ($) |
| Fidelity Strategic Dividend & Income Fund | 26,026,156 | 25,688,625 | 2,436,107 |
Other. During the period, the investment adviser reimbursed the Fund for certain losses as follows:
| | Amount ($) |
| Fidelity Strategic Dividend & Income Fund | 3,670 |
6. Committed Line of Credit.
Certain Funds participate with other funds managed by the investment adviser or an affiliate in a $4.25 billion credit facility (the "line of credit") to be utilized for temporary or emergency purposes to fund shareholder redemptions or for other short-term liquidity purposes. The participating funds have agreed to pay commitment fees on their pro-rata portion of the line of credit, which are reflected in Miscellaneous expenses on the Statement of Operations, and are listed below. During the period, there were no borrowings on this line of credit.
| | Amount |
| Fidelity Strategic Dividend & Income Fund | $4,806 |
7. Security Lending.
Funds lend portfolio securities from time to time in order to earn additional income. Lending agents are used, including National Financial Services (NFS), an affiliate of the investment adviser. Pursuant to a securities lending agreement, NFS will receive a fee, which is capped at 9.9% of a fund's daily lending revenue, for its services as lending agent. A fund may lend securities to certain qualified borrowers, including NFS. On the settlement date of the loan, a fund receives collateral (in the form of U.S. Treasury obligations, letters of credit and/or cash) against the loaned securities and maintains collateral in an amount not less than 100% of the market value of the loaned securities during the period of the loan. The market value of the loaned securities is determined at the close of business of a fund and any additional required collateral is delivered to a fund on the next business day. A fund or borrower may terminate the loan at any time, and if the borrower defaults on its obligation to return the securities loaned because of insolvency or other reasons, a fund may apply collateral received from the borrower against the obligation. A fund may experience delays and costs in recovering the securities loaned. Any cash collateral received is invested in the Fidelity Securities Lending Cash Central Fund. Any loaned securities are identified as such in the Schedule of Investments, and the value of loaned securities and cash collateral at period end, as applicable, are presented in the Statement of Assets and Liabilities. Security lending income represents the income earned on investing cash collateral, less rebates paid to borrowers and any lending agent fees associated with the loan, plus any premium payments received for lending certain types of securities. Security lending income is presented in the Statement of Operations as a component of income from Fidelity Central Funds. Affiliated security lending activity, if any, was as follows:
| | Total Security Lending Fees Paid to NFS | Security Lending Income From Securities Loaned to NFS | Value of Securities Loaned to NFS at Period End |
| Fidelity Strategic Dividend & Income Fund | $987 | $- | $- |
8. Expense Reductions.
In addition, during the period the investment adviser or an affiliate reimbursed and/or waived a portion of fund-level operating expenses in the amount of $86,150.
9. Distributions to Shareholders.
Distributions to shareholders of each class were as follows:
| | Six months ended May 31, 2022 | Year ended November 30, 2021 |
| Fidelity Strategic Dividend & Income Fund | | |
| Distributions to shareholders | | |
| Class A | $63,412,476 | $36,924,105 |
| Class M | 22,656,642 | 14,220,423 |
| Class C | 15,786,393 | 12,339,310 |
| Strategic Dividend and Income | 258,008,227 | 160,701,519 |
| Class I | 47,693,699 | 30,899,061 |
| Class Z | 13,350,971 | 8,395,099 |
| Total | $420,908,408 | $263,479,517 |
10. Share Transactions.
Share transactions for each class were as follows and may contain in-kind transactions, automatic conversions between classes or exchanges between affiliated funds:
| | Shares | Shares | Dollars | Dollars |
| | Six months ended May 31, 2022 | Year ended November 30, 2021 | Six months ended May 31, 2022 | Year ended November 30, 2021 |
| Fidelity Strategic Dividend & Income Fund | | | | |
| Class A | | | | |
| Shares sold | 5,183,646 | 12,094,516 | $88,067,115 | $211,168,381 |
| Reinvestment of distributions | 3,489,587 | 2,175,763 | 61,236,572 | 35,493,239 |
| Shares redeemed | (3,922,818) | (7,077,296) | (66,468,389) | (122,413,647) |
| Net increase (decrease) | 4,750,415 | 7,192,983 | $82,835,298 | $124,247,973 |
| Class M | | | | |
| Shares sold | 1,754,164 | 2,907,559 | $29,764,765 | $50,354,886 |
| Reinvestment of distributions | 1,284,160 | 869,852 | 22,524,978 | 14,122,294 |
| Shares redeemed | (1,657,482) | (3,156,422) | (28,126,661) | (54,446,328) |
| Net increase (decrease) | 1,380,842 | 620,989 | $24,163,082 | $10,030,852 |
| Class C | | | | |
| Shares sold | 824,662 | 1,911,204 | $13,893,112 | $33,138,920 |
| Reinvestment of distributions | 891,740 | 761,629 | 15,601,467 | 12,208,454 |
| Shares redeemed | (2,345,099) | (6,938,071) | (39,699,057) | (120,230,092) |
| Net increase (decrease) | (628,697) | (4,265,238) | $(10,204,478) | $(74,882,718) |
| Strategic Dividend and Income | | | | |
| Shares sold | 15,176,270 | 42,398,046 | $260,497,666 | $737,672,154 |
| Reinvestment of distributions | 13,039,951 | 8,716,987 | 230,634,818 | 143,602,730 |
| Shares redeemed | (16,581,500) | (25,566,443) | (283,931,159) | (447,911,652) |
| Net increase (decrease) | 11,634,721 | 25,548,590 | $207,201,325 | $433,363,232 |
| Class I | | | | |
| Shares sold | 5,554,580 | 8,676,062 | $94,015,317 | $151,884,997 |
| Reinvestment of distributions | 2,517,628 | 1,754,934 | 44,377,461 | 28,772,710 |
| Shares redeemed | (4,632,482) | (7,596,025) | (78,615,463) | (132,845,815) |
| Net increase (decrease) | 3,439,726 | 2,834,971 | $59,777,315 | $47,811,892 |
| Class Z | | | | |
| Shares sold | 1,784,864 | 3,184,821 | $30,275,621 | $55,551,851 |
| Reinvestment of distributions | 630,631 | 438,623 | 11,115,222 | 7,199,222 |
| Shares redeemed | (1,092,583) | (2,262,859) | (18,757,321) | (39,293,742) |
| Net increase (decrease) | 1,322,912 | 1,360,585 | $22,633,522 | $23,457,331 |
11. Other.
A fund's organizational documents provide former and current trustees and officers with a limited indemnification against liabilities arising in connection with the performance of their duties to the fund. In the normal course of business, a fund may also enter into contracts that provide general indemnifications. A fund's maximum exposure under these arrangements is unknown as this would be dependent on future claims that may be made against a fund. The risk of material loss from such claims is considered remote.
12.Coronavirus (COVID-19) Pandemic.
An outbreak of COVID-19 first detected in China during December 2019 has since spread globally and was declared a pandemic by the World Health Organization during March 2020. Developments that disrupt global economies and financial markets, such as the COVID-19 pandemic, may magnify factors that affect the Fund's performance.
As a shareholder, you incur two types of costs: (1) transaction costs, which may include sales charges (loads) on purchase payments or redemption proceeds, as applicable and (2) ongoing costs, which generally include management fees, distribution and/or service (12b-1) fees and other Fund expenses. This Example is intended to help you understand your ongoing costs (in dollars) of investing in a fund and to compare these costs with the ongoing costs of investing in other mutual funds.
| The Example is based on an investment of $1,000 invested at the beginning of the period and held for the entire period (December 1, 2021 to May 31, 2022). |
Actual Expenses
The first line of the accompanying table provides information about actual account values and actual expenses. You may use the information in this line, together with the amount you invested, to estimate the expenses that you paid over the period. Simply divide your account value by $1,000.00 (for example, an $8,600 account value divided by $1,000.00 = 8.6), then multiply the result by the number in the first line for a class/Fund under the heading entitled "Expenses Paid During Period" to estimate the expenses you paid on your account during this period. If any fund is a shareholder of any underlying mutual funds or exchange-traded funds (ETFs) (the Underlying Funds), such fund indirectly bears its proportional share of the expenses of the Underlying Funds in addition to the direct expenses incurred presented in the table. These fees and expenses are not included in the annualized expense ratio used to calculate the expense estimate in the table below.
Hypothetical Example for Comparison Purposes
The second line of the accompanying table provides information about hypothetical account values and hypothetical expenses based on the actual expense ratio and an assumed rate of return of 5% per year before expenses, which is not the actual return. The hypothetical account values and expenses may not be used to estimate the actual ending account balance or expenses you paid for the period. You may use this information to compare the ongoing costs of investing in the Fund and other funds. To do so, compare this 5% hypothetical example with the 5% hypothetical examples that appear in the shareholder reports of the other funds. If any fund is a shareholder of any Underlying Funds, such fund indirectly bears its proportional share of the expenses of the Underlying Funds in addition to the direct expenses as presented in the table. These fees and expenses are not included in the annualized expense ratio used to calculate the expense estimate in the table below.
Please note that the expenses shown in the table are meant to highlight your ongoing costs only and do not reflect any transaction costs. Therefore, the second line of the table is useful in comparing ongoing costs only, and will not help you determine the relative total costs of owning different funds. In addition, if these transactional costs were included, your costs would have been higher.
| | | | | Annualized Expense Ratio- A | | Beginning Account Value December 1, 2021 | | Ending Account Value May 31, 2022 | | Expenses Paid During Period- C December 1, 2021 to May 31, 2022 |
| Fidelity® Strategic Dividend & Income® Fund | | | | | | | | | | |
| Class A | | | | .96% | | | | | | |
| Actual | | | | | | $ 1,000 | | $ 979.90 | | $ 4.74 |
Hypothetical- B | | | | | | $ 1,000 | | $ 1,020.14 | | $ 4.84 |
| Class M | | | | 1.21% | | | | | | |
| Actual | | | | | | $ 1,000 | | $ 979.20 | | $ 5.97 |
Hypothetical- B | | | | | | $ 1,000 | | $ 1,018.90 | | $ 6.09 |
| Class C | | | | 1.72% | | | | | | |
| Actual | | | | | | $ 1,000 | | $ 976.40 | | $ 8.48 |
Hypothetical- B | | | | | | $ 1,000 | | $ 1,016.36 | | $ 8.65 |
| Strategic Dividend & Income® Fund | | | | .67% | | | | | | |
| Actual | | | | | | $ 1,000 | | $ 982.00 | | $ 3.31 |
Hypothetical- B | | | | | | $ 1,000 | | $ 1,021.59 | | $ 3.38 |
| Class I | | | | .71% | | | | | | |
| Actual | | | | | | $ 1,000 | | $ 981.70 | | $ 3.51 |
Hypothetical- B | | | | | | $ 1,000 | | $ 1,021.39 | | $ 3.58 |
| Class Z | | | | .59% | | | | | | |
| Actual | | | | | | $ 1,000 | | $ 982.30 | | $ 2.92 |
Hypothetical- B | | | | | | $ 1,000 | | $ 1,021.99 | | $ 2.97 |
| |
A Annualized expense ratio reflects expenses net of applicable fee waivers.
B 5% return per year before expenses
C Expenses are equal to the annualized expense ratio, multiplied by the average account value over the period, multiplied by 182/ 365 (to reflect the one-half year period). The fees and expenses of any Underlying Funds are not included in each annualized expense ratio.
The Securities and Exchange Commission adopted Rule 22e-4 under the Investment Company Act of 1940 (the Liquidity Rule) to promote effective liquidity risk management throughout the open-end investment company industry, thereby reducing the risk that funds will be unable to meet their redemption obligations and mitigating dilution of the interests of fund shareholders.
The Fund has adopted and implemented a liquidity risk management program pursuant to the Liquidity Rule (the Program) effective December 1, 2018. The Program is reasonably designed to assess and manage the Fund's liquidity risk and to comply with the requirements of the Liquidity Rule. The Fund's Board of Trustees (the Board) has designated the Fund's investment adviser as administrator of the Program. The Fidelity advisers have established a Liquidity Risk Management Committee (the LRM Committee) to manage the Program for each of the Fidelity Funds. The LRM Committee monitors the adequacy and effectiveness of implementation of the Program and on a periodic basis assesses each Fund's liquidity risk based on a variety of factors including (1) the Fund's investment strategy, (2) portfolio liquidity and cash flow projections during normal and reasonably foreseeable stressed conditions, (3) shareholder redemptions, (4) borrowings and other funding sources and (5) in the case of exchange-traded funds, certain additional factors including the effect of the Fund's prices and spreads, market participants, and basket compositions on the overall liquidity of the Fund's portfolio, as applicable.
In accordance with the Program, each of the Fund's portfolio investments is classified into one of four liquidity categories described below based on a determination of a reasonable expectation for how long it would take to convert the investment to cash (or sell or dispose of the investment) without significantly changing its market value.
- Highly liquid investments - cash or convertible to cash within three business days or less
- Moderately liquid investments - convertible to cash in three to seven calendar days
- Less liquid investments - can be sold or disposed of, but not settled, within seven calendar days
- Illiquid investments - cannot be sold or disposed of within seven calendar days
Liquidity classification determinations take into account a variety of factors including various market, trading and investment-specific considerations, as well as market depth, and generally utilize analysis from a third-party liquidity metrics service.
The Liquidity Rule places a 15% limit on a fund's illiquid investments and requires funds that do not primarily hold assets that are highly liquid investments to determine and maintain a minimum percentage of the fund's net assets to be invested in highly liquid investments (highly liquid investment minimum or HLIM). The Program includes provisions reasonably designed to comply with the 15% limit on illiquid investments and for determining, periodically reviewing and complying with the HLIM requirement as applicable.
At a recent meeting of the Fund's Board of Trustees, the LRM Committee provided a written report to the Board pertaining to the operation, adequacy, and effectiveness of implementation of the Program for the annual period from December 1, 2020 through November 30, 2021. The report concluded that the Program has been implemented and is operating effectively and is reasonably designed to assess and manage the Fund's liquidity risk.
1.802376.118
SDI-SANN-0722
Item 2.
Code of Ethics
Not applicable.
Item 3.
Audit Committee Financial Expert
Not applicable.
Item 4.
Principal Accountant Fees and Services
Not applicable.
Item 5.
Audit Committee of Listed Registrants
Not applicable.
Item 6.
Investments
(a)
Not applicable.
(b)
Not applicable
Item 7.
Disclosure of Proxy Voting Policies and Procedures for Closed-End Management Investment Companies
Not applicable.
Item 8.
Portfolio Managers of Closed-End Management Investment Companies
Not applicable.
Item 9.
Purchase of Equity Securities by Closed-End Management Investment Company and Affiliated Purchasers
Not applicable.
Item 10.
Submission of Matters to a Vote of Security Holders
There were no material changes to the procedures by which shareholders may recommend nominees to the Fidelity Salem Street Trust’s Board of Trustees.
Item 11.
Controls and Procedures
(a)(i) The President and Treasurer and the Chief Financial Officer have concluded that the Fidelity Salem Street Trust’s (the “Trust”) disclosure controls and procedures (as defined in Rule 30a-3(c) under the Investment Company Act) provide reasonable
assurances that material information relating to the Trust is made known to them by the appropriate persons, based on their evaluation of these controls and procedures as of a date within 90 days of the filing date of this report.
(a)(ii) There was no change in the Trust’s internal control over financial reporting (as defined in Rule 30a-3(d) under the Investment Company Act) that occurred during the period covered by this report that has materially affected, or is reasonably likely to materially affect, the Trust’s internal control over financial reporting.
Item 12.
Disclosure of Securities Lending Activities for Closed-End Management
Investment Companies
Not applicable.
Item 13.
Exhibits
SIGNATURES
Pursuant to the requirements of the Securities Exchange Act of 1934 and the Investment Company Act of 1940, the registrant has duly caused this report to be signed on its behalf by the undersigned, thereunto duly authorized.
Fidelity Salem Street Trust
| |
By: | /s/Laura M. Del Prato |
| Laura M. Del Prato |
| President and Treasurer |
|
|
Date: | July 21, 2022 |
Pursuant to the requirements of the Securities Exchange Act of 1934 and the Investment Company Act of 1940, this report has been signed below by the following persons on behalf of the registrant and in the capacities and on the dates indicated.
| |
By: | /s/Laura M. Del Prato |
| Laura M. Del Prato |
| President and Treasurer |
|
|
Date: | July 21, 2022 |
| |
By: | /s/John J. Burke III |
| John J. Burke III |
| Chief Financial Officer |
|
|
Date: | July 21, 2022 |