UNITED STATES
SECURITIES AND EXCHANGE COMMISSION
Washington, D.C. 20549
FORM N-CSR
CERTIFIED SHAREHOLDER REPORT OF REGISTERED
MANAGEMENT INVESTMENT COMPANIES
Investment Company Act file number 811-02105
Fidelity Salem Street Trust
(Exact name of registrant as specified in charter)
245 Summer St., Boston, MA 02210
(Address of principal executive offices) (Zip code)
Cynthia Lo Bessette, Secretary
245 Summer St.
Boston, Massachusetts 02210
(Name and address of agent for service)
Registrant's telephone number, including area code:
617-563-7000
Date of fiscal year end: | March 31 |
Date of reporting period: | September 30, 2022 |
Item 1.
Reports to Stockholders


Contents
Board Approval of Investment Advisory Contracts and Management Fees |
| Current 7-Day Yields | ||
| Fidelity® SAI Municipal Money Market Fund | 2.05% | |
Yield refers to the income paid by the Fund over a given period. Yield for money market funds is usually for seven-day periods, as it is here, though it is expressed as an annual percentage rate. Past performance is no guarantee of future results. Yield will vary and it's possible to lose money investing in the Fund. A portion of the Fund's expenses was reimbursed and/or waived. Absent such reimbursements and/or waivers the yield for the period ending September 30, 2022, the most recent period shown in the table, would have been 2.04% for Fidelity® SAI Municipal Money Market Fund. | ||
| Effective Maturity Diversification (% of Fund's Investments) | ||
| Days | ||
| 1 - 7 | 88.1 | |
| 8 - 30 | 2.8 | |
| 31 - 60 | 4.3 | |
| 61 - 90 | 0.8 | |
| 91 - 180 | 1.3 | |
| > 180 | 2.7 | |
| Effective maturity is determined in accordance with the requirements of Rule 2a-7 under the Investment Company Act of 1940. | ||
Asset Allocation (% of Fund's net assets) |
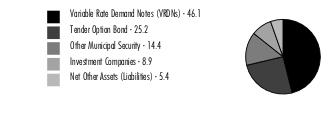 |
| Variable Rate Demand Note - 46.1% | |||
Principal Amount (a) | Value ($) | ||
| Alabama - 3.6% | |||
| Columbia Indl. Dev. Board Poll. Cont. Rev. (Alabama Pwr. Co. Proj.) Series 2014 B, 2.9% 10/3/22, VRDN (b) | 2,700,000 | 2,700,000 | |
| West Jefferson Indl. Dev. Series 2008, 2.58% 10/7/22, VRDN (b) | 500,000 | 500,000 | |
| West Jefferson Indl. Dev. Board Solid Waste Disp. Rev. (Alabama Pwr. Co. Miller Plant Proj.) Series 2008, 2.98% 10/3/22, VRDN (b)(c) | 2,140,000 | 2,140,000 | |
| Wilsonville Indl. Dev. Board Poll. Cont. Rev. (Alabama Pwr. Co. Gaston Plant Proj.) Series 2008, 2.98% 10/3/22, VRDN (b)(c) | 5,820,000 | 5,820,000 | |
TOTAL ALABAMA | 11,160,000 | ||
| Arizona - 0.3% | |||
| Maricopa County Poll. Cont. Rev. Series 2009 B, 2.64% 10/7/22, VRDN (b) | 800,000 | 800,000 | |
| Arkansas - 0.2% | |||
| Blytheville Indl. Dev. Rev. (Nucor Corp. Proj.) Series 2002, 2.77% 10/7/22, VRDN (b)(c) | 500,000 | 500,000 | |
| Connecticut - 0.3% | |||
| Connecticut Hsg. Fin. Auth. Series 2019 A, 2.5% 10/7/22 (Liquidity Facility U.S. Bank NA, Cincinnati), VRDN (b)(c) | 980,000 | 980,000 | |
| Delaware - 1.9% | |||
| Delaware Econ. Dev. Auth. Rev. (Delmarva Pwr. & Lt. Co. Proj.): | |||
| Series 1993 C, 2.62% 10/7/22, VRDN (b) | 200,000 | 200,000 | |
| Series 1994, 2.98% 10/3/22, VRDN (b)(c) | 5,400,000 | 5,400,000 | |
| Series 1999 B, 2.55% 10/7/22, VRDN (b)(c) | 400,000 | 400,000 | |
TOTAL DELAWARE | 6,000,000 | ||
| District Of Columbia - 0.1% | |||
| Metropolitan Washington DC Arpts. Auth. Sys. Rev. Series 2011 A, 2.55% 10/7/22, LOC TD Banknorth, NA, VRDN (b)(c) | 300,000 | 300,000 | |
| Florida - 0.8% | |||
| Broward County Indl. Dev. Rev. (Florida Pwr. & Lt. Co. Proj.) Series 2018 B, 2.95% 10/3/22, VRDN (b)(c) | 2,530,000 | 2,530,000 | |
| Georgia - 2.1% | |||
| Burke County Indl. Dev. Auth. Poll. Cont. Rev. (Georgia Pwr. Co. Plant Vogtle Proj.) Series 2018, 3.05% 10/3/22, VRDN (b) | 500,000 | 500,000 | |
| Effingham County Indl. Dev. Auth. Poll Cont. Series 2003, 2.97% 10/3/22, VRDN (b) | 1,300,000 | 1,300,000 | |
| Heard County Dev. Auth. Poll. Cont. Rev. Series 2007, 2.99% 10/3/22, VRDN (b)(c) | 2,900,000 | 2,900,000 | |
| Monroe County Dev. Auth. Rev. (Florida Pwr. & Lt. Co. Proj.) Series 2019, 2.85% 10/3/22, VRDN (b)(c) | 1,760,000 | 1,760,000 | |
TOTAL GEORGIA | 6,460,000 | ||
| Indiana - 2.0% | |||
| Indiana Dev. Fin. Auth. Envir. Rev. (PSI Energy Proj.): | |||
| Series 2003 A, 2.49% 10/7/22, VRDN (b)(c) | 3,500,000 | 3,500,000 | |
| Series 2003 B, 2.7% 10/7/22, VRDN (b)(c) | 2,750,000 | 2,750,000 | |
TOTAL INDIANA | 6,250,000 | ||
| Iowa - 2.6% | |||
| Iowa Fin. Auth. Solid Disp. Waste Rev. (MidAmerican Energy Co. Proj.) Series 2016 B, 2.5% 10/7/22, VRDN (b)(c) | 7,900,000 | 7,900,000 | |
| Kansas - 0.5% | |||
| Burlington Envir. Impt. Rev. (Kansas City Pwr. and Lt. Co. Proj.): | |||
| Series 2007 A, 2.58% 10/7/22, VRDN (b) | 100,000 | 100,000 | |
| Series 2007 B, 2.58% 10/7/22, VRDN (b) | 500,000 | 500,000 | |
| Wamego Kansas Poll. Cont. Rfdg. Rev. (Western Resources, Inc. Proj.) Series 1994, 2.55% 10/7/22, VRDN (b) | 1,000,000 | 1,000,000 | |
TOTAL KANSAS | 1,600,000 | ||
| Kentucky - 2.9% | |||
| Daviess County Exempt Facilities Rev. (Kimberly-Clark Tissue Co. Proj.) Series 1999, 2.55% 10/7/22 (Kimberly-Clark Corp. Guaranteed), VRDN (b)(c) | 1,800,000 | 1,800,000 | |
| Daviess County Solid Waste Disp. Facilities Rev. (Scott Paper Co. Proj.) Series 1993 A, 2.55% 10/7/22 (Kimberly-Clark Corp. Guaranteed), VRDN (b)(c) | 7,200,000 | 7,200,000 | |
TOTAL KENTUCKY | 9,000,000 | ||
| Louisiana - 2.1% | |||
| Louisiana Pub. Facilities Auth. Rev. (Air Products & Chemicals, Inc. Proj.): | |||
| Series 2002, 2.52% 10/7/22, VRDN (b)(c) | 1,000,000 | 1,000,000 | |
| Series 2003, 2.52% 10/7/22, VRDN (b)(c) | 2,230,000 | 2,230,000 | |
| Saint James Parish Gen. Oblig. (Nucor Steel Louisiana LLC Proj.) Series 2010 B1, 2.77% 10/7/22, VRDN (b) | 3,200,000 | 3,200,000 | |
TOTAL LOUISIANA | 6,430,000 | ||
| Michigan - 0.1% | |||
| Michigan Strategic Fund Ltd. Oblig. Rev. (The Kroger Co. Recovery Zone Facilities Bond Proj.) Series 2010, 2.5% 10/7/22, LOC Bank of Nova Scotia, VRDN (b) | 400,000 | 400,000 | |
| Mississippi - 3.2% | |||
| Mississippi Bus. Fin. Corp. Solid Waste Disp. Rev. (Waste Mgmt., Inc. Proj.) Series 2003, 2.35% 10/7/22, LOC Bank of America NA, VRDN (b)(c) | 10,000,000 | 10,000,000 | |
| Nebraska - 1.4% | |||
| Nebraska Invt. Fin. Auth. Single Family Hsg. Rev.: | |||
| Series 2013 F, 2.35% 10/7/22 (Liquidity Facility Fed. Home Ln. Bank Topeka), VRDN (b)(c) | 3,180,000 | 3,180,000 | |
| Series 2016 B, 2.35% 10/7/22 (Liquidity Facility Fed. Home Ln. Bank Topeka), VRDN (b)(c) | 500,000 | 500,000 | |
| Series 2016 D, 2.35% 10/7/22 (Liquidity Facility Fed. Home Ln. Bank Topeka), VRDN (b)(c) | 500,000 | 500,000 | |
| Stanton County Indl. Dev. Rev. Series 1998, 2.9% 10/7/22, VRDN (b)(c) | 200,000 | 200,000 | |
TOTAL NEBRASKA | 4,380,000 | ||
| Nevada - 3.1% | |||
| Clark County Arpt. Rev.: | |||
| Series 2008 C1, 2.59% 10/7/22, LOC Bank of America NA, VRDN (b)(c) | 2,000,000 | 2,000,000 | |
| Series 2008 C2, 2.35% 10/7/22, LOC State Street Bank & Trust Co., Boston, VRDN (b)(c) | 6,950,000 | 6,950,000 | |
| Series 2008 C3, 2.59% 10/7/22, LOC Sumitomo Mitsui Banking Corp., VRDN (b)(c) | 500,000 | 500,000 | |
TOTAL NEVADA | 9,450,000 | ||
| New York - 3.4% | |||
| FNMA: | |||
| New York City Hsg. Dev. Corp. Multi-family Rental Hsg. Rev. (Brittany Dev. Proj.) Series A, 2.48% 10/7/22, LOC Fannie Mae, VRDN (b)(c) | 2,500,000 | 2,500,000 | |
| New York Hsg. Fin. Agcy. Rev. (West 23rd Street Hsg. Proj.) Series 2002 A, 2.63% 10/7/22, LOC Fannie Mae, VRDN (b)(c) | 8,100,000 | 8,100,000 | |
TOTAL NEW YORK | 10,600,000 | ||
| North Carolina - 0.2% | |||
| Cumberland County Indl. Facilities & Poll. Cont. Fing. Auth. (Cargill, Inc. Proj.) Series 2022, 2.54% 10/7/22, VRDN (b)(c) | 600,000 | 600,000 | |
| Ohio - 0.3% | |||
| Cuyahoga County Health Care Facilities Rev. (The A.M. McGregor Home Proj.) Series 2014, 2.54% 10/7/22, LOC Northern Trust Co., VRDN (b) | 100,000 | 100,000 | |
| Ohio Hsg. Fin. Agcy. Residential Mtg. Rev. Series 2016 H, 2.59% 10/7/22 (Liquidity Facility Fed. Home Ln. Bank, Cincinnati), VRDN (b)(c) | 715,000 | 715,000 | |
TOTAL OHIO | 815,000 | ||
| Tennessee - 2.1% | |||
| Loudon County Indl. Dev. Board Exempt Facilities Rev. (Kimberly-Clark Corp. Proj.) Series 1999, 2.55% 10/7/22, VRDN (b)(c) | 6,400,000 | 6,400,000 | |
| Texas - 3.2% | |||
| Port Arthur Navigation District Indl. Dev. Corp. Exempt Facilities Rev. (Air Products Proj.): | |||
| Series 2001, 2.52% 10/7/22, VRDN (b)(c) | 800,000 | 800,000 | |
| Series 2002, 2.52% 10/7/22, VRDN (b)(c) | 400,000 | 400,000 | |
| Series 2010 A, 2.61% 10/7/22 (TotalEnergies SE Guaranteed), VRDN (b) | 2,100,000 | 2,100,000 | |
| Texas Gen. Oblig.: | |||
| (Texas Veterans Land Board Proj.) Series 2017, 2.6% 10/7/22 (Liquidity Facility Sumitomo Mitsui Banking Corp.), VRDN (b) | 600,000 | 600,000 | |
| Series 2001 A2, 2.6% 10/7/22 (Liquidity Facility State Street Bank & Trust Co., Boston), VRDN (b)(c) | 2,145,000 | 2,145,000 | |
| Series 2003 A, 2.6% 10/7/22 (Liquidity Facility State Street Bank & Trust Co., Boston), VRDN (b)(c) | 500,000 | 500,000 | |
| Series 2006 D, 2.6% 10/7/22 (Liquidity Facility State Street Bank & Trust Co., Boston), VRDN (b)(c) | 725,000 | 725,000 | |
| Series 2007 B, 2.6% 10/7/22 (Liquidity Facility State Street Bank & Trust Co., Boston), VRDN (b)(c) | 2,200,000 | 2,200,000 | |
| Series 2019, 2.4% 10/7/22 (Liquidity Facility JPMorgan Chase Bank), VRDN (b) | 250,000 | 250,000 | |
TOTAL TEXAS | 9,720,000 | ||
| Washington - 2.2% | |||
| Port of Seattle Rev. Series 2008, 2.45% 10/7/22, LOC MUFG Bank Ltd., VRDN (b)(c) | 6,800,000 | 6,800,000 | |
| West Virginia - 0.7% | |||
| West Virginia Econ. Dev. Auth. Solid Waste Disp. Facilities Rev.: | |||
| (Appalachian Pwr. Co. Amos Proj.) Series 2008 B, 2.52% 10/7/22, VRDN (b)(c) | 1,000,000 | 1,000,000 | |
| (Appalachian Pwr. Co.- Mountaineer Proj.) Series 2008 A, 2.64% 10/7/22, VRDN (b)(c) | 1,000,000 | 1,000,000 | |
| West Virginia Hosp. Fin. Auth. Hosp. Rev. Series A, 2.53% 10/7/22, LOC Truist Bank, VRDN (b) | 100,000 | 100,000 | |
TOTAL WEST VIRGINIA | 2,100,000 | ||
| Wisconsin - 1.6% | |||
| Green Bay Redev. Auth. (Green Bay Packaging, Inc. Proj.) Series 2019, 2.5% 10/7/22, LOC Wells Fargo Bank NA, VRDN (b)(c)(d) | 4,900,000 | 4,900,000 | |
| Wyoming - 5.2% | |||
| Converse County Envir. Impt. Rev. Series 1995, 2.7% 10/7/22, VRDN (b)(c) | 1,700,000 | 1,700,000 | |
| Laramie County Indl. Dev. Rev. (Cheyenne Lt., Fuel & Pwr. Co. Proj.) Series 2009 A, 2.48% 10/7/22, LOC Wells Fargo Bank NA, VRDN (b)(c) | 10,000,000 | 10,000,000 | |
| Lincoln County Envir. (PacifiCorp Proj.) Series 1995, 2.5% 10/7/22, VRDN (b)(c) | 4,300,000 | 4,300,000 | |
TOTAL WYOMING | 16,000,000 | ||
| TOTAL VARIABLE RATE DEMAND NOTE (Cost $142,075,000) | 142,075,000 | ||
| Tender Option Bond - 25.2% | |||
Principal Amount (a) | Value ($) | ||
| Arizona - 0.2% | |||
| Arizona Indl. Dev. Auth. Hosp. Rev. Participating VRDN: | |||
| Series 20 XF 09 90, 2.51% 10/7/22 (Liquidity Facility Toronto-Dominion Bank) (b)(e)(f) | 80,000 | 80,000 | |
| Series XM 10 13, 2.58% 10/7/22 (Liquidity Facility JPMorgan Chase Bank) (b)(e)(f) | 100,000 | 100,000 | |
| Phoenix Civic Impt. Board Arpt. Rev. Participating VRDN Series Floaters ZF 27 58, 2.56% 10/7/22 (Liquidity Facility Barclays Bank PLC) (b)(c)(e)(f) | 400,000 | 400,000 | |
TOTAL ARIZONA | 580,000 | ||
| California - 1.5% | |||
| Los Angeles Dept. Arpt. Rev. Participating VRDN Series Floaters XG 02 32, 2.5% 10/7/22 (Liquidity Facility Morgan Stanley Bank, West Valley City Utah) (b)(c)(e)(f) | 1,500,000 | 1,500,000 | |
| San Francisco City & County Arpts. Commission Int'l. Arpt. Rev. Participating VRDN Series YX 11 31, 2.5% 10/7/22 (Liquidity Facility Barclays Bank PLC) (b)(c)(e)(f) | 3,000,000 | 3,000,000 | |
TOTAL CALIFORNIA | 4,500,000 | ||
| Colorado - 1.8% | |||
| Colorado Health Facilities Auth. Rev. Bonds Participating VRDN Series 2022 004, 2.61% 11/14/22 (Liquidity Facility Barclays Bank PLC) (b)(e)(f) | 1,300,000 | 1,300,000 | |
| Denver City & County Arpt. Rev.: | |||
| Bonds Series G-114, 2.71%, tender 12/1/22 (Liquidity Facility Royal Bank of Canada) (b)(c)(e)(f)(g) | 200,000 | 200,000 | |
| Participating VRDN: | |||
Series Floaters XG 01 96, 2.59% 10/7/22 (Liquidity Facility Deutsche Bank AG New York Branch) (b)(c)(e)(f) | 2,100,000 | 2,100,000 | |
Series XG 03 73, 2.51% 10/7/22 (Liquidity Facility Barclays Bank PLC) (b)(c)(e)(f) | 2,000,000 | 2,000,000 | |
TOTAL COLORADO | 5,600,000 | ||
| Connecticut - 1.3% | |||
| Connecticut Gen. Oblig. Participating VRDN Series Floaters 016, 2.61% 11/14/22 (Liquidity Facility Barclays Bank PLC) (b)(e)(f) | 3,000,000 | 3,000,000 | |
| Connecticut Spl. Tax Oblig. Trans. Infrastructure Rev.: | |||
| Bonds Series Floaters G 110, 2.64%, tender 4/3/23 (Liquidity Facility Royal Bank of Canada) (b)(e)(f)(g) | 500,000 | 500,000 | |
| Participating VRDN Series ROC II R 14073, 2.52% 10/7/22 (Liquidity Facility Citibank NA) (b)(e)(f) | 400,000 | 400,000 | |
TOTAL CONNECTICUT | 3,900,000 | ||
| District Of Columbia - 0.2% | |||
| Metropolitan Washington Arpts. Auth. Dulles Toll Road Rev. Participating VRDN Series XG 02 67, 2.51% 10/7/22 (Liquidity Facility Bank of America NA) (b)(e)(f) | 265,000 | 265,000 | |
| Metropolitan Washington DC Arpts. Auth. Sys. Rev. Participating VRDN Series Floaters XF 06 94, 2.58% 10/7/22 (Liquidity Facility Bank of America NA) (b)(c)(e)(f) | 215,000 | 215,000 | |
TOTAL DISTRICT OF COLUMBIA | 480,000 | ||
| Florida - 2.1% | |||
| Broward County Arpt. Sys. Rev. Participating VRDN Series Floaters XL 00 88, 2.51% 10/7/22 (Liquidity Facility Barclays Bank PLC) (b)(c)(e)(f) | 2,930,000 | 2,930,000 | |
| Broward County Port Facilities Rev. Participating VRDN: | |||
| Series XF 08 17, 2.53% 10/7/22 (Liquidity Facility Royal Bank of Canada) (b)(c)(e)(f) | 195,000 | 195,000 | |
| Series XF 09 52, 2.52% 10/7/22 (Liquidity Facility Toronto-Dominion Bank) (b)(c)(e)(f) | 75,000 | 75,000 | |
| Escambia County Health Facilities Auth. Health Facilities Rev. Participating VRDN Series XG 02 81, 2.5% 10/7/22 (Liquidity Facility Bank of America NA) (b)(e)(f) | 200,000 | 200,000 | |
| Greater Orlando Aviation Auth. Arpt. Facilities Rev.: | |||
| Bonds Series Floaters G 25, 2.71%, tender 4/3/23 (Liquidity Facility Royal Bank of Canada) (b)(c)(e)(f)(g) | 200,000 | 200,000 | |
| Participating VRDN: | |||
Series XM 08 90, 2.51% 10/7/22 (Liquidity Facility JPMorgan Chase Bank) (b)(c)(e)(f) | 500,000 | 500,000 | |
Series XM 08 96, 2.51% 10/7/22 (Liquidity Facility JPMorgan Chase Bank) (b)(c)(e)(f) | 200,000 | 200,000 | |
Series ZF 08 22, 2.55% 10/7/22 (Liquidity Facility Bank of America NA) (b)(c)(e)(f) | 300,000 | 300,000 | |
| Lee County Arpt. Rev. Participating VRDN Series XF 11 26, 2.53% 10/7/22 (Liquidity Facility Deutsche Bank AG New York Branch) (b)(c)(e)(f) | 300,000 | 300,000 | |
| Miami-Dade County Expressway Auth. Participating VRDN Series XG 00 99, 2.52% 10/7/22 (Liquidity Facility Deutsche Bank AG New York Branch) (b)(e)(f) | 300,000 | 300,000 | |
| Orlando Health Participating VRDN Series 026, 2.61% 11/14/22 (Liquidity Facility Barclays Bank PLC) (b)(e)(f) | 100,000 | 100,000 | |
| RIB Floater Trust Various States Participating VRDN Series 2022 025, 2.64% 11/14/22 (Liquidity Facility Barclays Bank PLC) (b)(c)(e)(f) | 200,000 | 200,000 | |
| South Miami Health Facilities Auth. Hosp. Rev. Participating VRDN Series XF 25 23, 2.53% 10/7/22 (Liquidity Facility Barclays Bank PLC) (b)(e)(f) | 700,000 | 700,000 | |
| Tampa-Hillsborough County Expressway Auth. Rev. Bonds Series G-113, 2.66%, tender 1/3/23 (Liquidity Facility Royal Bank of Canada) (b)(e)(f)(g) | 300,000 | 300,000 | |
TOTAL FLORIDA | 6,500,000 | ||
| Georgia - 0.2% | |||
| Fulton County Dev. Auth. Rev. Participating VRDN Series XL 02 68, 2.56% 10/7/22 (Liquidity Facility Bank of America NA) (b)(e)(f) | 100,000 | 100,000 | |
| Georgia Muni. Elec. Auth. Pwr. Rev. Participating VRDN Series XF 08 23, 2.51% 10/7/22 (Liquidity Facility Bank of America NA) (b)(e)(f) | 75,000 | 75,000 | |
| Main Street Natural Gas, Inc. Participating VRDN Series 2022 ZL 03 05, 2.51% 10/7/22 (Liquidity Facility Royal Bank of Canada) (b)(e)(f) | 500,000 | 500,000 | |
TOTAL GEORGIA | 675,000 | ||
| Hawaii - 0.4% | |||
| Hawaii Arpts. Sys. Rev. Participating VRDN Series XX 12 17, 2.51% 10/7/22 (Liquidity Facility Barclays Bank PLC) (b)(c)(e)(f) | 900,000 | 900,000 | |
| Hawaii Dept. of Budget & Fin. Spl. Purp. Rev. Participating VRDN Series Floaters XM 06 19, 2.51% 10/7/22 (Liquidity Facility Barclays Bank PLC) (b)(c)(e)(f) | 300,000 | 300,000 | |
TOTAL HAWAII | 1,200,000 | ||
| Illinois - 3.8% | |||
| Chicago Gen. Oblig. Participating VRDN: | |||
| Series E 151, 2.5% 10/7/22 (Liquidity Facility Royal Bank of Canada) (b)(e)(f) | 1,600,000 | 1,600,000 | |
| Series Floaters XL 01 05, 2.5% 10/7/22 (Liquidity Facility Barclays Bank PLC) (b)(e)(f) | 300,000 | 300,000 | |
| Chicago O'Hare Int'l. Arpt. Rev. Participating VRDN: | |||
| Series Floaters XM 06 86, 2.55% 10/7/22 (Liquidity Facility Bank of America NA) (b)(c)(e)(f) | 200,000 | 200,000 | |
| Series XF 28 66, 2.51% 10/7/22 (Liquidity Facility Barclays Bank PLC) (b)(c)(e)(f) | 100,000 | 100,000 | |
| Illinois Fin. Auth. Participating VRDN Series XF 09 80, 2.51% 10/7/22 (Liquidity Facility Toronto-Dominion Bank) (b)(e)(f) | 470,000 | 470,000 | |
| Illinois Fin. Auth. Rev. Participating VRDN: | |||
| Series Floaters 017, 2.61% 11/14/22 (Liquidity Facility Barclays Bank PLC) (b)(e)(f) | 645,000 | 645,000 | |
| Series XF 11 47, 2.52% 10/7/22 (Liquidity Facility Deutsche Bank AG New York Branch) (b)(e)(f) | 200,000 | 200,000 | |
| Illinois Gen. Oblig. Participating VRDN: | |||
| Series Floaters XF 10 13, 2.5% 10/7/22 (Liquidity Facility Barclays Bank PLC) (b)(e)(f) | 400,000 | 400,000 | |
| Series Floaters XX 10 81, 2.5% 10/7/22 (Liquidity Facility Barclays Bank PLC) (b)(e)(f) | 500,000 | 500,000 | |
| Series Floaters YX 10 72, 2.5% 10/7/22 (Liquidity Facility Barclays Bank PLC) (b)(e)(f) | 100,000 | 100,000 | |
| Series YX 11 50, 2.5% 10/7/22 (Liquidity Facility Barclays Bank PLC) (b)(e)(f) | 300,000 | 300,000 | |
| Illinois Toll Hwy. Auth. Toll Hwy. Rev. Participating VRDN: | |||
| Series 2022 XF 12 88, 2.52% 10/7/22 (Liquidity Facility JPMorgan Chase Bank) (b)(e)(f) | 1,200,000 | 1,200,000 | |
| Series MS 16 XF 2212, 2.51% 10/7/22 (Liquidity Facility Toronto-Dominion Bank) (b)(e)(f) | 5,575,000 | 5,575,000 | |
| Portofino Landings Cmnty. Dev. D Participating VRDN Series XM 09 38, 2.51% 10/7/22 (Liquidity Facility Bank of America NA) (b)(e)(f) | 100,000 | 100,000 | |
TOTAL ILLINOIS | 11,690,000 | ||
| Indiana - 0.3% | |||
| Hamilton County Healthcare Facilities Rev. Participating VRDN Series XF 10 26, 2.52% 10/7/22 (Liquidity Facility Deutsche Bank AG New York Branch) (b)(e)(f) | 1,000,000 | 1,000,000 | |
| Iowa - 0.0% | |||
| Iowa Fin. Auth. Health Facilities Rev. Participating VRDN Series ZF 26 26, 2.5% 10/7/22 (Liquidity Facility Morgan Stanley Bank, West Valley City Utah) (b)(e)(f) | 100,000 | 100,000 | |
| Louisiana - 0.1% | |||
| New Orleans Aviation Board Rev. Participating VRDN Series Floaters XL 00 46, 2.51% 10/7/22 (Liquidity Facility Barclays Bank PLC) (b)(c)(e)(f) | 300,000 | 300,000 | |
| Maryland - 0.4% | |||
| Maryland Health & Higher Edl. Facilities Auth. Rev. Participating VRDN Series XF 10 21, 2.52% 10/7/22 (Liquidity Facility Deutsche Bank AG New York Branch) (b)(e)(f) | 400,000 | 400,000 | |
| Univ. of Maryland Med. Sys., Participating VRDN Series 2022 031, 2.61% 11/14/22 (Liquidity Facility Barclays Bank PLC) (b)(e)(f) | 1,000,000 | 1,000,000 | |
TOTAL MARYLAND | 1,400,000 | ||
| Michigan - 0.1% | |||
| Mclaren Health Care Corp. Participating VRDN Series XL 02 71, 2.56% 10/7/22 (Liquidity Facility Bank of America NA) (b)(e)(f) | 100,000 | 100,000 | |
| Monroe Mich Pub. Schools Participating VRDN Series XL 01 46, 2.58% 10/7/22 (Liquidity Facility JPMorgan Chase Bank) (b)(e)(f) | 100,000 | 100,000 | |
TOTAL MICHIGAN | 200,000 | ||
| Mississippi - 0.0% | |||
| Mississippi Bus. Fin. Corp. Rev. Participating VRDN Series 2021 XF 11 05, 2.53% 10/7/22 (Liquidity Facility Deutsche Bank AG New York Branch) (b)(e)(f) | 100,000 | 100,000 | |
| Missouri - 1.5% | |||
| Kansas City Indl. Dev. Auth. Participating VRDN: | |||
| Series XG 03 96, 2.65% 10/7/22 (Liquidity Facility Deutsche Bank AG New York Branch) (b)(c)(e)(f) | 500,000 | 500,000 | |
| Series XG 04 02, 2.53% 10/7/22 (Liquidity Facility Deutsche Bank AG New York Branch) (b)(c)(e)(f) | 300,000 | 300,000 | |
| Series YX 11 59, 2.51% 10/7/22 (Liquidity Facility Barclays Bank PLC) (b)(c)(e)(f) | 3,330,000 | 3,330,000 | |
| Missouri Health & Edl. Facilities Auth. Edl. Facilities Rev. Participating VRDN Series Floaters XG 01 84, 2.52% 10/7/22 (Liquidity Facility Deutsche Bank AG New York Branch) (b)(e)(f) | 500,000 | 500,000 | |
TOTAL MISSOURI | 4,630,000 | ||
| Nebraska - 0.2% | |||
| Omaha Pub. Pwr. District Elec. Rev. Participating VRDN Series 16 XF1053, 2.52% 10/7/22 (Liquidity Facility Deutsche Bank AG New York Branch) (b)(e)(f) | 600,000 | 600,000 | |
| Nevada - 0.7% | |||
| Las Vegas Convention & Visitors Auth. Participating VRDN Series XF 28 06, 2.5% 10/7/22 (Liquidity Facility Barclays Bank PLC) (b)(e)(f) | 2,205,000 | 2,205,000 | |
| New York - 0.2% | |||
| New York Dorm. Auth. Rev. Bonds Series MS 00 09, 2.56%, tender 10/27/22 (Liquidity Facility Morgan Stanley Bank, West Valley City Utah) (b)(e)(f) | 200,000 | 200,000 | |
| New York Metropolitan Trans. Auth. Rev. Participating VRDN Series RBC E 126, 2.51% 10/7/22 (Liquidity Facility Royal Bank of Canada) (b)(e)(f) | 400,000 | 400,000 | |
TOTAL NEW YORK | 600,000 | ||
| New York And New Jersey - 1.9% | |||
| Port Auth. of New York & New Jersey Participating VRDN: | |||
| Series Floaters XM 06 16, 2.53% 10/7/22 (Liquidity Facility Barclays Bank PLC) (b)(c)(e)(f) | 2,800,000 | 2,800,000 | |
| Series ROC 14086, 2.51% 10/7/22 (Liquidity Facility Citibank NA) (b)(c)(e)(f) | 200,000 | 200,000 | |
| Series XF 09 38, 2.53% 10/7/22 (Liquidity Facility JPMorgan Chase Bank) (b)(c)(e)(f) | 2,800,000 | 2,800,000 | |
TOTAL NEW YORK AND NEW JERSEY | 5,800,000 | ||
| North Carolina - 0.7% | |||
| Greater Asheville Reg'l. Arpt. Auth. Participating VRDN Series XM 10 11, 2.53% 10/7/22 (Liquidity Facility Royal Bank of Canada) (b)(c)(e)(f) | 2,100,000 | 2,100,000 | |
| North Dakota - 0.1% | |||
| Grand Forks Health Care Sys. Rev. Participating VRDN Series XL 02 45, 2.52% 10/7/22 (Liquidity Facility Deutsche Bank AG New York Branch) (b)(e)(f) | 200,000 | 200,000 | |
| Ohio - 0.4% | |||
| Cuyahoga County Ctfs. of Prtn. Participating VRDN Series Floaters XG 02 06, 2.56% 10/7/22 (Liquidity Facility Bank of America NA) (b)(e)(f) | 400,000 | 400,000 | |
| Ohio Hosp. Rev. Participating VRDN: | |||
| Series 002, 2.61% 11/14/22 (Liquidity Facility Barclays Bank PLC) (b)(e)(f) | 200,000 | 200,000 | |
| Series C18, 2.5% 10/7/22 (Liquidity Facility Royal Bank of Canada) (b)(e)(f) | 300,000 | 300,000 | |
| Ohio Univ. Gen. Receipts Athens Bonds Series Floaters G 27, 2.66%, tender 12/1/22 (Liquidity Facility Royal Bank of Canada) (b)(e)(f)(g) | 200,000 | 200,000 | |
TOTAL OHIO | 1,100,000 | ||
| Oklahoma - 0.5% | |||
| Norman Reg'l. Hosp. Auth. Hosp. Rev. Participating VRDN Series XF 28 84, 2.5% 10/7/22 (Liquidity Facility Barclays Bank PLC) (b)(e)(f) | 1,370,000 | 1,370,000 | |
| Oklahoma Dev. Fin. Auth. Health Sys. Rev. Participating VRDN Series Floaters XG 02 10, 2.51% 10/7/22 (Liquidity Facility Bank of America NA) (b)(e)(f) | 100,000 | 100,000 | |
TOTAL OKLAHOMA | 1,470,000 | ||
| Oregon - 0.0% | |||
| Salem Hosp. Facility Auth. Rev. Participating VRDN Series XM 08 13, 2.51% 10/7/22 (Liquidity Facility Royal Bank of Canada) (b)(e)(f) | 100,000 | 100,000 | |
| Pennsylvania - 0.7% | |||
| Geisinger Auth. Health Sys. Rev. Participating VRDN: | |||
| Series Floaters XF 05 43, 2.53% 10/7/22 (Liquidity Facility Royal Bank of Canada) (b)(e)(f) | 185,000 | 185,000 | |
| Series Floaters YX 10 49, 2.54% 10/7/22 (Liquidity Facility Barclays Bank PLC) (b)(e)(f) | 100,000 | 100,000 | |
| Pennsylvania Tpk. Commission Tpk. Rev. Participating VRDN: | |||
| Series BC 22 018, 2.61% 11/14/22 (Liquidity Facility Barclays Bank PLC) (b)(e)(f) | 200,000 | 200,000 | |
| Series XX 10 44, 2.5% 10/7/22 (Liquidity Facility Barclays Bank PLC) (b)(e)(f) | 300,000 | 300,000 | |
| Philadelphia Arpt. Rev. Participating VRDN Series YX 12 11, 2.51% 10/7/22 (Liquidity Facility Barclays Bank PLC) (b)(c)(e)(f) | 1,300,000 | 1,300,000 | |
TOTAL PENNSYLVANIA | 2,085,000 | ||
| South Carolina - 0.1% | |||
| South Carolina Ports Auth. Ports Rev. Participating VRDN: | |||
| Series XF 08 20, 2.54% 10/7/22 (Liquidity Facility Bank of America NA) (b)(c)(e)(f) | 100,000 | 100,000 | |
| Series ZF 08 24, 2.54% 10/7/22 (Liquidity Facility Bank of America NA) (b)(c)(e)(f) | 100,000 | 100,000 | |
| South Carolina Trans. Infrastructure Bank Rev. Bonds Series Floaters G 109, 2.66%, tender 4/3/23 (Liquidity Facility Royal Bank of Canada) (b)(e)(f)(g) | 100,000 | 100,000 | |
TOTAL SOUTH CAROLINA | 300,000 | ||
| Tennessee - 1.3% | |||
| Metropolitan Nashville Arpt. Auth. Rev. Participating VRDN: | |||
| Series XG 02 68, 2.33% 10/7/22 (Liquidity Facility Bank of America NA) (b)(c)(e)(f) | 4,045,000 | 4,045,000 | |
| Series YX 11 39, 2.51% 10/7/22 (Liquidity Facility Barclays Bank PLC) (b)(c)(e)(f) | 100,000 | 100,000 | |
TOTAL TENNESSEE | 4,145,000 | ||
| Texas - 0.5% | |||
| Alamo Cmnty. College District Rev. Bonds Series G-111, 2.66%, tender 5/1/23 (Liquidity Facility Royal Bank of Canada) (b)(e)(f)(g) | 200,000 | 200,000 | |
| Austin Arpt. Sys. Rev. Participating VRDN Series YX 11 99, 2.51% 10/7/22 (Liquidity Facility Barclays Bank PLC) (b)(c)(e)(f) | 700,000 | 700,000 | |
| Memorial Hermann Hosp. Sys. Participating VRDN Series XF 11 40, 2.52% 10/7/22 (Liquidity Facility Deutsche Bank AG New York Branch) (b)(e)(f) | 200,000 | 200,000 | |
| North Ft. Bend Wtr. Auth. Participating VRDN Series XF 08 16, 2.56% 10/7/22 (Liquidity Facility JPMorgan Chase Bank) (b)(e)(f) | 80,000 | 80,000 | |
| Tarrant County Cultural Ed. Facilities Fin. Corp. Hosp. Rev. Participating VRDN Series XG 02 78, 2.5% 10/7/22 (Liquidity Facility Bank of America NA) (b)(e)(f) | 100,000 | 100,000 | |
| Tender Option Bond Trust Receipts Bonds Series 2022 MS 00 10, 2.06%, tender 12/1/22 (Liquidity Facility Morgan Stanley Bank, West Valley City Utah) (b)(e)(f) | 400,000 | 400,000 | |
TOTAL TEXAS | 1,680,000 | ||
| Virginia - 0.1% | |||
| Virginia Pub. Bldg. Auth. Pub. Facilities Rev. Bonds Series Floaters G 40, 2.66%, tender 2/1/23 (Liquidity Facility Royal Bank of Canada) (b)(e)(f)(g) | 100,000 | 100,000 | |
| Virginia Small Bus. Fing. Auth. Health Care Facilities Rev. Participating VRDN: | |||
| Series XF 09 26, 2.61% 10/7/22 (Liquidity Facility JPMorgan Chase Bank) (b)(e)(f) | 100,000 | 100,000 | |
| Series ZF 09 16, 2.61% 10/7/22 (Liquidity Facility JPMorgan Chase Bank) (b)(e)(f) | 75,000 | 75,000 | |
TOTAL VIRGINIA | 275,000 | ||
| Washington - 3.9% | |||
| Port of Seattle Rev. Participating VRDN: | |||
| Series 2022 ZL 03 16, 2.53% 10/7/22 (Liquidity Facility Barclays Bank PLC) (b)(c)(e)(f) | 400,000 | 400,000 | |
| Series Floaters XM 06 65, 2.56% 10/7/22 (Liquidity Facility JPMorgan Chase Bank) (b)(c)(e)(f) | 500,000 | 500,000 | |
| Series Floaters ZM 06 69, 2.56% 10/7/22 (Liquidity Facility Morgan Stanley Bank, West Valley City Utah) (b)(c)(e)(f) | 300,000 | 300,000 | |
| Series XF 13 71, 2.58% 10/7/22 (Liquidity Facility JPMorgan Chase Bank) (b)(c)(e)(f) | 300,000 | 300,000 | |
| Series XF 26 30, 2.55% 10/7/22 (Liquidity Facility Deutsche Bank AG New York Branch) (b)(c)(e)(f) | 300,000 | 300,000 | |
| Series XM 08 75, 2.56% 10/7/22 (Liquidity Facility JPMorgan Chase Bank) (b)(c)(e)(f) | 100,000 | 100,000 | |
| Port of Tacoma Rev. Participating VRDN Series Floaters XF 06 58, 2.54% 10/7/22 (Liquidity Facility Bank of America NA) (b)(c)(e)(f) | 200,000 | 200,000 | |
| Washington Convention Ctr. Pub. Facilities Participating VRDN: | |||
| Series Floaters XM 06 80, 2.5% 10/7/22 (Liquidity Facility Barclays Bank PLC) (b)(e)(f) | 7,200,000 | 7,200,000 | |
| Series XG 02 87, 2.5% 10/7/22 (Liquidity Facility Barclays Bank PLC) (b)(e)(f) | 2,100,000 | 2,100,000 | |
| Series XG 02 92, 2.5% 10/7/22 (Liquidity Facility Barclays Bank PLC) (b)(e)(f) | 480,000 | 480,000 | |
| Washington Health Care Facilities Auth. Rev. Participating VRDN Series YX 12 10, 2.56% 10/7/22 (Liquidity Facility Barclays Bank PLC) (b)(e)(f) | 200,000 | 200,000 | |
| Washington Higher Ed. Facilities Auth. Rev. Participating VRDN Series XG 02 74, 2.51% 10/7/22 (Liquidity Facility Bank of America NA) (b)(e)(f) | 65,000 | 65,000 | |
TOTAL WASHINGTON | 12,145,000 | ||
| TOTAL TENDER OPTION BOND (Cost $77,660,000) | 77,660,000 | ||
| Other Municipal Security - 14.4% | |||
Principal Amount (a) | Value ($) | ||
| Guam - 0.3% | |||
| Guam Int'l. Arpt. Auth. Rev. Bonds Series 2019 A, 5% 10/1/23 (Escrowed to Maturity) (c) | 825,000 | 835,560 | |
| Arizona - 0.0% | |||
| Maricopa County Rev. Bonds Series B, 5%, tender 10/18/22 (b) | 100,000 | 100,066 | |
| Colorado - 0.1% | |||
| Colorado Health Facilities Auth. Rev. Bonds Series 2013 A, 5.25% 1/1/23 (Pre-Refunded to 1/1/23 @ 100) | 150,000 | 150,672 | |
| Connecticut - 0.1% | |||
| Connecticut Hsg. Fin. Auth. Bonds Series 2021 E5, 5% 11/15/22 (c) | 210,000 | 210,419 | |
| District Of Columbia - 1.2% | |||
| District of Columbia Income Tax Rev. Bonds Series 2019 C, 5% | 100,000 | 100,000 | |
| Metropolitan Washington DC Arpts. Auth. Sys. Rev. Bonds: | |||
| Series 2013 A, 5% (c) | 1,000,000 | 1,000,000 | |
| Series 2017 A, 5% (c) | 1,000,000 | 1,000,000 | |
| Series 2018 A, 5% (c) | 160,000 | 160,000 | |
| Series 2021 A, 5% (c) | 1,485,000 | 1,485,000 | |
TOTAL DISTRICT OF COLUMBIA | 3,745,000 | ||
| Florida - 2.9% | |||
| Broward County Arpt. Sys. Rev. Bonds Series 2012 Q1: | |||
| 5% | 200,000 | 200,000 | |
| 5% | 135,000 | 135,000 | |
| Greater Orlando Aviation Auth. Arpt. Facilities Rev. Bonds Series 2019 A, 5% (c) | 500,000 | 500,000 | |
| Miami-Dade County Series 2022 B1: | |||
| 1.52% 10/4/22, LOC Bank of America NA, CP (c) | 400,000 | 399,951 | |
| 2.44% 11/3/22, LOC Bank of America NA, CP (c) | 900,000 | 899,791 | |
| Miami-Dade County Aviation Rev. Bonds Series 2012 A: | |||
| 5% (c) | 6,185,000 | 6,185,000 | |
| 5% (c) | 200,000 | 200,000 | |
| 5% (c) | 210,000 | 210,000 | |
| Miami-Dade County School Board Ctfs. of Prtn. Bonds Series 2015 D, 5% 2/1/23 | 300,000 | 301,801 | |
TOTAL FLORIDA | 9,031,543 | ||
| Hawaii - 0.3% | |||
| Hawaii Gen. Oblig. Bonds: | |||
| Series 2015 EY, 5% | 800,000 | 800,000 | |
| Series 2016 FE, 5% | 125,000 | 125,000 | |
TOTAL HAWAII | 925,000 | ||
| Illinois - 0.2% | |||
| Chicago Metropolitan Wtr. Reclamation District of Greater Chicago Bonds: | |||
| Series 2015 D, 5% 12/1/22 | 300,000 | 300,870 | |
| Series 2021 C, 5% 12/1/22 | 325,000 | 325,943 | |
TOTAL ILLINOIS | 626,813 | ||
| Indiana - 0.4% | |||
| Indiana Fin. Auth. Rev. Bonds (Ohio River Bridges East End Crossing Proj.) Series 2013 A: | |||
| 5% 7/1/23 (Pre-Refunded to 7/1/23 @ 100) (c) | 200,000 | 202,183 | |
| 5% 7/1/23 (Pre-Refunded to 7/1/23 @ 100) (c) | 200,000 | 202,183 | |
| 5.25% 7/1/23 (Pre-Refunded to 7/1/23 @ 100) (c) | 360,000 | 364,582 | |
| Indiana Health Facility Fing. Auth. Rev. Bonds Series 2001 A2, 2%, tender 2/1/23 (b) | 400,000 | 398,137 | |
TOTAL INDIANA | 1,167,085 | ||
| Kentucky - 0.1% | |||
| Kentucky State Property & Buildings Commission Rev. Bonds Series B, 5% 11/1/22 | 400,000 | 400,556 | |
| Massachusetts - 0.1% | |||
| Nantucket Gen. Oblig. BAN Series 2022, 3% 10/14/22 | 300,000 | 300,009 | |
| Michigan - 0.7% | |||
| Michigan Bldg. Auth. Rev. Series 2022 9, 2.06% 11/17/22, LOC JPMorgan Chase Bank, CP | 1,800,000 | 1,798,808 | |
| Michigan Fin. Auth. Rev. Bonds Series 2017 A, 5% 12/1/22 | 200,000 | 200,564 | |
TOTAL MICHIGAN | 1,999,372 | ||
| Minnesota - 0.2% | |||
| Minnesota State Gen. Fdg. Rev. Bonds Series 2022 A, 5% 3/1/23 (h) | 700,000 | 705,149 | |
| Nevada - 0.2% | |||
| Nevada Hsg. Division Single Family Mtg. Rev. Bonds Series 2021 D, 0.25% 12/1/22 | 580,000 | 577,479 | |
| New Jersey - 0.5% | |||
| Cedar Grove Township Gen. Oblig. BAN Series 2022, 4% 7/10/23 | 700,000 | 701,439 | |
| Summit Gen. Oblig. BAN Series 2021, 2% 10/21/22 | 900,000 | 899,519 | |
TOTAL NEW JERSEY | 1,600,958 | ||
| New York - 0.8% | |||
| Casenovia Central School District BAN Series 2022, 4% 7/14/23 | 600,000 | 601,593 | |
| New York Urban Dev. Corp. Rev. Bonds Series 2015 A, 5% 3/15/23 | 800,000 | 806,968 | |
| North Hempstead Gen. Oblig. BAN Series 2022 C, 4.5% 9/22/23 | 700,000 | 705,313 | |
| South Huntington Union Free School District TAN Series 2022, 4% 6/28/23 | 300,000 | 301,058 | |
TOTAL NEW YORK | 2,414,932 | ||
| New York And New Jersey - 1.3% | |||
| Port Auth. of New York & New Jersey Series 2022 A: | |||
| 1.95% 10/12/22, CP (c) | 915,000 | 914,804 | |
| 2% 10/18/22, CP (c) | 1,600,000 | 1,599,485 | |
| 2.15% 10/13/22, CP (c) | 1,600,000 | 1,599,654 | |
TOTAL NEW YORK AND NEW JERSEY | 4,113,943 | ||
| Ohio - 0.0% | |||
| Ohio State Univ. Gen. Receipts Bonds Series 2020 A, 5% 12/1/22 | 100,000 | 100,319 | |
| Oklahoma - 0.2% | |||
| Oklahoma City Wtr. Utils. Trust Wtr. and Swr. Rev. Series 2022 A, 1.85% 10/3/22 (Liquidity Facility State Street Bank & Trust Co., Boston), CP | 500,000 | 499,973 | |
| Pennsylvania - 0.2% | |||
| Univ. of Pittsburgh Commonwealth Sys. of Higher Ed. Bonds Series 2022 B2, 1.67% tender 10/20/22, CP mode | 600,000 | 599,684 | |
| Tennessee - 0.1% | |||
| Chattanooga Health Ed. & Hsg. Facility Board Rev. Bonds Series 2013 A, 5.25% 1/1/23 (Pre-Refunded to 1/1/23 @ 100) | 250,000 | 251,212 | |
| Texas - 3.5% | |||
| Austin Elec. Util. Sys. Rev. Series 2022 A, 1.84% 10/6/22 (Liquidity Facility JPMorgan Chase Bank), CP | 3,200,000 | 3,199,658 | |
| Dallas Fort Worth Int'l. Arpt. Rev. Bonds: | |||
| Series 2013 C, 5.125% 11/1/22 (Pre-Refunded to 11/1/22 @ 100) (c) | 500,000 | 500,730 | |
| Series 2014 B, 4.5% 11/1/22 (Pre-Refunded to 11/1/22 @ 100) (c) | 425,000 | 425,415 | |
| Harris County Metropolitan Trans. Auth. Series 2022 A1, 1.35% 10/6/22 (Liquidity Facility JPMorgan Chase Bank), CP | 800,000 | 799,828 | |
| Houston Arpt. Sys. Rev. Series 2022 A: | |||
| 1.9% 11/1/22, LOC Sumitomo Mitsui Banking Corp., CP (c) | 1,500,000 | 1,499,274 | |
| 1.95% 10/3/22, LOC Sumitomo Mitsui Banking Corp., CP (c) | 800,000 | 799,950 | |
| Houston Gen. Oblig. Series 2022 G2, 1.95% 10/5/22, LOC Barclays Bank PLC, CP | 400,000 | 399,975 | |
| Love Field Arpt. Modernization Rev. Series 2022, 2% 10/18/22, LOC JPMorgan Chase Bank, CP (c) | 1,100,000 | 1,099,647 | |
| Lower Colorado River Auth. Rev. Series 2022, 1.97% 10/20/22, LOC JPMorgan Chase Bank, LOC State Street Bank & Trust Co., Boston, CP | 400,000 | 399,900 | |
| San Antonio Elec. & Gas Sys. Rev. Bonds Series 2013, 5% 2/1/23 (Pre-Refunded to 2/1/23 @ 100) | 300,000 | 301,860 | |
| Univ. of Texas Board of Regents Sys. Rev. Series 2022 A: | |||
| 1.92% 10/20/22 (Liquidity Facility Univ. of Texas Invt. Mgmt. Co.), CP | 600,000 | 599,851 | |
| 1.98% 11/2/22 (Liquidity Facility Univ. of Texas Invt. Mgmt. Co.), CP | 300,000 | 299,877 | |
| Univ. of Texas Permanent Univ. Fund Rev. Series 2022 A, 2.3% 1/10/23, CP | 400,000 | 399,551 | |
TOTAL TEXAS | 10,725,516 | ||
| Washington - 0.7% | |||
| Port of Seattle Rev. Bonds: | |||
| Series 2018 A, 5% 5/1/23 (c) | 680,000 | 685,684 | |
| Series 2019, 5% 4/1/23 (c) | 1,100,000 | 1,107,979 | |
| Series 2021 C, 5% 8/1/23 (c) | 100,000 | 101,151 | |
| Series 2022 B, 5% 8/1/23 (c) | 300,000 | 303,453 | |
TOTAL WASHINGTON | 2,198,267 | ||
| Wisconsin - 0.3% | |||
| Wisconsin Gen. Oblig. Series 2022: | |||
| 1.98% 5/15/23, CP | 600,000 | 599,955 | |
| 2.1% 5/15/23, CP | 300,000 | 299,880 | |
| Wisconsin Health & Edl. Facilities Bonds Series 2018 B, 5%, tender 1/25/23 (b) | 125,000 | 125,658 | |
TOTAL WISCONSIN | 1,025,493 | ||
| TOTAL OTHER MUNICIPAL SECURITY (Cost $44,347,558) | 44,305,020 | ||
| Investment Company - 8.9% | |||
| Shares | Value ($) | ||
Fidelity Municipal Cash Central Fund 2.29% (i)(j) (Cost $27,640,314) | 27,637,501 | 27,643,028 | |
| TOTAL INVESTMENT IN SECURITIES - 94.6% (Cost $291,722,872) | 291,683,048 |
NET OTHER ASSETS (LIABILITIES) - 5.4% | 16,709,813 |
| NET ASSETS - 100.0% | 308,392,861 |
| BAN | - | BOND ANTICIPATION NOTE |
| CP | - | COMMERCIAL PAPER |
| TAN | - | TAX ANTICIPATION NOTE |
| VRDN | - | VARIABLE RATE DEMAND NOTE (A debt instrument that is payable upon demand, either daily, weekly or monthly) |
| (a) | Amount is stated in United States dollars unless otherwise noted. |
| (b) | Coupon rates for floating and adjustable rate securities reflect the rates in effect at period end. |
| (c) | Private activity obligations whose interest is subject to the federal alternative minimum tax for individuals. |
| (d) | Security exempt from registration under Rule 144A of the Securities Act of 1933. These securities may be resold in transactions exempt from registration, normally to qualified institutional buyers. At the end of the period, the value of these securities amounted to $4,900,000 or 1.6% of net assets. |
| (e) | Provides evidence of ownership in one or more underlying municipal bonds. |
| (f) | Coupon rates are determined by re-marketing agents based on current market conditions. |
| (g) | Restricted securities (including private placements) - Investment in securities not registered under the Securities Act of 1933 (excluding 144A issues). At the end of the period, the value of restricted securities (excluding 144A issues) amounted to $1,800,000 or 0.6% of net assets. |
| (h) | Security or a portion of the security purchased on a delayed delivery or when-issued basis. |
| (i) | Information in this report regarding holdings by state and security types does not reflect the holdings of the Fidelity Municipal Cash Central Fund. |
| (j) | Affiliated fund that is generally available only to investment companies and other accounts managed by Fidelity Investments. The rate quoted is the annualized seven-day yield of the fund at period end. A complete unaudited listing of the fund's holdings as of its most recent quarter end is available upon request. In addition, each Fidelity Central Fund's financial statements are available on the SEC's website or upon request. |
| Additional information on each restricted holding is as follows: | ||
| Security | Acquisition Date | Cost ($) |
| Alamo Cmnty. College District Rev. Bonds Series G-111, 2.66%, tender 5/1/23 (Liquidity Facility Royal Bank of Canada) | 5/03/21 | 200,000 |
| Connecticut Spl. Tax Oblig. Trans. Infrastructure Rev. Bonds Series Floaters G 110, 2.64%, tender 4/3/23 (Liquidity Facility Royal Bank of Canada) | 4/01/21 | 500,000 |
| Denver City & County Arpt. Rev. Bonds Series G-114, 2.71%, tender 12/1/22 (Liquidity Facility Royal Bank of Canada) | 6/01/21 | 200,000 |
| Greater Orlando Aviation Auth. Arpt. Facilities Rev. Bonds Series Floaters G 25, 2.71%, tender 4/3/23 (Liquidity Facility Royal Bank of Canada) | 4/01/21 | 200,000 |
| Ohio Univ. Gen. Receipts Athens Bonds Series Floaters G 27, 2.66%, tender 12/1/22 (Liquidity Facility Royal Bank of Canada) | 6/01/21 | 200,000 |
| South Carolina Trans. Infrastructure Bank Rev. Bonds Series Floaters G 109, 2.66%, tender 4/3/23 (Liquidity Facility Royal Bank of Canada) | 4/01/21 | 100,000 |
| Tampa-Hillsborough County Expressway Auth. Rev. Bonds Series G-113, 2.66%, tender 1/3/23 (Liquidity Facility Royal Bank of Canada) | 7/01/21 | 300,000 |
| Virginia Pub. Bldg. Auth. Pub. Facilities Rev. Bonds Series Floaters G 40, 2.66%, tender 2/1/23 (Liquidity Facility Royal Bank of Canada) | 2/01/21 | 100,000 |
| Affiliate | Value, beginning of period ($) | Purchases ($) | Sales Proceeds ($) | Dividend Income ($) | Realized Gain (loss) ($) | Change in Unrealized appreciation (depreciation) ($) | Value, end of period ($) | %ownership, end of period |
| Fidelity Municipal Cash Central Fund 2.29% | 83,233,024 | 116,932,000 | 172,522,000 | 231,938 | 1,889 | (1,885) | 27,643,028 | 1.6% |
| Total | 83,233,024 | 116,932,000 | 172,522,000 | 231,938 | 1,889 | (1,885) | 27,643,028 | |
| Valuation Inputs at Reporting Date: | ||||
| Description | Total ($) | Level 1 ($) | Level 2 ($) | Level 3 ($) |
Investments in Securities: | ||||
| Variable Rate Demand Note | 142,075,000 | - | 142,075,000 | - |
| Tender Option Bond | 77,660,000 | - | 77,660,000 | - |
| Other Municipal Security | 44,305,020 | - | 44,305,020 | - |
| Investment Company | 27,643,028 | 27,643,028 | - | - |
| Total Investments in Securities: | 291,683,048 | 27,643,028 | 264,040,020 | - |
| Statement of Assets and Liabilities | ||||
September 30, 2022 (Unaudited) | ||||
| Assets | ||||
| Investment in securities, at value - See accompanying schedule: | $ | |||
Unaffiliated issuers (cost $264,082,558) | $264,040,020 | |||
Fidelity Central Funds (cost $27,640,314) | 27,643,028 | |||
| Total Investment in Securities (cost $291,722,872) | $ | 291,683,048 | ||
| Cash | 836,810 | |||
| Receivable for investments sold | 19,700,000 | |||
| Interest receivable | 1,023,469 | |||
| Distributions receivable from Fidelity Central Funds | 43,721 | |||
| Prepaid expenses | 506 | |||
| Receivable from investment adviser for expense reductions | 4,420 | |||
| Other receivables | 97 | |||
Total assets | 313,292,071 | |||
| Liabilities | ||||
| Payable for investments purchased | ||||
Regular delivery | $1,527,608 | |||
Delayed delivery | 705,299 | |||
| Payable for fund shares redeemed | 2,606,923 | |||
| Accrued management fee | 37,505 | |||
| Other payables and accrued expenses | 21,875 | |||
| Total Liabilities | 4,899,210 | |||
| Net Assets | $ | 308,392,861 | ||
| Net Assets consist of: | ||||
| Paid in capital | $ | 308,460,332 | ||
| Total accumulated earnings (loss) | (67,471) | |||
| Net Assets | $ | 308,392,861 | ||
Net Asset Value , offering price and redemption price per share ($308,392,861 ÷ 308,331,872 shares) | $ | 1.0002 | ||
| Statement of Operations | ||||
Six months ended September 30, 2022 (Unaudited) | ||||
| Investment Income | ||||
| Interest | $ | 1,770,318 | ||
| Income from Fidelity Central Funds | 231,938 | |||
| Total Income | 2,002,256 | |||
| Expenses | ||||
| Management fee | $ | 282,423 | ||
| Custodian fees and expenses | 3,891 | |||
| Independent trustees' fees and expenses | 729 | |||
| Registration fees | 6,795 | |||
| Audit | 19,748 | |||
| Legal | 177 | |||
| Miscellaneous | 480 | |||
| Total expenses before reductions | 314,243 | |||
| Expense reductions | (30,525) | |||
| Total expenses after reductions | 283,718 | |||
| Net Investment income (loss) | 1,718,538 | |||
| Realized and Unrealized Gain (Loss) | ||||
| Net realized gain (loss) on: | ||||
| Investment Securities: | ||||
| Unaffiliated issuers | (31,342) | |||
| Fidelity Central Funds | 1,889 | |||
| Total net realized gain (loss) | (29,453) | |||
| Change in net unrealized appreciation (depreciation) on: | ||||
| Investment Securities: | ||||
| Unaffiliated issuers | 144,109 | |||
| Fidelity Central Funds | (1,885) | |||
| Total change in net unrealized appreciation (depreciation) | 142,224 | |||
| Net increase in net assets resulting from operations | $ | 1,831,309 | ||
| Statement of Changes in Net Assets | ||||
Six months ended September 30, 2022 (Unaudited) | Year ended March 31, 2022 | |||
| Increase (Decrease) in Net Assets | ||||
| Operations | ||||
| Net investment income (loss) | $ | 1,718,538 | $ | 160,396 |
| Net realized gain (loss) | (29,453) | 13,452 | ||
| Change in net unrealized appreciation (depreciation) | 142,224 | (191,454) | ||
Net increase in net assets resulting from operations | 1,831,309 | (17,606) | ||
| Distributions to shareholders | (1,717,956) | (197,071) | ||
| Share transactions | ||||
| Proceeds from sales of shares | 32,504,109 | 95,610,355 | ||
| Reinvestment of distributions | 1,717,956 | 197,059 | ||
| Cost of shares redeemed | (263,353,418) | (4,009,724) | ||
Net increase (decrease) in net assets and shares resulting from share transactions | (229,131,353) | 91,797,690 | ||
| Total increase (decrease) in net assets | (229,018,000) | 91,583,013 | ||
| Net Assets | ||||
| Beginning of period | 537,410,861 | 445,827,848 | ||
| End of period | $ | 308,392,861 | $ | 537,410,861 |
| Other Information | ||||
| Shares | ||||
| Sold | 32,495,164 | 95,589,058 | ||
| Issued in reinvestment of distributions | 1,717,566 | 197,027 | ||
| Redeemed | (263,293,986) | (4,008,121) | ||
| Net increase (decrease) | (229,081,256) | 91,777,964 | ||
| Fidelity® SAI Municipal Money Market Fund |
Six months ended (Unaudited) September 30, 2022 | Years ended March 31, 2022 | 2021 | 2020 | 2019 | 2018 A | |||||||
Selected Per-Share Data | ||||||||||||
| Net asset value, beginning of period | $ | 1.0000 | $ | 1.0004 | $ | 1.0002 | $ | 1.0001 | $ | .9999 | $ | 1.0000 |
| Income from Investment Operations | ||||||||||||
Net investment income (loss) B | .0047 | .0003 | .0013 | .0142 | .0146 | .0023 | ||||||
| Net realized and unrealized gain (loss) | .0002 | (.0003) | .0002 | .0001 | .0002 | (.0001) | ||||||
| Total from investment operations | .0049 | - | .0015 | .0143 | .0148 | .0022 | ||||||
| Distributions from net investment income | (.0047) | (.0003) | (.0013) | (.0142) | (.0146) | (.0023) | ||||||
| Distributions from net realized gain | - | (.0001) | (.0001) | - | - | - | ||||||
| Total distributions | (.0047) | (.0004) | (.0013) C | (.0142) | (.0146) | (.0023) | ||||||
| Net asset value, end of period | $ | 1.0002 | $ | 1.0000 | $ | 1.0004 | $ | 1.0002 | $ | 1.0001 | $ | .9999 |
Total Return D,E | .49% | -% | .15% | 1.44% | 1.49% | .23% | ||||||
Ratios to Average Net Assets B,F,G | ||||||||||||
| Expenses before reductions | .16% H | .16% | .16% | .19% | .21% | .23% H,I | ||||||
| Expenses net of fee waivers, if any | .14% H | .09% | .12% | .14% | .14% | .14% H | ||||||
| Expenses net of all reductions | .14% H | .09% | .12% | .14% | .14% | .14% H | ||||||
| �� Net investment income (loss) | .85% H | .03% | .08% | 1.41% | 1.46% | 1.09% H | ||||||
| Supplemental Data | ||||||||||||
| Net assets, end of period (000 omitted) | $ | 308,393 | $ | 537,411 | $ | 445,828 | $ | 134,798 | $ | 295,510 | $ | 265,304 |
| Fidelity Central Fund | Investment Manager | Investment Objective | Investment Practices | Expense Ratio A |
| Fidelity Money Market Central Funds | Fidelity Management & Research Company LLC (FMR) | Each fund seeks to obtain a high level of current income consistent with the preservation of capital and liquidity. | Short-term Investments | Less than .005% |
| Gross unrealized appreciation | $1,902 |
| Gross unrealized depreciation | (41,726) |
| Net unrealized appreciation (depreciation) | $(39,824) |
| Tax cost | $291,722,872 |
| Purchases ($) | Sales ($) | Realized Gain (Loss) ($) | |
| Fidelity SAI Municipal Money Market Fund | 2,500,000 | 77,584,000 | - |
| Strategic Advisers Tax-Sensitive Short Duration Fund | |
| Fidelity SAI Municipal Money Market Fund | 99% |
| Fund | % of shares held |
| Fidelity SAI Municipal Money Market Fund | 100% |
| The Example is based on an investment of $1,000 invested at the beginning of the period and held for the entire period (April 1, 2022 to September 30, 2022). |
Annualized Expense Ratio- A | Beginning Account Value April 1, 2022 | Ending Account Value September 30, 2022 | Expenses Paid During Period- C April 1, 2022 to September 30, 2022 | |||||||
| Fidelity® SAI Municipal Money Market Fund | .14% | |||||||||
| Actual | $ 1,000 | $ 1,004.90 | $ .71 | |||||||
Hypothetical- B | $ 1,000 | $ 1,024.36 | $ .71 | |||||||
|
Item 2.
Code of Ethics
Not applicable.
Item 3.
Audit Committee Financial Expert
Not applicable.
Item 4.
Principal Accountant Fees and Services
Not applicable.
Item 5.
Audit Committee of Listed Registrants
Not applicable.
Item 6.
Investments
(a)
Not applicable.
(b)
Not applicable
Item 7.
Disclosure of Proxy Voting Policies and Procedures for Closed-End Management Investment Companies
Not applicable.
Item 8.
Portfolio Managers of Closed-End Management Investment Companies
Not applicable.
Item 9.
Purchase of Equity Securities by Closed-End Management Investment Company and Affiliated Purchasers
Not applicable.
Item 10.
Submission of Matters to a Vote of Security Holders
There were no material changes to the procedures by which shareholders may recommend nominees to the Fidelity Salem Street Trust’s Board of Trustees.
Item 11.
Controls and Procedures
(a)(i) The President and Treasurer and the Chief Financial Officer have concluded that the Fidelity Salem Street Trust’s (the “Trust”) disclosure controls and procedures (as defined in Rule 30a-3(c) under the Investment Company Act) provide reasonable assurances that material information relating to the Trust is made known to them by the appropriate persons, based on their evaluation of these controls and procedures as of a date within 90 days of the filing date of this report.
(a)(ii) There was no change in the Trust’s internal control over financial reporting (as defined in Rule 30a-3(d) under the Investment Company Act) that occurred during the period covered by this report that has materially affected, or is reasonably likely to materially affect, the Trust’s internal control over financial reporting.
Item 12.
Disclosure of Securities Lending Activities for Closed-End Management
Investment Companies
Not applicable.
Item 13.
Exhibits
(a) | (1) | Not applicable. |
(a) | (2) | |
(a) | (3) | Not applicable. |
(b) |
SIGNATURES
Pursuant to the requirements of the Securities Exchange Act of 1934 and the Investment Company Act of 1940, the registrant has duly caused this report to be signed on its behalf by the undersigned, thereunto duly authorized.
Fidelity Salem Street Trust
By: | /s/Laura M. Del Prato |
Laura M. Del Prato | |
President and Treasurer | |
Date: | November 18, 2022 |
Pursuant to the requirements of the Securities Exchange Act of 1934 and the Investment Company Act of 1940, this report has been signed below by the following persons on behalf of the registrant and in the capacities and on the dates indicated.
By: | /s/Laura M. Del Prato |
Laura M. Del Prato | |
President and Treasurer | |
Date: | November 18, 2022 |
By: | /s/John J. Burke III |
John J. Burke III | |
Chief Financial Officer | |
Date: | November 18, 2022 |