UNITED STATES
SECURITIES AND EXCHANGE COMMISSION
Washington, D.C. 20549
FORM N-CSR
CERTIFIED SHAREHOLDER REPORT OF REGISTERED
MANAGEMENT INVESTMENT COMPANIES
Investment Company Act file number 811-02105
Fidelity Salem Street Trust
(Exact name of registrant as specified in charter)
245 Summer St., Boston, Massachusetts 02210
(Address of principal executive offices) (Zip code)
Margaret Carey, Secretary
245 Summer St.
Boston, Massachusetts 02210
(Name and address of agent for service)
Registrant's telephone number, including area code:
617-563-7000
Date of fiscal year end: | March 31 |
Date of reporting period: | March 31, 2024 |
Item 1.
Reports to Stockholders


Contents
| Current 7-Day Yields | ||
| Fidelity® SAI Municipal Money Market Fund | 3.61% | |
Yield refers to the income paid by the Fund over a given period. Yield for money market funds is usually for seven-day periods, as it is here, though it is expressed as an annual percentage rate. Past performance is no guarantee of future results. Yield will vary and it's possible to lose money investing in the Fund. A portion of the Fund's expenses was reimbursed and/or waived. Absent such reimbursements and/or waivers the yield for the period ending March 31, 2024, the most recent period shown in the table, would have been 3.54% for Fidelity® SAI Municipal Money Market Fund. | ||
| Effective Maturity Diversification (% of Fund's Investments) | ||
| Days | ||
| 1 - 7 | 90.4 | |
| 8 - 30 | 0.8 | |
| 31 - 60 | 2.7 | |
| 61 - 90 | 3.1 | |
| 91 - 180 | 2.5 | |
| > 180 | 0.4 | |
| Effective maturity is determined in accordance with the requirements of Rule 2a-7 under the Investment Company Act of 1940. | ||
Asset Allocation (% of Fund's net assets) |
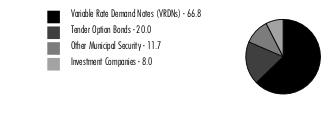 |
Net Other Assets (Liabilities) - (6.5)% |
| Variable Rate Demand Note - 66.8% | |||
Principal Amount (a) | Value ($) | ||
| Alabama - 3.2% | |||
| Walker County Econ. & Indl. Dev. Auth. Solid Waste Disp. Rev. (Alabama Pwr. Co. Plant Gorgas Proj.) Series 2023, 4.2% 4/1/24, VRDN (b)(c) | 1,000,000 | 1,000,000 | |
| West Jefferson Indl. Dev. Board Solid Waste Disp. Rev. (Alabama Pwr. Co. Plant Miller Proj.) Series 2023, 3.95% 4/4/24, VRDN (b)(c) | 400,000 | 400,000 | |
TOTAL ALABAMA | 1,400,000 | ||
| Arizona - 2.0% | |||
| Maricopa County Poll. Cont. Rev.: | |||
| Series 2009 B, 3.65% 4/4/24, VRDN (b) | 500,000 | 500,000 | |
| Series 2009 C, 3.7% 4/4/24, VRDN (b) | 400,000 | 400,000 | |
TOTAL ARIZONA | 900,000 | ||
| Delaware - 1.3% | |||
| Delaware Econ. Dev. Auth. Rev. (Delmarva Pwr. & Lt. Co. Proj.): | |||
| Series 1993 C, 3.84% 4/4/24, VRDN (b) | 200,000 | 200,000 | |
| Series 1999 B, 4% 4/4/24, VRDN (b)(c) | 400,000 | 400,000 | |
TOTAL DELAWARE | 600,000 | ||
| Florida - 2.2% | |||
| Broward County Indl. Dev. Rev. (Florida Pwr. & Lt. Co. Proj.) Series 2018 B, 3.9% 4/4/24, VRDN (b)(c) | 200,000 | 200,000 | |
| Hillsborough County Hsg. Fin. Auth. Multi-family Rev. (Claymore Crossings Apt. Proj.) Series 2005, 3.66% 4/4/24, LOC Citibank NA, VRDN (b)(c) | 465,000 | 465,000 | |
| Lee County Indl. Dev. Auth. Rev. (Florida Pwr. & Lt. Co. Proj.) Series 2016 A, 3.9% 4/4/24, VRDN (b)(c) | 300,000 | 300,000 | |
TOTAL FLORIDA | 965,000 | ||
| Georgia - 2.2% | |||
| Monroe County Dev. Auth. Rev. (Florida Pwr. & Lt. Co. Proj.) Series 2019, 3.55% 4/4/24, VRDN (b)(c) | 1,000,000 | 1,000,000 | |
| Illinois - 0.2% | |||
| Illinois Dev. Fin. Auth. Rev. (Glenwood School for Boys Proj.) Series 1998, 3.68% 4/4/24, LOC Northern Trust Co., VRDN (b) | 100,000 | 100,000 | |
| Indiana - 2.0% | |||
| Indiana Dev. Fin. Auth. Envir. Rev. (PSI Energy Proj.) Series 2003 A, 3.85% 4/4/24, VRDN (b)(c) | 900,000 | 900,000 | |
| Iowa - 1.8% | |||
| Iowa Fin. Auth. Midwestern Disaster Area Rev. (ADM Proj.) Series 2011, 3.8% 4/4/24, VRDN (b) | 100,000 | 100,000 | |
| Iowa Fin. Auth. Solid Waste Facilities (MidAmerican Energy Co. Proj.) Series 2017, 4% 4/4/24, VRDN (b)(c) | 700,000 | 700,000 | |
TOTAL IOWA | 800,000 | ||
| Kansas - 1.6% | |||
| Burlington Envir. Impt. Rev. (Kansas City Pwr. and Lt. Co. Proj.): | |||
| Series 2007 A, 3.9% 4/4/24, VRDN (b) | 100,000 | 100,000 | |
| Series 2007 B, 3.9% 4/4/24, VRDN (b) | 600,000 | 600,000 | |
TOTAL KANSAS | 700,000 | ||
| Louisiana - 5.0% | |||
| Saint James Parish Gen. Oblig. (Nucor Steel Louisiana LLC Proj.) Series 2010 B1, 3.9% 4/4/24, VRDN (b) | 2,200,000 | 2,200,000 | |
| Mississippi - 3.2% | |||
| Mississippi Bus. Fin. Corp. Rev. (Gulf Pwr. Co. Proj.) Series 2019, 3.9% 4/4/24, VRDN (b)(c) | 900,000 | 900,000 | |
| Mississippi Bus. Fin. Corp. Solid Waste Disp. Rev. (Waste Mgmt., Inc. Proj.) Series 2003, 3.55% 4/4/24, LOC Bank of America NA, VRDN (b)(c) | 500,000 | 500,000 | |
TOTAL MISSISSIPPI | 1,400,000 | ||
| Nebraska - 3.4% | |||
| Nebraska Invt. Fin. Auth. Single Family Hsg. Rev.: | |||
| Series 2015 B, 3.6% 4/4/24 (Liquidity Facility Fed. Home Ln. Bank Topeka), VRDN (b)(c) | 200,000 | 200,000 | |
| Series B, 3.62% 4/4/24 (Liquidity Facility Fed. Home Ln. Bank Topeka), VRDN (b)(c) | 1,100,000 | 1,100,000 | |
| Stanton County Indl. Dev. Rev. Series 1998, 4.18% 4/4/24, VRDN (b)(c) | 200,000 | 200,000 | |
TOTAL NEBRASKA | 1,500,000 | ||
| Nevada - 1.1% | |||
| Clark County Arpt. Rev. Series 2008 C1, 3.81% 4/4/24, LOC Bank of America NA, VRDN (b)(c) | 500,000 | 500,000 | |
| New York - 1.5% | |||
| New York City Hsg. Dev. Corp. Multi-family Mtg. Rev. (Urban Horizons II Dev. Proj.) Series 2005 A, 3.95% 4/4/24, LOC Citibank NA, VRDN (b)(c) | 100,000 | 100,000 | |
| New York Hsg. Fin. Agcy. Rev. Series 2010 A, 3.65% 4/4/24, LOC Landesbank Hessen-Thuringen, VRDN (b) | 570,000 | 570,000 | |
TOTAL NEW YORK | 670,000 | ||
| North Carolina - 1.6% | |||
| Lower Cape Fear Wtr. & Swr. Auth. Rev. (Bladen Bluffs Proj.) Series 2010, 3.56% 4/4/24, LOC Rabobank Nederland New York Branch, VRDN (b) | 715,000 | 715,000 | |
| Oregon - 0.6% | |||
| FHLMC Portland Multi-family Hsg. Rev. (The Village at Lovejoy Fountain Proj.) Series 2009, 3.53% 4/4/24, LOC Freddie Mac, VRDN (b)(c) | 250,000 | 250,000 | |
| Rhode Island - 1.4% | |||
| Rhode Island Health and Edl. Bldg. Corp. Higher Ed. Facility Rev. (New England Institute of Technology Proj.) Series 2008, 3.84% 4/4/24, LOC TD Banknorth, NA, VRDN (b) | 615,000 | 615,000 | |
| South Carolina - 4.1% | |||
| South Carolina Jobs-Econ. Dev. Auth. Econ. Dev. Rev. (Waste Mgmt. of South Carolina, Inc. Proj.) Series 2003 A, 3.55% 4/4/24, LOC Wells Fargo Bank NA, VRDN (b)(c) | 1,800,000 | 1,800,000 | |
| Tennessee - 5.0% | |||
| Loudon County Indl. Dev. Board Exempt Facilities Rev. (Kimberly-Clark Corp. Proj.) Series 1999, 3.85% 4/4/24, VRDN (b)(c) | 2,200,000 | 2,200,000 | |
| Texas - 10.4% | |||
| Houston Util. Sys. Rev. Series 2004 B2, 3.5% 4/4/24, LOC Sumitomo Mitsui Banking Corp., VRDN (b) | 370,000 | 370,000 | |
| Texas Gen. Oblig.: | |||
| Series 2003 A, 3.8% 4/4/24 (Liquidity Facility State Street Bank & Trust Co., Boston), VRDN (b)(c) | 500,000 | 500,000 | |
| Series 2012 B, 3.75% 4/4/24 (Liquidity Facility State Street Bank & Trust Co., Boston), VRDN (b) | 500,000 | 500,000 | |
| Series 2013 A, 3.75% 4/4/24 (Liquidity Facility State Street Bank & Trust Co., Boston), VRDN (b) | 420,000 | 420,000 | |
| Series 2014 A, 3.75% 4/4/24 (Liquidity Facility State Street Bank & Trust Co., Boston), VRDN (b) | 300,000 | 300,000 | |
| Series 2019, 3.6% 4/4/24 (Liquidity Facility JPMorgan Chase Bank), VRDN (b) | 540,000 | 540,000 | |
| FNMA Texas Dept. of Hsg. & Cmnty. Affairs Multi-family Hsg. Rev. (Pinnacle Apts. Proj.) Series 2004, 3.45% 4/4/24, LOC Fannie Mae, VRDN (b)(c) | 2,000,000 | 2,000,000 | |
TOTAL TEXAS | 4,630,000 | ||
| Utah - 0.4% | |||
| Emery County Poll. Cont. Rev. (PacifiCorp Proj.) Series 1994, 4.15% 4/4/24, VRDN (b) | 200,000 | 200,000 | |
| Washington - 5.4% | |||
| Washington Hsg. Fin. Commission Multi-family Hsg. Rev. (Interurban Sr. Living Apts. Proj.) Series 2012, 3.92% 4/4/24, LOC Freddie Mac, VRDN (b) | 300,000 | 300,000 | |
| FNMA Washington Hsg. Fin. Commission Multi-family Hsg. Rev.: | |||
| (New Haven Apts. Proj.) Series 2009, 3.45% 4/4/24, LOC Fannie Mae, VRDN (b) | 800,000 | 800,000 | |
| (Pinehurst Apts. Proj.) Series A, 3.45% 4/4/24, LOC Fannie Mae, VRDN (b)(c) | 1,000,000 | 1,000,000 | |
| (The Cambridge Apts. Proj.) Series 2009, 3.45% 4/4/24, LOC Fannie Mae, VRDN (b) | 300,000 | 300,000 | |
TOTAL WASHINGTON | 2,400,000 | ||
| West Virginia - 2.0% | |||
| West Virginia Econ. Dev. Auth. Solid Waste Disp. Facilities Rev. (Appalachian Pwr. Co.- Mountaineer Proj.) Series 2008 A, 3.58% 4/4/24, VRDN (b)(c) | 900,000 | 900,000 | |
| Wisconsin - 5.2% | |||
| Green Bay Redev. Auth. (Green Bay Packaging, Inc. Proj.) Series 2019, 3.5% 4/4/24, LOC Wells Fargo Bank NA, VRDN (b)(c)(d) | 2,300,000 | 2,300,000 | |
| TOTAL VARIABLE RATE DEMAND NOTE (Cost $29,645,000) | 29,645,000 | ||
| Tender Option Bond - 20.0% | |||
Principal Amount (a) | Value ($) | ||
| Arizona - 0.2% | |||
| Arizona Indl. Dev. Auth. Hosp. Rev. Participating VRDN Series XM 10 13, 3.57% 4/4/24 (Liquidity Facility JPMorgan Chase Bank) (b)(e)(f) | 75,000 | 75,000 | |
| Colorado - 1.7% | |||
| Colorado Health Facilities Auth. Rev. Bonds Participating VRDN Series 2023, 3.75% 5/2/24 (Liquidity Facility Barclays Bank PLC) (b)(e)(f) | 100,000 | 100,000 | |
| Denver City & County Arpt. Rev. Participating VRDN Series Floaters XG 01 96, 3.53% 4/4/24 (Liquidity Facility Toronto-Dominion Bank) (b)(c)(e)(f) | 640,000 | 640,000 | |
TOTAL COLORADO | 740,000 | ||
| Florida - 0.4% | |||
| County of Broward Tourist Dev. Tax Rev. Participating VRDN Series XL 04 29, 3.56% 4/4/24 (Liquidity Facility Wells Fargo Bank NA) (b)(e)(f) | 100,000 | 100,000 | |
| South Miami Health Facilities Auth. Hosp. Rev. Participating VRDN Series YX 12 86, 3.52% 4/4/24 (Liquidity Facility Barclays Bank PLC) (b)(e)(f) | 100,000 | 100,000 | |
TOTAL FLORIDA | 200,000 | ||
| Georgia - 0.2% | |||
| Fulton County Dev. Auth. Rev. Participating VRDN Series XL 02 68, 3.55% 4/4/24 (Liquidity Facility Bank of America NA) (b)(e)(f) | 90,000 | 90,000 | |
| Illinois - 1.1% | |||
| Illinois Fin. Auth. Participating VRDN Series BAML 50 45, 3.53% 4/4/24 (Liquidity Facility Bank of America NA) (b)(e)(f) | 500,000 | 500,000 | |
| Michigan - 0.2% | |||
| Mclaren Health Care Corp. Participating VRDN Series XL 02 71, 3.55% 4/4/24 (Liquidity Facility Bank of America NA) (b)(e)(f) | 90,000 | 90,000 | |
| Missouri - 0.7% | |||
| Kansas City Indl. Dev. Auth. Participating VRDN Series XG 03 96, 3.53% 4/4/24 (Liquidity Facility Toronto-Dominion Bank) (b)(c)(e)(f) | 300,000 | 300,000 | |
| New Jersey - 0.5% | |||
| New Jersey Hsg. & Mtg. Fin. Agcy. Multi-family Rev. Participating VRDN Series Floater 2024, 3.7% 5/2/24 (Liquidity Facility Barclays Bank PLC) (b)(e)(f) | 200,000 | 200,000 | |
| New York - 5.6% | |||
| New York Trans. Dev. Corp. Participating VRDN Series 2022 E 154, 3.55% 4/4/24 (Liquidity Facility Royal Bank of Canada) (b)(c)(e)(f) | 2,500,000 | 2,500,000 | |
| North Carolina - 5.0% | |||
| Charlotte Int'l. Arpt. Rev. Participating VRDN Series XG 05 27, 3.54% 4/4/24 (Liquidity Facility Bank of America NA) (b)(c)(e)(f) | 130,000 | 130,000 | |
| Greater Asheville Reg'l. Arpt. Auth. Participating VRDN Series XM 10 11, 3.52% 4/4/24 (Liquidity Facility Royal Bank of Canada) (b)(c)(e)(f) | 2,100,000 | 2,100,000 | |
TOTAL NORTH CAROLINA | 2,230,000 | ||
| Ohio - 0.9% | |||
| Cuyahoga County Ctfs. of Prtn. Participating VRDN Series Floaters XG 02 06, 3.55% 4/4/24 (Liquidity Facility Bank of America NA) (b)(e)(f) | 400,000 | 400,000 | |
| Pennsylvania - 1.8% | |||
| Allegheny County Arpt. Auth. Rev. Participating VRDN Series XG 05 41, 3.51% 4/4/24 (Liquidity Facility Royal Bank of Canada) (b)(c)(e)(f) | 100,000 | 100,000 | |
| Lehigh County Gen. Purp. Hosp. Rev. Participating VRDN Series BAML 23 50 39, 3.53% 5/2/24 (Liquidity Facility Bank of America NA) (b)(e)(f) | 200,000 | 200,000 | |
| Pennsylvania Econ. Dev. Fing. Auth. Participating VRDN Series XM 10 83, 3.53% 4/4/24 (Liquidity Facility Royal Bank of Canada) (b)(c)(e)(f) | 500,000 | 500,000 | |
TOTAL PENNSYLVANIA | 800,000 | ||
| Texas - 0.4% | |||
| Texas Private Activity Bond Surface Trans. Corp. Participating VRDN Series XM 11 23, 3.52% 4/4/24 (Liquidity Facility Royal Bank of Canada) (b)(c)(e)(f) | 100,000 | 100,000 | |
| Texas Wtr. Dev. Board Rev. Bonds Series MS 00 17, 3.6%, tender 4/25/24 (Liquidity Facility Morgan Stanley Bank, West Valley City Utah) (b)(e)(f)(g) | 100,000 | 100,000 | |
TOTAL TEXAS | 200,000 | ||
| Virginia - 0.5% | |||
| Suffolk Econ. Dev. Auth. Hosp. Facilities Rev. Participating VRDN Series MIZ 90 25, 3.55% 4/4/24 (Liquidity Facility Mizuho Cap. Markets LLC) (b)(e)(f) | 200,000 | 200,000 | |
| Washington - 0.8% | |||
| Port of Seattle Rev. Participating VRDN: | |||
| Series XF 13 71, 3.59% 4/4/24 (Liquidity Facility JPMorgan Chase Bank) (b)(c)(e)(f) | 300,000 | 300,000 | |
| Series XM 08 75, 3.55% 4/4/24 (Liquidity Facility JPMorgan Chase Bank) (b)(c)(e)(f) | 65,000 | 65,000 | |
TOTAL WASHINGTON | 365,000 | ||
| TOTAL TENDER OPTION BOND (Cost $8,890,000) | 8,890,000 | ||
| Other Municipal Security - 11.7% | |||
Principal Amount (a) | Value ($) | ||
| California - 0.2% | |||
| California Gen. Oblig. Bonds Series 2019, 5% 4/1/24 | 100,000 | 100,000 | |
| Connecticut - 0.4% | |||
| Darien Gen. Oblig. BAN Series 2023, 4% 4/25/24 | 190,000 | 190,016 | |
| District Of Columbia - 1.1% | |||
| District of Columbia Gen. Oblig. Bonds: | |||
| Series 2015 A, 5% 6/1/24 | 270,000 | 270,539 | |
| Series 2023 B, 5% 6/1/24 | 200,000 | 200,399 | |
TOTAL DISTRICT OF COLUMBIA | 470,938 | ||
| Georgia - 0.9% | |||
| Atlanta Arpt. Rev. Bonds Series 2023 C, 5% 7/1/24 (c) | 380,000 | 380,845 | |
| Illinois - 0.5% | |||
| Illinois Gen. Oblig. Bonds: | |||
| Series 2016, 5% 6/1/24 | 100,000 | 100,208 | |
| Series 2018 B, 5% 5/1/24 | 105,000 | 105,106 | |
TOTAL ILLINOIS | 205,314 | ||
| Kentucky - 0.9% | |||
| Kentucky State Property & Buildings Commission Rev. Bonds Series 2017, 5% 4/1/24 | 415,000 | 415,000 | |
| Michigan - 0.5% | |||
| Kent Hosp. Fin. Auth. Hosp. Facilities Rev. Bonds (Spectrum Health Sys. Proj.) Series 2015 A, SIFMA Municipal Swap Index + 0.250% 3.7%, tender 10/24/24 (b)(h) | 100,000 | 100,000 | |
| Michigan Fin. Auth. Rev. Bonds Series 2016 E1, 4%, tender 8/15/24 (b) | 110,000 | 109,924 | |
TOTAL MICHIGAN | 209,924 | ||
| New Jersey - 0.2% | |||
| Jefferson Township Gen. Oblig. BAN Series 2023, 5% 6/14/24 | 100,000 | 100,175 | |
| North Carolina - 0.5% | |||
| North Carolina Ltd. Oblig. Bonds: | |||
| Series 2020 B, 5% 5/1/24 | 100,000 | 100,090 | |
| Series 2021 A, 5% 5/1/24 | 135,000 | 135,122 | |
TOTAL NORTH CAROLINA | 235,212 | ||
| Oregon - 1.4% | |||
| Port of Portland Arpt. Rev. Bonds Series 2017 B, 5% 7/1/24 (c) | 510,000 | 510,957 | |
| Salem Hosp. Facility Auth. Rev. Bonds (Salem Health Projs.) Series 2019 A, 5% 5/15/24 | 125,000 | 125,140 | |
TOTAL OREGON | 636,097 | ||
| South Carolina - 0.4% | |||
| Greenville County School District Bonds Series 2023 B, 5% 6/25/24 | 155,000 | 155,358 | |
| Texas - 3.6% | |||
| Austin Elec. Util. Sys. Rev. Series 2024 A, 3.7% 6/5/24 (Liquidity Facility JPMorgan Chase Bank), CP | 200,000 | 199,978 | |
| Harris County Cultural Ed. Facilities Fin. Corp. Rev. Bonds Series 2020, 5% 6/1/24 | 250,000 | 250,408 | |
| Texas A&M Univ. Rev. Bonds Series 2017 E, 5% 5/15/24 | 300,000 | 300,376 | |
| Texas Gen. Oblig. Bonds: | |||
| Series 2014, 5% 4/1/24 (Pre-Refunded to 4/1/24 @ 100) | 425,000 | 425,000 | |
| Series 2016, 5% 4/1/24 | 150,000 | 150,000 | |
| Texas Trans. Commission State Hwy. Fund Rev. Bonds Series 2014 A, 5% 4/1/24 (Pre-Refunded to 4/1/24 @ 100) | 150,000 | 150,000 | |
| Texas Wtr. Dev. Board Rev. Bonds Series 2023 A, 5% 4/15/24 | 105,000 | 105,044 | |
TOTAL TEXAS | 1,580,806 | ||
| Washington - 0.4% | |||
| Port of Seattle Rev. Bonds Series 2022 B, 5% 8/1/24 (c) | 195,000 | 195,480 | |
| Wisconsin - 0.7% | |||
| Wisconsin Clean Wtr. Rev. Bonds Series 2012 2, 5% 6/1/24 (Escrowed to Maturity) | 205,000 | 205,331 | |
| Wisconsin Gen. Oblig. Series 2024, 3.8% 12/10/24, CP | 100,000 | 99,999 | |
TOTAL WISCONSIN | 305,330 | ||
| TOTAL OTHER MUNICIPAL SECURITY (Cost $5,180,168) | 5,180,495 | ||
| Investment Company - 8.0% | |||
| Shares | Value ($) | ||
Fidelity Municipal Cash Central Fund 3.63% (i)(j) (Cost $3,542,891) | 3,542,132 | 3,543,196 | |
| TOTAL INVESTMENT IN SECURITIES - 106.5% (Cost $47,258,059) | 47,258,691 |
NET OTHER ASSETS (LIABILITIES) - (6.5)% | (2,905,013) |
| NET ASSETS - 100.0% | 44,353,678 |
| BAN | - | BOND ANTICIPATION NOTE |
| CP | - | COMMERCIAL PAPER |
| VRDN | - | VARIABLE RATE DEMAND NOTE (A debt instrument that is payable upon demand, either daily, weekly or monthly) |
| (a) | Amount is stated in United States dollars unless otherwise noted. |
| (b) | Coupon rates for floating and adjustable rate securities reflect the rates in effect at period end. |
| (c) | Private activity obligations whose interest is subject to the federal alternative minimum tax for individuals. |
| (d) | Security exempt from registration under Rule 144A of the Securities Act of 1933. These securities may be resold in transactions exempt from registration, normally to qualified institutional buyers. At the end of the period, the value of these securities amounted to $2,300,000 or 5.2% of net assets. |
| (e) | Provides evidence of ownership in one or more underlying municipal bonds. |
| (f) | Coupon rates are determined by re-marketing agents based on current market conditions. |
| (g) | Restricted securities (including private placements) - Investment in securities not registered under the Securities Act of 1933 (excluding 144A issues). At the end of the period, the value of restricted securities (excluding 144A issues) amounted to $100,000 or 0.2% of net assets. |
| (h) | Coupon is indexed to a floating interest rate which may be multiplied by a specified factor and/or subject to caps or floors. |
| (i) | Information in this report regarding holdings by state and security types does not reflect the holdings of the Fidelity Municipal Cash Central Fund. |
| (j) | Affiliated fund that is generally available only to investment companies and other accounts managed by Fidelity Investments. The rate quoted is the annualized seven-day yield of the fund at period end. A complete unaudited listing of the fund's holdings as of its most recent quarter end is available upon request. In addition, each Fidelity Central Fund's financial statements, which are not covered by the Fund's Report of Independent Registered Public Accounting Firm, are available on the SEC's website or upon request. |
| Additional information on each restricted holding is as follows: | ||
| Security | Acquisition Date | Cost ($) |
| Texas Wtr. Dev. Board Rev. Bonds Series MS 00 17, 3.6%, tender 4/25/24 (Liquidity Facility Morgan Stanley Bank, West Valley City Utah) | 10/12/23 | 100,000 |
| Affiliate | Value, beginning of period ($) | Purchases ($) | Sales Proceeds ($) | Dividend Income ($) | Realized Gain (loss) ($) | Change in Unrealized appreciation (depreciation) ($) | Value, end of period ($) | % ownership, end of period |
| Fidelity Municipal Cash Central Fund 3.63% | 7,744,028 | 64,716,219 | 68,918,053 | 272,677 | 851 | 151 | 3,543,196 | 0.2% |
| Total | 7,744,028 | 64,716,219 | 68,918,053 | 272,677 | 851 | 151 | 3,543,196 | |
| Valuation Inputs at Reporting Date: | ||||
| Description | Total ($) | Level 1 ($) | Level 2 ($) | Level 3 ($) |
Investments in Securities: | ||||
| Variable Rate Demand Note | 29,645,000 | - | 29,645,000 | - |
| Tender Option Bond | 8,890,000 | - | 8,890,000 | - |
| Other Municipal Security | 5,180,495 | - | 5,180,495 | - |
| Investment Company | 3,543,196 | 3,543,196 | - | - |
| Total Investments in Securities: | 47,258,691 | 3,543,196 | 43,715,495 | - |
| Statement of Assets and Liabilities | ||||
| March 31, 2024 | ||||
| Assets | ||||
| Investment in securities, at value - See accompanying schedule: | ||||
Unaffiliated issuers (cost $43,715,168) | $ | 43,715,495 | ||
Fidelity Central Funds (cost $3,542,891) | 3,543,196 | |||
| Total Investment in Securities (cost $47,258,059) | $ | 47,258,691 | ||
| Cash | 1,000 | |||
| Interest receivable | 250,997 | |||
| Distributions receivable from Fidelity Central Funds | 19,663 | |||
| Prepaid expenses | 67 | |||
| Receivable from investment adviser for expense reductions | 3,278 | |||
| Other receivables | 341 | |||
Total assets | 47,534,037 | |||
| Liabilities | ||||
| Payable for fund shares redeemed | $ | 3,135,087 | ||
| Accrued management fee | 5,940 | |||
| Other payables and accrued expenses | 39,332 | |||
| Total liabilities | 3,180,359 | |||
| Net Assets | $ | 44,353,678 | ||
| Net Assets consist of: | ||||
| Paid in capital | $ | 44,378,031 | ||
| Total accumulated earnings (loss) | (24,353) | |||
| Net Assets | $ | 44,353,678 | ||
Net Asset Value, offering price and redemption price per share ($44,353,678 ÷ 44,342,833 shares) | $ | 1.0002 | ||
| Statement of Operations | ||||
Year ended March 31, 2024 | ||||
| Investment Income | ||||
| Interest | $ | 3,496,219 | ||
| Income from Fidelity Central Funds | 272,677 | |||
| Total income | 3,768,896 | |||
| Expenses | ||||
| Management fee | $ | 147,187 | ||
| Custodian fees and expenses | 4,368 | |||
| Independent trustees' fees and expenses | 404 | |||
| Registration fees | 21,726 | |||
| Audit | 41,193 | |||
| Legal | 96 | |||
| Miscellaneous | 373 | |||
| Total expenses before reductions | 215,347 | |||
| Expense reductions | (67,252) | |||
| Total expenses after reductions | 148,095 | |||
| Net Investment income (loss) | 3,620,801 | |||
| Realized and Unrealized Gain (Loss) | ||||
| Net realized gain (loss) on: | ||||
| Investment Securities: | ||||
| Unaffiliated issuers | (656) | |||
| Fidelity Central Funds | 851 | |||
| Total net realized gain (loss) | 195 | |||
| Change in net unrealized appreciation (depreciation) on: | ||||
| Investment Securities: | ||||
| Unaffiliated issuers | (27,116) | |||
| Fidelity Central Funds | 151 | |||
| Total change in net unrealized appreciation (depreciation) | (26,965) | |||
| Net gain (loss) | (26,770) | |||
| Net increase in net assets resulting from operations | $ | 3,594,031 | ||
| Statement of Changes in Net Assets | ||||
Year ended March 31, 2024 | Year ended March 31, 2023 | |||
| Increase (Decrease) in Net Assets | ||||
| Operations | ||||
| Net investment income (loss) | $ | 3,620,801 | $ | 5,336,986 |
| Net realized gain (loss) | 195 | (26,537) | ||
| Change in net unrealized appreciation (depreciation) | (26,965) | 209,645 | ||
Net increase in net assets resulting from operations | 3,594,031 | 5,520,094 | ||
| Distributions to shareholders | (3,619,585) | (5,339,450) | ||
| Share transactions | ||||
| Proceeds from sales of shares | 12,384,099 | 53,902,848 | ||
| Reinvestment of distributions | 3,619,585 | 5,339,450 | ||
| Cost of shares redeemed | (132,108,751) | (436,349,504) | ||
Net increase (decrease) in net assets and shares resulting from share transactions | (116,105,067) | (377,107,206) | ||
| Total increase (decrease) in net assets | (116,130,621) | (376,926,562) | ||
| Net Assets | ||||
| Beginning of period | 160,484,299 | 537,410,861 | ||
| End of period | $ | 44,353,678 | $ | 160,484,299 |
| Other Information | ||||
| Shares | ||||
| Sold | 12,380,540 | 53,885,181 | ||
| Issued in reinvestment of distributions | 3,618,521 | 5,337,763 | ||
| Redeemed | (132,071,921) | (436,220,379) | ||
| Net increase (decrease) | (116,072,860) | (376,997,435) | ||
Fidelity® SAI Municipal Money Market Fund |
| Years ended March 31, | 2024 | 2023 | 2022 | 2021 | 2020 | |||||
Selected Per-Share Data | ||||||||||
| Net asset value, beginning of period | $ | 1.0004 | $ | 1.0000 | $ | 1.0004 | $ | 1.0002 | $ | 1.0001 |
| Income from Investment Operations | ||||||||||
Net investment income (loss) A | .0346 | .0180 | .0003 | .0013 | .0142 | |||||
| Net realized and unrealized gain (loss) | (.0002) | .0004 | (.0003) | .0002 | .0001 | |||||
| Total from investment operations | .0344 | .0184 | - | .0015 | .0143 | |||||
| Distributions from net investment income | (.0346) | (.0180) | (.0003) | (.0013) | (.0142) | |||||
| Distributions from net realized gain | - | - | (.0001) | (.0001) | - | |||||
| Total distributions | (.0346) | (.0180) | (.0004) | (.0013) B | (.0142) | |||||
| Net asset value, end of period | $ | 1.0002 | $ | 1.0004 | $ | 1.0000 | $ | 1.0004 | $ | 1.0002 |
Total Return C | 3.47 % | 1.85% | -% | .15% | 1.44% | |||||
Ratios to Average Net Assets A,D,E | ||||||||||
| Expenses before reductions | .20% | .16% | .16% | .16% | .19% | |||||
| Expenses net of fee waivers, if any | .14 % | .14% | .09% | .12% | .14% | |||||
| Expenses net of all reductions | .14% | .14% | .09% | .12% | .14% | |||||
| Net investment income (loss) | 3.43% | 1.57% | .03% | .08% | 1.41% | |||||
| Supplemental Data | ||||||||||
| Net assets, end of period (000 omitted) | $ | 44,354 | $ | 160,484 | $ | 537,411 | $ | 445,828 | $ | 134,798 |
| Fidelity Central Fund | Investment Manager | Investment Objective | Investment Practices | Expense RatioA |
| Fidelity Money Market Central Funds | Fidelity Management & Research Company LLC (FMR) | Each fund seeks to obtain a high level of current income consistent with the preservation of capital and liquidity. | Short-term Investments | Less than .005% |
| Gross unrealized appreciation | $1,179 |
| Gross unrealized depreciation | (547) |
| Net unrealized appreciation (depreciation) | $632 |
| Tax Cost | $47,258,059 |
| Undistributed tax-exempt income | $440 |
| Capital loss carryforward | $(25,462) |
| Net unrealized appreciation (depreciation) on securities and other investments | $632 |
Short-term | $(25,462) |
| March 31, 2024 | March 31, 2023 | |
| Tax-exempt Income | 3,619,585 | 5,336,470 |
| Ordinary Income | - | $2,980 |
| Total | $3,619,585 | $5,339,450 |
| Purchases ($) | Sales ($) | Realized Gain (Loss)($) | |
| Fidelity SAI Municipal Money Market Fund | 513,344 | 61,585,000 | - |
| Strategic Advisers Tax-Sensitive Short Duration Fund | |
| Fidelity SAI Municipal Money Market Fund | 99% |
| Fund | % of shares held |
| Fidelity SAI Municipal Money Market Fund | 100% |
| The Example is based on an investment of $1,000 invested at the beginning of the period and held for the entire period (October 1, 2023 to March 31, 2024). |
Annualized Expense Ratio- A | Beginning Account Value October 1, 2023 | Ending Account Value March 31, 2024 | Expenses Paid During Period- C October 1, 2023 to March 31, 2024 | |||||||
Fidelity® SAI Municipal Money Market Fund ** | .14% | |||||||||
| Actual | $ 1,000 | $ 1,017.50 | $ .71 | |||||||
Hypothetical-B | $ 1,000 | $ 1,024.30 | $ .71 | |||||||
Annualized Expense Ratio- A | Expenses Paid | |||||
| Fidelity® SAI Municipal Money Market Fund | .07% | |||||
| Actual | $ 0.35 | |||||
Hypothetical- B | $ 0.35 | |||||
| A Annualized expense ratio reflects expenses net of applicable fee waivers. | ||||||
| B 5% return per year before expenses |
| A special meeting of shareholders was held on October 18, 2023. The results of votes taken among shareholders on the proposal before them are reported below. Each vote reported represents one dollar of net asset value held on the record date for the meeting. | ||
| Proposal 1 | ||
| To elect a Board of Trustees. | ||
# of Votes | % of Votes | |
| Abigail P. Johnson | ||
| Affirmative | 378,729,502,260.01 | 97.58 |
| Withheld | 9,407,876,478.96 | 2.42 |
| TOTAL | 388,137,378,738.97 | 100.00 |
| Jennifer Toolin McAuliffe | ||
| Affirmative | 378,454,868,010.95 | 97.51 |
| Withheld | 9,682,510,728.02 | 2.49 |
| TOTAL | 388,137,378,738.97 | 100.00 |
| Christine J. Thompson | ||
| Affirmative | 378,837,121,274.52 | 97.60 |
| Withheld | 9,300,257,464.45 | 2.40 |
| TOTAL | 388,137,378,738.97 | 100.00 |
| Elizabeth S. Acton | ||
| Affirmative | 378,262,110,794.85 | 97.46 |
| Withheld | 9,875,267,944.12 | 2.54 |
| TOTAL | 388,137,378,738.97 | 100.00 |
| Laura M. Bishop | ||
| Affirmative | 380,482,113,171.06 | 98.03 |
| Withheld | 7,655,265,567.91 | 1.97 |
| TOTAL | 388,137,378,738.97 | 100.00 |
| Ann E. Dunwoody | ||
| Affirmative | 380,016,034,008.12 | 97.91 |
| Withheld | 8,121,344,730.85 | 2.09 |
| TOTAL | 388,137,378,738.97 | 100.00 |
| John Engler | ||
| Affirmative | 379,432,488,394.20 | 97.76 |
| Withheld | 8,704,890,344.77 | 2.24 |
| TOTAL | 388,137,378,738.97 | 100.00 |
| Robert F. Gartland | ||
| Affirmative | 378,741,819,600.60 | 97.58 |
| Withheld | 9,395,559,138.37 | 2.42 |
| TOTAL | 388,137,378,738.97 | 100.00 |
| Robert W. Helm | ||
| Affirmative | 380,389,324,755.07 | 98.00 |
| Withheld | 7,748,053,983.90 | 2.00 |
| TOTAL | 388,137,378,738.97 | 100.00 |
| Arthur E. Johnson | ||
| Affirmative | 378,427,694,151.67 | 97.50 |
| Withheld | 9,709,684,587.30 | 2.50 |
| TOTAL | 388,137,378,738.97 | 100.00 |
| Michael E. Kenneally | ||
| Affirmative | 377,842,228,145.18 | 97.35 |
| Withheld | 10,295,150,593.79 | 2.65 |
| TOTAL | 388,137,378,738.97 | 100.00 |
| Mark A. Murray | ||
| Affirmative | 380,158,432,703.37 | 97.94 |
| Withheld | 7,978,946,035.60 | 2.06 |
| TOTAL | 388,137,378,738.97 | 100.00 |
| Carol J. Zierhoffer | ||
| Affirmative | 380,522,113,360.24 | 98.04 |
| Withheld | 7,615,265,378.73 | 1.96 |
| TOTAL | 388,137,378,738.97 | 100.00 |
| Proposal 1 reflects trust-wide proposal and voting results. | ||
 |
Item 2.
Code of Ethics
As of the end of the period, March 31, 2024, Fidelity Salem Street Trust (the trust) has adopted a code of ethics, as defined in Item 2 of Form N-CSR, that applies to its President and Treasurer and its Chief Financial Officer. A copy of the code of ethics is filed as an exhibit to this Form N-CSR.
Item 3.
Audit Committee Financial Expert
The Board of Trustees of the trust has determined that Elizabeth S. Acton is an audit committee financial expert, as defined in Item 3 of Form N-CSR. Ms. Acton is independent for purposes of Item 3 of Form N-CSR.
Item 4.
Principal Accountant Fees and Services
Fees and Services
The following table presents fees billed by PricewaterhouseCoopers LLP (“PwC”) in each of the last two fiscal years for services rendered to Fidelity SAI Municipal Money Market Fund (the “Fund”):
Services Billed by PwC
March 31, 2024 FeesA
Audit Fees | Audit-Related Fees | Tax Fees | All Other Fees | |
Fidelity SAI Municipal Money Market Fund | $34,500 | $2,700 | $2,100 | $1,100 |
March 31, 2023 FeesA
Audit Fees | Audit-Related Fees | Tax Fees | All Other Fees | |
Fidelity SAI Municipal Money Market Fund | $34,700 | $2,600 | $2,100 | $1,100 |
A Amounts may reflect rounding.
The following table(s) present(s) fees billed by PwC that were required to be approved by the Audit Committee for services that relate directly to the operations and financial reporting of the Fund(s) and that are rendered on behalf of Fidelity Management & Research Company LLC ("FMR") and entities controlling, controlled by, or under
common control with FMR (not including any sub-adviser whose role is primarily portfolio management and is subcontracted with or overseen by another investment adviser) that provide ongoing services to the Fund(s) (“Fund Service Providers”):
Services Billed by PwC
March 31, 2024A | March 31, 2023A | |
Audit-Related Fees | $9,452,800 | $8,519,200 |
Tax Fees | $61,000 | $1,000 |
All Other Fees | $- | $- |
A Amounts may reflect rounding.
“Audit-Related Fees” represent fees billed for assurance and related services that are reasonably related to the performance of the fund audit or the review of the fund's financial statements and that are not reported under Audit Fees.
“Tax Fees” represent fees billed for tax compliance, tax advice or tax planning that relate directly to the operations and financial reporting of the fund.
“All Other Fees” represent fees billed for services provided to the fund or Fund Service Provider, a significant portion of which are assurance related, that relate directly to the operations and financial reporting of the fund, excluding those services that are reported under Audit Fees, Audit-Related Fees or Tax Fees.
Assurance services must be performed by an independent public accountant.
* * *
The aggregate non-audit fees billed by PwC for services rendered to the Fund(s), FMR (not including any sub-adviser whose role is primarily portfolio management and is subcontracted with or overseen by another investment adviser), and any Fund Service Provider for each of the last two fiscal years of the Fund(s) are as follows:
Billed By | March 31, 2024A | March 31, 2023A |
PwC | $15,004,400 | $14,279,800 |
A Amounts may reflect rounding.
The trust's Audit Committee has considered non-audit services that were not pre-approved that were provided by PwC to Fund Service Providers to be compatible with maintaining the independence of PwC in its(their) audit of the Fund(s), taking into account representations from PwC, in accordance with Public Company Accounting Oversight Board rules, regarding its independence from the Fund(s) and its(their) related
entities and FMR’s review of the appropriateness and permissibility under applicable law of such non-audit services prior to their provision to the Fund(s) Service Providers.
Audit Committee Pre-Approval Policies and Procedures
The trust’s Audit Committee must pre-approve all audit and non-audit services provided by a fund’s independent registered public accounting firm relating to the operations or financial reporting of the fund. Prior to the commencement of any audit or non-audit services to a fund, the Audit Committee reviews the services to determine whether they are appropriate and permissible under applicable law.
The Audit Committee has adopted policies and procedures to, among other purposes, provide a framework for the Committee’s consideration of non-audit services by the audit firms that audit the Fidelity funds. The policies and procedures require that any non-audit service provided by a fund audit firm to a Fidelity fund and any non-audit service provided by a fund auditor to a Fund Service Provider that relates directly to the operations and financial reporting of a Fidelity fund (“Covered Service”) are subject to approval by the Audit Committee before such service is provided.
All Covered Services must be approved in advance of provision of the service either: (i) by formal resolution of the Audit Committee, or (ii) by oral or written approval of the service by the Chair of the Audit Committee (or if the Chair is unavailable, such other member of the Audit Committee as may be designated by the Chair to act in the Chair’s absence). The approval contemplated by (ii) above is permitted where the Treasurer determines that action on such an engagement is necessary before the next meeting of the Audit Committee.
Non-audit services provided by a fund audit firm to a Fund Service Provider that do not relate directly to the operations and financial reporting of a Fidelity fund are reported to the Audit Committee periodically.
Non-Audit Services Approved Pursuant to Rule 2-01(c)(7)(i)(C) and (ii) of Regulation S-X (“De Minimis Exception”)
There were no non-audit services approved or required to be approved by the Audit Committee pursuant to the De Minimis Exception during the Fund’s(s’) last two fiscal years relating to services provided to (i) the Fund(s) or (ii) any Fund Service Provider that relate directly to the operations and financial reporting of the Fund(s).
The Registrant has not retained, for the preparation of the audit report on the financial statements included in the Form N-CSR, a registered public accounting firm that has a branch or office that is located in a foreign jurisdiction and that the Public Company Accounting Oversight Board (the “PCAOB”) has determined that the PCAOB is unable to inspect or investigate completely because of a position taken by an authority in the foreign jurisdiction.
The Registrant is not a “foreign issuer,” as defined in 17 CFR 240.3b-4.
Item 5.
Audit Committee of Listed Registrants
Not applicable.
Item 6.
Investments
(a)
Not applicable.
(b)
Not applicable.
Item 7.
Disclosure of Proxy Voting Policies and Procedures for Closed-End Management Investment Companies
Not applicable.
Item 8.
Portfolio Managers of Closed-End Management Investment Companies
Not applicable.
Item 9.
Purchase of Equity Securities by Closed-End Management Investment Company and Affiliated Purchasers
Not applicable.
Item 10.
Submission of Matters to a Vote of Security Holders
There were no material changes to the procedures by which shareholders may recommend nominees to the trust’s Board of Trustees.
Item 11.
Controls and Procedures
(a)(i) The President and Treasurer and the Chief Financial Officer have concluded that the trust’s disclosure controls and procedures (as defined in Rule 30a-3(c) under the Investment Company Act) provide reasonable assurances that material information relating to the trust is made known to them by the appropriate persons, based on their evaluation of these controls and procedures as of a date within 90 days of the filing date of this report.
(a)(ii) There was no change in the trust’s internal control over financial reporting (as defined in Rule 30a-3(d) under the Investment Company Act) that occurred during the period covered by this report that has materially affected, or is reasonably likely to materially affect, the trust’s internal control over financial reporting.
Item 12.
Disclosure of Securities Lending Activities for Closed-End Management
Investment Companies
Not applicable.
Item 18.
Recovery of Erroneously Awarded Compensation
(a)
Not applicable.
(b)
Not applicable.
Item 19.
Exhibits
(a) | (1) | Code of Ethics pursuant to Item 2 of Form N-CSR is filed and attached hereto as EX-99.CODE ETH. |
(a) | (2) | |
(a) | (3) | Not applicable. |
(b) |
SIGNATURES
Pursuant to the requirements of the Securities Exchange Act of 1934 and the Investment Company Act of 1940, the registrant has duly caused this report to be signed on its behalf by the undersigned, thereunto duly authorized.
Fidelity Salem Street Trust
By: | /s/Laura M. Del Prato |
Laura M. Del Prato | |
President and Treasurer (Principal Executive Officer) | |
Date: | May 22, 2024 |
Pursuant to the requirements of the Securities Exchange Act of 1934 and the Investment Company Act of 1940, this report has been signed below by the following persons on behalf of the registrant and in the capacities and on the dates indicated.
By: | /s/Laura M. Del Prato |
Laura M. Del Prato | |
President and Treasurer (Principal Executive Officer) | |
Date: | May 22, 2024 |
By: | /s/John J. Burke III |
John J. Burke III | |
Chief Financial Officer (Principal Financial Officer) | |
Date: | May 22, 2024 |