UNITED STATES
SECURITIES AND EXCHANGE COMMISSION
Washington, D.C. 20549
FORM N-CSR
CERTIFIED SHAREHOLDER REPORT OF REGISTERED
MANAGEMENT INVESTMENT COMPANIES
Investment Company Act file number 811-02105
Fidelity Salem Street Trust
(Exact name of registrant as specified in charter)
245 Summer St., Boston, Massachusetts 02210
(Address of principal executive offices) (Zip code)
Margaret Carey, Secretary
245 Summer St.
Boston, Massachusetts 02210
(Name and address of agent for service)
Registrant's telephone number, including area code:
617-563-7000
Date of fiscal year end: | July 31 |
Date of reporting period: | July 31, 2024 |
Item 1.
Reports to Stockholders
ANNUAL SHAREHOLDER REPORT | AS OF JULY 31, 2024 | ||
| | Fidelity® SAI U.S. Quality Index Fund Fidelity® SAI U.S. Quality Index Fund : FUQIX | |
| Costs of a $10,000 investment | Costs paid as a percentage of a $10,000 investment | ||
| Fidelity® SAI U.S. Quality Index Fund | $ 12 | 0.11% |
Fidelity® SAI U.S. Quality Index Fund | $10,000 | $10,901 | $12,503 | $15,093 | $16,556 | $19,890 | $26,383 | $24,654 | $28,344 | $35,673 |
Fidelity SAI U.S. Quality Index Fund Linked Index℠ | $10,000 | $10,911 | $12,543 | $15,159 | $16,640 | $19,994 | $26,537 | $24,791 | $28,554 | $35,908 |
Fidelity U.S. Quality Focus Index℠ | $10,000 | $10,901 | $12,503 | $15,093 | $16,573 | $19,914 | $26,430 | $24,691 | $28,439 | $35,763 |
S&P 500® Index | $10,000 | $10,983 | $12,745 | $14,815 | $15,998 | $17,911 | $24,439 | $23,305 | $26,339 | $32,172 |
| 2015 | 2016 | 2017 | 2018 | 2019 | 2020 | 2021 | 2022 | 2023 | 2024 |
 |
| 1 Year | 5 Year | Life of Fund A | |
| Fidelity® SAI U.S. Quality Index Fund | 25.86% | 16.59% | 15.51% |
| Fidelity SAI U.S. Quality Index Fund Linked Index℠ | 25.76% | 16.63% | 15.60% |
| Fidelity U.S. Quality Focus Index℠ | 25.76% | 16.63% | -% |
| S&P 500® Index | 22.15% | 15.00% | 14.17% |
Visit www.fidelity.com for more recent performance information. |
The Fund's past performance is not a good predictor of the Fund's future performance. The graph and table do not reflect the deduction of taxes that a shareholder would pay on fund distributions or redemption of fund shares. |
KEY FACTS | ||
| Fund Size | $14,176,823,098 | |
| Number of Holdings | 87 | |
| Total Advisory Fee | $13,330,347 | |
| Portfolio Turnover | 53% |
(as of July 31, 2024)
MARKET SECTORS (% of Fund's net assets) | ||
| Information Technology | 41.0 | |
| Health Care | 15.1 | |
| Communication Services | 11.9 | |
| Financials | 10.8 | |
| Industrials | 7.0 | |
| Consumer Staples | 6.8 | |
| Consumer Discretionary | 5.8 | |
| Real Estate | 1.1 | |
| Energy | 0.2 | |
| Materials | 0.1 | |
| Common Stocks | 99.8 |
| Short-Term Investments and Net Other Assets (Liabilities) | 0.2 |
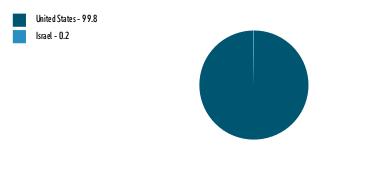
ASSET ALLOCATION (% of Fund's net assets) |
 |
| United States | 99.8 |
| Israel | 0.2 |
GEOGRAPHIC DIVERSIFICATION (% of Fund's net assets) |
 |
TOP HOLDINGS (% of Fund's net assets) | ||
| Apple Inc | 9.7 | |
| NVIDIA Corp | 8.6 | |
| Alphabet Inc Class A | 6.5 | |
| Meta Platforms Inc Class A | 4.9 | |
| Microsoft Corp | 4.1 | |
| Johnson & Johnson | 4.0 | |
| Mastercard Inc Class A | 3.8 | |
| Visa Inc Class A | 3.7 | |
| Coca-Cola Co/The | 3.6 | |
| Adobe Inc | 3.4 | |
| 52.3 | ||
| Fidelity, the Fidelity Investments Logo and all other Fidelity trademarks or service marks used herein are trademarks or service marks of FMR LLC. Any third-party marks that are used herein are trademarks or service marks of their respective owners. © 2024 FMR LLC. All rights reserved. | ||
 | For additional information about the Fund; including its prospectus, financial information, holdings and proxy information, scan the QR code or visit fundresearch.fidelity.com/prospectus/sec 1.9913531.100 2803-TSRA-0924 | |
ANNUAL SHAREHOLDER REPORT | AS OF JULY 31, 2024 | This report describes changes to the Fund that occurred during the reporting period. | |
| | Fidelity® SAI Small-Mid Cap 500 Index Fund Fidelity® SAI Small-Mid Cap 500 Index Fund : FZFLX | |
| Costs of a $10,000 investment | Costs paid as a percentage of a $10,000 investment | ||
| Fidelity® SAI Small-Mid Cap 500 Index Fund | $ 6 | 0.05% |
Fidelity® SAI Small-Mid Cap 500 Index Fund | $10,000 | $10,326 | $11,608 | $13,455 | $14,162 | $14,159 | $20,812 | $18,952 | $20,529 | $23,029 |
Russell SMID 500™ Index | $10,000 | $10,335 | $11,622 | $13,496 | $14,206 | $14,207 | $20,895 | $19,035 | $20,592 | $23,107 |
Russell 3000® Index | $10,000 | $10,538 | $12,239 | $14,245 | $15,249 | $16,916 | $23,466 | $21,741 | $24,491 | $29,653 |
| 2015 | 2016 | 2017 | 2018 | 2019 | 2020 | 2021 | 2022 | 2023 | 2024 |
 |
| 1 Year | 5 Year | Life of Fund A | |
| Fidelity® SAI Small-Mid Cap 500 Index Fund | 12.18% | 10.21% | 9.74% |
| Russell SMID 500™ Index | 12.21% | 10.22% | 9.78% |
| Russell 3000® Index | 21.07% | 14.23% | 12.87% |
Visit www.fidelity.com for more recent performance information. |
The Fund's past performance is not a good predictor of the Fund's future performance. The graph and table do not reflect the deduction of taxes that a shareholder would pay on fund distributions or redemption of fund shares. |
KEY FACTS | ||
| Fund Size | $1,734,459,634 | |
| Number of Holdings | 506 | |
| Total Advisory Fee | $1,752,006 | |
| Portfolio Turnover | 31% |
(as of July 31, 2024)
MARKET SECTORS (% of Fund's net assets) | ||
| Industrials | 20.4 | |
| Financials | 15.9 | |
| Consumer Discretionary | 14.3 | |
| Information Technology | 11.0 | |
| Health Care | 9.5 | |
| Real Estate | 7.5 | |
| Materials | 6.9 | |
| Energy | 5.1 | |
| Consumer Staples | 3.9 | |
| Communication Services | 3.4 | |
| Utilities | 2.1 | |
| Common Stocks | 100.0 |
| Short-Term Investments and Net Other Assets (Liabilities) | 0.0 |
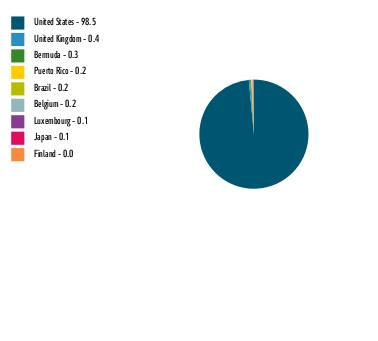
ASSET ALLOCATION (% of Fund's net assets) |
 |
| United States | 98.5 |
| United Kingdom | 0.4 |
| Bermuda | 0.3 |
| Puerto Rico | 0.2 |
| Brazil | 0.2 |
| Belgium | 0.2 |
| Luxembourg | 0.1 |
| Japan | 0.1 |
| Finland | 0.0 |
GEOGRAPHIC DIVERSIFICATION (% of Fund's net assets) |
 |
TOP HOLDINGS (% of Fund's net assets) | ||
| Eqt Corp | 0.7 | |
| Watsco Inc | 0.6 | |
| Lennox International Inc | 0.5 | |
| Packaging Corp of America | 0.5 | |
| Textron Inc | 0.5 | |
| EMCOR Group Inc | 0.5 | |
| Reliance Inc | 0.5 | |
| Avery Dennison Corp | 0.5 | |
| Everest Group Ltd | 0.5 | |
| Pure Storage Inc Class A | 0.4 | |
| 5.2 | ||
The fees associated with this class changed during the reporting year. The variations in class fees are primarily the result of the following changes:
|
| Fidelity, the Fidelity Investments Logo and all other Fidelity trademarks or service marks used herein are trademarks or service marks of FMR LLC. Any third-party marks that are used herein are trademarks or service marks of their respective owners. © 2024 FMR LLC. All rights reserved. | ||
 | For additional information about the Fund; including its prospectus, financial information, holdings and proxy information, scan the QR code or visit fundresearch.fidelity.com/prospectus/sec 1.9913530.100 2786-TSRA-0924 | |
ANNUAL SHAREHOLDER REPORT | AS OF JULY 31, 2024 | This report describes changes to the Fund that occurred during the reporting period. | |
| | Fidelity® SAI U.S. Momentum Index Fund Fidelity® SAI U.S. Momentum Index Fund : FUMIX | |
| Costs of a $10,000 investment | Costs paid as a percentage of a $10,000 investment | ||
| Fidelity® SAI U.S. Momentum Index Fund | $ 15 | 0.13% |
Fidelity® SAI U.S. Momentum Index Fund | $10,000 | $10,980 | $13,432 | $14,363 | $16,770 | $22,301 | $19,835 | $21,024 |
MSCI USA Custom Momentum Composite Index | $10,000 | $11,002 | $13,464 | $14,416 | $16,851 | $22,435 | $19,974 | $21,212 |
MSCI USA Index | $10,000 | $10,768 | $12,450 | $13,375 | $15,041 | $20,620 | $19,123 | $21,529 |
| 2017 | 2018 | 2019 | 2020 | 2021 | 2022 | 2023 | 2024 |
 |
| 1 Year | 5 Year | Life of Fund A | |
| Fidelity® SAI U.S. Momentum Index Fund | 35.08% | 14.61% | 14.98% |
| MSCI USA Custom Momentum Composite Index | 35.04% | 14.72% | 15.11% |
| MSCI USA Index | 21.48% | 14.35% | 13.72% |
Visit www.fidelity.com for more recent performance information. |
The Fund's past performance is not a good predictor of the Fund's future performance. The graph and table do not reflect the deduction of taxes that a shareholder would pay on fund distributions or redemption of fund shares. |
KEY FACTS | ||
| Fund Size | $645,694,919 | |
| Number of Holdings | 234 | |
| Total Advisory Fee | $446,924 | |
| Portfolio Turnover | 104% |
(as of July 31, 2024)
MARKET SECTORS (% of Fund's net assets) | ||
| Information Technology | 30.9 | |
| Financials | 15.4 | |
| Industrials | 15.2 | |
| Communication Services | 10.4 | |
| Consumer Discretionary | 10.0 | |
| Health Care | 9.8 | |
| Consumer Staples | 4.1 | |
| Utilities | 1.5 | |
| Materials | 1.4 | |
| Energy | 0.9 | |
| Real Estate | 0.3 | |
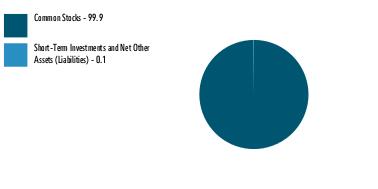
| Common Stocks | 99.9 |
| Short-Term Investments and Net Other Assets (Liabilities) | 0.1 |
ASSET ALLOCATION (% of Fund's net assets) |
 |
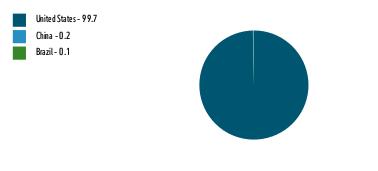
| United States | 99.7 |
| China | 0.2 |
| Brazil | 0.1 |
GEOGRAPHIC DIVERSIFICATION (% of Fund's net assets) |
 |
TOP HOLDINGS (% of Fund's net assets) | ||
| Broadcom Inc | 5.2 | |
| Amazon.com Inc | 5.2 | |
| NVIDIA Corp | 5.1 | |
| Meta Platforms Inc Class A | 4.9 | |
| Eli Lilly & Co | 4.7 | |
| JPMorgan Chase & Co | 3.8 | |
| Microsoft Corp | 3.2 | |
| Costco Wholesale Corp | 3.2 | |
| General Electric Co | 2.3 | |
| Netflix Inc | 1.9 | |
| 39.5 | ||
The fees associated with this class changed during the reporting year. The variations in class fees are primarily the result of the following changes:
|
| Fidelity, the Fidelity Investments Logo and all other Fidelity trademarks or service marks used herein are trademarks or service marks of FMR LLC. Any third-party marks that are used herein are trademarks or service marks of their respective owners. © 2024 FMR LLC. All rights reserved. | ||
 | For additional information about the Fund; including its prospectus, financial information, holdings and proxy information, scan the QR code or visit fundresearch.fidelity.com/prospectus/sec 1.9913545.100 2882-TSRA-0924 | |
ANNUAL SHAREHOLDER REPORT | AS OF JULY 31, 2024 | ||
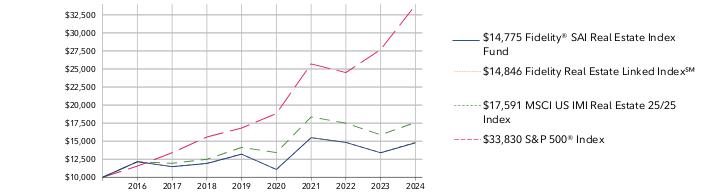
| | Fidelity® Real Estate Index Fund Fidelity® Real Estate Index Fund : FSRNX | |
| Costs of a $10,000 investment | Costs paid as a percentage of a $10,000 investment | ||
| Fidelity® Real Estate Index Fund | $ 7 | 0.07% |
Fidelity® Real Estate Index Fund | $10,000 | $11,129 | $13,433 | $12,680 | $13,174 | $14,602 | $12,216 | $17,069 | $16,350 | $14,764 | $16,333 |
Fidelity Real Estate Linked Index℠ | $10,000 | $11,129 | $13,457 | $12,695 | $13,185 | $14,621 | $12,238 | $17,133 | $16,409 | $14,825 | $16,415 |
MSCI US IMI Real Estate 25/25 Index | $10,000 | $11,129 | $13,433 | $13,204 | $13,810 | $15,636 | $14,843 | $20,304 | $19,446 | $17,568 | $19,453 |
S&P 500® Index | $10,000 | $11,121 | $11,745 | $13,629 | $15,843 | $17,108 | $19,153 | $26,134 | $24,921 | $28,165 | $34,403 |
| 2014 | 2015 | 2016 | 2017 | 2018 | 2019 | 2020 | 2021 | 2022 | 2023 | 2024 |
 |
| 1 Year | 5 Year | 10 Year | |
| Fidelity® Real Estate Index Fund | 10.63% | 2.27% | 5.03% |
| Fidelity Real Estate Linked Index℠ | 10.73% | 2.34% | 5.08% |
| MSCI US IMI Real Estate 25/25 Index | 10.73% | 4.46% | -% |
| S&P 500® Index | 22.15% | 15.00% | 13.15% |
Visit www.fidelity.com for more recent performance information. |
The Fund's past performance is not a good predictor of the Fund's future performance. The graph and table do not reflect the deduction of taxes that a shareholder would pay on fund distributions or redemption of fund shares. |
KEY FACTS | ||
| Fund Size | $2,726,235,514 | |
| Number of Holdings | 156 | |
| Total Advisory Fee | $1,716,716 | |
| Portfolio Turnover | 5% |
(as of July 31, 2024)
TOP INDUSTRIES (% of Fund's net assets) | ||
| Specialized REITs | 36.0 | |
| Retail REITs | 13.1 | |
| Residential REITs | 12.8 | |
| Industrial REITs | 11.8 | |
| Health Care REITs | 10.6 | |
| Real Estate Management & Development | 7.6 | |
| Office REITs | 3.3 | |
| Hotel & Resort REITs | 2.5 | |
| Diversified REITs | 1.9 | |
| Common Stocks | 99.6 |
| Short-Term Investments and Net Other Assets (Liabilities) | 0.4 |
ASSET ALLOCATION (% of Fund's net assets) |
 |
| United States | 100.0 |
GEOGRAPHIC DIVERSIFICATION (% of Fund's net assets) |
 |
TOP HOLDINGS (% of Fund's net assets) | ||
| Prologis Inc | 8.1 | |
| American Tower Corp | 7.2 | |
| Equinix Inc | 5.3 | |
| Welltower Inc | 4.5 | |
| Simon Property Group Inc | 3.6 | |
| Realty Income Corp | 3.4 | |
| Crown Castle Inc | 3.4 | |
| Public Storage Operating Co | 3.2 | |
| Digital Realty Trust Inc | 3.2 | |
| CBRE Group Inc Class A | 2.4 | |
| 44.3 | ||
| Fidelity, the Fidelity Investments Logo and all other Fidelity trademarks or service marks used herein are trademarks or service marks of FMR LLC. Any third-party marks that are used herein are trademarks or service marks of their respective owners. © 2024 FMR LLC. All rights reserved. | ||
 | For additional information about the Fund; including its prospectus, financial information, holdings and proxy information, scan the QR code or visit fundresearch.fidelity.com/prospectus/sec 1.9913516.100 2355-TSRA-0924 | |
ANNUAL SHAREHOLDER REPORT | AS OF JULY 31, 2024 | This report describes changes to the Fund that occurred during the reporting period. | |
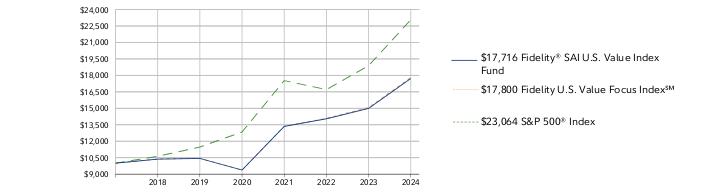
| | Fidelity® SAI U.S. Value Index Fund Fidelity® SAI U.S. Value Index Fund : FSWCX | |
| Costs of a $10,000 investment | Costs paid as a percentage of a $10,000 investment | ||
| Fidelity® SAI U.S. Value Index Fund | $ 12 | 0.11% |
Fidelity® SAI U.S. Value Index Fund | $10,000 | $10,367 | $10,431 | $9,375 | $13,348 | $14,044 | $14,991 | $17,716 |
Fidelity U.S. Value Focus Index℠ | $10,000 | $10,382 | $10,441 | $9,377 | $13,369 | $14,083 | $15,064 | $17,800 |
S&P 500® Index | $10,000 | $10,621 | $11,469 | $12,841 | $17,520 | $16,708 | $18,882 | $23,064 |
| 2017 | 2018 | 2019 | 2020 | 2021 | 2022 | 2023 | 2024 |
 |
| 1 Year | 5 Year | Life of Fund A | |
| Fidelity® SAI U.S. Value Index Fund | 18.17% | 11.17% | 9.02% |
| Fidelity U.S. Value Focus Index℠ | 18.16% | 11.26% | 9.10% |
| S&P 500® Index | 22.15% | 15.00% | 13.46% |
Visit www.fidelity.com for more recent performance information. |
The Fund's past performance is not a good predictor of the Fund's future performance. The graph and table do not reflect the deduction of taxes that a shareholder would pay on fund distributions or redemption of fund shares. |
KEY FACTS | ||
| Fund Size | $4,113,484,200 | |
| Number of Holdings | 204 | |
| Total Advisory Fee | $1,879,685 | |
| Portfolio Turnover | 63% |
(as of July 31, 2024)
MARKET SECTORS (% of Fund's net assets) | ||
| Financials | 23.1 | |
| Information Technology | 20.7 | |
| Energy | 13.3 | |
| Health Care | 12.9 | |
| Communication Services | 8.6 | |
| Consumer Discretionary | 5.9 | |
| Industrials | 5.4 | |
| Materials | 5.3 | |
| Consumer Staples | 3.7 | |
| Real Estate | 0.4 | |
| Utilities | 0.2 | |
| Common Stocks | 99.5 |
| Short-Term Investments and Net Other Assets (Liabilities) | 0.5 |
ASSET ALLOCATION (% of Fund's net assets) |
 |
| United States | 99.2 |
| Ireland | 0.2 |
| Bermuda | 0.2 |
| China | 0.2 |
| Peru | 0.2 |
GEOGRAPHIC DIVERSIFICATION (% of Fund's net assets) |
 |
TOP HOLDINGS (% of Fund's net assets) | ||
| Exxon Mobil Corp | 3.8 | |
| JPMorgan Chase & Co | 3.8 | |
| Chevron Corp | 3.5 | |
| Bank of America Corp | 3.3 | |
| Microsoft Corp | 3.2 | |
| Apple Inc | 3.2 | |
| NVIDIA Corp | 2.8 | |
| Wells Fargo & Co | 2.7 | |
| Cisco Systems Inc | 2.6 | |
| International Business Machines Corp | 2.4 | |
| 31.3 | ||
The fees associated with this class changed during the reporting year. The variations in class fees are primarily the result of the following changes:
|
| Fidelity, the Fidelity Investments Logo and all other Fidelity trademarks or service marks used herein are trademarks or service marks of FMR LLC. Any third-party marks that are used herein are trademarks or service marks of their respective owners. © 2024 FMR LLC. All rights reserved. | ||
 | For additional information about the Fund; including its prospectus, financial information, holdings and proxy information, scan the QR code or visit fundresearch.fidelity.com/prospectus/sec 1.9913551.100 3056-TSRA-0924 | |
ANNUAL SHAREHOLDER REPORT | AS OF JULY 31, 2024 | This report describes changes to the Fund that occurred during the reporting period. | |
| | Fidelity® SAI Real Estate Index Fund Fidelity® SAI Real Estate Index Fund : FESIX | |
| Costs of a $10,000 investment | Costs paid as a percentage of a $10,000 investment | ||
| Fidelity® SAI Real Estate Index Fund | $ 7 | 0.07% |
Fidelity® SAI Real Estate Index Fund | $10,000 | $12,152 | $11,471 | $11,915 | $13,200 | $11,083 | $15,485 | $14,829 | $13,395 |
Fidelity Real Estate Linked Index℠ | $10,000 | $12,170 | $11,482 | $11,924 | $13,223 | $11,068 | $15,495 | $14,841 | $13,408 |
MSCI US IMI Real Estate 25/25 Index | $10,000 | $12,152 | $11,940 | $12,488 | $14,139 | $13,422 | $18,360 | $17,496 | $15,886 |
S&P 500® Index | $10,000 | $11,549 | $13,402 | $15,579 | $16,823 | $18,834 | $25,699 | $24,506 | $27,696 |
| 2016 | 2017 | 2018 | 2019 | 2020 | 2021 | 2022 | 2023 | 2024 |
 |
| 1 Year | 5 Year | Life of Fund A | |
| Fidelity® SAI Real Estate Index Fund | 10.30% | 2.28% | 4.70% |
| Fidelity Real Estate Linked Index℠ | 10.73% | 2.34% | 4.76% |
| MSCI US IMI Real Estate 25/25 Index | 10.73% | 4.46% | -% |
| S&P 500® Index | 22.15% | 15.00% | 15.42% |
Visit www.fidelity.com for more recent performance information. |
The Fund's past performance is not a good predictor of the Fund's future performance. The graph and table do not reflect the deduction of taxes that a shareholder would pay on fund distributions or redemption of fund shares. |
KEY FACTS | ||
| Fund Size | $2,578,643 | |
| Number of Holdings | 155 | |
| Total Advisory Fee | $56,242 | |
| Portfolio Turnover | 7% |
(as of July 31, 2024)
TOP INDUSTRIES (% of Fund's net assets) | ||
| Specialized REITs | 35.6 | |
| Retail REITs | 13.0 | |
| Residential REITs | 12.6 | |
| Industrial REITs | 11.7 | |
| Health Care REITs | 10.4 | |
| Real Estate Management & Development | 7.5 | |
| Office REITs | 3.3 | |
| Hotel & Resort REITs | 2.4 | |
| Diversified REITs | 2.0 | |
| Common Stocks | 98.5 |
| Short-Term Investments and Net Other Assets (Liabilities) | 1.5 |
ASSET ALLOCATION (% of Fund's net assets) |
 |
| United States | 100.0 |
GEOGRAPHIC DIVERSIFICATION (% of Fund's net assets) |
 |
TOP HOLDINGS (% of Fund's net assets) | ||
| Prologis Inc | 8.0 | |
| American Tower Corp | 7.1 | |
| Equinix Inc | 5.2 | |
| Welltower Inc | 4.3 | |
| Simon Property Group Inc | 3.5 | |
| Realty Income Corp | 3.4 | |
| Crown Castle Inc | 3.3 | |
| Public Storage Operating Co | 3.2 | |
| Digital Realty Trust Inc | 3.2 | |
| CBRE Group Inc Class A | 2.4 | |
| 43.6 | ||
The fees associated with this class changed during the reporting year. The variations in class fees are primarily the result of the following changes:
|
| Fidelity, the Fidelity Investments Logo and all other Fidelity trademarks or service marks used herein are trademarks or service marks of FMR LLC. Any third-party marks that are used herein are trademarks or service marks of their respective owners. © 2024 FMR LLC. All rights reserved. | ||
 | For additional information about the Fund; including its prospectus, financial information, holdings and proxy information, scan the QR code or visit fundresearch.fidelity.com/prospectus/sec 1.9913533.100 2810-TSRA-0924 | |
ANNUAL SHAREHOLDER REPORT | AS OF JULY 31, 2024 | This report describes changes to the Fund that occurred during the reporting period. | |
| | Fidelity® SAI U.S. Large Cap Index Fund Fidelity® SAI U.S. Large Cap Index Fund : FLCPX | |
| Costs of a $10,000 investment | Costs paid as a percentage of a $10,000 investment | ||
| Fidelity® SAI U.S. Large Cap Index Fund | $ 2 | 0.02% |
Fidelity® SAI U.S. Large Cap Index Fund | $10,000 | $11,550 | $13,401 | $15,574 | $16,816 | $18,807 | $25,659 | $24,459 | $27,635 |
S&P 500® Index | $10,000 | $11,549 | $13,402 | $15,579 | $16,823 | $18,834 | $25,699 | $24,506 | $27,696 |
| 2016 | 2017 | 2018 | 2019 | 2020 | 2021 | 2022 | 2023 | 2024 |
 |
| 1 Year | 5 Year | Life of Fund A | |
| Fidelity® SAI U.S. Large Cap Index Fund | 22.14% | 14.95% | 15.39% |
| S&P 500® Index | 22.15% | 15.00% | 15.42% |
Visit www.fidelity.com for more recent performance information. |
The Fund's past performance is not a good predictor of the Fund's future performance. The graph and table do not reflect the deduction of taxes that a shareholder would pay on fund distributions or redemption of fund shares. |
KEY FACTS | ||
| Fund Size | $14,911,051,242 | |
| Number of Holdings | 507 | |
| Total Advisory Fee | $1,842,847 | |
| Portfolio Turnover | 40% |
(as of July 31, 2024)
MARKET SECTORS (% of Fund's net assets) | ||
| Information Technology | 31.3 | |
| Financials | 13.0 | |
| Health Care | 11.8 | |
| Consumer Discretionary | 10.0 | |
| Communication Services | 8.8 | |
| Industrials | 8.4 | |
| Consumer Staples | 5.8 | |
| Energy | 3.7 | |
| Utilities | 2.4 | |
| Real Estate | 2.3 | |
| Materials | 2.2 | |
| Common Stocks | 99.7 |
| Short-Term Investments and Net Other Assets (Liabilities) | 0.3 |
ASSET ALLOCATION (% of Fund's net assets) |
 |
| United States | 99.5 |
| Ireland | 0.4 |
| China | 0.1 |
GEOGRAPHIC DIVERSIFICATION (% of Fund's net assets) |
 |
TOP HOLDINGS (% of Fund's net assets) | ||
| Apple Inc | 6.9 | |
| Microsoft Corp | 6.7 | |
| NVIDIA Corp | 6.3 | |
| Amazon.com Inc | 3.7 | |
| Meta Platforms Inc Class A | 2.2 | |
| Alphabet Inc Class A | 2.2 | |
| Alphabet Inc Class C | 1.8 | |
| Berkshire Hathaway Inc Class B | 1.8 | |
| Broadcom Inc | 1.6 | |
| Tesla Inc | 1.4 | |
| 34.6 | ||
The fees associated with this class changed during the reporting year. The variations in class fees are primarily the result of the following changes:
|
| Fidelity, the Fidelity Investments Logo and all other Fidelity trademarks or service marks used herein are trademarks or service marks of FMR LLC. Any third-party marks that are used herein are trademarks or service marks of their respective owners. © 2024 FMR LLC. All rights reserved. | ||
 | For additional information about the Fund; including its prospectus, financial information, holdings and proxy information, scan the QR code or visit fundresearch.fidelity.com/prospectus/sec 1.9913532.100 2807-TSRA-0924 | |
Item 2.
Code of Ethics
As of the end of the period, July 31, 2024, Fidelity Salem Street Trust (the trust) has adopted a code of ethics, as defined in Item 2 of Form N-CSR, that applies to its President and Treasurer and its Chief Financial Officer. A copy of the code of ethics is filed as an exhibit to this Form N-CSR.
Item 3.
Audit Committee Financial Expert
The Board of Trustees of the trust has determined that Elizabeth S. Acton is an audit committee financial expert, as defined in Item 3 of Form N-CSR. Ms. Acton is independent for purposes of Item 3 of Form N-CSR.
Item 4.
Principal Accountant Fees and Services
Fees and Services
The following table presents fees billed by Deloitte & Touche LLP, the member firms of Deloitte Touche Tohmatsu, and their respective affiliates (collectively, “Deloitte Entities”) in each of the last two fiscal years for services rendered to Fidelity Real Estate Index Fund, Fidelity SAI Real Estate Index Fund, Fidelity SAI Small-Mid Cap 500 Index Fund, Fidelity SAI U.S. Large Cap Index Fund, Fidelity SAI U.S. Momentum Index Fund and Fidelity SAI U.S. Quality Index Fund (the “Funds”):
Services Billed by Deloitte Entities
July 31, 2024 FeesA
Audit Fees | Audit-Related Fees | Tax Fees | All Other Fees | |
Fidelity Real Estate Index Fund | $35,600 | $- | $9,800 | $900 |
Fidelity SAI Real Estate Index Fund | $39,000 | $- | $10,000 | $1,000 |
Fidelity SAI Small-Mid Cap 500 Index Fund | $40,800 | $- | $8,400 | $1,000 |
Fidelity SAI U.S. Large Cap Index Fund | $39,000 | $- | $10,200 | $1,000 |
Fidelity SAI U.S. Momentum Index Fund | $41,400 | $- | $8,400 | $1,000 |
Fidelity SAI U.S. Quality Index Fund | $40,600 | $- | $8,400 | $1,000 |
July 31, 2023 FeesA
Audit Fees | Audit-Related Fees | Tax Fees | All Other Fees | |
Fidelity Real Estate Index Fund | $35,700 | $- | $8,800 | $900 |
Fidelity SAI Real Estate Index Fund | $37,700 | $- | $9,200 | $1,000 |
Fidelity SAI Small-Mid Cap 500 Index Fund | $41,000 | $- | $7,400 | $1,000 |
Fidelity SAI U.S. Large Cap Index Fund | $39,100 | $- | $9,200 | $1,000 |
Fidelity SAI U.S. Momentum Index Fund | $40,500 | $- | $7,400 | $1,000 |
Fidelity SAI U.S. Quality Index Fund | $40,700 | $- | $7,400 | $1,000 |
A Amounts may reflect rounding.
Services Billed by PwC
The following table presents fees billed by PricewaterhouseCoopers LLP (“PwC”) in each of the last two fiscal years for services rendered to Fidelity SAI U.S. Value Index Fund (the “Fund(s)”):
July 31, 2024 FeesA
Audit Fees | Audit-Related Fees | Tax Fees | All Other Fees | |
Fidelity SAI U.S. Value Index Fund | $38,100 | $3,500 | $9,800 | $1,500 |
July 31, 2023 Fees A
Audit Fees | Audit-Related Fees | Tax Fees | All Other Fees | |
Fidelity SAI U.S. Value Index Fund | $38,100 | $3,400 | $9,800 | $1,500 |
A Amounts may reflect rounding.
The following table(s) present(s) fees billed by Deloitte Entities and PwC that were required to be approved by the Audit Committee for services that relate directly to the operations and financial reporting of the Fund(s) and that are rendered on behalf of Fidelity Management & Research Company LLC ("FMR") and entities controlling, controlled by, or under common control with FMR (not including any sub-adviser whose role is primarily portfolio management and is subcontracted with or overseen by another
investment adviser) that provide ongoing services to the Fund(s) (“Fund Service Providers”):
Services Billed by Deloitte Entities
July 31, 2024A | July 31, 2023A | |
Audit-Related Fees | $200,000 | $80,000 |
Tax Fees | $- | $- |
All Other Fees | $1,929,500 | $- |
A Amounts may reflect rounding.
Services Billed by PwC
July 31, 2024A | July 31, 2023 A | |
Audit-Related Fees | $9,437,800 | $8,699,200 |
Tax Fees | $61,000 | $1,000 |
All Other Fees | $35,000 | $- |
A Amounts may reflect rounding.
“Audit-Related Fees” represent fees billed for assurance and related services that are reasonably related to the performance of the fund audit or the review of the fund's financial statements and that are not reported under Audit Fees.
“Tax Fees” represent fees billed for tax compliance, tax advice or tax planning that relate directly to the operations and financial reporting of the fund.
“All Other Fees” represent fees billed for services provided to the fund or Fund Service Provider, a significant portion of which are assurance related, that relate directly to the operations and financial reporting of the fund, excluding those services that are reported under Audit Fees, Audit-Related Fees or Tax Fees.
Assurance services must be performed by an independent public accountant.
* * *
The aggregate non-audit fees billed by Deloitte Entities and PwC for services rendered to the Fund(s), FMR (not including any sub-adviser whose role is primarily portfolio management and is subcontracted with or overseen by another investment adviser), and
any Fund Service Provider for each of the last two fiscal years of the Fund(s) are as follows:
Billed By | July 31, 2024A | July 31, 2023A |
Deloitte Entities | $5,009,600 | $3,353,300 |
PwC | $15,023,200 | $14,167,700 |
A Amounts may reflect rounding
The trust's Audit Committee has considered non-audit services that were not pre-approved that were provided by Deloitte Entities and PwC to Fund Service Providers to be compatible with maintaining the independence of Deloitte Entities and PwC in its(their) audit of the Fund(s), taking into account representations from Deloitte Entities and PwC, in accordance with Public Company Accounting Oversight Board rules, regarding its independence from the Fund(s) and its(their) related entities and FMR’s review of the appropriateness and permissibility under applicable law of such non-audit services prior to their provision to the Fund(s) Service Providers.
Audit Committee Pre-Approval Policies and Procedures
The trust’s Audit Committee must pre-approve all audit and non-audit services provided by a fund’s independent registered public accounting firm relating to the operations or financial reporting of the fund. Prior to the commencement of any audit or non-audit services to a fund, the Audit Committee reviews the services to determine whether they are appropriate and permissible under applicable law.
The Audit Committee has adopted policies and procedures to, among other purposes, provide a framework for the Committee’s consideration of non-audit services by the audit firms that audit the Fidelity funds. The policies and procedures require that any non-audit service provided by a fund audit firm to a Fidelity fund and any non-audit service provided by a fund auditor to a Fund Service Provider that relates directly to the operations and financial reporting of a Fidelity fund (“Covered Service”) are subject to approval by the Audit Committee before such service is provided.
All Covered Services must be approved in advance of provision of the service either: (i) by formal resolution of the Audit Committee, or (ii) by oral or written approval of the service by the Chair of the Audit Committee (or if the Chair is unavailable, such other member of the Audit Committee as may be designated by the Chair to act in the Chair’s absence). The approval contemplated by (ii) above is permitted where the Treasurer determines that action on such an engagement is necessary before the next meeting of the Audit Committee.
Non-audit services provided by a fund audit firm to a Fund Service Provider that do not relate directly to the operations and financial reporting of a Fidelity fund are reported to the Audit Committee periodically.
Non-Audit Services Approved Pursuant to Rule 2-01(c)(7)(i)(C) and (ii) of Regulation S-X (“De Minimis Exception”)
There were no non-audit services approved or required to be approved by the Audit Committee pursuant to the De Minimis Exception during the Fund’s(s’) last two fiscal years relating to services provided to (i) the Fund(s) or (ii) any Fund Service Provider that relate directly to the operations and financial reporting of the Fund(s).
The Registrant has not retained, for the preparation of the audit report on the financial statements included in the Form N-CSR, a registered public accounting firm that has a branch or office that is located in a foreign jurisdiction and that the Public Company Accounting Oversight Board (the “PCAOB”) has determined that the PCAOB is unable to inspect or investigate completely because of a position taken by an authority in the foreign jurisdiction.
The Registrant is not a “foreign issuer,” as defined in 17 CFR 240.3b-4.
Item 5.
Audit Committee of Listed Registrants
Not applicable.
Item 6.
Investments
(a)
Not applicable.
(b)
Not applicable.
Item 7.
Financial Statements and Financial Highlights for Open-End Management Investment Companies


Contents
| Common Stocks - 99.4% | |||
| Shares | Value ($) | ||
| COMMUNICATION SERVICES - 8.6% | |||
| Diversified Telecommunication Services - 4.0% | |||
| AT&T, Inc. | 3,872,515 | 74,545,914 | |
| Verizon Communications, Inc. | 2,273,365 | 92,116,750 | |
| 166,662,664 | |||
| Entertainment - 0.3% | |||
| Warner Bros Discovery, Inc. (a) | 1,204,278 | 10,417,005 | |
| Interactive Media & Services - 0.8% | |||
| Alphabet, Inc. Class A | 196,582 | 33,721,676 | |
| Media - 3.5% | |||
| Charter Communications, Inc. Class A (a) | 52,896 | 20,085,669 | |
| Comcast Corp. Class A | 2,114,000 | 87,244,780 | |
| Fox Corp. Class A | 191,299 | 7,277,014 | |
| Interpublic Group of Companies, Inc. | 203,842 | 6,557,597 | |
| Liberty Broadband Corp. Class C (a) | 69,158 | 4,660,558 | |
| Nexstar Media Group, Inc. | 16,845 | 3,112,788 | |
| Omnicom Group, Inc. (b) | 105,767 | 10,369,397 | |
| Paramount Global Class B (b) | 275,867 | 3,150,401 | |
| 142,458,204 | |||
TOTAL COMMUNICATION SERVICES | 353,259,549 | ||
| CONSUMER DISCRETIONARY - 5.8% | |||
| Automobile Components - 0.4% | |||
| Aptiv PLC (a) | 146,937 | 10,195,958 | |
| BorgWarner, Inc. | 123,052 | 4,344,966 | |
| Lear Corp. | 30,670 | 3,742,967 | |
| 18,283,891 | |||
| Automobiles - 1.4% | |||
| Ford Motor Co. | 2,117,944 | 22,916,154 | |
| General Motors Co. | 616,217 | 27,310,737 | |
| Harley-Davidson, Inc. | 66,107 | 2,479,013 | |
| Thor Industries, Inc. (b) | 28,800 | 3,056,832 | |
| 55,762,736 | |||
| Broadline Retail - 0.9% | |||
| Amazon.com, Inc. (a) | 107,656 | 20,129,519 | |
| eBay, Inc. | 273,284 | 15,197,323 | |
| Macy's, Inc. | 148,609 | 2,567,964 | |
| 37,894,806 | |||
| Distributors - 0.1% | |||
| LKQ Corp. | 144,082 | 5,979,403 | |
| Hotels, Restaurants & Leisure - 0.4% | |||
| Expedia Group, Inc. (a) | 68,562 | 8,753,311 | |
| Yum China Holdings, Inc. | 210,581 | 6,367,969 | |
| 15,121,280 | |||
| Household Durables - 2.2% | |||
| D.R. Horton, Inc. | 160,071 | 28,801,575 | |
| KB Home | 39,714 | 3,418,581 | |
| Lennar Corp. Class A | 138,636 | 24,528,867 | |
| Meritage Homes Corp. | 19,615 | 3,979,295 | |
| Mohawk Industries, Inc. (a) | 28,628 | 4,611,112 | |
| PulteGroup, Inc. | 113,603 | 14,995,596 | |
| Taylor Morrison Home Corp. (a) | 57,122 | 3,831,744 | |
| Toll Brothers, Inc. | 56,261 | 8,029,007 | |
| 92,195,777 | |||
| Leisure Products - 0.1% | |||
| Mattel, Inc. (a)(b) | 185,844 | 3,584,931 | |
| Specialty Retail - 0.1% | |||
| Signet Jewelers Ltd. | 24,118 | 2,029,047 | |
| Textiles, Apparel & Luxury Goods - 0.2% | |||
| PVH Corp. | 30,575 | 3,118,344 | |
| Tapestry, Inc. | 124,097 | 4,975,049 | |
| 8,093,393 | |||
TOTAL CONSUMER DISCRETIONARY | 238,945,264 | ||
| CONSUMER STAPLES - 3.6% | |||
| Beverages - 0.1% | |||
| Molson Coors Beverage Co. Class B (b) | 98,206 | 5,190,187 | |
| Consumer Staples Distribution & Retail - 0.7% | |||
| Albertsons Companies, Inc. | 217,723 | 4,317,447 | |
| Kroger Co. | 361,528 | 19,703,276 | |
| Walgreens Boots Alliance, Inc. (b) | 386,730 | 4,590,485 | |
| 28,611,208 | |||
| Food Products - 1.7% | |||
| Archer Daniels Midland Co. | 267,040 | 16,559,150 | |
| Bunge Global SA | 76,474 | 8,047,359 | |
| Conagra Brands, Inc. | 258,196 | 7,828,503 | |
| Darling Ingredients, Inc. (a) | 86,295 | 3,428,500 | |
| Ingredion, Inc. | 35,455 | 4,409,538 | |
| The J.M. Smucker Co. | 57,344 | 6,763,725 | |
| The Kraft Heinz Co. | 426,287 | 15,009,565 | |
| Tyson Foods, Inc. Class A | 154,474 | 9,407,467 | |
| 71,453,807 | |||
| Tobacco - 1.1% | |||
| Altria Group, Inc. | 927,668 | 45,465,009 | |
TOTAL CONSUMER STAPLES | 150,720,211 | ||
| ENERGY - 13.3% | |||
| Oil, Gas & Consumable Fuels - 13.3% | |||
| APA Corp. | 194,462 | 6,065,270 | |
| Chesapeake Energy Corp. | 60,161 | 4,592,089 | |
| Chevron Corp. | 887,397 | 142,400,597 | |
| Chord Energy Corp. | 33,584 | 5,765,029 | |
| Civitas Resources, Inc. | 49,733 | 3,469,374 | |
| ConocoPhillips Co. | 426,880 | 47,469,056 | |
| Coterra Energy, Inc. | 401,951 | 10,370,336 | |
| Devon Energy Corp. | 341,335 | 16,052,985 | |
| EOG Resources, Inc. | 310,394 | 39,357,959 | |
| Exxon Mobil Corp. | 1,317,250 | 156,212,671 | |
| HF Sinclair Corp. | 80,950 | 4,166,497 | |
| Marathon Oil Corp. | 304,629 | 8,544,843 | |
| Marathon Petroleum Corp. | 190,289 | 33,684,959 | |
| Matador Resources Co. | 62,675 | 3,853,259 | |
| Murphy Oil Corp. | 78,284 | 3,239,392 | |
| Occidental Petroleum Corp. | 359,146 | 21,843,260 | |
| Ovintiv, Inc. | 134,437 | 6,243,254 | |
| PBF Energy, Inc. Class A | 56,991 | 2,322,383 | |
| SM Energy Co. | 62,129 | 2,870,360 | |
| Valero Energy Corp. | 176,606 | 28,560,722 | |
| 547,084,295 | |||
| FINANCIALS - 23.0% | |||
| Banks - 16.0% | |||
| Bank of America Corp. | 3,418,354 | 137,793,850 | |
| Bank OZK | 56,976 | 2,671,605 | |
| Citigroup, Inc. | 1,030,184 | 66,838,338 | |
| Citizens Financial Group, Inc. | 245,751 | 10,486,195 | |
| Credicorp Ltd. (United States) | 36,702 | 6,262,829 | |
| East West Bancorp, Inc. | 75,149 | 6,604,846 | |
| Fifth Third Bancorp | 369,444 | 15,642,259 | |
| First Citizens Bancshares, Inc. | 6,428 | 13,419,671 | |
| First Horizon National Corp. | 295,356 | 4,941,306 | |
| Huntington Bancshares, Inc. | 782,724 | 11,701,724 | |
| JPMorgan Chase & Co. | 732,824 | 155,944,947 | |
| M&T Bank Corp. | 90,116 | 15,515,272 | |
| PNC Financial Services Group, Inc. | 214,905 | 38,919,296 | |
| Regions Financial Corp. | 494,627 | 11,064,806 | |
| U.S. Bancorp | 842,785 | 37,824,191 | |
| Webster Financial Corp. | 92,618 | 4,595,705 | |
| Wells Fargo & Co. | 1,882,914 | 111,732,117 | |
| Western Alliance Bancorp. | 58,875 | 4,737,083 | |
| 656,696,040 | |||
| Capital Markets - 1.1% | |||
| Affiliated Managers Group, Inc. | 17,209 | 3,194,335 | |
| Bank of New York Mellon Corp. | 403,886 | 26,280,862 | |
| State Street Corp. | 162,706 | 13,825,129 | |
| 43,300,326 | |||
| Consumer Finance - 1.0% | |||
| Capital One Financial Corp. | 206,368 | 31,244,115 | |
| Synchrony Financial | 216,869 | 11,014,777 | |
| 42,258,892 | |||
| Financial Services - 0.3% | |||
| Corebridge Financial, Inc. | 125,147 | 3,698,094 | |
| Essent Group Ltd. | 57,613 | 3,620,401 | |
| Jackson Financial, Inc. | 36,658 | 3,228,103 | |
| MGIC Investment Corp. | 143,980 | 3,576,463 | |
| 14,123,061 | |||
| Insurance - 4.4% | |||
| American International Group, Inc. | 358,439 | 28,399,122 | |
| Arch Capital Group Ltd. (a) | 201,976 | 19,345,261 | |
| Assured Guaranty Ltd. | 27,922 | 2,299,935 | |
| Chubb Ltd. | 219,308 | 60,454,443 | |
| Cincinnati Financial Corp. | 84,555 | 11,044,574 | |
| Enstar Group Ltd. (a) | 6,827 | 2,214,679 | |
| Everest Re Group Ltd. | 23,471 | 9,221,052 | |
| Globe Life, Inc. | 45,349 | 4,205,666 | |
| Hartford Financial Services Group, Inc. | 159,733 | 17,717,584 | |
| Lincoln National Corp. | 91,829 | 3,057,906 | |
| Markel Group, Inc. (a) | 7,023 | 11,509,644 | |
| RenaissanceRe Holdings Ltd. | 28,559 | 6,623,118 | |
| Unum Group | 96,146 | 5,531,279 | |
| 181,624,263 | |||
| Mortgage Real Estate Investment Trusts - 0.2% | |||
| AGNC Investment Corp. | 392,605 | 3,929,976 | |
| Rithm Capital Corp. | 261,120 | 3,031,603 | |
| 6,961,579 | |||
TOTAL FINANCIALS | 944,964,161 | ||
| HEALTH CARE - 12.9% | |||
| Biotechnology - 1.8% | |||
| Biogen, Inc. (a) | 78,635 | 16,764,982 | |
| Gilead Sciences, Inc. | 672,869 | 51,178,416 | |
| United Therapeutics Corp. (a) | 23,956 | 7,505,175 | |
| 75,448,573 | |||
| Health Care Equipment & Supplies - 2.0% | |||
| Baxter International, Inc. | 275,218 | 9,858,309 | |
| Medtronic PLC | 717,140 | 57,600,685 | |
| Zimmer Biomet Holdings, Inc. | 111,111 | 12,372,210 | |
| 79,831,204 | |||
| Health Care Providers & Services - 5.1% | |||
| Centene Corp. (a) | 288,221 | 22,169,959 | |
| Cigna Group | 153,425 | 53,494,695 | |
| CVS Health Corp. | 678,011 | 40,904,404 | |
| Elevance Health, Inc. | 125,526 | 66,783,598 | |
| Molina Healthcare, Inc. (a) | 31,649 | 10,800,854 | |
| Tenet Healthcare Corp. (a) | 52,757 | 7,897,723 | |
| Universal Health Services, Inc. Class B | 32,231 | 6,889,699 | |
| 208,940,932 | |||
| Pharmaceuticals - 4.0% | |||
| Bristol-Myers Squibb Co. | 1,094,811 | 52,069,211 | |
| Jazz Pharmaceuticals PLC (a) | 34,047 | 3,753,682 | |
| Organon & Co. | 138,895 | 3,036,245 | |
| Pfizer, Inc. | 3,060,455 | 93,466,296 | |
| Royalty Pharma PLC | 209,469 | 5,900,742 | |
| Viatris, Inc. | 643,069 | 7,755,412 | |
| 165,981,588 | |||
TOTAL HEALTH CARE | 530,202,297 | ||
| INDUSTRIALS - 5.5% | |||
| Air Freight & Logistics - 0.9% | |||
| FedEx Corp. | 122,273 | 36,957,014 | |
| Building Products - 0.6% | |||
| Builders FirstSource, Inc. (a) | 65,921 | 11,033,198 | |
| Owens Corning | 46,802 | 8,722,957 | |
| UFP Industries, Inc. | 33,353 | 4,400,261 | |
| 24,156,416 | |||
| Electrical Equipment - 0.1% | |||
| Atkore, Inc. | 19,675 | 2,656,125 | |
| Industrial Conglomerates - 0.9% | |||
| 3M Co. | 298,863 | 38,119,976 | |
| Machinery - 1.8% | |||
| AGCO Corp. | 33,450 | 3,158,349 | |
| Allison Transmission Holdings, Inc. | 47,246 | 4,185,523 | |
| CNH Industrial NV | 495,780 | 5,280,057 | |
| Cummins, Inc. | 73,873 | 21,556,141 | |
| Mueller Industries, Inc. | 61,352 | 4,352,311 | |
| PACCAR, Inc. | 283,084 | 27,929,067 | |
| Snap-On, Inc. | 28,473 | 8,172,605 | |
| 74,634,053 | |||
| Passenger Airlines - 0.6% | |||
| Delta Air Lines, Inc. | 348,525 | 14,993,546 | |
| United Airlines Holdings, Inc. (a) | 177,582 | 8,065,774 | |
| 23,059,320 | |||
| Professional Services - 0.2% | |||
| SS&C Technologies Holdings, Inc. | 116,211 | 8,477,592 | |
| Trading Companies & Distributors - 0.4% | |||
| AerCap Holdings NV | 104,690 | 9,835,626 | |
| Boise Cascade Co. | 21,322 | 3,029,643 | |
| WESCO International, Inc. | 23,608 | 4,130,220 | |
| 16,995,489 | |||
TOTAL INDUSTRIALS | 225,055,985 | ||
| INFORMATION TECHNOLOGY - 20.7% | |||
| Communications Equipment - 2.7% | |||
| Cisco Systems, Inc. | 2,186,915 | 105,956,032 | |
| F5, Inc. (a) | 31,655 | 6,446,224 | |
| 112,402,256 | |||
| Electronic Equipment, Instruments & Components - 1.9% | |||
| Arrow Electronics, Inc. (a) | 28,749 | 3,555,964 | |
| Avnet, Inc. | 48,813 | 2,624,187 | |
| Corning, Inc. | 416,384 | 16,659,524 | |
| Flex Ltd. (a) | 216,921 | 6,974,010 | |
| Jabil, Inc. | 65,133 | 7,338,535 | |
| TD SYNNEX Corp. | 41,972 | 5,001,803 | |
| TE Connectivity Ltd. | 165,390 | 25,524,639 | |
| Teledyne Technologies, Inc. (a) | 25,612 | 10,804,678 | |
| 78,483,340 | |||
| IT Services - 3.3% | |||
| Akamai Technologies, Inc. (a) | 82,264 | 8,084,906 | |
| Amdocs Ltd. | 63,142 | 5,523,031 | |
| Cognizant Technology Solutions Corp. Class A | 268,531 | 20,322,426 | |
| IBM Corp. | 496,126 | 95,325,650 | |
| Twilio, Inc. Class A (a) | 92,448 | 5,466,450 | |
| 134,722,463 | |||
| Semiconductors & Semiconductor Equipment - 4.9% | |||
| NVIDIA Corp. | 975,376 | 114,138,500 | |
| ON Semiconductor Corp. (a) | 232,363 | 18,182,405 | |
| Qualcomm, Inc. | 339,419 | 61,417,868 | |
| Skyworks Solutions, Inc. | 86,655 | 9,845,741 | |
| 203,584,514 | |||
| Software - 3.6% | |||
| Gen Digital, Inc. | 297,593 | 7,734,442 | |
| Microsoft Corp. | 316,610 | 132,453,794 | |
| Zoom Video Communications, Inc. Class A (a) | 140,909 | 8,510,904 | |
| 148,699,140 | |||
| Technology Hardware, Storage & Peripherals - 4.3% | |||
| Apple, Inc. | 577,972 | 128,356,022 | |
| Dell Technologies, Inc. | 143,984 | 16,368,101 | |
| Hewlett Packard Enterprise Co. | 702,114 | 13,979,090 | |
| HP, Inc. | 466,119 | 16,822,235 | |
| 175,525,448 | |||
TOTAL INFORMATION TECHNOLOGY | 853,417,161 | ||
| MATERIALS - 5.3% | |||
| Chemicals - 2.5% | |||
| Celanese Corp. | 54,269 | 7,660,069 | |
| CF Industries Holdings, Inc. | 98,718 | 7,541,068 | |
| Corteva, Inc. | 376,428 | 21,117,611 | |
| Dow, Inc. | 379,793 | 20,687,325 | |
| DuPont de Nemours, Inc. | 225,813 | 18,900,548 | |
| Eastman Chemical Co. | 63,541 | 6,565,692 | |
| LyondellBasell Industries NV Class A | 138,933 | 13,818,276 | |
| Olin Corp. | 64,498 | 2,941,754 | |
| The Mosaic Co. | 173,580 | 5,167,477 | |
| 104,399,820 | |||
| Construction Materials - 0.8% | |||
| CRH PLC | 370,865 | 31,783,131 | |
| Containers & Packaging - 0.7% | |||
| Berry Global Group, Inc. | 61,786 | 4,060,576 | |
| Crown Holdings, Inc. | 64,439 | 5,715,739 | |
| International Paper Co. | 187,590 | 8,719,183 | |
| Smurfit Westrock PLC | 139,422 | 6,251,682 | |
| Sonoco Products Co. | 53,067 | 2,861,373 | |
| 27,608,553 | |||
| Metals & Mining - 1.3% | |||
| Cleveland-Cliffs, Inc. (a)(b) | 256,799 | 3,941,865 | |
| Commercial Metals Co. | 62,492 | 3,755,769 | |
| Nucor Corp. | 129,492 | 21,099,426 | |
| Reliance, Inc. | 31,016 | 9,446,233 | |
| Steel Dynamics, Inc. | 79,774 | 10,627,492 | |
| United States Steel Corp. | 120,834 | 4,965,069 | |
| 53,835,854 | |||
TOTAL MATERIALS | 217,627,358 | ||
| REAL ESTATE - 0.4% | |||
| Equity Real Estate Investment Trusts (REITs) - 0.4% | |||
| VICI Properties, Inc. | 563,409 | 17,612,165 | |
| UTILITIES - 0.3% | |||
| Electric Utilities - 0.2% | |||
| NRG Energy, Inc. | 112,595 | 8,463,766 | |
| Gas Utilities - 0.1% | |||
| UGI Corp. | 113,214 | 2,805,443 | |
TOTAL UTILITIES | 11,269,209 | ||
| TOTAL COMMON STOCKS (Cost $3,679,951,826) | 4,090,157,655 | ||
| U.S. Treasury Obligations - 0.0% | |||
Principal Amount (c) | Value ($) | ||
U.S. Treasury Bills, yield at date of purchase 5.31% 8/22/24 (d) (Cost $366,875) | 368,000 | 366,868 | |
| Money Market Funds - 0.9% | |||
| Shares | Value ($) | ||
| Fidelity Cash Central Fund 5.39% (e) | 16,463,499 | 16,466,792 | |
| Fidelity Securities Lending Cash Central Fund 5.39% (e)(f) | 18,185,403 | 18,187,221 | |
| TOTAL MONEY MARKET FUNDS (Cost $34,654,013) | 34,654,013 | ||
| TOTAL INVESTMENT IN SECURITIES - 100.3% (Cost $3,714,972,714) | 4,125,178,536 |
NET OTHER ASSETS (LIABILITIES) - (0.3)% | (11,694,336) |
| NET ASSETS - 100.0% | 4,113,484,200 |
| Futures Contracts | |||||
Number of contracts | Expiration Date | Notional Amount ($) | Value ($) | Unrealized Appreciation/ (Depreciation) ($) | |
| Purchased | |||||
| Equity Index Contracts | |||||
| CME E-mini S&P 500 Index Contracts (United States) | 84 | Sep 2024 | 23,343,600 | 12,544 | 12,544 |
| The notional amount of futures purchased as a percentage of Net Assets is 0.6% | |||||
| (a) | Non-income producing |
| (b) | Security or a portion of the security is on loan at period end. |
| (c) | Amount is stated in United States dollars unless otherwise noted. |
| (d) | Security or a portion of the security was pledged to cover margin requirements for futures contracts. At period end, the value of securities pledged amounted to $366,868. |
| (e) | Affiliated fund that is generally available only to investment companies and other accounts managed by Fidelity Investments. The rate quoted is the annualized seven-day yield of the fund at period end. A complete unaudited listing of the fund's holdings as of its most recent quarter end is available upon request. In addition, each Fidelity Central Fund's financial statements, which are not covered by the Fund's Report of Independent Registered Public Accounting Firm, are available on the SEC's website or upon request. |
| (f) | Investment made with cash collateral received from securities on loan. |
| Affiliate | Value, beginning of period ($) | Purchases ($) | Sales Proceeds ($) | Dividend Income ($) | Realized Gain (loss) ($) | Change in Unrealized appreciation (depreciation) ($) | Value, end of period ($) | % ownership, end of period |
| Fidelity Cash Central Fund 5.39% | 224,734 | 1,584,149,990 | 1,567,907,976 | 793,955 | 44 | - | 16,466,792 | 0.0% |
| Fidelity Securities Lending Cash Central Fund 5.39% | 3,834,773 | 121,949,641 | 107,597,193 | 39,471 | - | - | 18,187,221 | 0.1% |
| Total | 4,059,507 | 1,706,099,631 | 1,675,505,169 | 833,426 | 44 | - | 34,654,013 | |
| Valuation Inputs at Reporting Date: | ||||
| Description | Total ($) | Level 1 ($) | Level 2 ($) | Level 3 ($) |
Investments in Securities: | ||||
| Equities: | ||||
Communication Services | 353,259,549 | 353,259,549 | - | - |
Consumer Discretionary | 238,945,264 | 238,945,264 | - | - |
Consumer Staples | 150,720,211 | 150,720,211 | - | - |
Energy | 547,084,295 | 547,084,295 | - | - |
Financials | 944,964,161 | 944,964,161 | - | - |
Health Care | 530,202,297 | 530,202,297 | - | - |
Industrials | 225,055,985 | 225,055,985 | - | - |
Information Technology | 853,417,161 | 853,417,161 | - | - |
Materials | 217,627,358 | 217,627,358 | - | - |
Real Estate | 17,612,165 | 17,612,165 | - | - |
Utilities | 11,269,209 | 11,269,209 | - | - |
| U.S. Government and Government Agency Obligations | 366,868 | - | 366,868 | - |
| Money Market Funds | 34,654,013 | 34,654,013 | - | - |
| Total Investments in Securities: | 4,125,178,536 | 4,124,811,668 | 366,868 | - |
Derivative Instruments: Assets | ||||
Futures Contracts | 12,544 | 12,544 | - | - |
| Total Assets | 12,544 | 12,544 | - | - |
| Total Derivative Instruments: | 12,544 | 12,544 | - | - |
Primary Risk Exposure / Derivative Type | Value | |
| Asset ($) | Liability ($) | |
| Equity Risk | ||
Futures Contracts (a) | 12,544 | 0 |
| Total Equity Risk | 12,544 | 0 |
| Total Value of Derivatives | 12,544 | 0 |
| Statement of Assets and Liabilities | ||||
As of July 31, 2024 | ||||
| Assets | ||||
| Investment in securities, at value (including securities loaned of $17,633,687) - See accompanying schedule: | ||||
Unaffiliated issuers (cost $3,680,318,701) | $ | 4,090,524,523 | ||
Fidelity Central Funds (cost $34,654,013) | 34,654,013 | |||
| Total Investment in Securities (cost $3,714,972,714) | $ | 4,125,178,536 | ||
| Segregated cash with brokers for derivative instruments | 763,519 | |||
| Foreign currency held at value (cost $1,505) | 1,494 | |||
| Receivable for fund shares sold | 417,313 | |||
| Dividends receivable | 5,919,535 | |||
| Distributions receivable from Fidelity Central Funds | 40,256 | |||
| Receivable for daily variation margin on futures contracts | 362,633 | |||
| Prepaid expenses | 1,032 | |||
Total assets | 4,132,684,318 | |||
| Liabilities | ||||
| Payable for fund shares redeemed | $ | 620,686 | ||
| Accrued management fee | 319,404 | |||
| Other payables and accrued expenses | 73,178 | |||
| Collateral on securities loaned | 18,186,850 | |||
| Total liabilities | 19,200,118 | |||
| Net Assets | $ | 4,113,484,200 | ||
| Net Assets consist of: | ||||
| Paid in capital | $ | 3,615,460,132 | ||
| Total accumulated earnings (loss) | 498,024,068 | |||
| Net Assets | $ | 4,113,484,200 | ||
Net Asset Value, offering price and redemption price per share ($4,113,484,200 ÷ 334,763,922 shares) | $ | 12.29 | ||
| Statement of Operations | ||||
| Year ended July 31, 2024 | ||||
| Investment Income | ||||
| Dividends | $ | 53,062,799 | ||
| Interest | 19,291 | |||
| Income from Fidelity Central Funds (including $39,471 from security lending) | 833,426 | |||
| Total income | 53,915,516 | |||
| Expenses | ||||
| Management fee | $ | 1,879,685 | ||
| Custodian fees and expenses | 41,212 | |||
| Independent trustees' fees and expenses | 4,215 | |||
| Registration fees | 31,027 | |||
| Audit fees | 56,366 | |||
| Legal | 5,934 | |||
| Interest | 4,219 | |||
| Miscellaneous | 9,158 | |||
| Total expenses | 2,031,816 | |||
| Net Investment income (loss) | 51,883,700 | |||
| Realized and Unrealized Gain (Loss) | ||||
| Net realized gain (loss) on: | ||||
| Investment Securities: | ||||
| Unaffiliated issuers | 53,702,269 | |||
| Fidelity Central Funds | 44 | |||
| Foreign currency transactions | 2,759 | |||
| Futures contracts | 1,156,067 | |||
| Total net realized gain (loss) | 54,861,139 | |||
| Change in net unrealized appreciation (depreciation) on: | ||||
| Investment Securities: | ||||
| Unaffiliated issuers | 332,724,767 | |||
| Assets and liabilities in foreign currencies | (11) | |||
| Futures contracts | (43,805) | |||
| Total change in net unrealized appreciation (depreciation) | 332,680,951 | |||
| Net gain (loss) | 387,542,090 | |||
| Net increase (decrease) in net assets resulting from operations | $ | 439,425,790 | ||
| Statement of Changes in Net Assets | ||||
Year ended July 31, 2024 | Year ended July 31, 2023 | |||
| Increase (Decrease) in Net Assets | ||||
| Operations | ||||
| Net investment income (loss) | $ | 51,883,700 | $ | 38,920,584 |
| Net realized gain (loss) | 54,861,139 | 87,798,644 | ||
| Change in net unrealized appreciation (depreciation) | 332,680,951 | (260,301,630) | ||
| Net increase (decrease) in net assets resulting from operations | 439,425,790 | (133,582,402) | ||
| Distributions to shareholders | (49,337,422) | (299,214,923) | ||
| Share transactions | ||||
| Proceeds from sales of shares | 3,406,284,858 | 408,566,801 | ||
| Reinvestment of distributions | 44,602,754 | 289,927,267 | ||
| Cost of shares redeemed | (119,829,910) | (2,825,899,380) | ||
Net increase (decrease) in net assets resulting from share transactions | 3,331,057,702 | (2,127,405,312) | ||
| Total increase (decrease) in net assets | 3,721,146,070 | (2,560,202,637) | ||
| Net Assets | ||||
| Beginning of period | 392,338,130 | 2,952,540,767 | ||
| End of period | $ | 4,113,484,200 | $ | 392,338,130 |
| Other Information | ||||
| Shares | ||||
| Sold | 307,055,096 | 36,999,453 | ||
| Issued in reinvestment of distributions | 4,371,902 | 26,793,151 | ||
| Redeemed | (10,833,391) | (273,043,165) | ||
| Net increase (decrease) | 300,593,607 | (209,250,561) | ||
Fidelity® SAI U.S. Value Index Fund |
| Years ended July 31, | 2024 | 2023 | 2022 | 2021 | 2020 | |||||
Selected Per-Share Data | ||||||||||
| Net asset value, beginning of period | $ | 11.48 | $ | 12.13 | $ | 12.22 | $ | 8.82 | $ | 10.06 |
| Income from Investment Operations | ||||||||||
Net investment income (loss) A,B | .31 | .32 | .31 | .31 | .29 | |||||
| Net realized and unrealized gain (loss) | 1.54 | .40 C | .31 | 3.35 | (1.27) | |||||
| Total from investment operations | 1.85 | .72 | .62 | 3.66 | (.98) | |||||
| Distributions from net investment income | (.59) | (.38) | (.28) | (.26) | (.26) | |||||
| Distributions from net realized gain | (.45) | (.99) | (.42) | - | - | |||||
| Total distributions | (1.04) | (1.37) | (.71) D | (.26) | (.26) | |||||
| Net asset value, end of period | $ | 12.29 | $ | 11.48 | $ | 12.13 | $ | 12.22 | $ | 8.82 |
Total Return E | 18.17 % | 6.74% | 5.21% | 42.39% | (10.13)% | |||||
Ratios to Average Net Assets B,F,G | ||||||||||
| Expenses before reductions | .11% | .12% | .10% | .11% | .11% | |||||
| Expenses net of fee waivers, if any | .11 % | .12% | .10% | .11% | .11% | |||||
| Expenses net of all reductions | .11% | .12% | .10% | .11% | .11% | |||||
| Net investment income (loss) | 2.77% | 2.90% | 2.49% | 2.89% | 3.12% | |||||
| Supplemental Data | ||||||||||
| Net assets, end of period (000 omitted) | $ | 4,113,484 | $ | 392,338 | $ | 2,952,541 | $ | 3,589,260 | $ | 2,282,301 |
Portfolio turnover rate H | 63 % | 86% | 62% | 80% | 82% |
| Fidelity Central Fund | Investment Manager | Investment Objective | Investment Practices | Expense RatioA |
| Fidelity Money Market Central Funds | Fidelity Management & Research Company LLC (FMR) | Each fund seeks to obtain a high level of current income consistent with the preservation of capital and liquidity. | Short-term Investments | Less than .005% |
| Gross unrealized appreciation | $463,789,533 |
| Gross unrealized depreciation | (75,561,494) |
| Net unrealized appreciation (depreciation) | $388,228,039 |
| Tax Cost | $3,736,950,497 |
| Undistributed ordinary income | $92,069,171 |
| Undistributed long-term capital gain | $17,726,868 |
| Net unrealized appreciation (depreciation) on securities and other investments | $388,228,028 |
| July 31, 2024 | July 31, 2023 | |
| Ordinary Income | $30,621,895 | $ 82,934,907 |
| Long-term Capital Gains | 18,715,527 | 216,280,016 |
| Total | $49,337,422 | $ 299,214,923 |
| Equity Risk | Equity risk relates to the fluctuations in the value of financial instruments as a result of changes in market prices (other than those arising from interest rate risk or foreign exchange risk), whether caused by factors specific to an individual investment, its issuer, or all factors affecting all instruments traded in a market or market segment. |
| Purchases ($) | Sales ($) | |
| Fidelity SAI U.S. Value Index Fund | 4,524,695,428 | 1,211,418,933 |
| Borrower or Lender | Average Loan Balance ($) | Weighted Average Interest Rate | Interest Expense ($) | |
| Fidelity SAI U.S. Value Index Fund | Borrower | 6,813,250 | 5.57% | 4,219 |
| Amount ($) | |
| Fidelity SAI U.S. Value Index Fund | 2,621 |
| Total Security Lending Fees Paid to NFS ($) | Security Lending Income From Securities Loaned to NFS ($) | Value of Securities Loaned to NFS at Period End ($) | |
| Fidelity SAI U.S. Value Index Fund | 4,165 | - | - |
| Strategic Advisers Fidelity U.S. Total Stock Fund | |
| Fidelity SAI U.S. Value Index Fund | 83% |
| A special meeting of shareholders was held on October 18, 2023. The results of votes taken among shareholders on the proposal before them are reported below. Each vote reported represents one dollar of net asset value held on the record date for the meeting. | ||
| Proposal 1 | ||
| To elect a Board of Trustees. | ||
# of Votes | % of Votes | |
| Abigail P. Johnson | ||
| Affirmative | 378,729,502,260.01 | 97.58 |
| Withheld | 9,407,876,478.96 | 2.42 |
| TOTAL | 388,137,378,738.97 | 100.00 |
| Jennifer Toolin McAuliffe | ||
| Affirmative | 378,454,868,010.95 | 97.51 |
| Withheld | 9,682,510,728.02 | 2.49 |
| TOTAL | 388,137,378,738.97 | 100.00 |
| Christine J. Thompson | ||
| Affirmative | 378,837,121,274.52 | 97.60 |
| Withheld | 9,300,257,464.45 | 2.40 |
| TOTAL | 388,137,378,738.97 | 100.00 |
| Elizabeth S. Acton | ||
| Affirmative | 378,262,110,794.85 | 97.46 |
| Withheld | 9,875,267,944.12 | 2.54 |
| TOTAL | 388,137,378,738.97 | 100.00 |
| Laura M. Bishop | ||
| Affirmative | 380,482,113,171.06 | 98.03 |
| Withheld | 7,655,265,567.91 | 1.97 |
| TOTAL | 388,137,378,738.97 | 100.00 |
| Ann E. Dunwoody | ||
| Affirmative | 380,016,034,008.12 | 97.91 |
| Withheld | 8,121,344,730.85 | 2.09 |
| TOTAL | 388,137,378,738.97 | 100.00 |
| John Engler | ||
| Affirmative | 379,432,488,394.20 | 97.76 |
| Withheld | 8,704,890,344.77 | 2.24 |
| TOTAL | 388,137,378,738.97 | 100.00 |
| Robert F. Gartland | ||
| Affirmative | 378,741,819,600.60 | 97.58 |
| Withheld | 9,395,559,138.37 | 2.42 |
| TOTAL | 388,137,378,738.97 | 100.00 |
| Robert W. Helm | ||
| Affirmative | 380,389,324,755.07 | 98.00 |
| Withheld | 7,748,053,983.90 | 2.00 |
| TOTAL | 388,137,378,738.97 | 100.00 |
| Arthur E. Johnson | ||
| Affirmative | 378,427,694,151.67 | 97.50 |
| Withheld | 9,709,684,587.30 | 2.50 |
| TOTAL | 388,137,378,738.97 | 100.00 |
| Michael E. Kenneally | ||
| Affirmative | 377,842,228,145.18 | 97.35 |
| Withheld | 10,295,150,593.79 | 2.65 |
| TOTAL | 388,137,378,738.97 | 100.00 |
| Mark A. Murray | ||
| Affirmative | 380,158,432,703.37 | 97.94 |
| Withheld | 7,978,946,035.60 | 2.06 |
| TOTAL | 388,137,378,738.97 | 100.00 |
| Carol J. Zierhoffer | ||
| Affirmative | 380,522,113,360.24 | 98.04 |
| Withheld | 7,615,265,378.73 | 1.96 |
| TOTAL | 388,137,378,738.97 | 100.00 |
| Proposal 1 reflects trust-wide proposal and voting results. | ||
 |


Contents
| Common Stocks - 99.6% | |||
| Shares | Value ($) | ||
| Equity Real Estate Investment Trusts (REITs) - 92.0% | |||
| REITs - Apartments - 10.5% | |||
| American Homes 4 Rent Class A | 622,820 | 22,477,574 | |
| Apartment Investment & Management Co. Class A (a) | 242,187 | 2,145,777 | |
| AvalonBay Communities, Inc. | 268,922 | 55,107,496 | |
| Camden Property Trust (SBI) | 202,883 | 22,469,292 | |
| Centerspace | 28,611 | 1,997,906 | |
| Equity Residential (SBI) | 644,584 | 44,882,384 | |
| Essex Property Trust, Inc. | 121,507 | 33,822,689 | |
| Independence Realty Trust, Inc. | 432,968 | 8,074,853 | |
| Invitation Homes, Inc. | 1,158,000 | 40,842,660 | |
| Mid-America Apartment Communities, Inc. | 220,759 | 30,855,485 | |
| UDR, Inc. | 593,676 | 23,788,597 | |
| 286,464,713 | |||
| REITs - Diversified - 20.7% | |||
| Alexander & Baldwin, Inc. | 138,312 | 2,726,130 | |
| Apple Hospitality (REIT), Inc. | 439,877 | 6,505,781 | |
| Armada Hoffler Properties, Inc. Class A, | 125,723 | 1,493,589 | |
| Broadstone Net Lease, Inc. | 358,823 | 6,247,108 | |
| Cousins Properties, Inc. | 289,818 | 7,972,893 | |
| Crown Castle, Inc. | 818,578 | 90,109,066 | |
| Digital Realty Trust, Inc. | 590,564 | 88,283,412 | |
| Elme Communities (SBI) | 169,380 | 2,787,995 | |
| EPR Properties | 143,055 | 6,437,475 | |
| Equinix, Inc. | 179,200 | 141,611,008 | |
| Farmland Partners, Inc. (b) | 88,547 | 940,369 | |
| Gaming & Leisure Properties | 511,277 | 25,666,105 | |
| Gladstone Commercial Corp. | 79,449 | 1,195,707 | |
| Gladstone Land Corp. | 61,707 | 916,349 | |
| Global Net Lease, Inc. | 366,060 | 3,184,722 | |
| InvenTrust Properties Corp. | 128,955 | 3,632,662 | |
| Lamar Advertising Co. Class A | 166,629 | 19,972,152 | |
| NexPoint Diversified Real Estate Trust | 63,124 | 399,575 | |
| NexPoint Residential Trust, Inc. | 44,216 | 1,931,797 | |
| One Liberty Properties, Inc. | 36,967 | 975,559 | |
| Outfront Media, Inc. | 252,871 | 4,101,568 | |
| PotlatchDeltic Corp. | 148,475 | 6,586,351 | |
| SBA Communications Corp. Class A | 203,514 | 44,679,464 | |
| Uniti Group, Inc. | 458,123 | 1,759,192 | |
| VICI Properties, Inc. | 1,968,049 | 61,521,212 | |
| Vornado Realty Trust | 308,969 | 9,265,980 | |
| WP Carey, Inc. | 411,356 | 23,780,490 | |
| 564,683,711 | |||
| REITs - Health Care - 8.4% | |||
| CareTrust (REIT), Inc. | 259,047 | 6,983,907 | |
| Community Healthcare Trust, Inc. | 51,041 | 1,110,652 | |
| Diversified Healthcare Trust (SBI) | 321,932 | 1,075,253 | |
| Global Medical REIT, Inc. | 123,653 | 1,180,886 | |
| Healthcare Realty Trust, Inc. | 719,684 | 12,731,210 | |
| Healthpeak Properties, Inc. | 1,343,817 | 29,322,087 | |
| LTC Properties, Inc. | 82,382 | 2,941,861 | |
| Medical Properties Trust, Inc. (b) | 1,128,040 | 5,425,872 | |
| Sabra Health Care REIT, Inc. | 441,968 | 7,173,141 | |
| Universal Health Realty Income Trust (SBI) | 24,948 | 1,066,527 | |
| Ventas, Inc. | 759,842 | 41,365,798 | |
| Welltower, Inc. | 1,074,544 | 119,543,020 | |
| 229,920,214 | |||
| REITs - Health Care Facilities - 0.8% | |||
| National Health Investors, Inc. | 83,480 | 6,249,313 | |
| Omega Healthcare Investors, Inc. | 462,187 | 16,823,607 | |
| 23,072,920 | |||
| REITs - Hotels - 2.2% | |||
| Chatham Lodging Trust | 94,344 | 829,284 | |
| DiamondRock Hospitality Co. | 407,579 | 3,354,375 | |
| Host Hotels & Resorts, Inc. | 1,337,253 | 23,415,300 | |
| Park Hotels & Resorts, Inc. | 407,997 | 6,144,435 | |
| Pebblebrook Hotel Trust | 230,697 | 3,158,242 | |
| RLJ Lodging Trust | 297,803 | 2,811,260 | |
| Ryman Hospitality Properties, Inc. | 108,060 | 10,861,111 | |
| Service Properties Trust | 307,452 | 1,743,253 | |
| Summit Hotel Properties, Inc. | 213,169 | 1,351,491 | |
| Sunstone Hotel Investors, Inc. | 376,726 | 3,902,881 | |
| Xenia Hotels & Resorts, Inc. | 200,145 | 2,778,013 | |
| 60,349,645 | |||
| REITs - Industrial Buildings - 0.5% | |||
| STAG Industrial, Inc. | 346,198 | 14,128,340 | |
| REITs - Management/Investment - 10.2% | |||
| American Assets Trust, Inc. | 96,906 | 2,569,947 | |
| American Tower Corp. | 880,322 | 194,022,969 | |
| Empire State Realty Trust, Inc. | 267,223 | 2,877,992 | |
| LXP Industrial Trust (REIT) | 554,934 | 5,715,820 | |
| NNN (REIT), Inc. | 345,402 | 15,505,096 | |
| Rayonier, Inc. | 266,662 | 8,087,858 | |
| Safehold, Inc. | 85,726 | 1,983,700 | |
| UMH Properties, Inc. | 128,843 | 2,288,252 | |
| Weyerhaeuser Co. | 1,374,393 | 43,650,722 | |
| Whitestone REIT | 94,039 | 1,297,738 | |
| 278,000,094 | |||
| REITs - Manufactured Homes - 1.9% | |||
| Equity Lifestyle Properties, Inc. | 332,487 | 22,835,207 | |
| Sun Communities, Inc. | 234,719 | 29,745,939 | |
| 52,581,146 | |||
| REITs - Office Buildings - 0.0% | |||
| Office Properties Income Trust | 92,163 | 229,486 | |
| REITs - Office Property - 4.0% | |||
| Alexandria Real Estate Equities, Inc. | 297,762 | 34,924,505 | |
| Brandywine Realty Trust (SBI) | 332,327 | 1,674,928 | |
| BXP, Inc. | 282,318 | 20,132,097 | |
| City Office REIT, Inc. | 78,246 | 473,388 | |
| COPT Defense Properties (SBI) | 212,773 | 6,164,034 | |
| Douglas Emmett, Inc. | 319,037 | 5,133,305 | |
| Easterly Government Properties, Inc. | 187,639 | 2,613,811 | |
| Equity Commonwealth (a) | 193,077 | 3,932,978 | |
| Highwoods Properties, Inc. (SBI) | 203,934 | 6,315,836 | |
| Hudson Pacific Properties, Inc. | 239,059 | 1,431,963 | |
| JBG SMITH Properties | 165,674 | 2,708,770 | |
| Kilroy Realty Corp. | 211,197 | 7,807,953 | |
| Net Lease Office Properties (b) | 28,143 | 830,500 | |
| Orion Office (REIT), Inc. | 97,777 | 395,997 | |
| Paramount Group, Inc. | 322,400 | 1,689,376 | |
| Peakstone Realty Trust (b) | 68,275 | 927,175 | |
| Piedmont Office Realty Trust, Inc. Class A | 238,930 | 2,066,745 | |
| SL Green Realty Corp. | 125,810 | 8,383,978 | |
| Veris Residential, Inc. | 140,916 | 2,213,790 | |
| 109,821,129 | |||
| REITs - Regional Malls - 4.0% | |||
| CBL & Associates Properties, Inc. (b) | 23,573 | 607,476 | |
| Simon Property Group, Inc. | 615,093 | 94,379,870 | |
| Tanger, Inc. | 209,964 | 6,067,960 | |
| The Macerich Co. | 413,979 | 6,627,804 | |
| 107,683,110 | |||
| REITs - Shopping Centers - 7.8% | |||
| Acadia Realty Trust (SBI) | 198,913 | 4,304,477 | |
| Alexanders, Inc. | 4,637 | 1,123,545 | |
| Brixmor Property Group, Inc. | 569,538 | 14,506,133 | |
| Federal Realty Investment Trust (SBI) | 140,517 | 15,688,723 | |
| Kimco Realty Corp. | 1,273,043 | 27,663,224 | |
| Kite Realty Group Trust | 418,366 | 10,316,906 | |
| Phillips Edison & Co., Inc. | 232,682 | 8,167,138 | |
| Realty Income Corp. | 1,623,777 | 93,253,513 | |
| Regency Centers Corp. | 330,462 | 22,253,311 | |
| Retail Opportunity Investments Corp. | 238,930 | 3,572,004 | |
| Saul Centers, Inc. | 23,270 | 920,329 | |
| SITE Centers Corp. | 361,033 | 5,577,960 | |
| Urban Edge Properties | 225,580 | 4,579,274 | |
| 211,926,537 | |||
| REITs - Single Tenant - 1.2% | |||
| Agree Realty Corp. | 190,626 | 13,147,475 | |
| Essential Properties Realty Trust, Inc. | 326,987 | 9,675,545 | |
| Four Corners Property Trust, Inc. | 176,440 | 4,788,582 | |
| Getty Realty Corp. | 95,566 | 2,830,665 | |
| NETSTREIT Corp. | 147,398 | 2,427,645 | |
| 32,869,912 | |||
| REITs - Storage - 8.7% | |||
| CubeSmart | 428,079 | 20,367,999 | |
| Extra Space Storage, Inc. | 400,512 | 63,929,725 | |
| Iron Mountain, Inc. | 554,850 | 56,905,416 | |
| National Storage Affiliates Trust | 143,565 | 6,111,562 | |
| Public Storage Operating Co. | 299,032 | 88,489,549 | |
| 235,804,251 | |||
| REITs - Warehouse/Industrial - 11.1% | |||
| Americold Realty Trust | 508,166 | 15,189,082 | |
| EastGroup Properties, Inc. | 91,303 | 17,072,748 | |
| First Industrial Realty Trust, Inc. | 250,411 | 13,702,490 | |
| Plymouth Industrial REIT, Inc. | 83,464 | 1,996,459 | |
| Prologis, Inc. | 1,746,549 | 220,152,505 | |
| Rexford Industrial Realty, Inc. | 413,903 | 20,740,679 | |
| Terreno Realty Corp. | 184,176 | 12,599,480 | |
| 301,453,443 | |||
TOTAL EQUITY REAL ESTATE INVESTMENT TRUSTS (REITS) | 2,508,988,651 | ||
| Real Estate Management & Development - 7.6% | |||
| Diversified Real Estate Activities - 0.2% | |||
| Tejon Ranch Co. (a) | 37,021 | 703,399 | |
| The RMR Group, Inc. Class A | 30,580 | 793,245 | |
| The St. Joe Co. | 66,623 | 4,109,307 | |
| 5,605,951 | |||
| Real Estate Development - 0.2% | |||
| Forestar Group, Inc. (a)(b) | 37,510 | 1,186,441 | |
| Howard Hughes Holdings, Inc. | 60,005 | 4,450,571 | |
| 5,637,012 | |||
| Real Estate Operating Companies - 0.3% | |||
| Digitalbridge Group, Inc. | 311,273 | 4,398,287 | |
| Kennedy-Wilson Holdings, Inc. | 201,981 | 2,102,622 | |
| 6,500,909 | |||
| Real Estate Services - 6.9% | |||
| Anywhere Real Estate, Inc. (a) | 178,515 | 842,591 | |
| CBRE Group, Inc. (a) | 576,923 | 65,024,991 | |
| Compass, Inc. (a) | 727,567 | 3,194,019 | |
| CoStar Group, Inc. (a) | 771,002 | 60,153,576 | |
| Cushman & Wakefield PLC (a) | 436,373 | 5,720,850 | |
| eXp World Holdings, Inc. (b) | 146,039 | 2,097,120 | |
| Jones Lang LaSalle, Inc. (a) | 89,830 | 22,538,347 | |
| Marcus & Millichap, Inc. | 47,639 | 1,886,981 | |
| Newmark Group, Inc. Class A | 282,000 | 3,660,360 | |
| Opendoor Technologies, Inc. Class A (a)(b) | 1,103,449 | 2,560,002 | |
| Redfin Corp. (a)(b) | 225,862 | 1,838,517 | |
| Zillow Group, Inc.: | |||
| Class A (a) | 105,169 | 4,985,011 | |
| Class C (a) | 296,352 | 14,432,342 | |
| 188,934,707 | |||
| REITs - Shopping Centers - 0.0% | |||
| Seritage Growth Properties (a)(b) | 50,804 | 259,100 | |
TOTAL REAL ESTATE MANAGEMENT & DEVELOPMENT | 206,937,679 | ||
| TOTAL COMMON STOCKS (Cost $2,371,296,427) | 2,715,926,330 | ||
| U.S. Treasury Obligations - 0.0% | |||
Principal Amount (c) | Value ($) | ||
U.S. Treasury Bills, yield at date of purchase 5.31% 8/22/24 (d) (Cost $345,939) | 347,000 | 345,932 | |
| Money Market Funds - 0.8% | |||
| Shares | Value ($) | ||
| Fidelity Cash Central Fund 5.39% (e) | 7,751,940 | 7,753,491 | |
| Fidelity Securities Lending Cash Central Fund 5.39% (e)(f) | 14,077,228 | 14,078,636 | |
| TOTAL MONEY MARKET FUNDS (Cost $21,832,127) | 21,832,127 | ||
| TOTAL INVESTMENT IN SECURITIES - 100.4% (Cost $2,393,474,493) | 2,738,104,389 |
NET OTHER ASSETS (LIABILITIES) - (0.4)% | (11,868,875) |
| NET ASSETS - 100.0% | 2,726,235,514 |
| Futures Contracts | |||||
Number of contracts | Expiration Date | Notional Amount ($) | Value ($) | Unrealized Appreciation/ (Depreciation) ($) | |
| Purchased | |||||
| Equity Index Contracts | |||||
| CBOT Dow Jones U.S. Real Estate Index Contracts (United States) | 123 | Sep 2024 | 4,464,900 | 326,061 | 326,061 |
| CME E-mini S&P MidCap 400 Index Contracts (United States) | 17 | Sep 2024 | 5,304,170 | 34,013 | 34,013 |
| TOTAL FUTURES CONTRACTS | 360,074 | ||||
| The notional amount of futures purchased as a percentage of Net Assets is 0.4% | |||||
| (a) | Non-income producing |
| (b) | Security or a portion of the security is on loan at period end. |
| (c) | Amount is stated in United States dollars unless otherwise noted. |
| (d) | Security or a portion of the security was pledged to cover margin requirements for futures contracts. At period end, the value of securities pledged amounted to $345,932. |
| (e) | Affiliated fund that is generally available only to investment companies and other accounts managed by Fidelity Investments. The rate quoted is the annualized seven-day yield of the fund at period end. A complete unaudited listing of the fund's holdings as of its most recent quarter end is available upon request. In addition, each Fidelity Central Fund's financial statements, which are not covered by the Fund's Report of Independent Registered Public Accounting Firm, are available on the SEC's website or upon request. |
| (f) | Investment made with cash collateral received from securities on loan. |
| Affiliate | Value, beginning of period ($) | Purchases ($) | Sales Proceeds ($) | Dividend Income ($) | Realized Gain (loss) ($) | Change in Unrealized appreciation (depreciation) ($) | Value, end of period ($) | % ownership, end of period |
| Fidelity Cash Central Fund 5.39% | 6,169,355 | 207,561,165 | 205,977,157 | 282,789 | 128 | - | 7,753,491 | 0.0% |
| Fidelity Securities Lending Cash Central Fund 5.39% | 22,663,855 | 96,160,545 | 104,745,764 | 125,179 | - | - | 14,078,636 | 0.1% |
| Total | 28,833,210 | 303,721,710 | 310,722,921 | 407,968 | 128 | - | 21,832,127 | |
| Valuation Inputs at Reporting Date: | ||||
| Description | Total ($) | Level 1 ($) | Level 2 ($) | Level 3 ($) |
Investments in Securities: | ||||
| Common Stocks | 2,715,926,330 | 2,715,926,330 | - | - |
| U.S. Treasury Obligations | 345,932 | - | 345,932 | - |
| Money Market Funds | 21,832,127 | 21,832,127 | - | - |
| Total Investments in Securities: | 2,738,104,389 | 2,737,758,457 | 345,932 | - |
Derivative Instruments: Assets | ||||
Futures Contracts | 360,074 | 360,074 | - | - |
| Total Assets | 360,074 | 360,074 | - | - |
| Total Derivative Instruments: | 360,074 | 360,074 | - | - |
Primary Risk Exposure / Derivative Type | Value | |
| Asset ($) | Liability ($) | |
| Equity Risk | ||
Futures Contracts (a) | 360,074 | 0 |
| Total Equity Risk | 360,074 | 0 |
| Total Value of Derivatives | 360,074 | 0 |
| Statement of Assets and Liabilities | ||||
As of July 31, 2024 | ||||
| Assets | ||||
| Investment in securities, at value (including securities loaned of $13,240,627) - See accompanying schedule: | ||||
Unaffiliated issuers (cost $2,371,642,366) | $ | 2,716,272,262 | ||
Fidelity Central Funds (cost $21,832,127) | 21,832,127 | |||
| Total Investment in Securities (cost $2,393,474,493) | $ | 2,738,104,389 | ||
| Segregated cash with brokers for derivative instruments | 198,207 | |||
| Receivable for fund shares sold | 4,806,956 | |||
| Dividends receivable | 632,982 | |||
| Distributions receivable from Fidelity Central Funds | 29,257 | |||
| Receivable for daily variation margin on futures contracts | 16,697 | |||
| Other receivables | 285,883 | |||
Total assets | 2,744,074,371 | |||
| Liabilities | ||||
| Payable for fund shares redeemed | $ | 3,521,607 | ||
| Accrued management fee | 153,598 | |||
| Other payables and accrued expenses | 95,052 | |||
| Collateral on securities loaned | 14,068,600 | |||
| Total liabilities | 17,838,857 | |||
| Net Assets | $ | 2,726,235,514 | ||
| Net Assets consist of: | ||||
| Paid in capital | $ | 2,572,414,261 | ||
| Total accumulated earnings (loss) | 153,821,253 | |||
| Net Assets | $ | 2,726,235,514 | ||
Net Asset Value, offering price and redemption price per share ($2,726,235,514 ÷ 166,272,264 shares) | $ | 16.40 | ||
| Statement of Operations | ||||
| Year ended July 31, 2024 | ||||
| Investment Income | ||||
| Dividends | $ | 82,216,495 | ||
| Interest | 36,216 | |||
| Income from Fidelity Central Funds (including $125,179 from security lending) | 407,968 | |||
| Total income | 82,660,679 | |||
| Expenses | ||||
| Management fee | $ | 1,716,716 | ||
| Independent trustees' fees and expenses | 7,304 | |||
| Interest | 2,002 | |||
| Total expenses before reductions | 1,726,022 | |||
| Expense reductions | (4,245) | |||
| Total expenses after reductions | 1,721,777 | |||
| Net Investment income (loss) | 80,938,902 | |||
| Realized and Unrealized Gain (Loss) | ||||
| Net realized gain (loss) on: | ||||
| Investment Securities: | ||||
| Unaffiliated issuers | (16,590,302) | |||
| Fidelity Central Funds | 128 | |||
| Futures contracts | (1,020,100) | |||
| Total net realized gain (loss) | (17,610,274) | |||
| Change in net unrealized appreciation (depreciation) on: | ||||
| Investment Securities: | ||||
| Unaffiliated issuers | 200,598,518 | |||
| Futures contracts | 164,353 | |||
| Total change in net unrealized appreciation (depreciation) | 200,762,871 | |||
| Net gain (loss) | 183,152,597 | |||
| Net increase (decrease) in net assets resulting from operations | $ | 264,091,499 | ||
| Statement of Changes in Net Assets | ||||
Year ended July 31, 2024 | Year ended July 31, 2023 | |||
| Increase (Decrease) in Net Assets | ||||
| Operations | ||||
| Net investment income (loss) | $ | 80,938,902 | $ | 79,921,540 |
| Net realized gain (loss) | (17,610,274) | (24,549,785) | ||
| Change in net unrealized appreciation (depreciation) | 200,762,871 | (328,285,515) | ||
| Net increase (decrease) in net assets resulting from operations | 264,091,499 | (272,913,760) | ||
| Distributions to shareholders | (74,163,935) | (75,151,288) | ||
| Share transactions | ||||
| Proceeds from sales of shares | 582,720,334 | 636,858,558 | ||
| Reinvestment of distributions | 64,941,837 | 65,771,963 | ||
| Cost of shares redeemed | (600,106,753) | (739,809,748) | ||
Net increase (decrease) in net assets resulting from share transactions | 47,555,418 | (37,179,227) | ||
| Total increase (decrease) in net assets | 237,482,982 | (385,244,275) | ||
| Net Assets | ||||
| Beginning of period | 2,488,752,532 | 2,873,996,807 | ||
| End of period | $ | 2,726,235,514 | $ | 2,488,752,532 |
| Other Information | ||||
| Shares | ||||
| Sold | 39,317,946 | 42,354,093 | ||
| Issued in reinvestment of distributions | 4,293,111 | 4,300,329 | ||
| Redeemed | (40,308,949) | (48,594,088) | ||
| Net increase (decrease) | 3,302,108 | (1,939,666) | ||
Fidelity® Real Estate Index Fund |
| Years ended July 31, | 2024 | 2023 | 2022 | 2021 | 2020 | |||||
Selected Per-Share Data | ||||||||||
| Net asset value, beginning of period | $ | 15.27 | $ | 17.43 | $ | 18.44 | $ | 13.58 | $ | 16.82 |
| Income from Investment Operations | ||||||||||
Net investment income (loss) A,B | .49 | .49 | .44 | .39 | .51 | |||||
| Net realized and unrealized gain (loss) | 1.09 | (2.18) | (1.19) | 4.88 | (3.15) | |||||
| Total from investment operations | 1.58 | (1.69) | (.75) | 5.27 | (2.64) | |||||
| Distributions from net investment income | (.45) | (.47) | (.26) | (.41) | (.47) | |||||
| Distributions from net realized gain | - | - | - | - | (.13) | |||||
| Total distributions | (.45) | (.47) | (.26) | (.41) | (.60) | |||||
| Net asset value, end of period | $ | 16.40 | $ | 15.27 | $ | 17.43 | $ | 18.44 | $ | 13.58 |
Total Return C | 10.63 % | (9.70)% | (4.21)% | 39.73% | (16.34)% | |||||
Ratios to Average Net Assets B,D,E | ||||||||||
| Expenses before reductions | .07% | .07% | .07% | .07% | .07% | |||||
| Expenses net of fee waivers, if any | .07 % | .07% | .07% | .07% | .07% | |||||
| Expenses net of all reductions | .07% | .07% | .07% | .07% | .07% | |||||
| Net investment income (loss) | 3.30% | 3.25% | 2.45% | 2.53% | 3.32% | |||||
| Supplemental Data | ||||||||||
| Net assets, end of period (000 omitted) | $ | 2,726,236 | $ | 2,488,753 | $ | 2,873,997 | $ | 2,939,615 | $ | 2,082,589 |
Portfolio turnover rate F | 5 % | 13% | 10% | 44% | 26% |
| Fidelity Central Fund | Investment Manager | Investment Objective | Investment Practices | Expense RatioA |
| Fidelity Money Market Central Funds | Fidelity Management & Research Company LLC (FMR) | Each fund seeks to obtain a high level of current income consistent with the preservation of capital and liquidity. | Short-term Investments | Less than .005% |
| Gross unrealized appreciation | $595,522,240 |
| Gross unrealized depreciation | (274,666,949) |
| Net unrealized appreciation (depreciation) | $320,855,291 |
| Tax Cost | $2,417,249,098 |
| Undistributed ordinary income | $18,496,051 |
| Capital loss carryforward | $(185,530,089) |
| Net unrealized appreciation (depreciation) on securities and other investments | $320,855,291 |
Short-term | $(77,660,646) |
Long-term | (107,869,443) |
| Total capital loss carryforward | $(185,530,089) |
| July 31, 2024 | July 31, 2023 | |
| Ordinary Income | $74,163,935 | $ 75,151,288 |
| Total | $74,163,935 | $ 75,151,288 |
| Equity Risk | Equity risk relates to the fluctuations in the value of financial instruments as a result of changes in market prices (other than those arising from interest rate risk or foreign exchange risk), whether caused by factors specific to an individual investment, its issuer, or all factors affecting all instruments traded in a market or market segment. |
| Purchases ($) | Sales ($) | |
| Fidelity Real Estate Index Fund | 186,832,410 | 112,986,515 |
| Borrower or Lender | Average Loan Balance ($) | Weighted Average Interest Rate | Interest Expense ($) | |
| Fidelity Real Estate Index Fund | Borrower | 6,476,500 | 5.57% | 2,002 |
| Total Security Lending Fees Paid to NFS ($) | Security Lending Income From Securities Loaned to NFS ($) | Value of Securities Loaned to NFS at Period End ($) | |
| Fidelity Real Estate Index Fund | 12,974 | 2,019 | 37,999 |
| A special meeting of shareholders was held on October 18, 2023. The results of votes taken among shareholders on the proposal before them are reported below. Each vote reported represents one dollar of net asset value held on the record date for the meeting. | ||
| Proposal 1 | ||
| To elect a Board of Trustees. | ||
# of Votes | % of Votes | |
| Abigail P. Johnson | ||
| Affirmative | 378,729,502,260.01 | 97.58 |
| Withheld | 9,407,876,478.96 | 2.42 |
| TOTAL | 388,137,378,738.97 | 100.00 |
| Jennifer Toolin McAuliffe | ||
| Affirmative | 378,454,868,010.95 | 97.51 |
| Withheld | 9,682,510,728.02 | 2.49 |
| TOTAL | 388,137,378,738.97 | 100.00 |
| Christine J. Thompson | ||
| Affirmative | 378,837,121,274.52 | 97.60 |
| Withheld | 9,300,257,464.45 | 2.40 |
| TOTAL | 388,137,378,738.97 | 100.00 |
| Elizabeth S. Acton | ||
| Affirmative | 378,262,110,794.85 | 97.46 |
| Withheld | 9,875,267,944.12 | 2.54 |
| TOTAL | 388,137,378,738.97 | 100.00 |
| Laura M. Bishop | ||
| Affirmative | 380,482,113,171.06 | 98.03 |
| Withheld | 7,655,265,567.91 | 1.97 |
| TOTAL | 388,137,378,738.97 | 100.00 |
| Ann E. Dunwoody | ||
| Affirmative | 380,016,034,008.12 | 97.91 |
| Withheld | 8,121,344,730.85 | 2.09 |
| TOTAL | 388,137,378,738.97 | 100.00 |
| John Engler | ||
| Affirmative | 379,432,488,394.20 | 97.76 |
| Withheld | 8,704,890,344.77 | 2.24 |
| TOTAL | 388,137,378,738.97 | 100.00 |
| Robert F. Gartland | ||
| Affirmative | 378,741,819,600.60 | 97.58 |
| Withheld | 9,395,559,138.37 | 2.42 |
| TOTAL | 388,137,378,738.97 | 100.00 |
| Robert W. Helm | ||
| Affirmative | 380,389,324,755.07 | 98.00 |
| Withheld | 7,748,053,983.90 | 2.00 |
| TOTAL | 388,137,378,738.97 | 100.00 |
| Arthur E. Johnson | ||
| Affirmative | 378,427,694,151.67 | 97.50 |
| Withheld | 9,709,684,587.30 | 2.50 |
| TOTAL | 388,137,378,738.97 | 100.00 |
| Michael E. Kenneally | ||
| Affirmative | 377,842,228,145.18 | 97.35 |
| Withheld | 10,295,150,593.79 | 2.65 |
| TOTAL | 388,137,378,738.97 | 100.00 |
| Mark A. Murray | ||
| Affirmative | 380,158,432,703.37 | 97.94 |
| Withheld | 7,978,946,035.60 | 2.06 |
| TOTAL | 388,137,378,738.97 | 100.00 |
| Carol J. Zierhoffer | ||
| Affirmative | 380,522,113,360.24 | 98.04 |
| Withheld | 7,615,265,378.73 | 1.96 |
| TOTAL | 388,137,378,738.97 | 100.00 |
| Proposal 1 reflects trust-wide proposal and voting results. | ||
 |


Contents
| Common Stocks - 100.0% | |||
| Shares | Value ($) | ||
| COMMUNICATION SERVICES - 3.4% | |||
| Diversified Telecommunication Services - 0.5% | |||
| Frontier Communications Parent, Inc. (a)(b) | 118,457 | 3,470,790 | |
| Iridium Communications, Inc. | 57,819 | 1,659,405 | |
| Liberty Global Ltd.: | |||
| Class A | 80,313 | 1,565,300 | |
| Class C | 82,753 | 1,664,163 | |
| 8,359,658 | |||
| Entertainment - 0.6% | |||
| Liberty Media Corp. Liberty Live: | |||
| Class C | 22,374 | 873,033 | |
| Series A | 9,496 | 358,664 | |
| Madison Square Garden Sports Corp. (a) | 8,970 | 1,797,678 | |
| Playtika Holding Corp. | 33,862 | 258,367 | |
| Roku, Inc. Class A (a) | 60,979 | 3,549,588 | |
| TKO Group Holdings, Inc. | 38,070 | 4,162,955 | |
| 11,000,285 | |||
| Interactive Media & Services - 0.6% | |||
| IAC, Inc. (a) | 35,896 | 1,895,668 | |
| Match Group, Inc. (a) | 127,743 | 4,872,118 | |
| TripAdvisor, Inc. (a) | 52,037 | 917,412 | |
| Trump Media & Technology Group (a)(b) | 27,799 | 798,943 | |
| Zoominfo Technologies, Inc. (a) | 150,580 | 1,710,589 | |
| 10,194,730 | |||
| Media - 1.7% | |||
| Interpublic Group of Companies, Inc. | 181,793 | 5,848,281 | |
| Liberty Broadband Corp.: | |||
| Class A (a) | 8,004 | 530,025 | |
| Class C (a) | 53,221 | 3,586,563 | |
| Liberty Media Corp. Liberty SiriusXM: | |||
| Class A | 34,289 | 775,617 | |
| Class C | 71,087 | 1,600,168 | |
| News Corp.: | |||
| Class A | 183,831 | 5,070,059 | |
| Class B | 54,641 | 1,556,722 | |
| Nexstar Media Group, Inc. | 15,033 | 2,777,948 | |
| Paramount Global: | |||
| Class A (b) | 4,463 | 102,203 | |
| Class B (b) | 285,512 | 3,260,547 | |
| The New York Times Co. Class A | 77,571 | 4,157,030 | |
| 29,265,163 | |||
TOTAL COMMUNICATION SERVICES | 58,819,836 | ||
| CONSUMER DISCRETIONARY - 14.3% | |||
| Automobile Components - 0.7% | |||
| BorgWarner, Inc. | 110,977 | 3,918,598 | |
| Gentex Corp. | 111,606 | 3,466,482 | |
| Lear Corp. | 27,240 | 3,324,370 | |
| QuantumScape Corp. Class A (a)(b) | 169,115 | 1,092,483 | |
| 11,801,933 | |||
| Automobiles - 0.7% | |||
| Harley-Davidson, Inc. | 58,389 | 2,189,588 | |
| Lucid Group, Inc. Class A (a)(b) | 428,298 | 1,507,609 | |
| Rivian Automotive, Inc. (a)(b) | 397,083 | 6,516,132 | |
| Thor Industries, Inc. | 24,540 | 2,604,676 | |
| 12,818,005 | |||
| Broadline Retail - 0.7% | |||
| Dillard's, Inc. Class A (b) | 1,484 | 591,508 | |
| Etsy, Inc. (a) | 56,121 | 3,655,722 | |
| Kohl's Corp. | 53,299 | 1,154,456 | |
| Macy's, Inc. | 132,141 | 2,283,396 | |
| Nordstrom, Inc. | 48,266 | 1,101,913 | |
| Ollie's Bargain Outlet Holdings, Inc. (a) | 29,414 | 2,871,983 | |
| 11,658,978 | |||
| Distributors - 0.4% | |||
| Pool Corp. | 17,988 | 6,728,232 | |
| Diversified Consumer Services - 1.1% | |||
| ADT, Inc. | 139,975 | 1,089,006 | |
| Bright Horizons Family Solutions, Inc. (a) | 27,808 | 3,343,912 | |
| Duolingo, Inc. (a) | 17,702 | 3,043,682 | |
| Grand Canyon Education, Inc. (a) | 14,104 | 2,199,519 | |
| H&R Block, Inc. | 66,961 | 3,879,720 | |
| Service Corp. International | 68,829 | 5,500,125 | |
| 19,055,964 | |||
| Hotels, Restaurants & Leisure - 3.7% | |||
| Aramark | 126,349 | 4,329,980 | |
| Boyd Gaming Corp. | 33,130 | 2,016,623 | |
| Caesars Entertainment, Inc. (a) | 103,787 | 4,146,291 | |
| Cava Group, Inc. (a) | 36,406 | 3,066,113 | |
| Choice Hotels International, Inc. (b) | 13,884 | 1,769,516 | |
| Churchill Downs, Inc. | 33,618 | 4,826,200 | |
| Dutch Bros, Inc. (a) | 44,177 | 1,689,770 | |
| Hyatt Hotels Corp. Class A | 21,127 | 3,112,641 | |
| Light & Wonder, Inc. Class A (a) | 43,544 | 4,667,917 | |
| Marriott Vacations Worldwide Corp. | 16,793 | 1,420,352 | |
| Norwegian Cruise Line Holdings Ltd. (a) | 206,553 | 3,806,772 | |
| Penn Entertainment, Inc. (a) | 72,694 | 1,451,699 | |
| Planet Fitness, Inc. (a) | 41,995 | 3,095,032 | |
| Texas Roadhouse, Inc. | 32,172 | 5,617,553 | |
| Travel+Leisure Co. | 33,036 | 1,522,629 | |
| Vail Resorts, Inc. | 18,323 | 3,334,969 | |
| Wendy's Co. | 83,235 | 1,409,169 | |
| Wingstop, Inc. | 14,157 | 5,293,019 | |
| Wyndham Hotels & Resorts, Inc. | 37,850 | 2,866,002 | |
| Wynn Resorts Ltd. | 49,297 | 4,082,778 | |
| 63,525,025 | |||
| Household Durables - 1.7% | |||
| Leggett & Platt, Inc. | 64,163 | 845,027 | |
| Mohawk Industries, Inc. (a) | 25,606 | 4,124,358 | |
| Newell Brands, Inc. | 200,168 | 1,719,443 | |
| SharkNinja, Inc. | 31,935 | 2,454,205 | |
| Tempur Sealy International, Inc. | 80,957 | 4,238,099 | |
| Toll Brothers, Inc. | 50,052 | 7,142,921 | |
| TopBuild Corp. (a) | 15,324 | 7,333,147 | |
| Whirlpool Corp. | 25,531 | 2,603,396 | |
| 30,460,596 | |||
| Leisure Products - 0.8% | |||
| Brunswick Corp. | 32,575 | 2,653,234 | |
| Hasbro, Inc. | 67,106 | 4,325,653 | |
| Mattel, Inc. (a) | 165,309 | 3,188,811 | |
| Polaris, Inc. | 25,196 | 2,098,323 | |
| YETI Holdings, Inc. (a)(b) | 41,100 | 1,699,485 | |
| 13,965,506 | |||
| Specialty Retail - 2.9% | |||
| Advance Auto Parts, Inc. | 28,724 | 1,819,091 | |
| AutoNation, Inc. (a) | 12,439 | 2,372,366 | |
| Bath & Body Works, Inc. | 108,576 | 3,990,168 | |
| Carvana Co. Class A (a) | 50,883 | 6,779,142 | |
| Dick's Sporting Goods, Inc. | 27,463 | 5,941,620 | |
| Five Below, Inc. (a) | 26,230 | 1,907,970 | |
| Floor & Decor Holdings, Inc. Class A (a) | 50,658 | 4,964,484 | |
| GameStop Corp. Class A (a)(b) | 129,862 | 2,943,972 | |
| Gap, Inc. | 96,844 | 2,273,897 | |
| Lithia Motors, Inc. Class A (sub. vtg.) | 13,075 | 3,613,015 | |
| Murphy U.S.A., Inc. | 9,087 | 4,588,208 | |
| Penske Automotive Group, Inc. | 8,905 | 1,550,450 | |
| RH (a) | 7,170 | 2,079,874 | |
| Valvoline, Inc. (a) | 62,330 | 2,898,345 | |
| Wayfair LLC Class A (a)(b) | 44,508 | 2,422,570 | |
| 50,145,172 | |||
| Textiles, Apparel & Luxury Goods - 1.6% | |||
| Amer Sports, Inc. | 58,514 | 679,348 | |
| Birkenstock Holding PLC | 18,950 | 1,120,135 | |
| Capri Holdings Ltd. (a) | 54,742 | 1,836,047 | |
| Carter's, Inc. (b) | 17,303 | 1,047,697 | |
| Columbia Sportswear Co. | 16,047 | 1,311,040 | |
| Crocs, Inc. (a) | 28,694 | 3,855,613 | |
| PVH Corp. | 27,638 | 2,818,800 | |
| Ralph Lauren Corp. Class A | 18,580 | 3,262,462 | |
| Skechers U.S.A., Inc. Class A (sub. vtg.) (a) | 65,218 | 4,247,648 | |
| Tapestry, Inc. | 110,497 | 4,429,825 | |
| Under Armour, Inc.: | |||
| Class A (sub. vtg.) (a) | 91,029 | 634,472 | |
| Class C (non-vtg.) (a)(b) | 93,416 | 634,295 | |
| VF Corp. | 168,835 | 2,863,442 | |
| 28,740,824 | |||
TOTAL CONSUMER DISCRETIONARY | 248,900,235 | ||
| CONSUMER STAPLES - 3.9% | |||
| Beverages - 0.5% | |||
| Boston Beer Co., Inc. Class A (a) | 4,388 | 1,229,561 | |
| Celsius Holdings, Inc. (a) | 84,978 | 3,979,520 | |
| Coca-Cola Consolidated, Inc. | 2,846 | 3,261,203 | |
| 8,470,284 | |||
| Consumer Staples Distribution & Retail - 1.8% | |||
| Albertsons Companies, Inc. | 201,639 | 3,998,501 | |
| BJ's Wholesale Club Holdings, Inc. (a) | 63,650 | 5,598,654 | |
| Casey's General Stores, Inc. | 17,859 | 6,926,435 | |
| Grocery Outlet Holding Corp. (a) | 46,757 | 914,567 | |
| Maplebear, Inc. (NASDAQ) | 83,038 | 2,863,981 | |
| Performance Food Group Co. (a) | 73,738 | 5,087,922 | |
| U.S. Foods Holding Corp. (a) | 110,532 | 6,011,835 | |
| 31,401,895 | |||
| Food Products - 0.9% | |||
| Darling Ingredients, Inc. (a) | 76,503 | 3,039,464 | |
| Flowers Foods, Inc. | 90,422 | 2,036,303 | |
| Freshpet, Inc. (a) | 22,459 | 2,733,260 | |
| Ingredion, Inc. | 31,615 | 3,931,958 | |
| Pilgrim's Pride Corp. (a) | 19,911 | 820,931 | |
| Post Holdings, Inc. (a) | 23,832 | 2,606,268 | |
| Seaboard Corp. | 124 | 402,741 | |
| 15,570,925 | |||
| Household Products - 0.1% | |||
| Reynolds Consumer Products, Inc. | 26,234 | 729,830 | |
| Spectrum Brands Holdings, Inc. | 14,141 | 1,196,470 | |
| 1,926,300 | |||
| Personal Care Products - 0.6% | |||
| BellRing Brands, Inc. (a) | 62,878 | 3,224,384 | |
| Coty, Inc. Class A (a) | 189,838 | 1,888,888 | |
| elf Beauty, Inc. (a) | 25,531 | 4,406,140 | |
| 9,519,412 | |||
TOTAL CONSUMER STAPLES | 66,888,816 | ||
| ENERGY - 5.1% | |||
| Energy Equipment & Services - 0.8% | |||
| NOV, Inc. | 189,995 | 3,955,696 | |
| TechnipFMC PLC | 206,947 | 6,104,937 | |
| Weatherford International PLC | 34,819 | 4,103,767 | |
| 14,164,400 | |||
| Oil, Gas & Consumable Fuels - 4.3% | |||
| Antero Midstream GP LP | 163,538 | 2,348,406 | |
| Antero Resources Corp. (a) | 139,971 | 4,061,958 | |
| APA Corp. | 174,611 | 5,446,117 | |
| Chesapeake Energy Corp. | 63,334 | 4,834,284 | |
| Chord Energy Corp. | 29,815 | 5,118,043 | |
| Civitas Resources, Inc. | 48,220 | 3,363,827 | |
| DT Midstream, Inc. | 46,853 | 3,530,842 | |
| EQT Corp. | 284,408 | 9,814,906 | |
| HF Sinclair Corp. | 78,171 | 4,023,461 | |
| Matador Resources Co. | 56,716 | 3,486,900 | |
| New Fortress Energy, Inc. Class A (b) | 31,453 | 620,882 | |
| Ovintiv, Inc. | 129,422 | 6,010,358 | |
| Permian Resource Corp. Class A | 303,008 | 4,648,143 | |
| Range Resources Corp. | 114,394 | 3,572,525 | |
| Southwestern Energy Co. (a) | 529,221 | 3,413,475 | |
| Texas Pacific Land Corp. (b) | 9,062 | 7,656,484 | |
| Viper Energy, Inc. | 44,062 | 1,880,126 | |
| 73,830,737 | |||
TOTAL ENERGY | 87,995,137 | ||
| FINANCIALS - 15.9% | |||
| Banks - 3.5% | |||
| Bank OZK | 51,282 | 2,404,613 | |
| BOK Financial Corp. | 10,945 | 1,125,584 | |
| Columbia Banking Systems, Inc. | 100,612 | 2,632,010 | |
| Comerica, Inc. | 63,973 | 3,506,360 | |
| Commerce Bancshares, Inc. | 57,483 | 3,719,725 | |
| Cullen/Frost Bankers, Inc. | 28,376 | 3,321,695 | |
| East West Bancorp, Inc. | 66,569 | 5,850,749 | |
| First Hawaiian, Inc. | 61,459 | 1,538,933 | |
| First Horizon National Corp. | 263,389 | 4,406,498 | |
| FNB Corp., Pennsylvania | 171,617 | 2,632,605 | |
| Pinnacle Financial Partners, Inc. | 36,571 | 3,522,519 | |
| Popular, Inc. | 34,413 | 3,531,806 | |
| Prosperity Bancshares, Inc. | 43,286 | 3,139,101 | |
| Synovus Financial Corp. | 70,421 | 3,292,182 | |
| TFS Financial Corp. | 24,355 | 330,254 | |
| Webster Financial Corp. | 82,355 | 4,086,455 | |
| Western Alliance Bancorp. | 51,805 | 4,168,230 | |
| Wintrust Financial Corp. | 31,308 | 3,387,526 | |
| Zions Bancorporation NA | 69,783 | 3,605,688 | |
| 60,202,533 | |||
| Capital Markets - 3.8% | |||
| Affiliated Managers Group, Inc. | 15,415 | 2,861,332 | |
| Carlyle Group LP | 105,647 | 5,254,882 | |
| Evercore, Inc. Class A | 17,307 | 4,333,500 | |
| FactSet Research Systems, Inc. | 18,352 | 7,581,028 | |
| Houlihan Lokey | 24,817 | 3,728,754 | |
| Invesco Ltd. | 176,330 | 3,043,456 | |
| Janus Henderson Group PLC | 62,361 | 2,321,700 | |
| Jefferies Financial Group, Inc. | 86,910 | 5,081,628 | |
| Lazard, Inc. Class A | 52,815 | 2,596,914 | |
| MarketAxess Holdings, Inc. | 17,824 | 3,984,199 | |
| Morningstar, Inc. | 12,879 | 4,091,014 | |
| Robinhood Markets, Inc. (a) | 320,486 | 6,592,397 | |
| SEI Investments Co. | 48,767 | 3,308,353 | |
| Stifel Financial Corp. | 47,898 | 4,247,116 | |
| TPG, Inc. | 40,542 | 2,067,237 | |
| Virtu Financial, Inc. Class A | 39,804 | 1,087,445 | |
| XP, Inc. Class A | 196,875 | 3,368,531 | |
| 65,549,486 | |||
| Consumer Finance - 1.0% | |||
| Ally Financial, Inc. | 132,439 | 5,961,079 | |
| Credit Acceptance Corp. (a) | 3,000 | 1,724,700 | |
| OneMain Holdings, Inc. | 54,461 | 2,846,132 | |
| SLM Corp. | 105,267 | 2,388,508 | |
| SoFi Technologies, Inc. (a)(b) | 497,199 | 3,748,880 | |
| 16,669,299 | |||
| Financial Services - 2.4% | |||
| Affirm Holdings, Inc. Class A, (a)(b) | 109,908 | 3,109,297 | |
| Corebridge Financial, Inc. | 123,351 | 3,645,022 | |
| Equitable Holdings, Inc. | 157,655 | 6,875,335 | |
| Euronet Worldwide, Inc. (a) | 20,850 | 2,126,492 | |
| Jack Henry & Associates, Inc. | 34,997 | 6,001,286 | |
| MGIC Investment Corp. | 128,716 | 3,197,305 | |
| Shift4 Payments, Inc. (a)(b) | 28,996 | 1,994,635 | |
| The Western Union Co. | 163,144 | 1,939,782 | |
| Toast, Inc. (a) | 214,043 | 5,599,365 | |
| UWM Holdings Corp. Class A | 45,489 | 382,108 | |
| Voya Financial, Inc. | 48,895 | 3,556,133 | |
| WEX, Inc. (a) | 20,140 | 3,694,683 | |
| 42,121,443 | |||
| Insurance - 4.4% | |||
| American Financial Group, Inc. | 34,631 | 4,535,276 | |
| Assurant, Inc. | 25,097 | 4,388,712 | |
| Assured Guaranty Ltd. | 25,575 | 2,106,613 | |
| Axis Capital Holdings Ltd. | 37,462 | 2,837,747 | |
| Brighthouse Financial, Inc. (a) | 29,794 | 1,485,827 | |
| Everest Re Group Ltd. | 20,765 | 8,157,946 | |
| First American Financial Corp. | 48,208 | 2,920,441 | |
| Globe Life, Inc. | 44,750 | 4,150,115 | |
| Hanover Insurance Group, Inc. | 17,220 | 2,367,578 | |
| Kemper Corp. | 29,228 | 1,872,346 | |
| Kinsale Capital Group, Inc. | 10,627 | 4,857,283 | |
| Lincoln National Corp. | 82,068 | 2,732,864 | |
| Old Republic International Corp. | 121,553 | 4,208,165 | |
| Primerica, Inc. | 16,674 | 4,198,013 | |
| Reinsurance Group of America, Inc. | 31,694 | 7,144,778 | |
| RenaissanceRe Holdings Ltd. | 25,018 | 5,801,924 | |
| RLI Corp. | 19,987 | 3,009,842 | |
| Ryan Specialty Group Holdings, Inc. (b) | 49,371 | 3,040,760 | |
| Unum Group | 92,082 | 5,297,477 | |
| White Mountains Insurance Group Ltd. | 1,203 | 2,148,558 | |
| 77,262,265 | |||
| Mortgage Real Estate Investment Trusts - 0.8% | |||
| AGNC Investment Corp. | 334,943 | 3,352,779 | |
| Annaly Capital Management, Inc. | 241,467 | 4,807,608 | |
| Rithm Capital Corp. | 232,918 | 2,704,178 | |
| Starwood Property Trust, Inc. (b) | 143,006 | 2,852,970 | |
| 13,717,535 | |||
TOTAL FINANCIALS | 275,522,561 | ||
| HEALTH CARE - 9.5% | |||
| Biotechnology - 2.9% | |||
| Apellis Pharmaceuticals, Inc. (a) | 50,389 | 1,995,404 | |
| Cerevel Therapeutics Holdings (a) | 33,273 | 1,495,954 | |
| Exact Sciences Corp. (a) | 88,029 | 4,021,165 | |
| Exelixis, Inc. (a) | 138,116 | 3,238,820 | |
| Ionis Pharmaceuticals, Inc. (a) | 69,981 | 3,461,260 | |
| Natera, Inc. (a) | 54,614 | 5,591,927 | |
| Neurocrine Biosciences, Inc. (a) | 48,125 | 6,813,056 | |
| Repligen Corp. (a) | 26,882 | 4,498,703 | |
| Roivant Sciences Ltd. (a) | 169,116 | 1,834,909 | |
| Sarepta Therapeutics, Inc. (a) | 43,701 | 6,216,030 | |
| Ultragenyx Pharmaceutical, Inc. (a) | 42,110 | 1,895,792 | |
| United Therapeutics Corp. (a) | 21,073 | 6,601,960 | |
| Viking Therapeutics, Inc. (a) | 50,746 | 2,892,522 | |
| 50,557,502 | |||
| Health Care Equipment & Supplies - 1.3% | |||
| Dentsply Sirona, Inc. | 99,872 | 2,710,526 | |
| Enovis Corp. (a) | 26,239 | 1,250,026 | |
| Envista Holdings Corp. (a) | 82,920 | 1,415,444 | |
| Globus Medical, Inc. (a) | 54,022 | 3,887,423 | |
| Inspire Medical Systems, Inc. (a) | 14,360 | 2,025,478 | |
| Masimo Corp. (a)(b) | 20,669 | 2,211,170 | |
| Penumbra, Inc. (a) | 17,791 | 2,972,698 | |
| QuidelOrtho Corp. (a) | 26,009 | 1,021,894 | |
| Teleflex, Inc. | 22,725 | 5,020,407 | |
| 22,515,066 | |||
| Health Care Providers & Services - 2.1% | |||
| Acadia Healthcare Co., Inc. (a) | 43,907 | 2,847,369 | |
| Amedisys, Inc. (a) | 15,460 | 1,515,853 | |
| Chemed Corp. | 7,162 | 4,083,486 | |
| DaVita, Inc. (a) | 24,331 | 3,324,101 | |
| Encompass Health Corp. | 47,752 | 4,438,071 | |
| Henry Schein, Inc. (a) | 61,642 | 4,434,525 | |
| Premier, Inc. Class A | 57,447 | 1,205,238 | |
| R1 RCM, Inc. (a) | 75,671 | 974,642 | |
| Tenet Healthcare Corp. (a) | 46,782 | 7,003,265 | |
| Universal Health Services, Inc. Class B | 27,928 | 5,969,889 | |
| 35,796,439 | |||
| Health Care Technology - 0.1% | |||
| Certara, Inc. (a) | 58,018 | 905,661 | |
| Doximity, Inc. (a)(b) | 57,788 | 1,618,064 | |
| 2,523,725 | |||
| Life Sciences Tools & Services - 1.9% | |||
| 10X Genomics, Inc. (a) | 50,224 | 1,038,130 | |
| Azenta, Inc. (a) | 26,448 | 1,647,446 | |
| Bio-Rad Laboratories, Inc. Class A (a) | 9,316 | 3,152,162 | |
| Bio-Techne Corp. | 74,952 | 6,115,334 | |
| Bruker Corp. | 50,593 | 3,466,126 | |
| Charles River Laboratories International, Inc. (a) | 24,647 | 6,016,333 | |
| Fortrea Holdings, Inc. (a) | 43,162 | 1,190,840 | |
| Medpace Holdings, Inc. (a) | 12,261 | 4,690,078 | |
| QIAGEN NV | 106,592 | 4,742,278 | |
| Sotera Health Co. (a) | 60,560 | 839,967 | |
| 32,898,694 | |||
| Pharmaceuticals - 1.2% | |||
| Catalent, Inc. (a) | 87,330 | 5,182,162 | |
| Elanco Animal Health, Inc. (a) | 237,546 | 3,097,600 | |
| Intra-Cellular Therapies, Inc. (a) | 49,666 | 3,909,708 | |
| Jazz Pharmaceuticals PLC (a) | 29,365 | 3,237,491 | |
| Organon & Co. | 124,137 | 2,713,635 | |
| Perrigo Co. PLC | 65,391 | 1,848,604 | |
| 19,989,200 | |||
TOTAL HEALTH CARE | 164,280,626 | ||
| INDUSTRIALS - 20.4% | |||
| Aerospace & Defense - 1.9% | |||
| BWX Technologies, Inc. | 43,992 | 4,376,764 | |
| Curtiss-Wright Corp. | 18,406 | 5,424,248 | |
| Hexcel Corp. | 39,922 | 2,643,236 | |
| Huntington Ingalls Industries, Inc. | 19,055 | 5,335,019 | |
| Loar Holdings, Inc. (b) | 4,993 | 312,063 | |
| Spirit AeroSystems Holdings, Inc. Class A (a) | 55,949 | 2,028,151 | |
| Textron, Inc. | 91,790 | 8,527,291 | |
| Woodward, Inc. | 28,711 | 4,478,629 | |
| 33,125,401 | |||
| Air Freight & Logistics - 0.5% | |||
| C.H. Robinson Worldwide, Inc. | 55,348 | 4,928,739 | |
| GXO Logistics, Inc. (a) | 56,652 | 3,171,379 | |
| 8,100,118 | |||
| Building Products - 3.2% | |||
| A.O. Smith Corp. | 57,991 | 4,931,555 | |
| AAON, Inc. | 32,952 | 2,917,241 | |
| Advanced Drain Systems, Inc. | 32,064 | 5,676,611 | |
| Allegion PLC | 42,202 | 5,773,656 | |
| Armstrong World Industries, Inc. | 20,961 | 2,754,275 | |
| Fortune Brands Innovations, Inc. | 60,180 | 4,863,146 | |
| Hayward Holdings, Inc. (a) | 68,775 | 1,017,182 | |
| Lennox International, Inc. | 15,467 | 9,024,995 | |
| Owens Corning | 41,630 | 7,758,999 | |
| Simpson Manufacturing Co. Ltd. | 20,449 | 3,928,048 | |
| The AZEK Co., Inc. Class A, (a) | 69,271 | 3,109,575 | |
| Trex Co., Inc. (a) | 52,297 | 4,373,598 | |
| 56,128,881 | |||
| Commercial Services & Supplies - 1.0% | |||
| Clean Harbors, Inc. (a) | 24,873 | 5,937,931 | |
| MSA Safety, Inc. | 17,856 | 3,368,534 | |
| Stericycle, Inc. (a) | 44,477 | 2,604,128 | |
| Tetra Tech, Inc. | 25,717 | 5,483,893 | |
| Vestis Corp. | 63,415 | 822,493 | |
| 18,216,979 | |||
| Construction & Engineering - 2.1% | |||
| AECOM | 65,494 | 5,934,411 | |
| API Group Corp. (a) | 109,740 | 4,158,049 | |
| Comfort Systems U.S.A., Inc. | 16,959 | 5,637,511 | |
| EMCOR Group, Inc. | 22,434 | 8,422,621 | |
| MasTec, Inc. (a) | 30,232 | 3,326,427 | |
| MDU Resources Group, Inc. | 97,996 | 2,640,012 | |
| Valmont Industries, Inc. | 9,603 | 2,865,151 | |
| Willscot Holdings Corp. (a) | 89,113 | 3,653,633 | |
| 36,637,815 | |||
| Electrical Equipment - 1.3% | |||
| Acuity Brands, Inc. | 14,857 | 3,734,307 | |
| Generac Holdings, Inc. (a) | 28,409 | 4,422,713 | |
| nVent Electric PLC | 79,707 | 5,789,119 | |
| Regal Rexnord Corp. | 32,031 | 5,146,741 | |
| Sensata Technologies PLC | 72,102 | 2,811,257 | |
| 21,904,137 | |||
| Ground Transportation - 1.7% | |||
| Avis Budget Group, Inc. | 8,295 | 837,878 | |
| Knight-Swift Transportation Holdings, Inc. | 75,503 | 4,109,628 | |
| Landstar System, Inc. | 17,162 | 3,265,071 | |
| Lyft, Inc. (a) | 174,196 | 2,099,062 | |
| Ryder System, Inc. | 20,785 | 2,913,226 | |
| Saia, Inc. (a) | 12,779 | 5,339,705 | |
| Schneider National, Inc. Class B | 22,672 | 610,104 | |
| U-Haul Holding Co. (a)(b) | 3,623 | 241,980 | |
| U-Haul Holding Co. (non-vtg.) | 48,489 | 3,090,204 | |
| XPO, Inc. (a) | 55,161 | 6,337,447 | |
| 28,844,305 | |||
| Machinery - 4.6% | |||
| AGCO Corp. | 30,030 | 2,835,433 | |
| Allison Transmission Holdings, Inc. | 42,172 | 3,736,017 | |
| Crane Co. | 23,597 | 3,785,431 | |
| Donaldson Co., Inc. | 57,935 | 4,334,697 | |
| ESAB Corp. | 27,284 | 2,772,054 | |
| Flowserve Corp. | 63,358 | 3,202,747 | |
| Gates Industrial Corp. PLC (a) | 98,886 | 1,838,291 | |
| Graco, Inc. | 80,708 | 6,864,215 | |
| ITT, Inc. | 39,755 | 5,623,742 | |
| Lincoln Electric Holdings, Inc. | 26,630 | 5,470,068 | |
| Middleby Corp. (a) | 25,693 | 3,483,457 | |
| Nordson Corp. | 27,380 | 6,854,035 | |
| Oshkosh Corp. | 31,475 | 3,419,759 | |
| Pentair PLC | 79,669 | 7,000,515 | |
| RBC Bearings, Inc. (a) | 13,714 | 3,988,580 | |
| Snap-On, Inc. | 24,966 | 7,165,991 | |
| Timken Co. | 31,179 | 2,711,014 | |
| Toro Co. | 50,387 | 4,823,548 | |
| 79,909,594 | |||
| Marine Transportation - 0.2% | |||
| Kirby Corp. (a) | 27,988 | 3,439,165 | |
| Passenger Airlines - 0.3% | |||
| Alaska Air Group, Inc. (a) | 60,545 | 2,272,254 | |
| American Airlines Group, Inc. (a)(b) | 315,856 | 3,360,708 | |
| 5,632,962 | |||
| Professional Services - 2.2% | |||
| CACI International, Inc. (a) | 10,650 | 4,914,762 | |
| Clarivate PLC (a)(b) | 196,967 | 1,327,558 | |
| Concentrix Corp. | 22,917 | 1,615,649 | |
| Dayforce, Inc. (a)(b) | 71,515 | 4,239,409 | |
| Dun & Bradstreet Holdings, Inc. | 145,939 | 1,587,816 | |
| FTI Consulting, Inc. (a) | 16,968 | 3,698,515 | |
| Genpact Ltd. | 84,759 | 2,938,595 | |
| KBR, Inc. | 64,216 | 4,276,143 | |
| ManpowerGroup, Inc. | 23,064 | 1,766,241 | |
| Parsons Corp. (a) | 22,073 | 2,016,810 | |
| Paycor HCM, Inc. (a) | 35,024 | 434,648 | |
| Paylocity Holding Corp. (a) | 21,153 | 3,174,431 | |
| Robert Half, Inc. | 49,305 | 3,164,888 | |
| Science Applications International Corp. | 24,660 | 3,067,704 | |
| 38,223,169 | |||
| Trading Companies & Distributors - 1.4% | |||
| Air Lease Corp. Class A | 50,320 | 2,496,878 | |
| Core & Main, Inc. (a) | 80,053 | 4,280,434 | |
| MSC Industrial Direct Co., Inc. Class A | 22,141 | 1,969,442 | |
| SiteOne Landscape Supply, Inc. (a) | 21,519 | 3,156,407 | |
| Watsco, Inc. | 16,687 | 8,168,120 | |
| WESCO International, Inc. | 21,044 | 3,681,648 | |
| 23,752,929 | |||
TOTAL INDUSTRIALS | 353,915,455 | ||
| INFORMATION TECHNOLOGY - 11.0% | |||
| Communications Equipment - 1.0% | |||
| Ciena Corp. (a) | 69,453 | 3,662,951 | |
| F5, Inc. (a) | 28,186 | 5,739,797 | |
| Juniper Networks, Inc. | 155,109 | 5,846,058 | |
| Lumentum Holdings, Inc. (a) | 32,203 | 1,667,471 | |
| Ubiquiti, Inc. (b) | 2,009 | 372,810 | |
| 17,289,087 | |||
| Electronic Equipment, Instruments & Components - 1.9% | |||
| Arrow Electronics, Inc. (a) | 25,976 | 3,212,971 | |
| Avnet, Inc. | 43,319 | 2,328,829 | |
| Cognex Corp. | 82,940 | 4,115,483 | |
| Coherent Corp. (a) | 63,788 | 4,444,748 | |
| Crane NXT Co. | 23,649 | 1,487,049 | |
| IPG Photonics Corp. (a) | 13,723 | 1,103,329 | |
| Jabil, Inc. | 56,680 | 6,386,136 | |
| Littelfuse, Inc. | 11,773 | 3,144,686 | |
| TD SYNNEX Corp. | 36,366 | 4,333,736 | |
| Vontier Corp. | 74,513 | 2,923,145 | |
| 33,480,112 | |||
| IT Services - 0.8% | |||
| Amdocs Ltd. | 55,266 | 4,834,117 | |
| DXC Technology Co. (a) | 87,542 | 1,780,604 | |
| Globant SA (a) | 20,293 | 3,951,250 | |
| Kyndryl Holdings, Inc. (a) | 109,700 | 2,947,639 | |
| 13,513,610 | |||
| Semiconductors & Semiconductor Equipment - 1.9% | |||
| Allegro MicroSystems LLC (a) | 36,288 | 872,364 | |
| Amkor Technology, Inc. | 54,398 | 1,776,639 | |
| Astera Labs, Inc. (b) | 10,635 | 466,238 | |
| Cirrus Logic, Inc. (a) | 25,941 | 3,384,782 | |
| Lattice Semiconductor Corp. (a) | 65,713 | 3,482,789 | |
| MACOM Technology Solutions Holdings, Inc. (a) | 26,916 | 2,716,363 | |
| MKS Instruments, Inc. | 32,259 | 4,061,408 | |
| Onto Innovation, Inc. (a) | 23,631 | 4,520,610 | |
| Qorvo, Inc. (a) | 46,482 | 5,568,544 | |
| Universal Display Corp. | 22,508 | 5,010,731 | |
| Wolfspeed, Inc. (a)(b) | 60,062 | 1,132,169 | |
| 32,992,637 | |||
| Software - 4.9% | |||
| AppFolio, Inc. Class A, (a) | 10,608 | 2,349,460 | |
| Aspen Technology, Inc. (a) | 12,977 | 2,439,027 | |
| Bentley Systems, Inc. Class B | 67,620 | 3,295,799 | |
| Bill Holdings, Inc. (a) | 49,402 | 2,468,124 | |
| CCC Intelligent Solutions Holdings, Inc. Class A (a) | 215,087 | 2,206,793 | |
| Confluent, Inc. (a) | 116,652 | 2,918,633 | |
| Dolby Laboratories, Inc. Class A | 28,202 | 2,221,190 | |
| DoubleVerify Holdings, Inc. (a) | 69,928 | 1,476,879 | |
| Dropbox, Inc. Class A (a) | 119,985 | 2,870,041 | |
| Dynatrace, Inc. (a) | 125,587 | 5,515,781 | |
| Elastic NV (a) | 39,259 | 4,305,535 | |
| Five9, Inc. (a) | 35,363 | 1,575,422 | |
| Gen Digital, Inc. | 271,588 | 7,058,572 | |
| GitLab, Inc. (a) | 57,160 | 2,928,307 | |
| Guidewire Software, Inc. (a) | 39,495 | 5,927,015 | |
| HashiCorp, Inc. (a) | 46,418 | 1,566,608 | |
| Informatica, Inc. (a) | 30,799 | 737,328 | |
| Manhattan Associates, Inc. (a) | 29,555 | 7,547,756 | |
| nCino, Inc. (a) | 39,821 | 1,304,536 | |
| Nutanix, Inc. Class A (a) | 117,185 | 5,919,014 | |
| Pegasystems, Inc. | 21,511 | 1,499,747 | |
| Procore Technologies, Inc. (a) | 50,803 | 3,608,537 | |
| RingCentral, Inc. (a) | 39,647 | 1,389,627 | |
| SentinelOne, Inc. (a) | 110,612 | 2,533,015 | |
| Smartsheet, Inc. (a) | 61,178 | 2,934,097 | |
| Teradata Corp. (a) | 46,824 | 1,518,034 | |
| UiPath, Inc. Class A (a) | 187,744 | 2,284,844 | |
| Unity Software, Inc. (a)(b) | 143,427 | 2,346,466 | |
| 84,746,187 | |||
| Technology Hardware, Storage & Peripherals - 0.5% | |||
| Pure Storage, Inc. Class A (a) | 139,936 | 8,386,364 | |
TOTAL INFORMATION TECHNOLOGY | 190,407,997 | ||
| MATERIALS - 6.8% | |||
| Chemicals - 2.0% | |||
| Ashland, Inc. | 24,096 | 2,328,878 | |
| Axalta Coating Systems Ltd. (a) | 106,275 | 3,788,704 | |
| Element Solutions, Inc. | 107,984 | 2,910,169 | |
| FMC Corp. | 60,084 | 3,506,502 | |
| Huntsman Corp. | 78,848 | 1,886,833 | |
| NewMarket Corp. | 3,245 | 1,820,023 | |
| Olin Corp. | 57,622 | 2,628,139 | |
| RPM International, Inc. | 61,336 | 7,449,871 | |
| The Chemours Co. LLC | 71,938 | 1,738,741 | |
| The Mosaic Co. | 154,376 | 4,595,774 | |
| The Scotts Miracle-Gro Co. | 20,494 | 1,610,828 | |
| 34,264,462 | |||
| Construction Materials - 0.2% | |||
| Eagle Materials, Inc. | 16,449 | 4,479,063 | |
| Containers & Packaging - 2.7% | |||
| Aptargroup, Inc. | 31,849 | 4,681,166 | |
| Avery Dennison Corp. | 38,661 | 8,382,865 | |
| Berry Global Group, Inc. | 55,889 | 3,673,025 | |
| Crown Holdings, Inc. | 56,418 | 5,004,277 | |
| Graphic Packaging Holding Co. | 146,731 | 4,416,603 | |
| Packaging Corp. of America | 42,779 | 8,550,239 | |
| Sealed Air Corp. | 70,198 | 2,671,034 | |
| Silgan Holdings, Inc. | 39,988 | 2,056,583 | |
| Smurfit Westrock PLC | 123,429 | 5,534,556 | |
| Sonoco Products Co. | 47,253 | 2,547,882 | |
| 47,518,230 | |||
| Metals & Mining - 1.7% | |||
| Alcoa Corp. | 120,906 | 3,994,734 | |
| ATI, Inc. (a) | 59,537 | 4,031,250 | |
| Cleveland-Cliffs, Inc. (a) | 225,848 | 3,466,767 | |
| MP Materials Corp. (a)(b) | 63,184 | 854,248 | |
| Reliance, Inc. | 27,555 | 8,392,151 | |
| Royal Gold, Inc. | 31,688 | 4,376,747 | |
| United States Steel Corp. | 107,509 | 4,417,545 | |
| 29,533,442 | |||
| Paper & Forest Products - 0.2% | |||
| Louisiana-Pacific Corp. | 31,083 | 3,051,107 | |
TOTAL MATERIALS | 118,846,304 | ||
| REAL ESTATE - 7.5% | |||
| Equity Real Estate Investment Trusts (REITs) - 6.8% | |||
| Agree Realty Corp. | 47,785 | 3,295,731 | |
| American Homes 4 Rent Class A | 162,913 | 5,879,530 | |
| Americold Realty Trust | 137,111 | 4,098,248 | |
| Brixmor Property Group, Inc. | 144,580 | 3,682,453 | |
| BXP, Inc. | 75,781 | 5,403,943 | |
| Camden Property Trust (SBI) | 49,929 | 5,529,637 | |
| Cousins Properties, Inc. | 73,093 | 2,010,788 | |
| CubeSmart | 107,963 | 5,136,880 | |
| EastGroup Properties, Inc. | 23,050 | 4,310,120 | |
| EPR Properties | 36,050 | 1,622,250 | |
| Equity Lifestyle Properties, Inc. | 88,917 | 6,106,820 | |
| Federal Realty Investment Trust (SBI) | 39,766 | 4,439,874 | |
| First Industrial Realty Trust, Inc. | 63,720 | 3,486,758 | |
| Gaming & Leisure Properties | 125,682 | 6,309,236 | |
| Healthcare Realty Trust, Inc. | 183,441 | 3,245,071 | |
| Highwoods Properties, Inc. (SBI) | 50,323 | 1,558,503 | |
| Host Hotels & Resorts, Inc. | 336,322 | 5,888,998 | |
| Kilroy Realty Corp. | 56,394 | 2,084,886 | |
| Kimco Realty Corp. | 317,877 | 6,907,467 | |
| Lamar Advertising Co. Class A | 42,017 | 5,036,158 | |
| Medical Properties Trust, Inc. (b) | 286,419 | 1,377,675 | |
| National Storage Affiliates Trust | 34,561 | 1,471,262 | |
| NNN (REIT), Inc. | 87,452 | 3,925,720 | |
| Omega Healthcare Investors, Inc. | 119,048 | 4,333,347 | |
| Park Hotels & Resorts, Inc. | 100,205 | 1,509,087 | |
| Rayonier, Inc. (b) | 71,279 | 2,161,892 | |
| Regency Centers Corp. | 88,696 | 5,972,789 | |
| Rexford Industrial Realty, Inc. | 104,051 | 5,213,996 | |
| STAG Industrial, Inc. | 87,311 | 3,563,162 | |
| Vornado Realty Trust | 84,565 | 2,536,104 | |
| 118,098,385 | |||
| Real Estate Management & Development - 0.7% | |||
| Howard Hughes Holdings, Inc. | 14,943 | 1,108,322 | |
| Jones Lang LaSalle, Inc. (a) | 22,800 | 5,720,520 | |
| Zillow Group, Inc.: | |||
| Class A (a) | 22,729 | 1,077,355 | |
| Class C (a) | 76,494 | 3,725,258 | |
| 11,631,455 | |||
TOTAL REAL ESTATE | 129,729,840 | ||
| UTILITIES - 2.2% | |||
| Electric Utilities - 1.0% | |||
| IDACORP, Inc. | 24,397 | 2,384,807 | |
| NRG Energy, Inc. | 103,192 | 7,756,943 | |
| OGE Energy Corp. | 96,451 | 3,739,405 | |
| Pinnacle West Capital Corp. | 54,783 | 4,688,877 | |
| 18,570,032 | |||
| Gas Utilities - 0.3% | |||
| National Fuel Gas Co. | 43,958 | 2,575,499 | |
| UGI Corp. | 101,186 | 2,507,389 | |
| 5,082,888 | |||
| Independent Power and Renewable Electricity Producers - 0.2% | |||
| Brookfield Renewable Corp. | 65,199 | 1,832,092 | |
| Clearway Energy, Inc.: | |||
| Class A | 16,773 | 413,119 | |
| Class C | 39,497 | 1,053,780 | |
| 3,298,991 | |||
| Multi-Utilities - 0.4% | |||
| NiSource, Inc. | 216,423 | 6,763,219 | |
| Water Utilities - 0.3% | |||
| Essential Utilities, Inc. | 121,510 | 4,939,382 | |
TOTAL UTILITIES | 38,654,512 | ||
| TOTAL COMMON STOCKS (Cost $1,421,332,965) | 1,733,961,319 | ||
| U.S. Treasury Obligations - 0.0% | |||
Principal Amount (c) | Value ($) | ||
U.S. Treasury Bills, yield at date of purchase 5.31% 8/22/24 (d) (Cost $314,037) | 315,000 | 314,031 | |
| Money Market Funds - 3.4% | |||
| Shares | Value ($) | ||
| Fidelity Cash Central Fund 5.39% (e) | 2,441,158 | 2,441,647 | |
| Fidelity Securities Lending Cash Central Fund 5.39% (e)(f) | 55,887,904 | 55,893,492 | |
| TOTAL MONEY MARKET FUNDS (Cost $58,335,139) | 58,335,139 | ||
| TOTAL INVESTMENT IN SECURITIES - 103.4% (Cost $1,479,982,141) | 1,792,610,489 |
NET OTHER ASSETS (LIABILITIES) - (3.4)% | (58,150,855) |
| NET ASSETS - 100.0% | 1,734,459,634 |
| Futures Contracts | |||||
Number of contracts | Expiration Date | Notional Amount ($) | Value ($) | Unrealized Appreciation/ (Depreciation) ($) | |
| Purchased | |||||
| Equity Index Contracts | |||||
| CME E-mini S&P MidCap 400 Index Contracts (United States) | 8 | Sep 2024 | 2,496,080 | 126,282 | 126,282 |
| The notional amount of futures purchased as a percentage of Net Assets is 0.1% | |||||
| (a) | Non-income producing |
| (b) | Security or a portion of the security is on loan at period end. |
| (c) | Amount is stated in United States dollars unless otherwise noted. |
| (d) | Security or a portion of the security was pledged to cover margin requirements for futures contracts. At period end, the value of securities pledged amounted to $211,348. |
| (e) | Affiliated fund that is generally available only to investment companies and other accounts managed by Fidelity Investments. The rate quoted is the annualized seven-day yield of the fund at period end. A complete unaudited listing of the fund's holdings as of its most recent quarter end is available upon request. In addition, each Fidelity Central Fund's financial statements, which are not covered by the Fund's Report of Independent Registered Public Accounting Firm, are available on the SEC's website or upon request. |
| (f) | Investment made with cash collateral received from securities on loan. |
| Affiliate | Value, beginning of period ($) | Purchases ($) | Sales Proceeds ($) | Dividend Income ($) | Realized Gain (loss) ($) | Change in Unrealized appreciation (depreciation) ($) | Value, end of period ($) | % ownership, end of period |
| Fidelity Cash Central Fund 5.39% | 1,445,348 | 149,491,536 | 148,495,208 | 217,505 | (29) | - | 2,441,647 | 0.0% |
| Fidelity Securities Lending Cash Central Fund 5.39% | 92,897,377 | 308,085,699 | 345,089,584 | 400,433 | - | - | 55,893,492 | 0.3% |
| Total | 94,342,725 | 457,577,235 | 493,584,792 | 617,938 | (29) | - | 58,335,139 | |
| Valuation Inputs at Reporting Date: | ||||
| Description | Total ($) | Level 1 ($) | Level 2 ($) | Level 3 ($) |
Investments in Securities: | ||||
| Equities: | ||||
Communication Services | 58,819,836 | 58,819,836 | - | - |
Consumer Discretionary | 248,900,235 | 248,900,235 | - | - |
Consumer Staples | 66,888,816 | 66,888,816 | - | - |
Energy | 87,995,137 | 87,995,137 | - | - |
Financials | 275,522,561 | 275,522,561 | - | - |
Health Care | 164,280,626 | 164,280,626 | - | - |
Industrials | 353,915,455 | 353,915,455 | - | - |
Information Technology | 190,407,997 | 190,407,997 | - | - |
Materials | 118,846,304 | 118,846,304 | - | - |
Real Estate | 129,729,840 | 129,729,840 | - | - |
Utilities | 38,654,512 | 38,654,512 | - | - |
| U.S. Government and Government Agency Obligations | 314,031 | - | 314,031 | - |
| Money Market Funds | 58,335,139 | 58,335,139 | - | - |
| Total Investments in Securities: | 1,792,610,489 | 1,792,296,458 | 314,031 | - |
Derivative Instruments: Assets | ||||
Futures Contracts | 126,282 | 126,282 | - | - |
| Total Assets | 126,282 | 126,282 | - | - |
| Total Derivative Instruments: | 126,282 | 126,282 | - | - |
Primary Risk Exposure / Derivative Type | Value | |
| Asset ($) | Liability ($) | |
| Equity Risk | ||
Futures Contracts (a) | 126,282 | 0 |
| Total Equity Risk | 126,282 | 0 |
| Total Value of Derivatives | 126,282 | 0 |
| Statement of Assets and Liabilities | ||||
As of July 31, 2024 | ||||
| Assets | ||||
| Investment in securities, at value (including securities loaned of $55,025,889) - See accompanying schedule: | ||||
Unaffiliated issuers (cost $1,421,647,002) | $ | 1,734,275,350 | ||
Fidelity Central Funds (cost $58,335,139) | 58,335,139 | |||
| Total Investment in Securities (cost $1,479,982,141) | $ | 1,792,610,489 | ||
| Cash | 5,494 | |||
| Receivable for investments sold | 2,036 | |||
| Dividends receivable | 549,199 | |||
| Distributions receivable from Fidelity Central Funds | 58,972 | |||
| Receivable for daily variation margin on futures contracts | 23,698 | |||
| Prepaid expenses | 318 | |||
| Receivable from investment adviser for expense reductions | 128,978 | |||
| Other receivables | 62,830 | |||
Total assets | 1,793,442,014 | |||
| Liabilities | ||||
| Payable for investments purchased | $ | 186,751 | ||
| Payable for fund shares redeemed | 2,622,720 | |||
| Accrued management fee | 156,859 | |||
| Other payables and accrued expenses | 131,887 | |||
| Collateral on securities loaned | 55,884,163 | |||
| Total liabilities | 58,982,380 | |||
| Net Assets | $ | 1,734,459,634 | ||
| Net Assets consist of: | ||||
| Paid in capital | $ | 1,381,453,260 | ||
| Total accumulated earnings (loss) | 353,006,374 | |||
| Net Assets | $ | 1,734,459,634 | ||
Net Asset Value, offering price and redemption price per share ($1,734,459,634 ÷ 261,266,815 shares) | $ | 6.64 | ||
| Statement of Operations | ||||
| Year ended July 31, 2024 | ||||
| Investment Income | ||||
| Dividends | $ | 24,603,428 | ||
| Interest | 17,128 | |||
| Income from Fidelity Central Funds (including $400,433 from security lending) | 617,938 | |||
| Total income | 25,238,494 | |||
| Expenses | ||||
| Management fee | $ | 1,752,006 | ||
| Custodian fees and expenses | 104,507 | |||
| Independent trustees' fees and expenses | 4,702 | |||
| Registration fees | 25,758 | |||
| Audit fees | 56,720 | |||
| Legal | 7,300 | |||
| Interest | 29,179 | |||
| Miscellaneous | 6,517 | |||
| Total expenses before reductions | 1,986,689 | |||
| Expense reductions | (1,156,957) | |||
| Total expenses after reductions | 829,732 | |||
| Net Investment income (loss) | 24,408,762 | |||
| Realized and Unrealized Gain (Loss) | ||||
| Net realized gain (loss) on: | ||||
| Investment Securities: | ||||
| Unaffiliated issuers | 64,164,405 | |||
| Fidelity Central Funds | (29) | |||
| Futures contracts | 591,580 | |||
| Total net realized gain (loss) | 64,755,956 | |||
| Change in net unrealized appreciation (depreciation) on: | ||||
| Investment Securities: | ||||
| Unaffiliated issuers | 97,073,533 | |||
| Assets and liabilities in foreign currencies | (170) | |||
| Futures contracts | 12,743 | |||
| Total change in net unrealized appreciation (depreciation) | 97,086,106 | |||
| Net gain (loss) | 161,842,062 | |||
| Net increase (decrease) in net assets resulting from operations | $ | 186,250,824 | ||
| Statement of Changes in Net Assets | ||||
Year ended July 31, 2024 | Year ended July 31, 2023 | |||
| Increase (Decrease) in Net Assets | ||||
| Operations | ||||
| Net investment income (loss) | $ | 24,408,762 | $ | 17,192,877 |
| Net realized gain (loss) | 64,755,956 | (9,576,067) | ||
| Change in net unrealized appreciation (depreciation) | 97,086,106 | 138,189,010 | ||
| Net increase (decrease) in net assets resulting from operations | 186,250,824 | 145,805,820 | ||
| Distributions to shareholders | (37,672,815) | (110,768,589) | ||
| Share transactions | ||||
| Proceeds from sales of shares | 228,116,525 | 1,860,933,035 | ||
| Reinvestment of distributions | 37,661,887 | 110,367,799 | ||
| Cost of shares redeemed | (290,833,750) | (641,896,678) | ||
Net increase (decrease) in net assets resulting from share transactions | (25,055,338) | 1,329,404,156 | ||
| Total increase (decrease) in net assets | 123,522,671 | 1,364,441,387 | ||
| Net Assets | ||||
| Beginning of period | 1,610,936,963 | 246,495,576 | ||
| End of period | $ | 1,734,459,634 | $ | 1,610,936,963 |
| Other Information | ||||
| Shares | ||||
| Sold | 37,001,333 | 336,949,020 | ||
| Issued in reinvestment of distributions | 6,626,293 | 19,549,412 | ||
| Redeemed | (47,867,432) | (116,031,798) | ||
| Net increase (decrease) | (4,239,806) | 240,466,634 | ||
Fidelity® SAI Small-Mid Cap 500 Index Fund |
| Years ended July 31, | 2024 | 2023 | 2022 | 2021 | 2020 | |||||
Selected Per-Share Data | ||||||||||
| Net asset value, beginning of period | $ | 6.07 | $ | 9.84 | $ | 16.46 | $ | 12.19 | $ | 12.80 |
| Income from Investment Operations | ||||||||||
Net investment income (loss) A,B | .09 | .10 | .16 | .20 | .20 | |||||
| Net realized and unrealized gain (loss) | .62 | .38 | (1.07) | 5.09 | (.20) C | |||||
| Total from investment operations | .71 | .48 | (.91) | 5.29 | - | |||||
| Distributions from net investment income | (.09) | (.11) | (.22) | (.17) | (.22) | |||||
| Distributions from net realized gain | (.05) | (4.15) | (5.48) | (.85) | (.39) | |||||
| Total distributions | (.14) | (4.25) D | (5.71) D | (1.02) | (.61) | |||||
| Net asset value, end of period | $ | 6.64 | $ | 6.07 | $ | 9.84 | $ | 16.46 | $ | 12.19 |
Total Return E | 12.18 % | 8.32% | (8.94)% | 46.99% | (.03)% C | |||||
Ratios to Average Net Assets B,F,G | ||||||||||
| Expenses before reductions | .12% | .15% | .14% | .13% | .13% | |||||
| Expenses net of fee waivers, if any | .05 % | .06% | .05% | .05% | .05% | |||||
| Expenses net of all reductions | .05% | .06% | .05% | .05% | .05% | |||||
| Net investment income (loss) | 1.53% | 1.77% | 1.35% | 1.37% | 1.66% | |||||
| Supplemental Data | ||||||||||
| Net assets, end of period (000 omitted) | $ | 1,734,460 | $ | 1,610,937 | $ | 246,496 | $ | 1,087,415 | $ | 1,921,810 |
Portfolio turnover rate H | 31 % | 76% | 93% | 69% | 79% |
| Fidelity Central Fund | Investment Manager | Investment Objective | Investment Practices | Expense RatioA |
| Fidelity Money Market Central Funds | Fidelity Management & Research Company LLC (FMR) | Each fund seeks to obtain a high level of current income consistent with the preservation of capital and liquidity. | Short-term Investments | Less than .005% |
| Gross unrealized appreciation | $383,657,963 |
| Gross unrealized depreciation | (91,071,336) |
| Net unrealized appreciation (depreciation) | $292,586,627 |
| Tax Cost | $1,500,023,862 |
| Undistributed ordinary income | $12,627,119 |
| Undistributed long-term capital gain | $47,792,839 |
| Net unrealized appreciation (depreciation) on securities and other investments | $292,586,414 |
| July 31, 2024 | July 31, 2023 | |
| Ordinary Income | $29,749,451 | $6,412,901 |
| Long-term Capital Gains | 7,923,364 | 104,355,688 |
| Total | $37,672,815 | $110,768,589 |
| Equity Risk | Equity risk relates to the fluctuations in the value of financial instruments as a result of changes in market prices (other than those arising from interest rate risk or foreign exchange risk), whether caused by factors specific to an individual investment, its issuer, or all factors affecting all instruments traded in a market or market segment. |
| Purchases ($) | Sales ($) | |
| Fidelity SAI Small-Mid Cap 500 Index Fund | 494,767,932 | 501,870,465 |
| Borrower or Lender | Average Loan Balance ($) | Weighted Average Interest Rate | Interest Expense ($) | |
Fidelity SAI Small-Mid Cap 500 Index Fund | Borrower | 18,864,500 | 5.57% | 29,179 |
| Amount ($) | |
| Fidelity SAI Small-Mid Cap 500 Index Fund | 2,658 |
| Total Security Lending Fees Paid to NFS ($) | Security Lending Income From Securities Loaned to NFS ($) | Value of Securities Loaned to NFS at Period End ($) | |
| Fidelity SAI Small-Mid Cap 500 Index Fund | 39,527 | 5,093 | 32,668 |
| Strategic Advisers Fidelity U.S. Total Stock Fund | Strategic Advisers Small-Mid Cap Fund | |
| Fidelity SAI Small-Mid Cap 500 Index Fund | 74% | 26% |
| A special meeting of shareholders was held on October 18, 2023. The results of votes taken among shareholders on the proposal before them are reported below. Each vote reported represents one dollar of net asset value held on the record date for the meeting. | ||
| Proposal 1 | ||
| To elect a Board of Trustees. | ||
# of Votes | % of Votes | |
| Abigail P. Johnson | ||
| Affirmative | 378,729,502,260.01 | 97.58 |
| Withheld | 9,407,876,478.96 | 2.42 |
| TOTAL | 388,137,378,738.97 | 100.00 |
| Jennifer Toolin McAuliffe | ||
| Affirmative | 378,454,868,010.95 | 97.51 |
| Withheld | 9,682,510,728.02 | 2.49 |
| TOTAL | 388,137,378,738.97 | 100.00 |
| Christine J. Thompson | ||
| Affirmative | 378,837,121,274.52 | 97.60 |
| Withheld | 9,300,257,464.45 | 2.40 |
| TOTAL | 388,137,378,738.97 | 100.00 |
| Elizabeth S. Acton | ||
| Affirmative | 378,262,110,794.85 | 97.46 |
| Withheld | 9,875,267,944.12 | 2.54 |
| TOTAL | 388,137,378,738.97 | 100.00 |
| Laura M. Bishop | ||
| Affirmative | 380,482,113,171.06 | 98.03 |
| Withheld | 7,655,265,567.91 | 1.97 |
| TOTAL | 388,137,378,738.97 | 100.00 |
| Ann E. Dunwoody | ||
| Affirmative | 380,016,034,008.12 | 97.91 |
| Withheld | 8,121,344,730.85 | 2.09 |
| TOTAL | 388,137,378,738.97 | 100.00 |
| John Engler | ||
| Affirmative | 379,432,488,394.20 | 97.76 |
| Withheld | 8,704,890,344.77 | 2.24 |
| TOTAL | 388,137,378,738.97 | 100.00 |
| Robert F. Gartland | ||
| Affirmative | 378,741,819,600.60 | 97.58 |
| Withheld | 9,395,559,138.37 | 2.42 |
| TOTAL | 388,137,378,738.97 | 100.00 |
| Robert W. Helm | ||
| Affirmative | 380,389,324,755.07 | 98.00 |
| Withheld | 7,748,053,983.90 | 2.00 |
| TOTAL | 388,137,378,738.97 | 100.00 |
| Arthur E. Johnson | ||
| Affirmative | 378,427,694,151.67 | 97.50 |
| Withheld | 9,709,684,587.30 | 2.50 |
| TOTAL | 388,137,378,738.97 | 100.00 |
| Michael E. Kenneally | ||
| Affirmative | 377,842,228,145.18 | 97.35 |
| Withheld | 10,295,150,593.79 | 2.65 |
| TOTAL | 388,137,378,738.97 | 100.00 |
| Mark A. Murray | ||
| Affirmative | 380,158,432,703.37 | 97.94 |
| Withheld | 7,978,946,035.60 | 2.06 |
| TOTAL | 388,137,378,738.97 | 100.00 |
| Carol J. Zierhoffer | ||
| Affirmative | 380,522,113,360.24 | 98.04 |
| Withheld | 7,615,265,378.73 | 1.96 |
| TOTAL | 388,137,378,738.97 | 100.00 |
| Proposal 1 reflects trust-wide proposal and voting results. | ||
 |


Contents
| Common Stocks - 98.5% | |||
| Shares | Value ($) | ||
| Equity Real Estate Investment Trusts (REITs) - 91.0% | |||
| REITs - Apartments - 10.4% | |||
| American Homes 4 Rent Class A | 581 | 20,968 | |
| Apartment Investment & Management Co. Class A (a) | 237 | 2,100 | |
| AvalonBay Communities, Inc. | 251 | 51,435 | |
| Camden Property Trust (SBI) | 190 | 21,043 | |
| Centerspace | 28 | 1,955 | |
| Equity Residential (SBI) | 602 | 41,917 | |
| Essex Property Trust, Inc. | 114 | 31,733 | |
| Independence Realty Trust, Inc. | 406 | 7,572 | |
| Invitation Homes, Inc. | 1,083 | 38,197 | |
| Mid-America Apartment Communities, Inc. | 206 | 28,793 | |
| UDR, Inc. | 554 | 22,199 | |
| 267,912 | |||
| REITs - Diversified - 20.5% | |||
| Alexander & Baldwin, Inc. | 132 | 2,602 | |
| Apple Hospitality (REIT), Inc. | 412 | 6,093 | |
| Armada Hoffler Properties, Inc. Class A, | 111 | 1,319 | |
| Broadstone Net Lease, Inc. | 337 | 5,867 | |
| Cousins Properties, Inc. | 271 | 7,455 | |
| Crown Castle, Inc. | 766 | 84,321 | |
| Digital Realty Trust, Inc. | 552 | 82,518 | |
| Elme Communities (SBI) | 161 | 2,650 | |
| EPR Properties | 134 | 6,030 | |
| Equinix, Inc. | 168 | 132,760 | |
| Farmland Partners, Inc. | 79 | 839 | |
| Gaming & Leisure Properties | 478 | 23,996 | |
| Gladstone Commercial Corp. | 70 | 1,054 | |
| Gladstone Land Corp. | 55 | 817 | |
| Global Net Lease, Inc. | 347 | 3,019 | |
| InvenTrust Properties Corp. | 120 | 3,380 | |
| Lamar Advertising Co. Class A | 156 | 18,698 | |
| NexPoint Diversified Real Estate Trust | 56 | 354 | |
| NexPoint Residential Trust, Inc. | 40 | 1,748 | |
| One Liberty Properties, Inc. | 33 | 871 | |
| Outfront Media, Inc. | 239 | 3,877 | |
| PotlatchDeltic Corp. | 139 | 6,166 | |
| SBA Communications Corp. Class A | 190 | 41,713 | |
| Uniti Group, Inc. | 403 | 1,548 | |
| VICI Properties, Inc. | 1,841 | 57,550 | |
| Vornado Realty Trust | 289 | 8,667 | |
| WP Carey, Inc. | 385 | 22,257 | |
| 528,169 | |||
| REITs - Health Care - 8.3% | |||
| CareTrust (REIT), Inc. | 242 | 6,524 | |
| Community Healthcare Trust, Inc. | 45 | 979 | |
| Diversified Healthcare Trust (SBI) | 286 | 955 | |
| Global Medical REIT, Inc. | 109 | 1,041 | |
| Healthcare Realty Trust, Inc. | 674 | 11,923 | |
| Healthpeak Properties, Inc. | 1,256 | 27,406 | |
| LTC Properties, Inc. | 79 | 2,821 | |
| Medical Properties Trust, Inc. (b) | 1,058 | 5,089 | |
| Sabra Health Care REIT, Inc. | 414 | 6,719 | |
| Universal Health Realty Income Trust (SBI) | 22 | 941 | |
| Ventas, Inc. | 710 | 38,652 | |
| Welltower, Inc. | 1,005 | 111,806 | |
| 214,856 | |||
| REITs - Health Care Facilities - 0.8% | |||
| National Health Investors, Inc. | 78 | 5,839 | |
| Omega Healthcare Investors, Inc. | 433 | 15,761 | |
| 21,600 | |||
| REITs - Hotels - 2.2% | |||
| Chatham Lodging Trust | 84 | 738 | |
| DiamondRock Hospitality Co. | 384 | 3,160 | |
| Host Hotels & Resorts, Inc. | 1,249 | 21,870 | |
| Park Hotels & Resorts, Inc. | 382 | 5,753 | |
| Pebblebrook Hotel Trust | 218 | 2,984 | |
| RLJ Lodging Trust | 283 | 2,672 | |
| Ryman Hospitality Properties, Inc. | 101 | 10,152 | |
| Service Properties Trust | 270 | 1,531 | |
| Summit Hotel Properties, Inc. | 189 | 1,198 | |
| Sunstone Hotel Investors, Inc. | 354 | 3,667 | |
| Xenia Hotels & Resorts, Inc. | 192 | 2,665 | |
| 56,390 | |||
| REITs - Industrial Buildings - 0.5% | |||
| STAG Industrial, Inc. | 323 | 13,182 | |
| REITs - Management/Investment - 10.1% | |||
| American Assets Trust, Inc. | 93 | 2,466 | |
| American Tower Corp. | 824 | 181,610 | |
| Empire State Realty Trust, Inc. | 256 | 2,757 | |
| LXP Industrial Trust (REIT) | 521 | 5,366 | |
| NNN (REIT), Inc. | 323 | 14,499 | |
| Rayonier, Inc. | 250 | 7,583 | |
| Safehold, Inc. | 85 | 1,967 | |
| UMH Properties, Inc. | 126 | 2,238 | |
| Weyerhaeuser Co. | 1,286 | 40,843 | |
| Whitestone REIT | 83 | 1,145 | |
| 260,474 | |||
| REITs - Manufactured Homes - 1.9% | |||
| Equity Lifestyle Properties, Inc. | 311 | 21,359 | |
| Sun Communities, Inc. | 219 | 27,754 | |
| 49,113 | |||
| REITs - Office Buildings - 0.0% | |||
| Office Properties Income Trust | 80 | 199 | |
| REITs - Office Property - 4.0% | |||
| Alexandria Real Estate Equities, Inc. | 279 | 32,724 | |
| Brandywine Realty Trust (SBI) | 293 | 1,477 | |
| BXP, Inc. | 264 | 18,826 | |
| City Office REIT, Inc. | 69 | 417 | |
| COPT Defense Properties (SBI) | 199 | 5,765 | |
| Douglas Emmett, Inc. | 299 | 4,811 | |
| Easterly Government Properties, Inc. | 179 | 2,493 | |
| Equity Commonwealth (a) | 181 | 3,687 | |
| Highwoods Properties, Inc. (SBI) | 191 | 5,915 | |
| Hudson Pacific Properties, Inc. | 211 | 1,264 | |
| JBG SMITH Properties | 159 | 2,600 | |
| Kilroy Realty Corp. | 198 | 7,320 | |
| Net Lease Office Properties | 25 | 738 | |
| Orion Office (REIT), Inc. | 87 | 352 | |
| Paramount Group, Inc. | 286 | 1,499 | |
| Peakstone Realty Trust | 60 | 815 | |
| Piedmont Office Realty Trust, Inc. Class A | 236 | 2,041 | |
| SL Green Realty Corp. | 118 | 7,864 | |
| Veris Residential, Inc. | 136 | 2,137 | |
| 102,745 | |||
| REITs - Regional Malls - 3.9% | |||
| CBL & Associates Properties, Inc. | 22 | 567 | |
| Simon Property Group, Inc. | 575 | 88,228 | |
| Tanger, Inc. | 196 | 5,664 | |
| The Macerich Co. | 388 | 6,212 | |
| 100,671 | |||
| REITs - Shopping Centers - 7.7% | |||
| Acadia Realty Trust (SBI) | 188 | 4,068 | |
| Alexanders, Inc. | 4 | 969 | |
| Brixmor Property Group, Inc. | 532 | 13,550 | |
| Federal Realty Investment Trust (SBI) | 131 | 14,626 | |
| Kimco Realty Corp. | 1,190 | 25,859 | |
| Kite Realty Group Trust | 390 | 9,617 | |
| Phillips Edison & Co., Inc. | 217 | 7,617 | |
| Realty Income Corp. | 1,519 | 87,236 | |
| Regency Centers Corp. | 309 | 20,808 | |
| Retail Opportunity Investments Corp. | 224 | 3,349 | |
| Saul Centers, Inc. | 21 | 831 | |
| SITE Centers Corp. | 337 | 5,207 | |
| Urban Edge Properties | 211 | 4,283 | |
| 198,020 | |||
| REITs - Single Tenant - 1.2% | |||
| Agree Realty Corp. | 178 | 12,277 | |
| Essential Properties Realty Trust, Inc. | 306 | 9,055 | |
| Four Corners Property Trust, Inc. | 165 | 4,478 | |
| Getty Realty Corp. | 91 | 2,695 | |
| NETSTREIT Corp. | 142 | 2,339 | |
| 30,844 | |||
| REITs - Storage - 8.6% | |||
| CubeSmart | 400 | 19,032 | |
| Extra Space Storage, Inc. | 374 | 59,698 | |
| Iron Mountain, Inc. | 518 | 53,126 | |
| National Storage Affiliates Trust | 135 | 5,747 | |
| Public Storage Operating Co. | 280 | 82,858 | |
| 220,461 | |||
| REITs - Warehouse/Industrial - 10.9% | |||
| Americold Realty Trust | 475 | 14,198 | |
| EastGroup Properties, Inc. | 85 | 15,894 | |
| First Industrial Realty Trust, Inc. | 234 | 12,804 | |
| Plymouth Industrial REIT, Inc. | 82 | 1,961 | |
| Prologis, Inc. | 1,634 | 205,965 | |
| Rexford Industrial Realty, Inc. | 387 | 19,393 | |
| Terreno Realty Corp. | 172 | 11,767 | |
| 281,982 | |||
TOTAL EQUITY REAL ESTATE INVESTMENT TRUSTS (REITS) | 2,346,618 | ||
| Real Estate Management & Development - 7.5% | |||
| Diversified Real Estate Activities - 0.2% | |||
| Tejon Ranch Co. (a) | 32 | 608 | |
| The RMR Group, Inc. Class A | 28 | 726 | |
| The St. Joe Co. | 63 | 3,886 | |
| 5,220 | |||
| Real Estate Development - 0.2% | |||
| Forestar Group, Inc. (a) | 34 | 1,075 | |
| Howard Hughes Holdings, Inc. | 56 | 4,154 | |
| 5,229 | |||
| Real Estate Operating Companies - 0.2% | |||
| Digitalbridge Group, Inc. | 290 | 4,098 | |
| Kennedy-Wilson Holdings, Inc. | 198 | 2,061 | |
| 6,159 | |||
| Real Estate Services - 6.9% | |||
| Anywhere Real Estate, Inc. (a) | 160 | 755 | |
| CBRE Group, Inc. (a) | 539 | 60,751 | |
| Compass, Inc. (a) | 688 | 3,020 | |
| CoStar Group, Inc. (a) | 721 | 56,252 | |
| Cushman & Wakefield PLC (a) | 408 | 5,349 | |
| eXp World Holdings, Inc. (b) | 143 | 2,053 | |
| Jones Lang LaSalle, Inc. (a) | 84 | 21,076 | |
| Marcus & Millichap, Inc. | 47 | 1,862 | |
| Newmark Group, Inc. Class A | 265 | 3,440 | |
| Opendoor Technologies, Inc. Class A (a) | 1,058 | 2,455 | |
| Redfin Corp. (a) | 200 | 1,628 | |
| Zillow Group, Inc.: | |||
| Class A (a) | 97 | 4,598 | |
| Class C (a) | 278 | 13,539 | |
| 176,778 | |||
| REITs - Shopping Centers - 0.0% | |||
| Seritage Growth Properties (a) | 44 | 224 | |
TOTAL REAL ESTATE MANAGEMENT & DEVELOPMENT | 193,610 | ||
| TOTAL COMMON STOCKS (Cost $1,733,019) | 2,540,228 | ||
| U.S. Treasury Obligations - 0.5% | |||
Principal Amount (c) | Value ($) | ||
U.S. Treasury Bills, yield at date of purchase 5.31% 8/22/24 (d) (Cost $12,960) | 13,000 | 12,960 | |
| Money Market Funds - 7.0% | |||
| Shares | Value ($) | ||
| Fidelity Cash Central Fund 5.39% (e) | 174,282 | 174,317 | |
| Fidelity Securities Lending Cash Central Fund 5.39% (e)(f) | 5,757 | 5,757 | |
| TOTAL MONEY MARKET FUNDS (Cost $180,074) | 180,074 | ||
| TOTAL INVESTMENT IN SECURITIES - 106.0% (Cost $1,926,053) | 2,733,262 |
NET OTHER ASSETS (LIABILITIES) - (6.0)% | (154,619) |
| NET ASSETS - 100.0% | 2,578,643 |
| Futures Contracts | |||||
Number of contracts | Expiration Date | Notional Amount ($) | Value ($) | Unrealized Appreciation/ (Depreciation) ($) | |
| Purchased | |||||
| Equity Index Contracts | |||||
| CBOT Dow Jones U.S. Real Estate Index Contracts (United States) | 1 | Sep 2024 | 36,300 | 2,703 | 2,703 |
| The notional amount of futures purchased as a percentage of Net Assets is 1.4% | |||||
| (a) | Non-income producing |
| (b) | Security or a portion of the security is on loan at period end. |
| (c) | Amount is stated in United States dollars unless otherwise noted. |
| (d) | Security or a portion of the security was pledged to cover margin requirements for futures contracts. At period end, the value of securities pledged amounted to $12,960. |
| (e) | Affiliated fund that is generally available only to investment companies and other accounts managed by Fidelity Investments. The rate quoted is the annualized seven-day yield of the fund at period end. A complete unaudited listing of the fund's holdings as of its most recent quarter end is available upon request. In addition, each Fidelity Central Fund's financial statements, which are not covered by the Fund's Report of Independent Registered Public Accounting Firm, are available on the SEC's website or upon request. |
| (f) | Investment made with cash collateral received from securities on loan. |
| Affiliate | Value, beginning of period ($) | Purchases ($) | Sales Proceeds ($) | Dividend Income ($) | Realized Gain (loss) ($) | Change in Unrealized appreciation (depreciation) ($) | Value, end of period ($) | % ownership, end of period |
| Fidelity Cash Central Fund 5.39% | 196,160 | 3,302,400 | 3,324,246 | 9,912 | 3 | - | 174,317 | 0.0% |
| Fidelity Securities Lending Cash Central Fund 5.39% | 834,557 | 8,790,028 | 9,618,828 | 5,124 | - | - | 5,757 | 0.0% |
| Total | 1,030,717 | 12,092,428 | 12,943,074 | 15,036 | 3 | - | 180,074 | |
| Valuation Inputs at Reporting Date: | ||||
| Description | Total ($) | Level 1 ($) | Level 2 ($) | Level 3 ($) |
Investments in Securities: | ||||
| Common Stocks | 2,540,228 | 2,540,228 | - | - |
| U.S. Treasury Obligations | 12,960 | - | 12,960 | - |
| Money Market Funds | 180,074 | 180,074 | - | - |
| Total Investments in Securities: | 2,733,262 | 2,720,302 | 12,960 | - |
Derivative Instruments: Assets | ||||
Futures Contracts | 2,703 | 2,703 | - | - |
| Total Assets | 2,703 | 2,703 | - | - |
| Total Derivative Instruments: | 2,703 | 2,703 | - | - |
Primary Risk Exposure / Derivative Type | Value | |
| Asset ($) | Liability ($) | |
| Equity Risk | ||
Futures Contracts (a) | 2,703 | 0 |
| Total Equity Risk | 2,703 | 0 |
| Total Value of Derivatives | 2,703 | 0 |
| Statement of Assets and Liabilities | ||||
As of July 31, 2024 | ||||
| Assets | ||||
| Investment in securities, at value (including securities loaned of $5,765) - See accompanying schedule: | ||||
Unaffiliated issuers (cost $1,745,979) | $ | 2,553,188 | ||
Fidelity Central Funds (cost $180,074) | 180,074 | |||
| Total Investment in Securities (cost $1,926,053) | $ | 2,733,262 | ||
| Segregated cash with brokers for derivative instruments | 15,000 | |||
| Dividends receivable | 5,100 | |||
| Distributions receivable from Fidelity Central Funds | 896 | |||
| Prepaid expenses | 14 | |||
| Receivable from investment adviser for expense reductions | 6,586 | |||
| Other receivables | 16,376 | |||
Total assets | 2,777,234 | |||
| Liabilities | ||||
| Payable for investments purchased | $ | 141,626 | ||
| Accrued management fee | 4,215 | |||
| Payable for daily variation margin on futures contracts | 90 | |||
| Audit fee payable | 43,301 | |||
| Other payables and accrued expenses | 3,184 | |||
| Collateral on securities loaned | 6,175 | |||
| Total liabilities | 198,591 | |||
| Net Assets | $ | 2,578,643 | ||
| Net Assets consist of: | ||||
| Paid in capital | $ | 13,189,921 | ||
| Total accumulated earnings (loss) | (10,611,278) | |||
| Net Assets | $ | 2,578,643 | ||
Net Asset Value, offering price and redemption price per share ($2,578,643 ÷ 343,493 shares) | $ | 7.51 | ||
| Statement of Operations | ||||
| Year ended July 31, 2024 | ||||
| Investment Income | ||||
| Dividends | $ | 2,722,087 | ||
| Interest | 4,437 | |||
| Income from Fidelity Central Funds (including $5,124 from security lending) | 15,036 | |||
| Total income | 2,741,560 | |||
| Expenses | ||||
| Management fee | $ | 56,242 | ||
| Custodian fees and expenses | 6,814 | |||
| Independent trustees' fees and expenses | 243 | |||
| Registration fees | 22,426 | |||
| Audit fees | 55,804 | |||
| Legal | 268 | |||
| Miscellaneous | 308 | |||
| Total expenses before reductions | 142,105 | |||
| Expense reductions | (86,069) | |||
| Total expenses after reductions | 56,036 | |||
| Net Investment income (loss) | 2,685,524 | |||
| Realized and Unrealized Gain (Loss) | ||||
| Net realized gain (loss) on: | ||||
| Investment Securities: | ||||
| Unaffiliated issuers | 15,189,111 | |||
| Fidelity Central Funds | 3 | |||
| Futures contracts | 29,748 | |||
| Total net realized gain (loss) | 15,218,862 | |||
| Change in net unrealized appreciation (depreciation) on: | ||||
| Investment Securities: | ||||
| Unaffiliated issuers | (9,785,581) | |||
| Futures contracts | (16,874) | |||
| Total change in net unrealized appreciation (depreciation) | (9,802,455) | |||
| Net gain (loss) | 5,416,407 | |||
| Net increase (decrease) in net assets resulting from operations | $ | 8,101,931 | ||
| Statement of Changes in Net Assets | ||||
Year ended July 31, 2024 | Year ended July 31, 2023 | |||
| Increase (Decrease) in Net Assets | ||||
| Operations | ||||
| Net investment income (loss) | $ | 2,685,524 | $ | 3,505,923 |
| Net realized gain (loss) | 15,218,862 | 36,843,376 | ||
| Change in net unrealized appreciation (depreciation) | (9,802,455) | (77,494,494) | ||
| Net increase (decrease) in net assets resulting from operations | 8,101,931 | (37,145,195) | ||
| Distributions to shareholders | (3,751,888) | (64,713,259) | ||
| Share transactions | ||||
| Proceeds from sales of shares | - | 1,407,824 | ||
| Reinvestment of distributions | 3,751,888 | 64,704,858 | ||
| Cost of shares redeemed | (88,653,526) | (287,910,648) | ||
Net increase (decrease) in net assets resulting from share transactions | (84,901,638) | (221,797,966) | ||
| Total increase (decrease) in net assets | (80,551,595) | (323,656,420) | ||
| Net Assets | ||||
| Beginning of period | 83,130,238 | 406,786,658 | ||
| End of period | $ | 2,578,643 | $ | 83,130,238 |
| Other Information | ||||
| Shares | ||||
| Sold | - | 128,760 | ||
| Issued in reinvestment of distributions | 549,404 | 7,441,997 | ||
| Redeemed | (11,868,156) | (29,859,078) | ||
| Net increase (decrease) | (11,318,752) | (22,288,321) | ||
Fidelity® SAI Real Estate Index Fund |
| Years ended July 31, | 2024 | 2023 | 2022 | 2021 | 2020 | |||||
Selected Per-Share Data | ||||||||||
| Net asset value, beginning of period | $ | 7.13 | $ | 11.98 | $ | 13.17 | $ | 9.67 | $ | 11.88 |
| Income from Investment Operations | ||||||||||
Net investment income (loss) A,B | .23 | .26 | .29 | .28 | .36 | |||||
| Net realized and unrealized gain (loss) | .47 | (1.38) | (.79) | 3.48 | (2.20) | |||||
| Total from investment operations | .70 | (1.12) | (.50) | 3.76 | (1.84) | |||||
| Distributions from net investment income | (.11) | (.34) | (.21) | (.26) | (.30) | |||||
| Distributions from net realized gain | (.20) | (3.39) | (.48) | - | (.07) | |||||
| Total distributions | (.32) C | (3.73) | (.69) | (.26) | (.37) | |||||
| Net asset value, end of period | $ | 7.51 | $ | 7.13 | $ | 11.98 | $ | 13.17 | $ | 9.67 |
Total Return D | 10.30 % | (9.67)% | (4.24)% | 39.72% | (16.04)% | |||||
Ratios to Average Net Assets B,E,F | ||||||||||
| Expenses before reductions | .18% | .16% | .09% | .09% | .16% | |||||
| Expenses net of fee waivers, if any | .07 % | .09% | .07% | .07% | .07% | |||||
| Expenses net of all reductions | .07% | .09% | .07% | .07% | .07% | |||||
| Net investment income (loss) | 3.36% | 3.10% | 2.28% | 2.58% | 3.52% | |||||
| Supplemental Data | ||||||||||
| Net assets, end of period (000 omitted) | $ | 2,579 | $ | 83,130 | $ | 406,787 | $ | 747,826 | $ | 572,828 |
Portfolio turnover rate G | 7 % | 8% | 13% | 53% | 82% |
| Fidelity Central Fund | Investment Manager | Investment Objective | Investment Practices | Expense RatioA |
| Fidelity Money Market Central Funds | Fidelity Management & Research Company LLC (FMR) | Each fund seeks to obtain a high level of current income consistent with the preservation of capital and liquidity. | Short-term Investments | Less than .005% |
| Gross unrealized appreciation | $803,143 |
| Gross unrealized depreciation | (33,505) |
| Net unrealized appreciation (depreciation) | $769,638 |
| Tax Cost | $1,963,624 |
| Undistributed ordinary income | $603,356 |
| Undistributed long-term capital gain | $265,890 |
| Net unrealized appreciation (depreciation) on securities and other investments | $769,638 |
| Short-term | $(678,885) |
| Long-term | (11,418,962) |
| Total capital loss carryforward | $(12,097,847) |
| July 31, 2024 | July 31, 2023 | |
| Ordinary Income | $1,711,135 | $ 5,490,572 |
| Long-term Capital Gains | 2,040,753 | 59,222,687 |
| Total | $3,751,888 | $ 64,713,259 |
| Equity Risk | Equity risk relates to the fluctuations in the value of financial instruments as a result of changes in market prices (other than those arising from interest rate risk or foreign exchange risk), whether caused by factors specific to an individual investment, its issuer, or all factors affecting all instruments traded in a market or market segment. |
| Purchases ($) | Sales ($) | |
| Fidelity SAI Real Estate Index Fund | 5,526,559 | 90,387,273 |
| Amount ($) | |
| Fidelity SAI Real Estate Index Fund | 137 |
| Total Security Lending Fees Paid to NFS ($) | Security Lending Income From Securities Loaned to NFS ($) | Value of Securities Loaned to NFS at Period End ($) | |
| Fidelity SAI Real Estate Index Fund | 488 | 126 | 2,405 |
| Strategic Advisers Small-Mid Cap Fund | |
| Fidelity SAI Real Estate Index Fund | 87% |
| A special meeting of shareholders was held on October 18, 2023. The results of votes taken among shareholders on the proposal before them are reported below. Each vote reported represents one dollar of net asset value held on the record date for the meeting. | ||
| Proposal 1 | ||
| To elect a Board of Trustees. | ||
# of Votes | % of Votes | |
| Abigail P. Johnson | ||
| Affirmative | 378,729,502,260.01 | 97.58 |
| Withheld | 9,407,876,478.96 | 2.42 |
| TOTAL | 388,137,378,738.97 | 100.00 |
| Jennifer Toolin McAuliffe | ||
| Affirmative | 378,454,868,010.95 | 97.51 |
| Withheld | 9,682,510,728.02 | 2.49 |
| TOTAL | 388,137,378,738.97 | 100.00 |
| Christine J. Thompson | ||
| Affirmative | 378,837,121,274.52 | 97.60 |
| Withheld | 9,300,257,464.45 | 2.40 |
| TOTAL | 388,137,378,738.97 | 100.00 |
| Elizabeth S. Acton | ||
| Affirmative | 378,262,110,794.85 | 97.46 |
| Withheld | 9,875,267,944.12 | 2.54 |
| TOTAL | 388,137,378,738.97 | 100.00 |
| Laura M. Bishop | ||
| Affirmative | 380,482,113,171.06 | 98.03 |
| Withheld | 7,655,265,567.91 | 1.97 |
| TOTAL | 388,137,378,738.97 | 100.00 |
| Ann E. Dunwoody | ||
| Affirmative | 380,016,034,008.12 | 97.91 |
| Withheld | 8,121,344,730.85 | 2.09 |
| TOTAL | 388,137,378,738.97 | 100.00 |
| John Engler | ||
| Affirmative | 379,432,488,394.20 | 97.76 |
| Withheld | 8,704,890,344.77 | 2.24 |
| TOTAL | 388,137,378,738.97 | 100.00 |
| Robert F. Gartland | ||
| Affirmative | 378,741,819,600.60 | 97.58 |
| Withheld | 9,395,559,138.37 | 2.42 |
| TOTAL | 388,137,378,738.97 | 100.00 |
| Robert W. Helm | ||
| Affirmative | 380,389,324,755.07 | 98.00 |
| Withheld | 7,748,053,983.90 | 2.00 |
| TOTAL | 388,137,378,738.97 | 100.00 |
| Arthur E. Johnson | ||
| Affirmative | 378,427,694,151.67 | 97.50 |
| Withheld | 9,709,684,587.30 | 2.50 |
| TOTAL | 388,137,378,738.97 | 100.00 |
| Michael E. Kenneally | ||
| Affirmative | 377,842,228,145.18 | 97.35 |
| Withheld | 10,295,150,593.79 | 2.65 |
| TOTAL | 388,137,378,738.97 | 100.00 |
| Mark A. Murray | ||
| Affirmative | 380,158,432,703.37 | 97.94 |
| Withheld | 7,978,946,035.60 | 2.06 |
| TOTAL | 388,137,378,738.97 | 100.00 |
| Carol J. Zierhoffer | ||
| Affirmative | 380,522,113,360.24 | 98.04 |
| Withheld | 7,615,265,378.73 | 1.96 |
| TOTAL | 388,137,378,738.97 | 100.00 |
| Proposal 1 reflects trust-wide proposal and voting results. | ||
 |


Contents
| Common Stocks - 99.9% | |||
| Shares | Value ($) | ||
| COMMUNICATION SERVICES - 10.4% | |||
| Entertainment - 2.1% | |||
| Netflix, Inc. (a) | 19,357 | 12,162,971 | |
| Take-Two Interactive Software, Inc. (a) | 1,090 | 164,078 | |
| The Walt Disney Co. | 12,090 | 1,132,712 | |
| 13,459,761 | |||
| Interactive Media & Services - 8.3% | |||
| Alphabet, Inc.: | |||
| Class A | 68,699 | 11,784,626 | |
| Class C | 59,930 | 10,376,880 | |
| Meta Platforms, Inc. Class A | 65,792 | 31,240,015 | |
| Pinterest, Inc. Class A (a) | 3,354 | 107,160 | |
| 53,508,681 | |||
| Media - 0.0% | |||
| News Corp. Class A | 10,892 | 300,401 | |
TOTAL COMMUNICATION SERVICES | 67,268,843 | ||
| CONSUMER DISCRETIONARY - 10.0% | |||
| Automobiles - 0.1% | |||
| General Motors Co. | 18,526 | 821,072 | |
| Broadline Retail - 5.2% | |||
| Amazon.com, Inc. (a) | 176,581 | 33,017,115 | |
| MercadoLibre, Inc. (a) | 324 | 540,724 | |
| 33,557,839 | |||
| Hotels, Restaurants & Leisure - 2.3% | |||
| Booking Holdings, Inc. | 692 | 2,570,787 | |
| Chipotle Mexican Grill, Inc. (a) | 79,929 | 4,341,743 | |
| Domino's Pizza, Inc. | 1,121 | 480,573 | |
| Doordash, Inc. (a) | 10,400 | 1,151,488 | |
| Draftkings Holdings, Inc. (a) | 12,143 | 448,684 | |
| Hilton Worldwide Holdings, Inc. | 10,491 | 2,252,103 | |
| Hyatt Hotels Corp. Class A | 583 | 85,893 | |
| Marriott International, Inc. Class A | 6,742 | 1,532,457 | |
| Royal Caribbean Cruises Ltd. | 11,361 | 1,780,496 | |
| 14,644,224 | |||
| Household Durables - 1.2% | |||
| D.R. Horton, Inc. | 10,501 | 1,889,445 | |
| Garmin Ltd. | 6,982 | 1,195,668 | |
| Lennar Corp. Class A | 9,712 | 1,718,344 | |
| NVR, Inc. (a) | 118 | 1,015,683 | |
| PulteGroup, Inc. | 12,006 | 1,584,792 | |
| 7,403,932 | |||
| Specialty Retail - 0.9% | |||
| Bath & Body Works, Inc. | 1,665 | 61,189 | |
| Dick's Sporting Goods, Inc. | 2,768 | 598,857 | |
| O'Reilly Automotive, Inc. (a) | 1,048 | 1,180,404 | |
| Ross Stores, Inc. | 3,900 | 558,597 | |
| TJX Companies, Inc. | 15,269 | 1,725,702 | |
| Tractor Supply Co. | 1,709 | 450,014 | |
| Williams-Sonoma, Inc. | 8,612 | 1,332,104 | |
| 5,906,867 | |||
| Textiles, Apparel & Luxury Goods - 0.3% | |||
| Deckers Outdoor Corp. (a) | 1,870 | 1,725,318 | |
| lululemon athletica, Inc. (a) | 842 | 217,792 | |
| 1,943,110 | |||
TOTAL CONSUMER DISCRETIONARY | 64,277,044 | ||
| CONSUMER STAPLES - 4.1% | |||
| Beverages - 0.0% | |||
| Celsius Holdings, Inc. (a) | 4,434 | 207,644 | |
| Consumer Staples Distribution & Retail - 4.0% | |||
| Costco Wholesale Corp. | 24,979 | 20,532,738 | |
| Walmart, Inc. | 76,972 | 5,283,358 | |
| 25,816,096 | |||
| Household Products - 0.1% | |||
| Colgate-Palmolive Co. | 6,933 | 687,684 | |
TOTAL CONSUMER STAPLES | 26,711,424 | ||
| ENERGY - 0.9% | |||
| Oil, Gas & Consumable Fuels - 0.9% | |||
| Diamondback Energy, Inc. | 1,230 | 248,841 | |
| Marathon Petroleum Corp. | 14,709 | 2,603,787 | |
| Phillips 66 Co. | 10,892 | 1,584,568 | |
| Targa Resources Corp. | 7,470 | 1,010,542 | |
| Texas Pacific Land Corp. | 170 | 143,633 | |
| The Williams Companies, Inc. | 9,123 | 391,742 | |
| 5,983,113 | |||
| FINANCIALS - 15.4% | |||
| Banks - 6.0% | |||
| Bank of America Corp. | 52,499 | 2,116,235 | |
| Citigroup, Inc. | 63,675 | 4,131,234 | |
| Fifth Third Bancorp | 11,500 | 486,910 | |
| First Citizens Bancshares, Inc. | 197 | 411,275 | |
| JPMorgan Chase & Co. | 114,125 | 24,285,800 | |
| Wells Fargo & Co. | 117,188 | 6,953,936 | |
| 38,385,390 | |||
| Capital Markets - 2.3% | |||
| Ameriprise Financial, Inc. | 1,334 | 573,713 | |
| Ares Management Corp. Class A, | 7,300 | 1,118,360 | |
| Bank of New York Mellon Corp. | 12,259 | 797,693 | |
| Carlyle Group LP | 3,961 | 197,020 | |
| Cboe Global Markets, Inc. | 3,134 | 575,120 | |
| Coinbase Global, Inc. (a) | 14,994 | 3,364,054 | |
| Goldman Sachs Group, Inc. | 4,849 | 2,468,286 | |
| KKR & Co., Inc. | 37,959 | 4,686,039 | |
| Robinhood Markets, Inc. (a) | 36,708 | 755,084 | |
| Tradeweb Markets, Inc. Class A | 2,592 | 289,475 | |
| 14,824,844 | |||
| Consumer Finance - 1.1% | |||
| Ally Financial, Inc. | 4,284 | 192,823 | |
| American Express Co. | 24,484 | 6,195,431 | |
| Capital One Financial Corp. | 2,721 | 411,959 | |
| Discover Financial Services | 2,145 | 308,859 | |
| Synchrony Financial | 4,233 | 214,994 | |
| 7,324,066 | |||
| Financial Services - 2.7% | |||
| Apollo Global Management, Inc. | 18,912 | 2,369,863 | |
| Berkshire Hathaway, Inc. Class B (a) | 17,855 | 7,829,418 | |
| Corebridge Financial, Inc. | 15,278 | 451,465 | |
| Corpay, Inc. (a) | 356 | 103,888 | |
| Equitable Holdings, Inc. | 8,663 | 377,793 | |
| Fiserv, Inc. (a) | 13,801 | 2,257,430 | |
| MasterCard, Inc. Class A | 4,311 | 1,999,054 | |
| Toast, Inc. (a)(b) | 9,120 | 238,579 | |
| Visa, Inc. Class A | 7,371 | 1,958,254 | |
| 17,585,744 | |||
| Insurance - 3.3% | |||
| AFLAC, Inc. | 3,002 | 286,331 | |
| Allstate Corp. | 13,819 | 2,364,707 | |
| American International Group, Inc. | 9,688 | 767,580 | |
| Arch Capital Group Ltd. (a) | 10,483 | 1,004,062 | |
| Arthur J. Gallagher & Co. | 1,155 | 327,431 | |
| Assurant, Inc. | 1,945 | 340,122 | |
| Brown & Brown, Inc. | 7,197 | 715,598 | |
| Chubb Ltd. | 8,888 | 2,450,066 | |
| Erie Indemnity Co. Class A | 1,537 | 678,048 | |
| Fidelity National Financial, Inc. | 1,529 | 84,722 | |
| Hartford Financial Services Group, Inc. | 14,573 | 1,616,437 | |
| Loews Corp. | 3,755 | 300,212 | |
| Progressive Corp. | 36,996 | 7,921,584 | |
| Prudential Financial, Inc. | 2,807 | 351,773 | |
| The Travelers Companies, Inc. | 5,797 | 1,254,703 | |
| W.R. Berkley Corp. | 10,933 | 602,736 | |
| 21,066,112 | |||
TOTAL FINANCIALS | 99,186,156 | ||
| HEALTH CARE - 9.8% | |||
| Biotechnology - 1.5% | |||
| Amgen, Inc. | 9,202 | 3,059,389 | |
| Neurocrine Biosciences, Inc. (a) | 1,510 | 213,771 | |
| Regeneron Pharmaceuticals, Inc. (a) | 1,656 | 1,787,139 | |
| United Therapeutics Corp. (a) | 418 | 130,955 | |
| Vertex Pharmaceuticals, Inc. (a) | 9,335 | 4,627,546 | |
| 9,818,800 | |||
| Health Care Equipment & Supplies - 2.0% | |||
| Boston Scientific Corp. (a) | 86,650 | 6,401,702 | |
| Intuitive Surgical, Inc. (a) | 10,201 | 4,535,467 | |
| Stryker Corp. | 6,673 | 2,185,074 | |
| 13,122,243 | |||
| Health Care Providers & Services - 1.3% | |||
| Cardinal Health, Inc. | 5,931 | 598,023 | |
| Cencora, Inc. | 8,145 | 1,937,533 | |
| Cigna Group | 2,331 | 812,750 | |
| DaVita, Inc. (a) | 2,011 | 274,743 | |
| McKesson Corp. | 6,900 | 4,257,438 | |
| Molina Healthcare, Inc. (a) | 478 | 163,127 | |
| Universal Health Services, Inc. Class B | 833 | 178,062 | |
| 8,221,676 | |||
| Pharmaceuticals - 5.0% | |||
| Eli Lilly & Co. | 37,712 | 30,330,630 | |
| Merck & Co., Inc. | 15,110 | 1,709,394 | |
| 32,040,024 | |||
TOTAL HEALTH CARE | 63,202,743 | ||
| INDUSTRIALS - 15.2% | |||
| Aerospace & Defense - 3.9% | |||
| Axon Enterprise, Inc. (a) | 2,967 | 890,130 | |
| General Dynamics Corp. | 3,782 | 1,129,721 | |
| General Electric Co. | 85,580 | 14,565,716 | |
| HEICO Corp. | 723 | 174,489 | |
| HEICO Corp. Class A | 1,178 | 223,950 | |
| Howmet Aerospace, Inc. | 24,747 | 2,368,288 | |
| Huntington Ingalls Industries, Inc. | 663 | 185,627 | |
| RTX Corp. | 9,313 | 1,094,184 | |
| Textron, Inc. | 1,035 | 96,152 | |
| TransDigm Group, Inc. | 3,362 | 4,351,168 | |
| 25,079,425 | |||
| Building Products - 1.6% | |||
| A.O. Smith Corp. | 718 | 61,059 | |
| Builders FirstSource, Inc. (a) | 5,712 | 956,017 | |
| Carlisle Companies, Inc. | 2,644 | 1,106,726 | |
| Carrier Global Corp. | 11,867 | 808,261 | |
| Lennox International, Inc. | 1,685 | 983,198 | |
| Masco Corp. | 5,073 | 394,933 | |
| Owens Corning | 3,433 | 639,843 | |
| Trane Technologies PLC | 15,349 | 5,130,864 | |
| 10,080,901 | |||
| Commercial Services & Supplies - 1.8% | |||
| Cintas Corp. | 4,721 | 3,606,561 | |
| Copart, Inc. | 26,738 | 1,399,200 | |
| Republic Services, Inc. | 10,572 | 2,054,351 | |
| Veralto Corp. | 4,179 | 445,314 | |
| Waste Connections, Inc. (United States) | 1,821 | 323,719 | |
| Waste Management, Inc. | 18,204 | 3,689,223 | |
| 11,518,368 | |||
| Construction & Engineering - 0.4% | |||
| EMCOR Group, Inc. | 2,390 | 897,302 | |
| Quanta Services, Inc. | 6,176 | 1,638,987 | |
| 2,536,289 | |||
| Electrical Equipment - 2.2% | |||
| AMETEK, Inc. | 2,698 | 468,049 | |
| Eaton Corp. PLC | 28,609 | 8,719,737 | |
| Emerson Electric Co. | 7,248 | 848,813 | |
| GE Vernova LLC | 5,471 | 975,151 | |
| Hubbell, Inc. | 2,083 | 824,139 | |
| Vertiv Holdings Co. | 34,502 | 2,715,307 | |
| 14,551,196 | |||
| Ground Transportation - 1.0% | |||
| Uber Technologies, Inc. (a) | 101,002 | 6,511,599 | |
| Machinery - 2.8% | |||
| Caterpillar, Inc. | 19,163 | 6,634,231 | |
| Cummins, Inc. | 994 | 290,049 | |
| Dover Corp. | 2,354 | 433,748 | |
| Ingersoll Rand, Inc. | 22,767 | 2,285,807 | |
| PACCAR, Inc. | 24,581 | 2,425,161 | |
| Parker Hannifin Corp. | 6,675 | 3,745,743 | |
| Pentair PLC | 4,604 | 404,553 | |
| Westinghouse Air Brake Tech Co. | 9,226 | 1,486,770 | |
| Xylem, Inc. | 1,907 | 254,585 | |
| 17,960,647 | |||
| Passenger Airlines - 0.0% | |||
| Delta Air Lines, Inc. | 1,588 | 68,316 | |
| Professional Services - 0.4% | |||
| Booz Allen Hamilton Holding Corp. Class A | 6,508 | 932,661 | |
| Broadridge Financial Solutions, Inc. | 2,337 | 500,118 | |
| Leidos Holdings, Inc. | 6,693 | 966,469 | |
| Verisk Analytics, Inc. | 840 | 219,870 | |
| 2,619,118 | |||
| Trading Companies & Distributors - 1.1% | |||
| Fastenal Co. | 14,317 | 1,012,928 | |
| Ferguson PLC | 6,585 | 1,466,150 | |
| United Rentals, Inc. | 3,565 | 2,699,062 | |
| W.W. Grainger, Inc. | 1,815 | 1,772,910 | |
| Watsco, Inc. | 650 | 318,169 | |
| 7,269,219 | |||
TOTAL INDUSTRIALS | 98,195,078 | ||
| INFORMATION TECHNOLOGY - 30.9% | |||
| Communications Equipment - 1.0% | |||
| Arista Networks, Inc. (a) | 14,747 | 5,110,573 | |
| Juniper Networks, Inc. | 2,485 | 93,660 | |
| Motorola Solutions, Inc. | 3,265 | 1,302,474 | |
| 6,506,707 | |||
| Electronic Equipment, Instruments & Components - 0.8% | |||
| Amphenol Corp. Class A | 69,002 | 4,434,069 | |
| CDW Corp. | 1,771 | 386,273 | |
| Jabil, Inc. | 2,090 | 235,480 | |
| 5,055,822 | |||
| IT Services - 1.1% | |||
| Akamai Technologies, Inc. (a) | 2,311 | 227,125 | |
| Gartner, Inc. (a) | 1,793 | 898,634 | |
| GoDaddy, Inc. (a) | 8,578 | 1,247,670 | |
| IBM Corp. | 24,434 | 4,694,749 | |
| MongoDB, Inc. Class A (a) | 846 | 213,497 | |
| 7,281,675 | |||
| Semiconductors & Semiconductor Equipment - 17.4% | |||
| Advanced Micro Devices, Inc. (a) | 76,360 | 11,032,493 | |
| Applied Materials, Inc. | 39,767 | 8,438,557 | |
| Broadcom, Inc. | 205,512 | 33,021,664 | |
| Entegris, Inc. | 2,435 | 288,036 | |
| Intel Corp. | 67,641 | 2,079,284 | |
| KLA Corp. | 6,913 | 5,689,883 | |
| Lam Research Corp. | 6,214 | 5,724,585 | |
| Marvell Technology, Inc. | 4,776 | 319,896 | |
| Micron Technology, Inc. | 48,640 | 5,341,645 | |
| Monolithic Power Systems, Inc. | 1,003 | 865,679 | |
| NVIDIA Corp. | 274,208 | 32,087,820 | |
| NXP Semiconductors NV | 4,424 | 1,164,220 | |
| Qualcomm, Inc. | 32,681 | 5,913,627 | |
| Teradyne, Inc. | 2,215 | 290,519 | |
| 112,257,908 | |||
| Software - 9.2% | |||
| Adobe, Inc. (a) | 3,360 | 1,853,544 | |
| AppLovin Corp. Class A, (a) | 16,067 | 1,238,766 | |
| Cadence Design Systems, Inc. (a) | 7,705 | 2,062,320 | |
| Crowdstrike Holdings, Inc. (a) | 16,866 | 3,912,237 | |
| Datadog, Inc. Class A (a) | 4,004 | 466,226 | |
| Fair Isaac Corp. (a) | 1,238 | 1,980,800 | |
| HubSpot, Inc. (a) | 612 | 304,182 | |
| Intuit, Inc. | 5,912 | 3,827,133 | |
| Manhattan Associates, Inc. (a) | 1,845 | 471,176 | |
| Microsoft Corp. | 49,978 | 20,908,296 | |
| MicroStrategy, Inc. Class A (a) | 736 | 1,188,228 | |
| Oracle Corp. | 11,913 | 1,661,268 | |
| Palantir Technologies, Inc. Class A (a) | 79,105 | 2,127,133 | |
| Palo Alto Networks, Inc. (a) | 5,319 | 1,727,239 | |
| PTC, Inc. (a) | 2,591 | 460,809 | |
| Salesforce, Inc. | 24,638 | 6,376,314 | |
| Samsara, Inc. (a) | 6,974 | 266,965 | |
| ServiceNow, Inc. (a) | 5,911 | 4,813,859 | |
| Synopsys, Inc. (a) | 4,129 | 2,305,303 | |
| UiPath, Inc. Class A (a) | 6,614 | 80,492 | |
| Workday, Inc. Class A (a) | 3,152 | 715,882 | |
| Zscaler, Inc. (a) | 1,565 | 280,683 | |
| 59,028,855 | |||
| Technology Hardware, Storage & Peripherals - 1.4% | |||
| Dell Technologies, Inc. | 22,969 | 2,611,116 | |
| NetApp, Inc. | 8,075 | 1,025,364 | |
| Pure Storage, Inc. Class A (a) | 10,514 | 630,104 | |
| Seagate Technology Holdings PLC | 5,467 | 558,563 | |
| Super Micro Computer, Inc. (a) | 5,011 | 3,515,968 | |
| Western Digital Corp. (a) | 12,975 | 869,974 | |
| 9,211,089 | |||
TOTAL INFORMATION TECHNOLOGY | 199,342,056 | ||
| MATERIALS - 1.4% | |||
| Chemicals - 0.8% | |||
| Celanese Corp. | 1,199 | 169,239 | |
| Ecolab, Inc. | 3,906 | 901,075 | |
| Linde PLC | 6,063 | 2,749,571 | |
| Sherwin-Williams Co. | 3,709 | 1,301,117 | |
| Westlake Corp. | 268 | 39,626 | |
| 5,160,628 | |||
| Construction Materials - 0.4% | |||
| Martin Marietta Materials, Inc. | 2,914 | 1,729,022 | |
| Vulcan Materials Co. | 4,340 | 1,191,373 | |
| 2,920,395 | |||
| Containers & Packaging - 0.2% | |||
| International Paper Co. | 2,380 | 110,622 | |
| Packaging Corp. of America | 1,646 | 328,986 | |
| Smurfit Westrock PLC | 13,338 | 598,076 | |
| 1,037,684 | |||
| Metals & Mining - 0.0% | |||
| Reliance, Inc. | 279 | 84,972 | |
TOTAL MATERIALS | 9,203,679 | ||
| REAL ESTATE - 0.3% | |||
| Equity Real Estate Investment Trusts (REITs) - 0.3% | |||
| Digital Realty Trust, Inc. | 1,448 | 216,462 | |
| Iron Mountain, Inc. | 9,113 | 934,629 | |
| Simon Property Group, Inc. | 2,245 | 344,473 | |
| Welltower, Inc. | 3,467 | 385,704 | |
| 1,881,268 | |||
| UTILITIES - 1.5% | |||
| Electric Utilities - 1.1% | |||
| Constellation Energy Corp. | 29,404 | 5,580,879 | |
| NRG Energy, Inc. | 17,542 | 1,318,632 | |
| 6,899,511 | |||
| Independent Power and Renewable Electricity Producers - 0.4% | |||
| Vistra Corp. | 32,826 | 2,600,476 | |
TOTAL UTILITIES | 9,499,987 | ||
| TOTAL COMMON STOCKS (Cost $505,030,093) | 644,751,391 | ||
| U.S. Treasury Obligations - 0.0% | |||
Principal Amount (c) | Value ($) | ||
U.S. Treasury Bills, yield at date of purchase 5.31% 8/22/24 (d) (Cost $68,789) | 69,000 | 68,788 | |
| Money Market Funds - 0.1% | |||
| Shares | Value ($) | ||
| Fidelity Cash Central Fund 5.39% (e) | 864,832 | 865,005 | |
| Fidelity Securities Lending Cash Central Fund 5.39% (e)(f) | 84,792 | 84,800 | |
| TOTAL MONEY MARKET FUNDS (Cost $949,805) | 949,805 | ||
| TOTAL INVESTMENT IN SECURITIES - 100.0% (Cost $506,048,687) | 645,769,984 |
NET OTHER ASSETS (LIABILITIES) - 0.0% | (75,065) |
| NET ASSETS - 100.0% | 645,694,919 |
| Futures Contracts | |||||
Number of contracts | Expiration Date | Notional Amount ($) | Value ($) | Unrealized Appreciation/ (Depreciation) ($) | |
| Purchased | |||||
| Equity Index Contracts | |||||
| CME E-mini S&P 500 Index Contracts (United States) | 4 | Sep 2024 | 1,111,600 | 12,085 | 12,085 |
| The notional amount of futures purchased as a percentage of Net Assets is 0.2% | |||||
| (a) | Non-income producing |
| (b) | Security or a portion of the security is on loan at period end. |
| (c) | Amount is stated in United States dollars unless otherwise noted. |
| (d) | Security or a portion of the security was pledged to cover margin requirements for futures contracts. At period end, the value of securities pledged amounted to $68,788. |
| (e) | Affiliated fund that is generally available only to investment companies and other accounts managed by Fidelity Investments. The rate quoted is the annualized seven-day yield of the fund at period end. A complete unaudited listing of the fund's holdings as of its most recent quarter end is available upon request. In addition, each Fidelity Central Fund's financial statements, which are not covered by the Fund's Report of Independent Registered Public Accounting Firm, are available on the SEC's website or upon request. |
| (f) | Investment made with cash collateral received from securities on loan. |
| Affiliate | Value, beginning of period ($) | Purchases ($) | Sales Proceeds ($) | Dividend Income ($) | Realized Gain (loss) ($) | Change in Unrealized appreciation (depreciation) ($) | Value, end of period ($) | % ownership, end of period |
| Fidelity Cash Central Fund 5.39% | 1,483,312 | 161,303,415 | 161,921,618 | 109,702 | (104) | - | 865,005 | 0.0% |
| Fidelity Securities Lending Cash Central Fund 5.39% | 690,275 | 17,071,143 | 17,676,618 | 917 | - | - | 84,800 | 0.0% |
| Total | 2,173,587 | 178,374,558 | 179,598,236 | 110,619 | (104) | - | 949,805 | |
| Valuation Inputs at Reporting Date: | ||||
| Description | Total ($) | Level 1 ($) | Level 2 ($) | Level 3 ($) |
Investments in Securities: | ||||
| Equities: | ||||
Communication Services | 67,268,843 | 67,268,843 | - | - |
Consumer Discretionary | 64,277,044 | 64,277,044 | - | - |
Consumer Staples | 26,711,424 | 26,711,424 | - | - |
Energy | 5,983,113 | 5,983,113 | - | - |
Financials | 99,186,156 | 99,186,156 | - | - |
Health Care | 63,202,743 | 63,202,743 | - | - |
Industrials | 98,195,078 | 98,195,078 | - | - |
Information Technology | 199,342,056 | 199,342,056 | - | - |
Materials | 9,203,679 | 9,203,679 | - | - |
Real Estate | 1,881,268 | 1,881,268 | - | - |
Utilities | 9,499,987 | 9,499,987 | - | - |
| U.S. Government and Government Agency Obligations | 68,788 | - | 68,788 | - |
| Money Market Funds | 949,805 | 949,805 | - | - |
| Total Investments in Securities: | 645,769,984 | 645,701,196 | 68,788 | - |
Derivative Instruments: Assets | ||||
Futures Contracts | 12,085 | 12,085 | - | - |
| Total Assets | 12,085 | 12,085 | - | - |
| Total Derivative Instruments: | 12,085 | 12,085 | - | - |
Primary Risk Exposure / Derivative Type | Value | |
| Asset ($) | Liability ($) | |
| Equity Risk | ||
Futures Contracts (a) | 12,085 | 0 |
| Total Equity Risk | 12,085 | 0 |
| Total Value of Derivatives | 12,085 | 0 |
| Statement of Assets and Liabilities | ||||
As of July 31, 2024 | ||||
| Assets | ||||
| Investment in securities, at value (including securities loaned of $83,712) - See accompanying schedule: | ||||
Unaffiliated issuers (cost $505,098,882) | $ | 644,820,179 | ||
Fidelity Central Funds (cost $949,805) | 949,805 | |||
| Total Investment in Securities (cost $506,048,687) | $ | 645,769,984 | ||
| Segregated cash with brokers for derivative instruments | 62,283 | |||
| Receivable for investments sold | 38,106,041 | |||
| Receivable for fund shares sold | 499,646 | |||
| Dividends receivable | 122,505 | |||
| Distributions receivable from Fidelity Central Funds | 8,271 | |||
| Receivable for daily variation margin on futures contracts | 17,100 | |||
| Prepaid expenses | 161 | |||
Total assets | 684,585,991 | |||
| Liabilities | ||||
| Payable for investments purchased | $ | 38,275,430 | ||
| Payable for fund shares redeemed | 425,195 | |||
| Accrued management fee | 54,976 | |||
| Other payables and accrued expenses | 50,671 | |||
| Collateral on securities loaned | 84,800 | |||
| Total liabilities | 38,891,072 | |||
| Net Assets | $ | 645,694,919 | ||
| Net Assets consist of: | ||||
| Paid in capital | $ | 487,629,507 | ||
| Total accumulated earnings (loss) | 158,065,412 | |||
| Net Assets | $ | 645,694,919 | ||
Net Asset Value, offering price and redemption price per share ($645,694,919 ÷ 39,514,856 shares) | $ | 16.34 | ||
| Statement of Operations | ||||
| Year ended July 31, 2024 | ||||
| Investment Income | ||||
| Dividends | $ | 3,500,734 | ||
| Interest | 13,722 | |||
| Income from Fidelity Central Funds (including $917 from security lending) | 110,619 | |||
| Total income | 3,625,075 | |||
| Expenses | ||||
| Management fee | $ | 446,924 | ||
| Custodian fees and expenses | 27,110 | |||
| Independent trustees' fees and expenses | 1,202 | |||
| Registration fees | 27,833 | |||
| Audit fees | 56,777 | |||
| Legal | 6,333 | |||
| Interest | 7,275 | |||
| Miscellaneous | 6,517 | |||
| Total expenses | 579,971 | |||
| Net Investment income (loss) | 3,045,104 | |||
| Realized and Unrealized Gain (Loss) | ||||
| Net realized gain (loss) on: | ||||
| Investment Securities: | ||||
| Unaffiliated issuers | 29,312,633 | |||
| Fidelity Central Funds | (104) | |||
| Futures contracts | 279,597 | |||
| Total net realized gain (loss) | 29,592,126 | |||
| Change in net unrealized appreciation (depreciation) on: | ||||
| Investment Securities: | ||||
| Unaffiliated issuers | 87,603,267 | |||
| Futures contracts | (18,594) | |||
| Total change in net unrealized appreciation (depreciation) | 87,584,673 | |||
| Net gain (loss) | 117,176,799 | |||
| Net increase (decrease) in net assets resulting from operations | $ | 120,221,903 | ||
| Statement of Changes in Net Assets | ||||
Year ended July 31, 2024 | Year ended July 31, 2023 | |||
| Increase (Decrease) in Net Assets | ||||
| Operations | ||||
| Net investment income (loss) | $ | 3,045,104 | $ | 36,071,724 |
| Net realized gain (loss) | 29,592,126 | 250,894,815 | ||
| Change in net unrealized appreciation (depreciation) | 87,584,673 | (238,747,543) | ||
| Net increase (decrease) in net assets resulting from operations | 120,221,903 | 48,218,996 | ||
| Distributions to shareholders | (55,039,241) | (61,615,588) | ||
| Share transactions | ||||
| Proceeds from sales of shares | 337,347,841 | 56,880,947 | ||
| Reinvestment of distributions | 50,595,189 | 60,451,730 | ||
| Cost of shares redeemed | (142,340,861) | (4,293,261,374) | ||
Net increase (decrease) in net assets resulting from share transactions | 245,602,169 | (4,175,928,697) | ||
| Total increase (decrease) in net assets | 310,784,831 | (4,189,325,289) | ||
| Net Assets | ||||
| Beginning of period | 334,910,088 | 4,524,235,377 | ||
| End of period | $ | 645,694,919 | $ | 334,910,088 |
| Other Information | ||||
| Shares | ||||
| Sold | 22,317,838 | 4,142,276 | ||
| Issued in reinvestment of distributions | 4,023,283 | 4,354,609 | ||
| Redeemed | (9,948,777) | (309,624,256) | ||
| Net increase (decrease) | 16,392,344 | (301,127,371) | ||
Fidelity® SAI U.S. Momentum Index Fund |
| Years ended July 31, | 2024 | 2023 | 2022 | 2021 | 2020 | |||||
Selected Per-Share Data | ||||||||||
| Net asset value, beginning of period | $ | 14.48 | $ | 13.95 | $ | 19.05 | $ | 15.74 | $ | 13.77 |
| Income from Investment Operations | ||||||||||
Net investment income (loss) A,B | .10 | .30 | .19 | .10 | .19 | |||||
| Net realized and unrealized gain (loss) | 4.17 | .52 C | (1.81) | 4.66 | 2.07 | |||||
| Total from investment operations | 4.27 | .82 | (1.62) | 4.76 | 2.26 | |||||
| Distributions from net investment income | (.11) | (.29) | (.10) | (.18) | (.22) | |||||
| Distributions from net realized gain | (2.30) | - | (3.38) | (1.27) | (.08) | |||||
| Total distributions | (2.41) | (.29) | (3.48) | (1.45) | (.29) D | |||||
| Net asset value, end of period | $ | 16.34 | $ | 14.48 | $ | 13.95 | $ | 19.05 | $ | 15.74 |
Total Return E | 35.08 % | 5.99% C | (11.06)% | 32.98% | 16.76% | |||||
Ratios to Average Net Assets B,F,G | ||||||||||
| Expenses before reductions | .13% | .11% | .11% | .11% | .11% | |||||
| Expenses net of fee waivers, if any | .13 % | .11% | .11% | .11% | .11% | |||||
| Expenses net of all reductions | .13% | .11% | .11% | .11% | .11% | |||||
| Net investment income (loss) | .68% | 2.15% | 1.25% | .58% | 1.36% | |||||
| Supplemental Data | ||||||||||
| Net assets, end of period (000 omitted) | $ | 645,695 | $ | 334,910 | $ | 4,524,235 | $ | 2,908,860 | $ | 1,798,387 |
Portfolio turnover rate H | 104 % | 85% | 138% | 128% | 163% |
| Fidelity Central Fund | Investment Manager | Investment Objective | Investment Practices | Expense RatioA |
| Fidelity Money Market Central Funds | Fidelity Management & Research Company LLC (FMR) | Each fund seeks to obtain a high level of current income consistent with the preservation of capital and liquidity. | Short-term Investments | Less than .005% |
| Gross unrealized appreciation | $146,958,335 |
| Gross unrealized depreciation | (7,963,532) |
| Net unrealized appreciation (depreciation) | $138,994,803 |
| Tax Cost | $506,775,181 |
| Undistributed ordinary income | $1,783,387 |
| Undistributed long-term capital gain | $17,287,224 |
| Net unrealized appreciation (depreciation) on securities and other investments | $138,994,803 |
| July 31, 2024 | July 31, 2023 | |
| Ordinary Income | $2,427,968 | $ 61,615,588 |
| Long-term Capital Gains | 52,611,273 | - |
| Total | $55,039,241 | $ 61,615,588 |
| Equity Risk | Equity risk relates to the fluctuations in the value of financial instruments as a result of changes in market prices (other than those arising from interest rate risk or foreign exchange risk), whether caused by factors specific to an individual investment, its issuer, or all factors affecting all instruments traded in a market or market segment. |
| Purchases ($) | Sales ($) | |
| Fidelity SAI U.S. Momentum Index Fund | 658,992,972 | 461,919,610 |
| Borrower or Lender | Average Loan Balance ($) | Weighted Average Interest Rate | Interest Expense ($) | |
Fidelity SAI U.S. Momentum Index Fund | Borrower | 11,765,250 | 5.57% | 7,275 |
| Amount ($) | |
| Fidelity SAI U.S. Momentum Index Fund | 697 |
| Total Security Lending Fees Paid to NFS ($) | Security Lending Income From Securities Loaned to NFS ($) | Value of Securities Loaned to NFS at Period End ($) | |
| Fidelity SAI U.S. Momentum Index Fund | 79 | - | - |
| A special meeting of shareholders was held on October 18, 2023. The results of votes taken among shareholders on the proposal before them are reported below. Each vote reported represents one dollar of net asset value held on the record date for the meeting. | ||
| Proposal 1 | ||
| To elect a Board of Trustees. | ||
# of Votes | % of Votes | |
| Abigail P. Johnson | ||
| Affirmative | 378,729,502,260.01 | 97.58 |
| Withheld | 9,407,876,478.96 | 2.42 |
| TOTAL | 388,137,378,738.97 | 100.00 |
| Jennifer Toolin McAuliffe | ||
| Affirmative | 378,454,868,010.95 | 97.51 |
| Withheld | 9,682,510,728.02 | 2.49 |
| TOTAL | 388,137,378,738.97 | 100.00 |
| Christine J. Thompson | ||
| Affirmative | 378,837,121,274.52 | 97.60 |
| Withheld | 9,300,257,464.45 | 2.40 |
| TOTAL | 388,137,378,738.97 | 100.00 |
| Elizabeth S. Acton | ||
| Affirmative | 378,262,110,794.85 | 97.46 |
| Withheld | 9,875,267,944.12 | 2.54 |
| TOTAL | 388,137,378,738.97 | 100.00 |
| Laura M. Bishop | ||
| Affirmative | 380,482,113,171.06 | 98.03 |
| Withheld | 7,655,265,567.91 | 1.97 |
| TOTAL | 388,137,378,738.97 | 100.00 |
| Ann E. Dunwoody | ||
| Affirmative | 380,016,034,008.12 | 97.91 |
| Withheld | 8,121,344,730.85 | 2.09 |
| TOTAL | 388,137,378,738.97 | 100.00 |
| John Engler | ||
| Affirmative | 379,432,488,394.20 | 97.76 |
| Withheld | 8,704,890,344.77 | 2.24 |
| TOTAL | 388,137,378,738.97 | 100.00 |
| Robert F. Gartland | ||
| Affirmative | 378,741,819,600.60 | 97.58 |
| Withheld | 9,395,559,138.37 | 2.42 |
| TOTAL | 388,137,378,738.97 | 100.00 |
| Robert W. Helm | ||
| Affirmative | 380,389,324,755.07 | 98.00 |
| Withheld | 7,748,053,983.90 | 2.00 |
| TOTAL | 388,137,378,738.97 | 100.00 |
| Arthur E. Johnson | ||
| Affirmative | 378,427,694,151.67 | 97.50 |
| Withheld | 9,709,684,587.30 | 2.50 |
| TOTAL | 388,137,378,738.97 | 100.00 |
| Michael E. Kenneally | ||
| Affirmative | 377,842,228,145.18 | 97.35 |
| Withheld | 10,295,150,593.79 | 2.65 |
| TOTAL | 388,137,378,738.97 | 100.00 |
| Mark A. Murray | ||
| Affirmative | 380,158,432,703.37 | 97.94 |
| Withheld | 7,978,946,035.60 | 2.06 |
| TOTAL | 388,137,378,738.97 | 100.00 |
| Carol J. Zierhoffer | ||
| Affirmative | 380,522,113,360.24 | 98.04 |
| Withheld | 7,615,265,378.73 | 1.96 |
| TOTAL | 388,137,378,738.97 | 100.00 |
| Proposal 1 reflects trust-wide proposal and voting results. | ||
 |


Contents
| Common Stocks - 99.7% | |||
| Shares | Value ($) | ||
| COMMUNICATION SERVICES - 8.8% | |||
| Diversified Telecommunication Services - 0.7% | |||
| AT&T, Inc. | 2,298,707 | 44,250,110 | |
| Verizon Communications, Inc. | 1,349,475 | 54,680,727 | |
| 98,930,837 | |||
| Entertainment - 1.1% | |||
| Electronic Arts, Inc. | 77,996 | 11,772,716 | |
| Live Nation Entertainment, Inc. (a) | 45,666 | 4,392,613 | |
| Netflix, Inc. (a) | 138,144 | 86,802,782 | |
| Take-Two Interactive Software, Inc. (a) | 50,911 | 7,663,633 | |
| The Walt Disney Co. | 584,455 | 54,757,589 | |
| Warner Bros Discovery, Inc. (a) | 714,915 | 6,184,015 | |
| 171,573,348 | |||
| Interactive Media & Services - 6.2% | |||
| Alphabet, Inc.: | |||
| Class A | 1,882,918 | 322,995,754 | |
| Class C | 1,566,941 | 271,315,834 | |
| Match Group, Inc. (a) | 85,027 | 3,242,930 | |
| Meta Platforms, Inc. Class A | 702,568 | 333,600,363 | |
| 931,154,881 | |||
| Media - 0.6% | |||
| Charter Communications, Inc. Class A (a) | 31,400 | 11,923,208 | |
| Comcast Corp. Class A | 1,254,858 | 51,787,990 | |
| Fox Corp.: | |||
| Class A | 73,854 | 2,809,406 | |
| Class B | 42,640 | 1,510,735 | |
| Interpublic Group of Companies, Inc. | 121,116 | 3,896,302 | |
| News Corp.: | |||
| Class A | 121,449 | 3,349,563 | |
| Class B | 36,885 | 1,050,854 | |
| Omnicom Group, Inc. | 62,779 | 6,154,853 | |
| Paramount Global Class B (b) | 158,221 | 1,806,884 | |
| 84,289,795 | |||
| Wireless Telecommunication Services - 0.2% | |||
| T-Mobile U.S., Inc. | 165,302 | 30,131,249 | |
TOTAL COMMUNICATION SERVICES | 1,316,080,110 | ||
| CONSUMER DISCRETIONARY - 10.0% | |||
| Automobile Components - 0.1% | |||
| Aptiv PLC (a) | 87,239 | 6,053,514 | |
| BorgWarner, Inc. | 72,920 | 2,574,805 | |
| 8,628,319 | |||
| Automobiles - 1.6% | |||
| Ford Motor Co. | 1,257,252 | 13,603,467 | |
| General Motors Co. | 365,785 | 16,211,591 | |
| Tesla, Inc. (a) | 889,525 | 206,432,067 | |
| 236,247,125 | |||
| Broadline Retail - 3.8% | |||
| Amazon.com, Inc. (a) | 2,935,958 | 548,965,427 | |
| eBay, Inc. | 162,234 | 9,021,833 | |
| Etsy, Inc. (a) | 37,425 | 2,437,865 | |
| 560,425,125 | |||
| Distributors - 0.1% | |||
| Genuine Parts Co. | 44,662 | 6,570,227 | |
| LKQ Corp. | 85,631 | 3,553,687 | |
| Pool Corp. | 12,290 | 4,596,952 | |
| 14,720,866 | |||
| Hotels, Restaurants & Leisure - 1.8% | |||
| Airbnb, Inc. Class A (a) | 141,545 | 19,754,020 | |
| Booking Holdings, Inc. | 10,877 | 40,408,164 | |
| Caesars Entertainment, Inc. (a) | 69,264 | 2,767,097 | |
| Carnival Corp. (a) | 323,854 | 5,395,408 | |
| Chipotle Mexican Grill, Inc. (a) | 440,295 | 23,916,824 | |
| Darden Restaurants, Inc. | 38,272 | 5,598,811 | |
| Domino's Pizza, Inc. | 11,183 | 4,794,152 | |
| Expedia Group, Inc. (a) | 40,701 | 5,196,297 | |
| Hilton Worldwide Holdings, Inc. | 80,165 | 17,209,021 | |
| Las Vegas Sands Corp. | 117,051 | 4,643,413 | |
| Marriott International, Inc. Class A | 76,919 | 17,483,689 | |
| McDonald's Corp. | 231,050 | 61,320,670 | |
| MGM Resorts International (a) | 80,549 | 3,461,191 | |
| Norwegian Cruise Line Holdings Ltd. (a) | 137,315 | 2,530,715 | |
| Royal Caribbean Cruises Ltd. | 75,906 | 11,895,988 | |
| Starbucks Corp. | 363,151 | 28,307,620 | |
| Wynn Resorts Ltd. | 30,222 | 2,502,986 | |
| Yum! Brands, Inc. | 90,296 | 11,994,018 | |
| 269,180,084 | |||
| Household Durables - 0.4% | |||
| D.R. Horton, Inc. | 95,023 | 17,097,488 | |
| Garmin Ltd. | 49,262 | 8,436,118 | |
| Lennar Corp. Class A | 78,509 | 13,890,597 | |
| Mohawk Industries, Inc. (a) | 16,965 | 2,732,553 | |
| NVR, Inc. (a) | 1,004 | 8,641,910 | |
| PulteGroup, Inc. | 67,441 | 8,902,212 | |
| 59,700,878 | |||
| Leisure Products - 0.0% | |||
| Hasbro, Inc. | 41,883 | 2,699,778 | |
| Specialty Retail - 1.9% | |||
| AutoZone, Inc. (a) | 5,547 | 17,382,578 | |
| Bath & Body Works, Inc. | 71,584 | 2,630,712 | |
| Best Buy Co., Inc. | 61,736 | 5,341,399 | |
| CarMax, Inc. (a) | 50,468 | 4,261,518 | |
| Lowe's Companies, Inc. | 183,446 | 45,037,827 | |
| O'Reilly Automotive, Inc. (a) | 18,881 | 21,266,426 | |
| Ross Stores, Inc. | 107,499 | 15,397,082 | |
| The Home Depot, Inc. | 317,722 | 116,972,532 | |
| TJX Companies, Inc. | 363,073 | 41,034,510 | |
| Tractor Supply Co. | 34,565 | 9,101,656 | |
| Ulta Beauty, Inc. (a) | 15,369 | 5,607,994 | |
| 284,034,234 | |||
| Textiles, Apparel & Luxury Goods - 0.3% | |||
| Deckers Outdoor Corp. (a) | 8,229 | 7,592,322 | |
| lululemon athletica, Inc. (a) | 36,736 | 9,502,134 | |
| NIKE, Inc. Class B | 388,397 | 29,075,399 | |
| Ralph Lauren Corp. Class A | 12,496 | 2,194,173 | |
| Tapestry, Inc. | 73,787 | 2,958,121 | |
| 51,322,149 | |||
TOTAL CONSUMER DISCRETIONARY | 1,486,958,558 | ||
| CONSUMER STAPLES - 5.8% | |||
| Beverages - 1.3% | |||
| Brown-Forman Corp. Class B (non-vtg.) (b) | 57,294 | 2,587,397 | |
| Constellation Brands, Inc. Class A (sub. vtg.) | 51,616 | 12,654,179 | |
| Keurig Dr. Pepper, Inc. | 334,640 | 11,471,459 | |
| Molson Coors Beverage Co. Class B | 58,384 | 3,085,594 | |
| Monster Beverage Corp. (a) | 227,404 | 11,699,936 | |
| PepsiCo, Inc. | 440,751 | 76,104,475 | |
| The Coca-Cola Co. | 1,242,974 | 82,956,085 | |
| 200,559,125 | |||
| Consumer Staples Distribution & Retail - 1.9% | |||
| Costco Wholesale Corp. | 142,185 | 116,876,070 | |
| Dollar General Corp. | 70,432 | 8,479,308 | |
| Dollar Tree, Inc. (a) | 66,446 | 6,932,976 | |
| Kroger Co. | 214,613 | 11,696,409 | |
| Sysco Corp. | 159,659 | 12,237,862 | |
| Target Corp. | 148,322 | 22,309,112 | |
| Walgreens Boots Alliance, Inc. | 229,173 | 2,720,284 | |
| Walmart, Inc. | 1,369,474 | 94,000,695 | |
| 275,252,716 | |||
| Food Products - 0.7% | |||
| Archer Daniels Midland Co. | 158,515 | 9,829,515 | |
| Bunge Global SA | 45,394 | 4,776,811 | |
| Campbell Soup Co. | 63,182 | 2,960,709 | |
| Conagra Brands, Inc. | 153,266 | 4,647,025 | |
| General Mills, Inc. | 180,991 | 12,151,736 | |
| Hormel Foods Corp. | 93,216 | 2,993,166 | |
| Kellanova | 84,394 | 4,907,511 | |
| Lamb Weston Holdings, Inc. | 46,212 | 2,773,644 | |
| McCormick & Co., Inc. (non-vtg.) | 80,711 | 6,215,554 | |
| Mondelez International, Inc. | 430,022 | 29,392,004 | |
| The Hershey Co. | 47,326 | 9,345,938 | |
| The J.M. Smucker Co. | 34,042 | 4,015,254 | |
| The Kraft Heinz Co. | 253,035 | 8,909,362 | |
| Tyson Foods, Inc. Class A | 91,694 | 5,584,165 | |
| 108,502,394 | |||
| Household Products - 1.2% | |||
| Church & Dwight Co., Inc. | 78,393 | 7,683,298 | |
| Colgate-Palmolive Co. | 263,020 | 26,088,954 | |
| Kimberly-Clark Corp. | 107,948 | 14,578,377 | |
| Procter & Gamble Co. | 756,636 | 121,636,803 | |
| The Clorox Co. | 39,819 | 5,253,321 | |
| 175,240,753 | |||
| Personal Care Products - 0.1% | |||
| Estee Lauder Companies, Inc. Class A | 74,713 | 7,442,162 | |
| Kenvue, Inc. | 613,898 | 11,350,974 | |
| 18,793,136 | |||
| Tobacco - 0.6% | |||
| Altria Group, Inc. | 550,650 | 26,987,357 | |
| Philip Morris International, Inc. | 498,382 | 57,393,671 | |
| 84,381,028 | |||
TOTAL CONSUMER STAPLES | 862,729,152 | ||
| ENERGY - 3.7% | |||
| Energy Equipment & Services - 0.3% | |||
| Baker Hughes Co. Class A | 319,951 | 12,388,503 | |
| Halliburton Co. | 283,834 | 9,843,363 | |
| Schlumberger Ltd. | 458,243 | 22,128,554 | |
| 44,360,420 | |||
| Oil, Gas & Consumable Fuels - 3.4% | |||
| APA Corp. | 115,561 | 3,604,348 | |
| Chevron Corp. | 549,482 | 88,175,377 | |
| ConocoPhillips Co. | 374,940 | 41,693,328 | |
| Coterra Energy, Inc. | 238,596 | 6,155,777 | |
| Devon Energy Corp. | 202,616 | 9,529,030 | |
| Diamondback Energy, Inc. | 57,173 | 11,566,670 | |
| EOG Resources, Inc. | 184,245 | 23,362,266 | |
| EQT Corp. | 190,301 | 6,567,288 | |
| Exxon Mobil Corp. | 1,438,161 | 170,551,513 | |
| Hess Corp. | 88,607 | 13,594,086 | |
| Kinder Morgan, Inc. | 619,005 | 13,079,576 | |
| Marathon Oil Corp. | 180,835 | 5,072,422 | |
| Marathon Petroleum Corp. | 112,954 | 19,995,117 | |
| Occidental Petroleum Corp. | 213,187 | 12,966,033 | |
| ONEOK, Inc. | 187,104 | 15,591,376 | |
| Phillips 66 Co. | 135,915 | 19,772,914 | |
| Targa Resources Corp. | 71,077 | 9,615,297 | |
| The Williams Companies, Inc. | 390,713 | 16,777,216 | |
| Valero Energy Corp. | 104,833 | 16,953,593 | |
| 504,623,227 | |||
TOTAL ENERGY | 548,983,647 | ||
| FINANCIALS - 13.0% | |||
| Banks - 3.3% | |||
| Bank of America Corp. | 2,181,229 | 87,925,341 | |
| Citigroup, Inc. | 611,516 | 39,675,158 | |
| Citizens Financial Group, Inc. | 145,885 | 6,224,913 | |
| Fifth Third Bancorp | 219,292 | 9,284,823 | |
| Huntington Bancshares, Inc. | 464,640 | 6,946,368 | |
| JPMorgan Chase & Co. | 920,640 | 195,912,192 | |
| KeyCorp | 302,311 | 4,876,276 | |
| M&T Bank Corp. | 53,492 | 9,209,718 | |
| PNC Financial Services Group, Inc. | 127,565 | 23,102,022 | |
| Regions Financial Corp. | 293,623 | 6,568,347 | |
| Truist Financial Corp. | 429,000 | 19,172,010 | |
| U.S. Bancorp | 500,279 | 22,452,522 | |
| Wells Fargo & Co. | 1,117,690 | 66,323,725 | |
| 497,673,415 | |||
| Capital Markets - 3.0% | |||
| Ameriprise Financial, Inc. | 31,843 | 13,694,719 | |
| Bank of New York Mellon Corp. | 239,742 | 15,600,012 | |
| BlackRock, Inc. | 44,783 | 39,252,300 | |
| Blackstone, Inc. | 229,116 | 32,568,839 | |
| Cboe Global Markets, Inc. | 33,714 | 6,186,856 | |
| Charles Schwab Corp. | 478,624 | 31,201,499 | |
| CME Group, Inc. | 115,437 | 22,361,301 | |
| FactSet Research Systems, Inc. | 12,221 | 5,048,373 | |
| Franklin Resources, Inc. | 95,972 | 2,194,880 | |
| Goldman Sachs Group, Inc. | 103,382 | 52,624,539 | |
| Intercontinental Exchange, Inc. | 183,887 | 27,869,914 | |
| Invesco Ltd. | 143,969 | 2,484,905 | |
| KKR & Co., Inc. | 213,375 | 26,341,144 | |
| MarketAxess Holdings, Inc. | 12,129 | 2,711,195 | |
| Moody's Corp. | 50,346 | 22,981,942 | |
| Morgan Stanley | 401,191 | 41,406,923 | |
| MSCI, Inc. | 25,400 | 13,735,304 | |
| NASDAQ, Inc. | 132,630 | 8,976,398 | |
| Northern Trust Corp. | 65,598 | 5,815,263 | |
| Raymond James Financial, Inc. | 59,809 | 6,937,844 | |
| S&P Global, Inc. | 102,622 | 49,743,962 | |
| State Street Corp. | 96,588 | 8,207,082 | |
| T. Rowe Price Group, Inc. | 71,593 | 8,176,637 | |
| 446,121,831 | |||
| Consumer Finance - 0.6% | |||
| American Express Co. | 182,177 | 46,098,068 | |
| Capital One Financial Corp. | 122,505 | 18,547,257 | |
| Discover Financial Services | 80,343 | 11,568,589 | |
| Synchrony Financial | 128,746 | 6,539,009 | |
| 82,752,923 | |||
| Financial Services - 4.0% | |||
| Berkshire Hathaway, Inc. Class B (a) | 580,393 | 254,502,331 | |
| Corpay, Inc. (a) | 22,530 | 6,574,705 | |
| Fidelity National Information Services, Inc. | 178,339 | 13,701,785 | |
| Fiserv, Inc. (a) | 187,580 | 30,682,461 | |
| Global Payments, Inc. | 81,840 | 8,318,218 | |
| Jack Henry & Associates, Inc. | 23,373 | 4,008,002 | |
| MasterCard, Inc. Class A | 263,206 | 122,051,254 | |
| PayPal Holdings, Inc. (a) | 335,367 | 22,060,441 | |
| Visa, Inc. Class A | 504,665 | 134,074,351 | |
| 595,973,548 | |||
| Insurance - 2.1% | |||
| AFLAC, Inc. | 165,775 | 15,811,620 | |
| Allstate Corp. | 84,612 | 14,478,805 | |
| American International Group, Inc. | 212,780 | 16,858,559 | |
| Aon PLC | 69,710 | 22,900,432 | |
| Arch Capital Group Ltd. (a) | 119,896 | 11,483,639 | |
| Arthur J. Gallagher & Co. | 70,052 | 19,859,041 | |
| Assurant, Inc. | 16,638 | 2,909,487 | |
| Brown & Brown, Inc. | 75,905 | 7,547,234 | |
| Chubb Ltd. | 130,182 | 35,885,970 | |
| Cincinnati Financial Corp. | 50,197 | 6,556,732 | |
| Everest Re Group Ltd. | 13,934 | 5,474,251 | |
| Globe Life, Inc. | 26,873 | 2,492,202 | |
| Hartford Financial Services Group, Inc. | 94,818 | 10,517,213 | |
| Loews Corp. | 58,203 | 4,653,330 | |
| Marsh & McLennan Companies, Inc. | 157,966 | 35,158,493 | |
| MetLife, Inc. | 191,512 | 14,717,697 | |
| Principal Financial Group, Inc. | 69,141 | 5,635,683 | |
| Progressive Corp. | 187,771 | 40,205,527 | |
| Prudential Financial, Inc. | 115,094 | 14,423,580 | |
| The Travelers Companies, Inc. | 73,416 | 15,890,159 | |
| W.R. Berkley Corp. | 97,131 | 5,354,832 | |
| Willis Towers Watson PLC | 32,777 | 9,252,292 | |
| 318,066,778 | |||
TOTAL FINANCIALS | 1,940,588,495 | ||
| HEALTH CARE - 11.8% | |||
| Biotechnology - 2.0% | |||
| AbbVie, Inc. | 566,126 | 104,914,470 | |
| Amgen, Inc. | 171,978 | 57,177,526 | |
| Biogen, Inc. (a) | 46,678 | 9,951,750 | |
| Gilead Sciences, Inc. | 399,412 | 30,379,277 | |
| Incyte Corp. (a) | 51,030 | 3,320,522 | |
| Moderna, Inc. (a) | 106,894 | 12,743,903 | |
| Regeneron Pharmaceuticals, Inc. (a) | 34,003 | 36,695,698 | |
| Vertex Pharmaceuticals, Inc. (a) | 82,729 | 41,010,420 | |
| 296,193,566 | |||
| Health Care Equipment & Supplies - 2.3% | |||
| Abbott Laboratories | 557,717 | 59,084,539 | |
| Align Technology, Inc. (a) | 22,447 | 5,205,010 | |
| Baxter International, Inc. | 163,384 | 5,852,415 | |
| Becton, Dickinson & Co. | 92,655 | 22,335,414 | |
| Boston Scientific Corp. (a) | 471,321 | 34,821,195 | |
| DexCom, Inc. (a) | 127,499 | 8,646,982 | |
| Edwards Lifesciences Corp. (a) | 193,191 | 12,180,693 | |
| GE Healthcare Technologies, Inc. | 136,098 | 11,517,974 | |
| Hologic, Inc. (a) | 74,818 | 6,105,897 | |
| IDEXX Laboratories, Inc. (a) | 26,477 | 12,606,229 | |
| Insulet Corp. (a) | 22,456 | 4,364,324 | |
| Intuitive Surgical, Inc. (a) | 113,716 | 50,559,271 | |
| Medtronic PLC | 425,693 | 34,191,662 | |
| ResMed, Inc. | 47,098 | 10,043,649 | |
| Solventum Corp. | 44,221 | 2,603,732 | |
| STERIS PLC | 31,680 | 7,563,917 | |
| Stryker Corp. | 108,695 | 35,592,178 | |
| Teleflex, Inc. | 15,120 | 3,340,310 | |
| The Cooper Companies, Inc. | 63,722 | 5,947,174 | |
| Zimmer Biomet Holdings, Inc. | 65,957 | 7,344,312 | |
| 339,906,877 | |||
| Health Care Providers & Services - 2.6% | |||
| Cardinal Health, Inc. | 78,090 | 7,873,815 | |
| Cencora, Inc. | 53,073 | 12,625,005 | |
| Centene Corp. (a) | 171,094 | 13,160,550 | |
| Cigna Group | 91,074 | 31,754,772 | |
| CVS Health Corp. | 402,478 | 24,281,498 | |
| DaVita, Inc. (a) | 16,560 | 2,262,427 | |
| Elevance Health, Inc. | 74,513 | 39,643,151 | |
| HCA Holdings, Inc. | 62,138 | 22,559,201 | |
| Henry Schein, Inc. (a) | 40,983 | 2,948,317 | |
| Humana, Inc. | 38,634 | 13,970,441 | |
| Labcorp Holdings, Inc. | 27,028 | 5,822,912 | |
| McKesson Corp. | 41,672 | 25,712,457 | |
| Molina Healthcare, Inc. (a) | 18,788 | 6,411,781 | |
| Quest Diagnostics, Inc. | 35,621 | 5,068,868 | |
| UnitedHealth Group, Inc. | 295,072 | 170,008,684 | |
| Universal Health Services, Inc. Class B | 19,134 | 4,090,084 | |
| 388,193,963 | |||
| Life Sciences Tools & Services - 1.3% | |||
| Agilent Technologies, Inc. | 93,955 | 13,285,237 | |
| Bio-Rad Laboratories, Inc. Class A (a) | 6,528 | 2,208,814 | |
| Bio-Techne Corp. | 50,527 | 4,122,498 | |
| Charles River Laboratories International, Inc. (a) | 16,516 | 4,031,556 | |
| Danaher Corp. | 211,340 | 58,558,087 | |
| IQVIA Holdings, Inc. (a) | 58,414 | 14,383,279 | |
| Mettler-Toledo International, Inc. (a) | 6,847 | 10,414,492 | |
| Revvity, Inc. | 39,563 | 4,969,508 | |
| Thermo Fisher Scientific, Inc. | 122,376 | 75,058,096 | |
| Waters Corp. (a) | 19,019 | 6,395,709 | |
| West Pharmaceutical Services, Inc. | 23,354 | 7,150,294 | |
| 200,577,570 | |||
| Pharmaceuticals - 3.6% | |||
| Bristol-Myers Squibb Co. | 649,887 | 30,908,626 | |
| Catalent, Inc. (a) | 58,093 | 3,447,239 | |
| Eli Lilly & Co. | 255,943 | 205,847,277 | |
| Johnson & Johnson | 771,563 | 121,791,220 | |
| Merck & Co., Inc. | 811,998 | 91,861,334 | |
| Pfizer, Inc. | 1,816,690 | 55,481,713 | |
| Viatris, Inc. | 381,729 | 4,603,652 | |
| Zoetis, Inc. Class A | 146,286 | 26,337,331 | |
| 540,278,392 | |||
TOTAL HEALTH CARE | 1,765,150,368 | ||
| INDUSTRIALS - 8.4% | |||
| Aerospace & Defense - 2.0% | |||
| Axon Enterprise, Inc. (a) | 22,743 | 6,823,127 | |
| General Dynamics Corp. | 72,885 | 21,771,478 | |
| General Electric Co. | 350,926 | 59,727,605 | |
| Howmet Aerospace, Inc. | 124,319 | 11,897,328 | |
| Huntington Ingalls Industries, Inc. | 12,657 | 3,543,707 | |
| L3Harris Technologies, Inc. | 60,808 | 13,796,727 | |
| Lockheed Martin Corp. | 68,460 | 37,099,843 | |
| Northrop Grumman Corp. | 44,598 | 21,599,703 | |
| RTX Corp. | 426,230 | 50,077,763 | |
| Textron, Inc. | 61,135 | 5,679,442 | |
| The Boeing Co. (a) | 185,003 | 35,261,572 | |
| TransDigm Group, Inc. | 17,940 | 23,218,307 | |
| 290,496,602 | |||
| Air Freight & Logistics - 0.4% | |||
| C.H. Robinson Worldwide, Inc. | 37,588 | 3,347,211 | |
| Expeditors International of Washington, Inc. | 45,280 | 5,651,850 | |
| FedEx Corp. | 72,579 | 21,937,003 | |
| United Parcel Service, Inc. Class B | 233,839 | 30,485,590 | |
| 61,421,654 | |||
| Building Products - 0.5% | |||
| A.O. Smith Corp. | 38,775 | 3,297,426 | |
| Allegion PLC | 28,030 | 3,834,784 | |
| Builders FirstSource, Inc. (a) | 39,133 | 6,549,690 | |
| Carrier Global Corp. | 268,638 | 18,296,934 | |
| Johnson Controls International PLC | 215,973 | 15,450,708 | |
| Masco Corp. | 70,606 | 5,496,677 | |
| Trane Technologies PLC | 72,564 | 24,256,694 | |
| 77,182,913 | |||
| Commercial Services & Supplies - 0.6% | |||
| Cintas Corp. | 27,648 | 21,121,413 | |
| Copart, Inc. | 280,500 | 14,678,565 | |
| Republic Services, Inc. | 65,620 | 12,751,278 | |
| Rollins, Inc. | 90,041 | 4,313,864 | |
| Veralto Corp. | 70,435 | 7,505,554 | |
| Waste Management, Inc. | 117,011 | 23,713,449 | |
| 84,084,123 | |||
| Construction & Engineering - 0.1% | |||
| Quanta Services, Inc. | 46,932 | 12,454,814 | |
| Electrical Equipment - 0.7% | |||
| AMETEK, Inc. | 74,201 | 12,872,389 | |
| Eaton Corp. PLC | 128,170 | 39,064,934 | |
| Emerson Electric Co. | 183,405 | 21,478,560 | |
| GE Vernova LLC | 87,871 | 15,662,127 | |
| Generac Holdings, Inc. (a) | 19,464 | 3,030,156 | |
| Hubbell, Inc. | 17,211 | 6,809,532 | |
| Rockwell Automation, Inc. | 36,549 | 10,184,379 | |
| 109,102,077 | |||
| Ground Transportation - 1.0% | |||
| CSX Corp. | 626,729 | 21,998,188 | |
| J.B. Hunt Transport Services, Inc. | 26,138 | 4,525,795 | |
| Norfolk Southern Corp. | 72,428 | 18,075,132 | |
| Old Dominion Freight Lines, Inc. | 57,124 | 12,006,322 | |
| Uber Technologies, Inc. (a) | 669,892 | 43,187,937 | |
| Union Pacific Corp. | 195,601 | 48,260,635 | |
| 148,054,009 | |||
| Industrial Conglomerates - 0.4% | |||
| 3M Co. | 177,407 | 22,628,263 | |
| Honeywell International, Inc. | 208,765 | 42,744,634 | |
| 65,372,897 | |||
| Machinery - 1.6% | |||
| Caterpillar, Inc. | 156,788 | 54,280,006 | |
| Cummins, Inc. | 43,852 | 12,796,014 | |
| Deere & Co. | 82,994 | 30,872,108 | |
| Dover Corp. | 44,057 | 8,117,943 | |
| Fortive Corp. | 112,857 | 8,108,775 | |
| IDEX Corp. | 24,269 | 5,059,601 | |
| Illinois Tool Works, Inc. | 87,053 | 21,526,466 | |
| Ingersoll Rand, Inc. | 129,339 | 12,985,636 | |
| Nordson Corp. | 17,419 | 4,360,498 | |
| Otis Worldwide Corp. | 129,624 | 12,249,468 | |
| PACCAR, Inc. | 168,038 | 16,578,629 | |
| Parker Hannifin Corp. | 41,209 | 23,124,842 | |
| Pentair PLC | 53,232 | 4,677,496 | |
| Snap-On, Inc. | 16,902 | 4,851,381 | |
| Stanley Black & Decker, Inc. | 49,341 | 5,211,396 | |
| Westinghouse Air Brake Tech Co. | 56,545 | 9,112,227 | |
| Xylem, Inc. | 77,725 | 10,376,288 | |
| 244,288,774 | |||
| Passenger Airlines - 0.1% | |||
| American Airlines Group, Inc. (a)(b) | 209,983 | 2,234,219 | |
| Delta Air Lines, Inc. | 206,909 | 8,901,225 | |
| Southwest Airlines Co. | 191,902 | 5,169,840 | |
| United Airlines Holdings, Inc. (a) | 105,431 | 4,788,676 | |
| 21,093,960 | |||
| Professional Services - 0.7% | |||
| Automatic Data Processing, Inc. | 131,219 | 34,460,734 | |
| Broadridge Financial Solutions, Inc. | 37,891 | 8,108,674 | |
| Dayforce, Inc. (a)(b) | 50,536 | 2,995,774 | |
| Equifax, Inc. | 39,632 | 11,071,992 | |
| Jacobs Solutions, Inc. | 40,145 | 5,875,221 | |
| Leidos Holdings, Inc. | 43,348 | 6,259,451 | |
| Paychex, Inc. | 102,716 | 13,149,702 | |
| Paycom Software, Inc. | 15,387 | 2,566,398 | |
| Verisk Analytics, Inc. | 45,744 | 11,973,492 | |
| 96,461,438 | |||
| Trading Companies & Distributors - 0.3% | |||
| Fastenal Co. | 183,549 | 12,986,092 | |
| United Rentals, Inc. | 21,349 | 16,163,328 | |
| W.W. Grainger, Inc. | 14,018 | 13,692,923 | |
| 42,842,343 | |||
TOTAL INDUSTRIALS | 1,252,855,604 | ||
| INFORMATION TECHNOLOGY - 31.3% | |||
| Communications Equipment - 0.8% | |||
| Arista Networks, Inc. (a) | 81,374 | 28,200,160 | |
| Cisco Systems, Inc. | 1,298,133 | 62,894,544 | |
| F5, Inc. (a) | 18,815 | 3,831,487 | |
| Juniper Networks, Inc. | 104,150 | 3,925,414 | |
| Motorola Solutions, Inc. | 53,468 | 21,329,455 | |
| 120,181,060 | |||
| Electronic Equipment, Instruments & Components - 0.6% | |||
| Amphenol Corp. Class A | 385,091 | 24,745,948 | |
| CDW Corp. | 43,087 | 9,397,706 | |
| Corning, Inc. | 247,168 | 9,889,192 | |
| Jabil, Inc. | 38,665 | 4,356,386 | |
| Keysight Technologies, Inc. (a) | 55,964 | 7,810,895 | |
| TE Connectivity Ltd. | 98,171 | 15,150,730 | |
| Teledyne Technologies, Inc. (a) | 15,203 | 6,413,538 | |
| Trimble, Inc. (a) | 78,294 | 4,270,155 | |
| Zebra Technologies Corp. Class A (a) | 16,485 | 5,789,367 | |
| 87,823,917 | |||
| IT Services - 1.1% | |||
| Accenture PLC Class A | 201,568 | 66,642,412 | |
| Akamai Technologies, Inc. (a) | 48,836 | 4,799,602 | |
| Cognizant Technology Solutions Corp. Class A | 159,402 | 12,063,543 | |
| EPAM Systems, Inc. (a) | 18,588 | 3,998,836 | |
| Gartner, Inc. (a) | 24,887 | 12,473,116 | |
| GoDaddy, Inc. (a) | 45,182 | 6,571,722 | |
| IBM Corp. | 294,499 | 56,585,038 | |
| VeriSign, Inc. (a) | 27,781 | 5,195,325 | |
| 168,329,594 | |||
| Semiconductors & Semiconductor Equipment - 11.3% | |||
| Advanced Micro Devices, Inc. (a) | 518,184 | 74,867,224 | |
| Analog Devices, Inc. | 158,985 | 36,785,949 | |
| Applied Materials, Inc. | 266,379 | 56,525,624 | |
| Broadcom, Inc. | 1,396,562 | 224,399,582 | |
| Enphase Energy, Inc. (a) | 43,623 | 5,021,444 | |
| First Solar, Inc. (a) | 34,317 | 7,412,129 | |
| Intel Corp. | 1,364,779 | 41,953,306 | |
| KLA Corp. | 43,164 | 35,526,993 | |
| Lam Research Corp. | 41,914 | 38,612,853 | |
| Microchip Technology, Inc. | 173,249 | 15,381,046 | |
| Micron Technology, Inc. | 355,017 | 38,987,967 | |
| Monolithic Power Systems, Inc. | 15,604 | 13,467,656 | |
| NVIDIA Corp. | 7,886,104 | 922,831,890 | |
| NXP Semiconductors NV | 81,971 | 21,571,488 | |
| ON Semiconductor Corp. (a) | 137,934 | 10,793,336 | |
| Qorvo, Inc. (a) | 30,953 | 3,708,169 | |
| Qualcomm, Inc. | 358,424 | 64,856,823 | |
| Skyworks Solutions, Inc. | 51,440 | 5,844,613 | |
| Teradyne, Inc. | 50,049 | 6,564,427 | |
| Texas Instruments, Inc. | 291,894 | 59,490,916 | |
| 1,684,603,435 | |||
| Software - 10.3% | |||
| Adobe, Inc. (a) | 143,627 | 79,231,835 | |
| ANSYS, Inc. (a) | 27,988 | 8,777,876 | |
| Autodesk, Inc. (a) | 68,581 | 16,975,169 | |
| Cadence Design Systems, Inc. (a) | 87,245 | 23,351,997 | |
| Crowdstrike Holdings, Inc. (a) | 73,952 | 17,153,906 | |
| Fair Isaac Corp. (a) | 7,922 | 12,675,200 | |
| Fortinet, Inc. (a) | 203,284 | 11,798,603 | |
| Gen Digital, Inc. | 176,659 | 4,591,367 | |
| Intuit, Inc. | 89,760 | 58,106,136 | |
| Microsoft Corp. | 2,382,758 | 996,826,809 | |
| Oracle Corp. | 511,074 | 71,269,269 | |
| Palo Alto Networks, Inc. (a) | 103,584 | 33,636,832 | |
| PTC, Inc. (a) | 38,389 | 6,827,484 | |
| Roper Technologies, Inc. | 34,317 | 18,694,186 | |
| Salesforce, Inc. | 311,379 | 80,584,885 | |
| ServiceNow, Inc. (a) | 65,722 | 53,523,340 | |
| Synopsys, Inc. (a) | 48,905 | 27,304,640 | |
| Tyler Technologies, Inc. (a) | 13,611 | 7,732,545 | |
| 1,529,062,079 | |||
| Technology Hardware, Storage & Peripherals - 7.2% | |||
| Apple, Inc. | 4,621,068 | 1,026,246,774 | |
| Hewlett Packard Enterprise Co. | 416,780 | 8,298,090 | |
| HP, Inc. | 276,689 | 9,985,706 | |
| NetApp, Inc. | 66,159 | 8,400,870 | |
| Seagate Technology Holdings PLC | 62,610 | 6,396,864 | |
| Super Micro Computer, Inc. (a) | 16,145 | 11,328,139 | |
| Western Digital Corp. (a) | 104,686 | 7,019,196 | |
| 1,077,675,639 | |||
TOTAL INFORMATION TECHNOLOGY | 4,667,675,724 | ||
| MATERIALS - 2.2% | |||
| Chemicals - 1.5% | |||
| Air Products & Chemicals, Inc. | 71,272 | 18,805,117 | |
| Albemarle Corp. (b) | 37,724 | 3,533,607 | |
| Celanese Corp. | 32,216 | 4,547,288 | |
| CF Industries Holdings, Inc. | 58,602 | 4,476,607 | |
| Corteva, Inc. | 223,447 | 12,535,377 | |
| Dow, Inc. | 225,444 | 12,279,935 | |
| DuPont de Nemours, Inc. | 134,041 | 11,219,232 | |
| Eastman Chemical Co. | 37,717 | 3,897,298 | |
| Ecolab, Inc. | 81,476 | 18,795,698 | |
| FMC Corp. | 39,948 | 2,331,365 | |
| International Flavors & Fragrances, Inc. | 81,867 | 8,144,129 | |
| Linde PLC | 154,112 | 69,889,792 | |
| LyondellBasell Industries NV Class A | 82,466 | 8,202,068 | |
| PPG Industries, Inc. | 75,455 | 9,581,276 | |
| Sherwin-Williams Co. | 74,784 | 26,234,227 | |
| The Mosaic Co. | 103,204 | 3,072,383 | |
| 217,545,399 | |||
| Construction Materials - 0.1% | |||
| Martin Marietta Materials, Inc. | 19,761 | 11,725,189 | |
| Vulcan Materials Co. | 42,397 | 11,638,400 | |
| 23,363,589 | |||
| Containers & Packaging - 0.2% | |||
| Amcor PLC | 463,402 | 4,879,623 | |
| Avery Dennison Corp. | 25,822 | 5,598,984 | |
| Ball Corp. | 99,508 | 6,351,596 | |
| International Paper Co. | 111,363 | 5,176,152 | |
| Packaging Corp. of America | 28,578 | 5,711,885 | |
| Smurfit Westrock PLC | 166,477 | 7,464,829 | |
| 35,183,069 | |||
| Metals & Mining - 0.4% | |||
| Freeport-McMoRan, Inc. | 460,538 | 20,913,031 | |
| Newmont Corp. | 369,698 | 18,141,081 | |
| Nucor Corp. | 76,865 | 12,524,383 | |
| Steel Dynamics, Inc. | 47,351 | 6,308,100 | |
| 57,886,595 | |||
TOTAL MATERIALS | 333,978,652 | ||
| REAL ESTATE - 2.3% | |||
| Equity Real Estate Investment Trusts (REITs) - 2.1% | |||
| Alexandria Real Estate Equities, Inc. | 50,461 | 5,918,571 | |
| American Tower Corp. | 149,712 | 32,996,525 | |
| AvalonBay Communities, Inc. | 45,518 | 9,327,549 | |
| BXP, Inc. | 46,386 | 3,307,786 | |
| Camden Property Trust (SBI) | 34,155 | 3,782,666 | |
| Crown Castle, Inc. | 139,311 | 15,335,355 | |
| Digital Realty Trust, Inc. | 104,034 | 15,552,043 | |
| Equinix, Inc. | 30,427 | 24,044,632 | |
| Equity Residential (SBI) | 110,556 | 7,698,014 | |
| Essex Property Trust, Inc. | 20,584 | 5,729,762 | |
| Extra Space Storage, Inc. | 67,878 | 10,834,686 | |
| Federal Realty Investment Trust (SBI) | 23,894 | 2,667,765 | |
| Healthpeak Properties, Inc. | 225,644 | 4,923,552 | |
| Host Hotels & Resorts, Inc. | 226,034 | 3,957,855 | |
| Invitation Homes, Inc. | 184,576 | 6,509,996 | |
| Iron Mountain, Inc. | 93,977 | 9,638,281 | |
| Kimco Realty Corp. | 213,959 | 4,649,329 | |
| Mid-America Apartment Communities, Inc. | 37,454 | 5,234,946 | |
| Prologis, Inc. | 296,821 | 37,414,287 | |
| Public Storage Operating Co. | 50,702 | 15,003,736 | |
| Realty Income Corp. | 279,162 | 16,032,274 | |
| Regency Centers Corp. | 52,785 | 3,554,542 | |
| SBA Communications Corp. Class A | 34,449 | 7,562,933 | |
| Simon Property Group, Inc. | 104,493 | 16,033,406 | |
| UDR, Inc. | 97,126 | 3,891,839 | |
| Ventas, Inc. | 129,770 | 7,064,679 | |
| VICI Properties, Inc. | 334,423 | 10,454,063 | |
| Welltower, Inc. | 191,680 | 21,324,400 | |
| Weyerhaeuser Co. | 233,719 | 7,422,915 | |
| 317,868,387 | |||
| Real Estate Management & Development - 0.2% | |||
| CBRE Group, Inc. (a) | 96,695 | 10,898,493 | |
| CoStar Group, Inc. (a) | 130,918 | 10,214,222 | |
| 21,112,715 | |||
TOTAL REAL ESTATE | 338,981,102 | ||
| UTILITIES - 2.4% | |||
| Electric Utilities - 1.6% | |||
| Alliant Energy Corp. | 82,191 | 4,574,751 | |
| American Electric Power Co., Inc. | 168,987 | 16,581,004 | |
| Constellation Energy Corp. | 101,063 | 19,181,757 | |
| Duke Energy Corp. | 247,412 | 27,034,709 | |
| Edison International | 123,347 | 9,868,993 | |
| Entergy Corp. | 68,452 | 7,938,378 | |
| Evergy, Inc. | 73,715 | 4,275,470 | |
| Eversource Energy | 112,940 | 7,330,935 | |
| Exelon Corp. | 320,611 | 11,926,729 | |
| FirstEnergy Corp. | 166,030 | 6,958,317 | |
| NextEra Energy, Inc. | 658,680 | 50,316,565 | |
| NRG Energy, Inc. | 66,836 | 5,024,062 | |
| PG&E Corp. | 685,119 | 12,503,422 | |
| Pinnacle West Capital Corp. | 36,462 | 3,120,783 | |
| PPL Corp. | 236,482 | 7,028,245 | |
| Southern Co. | 350,533 | 29,276,516 | |
| Xcel Energy, Inc. | 178,144 | 10,382,232 | |
| 233,322,868 | |||
| Gas Utilities - 0.0% | |||
| Atmos Energy Corp. | 48,361 | 6,184,405 | |
| Independent Power and Renewable Electricity Producers - 0.1% | |||
| The AES Corp. | 227,880 | 4,053,985 | |
| Vistra Corp. | 104,710 | 8,295,126 | |
| 12,349,111 | |||
| Multi-Utilities - 0.6% | |||
| Ameren Corp. | 85,498 | 6,777,426 | |
| CenterPoint Energy, Inc. | 205,099 | 5,691,497 | |
| CMS Energy Corp. | 95,744 | 6,204,211 | |
| Consolidated Edison, Inc. | 110,865 | 10,811,555 | |
| Dominion Energy, Inc. | 268,733 | 14,366,466 | |
| DTE Energy Co. | 66,345 | 7,996,563 | |
| NiSource, Inc. | 143,715 | 4,491,094 | |
| Public Service Enterprise Group, Inc. | 159,675 | 12,737,275 | |
| Sempra | 202,882 | 16,242,733 | |
| WEC Energy Group, Inc. | 101,258 | 8,714,263 | |
| 94,033,083 | |||
| Water Utilities - 0.1% | |||
| American Water Works Co., Inc. | 62,460 | 8,891,806 | |
TOTAL UTILITIES | 354,781,273 | ||
| TOTAL COMMON STOCKS (Cost $6,924,675,140) | 14,868,762,685 | ||
| U.S. Treasury Obligations - 0.0% | |||
Principal Amount (c) | Value ($) | ||
U.S. Treasury Bills, yield at date of purchase 5.31% 8/22/24 (d) (Cost $2,264,056) | 2,271,000 | 2,264,012 | |
| Money Market Funds - 0.3% | |||
| Shares | Value ($) | ||
| Fidelity Cash Central Fund 5.39% (e) | 32,960,786 | 32,967,378 | |
| Fidelity Securities Lending Cash Central Fund 5.39% (e)(f) | 10,592,915 | 10,593,974 | |
| TOTAL MONEY MARKET FUNDS (Cost $43,561,352) | 43,561,352 | ||
| TOTAL INVESTMENT IN SECURITIES - 100.0% (Cost $6,970,500,548) | 14,914,588,049 |
NET OTHER ASSETS (LIABILITIES) - 0.0% | (3,536,807) |
| NET ASSETS - 100.0% | 14,911,051,242 |
| Futures Contracts | |||||
Number of contracts | Expiration Date | Notional Amount ($) | Value ($) | Unrealized Appreciation/ (Depreciation) ($) | |
| Purchased | |||||
| Equity Index Contracts | |||||
| CME E-mini S&P 500 Index Contracts (United States) | 158 | Sep 2024 | 43,908,200 | 521,065 | 521,065 |
| The notional amount of futures purchased as a percentage of Net Assets is 0.3% | |||||
| (a) | Non-income producing |
| (b) | Security or a portion of the security is on loan at period end. |
| (c) | Amount is stated in United States dollars unless otherwise noted. |
| (d) | Security or a portion of the security was pledged to cover margin requirements for futures contracts. At period end, the value of securities pledged amounted to $1,943,002. |
| (e) | Affiliated fund that is generally available only to investment companies and other accounts managed by Fidelity Investments. The rate quoted is the annualized seven-day yield of the fund at period end. A complete unaudited listing of the fund's holdings as of its most recent quarter end is available upon request. In addition, each Fidelity Central Fund's financial statements, which are not covered by the Fund's Report of Independent Registered Public Accounting Firm, are available on the SEC's website or upon request. |
| (f) | Investment made with cash collateral received from securities on loan. |
| Affiliate | Value, beginning of period ($) | Purchases ($) | Sales Proceeds ($) | Dividend Income ($) | Realized Gain (loss) ($) | Change in Unrealized appreciation (depreciation) ($) | Value, end of period ($) | % ownership, end of period |
| Fidelity Cash Central Fund 5.39% | 5,681,263 | 3,101,806,385 | 3,074,522,099 | 1,993,582 | 1,829 | - | 32,967,378 | 0.1% |
| Fidelity Securities Lending Cash Central Fund 5.39% | 11,223,374 | 192,573,119 | 193,202,519 | 100,841 | - | - | 10,593,974 | 0.0% |
| Total | 16,904,637 | 3,294,379,504 | 3,267,724,618 | 2,094,423 | 1,829 | - | 43,561,352 | |
| Valuation Inputs at Reporting Date: | ||||
| Description | Total ($) | Level 1 ($) | Level 2 ($) | Level 3 ($) |
Investments in Securities: | ||||
| Equities: | ||||
Communication Services | 1,316,080,110 | 1,316,080,110 | - | - |
Consumer Discretionary | 1,486,958,558 | 1,486,958,558 | - | - |
Consumer Staples | 862,729,152 | 862,729,152 | - | - |
Energy | 548,983,647 | 548,983,647 | - | - |
Financials | 1,940,588,495 | 1,940,588,495 | - | - |
Health Care | 1,765,150,368 | 1,765,150,368 | - | - |
Industrials | 1,252,855,604 | 1,252,855,604 | - | - |
Information Technology | 4,667,675,724 | 4,667,675,724 | - | - |
Materials | 333,978,652 | 333,978,652 | - | - |
Real Estate | 338,981,102 | 338,981,102 | - | - |
Utilities | 354,781,273 | 354,781,273 | - | - |
| U.S. Government and Government Agency Obligations | 2,264,012 | - | 2,264,012 | - |
| Money Market Funds | 43,561,352 | 43,561,352 | - | - |
| Total Investments in Securities: | 14,914,588,049 | 14,912,324,037 | 2,264,012 | - |
Derivative Instruments: Assets | ||||
Futures Contracts | 521,065 | 521,065 | - | - |
| Total Assets | 521,065 | 521,065 | - | - |
| Total Derivative Instruments: | 521,065 | 521,065 | - | - |
Primary Risk Exposure / Derivative Type | Value | |
| Asset ($) | Liability ($) | |
| Equity Risk | ||
Futures Contracts (a) | 521,065 | 0 |
| Total Equity Risk | 521,065 | 0 |
| Total Value of Derivatives | 521,065 | 0 |
| Statement of Assets and Liabilities | ||||
As of July 31, 2024 | ||||
| Assets | ||||
| Investment in securities, at value (including securities loaned of $10,721,461) - See accompanying schedule: | ||||
Unaffiliated issuers (cost $6,926,939,196) | $ | 14,871,026,697 | ||
Fidelity Central Funds (cost $43,561,352) | 43,561,352 | |||
| Total Investment in Securities (cost $6,970,500,548) | $ | 14,914,588,049 | ||
| Cash | 9,998 | |||
| Receivable for fund shares sold | 6,460,763 | |||
| Dividends receivable | 8,742,526 | |||
| Distributions receivable from Fidelity Central Funds | 127,404 | |||
| Receivable for daily variation margin on futures contracts | 635,064 | |||
| Prepaid expenses | 3,199 | |||
| Receivable from investment adviser for expense reductions | 28,565 | |||
| Other receivables | 49,986 | |||
Total assets | 14,930,645,554 | |||
| Liabilities | ||||
| Payable for investments purchased | $ | 10,058 | ||
| Payable for fund shares redeemed | 8,613,525 | |||
| Accrued management fee | 182,703 | |||
| Other payables and accrued expenses | 163,876 | |||
| Collateral on securities loaned | 10,624,150 | |||
| Total liabilities | 19,594,312 | |||
| Net Assets | $ | 14,911,051,242 | ||
| Net Assets consist of: | ||||
| Paid in capital | $ | 6,909,366,756 | ||
| Total accumulated earnings (loss) | 8,001,684,486 | |||
| Net Assets | $ | 14,911,051,242 | ||
Net Asset Value, offering price and redemption price per share ($14,911,051,242 ÷ 647,727,544 shares) | $ | 23.02 | ||
| Statement of Operations | ||||
| Year ended July 31, 2024 | ||||
| Investment Income | ||||
| Dividends | $ | 181,883,924 | ||
| Interest | 99,710 | |||
| Income from Fidelity Central Funds (including $100,841 from security lending) | 2,094,423 | |||
| Total income | 184,078,057 | |||
| Expenses | ||||
| Management fee | $ | 1,842,847 | ||
| Custodian fees and expenses | 184,806 | |||
| Independent trustees' fees and expenses | 34,925 | |||
| Registration fees | 74,238 | |||
| Audit fees | 56,814 | |||
| Legal | 18,657 | |||
| Interest | 312,358 | |||
| Miscellaneous | 51,484 | |||
| Total expenses before reductions | 2,576,129 | |||
| Expense reductions | (384,432) | |||
| Total expenses after reductions | 2,191,697 | |||
| Net Investment income (loss) | 181,886,360 | |||
| Realized and Unrealized Gain (Loss) | ||||
| Net realized gain (loss) on: | ||||
| Investment Securities: | ||||
| Unaffiliated issuers | 62,037,632 | |||
| Fidelity Central Funds | 1,829 | |||
| Futures contracts | 7,496,374 | |||
| Total net realized gain (loss) | 69,535,835 | |||
| Change in net unrealized appreciation (depreciation) on: | ||||
| Investment Securities: | ||||
| Unaffiliated issuers | 2,364,984,019 | |||
| Futures contracts | (256,764) | |||
| Total change in net unrealized appreciation (depreciation) | 2,364,727,255 | |||
| Net gain (loss) | 2,434,263,090 | |||
| Net increase (decrease) in net assets resulting from operations | $ | 2,616,149,450 | ||
| Statement of Changes in Net Assets | ||||
Year ended July 31, 2024 | Year ended July 31, 2023 | |||
| Increase (Decrease) in Net Assets | ||||
| Operations | ||||
| Net investment income (loss) | $ | 181,886,360 | $ | 176,131,497 |
| Net realized gain (loss) | 69,535,835 | 1,099,626,174 | ||
| Change in net unrealized appreciation (depreciation) | 2,364,727,255 | (125,052,184) | ||
| Net increase (decrease) in net assets resulting from operations | 2,616,149,450 | 1,150,705,487 | ||
| Distributions to shareholders | (724,077,694) | (1,089,852,286) | ||
| Share transactions | ||||
| Proceeds from sales of shares | 9,140,804,990 | 10,289,960,268 | ||
| Reinvestment of distributions | 711,398,422 | 1,074,867,889 | ||
| Cost of shares redeemed | (7,003,466,492) | (13,382,025,198) | ||
Net increase (decrease) in net assets resulting from share transactions | 2,848,736,920 | (2,017,197,041) | ||
| Total increase (decrease) in net assets | 4,740,808,676 | (1,956,343,840) | ||
| Net Assets | ||||
| Beginning of period | 10,170,242,566 | 12,126,586,406 | ||
| End of period | $ | 14,911,051,242 | $ | 10,170,242,566 |
| Other Information | ||||
| Shares | ||||
| Sold | 452,527,025 | 566,651,200 | ||
| Issued in reinvestment of distributions | 38,357,677 | 59,907,420 | ||
| Redeemed | (344,834,208) | (735,080,816) | ||
| Net increase (decrease) | 146,050,494 | (108,522,196) | ||
Fidelity® SAI U.S. Large Cap Index Fund |
| Years ended July 31, | 2024 | 2023 | 2022 | 2021 | 2020 | |||||
Selected Per-Share Data | ||||||||||
| Net asset value, beginning of period | $ | 20.27 | $ | 19.87 | $ | 23.16 | $ | 17.68 | $ | 16.09 |
| Income from Investment Operations | ||||||||||
Net investment income (loss) A,B | .30 | .30 | .30 | .31 | .32 | |||||
| Net realized and unrealized gain (loss) | 3.84 | 1.99 | (1.23) | 5.94 | 1.56 | |||||
| Total from investment operations | 4.14 | 2.29 | (.93) | 6.25 | 1.88 | |||||
| Distributions from net investment income | (.32) | (.33) | (.34) | (.35) | (.29) | |||||
| Distributions from net realized gain | (1.07) | (1.56) | (2.02) | (.42) | - | |||||
| Total distributions | (1.39) | (1.89) | (2.36) | (.77) | (.29) | |||||
| Net asset value, end of period | $ | 23.02 | $ | 20.27 | $ | 19.87 | $ | 23.16 | $ | 17.68 |
Total Return C | 22.14 % | 12.98% | (4.68)% | 36.43% | 11.84% | |||||
Ratios to Average Net Assets B,D,E | ||||||||||
| Expenses before reductions | .02% | .03% | .02% | .02% | .02% | |||||
| Expenses net of fee waivers, if any | .02 % | .03% | .02% | .02% | .02% | |||||
| Expenses net of all reductions | .02% | .03% | .02% | .02% | .02% | |||||
| Net investment income (loss) | 1.48% | 1.66% | 1.43% | 1.52% | 1.97% | |||||
| Supplemental Data | ||||||||||
| Net assets, end of period (000 omitted) | $ | 14,911,051 | $ | 10,170,243 | $ | 12,126,586 | $ | 13,967,770 | $ | 15,406,444 |
Portfolio turnover rate F | 40 % | 75% | 75% | 86% | 80% |
| Fidelity Central Fund | Investment Manager | Investment Objective | Investment Practices | Expense RatioA |
| Fidelity Money Market Central Funds | Fidelity Management & Research Company LLC (FMR) | Each fund seeks to obtain a high level of current income consistent with the preservation of capital and liquidity. | Short-term Investments | Less than .005% |
| Gross unrealized appreciation | $8,047,846,818 |
| Gross unrealized depreciation | (197,848,580) |
| Net unrealized appreciation (depreciation) | $7,849,998,238 |
| Tax Cost | $7,064,589,811 |
| Undistributed ordinary income | $171,768,768 |
| Net unrealized appreciation (depreciation) on securities and other investments | $7,849,998,238 |
| July 31, 2024 | July 31, 2023 | |
| Ordinary Income | $167,590,242 | $189,184,878 |
| Long-term Capital Gains | 556,487,452 | 900,667,408 |
| Total | $724,077,694 | $1,089,852,286 |
| Equity Risk | Equity risk relates to the fluctuations in the value of financial instruments as a result of changes in market prices (other than those arising from interest rate risk or foreign exchange risk), whether caused by factors specific to an individual investment, its issuer, or all factors affecting all instruments traded in a market or market segment. |
| Purchases ($) | Sales ($) | |
| Fidelity SAI U.S. Large Cap Index Fund | 7,248,348,623 | 4,935,100,069 |
| Borrower or Lender | Average Loan Balance ($) | Weighted Average Interest Rate | Interest Expense ($) | |
| Fidelity SAI U.S. Large Cap Index Fund | Borrower | 59,384,647 | 5.57% | 312,358 |
| Amount ($) | |
| Fidelity SAI U.S. Large Cap Index Fund | 20,067 |
| Total Security Lending Fees Paid to NFS ($) | Security Lending Income From Securities Loaned to NFS ($) | Value of Securities Loaned to NFS at Period End ($) | |
| Fidelity SAI U.S. Large Cap Index Fund | 9,550 | - | - |
| Strategic Advisers Fidelity U.S. Total Stock Fund | |
| Fidelity SAI U.S. Large Cap Index Fund | 22% |
| Fund | % of shares held |
| Fidelity SAI U.S. Large Cap Index Fund | 31% |
| A special meeting of shareholders was held on October 18, 2023. The results of votes taken among shareholders on the proposal before them are reported below. Each vote reported represents one dollar of net asset value held on the record date for the meeting. | ||
| Proposal 1 | ||
| To elect a Board of Trustees. | ||
# of Votes | % of Votes | |
| Abigail P. Johnson | ||
| Affirmative | 378,729,502,260.01 | 97.58 |
| Withheld | 9,407,876,478.96 | 2.42 |
| TOTAL | 388,137,378,738.97 | 100.00 |
| Jennifer Toolin McAuliffe | ||
| Affirmative | 378,454,868,010.95 | 97.51 |
| Withheld | 9,682,510,728.02 | 2.49 |
| TOTAL | 388,137,378,738.97 | 100.00 |
| Christine J. Thompson | ||
| Affirmative | 378,837,121,274.52 | 97.60 |
| Withheld | 9,300,257,464.45 | 2.40 |
| TOTAL | 388,137,378,738.97 | 100.00 |
| Elizabeth S. Acton | ||
| Affirmative | 378,262,110,794.85 | 97.46 |
| Withheld | 9,875,267,944.12 | 2.54 |
| TOTAL | 388,137,378,738.97 | 100.00 |
| Laura M. Bishop | ||
| Affirmative | 380,482,113,171.06 | 98.03 |
| Withheld | 7,655,265,567.91 | 1.97 |
| TOTAL | 388,137,378,738.97 | 100.00 |
| Ann E. Dunwoody | ||
| Affirmative | 380,016,034,008.12 | 97.91 |
| Withheld | 8,121,344,730.85 | 2.09 |
| TOTAL | 388,137,378,738.97 | 100.00 |
| John Engler | ||
| Affirmative | 379,432,488,394.20 | 97.76 |
| Withheld | 8,704,890,344.77 | 2.24 |
| TOTAL | 388,137,378,738.97 | 100.00 |
| Robert F. Gartland | ||
| Affirmative | 378,741,819,600.60 | 97.58 |
| Withheld | 9,395,559,138.37 | 2.42 |
| TOTAL | 388,137,378,738.97 | 100.00 |
| Robert W. Helm | ||
| Affirmative | 380,389,324,755.07 | 98.00 |
| Withheld | 7,748,053,983.90 | 2.00 |
| TOTAL | 388,137,378,738.97 | 100.00 |
| Arthur E. Johnson | ||
| Affirmative | 378,427,694,151.67 | 97.50 |
| Withheld | 9,709,684,587.30 | 2.50 |
| TOTAL | 388,137,378,738.97 | 100.00 |
| Michael E. Kenneally | ||
| Affirmative | 377,842,228,145.18 | 97.35 |
| Withheld | 10,295,150,593.79 | 2.65 |
| TOTAL | 388,137,378,738.97 | 100.00 |
| Mark A. Murray | ||
| Affirmative | 380,158,432,703.37 | 97.94 |
| Withheld | 7,978,946,035.60 | 2.06 |
| TOTAL | 388,137,378,738.97 | 100.00 |
| Carol J. Zierhoffer | ||
| Affirmative | 380,522,113,360.24 | 98.04 |
| Withheld | 7,615,265,378.73 | 1.96 |
| TOTAL | 388,137,378,738.97 | 100.00 |
| Proposal 1 reflects trust-wide proposal and voting results. | ||
 |


Contents
| Common Stocks - 99.8% | |||
| Shares | Value ($) | ||
| COMMUNICATION SERVICES - 12.0% | |||
| Interactive Media & Services - 11.4% | |||
| Alphabet, Inc. Class A | 5,404,117 | 927,022,230 | |
| Meta Platforms, Inc. Class A | 1,453,223 | 690,033,877 | |
| 1,617,056,107 | |||
| Media - 0.6% | |||
| The Trade Desk, Inc. Class A (a) | 843,335 | 75,798,950 | |
TOTAL COMMUNICATION SERVICES | 1,692,855,057 | ||
| CONSUMER DISCRETIONARY - 5.8% | |||
| Broadline Retail - 0.4% | |||
| Amazon.com, Inc. (a) | 258,721 | 48,375,653 | |
| Hotels, Restaurants & Leisure - 2.5% | |||
| Booking Holdings, Inc. | 68,179 | 253,285,667 | |
| Wingstop, Inc. | 56,854 | 21,256,574 | |
| Yum! Brands, Inc. | 547,897 | 72,777,159 | |
| 347,319,400 | |||
| Household Durables - 0.7% | |||
| Garmin Ltd. | 299,377 | 51,268,311 | |
| NVR, Inc. (a) | 6,133 | 52,789,675 | |
| 104,057,986 | |||
| Specialty Retail - 1.9% | |||
| AutoZone, Inc. (a) | 33,745 | 105,746,369 | |
| O'Reilly Automotive, Inc. (a) | 115,229 | 129,787,032 | |
| Williams-Sonoma, Inc. (b) | 251,762 | 38,942,546 | |
| 274,475,947 | |||
| Textiles, Apparel & Luxury Goods - 0.3% | |||
| Deckers Outdoor Corp. (a) | 50,291 | 46,399,985 | |
TOTAL CONSUMER DISCRETIONARY | 820,628,971 | ||
| CONSUMER STAPLES - 6.9% | |||
| Beverages - 3.6% | |||
| The Coca-Cola Co. | 7,586,752 | 506,339,828 | |
| Household Products - 2.1% | |||
| Colgate-Palmolive Co. | 1,608,645 | 159,561,498 | |
| Procter & Gamble Co. | 834,246 | 134,113,387 | |
| 293,674,885 | |||
| Tobacco - 1.2% | |||
| Altria Group, Inc. | 3,446,918 | 168,933,451 | |
TOTAL CONSUMER STAPLES | 968,948,164 | ||
| ENERGY - 0.2% | |||
| Oil, Gas & Consumable Fuels - 0.2% | |||
| Texas Pacific Land Corp. (b) | 36,482 | 30,823,642 | |
| FINANCIALS - 10.8% | |||
| Capital Markets - 0.9% | |||
| Ameriprise Financial, Inc. | 195,622 | 84,131,154 | |
| Hamilton Lane, Inc. Class A | 73,884 | 10,666,633 | |
| LPL Financial | 145,027 | 32,126,381 | |
| 126,924,168 | |||
| Financial Services - 7.6% | |||
| Equitable Holdings, Inc. | 615,716 | 26,851,375 | |
| MasterCard, Inc. Class A | 1,160,802 | 538,275,495 | |
| Visa, Inc. Class A | 1,955,130 | 519,419,387 | |
| 1,084,546,257 | |||
| Insurance - 2.3% | |||
| Arch Capital Group Ltd. (a) | 725,356 | 69,474,598 | |
| Erie Indemnity Co. Class A | 48,610 | 21,444,302 | |
| Kinsale Capital Group, Inc. (b) | 43,021 | 19,663,608 | |
| Marsh & McLennan Companies, Inc. | 958,721 | 213,382,533 | |
| 323,965,041 | |||
TOTAL FINANCIALS | 1,535,435,466 | ||
| HEALTH CARE - 15.0% | |||
| Biotechnology - 4.9% | |||
| AbbVie, Inc. | 1,098,675 | 203,606,451 | |
| Regeneron Pharmaceuticals, Inc. (a) | 201,148 | 217,076,910 | |
| United Therapeutics Corp. (a) | 91,868 | 28,781,326 | |
| Vertex Pharmaceuticals, Inc. (a) | 486,622 | 241,228,258 | |
| 690,692,945 | |||
| Health Care Equipment & Supplies - 1.0% | |||
| Edwards Lifesciences Corp. (a) | 1,147,481 | 72,348,677 | |
| IDEXX Laboratories, Inc. (a) | 162,637 | 77,434,728 | |
| 149,783,405 | |||
| Health Care Technology - 0.4% | |||
| Veeva Systems, Inc. Class A (a) | 286,547 | 54,996,966 | |
| Life Sciences Tools & Services - 0.6% | |||
| Medpace Holdings, Inc. (a) | 45,960 | 17,580,619 | |
| Mettler-Toledo International, Inc. (a) | 42,154 | 64,117,499 | |
| 81,698,118 | |||
| Pharmaceuticals - 8.1% | |||
| Johnson & Johnson | 3,516,583 | 555,092,627 | |
| Merck & Co., Inc. | 3,770,541 | 426,561,303 | |
| Zoetis, Inc. Class A | 898,320 | 161,733,533 | |
| 1,143,387,463 | |||
TOTAL HEALTH CARE | 2,120,558,897 | ||
| INDUSTRIALS - 7.0% | |||
| Building Products - 0.1% | |||
| A.O. Smith Corp. | 241,168 | 20,508,927 | |
| Commercial Services & Supplies - 0.9% | |||
| Cintas Corp. | 168,127 | 128,438,940 | |
| Machinery - 2.0% | |||
| Allison Transmission Holdings, Inc. | 176,957 | 15,676,621 | |
| Graco, Inc. | 328,801 | 27,964,525 | |
| Illinois Tool Works, Inc. | 530,468 | 131,174,127 | |
| Otis Worldwide Corp. | 794,131 | 75,045,380 | |
| Snap-On, Inc. | 103,722 | 29,771,326 | |
| 279,631,979 | |||
| Professional Services - 2.8% | |||
| Automatic Data Processing, Inc. | 799,868 | 210,061,334 | |
| Paychex, Inc. | 623,737 | 79,850,811 | |
| Paycom Software, Inc. | 94,747 | 15,802,852 | |
| Paylocity Holding Corp. (a)(b) | 85,318 | 12,803,672 | |
| Robert Half, Inc. | 206,068 | 13,227,505 | |
| Verisk Analytics, Inc. | 273,346 | 71,548,316 | |
| 403,294,490 | |||
| Trading Companies & Distributors - 1.2% | |||
| Fastenal Co. | 1,116,561 | 78,996,691 | |
| W.W. Grainger, Inc. | 86,102 | 84,105,295 | |
| 163,101,986 | |||
TOTAL INDUSTRIALS | 994,976,322 | ||
| INFORMATION TECHNOLOGY - 40.9% | |||
| Communications Equipment - 1.2% | |||
| Arista Networks, Inc. (a) | 492,625 | 170,719,194 | |
| IT Services - 0.8% | |||
| Gartner, Inc. (a) | 152,280 | 76,321,213 | |
| VeriSign, Inc. (a) | 171,085 | 31,994,606 | |
| 108,315,819 | |||
| Semiconductors & Semiconductor Equipment - 16.1% | |||
| Applied Materials, Inc. | 1,625,474 | 344,925,583 | |
| KLA Corp. | 264,252 | 217,497,894 | |
| Lam Research Corp. | 256,160 | 235,984,838 | |
| Lattice Semiconductor Corp. (a)(b) | 261,379 | 13,853,087 | |
| Microchip Technology, Inc. | 1,056,757 | 93,818,886 | |
| NVIDIA Corp. | 10,288,834 | 1,203,999,355 | |
| Qualcomm, Inc. | 951,355 | 172,147,687 | |
| 2,282,227,330 | |||
| Software - 12.8% | |||
| Adobe, Inc. (a) | 883,197 | 487,215,625 | |
| ANSYS, Inc. (a) | 170,017 | 53,322,432 | |
| Autodesk, Inc. (a) | 418,409 | 103,564,596 | |
| Cadence Design Systems, Inc. (a) | 531,738 | 142,324,993 | |
| Check Point Software Technologies Ltd. (a) | 179,280 | 32,888,916 | |
| CommVault Systems, Inc. (a) | 84,890 | 12,975,437 | |
| Dolby Laboratories, Inc. Class A | 114,653 | 9,030,070 | |
| Fair Isaac Corp. (a) | 48,796 | 78,073,600 | |
| Fortinet, Inc. (a) | 1,245,660 | 72,298,106 | |
| Manhattan Associates, Inc. (a) | 120,322 | 30,727,832 | |
| Microsoft Corp. | 1,402,271 | 586,640,073 | |
| Palo Alto Networks, Inc. (a) | 616,052 | 200,050,566 | |
| Qualys, Inc. (a) | 72,148 | 10,760,153 | |
| 1,819,872,399 | |||
| Technology Hardware, Storage & Peripherals - 10.0% | |||
| Apple, Inc. | 6,172,591 | 1,370,809,007 | |
| NetApp, Inc. | 402,336 | 51,088,625 | |
| 1,421,897,632 | |||
TOTAL INFORMATION TECHNOLOGY | 5,803,032,374 | ||
| MATERIALS - 0.1% | |||
| Metals & Mining - 0.1% | |||
| Royal Gold, Inc. (b) | 130,491 | 18,023,417 | |
| REAL ESTATE - 1.1% | |||
| Equity Real Estate Investment Trusts (REITs) - 1.1% | |||
| Iron Mountain, Inc. | 573,249 | 58,792,417 | |
| Simon Property Group, Inc. | 638,371 | 97,951,646 | |
| 156,744,063 | |||
| TOTAL COMMON STOCKS (Cost $8,921,909,475) | 14,142,026,373 | ||
| U.S. Treasury Obligations - 0.0% | |||
Principal Amount (c) | Value ($) | ||
U.S. Treasury Bills, yield at date of purchase 5.31% 8/22/24 (d) (Cost $1,791,505) | 1,797,000 | 1,791,470 | |
| Money Market Funds - 0.5% | |||
| Shares | Value ($) | ||
| Fidelity Cash Central Fund 5.39% (e) | 27,065,482 | 27,070,895 | |
| Fidelity Securities Lending Cash Central Fund 5.39% (e)(f) | 42,157,763 | 42,161,979 | |
| TOTAL MONEY MARKET FUNDS (Cost $69,232,874) | 69,232,874 | ||
| TOTAL INVESTMENT IN SECURITIES - 100.3% (Cost $8,992,933,854) | 14,213,050,717 |
NET OTHER ASSETS (LIABILITIES) - (0.3)% | (36,227,619) |
| NET ASSETS - 100.0% | 14,176,823,098 |
| Futures Contracts | |||||
Number of contracts | Expiration Date | Notional Amount ($) | Value ($) | Unrealized Appreciation/ (Depreciation) ($) | |
| Purchased | |||||
| Equity Index Contracts | |||||
| CME Micro E-mini NASDAQ 100 Index Contracts (United States) | 89 | Sep 2024 | 34,719,345 | (397,136) | (397,136) |
| The notional amount of futures purchased as a percentage of Net Assets is 0.2% | |||||
| (a) | Non-income producing |
| (b) | Security or a portion of the security is on loan at period end. |
| (c) | Amount is stated in United States dollars unless otherwise noted. |
| (d) | Security or a portion of the security was pledged to cover margin requirements for futures contracts. At period end, the value of securities pledged amounted to $1,791,470. |
| (e) | Affiliated fund that is generally available only to investment companies and other accounts managed by Fidelity Investments. The rate quoted is the annualized seven-day yield of the fund at period end. A complete unaudited listing of the fund's holdings as of its most recent quarter end is available upon request. In addition, each Fidelity Central Fund's financial statements, which are not covered by the Fund's Report of Independent Registered Public Accounting Firm, are available on the SEC's website or upon request. |
| (f) | Investment made with cash collateral received from securities on loan. |
| Affiliate | Value, beginning of period ($) | Purchases ($) | Sales Proceeds ($) | Dividend Income ($) | Realized Gain (loss) ($) | Change in Unrealized appreciation (depreciation) ($) | Value, end of period ($) | % ownership, end of period |
| Fidelity Cash Central Fund 5.39% | 26,917,616 | 1,411,997,157 | 1,411,843,657 | 1,390,600 | (221) | - | 27,070,895 | 0.1% |
| Fidelity Securities Lending Cash Central Fund 5.39% | 24,275,950 | 368,306,971 | 350,420,942 | 12,027 | - | - | 42,161,979 | 0.2% |
| Total | 51,193,566 | 1,780,304,128 | 1,762,264,599 | 1,402,627 | (221) | - | 69,232,874 | |
| Valuation Inputs at Reporting Date: | ||||
| Description | Total ($) | Level 1 ($) | Level 2 ($) | Level 3 ($) |
Investments in Securities: | ||||
| Equities: | ||||
Communication Services | 1,692,855,057 | 1,692,855,057 | - | - |
Consumer Discretionary | 820,628,971 | 820,628,971 | - | - |
Consumer Staples | 968,948,164 | 968,948,164 | - | - |
Energy | 30,823,642 | 30,823,642 | - | - |
Financials | 1,535,435,466 | 1,535,435,466 | - | - |
Health Care | 2,120,558,897 | 2,120,558,897 | - | - |
Industrials | 994,976,322 | 994,976,322 | - | - |
Information Technology | 5,803,032,374 | 5,803,032,374 | - | - |
Materials | 18,023,417 | 18,023,417 | - | - |
Real Estate | 156,744,063 | 156,744,063 | - | - |
| U.S. Government and Government Agency Obligations | 1,791,470 | - | 1,791,470 | - |
| Money Market Funds | 69,232,874 | 69,232,874 | - | - |
| Total Investments in Securities: | 14,213,050,717 | 14,211,259,247 | 1,791,470 | - |
Derivative Instruments: Liabilities | ||||
Futures Contracts | (397,136) | (397,136) | - | - |
| Total Liabilities | (397,136) | (397,136) | - | - |
| Total Derivative Instruments: | (397,136) | (397,136) | - | - |
Primary Risk Exposure / Derivative Type | Value | |
| Asset ($) | Liability ($) | |
| Equity Risk | ||
Futures Contracts (a) | 0 | (397,136) |
| Total Equity Risk | 0 | (397,136) |
| Total Value of Derivatives | 0 | (397,136) |
| Statement of Assets and Liabilities | ||||
As of July 31, 2024 | ||||
| Assets | ||||
| Investment in securities, at value (including securities loaned of $42,165,756) - See accompanying schedule: | ||||
Unaffiliated issuers (cost $8,923,700,980) | $ | 14,143,817,843 | ||
Fidelity Central Funds (cost $69,232,874) | 69,232,874 | |||
| Total Investment in Securities (cost $8,992,933,854) | $ | 14,213,050,717 | ||
| Segregated cash with brokers for derivative instruments | 55,747 | |||
| Receivable for fund shares sold | 490,310 | |||
| Dividends receivable | 6,022,479 | |||
| Distributions receivable from Fidelity Central Funds | 136,848 | |||
| Receivable for daily variation margin on futures contracts | 1,012,820 | |||
| Prepaid expenses | 2,660 | |||
| Other receivables | 3,483 | |||
Total assets | 14,220,775,064 | |||
| Liabilities | ||||
| Payable for fund shares redeemed | $ | 537,832 | ||
| Accrued management fee | 1,197,242 | |||
| Other payables and accrued expenses | 68,237 | |||
| Collateral on securities loaned | 42,148,655 | |||
| Total liabilities | 43,951,966 | |||
| Net Assets | $ | 14,176,823,098 | ||
| Net Assets consist of: | ||||
| Paid in capital | $ | 7,534,119,190 | ||
| Total accumulated earnings (loss) | 6,642,703,908 | |||
| Net Assets | $ | 14,176,823,098 | ||
Net Asset Value, offering price and redemption price per share ($14,176,823,098 ÷ 617,447,213 shares) | $ | 22.96 | ||
| Statement of Operations | ||||
| Year ended July 31, 2024 | ||||
| Investment Income | ||||
| Dividends | $ | 153,452,516 | ||
| Interest | 111,779 | |||
| Income from Fidelity Central Funds (including $12,027 from security lending) | 1,402,627 | |||
| Total income | 154,966,922 | |||
| Expenses | ||||
| Management fee | $ | 13,330,347 | ||
| Custodian fees and expenses | 91,245 | |||
| Independent trustees' fees and expenses | 39,357 | |||
| Registration fees | 33,568 | |||
| Audit fees | 56,484 | |||
| Legal | 14,234 | |||
| Interest | 490,722 | |||
| Miscellaneous | 59,402 | |||
| Total expenses before reductions | 14,115,359 | |||
| Expense reductions | (59,124) | |||
| Total expenses after reductions | 14,056,235 | |||
| Net Investment income (loss) | 140,910,687 | |||
| Realized and Unrealized Gain (Loss) | ||||
| Net realized gain (loss) on: | ||||
| Investment Securities: | ||||
| Unaffiliated issuers | 1,576,689,608 | |||
| Fidelity Central Funds | (221) | |||
| Futures contracts | 6,289,763 | |||
| Total net realized gain (loss) | 1,582,979,150 | |||
| Change in net unrealized appreciation (depreciation) on: | ||||
| Investment Securities: | ||||
| Unaffiliated issuers | 1,405,138,185 | |||
| Futures contracts | (2,513,836) | |||
| Total change in net unrealized appreciation (depreciation) | 1,402,624,349 | |||
| Net gain (loss) | 2,985,603,499 | |||
| Net increase (decrease) in net assets resulting from operations | $ | 3,126,514,186 | ||
| Statement of Changes in Net Assets | ||||
Year ended July 31, 2024 | Year ended July 31, 2023 | |||
| Increase (Decrease) in Net Assets | ||||
| Operations | ||||
| Net investment income (loss) | $ | 140,910,687 | $ | 159,567,532 |
| Net realized gain (loss) | 1,582,979,150 | 72,409,466 | ||
| Change in net unrealized appreciation (depreciation) | 1,402,624,349 | 1,425,225,146 | ||
| Net increase (decrease) in net assets resulting from operations | 3,126,514,186 | 1,657,202,144 | ||
| Distributions to shareholders | (317,078,481) | (151,433,952) | ||
| Share transactions | ||||
| Proceeds from sales of shares | 1,055,257,787 | 2,689,324,785 | ||
| Reinvestment of distributions | 312,161,986 | 148,959,461 | ||
| Cost of shares redeemed | (3,073,561,656) | (2,679,474,559) | ||
Net increase (decrease) in net assets resulting from share transactions | (1,706,141,883) | 158,809,687 | ||
| Total increase (decrease) in net assets | 1,103,293,822 | 1,664,577,879 | ||
| Net Assets | ||||
| Beginning of period | 13,073,529,276 | 11,408,951,397 | ||
| End of period | $ | 14,176,823,098 | $ | 13,073,529,276 |
| Other Information | ||||
| Shares | ||||
| Sold | 53,032,086 | 165,452,298 | ||
| Issued in reinvestment of distributions | 16,907,890 | 9,395,183 | ||
| Redeemed | (151,753,582) | (167,559,660) | ||
| Net increase (decrease) | (81,813,606) | 7,287,821 | ||
Fidelity® SAI U.S. Quality Index Fund |
| Years ended July 31, | 2024 | 2023 | 2022 | 2021 | 2020 | |||||
Selected Per-Share Data | ||||||||||
| Net asset value, beginning of period | $ | 18.70 | $ | 16.49 | $ | 19.24 | $ | 15.96 | $ | 15.19 |
| Income from Investment Operations | ||||||||||
Net investment income (loss) A,B | .21 | .23 | .23 | .22 | .26 | |||||
| Net realized and unrealized gain (loss) | 4.51 | 2.20 | (1.36) | 4.58 | 2.45 | |||||
| Total from investment operations | 4.72 | 2.43 | (1.13) | 4.80 | 2.71 | |||||
| Distributions from net investment income | (.23) | (.22) | (.20) | (.28) | (.24) | |||||
| Distributions from net realized gain | (.23) | - | (1.42) | (1.25) | (1.69) | |||||
| Total distributions | (.46) | (.22) | (1.62) | (1.52) C | (1.94) C | |||||
| Net asset value, end of period | $ | 22.96 | $ | 18.70 | $ | 16.49 | $ | 19.24 | $ | 15.96 |
Total Return D | 25.86 % | 14.97% | (6.55)% | 32.64% | 20.14% | |||||
Ratios to Average Net Assets B,E,F | ||||||||||
| Expenses before reductions | .11% | .11% | .10% | .10% | .11% | |||||
| Expenses net of fee waivers, if any | .11 % | .11% | .10% | .10% | .11% | |||||
| Expenses net of all reductions | .11% | .11% | .10% | .10% | .11% | |||||
| Net investment income (loss) | 1.06% | 1.43% | 1.30% | 1.30% | 1.83% | |||||
| Supplemental Data | ||||||||||
| Net assets, end of period (000 omitted) | $ | 14,176,823 | $ | 13,073,529 | $ | 11,408,951 | $ | 10,136,091 | $ | 8,332,335 |
Portfolio turnover rate G | 53 % | 58% | 47% | 71% | 60% |
| Fidelity Central Fund | Investment Manager | Investment Objective | Investment Practices | Expense RatioA |
| Fidelity Money Market Central Funds | Fidelity Management & Research Company LLC (FMR) | Each fund seeks to obtain a high level of current income consistent with the preservation of capital and liquidity. | Short-term Investments | Less than .005% |
| Gross unrealized appreciation | $5,328,921,179 |
| Gross unrealized depreciation | (122,056,473) |
| Net unrealized appreciation (depreciation) | $5,206,864,706 |
| Tax Cost | $9,006,186,011 |
| Undistributed ordinary income | $319,615,850 |
| Undistributed long-term capital gain | $1,116,223,352 |
| Net unrealized appreciation (depreciation) on securities and other investments | $5,206,864,706 |
| July 31, 2024 | July 31, 2023 | |
| Ordinary Income | $157,333,391 | $151,433,952 |
| Long-term Capital Gains | 159,745,090 | - |
| Total | $317,078,481 | $151,433,952 |
| Equity Risk | Equity risk relates to the fluctuations in the value of financial instruments as a result of changes in market prices (other than those arising from interest rate risk or foreign exchange risk), whether caused by factors specific to an individual investment, its issuer, or all factors affecting all instruments traded in a market or market segment. |
| Purchases ($) | Sales ($) | |
| Fidelity SAI U.S. Quality Index Fund | 7,048,339,828 | 8,742,789,576 |
| Borrower or Lender | Average Loan Balance ($) | Weighted Average Interest Rate | Interest Expense ($) | |
| Fidelity SAI U.S. Quality Index Fund | Borrower | 66,665,244 | 5.57% | 463,809 |
| Amount ($) | |
| Fidelity SAI U.S. Quality Index Fund | 22,141 |
| Total Security Lending Fees Paid to NFS ($) | Security Lending Income From Securities Loaned to NFS ($) | Value of Securities Loaned to NFS at Period End ($) | |
| Fidelity SAI U.S. Quality Index Fund | 1,262 | 2 | - |
| Average Loan Balance ($) | Weighted Average Interest Rate | Interest Expense ($) | |
| Fidelity SAI U.S. Quality Index Fund | 27,698,000 | 5.83% | 26,913 |
| Strategic Advisers Fidelity U.S. Total Stock Fund | |
| Fidelity SAI U.S. Quality Index Fund | 88% |
| Fund | % of shares held |
| Fidelity SAI U.S. Quality Index Fund | 93% |
| A special meeting of shareholders was held on October 18, 2023. The results of votes taken among shareholders on the proposal before them are reported below. Each vote reported represents one dollar of net asset value held on the record date for the meeting. | ||
| Proposal 1 | ||
| To elect a Board of Trustees. | ||
# of Votes | % of Votes | |
| Abigail P. Johnson | ||
| Affirmative | 378,729,502,260.01 | 97.58 |
| Withheld | 9,407,876,478.96 | 2.42 |
| TOTAL | 388,137,378,738.97 | 100.00 |
| Jennifer Toolin McAuliffe | ||
| Affirmative | 378,454,868,010.95 | 97.51 |
| Withheld | 9,682,510,728.02 | 2.49 |
| TOTAL | 388,137,378,738.97 | 100.00 |
| Christine J. Thompson | ||
| Affirmative | 378,837,121,274.52 | 97.60 |
| Withheld | 9,300,257,464.45 | 2.40 |
| TOTAL | 388,137,378,738.97 | 100.00 |
| Elizabeth S. Acton | ||
| Affirmative | 378,262,110,794.85 | 97.46 |
| Withheld | 9,875,267,944.12 | 2.54 |
| TOTAL | 388,137,378,738.97 | 100.00 |
| Laura M. Bishop | ||
| Affirmative | 380,482,113,171.06 | 98.03 |
| Withheld | 7,655,265,567.91 | 1.97 |
| TOTAL | 388,137,378,738.97 | 100.00 |
| Ann E. Dunwoody | ||
| Affirmative | 380,016,034,008.12 | 97.91 |
| Withheld | 8,121,344,730.85 | 2.09 |
| TOTAL | 388,137,378,738.97 | 100.00 |
| John Engler | ||
| Affirmative | 379,432,488,394.20 | 97.76 |
| Withheld | 8,704,890,344.77 | 2.24 |
| TOTAL | 388,137,378,738.97 | 100.00 |
| Robert F. Gartland | ||
| Affirmative | 378,741,819,600.60 | 97.58 |
| Withheld | 9,395,559,138.37 | 2.42 |
| TOTAL | 388,137,378,738.97 | 100.00 |
| Robert W. Helm | ||
| Affirmative | 380,389,324,755.07 | 98.00 |
| Withheld | 7,748,053,983.90 | 2.00 |
| TOTAL | 388,137,378,738.97 | 100.00 |
| Arthur E. Johnson | ||
| Affirmative | 378,427,694,151.67 | 97.50 |
| Withheld | 9,709,684,587.30 | 2.50 |
| TOTAL | 388,137,378,738.97 | 100.00 |
| Michael E. Kenneally | ||
| Affirmative | 377,842,228,145.18 | 97.35 |
| Withheld | 10,295,150,593.79 | 2.65 |
| TOTAL | 388,137,378,738.97 | 100.00 |
| Mark A. Murray | ||
| Affirmative | 380,158,432,703.37 | 97.94 |
| Withheld | 7,978,946,035.60 | 2.06 |
| TOTAL | 388,137,378,738.97 | 100.00 |
| Carol J. Zierhoffer | ||
| Affirmative | 380,522,113,360.24 | 98.04 |
| Withheld | 7,615,265,378.73 | 1.96 |
| TOTAL | 388,137,378,738.97 | 100.00 |
| Proposal 1 reflects trust-wide proposal and voting results. | ||
 |
Item 8.
Changes in and Disagreements with Accountants for Open-End Management Investment Companies
See Item 7.
Item 9.
Proxy Disclosures for Open-End Management Investment Companies
See Item 7.
Item 10.
Remuneration Paid to Directors, Officers, and Others of Open-End Management Investment Companies
See Item 7.
Item 11.
Statement Regarding Basis for Approval of Investment Advisory Contract
See Item 7.
Item 12.
Disclosure of Proxy Voting Policies and Procedures for Closed-End Management Investment Companies
Not applicable.
Item 13.
Portfolio Managers of Closed-End Management Investment Companies
Not applicable.
Item 14.
Purchase of Equity Securities by Closed-End Management Investment Company and Affiliated Purchasers
Not applicable.
Item 15.
Submission of Matters to a Vote of Security Holders
There were no material changes to the procedures by which shareholders may recommend nominees to the trust’s Board of Trustees.
Item 16.
Controls and Procedures
(a)(i) The President and Treasurer and the Chief Financial Officer have concluded that the trust’s disclosure controls and procedures (as defined in Rule 30a-3(c) under the Investment Company Act) provide reasonable assurances that material information relating to the trust is made known to them by the appropriate persons, based on their evaluation of these controls and procedures as of a date within 90 days of the filing date of this report.
(a)(ii) There was no change in the trust’s internal control over financial reporting (as defined in Rule 30a-3(d) under the Investment Company Act) that occurred during the period covered by this report that has materially affected, or is reasonably likely to materially affect, the trust’s internal control over financial reporting.
Item 17.
Disclosure of Securities Lending Activities for Closed-End Management Investment Companies
Not applicable.
Item 18.
Recovery of Erroneously Awarded Compensation
(a)
Not applicable.
(b)
Not applicable.
Item 19.
Exhibits
(a) | (1) | Code of Ethics pursuant to Item 2 of Form N-CSR is filed and attached hereto as EX-99.CODE ETH. |
(a) | (2) | |
(a) | (3) | Not applicable. |
(b) |
SIGNATURES
Pursuant to the requirements of the Securities Exchange Act of 1934 and the Investment Company Act of 1940, the registrant has duly caused this report to be signed on its behalf by the undersigned, thereunto duly authorized.
Fidelity Salem Street Trust
By: | /s/Laura M. Del Prato |
Laura M. Del Prato | |
President and Treasurer (Principal Executive Officer) | |
Date: | September 20, 2024 |
Pursuant to the requirements of the Securities Exchange Act of 1934 and the Investment Company Act of 1940, this report has been signed below by the following persons on behalf of the registrant and in the capacities and on the dates indicated.
By: | /s/Laura M. Del Prato |
Laura M. Del Prato | |
President and Treasurer (Principal Executive Officer) | |
Date: | September 20, 2024 |
By: | /s/John J. Burke III |
John J. Burke III | |
Chief Financial Officer (Principal Financial Officer) | |
Date: | September 20, 2024 |