UNITED STATES
SECURITIES AND EXCHANGE COMMISSION
Washington, D.C. 20549
FORM N-CSR
CERTIFIED SHAREHOLDER REPORT OF REGISTERED
MANAGEMENT INVESTMENT COMPANIES
Investment Company Act file number 811-02105
Fidelity Salem Street Trust
(Exact name of registrant as specified in charter)
245 Summer St., Boston, Massachusetts 02210
(Address of principal executive offices) (Zip code)
Nicole Macarchuk, Secretary
245 Summer St.
Boston, Massachusetts 02210
(Name and address of agent for service)
Registrant's telephone number, including area code:
617-563-7000
| |
Date of fiscal year end: | December 31 |
|
|
Date of reporting period: | December 31, 2024 |
Item 1.
Reports to Stockholders
| |
| | ANNUAL SHAREHOLDER REPORT | AS OF DECEMBER 31, 2024 | |
| | Fidelity® Series 0-5 Year Inflation-Protected Bond Index Fund Fidelity® Series 0-5 Year Inflation-Protected Bond Index Fund : FSTZX |
| | | |
This annual shareholder report contains information about Fidelity® Series 0-5 Year Inflation-Protected Bond Index Fund for the period January 1, 2024 to December 31, 2024. You can find additional information about the Fund at fundresearch.fidelity.com/prospectus/sec. You can also request this information by contacting us at 1-800-544-8544.
What were your Fund costs for the last year?(based on hypothetical $10,000 investment)
FUND COST (PREVIOUS YEAR)
| | Costs of a $10,000 investment | Costs paid as a percentage of a $10,000 investment | |
| Fidelity® Series 0-5 Year Inflation-Protected Bond Index Fund | $ 0 A | 0.00%B | |
A Amount represents less than $.50
B Amount represents less than 0.005%
What affected the Fund's performance this period?
•U.S. taxable investment-grade bonds posted a modest advance in 2024, rallying during the summer months, as the bond market reflected anticipated interest-rate reductions by the U.S. Federal Reserve, but falling back in the fourth quarter when the Fed tempered rate-cut expectations for 2025.
•We construct the portfolio using optimization. This approach minimizes the differences between risk exposures of the fund relative to the U.S. Treasury Inflation-Protected Securities index. We attempt to hold all positions held by the index in the same relative proportions.
•Exposures include duration, key rate durations and other factors.
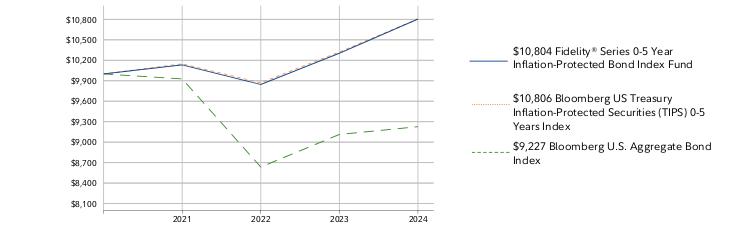
How did the Fund perform over the life of Fund?
CUMULATIVE PERFORMANCE
August 13, 2021 through December 31, 2024.
Initial investment of $10,000.
Fidelity® Series 0-5 Year Inflation-Protected Bond Index Fund | $10,000 | $10,133 | $9,845 | $10,303 |
Bloomberg US Treasury Inflation-Protected Securities (TIPS) 0-5 Years Index | $10,000 | $10,148 | $9,870 | $10,321 |
Bloomberg U.S. Aggregate Bond Index | $10,000 | $9,927 | $8,635 | $9,113 |
| | 2021 | 2022 | 2023 | 2024 |
AVERAGE ANNUAL TOTAL RETURNS:| | 1 Year | Life of Fund A |
| Fidelity® Series 0-5 Year Inflation-Protected Bond Index Fund | 4.86% | 2.31% |
| Bloomberg US Treasury Inflation-Protected Securities (TIPS) 0-5 Years Index | 4.69% | 2.31% |
| Bloomberg U.S. Aggregate Bond Index | 1.25% | -2.35% |
A From August 13, 2021
Visit www.fidelity.com for more recent performance information. |
The Fund's past performance is not a good predictor of the Fund's future performance. The graph and table do not reflect the deduction of taxes that a shareholder would pay on fund distributions or redemption of fund shares. |
Key Fund Statistics(as of December 31, 2024)
KEY FACTS | | |
| Fund Size | $9,147,192,964 | |
| Number of Holdings | 28 | |
| Total Advisory Fee | $0 | |
| Portfolio Turnover | 28% | |
What did the Fund invest in?
(as of December 31, 2024)
COUPON DISTRIBUTION (% of Fund's net assets) |
| 0.01 - 0.99% | 59.9 | |
| 1 - 1.99% | 18.4 | |
| 2 - 2.99% | 18.8 | |
| 3 - 3.99% | 2.6 | |
| U.S. Treasury Obligations | 99.7 |
| Short-Term Investments and Net Other Assets (Liabilities) | 0.3 |
ASSET ALLOCATION (% of Fund's net assets) |
|
| | U.S. Treasury Obligations - 99.7 |
| | Short-Term Investments and Net Other Assets (Liabilities) - 0.3 |
| |
TOP HOLDINGS(% of Fund's net assets) | | |
| US Treasury Notes | 86.3 | |
| US Treasury Bonds | 13.4 | |
| | 99.7 | |
| Fidelity, the Fidelity Investments Logo and all other Fidelity trademarks or service marks used herein are trademarks or service marks of FMR LLC. Any third-party marks that are used herein are trademarks or service marks of their respective owners. © 2025 FMR LLC. All rights reserved. |
| | For additional information about the Fund; including its prospectus, financial information, holdings and proxy information, scan the QR code or visit fundresearch.fidelity.com/prospectus/sec 1.9914397.100 6398-TSRA-0325 |
| |
| | ANNUAL SHAREHOLDER REPORT | AS OF DECEMBER 31, 2024 | |
| | Fidelity® International Bond Index Fund Fidelity® International Bond Index Fund : FBIIX |
| | | |
This annual shareholder report contains information about Fidelity® International Bond Index Fund for the period January 1, 2024 to December 31, 2024. You can find additional information about the Fund at fundresearch.fidelity.com/prospectus/sec. You can also request this information by contacting us at 1-800-544-8544 or by sending an e-mail to fidfunddocuments@fidelity.com.
What were your Fund costs for the last year?(based on hypothetical $10,000 investment)
FUND COST (PREVIOUS YEAR)
| | Costs of a $10,000 investment | Costs paid as a percentage of a $10,000 investment | |
| Fidelity® International Bond Index Fund | $ 6 | 0.06% | |
What affected the Fund's performance this period?
•International bonds advanced in 2024, buoyed by global monetary easing, as most major developed-market central banks - including in the U.S., U.K, Europe and Canada - began to lower policy interest rates after raising them aggressively the previous two years to combat inflation.
•We construct the portfolio using optimization. This approach minimizes the differences between risk exposures of the fund relative to the index. We attempt to hold all positions held by the index in the same relative proportions.
•Exposures include duration, key rate durations, credit quality, sector and issuer allocation, and other factors.
•The fund lagged the index primarily due to costs related to hedging the Chinese Renminbi.
How did the Fund perform over the life of Fund?
CUMULATIVE PERFORMANCE
October 10, 2019 through December 31, 2024.
Initial investment of $10,000.
Fidelity® International Bond Index Fund | $10,000 | $9,887 | $10,315 | $10,135 | $9,036 | $9,712 |
Bloomberg Global Aggregate ex-USD Float Adjusted RIC Diversified Index (Hedged USD) | $10,000 | $9,918 | $10,351 | $10,198 | $9,142 | $9,932 |
Bloomberg Global Aggregate Bond Index | $10,000 | $10,038 | $10,961 | $10,445 | $8,748 | $9,248 |
| | 2019 | 2020 | 2021 | 2022 | 2023 | 2024 |
AVERAGE ANNUAL TOTAL RETURNS:| | 1 Year | 5 Year | Life of Fund A |
| Fidelity® International Bond Index Fund | 4.64% | 0.55% | 0.31% |
| Bloomberg Global Aggregate ex-USD Float Adjusted RIC Diversified Index (Hedged USD) | 5.26% | 1.06% | 0.85% |
| Bloomberg Global Aggregate Bond Index | -1.69% | -1.96% | -1.80% |
A From October 10, 2019
Visit www.fidelity.com for more recent performance information. |
The Fund's past performance is not a good predictor of the Fund's future performance. The graph and table do not reflect the deduction of taxes that a shareholder would pay on fund distributions or redemption of fund shares. |
Key Fund Statistics(as of December 31, 2024)
KEY FACTS | | |
| Fund Size | $917,079,303 | |
| Number of Holdings | 1,817 | |
| Total Advisory Fee | $489,658 | |
| Portfolio Turnover | 19% | |
What did the Fund invest in?
(as of December 31, 2024)
| AAA | 15.7 |
| AA | 12.1 |
| A | 12.0 |
| BBB | 10.5 |
| BB | 0.4 |
| B | 0.0 |
| CCC,CC,C | 0.0 |
| Not Rated | 47.6 |
| Short-Term Investments and Net Other Assets (Liabilities) | 1.7 |
QUALITY DIVERSIFICATION (% of Fund's net assets) |
| |
| | AAA - 15.7 |
| | AA - 12.1 |
| | A - 12.0 |
| | BBB - 10.5 |
| | BB - 0.4 |
| | B - 0.0 |
| | CCC,CC,C - 0.0 |
| | Not Rated - 47.6 |
| | Short-Term Investments and Net Other Assets (Liabilities) - 1.7 |
| |
| We have used ratings from Moody's Investors Service, Inc. Where Moody's® ratings are not available, we have used S&P® ratings. All ratings are as of the date indicated and do not reflect subsequent changes. |
| Foreign Government and Government Agency Obligations | 69.1 |
| Corporate Bonds | 28.9 |
| Preferred Securities | 0.3 |
| Short-Term Investments and Net Other Assets (Liabilities) | 1.7 |
ASSET ALLOCATION (% of Fund's net assets) |
|
| | Foreign Government and Government Agency Obligations - 69.1 |
| | Corporate Bonds - 28.9 |
| | Preferred Securities - 0.3 |
| | Short-Term Investments and Net Other Assets (Liabilities) - 1.7 |
| |
| China | 20.4 |
| Japan | 10.3 |
| France | 9.6 |
| Germany | 8.0 |
| Italy | 6.3 |
| Canada | 5.7 |
| United States | 5.4 |
| United Kingdom | 4.6 |
| Multi-national | 4.1 |
| Others | 25.6 |
GEOGRAPHIC DIVERSIFICATION (% of Fund's net assets) |
|
| | China - 20.4 |
| | Japan - 10.3 |
| | France - 9.6 |
| | Germany - 8.0 |
| | Italy - 6.3 |
| | Canada - 5.7 |
| | United States - 5.4 |
| | United Kingdom - 4.6 |
| | Multi-national - 4.1 |
| | Others - 25.6 |
| |
TOP HOLDINGS(% of Fund's net assets) | | |
| Peoples Republic of China | 13.4 | |
| Japan Government | 9.9 | |
| Italian Republic | 5.6 | |
| French Government | 5.4 | |
| German Federal Republic | 4.2 | |
| China Development Bank | 3.7 | |
| Spanish Kingdom | 3.3 | |
| United Kingdom of Great Britain and Northern Ireland | 3.1 | |
| Korean Republic | 2.1 | |
| Agricultural Development Bank of China | 1.9 | |
| | 52.6 | |
| Fidelity, the Fidelity Investments Logo and all other Fidelity trademarks or service marks used herein are trademarks or service marks of FMR LLC. Any third-party marks that are used herein are trademarks or service marks of their respective owners. © 2025 FMR LLC. All rights reserved. |
| | For additional information about the Fund; including its prospectus, financial information, holdings and proxy information, scan the QR code or visit fundresearch.fidelity.com/prospectus/sec 1.9914393.100 4506-TSRA-0325 |
| |
| | ANNUAL SHAREHOLDER REPORT | AS OF DECEMBER 31, 2024 | |
| | Fidelity® Inflation-Protected Bond Index Fund Fidelity® Inflation-Protected Bond Index Fund : FIPDX |
| | | |
This annual shareholder report contains information about Fidelity® Inflation-Protected Bond Index Fund for the period January 1, 2024 to December 31, 2024. You can find additional information about the Fund at fundresearch.fidelity.com/prospectus/sec. You can also request this information by contacting us at 1-800-544-8544 or by sending an e-mail to fidfunddocuments@fidelity.com.
What were your Fund costs for the last year?(based on hypothetical $10,000 investment)
FUND COST (PREVIOUS YEAR)
| | Costs of a $10,000 investment | Costs paid as a percentage of a $10,000 investment | |
| Fidelity® Inflation-Protected Bond Index Fund | $ 5 | 0.05% | |
What affected the Fund's performance this period?
•U.S. taxable investment-grade bonds posted a modest advance in 2024, rallying during the summer months, as the bond market reflected anticipated interest-rate reductions by the U.S. Federal Reserve, but falling back in the fourth quarter when the Fed tempered rate-cut expectations for 2025.
•We construct the portfolio using optimization. This approach minimizes the differences between risk exposures of the fund relative to the Bloomberg U.S. Treasury Inflation-Protected Securities index. We attempt to hold all positions held by the index in the same relative proportions.
•Exposures include duration, key rate durations and other factors.
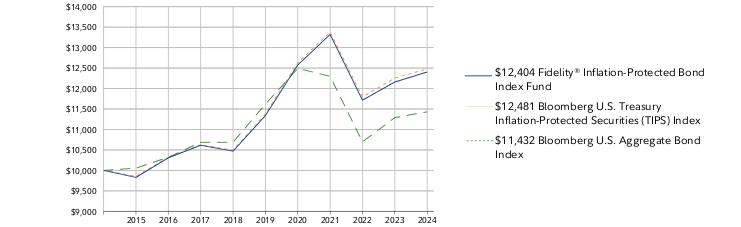
How did the Fund perform over the past 10 years?
CUMULATIVE PERFORMANCE
December 31, 2014 through December 31, 2024.
Initial investment of $10,000.
Fidelity® Inflation-Protected Bond Index Fund | $10,000 | $9,829 | $10,308 | $10,615 | $10,469 | $11,340 | $12,576 | $13,321 | $11,716 | $12,159 | $12,404 |
Bloomberg U.S. Treasury Inflation-Protected Securities (TIPS) Index | $10,000 | $9,856 | $10,318 | $10,628 | $10,494 | $11,378 | $12,629 | $13,381 | $11,796 | $12,256 | $12,481 |
Bloomberg U.S. Aggregate Bond Index | $10,000 | $10,055 | $10,321 | $10,687 | $10,688 | $11,620 | $12,492 | $12,299 | $10,699 | $11,291 | $11,432 |
| | 2014 | 2015 | 2016 | 2017 | 2018 | 2019 | 2020 | 2021 | 2022 | 2023 | 2024 |
AVERAGE ANNUAL TOTAL RETURNS:| | 1 Year | 5 Year | 10 Year |
| Fidelity® Inflation-Protected Bond Index Fund | 2.01% | 1.81% | 2.18% |
| Bloomberg U.S. Treasury Inflation-Protected Securities (TIPS) Index | 1.84% | 1.87% | 2.24% |
| Bloomberg U.S. Aggregate Bond Index | 1.25% | -0.33% | 1.35% |
Visit www.fidelity.com for more recent performance information. |
The Fund's past performance is not a good predictor of the Fund's future performance. The graph and table do not reflect the deduction of taxes that a shareholder would pay on fund distributions or redemption of fund shares. |
Key Fund Statistics(as of December 31, 2024)
KEY FACTS | | |
| Fund Size | $8,969,120,308 | |
| Number of Holdings | 49 | |
| Total Advisory Fee | $4,639,266 | |
| Portfolio Turnover | 23% | |
What did the Fund invest in?
(as of December 31, 2024)
COUPON DISTRIBUTION (% of Fund's net assets) |
| 0.01 - 0.99% | 56.2 | |
| 1 - 1.99% | 26.0 | |
| 2 - 2.99% | 13.7 | |
| 3 - 3.99% | 3.5 | |
| U.S. Treasury Obligations | 99.4 |
| Short-Term Investments and Net Other Assets (Liabilities) | 0.6 |
ASSET ALLOCATION (% of Fund's net assets) |
|
| | U.S. Treasury Obligations - 99.4 |
| | Short-Term Investments and Net Other Assets (Liabilities) - 0.6 |
| |
TOP HOLDINGS(% of Fund's net assets) | | |
| US Treasury Notes | 77.0 | |
| US Treasury Bonds | 22.4 | |
| | 99.4 | |
| Fidelity, the Fidelity Investments Logo and all other Fidelity trademarks or service marks used herein are trademarks or service marks of FMR LLC. Any third-party marks that are used herein are trademarks or service marks of their respective owners. © 2025 FMR LLC. All rights reserved. |
| | For additional information about the Fund; including its prospectus, financial information, holdings and proxy information, scan the QR code or visit fundresearch.fidelity.com/prospectus/sec 1.9914344.100 2418-TSRA-0325 |
| |
| | ANNUAL SHAREHOLDER REPORT | AS OF DECEMBER 31, 2024 | |
| | Fidelity® SAI International Credit Fund Fidelity® SAI International Credit Fund : FSNDX |
| | | |
This annual shareholder report contains information about Fidelity® SAI International Credit Fund for the period January 1, 2024 to December 31, 2024. You can find additional information about the Fund at fundresearch.fidelity.com/prospectus/sec. You can also request this information by contacting us at 1-800-544-3455 or by sending an e-mail to fidfunddocuments@fidelity.com.
What were your Fund costs for the last year?(based on hypothetical $10,000 investment)
FUND COST (PREVIOUS YEAR)
| | Costs of a $10,000 investment | Costs paid as a percentage of a $10,000 investment | |
| Fidelity® SAI International Credit Fund | $ 42 | 0.41% | |
What affected the Fund's performance this period?
•Global investment-grade bonds gained in 2024, buoyed by global monetary easing, as most major developed-market central banks - including in the U.S., U.K, Europe and Canada - began to lower policy interest rates after raising them aggressively the previous two years to combat inflation.
•At year-end, about 48% of the portfolio was comprised of corporate bond holdings, while24% was in non-benchmark exposure to U.S. government bonds and roughly 9% in non-U.S. government bonds.
•Roughly 57% of the fund was invested in investment-grade securities rated A and above, while 34% was in bonds rated BBB and lower. The fund also had an approximate 6% allocation to cash as of December 31.
•The largest individual relative contributor this period was the fund's position in European property company Heimstaden, real-estate investor Aroundtown bonds and another European property company, Grand City Properties.
•Conversely, the largest individual relative detractor was an exposure to the UK water sector including Southern Water bonds.
•Top fund holdings at year-end included U.S. treasury notes and bonds, KfW, German and Japanese government bonds.
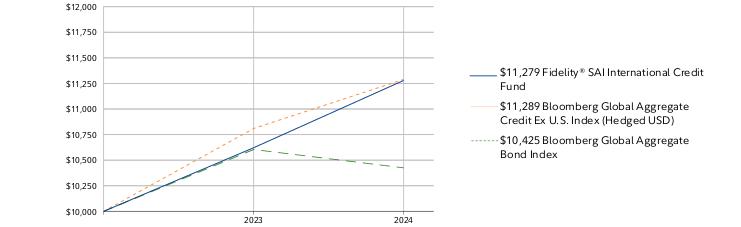
How did the Fund perform over the life of Fund?
CUMULATIVE PERFORMANCE
March 1, 2023 through December 31, 2024.
Initial investment of $10,000.
Fidelity® SAI International Credit Fund | $10,000 | $10,621 |
Bloomberg Global Aggregate Credit Ex U.S. Index (Hedged USD) | $10,000 | $10,810 |
Bloomberg Global Aggregate Bond Index | $10,000 | $10,604 |
| | 2023 | 2024 |
AVERAGE ANNUAL TOTAL RETURNS:| | 1 Year | Life of Fund A |
| Fidelity® SAI International Credit Fund | 6.19% | 6.77% |
| Bloomberg Global Aggregate Credit Ex U.S. Index (Hedged USD) | 4.44% | 6.82% |
| Bloomberg Global Aggregate Bond Index | -1.69% | 2.29% |
A From March 1, 2023
Visit www.fidelity.com for more recent performance information. |
The Fund's past performance is not a good predictor of the Fund's future performance. The graph and table do not reflect the deduction of taxes that a shareholder would pay on fund distributions or redemption of fund shares. |
Key Fund Statistics(as of December 31, 2024)
KEY FACTS | | |
| Fund Size | $706,533,349 | |
| Number of Holdings | 238 | |
| Total Advisory Fee | $1,630,941 | |
| Portfolio Turnover | 64% | |
What did the Fund invest in?
(as of December 31, 2024)
| U.S. Government and U.S. Government Agency Obligations | 24.3 |
| AAA | 9.3 |
| A | 11.5 |
| BBB | 34.0 |
| BB | 5.0 |
| B | 1.3 |
| CCC,CC,C | 0.5 |
| D | 0.0 |
| Not Rated | 5.5 |
| Short-Term Investments and Net Other Assets (Liabilities) | 8.6 |
QUALITY DIVERSIFICATION (% of Fund's net assets) |
| |
| | U.S. Government and U.S. Government Agency Obligations - 24.3 |
| | AAA - 9.3 |
| | A - 11.5 |
| | BBB - 34.0 |
| | BB - 5.0 |
| | B - 1.3 |
| | CCC,CC,C - 0.5 |
| | D - 0.0 |
| | Not Rated - 5.5 |
| | Short-Term Investments and Net Other Assets (Liabilities) - 8.6 |
| |
| We have used ratings from Moody's Investors Service, Inc. Where Moody's® ratings are not available, we have used S&P® ratings. All ratings are as of the date indicated and do not reflect subsequent changes. |
| Corporate Bonds | 54.5 |
| U.S. Treasury Obligations | 24.3 |
| Foreign Government and Government Agency Obligations | 8.9 |
| Preferred Securities | 3.7 |
| Short-Term Investments and Net Other Assets (Liabilities) | 8.6 |
ASSET ALLOCATION (% of Fund's net assets) |
|
| | Corporate Bonds - 54.5 |
| | U.S. Treasury Obligations - 24.3 |
| | Foreign Government and Government Agency Obligations - 8.9 |
| | Preferred Securities - 3.7 |
| | Short-Term Investments and Net Other Assets (Liabilities) - 8.6 |
| |
| United States | 34.9 |
| United Kingdom | 17.5 |
| Germany | 15.5 |
| Netherlands | 4.3 |
| France | 3.9 |
| Luxembourg | 3.5 |
| Canada | 3.3 |
| Japan | 2.6 |
| Denmark | 2.2 |
| Others | 12.3 |
GEOGRAPHIC DIVERSIFICATION (% of Fund's net assets) |
|
| | United States - 34.9 |
| | United Kingdom - 17.5 |
| | Germany - 15.5 |
| | Netherlands - 4.3 |
| | France - 3.9 |
| | Luxembourg - 3.5 |
| | Canada - 3.3 |
| | Japan - 2.6 |
| | Denmark - 2.2 |
| | Others - 12.3 |
| |
TOP HOLDINGS(% of Fund's net assets) | | |
| US Treasury Notes | 15.8 | |
| US Treasury Bonds | 8.5 | |
| KfW | 3.9 | |
| Canadian Government | 3.3 | |
| Japan Government | 2.6 | |
| German Federal Republic | 2.1 | |
| Blackstone Property Partners Europe Holdings Sarl | 1.8 | |
| UBS Group AG | 1.6 | |
| NatWest Group PLC | 1.6 | |
| Lloyds Banking Group PLC | 1.5 | |
| | 42.7 | |
| Fidelity, the Fidelity Investments Logo and all other Fidelity trademarks or service marks used herein are trademarks or service marks of FMR LLC. Any third-party marks that are used herein are trademarks or service marks of their respective owners. © 2025 FMR LLC. All rights reserved. |
| | For additional information about the Fund; including its prospectus, financial information, holdings and proxy information, scan the QR code or visit fundresearch.fidelity.com/prospectus/sec 1.9914415.100 7328-TSRA-0325 |
| |
| | ANNUAL SHAREHOLDER REPORT | AS OF DECEMBER 31, 2024 | |
| | Fidelity® Series 5+ Year Inflation-Protected Bond Index Fund Fidelity® Series 5+ Year Inflation-Protected Bond Index Fund : FSTDX |
| | | |
This annual shareholder report contains information about Fidelity® Series 5+ Year Inflation-Protected Bond Index Fund for the period January 1, 2024 to December 31, 2024. You can find additional information about the Fund at fundresearch.fidelity.com/prospectus/sec. You can also request this information by contacting us at 1-800-544-8544.
What were your Fund costs for the last year?(based on hypothetical $10,000 investment)
FUND COST (PREVIOUS YEAR)
| | Costs of a $10,000 investment | Costs paid as a percentage of a $10,000 investment | |
| Fidelity® Series 5+ Year Inflation-Protected Bond Index Fund | $ 0 A | 0.00%B | |
A Amount represents less than $.50
B Amount represents less than 0.005%
What affected the Fund's performance this period?
•U.S. taxable investment-grade bonds posted a modest advance in 2024, rallying during the summer months, as the bond market reflected anticipated interest-rate reductions by the U.S. Federal Reserve, but falling back in the fourth quarter when the Fed tempered rate-cut expectations for 2025.
•We construct the portfolio using optimization. This approach minimizes the differences between risk exposures of the fund relative to the U.S. Treasury Inflation-Protected Securities index. We attempt to hold all positions held by the index in the same relative proportions.
•Exposures include duration, key rate durations and other factors.
•The fund outperformed the index primarily due to pricing basis, meaning differences between when the fund and the index are priced on the last day of the year.
How did the Fund perform over the life of Fund?
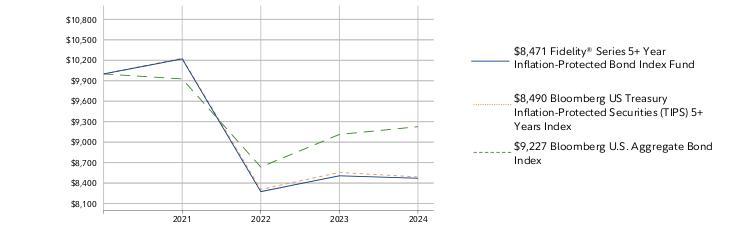
CUMULATIVE PERFORMANCE
August 13, 2021 through December 31, 2024.
Initial investment of $10,000.
Fidelity® Series 5+ Year Inflation-Protected Bond Index Fund | $10,000 | $10,221 | $8,275 | $8,507 |
Bloomberg US Treasury Inflation-Protected Securities (TIPS) 5+ Years Index | $10,000 | $10,230 | $8,308 | $8,556 |
Bloomberg U.S. Aggregate Bond Index | $10,000 | $9,927 | $8,635 | $9,113 |
| | 2021 | 2022 | 2023 | 2024 |
AVERAGE ANNUAL TOTAL RETURNS:| | 1 Year | Life of Fund A |
| Fidelity® Series 5+ Year Inflation-Protected Bond Index Fund | -0.42% | -4.78% |
| Bloomberg US Treasury Inflation-Protected Securities (TIPS) 5+ Years Index | -0.78% | -4.72% |
| Bloomberg U.S. Aggregate Bond Index | 1.25% | -2.35% |
A From August 13, 2021
Visit www.fidelity.com for more recent performance information. |
The Fund's past performance is not a good predictor of the Fund's future performance. The graph and table do not reflect the deduction of taxes that a shareholder would pay on fund distributions or redemption of fund shares. |
Key Fund Statistics(as of December 31, 2024)
KEY FACTS | | |
| Fund Size | $10,842,479,536 | |
| Number of Holdings | 27 | |
| Total Advisory Fee | $0 | |
| Portfolio Turnover | 26% | |
What did the Fund invest in?
(as of December 31, 2024)
COUPON DISTRIBUTION (% of Fund's net assets) |
| 0.01 - 0.99% | 52.2 | |
| 1 - 1.99% | 40.2 | |
| 2 - 2.99% | 6.0 | |
| 3 - 3.99% | 1.1 | |
| U.S. Treasury Obligations | 99.5 |
| Short-Term Investments and Net Other Assets (Liabilities) | 0.5 |
ASSET ALLOCATION (% of Fund's net assets) |
|
| | U.S. Treasury Obligations - 99.5 |
| | Short-Term Investments and Net Other Assets (Liabilities) - 0.5 |
| |
TOP HOLDINGS(% of Fund's net assets) | | |
| US Treasury Notes | 69.3 | |
| US Treasury Bonds | 30.2 | |
| | 99.5 | |
| Fidelity, the Fidelity Investments Logo and all other Fidelity trademarks or service marks used herein are trademarks or service marks of FMR LLC. Any third-party marks that are used herein are trademarks or service marks of their respective owners. © 2025 FMR LLC. All rights reserved. |
| | For additional information about the Fund; including its prospectus, financial information, holdings and proxy information, scan the QR code or visit fundresearch.fidelity.com/prospectus/sec 1.9914398.100 6399-TSRA-0325 |
| |
| | ANNUAL SHAREHOLDER REPORT | AS OF DECEMBER 31, 2024 | This report describes changes to the Fund that occurred during the reporting period. |
| | Fidelity® SAI Municipal Income Fund Fidelity® SAI Municipal Income Fund : FSMNX |
| | | |
This annual shareholder report contains information about Fidelity® SAI Municipal Income Fund for the period January 1, 2024 to December 31, 2024. You can find additional information about the Fund at fundresearch.fidelity.com/prospectus/sec. You can also request this information by contacting us at 1-800-544-3455 or by sending an e-mail to fidfunddocuments@fidelity.com.
What were your Fund costs for the last year?(based on hypothetical $10,000 investment)
FUND COST (PREVIOUS YEAR)
| | Costs of a $10,000 investment | Costs paid as a percentage of a $10,000 investment | |
| Fidelity® SAI Municipal Income Fund | $ 35 | 0.34% | |
What affected the Fund's performance this period?
•U.S. tax-exempt municipal bonds produced a modest gain in 2024, rallying during the summer months, as the muni market reflected anticipated interest-rate reductions by the U.S. Federal Reserve, but falling back in the fourth quarter, when municipal bond supply swelled and the Fed tempered rate-cut expectations for 2025.
•Against this backdrop, the fund's credit-quality positioning was a key contributor to performance versus the Bloomberg Municipal Bond Index for the fiscal year.
•This included an overweight in lower-quality investment-grade municipal securities - primarily health care and higher education credits - that outperformed as credit spreads tightened. For the same reason, an overweight in bonds from the Puerto Rico Commonwealth Aqueducts and Sewers Authority also added value.
•Underweights in certain high-quality bonds that lagged the index, such as those backed by the New York Transitional Finance Authority Future Tax Secured Revenue, also aided the relative return.
•Pricing factors boosted relative performance as well. Fund holdings are priced by a third-party pricing service and validated daily by Fidelity Management & Research's fair-value processes. Securities within the index, however, are priced by the index provider. These two approaches employ somewhat different methodologies in setting the prices of municipal securities, most of which trade infrequently.
•In contrast, an overweight in lower-coupon tobacco bonds that trailed the index, partly due to their heightened interest-rate sensitivity, detracted from the relative result.
•Exposure to municipal private activity bonds issued for a wood pellet company to fund a project in Mississippi also hurt, as the company declared Chapter 11 bankruptcy.
How did the Fund perform over the life of Fund?
CUMULATIVE PERFORMANCE
October 2, 2018 through December 31, 2024.
Initial investment of $10,000.
Fidelity® SAI Municipal Income Fund | $10,000 | $10,267 | $11,141 | $11,617 | $11,887 | $10,706 | $11,514 |
Bloomberg 3+ Year Municipal Bond Index | $10,000 | $10,178 | $11,010 | $11,631 | $11,828 | $10,711 | $11,440 |
Bloomberg Municipal Bond Index | $10,000 | $10,167 | $10,933 | $11,503 | $11,678 | $10,682 | $11,366 |
| | 2018 | 2019 | 2020 | 2021 | 2022 | 2023 | 2024 |
AVERAGE ANNUAL TOTAL RETURNS:| | 1 Year | 5 Year | Life of Fund A |
| Fidelity® SAI Municipal Income Fund | 1.83% | 1.02% | 2.58% |
| Bloomberg 3+ Year Municipal Bond Index | 0.88% | 0.95% | 2.32% |
| Bloomberg Municipal Bond Index | 1.05% | 0.99% | 2.24% |
A From October 2, 2018
Visit www.fidelity.com for more recent performance information. |
The Fund's past performance is not a good predictor of the Fund's future performance. The graph and table do not reflect the deduction of taxes that a shareholder would pay on fund distributions or redemption of fund shares. |
Key Fund Statistics(as of December 31, 2024)
KEY FACTS | | |
| Fund Size | $2,251,283,165 | |
| Number of Holdings | 1,754 | |
| Total Advisory Fee | $6,863,329 | |
| Portfolio Turnover | 10% | |
What did the Fund invest in?
(as of December 31, 2024)
REVENUE SOURCES (% of Fund's net assets) |
| General Obligations | 28.0 | |
| Transportation | 17.4 | |
| Health Care | 13.6 | |
| Education | 9.2 | |
| Special Tax | 8.8 | |
| Housing | 6.0 | |
| Others(Individually Less Than 5%) | 17.0 | |
| 100.0 | |
| |
| AAA | 10.9 |
| AA | 34.3 |
| A | 34.9 |
| BBB | 8.6 |
| BB | 1.1 |
| B | 0.3 |
| CCC,CC,C | 0.0 |
| Not Rated | 3.0 |
| Short-Term Investments and Net Other Assets (Liabilities) | 6.9 |
QUALITY DIVERSIFICATION (% of Fund's net assets) |
| |
| | AAA - 10.9 |
| | AA - 34.3 |
| | A - 34.9 |
| | BBB - 8.6 |
| | BB - 1.1 |
| | B - 0.3 |
| | CCC,CC,C - 0.0 |
| | Not Rated - 3.0 |
| | Short-Term Investments and Net Other Assets (Liabilities) - 6.9 |
| |
| We have used ratings from Moody's Investors Service, Inc. Where Moody's® ratings are not available, we have used S&P® ratings. All ratings are as of the date indicated and do not reflect subsequent changes. |
TOP STATES (% of Fund's net assets) |
| Illinois | 10.0 |
| New York | 8.3 |
| Texas | 7.2 |
| New Jersey | 7.1 |
| Pennsylvania | 5.1 |
| | |
How has the Fund changed?
This is a summary of certain changes to the Fund since January 1, 2024. For more complete information, you may review the Fund's next prospectus, which we expect to be available by March 1, 2025 at fundresearch.fidelity.com/prospectus/sec or upon request at 1-800-544-3455 or by sending an e-mail to fidfunddocuments@fidelity.com.
The fees associated with this class changed during the reporting year. The variations in class fees are primarily the result of the following changes:- Management fee
- Operating expenses
- Expense reductions
The fund's contractual management fee was reduced during the reporting period. | |
| Fidelity, the Fidelity Investments Logo and all other Fidelity trademarks or service marks used herein are trademarks or service marks of FMR LLC. Any third-party marks that are used herein are trademarks or service marks of their respective owners. © 2025 FMR LLC. All rights reserved. |
| | For additional information about the Fund; including its prospectus, financial information, holdings and proxy information, scan the QR code or visit fundresearch.fidelity.com/prospectus/sec 1.9914383.100 3307-TSRA-0325 |
| |
| | ANNUAL SHAREHOLDER REPORT | AS OF DECEMBER 31, 2024 | |
| | Fidelity® SAI Inflation-Protected Bond Index Fund Fidelity® SAI Inflation-Protected Bond Index Fund : FSPWX |
| | | |
This annual shareholder report contains information about Fidelity® SAI Inflation-Protected Bond Index Fund for the period August 16, 2024 to December 31, 2024. You can find additional information about the Fund at fundresearch.fidelity.com/prospectus/sec. You can also request this information by contacting us at 1-800-544-3455 or by sending an e-mail to fidfunddocuments@fidelity.com.
What were your Fund costs for the last year?(based on hypothetical $10,000 investment)
FUND COST (PREVIOUS YEAR)
| | Costs of a $10,000 investment | Costs paid as a percentage of a $10,000 investment | |
Fidelity® SAI Inflation-Protected Bond Index Fund A | $ 2 | 0.05% | |
A Expenses for the full reporting period would be higher.
Key Fund Statistics(as of December 31, 2024)
KEY FACTS | | |
| Fund Size | $10,129,497,606 | |
| Number of Holdings | 49 | |
| Total Advisory Fee | $1,060,569 | |
Portfolio TurnoverA | 8% | |
A Amount not annualized
What did the Fund invest in?
(as of December 31, 2024)
COUPON DISTRIBUTION (% of Fund's net assets) |
| 0.01 - 0.99% | 53.5 | |
| 1 - 1.99% | 29.4 | |
| 2 - 2.99% | 14.7 | |
| 3 - 3.99% | 1.8 | |
| U.S. Treasury Obligations | 99.4 |
| Short-Term Investments and Net Other Assets (Liabilities) | 0.6 |
ASSET ALLOCATION (% of Fund's net assets) |
|
| | U.S. Treasury Obligations - 99.4 |
| | Short-Term Investments and Net Other Assets (Liabilities) - 0.6 |
| |
TOP HOLDINGS(% of Fund's net assets) | | |
| US Treasury Notes | 80.1 | |
| US Treasury Bonds | 19.3 | |
| | 99.4 | |
| Fidelity, the Fidelity Investments Logo and all other Fidelity trademarks or service marks used herein are trademarks or service marks of FMR LLC. Any third-party marks that are used herein are trademarks or service marks of their respective owners. © 2025 FMR LLC. All rights reserved. |
| | For additional information about the Fund; including its prospectus, financial information, holdings and proxy information, scan the QR code or visit fundresearch.fidelity.com/prospectus/sec 1.9916284.100 7702-TSRA-0325 |
Item 2.
Code of Ethics
As of the end of the period, December 31, 2024, Fidelity Salem Street Trust (the trust) has adopted a code of ethics, as defined in Item 2 of Form N-CSR, that applies to its President and Treasurer and its Chief Financial Officer. A copy of the code of ethics is filed as an exhibit to this Form N-CSR.
Item 3.
Audit Committee Financial Expert
The Board of Trustees of the trust has determined that Laura M. Bishop is an audit committee financial expert, as defined in Item 3 of Form N-CSR. Ms. Bishop is independent for purposes of Item 3 of Form N-CSR.
Item 4.
Principal Accountant Fees and Services
Fees and Services
The following table presents fees billed by PricewaterhouseCoopers LLP (“PwC”) in each of the last two fiscal years for services rendered to Fidelity Inflation-Protected Bond Index Fund, Fidelity International Bond Index Fund, Fidelity SAI Inflation-Protected Bond Index Fund, Fidelity SAI International Credit Fund, Fidelity SAI Municipal Income Fund, Fidelity Series 0-5 Year Inflation-Protected Bond Index Fund and Fidelity Series 5+ Year Inflation-Protected Bond Index Fund (the “Funds”):
Services Billed by PwC
December 31, 2024 FeesA,C
| | | | |
| Audit Fees | Audit-Related Fees | Tax Fees | All Other Fees |
Fidelity Inflation-Protected Bond Index Fund | $34,800 | $2,900 | $5,500 | $1,300 |
Fidelity International Bond Index Fund | $78,300 | $6,600 | $11,900 | $2,900 |
Fidelity SAI Inflation-Protected Bond Index Fund | $24,700 | $700 | $5,500 | $300 |
Fidelity SAI International Credit Fund | $78,100 | $6,400 | $14,900 | $2,800 |
Fidelity SAI Municipal Income Fund | $52,600 | $4,300 | $8,700 | $1,800 |
Fidelity Series 0-5 Year Inflation-Protected Bond Index Fund | $36,100 | $3,100 | $7,600 | $1,300 |
Fidelity Series 5+ Year Inflation-Protected Bond Index Fund | $36,200 | $3,100 | $6,000 | $1,300 |
December 31, 2023 FeesA,B,C
| | | | |
| Audit Fees | Audit-Related Fees | Tax Fees | All Other Fees |
Fidelity Inflation-Protected Bond Index Fund | $35,000 | $3,000 | $5,500 | $1,200 |
Fidelity International Bond Index Fund | $78,600 | $6,700 | $11,900 | $2,800 |
Fidelity SAI Inflation-Protected Bond Index Fund | $- | $- | $- | $- |
Fidelity SAI International Credit Fund | $66,400 | $4,400 | $13,900 | $1,800 |
Fidelity SAI Municipal Income Fund | $55,300 | $4,300 | $9,600 | $1,800 |
Fidelity Series 0-5 Year Inflation-Protected Bond Index Fund | $46,200 | $3,100 | $6,000 | $1,300 |
Fidelity Series 5+ Year Inflation-Protected Bond Index Fund | $46,300 | $3,100 | $6,000 | $1,300 |
A Amounts may reflect rounding
B Fidelity SAI International Credit Fund commenced operations on March 1, 2023.
C Fidelity SAI Inflation-Protected Bond Index Fund commenced operations on August 16, 2024.
The following table(s) present(s) fees billed by PwC that were required to be approved by the Audit Committee for services that relate directly to the operations and financial reporting of the Fund(s) and that are rendered on behalf of Fidelity Management & Research Company LLC ("FMR") and entities controlling, controlled by, or under common control with FMR (not including any sub-adviser whose role is primarily portfolio management and is subcontracted with or overseen by another investment adviser) that provide ongoing services to the Fund(s) (“Fund Service Providers”):
Services Billed by PwC
| | |
| December 31, 2024A,C | December 31, 2023A,B,C |
Audit-Related Fees | $9,701,800 | $8,881,200 |
Tax Fees | $61,000 | $1,000 |
All Other Fees | $35,000 | $- |
A Amounts may reflect rounding.
B May include amounts billed prior to the Fidelity SAI International Credit Fund’s commencement of operations.
C May include amounts billed prior to the Fidelity SAI Inflation-Protected Bond Index Fund’s commencement of operations
“Audit-Related Fees” represent fees billed for assurance and related services that are reasonably related to the performance of the fund audit or the review of the fund's financial statements and that are not reported under Audit Fees.
“Tax Fees” represent fees billed for tax compliance, tax advice or tax planning that relate directly to the operations and financial reporting of the fund.
“All Other Fees” represent fees billed for services provided to the fund or Fund Service Provider, a significant portion of which are assurance related, that relate directly to the operations and financial reporting of the fund, excluding those services that are reported under Audit Fees, Audit-Related Fees or Tax Fees.
Assurance services must be performed by an independent public accountant.
* * *
The aggregate non-audit fees billed by PwC for services rendered to the Fund(s), FMR (not including any sub-adviser whose role is primarily portfolio management and is subcontracted with or overseen by another investment adviser), and any Fund Service Provider for each of the last two fiscal years of the Fund(s) are as follows:
| | |
Billed By | December 31, 2024A,C | December 31, 2023A,B,C |
PwC | $15,390,000 | $14,424,000 |
A Amounts may reflect rounding.
B May include amounts billed prior to the Fidelity SAI International Credit Fund’ss commencement of operations.
C May include amounts billed prior to the Fidelity SAI Inflation-Protected Bond Index Fund’s commencement of operations
The trust's Audit Committee has considered non-audit services that were not pre-approved that were provided by PwC to Fund Service Providers to be compatible with maintaining the independence of PwC in its(their) audit of the Fund(s), taking into account representations from PwC, in accordance with Public Company Accounting Oversight Board rules, regarding its independence from the Fund(s) and its(their) related entities and FMR’s review of the appropriateness and permissibility under applicable law of such non-audit services prior to their provision to the Fund(s) Service Providers.
Audit Committee Pre-Approval Policies and Procedures
The trust’s Audit Committee must pre-approve all audit and non-audit services provided by a fund’s independent registered public accounting firm relating to the operations or financial reporting of the fund. Prior to the commencement of any audit or non-audit services to a fund, the Audit Committee reviews the services to determine whether they are appropriate and permissible under applicable law.
The Audit Committee has adopted policies and procedures to, among other purposes, provide a framework for the Committee’s consideration of non-audit services by the audit firms that audit the Fidelity funds. The policies and procedures require that any non-audit service provided by a fund audit firm to a Fidelity fund and any non-audit service provided by a fund auditor to a Fund Service Provider that relates directly to the operations and financial reporting of a Fidelity fund (“Covered Service”) are subject to approval by the Audit Committee before such service is provided.
All Covered Services must be approved in advance of provision of the service either: (i) by formal resolution of the Audit Committee, or (ii) by oral or written approval of the service by the Chair of the Audit Committee (or if the Chair is unavailable, such other member of the Audit Committee as may be designated by the Chair to act in the Chair’s absence). The approval contemplated by (ii) above is permitted where the Treasurer determines that action on such an engagement is necessary before the next meeting of the Audit Committee.
Non-audit services provided by a fund audit firm to a Fund Service Provider that do not relate directly to the operations and financial reporting of a Fidelity fund are reported to the Audit Committee periodically.
Non-Audit Services Approved Pursuant to Rule 2-01(c)(7)(i)(C) and (ii) of Regulation S-X (“De Minimis Exception”)
There were no non-audit services approved or required to be approved by the Audit Committee pursuant to the De Minimis Exception during the Fund’s(s’) last two fiscal years relating to services provided to (i) the Fund(s) or (ii) any Fund Service Provider that relate directly to the operations and financial reporting of the Fund(s).
The Registrant has not retained, for the preparation of the audit report on the financial statements included in the Form N-CSR, a registered public accounting firm that has a branch or office that is located in a foreign jurisdiction and that the Public Company Accounting Oversight Board (the “PCAOB”) has determined that the PCAOB is unable to inspect or investigate completely because of a position taken by an authority in the foreign jurisdiction.
The Registrant is not a “foreign issuer,” as defined in 17 CFR 240.3b-4.
Item 5.
Audit Committee of Listed Registrants
Not applicable.
Item 6.
Investments
(a)
Not applicable.
(b)
Not applicable.
Item 7.
Financial Statements and Financial Highlights for Open-End Management Investment Companies
Fidelity® Series 0-5 Year Inflation-Protected Bond Index Fund
Fidelity® Series 5+ Year Inflation-Protected Bond Index Fund
Annual Report
December 31, 2024
Contents
To view a fund's proxy voting guidelines and proxy voting record for the 12-month period ended June 30, visit http://www.fidelity.com/proxyvotingresults or visit the Securities and Exchange Commission's (SEC) web site at http://www.sec.gov.
You may also call 1-800-544-8544 to request a free copy of the proxy voting guidelines.
BLOOMBERG ® is a trademark and service mark of Bloomberg Finance L.P. and its affiliates (collectively "Bloomberg"). Bloomberg or Bloomberg's licensors own all proprietary rights in the Bloomberg Indices. Neither Bloomberg nor Bloomberg's licensors approves or endorses this material, or guarantees the accuracy or completeness of any information herein, or makes any warranty, express or implied, as to the results to be obtained therefrom and, to the maximum extent allowed by law, neither shall have any liability or responsibility for injury or damages arising in connection therewith.
Standard & Poor's, S&P and S&P 500 are registered service marks of The McGraw-Hill Companies, Inc. and have been licensed for use by Fidelity Distributors Corporation.
Other third-party marks appearing herein are the property of their respective owners.
All other marks appearing herein are registered or unregistered trademarks or service marks of FMR LLC or an affiliated company. © 2025 FMR LLC. All rights reserved.
This report and the financial statements contained herein are submitted for the general information of the shareholders of the Funds. This report is not authorized for distribution to prospective investors in the Funds unless preceded or accompanied by an effective prospectus.
A fund files its complete schedule of portfolio holdings with the SEC for the first and third quarters of each fiscal year on Form N-PORT. Forms N-PORT are available on the SEC's web site at http://www.sec.gov. A fund's Forms N-PORT may be reviewed and copied at the SEC's Public Reference Room in Washington, DC. Information regarding the operation of the SEC's Public Reference Room may be obtained by calling 1-800-SEC-0330.
For a complete list of a fund's portfolio holdings, view the most recent holdings listing, semiannual report, or annual report on Fidelity's web site at http://www.fidelity.com, http://www.institutional.fidelity.com, or http://www.401k.com, as applicable.
NOT FDIC INSURED •MAY LOSE VALUE •NO BANK GUARANTEE
Neither the Funds nor Fidelity Distributors Corporation is a bank.
Item 7: Financial Statements and Financial Highlights for Open-End Management Investment Companies (Annual Report)
Fidelity® Series 0-5 Year Inflation-Protected Bond Index Fund
Schedule of Investments December 31, 2024
Showing Percentage of Net Assets
| U.S. Treasury Obligations - 99.7% |
| | | Yield (%) (a) | Principal Amount (b) | Value ($) |
| US Treasury Bonds Inflation-Indexed 1.75% 1/15/2028 | | 1.24 to 1.92 | 178,853,599 | 177,581,786 |
| US Treasury Bonds Inflation-Indexed 2% 1/15/2026 | | -1.98 to 2.65 | 117,027,020 | 117,042,352 |
| US Treasury Bonds Inflation-Indexed 2.375% 1/15/2025 | | -2.33 to 4.87 | 296,246,663 | 296,062,671 |
| US Treasury Bonds Inflation-Indexed 2.375% 1/15/2027 | | -1.27 to 2.18 | 224,994,785 | 227,180,194 |
| US Treasury Bonds Inflation-Indexed 2.5% 1/15/2029 | | 1.71 to 1.89 | 171,432,316 | 174,482,521 |
| US Treasury Bonds Inflation-Indexed 3.625% 4/15/2028 | | 1.10 to 1.91 | 24,981,504 | 26,224,574 |
| US Treasury Bonds Inflation-Indexed 3.875% 4/15/2029 | | 1.49 to 2.29 | 196,818,450 | 211,153,206 |
| US Treasury Notes Inflation-Indexed 0.125% 10/15/2025 | | -2.10 to 2.47 | 423,035,940 | 418,165,175 |
| US Treasury Notes Inflation-Indexed 0.125% 10/15/2026 | | -1.83 to 1.97 | 413,782,127 | 402,340,472 |
| US Treasury Notes Inflation-Indexed 0.125% 4/15/2025 | | -2.19 to 3.97 | 336,169,400 | 334,085,192 |
| US Treasury Notes Inflation-Indexed 0.125% 4/15/2026 | | -1.89 to 2.54 | 331,767,682 | 323,853,006 |
| US Treasury Notes Inflation-Indexed 0.125% 4/15/2027 | | -0.44 to 1.89 | 469,112,800 | 449,713,635 |
| US Treasury Notes Inflation-Indexed 0.125% 7/15/2026 | | -1.91 to 2.32 | 415,799,583 | 406,131,837 |
| US Treasury Notes Inflation-Indexed 0.25% 1/15/2025 | | -2.29 to 4.90 | 416,285,071 | 415,679,029 |
| US Treasury Notes Inflation-Indexed 0.25% 7/15/2029 | | 1.59 to 1.80 | 335,047,290 | 310,392,474 |
| US Treasury Notes Inflation-Indexed 0.375% 1/15/2027 | | -1.74 to 2.40 | 336,090,748 | 325,924,639 |
| US Treasury Notes Inflation-Indexed 0.375% 7/15/2025 | | -2.21 to 2.84 | 416,799,426 | 414,287,969 |
| US Treasury Notes Inflation-Indexed 0.375% 7/15/2027 | | -0.17 to 1.69 | 271,054,822 | 261,623,381 |
| US Treasury Notes Inflation-Indexed 0.5% 1/15/2028 | | 1.40 to 1.85 | 420,963,894 | 402,506,982 |
| US Treasury Notes Inflation-Indexed 0.625% 1/15/2026 | | -1.97 to 2.71 | 390,973,677 | 385,617,434 |
| US Treasury Notes Inflation-Indexed 0.75% 7/15/2028 | | 1.66 to 1.76 | 345,949,254 | 332,349,955 |
| US Treasury Notes Inflation-Indexed 0.875% 1/15/2029 | | 1.67 to 1.89 | 318,660,686 | 304,315,392 |
| US Treasury Notes Inflation-Indexed 1.25% 4/15/2028 | | 1.27 to 1.96 | 523,353,547 | 510,007,518 |
| US Treasury Notes Inflation-Indexed 1.625% 10/15/2027 | | 1.32 to 2.23 | 517,673,338 | 514,651,684 |
| US Treasury Notes Inflation-Indexed 1.625% 10/15/2029 | | 1.77 to 1.99 | 479,284,819 | 471,368,778 |
| US Treasury Notes Inflation-Indexed 2.125% 4/15/2029 | | 1.48 to 2.29 | 470,796,044 | 471,480,330 |
| US Treasury Notes Inflation-Indexed 2.375% 10/15/2028 | | 1.38 to 2.43 | 423,984,726 | 430,640,729 |
| TOTAL U.S. TREASURY OBLIGATIONS (Cost $9,217,516,971) | | | | 9,114,862,915 |
| | | | | |
| Money Market Funds - 0.0% |
| | | Yield (%) | Shares | Value ($) |
Fidelity Cash Central Fund (c) (Cost $3,312,713) | | 4.36 | 3,312,051 | 3,312,713 |
| | | | | |
| TOTAL INVESTMENT IN SECURITIES - 99.7% (Cost $9,220,829,684) | 9,118,175,628 |
NET OTHER ASSETS (LIABILITIES) - 0.3% | 29,017,336 |
| NET ASSETS - 100.0% | 9,147,192,964 |
| | |
Legend
| (a) | Yield represents either the annualized yield at the date of purchase, or the stated coupon rate, or, for floating and adjustable rate securities, the rate at period end. |
| (b) | Amount is stated in United States dollars unless otherwise noted. |
| (c) | Affiliated fund that is generally available only to investment companies and other accounts managed by Fidelity Investments. The rate quoted is the annualized seven-day yield of the fund at period end. A complete unaudited listing of the fund's holdings as of its most recent quarter end is available upon request. In addition, each Fidelity Central Fund's financial statements, which are not covered by the Fund's Report of Independent Registered Public Accounting Firm, are available on the SEC's website or upon request. |
Affiliated Central Funds
Fiscal year to date information regarding the Fund's investments in Fidelity Central Funds, including the ownership percentage, is presented below.
| Affiliate | Value, beginning of period ($) | Purchases ($) | Sales Proceeds ($) | Dividend Income ($) | Realized Gain (loss) ($) | Change in Unrealized appreciation (depreciation) ($) | Value, end of period ($) | Shares, end of period | % ownership, end of period |
| Fidelity Cash Central Fund | 86,324,413 | 2,086,913,681 | 2,169,925,277 | 6,985,121 | (104) | - | 3,312,713 | 3,312,051 | 0.0% |
| Total | 86,324,413 | 2,086,913,681 | 2,169,925,277 | 6,985,121 | (104) | - | 3,312,713 | 3,312,051 | |
| | | | | | | | | | |
Amounts in the dividend income column in the above table include any capital gain distributions from underlying funds, which are presented in the corresponding line item in the Statement of Operations, if applicable.
Amounts included in the purchases and sales proceeds columns may include in-kind transactions, if applicable.
Investment Valuation
The following is a summary of the inputs used, as of December 31, 2024, involving the Fund's assets and liabilities carried at fair value. The inputs or methodology used for valuing securities may not be an indication of the risk associated with investing in those securities. For more information on valuation inputs, and their aggregation into the levels used below, please refer to the Investment Valuation section in the accompanying Notes to Financial Statements.
| Valuation Inputs at Reporting Date: |
| Description | Total ($) | Level 1 ($) | Level 2 ($) | Level 3 ($) |
Investments in Securities: | | | | |
|
| U.S. Treasury Obligations | 9,114,862,915 | - | 9,114,862,915 | - |
|
| Money Market Funds | 3,312,713 | 3,312,713 | - | - |
| Total Investments in Securities: | 9,118,175,628 | 3,312,713 | 9,114,862,915 | - |
Fidelity® Series 0-5 Year Inflation-Protected Bond Index Fund
Financial Statements
| Statement of Assets and Liabilities |
As of December 31, 2024 |
| Assets | | | | |
| Investment in securities, at value - See accompanying schedule: | | | | |
Unaffiliated issuers (cost $9,217,516,971) | $ | 9,114,862,915 | | |
Fidelity Central Funds (cost $3,312,713) | | 3,312,713 | | |
| | | | | |
| | | | | |
| Total Investment in Securities (cost $9,220,829,684) | | | $ | 9,118,175,628 |
| Receivable for investments sold | | | | 258,308,207 |
| Receivable for fund shares sold | | | | 7,383,457 |
| Interest receivable | | | | 29,830,677 |
| Distributions receivable from Fidelity Central Funds | | | | 43,232 |
Total assets | | | | 9,413,741,201 |
| Liabilities | | | | |
| Payable for investments purchased | $ | 207,600,045 | | |
| Payable for fund shares redeemed | | 58,939,323 | | |
| Other payables and accrued expenses | | 8,869 | | |
| Total liabilities | | | | 266,548,237 |
| Net Assets | | | $ | 9,147,192,964 |
| Net Assets consist of: | | | | |
| Paid in capital | | | $ | 9,382,866,349 |
| Total accumulated earnings (loss) | | | | (235,673,385) |
| Net Assets | | | $ | 9,147,192,964 |
Net Asset Value, offering price and redemption price per share ($9,147,192,964 ÷ 947,255,571 shares) | | | $ | 9.66 |
| Statement of Operations |
| Year ended December 31, 2024 |
| Investment Income | | | | |
| Interest | | | $ | 257,445,363 |
| Income from Fidelity Central Funds | | | | 6,985,121 |
| Total income | | | | 264,430,484 |
| Expenses | | | | |
| Custodian fees and expenses | $ | 30,922 | | |
| Independent trustees' fees and expenses | | 20,398 | | |
| Miscellaneous | | 1 | | |
| Total expenses before reductions | | 51,321 | | |
| Expense reductions | | (8,024) | | |
| Total expenses after reductions | | | | 43,297 |
| Net Investment income (loss) | | | | 264,387,187 |
| Realized and Unrealized Gain (Loss) | | | | |
| Net realized gain (loss) on: | | | | |
| Investment Securities: | | | | |
| Unaffiliated issuers | | (42,176,195) | | |
| Fidelity Central Funds | | (104) | | |
| Total net realized gain (loss) | | | | (42,176,299) |
| Change in net unrealized appreciation (depreciation) on investment securities | | | | 146,117,915 |
| Net gain (loss) | | | | 103,941,616 |
| Net increase (decrease) in net assets resulting from operations | | | $ | 368,328,803 |
| Statement of Changes in Net Assets |
| |
| | Year ended December 31, 2024 | | Year ended December 31, 2023 |
| Increase (Decrease) in Net Assets | | | | |
| Operations | | | | |
| Net investment income (loss) | $ | 264,387,187 | $ | 190,535,717 |
| Net realized gain (loss) | | (42,176,299) | | (80,571,468) |
| Change in net unrealized appreciation (depreciation) | | 146,117,915 | | 194,932,184 |
| Net increase (decrease) in net assets resulting from operations | | 368,328,803 | | 304,896,433 |
| Distributions to shareholders | | (224,620,483) | | (172,713,221) |
| Distributions to shareholders from tax return of capital | | (15,688,981) | | - |
| | | | | |
| Total Distributions | | (240,309,464) | | (172,713,221) |
| Share transactions | | | | |
| Proceeds from sales of shares | | 3,326,150,090 | | 1,554,558,912 |
| Reinvestment of distributions | | 240,309,464 | | 172,713,220 |
| Cost of shares redeemed | | (1,687,529,375) | | (1,226,661,924) |
| | | | | |
Net increase (decrease) in net assets resulting from share transactions | | 1,878,930,179 | | 500,610,208 |
| Total increase (decrease) in net assets | | 2,006,949,518 | | 632,793,420 |
| | | | | |
| Net Assets | | | | |
| Beginning of period | | 7,140,243,446 | | 6,507,450,026 |
| End of period | $ | 9,147,192,964 | $ | 7,140,243,446 |
| | | | | |
| Other Information | | | | |
| Shares | | | | |
| Sold | | 342,018,194 | | 164,186,153 |
| Issued in reinvestment of distributions | | 24,825,599 | | 18,315,070 |
| Redeemed | | (173,400,296) | | (129,737,211) |
| Net increase (decrease) | | 193,443,497 | | 52,764,012 |
| | | | | |
Financial Highlights
Fidelity® Series 0-5 Year Inflation-Protected Bond Index Fund |
| |
| Years ended December 31, | | 2024 | | 2023 | | 2022 | | 2021 A |
Selected Per-Share Data | | | | | | | | |
| Net asset value, beginning of period | $ | 9.47 | $ | 9.28 | $ | 10.05 | $ | 10.00 |
| Income from Investment Operations | | | | | | | | |
Net investment income (loss) B,C | | .314 | | .265 | | .531 | | .127 |
| Net realized and unrealized gain (loss) | | .145 | | .166 | | (.814) | | .005 |
| Total from investment operations | | .459 | | .431 | | (.283) | | .132 |
| Distributions from net investment income | | (.251) | | (.241) | | (.477) | | (.071) |
| Distributions from tax return of capital | | (.018) | | - | | (.010) | | (.011) |
| Total distributions | | (.269) | | (.241) | | (.487) | | (.082) |
| Net asset value, end of period | $ | 9.66 | $ | 9.47 | $ | 9.28 | $ | 10.05 |
Total Return D,E | | | | 4.65% | | (2.84)% | | 1.33% |
Ratios to Average Net Assets C,F,G | | | | | | | | |
Expenses before reductions H | | -% | | -% | | -% | | -% I |
Expenses net of fee waivers, if any H | | | | -% | | -% | | -% I |
Expenses net of all reductions H | | -% | | -% | | -% | | -% I |
| Net investment income (loss) | | 3.26% | | 2.81% | | 5.38% | | 3.33% I |
| Supplemental Data | | | | | | | | |
| Net assets, end of period (000 omitted) | $ | 9,147,193 | $ | 7,140,243 | $ | 6,507,450 | $ | 4,199,988 |
Portfolio turnover rate J | | | | 31% | | 21% K | | 33% K |
AFor the period August 13, 2021 (commencement of operations) through December 31, 2021.
BCalculated based on average shares outstanding during the period.
CNet investment income (loss) is affected by the timing of the declaration of dividends by any underlying mutual funds or exchange-traded funds (ETFs). Net investment income (loss) of any mutual funds or ETFs is not included in the Fund's net investment income (loss) ratio.
DTotal returns for periods of less than one year are not annualized.
ETotal returns would have been lower if certain expenses had not been reduced during the applicable periods shown.
FFees and expenses of any underlying mutual funds or exchange-traded funds (ETFs) are not included in the Fund's expense ratio. The Fund indirectly bears its proportionate share of these expenses. For additional expense information related to investments in Fidelity Central Funds, please refer to the "Investments in Fidelity Central Funds" note found in the Notes to Financial Statements section of the most recent Annual or Semi-Annual report.
GExpense ratios reflect operating expenses of the class. Expenses before reductions do not reflect amounts reimbursed, waived, or reduced through arrangements with the investment adviser, brokerage services, or other offset arrangements, if applicable, and do not represent the amount paid by the class during periods when reimbursements, waivers or reductions occur.
HAmount represents less than .005%.
IAnnualized.
JAmount does not include the portfolio activity of any underlying mutual funds or exchange-traded funds (ETFs), derivatives or securities that mature within one year from acquisition.
KPortfolio turnover rate excludes securities received or delivered in-kind.
Fidelity® Series 5+ Year Inflation-Protected Bond Index Fund
Schedule of Investments December 31, 2024
Showing Percentage of Net Assets
| U.S. Treasury Obligations - 99.5% |
| | | Yield (%) (a) | Principal Amount (b) | Value ($) |
| US Treasury Bonds Inflation-Indexed 0.125% 2/15/2051 | | -0.53 to 2.31 | 335,917,760 | 185,087,801 |
| US Treasury Bonds Inflation-Indexed 0.125% 2/15/2052 | | -0.15 to 1.73 | 437,818,095 | 237,834,293 |
| US Treasury Bonds Inflation-Indexed 0.25% 2/15/2050 | | -0.56 to 1.32 | 197,097,884 | 115,070,363 |
| US Treasury Bonds Inflation-Indexed 0.625% 2/15/2043 | | -0.58 to 2.27 | 271,707,250 | 199,211,976 |
| US Treasury Bonds Inflation-Indexed 0.75% 2/15/2042 | | -0.62 to 2.43 | 387,671,710 | 297,274,438 |
| US Treasury Bonds Inflation-Indexed 0.75% 2/15/2045 | | -0.53 to 2.04 | 358,901,449 | 260,293,569 |
| US Treasury Bonds Inflation-Indexed 0.875% 2/15/2047 | | -0.53 to 2.45 | 302,819,458 | 219,269,223 |
| US Treasury Bonds Inflation-Indexed 1% 2/15/2046 | | -0.53 to 1.89 | 380,230,432 | 286,644,322 |
| US Treasury Bonds Inflation-Indexed 1% 2/15/2048 | | -0.53 to 2.52 | 210,235,219 | 154,914,860 |
| US Treasury Bonds Inflation-Indexed 1% 2/15/2049 | | -0.54 to 2.38 | 130,633,405 | 95,286,677 |
| US Treasury Bonds Inflation-Indexed 1.375% 2/15/2044 | | -0.55 to 2.49 | 305,854,223 | 254,707,881 |
| US Treasury Bonds Inflation-Indexed 1.5% 2/15/2053 | | 1.43 to 2.56 | 244,243,900 | 195,801,972 |
| US Treasury Bonds Inflation-Indexed 2.125% 2/15/2040 | | -0.74 to 1.92 | 139,384,842 | 134,588,052 |
| US Treasury Bonds Inflation-Indexed 2.125% 2/15/2041 | | -0.70 to 2.36 | 253,058,079 | 244,985,322 |
| US Treasury Bonds Inflation-Indexed 2.125% 2/15/2054 | | 2.00 to 2.49 | 287,065,514 | 265,948,319 |
| US Treasury Bonds Inflation-Indexed 3.375% 4/15/2032 | | -1.11 to 1.74 | 114,144,184 | 123,591,026 |
| US Treasury Notes Inflation-Indexed 0.125% 1/15/2030 | | -1.27 to 2.28 | 650,694,172 | 591,164,065 |
| US Treasury Notes Inflation-Indexed 0.125% 1/15/2031 | | -1.15 to 2.11 | 767,932,723 | 681,786,230 |
| US Treasury Notes Inflation-Indexed 0.125% 1/15/2032 | | -0.71 to 2.47 | 902,368,275 | 782,512,272 |
| US Treasury Notes Inflation-Indexed 0.125% 7/15/2030 | | -1.25 to 2.17 | 759,259,842 | 684,561,418 |
| US Treasury Notes Inflation-Indexed 0.125% 7/15/2031 | | -1.13 to 2.09 | 762,041,813 | 671,043,040 |
| US Treasury Notes Inflation-Indexed 0.625% 7/15/2032 | | 0.09 to 2.03 | 823,086,944 | 735,919,559 |
| US Treasury Notes Inflation-Indexed 1.125% 1/15/2033 | | 1.15 to 1.93 | 884,866,200 | 814,211,701 |
| US Treasury Notes Inflation-Indexed 1.375% 7/15/2033 | | 1.57 to 2.49 | 863,196,785 | 807,800,383 |
| US Treasury Notes Inflation-Indexed 1.75% 1/15/2034 | | 1.69 to 2.25 | 881,499,544 | 845,330,572 |
| US Treasury Notes Inflation-Indexed 1.875% 7/15/2034 | | 1.55 to 2.24 | 932,049,735 | 903,361,268 |
| TOTAL U.S. TREASURY OBLIGATIONS (Cost $12,465,894,673) | | | | 10,788,200,602 |
| | | | | |
| Money Market Funds - 0.1% |
| | | Yield (%) | Shares | Value ($) |
Fidelity Cash Central Fund (c) (Cost $9,356,380) | | 4.36 | 9,354,510 | 9,356,380 |
| | | | | |
| TOTAL INVESTMENT IN SECURITIES - 99.6% (Cost $12,475,251,053) | 10,797,556,982 |
NET OTHER ASSETS (LIABILITIES) - 0.4% | 44,922,554 |
| NET ASSETS - 100.0% | 10,842,479,536 |
| | |
Legend
| (a) | Yield represents either the annualized yield at the date of purchase, or the stated coupon rate, or, for floating and adjustable rate securities, the rate at period end. |
| (b) | Amount is stated in United States dollars unless otherwise noted. |
| (c) | Affiliated fund that is generally available only to investment companies and other accounts managed by Fidelity Investments. The rate quoted is the annualized seven-day yield of the fund at period end. A complete unaudited listing of the fund's holdings as of its most recent quarter end is available upon request. In addition, each Fidelity Central Fund's financial statements, which are not covered by the Fund's Report of Independent Registered Public Accounting Firm, are available on the SEC's website or upon request. |
Affiliated Central Funds
Fiscal year to date information regarding the Fund's investments in Fidelity Central Funds, including the ownership percentage, is presented below.
| Affiliate | Value, beginning of period ($) | Purchases ($) | Sales Proceeds ($) | Dividend Income ($) | Realized Gain (loss) ($) | Change in Unrealized appreciation (depreciation) ($) | Value, end of period ($) | Shares, end of period | % ownership, end of period |
| Fidelity Cash Central Fund | 1,277,209 | 547,137,820 | 539,057,071 | 445,999 | (1,578) | - | 9,356,380 | 9,354,510 | 0.0% |
| Total | 1,277,209 | 547,137,820 | 539,057,071 | 445,999 | (1,578) | - | 9,356,380 | 9,354,510 | |
| | | | | | | | | | |
Amounts in the dividend income column in the above table include any capital gain distributions from underlying funds, which are presented in the corresponding line item in the Statement of Operations, if applicable.
Amounts included in the purchases and sales proceeds columns may include in-kind transactions, if applicable.
Investment Valuation
The following is a summary of the inputs used, as of December 31, 2024, involving the Fund's assets and liabilities carried at fair value. The inputs or methodology used for valuing securities may not be an indication of the risk associated with investing in those securities. For more information on valuation inputs, and their aggregation into the levels used below, please refer to the Investment Valuation section in the accompanying Notes to Financial Statements.
| Valuation Inputs at Reporting Date: |
| Description | Total ($) | Level 1 ($) | Level 2 ($) | Level 3 ($) |
Investments in Securities: | | | | |
|
| U.S. Treasury Obligations | 10,788,200,602 | - | 10,788,200,602 | - |
|
| Money Market Funds | 9,356,380 | 9,356,380 | - | - |
| Total Investments in Securities: | 10,797,556,982 | 9,356,380 | 10,788,200,602 | - |
Fidelity® Series 5+ Year Inflation-Protected Bond Index Fund
Financial Statements
| Statement of Assets and Liabilities |
As of December 31, 2024 |
| Assets | | | | |
| Investment in securities, at value - See accompanying schedule: | | | | |
Unaffiliated issuers (cost $12,465,894,673) | $ | 10,788,200,602 | | |
Fidelity Central Funds (cost $9,356,380) | | 9,356,380 | | |
| | | | | |
| | | | | |
| Total Investment in Securities (cost $12,475,251,053) | | | $ | 10,797,556,982 |
| Receivable for fund shares sold | | | | 55,437,946 |
| Interest receivable | | | | 45,920,352 |
| Distributions receivable from Fidelity Central Funds | | | | 34,062 |
Total assets | | | | 10,898,949,342 |
| Liabilities | | | | |
| Payable for investments purchased | $ | 47,656,000 | | |
| Payable for fund shares redeemed | | 8,803,268 | | |
| Other payables and accrued expenses | | 10,538 | | |
| Total liabilities | | | | 56,469,806 |
| Net Assets | | | $ | 10,842,479,536 |
| Net Assets consist of: | | | | |
| Paid in capital | | | $ | 13,486,011,587 |
| Total accumulated earnings (loss) | | | | (2,643,532,051) |
| Net Assets | | | $ | 10,842,479,536 |
Net Asset Value, offering price and redemption price per share ($10,842,479,536 ÷ 1,471,756,492 shares) | | | $ | 7.37 |
| Statement of Operations |
| Year ended December 31, 2024 |
| Investment Income | | | | |
| Interest | | | $ | 393,588,960 |
| Income from Fidelity Central Funds | | | | 445,999 |
| Total income | | | | 394,034,959 |
| Expenses | | | | |
| Custodian fees and expenses | $ | 41,690 | | |
| Independent trustees' fees and expenses | | 26,872 | | |
| Miscellaneous | | 2 | | |
| Total expenses | | | | 68,564 |
| Net Investment income (loss) | | | | 393,966,395 |
| Realized and Unrealized Gain (Loss) | | | | |
| Net realized gain (loss) on: | | | | |
| Investment Securities: | | | | |
| Unaffiliated issuers | | (369,491,257) | | |
| Fidelity Central Funds | | (1,578) | | |
| Total net realized gain (loss) | | | | (369,492,835) |
| Change in net unrealized appreciation (depreciation) on investment securities | | | | (82,492,244) |
| Net gain (loss) | | | | (451,985,079) |
| Net increase (decrease) in net assets resulting from operations | | | $ | (58,018,684) |
| Statement of Changes in Net Assets |
| |
| | Year ended December 31, 2024 | | Year ended December 31, 2023 |
| Increase (Decrease) in Net Assets | | | | |
| Operations | | | | |
| Net investment income (loss) | $ | 393,966,395 | $ | 339,995,932 |
| Net realized gain (loss) | | (369,492,835) | | (467,469,438) |
| Change in net unrealized appreciation (depreciation) | | (82,492,244) | | 375,327,641 |
| Net increase (decrease) in net assets resulting from operations | | (58,018,684) | | 247,854,135 |
| Distributions to shareholders | | (352,832,046) | | (314,692,881) |
| Distributions to shareholders from tax return of capital | | (20,783,643) | | - |
| | | | | |
| Total Distributions | | (373,615,689) | | (314,692,881) |
| Share transactions | | | | |
| Proceeds from sales of shares | | 2,862,067,705 | | 2,245,894,953 |
| Reinvestment of distributions | | 373,615,689 | | 314,692,850 |
| Cost of shares redeemed | | (1,846,064,557) | | (1,193,542,124) |
| | | | | |
Net increase (decrease) in net assets resulting from share transactions | | 1,389,618,837 | | 1,367,045,679 |
| Total increase (decrease) in net assets | | 957,984,464 | | 1,300,206,933 |
| | | | | |
| Net Assets | | | | |
| Beginning of period | | 9,884,495,072 | | 8,584,288,139 |
| End of period | $ | 10,842,479,536 | $ | 9,884,495,072 |
| | | | | |
| Other Information | | | | |
| Shares | | | | |
| Sold | | 373,482,174 | | 288,482,846 |
| Issued in reinvestment of distributions | | 48,914,975 | | 41,460,846 |
| Redeemed | | (241,211,094) | | (153,699,188) |
| Net increase (decrease) | | 181,186,055 | | 176,244,504 |
| | | | | |
Financial Highlights
Fidelity® Series 5+ Year Inflation-Protected Bond Index Fund |
| |
| Years ended December 31, | | 2024 | | 2023 | | 2022 | | 2021 A |
Selected Per-Share Data | | | | | | | | |
| Net asset value, beginning of period | $ | 7.66 | $ | 7.70 | $ | 10.13 | $ | 10.00 |
| Income from Investment Operations | | | | | | | | |
Net investment income (loss) B,C | | .287 | | .290 | | .579 | | .158 |
| Net realized and unrealized gain (loss) | | (.313) | | (.077) | | (2.494) | | .061 |
| Total from investment operations | | (.026) | | .213 | | (1.915) | | .219 |
| Distributions from net investment income | | (.249) | | (.253) | | (.514) | | (.089) |
| Distributions from net realized gain | | - | | - | | (.001) | | - |
| Distributions from tax return of capital | | (.015) | | - | | - | | - |
| Total distributions | | (.264) | | (.253) | | (.515) | | (.089) |
| Net asset value, end of period | $ | 7.37 | $ | 7.66 | $ | 7.70 | $ | 10.13 |
Total Return D,E | | | | 2.81% | | (19.04)% | | 2.21% |
Ratios to Average Net Assets C,F,G | | | | | | | | |
Expenses before reductions H | | -% | | -% | | -% | | -% I |
Expenses net of fee waivers, if any H | | | | -% | | -% | | -% I |
Expenses net of all reductions H | | -% | | -% | | -% | | -% I |
| Net investment income (loss) | | 3.76% | | 3.73% | | 6.57% | | 4.16% I |
| Supplemental Data | | | | | | | | |
| Net assets, end of period (000 omitted) | $ | 10,842,480 | $ | 9,884,495 | $ | 8,584,288 | $ | 7,218,254 |
Portfolio turnover rate J | | | | 31% | | 31% K | | 31% K |
AFor the period August 13, 2021 (commencement of operations) through December 31, 2021.
BCalculated based on average shares outstanding during the period.
CNet investment income (loss) is affected by the timing of the declaration of dividends by any underlying mutual funds or exchange-traded funds (ETFs). Net investment income (loss) of any mutual funds or ETFs is not included in the Fund's net investment income (loss) ratio.
DTotal returns for periods of less than one year are not annualized.
ETotal returns would have been lower if certain expenses had not been reduced during the applicable periods shown.
FFees and expenses of any underlying mutual funds or exchange-traded funds (ETFs) are not included in the Fund's expense ratio. The Fund indirectly bears its proportionate share of these expenses. For additional expense information related to investments in Fidelity Central Funds, please refer to the "Investments in Fidelity Central Funds" note found in the Notes to Financial Statements section of the most recent Annual or Semi-Annual report.
GExpense ratios reflect operating expenses of the class. Expenses before reductions do not reflect amounts reimbursed, waived, or reduced through arrangements with the investment adviser, brokerage services, or other offset arrangements, if applicable, and do not represent the amount paid by the class during periods when reimbursements, waivers or reductions occur.
HAmount represents less than .005%.
IAnnualized.
JAmount does not include the portfolio activity of any underlying mutual funds or exchange-traded funds (ETFs), derivatives or securities that mature within one year from acquisition.
KPortfolio turnover rate excludes securities received or delivered in-kind.
Notes to Financial Statements
For the period ended December 31, 2024
1. Organization.
Fidelity Series 0-5 Year Inflation-Protected Bond Index Fund and Fidelity Series 5+ Year Inflation-Protected Bond Index Fund (the Funds) are funds of Fidelity Salem Street Trust (the Trust). The Trust is registered under the Investment Company Act of 1940, as amended (the 1940 Act), as an open-end management investment company organized as a Massachusetts business trust. Each Fund is authorized to issue an unlimited number of shares. Shares are offered only to certain other Fidelity funds, Fidelity managed 529 plans, and Fidelity managed collective investment trusts.
2. Investments in Fidelity Central Funds.
Funds may invest in Fidelity Central Funds, which are open-end investment companies generally available only to other investment companies and accounts managed by the investment adviser and its affiliates. The Schedule of Investments lists any Fidelity Central Funds held as an investment as of period end, but does not include the underlying holdings of each Fidelity Central Fund. An investing fund indirectly bears its proportionate share of the expenses of the underlying Fidelity Central Funds.
Based on its investment objective, each Fidelity Central Fund may invest or participate in various investment vehicles or strategies that are similar to those of the investing fund. These strategies are consistent with the investment objectives of the investing fund and may involve certain economic risks which may cause a decline in value of each of the Fidelity Central Funds and thus a decline in the value of the investing fund.
| Fidelity Central Fund | Investment Manager | Investment Objective | Investment Practices | Expense RatioA |
| Fidelity Money Market Central Funds | Fidelity Management & Research Company LLC (FMR) | Each fund seeks to obtain a high level of current income consistent with the preservation of capital and liquidity. | Short-term Investments | Less than .005% |
A Expenses expressed as a percentage of average net assets and are as of each underlying Central Fund's most recent annual or semi-annual shareholder report.
A complete unaudited list of holdings for each Fidelity Central Fund is available upon request or at the Securities and Exchange Commission website at www.sec.gov. In addition, the financial statements of the Fidelity Central Funds which contain the significant accounting policies (including investment valuation policies) of those funds, and are not covered by the Report of Independent Registered Public Accounting Firm, are available on the Securities and Exchange Commission website or upon request.
3. Significant Accounting Policies.
Each Fund is an investment company and applies the accounting and reporting guidance of the Financial Accounting Standards Board (FASB) Accounting Standards Codification Topic 946 Financial Services - Investment Companies. The financial statements have been prepared in conformity with accounting principles generally accepted in the United States of America (GAAP), which require management to make certain estimates and assumptions at the date of the financial statements. Actual results could differ from those estimates. Each Fund operates as a single operating segment. Each Fund's income, expenses, assets, and performance are regularly monitored and assessed as a whole by the investment adviser and other individuals responsible for oversight functions of the Trust, using the information presented in the financial statements and financial highlights. Subsequent events, if any, through the date that the financial statements were issued have been evaluated in the preparation of the financial statements. Each Fund's Schedule of Investments lists any underlying mutual funds or exchange-traded funds (ETFs) but does not include the underlying holdings of these funds. The following summarizes the significant accounting policies of each Fund:
Investment Valuation. Investments are valued as of 4:00 p.m. Eastern time on the last calendar day of the period. The Board of Trustees (the Board) has designated each Fund's investment adviser as the valuation designee responsible for the fair valuation function and performing fair value determinations as needed. The investment adviser has established a Fair Value Committee (the Committee) to carry out the day-to-day fair valuation responsibilities and has adopted policies and procedures to govern the fair valuation process and the activities of the Committee. In accordance with these fair valuation policies and procedures, which have been approved by the Board, each Fund attempts to obtain prices from one or more third party pricing services or brokers to value its investments. When current market prices, quotations or currency exchange rates are not readily available or reliable, investments will be fair valued in good faith by the Committee, in accordance with the policies and procedures. Factors used in determining fair value vary by investment type and may include market or investment specific events, transaction data, estimated cash flows, and market observations of comparable investments. The frequency that the fair valuation procedures are used cannot be predicted and they may be utilized to a significant extent. The Committee manages each Fund's fair valuation practices and maintains the fair valuation policies and procedures. Each Fund's investment adviser reports to the Board information regarding the fair valuation process and related material matters.
Each Fund categorizes the inputs to valuation techniques used to value its investments into a disclosure hierarchy consisting of three levels as shown below:
Level 1 - unadjusted quoted prices in active markets for identical investments
Level 2 - other significant observable inputs (including quoted prices for similar investments, interest rates, prepayment speeds, etc.)
Level 3 - unobservable inputs (including the Fund's own assumptions based on the best information available)
Valuation techniques used to value each Fund's investments by major category are as follows:
Debt securities, including restricted securities, are valued based on evaluated prices received from third party pricing services or from brokers who make markets in such securities. U.S. government and government agency obligations are valued by pricing services who utilize matrix pricing which considers yield or price of bonds of comparable quality, coupon, maturity and type or by broker-supplied prices. When independent prices are unavailable or unreliable, debt securities may be valued utilizing pricing methodologies which consider similar factors that would be used by third party pricing services. Debt securities are generally categorized as Level 2 in the hierarchy but may be Level 3 depending on the circumstances.
Investments in open-end mutual funds, including the Fidelity Central Funds, are valued at their closing net asset value (NAV) each business day and are categorized as Level 1 in the hierarchy.
Changes in valuation techniques may result in transfers in or out of an assigned level within the disclosure hierarchy. The aggregate value of investments by input level as of December 31, 2024 is included at the end of each Fund's Schedule of Investments.
Investment Transactions and Income. For financial reporting purposes, the Funds' investment holdings and NAV include trades executed through the end of the last business day of the period. The NAV per share for processing shareholder transactions is calculated as of the close of business of the New York Stock Exchange (NYSE), normally 4:00 p.m. Eastern time and includes trades executed through the end of the prior business day. Gains and losses on securities sold are determined on the basis of identified cost. Income and capital gain distributions from Fidelity Central Funds, if any, are recorded on the ex-dividend date. Interest income is accrued as earned and includes coupon interest and amortization of premium and accretion of discount on debt securities as applicable. For Treasury Inflation-Protected Securities (TIPS) the principal amount is adjusted daily to keep pace with inflation. Interest is accrued based on the adjusted principal amount. The adjustments to principal due to inflation are reflected as increases or decreases to Interest in the accompanying Statement of Operations. Such adjustments may result in negative Interest and may have a significant impact on the Fund's distributions.
Expenses. Expenses directly attributable to a fund are charged to that fund. Expenses attributable to more than one fund are allocated among the respective funds on the basis of relative net assets or other appropriate methods. Expenses included in the accompanying financial statements reflect the expenses of that fund and do not include any expenses associated with any underlying mutual funds or exchange-traded funds. Although not included in a fund's expenses, a fund indirectly bears its proportionate share of these expenses through the net asset value of each underlying mutual fund or exchange-traded fund. Expense estimates are accrued in the period to which they relate and adjustments are made when actual amounts are known.
Income Tax Information and Distributions to Shareholders. Each year, each Fund intends to qualify as a regulated investment company under Subchapter M of the Internal Revenue Code, including distributing substantially all of its taxable income and realized gains. As a result, no provision for U.S. Federal income taxes is required. As of December 31, 2024, each Fund did not have any unrecognized tax benefits in the financial statements; nor is each Fund aware of any tax positions for which it is reasonably possible that the total amounts of unrecognized tax benefits will significantly change in the next twelve months. Each Fund files a U.S. federal tax return, in addition to state and local tax returns as required. Each Fund's federal income tax returns are subject to examination by the Internal Revenue Service (IRS) for a period of three fiscal years after they are filed. State and local tax returns may be subject to examination for an additional fiscal year depending on the jurisdiction.
Distributions are declared and recorded daily and paid monthly from net investment income. Distributions from realized gains, if any, are declared and recorded on the ex-dividend date. Income and capital gain distributions are determined in accordance with income tax regulations, which may differ from GAAP.
Capital accounts within the financial statements are adjusted for permanent book-tax differences. These adjustments have no impact on net assets or the results of operations. Capital accounts are not adjusted for temporary book-tax differences which will reverse in a subsequent period.
Book-tax differences are primarily due to market discount, capital loss carryforwards, certain losses related to deflation adjustments on U.S. Treasury inflation-indexed securities and losses deferred due to wash sales.
As of period end, the cost and unrealized appreciation (depreciation) in securities, and derivatives if applicable, for federal income tax purposes were as follows for each Fund:
| | Tax cost ($) | Gross unrealized appreciation ($) | Gross unrealized depreciation ($) | Net unrealized appreciation (depreciation)($) |
Fidelity Series 0-5 Year Inflation-Protected Bond Index Fund | 9,171,449,017 | 18,691,323 | (71,964,712) | (53,273,389) |
Fidelity Series 5+ Year Inflation-Protected Bond Index Fund | 12,476,613,264 | 1,587,930 | (1,680,644,212) | (1,679,056,282) |
The tax-based components of distributable earnings as of period end were as follows for each Fund:
| | Capital loss carryforward ($) | Net unrealized appreciation (depreciation) on securities and other investments ($) |
Fidelity Series 0-5 Year Inflation-Protected Bond Index Fund | (182,399,997) | (53,273,389) |
Fidelity Series 5+ Year Inflation-Protected Bond Index Fund | (964,475,769) | (1,679,056,282) |
Capital loss carryforwards are only available to offset future capital gains of the Funds to the extent provided by regulations and may be limited. The capital loss carryforward information presented below, including any applicable limitation, is estimated as of fiscal period end and is subject to adjustment.
| | Short-term ($) | Long-term ($) | Total capital loss carryforward ($) |
Fidelity Series 0-5 Year Inflation-Protected Bond Index Fund | (75,211,962) | (107,188,035) | (182,399,997) |
Fidelity Series 5+ Year Inflation-Protected Bond Index Fund | (205,391,882) | (759,083,887) | (964,475,769) |
For the period ended December 31, 2024, each Fund's distributions exceeded the aggregate amount of taxable income and net realized gains resulting in a return of capital for tax purposes. This was due to reductions in taxable income available for distribution after certain distributions had been made.
The tax character of distributions paid was as follows:
| December 31, 2024 | | | |
| | Ordinary Income ($) | Tax Return of Capital ($) | Total ($) |
Fidelity Series 0-5 Year Inflation-Protected Bond Index Fund | 224,620,483 | 15,688,981 | 240,309,464 |
Fidelity Series 5+ Year Inflation-Protected Bond Index Fund | 352,832,046 | 20,783,643 | 373,615,689 |
| | | | |
| December 31, 2023 | |
| | Ordinary Income ($) |
Fidelity Series 0-5 Year Inflation-Protected Bond Index Fund | 172,713,221 |
Fidelity Series 5+ Year Inflation-Protected Bond Index Fund | 314,692,881 |
New Accounting Pronouncement. FASB Accounting Standards Update (ASU) 2023-07 Segment Reporting (Topic 280): Improvements to Reportable Segment Disclosures became effective in this reporting period. ASU 2023-07 enhances segment information disclosure in the notes to financial statements.
4. Fees and Other Transactions with Affiliates.
Management Fee. Fidelity Management & Research Company LLC (the investment adviser) and its affiliates provide the Funds with investment management related services for which the Funds do not pay a management fee. Under the management contract, the investment adviser or an affiliate pays all ordinary operating expenses of the Funds, except custody fees, fees and expenses of the independent Trustees, and certain miscellaneous expenses such as proxy and shareholder meeting expenses.
Interfund Trades. Funds may purchase from or sell securities to other Fidelity Funds under procedures adopted by the Board. The procedures have been designed to ensure these interfund trades are executed in accordance with Rule 17a-7 of the 1940 Act. Any interfund trades are included within the respective purchases and sales amounts shown in the Purchases and Sales of Investments note. During the period, there were no interfund trades.
Sub-Advisory Arrangements. Effective March 1, 2024, the Fund's sub-advisory agreements with FMR Investment Management (UK) Limited, Fidelity Management & Research (Hong Kong) Limited, and Fidelity Management & Research (Japan) Limited were amended to provide that the investment adviser pays each sub-adviser monthly fees equal to 110% of the sub-adviser's costs for providing sub-advisory services.
5. Committed Line of Credit.
Certain Funds participate with other funds managed by the investment adviser or an affiliate in a $4.25 billion credit facility (the "line of credit") to be utilized for temporary or emergency purposes to fund shareholder redemptions or for other short-term liquidity purposes.
Commitment fees are charged based on the unused amount of the line of credit at an annual rate of .10%, and then allocated to each participating fund based on its pro-rata portion of the line of credit. The commitment fees are borne by the investment adviser.
Interest is charged to a participating fund based on its borrowings at an annual rate of .75% plus the highest of (i) daily SOFR plus a .10% spread adjustment, (ii) Federal Funds Effective Rate, or (iii) Overnight Bank Funding Rate. During the period, there were no borrowings on this line of credit.
The line of credit agreement will expire in March 2025 unless extended or renewed.
6. Expense Reductions.
Through arrangements with each applicable Fund's custodian, credits realized as a result of certain uninvested cash balances were used to reduce each applicable Fund's expenses. All of the applicable expense reductions are noted in the table below.
| | Custodian credits ($) |
Fidelity Series 0-5 Year Inflation-Protected Bond Index Fund | 8,024 |
7. Other.
A fund's organizational documents provide former and current trustees and officers with a limited indemnification against liabilities arising in connection with the performance of their duties to the fund. In the normal course of business, a fund may also enter into contracts that provide general indemnifications. A fund's maximum exposure under these arrangements is unknown as this would be dependent on future claims that may be made against a fund. The risk of material loss from such claims is considered remote.
At the end of the period, mutual funds and accounts managed by the investment adviser or its affiliates were the owners of record of all of the outstanding shares of the Funds.
8. Risk and Uncertainties.
Many factors affect a fund's performance. Developments that disrupt global economies and financial markets, such as pandemics, epidemics, outbreaks of infectious diseases, war, terrorism, and environmental disasters, may significantly affect a fund's investment performance. The effects of these developments to a fund will be impacted by the types of securities in which a fund invests, the financial condition, industry, economic sector, and geographic location of an issuer, and a fund's level of investment in the securities of that issuer. Significant concentrations in security types, issuers, industries, sectors, and geographic locations may magnify the factors that affect a fund's performance.
Report of Independent Registered Public Accounting Firm
To the Board of Trustees of Fidelity Salem Street Trust and Shareholders of Fidelity Series 0-5 Year Inflation-Protected Bond Index Fund and Fidelity Series 5+ Year Inflation-Protected Bond Index Fund
Opinions on the Financial Statements
We have audited the accompanying statements of assets and liabilities, including the schedules of investments, of Fidelity Series 0-5 Year Inflation-Protected Bond Index Fund and Fidelity Series 5+ Year Inflation-Protected Bond Index Fund (two of the funds constituting Fidelity Salem Street Trust, hereafter collectively referred to as the "Funds") as of December 31, 2024, the related statements of operations for the year ended December 31, 2024, the statements of changes in net assets for each of the two years in the period ended December 31, 2024, including the related notes, and the financial highlights for each of the three years in the period ended December 31, 2024 and for the period August 13, 2021 (commencement of operations) through December 31, 2021 (collectively referred to as the "financial statements"). In our opinion, the financial statements present fairly, in all material respects, the financial position of each of the Funds as of December 31, 2024, the results of each of their operations for the year then ended, the changes in each of their net assets for each of the two years in the period ended December 31, 2024 and each of the financial highlights for each of the three years in the period ended December 31, 2024 and for the period August 13, 2021 (commencement of operations) through December 31, 2021 in conformity with accounting principles generally accepted in the United States of America.
Basis for Opinions
These financial statements are the responsibility of the Funds' management. Our responsibility is to express an opinion on the Funds' financial statements based on our audits. We are a public accounting firm registered with the Public Company Accounting Oversight Board (United States) (PCAOB) and are required to be independent with respect to the Funds in accordance with the U.S. federal securities laws and the applicable rules and regulations of the Securities and Exchange Commission and the PCAOB.
We conducted our audits of these financial statements in accordance with the standards of the PCAOB. Those standards require that we plan and perform the audit to obtain reasonable assurance about whether the financial statements are free of material misstatement, whether due to error or fraud.
Our audits included performing procedures to assess the risks of material misstatement of the financial statements, whether due to error or fraud, and performing procedures that respond to those risks. Such procedures included examining, on a test basis, evidence regarding the amounts and disclosures in the financial statements. Our audits also included evaluating the accounting principles used and significant estimates made by management, as well as evaluating the overall presentation of the financial statements. Our procedures included confirmation of securities owned as of December 31, 2024 by correspondence with the custodian and brokers; when replies were not received from brokers, we performed other auditing procedures. We believe that our audits provide a reasonable basis for our opinions.
/s/ PricewaterhouseCoopers LLP
Boston, Massachusetts
February 12, 2025
We have served as the auditor of one or more investment companies in the Fidelity group of funds since 1932.
Distributions
(Unaudited)The dividend and capital gains distributions for the fund(s) are available on Fidelity.com or Institutional.Fidelity.com.
A percentage of the dividends distributed during the fiscal year for the following funds were derived from interest on U.S. Government securities which is generally exempt from state income tax:
| Fidelity® Series 0-5 Year Inflation-Protected Bond Index Fund | 97.79% |
| Fidelity® Series 5+ Year Inflation-Protected Bond Index Fund | 99.91% |
The funds hereby designate the amounts noted below as distributions paid during the fiscal year ended 2024 as qualifying to be taxed as section 163(j) interest dividends:
| Fidelity® Series 0-5 Year Inflation-Protected Bond Index Fund | $224,709,701 |
| Fidelity® Series 5+ Year Inflation-Protected Bond Index Fund | $352,901,250 |
The funds will notify shareholders in January 2025 of amounts for use in preparing 2024 income tax returns.
Item 8: Changes in and Disagreements with Accountants for Open-End Management Investment Companies
(Unaudited)
Note: This is not applicable for any fund included in this document.
Item 9: Proxy Disclosures for Open-End Management Investment Companies
(Unaudited)
Note: This is not applicable for any fund included in this document.
Item 10: Remuneration Paid to Directors, Officers, and others of Open-End Management Investment Companies
(Unaudited)
Note: This information is disclosed as part of the financial statements for each Fund as part of Item 7: Financial Statements and Financial Highlights for Open-End Management Investment companies.
Item 11: Statement Regarding Basis for Approval of Investment Advisory Contract
(Unaudited)
Board Approval of Investment Advisory Contracts and Management Fees
Fidelity Series 0-5 Year Inflation-Protected Bond Index Fund
Fidelity Series 5+ Year Inflation-Protected Bond Index Fund
Each year, the Board of Trustees, including the Independent Trustees (together, the Board), considers the renewal of the fund's management contract with Fidelity Management & Research Company LLC (FMR) and the sub-advisory agreements (together, the Advisory Contracts) for each fund. FMR and the sub-advisers are referred to herein as the Investment Advisers. The Board, assisted by the advice of fund counsel and Independent Trustees' counsel, requests and considers a broad range of information relevant to the renewal of the Advisory Contracts throughout the year.
The Board meets regularly and, at each of its meetings, covers an extensive agenda of topics and materials and considers factors that are relevant to its annual consideration of the renewal of each fund's Advisory Contracts, including the services and support provided to each fund and its shareholders. The Board's Operations Committee, of which all the Independent Trustees are members, meets regularly throughout the year and requests, receives and considers, among other matters, information related to the annual consideration of the renewal of the fund's Advisory Contracts before making its recommendation to the Board. The Board also meets as needed to review matters specifically related to the Board's annual consideration of the renewal of the Advisory Contracts. Members of the Board may also meet from time to time with trustees of other Fidelity funds through joint ad hoc committees to discuss certain matters relevant to all of the Fidelity funds.
At its September 2024 meeting, the Board unanimously determined to renew each fund's Advisory Contracts. The Board considered all factors it believed relevant and reached a determination, with the assistance of fund counsel and Independent Trustees' counsel and through the exercise of its business judgment, that the renewal of the Advisory Contracts was in the best interests of each fund and its shareholders and the fact that no fee is payable under the management contract was fair and reasonable. The Board's decision to renew the Advisory Contracts was not based on any single factor and the factors may have been weighed differently by different Trustees.
Nature, Extent, and Quality of Services Provided. The Board considered staffing as it relates to the funds, including the backgrounds and experience of investment personnel of the Investment Advisers, and also considered the Investment Advisers' implementation of each fund's investment program. The Independent Trustees also had discussions with senior management of Fidelity's investment operations and investment groups. The Board considered the structure of the investment personnel compensation program and whether this structure provides appropriate incentives to act in the best interests of the funds.
Resources Dedicated to Investment Management and Support Services. The Board reviewed the general qualifications and capabilities of Fidelity's investment staff, including its size, education, experience, and resources, as well as Fidelity's approach to recruiting, training, managing, and compensating investment personnel. The Board noted the resources devoted to Fidelity's global investment organization, and that Fidelity's analysts have extensive resources, tools and capabilities that allow them to conduct quantitative and fundamental analysis, as well as credit analysis of issuers, counterparties and guarantors. Further, the Board considered that Fidelity's investment professionals have sufficient access to global information and data so as to provide competitive investment results over time, and that those professionals also have access to sophisticated tools that permit them to assess portfolio construction and risk and performance attribution characteristics continuously, as well as to transmit new information and research conclusions rapidly around the world. Additionally, in its deliberations, the Board considered Fidelity's trading, risk management, compliance, cybersecurity, and technology and operations capabilities and resources, which are integral parts of the investment management process.
Administrative Services. The Board considered (i) the nature, extent, quality, and cost of advisory and administrative services performed by the Investment Advisers and their affiliates under the Advisory Contracts and under separate agreements covering transfer agency and pricing and bookkeeping services for the fund; (ii) the nature and extent of Fidelity's supervision of third party service providers, principally custodians, subcustodians, and pricing vendors; and (iii) the resources devoted by Fidelity to, and the record of compliance with, the fund's compliance policies and procedures, including with respect to liquidity risk management. The Board also considered each fund's securities lending activities and any payments made to Fidelity relating to securities lending under a separate agreement.
Investment Performance. The Board reviewed each fund's absolute investment performance, as well as the fund's relative investment performance. In this regard, the Board noted that the funds are designed to offer an investment option for other investment companies, collective investment trusts, and 529 plans managed by Fidelity and ultimately to enhance the performance of those investment companies, collective investment trusts, and 529 plans.
Based on its review, the Board concluded that the nature, extent, and quality of services provided to each fund under the Advisory Contracts should continue to benefit the shareholders of each fund.
Competitiveness of Management Fee and Total Expense Ratio. The Board considered that each fund does not pay FMR a management fee for investment advisory services, but that FMR receives fees for providing services to funds, 529 plans and collective investment trusts that invest in each fund. The Board also noted that FMR or an affiliate undertakes to pay all operating expenses of each fund, except transfer agent fees, 12b-1 fees, Independent Trustee fees and expenses, custodian fees and expenses, proxy and shareholder meeting expenses, interest, taxes, and extraordinary expenses (such as litigation expenses). The Board further noted that each fund pays its non-operating expenses, including brokerage commissions and fees and expenses associated with the fund's securities lending program, if applicable.
The Board further considered that FMR has contractually agreed to reimburse each fund to the extent that total operating expenses, with certain exceptions, as a percentage of its average net assets, exceed 0.003% through April 30, 2027.
Based on its review, the Board considered that each fund does not pay a management fee and concluded that each fund's total expense ratio was reasonable in light of the services that the fund and its shareholders receive and the other factors considered.
Costs of the Services and Profitability. The Board considered the level of Fidelity's profits in respect of all the Fidelity funds.
A public accounting firm has been engaged annually by the Board as part of the Board's assessment of Fidelity's profitability analysis. The engagement includes the review and assessment of the methodologies used by Fidelity in determining the revenues and expenses attributable to Fidelity's fund business. After considering the reports issued under the engagement and information provided by Fidelity, the Board concluded that while other allocation methods may also be reasonable, Fidelity's profitability methodologies are reasonable in all material respects.
The Board also reviewed Fidelity's non-fund businesses and potential indirect benefits such businesses may have received as a result of their association with Fidelity's fund business (i.e., fall-out benefits) as well as cases where Fidelity's affiliates may benefit from the funds' business. The Board considered areas where potential indirect benefits to the Fidelity funds from their relationships with Fidelity may exist. The Board's consideration of these matters was informed by the findings of a joint ad hoc committee created by it and the boards of other Fidelity funds to evaluate potential fall-out benefits.
The Board concluded that the costs of the services provided by and the profits realized by Fidelity in connection with the operation of each fund were not relevant to the renewal of the Advisory Contracts because each fund pays no advisory fees and FMR or an affiliate bears all expenses of each fund, with limited exceptions.
Economies of Scale. The Board concluded that because each fund pays no advisory fees and FMR or an affiliate bears all expenses of each fund with certain limited exceptions, the realization of economies of scale was not a material factor in the Board's decision to renew each fund's Advisory Contracts.
Additional Information Requested by the Board. In order to develop fully the factual basis for consideration of the Fidelity funds' advisory contracts, the Board requested and received additional information on certain topics, including: (i) portfolio manager changes that have occurred during the past year; (ii) hiring, training, compensating, and retaining adviser and sub-adviser personnel; (iii) the terms of the funds' various management fee structures and arrangements for transfer agent and pricing and bookkeeping services; (iv) Fidelity's fund profitability methodology, profitability trends for certain funds, the allocation of various costs to different funds, and the impact of certain factors on fund profitability results; (v) the impact on fund profitability of recent industry trends, such as the growth in passively managed funds and the changes in flows for different types of funds; (vi) the types of management fee and total expense comparisons provided, and the challenges and limitations associated with such information; (vii) explanations regarding the relative total expense ratios and management fees of certain funds and classes, total expense and management fee competitive trends, and methodologies for total expense and management fee competitive comparisons; (viii) matters related to money market funds, exchange-traded funds, and target date funds; (ix) the arrangements with and compensation paid to certain fund sub-advisers and the treatment of such compensation within Fidelity's fund profitability methodology; and (x) the terms of management contracts between Fidelity and other funds and products not overseen by the Board.
Conclusion. Based on its evaluation of all of the conclusions noted above, and after considering all factors it believed relevant, the Board, including the Independent Trustees, concluded that the advisory and sub-advisory fee arrangements are fair and reasonable in light of all of the surrounding circumstances and that each fund's Advisory Contracts should be renewed through September 30, 2025.
1.9901939.103
SYI-ANN-0325
Fidelity® SAI Inflation-Protected Bond Index Fund
Annual Report
December 31, 2024
Offered exclusively to certain clients of the Adviser, or its affiliates, including Strategic Advisers LLC (Strategic Advisers) - not available for sale to the general public. Fidelity® SAI is a product name of Fidelity® funds dedicated to certain programs affiliated with Strategic Advisers.
Contents
To view a fund's proxy voting guidelines and proxy voting record for the 12-month period ended June 30, visit http://www.fidelity.com/proxyvotingresults or visit the Securities and Exchange Commission's (SEC) web site at http://www.sec.gov.
You may also call 1-800-544-3455 to request a free copy of the proxy voting guidelines.
BLOOMBERG ® is a trademark and service mark of Bloomberg Finance L.P. and its affiliates (collectively "Bloomberg"). Bloomberg or Bloomberg's licensors own all proprietary rights in the Bloomberg Indices. Neither Bloomberg nor Bloomberg's licensors approves or endorses this material, or guarantees the accuracy or completeness of any information herein, or makes any warranty, express or implied, as to the results to be obtained therefrom and, to the maximum extent allowed by law, neither shall have any liability or responsibility for injury or damages arising in connection therewith.
Standard & Poor's, S&P and S&P 500 are registered service marks of The McGraw-Hill Companies, Inc. and have been licensed for use by Fidelity Distributors Corporation.
Other third-party marks appearing herein are the property of their respective owners.
All other marks appearing herein are registered or unregistered trademarks or service marks of FMR LLC or an affiliated company. © 2025 FMR LLC. All rights reserved.
This report and the financial statements contained herein are submitted for the general information of the shareholders of the Fund. This report is not authorized for distribution to prospective investors in the Fund unless preceded or accompanied by an effective prospectus.
A fund files its complete schedule of portfolio holdings with the SEC for the first and third quarters of each fiscal year on Form N-PORT. Forms N-PORT are available on the SEC's web site at http://www.sec.gov. A fund's Forms N-PORT may be reviewed and copied at the SEC's Public Reference Room in Washington, DC. Information regarding the operation of the SEC's Public Reference Room may be obtained by calling 1-800-SEC-0330.
For a complete list of a fund's portfolio holdings, view the most recent holdings listing, semiannual report, or annual report on Fidelity's web site at http://www.fidelity.com, http://www.institutional.fidelity.com, or http://www.401k.com, as applicable.
NOT FDIC INSURED •MAY LOSE VALUE •NO BANK GUARANTEE
Neither the Fund nor Fidelity Distributors Corporation is a bank.
Item 7: Financial Statements and Financial Highlights for Open-End Management Investment Companies (Annual Report)
Fidelity® SAI Inflation-Protected Bond Index Fund
Schedule of Investments December 31, 2024
Showing Percentage of Net Assets
| U.S. Treasury Obligations - 99.4% |
| | | Yield (%) (a) | Principal Amount (b) | Value ($) |
| US Treasury Bonds Inflation-Indexed 0.125% 2/15/2051 | | 1.87 to 2.44 | 97,108,879 | 53,506,158 |
| US Treasury Bonds Inflation-Indexed 0.125% 2/15/2052 | | 1.94 to 2.44 | 136,156,665 | 73,963,878 |
| US Treasury Bonds Inflation-Indexed 0.25% 2/15/2050 | | 1.97 to 2.45 | 32,852,758 | 19,180,210 |
| US Treasury Bonds Inflation-Indexed 0.625% 2/15/2043 | | 1.82 to 2.30 | 200,948,941 | 147,332,968 |
| US Treasury Bonds Inflation-Indexed 0.75% 2/15/2042 | | 1.87 to 2.27 | 146,763,020 | 112,540,825 |
| US Treasury Bonds Inflation-Indexed 0.75% 2/15/2045 | | 1.92 to 2.50 | 100,490,448 | 72,880,780 |
| US Treasury Bonds Inflation-Indexed 0.875% 2/15/2047 | | 1.91 to 2.32 | 160,916,301 | 116,518,247 |
| US Treasury Bonds Inflation-Indexed 1% 2/15/2046 | | 1.94 to 2.21 | 100,342,098 | 75,644,899 |
| US Treasury Bonds Inflation-Indexed 1% 2/15/2048 | | 1.84 to 2.08 | 214,236,749 | 157,863,445 |
| US Treasury Bonds Inflation-Indexed 1% 2/15/2049 | | 1.90 to 2.24 | 103,130,342 | 75,225,381 |
| US Treasury Bonds Inflation-Indexed 1.375% 2/15/2044 | | 1.90 to 2.47 | 121,247,166 | 100,971,661 |
| US Treasury Bonds Inflation-Indexed 1.5% 2/15/2053 | | 1.83 to 2.33 | 140,345,200 | 112,509,941 |
| US Treasury Bonds Inflation-Indexed 1.75% 1/15/2028 | | 1.61 to 1.93 | 56,841,241 | 56,437,047 |
| US Treasury Bonds Inflation-Indexed 2% 1/15/2026 | | 2.20 to 2.72 | 195,432,038 | 195,457,642 |
| US Treasury Bonds Inflation-Indexed 2.125% 2/15/2040 | | 1.79 to 1.93 | 53,819,558 | 51,967,411 |
| US Treasury Bonds Inflation-Indexed 2.125% 2/15/2041 | | 1.76 to 2.14 | 91,518,958 | 88,599,429 |
| US Treasury Bonds Inflation-Indexed 2.125% 2/15/2054 | | 1.90 to 2.21 | 142,438,905 | 131,960,774 |
| US Treasury Bonds Inflation-Indexed 2.375% 1/15/2027 | | 1.78 to 1.94 | 119,540,102 | 120,701,213 |
| US Treasury Bonds Inflation-Indexed 2.5% 1/15/2029 | | 1.41 to 1.62 | 7,776,499 | 7,914,862 |
| US Treasury Bonds Inflation-Indexed 3.375% 4/15/2032 | | 1.50 to 1.64 | 7,166,023 | 7,759,099 |
| US Treasury Bonds Inflation-Indexed 3.625% 4/15/2028 | | 1.52 to 1.98 | 55,043,426 | 57,782,368 |
| US Treasury Bonds Inflation-Indexed 3.875% 4/15/2029 | | 1.46 to 2.08 | 112,987,808 | 121,216,979 |
| US Treasury Notes Inflation-Indexed 0.125% 1/15/2030 | | 1.40 to 2.10 | 203,781,040 | 185,137,708 |
| US Treasury Notes Inflation-Indexed 0.125% 1/15/2031 | | 1.48 to 1.85 | 205,349,557 | 182,313,498 |
| US Treasury Notes Inflation-Indexed 0.125% 1/15/2032 | | 1.46 to 1.99 | 410,246,986 | 355,756,413 |
| US Treasury Notes Inflation-Indexed 0.125% 10/15/2026 | | 1.62 to 1.84 | 129,362,104 | 125,785,061 |
| US Treasury Notes Inflation-Indexed 0.125% 4/15/2026 | | 1.98 to 2.35 | 269,347,523 | 262,921,947 |
| US Treasury Notes Inflation-Indexed 0.125% 4/15/2027 | | 1.58 to 1.92 | 370,481,275 | 355,160,807 |
| US Treasury Notes Inflation-Indexed 0.125% 7/15/2026 | | 1.56 to 2.11 | 277,410,120 | 270,960,064 |
| US Treasury Notes Inflation-Indexed 0.125% 7/15/2030 | | 1.36 to 2.00 | 546,874,643 | 493,071,358 |
| US Treasury Notes Inflation-Indexed 0.125% 7/15/2031 | | 1.42 to 1.93 | 393,890,054 | 346,853,906 |
| US Treasury Notes Inflation-Indexed 0.25% 7/15/2029 | | 1.32 to 1.78 | 241,507,393 | 223,735,812 |
| US Treasury Notes Inflation-Indexed 0.375% 1/15/2027 | | 1.76 to 1.94 | 302,260,828 | 293,118,010 |
| US Treasury Notes Inflation-Indexed 0.375% 7/15/2027 | | 1.52 to 1.66 | 368,209,232 | 355,397,273 |
| US Treasury Notes Inflation-Indexed 0.5% 1/15/2028 | | 1.37 to 1.89 | 337,009,399 | 322,233,422 |
| US Treasury Notes Inflation-Indexed 0.625% 1/15/2026 | | 2.05 to 2.48 | 250,309,835 | 246,880,652 |
| US Treasury Notes Inflation-Indexed 0.625% 7/15/2032 | | 1.52 to 2.16 | 343,446,391 | 307,074,384 |
| US Treasury Notes Inflation-Indexed 0.75% 7/15/2028 | | 1.45 to 1.69 | 295,123,889 | 283,522,539 |
| US Treasury Notes Inflation-Indexed 0.875% 1/15/2029 | | 1.38 to 1.84 | 222,747,070 | 212,719,563 |
| US Treasury Notes Inflation-Indexed 1.125% 1/15/2033 | | 1.52 to 1.81 | 441,500,123 | 406,247,369 |
| US Treasury Notes Inflation-Indexed 1.25% 4/15/2028 | | 1.52 to 1.93 | 332,640,905 | 324,158,235 |
| US Treasury Notes Inflation-Indexed 1.375% 7/15/2033 | | 1.49 to 2.07 | 319,598,895 | 299,088,359 |
| US Treasury Notes Inflation-Indexed 1.625% 10/15/2027 | | 1.50 to 1.93 | 359,287,781 | 357,190,622 |
| US Treasury Notes Inflation-Indexed 1.625% 10/15/2029 | | 1.77 to 1.84 | 229,267,315 | 225,480,653 |
| US Treasury Notes Inflation-Indexed 1.75% 1/15/2034 | | 1.57 to 2.07 | 413,244,604 | 396,288,687 |
| US Treasury Notes Inflation-Indexed 1.875% 7/15/2034 | | 1.53 to 2.23 | 406,586,451 | 394,071,731 |
| US Treasury Notes Inflation-Indexed 2.125% 4/15/2029 | | 1.45 to 1.80 | 661,712,782 | 662,674,560 |
| US Treasury Notes Inflation-Indexed 2.375% 10/15/2028 | | 1.46 to 1.76 | 221,981,047 | 225,465,858 |
| TOTAL U.S. TREASURY OBLIGATIONS (Cost $10,301,861,550) | | | | 10,071,243,708 |
| | | | | |
| Money Market Funds - 0.4% |
| | | Yield (%) | Shares | Value ($) |
Fidelity Cash Central Fund (c) (Cost $39,859,125) | | 4.36 | 39,851,155 | 39,859,125 |
| | | | | |
| TOTAL INVESTMENT IN SECURITIES - 99.8% (Cost $10,341,720,675) | 10,111,102,833 |
NET OTHER ASSETS (LIABILITIES) - 0.2% | 18,394,773 |
| NET ASSETS - 100.0% | 10,129,497,606 |
| | |
Legend
| (a) | Yield represents either the annualized yield at the date of purchase, or the stated coupon rate, or, for floating and adjustable rate securities, the rate at period end. |
| (b) | Amount is stated in United States dollars unless otherwise noted. |
| (c) | Affiliated fund that is generally available only to investment companies and other accounts managed by Fidelity Investments. The rate quoted is the annualized seven-day yield of the fund at period end. A complete unaudited listing of the fund's holdings as of its most recent quarter end is available upon request. In addition, each Fidelity Central Fund's financial statements, which are not covered by the Fund's Report of Independent Registered Public Accounting Firm, are available on the SEC's website or upon request. |
Affiliated Central Funds
Fiscal year to date information regarding the Fund's investments in Fidelity Central Funds, including the ownership percentage, is presented below.
| Affiliate | Value, beginning of period ($) | Purchases ($) | Sales Proceeds ($) | Dividend Income ($) | Realized Gain (loss) ($) | Change in Unrealized appreciation (depreciation) ($) | Value, end of period ($) | Shares, end of period | % ownership, end of period |
| Fidelity Cash Central Fund | - | 589,885,835 | 550,026,710 | 532,697 | - | - | 39,859,125 | 39,851,155 | 0.1% |
| Total | - | 589,885,835 | 550,026,710 | 532,697 | - | - | 39,859,125 | 39,851,155 | |
| | | | | | | | | | |
Amounts in the dividend income column in the above table include any capital gain distributions from underlying funds, which are presented in the corresponding line item in the Statement of Operations, if applicable.
Amounts included in the purchases and sales proceeds columns may include in-kind transactions, if applicable.
Investment Valuation
The following is a summary of the inputs used, as of December 31, 2024, involving the Fund's assets and liabilities carried at fair value. The inputs or methodology used for valuing securities may not be an indication of the risk associated with investing in those securities. For more information on valuation inputs, and their aggregation into the levels used below, please refer to the Investment Valuation section in the accompanying Notes to Financial Statements.
| Valuation Inputs at Reporting Date: |
| Description | Total ($) | Level 1 ($) | Level 2 ($) | Level 3 ($) |
Investments in Securities: | | | | |
|
| U.S. Treasury Obligations | 10,071,243,708 | - | 10,071,243,708 | - |
|
| Money Market Funds | 39,859,125 | 39,859,125 | - | - |
| Total Investments in Securities: | 10,111,102,833 | 39,859,125 | 10,071,243,708 | - |
Financial Statements
| Statement of Assets and Liabilities |
As of December 31, 2024 |
| Assets | | | | |
| Investment in securities, at value - See accompanying schedule: | | | | |
Unaffiliated issuers (cost $10,301,861,550) | $ | 10,071,243,708 | | |
Fidelity Central Funds (cost $39,859,125) | | 39,859,125 | | |
| | | | | |
| | | | | |
| Total Investment in Securities (cost $10,341,720,675) | | | $ | 10,111,102,833 |
| Cash | | | | 1 |
| Receivable for investments sold | | | | 256,863,982 |
| Receivable for fund shares sold | | | | 7,752,306 |
| Interest receivable | | | | 38,795,224 |
| Distributions receivable from Fidelity Central Funds | | | | 194,644 |
| Prepaid expenses | | | | 17,702 |
| Receivable from investment adviser for expense reductions | | | | 131,842 |
Total assets | | | | 10,414,858,534 |
| Liabilities | | | | |
| Payable for investments purchased | $ | 280,951,121 | | |
| Payable for fund shares redeemed | | 3,157,315 | | |
| Accrued management fee | | 420,312 | | |
| Other payables and accrued expenses | | 832,180 | | |
| Total liabilities | | | | 285,360,928 |
| Net Assets | | | $ | 10,129,497,606 |
| Net Assets consist of: | | | | |
| Paid in capital | | | $ | 10,358,343,119 |
| Total accumulated earnings (loss) | | | | (228,845,513) |
| Net Assets | | | $ | 10,129,497,606 |
Net Asset Value, offering price and redemption price per share ($10,129,497,606 ÷ 1,030,658,501 shares) | | | $ | 9.83 |
| Statement of Operations |
| For the period August 16, 2024 (commencement of operations) through December 31, 2024 |
| Investment Income | | | | |
| Interest | | | $ | 71,914,381 |
| Income from Fidelity Central Funds | | | | 532,697 |
| Total income | | | | 72,447,078 |
| Expenses | | | | |
| Management fee | $ | 1,060,569 | | |
| Custodian fees and expenses | | 1,240 | | |
| Independent trustees' fees and expenses | | 2,579 | | |
| Registration fees | | 1,071,835 | | |
| Audit fees | | 31,457 | | |
| Legal | | 627 | | |
| Miscellaneous | | 207 | | |
| Total expenses before reductions | | 2,168,514 | | |
| Expense reductions | | (1,103,997) | | |
| Total expenses after reductions | | | | 1,064,517 |
| Net Investment income (loss) | | | | 71,382,561 |
| Realized and Unrealized Gain (Loss) | | | | |
| Net realized gain (loss) on: | | | | |
| Investment Securities: | | | | |
| Unaffiliated issuers | | (14,905,261) | | |
| Total net realized gain (loss) | | | | (14,905,261) |
| Change in net unrealized appreciation (depreciation) on investment securities | | | | (230,617,842) |
| Net gain (loss) | | | | (245,523,103) |
| Net increase (decrease) in net assets resulting from operations | | | $ | (174,140,542) |
| Statement of Changes in Net Assets |
| |
| | For the period August 16, 2024 (commencement of operations) through December 31, 2024 |
| Increase (Decrease) in Net Assets | | |
| Operations | | |
| Net investment income (loss) | $ | 71,382,561 |
| Net realized gain (loss) | | (14,905,261) |
| Change in net unrealized appreciation (depreciation) | | (230,617,842) |
| Net increase (decrease) in net assets resulting from operations | | (174,140,542) |
| Distributions to shareholders | | (54,707,031) |
| Distributions to shareholders from tax return of capital | | (10,806,752) |
| | | |
| Total Distributions | | (65,513,783) |
| Share transactions | | |
| Proceeds from sales of shares | | 10,566,362,917 |
| Reinvestment of distributions | | 51,330,007 |
| Cost of shares redeemed | | (248,540,993) |
| | | |
Net increase (decrease) in net assets resulting from share transactions | | 10,369,151,931 |
| Total increase (decrease) in net assets | | 10,129,497,606 |
| | | |
| Net Assets | | |
| Beginning of period | | - |
| End of period | $ | 10,129,497,606 |
| | | |
| Other Information | | |
| Shares | | |
| Sold | | 1,050,338,541 |
| Issued in reinvestment of distributions | | 5,215,440 |
| Redeemed | | (24,895,480) |
| Net increase (decrease) | | 1,030,658,501 |
| | | |
Financial Highlights
Fidelity® SAI Inflation-Protected Bond Index Fund |
| |
| Years ended December 31, | | 2024 A |
Selected Per-Share Data | | |
| Net asset value, beginning of period | $ | 10.00 |
| Income from Investment Operations | | |
Net investment income (loss) B,C | | .124 |
| Net realized and unrealized gain (loss) | | (.226) |
| Total from investment operations | | (.102) |
| Distributions from net investment income | | (.057) |
| Distributions from tax return of capital | | (.011) |
| Total distributions | | (.068) |
| Net asset value, end of period | $ | 9.83 |
Total Return D,E | | |
Ratios to Average Net Assets C,F,G | | |
| Expenses before reductions | | .10% H |
| Expenses net of fee waivers, if any | | |
| Expenses net of all reductions | | .05% H |
| Net investment income (loss) | | 3.36% H |
| Supplemental Data | | |
| Net assets, end of period (000 omitted) | $ | 10,129,498 |
Portfolio turnover rate I | | |
AFor the period August 16, 2024 (commencement of operations) through December 31, 2024.
BCalculated based on average shares outstanding during the period.
CNet investment income (loss) is affected by the timing of the declaration of dividends by any underlying mutual funds or exchange-traded funds (ETFs). Net investment income (loss) of any mutual funds or ETFs is not included in the Fund's net investment income (loss) ratio.
DTotal returns for periods of less than one year are not annualized.
ETotal returns would have been lower if certain expenses had not been reduced during the applicable periods shown.
FFees and expenses of any underlying mutual funds or exchange-traded funds (ETFs) are not included in the Fund's expense ratio. The Fund indirectly bears its proportionate share of these expenses. For additional expense information related to investments in Fidelity Central Funds, please refer to the "Investments in Fidelity Central Funds" note found in the Notes to Financial Statements section of the most recent Annual or Semi-Annual report.
GExpense ratios reflect operating expenses of the class. Expenses before reductions do not reflect amounts reimbursed, waived, or reduced through arrangements with the investment adviser, brokerage services, or other offset arrangements, if applicable, and do not represent the amount paid by the class during periods when reimbursements, waivers or reductions occur.
HAnnualized.
IAmount does not include the portfolio activity of any underlying mutual funds or exchange-traded funds (ETFs), derivatives or securities that mature within one year from acquisition.
JPortfolio turnover rate excludes securities received or delivered in-kind.
KAmount not annualized.
Notes to Financial Statements
For the period ended December 31, 2024
1. Organization.
Fidelity SAI Inflation-Protected Bond Index Fund (the Fund) is a fund of Fidelity Salem Street Trust (the Trust) and is authorized to issue an unlimited number of shares. Shares are offered exclusively to certain clients of Fidelity Management & Research Company LLC (FMR) or its affiliates. The Trust is registered under the Investment Company Act of 1940, as amended (the 1940 Act), as an open-end management investment company organized as a Massachusetts business trust.
2. Investments in Fidelity Central Funds.
Funds may invest in Fidelity Central Funds, which are open-end investment companies generally available only to other investment companies and accounts managed by the investment adviser and its affiliates. The Schedule of Investments lists any Fidelity Central Funds held as an investment as of period end, but does not include the underlying holdings of each Fidelity Central Fund. An investing fund indirectly bears its proportionate share of the expenses of the underlying Fidelity Central Funds.
Based on its investment objective, each Fidelity Central Fund may invest or participate in various investment vehicles or strategies that are similar to those of the investing fund. These strategies are consistent with the investment objectives of the investing fund and may involve certain economic risks which may cause a decline in value of each of the Fidelity Central Funds and thus a decline in the value of the investing fund.
| Fidelity Central Fund | Investment Manager | Investment Objective | Investment Practices | Expense RatioA |
| Fidelity Money Market Central Funds | Fidelity Management & Research Company LLC (FMR) | Each fund seeks to obtain a high level of current income consistent with the preservation of capital and liquidity. | Short-term Investments | Less than .005% |
A Expenses expressed as a percentage of average net assets and are as of each underlying Central Fund's most recent annual or semi-annual shareholder report.
A complete unaudited list of holdings for each Fidelity Central Fund is available upon request or at the Securities and Exchange Commission website at www.sec.gov. In addition, the financial statements of the Fidelity Central Funds which contain the significant accounting policies (including investment valuation policies) of those funds, and are not covered by the Report of Independent Registered Public Accounting Firm, are available on the Securities and Exchange Commission website or upon request.
3. Significant Accounting Policies.
The Fund is an investment company and applies the accounting and reporting guidance of the Financial Accounting Standards Board (FASB) Accounting Standards Codification Topic 946 Financial Services - Investment Companies. The financial statements have been prepared in conformity with accounting principles generally accepted in the United States of America (GAAP), which require management to make certain estimates and assumptions at the date of the financial statements. Actual results could differ from those estimates. The Fund operates as a single operating segment. The Fund's income, expenses, assets, and performance are regularly monitored and assessed as a whole by the investment adviser and other individuals responsible for oversight functions of the Trust, using the information presented in the financial statements and financial highlights. Subsequent events, if any, through the date that the financial statements were issued have been evaluated in the preparation of the financial statements. The Fund's Schedule of Investments lists any underlying mutual funds or exchange-traded funds (ETFs) but does not include the underlying holdings of these funds. The following summarizes the significant accounting policies of the Fund:
Investment Valuation. Investments are valued as of 4:00 p.m. Eastern time on the last calendar day of the period. The Board of Trustees (the Board) has designated the Fund's investment adviser as the valuation designee responsible for the fair valuation function and performing fair value determinations as needed. The investment adviser has established a Fair Value Committee (the Committee) to carry out the day-to-day fair valuation responsibilities and has adopted policies and procedures to govern the fair valuation process and the activities of the Committee. In accordance with these fair valuation policies and procedures, which have been approved by the Board, the Fund attempts to obtain prices from one or more third party pricing services or brokers to value its investments. When current market prices, quotations or currency exchange rates are not readily available or reliable, investments will be fair valued in good faith by the Committee, in accordance with the policies and procedures. Factors used in determining fair value vary by investment type and may include market or investment specific events, transaction data, estimated cash flows, and market observations of comparable investments. The frequency that the fair valuation procedures are used cannot be predicted and they may be utilized to a significant extent. The Committee manages the Fund's fair valuation practices and maintains the fair valuation policies and procedures. The Fund's investment adviser reports to the Board information regarding the fair valuation process and related material matters.
The Fund categorizes the inputs to valuation techniques used to value its investments into a disclosure hierarchy consisting of three levels as shown below:
Level 1 - unadjusted quoted prices in active markets for identical investments
Level 2 - other significant observable inputs (including quoted prices for similar investments, interest rates, prepayment speeds, etc.)
Level 3 - unobservable inputs (including the Fund's own assumptions based on the best information available)
Valuation techniques used to value the Fund's investments by major category are as follows:
Debt securities, including restricted securities, are valued based on evaluated prices received from third party pricing services or from brokers who make markets in such securities. U.S. government and government agency obligations are valued by pricing services who utilize matrix pricing which considers yield or price of bonds of comparable quality, coupon, maturity and type or by broker-supplied prices.
Investments in open-end mutual funds, including the Fidelity Central Funds, are valued at their closing net asset value (NAV) each business day and are categorized as Level 1 in the hierarchy.
Changes in valuation techniques may result in transfers in or out of an assigned level within the disclosure hierarchy. The aggregate value of investments by input level as of December 31, 2024 is included at the end of the Fund's Schedule of Investments.
Investment Transactions and Income. For financial reporting purposes, the Fund's investment holdings and NAV include trades executed through the end of the last business day of the period. The NAV per share for processing shareholder transactions is calculated as of the close of business of the New York Stock Exchange (NYSE), normally 4:00 p.m. Eastern time and includes trades executed through the end of the prior business day. Gains and losses on securities sold are determined on the basis of identified cost. Income and capital gain distributions from Fidelity Central Funds, if any, are recorded on the ex-dividend date. Interest income is accrued as earned and includes coupon interest and amortization of premium and accretion of discount on debt securities as applicable. The principal amount on inflation-indexed securities is periodically adjusted to the rate of inflation and interest is accrued based on the principal amount. The adjustments to principal due to inflation are reflected as increases or decreases to Interest in the accompanying Statement of Operations.
Expenses. Expenses directly attributable to a fund are charged to that fund. Expenses attributable to more than one fund are allocated among the respective funds on the basis of relative net assets or other appropriate methods. Expenses included in the accompanying financial statements reflect the expenses of that fund and do not include any expenses associated with any underlying mutual funds or exchange-traded funds. Although not included in a fund's expenses, a fund indirectly bears its proportionate share of these expenses through the net asset value of each underlying mutual fund or exchange-traded fund. Expense estimates are accrued in the period to which they relate and adjustments are made when actual amounts are known.
Income Tax Information and Distributions to Shareholders. Each year, the Fund intends to qualify as a regulated investment company under Subchapter M of the Internal Revenue Code, including distributing substantially all of its taxable income and realized gains. As a result, no provision for U.S. Federal income taxes is required. As of December 31, 2024, the Fund did not have any unrecognized tax benefits in the financial statements; nor is the Fund aware of any tax positions for which it is reasonably possible that the total amounts of unrecognized tax benefits will significantly change in the next twelve months. The Fund files a U.S. federal tax return, in addition to state and local tax returns as required. The Fund's federal income tax returns are subject to examination by the Internal Revenue Service (IRS) for a period of three fiscal years after they are filed. State and local tax returns may be subject to examination for an additional fiscal year depending on the jurisdiction.
Distributions are declared and recorded daily and paid monthly from net investment income. Distributions from realized gains, if any, are declared and recorded on the ex-dividend date. Income and capital gain distributions are determined in accordance with income tax regulations, which may differ from GAAP.
Capital accounts within the financial statements are adjusted for permanent book-tax differences. These adjustments have no impact on net assets or the results of operations. Capital accounts are not adjusted for temporary book-tax differences which will reverse in a subsequent period.
Book-tax differences are primarily due to market discount, capital loss carryforwards and losses deferred due to wash sales.
As of period end, the cost and unrealized appreciation (depreciation) in securities, and derivatives if applicable, for federal income tax purposes were as follows:
| Gross unrealized appreciation | $1,926,659 |
| Gross unrealized depreciation | (218,542,875) |
| Net unrealized appreciation (depreciation) | $(216,616,216) |
| Tax Cost | $10,327,719,049 |
The tax-based components of distributable earnings as of period end were as follows:
| Capital loss carryforward | $(12,229,298) |
| Net unrealized appreciation (depreciation) on securities and other investments | $(216,616,216) |
Capital loss carryforwards are only available to offset future capital gains of the Fund to the extent provided by regulations and may be limited. The capital loss carryforward information presented below, including any applicable limitation, is estimated as of fiscal period end and is subject to adjustment.
| Short-term | $(12,229,298) |
| Long-term | - |
| Total capital loss carryforward | $(12,229,298) |
For the applicable period ended December 31, 2024, the Fund's distributions exceeded the aggregate amount of taxable income and net realized gains resulting in a return of capital for tax purposes. This was due to reductions in taxable income available for distribution after certain distributions had been made.
The tax character of distributions paid was as follows:
| | December 31, 2024A |
| Ordinary Income | $54,707,031 |
| Tax Return of Capital | 10,806,752 |
| Total | $65,513,783 |
A For the period August 16, 2024 (commencement of operations) through December 31, 2024.
New Accounting Pronouncement. FASB Accounting Standards Update (ASU) 2023-07 Segment Reporting (Topic 280): Improvements to Reportable Segment Disclosures became effective in this reporting period. ASU 2023-07 enhances segment information disclosure in the notes to financial statements.
4. Fees and Other Transactions with Affiliates.
Management Fee. Fidelity Management & Research Company LLC (the investment adviser) and its affiliates provide the Fund with investment management related services for which the Fund pays a monthly management fee that is based on an annual rate of .05% of the Fund's average net assets.
Interfund Trades. Funds may purchase from or sell securities to other Fidelity Funds under procedures adopted by the Board. The procedures have been designed to ensure these interfund trades are executed in accordance with Rule 17a-7 of the 1940 Act. Any interfund trades are included within the respective purchases and sales amounts shown in the Purchases and Sales of Investments note. During the period, there were no interfund trades.
Affiliated Exchanges In-Kind. Shares that were exchanged for investments, including accrued interest and cash, if any, are shown in the table below. The amount of in-kind exchanges is included in share transactions in the accompanying Statement of Changes in Net Assets.
| | Shares | Total Proceeds ($) |
| Fidelity SAI Inflation-Protected Bond Index Fund | 23,536,569 | 237,483,980 |
5. Expense Reductions.
The investment adviser contractually agreed to reimburse the Fund to the extent annual operating expenses exceeded .05% of average net assets. This reimbursement will remain in place through April 30, 2026. Some expenses, for example the compensation of the independent Trustees, and certain miscellaneous expenses such as proxy and shareholder meeting expenses, are excluded from this reimbursement. During the period this reimbursement reduced the Fund's expenses by $1,103,997.
6. Other.
A fund's organizational documents provide former and current trustees and officers with a limited indemnification against liabilities arising in connection with the performance of their duties to the fund. In the normal course of business, a fund may also enter into contracts that provide general indemnifications. A fund's maximum exposure under these arrangements is unknown as this would be dependent on future claims that may be made against a fund. The risk of material loss from such claims is considered remote.
7. Risk and Uncertainties.
Many factors affect a fund's performance. Developments that disrupt global economies and financial markets, such as pandemics, epidemics, outbreaks of infectious diseases, war, terrorism, and environmental disasters, may significantly affect a fund's investment performance. The effects of these developments to a fund will be impacted by the types of securities in which a fund invests, the financial condition, industry, economic sector, and geographic location of an issuer, and a fund's level of investment in the securities of that issuer. Significant concentrations in security types, issuers, industries, sectors, and geographic locations may magnify the factors that affect a fund's performance.
Report of Independent Registered Public Accounting Firm
To the Board of Trustees of Fidelity Salem Street Trust and Shareholders of Fidelity SAI Inflation-Protected Bond Index Fund
Opinion on the Financial Statements
We have audited the accompanying statement of assets and liabilities, including the schedule of investments, of Fidelity SAI Inflation-Protected Bond Index Fund (one of the funds constituting Fidelity Salem Street Trust, referred to hereafter as the "Fund") as of December 31, 2024, and the related statements of operations and changes in net assets, including the related notes, and the financial highlights for the period August 16, 2024 (commencement of operations) through December 31, 2024 (collectively referred to as the "financial statements"). In our opinion, the financial statements present fairly, in all material respects, the financial position of the Fund as of December 31, 2024, and the results of its operations, changes in its net assets, and the financial highlights for the period August 16, 2024 (commencement of operations) through December 31, 2024 in conformity with accounting principles generally accepted in the United States of America.
Basis for Opinion
These financial statements are the responsibility of the Fund's management. Our responsibility is to express an opinion on the Fund's financial statements based on our audit. We are a public accounting firm registered with the Public Company Accounting Oversight Board (United States) (PCAOB) and are required to be independent with respect to the Fund in accordance with the U.S. federal securities laws and the applicable rules and regulations of the Securities and Exchange Commission and the PCAOB.
We conducted our audit of these financial statements in accordance with the standards of the PCAOB. Those standards require that we plan and perform the audit to obtain reasonable assurance about whether the financial statements are free of material misstatement, whether due to error or fraud.
Our audit included performing procedures to assess the risks of material misstatement of the financial statements, whether due to error or fraud, and performing procedures that respond to those risks. Such procedures included examining, on a test basis, evidence regarding the amounts and disclosures in the financial statements. Our audit also included evaluating the accounting principles used and significant estimates made by management, as well as evaluating the overall presentation of the financial statements. Our procedures included confirmation of securities owned as of December 31, 2024 by correspondence with the custodian and brokers; when replies were not received from brokers, we performed other auditing procedures. We believe that our audit provides a reasonable basis for our opinion.
/s/ PricewaterhouseCoopers LLP
Boston, Massachusetts
February 14, 2025
We have served as the auditor of one or more investment companies in the Fidelity group of funds since 1932.
Distributions
(Unaudited)
The dividend and capital gains distributions for the fund(s) are available on Fidelity.com or Institutional.Fidelity.com.
A total of 99.34% of the dividends distributed during the fiscal year was derived from interest on U.S. Government securities which is generally exempt from state income tax.
The fund designates $54,707,033 of distributions paid during the fiscal year ended 2024 as qualifying to be taxed as section 163(j) interest dividends.
The fund will notify shareholders in January 2025 of amounts for use in preparing 2024 income tax returns.
Item 8: Changes in and Disagreements with Accountants for Open-End Management Investment Companies
(Unaudited)
Note: This is not applicable for any fund included in this document.
Item 9: Proxy Disclosures for Open-End Management Investment Companies
(Unaudited)
Note: This is not applicable for any fund included in this document.
Item 10: Remuneration Paid to Directors, Officers, and others of Open-End Management Investment Companies
(Unaudited)
Note: This information is disclosed as part of the financial statements for each Fund as part of Item 7: Financial Statements and Financial Highlights for Open-End Management Investment companies.
Item 11: Statement Regarding Basis for Approval of Investment Advisory Contract
(Unaudited)
Board Approval of Investment Advisory Contracts and Management Fees
Fidelity SAI Inflation-Protected Bond Index Fund
At its May 2024 meeting, the Board of Trustees, including the Independent Trustees (together, the Board), voted to approve the management contract with Fidelity Management & Research Company LLC (FMR) and the sub-advisory agreements with affiliates of FMR (together, the Advisory Contracts) for the fund. FMR and the sub-advisers are collectively referred to herein as the Investment Advisers. The Board, assisted by the advice of fund counsel and Independent Trustees' counsel, requested and considered a broad range of information.
Nature, Extent, and Quality of Services Provided. The Board considered Fidelity's staffing as it relates to the fund, including the backgrounds and experience of investment personnel of Fidelity, and also considered the fund's investment objective, strategies, and related investment philosophy.
Resources Dedicated to Investment Management and Support Services. The Board reviewed the general qualifications and capabilities of Fidelity's investment staff, including its size, education, experience, and resources, as well as Fidelity's approach to recruiting, training, managing, and compensating investment personnel. The Board noted the resources devoted to Fidelity's global investment organization and that Fidelity's analysts have extensive resources, tools and capabilities that allow them to conduct sophisticated quantitative and fundamental analysis, as well as credit analysis of issuers, counterparties and guarantors. Further, the Board considered that Fidelity's investment professionals have sufficient access to global information and data so as to provide competitive investment results over time, and that those professionals also have access to sophisticated tools that permit them to assess portfolio construction and risk and performance attribution characteristics continuously, as well as to transmit new information and research conclusions rapidly around the world. Additionally, in its deliberations, the Board considered Fidelity's trading, risk management, compliance, and technology and operations capabilities and resources, which are integral parts of the investment management process.
Shareholder and Administrative Services. The Board considered the nature, extent, quality, and cost of advisory, administrative, and shareholder services to be performed by the Investment Advisers and their affiliates under the Advisory Contracts and under separate agreements covering transfer agency, pricing and bookkeeping, and securities lending services for the fund. The Board also considered the nature and extent of the supervision of third party service providers, principally custodians, subcustodians, and pricing vendors. The Board also considered that the fund is offered exclusively to Fidelity's managed account programs and other Fidelity proprietary investment solutions, and is not offered to the general public.
The Board noted that the growth of fund assets over time across the complex allows Fidelity to reinvest in the development of services designed to enhance the value and convenience of the Fidelity funds as investment vehicles. These services include 24-hour access to account information and market information over the Internet and through telephone representatives, investor education materials and asset allocation tools. The Board also considered that it reviews customer service metrics such as telephone response times, continuity of services on the website and metrics addressing services at Fidelity Investor Centers.
Investment Performance. The fund is a new fund and therefore had no historical performance for the Board to review at the time it approved the fund's Advisory Contracts. The Board considered the fact that it oversees funds managed by FMR that have similar investment objectives and policies as the fund.
Based on its review, the Board concluded that the nature, extent, and quality of services to be provided to the fund under the Advisory Contracts should benefit the shareholders of the fund.
Competitiveness of Management Fee and Total Expense Ratio. The Board was provided with information regarding industry trends in management fees and expenses. In its review of the fund's proposed management fee and total expenses, the Board noted that FMR may agree to waive fees or reimburse expenses from time to time.
Comparisons of Management Fees and Total Expense Ratios. The information provided to the Board indicated that the fund's proposed management fee rate ranked below the competitive median fee rate of funds with a similar Lipper investment mandate, regardless of whether their management fee structures are comparable. Further, the information provided to the Board indicated that the projected total net expense ratio of the fund ranked below the competitive median of the similar sales load structure group.
Other Contractual Arrangements. The Board also noted that FMR has agreed to contractually limit the fund's total operating expenses, with certain limited exceptions, to 5 basis points through April 30, 2026.
Based on its review, the Board concluded that the fund's management fee and projected total net expenses were fair and reasonable in light of the services that the fund and its shareholders will receive and the other factors considered.
Costs of the Services and Profitability. The fund is a new fund and therefore no revenue, cost, or profitability data was available for the Board to review in respect of the fund at the time it approved the Advisory Contracts. In connection with its consideration of future renewals of the fund's Advisory Contracts, the Board will consider the revenues earned and the expenses incurred by Fidelity in conducting the business of developing, marketing, distributing, managing, administering and servicing the fund and servicing the fund's shareholders.
Economies of Scale. The Board will consider economies of scale when there is operating experience to permit assessment thereof. It noted that, notwithstanding the entrepreneurial risk associated with a new fund, the management fee for the fund was at a level normally associated, by comparison with competitors, with very high fund net assets, and Fidelity asserted to the Board that the level of the fee anticipated economies of scale at lower asset levels even before, if ever, economies of scale are achieved. The Board also noted that the fund and its shareholders would have access to the very considerable number and variety of services available through Fidelity and its affiliates.
Conclusion. Based on its evaluation of all of the conclusions noted above, and after considering all factors it believed relevant, the Board, including the Independent Trustees, concluded that the advisory fee arrangements are fair and reasonable in light of all of the surrounding circumstances, and that the fund's Advisory Contracts should be approved through September 2025.
1.9917104.100
SPB-ANN-0325
Fidelity® Inflation-Protected Bond Index Fund
Annual Report
December 31, 2024
Contents
To view a fund's proxy voting guidelines and proxy voting record for the 12-month period ended June 30, visit http://www.fidelity.com/proxyvotingresults or visit the Securities and Exchange Commission's (SEC) web site at http://www.sec.gov.
You may also call 1-800-544-8544 to request a free copy of the proxy voting guidelines.
BLOOMBERG ® is a trademark and service mark of Bloomberg Finance L.P. and its affiliates (collectively "Bloomberg"). Bloomberg or Bloomberg's licensors own all proprietary rights in the Bloomberg Indices. Neither Bloomberg nor Bloomberg's licensors approves or endorses this material, or guarantees the accuracy or completeness of any information herein, or makes any warranty, express or implied, as to the results to be obtained therefrom and, to the maximum extent allowed by law, neither shall have any liability or responsibility for injury or damages arising in connection therewith.
Standard & Poor's, S&P and S&P 500 are registered service marks of The McGraw-Hill Companies, Inc. and have been licensed for use by Fidelity Distributors Corporation.
Other third-party marks appearing herein are the property of their respective owners.
All other marks appearing herein are registered or unregistered trademarks or service marks of FMR LLC or an affiliated company. © 2025 FMR LLC. All rights reserved.
This report and the financial statements contained herein are submitted for the general information of the shareholders of the Fund. This report is not authorized for distribution to prospective investors in the Fund unless preceded or accompanied by an effective prospectus.
A fund files its complete schedule of portfolio holdings with the SEC for the first and third quarters of each fiscal year on Form N-PORT. Forms N-PORT are available on the SEC's web site at http://www.sec.gov. A fund's Forms N-PORT may be reviewed and copied at the SEC's Public Reference Room in Washington, DC. Information regarding the operation of the SEC's Public Reference Room may be obtained by calling 1-800-SEC-0330.
For a complete list of a fund's portfolio holdings, view the most recent holdings listing, semiannual report, or annual report on Fidelity's web site at http://www.fidelity.com, http://www.institutional.fidelity.com, or http://www.401k.com, as applicable.
NOT FDIC INSURED •MAY LOSE VALUE •NO BANK GUARANTEE
Neither the Fund nor Fidelity Distributors Corporation is a bank.
Item 7: Financial Statements and Financial Highlights for Open-End Management Investment Companies (Annual Report)
Fidelity® Inflation-Protected Bond Index Fund
Schedule of Investments December 31, 2024
Showing Percentage of Net Assets
| U.S. Treasury Obligations - 99.4% |
| | | Yield (%) (a) | Principal Amount (b) | Value ($) |
| US Treasury Bonds Inflation-Indexed 0.125% 2/15/2051 | | -0.34 to 1.97 | 119,492,889 | 65,839,555 |
| US Treasury Bonds Inflation-Indexed 0.125% 2/15/2052 | | -0.13 to 1.59 | 142,556,906 | 77,440,657 |
| US Treasury Bonds Inflation-Indexed 0.25% 2/15/2050 | | -0.56 to 2.49 | 146,955,106 | 85,795,835 |
| US Treasury Bonds Inflation-Indexed 0.625% 2/15/2043 | | -0.43 to 1.98 | 94,808,800 | 69,512,493 |
| US Treasury Bonds Inflation-Indexed 0.75% 2/15/2042 | | -0.53 to 2.77 | 148,570,445 | 113,926,795 |
| US Treasury Bonds Inflation-Indexed 0.75% 2/15/2045 | | -0.50 to 2.01 | 187,848,421 | 136,237,220 |
| US Treasury Bonds Inflation-Indexed 0.875% 2/15/2047 | | -0.38 to 2.20 | 143,953,599 | 104,235,686 |
| US Treasury Bonds Inflation-Indexed 1% 2/15/2046 | | -0.48 to 2.46 | 62,087,380 | 46,805,814 |
| US Treasury Bonds Inflation-Indexed 1% 2/15/2048 | | -0.42 to 2.65 | 64,309,939 | 47,387,708 |
| US Treasury Bonds Inflation-Indexed 1% 2/15/2049 | | -0.40 to 1.67 | 13,137,102 | 9,582,471 |
| US Treasury Bonds Inflation-Indexed 1.375% 2/15/2044 | | -0.55 to 2.40 | 160,193,276 | 133,405,023 |
| US Treasury Bonds Inflation-Indexed 1.5% 2/15/2053 | | 1.57 to 2.28 | 89,036,990 | 71,377,906 |
| US Treasury Bonds Inflation-Indexed 1.75% 1/15/2028 | | -1.54 to 2.43 | 86,194,929 | 85,582,003 |
| US Treasury Bonds Inflation-Indexed 2% 1/15/2026 | | 2.40 to 2.73 | 73,675,079 | 73,684,731 |
| US Treasury Bonds Inflation-Indexed 2.125% 2/15/2040 | | -0.56 to 1.55 | 75,235,451 | 72,646,298 |
| US Treasury Bonds Inflation-Indexed 2.125% 2/15/2041 | | -0.59 to 2.33 | 69,822,541 | 67,595,145 |
| US Treasury Bonds Inflation-Indexed 2.125% 2/15/2054 | | 2.05 to 2.48 | 131,318,330 | 121,658,254 |
| US Treasury Bonds Inflation-Indexed 2.375% 1/15/2027 | | -1.79 to 2.10 | 152,042,409 | 153,519,222 |
| US Treasury Bonds Inflation-Indexed 2.5% 1/15/2029 | | -1.47 to 1.74 | 148,562,128 | 151,205,416 |
| US Treasury Bonds Inflation-Indexed 3.375% 4/15/2032 | | -1.11 to 2.55 | 26,580,706 | 28,780,588 |
| US Treasury Bonds Inflation-Indexed 3.625% 4/15/2028 | | -1.54 to 3.04 | 186,371,583 | 195,645,370 |
| US Treasury Bonds Inflation-Indexed 3.875% 4/15/2029 | | -1.34 to 2.51 | 90,942,989 | 97,566,584 |
| US Treasury Notes Inflation-Indexed 0.125% 1/15/2030 | | -1.27 to 2.48 | 327,537,243 | 297,571,818 |
| US Treasury Notes Inflation-Indexed 0.125% 1/15/2031 | | -1.09 to 1.84 | 280,131,348 | 248,706,286 |
| US Treasury Notes Inflation-Indexed 0.125% 1/15/2032 | | -0.73 to 1.80 | 320,010,614 | 277,505,581 |
| US Treasury Notes Inflation-Indexed 0.125% 10/15/2026 | | -1.85 to 1.62 | 283,836,652 | 275,988,171 |
| US Treasury Notes Inflation-Indexed 0.125% 4/15/2026 | | -1.97 to 2.23 | 186,630,358 | 182,178,089 |
| US Treasury Notes Inflation-Indexed 0.125% 4/15/2027 | | -0.44 to 2.06 | 321,471,285 | 308,177,522 |
| US Treasury Notes Inflation-Indexed 0.125% 7/15/2026 | | -2.04 to 1.00 | 158,177,616 | 154,499,832 |
| US Treasury Notes Inflation-Indexed 0.125% 7/15/2030 | | -1.20 to 2.17 | 283,419,606 | 255,535,874 |
| US Treasury Notes Inflation-Indexed 0.125% 7/15/2031 | | -1.17 to 2.15 | 341,307,781 | 300,550,715 |
| US Treasury Notes Inflation-Indexed 0.25% 7/15/2029 | | -1.35 to 1.95 | 285,773,125 | 264,744,202 |
| US Treasury Notes Inflation-Indexed 0.375% 1/15/2027 | | -1.71 to 1.25 | 224,477,362 | 217,687,346 |
| US Treasury Notes Inflation-Indexed 0.375% 7/15/2027 | | -1.65 to 2.12 | 237,599,908 | 229,332,543 |
| US Treasury Notes Inflation-Indexed 0.5% 1/15/2028 | | -1.66 to 1.69 | 309,466,753 | 295,898,367 |
| US Treasury Notes Inflation-Indexed 0.625% 1/15/2026 | | -1.91 to 1.72 | 353,737,298 | 348,891,185 |
| US Treasury Notes Inflation-Indexed 0.625% 7/15/2032 | | 0.09 to 1.73 | 366,385,702 | 327,584,353 |
| US Treasury Notes Inflation-Indexed 0.75% 7/15/2028 | | -1.56 to 1.77 | 233,843,964 | 224,651,535 |
| US Treasury Notes Inflation-Indexed 0.875% 1/15/2029 | | -1.44 to 1.81 | 179,175,440 | 171,109,418 |
| US Treasury Notes Inflation-Indexed 1.125% 1/15/2033 | | 1.15 to 1.76 | 324,855,470 | 298,916,520 |
| US Treasury Notes Inflation-Indexed 1.25% 4/15/2028 | | 1.83 to 2.29 | 218,937,742 | 213,354,615 |
| US Treasury Notes Inflation-Indexed 1.375% 7/15/2033 | | 1.57 to 2.23 | 335,578,378 | 314,042,344 |
| US Treasury Notes Inflation-Indexed 1.625% 10/15/2027 | | 1.51 to 2.49 | 235,823,436 | 234,446,937 |
| US Treasury Notes Inflation-Indexed 1.625% 10/15/2029 | | 1.77 to 1.99 | 208,239,240 | 204,799,885 |
| US Treasury Notes Inflation-Indexed 1.75% 1/15/2034 | | 1.69 to 2.13 | 346,293,974 | 332,085,121 |
| US Treasury Notes Inflation-Indexed 1.875% 7/15/2034 | | 1.60 to 1.92 | 357,915,649 | 346,899,015 |
| US Treasury Notes Inflation-Indexed 2.125% 4/15/2029 | | 1.62 to 2.29 | 276,702,334 | 277,104,511 |
| US Treasury Notes Inflation-Indexed 2.375% 10/15/2028 | | 1.74 to 2.43 | 298,085,584 | 302,765,136 |
| TOTAL U.S. TREASURY OBLIGATIONS (Cost $9,579,480,277) | | | | 8,914,457,695 |
| | | | | |
| Money Market Funds - 0.0% |
| | | Yield (%) | Shares | Value ($) |
Fidelity Cash Central Fund (c) (Cost $1,517,166) | | 4.36 | 1,516,862 | 1,517,166 |
| | | | | |
| TOTAL INVESTMENT IN SECURITIES - 99.4% (Cost $9,580,997,443) | 8,915,974,861 |
NET OTHER ASSETS (LIABILITIES) - 0.6% | 53,145,447 |
| NET ASSETS - 100.0% | 8,969,120,308 |
| | |
Legend
| (a) | Yield represents either the annualized yield at the date of purchase, or the stated coupon rate, or, for floating and adjustable rate securities, the rate at period end. |
| (b) | Amount is stated in United States dollars unless otherwise noted. |
| (c) | Affiliated fund that is generally available only to investment companies and other accounts managed by Fidelity Investments. The rate quoted is the annualized seven-day yield of the fund at period end. A complete unaudited listing of the fund's holdings as of its most recent quarter end is available upon request. In addition, each Fidelity Central Fund's financial statements, which are not covered by the Fund's Report of Independent Registered Public Accounting Firm, are available on the SEC's website or upon request. |
Affiliated Central Funds
Fiscal year to date information regarding the Fund's investments in Fidelity Central Funds, including the ownership percentage, is presented below.
| Affiliate | Value, beginning of period ($) | Purchases ($) | Sales Proceeds ($) | Dividend Income ($) | Realized Gain (loss) ($) | Change in Unrealized appreciation (depreciation) ($) | Value, end of period ($) | Shares, end of period | % ownership, end of period |
| Fidelity Cash Central Fund | 1,490,620 | 687,533,282 | 687,507,897 | 655,897 | 1,161 | - | 1,517,166 | 1,516,862 | 0.0% |
| Fidelity Securities Lending Cash Central Fund | - | 466,816,643 | 466,816,643 | 6,607 | - | - | - | - | 0.0% |
| Total | 1,490,620 | 1,154,349,925 | 1,154,324,540 | 662,504 | 1,161 | - | 1,517,166 | 1,516,862 | |
| | | | | | | | | | |
Amounts in the dividend income column in the above table include any capital gain distributions from underlying funds, which are presented in the corresponding line item in the Statement of Operations, if applicable.
Amounts in the dividend income column for Fidelity Securities Lending Cash Central Fund represents the income earned on investing cash collateral, less rebates paid to borrowers and any lending agent fees associated with the loan, plus any premium payments received for lending certain types of securities.
Amounts included in the purchases and sales proceeds columns may include in-kind transactions, if applicable.
Investment Valuation
The following is a summary of the inputs used, as of December 31, 2024, involving the Fund's assets and liabilities carried at fair value. The inputs or methodology used for valuing securities may not be an indication of the risk associated with investing in those securities. For more information on valuation inputs, and their aggregation into the levels used below, please refer to the Investment Valuation section in the accompanying Notes to Financial Statements.
| Valuation Inputs at Reporting Date: |
| Description | Total ($) | Level 1 ($) | Level 2 ($) | Level 3 ($) |
Investments in Securities: | | | | |
|
| U.S. Treasury Obligations | 8,914,457,695 | - | 8,914,457,695 | - |
|
| Money Market Funds | 1,517,166 | 1,517,166 | - | - |
| Total Investments in Securities: | 8,915,974,861 | 1,517,166 | 8,914,457,695 | - |
Financial Statements
| Statement of Assets and Liabilities |
As of December 31, 2024 |
| Assets | | | | |
| Investment in securities, at value - See accompanying schedule: | | | | |
Unaffiliated issuers (cost $9,579,480,277) | $ | 8,914,457,695 | | |
Fidelity Central Funds (cost $1,517,166) | | 1,517,166 | | |
| | | | | |
| | | | | |
| Total Investment in Securities (cost $9,580,997,443) | | | $ | 8,915,974,861 |
| Receivable for investments sold | | | | 134,685,416 |
| Receivable for fund shares sold | | | | 20,179,636 |
| Interest receivable | | | | 34,641,884 |
| Distributions receivable from Fidelity Central Funds | | | | 14,922 |
| Other receivables | | | | 53,973 |
Total assets | | | | 9,105,550,692 |
| Liabilities | | | | |
| Payable for investments purchased | $ | 120,127,892 | | |
| Payable for fund shares redeemed | | 15,870,701 | | |
| Accrued management fee | | 377,824 | | |
| Other payables and accrued expenses | | 53,967 | | |
| Total liabilities | | | | 136,430,384 |
| Net Assets | | | $ | 8,969,120,308 |
| Net Assets consist of: | | | | |
| Paid in capital | | | $ | 10,383,300,851 |
| Total accumulated earnings (loss) | | | | (1,414,180,543) |
| Net Assets | | | $ | 8,969,120,308 |
Net Asset Value, offering price and redemption price per share ($8,969,120,308 ÷ 1,008,959,882 shares) | | | $ | 8.89 |
| Statement of Operations |
| Year ended December 31, 2024 |
| Investment Income | | | | |
| Interest | | | $ | 343,748,082 |
| Income from Fidelity Central Funds (including $6,607 from security lending) | | | | 662,504 |
| Total income | | | | 344,410,586 |
| Expenses | | | | |
| Management fee | $ | 4,639,266 | | |
| Independent trustees' fees and expenses | | 24,161 | | |
| Total expenses | | | | 4,663,427 |
| Net Investment income (loss) | | | | 339,747,159 |
| Realized and Unrealized Gain (Loss) | | | | |
| Net realized gain (loss) on: | | | | |
| Investment Securities: | | | | |
| Unaffiliated issuers | | (238,098,536) | | |
| Redemptions in-kind | | 2,816,699 | | |
| Fidelity Central Funds | | 1,161 | | |
| Foreign currency transactions | | (2) | | |
| Total net realized gain (loss) | | | | (235,280,678) |
| Change in net unrealized appreciation (depreciation) on investment securities | | | | 78,987,955 |
| Net gain (loss) | | | | (156,292,723) |
| Net increase (decrease) in net assets resulting from operations | | | $ | 183,454,436 |
| Statement of Changes in Net Assets |
| |
| | Year ended December 31, 2024 | | Year ended December 31, 2023 |
| Increase (Decrease) in Net Assets | | | | |
| Operations | | | | |
| Net investment income (loss) | $ | 339,747,159 | $ | 352,666,349 |
| Net realized gain (loss) | | (235,280,678) | | (253,420,844) |
| Change in net unrealized appreciation (depreciation) | | 78,987,955 | | 244,668,807 |
| Net increase (decrease) in net assets resulting from operations | | 183,454,436 | | 343,914,312 |
| Distributions to shareholders | | (320,609,745) | | (341,253,951) |
| Distributions to shareholders from tax return of capital | | (11,580,879) | | - |
| | | | | |
| Total Distributions | | (332,190,624) | | (341,253,951) |
| Share transactions | | | | |
| Proceeds from sales of shares | | 2,418,569,364 | | 3,806,760,471 |
| Reinvestment of distributions | | 299,789,734 | | 309,979,635 |
| Cost of shares redeemed | | (3,377,400,877) | | (3,598,552,766) |
| | | | | |
Net increase (decrease) in net assets resulting from share transactions | | (659,041,779) | | 518,187,340 |
| Total increase (decrease) in net assets | | (807,777,967) | | 520,847,701 |
| | | | | |
| Net Assets | | | | |
| Beginning of period | | 9,776,898,275 | | 9,256,050,574 |
| End of period | $ | 8,969,120,308 | $ | 9,776,898,275 |
| | | | | |
| Other Information | | | | |
| Shares | | | | |
| Sold | | 265,587,532 | | 414,265,082 |
| Issued in reinvestment of distributions | | 33,211,045 | | 34,208,107 |
| Redeemed | | (371,257,186) | | (393,122,773) |
| Net increase (decrease) | | (72,458,609) | | 55,350,416 |
| | | | | |
Financial Highlights
Fidelity® Inflation-Protected Bond Index Fund |
| |
| Years ended December 31, | | 2024 | | 2023 | | 2022 | | 2021 | | 2020 |
Selected Per-Share Data | | | | | | | | | | |
| Net asset value, beginning of period | $ | 9.04 | $ | 9.02 | $ | 11.16 | $ | 11.04 | $ | 10.08 |
| Income from Investment Operations | | | | | | | | | | |
Net investment income (loss) A,B | | .333 | | .346 | | .748 | | .593 | | .157 |
| Net realized and unrealized gain (loss) | | (.150) | | (.005) | | (2.088) | | .058 | | .940 |
| Total from investment operations | | .183 | | .341 | | (1.340) | | .651 | | 1.097 |
| Distributions from net investment income | | (.321) | | (.321) | | (.800) | | (.531) | | (.027) |
| Distributions from net realized gain | | - | | - | | - | | - | | (.110) |
| Distributions from tax return of capital | | (.012) | | - | | - | | - | | - |
| Total distributions | | (.333) | | (.321) | | (.800) | | (.531) | | (.137) |
| Net asset value, end of period | $ | 8.89 | $ | 9.04 | $ | 9.02 | $ | 11.16 | $ | 11.04 |
Total Return C | | | | 3.78% | | (12.05)% | | 5.93% | | 10.90% |
Ratios to Average Net Assets B,D,E | | | | | | | | | | |
| Expenses before reductions | | .05% | | .05% | | .05% | | .05% | | .05% |
| Expenses net of fee waivers, if any | | | | .05% | | .05% | | .05% | | .05% |
| Expenses net of all reductions | | .05% | | .05% | | .05% | | .05% | | .05% |
| Net investment income (loss) | | 3.66% | | 3.78% | | 7.22% | | 5.27% | | 1.47% |
| Supplemental Data | | | | | | | | | | |
| Net assets, end of period (000 omitted) | $ | 8,969,120 | $ | 9,776,898 | $ | 9,256,051 | $ | 11,771,837 | $ | 8,950,534 |
Portfolio turnover rate F | | | | 31% | | 28% | | 22% | | 31% |
ACalculated based on average shares outstanding during the period.
BNet investment income (loss) is affected by the timing of the declaration of dividends by any underlying mutual funds or exchange-traded funds (ETFs). Net investment income (loss) of any mutual funds or ETFs is not included in the Fund's net investment income (loss) ratio.
CTotal returns would have been lower if certain expenses had not been reduced during the applicable periods shown.
DFees and expenses of any underlying mutual funds or exchange-traded funds (ETFs) are not included in the Fund's expense ratio. The Fund indirectly bears its proportionate share of these expenses. For additional expense information related to investments in Fidelity Central Funds, please refer to the "Investments in Fidelity Central Funds" note found in the Notes to Financial Statements section of the most recent Annual or Semi-Annual report.
EExpense ratios reflect operating expenses of the class. Expenses before reductions do not reflect amounts reimbursed, waived, or reduced through arrangements with the investment adviser, brokerage services, or other offset arrangements, if applicable, and do not represent the amount paid by the class during periods when reimbursements, waivers or reductions occur.
FAmount does not include the portfolio activity of any underlying mutual funds or exchange-traded funds (ETFs), derivatives or securities that mature within one year from acquisition.
GPortfolio turnover rate excludes securities received or delivered in-kind.
Notes to Financial Statements
For the period ended December 31, 2024
1. Organization.
Fidelity Inflation-Protected Bond Index Fund (the Fund) is a fund of Fidelity Salem Street Trust (the Trust) and is authorized to issue an unlimited number of shares. Share transactions on the Statement of Changes in Net Assets may contain exchanges between affiliated funds. The Trust is registered under the Investment Company Act of 1940, as amended (the 1940 Act), as an open-end management investment company organized as a Massachusetts business trust.
2. Investments in Fidelity Central Funds.
Funds may invest in Fidelity Central Funds, which are open-end investment companies generally available only to other investment companies and accounts managed by the investment adviser and its affiliates. The Schedule of Investments lists any Fidelity Central Funds held as an investment as of period end, but does not include the underlying holdings of each Fidelity Central Fund. An investing fund indirectly bears its proportionate share of the expenses of the underlying Fidelity Central Funds.
Based on its investment objective, each Fidelity Central Fund may invest or participate in various investment vehicles or strategies that are similar to those of the investing fund. These strategies are consistent with the investment objectives of the investing fund and may involve certain economic risks which may cause a decline in value of each of the Fidelity Central Funds and thus a decline in the value of the investing fund.
| Fidelity Central Fund | Investment Manager | Investment Objective | Investment Practices | Expense RatioA |
| Fidelity Money Market Central Funds | Fidelity Management & Research Company LLC (FMR) | Each fund seeks to obtain a high level of current income consistent with the preservation of capital and liquidity. | Short-term Investments | Less than .005% |
A Expenses expressed as a percentage of average net assets and are as of each underlying Central Fund's most recent annual or semi-annual shareholder report.
A complete unaudited list of holdings for each Fidelity Central Fund is available upon request or at the Securities and Exchange Commission website at www.sec.gov. In addition, the financial statements of the Fidelity Central Funds which contain the significant accounting policies (including investment valuation policies) of those funds, and are not covered by the Report of Independent Registered Public Accounting Firm, are available on the Securities and Exchange Commission website or upon request.
3. Significant Accounting Policies.
The Fund is an investment company and applies the accounting and reporting guidance of the Financial Accounting Standards Board (FASB) Accounting Standards Codification Topic 946 Financial Services - Investment Companies. The financial statements have been prepared in conformity with accounting principles generally accepted in the United States of America (GAAP), which require management to make certain estimates and assumptions at the date of the financial statements. Actual results could differ from those estimates. The Fund operates as a single operating segment. The Fund's income, expenses, assets, and performance are regularly monitored and assessed as a whole by the investment adviser and other individuals responsible for oversight functions of the Trust, using the information presented in the financial statements and financial highlights. Subsequent events, if any, through the date that the financial statements were issued have been evaluated in the preparation of the financial statements. The Fund's Schedule of Investments lists any underlying mutual funds or exchange-traded funds (ETFs) but does not include the underlying holdings of these funds. The following summarizes the significant accounting policies of the Fund:
Investment Valuation. Investments are valued as of 4:00 p.m. Eastern time on the last calendar day of the period. The Board of Trustees (the Board) has designated the Fund's investment adviser as the valuation designee responsible for the fair valuation function and performing fair value determinations as needed. The investment adviser has established a Fair Value Committee (the Committee) to carry out the day-to-day fair valuation responsibilities and has adopted policies and procedures to govern the fair valuation process and the activities of the Committee. In accordance with these fair valuation policies and procedures, which have been approved by the Board, the Fund attempts to obtain prices from one or more third party pricing services or brokers to value its investments. When current market prices, quotations or currency exchange rates are not readily available or reliable, investments will be fair valued in good faith by the Committee, in accordance with the policies and procedures. Factors used in determining fair value vary by investment type and may include market or investment specific events, transaction data, estimated cash flows, and market observations of comparable investments. The frequency that the fair valuation procedures are used cannot be predicted and they may be utilized to a significant extent. The Committee manages the Fund's fair valuation practices and maintains the fair valuation policies and procedures. The Fund's investment adviser reports to the Board information regarding the fair valuation process and related material matters.
The Fund categorizes the inputs to valuation techniques used to value its investments into a disclosure hierarchy consisting of three levels as shown below:
Level 1 - unadjusted quoted prices in active markets for identical investments
Level 2 - other significant observable inputs (including quoted prices for similar investments, interest rates, prepayment speeds, etc.)
Level 3 - unobservable inputs (including the Fund's own assumptions based on the best information available)
Valuation techniques used to value the Fund's investments by major category are as follows:
Debt securities, including restricted securities, are valued based on evaluated prices received from third party pricing services or from brokers who make markets in such securities. U.S. government and government agency obligations are valued by pricing services who utilize matrix pricing which considers yield or price of bonds of comparable quality, coupon, maturity and type or by broker-supplied prices. When independent prices are unavailable or unreliable, debt securities may be valued utilizing pricing methodologies which consider similar factors that would be used by third party pricing services. Debt securities are generally categorized as Level 2 in the hierarchy but may be Level 3 depending on the circumstances.
Investments in open-end mutual funds, including the Fidelity Central Funds, are valued at their closing net asset value (NAV) each business day and are categorized as Level 1 in the hierarchy.
Changes in valuation techniques may result in transfers in or out of an assigned level within the disclosure hierarchy. The aggregate value of investments by input level as of December 31, 2024 is included at the end of the Fund's Schedule of Investments.
Foreign Currency. Certain Funds may use foreign currency contracts to facilitate transactions in foreign-denominated securities. Gains and losses from these transactions may arise from changes in the value of the foreign currency or if the counterparties do not perform under the contracts' terms.
Foreign-denominated assets, including investment securities, and liabilities are translated into U.S. dollars at the exchange rates at period end. Purchases and sales of investment securities, income and dividends received, and expenses denominated in foreign currencies are translated into U.S. dollars at the exchange rate in effect on the transaction date.
The effects of exchange rate fluctuations on investments are included with the net realized and unrealized gain (loss) on investment securities. Other foreign currency transactions resulting in realized and unrealized gain (loss) are disclosed separately.
Investment Transactions and Income. For financial reporting purposes, the Fund's investment holdings and NAV include trades executed through the end of the last business day of the period. The NAV per share for processing shareholder transactions is calculated as of the close of business of the New York Stock Exchange (NYSE), normally 4:00 p.m. Eastern time and includes trades executed through the end of the prior business day. Gains and losses on securities sold are determined on the basis of identified cost and include proceeds received from litigation. Income and capital gain distributions from Fidelity Central Funds, if any, are recorded on the ex-dividend date. Interest income is accrued as earned and includes coupon interest and amortization of premium and accretion of discount on debt securities as applicable. For Treasury Inflation-Protected Securities (TIPS) the principal amount is adjusted daily to keep pace with inflation. Interest is accrued based on the adjusted principal amount. The adjustments to principal due to inflation are reflected as increases or decreases to Interest in the accompanying Statement of Operations. Such adjustments may result in negative Interest and may have a significant impact on the Fund's distributions. Investment income is recorded net of foreign taxes withheld where recovery of such taxes is uncertain.
Expenses. Expenses directly attributable to a fund are charged to that fund. Expenses attributable to more than one fund are allocated among the respective funds on the basis of relative net assets or other appropriate methods. Expenses included in the accompanying financial statements reflect the expenses of that fund and do not include any expenses associated with any underlying mutual funds or exchange-traded funds. Although not included in a fund's expenses, a fund indirectly bears its proportionate share of these expenses through the net asset value of each underlying mutual fund or exchange-traded fund. Expense estimates are accrued in the period to which they relate and adjustments are made when actual amounts are known.
Deferred Trustee Compensation. Under a Deferred Compensation Plan (the Plan) for certain Funds, certain independent Trustees have elected to defer receipt of a portion of their annual compensation. Deferred amounts are invested in affiliated mutual funds, are marked-to-market and remain in a fund until distributed in accordance with the Plan. The investment of deferred amounts and the offsetting payable to the Trustees presented below are included in the accompanying Statement of Assets and Liabilities in other receivables and other payables and accrued expenses, as applicable.
| Fidelity Inflation-Protected Bond Index Fund | $53,973 |
Income Tax Information and Distributions to Shareholders. Each year, the Fund intends to qualify as a regulated investment company under Subchapter M of the Internal Revenue Code, including distributing substantially all of its taxable income and realized gains. As a result, no provision for U.S. Federal income taxes is required. As of December 31, 2024, the Fund did not have any unrecognized tax benefits in the financial statements; nor is the Fund aware of any tax positions for which it is reasonably possible that the total amounts of unrecognized tax benefits will significantly change in the next twelve months. The Fund files a U.S. federal tax return, in addition to state and local tax returns as required. The Fund's federal income tax returns are subject to examination by the Internal Revenue Service (IRS) for a period of three fiscal years after they are filed. State and local tax returns may be subject to examination for an additional fiscal year depending on the jurisdiction. Foreign taxes are provided for based on the Fund's understanding of the tax rules and rates that exist in the foreign markets in which it invests.
Distributions are declared and recorded daily and paid monthly from net investment income. Distributions from realized gains, if any, are declared and recorded on the ex-dividend date. Income and capital gain distributions are determined in accordance with income tax regulations, which may differ from GAAP.
Capital accounts within the financial statements are adjusted for permanent book-tax differences. These adjustments have no impact on net assets or the results of operations. Capital accounts are not adjusted for temporary book-tax differences which will reverse in a subsequent period.
Book-tax differences are primarily due to market discount, redemptions in-kind, capital loss carryforwards, certain losses related to deflation adjustments on U.S. Treasury inflation-indexed securities and losses deferred due to wash sales.
As of period end, the cost and unrealized appreciation (depreciation) in securities, and derivatives if applicable, for federal income tax purposes were as follows:
| Gross unrealized appreciation | $7,672,071 |
| Gross unrealized depreciation | (717,012,468) |
| Net unrealized appreciation (depreciation) | $(709,340,397) |
| Tax Cost | $9,625,315,258 |
The tax-based components of distributable earnings as of period end were as follows:
| Capital loss carryforward | $(704,840,148) |
| Net unrealized appreciation (depreciation) on securities and other investments | $(709,340,397) |
Capital loss carryforwards are only available to offset future capital gains of the Fund to the extent provided by regulations and may be limited. The capital loss carryforward information presented below, including any applicable limitation, is estimated as of fiscal period end and is subject to adjustment.
Short-term | $(174,524,285) |
Long-term | (530,315,862) |
| Total capital loss carryforward | $(704,840,148) |
For the applicable period ended December 31, 2024, the Fund's distributions exceeded the aggregate amount of taxable income and net realized gains resulting in a return of capital for tax purposes. This was due to reductions in taxable income available for distribution after certain distributions had been made.
The tax character of distributions paid was as follows:
| | December 31, 2024 | December 31, 2023 |
| Ordinary Income | $320,609,745 | $341,253,951 |
| Tax Return of Capital | 11,580,879 | - |
| Total | $332,190,624 | $341,253,951 |
New Accounting Pronouncement. FASB Accounting Standards Update (ASU) 2023-07 Segment Reporting (Topic 280): Improvements to Reportable Segment Disclosures became effective in this reporting period. ASU 2023-07 enhances segment information disclosure in the notes to financial statements.
4. Fees and Other Transactions with Affiliates.
Management Fee. Fidelity Management & Research Company LLC (the investment adviser) and its affiliates provide the Fund with investment management related services for which the Fund pays a monthly management fee. The management fee is based on an annual rate of .05% of the Fund's average net assets. Under the management contract, the investment adviser pays all other operating expenses, except the compensation of the independent Trustees and certain other expenses such as interest expense.
Interfund Trades. Funds may purchase from or sell securities to other Fidelity Funds under procedures adopted by the Board. The procedures have been designed to ensure these interfund trades are executed in accordance with Rule 17a-7 of the 1940 Act. Any interfund trades are included within the respective purchases and sales amounts shown in the Purchases and Sales of Investments note. During the period, there were no interfund trades.
Affiliated Redemptions In-Kind. Shares that were redeemed in-kind for investments, including accrued interest and cash, if any, are shown in the table below. The net realized gain or loss on investments delivered through in-kind redemptions is included in the "Net realized gain (loss) on: Redemptions in-kind" line in the accompanying Statement of Operations. The amount of the in-kind redemptions is included in share transactions in the accompanying Statement of Changes in Net Assets. There was no gain or loss for federal income tax purposes.
| | Shares | Total net realized gain or loss ($) | Total Proceeds ($) |
| Fidelity Inflation-Protected Bond Index Fund | 25,563,399 | 2,816,699 | 237,483,980 |
Sub-Advisory Arrangements. Effective March 1, 2024, the Fund's sub-advisory agreements with FMR Investment Management (UK) Limited, Fidelity Management & Research (Hong Kong) Limited, and Fidelity Management & Research (Japan) Limited were amended to provide that the investment adviser pays each sub-adviser monthly fees equal to 110% of the sub-adviser's costs for providing sub-advisory services.
5. Committed Line of Credit.
Certain Funds participate with other funds managed by the investment adviser or an affiliate in a $4.25 billion credit facility (the "line of credit") to be utilized for temporary or emergency purposes to fund shareholder redemptions or for other short-term liquidity purposes.
Commitment fees are charged based on the unused amount of the line of credit at an annual rate of .10%, and then allocated to each participating fund based on its pro-rata portion of the line of credit. The commitment fees are borne by the investment adviser.
Interest is charged to a participating fund based on its borrowings at an annual rate of .75% plus the highest of (i) daily SOFR plus a .10% spread adjustment, (ii) Federal Funds Effective Rate, or (iii) Overnight Bank Funding Rate. During the period, there were no borrowings on this line of credit.
The line of credit agreement will expire in March 2025 unless extended or renewed.
6. Security Lending.
Funds lend portfolio securities from time to time in order to earn additional income. Lending agents are used, including National Financial Services (NFS), an affiliate of the investment adviser. Pursuant to a securities lending agreement, NFS will receive a fee, which is capped at 9.9% of a fund's daily lending revenue, for its services as lending agent. A fund may lend securities to certain qualified borrowers, including NFS. On the settlement date of the loan, a fund receives collateral (in the form of U.S. Treasury obligations, letters of credit and/or cash) against the loaned securities and maintains collateral in an amount not less than 100% of the market value of the loaned securities during the period of the loan. The market value of the loaned securities is determined at the close of business of a fund and any additional required collateral is delivered to a fund on the next business day. A fund or borrower may terminate the loan at any time, and if the borrower defaults on its obligation to return the securities loaned because of insolvency or other reasons, a fund may apply collateral received from the borrower against the obligation. A fund may experience delays and costs in recovering the securities loaned. Any cash collateral received is invested in the Fidelity Securities Lending Cash Central Fund. Any loaned securities are identified as such in the Schedule of Investments, and the value of loaned securities and cash collateral at period end, as applicable, are presented in the Statement of Assets and Liabilities. Security lending income represents the income earned on investing cash collateral, less rebates paid to borrowers and any lending agent fees associated with the loan, plus any premium payments received for lending certain types of securities. Security lending income is presented in the Statement of Operations as a component of income from Fidelity Central Funds. Affiliated security lending activity, if any, was as follows:
| | Total Security Lending Fees Paid to NFS ($) | Security Lending Income From Securities Loaned to NFS ($) | Value of Securities Loaned to NFS at Period End ($) |
| Fidelity Inflation-Protected Bond Index Fund | 699 | - | - |
7. Other.
A fund's organizational documents provide former and current trustees and officers with a limited indemnification against liabilities arising in connection with the performance of their duties to the fund. In the normal course of business, a fund may also enter into contracts that provide general indemnifications. A fund's maximum exposure under these arrangements is unknown as this would be dependent on future claims that may be made against a fund. The risk of material loss from such claims is considered remote.
8. Risk and Uncertainties.
Many factors affect a fund's performance. Developments that disrupt global economies and financial markets, such as pandemics, epidemics, outbreaks of infectious diseases, war, terrorism, and environmental disasters, may significantly affect a fund's investment performance. The effects of these developments to a fund will be impacted by the types of securities in which a fund invests, the financial condition, industry, economic sector, and geographic location of an issuer, and a fund's level of investment in the securities of that issuer. Significant concentrations in security types, issuers, industries, sectors, and geographic locations may magnify the factors that affect a fund's performance.
Report of Independent Registered Public Accounting Firm
To the Board of Trustees of Fidelity Salem Street Trust and Shareholders of Fidelity Inflation-Protected Bond Index Fund
Opinion on the Financial Statements
We have audited the accompanying statement of assets and liabilities, including the schedule of investments, of Fidelity Inflation-Protected Bond Index Fund (one of the funds constituting Fidelity Salem Street Trust, referred to hereafter as the "Fund") as of December 31, 2024, the related statement of operations for the year ended December 31, 2024, the statement of changes in net assets for each of the two years in the period ended December 31, 2024, including the related notes, and the financial highlights for each of the five years in the period ended December 31, 2024 (collectively referred to as the "financial statements"). In our opinion, the financial statements present fairly, in all material respects, the financial position of the Fund as of December 31, 2024, the results of its operations for the year then ended, the changes in its net assets for each of the two years in the period ended December 31, 2024 and the financial highlights for each of the five years in the period ended December 31, 2024 in conformity with accounting principles generally accepted in the United States of America.
Basis for Opinion
These financial statements are the responsibility of the Fund's management. Our responsibility is to express an opinion on the Fund's financial statements based on our audits. We are a public accounting firm registered with the Public Company Accounting Oversight Board (United States) (PCAOB) and are required to be independent with respect to the Fund in accordance with the U.S. federal securities laws and the applicable rules and regulations of the Securities and Exchange Commission and the PCAOB.
We conducted our audits of these financial statements in accordance with the standards of the PCAOB. Those standards require that we plan and perform the audit to obtain reasonable assurance about whether the financial statements are free of material misstatement, whether due to error or fraud.
Our audits included performing procedures to assess the risks of material misstatement of the financial statements, whether due to error or fraud, and performing procedures that respond to those risks. Such procedures included examining, on a test basis, evidence regarding the amounts and disclosures in the financial statements. Our audits also included evaluating the accounting principles used and significant estimates made by management, as well as evaluating the overall presentation of the financial statements. Our procedures included confirmation of securities owned as of December 31, 2024 by correspondence with the custodian and brokers; when replies were not received from brokers, we performed other auditing procedures. We believe that our audits provide a reasonable basis for our opinion.
/s/ PricewaterhouseCoopers LLP
Boston, Massachusetts
February 14, 2025
We have served as the auditor of one or more investment companies in the Fidelity group of funds since 1932.
Distributions
(Unaudited)
The dividend and capital gains distributions for the fund(s) are available on Fidelity.com or Institutional.Fidelity.com.
A total of 99.84% of the dividends distributed during the fiscal year was derived from interest on U.S. Government securities which is generally exempt from state income tax.
The fund designates $350,419,256 of distributions paid in the calendar year 2023 as qualifying to be taxed as interest-related dividends for nonresident alien shareholders.
The fund designates $322,259,554 of distributions paid during the fiscal year ended 2024 as qualifying to be taxed as section 163(j) interest dividends.
The fund will notify shareholders in January 2025 of amounts for use in preparing 2024 income tax returns.
Item 8: Changes in and Disagreements with Accountants for Open-End Management Investment Companies
(Unaudited)
Note: This is not applicable for any fund included in this document.
Item 9: Proxy Disclosures for Open-End Management Investment Companies
(Unaudited)
Note: This is not applicable for any fund included in this document.
Item 10: Remuneration Paid to Directors, Officers, and others of Open-End Management Investment Companies
(Unaudited)
Note: This information is disclosed as part of the financial statements for each Fund as part of Item 7: Financial Statements and Financial Highlights for Open-End Management Investment companies.
Item 11: Statement Regarding Basis for Approval of Investment Advisory Contract
(Unaudited)
Board Approval of Investment Advisory Contracts and Management Fees
Fidelity Inflation-Protected Bond Index Fund
Each year, the Board of Trustees, including the Independent Trustees (together, the Board), considers the renewal of the fund's management contract with Fidelity Management & Research Company LLC (FMR) and the sub-advisory agreements (together, the Advisory Contracts) for the fund. FMR and the sub-advisers are referred to herein as the Investment Advisers. The Board, assisted by the advice of fund counsel and Independent Trustees' counsel, requests and considers a broad range of information relevant to the renewal of the Advisory Contracts throughout the year.
The Board meets regularly and, at each of its meetings, covers an extensive agenda of topics and materials and considers factors that are relevant to its annual consideration of the renewal of the fund's Advisory Contracts, including the services and support provided to the fund and its shareholders. The Board's Operations Committee, of which all the Independent Trustees are members, meets regularly throughout the year and requests, receives and considers, among other matters, information related to the annual consideration of the renewal of the fund's Advisory Contracts before making its recommendation to the Board. The Board also meets as needed to review matters specifically related to the Board's annual consideration of the renewal of the Advisory Contracts. Members of the Board may also meet from time to time with trustees of other Fidelity funds through joint ad hoc committees to discuss certain matters relevant to all of the Fidelity funds.
At its September 2024 meeting, the Board unanimously determined to renew the fund's Advisory Contracts. In reaching its determination, the Board considered all factors it believed relevant, including (i) the nature, extent, and quality of the services provided to the fund and its shareholders (including the investment performance of the fund); (ii) the competitiveness relative to peer funds of the fund's management fee and total expense ratio; (iii) the total costs of the services provided by and the profits realized by FMR and its affiliates (Fidelity) from its relationships with the fund; and (iv) the extent to which, if any, economies of scale exist and are realized as the fund grows, and whether any economies of scale are appropriately shared with fund shareholders. The Board also considered the broad range of investment choices available to shareholders from FMR's competitors and that the fund's shareholders have chosen to invest in the fund, which is part of the Fidelity family of funds. The Board's decision to renew the Advisory Contracts was not based on any single factor and the factors may have been weighed differently by different Trustees.
The Board reached a determination, with the assistance of fund counsel and Independent Trustees' counsel and through the exercise of its business judgment, that the renewal of the Advisory Contracts was in the best interests of the fund and its shareholders and that the compensation payable under the Advisory Contracts was fair and reasonable in light of all of the surrounding circumstances.
Nature, Extent, and Quality of Services Provided. The Board considered Fidelity's staffing as it relates to the fund, including the backgrounds and experience of investment personnel, and also considered the Investment Advisers' implementation of the fund's investment program. The Independent Trustees also had discussions with senior management of Fidelity's investment operations and investment groups. The Board considered the structure of the investment personnel compensation program and whether this structure provides appropriate incentives to act in the best interests of the fund. Additionally, the Board considered the portfolio managers' investments, if any, in the funds that they manage.
Resources Dedicated to Investment Management and Support Services. The Board reviewed the general qualifications and capabilities of Fidelity's investment staff, including its size, education, experience, and resources, as well as Fidelity's approach to recruiting, training, managing, and compensating investment personnel. The Board noted the resources devoted to Fidelity's global investment organization, and that Fidelity's analysts have extensive resources, tools and capabilities that allow them to conduct quantitative and fundamental analysis, as well as credit analysis of issuers, counterparties and guarantors. Further, the Board considered that Fidelity's investment professionals have sufficient access to global information and data so as to provide competitive investment results over time, and that those professionals also have access to sophisticated tools that permit them to assess portfolio construction and risk and performance attribution characteristics continuously, as well as to transmit new information and research conclusions rapidly around the world. Additionally, in its deliberations, the Board considered Fidelity's trading, risk management, compliance, cybersecurity, and technology and operations capabilities and resources, which are integral parts of the investment management process.
Shareholder and Administrative Services. The Board considered (i) the nature, extent, quality, and cost of advisory, administrative, and shareholder services performed by the Investment Advisers and their affiliates under the Advisory Contracts and under separate agreements covering transfer agency and pricing and bookkeeping services for the fund; (ii) the nature and extent of Fidelity's supervision of third party service providers, principally custodians, subcustodians, and pricing vendors; and (iii) the resources devoted by Fidelity to, and the record of compliance with, the fund's compliance policies and procedures, including with respect to liquidity risk management. The Board also considered the fund's securities lending activities and any payments made to Fidelity relating to securities lending under a separate agreement.
The Board noted that the growth of fund assets over time across the complex allows Fidelity to reinvest in the development of services designed to enhance the value and convenience of the Fidelity funds as investment vehicles. These services include 24-hour access to account information and market information over the Internet and through telephone representatives, investor education materials and asset allocation tools. The Board also considered that it reviews customer service metrics such as telephone response times, continuity of services on the website and metrics addressing services at Fidelity Investor Centers.
Investment in a Large Fund Family. The Board considered the benefits to shareholders of investing in a fund that is part of a large family of funds offering a variety of investment disciplines and providing a large variety of fund investor services. The Board noted that Fidelity had taken, or had made recommendations to the Board that resulted in the Fidelity funds taking, a number of actions over the previous year that benefited particular funds and/or the Fidelity funds in general.
Investment Performance. The Board took into account discussions that occur with representatives of the Investment Advisers, and reports that it receives, at Board meetings throughout the year relating to fund investment performance. In this regard the Board noted that as part of regularly scheduled fund reviews and other reports to the Board on fund performance, the Board considered annualized return information for the fund for different time periods, measured against the securities market index the fund seeks to track (benchmark index) and an appropriate peer group of funds with similar objectives (peer group). The Board also periodically considers the fund's tracking error versus its benchmark index. In its evaluation of fund investment performance at meetings throughout the year, the Board gave particular attention to information indicating underperformance of certain Fidelity funds over different time periods and discussed with the Investment Advisers the reasons for such underperformance.
In addition to reviewing absolute and relative fund performance, the Independent Trustees periodically consider the appropriateness of fund performance metrics in evaluating the results achieved. In general, the Independent Trustees believe that an index fund's performance should be evaluated based on gross performance (before fees and expenses but after transaction costs) of the fund compared to the fund's benchmark index, over appropriate time periods.
Based on its review, the Board concluded that the nature, extent, and quality of services provided to the fund under the Advisory Contracts should continue to benefit the shareholders of the fund.
Competitiveness of Management Fee and Total Expense Ratio. The Board was provided with information regarding industry trends in management fees and expenses. In its review of the fund's management fee and total expense ratio, the Board considered the fund's unitary (subject to certain limited exceptions) fee rate as well as fund expenses paid by FMR under the fund's management contract, such as transfer agent fees, pricing and bookkeeping fees, and custodial, legal, and audit fees. The Board noted that Fidelity may agree to waive fees or reimburse expenses from time to time, and the extent to which, if any, it has done so for the fund.
Comparisons of Management Fees and Total Expense Ratios. Among other things, the Board reviewed data for selected groups of competitive funds and classes (referred to as "mapped groups") that were compiled by Fidelity based on combining similar investment objective categories (as classified by Morningstar) that have comparable investment mandates. The data reviewed by the Board included (i) gross management fee comparisons (before taking into account expense reimbursements or caps) relative to the total universe of funds within the mapped group; (ii) gross management fee comparisons relative to a subset of non-Fidelity funds in the mapped group that are similar in size and management fee structure to the fund (referred to as the "asset size peer group"); (iii) total expense comparisons of the fund relative to funds and classes in the mapped group that have a similar sales load structure to the fund (referred to as the "similar sales load structure group"); and (iv) total expense comparisons of the fund relative to funds and classes in the similar sales load structure group that are similar in size and management fee structure to the fund (referred to as the "total expense asset size peer group"). The total expense asset size peer group comparison excludes performance adjustments and fund-paid 12b-1 fees to eliminate variability in fee structures.
The information provided to the Board indicated that the fund's management fee rate ranked below the competitive median of the mapped group for 2023 and below the competitive median of the asset size peer group for 2023. Further, the information provided to the Board indicated that the total expense ratio of the fund ranked below the competitive median of the similar sales load structure group for 2023 and below the competitive median of the total expense asset size peer group for 2023.
Fees Charged to Other Fidelity Clients. The Board also considered Fidelity fee structures and other information with respect to clients of Fidelity, such as other funds advised or subadvised by Fidelity, pension plan clients, and other institutional clients with similar mandates. The Board noted that a joint ad hoc committee created by it and the boards of other Fidelity funds periodically reviews and compares Fidelity's institutional investment advisory business with its business of providing services to the Fidelity funds and also noted the most recent findings of the committee. The Board noted that the committee's review included a consideration of the differences in services provided, fees charged, and costs incurred, as well as competition in the markets serving the different categories of clients.
Based on its review, the Board concluded that the fund's management fee is fair and reasonable in light of the services that the fund receives and the other factors considered. Further, based on its review of total expense ratios and fees charged to other Fidelity clients, the Board concluded that the fund's total expense ratio was reasonable in light of the services that the fund and its shareholders receive and the other factors considered.
Costs of the Services and Profitability. The Board considered the revenues earned and the expenses incurred by Fidelity in conducting the business of developing, marketing, distributing, managing, administering and servicing the fund and servicing the fund's shareholders. The Board also considered the level of Fidelity's profits in respect of all the Fidelity funds.
On an annual basis, Fidelity presents to the Board information about the profitability of its relationships with the fund. Fidelity calculates profitability information for each Fidelity fund, as well as aggregate profitability information for groups of Fidelity funds and all Fidelity funds, using a series of detailed revenue and cost allocation methodologies which originate with the books and records of Fidelity on which Fidelity's audited financial statements are based. The Audit Committee of the Board reviews any significant changes from the prior year's methodologies.
A public accounting firm has been engaged annually by the Board as part of the Board's assessment of Fidelity's profitability analysis. The engagement includes the review and assessment of the methodologies used by Fidelity in determining the revenues and expenses attributable to Fidelity's fund business. After considering the reports issued under the engagement and information provided by Fidelity, the Board concluded that while other allocation methods may also be reasonable, Fidelity's profitability methodologies are reasonable in all material respects.
The Board also reviewed Fidelity's non-fund businesses and potential indirect benefits such businesses may have received as a result of their association with Fidelity's fund business (i.e., fall-out benefits) as well as cases where Fidelity's affiliates may benefit from the funds' business. The Board considered areas where potential indirect benefits to the Fidelity funds from their relationships with Fidelity may exist. The Board's consideration of these matters was informed by the findings of a joint ad hoc committee created by it and the boards of other Fidelity funds to evaluate potential fall-out benefits.
The Board considered the costs of the services provided by and the profits realized by Fidelity in connection with the operation of the fund and was satisfied that the profitability was not excessive.
Economies of Scale. The Board considered whether there have been economies of scale in respect of the management of the Fidelity funds, whether the Fidelity funds (including the fund) have appropriately benefited from any such economies of scale, and whether there is potential for realization of any further economies of scale. The Board considered the extent to which the fund will benefit from economies of scale as assets grow through increased services to the fund, through waivers or reimbursements, or through fee or expense ratio reductions. The Board recognized that, due to the fund's current contractual arrangements, its expense ratio will not decline if the fund's operating costs decrease as assets grow, or rise as assets decrease. The Board also noted that a committee created by it and the boards of other Fidelity funds periodically analyzes whether Fidelity attains economies of scale in respect of the management and servicing of the Fidelity funds, whether the Fidelity funds have appropriately benefited from such economies of scale, and whether there is potential for realization of any further economies of scale.
The Board concluded, taking into account the analysis of the committee, that economies of scale, if any, are being appropriately shared between fund shareholders and Fidelity.
Additional Information Requested by the Board. In order to develop fully the factual basis for consideration of the Fidelity funds' advisory contracts, the Board requested and received additional information on certain topics, including: (i) portfolio manager changes that have occurred during the past year; (ii) hiring, training, compensating, and retaining adviser and sub-adviser personnel; (iii) the terms of the funds' various management fee structures and arrangements for transfer agent and pricing and bookkeeping services; (iv) Fidelity's fund profitability methodology, profitability trends for certain funds, the allocation of various costs to different funds, and the impact of certain factors on fund profitability results; (v) the impact on fund profitability of recent industry trends, such as the growth in passively managed funds and the changes in flows for different types of funds; (vi) the types of management fee and total expense comparisons provided, and the challenges and limitations associated with such information; (vii) explanations regarding the relative total expense ratios and management fees of certain funds and classes, total expense and management fee competitive trends, and methodologies for total expense and management fee competitive comparisons; (viii) matters related to money market funds, exchange-traded funds, and target date funds; (ix) the arrangements with and compensation paid to certain fund sub-advisers and the treatment of such compensation within Fidelity's fund profitability methodology; and (x) the terms of management contracts between Fidelity and other funds and products not overseen by the Board.
Conclusion. Based on its evaluation of all of the conclusions noted above, and after considering all factors it believed relevant, the Board, including the Independent Trustees, concluded that the advisory and sub-advisory fee arrangements are fair and reasonable in light of all of the surrounding circumstances and that the fund's Advisory Contracts should be renewed through September 30, 2025.
1.939238.112
PIB-I-PIB-AI-ANN-0325
Fidelity® International Bond Index Fund
Annual Report
December 31, 2024
Contents
To view a fund's proxy voting guidelines and proxy voting record for the 12-month period ended June 30, visit http://www.fidelity.com/proxyvotingresults or visit the Securities and Exchange Commission's (SEC) web site at http://www.sec.gov.
You may also call 1-800-544-8544 to request a free copy of the proxy voting guidelines.
BLOOMBERG ® is a trademark and service mark of Bloomberg Finance L.P. and its affiliates (collectively "Bloomberg"). Bloomberg or Bloomberg's licensors own all proprietary rights in the Bloomberg Indices. Neither Bloomberg nor Bloomberg's licensors approves or endorses this material, or guarantees the accuracy or completeness of any information herein, or makes any warranty, express or implied, as to the results to be obtained therefrom and, to the maximum extent allowed by law, neither shall have any liability or responsibility for injury or damages arising in connection therewith.
Standard & Poor's, S&P and S&P 500 are registered service marks of The McGraw-Hill Companies, Inc. and have been licensed for use by Fidelity Distributors Corporation.
Other third-party marks appearing herein are the property of their respective owners.
All other marks appearing herein are registered or unregistered trademarks or service marks of FMR LLC or an affiliated company. © 2025 FMR LLC. All rights reserved.
This report and the financial statements contained herein are submitted for the general information of the shareholders of the Fund. This report is not authorized for distribution to prospective investors in the Fund unless preceded or accompanied by an effective prospectus.
A fund files its complete schedule of portfolio holdings with the SEC for the first and third quarters of each fiscal year on Form N-PORT. Forms N-PORT are available on the SEC's web site at http://www.sec.gov. A fund's Forms N-PORT may be reviewed and copied at the SEC's Public Reference Room in Washington, DC. Information regarding the operation of the SEC's Public Reference Room may be obtained by calling 1-800-SEC-0330.
For a complete list of a fund's portfolio holdings, view the most recent holdings listing, semiannual report, or annual report on Fidelity's web site at http://www.fidelity.com, http://www.institutional.fidelity.com, or http://www.401k.com, as applicable.
NOT FDIC INSURED •MAY LOSE VALUE •NO BANK GUARANTEE
Neither the Fund nor Fidelity Distributors Corporation is a bank.
Item 7: Financial Statements and Financial Highlights for Open-End Management Investment Companies (Annual Report)
Fidelity® International Bond Index Fund
Schedule of Investments December 31, 2024
Showing Percentage of Net Assets
| Foreign Government and Government Agency Obligations - 69.1% |
| | | Principal Amount (a) | Value ($) |
| AUSTRALIA - 2.3% | | | |
| Australian Commonwealth 1% 12/21/2030 (b) | AUD | 542,000 | 281,514 |
| Australian Commonwealth 1.25% 5/21/2032 | AUD | 1,576,000 | 793,131 |
| Australian Commonwealth 1.75% 11/21/2032 (b) | AUD | 490,000 | 252,464 |
| Australian Commonwealth 1.75% 6/21/2051 (b) | AUD | 809,000 | 269,328 |
| Australian Commonwealth 2.25% 5/21/2028 (b) | AUD | 1,320,000 | 775,730 |
| Australian Commonwealth 2.75% 11/21/2027 (b) | AUD | 1,360,000 | 816,712 |
| Australian Commonwealth 2.75% 11/21/2028 (b) | AUD | 1,329,000 | 789,550 |
| Australian Commonwealth 2.75% 11/21/2029 (b) | AUD | 3,840,000 | 2,251,726 |
| Australian Commonwealth 2.75% 5/21/2041 (b) | AUD | 244,000 | 117,870 |
| Australian Commonwealth 3% 11/21/2033 (b) | AUD | 3,690,000 | 2,060,375 |
| Australian Commonwealth 3% 3/21/2047 (b) | AUD | 468,000 | 217,897 |
| Australian Commonwealth 3.25% 4/21/2025 (b) | AUD | 56,000 | 34,553 |
| Australian Commonwealth 3.25% 4/21/2029 (b) | AUD | 70,000 | 42,221 |
| Australian Commonwealth 3.5% 12/21/2034 (b) | AUD | 2,180,000 | 1,254,104 |
| Australian Commonwealth 3.75% 5/21/2034 (b) | AUD | 1,460,000 | 862,243 |
| Australian Commonwealth 4.5% 4/21/2033 (b) | AUD | 1,080,000 | 678,239 |
| Australian Commonwealth 4.75% 4/21/2027 (b) | AUD | 370,000 | 233,518 |
| New South Wales Treasury Corp 1.25% 11/20/2030 | AUD | 670,000 | 347,661 |
| New South Wales Treasury Corp 1.75% 3/20/2034 (b) | AUD | 840,000 | 395,533 |
| New South Wales Treasury Corp 2% 3/20/2031 | AUD | 1,106,000 | 592,191 |
| New South Wales Treasury Corp 3% 4/20/2029 (b) | AUD | 860,000 | 507,492 |
| New South Wales Treasury Corp 3% 5/20/2027 (b) | AUD | 620,000 | 374,831 |
| New South Wales Treasury Corp 4.25% 2/20/2036 (b) | AUD | 470,000 | 267,517 |
| New South Wales Treasury Corp 4.75% 2/20/2037 (b) | AUD | 600,000 | 353,470 |
| Queensland Treasury Corp 1.75% 7/20/2034 (b)(c) | AUD | 450,000 | 208,684 |
| Queensland Treasury Corp 1.75% 8/21/2031 (b)(c) | AUD | 2,631,000 | 1,365,038 |
| Queensland Treasury Corp 2.25% 11/20/2041 (b)(c) | AUD | 70,000 | 27,909 |
| Queensland Treasury Corp 3.25% 7/21/2026 (b)(c) | AUD | 247,000 | 151,074 |
| Queensland Treasury Corp 3.25% 7/21/2028 (b)(c) | AUD | 154,000 | 92,573 |
| Queensland Treasury Corp 3.5% 8/21/2030 (b)(c) | AUD | 58,000 | 34,273 |
| South Australian Government Financing Authority 1.75% 5/24/2032 (b) | AUD | 490,000 | 246,917 |
| South Australian Government Financing Authority 2% 5/23/2036 (b) | AUD | 150,000 | 66,814 |
| Treasury Corp of Victoria 0.5% 11/20/2025 | AUD | 110,000 | 65,996 |
| Treasury Corp of Victoria 1.25% 11/19/2027 | AUD | 952,000 | 544,199 |
| Treasury Corp of Victoria 1.5% 11/20/2030 | AUD | 1,347,000 | 704,115 |
| Treasury Corp of Victoria 1.5% 9/10/2031 | AUD | 1,000,000 | 506,369 |
| Treasury Corp of Victoria 2% 11/20/2037 | AUD | 260,000 | 109,361 |
| Treasury Corp of Victoria 2.25% 11/20/2034 | AUD | 350,000 | 167,825 |
| Treasury Corp of Victoria 2.25% 11/20/2042 | AUD | 330,000 | 126,474 |
| Treasury Corp of Victoria 2.5% 10/22/2029 | AUD | 424,000 | 241,590 |
| Treasury Corp of Victoria 4.75% 9/15/2036 | AUD | 50,000 | 29,317 |
| Treasury Corp of Victoria 5.25% 9/15/2038 | AUD | 410,000 | 247,920 |
| Western Australian Treasury Corp 3% 10/21/2026 (b) | AUD | 1,842,000 | 1,120,701 |
| Western Australian Treasury Corp 4.25% 7/20/2033 | AUD | 150,000 | 89,623 |
TOTAL AUSTRALIA | | | 20,716,642 |
| AUSTRIA - 1.0% | | | |
| Republic of Austria Government Bond 0% 10/20/2028 (b)(c) | EUR | 600,000 | 569,306 |
| Republic of Austria Government Bond 0% 10/20/2040 (b)(c) | EUR | 788,000 | 512,527 |
| Republic of Austria Government Bond 0% 2/20/2030 (b)(c) | EUR | 542,000 | 495,139 |
| Republic of Austria Government Bond 0% 2/20/2031 (b)(c) | EUR | 1,030,000 | 913,800 |
| Republic of Austria Government Bond 0.5% 2/20/2029 (b)(c) | EUR | 1,257,000 | 1,207,169 |
| Republic of Austria Government Bond 0.5% 4/20/2027 (b)(c) | EUR | 1,281,000 | 1,276,230 |
| Republic of Austria Government Bond 0.7% 4/20/2071 (b)(c) | EUR | 80,000 | 38,275 |
| Republic of Austria Government Bond 0.75% 10/20/2026 (b)(c) | EUR | 185,000 | 186,841 |
| Republic of Austria Government Bond 0.75% 2/20/2028 (b)(c) | EUR | 355,000 | 350,829 |
| Republic of Austria Government Bond 0.75% 3/20/2051 (b)(c) | EUR | 930,000 | 574,819 |
| Republic of Austria Government Bond 0.85% 6/30/2120 (b)(c) | EUR | 380,000 | 168,313 |
| Republic of Austria Government Bond 0.9% 2/20/2032 (b)(c) | EUR | 394,000 | 362,407 |
| Republic of Austria Government Bond 1.2% 10/20/2025 (b)(c) | EUR | 77,000 | 79,067 |
| Republic of Austria Government Bond 1.5% 2/20/2047 (b)(c) | EUR | 293,000 | 230,224 |
| Republic of Austria Government Bond 2% 7/15/2026 (b)(c) | EUR | 1,070,000 | 1,104,909 |
| Republic of Austria Government Bond 2.4% 5/23/2034 (b)(c) | EUR | 40,000 | 40,178 |
| Republic of Austria Government Bond 2.9% 2/20/2033 (b)(c) | EUR | 140,000 | 146,986 |
| Republic of Austria Government Bond 2.9% 2/20/2034 (b)(c) | EUR | 620,000 | 648,495 |
| Republic of Austria Government Bond 3.15% 6/20/2044 (b)(c) | EUR | 10,000 | 10,493 |
| Republic of Austria Government Bond 4.15% 3/15/2037 (b)(c) | EUR | 20,000 | 23,291 |
TOTAL AUSTRIA | | | 8,939,298 |
| BELGIUM - 1.2% | | | |
| Kingdom of Belgium 0% 10/22/2027 (b)(c) | EUR | 1,690,000 | 1,643,826 |
| Kingdom of Belgium 0% 10/22/2031 (b)(c) | EUR | 882,000 | 762,402 |
| Kingdom of Belgium 0.1% 6/22/2030 (b)(c) | EUR | 215,000 | 195,321 |
| Kingdom of Belgium 0.35% 6/22/2032 (b)(c) | EUR | 549,000 | 476,282 |
| Kingdom of Belgium 0.4% 6/22/2040 (b)(c) | EUR | 1,212,000 | 820,226 |
| Kingdom of Belgium 0.65% 6/22/2071 (b)(c) | EUR | 590,000 | 245,723 |
| Kingdom of Belgium 0.8% 6/22/2025 (b)(c) | EUR | 105,000 | 107,881 |
| Kingdom of Belgium 0.8% 6/22/2027 (b)(c) | EUR | 39,000 | 39,008 |
| Kingdom of Belgium 0.9% 6/22/2029 (b)(c) | EUR | 1,373,000 | 1,329,883 |
| Kingdom of Belgium 1% 6/22/2026 (b)(c) | EUR | 161,000 | 163,852 |
| Kingdom of Belgium 1.25% 4/22/2033 (b)(c) | EUR | 1,521,000 | 1,396,227 |
| Kingdom of Belgium 1.4% 6/22/2053 (b)(c) | EUR | 932,000 | 604,626 |
| Kingdom of Belgium 1.45% 6/22/2037 (b)(c) | EUR | 84,000 | 71,955 |
| Kingdom of Belgium 1.6% 6/22/2047 (b)(c) | EUR | 38,000 | 28,244 |
| Kingdom of Belgium 1.7% 6/22/2050 (b)(c) | EUR | 23,000 | 16,741 |
| Kingdom of Belgium 1.9% 6/22/2038 (b)(c) | EUR | 101,000 | 90,051 |
| Kingdom of Belgium 2.25% 6/22/2057 (b)(c) | EUR | 124,000 | 96,450 |
| Kingdom of Belgium 2.85% 10/22/2034 (b)(c) | EUR | 1,020,000 | 1,044,977 |
| Kingdom of Belgium 3.3% 6/22/2054 (b)(c) | EUR | 360,000 | 356,192 |
| Kingdom of Belgium 3.75% 6/22/2045 (b) | EUR | 170,000 | 185,074 |
| Kingdom of Belgium 4% 3/28/2032 (b) | EUR | 30,000 | 33,481 |
| Kingdom of Belgium 4.25% 3/28/2041 (b)(c) | EUR | 545,000 | 629,948 |
| Kingdom of Belgium 5.5% 3/28/2028 (b) | EUR | 40,000 | 45,441 |
| Ministeries Van de Vlaamse Gemeenschap 1.875% 6/2/2042 | EUR | 100,000 | 81,925 |
| Ministeries Van de Vlaamse Gemeenschap 3.125% 6/22/2034 (b) | EUR | 100,000 | 103,643 |
| Ministeries Van de Vlaamse Gemeenschap 3.25% 4/5/2033 (b) | EUR | 300,000 | 314,456 |
| Region Wallonne Belgium 1.05% 6/22/2040 (b) | EUR | 100,000 | 71,507 |
| Region Wallonne Belgium 1.25% 5/3/2034 (b) | EUR | 400,000 | 346,566 |
TOTAL BELGIUM | | | 11,301,908 |
| BULGARIA - 0.0% | | | |
| Bulgarian Republic 4.5% 1/27/2033 (b) | EUR | 240,000 | 269,497 |
| Bulgarian Republic 4.625% 9/23/2034 (b) | EUR | 190,000 | 215,006 |
TOTAL BULGARIA | | | 484,503 |
| CANADA - 3.5% | | | |
| Canada Housing Trust No 1 1.6% 12/15/2031 (c) | CAD | 320,000 | 199,019 |
| Canada Housing Trust No 1 1.75% 6/15/2030 (c) | CAD | 730,000 | 471,472 |
| Canada Housing Trust No 1 1.9% 9/15/2026 (c) | CAD | 480,000 | 328,164 |
| Canada Housing Trust No 1 2.1% 9/15/2029 (c) | CAD | 70,000 | 46,604 |
| Canada Housing Trust No 1 3.6% 12/15/2027 (c) | CAD | 1,910,000 | 1,352,806 |
| Canada Housing Trust No 1 4.25% 3/15/2034 (c) | CAD | 780,000 | 573,004 |
| Canadian Government 0.5% 12/1/2030 | CAD | 491,000 | 295,061 |
| Canadian Government 1% 6/1/2027 | CAD | 58,000 | 38,655 |
| Canadian Government 1% 9/1/2026 | CAD | 390,000 | 263,088 |
| Canadian Government 1.25% 3/1/2027 | CAD | 100,000 | 67,197 |
| Canadian Government 1.25% 6/1/2030 | CAD | 16,000 | 10,154 |
| Canadian Government 1.5% 12/1/2031 | CAD | 1,320,000 | 827,262 |
| Canadian Government 1.5% 6/1/2031 | CAD | 1,380,000 | 872,479 |
| Canadian Government 1.75% 12/1/2053 | CAD | 780,000 | 383,963 |
| Canadian Government 2% 6/1/2028 | CAD | 50,000 | 33,795 |
| Canadian Government 2% 6/1/2032 | CAD | 540,000 | 347,490 |
| Canadian Government 2.75% 12/1/2064 | CAD | 1,750,000 | 1,087,303 |
| Canadian Government 2.75% 6/1/2033 | CAD | 430,000 | 289,676 |
| Canadian Government 3% 6/1/2034 | CAD | 3,760,000 | 2,569,816 |
| Canadian Government 3.25% 12/1/2033 | CAD | 1,640,000 | 1,145,595 |
| Canadian Government 3.25% 9/1/2028 | CAD | 510,000 | 358,754 |
| Canadian Government 3.5% 12/1/2045 | CAD | 90,000 | 64,171 |
| Canadian Government 3.5% 9/1/2029 | CAD | 520,000 | 369,945 |
| City of Montreal 2.3% 9/1/2029 | CAD | 140,000 | 93,151 |
| City of Montreal 2.4% 12/1/2041 | CAD | 70,000 | 36,962 |
| City of Montreal 4.4% 12/1/2043 | CAD | 50,000 | 34,449 |
| City of Ottawa Ontario 4.6% 7/14/2042 | CAD | 70,000 | 49,652 |
| City of Toronto Canada 2.15% 8/25/2040 | CAD | 70,000 | 36,566 |
| City of Toronto Canada 2.8% 11/22/2049 | CAD | 180,000 | 93,753 |
| Export Development Canada 0.5% 2/25/2027 (b) | EUR | 330,000 | 328,635 |
| Province of Alberta 0.5% 4/16/2025 (b) | EUR | 100,000 | 102,906 |
| Province of Alberta 2.05% 6/1/2030 | CAD | 1,100,000 | 719,146 |
| Province of Alberta 3.05% 12/1/2048 | CAD | 724,000 | 413,019 |
| Province of Alberta 3.1% 6/1/2050 | CAD | 231,000 | 132,127 |
| Province of British Columbia 2.3% 6/18/2026 | CAD | 210,000 | 144,706 |
| Province of British Columbia 2.75% 6/18/2052 | CAD | 140,000 | 74,046 |
| Province of British Columbia 2.95% 6/18/2050 | CAD | 924,000 | 512,322 |
| Province of British Columbia 3.55% 6/18/2033 | CAD | 970,000 | 666,972 |
| Province of Manitoba 3% 6/2/2028 | CAD | 320,000 | 221,953 |
| Province of Manitoba 3.2% 3/5/2050 | CAD | 256,000 | 147,393 |
| Province of Manitoba 3.4% 9/5/2048 | CAD | 470,000 | 281,111 |
| Province of New Brunswick 3.05% 8/14/2050 | CAD | 227,000 | 127,041 |
| Province of New Brunswick 3.55% 6/3/2043 | CAD | 100,000 | 62,801 |
| Province of New Brunswick 4.8% 9/26/2039 | CAD | 90,000 | 66,736 |
| Province of Newfoundland 1.75% 6/2/2030 | CAD | 290,000 | 185,528 |
| Province of Newfoundland 2.65% 10/17/2050 | CAD | 217,000 | 109,150 |
| Province of Newfoundland 3.3% 10/17/2046 | CAD | 50,000 | 29,041 |
| Province of Newfoundland 3.7% 10/17/2048 | CAD | 70,000 | 43,109 |
| Province of Nova Scotia 3.15% 12/1/2051 | CAD | 160,000 | 90,971 |
| Province of Nova Scotia 3.45% 6/1/2045 | CAD | 150,000 | 91,755 |
| Province of Ontario 0.25% 12/15/2026 (b) | GBP | 638,000 | 734,676 |
| Province of Ontario 0.375% 4/8/2027 (b) | EUR | 283,000 | 279,708 |
| Province of Ontario 1.05% 9/8/2027 | CAD | 2,770,000 | 1,829,999 |
| Province of Ontario 1.75% 9/8/2025 | CAD | 401,000 | 276,584 |
| Province of Ontario 1.9% 12/2/2051 | CAD | 210,000 | 92,700 |
| Province of Ontario 2.05% 6/2/2030 | CAD | 59,000 | 38,568 |
| Province of Ontario 2.15% 6/2/2031 | CAD | 170,000 | 109,810 |
| Province of Ontario 2.4% 6/2/2026 | CAD | 49,000 | 33,809 |
| Province of Ontario 2.65% 12/2/2050 | CAD | 49,000 | 25,763 |
| Province of Ontario 2.7% 6/2/2029 | CAD | 1,703,000 | 1,162,440 |
| Province of Ontario 2.8% 6/2/2048 | CAD | 1,868,000 | 1,024,752 |
| Province of Ontario 2.9% 12/2/2046 | CAD | 480,000 | 269,824 |
| Province of Ontario 2.9% 6/2/2049 | CAD | 1,735,000 | 963,728 |
| Province of Ontario 3.65% 6/2/2033 | CAD | 1,500,000 | 1,041,198 |
| Province of Ontario 3.75% 12/2/2053 | CAD | 210,000 | 135,502 |
| Province of Ontario 4.1% 3/4/2033 | CAD | 840,000 | 602,460 |
| Province of Ontario 4.6% 6/2/2039 | CAD | 230,000 | 168,243 |
| Province of Ontario 4.7% 6/2/2037 | CAD | 190,000 | 140,894 |
| Province of Quebec 0% 10/29/2030 (b) | EUR | 1,050,000 | 926,535 |
| Province of Quebec 0.5% 1/25/2032 (b) | EUR | 330,000 | 290,509 |
| Province of Quebec 1.5% 9/1/2031 | CAD | 1,966,000 | 1,211,455 |
| Province of Quebec 1.9% 9/1/2030 | CAD | 131,000 | 84,557 |
| Province of Quebec 2.25% 9/15/2026 (b) | GBP | 112,000 | 134,583 |
| Province of Quebec 2.3% 9/1/2029 | CAD | 1,179,000 | 789,576 |
| Province of Quebec 2.5% 9/1/2026 | CAD | 423,000 | 291,952 |
| Province of Quebec 2.85% 12/1/2053 | CAD | 110,000 | 59,106 |
| Province of Quebec 3.1% 12/1/2051 | CAD | 230,000 | 131,129 |
| Province of Quebec 3.5% 12/1/2045 | CAD | 880,000 | 547,015 |
| Province of Quebec 3.5% 12/1/2048 | CAD | 270,000 | 166,236 |
| Province of Quebec 3.6% 9/1/2033 | CAD | 300,000 | 206,916 |
| Province of Quebec 3.65% 5/20/2032 | CAD | 410,000 | 287,158 |
| Province of Quebec 4.4% 12/1/2055 | CAD | 260,000 | 186,217 |
| Province of Quebec 5% 12/1/2038 | CAD | 90,000 | 68,459 |
| Province of Quebec 5% 12/1/2041 | CAD | 420,000 | 319,258 |
| Province of Saskatchewan 3.1% 6/2/2050 | CAD | 293,000 | 168,041 |
| Province of Saskatchewan 3.3% 6/2/2048 | CAD | 150,000 | 89,622 |
| Province of Saskatchewan 3.9% 6/2/2033 | CAD | 70,000 | 49,463 |
| Province of Saskatchewan 4.75% 6/1/2040 | CAD | 120,000 | 89,081 |
TOTAL CANADA | | | 31,918,000 |
| CHILE - 0.1% | | | |
| Chilean Republic 1.25% 1/29/2040 | EUR | 114,000 | 83,620 |
| Chilean Republic 1.875% 5/27/2030 | EUR | 100,000 | 96,724 |
| Chilean Republic 2.3% 10/1/2028 (b)(c) | CLP | 245,000,000 | 217,943 |
| Chilean Republic 5.1% 7/15/2050 | CLP | 120,000,000 | 113,794 |
| Chilean Republic 6% 1/1/2043 | CLP | 200,000,000 | 207,313 |
| Chilean Republic 7% 5/1/2034 (b)(c) | CLP | 105,000,000 | 114,161 |
TOTAL CHILE | | | 833,555 |
| CHINA - 13.4% | | | |
| Peoples Republic of China 0.5% 11/12/2031 (b) | EUR | 110,000 | 96,862 |
| Peoples Republic of China 0.625% 11/25/2035 (b) | EUR | 150,000 | 121,056 |
| Peoples Republic of China 1.35% 9/25/2026 | CNY | 47,730,000 | 6,566,441 |
| Peoples Republic of China 1.74% 10/15/2029 | CNY | 73,620,000 | 10,236,772 |
| Peoples Republic of China 1.87% 9/15/2031 | CNY | 8,490,000 | 1,184,241 |
| Peoples Republic of China 1.91% 7/15/2029 | CNY | 25,000,000 | 3,500,037 |
| Peoples Republic of China 2.04% 2/25/2027 | CNY | 24,640,000 | 3,438,938 |
| Peoples Republic of China 2.05% 4/15/2029 | CNY | 32,240,000 | 4,535,090 |
| Peoples Republic of China 2.11% 8/25/2034 | CNY | 40,010,000 | 5,688,985 |
| Peoples Republic of China 2.27% 5/25/2034 | CNY | 36,660,000 | 5,280,476 |
| Peoples Republic of China 2.35% 2/25/2034 | CNY | 19,030,000 | 2,749,401 |
| Peoples Republic of China 2.37% 1/15/2029 | CNY | 28,050,000 | 3,989,449 |
| Peoples Republic of China 2.37% 1/20/2027 | CNY | 5,670,000 | 796,183 |
| Peoples Republic of China 2.39% 11/15/2026 | CNY | 14,910,000 | 2,089,685 |
| Peoples Republic of China 2.4% 7/15/2028 | CNY | 50,010,000 | 7,099,545 |
| Peoples Republic of China 2.44% 10/15/2027 | CNY | 4,120,000 | 583,834 |
| Peoples Republic of China 2.48% 4/15/2027 | CNY | 6,860,000 | 968,574 |
| Peoples Republic of China 2.5% 7/25/2027 | CNY | 21,290,000 | 3,010,711 |
| Peoples Republic of China 2.52% 8/25/2033 | CNY | 35,920,000 | 5,242,828 |
| Peoples Republic of China 2.55% 10/15/2028 | CNY | 36,740,000 | 5,248,572 |
| Peoples Republic of China 2.6% 9/1/2032 | CNY | 15,220,000 | 2,222,217 |
| Peoples Republic of China 2.6% 9/15/2030 | CNY | 1,630,000 | 235,922 |
| Peoples Republic of China 2.62% 4/15/2028 | CNY | 12,130,000 | 1,731,696 |
| Peoples Republic of China 2.62% 9/25/2029 | CNY | 13,690,000 | 1,976,607 |
| Peoples Republic of China 2.64% 1/15/2028 | CNY | 20,000,000 | 2,855,560 |
| Peoples Republic of China 2.65% 3/25/2074 | CNY | 7,760,000 | 1,287,316 |
| Peoples Republic of China 2.67% 11/25/2033 | CNY | 25,000,000 | 3,691,402 |
| Peoples Republic of China 2.68% 5/21/2030 | CNY | 1,760,000 | 255,576 |
| Peoples Republic of China 2.7% 11/3/2026 | CNY | 20,270,000 | 2,851,765 |
| Peoples Republic of China 2.75% 2/17/2032 | CNY | 9,650,000 | 1,422,521 |
| Peoples Republic of China 2.75% 6/15/2029 | CNY | 11,830,000 | 1,712,124 |
| Peoples Republic of China 2.76% 5/15/2032 | CNY | 20,700,000 | 3,055,861 |
| Peoples Republic of China 2.79% 12/15/2029 | CNY | 8,320,000 | 1,213,056 |
| Peoples Republic of China 2.8% 11/15/2032 | CNY | 12,110,000 | 1,793,021 |
| Peoples Republic of China 2.8% 3/24/2029 | CNY | 7,560,000 | 1,094,659 |
| Peoples Republic of China 2.88% 2/25/2033 | CNY | 5,620,000 | 839,306 |
| Peoples Republic of China 3.02% 10/22/2025 | CNY | 15,570,000 | 2,167,230 |
| Peoples Republic of China 3.02% 5/27/2031 | CNY | 2,210,000 | 329,370 |
| Peoples Republic of China 3.12% 10/25/2052 | CNY | 9,420,000 | 1,593,663 |
| Peoples Republic of China 3.19% 4/15/2053 | CNY | 2,170,000 | 372,114 |
| Peoples Republic of China 3.27% 11/19/2030 | CNY | 40,000 | 6,034 |
| Peoples Republic of China 3.27% 3/25/2073 | CNY | 6,040,000 | 1,151,167 |
| Peoples Republic of China 3.32% 4/15/2052 | CNY | 19,390,000 | 3,377,930 |
| Peoples Republic of China 3.53% 10/18/2051 | CNY | 2,230,000 | 400,551 |
| Peoples Republic of China 3.73% 5/25/2070 | CNY | 1,050,000 | 216,602 |
| Peoples Republic of China 3.81% 9/14/2050 | CNY | 36,960,000 | 6,867,040 |
| Peoples Republic of China 3.82% 11/19/2068 | CNY | 5,380,000 | 1,117,049 |
| Peoples Republic of China 3.86% 7/22/2049 | CNY | 17,330,000 | 3,218,935 |
| Peoples Republic of China 4% 6/24/2069 | CNY | 1,080,000 | 233,871 |
| Peoples Republic of China 4.12% 8/2/2042 | CNY | 3,320,000 | 600,914 |
| Peoples Republic of China 4.3% 10/27/2044 | CNY | 4,540,000 | 858,175 |
TOTAL CHINA | | | 123,176,934 |
| COLOMBIA - 0.3% | | | |
| Colombian Republic 5.75% 11/3/2027 | COP | 2,000,000,000 | 407,243 |
| Colombian Republic 7% 3/26/2031 | COP | 3,780,000,000 | 696,436 |
| Colombian Republic 7% 6/30/2032 | COP | 873,300,000 | 153,890 |
| Colombian Republic 7.25% 10/18/2034 | COP | 1,541,500,000 | 257,718 |
| Colombian Republic 7.5% 8/26/2026 | COP | 4,005,000,000 | 882,809 |
TOTAL COLOMBIA | | | 2,398,096 |
| CROATIA - 0.0% | | | |
| Republic of Croatia Ministry of Finance 1.125% 6/19/2029 (b) | EUR | 151,000 | 146,539 |
| Republic of Croatia Ministry of Finance 1.75% 3/4/2041 (b) | EUR | 200,000 | 167,485 |
| Republic of Croatia Ministry of Finance 2.7% 6/15/2028 (b) | EUR | 200,000 | 207,833 |
TOTAL CROATIA | | | 521,857 |
| CYPRUS - 0.0% | | | |
| Cyprus Government Bond 2.25% 4/16/2050 (b) | EUR | 59,000 | 46,194 |
| Cyprus Government Bond 2.375% 9/25/2028 (b) | EUR | 84,000 | 85,925 |
| Cyprus Government Bond 4.125% 4/13/2033 (b) | EUR | 290,000 | 327,811 |
TOTAL CYPRUS | | | 459,930 |
| CZECH REPUBLIC - 0.4% | | | |
| Czech Republic 0.25% 2/10/2027 | CZK | 27,960,000 | 1,066,838 |
| Czech Republic 1.2% 3/13/2031 | CZK | 5,250,000 | 183,212 |
| Czech Republic 1.25% 2/14/2025 | CZK | 170,000 | 6,955 |
| Czech Republic 1.5% 4/24/2040 | CZK | 10,600,000 | 296,272 |
| Czech Republic 1.75% 6/23/2032 | CZK | 7,650,000 | 268,947 |
| Czech Republic 2% 10/13/2033 | CZK | 2,230,000 | 77,152 |
| Czech Republic 4.85% 11/26/2057 (b) | CZK | 1,830,000 | 78,161 |
| Czech Republic 5.5% 12/12/2028 | CZK | 7,560,000 | 329,983 |
| Czech Republic 5.75% 3/29/2029 | CZK | 20,610,000 | 910,815 |
TOTAL CZECH REPUBLIC | | | 3,218,335 |
| DENMARK - 0.3% | | | |
| Danish Kingdom 0% 11/15/2031 | DKK | 610,000 | 74,354 |
| Danish Kingdom 0.25% 11/15/2052 | DKK | 1,761,000 | 142,778 |
| Danish Kingdom 0.5% 11/15/2027 | DKK | 3,050,000 | 408,622 |
| Danish Kingdom 0.5% 11/15/2029 | DKK | 7,384,000 | 959,407 |
| Danish Kingdom 2.25% 11/15/2033 | DKK | 2,510,000 | 352,963 |
| Danish Kingdom 4.5% 11/15/2039 | DKK | 3,960,000 | 700,023 |
TOTAL DENMARK | | | 2,638,147 |
| ESTONIA - 0.1% | | | |
| Estonia Government International Bond 4% 10/12/2032 (b) | EUR | 470,000 | 523,327 |
| FINLAND - 0.4% | | | |
| Finnish Government 0% 9/15/2030 (b)(c) | EUR | 260,000 | 233,777 |
| Finnish Government 0.125% 4/15/2036 (b)(c) | EUR | 452,000 | 343,737 |
| Finnish Government 0.125% 4/15/2052 (b)(c) | EUR | 294,000 | 144,486 |
| Finnish Government 0.25% 9/15/2040 (b)(c) | EUR | 433,000 | 294,722 |
| Finnish Government 0.5% 4/15/2026 (b)(c) | EUR | 44,000 | 44,599 |
| Finnish Government 0.5% 4/15/2043 (b)(c) | EUR | 373,000 | 250,061 |
| Finnish Government 0.5% 9/15/2028 (b)(c) | EUR | 890,000 | 862,416 |
| Finnish Government 1.125% 4/15/2034 (b)(c) | EUR | 166,000 | 149,050 |
| Finnish Government 1.5% 9/15/2032 (b)(c) | EUR | 270,000 | 256,568 |
| Finnish Government 2.625% 7/4/2042 (b)(c) | EUR | 20,000 | 19,625 |
| Finnish Government 2.875% 4/15/2029 (b)(c) | EUR | 440,000 | 464,327 |
| Finnish Government 3% 9/15/2033 (b)(c) | EUR | 200,000 | 210,845 |
TOTAL FINLAND | | | 3,274,213 |
| FRANCE - 5.9% | | | |
| Action Logement Services 0.375% 10/5/2031 (b) | EUR | 600,000 | 519,351 |
| Agence France Locale-Societe Territoriale SA 3.125% 3/20/2034 (b) | EUR | 100,000 | 102,104 |
| Caisse d'Amortissement de la Dette Sociale 0% 11/25/2030 (b) | EUR | 900,000 | 789,616 |
| Caisse d'Amortissement de la Dette Sociale 0% 2/25/2028 (b) | EUR | 600,000 | 574,058 |
| Caisse d'Amortissement de la Dette Sociale 0% 5/25/2031 (b) | EUR | 300,000 | 258,623 |
| Caisse d'Amortissement de la Dette Sociale 0.125% 12/15/2025 (b) | GBP | 400,000 | 479,232 |
| Caisse d'Amortissement de la Dette Sociale 1.75% 11/25/2027 (b) | EUR | 500,000 | 506,947 |
| Caisse d'Amortissement de la Dette Sociale 3% 11/25/2031 (b) | EUR | 200,000 | 207,640 |
| French Government 0% 11/25/2029 (b)(c) | EUR | 3,307,000 | 3,014,386 |
| French Government 0% 11/25/2030 (b)(c) | EUR | 1,209,000 | 1,065,338 |
| French Government 0% 11/25/2031 (b)(c) | EUR | 3,017,000 | 2,570,912 |
| French Government 0% 2/25/2026 (b)(c) | EUR | 2,683,000 | 2,708,690 |
| French Government 0% 2/25/2027 (b)(c) | EUR | 315,000 | 310,686 |
| French Government 0% 3/25/2025 (b)(c) | EUR | 14,000 | 14,418 |
| French Government 0% 5/25/2032 (b)(c) | EUR | 883,000 | 737,765 |
| French Government 0.25% 11/25/2026 (b)(c) | EUR | 1,615,000 | 1,611,052 |
| French Government 0.5% 5/25/2026 (b)(c) | EUR | 33,000 | 33,382 |
| French Government 0.5% 5/25/2029 (b)(c) | EUR | 1,326,000 | 1,254,009 |
| French Government 0.5% 5/25/2040 (b)(c) | EUR | 3,197,000 | 2,154,800 |
| French Government 0.5% 5/25/2072 (b)(c) | EUR | 1,400,000 | 495,733 |
| French Government 0.5% 6/25/2044 (b)(c) | EUR | 690,000 | 414,951 |
| French Government 0.75% 2/25/2028 (b)(c) | EUR | 3,330,000 | 3,272,986 |
| French Government 0.75% 5/25/2028 (b)(c) | EUR | 473,000 | 462,692 |
| French Government 0.75% 5/25/2052 (b)(c) | EUR | 2,316,000 | 1,214,852 |
| French Government 0.75% 5/25/2053 (b)(c) | EUR | 2,348,000 | 1,204,005 |
| French Government 1% 11/25/2025 (b)(c) | EUR | 36,000 | 36,853 |
| French Government 1% 5/25/2027 (b)(c) | EUR | 3,126,000 | 3,139,598 |
| French Government 1.25% 5/25/2034 (b)(c) | EUR | 137,000 | 120,242 |
| French Government 1.25% 5/25/2036 (b)(c) | EUR | 1,858,000 | 1,563,091 |
| French Government 1.25% 5/25/2038 (b)(c) | EUR | 390,000 | 311,638 |
| French Government 1.5% 5/25/2031 (b)(c) | EUR | 1,913,000 | 1,831,219 |
| French Government 1.5% 5/25/2050 (b)(c) | EUR | 354,000 | 238,435 |
| French Government 1.75% 5/25/2066 (b)(c) | EUR | 33,000 | 20,755 |
| French Government 1.75% 6/25/2039 (b)(c) | EUR | 655,000 | 553,343 |
| French Government 2% 11/25/2032 (b)(c) | EUR | 2,970,000 | 2,860,025 |
| French Government 2% 5/25/2048 (b)(c) | EUR | 124,000 | 96,382 |
| French Government 2.5% 5/25/2030 (b)(c) | EUR | 840,000 | 861,042 |
| French Government 2.5% 5/25/2043 (b)(c) | EUR | 2,480,000 | 2,212,472 |
| French Government 2.5% 9/24/2026 (b)(c) | EUR | 420,000 | 436,746 |
| French Government 2.5% 9/24/2027 (b)(c) | EUR | 3,440,000 | 3,573,808 |
| French Government 2.75% 2/25/2029 (b)(c) | EUR | 2,400,000 | 2,499,567 |
| French Government 3% 11/25/2034 (b)(c) | EUR | 2,610,000 | 2,660,852 |
| French Government 3% 5/25/2033 (b)(c) | EUR | 870,000 | 896,421 |
| French Government 3% 5/25/2054 (b)(c) | EUR | 610,000 | 552,430 |
| French Government 3.5% 11/25/2033 (b)(c) | EUR | 2,300,000 | 2,451,794 |
| French Government 4% 4/25/2060 (b)(c) | EUR | 230,000 | 251,162 |
| French Government 4.75% 4/25/2035 (b)(c) | EUR | 100,000 | 117,459 |
| Societe Des Grands Projets EPIC 0% 11/25/2030 (b) | EUR | 500,000 | 435,848 |
| Societe Des Grands Projets EPIC 1.7% 5/25/2050 (b) | EUR | 500,000 | 341,433 |
| Ville de Paris 1.375% 11/20/2034 (b) | EUR | 100,000 | 84,929 |
TOTAL FRANCE | | | 54,125,772 |
| GERMANY - 5.0% | | | |
| Free State of Saxony 0.01% 12/17/2035 (b) | EUR | 490,000 | 376,142 |
| Gemeinsame Deutsche Bundeslaender 0.01% 2/4/2031 (b) | EUR | 50,000 | 44,316 |
| German Federal Republic 0% 2/15/2032 (b) | EUR | 8,000 | 7,105 |
| German Federal Republic 0% 4/11/2025 (b) | EUR | 5,000 | 5,144 |
| German Federal Republic 0% 4/16/2027 (b) | EUR | 3,750,000 | 3,710,873 |
| German Federal Republic 0% 8/15/2030 (b) | EUR | 2,261,000 | 2,085,704 |
| German Federal Republic 0% 8/15/2031 (b) | EUR | 4,080,000 | 3,673,286 |
| German Federal Republic 0.25% 2/15/2029 (b) | EUR | 6,000 | 5,785 |
| German Federal Republic 0.5% 2/15/2028 (b) | EUR | 7,000 | 6,930 |
| German Federal Republic 1.3% 10/15/2027 (b)(d) | EUR | 4,950,000 | 5,034,394 |
| German Federal Republic 1.8% 8/15/2053 (b) | EUR | 1,740,000 | 1,518,387 |
| German Federal Republic 2.1% 4/12/2029 (b) | EUR | 530,000 | 548,601 |
| German Federal Republic 2.2% 2/15/2034 (b) | EUR | 2,860,000 | 2,930,275 |
| German Federal Republic 2.3% 2/15/2033 (b) | EUR | 1,000,000 | 1,038,266 |
| German Federal Republic 2.4% 11/15/2030 (b) | EUR | 1,720,000 | 1,803,113 |
| German Federal Republic 2.5% 10/11/2029 (b) | EUR | 3,710,000 | 3,902,204 |
| German Federal Republic 2.5% 7/4/2044 (b) | EUR | 2,970,000 | 3,035,842 |
| German Federal Republic 2.5% 8/15/2054 (b) | EUR | 1,920,000 | 1,948,059 |
| German Federal Republic 2.6% 8/15/2033 (b) | EUR | 340,000 | 360,246 |
| German Federal Republic 2.6% 8/15/2034 (b) | EUR | 2,170,000 | 2,293,147 |
| German Federal Republic 3.25% 7/4/2042 (b) | EUR | 3,520,000 | 3,976,595 |
| German Federal Republic 4% 1/4/2037 (b) | EUR | 40,000 | 47,847 |
| German Federal Republic 4.75% 7/4/2040 (b) | EUR | 20,000 | 26,414 |
| Land Berlin 0.125% 11/24/2045 (b) | EUR | 270,000 | 152,558 |
| Land Berlin 2.75% 2/14/2033 | EUR | 340,000 | 353,713 |
| State of Brandenburg 0.05% 7/1/2031 (b) | EUR | 110,000 | 96,992 |
| State of Bremen 0.15% 10/24/2031 | EUR | 50,000 | 43,878 |
| State of Bremen 0.4% 8/20/2049 (b) | EUR | 29,000 | 15,961 |
| State of Hesse 0.01% 6/18/2031 (b) | EUR | 540,000 | 474,529 |
| State of Hesse 0.125% 10/10/2031 | EUR | 210,000 | 184,287 |
| State of Lower Saxony 0.01% 1/10/2031 (b) | EUR | 130,000 | 115,698 |
| State of Lower Saxony 0.01% 11/25/2027 (b) | EUR | 430,000 | 416,110 |
| State of Lower Saxony 0.125% 1/9/2032 (b) | EUR | 200,000 | 174,521 |
| State of Lower Saxony 0.75% 3/21/2031 | EUR | 170,000 | 157,929 |
| State of Lower Saxony 1.125% 9/12/2033 (b) | EUR | 70,000 | 63,702 |
| State of North Rhine-Westphalia Germany 0% 10/12/2035 (b) | EUR | 80,000 | 61,182 |
| State of North Rhine-Westphalia Germany 0.2% 1/27/2051 (b) | EUR | 50,000 | 24,773 |
| State of North Rhine-Westphalia Germany 0.2% 3/31/2027 (b) | EUR | 1,513,000 | 1,496,319 |
| State of North Rhine-Westphalia Germany 0.2% 4/9/2030 (b) | EUR | 725,000 | 665,420 |
| State of North Rhine-Westphalia Germany 0.5% 11/25/2039 (b) | EUR | 72,000 | 52,118 |
| State of North Rhine-Westphalia Germany 0.625% 7/21/2031 (b) | EUR | 24,000 | 21,903 |
| State of North Rhine-Westphalia Germany 0.8% 7/30/2049 (b) | EUR | 364,000 | 226,467 |
| State of North Rhine-Westphalia Germany 1.25% 5/12/2036 (b) | EUR | 226,000 | 196,988 |
| State of North Rhine-Westphalia Germany 1.375% 1/15/2120 (b) | EUR | 70,000 | 37,107 |
| State of North Rhine-Westphalia Germany 1.55% 6/16/2048 (b) | EUR | 178,000 | 136,534 |
| State of North Rhine-Westphalia Germany 1.65% 2/22/2038 (b) | EUR | 607,000 | 539,108 |
| State of North Rhine-Westphalia Germany 1.95% 9/26/2078 (b) | EUR | 270,000 | 200,547 |
| State of North Rhine-Westphalia Germany 2% 6/15/2032 (b) | EUR | 590,000 | 583,949 |
| State of North Rhine-Westphalia Germany 2.15% 3/21/2119 (b) | EUR | 70,000 | 52,998 |
| State of Rhineland-Palatinate 0.01% 1/21/2031 (b) | EUR | 340,000 | 302,368 |
| State of Rhineland-Palatinate 0.75% 2/23/2032 | EUR | 130,000 | 118,661 |
| State of Saxony-Anhalt 3.15% 2/6/2054 | EUR | 50,000 | 51,117 |
| State of Schleswig-Holstein Germany 0.05% 7/8/2031 (b) | EUR | 410,000 | 360,344 |
TOTAL GERMANY | | | 45,756,456 |
| GREECE - 0.2% | | | |
| Greek Government 1.875% 1/24/2052 (b)(c) | EUR | 320,000 | 229,090 |
| Greek Government 3.9% 1/30/2033 (b) | EUR | 1,280,000 | 1,401,493 |
| Greek Government 4.2% 1/30/2042 (b) | EUR | 110,000 | 120,891 |
TOTAL GREECE | | | 1,751,474 |
| HONG KONG - 0.0% | | | |
| Hong Kong Government 1.59% 3/4/2036 | HKD | 1,050,000 | 109,501 |
| HUNGARY - 0.2% | | | |
| Hungary Government 1% 11/26/2025 | HUF | 30,380,000 | 73,636 |
| Hungary Government 1.5% 4/22/2026 | HUF | 43,280,000 | 103,186 |
| Hungary Government 1.625% 4/28/2032 (b) | EUR | 246,000 | 217,725 |
| Hungary Government 1.75% 10/10/2027 (b) | EUR | 150,000 | 148,922 |
| Hungary Government 1.75% 6/5/2035 (b) | EUR | 80,000 | 65,593 |
| Hungary Government 2.75% 12/22/2026 | HUF | 30,520,000 | 72,051 |
| Hungary Government 3% 4/25/2041 | HUF | 227,580,000 | 353,962 |
| Hungary Government 3% 8/21/2030 | HUF | 64,320,000 | 138,085 |
| Hungary Government 4.5% 3/23/2028 | HUF | 112,000,000 | 266,492 |
TOTAL HUNGARY | | | 1,439,652 |
| INDONESIA - 0.8% | | | |
| Indonesia Government 1.45% 9/18/2026 | EUR | 430,000 | 431,723 |
| Indonesia Government 5.125% 4/15/2027 | IDR | 9,200,000,000 | 549,599 |
| Indonesia Government 5.5% 4/15/2026 | IDR | 1,000,000 | 60 |
| Indonesia Government 6.375% 4/15/2042 | IDR | 900,000,000 | 51,389 |
| Indonesia Government 6.375% 8/15/2028 | IDR | 6,111,000,000 | 371,140 |
| Indonesia Government 6.5% 2/15/2031 | IDR | 4,193,000,000 | 253,929 |
| Indonesia Government 6.5% 6/15/2025 | IDR | 717,000,000 | 44,477 |
| Indonesia Government 6.625% 2/15/2034 | IDR | 11,657,000,000 | 704,178 |
| Indonesia Government 6.875% 4/15/2029 | IDR | 10,560,000,000 | 652,359 |
| Indonesia Government 6.875% 8/15/2051 | IDR | 528,000,000 | 31,690 |
| Indonesia Government 7% 2/15/2033 | IDR | 24,508,000,000 | 1,515,984 |
| Indonesia Government 7% 9/15/2030 | IDR | 15,924,000,000 | 985,003 |
| Indonesia Government 7.125% 6/15/2042 | IDR | 2,600,000,000 | 161,137 |
| Indonesia Government 7.125% 6/15/2043 | IDR | 5,576,000,000 | 346,270 |
| Indonesia Government 7.375% 5/15/2048 | IDR | 8,728,000,000 | 553,126 |
| Indonesia Government 7.5% 4/15/2040 | IDR | 9,622,000,000 | 618,151 |
| Indonesia Government 7.5% 5/15/2038 | IDR | 1,631,000,000 | 104,629 |
| Indonesia Government 7.5% 6/15/2035 | IDR | 1,449,000,000 | 92,549 |
| Indonesia Government 8.375% 4/15/2039 | IDR | 1,794,000,000 | 123,390 |
TOTAL INDONESIA | | | 7,590,783 |
| IRELAND - 0.5% | | | |
| Republic of Ireland Treasury Bill 0.2% 10/18/2030 (b) | EUR | 86,000 | 78,610 |
| Republic of Ireland Treasury Bill 0.2% 5/15/2027 (b) | EUR | 225,000 | 222,878 |
| Republic of Ireland Treasury Bill 0.35% 10/18/2032 (b) | EUR | 290,000 | 255,910 |
| Republic of Ireland Treasury Bill 0.4% 5/15/2035 (b) | EUR | 355,000 | 291,490 |
| Republic of Ireland Treasury Bill 0.55% 4/22/2041 (b) | EUR | 130,000 | 94,316 |
| Republic of Ireland Treasury Bill 0.9% 5/15/2028 (b) | EUR | 1,202,000 | 1,195,792 |
| Republic of Ireland Treasury Bill 1% 5/15/2026 (b) | EUR | 188,000 | 192,072 |
| Republic of Ireland Treasury Bill 1.1% 5/15/2029 (b) | EUR | 689,000 | 678,801 |
| Republic of Ireland Treasury Bill 1.3% 5/15/2033 (b) | EUR | 570,000 | 536,580 |
| Republic of Ireland Treasury Bill 1.5% 5/15/2050 (b) | EUR | 310,000 | 240,471 |
| Republic of Ireland Treasury Bill 1.7% 5/15/2037 (b) | EUR | 380,000 | 348,541 |
TOTAL IRELAND | | | 4,135,461 |
| ISRAEL - 0.2% | | | |
| Israel Government 1% 3/31/2030 | ILS | 1,812,000 | 423,027 |
| Israel Government 1.3% 4/30/2032 | ILS | 840,000 | 187,625 |
| Israel Government 1.5% 1/16/2029 (b) | EUR | 335,000 | 320,986 |
| Israel Government 1.5% 5/31/2037 | ILS | 738,000 | 144,568 |
| Israel Government 2.8% 11/29/2052 | ILS | 930,000 | 176,419 |
| Israel Government 3.75% 2/28/2029 | ILS | 830,000 | 224,003 |
| Israel Government 3.75% 3/31/2047 | ILS | 476,000 | 113,038 |
| Israel Government 4% 3/30/2035 | ILS | 1,480,000 | 391,242 |
TOTAL ISRAEL | | | 1,980,908 |
| ITALY - 5.6% | | | |
| Cassa Depositi e Prestiti SpA 1% 2/11/2030 (b) | EUR | 100,000 | 93,034 |
| Italian Republic 0.45% 2/15/2029 (b) | EUR | 190,000 | 179,905 |
| Italian Republic 0.5% 7/15/2028 (b) | EUR | 1,040,000 | 1,002,289 |
| Italian Republic 0.85% 1/15/2027 (b) | EUR | 81,000 | 81,464 |
| Italian Republic 0.9% 4/1/2031 (b) | EUR | 82,000 | 74,662 |
| Italian Republic 0.95% 6/1/2032 (b) | EUR | 701,000 | 621,051 |
| Italian Republic 0.95% 8/1/2030 (b) | EUR | 142,000 | 132,132 |
| Italian Republic 0.95% 9/15/2027 (b) | EUR | 1,948,000 | 1,939,378 |
| Italian Republic 1.1% 4/1/2027 (b) | EUR | 2,024,000 | 2,037,416 |
| Italian Republic 1.35% 4/1/2030 (b) | EUR | 1,950,000 | 1,871,444 |
| Italian Republic 1.45% 3/1/2036 (b)(c) | EUR | 1,347,000 | 1,125,887 |
| Italian Republic 1.45% 5/15/2025 (b) | EUR | 80,000 | 82,561 |
| Italian Republic 1.6% 6/1/2026 (b) | EUR | 179,000 | 183,693 |
| Italian Republic 1.65% 3/1/2032 (b)(c) | EUR | 575,000 | 539,974 |
| Italian Republic 1.7% 9/1/2051 (b)(c) | EUR | 536,000 | 355,128 |
| Italian Republic 1.8% 3/1/2041 (b)(c) | EUR | 2,541,000 | 1,987,711 |
| Italian Republic 2.05% 8/1/2027 (b) | EUR | 213,000 | 218,648 |
| Italian Republic 2.1% 7/15/2026 (b) | EUR | 1,186,000 | 1,225,570 |
| Italian Republic 2.15% 3/1/2072 (b)(c) | EUR | 520,000 | 341,933 |
| Italian Republic 2.15% 9/1/2052 (b)(c) | EUR | 962,000 | 692,396 |
| Italian Republic 2.2% 6/1/2027 (b) | EUR | 1,612,000 | 1,662,826 |
| Italian Republic 2.25% 9/1/2036 (b)(c) | EUR | 639,000 | 579,837 |
| Italian Republic 2.45% 9/1/2033 (b)(c) | EUR | 897,000 | 871,001 |
| Italian Republic 2.45% 9/1/2050 (b)(c) | EUR | 77,000 | 60,382 |
| Italian Republic 2.5% 11/15/2025 (b) | EUR | 2,093,000 | 2,172,153 |
| Italian Republic 2.5% 12/1/2032 (b) | EUR | 260,000 | 255,909 |
| Italian Republic 2.65% 12/1/2027 (b) | EUR | 640,000 | 665,622 |
| Italian Republic 2.7% 3/1/2047 (b)(c) | EUR | 116,000 | 98,521 |
| Italian Republic 2.8% 3/1/2067 (b)(c) | EUR | 120,000 | 95,296 |
| Italian Republic 2.8% 6/15/2029 (b) | EUR | 1,740,000 | 1,806,496 |
| Italian Republic 2.95% 9/1/2038 (b)(c) | EUR | 433,000 | 411,500 |
| Italian Republic 3% 8/1/2029 (b) | EUR | 1,708,000 | 1,789,773 |
| Italian Republic 3.1% 3/1/2040 (b)(c) | EUR | 1,208,000 | 1,148,631 |
| Italian Republic 3.15% 11/15/2031 (b)(c) | EUR | 680,000 | 703,722 |
| Italian Republic 3.35% 3/1/2035 (b)(c) | EUR | 1,808,000 | 1,857,596 |
| Italian Republic 3.45% 3/1/2048 (b)(c) | EUR | 1,000 | 955 |
| Italian Republic 3.45% 7/15/2027 (b) | EUR | 5,010,000 | 5,312,184 |
| Italian Republic 3.45% 7/15/2031 (b) | EUR | 1,450,000 | 1,531,397 |
| Italian Republic 3.5% 2/15/2031 (b)(c) | EUR | 330,000 | 350,149 |
| Italian Republic 3.6% 9/29/2025 (b) | EUR | 620,000 | 647,484 |
| Italian Republic 3.7% 6/15/2030 (b) | EUR | 1,220,000 | 1,310,584 |
| Italian Republic 3.8% 4/15/2026 (b) | EUR | 630,000 | 664,136 |
| Italian Republic 3.85% 12/15/2029 (b) | EUR | 1,770,000 | 1,917,242 |
| Italian Republic 3.85% 2/1/2035 (b) | EUR | 500,000 | 533,524 |
| Italian Republic 3.85% 7/1/2034 (b) | EUR | 1,280,000 | 1,368,856 |
| Italian Republic 3.85% 9/1/2049 (b)(c) | EUR | 679,000 | 686,075 |
| Italian Republic 4% 11/15/2030 (b) | EUR | 2,510,000 | 2,737,211 |
| Italian Republic 4.1% 2/1/2029 (b) | EUR | 130,000 | 141,705 |
| Italian Republic 4.15% 10/1/2039 (b)(c) | EUR | 50,000 | 53,667 |
| Italian Republic 4.2% 3/1/2034 (b) | EUR | 590,000 | 649,881 |
| Italian Republic 4.4% 5/1/2033 (b) | EUR | 760,000 | 850,966 |
| Italian Republic 4.45% 9/1/2043 (b)(c) | EUR | 2,310,000 | 2,545,480 |
| Italian Republic 4.5% 10/1/2053 (b)(c) | EUR | 390,000 | 431,147 |
| Italian Republic 4.5% 3/1/2026 (b)(c) | EUR | 50,000 | 53,072 |
| Italian Republic 5% 3/1/2025 (b)(c) | EUR | 80,000 | 83,158 |
| Italian Republic 5% 8/1/2034 (b)(c) | EUR | 20,000 | 23,386 |
| Italian Republic 5% 8/1/2039 (b)(c) | EUR | 20,000 | 23,506 |
| Italian Republic 6.5% 11/1/2027 (b) | EUR | 50,000 | 57,406 |
TOTAL ITALY | | | 50,938,712 |
| JAPAN - 9.9% | | | |
| Japan Government 0.005% 3/20/2027 | JPY | 121,200,000 | 760,730 |
| Japan Government 0.005% 6/20/2027 | JPY | 230,000,000 | 1,441,277 |
| Japan Government 0.1% 12/20/2026 | JPY | 70,150,000 | 441,738 |
| Japan Government 0.1% 12/20/2027 | JPY | 75,800,000 | 474,614 |
| Japan Government 0.1% 12/20/2028 | JPY | 69,800,000 | 433,577 |
| Japan Government 0.1% 12/20/2029 | JPY | 617,250,000 | 3,801,926 |
| Japan Government 0.1% 12/20/2030 | JPY | 83,550,000 | 510,486 |
| Japan Government 0.1% 12/20/2031 | JPY | 365,450,000 | 2,207,634 |
| Japan Government 0.1% 3/20/2025 | JPY | 50,000 | 317 |
| Japan Government 0.1% 3/20/2026 | JPY | 19,900,000 | 125,897 |
| Japan Government 0.1% 3/20/2027 | JPY | 295,100,000 | 1,856,123 |
| Japan Government 0.1% 3/20/2028 | JPY | 53,650,000 | 335,355 |
| Japan Government 0.1% 3/20/2029 | JPY | 23,050,000 | 142,862 |
| Japan Government 0.1% 3/20/2030 | JPY | 15,400,000 | 94,669 |
| Japan Government 0.1% 3/20/2031 | JPY | 407,600,000 | 2,483,395 |
| Japan Government 0.1% 6/20/2027 | JPY | 459,900,000 | 2,888,650 |
| Japan Government 0.1% 6/20/2028 | JPY | 30,400,000 | 189,638 |
| Japan Government 0.1% 6/20/2030 | JPY | 393,950,000 | 2,417,305 |
| Japan Government 0.1% 9/20/2026 | JPY | 63,300,000 | 399,102 |
| Japan Government 0.1% 9/20/2027 | JPY | 177,000,000 | 1,110,090 |
| Japan Government 0.1% 9/20/2027 | JPY | 510,700,000 | 3,203,053 |
| Japan Government 0.1% 9/20/2028 | JPY | 231,650,000 | 1,442,135 |
| Japan Government 0.1% 9/20/2030 | JPY | 362,600,000 | 2,220,100 |
| Japan Government 0.2% 12/20/2027 | JPY | 169,000,000 | 1,061,334 |
| Japan Government 0.2% 12/20/2028 | JPY | 46,550,000 | 290,329 |
| Japan Government 0.2% 3/20/2032 | JPY | 28,000,000 | 169,822 |
| Japan Government 0.2% 6/20/2028 | JPY | 54,650,000 | 342,088 |
| Japan Government 0.2% 6/20/2032 | JPY | 84,300,000 | 509,733 |
| Japan Government 0.2% 6/20/2036 | JPY | 272,850,000 | 1,540,459 |
| Japan Government 0.2% 9/20/2032 | JPY | 53,150,000 | 320,309 |
| Japan Government 0.3% 12/20/2025 | JPY | 821,250,000 | 5,212,898 |
| Japan Government 0.3% 12/20/2039 | JPY | 900,000 | 4,765 |
| Japan Government 0.3% 6/20/2039 | JPY | 158,200,000 | 847,671 |
| Japan Government 0.3% 6/20/2046 | JPY | 137,800,000 | 622,331 |
| Japan Government 0.3% 9/20/2039 | JPY | 56,150,000 | 299,016 |
| Japan Government 0.4% 3/20/2036 | JPY | 192,500,000 | 1,118,028 |
| Japan Government 0.4% 3/20/2040 | JPY | 51,800,000 | 277,033 |
| Japan Government 0.4% 3/20/2050 | JPY | 35,400,000 | 150,694 |
| Japan Government 0.4% 3/20/2056 | JPY | 505,000,000 | 1,875,733 |
| Japan Government 0.4% 6/20/2025 | JPY | 12,550,000 | 79,814 |
| Japan Government 0.4% 6/20/2040 | JPY | 10,450,000 | 55,553 |
| Japan Government 0.4% 9/20/2040 | JPY | 73,150,000 | 386,608 |
| Japan Government 0.4% 9/20/2049 | JPY | 5,450,000 | 23,491 |
| Japan Government 0.5% 12/20/2038 | JPY | 15,550,000 | 86,740 |
| Japan Government 0.5% 3/20/2033 | JPY | 20,850,000 | 128,003 |
| Japan Government 0.5% 3/20/2049 | JPY | 10,450,000 | 46,857 |
| Japan Government 0.5% 9/20/2036 | JPY | 93,750,000 | 545,829 |
| Japan Government 0.6% 12/20/2033 | JPY | 301,400,000 | 1,849,986 |
| Japan Government 0.6% 12/20/2037 | JPY | 6,700,000 | 38,625 |
| Japan Government 0.6% 6/20/2037 | JPY | 204,850,000 | 1,191,696 |
| Japan Government 0.6% 6/20/2050 | JPY | 27,350,000 | 122,463 |
| Japan Government 0.7% 12/20/2048 | JPY | 10,800,000 | 51,208 |
| Japan Government 0.7% 3/20/2037 | JPY | 22,050,000 | 130,403 |
| Japan Government 0.7% 6/20/2048 | JPY | 13,100,000 | 62,654 |
| Japan Government 0.7% 9/20/2038 | JPY | 1,033,250,000 | 5,956,595 |
| Japan Government 0.8% 3/20/2034 | JPY | 190,550,000 | 1,187,055 |
| Japan Government 0.8% 3/20/2042 | JPY | 149,000,000 | 817,523 |
| Japan Government 0.8% 9/20/2033 | JPY | 83,150,000 | 520,799 |
| Japan Government 0.8% 9/20/2047 | JPY | 10,200,000 | 50,630 |
| Japan Government 0.9% 3/20/2057 | JPY | 184,150,000 | 803,322 |
| Japan Government 0.9% 6/20/2042 | JPY | 345,000,000 | 1,917,283 |
| Japan Government 0.9% 9/20/2034 | JPY | 598,400,000 | 3,738,493 |
| Japan Government 0.9% 9/20/2048 | JPY | 249,150,000 | 1,245,837 |
| Japan Government 1% 12/20/2035 | JPY | 647,550,000 | 4,031,194 |
| Japan Government 1% 3/20/2052 | JPY | 170,000,000 | 819,483 |
| Japan Government 1.1% 3/20/2043 | JPY | 45,600,000 | 259,049 |
| Japan Government 1.1% 6/20/2034 | JPY | 27,100,000 | 172,853 |
| Japan Government 1.1% 6/20/2043 | JPY | 110,150,000 | 623,279 |
| Japan Government 1.1% 9/20/2042 | JPY | 219,650,000 | 1,257,189 |
| Japan Government 1.2% 3/20/2035 | JPY | 19,650,000 | 125,724 |
| Japan Government 1.2% 6/20/2053 | JPY | 98,900,000 | 494,258 |
| Japan Government 1.3% 12/20/2043 | JPY | 398,750,000 | 2,320,426 |
| Japan Government 1.3% 3/20/2063 | JPY | 47,600,000 | 213,870 |
| Japan Government 1.3% 6/20/2052 | JPY | 232,000,000 | 1,203,873 |
| Japan Government 1.4% 12/20/2042 | JPY | 193,650,000 | 1,160,337 |
| Japan Government 1.4% 12/20/2045 | JPY | 307,650,000 | 1,774,201 |
| Japan Government 1.4% 3/20/2053 | JPY | 110,700,000 | 583,763 |
| Japan Government 1.4% 3/20/2055 | JPY | 5,500,000 | 28,442 |
| Japan Government 1.4% 9/20/2052 | JPY | 52,050,000 | 276,127 |
| Japan Government 1.5% 9/20/2043 | JPY | 51,950,000 | 313,638 |
| Japan Government 1.6% 12/20/2052 | JPY | 170,150,000 | 944,738 |
| Japan Government 1.6% 12/20/2053 | JPY | 171,100,000 | 941,564 |
| Japan Government 1.6% 3/20/2033 | JPY | 4,300,000 | 28,765 |
| Japan Government 1.6% 3/20/2044 | JPY | 163,650,000 | 999,020 |
| Japan Government 1.6% 6/20/2030 | JPY | 4,600,000 | 30,566 |
| Japan Government 1.8% 9/20/2044 | JPY | 438,650,000 | 2,751,916 |
| Japan Government 1.8% 9/20/2053 | JPY | 32,000,000 | 185,224 |
| Japan Government 1.9% 3/20/2053 | JPY | 42,450,000 | 251,945 |
| Japan Government 1.9% 6/20/2044 | JPY | 66,600,000 | 425,898 |
| Japan Government 2% 3/20/2042 | JPY | 110,000,000 | 727,645 |
| Japan Government 2.1% 9/20/2054 | JPY | 106,900,000 | 657,196 |
| Japan Government 2.2% 3/20/2064 | JPY | 362,550,000 | 2,114,677 |
| Japan Government 2.2% 6/20/2054 | JPY | 19,550,000 | 123,025 |
| Japan Government 2.3% 5/20/2032 | JPY | 1,000,000 | 7,001 |
TOTAL JAPAN | | | 90,507,269 |
| KOREA (SOUTH) - 2.1% | | | |
| Korean Republic 1.125% 9/10/2039 | KRW | 321,370,000 | 171,885 |
| Korean Republic 1.25% 3/10/2026 | KRW | 2,172,900,000 | 1,445,552 |
| Korean Republic 1.375% 12/10/2029 | KRW | 41,420,000 | 26,074 |
| Korean Republic 1.375% 6/10/2030 | KRW | 902,510,000 | 563,289 |
| Korean Republic 1.5% 12/10/2026 | KRW | 32,000,000 | 21,167 |
| Korean Republic 1.5% 12/10/2030 | KRW | 1,681,130,000 | 1,047,757 |
| Korean Republic 1.5% 9/10/2040 | KRW | 2,069,710,000 | 1,158,174 |
| Korean Republic 1.875% 3/10/2051 | KRW | 2,378,220,000 | 1,331,462 |
| Korean Republic 2% 3/10/2049 | KRW | 381,850,000 | 220,902 |
| Korean Republic 2% 6/10/2031 | KRW | 2,503,570,000 | 1,599,207 |
| Korean Republic 2.125% 3/10/2047 | KRW | 29,200,000 | 17,401 |
| Korean Republic 2.125% 6/10/2027 | KRW | 1,520,000,000 | 1,015,340 |
| Korean Republic 2.375% 12/10/2027 | KRW | 50,660,000 | 34,029 |
| Korean Republic 2.375% 12/10/2028 | KRW | 514,930,000 | 344,013 |
| Korean Republic 2.375% 12/10/2031 | KRW | 600,000,000 | 390,673 |
| Korean Republic 2.375% 9/10/2038 | KRW | 415,730,000 | 265,216 |
| Korean Republic 2.5% 3/10/2052 | KRW | 1,402,900,000 | 895,351 |
| Korean Republic 2.625% 3/10/2048 | KRW | 622,670,000 | 405,773 |
| Korean Republic 2.625% 6/10/2028 | KRW | 940,310,000 | 635,315 |
| Korean Republic 2.75% 9/10/2054 | KRW | 1,269,760,000 | 849,468 |
| Korean Republic 3.25% 3/10/2026 | KRW | 617,000,000 | 420,113 |
| Korean Republic 3.25% 3/10/2028 | KRW | 1,690,020,000 | 1,164,428 |
| Korean Republic 3.25% 3/10/2053 | KRW | 1,849,990,000 | 1,372,524 |
| Korean Republic 3.25% 3/10/2054 | KRW | 250,000,000 | 184,573 |
| Korean Republic 3.25% 6/10/2027 | KRW | 1,157,040,000 | 793,505 |
| Korean Republic 3.25% 6/10/2033 | KRW | 800,600,000 | 549,487 |
| Korean Republic 3.25% 9/10/2042 | KRW | 1,205,650,000 | 863,971 |
| Korean Republic 3.375% 6/10/2032 | KRW | 838,210,000 | 581,166 |
| Korean Republic 3.625% 9/10/2053 | KRW | 490,000,000 | 386,546 |
| Korean Republic 3.875% 9/10/2043 | KRW | 589,180,000 | 457,053 |
TOTAL KOREA (SOUTH) | | | 19,211,414 |
| LATVIA - 0.1% | | | |
| Latvia Government International Bond 1.125% 5/30/2028 (b) | EUR | 330,000 | 324,650 |
| Latvia Government International Bond 1.375% 5/16/2036 (b) | EUR | 490,000 | 421,701 |
| Latvia Government International Bond 1.375% 9/23/2025 (b) | EUR | 100,000 | 102,130 |
TOTAL LATVIA | | | 848,481 |
| LITHUANIA - 0.0% | | | |
| Lithuania Government 0.5% 6/19/2029 (b) | EUR | 32,000 | 29,818 |
| Lithuania Government 2.1% 5/26/2047 (b) | EUR | 110,000 | 85,173 |
| Lithuania Government 2.125% 10/22/2035 (b) | EUR | 57,000 | 52,419 |
| Lithuania Government 3.875% 6/14/2033 (b) | EUR | 90,000 | 98,280 |
TOTAL LITHUANIA | | | 265,690 |
| LUXEMBOURG - 0.0% | | | |
| Luxembourg Government 0% 11/13/2026 (b) | EUR | 230,000 | 228,538 |
| Luxembourg Government 0% 4/28/2025 (b) | EUR | 35,000 | 35,940 |
| State of the Grand-Duchy of Luxembourg 0% 9/14/2032 (b) | EUR | 210,000 | 177,750 |
TOTAL LUXEMBOURG | | | 442,228 |
| MALAYSIA - 0.8% | | | |
| Malaysia Government 3.519% 4/20/2028 | MYR | 4,960,000 | 1,107,417 |
| Malaysia Government 3.582% 7/15/2032 | MYR | 2,240,000 | 493,186 |
| Malaysia Government 3.757% 5/22/2040 | MYR | 2,310,000 | 499,846 |
| Malaysia Government 3.828% 7/5/2034 | MYR | 3,760,000 | 840,419 |
| Malaysia Government 3.885% 8/15/2029 | MYR | 1,820,000 | 411,406 |
| Malaysia Government 3.899% 11/16/2027 | MYR | 3,032,000 | 685,158 |
| Malaysia Government 3.9% 11/30/2026 | MYR | 2,999,000 | 676,480 |
| Malaysia Government 3.906% 7/15/2026 | MYR | 171,000 | 38,531 |
| Malaysia Government 4.065% 6/15/2050 | MYR | 2,823,000 | 620,372 |
| Malaysia Government 4.119% 11/30/2034 | MYR | 831,000 | 189,782 |
| Malaysia Government 4.128% 8/15/2025 | MYR | 405,000 | 91,053 |
| Malaysia Government 4.457% 3/31/2053 | MYR | 820,000 | 191,038 |
| Malaysia Government 4.504% 4/30/2029 | MYR | 560,000 | 129,626 |
| Malaysia Government 4.642% 11/7/2033 | MYR | 2,170,000 | 513,962 |
| Malaysia Government 4.696% 10/15/2042 | MYR | 2,150,000 | 516,986 |
| Malaysia Government 4.724% 6/15/2033 | MYR | 2,083,000 | 494,754 |
| Malaysia Government 4.736% 3/15/2046 | MYR | 90,000 | 21,888 |
| Malaysia Government 4.921% 7/6/2048 | MYR | 50,000 | 12,502 |
| Malaysia Government 4.935% 9/30/2043 | MYR | 150,000 | 37,207 |
TOTAL MALAYSIA | | | 7,571,613 |
| MEXICO - 0.7% | | | |
| United Mexican States 1.125% 1/17/2030 | EUR | 100,000 | 90,896 |
| United Mexican States 2.125% 10/25/2051 | EUR | 100,000 | 59,431 |
| United Mexican States 2.25% 8/12/2036 | EUR | 130,000 | 104,821 |
| United Mexican States 2.875% 4/8/2039 | EUR | 185,000 | 152,168 |
| United Mexican States 5.5% 3/4/2027 | MXN | 45,500,000 | 2,002,046 |
| United Mexican States 5.75% 3/5/2026 | MXN | 26,769,000 | 1,226,828 |
| United Mexican States 7.5% 5/26/2033 | MXN | 10,860,000 | 441,521 |
| United Mexican States 7.5% 6/3/2027 | MXN | 2,000,000 | 91,179 |
| United Mexican States 7.75% 11/13/2042 | MXN | 14,660,000 | 538,643 |
| United Mexican States 7.75% 11/23/2034 | MXN | 17,320,000 | 694,800 |
| United Mexican States 8% 11/7/2047 | MXN | 13,363,000 | 491,583 |
| United Mexican States 8.5% 5/31/2029 | MXN | 10,000,000 | 454,681 |
TOTAL MEXICO | | | 6,348,597 |
| MULTI-NATIONAL - 2.4% | | | |
| European Financial Stability Facility 0% 10/13/2027 (b) | EUR | 85,000 | 82,531 |
| European Financial Stability Facility 0.05% 1/18/2052 (b) | EUR | 225,000 | 104,743 |
| European Financial Stability Facility 0.05% 10/17/2029 (b) | EUR | 23,000 | 21,221 |
| European Financial Stability Facility 0.625% 10/16/2026 (b) | EUR | 466,000 | 468,990 |
| European Financial Stability Facility 0.7% 1/20/2050 (b) | EUR | 176,000 | 106,499 |
| European Financial Stability Facility 0.75% 5/3/2027 (b) | EUR | 43,000 | 43,016 |
| European Financial Stability Facility 0.875% 4/10/2035 (b) | EUR | 610,000 | 520,684 |
| European Financial Stability Facility 1.25% 5/24/2033 (b) | EUR | 1,849,000 | 1,705,348 |
| European Financial Stability Facility 1.45% 9/5/2040 (b) | EUR | 1,125,000 | 925,908 |
| European Financial Stability Facility 3.375% 8/30/2038 (b) | EUR | 50,000 | 53,529 |
| European Stability Mechanism Treasury Bill 0.01% 3/4/2030 (b) | EUR | 35,000 | 31,911 |
| European Stability Mechanism Treasury Bill 0.5% 3/5/2029 (b) | EUR | 2,229,000 | 2,133,817 |
| European Stability Mechanism Treasury Bill 0.75% 3/15/2027 (b) | EUR | 184,000 | 184,349 |
| European Stability Mechanism Treasury Bill 0.75% 9/5/2028 (b) | EUR | 48,000 | 46,895 |
| European Stability Mechanism Treasury Bill 0.875% 7/18/2042 (b) | EUR | 266,000 | 195,089 |
| European Stability Mechanism Treasury Bill 1.125% 5/3/2032 (b) | EUR | 47,000 | 43,928 |
| European Stability Mechanism Treasury Bill 1.2% 5/23/2033 (b) | EUR | 37,000 | 34,147 |
| European Stability Mechanism Treasury Bill 1.625% 11/17/2036 (b) | EUR | 218,000 | 197,870 |
| European Stability Mechanism Treasury Bill 1.85% 12/1/2055 (b) | EUR | 186,000 | 145,147 |
| European Union 0% 10/4/2030 (b) | EUR | 2,889,000 | 2,589,160 |
| European Union 0% 11/4/2025 (b) | EUR | 1,426,000 | 1,448,865 |
| European Union 0% 7/4/2035 (b) | EUR | 3,297,000 | 2,520,720 |
| European Union 0.1% 10/4/2040 (b) | EUR | 946,000 | 613,851 |
| European Union 0.25% 4/22/2036 (b) | EUR | 380,000 | 292,525 |
| European Union 0.3% 11/4/2050 (b) | EUR | 562,000 | 290,385 |
| European Union 0.45% 5/2/2046 (b) | EUR | 170,000 | 102,458 |
| European Union 0.45% 7/4/2041 (b) | EUR | 162,000 | 109,283 |
| European Union 0.7% 7/6/2051 (b) | EUR | 1,070,000 | 619,796 |
| European Union 0.8% 7/4/2025 (b) | EUR | 1,760,000 | 1,807,957 |
| European Union 0.875% 3/11/2037 (b) | EUR | 100,000 | 81,342 |
| European Union 1.125% 4/4/2036 (b) | EUR | 94,000 | 81,084 |
| European Union 1.25% 2/4/2043 (b) | EUR | 172,000 | 129,561 |
| European Union 1.25% 4/4/2033 (b) | EUR | 1,418,000 | 1,318,890 |
| European Union 2% 10/4/2027 (b) | EUR | 860,000 | 884,345 |
| European Union 2.5% 10/4/2052 (b) | EUR | 380,000 | 333,435 |
| European Union 3% 3/4/2053 (b) | EUR | 1,120,000 | 1,083,351 |
| European Union 3.375% 10/5/2054 (b) | EUR | 490,000 | 503,371 |
TOTAL MULTI-NATIONAL | | | 21,856,001 |
| NETHERLANDS - 1.1% | | | |
| Dutch Government 0% 1/15/2027 (b)(c) | EUR | 1,052,000 | 1,044,951 |
| Dutch Government 0% 1/15/2052 (b)(c) | EUR | 285,000 | 146,027 |
| Dutch Government 0% 7/15/2030 (b)(c) | EUR | 408,000 | 372,210 |
| Dutch Government 0.25% 7/15/2025 (b)(c) | EUR | 91,000 | 93,149 |
| Dutch Government 0.25% 7/15/2029 (b)(c) | EUR | 1,336,000 | 1,265,145 |
| Dutch Government 0.5% 1/15/2040 (b)(c) | EUR | 1,722,000 | 1,301,305 |
| Dutch Government 0.5% 7/15/2026 (b)(c) | EUR | 714,000 | 721,980 |
| Dutch Government 0.5% 7/15/2032 (b)(c) | EUR | 1,061,000 | 952,238 |
| Dutch Government 0.75% 7/15/2027 (b)(c) | EUR | 866,000 | 866,922 |
| Dutch Government 0.75% 7/15/2028 (b)(c) | EUR | 740,000 | 729,383 |
| Dutch Government 2% 1/15/2054 (b)(c) | EUR | 530,000 | 471,921 |
| Dutch Government 2.5% 1/15/2033 (b)(c) | EUR | 80,000 | 82,979 |
| Dutch Government 2.5% 7/15/2033 (b)(c) | EUR | 540,000 | 558,140 |
| Dutch Government 2.5% 7/15/2034 (b)(c) | EUR | 190,000 | 195,284 |
| Dutch Government 3.25% 1/15/2044 (b)(c) | EUR | 500,000 | 556,058 |
| Dutch Government 3.75% 1/15/2042 (b)(c) | EUR | 530,000 | 623,073 |
| Dutch Government 4% 1/15/2037 (b)(c) | EUR | 30,000 | 35,277 |
TOTAL NETHERLANDS | | | 10,016,042 |
| NEW ZEALAND - 0.3% | | | |
| New Zealand Government 0.5% 5/15/2026 | NZD | 1,590,000 | 852,766 |
| New Zealand Government 1.5% 5/15/2031 | NZD | 2,032,000 | 973,532 |
| New Zealand Government 1.75% 5/15/2041 | NZD | 82,000 | 29,690 |
| New Zealand Government 2.75% 4/15/2037 (b) | NZD | 410,000 | 188,069 |
| New Zealand Government 4.25% 5/15/2034 | NZD | 1,430,000 | 789,428 |
| New Zealand Government 5% 5/15/2054 | NZD | 170,000 | 93,403 |
| New Zealand Local Government Funding Agency Bond 5.1% 11/28/2030 | AUD | 50,000 | 31,562 |
TOTAL NEW ZEALAND | | | 2,958,450 |
| NORWAY - 0.2% | | | |
| Kingdom of Norway 1.5% 2/19/2026 (b)(c) | NOK | 10,000 | 854 |
| Kingdom of Norway 1.75% 2/17/2027 (b)(c) | NOK | 16,010,000 | 1,346,492 |
| Kingdom of Norway 3% 8/15/2033 (b)(c) | NOK | 2,060,000 | 169,753 |
| Kingdom of Norway 3.5% 10/6/2042 (b)(c) | NOK | 2,430,000 | 202,689 |
TOTAL NORWAY | | | 1,719,788 |
| PERU - 0.1% | | | |
| Peruvian Republic 5.4% 8/12/2034 | PEN | 550,000 | 133,520 |
| Peruvian Republic 6.15% 8/12/2032 | PEN | 2,364,000 | 623,815 |
| Peruvian Republic 6.7142% 2/12/2055 | PEN | 500,000 | 130,335 |
| Peruvian Republic 9.331% 8/12/2039 (b)(c)(e) | PEN | 964,000 | 269,194 |
TOTAL PERU | | | 1,156,864 |
| POLAND - 0.6% | | | |
| Bank Gospodarstwa Krajowego 4% 3/13/2032 (b) | EUR | 330,000 | 349,966 |
| Republic of Poland 0% 2/10/2025 (b) | EUR | 41,000 | 42,316 |
| Republic of Poland 1% 3/7/2029 (b) | EUR | 309,000 | 300,172 |
| Republic of Poland 1.25% 10/25/2030 | PLN | 396,000 | 75,549 |
| Republic of Poland 1.75% 4/25/2032 | PLN | 5,520,000 | 1,022,023 |
| Republic of Poland 2% 3/8/2049 (b) | EUR | 17,000 | 12,736 |
| Republic of Poland 2.5% 7/25/2026 | PLN | 6,990,000 | 1,626,886 |
| Republic of Poland 2.5% 7/25/2027 | PLN | 3,047,000 | 690,210 |
| Republic of Poland 2.75% 10/25/2029 | PLN | 2,390,000 | 512,225 |
| Republic of Poland 3.875% 2/14/2033 (b) | EUR | 220,000 | 237,103 |
| Republic of Poland 4% 4/25/2047 | PLN | 96,000 | 17,408 |
| Republic of Poland 4.125% 1/11/2044 (b) | EUR | 50,000 | 53,022 |
| Republic of Poland 5% 10/25/2034 | PLN | 470,000 | 106,330 |
| Republic of Poland 5.75% 4/25/2029 | PLN | 1,320,000 | 321,143 |
TOTAL POLAND | | | 5,367,089 |
| PORTUGAL - 0.5% | | | |
| Portugal Obrigacoes do Tesouro OT 0.475% 10/18/2030 (b)(c) | EUR | 258,000 | 240,302 |
| Portugal Obrigacoes do Tesouro OT 0.7% 10/15/2027 (b)(c) | EUR | 350,000 | 348,878 |
| Portugal Obrigacoes do Tesouro OT 0.9% 10/12/2035 (b)(c) | EUR | 734,000 | 619,115 |
| Portugal Obrigacoes do Tesouro OT 1% 4/12/2052 (b)(c) | EUR | 220,000 | 132,970 |
| Portugal Obrigacoes do Tesouro OT 1.65% 7/16/2032 (b)(c) | EUR | 3,000 | 2,912 |
| Portugal Obrigacoes do Tesouro OT 1.95% 6/15/2029 (b)(c) | EUR | 458,000 | 468,464 |
| Portugal Obrigacoes do Tesouro OT 2.25% 4/18/2034 (b)(c) | EUR | 260,000 | 257,887 |
| Portugal Obrigacoes do Tesouro OT 2.875% 10/15/2025 (b)(c) | EUR | 22,000 | 22,864 |
| Portugal Obrigacoes do Tesouro OT 2.875% 10/20/2034 (b)(c) | EUR | 390,000 | 404,713 |
| Portugal Obrigacoes do Tesouro OT 2.875% 7/21/2026 (b)(c) | EUR | 33,000 | 34,574 |
| Portugal Obrigacoes do Tesouro OT 3.625% 6/12/2054 (b)(c) | EUR | 150,000 | 160,207 |
| Portugal Obrigacoes do Tesouro OT 3.875% 2/15/2030 (b)(c) | EUR | 760,000 | 846,561 |
| Portugal Obrigacoes do Tesouro OT 4.125% 4/14/2027 (b)(c) | EUR | 524,000 | 567,474 |
| Republic of Portugal 2.125% 10/17/2028 (b)(c) | EUR | 70,000 | 72,336 |
TOTAL PORTUGAL | | | 4,179,257 |
| ROMANIA - 0.3% | | | |
| Romanian Republic 1.375% 12/2/2029 (b) | EUR | 567,000 | 501,067 |
| Romanian Republic 2.125% 3/7/2028 (b) | EUR | 470,000 | 456,572 |
| Romanian Republic 2.5% 10/25/2027 | RON | 2,330,000 | 429,628 |
| Romanian Republic 2.875% 4/13/2042 (b) | EUR | 60,000 | 40,087 |
| Romanian Republic 2.875% 5/26/2028 (b) | EUR | 32,000 | 31,709 |
| Romanian Republic 3.375% 1/28/2050 (b) | EUR | 54,000 | 36,345 |
| Romanian Republic 3.5% 11/25/2025 | RON | 4,230,000 | 855,966 |
| Romanian Republic 4.75% 10/11/2034 | RON | 1,110,000 | 190,075 |
| Romanian Republic 4.85% 7/25/2029 | RON | 1,570,000 | 297,038 |
| Romanian Republic 7.2% 10/30/2033 | RON | 1,360,000 | 279,407 |
TOTAL ROMANIA | | | 3,117,894 |
| RUSSIA - 0.0% | | | |
| Ministry of Finance of the Russian Federation 7.6% (f)(g) | RUB | 4,237,000 | 0 |
| SAUDI ARABIA - 0.0% | | | |
| Kingdom of Saudi Arabia 2% 7/9/2039 (b) | EUR | 163,000 | 130,656 |
| SINGAPORE - 0.5% | | | |
| Republic of Singapore 1.625% 7/1/2031 | SGD | 520,000 | 353,074 |
| Republic of Singapore 1.875% 10/1/2051 | SGD | 330,000 | 199,240 |
| Republic of Singapore 2.125% 6/1/2026 | SGD | 271,000 | 196,517 |
| Republic of Singapore 2.25% 8/1/2036 | SGD | 768,000 | 528,369 |
| Republic of Singapore 2.375% 7/1/2039 | SGD | 325,000 | 222,337 |
| Republic of Singapore 2.625% 5/1/2028 | SGD | 1,016,000 | 741,357 |
| Republic of Singapore 2.625% 8/1/2032 | SGD | 310,000 | 223,051 |
| Republic of Singapore 2.75% 3/1/2046 | SGD | 20,000 | 14,436 |
| Republic of Singapore 2.75% 4/1/2042 | SGD | 260,000 | 188,264 |
| Republic of Singapore 2.875% 9/1/2027 | SGD | 690,000 | 507,252 |
| Republic of Singapore 3% 8/1/2072 (b) | SGD | 200,000 | 153,485 |
| Republic of Singapore Treasury Bills 3% 4/1/2029 | SGD | 1,280,000 | 947,854 |
TOTAL SINGAPORE | | | 4,275,236 |
| SLOVAKIA - 0.2% | | | |
| Slovakia Treasury Bill 0.125% 6/17/2027 (b) | EUR | 288,000 | 281,898 |
| Slovakia Treasury Bill 0.25% 5/14/2025 (b) | EUR | 84,000 | 86,202 |
| Slovakia Treasury Bill 0.75% 4/9/2030 (b) | EUR | 400,000 | 374,045 |
| Slovakia Treasury Bill 1% 10/13/2051 (b) | EUR | 160,000 | 85,818 |
| Slovakia Treasury Bill 1% 10/9/2030 (b) | EUR | 110,000 | 102,948 |
| Slovakia Treasury Bill 1.625% 1/21/2031 (b) | EUR | 348,000 | 335,863 |
| Slovakia Treasury Bill 1.875% 3/9/2037 (b) | EUR | 515,000 | 445,342 |
| Slovakia Treasury Bill 3.75% 3/6/2034 (b) | EUR | 180,000 | 191,930 |
TOTAL SLOVAKIA | | | 1,904,046 |
| SLOVENIA - 0.1% | | | |
| Republic of Slovenia 0.125% 7/1/2031 (b) | EUR | 288,000 | 253,774 |
| Republic of Slovenia 1.1875% 3/14/2029 (b) | EUR | 110,000 | 109,051 |
| Republic of Slovenia 1.25% 3/22/2027 (b) | EUR | 84,000 | 85,365 |
| Republic of Slovenia 1.75% 11/3/2040 (b) | EUR | 89,000 | 75,150 |
| Republic of Slovenia 2.125% 7/28/2025 (b) | EUR | 64,000 | 66,133 |
| Republic of Slovenia 2.25% 3/3/2032 (b) | EUR | 230,000 | 230,092 |
| Republic of Slovenia 3.125% 8/7/2045 (b) | EUR | 230,000 | 227,316 |
| Republic of Slovenia 3.625% 3/11/2033 (b) | EUR | 110,000 | 120,215 |
TOTAL SLOVENIA | | | 1,167,096 |
| SPAIN - 3.3% | | | |
| Autonomous Community of Madrid Spain 0.827% 7/30/2027 (b) | EUR | 50,000 | 49,674 |
| Autonomous Community of Madrid Spain 1.571% 4/30/2029 (b) | EUR | 316,000 | 312,541 |
| Basque Government 1.45% 4/30/2028 (b) | EUR | 370,000 | 369,888 |
| Junta de Andalucia 0.5% 4/30/2031 (b) | EUR | 180,000 | 159,594 |
| Spanish Kingdom 0% 1/31/2027 | EUR | 880,000 | 869,863 |
| Spanish Kingdom 0% 1/31/2028 | EUR | 680,000 | 654,974 |
| Spanish Kingdom 0.1% 4/30/2031 (b)(c) | EUR | 1,410,000 | 1,242,197 |
| Spanish Kingdom 0.5% 10/31/2031 (b)(c) | EUR | 976,000 | 871,898 |
| Spanish Kingdom 0.5% 4/30/2030 (b)(c) | EUR | 143,000 | 132,916 |
| Spanish Kingdom 0.6% 10/31/2029 (b)(c) | EUR | 574,000 | 542,706 |
| Spanish Kingdom 0.7% 4/30/2032 (b)(c) | EUR | 140,000 | 124,986 |
| Spanish Kingdom 0.8% 7/30/2027 (b)(c) | EUR | 1,203,000 | 1,198,453 |
| Spanish Kingdom 0.85% 7/30/2037 (b)(c) | EUR | 1,098,000 | 856,048 |
| Spanish Kingdom 1% 10/31/2050 (b)(c) | EUR | 1,856,000 | 1,097,408 |
| Spanish Kingdom 1% 7/30/2042 (b)(c) | EUR | 171,000 | 120,334 |
| Spanish Kingdom 1.2% 10/31/2040 (b)(c) | EUR | 2,179,000 | 1,644,033 |
| Spanish Kingdom 1.25% 10/31/2030 (b)(c) | EUR | 1,376,000 | 1,318,134 |
| Spanish Kingdom 1.3% 10/31/2026 (b)(c) | EUR | 150,000 | 152,931 |
| Spanish Kingdom 1.4% 4/30/2028 (b)(c) | EUR | 100,000 | 100,334 |
| Spanish Kingdom 1.45% 10/31/2027 (b)(c) | EUR | 100,000 | 101,069 |
| Spanish Kingdom 1.45% 10/31/2071 (b)(c) | EUR | 330,000 | 174,038 |
| Spanish Kingdom 1.45% 4/30/2029 (b)(c) | EUR | 2,226,000 | 2,209,420 |
| Spanish Kingdom 1.5% 4/30/2027 (b)(c) | EUR | 157,000 | 159,870 |
| Spanish Kingdom 1.85% 7/30/2035 (b)(c) | EUR | 480,000 | 441,516 |
| Spanish Kingdom 1.9% 10/31/2052 (b)(c) | EUR | 960,000 | 695,825 |
| Spanish Kingdom 1.95% 4/30/2026 (b)(c) | EUR | 2,222,000 | 2,295,030 |
| Spanish Kingdom 1.95% 7/30/2030 (b)(c) | EUR | 26,000 | 26,033 |
| Spanish Kingdom 2.15% 10/31/2025 (b)(c) | EUR | 44,000 | 45,497 |
| Spanish Kingdom 2.35% 7/30/2033 (b)(c) | EUR | 292,000 | 289,402 |
| Spanish Kingdom 2.55% 10/31/2032 (b)(c) | EUR | 2,490,000 | 2,524,838 |
| Spanish Kingdom 2.7% 10/31/2048 (b)(c) | EUR | 189,000 | 168,714 |
| Spanish Kingdom 2.8% 5/31/2026 | EUR | 530,000 | 553,036 |
| Spanish Kingdom 3.1% 7/30/2031 | EUR | 590,000 | 624,270 |
| Spanish Kingdom 3.15% 4/30/2033 (b)(c) | EUR | 510,000 | 537,441 |
| Spanish Kingdom 3.25% 4/30/2034 (b)(c) | EUR | 1,110,000 | 1,170,703 |
| Spanish Kingdom 3.45% 10/31/2034 (b)(c) | EUR | 1,040,000 | 1,111,876 |
| Spanish Kingdom 3.45% 7/30/2043 (b)(c) | EUR | 1,760,000 | 1,798,346 |
| Spanish Kingdom 3.5% 5/31/2029 | EUR | 2,220,000 | 2,393,314 |
| Spanish Kingdom 3.55% 10/31/2033 (b)(c) | EUR | 290,000 | 313,624 |
| Spanish Kingdom 5.15% 10/31/2028 (b)(c) | EUR | 980,000 | 1,114,185 |
TOTAL SPAIN | | | 30,566,959 |
| SWEDEN - 0.2% | | | |
| Sweden Kingdom 0.125% 5/12/2031 (b) | SEK | 3,600,000 | 284,770 |
| Sweden Kingdom 0.5% 11/24/2045 (b) | SEK | 1,660,000 | 98,860 |
| Sweden Kingdom 0.75% 5/12/2028 (b) | SEK | 16,670,000 | 1,440,700 |
| Sweden Kingdom 1.375% 6/23/2071 (b) | SEK | 580,000 | 32,435 |
| Sweden Kingdom 1.75% 11/11/2033 (b) | SEK | 2,500,000 | 215,090 |
| Sweden Kingdom 3.5% 3/30/2039 (b) | SEK | 760,000 | 76,235 |
TOTAL SWEDEN | | | 2,148,090 |
| SWITZERLAND - 0.5% | | | |
| Swiss Confederation 0% 6/22/2029 (b) | CHF | 662,000 | 727,197 |
| Swiss Confederation 0% 6/26/2034 (b) | CHF | 974,000 | 1,047,106 |
| Swiss Confederation 0% 7/24/2039 (b) | CHF | 273,000 | 283,904 |
| Swiss Confederation 0.5% 5/24/2055 (b) | CHF | 180,000 | 206,548 |
| Swiss Confederation 1.25% 6/28/2043 (b) | CHF | 480,000 | 609,928 |
| Swiss Confederation 1.5% 4/30/2042 (b) | CHF | 200,000 | 261,204 |
| Swiss Confederation 2% 6/25/2064 (b) | CHF | 70,000 | 127,718 |
| Swiss Confederation 3.5% 4/8/2033 (b) | CHF | 625,000 | 872,836 |
TOTAL SWITZERLAND | | | 4,136,441 |
| THAILAND - 0.7% | | | |
| Kingdom of Thailand 1.6% 12/17/2029 | THB | 12,408,000 | 352,274 |
| Kingdom of Thailand 1.6% 6/17/2035 | THB | 14,678,000 | 398,510 |
| Kingdom of Thailand 2% 6/17/2042 | THB | 7,800,000 | 206,682 |
| Kingdom of Thailand 2.125% 12/17/2026 | THB | 69,582,000 | 2,027,170 |
| Kingdom of Thailand 2.5% 11/17/2029 | THB | 9,790,000 | 289,779 |
| Kingdom of Thailand 2.5% 6/17/2071 | THB | 12,170,000 | 306,527 |
| Kingdom of Thailand 2.75% 6/17/2052 | THB | 21,057,000 | 607,087 |
| Kingdom of Thailand 2.8% 6/17/2034 | THB | 15,150,000 | 460,214 |
| Kingdom of Thailand 2.875% 6/17/2046 | THB | 9,832,000 | 293,256 |
| Kingdom of Thailand 3.3% 6/17/2038 | THB | 13,193,000 | 419,363 |
| Kingdom of Thailand 3.4% 6/17/2036 | THB | 3,260,000 | 105,306 |
| Kingdom of Thailand 3.45% 6/17/2043 | THB | 9,230,000 | 299,871 |
| Kingdom of Thailand 3.65% 6/20/2031 | THB | 6,884,000 | 218,079 |
| Kingdom of Thailand 3.775% 6/25/2032 | THB | 13,170,000 | 424,117 |
| Kingdom of Thailand 3.85% 12/12/2025 | THB | 1,091,000 | 32,255 |
| Kingdom of Thailand 4.85% 6/17/2061 | THB | 1,660,000 | 67,812 |
TOTAL THAILAND | | | 6,508,302 |
| UNITED KINGDOM - 3.1% | | | |
| United Kingdom of Great Britain and Northern Ireland 0.25% 7/31/2031 (b) | GBP | 2,137,000 | 2,063,261 |
| United Kingdom of Great Britain and Northern Ireland 0.375% 10/22/2030 (b) | GBP | 497,000 | 500,374 |
| United Kingdom of Great Britain and Northern Ireland 0.5% 1/31/2029 (b) | GBP | 1,230,000 | 1,327,851 |
| United Kingdom of Great Britain and Northern Ireland 0.625% 10/22/2050 (b) | GBP | 1,885,000 | 879,356 |
| United Kingdom of Great Britain and Northern Ireland 0.625% 7/31/2035 (b) | GBP | 2,162,000 | 1,813,170 |
| United Kingdom of Great Britain and Northern Ireland 0.875% 1/31/2046 (b) | GBP | 665,000 | 385,648 |
| United Kingdom of Great Britain and Northern Ireland 1.125% 10/22/2073 (b) | GBP | 3,630,000 | 1,509,326 |
| United Kingdom of Great Britain and Northern Ireland 1.25% 10/22/2041 (b) | GBP | 4,399,076 | 3,218,498 |
| United Kingdom of Great Britain and Northern Ireland 1.25% 7/22/2027 (b) | GBP | 42,000 | 48,878 |
| United Kingdom of Great Britain and Northern Ireland 1.25% 7/31/2051 (b) | GBP | 2,070,000 | 1,158,682 |
| United Kingdom of Great Britain and Northern Ireland 1.5% 7/22/2047 (b) | GBP | 195,000 | 128,312 |
| United Kingdom of Great Britain and Northern Ireland 1.625% 10/22/2054 (b) | GBP | 409,000 | 243,637 |
| United Kingdom of Great Britain and Northern Ireland 1.75% 1/22/2049 (b) | GBP | 742,000 | 504,086 |
| United Kingdom of Great Britain and Northern Ireland 1.75% 7/22/2057 (b) | GBP | 1,294,000 | 779,197 |
| United Kingdom of Great Britain and Northern Ireland 1.75% 9/7/2037 (b) | GBP | 7,000 | 6,291 |
| United Kingdom of Great Britain and Northern Ireland 3.25% 1/22/2044 (b) | GBP | 450,000 | 438,830 |
| United Kingdom of Great Britain and Northern Ireland 3.25% 1/31/2033 (b) | GBP | 2,090,000 | 2,396,538 |
| United Kingdom of Great Britain and Northern Ireland 3.5% 1/22/2045 (b) | GBP | 1,450,000 | 1,457,613 |
| United Kingdom of Great Britain and Northern Ireland 3.75% 10/22/2053 (b) | GBP | 1,670,000 | 1,657,977 |
| United Kingdom of Great Britain and Northern Ireland 4% 10/22/2031 (b) | GBP | 500,000 | 610,071 |
| United Kingdom of Great Britain and Northern Ireland 4% 10/22/2063 (b) | GBP | 540,000 | 555,224 |
| United Kingdom of Great Britain and Northern Ireland 4.125% 7/22/2029 (b) | GBP | 1,630,000 | 2,021,030 |
| United Kingdom of Great Britain and Northern Ireland 4.25% 12/7/2040 (b) | GBP | 19,000 | 21,990 |
| United Kingdom of Great Britain and Northern Ireland 4.25% 12/7/2055 (b) | GBP | 30,000 | 32,619 |
| United Kingdom of Great Britain and Northern Ireland 4.25% 7/31/2034 (b) | GBP | 2,470,000 | 3,015,500 |
| United Kingdom of Great Britain and Northern Ireland 4.25% 9/7/2039 (b) | GBP | 13,000 | 15,199 |
| United Kingdom of Great Britain and Northern Ireland 4.5% 12/7/2042 (b) | GBP | 920,000 | 1,083,431 |
| United Kingdom of Great Britain and Northern Ireland 4.5% 6/7/2028 (b) | GBP | 40,000 | 50,327 |
| United Kingdom of Great Britain and Northern Ireland 4.625% 1/31/2034 (b) | GBP | 560,000 | 704,255 |
TOTAL UNITED KINGDOM | | | 28,627,171 |
| TOTAL FOREIGN GOVERNMENT AND GOVERNMENT AGENCY OBLIGATIONS (Cost $718,262,522) | | | 633,264,138 |
| | | | |
| Non-Convertible Corporate Bonds - 28.9% |
| | | Principal Amount (a) | Value ($) |
| AUSTRALIA - 0.5% | | | |
| Communication Services - 0.0% | | | |
| Diversified Telecommunication Services - 0.0% | | | |
| NBN Co Ltd 4.125% 3/15/2029 (b) | EUR | 100,000 | 108,522 |
| Telstra Group Ltd 4.9% 3/8/2028 | AUD | 220,000 | 136,947 |
| | | | 245,469 |
| Financials - 0.5% | | | |
| Banks - 0.3% | | | |
| Australia & New Zealand Banking Group Ltd 1.65% 1/16/2025 | AUD | 160,000 | 98,947 |
| Australia & New Zealand Banking Group Ltd 5.906% 8/12/2032 (h) | AUD | 420,000 | 265,317 |
| Commonwealth Bank of Australia 0.125% 10/15/2029 (b) | EUR | 120,000 | 110,022 |
| Commonwealth Bank of Australia 4.2% 8/18/2025 | AUD | 580,000 | 358,251 |
| Commonwealth Bank of Australia 6.86% 11/9/2032 (b)(h) | AUD | 230,000 | 149,089 |
| National Australia Bank Ltd 2.125% 5/24/2028 (b) | EUR | 160,000 | 162,078 |
| National Australia Bank Ltd 2.347% 8/30/2029 (b) | EUR | 130,000 | 132,257 |
| National Australia Bank Ltd 6.163% 3/9/2033 (b)(h) | AUD | 220,000 | 140,235 |
| Westpac Banking Corp 4.6% 2/16/2026 | AUD | 300,000 | 185,930 |
| Westpac Banking Corp 5.754% 4/3/2034 (b)(h) | AUD | 300,000 | 187,902 |
| | | | 1,790,028 |
| Capital Markets - 0.0% | | | |
| Macquarie Bank Ltd 1.125% 12/15/2025 (b) | GBP | 110,000 | 132,855 |
| Macquarie Group Ltd 0.943% 1/19/2029 (b) | EUR | 120,000 | 114,078 |
| | | | 246,933 |
| Financial Services - 0.2% | | | |
| Amcor UK Finance PLC 1.125% 6/23/2027 | EUR | 1,384,000 | 1,367,960 |
| Australian Capital Territory 5.25% 10/23/2036 (b) | AUD | 110,000 | 67,416 |
| | | | 1,435,376 |
TOTAL FINANCIALS | | | 3,472,337 |
| | | | |
| Industrials - 0.0% | | | |
| Transportation Infrastructure - 0.0% | | | |
| Sydney Airport Finance Co Pty Ltd 1.75% 4/26/2028 (b) | EUR | 100,000 | 99,901 |
| Transurban Finance Co Pty Ltd 3.713% 3/12/2032 (b) | EUR | 100,000 | 105,771 |
| | | | 205,672 |
| Materials - 0.0% | | | |
| Metals & Mining - 0.0% | | | |
| Glencore Capital Finance DAC 0.75% 3/1/2029 (b) | EUR | 100,000 | 94,023 |
| Utilities - 0.0% | | | |
| Electric Utilities - 0.0% | | | |
| AusNet Services Holdings Pty Ltd 1.625% 3/11/2081 (b)(h) | EUR | 100,000 | 99,916 |
| Gas Utilities - 0.0% | | | |
| APA Infrastructure Ltd 2% 7/15/2030 (b) | EUR | 110,000 | 106,043 |
TOTAL UTILITIES | | | 205,959 |
| | | | |
| TOTAL AUSTRALIA | | | 4,223,460 |
| AUSTRIA - 0.2% | | | |
| Energy - 0.0% | | | |
| Oil, Gas & Consumable Fuels - 0.0% | | | |
| OMV AG 2.375% 4/9/2032 (b) | EUR | 76,000 | 75,981 |
| Financials - 0.2% | | | |
| Banks - 0.2% | | | |
| BAWAG PSK Bank fuer Arbeit und Wirtschaft und Oesterreichische Postsparkasse AG 0.1% 5/12/2031 (b) | EUR | 300,000 | 261,705 |
| Erste Group Bank AG 0.01% 9/11/2029 (b) | EUR | 400,000 | 365,141 |
| Erste Group Bank AG 0.25% 9/14/2029 (b) | EUR | 100,000 | 91,590 |
| Erste Group Bank AG 1% 6/10/2030 (b)(h) | EUR | 100,000 | 102,309 |
| Oesterreichische Kontrollbank AG 0.5% 12/15/2025 (b) | GBP | 152,000 | 182,875 |
| Raiffeisen Bank International AG 1.5% 3/12/2030 (b)(h) | EUR | 100,000 | 103,060 |
| Raiffeisen Bank International AG 4.75% 1/26/2027 (b)(h) | EUR | 200,000 | 211,146 |
| Raiffeisenlandesbank Niederoesterreich-Wien AG 2.375% 8/31/2032 (b) | EUR | 100,000 | 99,626 |
| | | | 1,417,452 |
| Industrials - 0.0% | | | |
| Construction & Engineering - 0.0% | | | |
| Autobahnen- und Schnell- strassen-Finanzierungs AG 0.1% 7/16/2035 (b) | EUR | 710,000 | 552,208 |
| TOTAL AUSTRIA | | | 2,045,641 |
| BELGIUM - 0.3% | | | |
| Consumer Discretionary - 0.0% | | | |
| Hotels, Restaurants & Leisure - 0.0% | | | |
| Communaute Francaise de Belgique 1.625% 5/3/2032 (b) | EUR | 100,000 | 93,569 |
| Consumer Staples - 0.1% | | | |
| Beverages - 0.1% | | | |
| Anheuser-Busch InBev SA/NV 1.5% 4/18/2030 (b) | EUR | 49,000 | 47,709 |
| Anheuser-Busch InBev SA/NV 2% 3/17/2028 (b) | EUR | 23,000 | 23,441 |
| Anheuser-Busch InBev SA/NV 2.85% 5/25/2037 (b) | GBP | 200,000 | 200,034 |
| Anheuser-Busch InBev SA/NV 3.7% 4/2/2040 (b) | EUR | 231,000 | 240,519 |
| | | | 511,703 |
| Financials - 0.2% | | | |
| Banks - 0.2% | | | |
| Belfius Bank SA 0% 8/28/2026 (b) | EUR | 100,000 | 98,928 |
| Belfius Bank SA 5.25% 4/19/2033 (b)(h) | EUR | 100,000 | 108,184 |
| Dexia SA 0.625% 1/17/2026 (b) | EUR | 500,000 | 507,831 |
| Dexia SA 1% 10/18/2027 (b) | EUR | 100,000 | 99,509 |
| Dexia SA 1.25% 7/21/2025 (b) | GBP | 200,000 | 245,416 |
| KBC Group NV 0.125% 1/14/2029 (b)(h) | EUR | 200,000 | 190,580 |
| KBC Group NV 4.375% 4/19/2030 (b)(h) | EUR | 100,000 | 108,737 |
| | | | 1,359,185 |
| Utilities - 0.0% | | | |
| Electric Utilities - 0.0% | | | |
| Elia Transmission Belgium SA 0.875% 4/28/2030 (b) | EUR | 100,000 | 92,736 |
| FLUVIUS System Operator CV 0.25% 6/14/2028 (b) | EUR | 300,000 | 284,941 |
| | | | 377,677 |
| TOTAL BELGIUM | | | 2,342,134 |
| CANADA - 2.2% | | | |
| Communication Services - 0.1% | | | |
| Diversified Telecommunication Services - 0.0% | | | |
| Bell Canada 4.45% 2/27/2047 (b) | CAD | 40,000 | 24,990 |
| TELUS Corp 2.05% 10/7/2030 | CAD | 490,000 | 307,966 |
| TELUS Corp 3.95% 2/16/2050 | CAD | 33,000 | 18,895 |
| | | | 351,851 |
| Wireless Telecommunication Services - 0.1% | | | |
| Rogers Communications Inc 2.9% 12/9/2030 | CAD | 968,000 | 631,071 |
TOTAL COMMUNICATION SERVICES | | | 982,922 |
| | | | |
| Energy - 0.3% | | | |
| Oil, Gas & Consumable Fuels - 0.3% | | | |
| Enbridge Pipelines Inc 4.13% 8/9/2046 | CAD | 406,000 | 247,292 |
| Inter Pipeline Ltd/AB 4.232% 6/1/2027 | CAD | 1,526,000 | 1,070,223 |
| Keyera Corp 3.959% 5/29/2030 | CAD | 761,000 | 526,307 |
| North West Redwater Partnership / NWR Financing Co Ltd 4.35% 1/10/2039 | CAD | 591,000 | 402,687 |
| Pembina Pipeline Corp 4.74% 1/21/2047 | CAD | 402,000 | 262,717 |
| TransCanada PipeLines Ltd 3% 9/18/2029 (b) | CAD | 30,000 | 20,227 |
| TransCanada PipeLines Ltd 4.18% 7/3/2048 (b) | CAD | 33,000 | 20,137 |
| TransCanada PipeLines Ltd 4.35% 6/6/2046 | CAD | 456,000 | 287,251 |
| | | | 2,836,841 |
| Financials - 1.4% | | | |
| Banks - 1.0% | | | |
| Bank of Montreal 3.19% 3/1/2028 | CAD | 585,000 | 403,914 |
| Bank of Montreal 6.034% 9/7/2033 (h) | CAD | 60,000 | 44,581 |
| Bank of Nova Scotia/The 0.01% 1/14/2027 (b) | EUR | 500,000 | 492,601 |
| Bank of Nova Scotia/The 0.25% 11/1/2028 (b) | EUR | 140,000 | 130,866 |
| Bank of Nova Scotia/The 3.1% 2/2/2028 | CAD | 85,000 | 58,642 |
| Bank of Nova Scotia/The 3.934% 5/3/2032 (h) | CAD | 440,000 | 307,007 |
| Bank of Nova Scotia/The 5.5% 12/29/2025 | CAD | 840,000 | 596,044 |
| Bank of Nova Scotia/The 5.679% 8/2/2033 (h) | CAD | 160,000 | 117,591 |
| Canadian Imperial Bank of Commerce 0.01% 4/30/2029 (b) | EUR | 3,019,000 | 2,791,002 |
| Canadian Imperial Bank of Commerce 1.7% 7/15/2026 | CAD | 498,000 | 338,094 |
| Canadian Imperial Bank of Commerce 5.33% 1/20/2033 (h) | CAD | 150,000 | 108,562 |
| Federation des Caisses Desjardins du Quebec 5.279% 5/15/2034 (h) | CAD | 50,000 | 36,333 |
| Federation des Caisses Desjardins du Quebec 5.467% 11/17/2028 | CAD | 80,000 | 59,101 |
| National Bank of Canada 2.237% 11/4/2026 | CAD | 360,000 | 245,224 |
| Royal Bank of Canada 0.01% 1/27/2031 (b) | EUR | 120,000 | 105,095 |
| Royal Bank of Canada 0.625% 9/10/2025 (b) | EUR | 756,000 | 772,345 |
| Royal Bank of Canada 2.088% 6/30/2030 (h) | CAD | 710,000 | 490,680 |
| Royal Bank of Canada 2.125% 4/26/2029 (b) | EUR | 110,000 | 110,376 |
| Royal Bank of Canada 4.612% 7/26/2027 | CAD | 530,000 | 378,667 |
| Royal Bank of Canada 4.632% 5/1/2028 | CAD | 340,000 | 244,047 |
| Royal Bank of Canada 5.01% 2/1/2033 (h) | CAD | 80,000 | 57,492 |
| Toronto Dominion Bank 1.707% 7/28/2025 (b) | EUR | 360,000 | 370,880 |
| Toronto Dominion Bank 1.943% 3/13/2025 | CAD | 252,000 | 174,886 |
| Toronto Dominion Bank 3.631% 12/13/2029 (b) | EUR | 320,000 | 337,510 |
| Toronto Dominion Bank 4.68% 1/8/2029 | CAD | 350,000 | 251,921 |
| Toronto Dominion Bank 5.177% 4/9/2034 (b)(h) | CAD | 80,000 | 57,968 |
| | | | 9,081,429 |
| Capital Markets - 0.3% | | | |
| Brookfield Corp 3.8% 3/16/2027 | CAD | 260,000 | 182,133 |
| CPPIB Capital Inc 0.25% 4/6/2027 (b) | EUR | 300,000 | 295,856 |
| CPPIB Capital Inc 1.25% 12/7/2027 (b) | GBP | 544,000 | 619,783 |
| CPPIB Capital Inc 3% 6/15/2028 (b) | CAD | 1,310,000 | 908,949 |
| CPPIB Capital Inc 4.2% 5/2/2028 (b) | AUD | 90,000 | 55,473 |
| Ontario Teachers' Finance Trust 0.95% 11/24/2051 (b) | EUR | 110,000 | 64,905 |
| PSP Capital Inc 1.5% 3/15/2028 (b) | CAD | 340,000 | 225,186 |
| | | | 2,352,285 |
| Insurance - 0.1% | | | |
| Fairfax Financial Holdings Ltd 4.7% 12/16/2026 | CAD | 234,000 | 165,914 |
| Great-West Lifeco Inc 5.998% 11/16/2039 | CAD | 50,000 | 39,595 |
| Intact Financial Corp 4.653% 5/16/2034 (h) | CAD | 190,000 | 136,564 |
| Manulife Financial Corp 2.237% 5/12/2030 (h) | CAD | 460,000 | 318,683 |
| Sun Life Financial Inc 2.06% 10/1/2035 (h) | CAD | 110,000 | 68,931 |
| Sun Life Financial Inc 2.58% 5/10/2032 (b)(h) | CAD | 50,000 | 34,005 |
| Sun Life Financial Inc 2.8% 11/21/2033 (h) | CAD | 50,000 | 33,561 |
| | | | 797,253 |
TOTAL FINANCIALS | | | 12,230,967 |
| | | | |
| Industrials - 0.1% | | | |
| Electrical Equipment - 0.0% | | | |
| Brookfield Renewable Partners ULC 5.84% 11/5/2036 | CAD | 80,000 | 60,953 |
| Ground Transportation - 0.0% | | | |
| Canadian National Railway Co 3.6% 8/1/2047 | CAD | 229,000 | 137,389 |
| Transportation Infrastructure - 0.1% | | | |
| 407 International Inc 2.84% 3/7/2050 | CAD | 73,000 | 37,300 |
| 407 International Inc 3.65% 9/8/2044 (b) | CAD | 295,000 | 180,175 |
| Greater Toronto Airports Authority 2.75% 10/17/2039 | CAD | 516,000 | 295,306 |
| | | | 512,781 |
TOTAL INDUSTRIALS | | | 711,123 |
| | | | |
| Real Estate - 0.0% | | | |
| Office REITs - 0.0% | | | |
| Allied Properties Real Estate Investment Trust 3.113% 4/8/2027 | CAD | 110,000 | 74,206 |
| Retail REITs - 0.0% | | | |
| Choice Properties Real Estate Investment Trust 4.178% 3/8/2028 | CAD | 128,000 | 90,195 |
| Choice Properties Real Estate Investment Trust 5.03% 2/28/2031 | CAD | 60,000 | 43,480 |
| SmartCentres Real Estate Investment Trust 2.307% 12/18/2028 | CAD | 100,000 | 64,892 |
| | | | 198,567 |
TOTAL REAL ESTATE | | | 272,773 |
| | | | |
| Utilities - 0.3% | | | |
| Electric Utilities - 0.2% | | | |
| AltaLink LP 3.717% 12/3/2046 | CAD | 338,000 | 207,768 |
| Brookfield Infrastructure Finance ULC 5.98% 2/14/2033 | CAD | 90,000 | 68,833 |
| FortisAlberta Inc 2.632% 6/8/2051 | CAD | 50,000 | 24,302 |
| Hydro One Inc 1.69% 1/16/2031 | CAD | 417,000 | 260,493 |
| Hydro One Inc 3.02% 4/5/2029 | CAD | 30,000 | 20,499 |
| Hydro One Inc 4.46% 1/27/2053 | CAD | 110,000 | 75,403 |
| Hydro One Inc 5.36% 5/20/2036 | CAD | 50,000 | 37,922 |
| Hydro-Quebec 2.1% 2/15/2060 | CAD | 70,000 | 30,059 |
| Hydro-Quebec 4% 2/15/2055 | CAD | 220,000 | 146,587 |
| Hydro-Quebec 4% 2/15/2063 | CAD | 500,000 | 334,106 |
| Hydro-Quebec 5% 2/15/2050 | CAD | 370,000 | 286,798 |
| Nova Scotia Power Inc 5.67% 11/14/2035 | CAD | 90,000 | 66,699 |
| Ontario Power Generation Inc 2.893% 4/8/2025 | CAD | 390,000 | 270,945 |
| Ontario Power Generation Inc 3.215% 4/8/2030 | CAD | 100,000 | 67,821 |
| Ontario Power Generation Inc 4.248% 1/18/2049 | CAD | 50,000 | 32,712 |
| Toronto Hydro Corp 2.43% 12/11/2029 | CAD | 80,000 | 52,968 |
| | | | 1,983,915 |
| Gas Utilities - 0.0% | | | |
| Enbridge Gas Inc 3.65% 4/1/2050 | CAD | 290,000 | 172,271 |
| FortisBC Energy Inc 2.82% 8/9/2049 | CAD | 70,000 | 35,862 |
| | | | 208,133 |
| Multi-Utilities - 0.1% | | | |
| CU Inc 3.548% 11/22/2047 | CAD | 280,000 | 166,299 |
| EPCOR Utilities Inc 3.554% 11/27/2047 | CAD | 571,000 | 338,739 |
| | | | 505,038 |
TOTAL UTILITIES | | | 2,697,086 |
| | | | |
| TOTAL CANADA | | | 19,731,712 |
| CHINA - 7.0% | | | |
| Financials - 7.0% | | | |
| Banks - 5.1% | | | |
| China Development Bank 2.83% 9/10/2026 | CNY | 59,070,000 | 8,284,768 |
| China Development Bank 3% 1/17/2032 | CNY | 10,000,000 | 1,485,227 |
| China Development Bank 3.02% 3/6/2033 | CNY | 16,400,000 | 2,456,163 |
| China Development Bank 3.34% 7/14/2025 | CNY | 19,020,000 | 2,634,309 |
| China Development Bank 3.41% 6/7/2031 | CNY | 2,540,000 | 384,310 |
| China Development Bank 3.48% 1/8/2029 | CNY | 62,240,000 | 9,171,610 |
| China Development Bank 3.5% 11/4/2046 | CNY | 820,000 | 140,958 |
| China Development Bank 3.68% 2/26/2026 | CNY | 27,100,000 | 3,812,162 |
| China Development Bank 3.7% 10/20/2030 | CNY | 17,030,000 | 2,598,900 |
| China Development Bank 3.8% 1/25/2036 | CNY | 550,000 | 90,176 |
| China Development Bank 3.9% 8/3/2040 | CNY | 12,690,000 | 2,178,229 |
| Export-Import Bank of China/The 3.22% 5/14/2026 | CNY | 57,740,000 | 8,106,378 |
| Export-Import Bank of China/The 3.38% 7/16/2031 | CNY | 32,570,000 | 4,923,255 |
| | | | 46,266,445 |
| Financial Services - 1.9% | | | |
| Agricultural Development Bank of China 2.99% 8/11/2026 | CNY | 31,790,000 | 4,464,341 |
| Agricultural Development Bank of China 3.3% 11/5/2031 | CNY | 42,520,000 | 6,413,426 |
| Agricultural Development Bank of China 3.52% 5/24/2031 | CNY | 38,250,000 | 5,810,315 |
| | | | 16,688,082 |
TOTAL FINANCIALS | | | 62,954,527 |
| | | | |
| Utilities - 0.0% | | | |
| Electric Utilities - 0.0% | | | |
| State Grid Overseas Investment BVI Ltd 0.797% 8/5/2026 (b) | EUR | 160,000 | 160,684 |
| TOTAL CHINA | | | 63,115,211 |
| CZECH REPUBLIC - 0.0% | | | |
| Real Estate - 0.0% | | | |
| Real Estate Management & Development - 0.0% | | | |
| CPI Property Group SA 2.75% 5/12/2026 (b) | EUR | 153,000 | 155,683 |
| Utilities - 0.0% | | | |
| Electric Utilities - 0.0% | | | |
| CEZ AS 0.875% 12/2/2026 (b) | EUR | 210,000 | 208,062 |
| TOTAL CZECH REPUBLIC | | | 363,745 |
| DENMARK - 0.2% | | | |
| Financials - 0.1% | | | |
| Banks - 0.1% | | | |
| Danske Bank A/S 1.5% 9/2/2030 (b)(h) | EUR | 110,000 | 112,554 |
| Danske Bank A/S 4% 1/12/2027 (b)(h) | EUR | 210,000 | 220,058 |
| Danske Bank A/S 4.5% 11/9/2028 (b)(h) | EUR | 110,000 | 118,723 |
| Danske Bank A/S 4.625% 4/13/2027 (b)(h) | GBP | 100,000 | 124,827 |
| Jyske Bank A/S 0.25% 2/17/2028 (b)(h) | EUR | 100,000 | 98,133 |
| Nykredit Realkredit AS 0.5% 7/10/2025 (b) | EUR | 144,000 | 147,372 |
| Nykredit Realkredit AS 0.75% 1/20/2027 | EUR | 130,000 | 128,949 |
| | | | 950,616 |
| Financial Services - 0.0% | | | |
| Kommunekredit 0% 11/17/2029 | EUR | 240,000 | 220,106 |
| Kommunekredit 0% 8/27/2030 (b) | EUR | 130,000 | 116,600 |
| Kommunekredit 0.125% 9/26/2040 (b) | EUR | 100,000 | 66,082 |
| | | | 402,788 |
TOTAL FINANCIALS | | | 1,353,404 |
| | | | |
| Industrials - 0.0% | | | |
| Transportation Infrastructure - 0.0% | | | |
| DSV Finance BV 3.375% 11/6/2032 (b) | EUR | 200,000 | 209,755 |
| Utilities - 0.1% | | | |
| Independent Power and Renewable Electricity Producers - 0.1% | | | |
| Orsted AS 2.125% 5/17/2027 (b) | GBP | 104,000 | 122,098 |
| Orsted AS 2.5% 5/16/2033 (b) | GBP | 104,000 | 103,915 |
| Orsted AS 5.125% 9/13/2034 (b) | GBP | 290,000 | 348,611 |
| | | | 574,624 |
| TOTAL DENMARK | | | 2,137,783 |
| FINLAND - 0.2% | | | |
| Financials - 0.2% | | | |
| Banks - 0.1% | | | |
| Nordea Bank Abp 0.5% 3/19/2031 (b) | EUR | 120,000 | 106,260 |
| Nordea Bank Abp 0.625% 8/18/2031 (b)(h) | EUR | 220,000 | 218,913 |
| Nordea Bank Abp 2.5% 5/23/2029 (b) | EUR | 244,000 | 247,993 |
| Nordea Kiinnitysluottopankki Oyj 2.5% 9/14/2032 (b) | EUR | 110,000 | 111,878 |
| OP Mortgage Bank 0.01% 11/19/2030 (b) | EUR | 180,000 | 159,487 |
| | | | 844,531 |
| Capital Markets - 0.0% | | | |
| Finnvera Oyj 2.875% 8/30/2029 (b) | EUR | 200,000 | 210,240 |
| Financial Services - 0.1% | | | |
| Kuntarahoitus Oyj 0.25% 2/25/2032 (b) | EUR | 140,000 | 122,028 |
| Kuntarahoitus Oyj 2.75% 2/2/2034 (b) | EUR | 110,000 | 112,990 |
| Kuntarahoitus Oyj 5.125% 7/22/2027 (b) | GBP | 120,000 | 152,094 |
| OP Corporate Bank plc 0.1% 11/16/2027 (b) | EUR | 130,000 | 124,710 |
| OP Corporate Bank plc 1.375% 9/4/2026 (b) | GBP | 160,000 | 188,716 |
| | | | 700,538 |
| TOTAL FINLAND | | | 1,755,309 |
| FRANCE - 3.4% | | | |
| Communication Services - 0.1% | | | |
| Diversified Telecommunication Services - 0.1% | | | |
| Ile-de-France Mobilites 0.4% 5/28/2031 (b) | EUR | 200,000 | 175,228 |
| Ile-de-France Mobilites 3.7% 6/14/2038 (b) | EUR | 100,000 | 103,937 |
| Orange SA 0.75% 6/29/2034 (b) | EUR | 500,000 | 414,090 |
| Orange SA 8.125% 1/28/2033 | EUR | 70,000 | 98,165 |
| | | | 791,420 |
| Consumer Discretionary - 0.0% | | | |
| Automobile Components - 0.0% | | | |
| Cie Generale des Etablissements Michelin SCA 0.25% 11/2/2032 (b) | EUR | 200,000 | 165,208 |
| Automobiles - 0.0% | | | |
| RCI Banque SA 1.625% 5/26/2026 (b) | EUR | 37,000 | 37,564 |
| RCI Banque SA 4.875% 10/2/2029 (b) | EUR | 150,000 | 163,627 |
| | | | 201,191 |
| Textiles, Apparel & Luxury Goods - 0.0% | | | |
| Kering SA 3.625% 3/11/2036 (b) | EUR | 100,000 | 101,900 |
TOTAL CONSUMER DISCRETIONARY | | | 468,299 |
| | | | |
| Consumer Staples - 0.0% | | | |
| Beverages - 0.0% | | | |
| Pernod Ricard SA 3.625% 5/7/2034 (b) | EUR | 100,000 | 104,262 |
| Food Products - 0.0% | | | |
| Danone SA 3.071% 9/7/2032 (b) | EUR | 200,000 | 205,962 |
TOTAL CONSUMER STAPLES | | | 310,224 |
| | | | |
| Energy - 0.0% | | | |
| Oil, Gas & Consumable Fuels - 0.0% | | | |
| TotalEnergies Capital International SA 1.491% 4/8/2027 (b) | EUR | 100,000 | 100,911 |
| Financials - 2.3% | | | |
| Banks - 1.5% | | | |
| Agence Francaise de Developpement EPIC 0.125% 9/29/2031 (b) | EUR | 200,000 | 169,577 |
| Arkea Public Sector SCF SA 0.875% 3/31/2028 (b) | EUR | 200,000 | 195,821 |
| Banque Federative du Credit Mutuel SA 0.625% 11/19/2027 (b) | EUR | 100,000 | 96,786 |
| Banque Federative du Credit Mutuel SA 0.75% 1/17/2030 (b) | EUR | 200,000 | 181,972 |
| Banque Federative du Credit Mutuel SA 0.875% 12/7/2027 (b) | GBP | 600,000 | 672,023 |
| Banque Federative du Credit Mutuel SA 1% 7/16/2026 (b) | GBP | 100,000 | 117,985 |
| Banque Federative du Credit Mutuel SA 1.125% 11/19/2031 (b) | EUR | 100,000 | 86,222 |
| Banque Federative du Credit Mutuel SA 1.25% 5/26/2027 (b) | EUR | 100,000 | 99,712 |
| Banque Federative du Credit Mutuel SA 1.25% 6/3/2030 (b) | EUR | 100,000 | 92,526 |
| Banque Federative du Credit Mutuel SA 2.5% 5/25/2028 (b) | EUR | 300,000 | 301,956 |
| Banque Federative du Credit Mutuel SA 2.625% 11/6/2029 (b) | EUR | 100,000 | 100,066 |
| Banque Federative du Credit Mutuel SA 3.875% 6/16/2032 (b)(h) | EUR | 200,000 | 207,462 |
| Banque Federative du Credit Mutuel SA 4.375% 5/2/2030 (b) | EUR | 100,000 | 108,133 |
| Banque Federative du Credit Mutuel SA 4.75% 11/10/2031 (b) | EUR | 200,000 | 220,791 |
| BNP Paribas SA 0.5% 1/19/2030 (b)(h) | EUR | 300,000 | 277,644 |
| BNP Paribas SA 0.5% 2/19/2028 (b)(h) | EUR | 100,000 | 97,958 |
| BNP Paribas SA 0.625% 12/3/2032 (b) | EUR | 100,000 | 83,009 |
| BNP Paribas SA 0.875% 7/11/2030 (b)(h) | EUR | 100,000 | 92,926 |
| BNP Paribas SA 1.25% 7/13/2031 (b) | GBP | 100,000 | 96,965 |
| BNP Paribas SA 1.625% 7/2/2031 (b) | EUR | 100,000 | 91,177 |
| BNP Paribas SA 1.875% 12/14/2027 (b) | GBP | 200,000 | 228,783 |
| BNP Paribas SA 2% 5/24/2031 (b)(h) | GBP | 200,000 | 238,011 |
| BNP Paribas SA 2% 9/13/2036 (b) | GBP | 100,000 | 86,205 |
| BNP Paribas SA 2.5% 3/31/2032 (b)(h) | EUR | 100,000 | 100,836 |
| BNP Paribas SA 2.538% 7/13/2029 (h) | CAD | 250,000 | 165,865 |
| BNP Paribas SA 3.375% 1/23/2026 (b) | GBP | 550,000 | 676,614 |
| BNP Paribas SA 4.75% 11/13/2032 (b)(h) | EUR | 100,000 | 110,455 |
| BPCE SA 0.25% 1/14/2031 (b) | EUR | 200,000 | 173,968 |
| BPCE SA 0.25% 1/15/2026 (b) | EUR | 100,000 | 100,818 |
| BPCE SA 0.5% 9/15/2027 (b)(h) | EUR | 600,000 | 594,919 |
| BPCE SA 0.75% 3/3/2031 (b) | EUR | 200,000 | 175,667 |
| BPCE SA 1% 1/14/2032 (b) | EUR | 200,000 | 174,342 |
| BPCE SA 1.375% 12/23/2026 (b) | GBP | 100,000 | 116,915 |
| BPCE SA 1.625% 1/31/2028 (b) | EUR | 100,000 | 98,804 |
| BPCE SA 2.25% 3/2/2032 (b)(h) | EUR | 100,000 | 100,464 |
| BPCE SA 2.5% 11/30/2032 (b)(h) | GBP | 100,000 | 113,905 |
| BPCE SA 5.75% 6/1/2033 (b)(h) | EUR | 100,000 | 109,897 |
| Carrefour Banque SA 4.079% 5/5/2027 (b) | EUR | 100,000 | 105,450 |
| Cie de Financement Foncier SA 0.01% 4/16/2029 (b) | EUR | 1,000,000 | 922,290 |
| Credit Agricole Home Loan SFH SA 0.05% 12/6/2029 (b) | EUR | 200,000 | 181,564 |
| Credit Agricole Home Loan SFH SA 1.5% 9/28/2038 (b) | EUR | 300,000 | 252,402 |
| Credit Agricole SA 0.375% 4/20/2028 (b) | EUR | 100,000 | 94,909 |
| Credit Agricole SA 0.5% 9/21/2029 (b)(h) | EUR | 100,000 | 93,991 |
| Credit Agricole SA 1% 9/18/2025 (b) | EUR | 200,000 | 204,780 |
| Credit Agricole SA 1.125% 7/12/2032 (b) | EUR | 300,000 | 262,253 |
| Credit Agricole SA 1.625% 6/5/2030 (b)(h) | EUR | 100,000 | 102,696 |
| Credit Agricole SA 1.874% 12/9/2031 (b)(h) | GBP | 200,000 | 232,791 |
| Credit Agricole SA 2.625% 3/17/2027 (b) | EUR | 107,000 | 109,898 |
| Credit Agricole SA 3.75% 1/23/2031 (b)(h) | EUR | 200,000 | 210,324 |
| Credit Agricole SA 3.875% 11/28/2034 (b) | EUR | 100,000 | 107,654 |
| Credit Agricole SA 4% 1/18/2033 (b) | EUR | 100,000 | 108,447 |
| Credit Agricole SA 4.875% 10/23/2029 (b) | GBP | 100,000 | 124,151 |
| Credit Mutuel Arkea SA 0.375% 10/3/2028 (b) | EUR | 300,000 | 282,722 |
| Credit Mutuel Arkea SA 0.875% 10/25/2031 (b) | EUR | 100,000 | 87,330 |
| HSBC Continental Europe SA 0.1% 9/3/2027 (b) | EUR | 200,000 | 193,643 |
| HSBC Continental Europe SA 1.375% 9/4/2028 (b) | EUR | 300,000 | 295,116 |
| La Banque Postale SA 0.75% 8/2/2032 (b)(h) | EUR | 100,000 | 96,569 |
| La Banque Postale SA 1% 2/9/2028 (b)(h) | EUR | 200,000 | 198,095 |
| La Banque Postale SA 5.625% 9/21/2028 (b)(h) | GBP | 100,000 | 125,425 |
| SFIL SA 0.25% 12/1/2031 (b) | EUR | 100,000 | 85,356 |
| SFIL SA 3.125% 9/17/2029 (b) | EUR | 100,000 | 104,665 |
| Societe Generale SA 0.875% 9/22/2028 (b)(h) | EUR | 200,000 | 194,794 |
| Societe Generale SA 0.875% 9/24/2029 (b) | EUR | 100,000 | 91,946 |
| Societe Generale SA 1% 11/24/2030 (h) | EUR | 200,000 | 202,053 |
| Societe Generale SA 1.125% 6/30/2031 (b)(h) | EUR | 200,000 | 199,808 |
| Societe Generale SA 1.25% 12/7/2027 (b) | GBP | 300,000 | 337,562 |
| Societe Generale SA 1.25% 6/12/2030 (b) | EUR | 200,000 | 183,381 |
| Societe Generale SA 4.25% 11/16/2032 (b) | EUR | 100,000 | 110,069 |
| Societe Generale SFH SA 3.125% 2/24/2026 (b) | EUR | 1,000,000 | 1,043,112 |
| | | | 13,702,425 |
| Capital Markets - 0.2% | | | |
| Bpifrance SACA 0.05% 9/26/2029 (b) | EUR | 600,000 | 546,273 |
| Bpifrance SACA 0.125% 3/25/2025 (b) | EUR | 200,000 | 205,895 |
| Bpifrance SACA 0.25% 3/29/2030 (b) | EUR | 100,000 | 90,599 |
| Bpifrance SACA 0.625% 5/25/2026 (b) | EUR | 200,000 | 202,057 |
| Bpifrance SACA 2.125% 11/29/2027 (b) | EUR | 200,000 | 204,783 |
| Bpifrance SACA 3% 9/10/2026 (b) | EUR | 500,000 | 522,716 |
| | | | 1,772,323 |
| Financial Services - 0.5% | | | |
| BPCE SFH SA 0.01% 10/16/2028 (b) | EUR | 500,000 | 468,562 |
| BPCE SFH SA 3.375% 6/27/2033 (b) | EUR | 400,000 | 425,398 |
| Caisse de Refinancement de l'Habitat SA 0.01% 10/8/2029 (b) | EUR | 600,000 | 546,898 |
| Caisse Francaise de Financement Local SA 0.125% 2/15/2036 (b) | EUR | 900,000 | 672,749 |
| Caisse Francaise de Financement Local SA 0.125% 6/30/2031 (b) | EUR | 1,200,000 | 1,039,728 |
| UNEDIC ASSEO 0% 11/25/2028 (b) | EUR | 200,000 | 187,063 |
| UNEDIC ASSEO 0.25% 11/25/2029 (b) | EUR | 600,000 | 551,201 |
| UNEDIC ASSEO 0.25% 7/16/2035 (b) | EUR | 400,000 | 305,415 |
| UNEDIC ASSEO 0.875% 5/25/2028 (b) | EUR | 400,000 | 391,465 |
| UNEDIC ASSEO 1.25% 10/21/2027 (b) | EUR | 100,000 | 100,110 |
| UNEDIC ASSEO 1.5% 4/20/2032 (b) | EUR | 100,000 | 93,458 |
| | | | 4,782,047 |
| Insurance - 0.1% | | | |
| AXA SA 1.875% 7/10/2042 (b)(h) | EUR | 253,000 | 228,432 |
| AXA SA 3.375% 7/6/2047 (b)(h) | EUR | 100,000 | 103,922 |
| CNP Assurances SACA 2.5% 6/30/2051 (b)(h) | EUR | 100,000 | 95,398 |
| Credit Agricole Assurances SA 1.5% 10/6/2031 (b) | EUR | 100,000 | 89,169 |
| Credit Agricole Assurances SA 2% 7/17/2030 (b) | EUR | 100,000 | 94,972 |
| La Mondiale SAM 0.75% 4/20/2026 (b) | EUR | 100,000 | 100,771 |
| Mutuelle Assurance Des Commercants et Industriels de France et Des Cadres et Sal 0.625% 6/21/2027 (b) | EUR | 200,000 | 194,810 |
| | | | 907,474 |
TOTAL FINANCIALS | | | 21,164,269 |
| | | | |
| Industrials - 0.5% | | | |
| Aerospace & Defense - 0.0% | | | |
| Airbus SE 2.375% 6/9/2040 (b) | EUR | 166,000 | 148,307 |
| Building Products - 0.0% | | | |
| Cie de Saint-Gobain SA 3.875% 11/29/2030 (b) | EUR | 200,000 | 214,911 |
| Construction & Engineering - 0.0% | | | |
| Bouygues SA 0.5% 2/11/2030 (b) | EUR | 100,000 | 91,498 |
| Bouygues SA 2.25% 6/29/2029 (b) | EUR | 100,000 | 101,077 |
| Bouygues SA 4.625% 6/7/2032 (b) | EUR | 100,000 | 111,954 |
| | | | 304,529 |
| Electrical Equipment - 0.0% | | | |
| Legrand SA 0.375% 10/6/2031 (b) | EUR | 200,000 | 174,064 |
| Ground Transportation - 0.4% | | | |
| Ayvens SA 4% 7/5/2027 (b) | EUR | 200,000 | 212,152 |
| SNCF Reseau 0.875% 1/22/2029 (b) | EUR | 300,000 | 287,217 |
| SNCF Reseau 1.125% 5/19/2027 (b) | EUR | 1,100,000 | 1,100,980 |
| Societe Nationale SNCF SACA 0.625% 4/17/2030 (b) | EUR | 400,000 | 366,784 |
| Societe Nationale SNCF SACA 3.125% 11/2/2027 (b) | EUR | 500,000 | 524,530 |
| | | | 2,491,663 |
| Transportation Infrastructure - 0.1% | | | |
| Aeroports de Paris SA 2.125% 10/2/2026 (b) | EUR | 500,000 | 512,625 |
| APRR SA 1.875% 1/6/2031 (b) | EUR | 200,000 | 193,536 |
| Autoroutes du Sud de la France SA 2.75% 9/2/2032 (b) | EUR | 300,000 | 299,785 |
| La Poste SA 1.375% 4/21/2032 (b) | EUR | 400,000 | 363,128 |
| | | | 1,369,074 |
TOTAL INDUSTRIALS | | | 4,702,548 |
| | | | |
| Information Technology - 0.0% | | | |
| IT Services - 0.0% | | | |
| Capgemini SE 1.125% 6/23/2030 (b) | EUR | 100,000 | 93,894 |
| Materials - 0.0% | | | |
| Chemicals - 0.0% | | | |
| Arkema SA 0.75% 12/3/2029 (b) | EUR | 100,000 | 93,000 |
| Real Estate - 0.2% | | | |
| Diversified REITs - 0.0% | | | |
| ICADE 1.625% 2/28/2028 (b) | EUR | 100,000 | 98,515 |
| Office REITs - 0.0% | | | |
| Gecina SA 1.375% 1/26/2028 (b) | EUR | 200,000 | 198,686 |
| Retail REITs - 0.2% | | | |
| Klepierre SA 0.875% 2/17/2031 (b) | EUR | 100,000 | 90,224 |
| Unibail-Rodamco-Westfield SE 0.75% 10/25/2028 (b) | EUR | 500,000 | 476,550 |
| Unibail-Rodamco-Westfield SE 1% 2/27/2027 (b) | EUR | 600,000 | 600,763 |
| Unibail-Rodamco-Westfield SE 1.5% 5/29/2029 (b) | EUR | 120,000 | 115,785 |
| | | | 1,283,322 |
TOTAL REAL ESTATE | | | 1,580,523 |
| | | | |
| Utilities - 0.3% | | | |
| Electric Utilities - 0.2% | | | |
| Coentreprise de Transport d'Electricite SA 1.5% 7/29/2028 (b) | EUR | 100,000 | 98,103 |
| Electricite de France SA 1% 11/29/2033 (b) | EUR | 100,000 | 83,812 |
| Electricite de France SA 2% 12/9/2049 (b) | EUR | 400,000 | 268,687 |
| Electricite de France SA 5.5% 1/25/2035 (b) | GBP | 200,000 | 239,453 |
| RTE Reseau de Transport d'Electricite SADIR 0% 9/9/2027 (b) | EUR | 100,000 | 96,050 |
| RTE Reseau de Transport d'Electricite SADIR 0.625% 7/8/2032 (b) | EUR | 400,000 | 341,853 |
| | | | 1,127,958 |
| Multi-Utilities - 0.1% | | | |
| Engie SA 0.375% 10/26/2029 (b) | EUR | 400,000 | 365,807 |
| Engie SA 1.25% 10/24/2041 (b) | EUR | 200,000 | 137,536 |
| Engie SA 5.625% 4/3/2053 (b) | GBP | 100,000 | 115,809 |
| Veolia Environnement SA 0.664% 1/15/2031 (b) | EUR | 100,000 | 89,354 |
| Veolia Environnement SA 1.25% 4/15/2028 (b) | EUR | 100,000 | 98,700 |
| Veolia Environnement SA 1.25% 5/14/2035 (b) | EUR | 100,000 | 83,900 |
| | | | 891,106 |
| Water Utilities - 0.0% | | | |
| Suez SACA 1.875% 5/24/2027 (b) | EUR | 100,000 | 100,844 |
| Suez SACA 2.375% 5/24/2030 (b) | EUR | 100,000 | 99,147 |
| Suez SACA 4.625% 11/3/2028 (b) | EUR | 100,000 | 108,883 |
| | | | 308,874 |
TOTAL UTILITIES | | | 2,327,938 |
| | | | |
| TOTAL FRANCE | | | 31,633,026 |
| GERMANY - 3.0% | | | |
| Communication Services - 0.0% | | | |
| Diversified Telecommunication Services - 0.0% | | | |
| Deutsche Telekom AG 3.125% 2/6/2034 (b) | GBP | 60,000 | 64,768 |
| Deutsche Telekom AG 3.25% 3/20/2036 (b) | EUR | 180,000 | 186,255 |
| | | | 251,023 |
| Consumer Discretionary - 0.2% | | | |
| Automobile Components - 0.0% | | | |
| Robert Bosch GmbH 4.375% 6/2/2043 (b) | EUR | 100,000 | 108,035 |
| Automobiles - 0.2% | | | |
| BMW Finance NV 1.5% 2/6/2029 (b) | EUR | 86,000 | 84,363 |
| BMW Finance NV 3.25% 7/22/2030 (b) | EUR | 350,000 | 370,746 |
| Mercedes-Benz Group AG 1.125% 8/8/2034 (b) | EUR | 267,000 | 227,748 |
| Mercedes-Benz Group AG 1.5% 7/3/2029 (b) | EUR | 44,000 | 42,860 |
| Mercedes-Benz Group AG 2.375% 5/22/2030 (b) | EUR | 100,000 | 99,939 |
| Mercedes-Benz International Finance BV 0.375% 11/8/2026 (b) | EUR | 23,000 | 22,797 |
| Mercedes-Benz International Finance BV 1.375% 6/26/2026 (b) | EUR | 44,000 | 44,725 |
| Volkswagen Financial Services NV 1.125% 7/5/2026 (b) | GBP | 100,000 | 117,511 |
| Volkswagen Financial Services NV 2.25% 4/12/2025 (b) | GBP | 26,000 | 32,259 |
| Volkswagen International Finance NV 1.625% 1/16/2030 (b) | EUR | 45,000 | 42,637 |
| Volkswagen International Finance NV 3.25% 11/18/2030 (b) | EUR | 200,000 | 203,986 |
| Volkswagen International Finance NV 4.125% 11/16/2038 (b) | EUR | 200,000 | 211,604 |
| | | | 1,501,175 |
TOTAL CONSUMER DISCRETIONARY | | | 1,609,210 |
| | | | |
| Energy - 0.0% | | | |
| Energy Equipment & Services - 0.0% | | | |
| Vier Gas Transport GmbH 1.5% 9/25/2028 (b) | EUR | 100,000 | 98,385 |
| Financials - 2.1% | | | |
| Banks - 0.4% | | | |
| Berlin Hyp AG 0.25% 5/19/2033 (b) | EUR | 1,020,000 | 856,592 |
| Commerzbank AG 0.01% 3/11/2030 | EUR | 183,000 | 165,335 |
| Commerzbank AG 0.5% 12/4/2026 (b) | EUR | 58,000 | 57,627 |
| Commerzbank AG 1.25% 1/9/2034 | EUR | 58,000 | 52,458 |
| Commerzbank AG 1.5% 8/28/2028 (b) | EUR | 100,000 | 98,769 |
| Commerzbank AG 1.875% 2/28/2028 (b) | EUR | 100,000 | 100,011 |
| Commerzbank AG 4% 12/5/2030 (b)(h) | EUR | 400,000 | 415,467 |
| Commerzbank AG 4.625% 3/21/2028 (b)(h) | EUR | 300,000 | 321,321 |
| Hamburg Commercial Bank AG 0.01% 1/19/2027 (b) | EUR | 100,000 | 98,049 |
| Investitionsbank Berlin 0.01% 7/15/2027 | EUR | 500,000 | 487,778 |
| Landesbank Baden-Wuerttemberg 0.375% 5/7/2029 (b) | EUR | 100,000 | 91,845 |
| Landesbank Baden-Wuerttemberg 3% 4/26/2027 (b) | EUR | 200,000 | 209,712 |
| Muenchener Hypothekenbank eG 1.875% 8/25/2032 (b) | EUR | 60,000 | 58,532 |
| NRW Bank 0.5% 6/17/2041 (b) | EUR | 50,000 | 34,283 |
| NRW Bank 0.875% 4/12/2034 | EUR | 387,000 | 338,403 |
| UniCredit Bank GmbH 0.25% 1/15/2032 (b) | EUR | 39,000 | 33,988 |
| UniCredit Bank GmbH 0.375% 1/17/2033 (b) | EUR | 200,000 | 171,169 |
| UniCredit Bank GmbH 0.85% 5/22/2034 (b) | EUR | 102,000 | 87,662 |
| Volkswagen Bank GmbH 2.5% 7/31/2026 (b) | EUR | 100,000 | 102,609 |
| | | | 3,781,610 |
| Capital Markets - 0.2% | | | |
| Deutsche Bank AG 0.75% 2/17/2027 (b)(h) | EUR | 100,000 | 100,952 |
| Deutsche Bank AG 1.375% 9/3/2026 (b)(h) | EUR | 200,000 | 204,664 |
| Deutsche Bank AG 1.625% 1/20/2027 (b) | EUR | 300,000 | 301,965 |
| Deutsche Bank AG 1.875% 2/23/2028 (b)(h) | EUR | 200,000 | 201,562 |
| Deutsche Bank AG 3.25% 5/24/2028 (b)(h) | EUR | 100,000 | 103,716 |
| Deutsche Bank AG 4% 6/24/2026 (b)(h) | GBP | 200,000 | 248,861 |
| Deutsche Bank AG 4% 6/24/2032 (b)(h) | EUR | 100,000 | 103,679 |
| Deutsche Bank AG 4.125% 4/4/2030 (b)(h) | EUR | 200,000 | 212,175 |
| Deutsche Boerse AG 0.125% 2/22/2031 (b) | EUR | 100,000 | 88,021 |
| Deutsche Boerse AG 1.5% 4/4/2032 (b) | EUR | 100,000 | 93,670 |
| | | | 1,659,265 |
| Consumer Finance - 0.1% | | | |
| Volkswagen Financial Services AG 0.375% 2/12/2030 (b) | EUR | 70,000 | 61,481 |
| Volkswagen Financial Services AG 0.875% 1/31/2028 (b) | EUR | 630,000 | 606,180 |
| Volkswagen Financial Services AG 3.375% 4/6/2028 (b) | EUR | 32,000 | 33,137 |
| | | | 700,798 |
| Financial Services - 1.3% | | | |
| Aareal Bank AG 0.01% 2/1/2028 (b) | EUR | 100,000 | 95,325 |
| Aareal Bank AG 0.05% 9/2/2026 (b) | EUR | 100,000 | 98,396 |
| DZ HYP AG 0.5% 6/16/2026 (b) | EUR | 1,200,000 | 1,208,097 |
| Free and Hanseatic City of Hamburg 0.25% 2/18/2041 (b) | EUR | 190,000 | 126,458 |
| KfW 0% 9/15/2028 (b) | EUR | 442,000 | 420,545 |
| KfW 0% 9/17/2030 (b) | EUR | 261,000 | 235,141 |
| KfW 0% 9/30/2026 (b) | EUR | 273,000 | 272,067 |
| KfW 0.01% 5/5/2027 (b) | EUR | 38,000 | 37,377 |
| KfW 0.05% 9/29/2034 (b) | EUR | 1,284,000 | 1,028,603 |
| KfW 0.125% 12/30/2026 (b) | GBP | 1,064,000 | 1,225,002 |
| KfW 0.625% 1/7/2028 | EUR | 1,834,000 | 1,807,843 |
| KfW 0.625% 2/22/2027 | EUR | 283,000 | 283,288 |
| KfW 0.75% 12/7/2027 (b) | GBP | 320,000 | 360,909 |
| KfW 0.75% 6/28/2028 | EUR | 72,000 | 70,670 |
| KfW 0.875% 7/4/2039 (b) | EUR | 110,000 | 86,645 |
| KfW 0.875% 9/15/2026 (b) | GBP | 43,000 | 50,643 |
| KfW 1.375% 2/2/2028 (b) | SEK | 310,000 | 27,007 |
| KfW 2.15% 8/25/2025 | AUD | 1,210,000 | 738,617 |
| KfW 2.625% 1/10/2034 (b) | EUR | 420,000 | 433,259 |
| KfW 2.875% 12/28/2029 (b) | EUR | 740,000 | 781,138 |
| KfW 3.2% 9/11/2026 | AUD | 118,000 | 71,875 |
| Landwirtschaftliche Rentenbank 0.05% 1/31/2031 (b) | EUR | 480,000 | 427,231 |
| Landwirtschaftliche Rentenbank 0.05% 12/18/2029 (b) | EUR | 42,000 | 38,583 |
| Landwirtschaftliche Rentenbank 0.875% 12/15/2026 (b) | GBP | 19,000 | 22,210 |
| Landwirtschaftliche Rentenbank 1.375% 9/8/2025 (b) | GBP | 1,512,000 | 1,850,047 |
| Landwirtschaftliche Rentenbank 2.6% 3/23/2027 (b) | AUD | 60,000 | 35,918 |
| Landwirtschaftliche Rentenbank 4% 1/19/2028 | AUD | 350,000 | 215,359 |
| Volkswagen Leasing GmbH 0.625% 7/19/2029 (b) | EUR | 50,000 | 45,518 |
| Volkswagen Leasing GmbH 4% 4/11/2031 (b) | EUR | 140,000 | 147,401 |
| | | | 12,241,172 |
| Insurance - 0.1% | | | |
| Allianz Finance II BV 1.5% 1/15/2030 (b) | EUR | 200,000 | 194,793 |
| Allianz SE 1.301% 9/25/2049 (b)(h) | EUR | 200,000 | 188,003 |
| Allianz SE 4.252% 7/5/2052 (b)(h) | EUR | 100,000 | 106,501 |
| Hannover Rueck SE 1.75% 10/8/2040 (b)(h) | EUR | 100,000 | 94,553 |
| Muenchener Rueckversicherungs-Gesellschaft AG in Muenchen 1.25% 5/26/2041 (b)(h) | EUR | 100,000 | 90,067 |
| | | | 673,917 |
TOTAL FINANCIALS | | | 19,056,762 |
| | | | |
| Health Care - 0.0% | | | |
| Pharmaceuticals - 0.0% | | | |
| Bayer AG 1.375% 7/6/2032 (b) | EUR | 300,000 | 261,836 |
| Industrials - 0.2% | | | |
| Air Freight & Logistics - 0.0% | | | |
| Deutsche Post AG 3.375% 7/3/2033 (b) | EUR | 100,000 | 106,796 |
| Electrical Equipment - 0.0% | | | |
| Eurogrid GmbH 3.598% 2/1/2029 (b) | EUR | 400,000 | 422,297 |
| Ground Transportation - 0.2% | | | |
| Deutsche Bahn Finance GMBH 0.375% 12/3/2026 (b) | GBP | 214,000 | 248,238 |
| Deutsche Bahn Finance GMBH 0.625% 12/8/2050 (b) | EUR | 144,000 | 78,862 |
| Deutsche Bahn Finance GMBH 0.625% 4/15/2036 (b) | EUR | 170,000 | 134,932 |
| Deutsche Bahn Finance GMBH 0.875% 6/23/2039 (b) | EUR | 198,000 | 146,346 |
| Deutsche Bahn Finance GMBH 1.375% 7/7/2025 (b) | GBP | 28,000 | 34,454 |
| Deutsche Bahn Finance GMBH 1.875% 2/13/2026 (b) | GBP | 171,000 | 207,870 |
| | | | 850,702 |
| Industrial Conglomerates - 0.0% | | | |
| Siemens Financieringsmaatschappij NV 0.125% 9/5/2029 (b) | EUR | 24,000 | 22,482 |
| Siemens Financieringsmaatschappij NV 1.75% 2/28/2039 (b) | EUR | 23,000 | 19,583 |
| Siemens Financieringsmaatschappij NV 3% 9/8/2033 (b) | EUR | 100,000 | 103,099 |
| Siemens Financieringsmaatschappij NV 3.125% 5/22/2032 (b) | EUR | 200,000 | 209,405 |
| Siemens Financieringsmaatschappij NV 3.625% 2/24/2043 (b) | EUR | 100,000 | 103,457 |
| | | | 458,026 |
| Machinery - 0.0% | | | |
| Traton Finance Luxembourg SA 4.5% 11/23/2026 (b) | EUR | 200,000 | 212,207 |
TOTAL INDUSTRIALS | | | 2,050,028 |
| | | | |
| Materials - 0.0% | | | |
| Chemicals - 0.0% | | | |
| BASF SE 4.25% 3/8/2032 (b) | EUR | 200,000 | 219,821 |
| Construction Materials - 0.0% | | | |
| Heidelberg Materials Finance Luxembourg SA 4.875% 11/21/2033 (b) | EUR | 100,000 | 113,322 |
TOTAL MATERIALS | | | 333,143 |
| | | | |
| Real Estate - 0.2% | | | |
| Real Estate Management & Development - 0.2% | | | |
| Aroundtown SA 0.375% 4/15/2027 (b) | EUR | 200,000 | 193,099 |
| Aroundtown SA 1.45% 7/9/2028 (b) | EUR | 100,000 | 96,074 |
| Grand City Properties SA 1.375% 8/3/2026 (b) | EUR | 400,000 | 403,732 |
| LEG Immobilien SE 0.375% 1/17/2026 (b) | EUR | 100,000 | 100,980 |
| LEG Immobilien SE 0.875% 1/17/2029 (b) | EUR | 100,000 | 94,281 |
| LEG Immobilien SE 0.875% 11/28/2027 (b) | EUR | 100,000 | 98,193 |
| Vonovia SE 0.625% 10/7/2027 (b) | EUR | 200,000 | 194,525 |
| Vonovia SE 0.75% 9/1/2032 (b) | EUR | 100,000 | 83,831 |
| Vonovia SE 1% 6/16/2033 (b) | EUR | 400,000 | 332,932 |
| | | | 1,597,647 |
| Utilities - 0.3% | | | |
| Electric Utilities - 0.1% | | | |
| Amprion GmbH 3.45% 9/22/2027 (b) | EUR | 100,000 | 105,165 |
| Amprion GmbH 3.971% 9/22/2032 (b) | EUR | 200,000 | 214,532 |
| E.ON International Finance BV 1.5% 7/31/2029 (b) | EUR | 115,000 | 112,361 |
| E.ON International Finance BV 5.75% 2/14/2033 (b) | EUR | 130,000 | 158,557 |
| EnBW Energie Baden-Wuerttemberg AG 1.375% 8/31/2081 (b)(h) | EUR | 100,000 | 94,996 |
| EnBW International Finance BV 0.5% 3/1/2033 (b) | EUR | 281,000 | 232,202 |
| EnBW International Finance BV 3.625% 11/22/2026 (b) | EUR | 260,000 | 274,085 |
| | | | 1,191,898 |
| Independent Power and Renewable Electricity Producers - 0.1% | | | |
| RWE AG 2.5% 8/24/2025 (b) | EUR | 430,000 | 444,384 |
| RWE AG 2.75% 5/24/2030 (b) | EUR | 120,000 | 122,368 |
| | | | 566,752 |
| Multi-Utilities - 0.1% | | | |
| E.ON SE 0.25% 10/24/2026 (b) | EUR | 69,000 | 68,733 |
| E.ON SE 0.35% 2/28/2030 (b) | EUR | 190,000 | 173,458 |
| E.ON SE 0.75% 2/20/2028 (b) | EUR | 99,000 | 97,042 |
| E.ON SE 0.875% 10/18/2034 (b) | EUR | 117,000 | 97,343 |
| E.ON SE 0.875% 8/20/2031 (b) | EUR | 200,000 | 180,057 |
| E.ON SE 3.5% 1/12/2028 (b) | EUR | 140,000 | 148,136 |
| E.ON SE 4.125% 3/25/2044 (b) | EUR | 50,000 | 52,500 |
| | | | 817,269 |
TOTAL UTILITIES | | | 2,575,919 |
| | | | |
| TOTAL GERMANY | | | 27,833,953 |
| HONG KONG - 0.0% | | | |
| Financials - 0.0% | | | |
| Banks - 0.0% | | | |
| Hongkong & Shanghai Banking Corp Ltd-The-/Sydney 5.1% 3/3/2028 (b) | AUD | 250,000 | 156,967 |
| IRELAND - 0.1% | | | |
| Financials - 0.1% | | | |
| Banks - 0.1% | | | |
| AIB Group PLC 4.625% 7/23/2029 (b)(h) | EUR | 100,000 | 108,876 |
| Bank of Ireland Group PLC 0.375% 5/10/2027 (b)(h) | EUR | 140,000 | 140,485 |
| Bank of Ireland Group PLC 1.375% 8/11/2031 (b)(h) | EUR | 100,000 | 100,582 |
| | | | 349,943 |
| Materials - 0.0% | | | |
| Containers & Packaging - 0.0% | | | |
| Smurfit Kappa Treasury ULC 1.5% 9/15/2027 (b) | EUR | 100,000 | 100,447 |
| Utilities - 0.0% | | | |
| Electric Utilities - 0.0% | | | |
| ESB Finance DAC 1.125% 6/11/2030 (b) | EUR | 135,000 | 126,459 |
| ESB Finance DAC 4% 10/3/2028 (b) | EUR | 100,000 | 107,276 |
| | | | 233,735 |
| TOTAL IRELAND | | | 684,125 |
| ITALY - 0.7% | | | |
| Energy - 0.0% | | | |
| Oil, Gas & Consumable Fuels - 0.0% | | | |
| Eni SpA 3.625% 5/19/2027 (b) | EUR | 100,000 | 105,590 |
| Eni SpA 4.25% 5/19/2033 (b) | EUR | 120,000 | 130,387 |
| | | | 235,977 |
| Financials - 0.3% | | | |
| Banks - 0.3% | | | |
| AMCO - Asset Management Co SpA 1.375% 1/27/2025 (b) | EUR | 110,000 | 113,809 |
| Credit Agricole Italia SpA 0.375% 1/20/2032 (b) | EUR | 200,000 | 173,471 |
| Iccrea Banca SpA 4% 11/8/2027 (b) | EUR | 140,000 | 149,656 |
| Intesa Sanpaolo SpA 0.75% 3/16/2028 (b) | EUR | 360,000 | 348,510 |
| Intesa Sanpaolo SpA 2.5% 1/15/2030 (b) | GBP | 100,000 | 109,631 |
| Intesa Sanpaolo SpA 4.875% 5/19/2030 (b) | EUR | 200,000 | 223,386 |
| Intesa Sanpaolo SpA 5.125% 8/29/2031 (b) | EUR | 100,000 | 114,339 |
| Mediobanca Banca di Credito Finanziario SpA 2.375% 6/30/2027 (b) | EUR | 160,000 | 164,116 |
| Mediobanca Banca di Credito Finanziario SpA 4.75% 3/14/2028 (b)(h) | EUR | 100,000 | 107,639 |
| UniCredit SpA 0.85% 1/19/2031 (b) | EUR | 140,000 | 125,887 |
| UniCredit SpA 2.2% 7/22/2027 (b)(h) | EUR | 490,000 | 501,994 |
| UniCredit SpA 4.45% 2/16/2029 (b)(h) | EUR | 320,000 | 344,283 |
| | | | 2,476,721 |
| Insurance - 0.0% | | | |
| Generali 1.713% 6/30/2032 (b) | EUR | 100,000 | 90,707 |
| Generali 2.124% 10/1/2030 (b) | EUR | 130,000 | 126,918 |
| Generali 5.5% 10/27/2047 (b)(h) | EUR | 100,000 | 109,474 |
| | | | 327,099 |
TOTAL FINANCIALS | | | 2,803,820 |
| | | | |
| Industrials - 0.1% | | | |
| Ground Transportation - 0.1% | | | |
| Ferrovie dello Stato Italiane SpA 1.125% 7/9/2026 (b) | EUR | 230,000 | 233,133 |
| Ferrovie dello Stato Italiane SpA 1.5% 6/27/2025 (b) | EUR | 144,000 | 148,082 |
| | | | 381,215 |
| Transportation Infrastructure - 0.0% | | | |
| Autostrade per l'Italia SpA 1.875% 9/26/2029 (b) | EUR | 320,000 | 311,538 |
TOTAL INDUSTRIALS | | | 692,753 |
| | | | |
| Utilities - 0.3% | | | |
| Electric Utilities - 0.2% | | | |
| Enel Finance International NV 0.375% 6/17/2027 (b) | EUR | 220,000 | 215,578 |
| Enel Finance International NV 0.75% 6/17/2030 (b) | EUR | 110,000 | 100,516 |
| Enel Finance International NV 2.875% 4/11/2029 (b) | GBP | 636,000 | 730,197 |
| Enel Finance International NV 4% 2/20/2031 (b) | EUR | 300,000 | 324,187 |
| Terna - Rete Elettrica Nazionale 0.375% 6/23/2029 (b) | EUR | 120,000 | 111,091 |
| Terna - Rete Elettrica Nazionale 1.375% 7/26/2027 (b) | EUR | 150,000 | 150,276 |
| | | | 1,631,845 |
| Gas Utilities - 0.0% | | | |
| Italgas SpA 1% 12/11/2031 (b) | EUR | 110,000 | 99,213 |
| Snam SpA 0.75% 6/20/2029 (b) | EUR | 420,000 | 394,723 |
| | | | 493,936 |
| Multi-Utilities - 0.1% | | | |
| A2A SpA 0.625% 7/15/2031 (b) | EUR | 140,000 | 122,644 |
| ACEA SpA 1.5% 6/8/2027 (b) | EUR | 217,000 | 218,337 |
| Hera SpA 0.875% 7/5/2027 (b) | EUR | 190,000 | 187,873 |
| | | | 528,854 |
TOTAL UTILITIES | | | 2,654,635 |
| | | | |
| TOTAL ITALY | | | 6,387,185 |
| JAPAN - 0.4% | | | |
| Communication Services - 0.2% | | | |
| Diversified Telecommunication Services - 0.2% | | | |
| NTT Finance Corp 0.18% 12/19/2025 | JPY | 200,000,000 | 1,265,196 |
| Consumer Discretionary - 0.1% | | | |
| Automobiles - 0.1% | | | |
| Toyota Finance Corp 0.37% 10/13/2026 | JPY | 100,000,000 | 630,510 |
| Consumer Staples - 0.0% | | | |
| Tobacco - 0.0% | | | |
| JT International Financial Services BV 2.375% 4/7/2081 (b)(h) | EUR | 120,000 | 122,240 |
| Financials - 0.1% | | | |
| Banks - 0.1% | | | |
| Development Bank of Japan Inc 3.125% 4/13/2028 (b) | EUR | 140,000 | 147,760 |
| Mizuho Financial Group Inc 0.797% 4/15/2030 (b) | EUR | 470,000 | 429,967 |
| Mizuho Financial Group Inc 1.412% 7/13/2033 | JPY | 12,000,000 | 74,008 |
| Sumitomo Mitsui Financial Group Inc 0.632% 10/23/2029 (b) | EUR | 110,000 | 101,727 |
| | | | 753,462 |
| Consumer Finance - 0.0% | | | |
| Toyota Motor Finance Netherlands BV 3.5% 1/13/2028 (b) | EUR | 300,000 | 316,339 |
TOTAL FINANCIALS | | | 1,069,801 |
| | | | |
| Health Care - 0.0% | | | |
| Pharmaceuticals - 0.0% | | | |
| Takeda Pharmaceutical Co Ltd 2% 7/9/2040 | EUR | 157,000 | 129,719 |
| Industrials - 0.0% | | | |
| Ground Transportation - 0.0% | | | |
| East Japan Railway Co 1.104% 9/15/2039 (b) | EUR | 160,000 | 120,904 |
| East Japan Railway Co 1.162% 9/15/2028 (b) | GBP | 210,000 | 230,937 |
| | | | 351,841 |
| TOTAL JAPAN | | | 3,569,307 |
| KOREA (SOUTH) - 0.0% | | | |
| Financials - 0.0% | | | |
| Financial Services - 0.0% | | | |
| Korea Housing Finance Corp 0.01% 7/7/2025 (b) | EUR | 160,000 | 163,429 |
| LUXEMBOURG - 0.1% | | | |
| Financials - 0.0% | | | |
| Capital Markets - 0.0% | | | |
| JAB Holdings BV 1% 7/14/2031 (b) | EUR | 100,000 | 90,309 |
| JAB Holdings BV 2.5% 6/25/2029 (b) | EUR | 100,000 | 101,615 |
| | | | 191,924 |
| Financial Services - 0.0% | | | |
| CBRE Global Investors Open-Ended Funds SCA SICAV-SIF-Pan European Core Fund 0.5% 1/27/2028 (b) | EUR | 100,000 | 95,680 |
TOTAL FINANCIALS | | | 287,604 |
| | | | |
| Real Estate - 0.1% | | | |
| Industrial REITs - 0.0% | | | |
| Prologis International Funding II SA 1.75% 3/15/2028 (b) | EUR | 514,000 | 513,713 |
| Real Estate Management & Development - 0.1% | | | |
| Blackstone Property Partners Europe Holdings Sarl 1.25% 4/26/2027 (b) | EUR | 153,000 | 151,204 |
| Logicor Financing Sarl 1.625% 7/15/2027 (b) | EUR | 290,000 | 288,612 |
| SELP Finance Sarl 1.5% 11/20/2025 (b) | EUR | 100,000 | 102,286 |
| | | | 542,102 |
TOTAL REAL ESTATE | | | 1,055,815 |
| | | | |
| TOTAL LUXEMBOURG | | | 1,343,419 |
| MEXICO - 0.0% | | | |
| Communication Services - 0.0% | | | |
| Wireless Telecommunication Services - 0.0% | | | |
| America Movil SAB de CV 0.75% 6/26/2027 | EUR | 100,000 | 98,582 |
| America Movil SAB de CV 2.125% 3/10/2028 | EUR | 200,000 | 203,163 |
| | | | 301,745 |
| Energy - 0.0% | | | |
| Oil, Gas & Consumable Fuels - 0.0% | | | |
| Petroleos Mexicanos 4.75% 2/26/2029 (b) | EUR | 100,000 | 95,493 |
| TOTAL MEXICO | | | 397,238 |
| MULTI-NATIONAL - 1.7% | | | |
| Financials - 1.7% | | | |
| Banks - 1.3% | | | |
| African Development Bank 0.125% 10/7/2026 | EUR | 41,000 | 40,919 |
| African Development Bank 0.875% 5/24/2028 | EUR | 87,000 | 85,720 |
| African Development Bank 1.1% 12/16/2026 | AUD | 260,000 | 151,556 |
| African Development Bank 1.125% 6/18/2025 | GBP | 80,000 | 98,443 |
| Asian Development Bank 1.125% 12/15/2025 | GBP | 32,000 | 38,758 |
| Asian Development Bank 1.375% 3/7/2025 | GBP | 25,000 | 31,087 |
| Asian Development Bank 1.625% 1/28/2025 | CAD | 290,000 | 201,498 |
| Asian Development Bank 3.3% 8/8/2028 (b) | AUD | 55,000 | 32,989 |
| Asian Development Bank 3.875% 7/22/2027 | GBP | 310,000 | 382,282 |
| Asian Development Bank 4.65% 2/16/2027 | CAD | 700,000 | 502,912 |
| Corp Andina de Fomento 1.625% 6/3/2025 (b) | EUR | 198,000 | 204,019 |
| Council Of Europe Development Bank 0% 4/9/2027 (b) | EUR | 33,000 | 32,450 |
| Council Of Europe Development Bank 1% 4/13/2029 (b) | EUR | 210,000 | 204,898 |
| European Investment Bank 0% 6/17/2027 | EUR | 215,000 | 210,884 |
| European Investment Bank 0% 9/9/2030 (b) | EUR | 309,000 | 278,098 |
| European Investment Bank 0.01% 5/15/2041 (b) | EUR | 330,000 | 208,947 |
| European Investment Bank 0.05% 10/13/2034 (b) | EUR | 1,677,000 | 1,333,318 |
| European Investment Bank 0.05% 11/15/2029 (b) | EUR | 2,750,000 | 2,537,974 |
| European Investment Bank 0.125% 6/20/2029 (b) | EUR | 578,000 | 541,366 |
| European Investment Bank 0.375% 4/14/2026 (b) | EUR | 413,000 | 418,009 |
| European Investment Bank 0.375% 7/16/2025 | EUR | 577,000 | 591,136 |
| European Investment Bank 0.75% 7/15/2027 | AUD | 340,000 | 193,281 |
| European Investment Bank 1% 4/14/2032 (b) | EUR | 736,000 | 683,966 |
| European Investment Bank 1% 9/21/2026 (b) | GBP | 226,000 | 266,666 |
| European Investment Bank 1.125% 4/13/2033 (b) | EUR | 265,000 | 243,738 |
| European Investment Bank 1.75% 11/12/2026 (b) | SEK | 240,000 | 21,405 |
| European Investment Bank 3.625% 1/12/2032 (b) | GBP | 550,000 | 651,575 |
| Inter-American Development Bank 1.25% 12/15/2025 | GBP | 308,000 | 373,467 |
| Inter-American Development Bank 3.15% 6/26/2029 | AUD | 120,000 | 70,723 |
| Inter-American Development Bank 3.875% 2/15/2029 | GBP | 130,000 | 159,160 |
| International Development Association 0% 7/15/2031 (b) | EUR | 110,000 | 96,161 |
| International Development Association 0.7% 1/17/2042 (b) | EUR | 297,000 | 208,438 |
| International Development Association 4.75% 10/14/2031 (b) | GBP | 230,000 | 290,400 |
| | | | 11,386,243 |
| Financial Services - 0.4% | | | |
| International Bank for Reconstruction & Development 0% 1/15/2027 | EUR | 1,828,000 | 1,808,370 |
| International Bank for Reconstruction & Development 0.01% 4/24/2028 | EUR | 687,000 | 658,522 |
| International Bank for Reconstruction & Development 1% 12/21/2029 | GBP | 248,000 | 263,769 |
| International Bank for Reconstruction & Development 1.2% 8/8/2034 | EUR | 403,000 | 360,546 |
| International Bank for Reconstruction & Development 1.25% 12/13/2028 | GBP | 100,000 | 111,023 |
| International Bank for Reconstruction & Development 3.3% 8/14/2028 | AUD | 210,000 | 126,031 |
| International Bank for Reconstruction & Development 3.45% 9/13/2038 | EUR | 140,000 | 151,408 |
| International Finance Corp 3.15% 6/26/2029 (b) | AUD | 90,000 | 53,046 |
| International Finance Corp 4.5% 10/2/2028 | GBP | 370,000 | 463,685 |
| | | | 3,996,400 |
TOTAL FINANCIALS | | | 15,382,643 |
| | | | |
| Industrials - 0.0% | | | |
| Ground Transportation - 0.0% | | | |
| EUROFIMA 0.15% 10/10/2034 (b) | EUR | 191,000 | 152,216 |
| TOTAL MULTI-NATIONAL | | | 15,534,859 |
| NETHERLANDS - 1.2% | | | |
| Communication Services - 0.0% | | | |
| Diversified Telecommunication Services - 0.0% | | | |
| Koninklijke KPN NV 3.875% 7/3/2031 (b) | EUR | 100,000 | 107,945 |
| Consumer Staples - 0.0% | | | |
| Beverages - 0.0% | | | |
| Heineken NV 1.75% 5/7/2040 (b) | EUR | 160,000 | 130,554 |
| Consumer Staples Distribution & Retail - 0.0% | | | |
| Koninklijke Ahold Delhaize NV 0.375% 3/18/2030 (b) | EUR | 120,000 | 109,206 |
| Food Products - 0.0% | | | |
| JDE Peet's NV 0.5% 1/16/2029 (b) | EUR | 130,000 | 121,005 |
TOTAL CONSUMER STAPLES | | | 360,765 |
| | | | |
| Financials - 1.2% | | | |
| Banks - 1.1% | | | |
| ABN AMRO Bank NV 0.375% 1/14/2035 (b) | EUR | 200,000 | 161,119 |
| ABN AMRO Bank NV 0.5% 9/23/2029 (b) | EUR | 200,000 | 183,312 |
| ABN AMRO Bank NV 0.6% 1/15/2027 (b) | EUR | 300,000 | 296,930 |
| ABN AMRO Bank NV 1.375% 1/12/2037 (b) | EUR | 400,000 | 344,820 |
| ABN AMRO Bank NV 4.5% 11/21/2034 (b) | EUR | 100,000 | 112,481 |
| BNG Bank NV 0% 1/20/2031 (b) | EUR | 120,000 | 105,949 |
| BNG Bank NV 0.75% 1/24/2029 (b) | EUR | 2,384,000 | 2,305,162 |
| BNG Bank NV 3.3% 7/17/2028 (b) | AUD | 1,267,000 | 757,868 |
| Cooperatieve Rabobank UA 0.25% 10/30/2026 (b) | EUR | 500,000 | 494,903 |
| Cooperatieve Rabobank UA 0.625% 2/25/2033 (b) | EUR | 100,000 | 84,865 |
| Cooperatieve Rabobank UA 1.125% 5/7/2031 (b) | EUR | 100,000 | 91,161 |
| Cooperatieve Rabobank UA 1.25% 3/23/2026 (b) | EUR | 79,000 | 80,448 |
| Cooperatieve Rabobank UA 1.875% 7/12/2028 (b)(h) | GBP | 200,000 | 233,068 |
| Cooperatieve Rabobank UA 3.202% 5/6/2036 (b) | EUR | 400,000 | 423,173 |
| ING Bank NV 3% 5/21/2034 (b) | EUR | 300,000 | 313,373 |
| ING Groep NV 0.25% 2/1/2030 (b)(h) | EUR | 200,000 | 183,922 |
| ING Groep NV 0.25% 2/18/2029 (b)(h) | EUR | 500,000 | 474,260 |
| ING Groep NV 1% 11/16/2032 (b)(h) | EUR | 200,000 | 194,263 |
| ING Groep NV 2.125% 5/26/2031 (b)(h) | EUR | 400,000 | 408,622 |
| ING Groep NV 3% 2/18/2026 (b) | GBP | 100,000 | 122,463 |
| ING Groep NV 3.5% 9/3/2030 (b)(h) | EUR | 300,000 | 314,178 |
| ING Groep NV 4.875% 11/14/2027 (b)(h) | EUR | 200,000 | 214,523 |
| Nationale-Nederlanden Bank NV/The Netherlands 1% 9/25/2028 (b) | EUR | 700,000 | 682,362 |
| Nederlandse Waterschapsbank NV 0.75% 10/4/2041 (b) | EUR | 748,000 | 529,106 |
| Nederlandse Waterschapsbank NV 3.3% 5/2/2029 (b) | AUD | 40,000 | 23,623 |
| | | | 9,135,954 |
| Consumer Finance - 0.0% | | | |
| Ayvens Bank NV 2.125% 5/6/2025 (b) | EUR | 130,000 | 134,193 |
| Financial Services - 0.0% | | | |
| EXOR NV 1.75% 1/18/2028 (b) | EUR | 170,000 | 171,003 |
| Insurance - 0.1% | | | |
| ASR Nederland NV 3.375% 5/2/2049 (b)(h) | EUR | 100,000 | 102,091 |
| NN Group NV 4.625% 1/13/2048 (b)(h) | EUR | 180,000 | 193,724 |
| | | | 295,815 |
TOTAL FINANCIALS | | | 9,736,965 |
| | | | |
| Health Care - 0.0% | | | |
| Health Care Equipment & Supplies - 0.0% | | | |
| Koninklijke Philips NV 2.125% 11/5/2029 (b) | EUR | 110,000 | 109,669 |
| Industrials - 0.0% | | | |
| Transportation Infrastructure - 0.0% | | | |
| Royal Schiphol Group NV 2% 4/6/2029 (b) | EUR | 117,000 | 116,944 |
| Real Estate - 0.0% | | | |
| Real Estate Management & Development - 0.0% | | | |
| CTP NV 0.625% 9/27/2026 (b) | EUR | 110,000 | 109,874 |
| CTP NV 0.75% 2/18/2027 (b) | EUR | 108,000 | 106,429 |
| | | | 216,303 |
| Utilities - 0.0% | | | |
| Electric Utilities - 0.0% | | | |
| Enexis Holding NV 0.75% 7/2/2031 (b) | EUR | 100,000 | 90,191 |
| TenneT Holding BV 0.875% 6/16/2035 (b) | EUR | 234,000 | 194,567 |
| | | | 284,758 |
| Multi-Utilities - 0.0% | | | |
| Stedin Holding NV 0% 11/16/2026 (b) | EUR | 117,000 | 115,341 |
TOTAL UTILITIES | | | 400,099 |
| | | | |
| TOTAL NETHERLANDS | | | 11,048,690 |
| NEW ZEALAND - 0.1% | | | |
| Financials - 0.1% | | | |
| Banks - 0.1% | | | |
| Westpac Securities NZ Ltd/London 0.01% 6/8/2028 (b) | EUR | 998,000 | 942,599 |
| NORWAY - 0.2% | | | |
| Communication Services - 0.0% | | | |
| Diversified Telecommunication Services - 0.0% | | | |
| Telenor ASA 0.75% 5/31/2026 (b) | EUR | 100,000 | 100,816 |
| Telenor ASA 1.125% 5/31/2029 (b) | EUR | 157,000 | 151,346 |
| | | | 252,162 |
| Energy - 0.0% | | | |
| Oil, Gas & Consumable Fuels - 0.0% | | | |
| Equinor ASA 1.375% 5/22/2032 (b) | EUR | 241,000 | 222,421 |
| Financials - 0.2% | | | |
| Banks - 0.2% | | | |
| DNB Bank ASA 3.125% 9/21/2027 (b)(h) | EUR | 170,000 | 177,157 |
| DNB Bank ASA 4% 8/17/2027 (b)(h) | GBP | 100,000 | 123,281 |
| SpareBank 1 Boligkreditt AS 0.01% 9/22/2027 (b) | EUR | 1,151,000 | 1,114,396 |
| | | | 1,414,834 |
| Capital Markets - 0.0% | | | |
| Kommunalbanken AS 0.6% 6/1/2026 | AUD | 500,000 | 293,843 |
TOTAL FINANCIALS | | | 1,708,677 |
| | | | |
| TOTAL NORWAY | | | 2,183,260 |
| PORTUGAL - 0.1% | | | |
| Financials - 0.1% | | | |
| Banks - 0.1% | | | |
| Banco Santander Totta SA 3.25% 2/15/2031 (b) | EUR | 100,000 | 105,963 |
| Banco Santander Totta SA 3.375% 4/19/2028 (b) | EUR | 400,000 | 423,205 |
| | | | 529,168 |
| Utilities - 0.0% | | | |
| Electric Utilities - 0.0% | | | |
| EDP Finance BV 1.875% 9/21/2029 (b) | EUR | 100,000 | 98,448 |
| TOTAL PORTUGAL | | | 627,616 |
| SOUTH AFRICA - 0.0% | | | |
| Materials - 0.0% | | | |
| Metals & Mining - 0.0% | | | |
| Anglo American Capital PLC 3.75% 6/15/2029 (b) | EUR | 140,000 | 148,064 |
| SPAIN - 0.5% | | | |
| Communication Services - 0.0% | | | |
| Diversified Telecommunication Services - 0.0% | | | |
| Telefonica Emisiones SA 0.664% 2/3/2030 (b) | EUR | 100,000 | 92,757 |
| Telefonica Emisiones SA 1.93% 10/17/2031 (b) | EUR | 300,000 | 285,176 |
| | | | 377,933 |
| Financials - 0.4% | | | |
| Banks - 0.4% | | | |
| Banco Bilbao Vizcaya Argentaria SA 4.375% 10/14/2029 (b) | EUR | 300,000 | 331,109 |
| Banco Bilbao Vizcaya Argentaria SA 5.75% 9/15/2033 (b)(h) | EUR | 100,000 | 110,292 |
| Banco Santander SA 0.2% 2/11/2028 (b) | EUR | 300,000 | 285,932 |
| Banco Santander SA 0.5% 3/24/2027 (b)(h) | EUR | 100,000 | 100,637 |
| Banco Santander SA 1.375% 1/5/2026 (b) | EUR | 300,000 | 307,107 |
| Banco Santander SA 2.125% 2/8/2028 (b) | EUR | 100,000 | 100,335 |
| Banco Santander SA 3.125% 1/19/2027 (b) | EUR | 100,000 | 103,891 |
| Banco Santander SA 3.25% 4/2/2029 (b)(h) | EUR | 300,000 | 311,626 |
| Banco Santander SA 3.5% 1/9/2030 (b)(h) | EUR | 100,000 | 105,358 |
| Banco Santander SA 3.75% 1/9/2034 (b) | EUR | 100,000 | 106,573 |
| Banco Santander SA 5.125% 1/25/2030 (b) | GBP | 100,000 | 125,679 |
| Banco Santander SA 5.75% 8/23/2033 (b)(h) | EUR | 100,000 | 110,156 |
| CaixaBank SA 0.5% 2/9/2029 (b)(h) | EUR | 400,000 | 383,058 |
| CaixaBank SA 0.75% 5/26/2028 (b)(h) | EUR | 300,000 | 295,614 |
| CaixaBank SA 1.5% 12/3/2026 (b)(h) | GBP | 200,000 | 242,143 |
| CaixaBank SA 2.25% 4/17/2030 (b)(h) | EUR | 100,000 | 103,143 |
| CaixaBank SA 5% 7/19/2029 (b)(h) | EUR | 100,000 | 110,212 |
| CaixaBank SA 6.25% 2/23/2033 (b)(h) | EUR | 100,000 | 110,964 |
| | | | 3,343,829 |
| Industrials - 0.0% | | | |
| Transportation Infrastructure - 0.0% | | | |
| Abertis Infraestructuras SA 2.375% 9/27/2027 (b) | EUR | 400,000 | 409,152 |
| Information Technology - 0.0% | | | |
| Communications Equipment - 0.0% | | | |
| Cellnex Finance Co SA 1% 9/15/2027 (b) | EUR | 400,000 | 394,510 |
| Utilities - 0.1% | | | |
| Electric Utilities - 0.0% | | | |
| Iberdrola Finanzas SA 3.375% 11/22/2032 (b) | EUR | 200,000 | 210,047 |
| Gas Utilities - 0.1% | | | |
| Naturgy Finance Iberia SA 1.25% 1/15/2026 (b) | EUR | 200,000 | 204,087 |
| Naturgy Finance Iberia SA 1.5% 1/29/2028 (b) | EUR | 100,000 | 99,524 |
| | | | 303,611 |
TOTAL UTILITIES | | | 513,658 |
| | | | |
| TOTAL SPAIN | | | 5,039,082 |
| SWEDEN - 0.9% | | | |
| Communication Services - 0.0% | | | |
| Diversified Telecommunication Services - 0.0% | | | |
| Telia Co AB 0.125% 11/27/2030 (b) | EUR | 310,000 | 271,719 |
| Financials - 0.8% | | | |
| Banks - 0.7% | | | |
| Lansforsakringar Hypotek AB 1.25% 9/17/2025 (b) | SEK | 400,000 | 35,819 |
| Lansforsakringar Hypotek AB 1.5% 9/16/2026 (b) | SEK | 5,600,000 | 497,653 |
| Nordea Hypotek AB 0.5% 9/16/2026 (b) | SEK | 15,200,000 | 1,328,222 |
| Nordea Hypotek AB 1% 9/17/2025 (b) | SEK | 1,700,000 | 152,006 |
| Skandinaviska Enskilda Banken AB 0.75% 11/15/2027 (b) | EUR | 100,000 | 98,555 |
| Skandinaviska Enskilda Banken AB 1.75% 11/11/2026 (b) | EUR | 210,000 | 213,773 |
| Skandinaviska Enskilda Banken AB 3% 11/6/2028 (b) | SEK | 4,000,000 | 364,059 |
| Skandinaviska Enskilda Banken AB 3.25% 5/4/2028 (b) | EUR | 250,000 | 264,563 |
| Skandinaviska Enskilda Banken AB 3.75% 2/7/2028 (b) | EUR | 160,000 | 169,484 |
| Stadshypotek AB 0.375% 3/13/2026 (b) | EUR | 500,000 | 505,381 |
| Stadshypotek AB 2% 9/1/2028 (b) | SEK | 10,000,000 | 880,103 |
| Svenska Handelsbanken AB 0.5% 2/18/2030 (b) | EUR | 200,000 | 182,363 |
| Svenska Handelsbanken AB 1.375% 2/23/2029 (b) | EUR | 110,000 | 106,806 |
| Sveriges Sakerstallda Obligationer AB 2% 6/17/2026 (b) | SEK | 11,000,000 | 987,133 |
| Swedbank AB 0.3% 5/20/2027 (b)(h) | EUR | 240,000 | 239,878 |
| Swedbank AB 2.1% 5/25/2027 (b) | EUR | 108,000 | 110,456 |
| | | | 6,136,254 |
| Financial Services - 0.1% | | | |
| Investor AB 1.5% 9/12/2030 (b) | EUR | 120,000 | 115,272 |
| Kommuninvest I Sverige AB 1% 11/12/2026 (b) | SEK | 6,710,000 | 590,260 |
| Swedbank Hypotek AB 3% 3/28/2029 (b) | SEK | 1,900,000 | 172,707 |
| Swedbank Hypotek AB 3.125% 7/5/2028 (b) | EUR | 390,000 | 411,259 |
| | | | 1,289,498 |
TOTAL FINANCIALS | | | 7,425,752 |
| | | | |
| Real Estate - 0.1% | | | |
| Real Estate Management & Development - 0.1% | | | |
| Akelius Residential Property Financing BV 1% 1/17/2028 (b) | EUR | 100,000 | 96,080 |
| Fastighets AB Balder 1.25% 1/28/2028 (b) | EUR | 108,000 | 104,384 |
| Heimstaden Bostad Treasury BV 0.625% 7/24/2025 (b) | EUR | 160,000 | 163,065 |
| Heimstaden Bostad Treasury BV 1.375% 7/24/2028 (b) | EUR | 135,000 | 128,563 |
| Sagax AB 2.25% 3/13/2025 (b) | EUR | 120,000 | 124,030 |
| Samhallsbyggnadsbolaget i Norden AB 2.25% 8/12/2027 (b)(e) | EUR | 108,000 | 87,633 |
| | | | 703,755 |
| Utilities - 0.0% | | | |
| Electric Utilities - 0.0% | | | |
| Vattenfall AB 0.125% 2/12/2029 (b) | EUR | 108,000 | 100,654 |
| TOTAL SWEDEN | | | 8,501,880 |
| SWITZERLAND - 0.7% | | | |
| Communication Services - 0.0% | | | |
| Diversified Telecommunication Services - 0.0% | | | |
| Swisscom Finance BV 0.375% 11/14/2028 (b) | EUR | 430,000 | 407,217 |
| Financials - 0.7% | | | |
| Banks - 0.3% | | | |
| Pfandbriefzentrale der schweizerischen Kantonalbanken AG 0% 3/13/2028 (b) | CHF | 600,000 | 651,465 |
| Pfandbriefzentrale der schweizerischen Kantonalbanken AG 0% 7/25/2031 (b) | CHF | 340,000 | 359,293 |
| Pfandbriefzentrale der schweizerischen Kantonalbanken AG 0.1% 12/3/2031 (b) | CHF | 795,000 | 843,100 |
| Pfandbriefzentrale der schweizerischen Kantonalbanken AG 0.5% 11/24/2028 (b) | CHF | 40,000 | 44,104 |
| UBS AG/Australia 5.808% 11/24/2028 (b) | AUD | 90,000 | 57,769 |
| | | | 1,955,731 |
| Capital Markets - 0.1% | | | |
| UBS AG/London 0.25% 9/1/2028 (b) | EUR | 390,000 | 366,644 |
| UBS Group AG 0.65% 1/14/2028 (b)(h) | EUR | 100,000 | 98,814 |
| UBS Group AG 1% 6/24/2027 (b)(h) | EUR | 150,000 | 151,120 |
| UBS Group AG 2.125% 11/15/2029 (b)(h) | GBP | 130,000 | 146,063 |
| UBS Group AG 2.875% 4/2/2032 (b)(h) | EUR | 270,000 | 272,271 |
| UBS Group AG 7.75% 3/1/2029 (b)(h) | EUR | 260,000 | 306,767 |
| | | | 1,341,679 |
| Financial Services - 0.3% | | | |
| Pfandbriefbank schweizerischer Hypothekarinstitute AG 0% 10/26/2029 (b) | CHF | 50,000 | 53,690 |
| Pfandbriefbank schweizerischer Hypothekarinstitute AG 0% 8/26/2049 (b) | CHF | 520,000 | 468,805 |
| Pfandbriefbank schweizerischer Hypothekarinstitute AG 0.125% 12/19/2031 (b) | CHF | 1,270,000 | 1,350,263 |
| | | | 1,872,758 |
| Insurance - 0.0% | | | |
| Argentum Netherlands BV for Zurich Insurance Co Ltd 2.75% 2/19/2049 (b)(h) | EUR | 120,000 | 121,008 |
| Zurich Finance Ireland Designated Activity Co 1.625% 6/17/2039 (b) | EUR | 100,000 | 82,924 |
| | | | 203,932 |
TOTAL FINANCIALS | | | 5,374,100 |
| | | | |
| Industrials - 0.0% | | | |
| Building Products - 0.0% | | | |
| ABB Finance BV 0% 1/19/2030 (b) | EUR | 130,000 | 116,780 |
| Materials - 0.0% | | | |
| Construction Materials - 0.0% | | | |
| Holcim Finance Luxembourg SA 0.5% 4/23/2031 (b) | EUR | 130,000 | 113,620 |
| TOTAL SWITZERLAND | | | 6,011,717 |
| UNITED KINGDOM - 1.5% | | | |
| Communication Services - 0.1% | | | |
| Diversified Telecommunication Services - 0.0% | | | |
| British Telecommunications PLC 3.75% 5/13/2031 (b) | EUR | 170,000 | 181,693 |
| Media - 0.0% | | | |
| WPP Finance SA 4.125% 5/30/2028 (b) | EUR | 170,000 | 183,186 |
| Wireless Telecommunication Services - 0.1% | | | |
| CK Hutchison Group Telecom Finance SA 1.125% 10/17/2028 (b) | EUR | 100,000 | 95,478 |
| Vodafone International Financing DAC 3.75% 12/2/2034 (b) | EUR | 330,000 | 352,236 |
| | | | 447,714 |
TOTAL COMMUNICATION SERVICES | | | 812,593 |
| | | | |
| Consumer Staples - 0.1% | | | |
| Beverages - 0.0% | | | |
| CCEP Finance Ireland DAC 0.875% 5/6/2033 (b) | EUR | 110,000 | 94,050 |
| Diageo Finance PLC 3.125% 2/28/2031 (b) | EUR | 270,000 | 281,270 |
| | | | 375,320 |
| Household Products - 0.0% | | | |
| Reckitt Benckiser Treasury Services Nederland BV 0.75% 5/19/2030 (b) | EUR | 110,000 | 101,672 |
| Personal Care Products - 0.0% | | | |
| Unilever Finance Netherlands BV 3.5% 2/15/2037 (b) | EUR | 170,000 | 179,417 |
| Tobacco - 0.1% | | | |
| BAT International Finance PLC 2.25% 6/26/2028 (b) | GBP | 240,000 | 273,015 |
| BAT Netherlands Finance BV 3.125% 4/7/2028 (b) | EUR | 100,000 | 104,493 |
| BAT Netherlands Finance BV 5.375% 2/16/2031 (b) | EUR | 110,000 | 125,002 |
| | | | 502,510 |
TOTAL CONSUMER STAPLES | | | 1,158,919 |
| | | | |
| Financials - 0.8% | | | |
| Banks - 0.5% | | | |
| Barclays PLC 0.577% 8/9/2029 (b)(h) | EUR | 300,000 | 283,758 |
| Barclays PLC 1.106% 5/12/2032 (b)(h) | EUR | 110,000 | 98,757 |
| Barclays PLC 1.125% 3/22/2031 (b)(h) | EUR | 230,000 | 232,184 |
| Barclays PLC 3.25% 1/17/2033 | GBP | 299,000 | 317,565 |
| HSBC Holdings PLC 3% 5/29/2030 (h) | GBP | 130,000 | 148,281 |
| HSBC Holdings PLC 3% 7/22/2028 (h) | GBP | 110,000 | 130,729 |
| HSBC Holdings PLC 3.755% 5/20/2029 (b)(h) | EUR | 210,000 | 221,730 |
| HSBC Holdings PLC 6.364% 11/16/2032 (b)(h) | EUR | 270,000 | 301,027 |
| HSBC Holdings PLC 8.201% 11/16/2034 (b)(h) | GBP | 150,000 | 205,602 |
| Lloyds Bank PLC 0.125% 9/23/2029 (b) | EUR | 100,000 | 91,864 |
| Lloyds Banking Group PLC 1.985% 12/15/2031 (h) | GBP | 104,000 | 122,577 |
| Lloyds Banking Group PLC 2% 4/12/2028 (b)(h) | GBP | 140,000 | 163,808 |
| Lloyds Banking Group PLC 3.5% 11/6/2030 (b)(h) | EUR | 210,000 | 220,023 |
| Lloyds Banking Group PLC 3.5% 4/1/2026 (b)(h) | EUR | 404,000 | 418,860 |
| Lloyds Banking Group PLC 5.802% 3/17/2029 (h) | AUD | 100,000 | 63,032 |
| NatWest Group PLC 1.75% 3/2/2026 (b)(h) | EUR | 110,000 | 113,695 |
| NatWest Group PLC 3.622% 8/14/2030 (b)(h) | GBP | 411,000 | 510,048 |
| NatWest Group PLC 4.771% 2/16/2029 (b)(h) | EUR | 120,000 | 130,560 |
| NatWest Markets PLC 6.375% 11/8/2027 (b) | GBP | 280,000 | 363,449 |
| Santander UK Group Holdings PLC 7.098% 11/16/2027 (b)(h) | GBP | 110,000 | 141,983 |
| Santander UK PLC 0.05% 1/12/2027 (b) | EUR | 200,000 | 197,053 |
| Standard Chartered PLC 0.8% 11/17/2029 (b)(h) | EUR | 110,000 | 103,935 |
| Standard Chartered PLC 0.85% 1/27/2028 (b)(h) | EUR | 107,000 | 106,133 |
| Standard Chartered PLC 2.5% 9/9/2030 (b)(h) | EUR | 130,000 | 133,823 |
| | | | 4,820,476 |
| Capital Markets - 0.0% | | | |
| London Stock Exchange Group PLC 1.75% 9/19/2029 (b) | EUR | 110,000 | 108,307 |
| Consumer Finance - 0.0% | | | |
| Motability Operations Group PLC 1.5% 1/20/2041 (b) | GBP | 220,000 | 155,305 |
| Motability Operations Group PLC 3.5% 7/17/2031 (b) | EUR | 200,000 | 209,694 |
| | | | 364,999 |
| Financial Services - 0.2% | | | |
| Clarion Funding PLC 1.25% 11/13/2032 (b) | GBP | 120,000 | 111,053 |
| LCR Finance PLC 5.1% 3/7/2051 | GBP | 93,000 | 113,581 |
| M&G PLC 5.625% 10/20/2051 (b)(h) | GBP | 104,000 | 124,726 |
| Nationwide Building Society 0.625% 3/25/2027 (b) | EUR | 903,000 | 898,313 |
| Nationwide Building Society 6.178% 12/7/2027 (b)(h) | GBP | 110,000 | 140,763 |
| | | | 1,388,436 |
| Insurance - 0.1% | | | |
| Aviva PLC 6.875% 11/27/2053 (b)(h) | GBP | 100,000 | 129,592 |
| Legal & General Group PLC 5.125% 11/14/2048 (b)(h) | GBP | 100,000 | 123,252 |
| Pension Insurance Corp PLC 5.625% 9/20/2030 (b) | GBP | 100,000 | 120,923 |
| Phoenix Group Holdings PLC 5.867% 6/13/2029 (b) | GBP | 100,000 | 124,717 |
| | | | 498,484 |
TOTAL FINANCIALS | | | 7,180,702 |
| | | | |
| Health Care - 0.0% | | | |
| Pharmaceuticals - 0.0% | | | |
| GlaxoSmithKline Capital PLC 1.625% 5/12/2035 (b) | GBP | 140,000 | 125,738 |
| Industrials - 0.1% | | | |
| Commercial Services & Supplies - 0.0% | | | |
| AA Bond Co Ltd 7.375% 7/31/2050 (b) | GBP | 120,000 | 155,767 |
| AA Bond Co Ltd 8.45% 7/31/2050 (b) | GBP | 130,000 | 171,761 |
| | | | 327,528 |
| Transportation Infrastructure - 0.1% | | | |
| Gatwick Funding Ltd 2.5% 4/15/2032 (b) | GBP | 220,000 | 242,153 |
| Heathrow Funding Ltd 2.625% 3/16/2028 (b) | GBP | 300,000 | 344,848 |
| Heathrow Funding Ltd 3.661% 1/13/2033 (b) | CAD | 215,000 | 144,775 |
| | | | 731,776 |
TOTAL INDUSTRIALS | | | 1,059,304 |
| | | | |
| Real Estate - 0.0% | | | |
| Real Estate Management & Development - 0.0% | | | |
| Land Securities Capital Markets PLC 2.375% 3/29/2029 (b) | GBP | 160,000 | 188,660 |
| London & Quadrant Housing Trust 2% 3/31/2032 (b) | GBP | 112,000 | 112,275 |
| Segro Capital Sarl 1.25% 3/23/2026 (b) | EUR | 160,000 | 162,796 |
| | | | 463,731 |
| Utilities - 0.4% | | | |
| Electric Utilities - 0.1% | | | |
| National Grid Electricity Distribution South West PLC 2.375% 5/16/2029 (b) | GBP | 250,000 | 281,339 |
| National Grid Electricity Transmission PLC 0.19% 1/20/2025 (b) | EUR | 160,000 | 165,505 |
| National Grid Electricity Transmission PLC 0.823% 7/7/2032 (b) | EUR | 140,000 | 121,524 |
| National Grid Electricity Transmission PLC 1.375% 9/16/2026 (b) | GBP | 200,000 | 236,005 |
| NIE Finance PLC 2.5% 10/27/2025 (b) | GBP | 200,000 | 245,129 |
| South Eastern Power Networks PLC 1.75% 9/30/2034 (b) | GBP | 100,000 | 91,513 |
| | | | 1,141,015 |
| Multi-Utilities - 0.1% | | | |
| Cadent Finance PLC 3.125% 3/21/2040 (b) | GBP | 100,000 | 88,760 |
| National Grid PLC 0.163% 1/20/2028 (b) | EUR | 220,000 | 209,791 |
| National Grid PLC 0.25% 9/1/2028 (b) | EUR | 130,000 | 122,182 |
| National Grid PLC 2.179% 6/30/2026 (b) | EUR | 430,000 | 441,941 |
| | | | 862,674 |
| Water Utilities - 0.2% | | | |
| Anglian Water Services Financing PLC 1.625% 8/10/2025 (b) | GBP | 240,000 | 293,500 |
| Northumbrian Water Finance PLC 5.5% 10/2/2037 (b) | GBP | 100,000 | 118,671 |
| Severn Trent Utilities Finance PLC 2.625% 2/22/2033 (b) | GBP | 100,000 | 102,325 |
| Severn Trent Utilities Finance PLC 4.625% 11/30/2034 (b) | GBP | 100,000 | 116,831 |
| Southern Water Services Finance Ltd 1.625% 3/30/2027 (b) | GBP | 150,000 | 154,028 |
| Southern Water Services Finance Ltd 2.375% 5/28/2028 (b) | GBP | 200,000 | 203,487 |
| United Utilities Water Finance PLC 0.875% 10/28/2029 (b) | GBP | 200,000 | 206,814 |
| Yorkshire Water Finance PLC 1.75% 10/27/2032 (b) | GBP | 100,000 | 92,556 |
| | | | 1,288,212 |
TOTAL UTILITIES | | | 3,291,901 |
| | | | |
| TOTAL UNITED KINGDOM | | | 14,092,888 |
| UNITED STATES - 3.7% | | | |
| Communication Services - 0.6% | | | |
| Diversified Telecommunication Services - 0.6% | | | |
| AT&T Inc 0.25% 3/4/2026 | EUR | 100,000 | 100,675 |
| AT&T Inc 2.05% 5/19/2032 | EUR | 230,000 | 219,514 |
| AT&T Inc 2.9% 12/4/2026 | GBP | 2,720,000 | 3,283,835 |
| Verizon Communications Inc 1.125% 9/19/2035 | EUR | 100,000 | 81,515 |
| Verizon Communications Inc 1.3% 5/18/2033 | EUR | 120,000 | 105,816 |
| Verizon Communications Inc 2.1% 5/6/2026 (b) | AUD | 200,000 | 119,643 |
| Verizon Communications Inc 3.375% 10/27/2036 | GBP | 486,000 | 493,107 |
| | | | 4,404,105 |
| Entertainment - 0.0% | | | |
| Netflix Inc 3.625% 6/15/2030 (b) | EUR | 100,000 | 106,668 |
| Media - 0.0% | | | |
| Comcast Corp 1.875% 2/20/2036 | GBP | 405,000 | 360,536 |
TOTAL COMMUNICATION SERVICES | | | 4,871,309 |
| | | | |
| Consumer Discretionary - 0.1% | | | |
| Automobiles - 0.0% | | | |
| General Motors Financial Co Inc 3.9% 1/12/2028 (b) | EUR | 100,000 | 105,978 |
| Stellantis NV 2.75% 4/1/2032 (b) | EUR | 200,000 | 193,323 |
| | | | 299,301 |
| Hotels, Restaurants & Leisure - 0.0% | | | |
| Booking Holdings Inc 4.125% 5/12/2033 | EUR | 110,000 | 120,093 |
| Booking Holdings Inc 4.5% 11/15/2031 | EUR | 150,000 | 167,199 |
| McDonald's Corp 1.6% 3/15/2031 (b) | EUR | 200,000 | 190,160 |
| | | | 477,452 |
| Textiles, Apparel & Luxury Goods - 0.1% | | | |
| VF Corp 0.25% 2/25/2028 | EUR | 606,000 | 559,022 |
TOTAL CONSUMER DISCRETIONARY | | | 1,335,775 |
| | | | |
| Consumer Staples - 0.5% | | | |
| Beverages - 0.1% | | | |
| Coca-Cola Co/The 0.375% 3/15/2033 | EUR | 906,000 | 761,520 |
| Consumer Staples Distribution & Retail - 0.2% | | | |
| Mondelez International Holdings Netherlands BV 0.25% 9/9/2029 (b) | EUR | 140,000 | 128,066 |
| Mondelez International Holdings Netherlands BV 0.875% 10/1/2031 (b) | EUR | 110,000 | 97,593 |
| Nestle Finance International Ltd 0% 6/14/2026 (b) | EUR | 540,000 | 540,053 |
| Nestle Finance International Ltd 0.25% 6/14/2029 (b) | EUR | 120,000 | 112,200 |
| Nestle Finance International Ltd 1.25% 11/2/2029 (b) | EUR | 30,000 | 29,174 |
| Nestle Finance International Ltd 3.25% 1/23/2037 (b) | EUR | 190,000 | 194,849 |
| Nestle Holdings Inc 1.375% 6/23/2033 (b) | GBP | 120,000 | 114,652 |
| | | | 1,216,587 |
| Household Products - 0.1% | | | |
| Procter & Gamble Co/The 1.375% 5/3/2025 | GBP | 221,000 | 273,602 |
| Procter & Gamble Co/The 1.8% 5/3/2029 | GBP | 381,000 | 431,001 |
| | | | 704,603 |
| Tobacco - 0.1% | | | |
| Altria Group Inc 2.2% 6/15/2027 | EUR | 398,000 | 406,266 |
| Altria Group Inc 3.125% 6/15/2031 | EUR | 174,000 | 176,107 |
| Philip Morris International Inc 1.45% 8/1/2039 | EUR | 100,000 | 73,189 |
| Philip Morris International Inc 2% 5/9/2036 | EUR | 210,000 | 179,972 |
| | | | 835,534 |
TOTAL CONSUMER STAPLES | | | 3,518,244 |
| | | | |
| Energy - 0.1% | | | |
| Energy Equipment & Services - 0.0% | | | |
| Schlumberger Finance BV 2% 5/6/2032 (b) | EUR | 230,000 | 218,988 |
| Oil, Gas & Consumable Fuels - 0.1% | | | |
| BP Capital Markets BV 0.933% 12/4/2040 (b) | EUR | 290,000 | 195,486 |
| BP Capital Markets PLC 1.637% 6/26/2029 (b) | EUR | 100,000 | 98,077 |
| Shell International Finance BV 0.5% 11/8/2031 (b) | EUR | 310,000 | 271,249 |
| | | | 564,812 |
TOTAL ENERGY | | | 783,800 |
| | | | |
| Financials - 1.4% | | | |
| Banks - 0.3% | | | |
| Bank of America Corp 0.694% 3/22/2031 (b)(h) | EUR | 486,000 | 444,516 |
| Bank of America Corp 1.667% 6/2/2029 (b)(h) | GBP | 100,000 | 112,526 |
| Citigroup Inc 4.112% 9/22/2033 (b)(h) | EUR | 220,000 | 238,295 |
| JPMorgan Chase & Co 0.389% 2/24/2028 (b)(h) | EUR | 792,000 | 777,382 |
| JPMorgan Chase & Co 0.991% 4/28/2026 (b)(h) | GBP | 100,000 | 123,446 |
| JPMorgan Chase & Co 1.001% 7/25/2031 (b)(h) | EUR | 100,000 | 92,372 |
| JPMorgan Chase & Co 1.638% 5/18/2028 (b)(h) | EUR | 210,000 | 211,011 |
| Wells Fargo & Co 2.125% 9/24/2031 (b) | GBP | 350,000 | 365,564 |
| | | | 2,365,112 |
| Capital Markets - 0.1% | | | |
| Athene Global Funding 0.832% 1/8/2027 (b) | EUR | 140,000 | 139,133 |
| Goldman Sachs Group Inc/The 0.75% 3/23/2032 (b) | EUR | 170,000 | 147,478 |
| Goldman Sachs Group Inc/The 1% 3/18/2033 (b) | EUR | 70,000 | 60,870 |
| Goldman Sachs Group Inc/The 1.25% 2/7/2029 (b) | EUR | 50,000 | 48,305 |
| Goldman Sachs Group Inc/The 1.875% 12/16/2030 (b) | GBP | 100,000 | 104,675 |
| Goldman Sachs Group Inc/The 2% 11/1/2028 (b) | EUR | 51,000 | 51,103 |
| Goldman Sachs Group Inc/The 3.125% 7/25/2029 (b) | GBP | 27,000 | 31,300 |
| Morgan Stanley 0.495% 10/26/2029 (h) | EUR | 100,000 | 94,332 |
| Morgan Stanley 1.102% 4/29/2033 (h) | EUR | 243,000 | 214,737 |
| Morgan Stanley 5.789% 11/18/2033 (h) | GBP | 170,000 | 220,509 |
| Nasdaq Inc 0.875% 2/13/2030 | EUR | 100,000 | 93,056 |
| | | | 1,205,498 |
| Consumer Finance - 0.0% | | | |
| Ford Motor Credit Co LLC 2.33% 11/25/2025 | EUR | 100,000 | 102,964 |
| Ford Motor Credit Co LLC 6.125% 5/15/2028 | EUR | 130,000 | 145,616 |
| | | | 248,580 |
| Financial Services - 0.8% | | | |
| Berkshire Hathaway Inc 2.15% 3/15/2028 | EUR | 797,000 | 814,766 |
| CRH SMW Finance DAC 4% 7/11/2031 (b) | EUR | 120,000 | 130,520 |
| DH Europe Finance II Sarl 0.2% 3/18/2026 | EUR | 2,894,000 | 2,912,737 |
| DH Europe Finance II Sarl 0.75% 9/18/2031 | EUR | 456,000 | 407,024 |
| DH Europe Finance II Sarl 1.35% 9/18/2039 | EUR | 192,000 | 150,473 |
| Fidelity National Information Services Inc 1.5% 5/21/2027 | EUR | 758,000 | 761,713 |
| Fiserv Inc 2.25% 7/1/2025 | GBP | 925,000 | 1,141,535 |
| Upjohn Finance BV 1.362% 6/23/2027 (b) | EUR | 150,000 | 149,802 |
| | | | 6,468,570 |
| Insurance - 0.2% | | | |
| Chubb INA Holdings LLC 1.55% 3/15/2028 | EUR | 639,000 | 635,461 |
| Marsh & McLennan Cos Inc 1.349% 9/21/2026 | EUR | 768,000 | 776,907 |
| Metropolitan Life Global Funding I 0.5% 5/25/2029 (b) | EUR | 100,000 | 93,621 |
| Metropolitan Life Global Funding I 1.625% 10/12/2028 (b) | GBP | 110,000 | 123,029 |
| New York Life Global Funding 0.125% 7/23/2030 (b) | CHF | 215,000 | 228,139 |
| | | | 1,857,157 |
TOTAL FINANCIALS | | | 12,144,917 |
| | | | |
| Health Care - 0.3% | | | |
| Health Care Equipment & Supplies - 0.2% | | | |
| Becton Dickinson Euro Finance Sarl 1.208% 6/4/2026 | EUR | 1,553,000 | 1,576,132 |
| Medtronic Global Holdings SCA 0.25% 7/2/2025 | EUR | 100,000 | 102,283 |
| Medtronic Global Holdings SCA 1.75% 7/2/2049 | EUR | 227,000 | 160,092 |
| Thermo Fisher Scientific Finance I BV 1.625% 10/18/2041 | EUR | 150,000 | 114,193 |
| | | | 1,952,700 |
| Health Care Providers & Services - 0.1% | | | |
| McKesson Corp 3.125% 2/17/2029 | GBP | 573,000 | 670,458 |
| Life Sciences Tools & Services - 0.0% | | | |
| Thermo Fisher Scientific Inc 0.125% 3/1/2025 | EUR | 100,000 | 103,097 |
| Thermo Fisher Scientific Inc 1.875% 10/1/2049 | EUR | 106,000 | 76,280 |
| | | | 179,377 |
| Pharmaceuticals - 0.0% | | | |
| MSD Netherlands Capital BV 3.7% 5/30/2044 | EUR | 100,000 | 104,938 |
TOTAL HEALTH CARE | | | 2,907,473 |
| | | | |
| Industrials - 0.1% | | | |
| Aerospace & Defense - 0.0% | | | |
| GE Aerospace 2.125% 5/17/2037 | EUR | 230,000 | 202,533 |
| Air Freight & Logistics - 0.1% | | | |
| FedEx Corp 0.95% 5/4/2033 | EUR | 371,000 | 316,683 |
| Building Products - 0.0% | | | |
| Whirlpool EMEA Finance Sarl 0.5% 2/20/2028 | EUR | 170,000 | 160,885 |
| Electrical Equipment - 0.0% | | | |
| Schneider Electric SE 3% 1/10/2031 (b) | EUR | 300,000 | 312,977 |
| Industrial Conglomerates - 0.0% | | | |
| Honeywell International Inc 0.75% 3/10/2032 | EUR | 150,000 | 132,077 |
| Machinery - 0.0% | | | |
| Illinois Tool Works Inc 1% 6/5/2031 | EUR | 100,000 | 91,749 |
TOTAL INDUSTRIALS | | | 1,216,904 |
| | | | |
| Information Technology - 0.2% | | | |
| IT Services - 0.1% | | | |
| DXC Technology Co 1.75% 1/15/2026 | EUR | 914,000 | 934,609 |
| IBM Corporation 1.2% 2/11/2040 | EUR | 272,000 | 202,721 |
| | | | 1,137,330 |
| Technology Hardware, Storage & Peripherals - 0.1% | | | |
| Apple Inc 0.5% 11/15/2031 | EUR | 911,000 | 817,256 |
TOTAL INFORMATION TECHNOLOGY | | | 1,954,586 |
| | | | |
| Materials - 0.2% | | | |
| Chemicals - 0.2% | | | |
| Air Products and Chemicals Inc 0.5% 5/5/2028 | EUR | 1,223,000 | 1,176,638 |
| Dow Chemical Co/The 1.875% 3/15/2040 | EUR | 232,000 | 184,059 |
| Linde PLC 0.375% 9/30/2033 (b) | EUR | 200,000 | 164,308 |
| PPG Industries Inc 0.875% 11/3/2025 | EUR | 744,000 | 757,773 |
| | | | 2,282,778 |
| Real Estate - 0.2% | | | |
| Diversified REITs - 0.0% | | | |
| Digital Dutch Finco BV 1.5% 3/15/2030 (b) | EUR | 100,000 | 94,521 |
| Digital Intrepid Holding BV 0.625% 7/15/2031 (b) | EUR | 100,000 | 86,373 |
| WPC Eurobond BV 2.25% 4/9/2026 | EUR | 110,000 | 113,104 |
| | | | 293,998 |
| Industrial REITs - 0.2% | | | |
| Prologis Euro Finance LLC 1.875% 1/5/2029 | EUR | 200,000 | 199,048 |
| Prologis LP 2.25% 6/30/2029 | GBP | 619,000 | 698,433 |
| | | | 897,481 |
| Retail REITs - 0.0% | | | |
| Realty Income Corp 1.75% 7/13/2033 | GBP | 413,000 | 388,097 |
| Specialized REITs - 0.0% | | | |
| American Tower Corp 1% 1/15/2032 | EUR | 140,000 | 123,247 |
| Public Storage Operating Co 0.875% 1/24/2032 | EUR | 245,000 | 216,238 |
| | | | 339,485 |
TOTAL REAL ESTATE | | | 1,919,061 |
| | | | |
| Utilities - 0.0% | | | |
| Electric Utilities - 0.0% | | | |
| Duke Energy Corp 3.1% 6/15/2028 | EUR | 100,000 | 103,806 |
| TOTAL UNITED STATES | | | 33,038,653 |
| TOTAL NON-CONVERTIBLE CORPORATE BONDS (Cost $287,099,716) | | | 265,052,952 |
| | | | |
| Preferred Securities - 0.3% |
| | | Principal Amount (a) | Value ($) |
| FRANCE - 0.3% | | | |
| Energy - 0.0% | | | |
| Oil, Gas & Consumable Fuels - 0.0% | | | |
| TotalEnergies SE 2% (b)(h)(i) | EUR | 120,000 | 121,602 |
| TotalEnergies SE 2.125% (b)(h)(i) | EUR | 160,000 | 146,714 |
| | | | 268,316 |
| Utilities - 0.3% | | | |
| Multi-Utilities - 0.3% | | | |
| Engie SA 1.5% (b)(h)(i) | EUR | 300,000 | 287,290 |
| Engie SA 1.625% (b)(h)(i) | EUR | 1,300,000 | 1,342,093 |
| Veolia Environnement SA 1.625% (b)(h)(i) | EUR | 100,000 | 100,484 |
| | | | 1,729,867 |
| TOTAL FRANCE | | | 1,998,183 |
| GERMANY - 0.0% | | | |
| Consumer Discretionary - 0.0% | | | |
| Automobiles - 0.0% | | | |
| Volkswagen International Finance NV 4.625% (b)(h)(i) | EUR | 200,000 | 208,466 |
| ITALY - 0.0% | | | |
| Energy - 0.0% | | | |
| Oil, Gas & Consumable Fuels - 0.0% | | | |
| Eni SpA 3.375% (b)(h)(i) | EUR | 110,000 | 111,253 |
| Utilities - 0.0% | | | |
| Electric Utilities - 0.0% | | | |
| Enel SpA 1.375% (b)(h)(i) | EUR | 150,000 | 146,486 |
| Enel SpA 6.375% (b)(h)(i) | EUR | 100,000 | 114,178 |
| | | | 260,664 |
| TOTAL ITALY | | | 371,917 |
| SPAIN - 0.0% | | | |
| Energy - 0.0% | | | |
| Oil, Gas & Consumable Fuels - 0.0% | | | |
| Repsol International Finance BV 4.247% (b)(h)(i) | EUR | 100,000 | 105,419 |
| Utilities - 0.0% | | | |
| Electric Utilities - 0.0% | | | |
| Iberdrola Finanzas SA 1.575% (b)(h)(i) | EUR | 100,000 | 97,800 |
| Iberdrola International BV 1.825% (b)(h)(i) | EUR | 100,000 | 95,760 |
| Iberdrola International BV 3.25% (b)(h)(i) | EUR | 100,000 | 106,439 |
| | | | 299,999 |
| TOTAL SPAIN | | | 405,418 |
| UNITED KINGDOM - 0.0% | | | |
| Utilities - 0.0% | | | |
| Electric Utilities - 0.0% | | | |
| SSE PLC 3.74% (b)(h)(i) | GBP | 216,000 | 271,566 |
| TOTAL PREFERRED SECURITIES (Cost $3,137,670) | | | 3,255,550 |
| | | | |
| Money Market Funds - 0.6% |
| | | Yield (%) | Shares | Value ($) |
Fidelity Cash Central Fund (j) (Cost $5,113,906) | | 4.36 | 5,112,884 | 5,113,906 |
| | | | | |
| TOTAL INVESTMENT IN SECURITIES - 98.9% (Cost $1,013,613,814) | 906,686,546 |
NET OTHER ASSETS (LIABILITIES) - 1.1% | 10,392,757 |
| NET ASSETS - 100.0% | 917,079,303 |
| | |
| Futures Contracts |
| | Number of contracts | Expiration Date | Notional Amount ($) | Value ($) | Unrealized Appreciation/ (Depreciation) ($) |
| Purchased | | | | | |
| | | | | | |
| Interest Rate Contracts | | | | | |
| Eurex Euro-Bobl Contracts (Germany) | 21 | Mar 2025 | 2,563,791 | (31,252) | (31,252) |
| ICE Long Gilt Contracts (United Kingdom) | 9 | Mar 2025 | 1,041,193 | (23,847) | (23,847) |
| | | | | | |
| TOTAL FUTURES CONTRACTS | | | | | (55,099) |
| The notional amount of futures purchased as a percentage of Net Assets is 0.4% |
| Forward Foreign Currency Contracts |
Currency Purchased
| Currency Sold | Counterparty | Settlement Date | Unrealized Appreciation/ (Depreciation) ($) |
| | | | | | | |
| USD | 974,949 | CZK | 23,476,000 | BNP Paribas SA | 1/08/25 | 9,892 |
| USD | 136,302,089 | CNH | 986,500,000 | Bank of America NA | 1/08/25 | 1,846,588 |
| USD | 1,176,112 | EUR | 1,127,000 | Bank of America NA | 1/08/25 | 8,470 |
| USD | 2,449,777 | NZD | 4,149,000 | Bank of America NA | 1/08/25 | 128,337 |
| GBP | 307,000 | USD | 387,464 | Brown Brothers Harriman & Co | 1/08/25 | (3,147) |
| CZK | 213,000 | USD | 8,935 | State Street Bank & Trust Co | 1/08/25 | (179) |
| USD | 2,560,082 | COP | 11,304,300,000 | State Street Bank & Trust Co | 1/08/25 | (4,004) |
| EUR | 682,000 | USD | 716,575 | HSBC BANK USA | 1/08/25 | (9,981) |
| USD | 464,575 | JPY | 72,950,000 | Bank of America NA | 1/08/25 | 660 |
| USD | 515,568 | PLN | 2,111,000 | Brown Brothers Harriman & Co | 1/08/25 | 4,546 |
| USD | 87,474,991 | JPY | 13,160,000,000 | JPMorgan Chase Bank NA | 1/08/25 | 3,785,760 |
| GBP | 1,034,000 | USD | 1,295,580 | Royal Bank of Canada | 1/08/25 | (1,172) |
| USD | 18,553,934 | KRW | 25,771,600,000 | BNP Paribas SA | 1/08/25 | 1,117,514 |
| USD | 3,879,946 | EUR | 3,668,000 | Bank of America NA | 1/08/25 | 79,670 |
| USD | 21,220 | CAD | 30,512 | Brown Brothers Harriman & Co | 1/02/25 | (6) |
| USD | 883,110 | JPY | 131,650,000 | Brown Brothers Harriman & Co | 1/08/25 | 45,899 |
| USD | 1,281,497 | EUR | 1,232,000 | Citibank NA | 1/08/25 | 5,068 |
| USD | 23,240,069 | CNH | 168,200,000 | JPMorgan Chase Bank NA | 1/08/25 | 315,168 |
| USD | 166,994 | JPY | 26,050,000 | JPMorgan Chase Bank NA | 1/08/25 | 1,333 |
| USD | 5,655,366 | MXN | 117,977,000 | Royal Bank of Canada | 1/08/25 | 2,508 |
| USD | 23,890,760 | AUD | 36,796,000 | HSBC BANK USA | 1/08/25 | 1,115,784 |
| USD | 1,042,543 | HUF | 407,997,000 | HSBC BANK USA | 1/08/25 | 15,599 |
| AUD | 116,000 | USD | 72,355 | Bank of America NA | 1/08/25 | (557) |
| USD | 3,116,508 | CNH | 22,844,000 | Bank of America NA | 1/08/25 | 2,973 |
| USD | 2,390,253 | CZK | 57,194,000 | Bank of America NA | 1/08/25 | 39,108 |
| USD | 1,196,417 | EUR | 1,129,000 | Bank of America NA | 1/08/25 | 26,703 |
| USD | 13,457 | HUF | 5,339,000 | Bank of America NA | 1/08/25 | 19 |
| CAD | 1,296,000 | USD | 916,758 | Brown Brothers Harriman & Co | 1/08/25 | (14,989) |
| CAD | 150,000 | USD | 104,366 | Brown Brothers Harriman & Co | 1/08/25 | 5 |
| CAD | 395,000 | USD | 274,772 | Brown Brothers Harriman & Co | 1/08/25 | 72 |
| USD | 361,178 | JPY | 53,950,000 | Citibank NA | 1/08/25 | 18,090 |
| CNY | 6,557,918 | USD | 894,390 | Citibank NA | 1/08/25 | 4,386 |
| USD | 1,183,108 | PEN | 4,446,000 | Goldman Sachs Bank USA | 1/08/25 | (53) |
| NZD | 339,000 | USD | 195,242 | HSBC BANK USA | 1/08/25 | (5,566) |
| USD | 8,166,845 | CHF | 7,170,000 | HSBC BANK USA | 1/08/25 | 261,845 |
| USD | 382,108,989 | EUR | 360,538,000 | HSBC BANK USA | 1/08/25 | 8,569,236 |
| EUR | 93,000 | USD | 97,632 | Bank of America NA | 1/08/25 | (1,278) |
| SEK | 338,000 | USD | 30,735 | Bank of America NA | 1/08/25 | (177) |
| USD | 31,863,778 | EUR | 30,391,000 | Bank of America NA | 1/08/25 | 376,815 |
| USD | 5,173,812 | JPY | 774,100,000 | Bank of America NA | 1/08/25 | 251,028 |
| CAD | 131,000 | USD | 92,088 | Brown Brothers Harriman & Co | 1/08/25 | (937) |
| USD | 634,963 | MXN | 13,078,000 | Brown Brothers Harriman & Co | 1/08/25 | 8,331 |
| USD | 12,792,369 | CNH | 92,590,000 | JPMorgan Chase Bank NA | 1/08/25 | 172,769 |
| USD | 114,424 | HKD | 890,000 | JPMorgan Chase Bank NA | 1/08/25 | (174) |
| USD | 5,429,602 | CNH | 39,300,000 | Goldman Sachs Bank USA | 1/08/25 | 73,189 |
| USD | 6,953,936 | MYR | 30,872,000 | Goldman Sachs Bank USA | 1/08/25 | 48,335 |
| USD | 3,318,210 | SGD | 4,438,000 | State Street Bank & Trust Co | 1/08/25 | 67,769 |
| USD | 7,130,694 | IDR | 113,430,800,000 | BNP Paribas SA | 1/08/25 | 84,373 |
| USD | 1,818,748 | AUD | 2,819,000 | Bank of America NA | 1/08/25 | 73,921 |
| USD | 311,148 | CHF | 275,000 | Bank of America NA | 1/08/25 | 7,958 |
| USD | 9,029,800 | CNH | 66,360,000 | Bank of America NA | 1/08/25 | (14,769) |
| USD | 152,121 | GBP | 121,000 | Bank of America NA | 1/08/25 | 648 |
| USD | 2,116 | HUF | 839,300 | Bank of America NA | 1/02/25 | 3 |
| USD | 1,628,121 | ILS | 5,953,000 | Bank of America NA | 1/08/25 | (9,553) |
| CNY | 11,677,123 | USD | 1,591,980 | Citibank NA | 1/08/25 | 8,394 |
| USD | 850,093 | NZD | 1,448,000 | HSBC BANK USA | 1/08/25 | 39,911 |
| USD | 2,148,980 | RON | 10,148,000 | BNP Paribas SA | 1/08/25 | 36,939 |
| EUR | 4,670,000 | USD | 4,848,357 | Bank of America NA | 1/08/25 | (9,947) |
| USD | 107,760 | AUD | 167,000 | Bank of America NA | 1/08/25 | 4,395 |
| USD | 35,291 | EUR | 34,000 | Bank of America NA | 1/02/25 | 72 |
| USD | 4,510,618 | GBP | 3,554,000 | Bank of America NA | 1/08/25 | 61,561 |
| USD | 7,507,335 | SEK | 81,775,000 | Bank of America NA | 1/08/25 | 114,126 |
| USD | 4,034,195 | PLN | 16,490,000 | Brown Brothers Harriman & Co | 1/08/25 | 42,369 |
| USD | 5,992,329 | THB | 206,226,000 | JPMorgan Chase Bank NA | 1/08/25 | (15,934) |
| USD | 699,380 | CLP | 682,665,000 | Goldman Sachs Bank USA | 1/08/25 | 12,992 |
| USD | 1,524,650 | KRW | 2,133,900,000 | State Street Bank & Trust Co | 1/08/25 | 80,907 |
| MXN | 2,899,000 | USD | 143,376 | HSBC BANK USA | 1/08/25 | (4,471) |
| USD | 3,193,333 | CAD | 4,489,000 | HSBC BANK USA | 1/08/25 | 69,845 |
| USD | 285,248 | CAD | 400,000 | HSBC BANK USA | 1/08/25 | 6,925 |
| USD | 1,701,902 | NOK | 18,801,000 | HSBC BANK USA | 1/08/25 | 50,306 |
| GBP | 272,000 | USD | 346,492 | Bank of America NA | 1/08/25 | (5,990) |
| CNY | 48,126,090 | USD | 6,564,080 | Citibank NA | 1/08/25 | 31,700 |
| USD | 42,311,417 | CAD | 59,196,000 | JPMorgan Chase Bank NA | 1/08/25 | 1,122,279 |
| USD | 2,330,783 | DKK | 16,422,000 | HSBC BANK USA | 1/08/25 | 49,092 |
| USD | 59,308,620 | GBP | 46,740,000 | HSBC BANK USA | 1/08/25 | 797,377 |
| | | | | | | |
| TOTAL FORWARD FOREIGN CURRENCY CONTRACTS | | 20,996,678 |
| Unrealized Appreciation | | | 21,099,562 |
| Unrealized Depreciation | | | (102,884) |
Currency Abbreviations
| AUD | - | Australian Dollar |
| CAD | - | Canadian Dollar |
| CHF | - | Swiss Franc |
| CLP | - | Chilean Peso |
| CNH | - | Chinese Offshore Currency |
| CNY | - | Chinese (Peoples Rep) Yuan |
| COP | - | Colombian Peso |
| CZK | - | Czech Koruna |
| DKK | - | Danish Kronen |
| EUR | - | European Monetary Unit (Euro) |
| GBP | - | United Kingdom Pound |
| HKD | - | Hong Kong Dollar |
| HUF | - | Hungarian Forint |
| IDR | - | Indonesia Rupiatt |
| ILS | - | Israel Sheckel |
| JPY | - | Japanese Yen |
| KRW | - | Korean Won |
| MXN | - | Mexican Peso |
| MYR | - | Malaysian Ringet |
| NOK | - | Norwegian Krona |
| NZD | - | New Zealand Dollar |
| PEN | - | Peruvian New Sol |
| PLN | - | Polish Zloty |
| RON | - | Romanian Leu |
| RUB | - | Russian Ruble |
| SEK | - | Swedish Krona |
| SGD | - | Singapore Dollar |
| THB | - | Thailand Baht |
| USD | - | United States Dollar |
Legend
| (a) | Amount is stated in United States dollars unless otherwise noted. |
| (b) | Security is exempt from registration under Regulation S of the Securities Act of 1933 and may be resold to qualified foreign investors outside of the United States. At the end of the period, the value of securities amounted to $456,258,846 or 49.8% of net assets. |
| (c) | Security exempt from registration under Rule 144A of the Securities Act of 1933. These securities may be resold in transactions exempt from registration, normally to qualified institutional buyers. At the end of the period, the value of these securities amounted to $133,455,327 or 14.6% of net assets. |
| (d) | Security or a portion of the security was pledged to cover margin requirements for futures contracts. At period end, the value of securities pledged amounted to $70,176. |
| (e) | Security initially issued at one coupon which converts to a higher coupon at a specified date. The rate shown is the rate at period end. |
| (g) | Non-income producing - Security is in default. |
| (h) | Coupon rates for floating and adjustable rate securities reflect the rates in effect at period end. |
| (i) | Security is perpetual in nature with no stated maturity date. |
| (j) | Affiliated fund that is generally available only to investment companies and other accounts managed by Fidelity Investments. The rate quoted is the annualized seven-day yield of the fund at period end. A complete unaudited listing of the fund's holdings as of its most recent quarter end is available upon request. In addition, each Fidelity Central Fund's financial statements, which are not covered by the Fund's Report of Independent Registered Public Accounting Firm, are available on the SEC's website or upon request. |
Affiliated Central Funds
Fiscal year to date information regarding the Fund's investments in Fidelity Central Funds, including the ownership percentage, is presented below.
| Affiliate | Value, beginning of period ($) | Purchases ($) | Sales Proceeds ($) | Dividend Income ($) | Realized Gain (loss) ($) | Change in Unrealized appreciation (depreciation) ($) | Value, end of period ($) | Shares, end of period | % ownership, end of period |
| Fidelity Cash Central Fund | 20,006,063 | 182,836,031 | 197,728,833 | 203,134 | 645 | - | 5,113,906 | 5,112,884 | 0.0% |
| Total | 20,006,063 | 182,836,031 | 197,728,833 | 203,134 | 645 | - | 5,113,906 | 5,112,884 | |
| | | | | | | | | | |
Amounts in the dividend income column in the above table include any capital gain distributions from underlying funds, which are presented in the corresponding line item in the Statement of Operations, if applicable.
Amounts included in the purchases and sales proceeds columns may include in-kind transactions, if applicable.
Investment Valuation
The following is a summary of the inputs used, as of December 31, 2024, involving the Fund's assets and liabilities carried at fair value. The inputs or methodology used for valuing securities may not be an indication of the risk associated with investing in those securities. For more information on valuation inputs, and their aggregation into the levels used below, please refer to the Investment Valuation section in the accompanying Notes to Financial Statements.
| Valuation Inputs at Reporting Date: |
| Description | Total ($) | Level 1 ($) | Level 2 ($) | Level 3 ($) |
Investments in Securities: | | | | |
|
| Foreign Government and Government Agency Obligations | 633,264,138 | - | 633,264,138 | - |
|
| Non-Convertible Corporate Bonds | | | | |
Communication Services | 10,938,653 | - | 10,938,653 | - |
Consumer Discretionary | 4,137,363 | - | 4,137,363 | - |
Consumer Staples | 5,982,095 | - | 5,982,095 | - |
Energy | 4,449,809 | - | 4,449,809 | - |
Financials | 193,365,128 | - | 193,365,128 | - |
Health Care | 3,534,435 | - | 3,534,435 | - |
Industrials | 12,547,228 | - | 12,547,228 | - |
Information Technology | 2,442,990 | - | 2,442,990 | - |
Materials | 3,165,075 | - | 3,165,075 | - |
Real Estate | 7,965,291 | - | 7,965,291 | - |
Utilities | 16,524,885 | - | 16,524,885 | - |
|
| Preferred Securities | | | | |
Consumer Discretionary | 208,466 | - | 208,466 | - |
Energy | 484,988 | - | 484,988 | - |
Utilities | 2,562,096 | - | 2,562,096 | - |
|
| Money Market Funds | 5,113,906 | 5,113,906 | - | - |
| Total Investments in Securities: | 906,686,546 | 5,113,906 | 901,572,640 | - |
Derivative Instruments: Assets | | | | |
Forward Foreign Currency Contracts | 21,099,562 | - | 21,099,562 | - |
| Total Assets | 21,099,562 | - | 21,099,562 | - |
| Liabilities | | | | |
Futures Contracts | (55,099) | (55,099) | - | - |
Forward Foreign Currency Contracts | (102,884) | - | (102,884) | - |
| Total Liabilities | (157,983) | (55,099) | (102,884) | - |
| Total Derivative Instruments: | 20,941,579 | (55,099) | 20,996,678 | - |
Value of Derivative Instruments
The following table is a summary of the Fund's value of derivative instruments by primary risk exposure as of December 31, 2024. For additional information on derivative instruments, please refer to the Derivative Instruments section in the accompanying Notes to Financial Statements.
Primary Risk Exposure / Derivative Type | Value |
| Asset ($) | Liability ($) |
| Foreign Exchange Risk | | |
Forward Foreign Currency Contracts (a) | 21,099,562 | (102,884) |
| Total Foreign Exchange Risk | 21,099,562 | (102,884) |
| Interest Rate Risk | | |
Futures Contracts (b) | 0 | (55,099) |
| Total Interest Rate Risk | 0 | (55,099) |
| Total Value of Derivatives | 21,099,562 | (157,983) |
(a)Gross value is presented in the Statement of Assets and Liabilities in the unrealized appreciation/depreciation on forward foreign currency contracts line-items.
(b)Reflects gross cumulative appreciation (depreciation) on futures contracts as presented in the Schedule of Investments. In the Statement of Assets and Liabilities, the period end daily variation margin is included in receivable or payable for daily variation margin on futures contracts, and the net cumulative appreciation (depreciation) is included in Total accumulated earnings (loss).
The following table is a summary of the Fund's derivatives inclusive of potential netting arrangements.
| | | | | | | | | | | |
| Counterparty | | Value of Derivative Assets ($) | | Value of Derivative Liabilities ($) | | Collateral Received(a) ($) | | Collateral Pledged(a) ($) | | Net(b) ($) |
| Bank of America NA | | 3,023,055 | | (42,271) | | (2,250,079) | | - | | 730,705 |
| BNP Paribas SA | | 1,248,718 | | - | | (1,248,718) | | - | | - |
| Brown Brothers Harriman & Co | | 101,222 | | (19,079) | | - | | - | | 82,143 |
| Citibank NA | | 67,638 | | - | | - | | - | | 67,638 |
| Goldman Sachs Bank USA | | 134,516 | | (53) | | - | | - | | 134,463 |
| HSBC Bank | | 10,975,920 | | (20,018) | | (9,100,000) | | - | | 1,855,902 |
| JPMorgan Chase Bank NA | | 5,397,309 | | (16,108) | | (5,299,784) | | - | | 81,417 |
| Royal Bank of Canada | | 2,508 | | (1,172) | | - | | - | | 1,336 |
| State Street Bank & Trust Co | | 148,676 | | (4,183) | | (52,459) | | - | | 92,034 |
| Total | $ | 21,099,562 | $ | (102,884) | $ | (17,951,040) | $ | - | $ | 3,045,638 |
| | | | | | | | | | | |
(a) Reflects collateral received from or pledged to an individual counterparty, excluding any excess or initial collateral amounts.
(b) Net represents the receivable / (payable) that would be due from / (to) the counterparty in an event of default. Netting may be allowed across transactions traded under the same legal agreement with the same legal entity. Please refer to Derivative Instruments - Risk Exposures and the Use of Derivative Instruments section in the accompanying Notes to Financial Statements.
Financial Statements
| Statement of Assets and Liabilities |
As of December 31, 2024 |
| Assets | | | | |
| Investment in securities, at value - See accompanying schedule: | | | | |
Unaffiliated issuers (cost $1,008,499,908) | $ | 901,572,640 | | |
Fidelity Central Funds (cost $5,113,906) | | 5,113,906 | | |
| | | | | |
| | | | | |
| Total Investment in Securities (cost $1,013,613,814) | | | $ | 906,686,546 |
| Foreign currency held at value (cost $118,571) | | | | 118,018 |
| Unrealized appreciation on forward foreign currency contracts | | | | 21,099,562 |
| Receivable for fund shares sold | | | | 4,901,242 |
| Dividends receivable | | | | 65,890 |
| Interest receivable | | | | 7,174,606 |
| Distributions receivable from Fidelity Central Funds | | | | 27,414 |
| Receivable for daily variation margin on futures contracts | | | | 10,990 |
Total assets | | | | 940,084,268 |
| Liabilities | | | | |
| Payable for investments purchased | $ | 16,678,993 | | |
| Unrealized depreciation on forward foreign currency contracts | | 102,884 | | |
| Payable for fund shares redeemed | | 6,167,612 | | |
| Accrued management fee | | 45,791 | | |
| Other payables and accrued expenses | | 9,685 | | |
| Total liabilities | | | | 23,004,965 |
| Net Assets | | | $ | 917,079,303 |
| Net Assets consist of: | | | | |
| Paid in capital | | | $ | 959,232,636 |
| Total accumulated earnings (loss) | | | | (42,153,333) |
| Net Assets | | | $ | 917,079,303 |
Net Asset Value, offering price and redemption price per share ($917,079,303 ÷ 98,590,873 shares) | | | $ | 9.30 |
| Statement of Operations |
| Year ended December 31, 2024 |
| Investment Income | | | | |
| Dividends | | | $ | 68,005 |
| Interest | | | | 18,603,688 |
| Income from Fidelity Central Funds | | | | 203,134 |
| Income before foreign taxes withheld | | | $ | 18,874,827 |
| Less foreign taxes withheld | | | | (72,927) |
| Total income | | | | 18,801,900 |
| Expenses | | | | |
| Management fee | $ | 489,658 | | |
| Independent trustees' fees and expenses | | 2,072 | | |
| Interest | | 1,684 | | |
| Miscellaneous | | 476 | | |
| Total expenses before reductions | | 493,890 | | |
| Expense reductions | | (150) | | |
| Total expenses after reductions | | | | 493,740 |
| Net Investment income (loss) | | | | 18,308,160 |
| Realized and Unrealized Gain (Loss) | | | | |
| Net realized gain (loss) on: | | | | |
| Investment Securities: | | | | |
| Unaffiliated issuers | | (9,818,323) | | |
| Fidelity Central Funds | | 645 | | |
| Forward foreign currency contracts | | 29,683,335 | | |
| Foreign currency transactions | | 47,580 | | |
| Futures contracts | | (13,221) | | |
| Total net realized gain (loss) | | | | 19,900,016 |
| Change in net unrealized appreciation (depreciation) on: | | | | |
| Investment Securities: | | | | |
| Unaffiliated issuers (net of decrease in deferred foreign taxes of $5,912) | | (34,867,872) | | |
| Forward foreign currency contracts | | 35,815,495 | | |
| Assets and liabilities in foreign currencies | | (315,244) | | |
| Futures contracts | | (194,455) | | |
| Total change in net unrealized appreciation (depreciation) | | | | 437,924 |
| Net gain (loss) | | | | 20,337,940 |
| Net increase (decrease) in net assets resulting from operations | | | $ | 38,646,100 |
| Statement of Changes in Net Assets |
| |
| | Year ended December 31, 2024 | | Year ended December 31, 2023 |
| Increase (Decrease) in Net Assets | | | | |
| Operations | | | | |
| Net investment income (loss) | $ | 18,308,160 | $ | 13,209,808 |
| Net realized gain (loss) | | 19,900,016 | | (16,905,309) |
| Change in net unrealized appreciation (depreciation) | | 437,924 | | 53,048,267 |
| Net increase (decrease) in net assets resulting from operations | | 38,646,100 | | 49,352,766 |
| Distributions to shareholders | | (29,309,897) | | (20,544,715) |
| | | | | |
| Share transactions | | | | |
| Proceeds from sales of shares | | 285,045,271 | | 232,402,472 |
| Reinvestment of distributions | | 27,547,863 | | 19,585,468 |
| Cost of shares redeemed | | (154,538,642) | | (157,170,529) |
| | | | | |
Net increase (decrease) in net assets resulting from share transactions | | 158,054,492 | | 94,817,411 |
| Total increase (decrease) in net assets | | 167,390,695 | | 123,625,462 |
| | | | | |
| Net Assets | | | | |
| Beginning of period | | 749,688,608 | | 626,063,146 |
| End of period | $ | 917,079,303 | $ | 749,688,608 |
| | | | | |
| Other Information | | | | |
| Shares | | | | |
| Sold | | 30,762,599 | | 25,821,303 |
| Issued in reinvestment of distributions | | 2,987,250 | | 2,162,484 |
| Redeemed | | (16,688,594) | | (17,516,244) |
| Net increase (decrease) | | 17,061,255 | | 10,467,543 |
| | | | | |
Financial Highlights
Fidelity® International Bond Index Fund |
| |
| Years ended December 31, | | 2024 | | 2023 | | 2022 | | 2021 | | 2020 |
Selected Per-Share Data | | | | | | | | | | |
| Net asset value, beginning of period | $ | 9.20 | $ | 8.81 | $ | 9.98 | $ | 10.22 | $ | 9.87 |
| Income from Investment Operations | | | | | | | | | | |
Net investment income (loss) A,B | | .207 | | .171 | | .113 | | .079 | | .054 |
| Net realized and unrealized gain (loss) | | .213 | | .481 | | (1.193) | | (.257) | | .372 |
| Total from investment operations | | .420 | | .652 | | (1.080) | | (.178) | | .426 |
| Distributions from net investment income | | (.320) | | (.262) | | (.090) | | (.062) | | (.076) |
| Total distributions | | (.320) | | (.262) | | (.090) | | (.062) | | (.076) |
| Net asset value, end of period | $ | 9.30 | $ | 9.20 | $ | 8.81 | $ | 9.98 | $ | 10.22 |
Total Return C | | | | 7.48% | | (10.84)% | | (1.74)% | | 4.33% |
Ratios to Average Net Assets B,D,E | | | | | | | | | | |
| Expenses before reductions | | .06% | | .06% | | .06% | | .06% | | .06% |
| Expenses net of fee waivers, if any | | | | .06% | | .06% | | .06% | | .06% |
| Expenses net of all reductions | | .06% | | .06% | | .06% | | .06% | | .06% |
| Net investment income (loss) | | 2.24% | | 1.91% | | 1.23% | | .79% | | .54% |
| Supplemental Data | | | | | | | | | | |
| Net assets, end of period (000 omitted) | $ | 917,079 | $ | 749,689 | $ | 626,063 | $ | 598,137 | $ | 184,632 |
Portfolio turnover rate F | | | | 22% | | 22% | | 18% | | 5% |
ACalculated based on average shares outstanding during the period.
BNet investment income (loss) is affected by the timing of the declaration of dividends by any underlying mutual funds or exchange-traded funds (ETFs). Net investment income (loss) of any mutual funds or ETFs is not included in the Fund's net investment income (loss) ratio.
CTotal returns would have been lower if certain expenses had not been reduced during the applicable periods shown.
DFees and expenses of any underlying mutual funds or exchange-traded funds (ETFs) are not included in the Fund's expense ratio. The Fund indirectly bears its proportionate share of these expenses. For additional expense information related to investments in Fidelity Central Funds, please refer to the "Investments in Fidelity Central Funds" note found in the Notes to Financial Statements section of the most recent Annual or Semi-Annual report.
EExpense ratios reflect operating expenses of the class. Expenses before reductions do not reflect amounts reimbursed, waived, or reduced through arrangements with the investment adviser, brokerage services, or other offset arrangements, if applicable, and do not represent the amount paid by the class during periods when reimbursements, waivers or reductions occur.
FAmount does not include the portfolio activity of any underlying mutual funds or exchange-traded funds (ETFs), derivatives or securities that mature within one year from acquisition.
Notes to Financial Statements
For the period ended December 31, 2024
1. Organization.
Fidelity International Bond Index Fund (the Fund) is a non-diversified fund of Fidelity Salem Street Trust (the Trust) and is authorized to issue an unlimited number of shares. Share transactions on the Statement of Changes in Net Assets may contain exchanges between affiliated funds. The Trust is registered under the Investment Company Act of 1940, as amended (the 1940 Act), as an open-end management investment company organized as a Massachusetts business trust. The Fund's investments in emerging markets can be subject to social, economic, regulatory, and political uncertainties and can be extremely volatile.
2. Investments in Fidelity Central Funds.
Funds may invest in Fidelity Central Funds, which are open-end investment companies generally available only to other investment companies and accounts managed by the investment adviser and its affiliates. The Schedule of Investments lists any Fidelity Central Funds held as an investment as of period end, but does not include the underlying holdings of each Fidelity Central Fund. An investing fund indirectly bears its proportionate share of the expenses of the underlying Fidelity Central Funds.
Based on its investment objective, each Fidelity Central Fund may invest or participate in various investment vehicles or strategies that are similar to those of the investing fund. These strategies are consistent with the investment objectives of the investing fund and may involve certain economic risks which may cause a decline in value of each of the Fidelity Central Funds and thus a decline in the value of the investing fund.
| Fidelity Central Fund | Investment Manager | Investment Objective | Investment Practices | Expense RatioA |
| Fidelity Money Market Central Funds | Fidelity Management & Research Company LLC (FMR) | Each fund seeks to obtain a high level of current income consistent with the preservation of capital and liquidity. | Short-term Investments | Less than .005% |
A Expenses expressed as a percentage of average net assets and are as of each underlying Central Fund's most recent annual or semi-annual shareholder report.
A complete unaudited list of holdings for each Fidelity Central Fund is available upon request or at the Securities and Exchange Commission website at www.sec.gov. In addition, the financial statements of the Fidelity Central Funds which contain the significant accounting policies (including investment valuation policies) of those funds, and are not covered by the Report of Independent Registered Public Accounting Firm, are available on the Securities and Exchange Commission website or upon request.
3. Significant Accounting Policies.
The Fund is an investment company and applies the accounting and reporting guidance of the Financial Accounting Standards Board (FASB) Accounting Standards Codification Topic 946 Financial Services - Investment Companies. The financial statements have been prepared in conformity with accounting principles generally accepted in the United States of America (GAAP), which require management to make certain estimates and assumptions at the date of the financial statements. Actual results could differ from those estimates. The Fund operates as a single operating segment. The Fund's income, expenses, assets, and performance are regularly monitored and assessed as a whole by the investment adviser and other individuals responsible for oversight functions of the Trust, using the information presented in the financial statements and financial highlights. Subsequent events, if any, through the date that the financial statements were issued have been evaluated in the preparation of the financial statements. The Fund's Schedule of Investments lists any underlying mutual funds or exchange-traded funds (ETFs) but does not include the underlying holdings of these funds. The following summarizes the significant accounting policies of the Fund:
Investment Valuation. Investments are valued as of 4:00 p.m. Eastern time on the last calendar day of the period. The Board of Trustees (the Board) has designated the Fund's investment adviser as the valuation designee responsible for the fair valuation function and performing fair value determinations as needed. The investment adviser has established a Fair Value Committee (the Committee) to carry out the day-to-day fair valuation responsibilities and has adopted policies and procedures to govern the fair valuation process and the activities of the Committee. In accordance with these fair valuation policies and procedures, which have been approved by the Board, the Fund attempts to obtain prices from one or more third party pricing services or brokers to value its investments. When current market prices, quotations or currency exchange rates are not readily available or reliable, investments will be fair valued in good faith by the Committee, in accordance with the policies and procedures. Factors used in determining fair value vary by investment type and may include market or investment specific events, transaction data, estimated cash flows, and market observations of comparable investments. The frequency that the fair valuation procedures are used cannot be predicted and they may be utilized to a significant extent. The Committee manages the Fund's fair valuation practices and maintains the fair valuation policies and procedures. The Fund's investment adviser reports to the Board information regarding the fair valuation process and related material matters.
The Fund categorizes the inputs to valuation techniques used to value its investments into a disclosure hierarchy consisting of three levels as shown below:
Level 1 - unadjusted quoted prices in active markets for identical investments
Level 2 - other significant observable inputs (including quoted prices for similar investments, interest rates, prepayment speeds, etc.)
Level 3 - unobservable inputs (including the Fund's own assumptions based on the best information available)
Valuation techniques used to value the Fund's investments by major category are as follows:
Debt securities, including restricted securities, are valued based on evaluated prices received from third party pricing services or from brokers who make markets in such securities. Corporate bonds, foreign government and government agency obligations, and preferred securities are valued by pricing services who utilize matrix pricing which considers yield or price of bonds of comparable quality, coupon, maturity and type or by broker-supplied prices. When independent prices are unavailable or unreliable, debt securities may be valued utilizing pricing methodologies which consider similar factors that would be used by third party pricing services. For foreign debt securities, when significant market or security specific events arise, valuations may be determined in good faith in accordance with procedures adopted by the Board. Debt securities are generally categorized as Level 2 in the hierarchy but may be Level 3 depending on the circumstances.
The U.S. dollar value of forward foreign currency contracts is determined using currency exchange rates supplied by a pricing service and are categorized as Level 2 in the hierarchy. Futures contracts are valued at the settlement price established each day by the board of trade or exchange on which they are traded and are categorized as Level 1 in the hierarchy. Investments in open-end mutual funds, including the Fidelity Central Funds, are valued at their closing net asset value (NAV) each business day and are categorized as Level 1 in the hierarchy.
Changes in valuation techniques may result in transfers in or out of an assigned level within the disclosure hierarchy. The aggregate value of investments by input level as of December 31, 2024 is included at the end of the Fund's Schedule of Investments.
Foreign Currency. Foreign-denominated assets, including investment securities, and liabilities are translated into U.S. dollars at the exchange rates at period end. Purchases and sales of investment securities, income and dividends received, and expenses denominated in foreign currencies are translated into U.S. dollars at the exchange rate in effect on the transaction date.
The effects of exchange rate fluctuations on investments are included with the net realized and unrealized gain (loss) on investment securities. Other foreign currency transactions resulting in realized and unrealized gain (loss) are disclosed separately.
Realized gains and losses on foreign currency transactions arise from the disposition of foreign currency, realized changes in the value of foreign currency between the trade and settlement dates on security transactions, and the difference between the amounts of dividends, interest and foreign withholding taxes recorded on transaction date and the U.S. dollar equivalent of the amounts actually received or paid. Unrealized gains and losses on assets and liabilities in foreign currencies arise from changes in the value of foreign currency, and from assets and liabilities denominated in foreign currencies, other than investments, which are held at period end.
Investment Transactions and Income. For financial reporting purposes, the Fund's investment holdings and NAV include trades executed through the end of the last business day of the period. The NAV per share for processing shareholder transactions is calculated as of the close of business of the New York Stock Exchange (NYSE), normally 4:00 p.m. Eastern time and includes trades executed through the end of the prior business day. Gains and losses on securities sold are determined on the basis of identified cost. Dividend income is recorded on the ex-dividend date. Income and capital gain distributions from Fidelity Central Funds, if any, are recorded on the ex-dividend date. Interest income is accrued as earned and includes coupon interest and amortization of premium and accretion of discount on debt securities as applicable. Investment income is recorded net of foreign taxes withheld where recovery of such taxes is uncertain. Debt obligations may be placed on non-accrual status and related interest income may be reduced by ceasing current accruals and writing off interest receivables when the collection of all or a portion of interest has become doubtful based on consistently applied procedures. A debt obligation is removed from non-accrual status when the issuer resumes interest payments or when collectability of interest is reasonably assured. Funds may file withholding tax reclaims in certain jurisdictions to recover a portion of amounts previously withheld. Any withholding tax reclaims income is included in the Statement of Operations in foreign taxes withheld. Any receivables for withholding tax reclaims are included in the Statement of Assets and Liabilities in dividends receivable.
Expenses. Expenses directly attributable to a fund are charged to that fund. Expenses attributable to more than one fund are allocated among the respective funds on the basis of relative net assets or other appropriate methods. Expenses included in the accompanying financial statements reflect the expenses of that fund and do not include any expenses associated with any underlying mutual funds or exchange-traded funds. Although not included in a fund's expenses, a fund indirectly bears its proportionate share of these expenses through the net asset value of each underlying mutual fund or exchange-traded fund. Expense estimates are accrued in the period to which they relate and adjustments are made when actual amounts are known.
Income Tax Information and Distributions to Shareholders. Each year, the Fund intends to qualify as a regulated investment company under Subchapter M of the Internal Revenue Code, including distributing substantially all of its taxable income and realized gains. As a result, no provision for U.S. Federal income taxes is required. As of December 31, 2024, the Fund did not have any unrecognized tax benefits in the financial statements; nor is the Fund aware of any tax positions for which it is reasonably possible that the total amounts of unrecognized tax benefits will significantly change in the next twelve months. The Fund files a U.S. federal tax return, in addition to state and local tax returns as required. The Fund's federal income tax returns are subject to examination by the Internal Revenue Service (IRS) for a period of three fiscal years after they are filed. State and local tax returns may be subject to examination for an additional fiscal year depending on the jurisdiction. Foreign taxes are provided for based on the Fund's understanding of the tax rules and rates that exist in the foreign markets in which it invests. The Fund is subject to a tax imposed on capital gains by certain countries in which it invests. An estimated deferred tax liability for net unrealized appreciation on the applicable securities is included in Other payables and accrued expenses on the Statement of Assets and Liabilities.
Distributions are declared and recorded daily and paid monthly from net investment income. Distributions from realized gains, if any, are declared and recorded on the ex-dividend date. Income and capital gain distributions are determined in accordance with income tax regulations, which may differ from GAAP.
Capital accounts within the financial statements are adjusted for permanent book-tax differences. These adjustments have no impact on net assets or the results of operations. Capital accounts are not adjusted for temporary book-tax differences which will reverse in a subsequent period.
Book-tax differences are primarily due to foreign currency transactions, market discount, capital loss carryforwards and futures transactions.
As of period end, the cost and unrealized appreciation (depreciation) in securities, and derivatives if applicable, for federal income tax purposes were as follows:
| Gross unrealized appreciation | $18,884,858 |
| Gross unrealized depreciation | (45,944,285) |
| Net unrealized appreciation (depreciation) | $(27,059,427) |
| Tax Cost | $1,006,688,933 |
The tax-based components of distributable earnings as of period end were as follows:
| Undistributed ordinary income | $2,318,737 |
| Capital loss carryforward | $(17,206,697) |
| Net unrealized appreciation (depreciation) on securities and other investments | $(27,255,688) |
Capital loss carryforwards are only available to offset future capital gains of the Fund to the extent provided by regulations and may be limited. The capital loss carryforward information presented below, including any applicable limitation, is estimated as of fiscal period end and is subject to adjustment.
Short-term | $(5,440,590) |
Long-term | (11,766,107) |
| Total capital loss carryforward | $(17,206,697) |
The tax character of distributions paid was as follows:
| | December 31, 2024 | December 31, 2023 |
| Ordinary Income | $29,309,897 | $ 20,544,715 |
Restricted Securities (including Private Placements). Funds may invest in securities that are subject to legal or contractual restrictions on resale. These securities generally may be resold in transactions exempt from registration or to the public if the securities are registered. Disposal of these securities may involve time-consuming negotiations and expense, and prompt sale at an acceptable price may be difficult. Information regarding restricted securities held at period end is included at the end of the Schedule of Investments, if applicable.
New Accounting Pronouncement. FASB Accounting Standards Update (ASU) 2023-07 Segment Reporting (Topic 280): Improvements to Reportable Segment Disclosures became effective in this reporting period. ASU 2023-07 enhances segment information disclosure in the notes to financial statements.
4. Derivative Instruments.
Risk Exposures and the Use of Derivative Instruments. The Fund's investment objectives allow for various types of derivative instruments, including futures contracts and forward foreign currency contracts. Derivatives are investments whose value is primarily derived from underlying assets, indices or reference rates and may be transacted on an exchange or over-the-counter (OTC). Derivatives may involve a future commitment to buy or sell a specified asset based on specified terms, to exchange future cash flows at periodic intervals based on a notional principal amount, or for one party to make one or more payments upon the occurrence of specified events in exchange for periodic payments from the other party.
Derivatives were used to increase returns, to facilitate transactions in foreign-denominated securities and to manage exposure to certain risks as defined below. The success of any strategy involving derivatives depends on analysis of numerous economic factors, and if the strategies for investment do not work as intended, the objectives may not be achieved.
Derivatives were used to increase or decrease exposure to the following risk(s):
| | |
| Foreign Exchange Risk | Foreign exchange rate risk relates to fluctuations in the value of an asset or liability due to changes in currency exchange rates. |
| Interest Rate Risk | Interest rate risk relates to the fluctuations in the value of interest-bearing securities due to changes in the prevailing levels of market interest rates. |
Funds are also exposed to additional risks from investing in derivatives, such as liquidity risk and counterparty credit risk. Liquidity risk is the risk that a fund will be unable to close out the derivative in the open market in a timely manner. Counterparty credit risk is the risk that the counterparty will not be able to fulfill its obligation to a fund. Derivative counterparty credit risk is managed through formal evaluation of the creditworthiness of all potential counterparties. On certain OTC derivatives such as forward foreign currency contracts, a fund attempts to reduce its exposure to counterparty credit risk by entering into an International Swaps and Derivatives Association, Inc. (ISDA) Master Agreement with each of its counterparties. The ISDA Master Agreement gives a fund the right to terminate all transactions traded under such agreement upon the deterioration in the credit quality of the counterparty beyond specified levels. The ISDA Master Agreement gives each party the right, upon an event of default by the other party or a termination of the agreement, to close out all transactions traded under such agreement and to net amounts owed under each transaction to one net payable by one party to the other. To mitigate counterparty credit risk on bi-lateral OTC derivatives, a fund receives collateral in the form of cash or securities once net unrealized appreciation on outstanding derivative contracts under an ISDA Master Agreement exceeds certain applicable thresholds, subject to certain minimum transfer provisions. The collateral received is held in segregated accounts with the custodian bank in accordance with the collateral agreements entered into between a fund, the counterparty and the custodian bank. A fund could experience delays and costs in gaining access to the collateral even though it is held by the custodian bank. The maximum risk of loss to a fund from counterparty credit risk related to bi-lateral OTC derivatives is generally the aggregate unrealized appreciation and unpaid counterparty payments in excess of any collateral pledged by the counterparty to a fund. A fund may be required to pledge collateral for the benefit of the counterparties on bi-lateral OTC derivatives in an amount not less than each counterparty's unrealized appreciation on outstanding derivative contracts, subject to certain minimum transfer provisions, and any such pledged collateral is identified in the Schedule of Investments. Exchange-traded contracts are not covered by the ISDA Master Agreement; however counterparty credit risk related to these contracts may be mitigated by the protection provided by the exchange on which they trade. A summary of derivatives inclusive of potential netting arrangements is presented at the end of the Schedule of Investments.
Investing in derivatives may involve greater risks than investing in the underlying assets directly and, to varying degrees, may involve risk of loss in excess of any initial investment and collateral received and amounts recognized in the Statement of Assets and Liabilities. In addition, there may be the risk that the change in value of the derivative contract does not correspond to the change in value of the underlying instrument.
Net Realized Gain (Loss) and Change in Net Unrealized Appreciation (Depreciation) on Derivatives. The table below, which reflects the impacts of derivatives on the financial performance, summarizes the net realized gain (loss) and change in net unrealized appreciation (depreciation) for derivatives during the period as presented in the Statement of Operations.
| Primary Risk Exposure / Derivative Type | Net Realized Gain (Loss)($) | Change in Net Unrealized Appreciation (Depreciation)($) |
| Fidelity International Bond Index Fund | | |
| Foreign Exchange Risk | | |
| Forward Foreign Currency Contracts | 29,683,335 | 35,815,495 |
| Total Foreign Exchange Risk | 29,683,335 | 35,815,495 |
| Interest Rate Risk | | |
| Futures Contracts | (13,221) | (194,455) |
| Total Interest Rate Risk | (13,221) | (194,455) |
| Totals | 29,670,114 | 35,621,040 |
If there are any open positions at period end, a summary of the value of derivatives by primary risk exposure is included at the end of the Schedule of Investments.
Forward Foreign Currency Contracts. Forward foreign currency contracts represent obligations to purchase or sell foreign currency on a specified future date at a price fixed at the time the contracts are entered into. Forward foreign currency contracts were used to facilitate transactions in foreign-denominated securities and to manage exposure to certain foreign currencies.
Forward foreign currency contracts are valued daily and fluctuations in exchange rates on open contracts are recorded as unrealized appreciation or (depreciation) and reflected in total accumulated earnings (loss) in the Statement of Assets and Liabilities. When the contract is closed, a gain or loss is realized equal to the difference between the closing value and the value at the time it was opened. Non-deliverable forward foreign currency exchange contracts are settled with the counterparty in cash without the delivery of foreign currency. The net realized gain (loss) and change in net unrealized appreciation (depreciation) on forward foreign currency contracts during the period is presented in the Statement of Operations.
Any open forward foreign currency contracts at period end are presented in the Schedule of Investments under the caption "Forward Foreign Currency Contracts." The contract amount and unrealized appreciation (depreciation) reflects each contract's exposure to the underlying currency at period end, and is representative of volume of activity during the period, unless an average contract value is presented in the table below.
| | Average Contracts Amount ($) |
| Fidelity International Bond Index Fund | 2,400,422,823 |
Futures Contracts. A futures contract is an agreement between two parties to buy or sell a specified underlying instrument for a fixed price at a specified future date. Futures contracts were used to manage exposure to the bond market and fluctuations in interest rates.
Upon entering into a futures contract, a fund is required to deposit either cash or securities (initial margin) with a clearing broker in an amount equal to a certain percentage of the face value of the contract. Futures contracts are marked-to-market daily and subsequent daily payments are made or received by a fund depending on the daily fluctuations in the value of the futures contracts and are recorded as unrealized appreciation or (depreciation). This receivable and/or payable, if any, is included in daily variation margin on futures contracts in the Statement of Assets and Liabilities. Realized gain or (loss) is recorded upon the expiration or closing of a futures contract. The net realized gain (loss) and change in net unrealized appreciation (depreciation) on futures contracts during the period is presented in the Statement of Operations.
Any open futures contracts at period end are presented in the Schedule of Investments under the caption "Futures Contracts". The notional amount at value reflects each contract's exposure to the underlying instrument or index at period end, and is representative of volume of activity during the period.
Any securities deposited to meet initial margin requirements are identified in the Schedule of Investments. Any cash deposited to meet initial margin requirements is presented as segregated cash with brokers for derivative instruments in the Statement of Assets and Liabilities.
5. Purchases and Sales of Investments.
Purchases and sales of securities, other than short-term securities and in-kind transactions, as applicable, are noted in the table below.
| | Purchases ($) | Sales ($) |
| Fidelity International Bond Index Fund | 359,700,681 | 156,403,692 |
6. Fees and Other Transactions with Affiliates.
Management Fee. Fidelity Management & Research Company LLC (the investment adviser) and its affiliates provide the Fund with investment management related services for which the Fund pays a monthly management fee. The management fee is based on an annual rate of .06% of the Fund's average net assets. Under the management contract, the investment adviser pays all other operating expenses, except the compensation of the independent Trustees and certain miscellaneous expenses such as proxy and shareholder meeting expenses.
Interfund Lending Program. Pursuant to an Exemptive Order issued by the Securities and Exchange Commission (the SEC), the Fund, along with other registered investment companies having management contracts with Fidelity Management & Research Company LLC (FMR), or other affiliated entities of FMR, may participate in an interfund lending program. This program provides an alternative credit facility allowing the Fund to borrow from, or lend money to, other participating affiliated funds at rates that are beneficial to both the borrowing and lending fund. Borrowings under the program are generally for temporary or emergency purposes, including meeting fund shareholder redemptions. The interfund loan rate is determined, as specified in the Exemptive Order, by averaging, (1) the higher of the overnight time deposit rate and the current overnight repurchase agreement rate, and (2) a benchmark rate representing the lowest bank loan rate available to the funds. At period end, there were no interfund loans outstanding. Activity in this program during the period for which loans were outstanding was as follows:
| | Borrower or Lender | Average Loan Balance ($) | Weighted Average Interest Rate | Interest Expense ($) |
| Fidelity International Bond Index Fund | Borrower | 5,428,000 | 5.58% | 1,684 |
Interfund Trades. Funds may purchase from or sell securities to other Fidelity Funds under procedures adopted by the Board. The procedures have been designed to ensure these interfund trades are executed in accordance with Rule 17a-7 of the 1940 Act. Any interfund trades are included within the respective purchases and sales amounts shown in the Purchases and Sales of Investments note. During the period, there were no interfund trades.
Sub-Advisory Arrangements. Effective March 1, 2024, the Fund's sub-advisory agreements with FMR Investment Management (UK) Limited, Fidelity Management & Research (Hong Kong) Limited, and Fidelity Management & Research (Japan) Limited were amended to provide that the investment adviser pays each sub-adviser monthly fees equal to 110% of the sub-adviser's costs for providing sub-advisory services.
7. Committed Line of Credit.
Certain Funds participate with other funds managed by the investment adviser or an affiliate in a $4.25 billion credit facility (the "line of credit") to be utilized for temporary or emergency purposes to fund shareholder redemptions or for other short-term liquidity purposes.
Commitment fees are charged based on the unused amount of the line of credit at an annual rate of .10%, and then allocated to each participating fund based on its pro-rata portion of the line of credit. The commitment fees are borne by the investment adviser.
Interest is charged to a participating fund based on its borrowings at an annual rate of .75% plus the highest of (i) daily SOFR plus a .10% spread adjustment, (ii) Federal Funds Effective Rate, or (iii) Overnight Bank Funding Rate. During the period, there were no borrowings on this line of credit.
The line of credit agreement will expire in March 2025 unless extended or renewed.
8. Expense Reductions.
Through arrangements with the Fund's custodian, credits realized as a result of certain uninvested cash balances were used to reduce the Fund's expenses by $150.
9. Other.
A fund's organizational documents provide former and current trustees and officers with a limited indemnification against liabilities arising in connection with the performance of their duties to the fund. In the normal course of business, a fund may also enter into contracts that provide general indemnifications. A fund's maximum exposure under these arrangements is unknown as this would be dependent on future claims that may be made against a fund. The risk of material loss from such claims is considered remote.
At the end of the period, the following mutual funds managed by the investment adviser or its affiliates were the owners of record of 10% or more of the total outstanding shares.
| | Fidelity Multi-Asset Index Fund |
Fidelity International Bond Index Fund | 27% |
Mutual funds managed by the investment adviser or its affiliates, in aggregate, were the owners of record of more than 20% of the total outstanding shares.
| Fund | % of shares held |
Fidelity International Bond Index Fund | 44% |
10. Risk and Uncertainties.
Many factors affect a fund's performance. Developments that disrupt global economies and financial markets, such as pandemics, epidemics, outbreaks of infectious diseases, war, terrorism, and environmental disasters, may significantly affect a fund's investment performance. The effects of these developments to a fund will be impacted by the types of securities in which a fund invests, the financial condition, industry, economic sector, and geographic location of an issuer, and a fund's level of investment in the securities of that issuer. Significant concentrations in security types, issuers, industries, sectors, and geographic locations may magnify the factors that affect a fund's performance.
Report of Independent Registered Public Accounting Firm
To the Board of Trustees of Fidelity Salem Street Trust and Shareholders of Fidelity International Bond Index Fund
Opinion on the Financial Statements
We have audited the accompanying statement of assets and liabilities, including the schedule of investments, of Fidelity International Bond Index Fund (one of the funds constituting Fidelity Salem Street Trust, referred to hereafter as the "Fund") as of December 31, 2024, the related statement of operations for the year ended December 31, 2024, the statement of changes in net assets for each of the two years in the period ended December 31, 2024, including the related notes, and the financial highlights for each of the five years in the period ended December 31, 2024 (collectively referred to as the "financial statements"). In our opinion, the financial statements present fairly, in all material respects, the financial position of the Fund as of December 31, 2024, the results of its operations for the year then ended, the changes in its net assets for each of the two years in the period ended December 31, 2024 and the financial highlights for each of the five years in the period ended December 31, 2024 in conformity with accounting principles generally accepted in the United States of America.
Basis for Opinion
These financial statements are the responsibility of the Fund's management. Our responsibility is to express an opinion on the Fund's financial statements based on our audits. We are a public accounting firm registered with the Public Company Accounting Oversight Board (United States) (PCAOB) and are required to be independent with respect to the Fund in accordance with the U.S. federal securities laws and the applicable rules and regulations of the Securities and Exchange Commission and the PCAOB.
We conducted our audits of these financial statements in accordance with the standards of the PCAOB. Those standards require that we plan and perform the audit to obtain reasonable assurance about whether the financial statements are free of material misstatement, whether due to error or fraud.
Our audits included performing procedures to assess the risks of material misstatement of the financial statements, whether due to error or fraud, and performing procedures that respond to those risks. Such procedures included examining, on a test basis, evidence regarding the amounts and disclosures in the financial statements. Our audits also included evaluating the accounting principles used and significant estimates made by management, as well as evaluating the overall presentation of the financial statements. Our procedures included confirmation of securities owned as of December 31, 2024 by correspondence with the custodian and brokers; when replies were not received from brokers, we performed other auditing procedures. We believe that our audits provide a reasonable basis for our opinion.
/s/ PricewaterhouseCoopers LLP
Boston, Massachusetts
February 13, 2025
We have served as the auditor of one or more investment companies in the Fidelity group of funds since 1932.
Distributions
(Unaudited)
The dividend and capital gains distributions for the fund(s) are available on Fidelity.com or Institutional.Fidelity.com.
The fund designates $14,681,215 of distributions paid during the fiscal year ended 2024 as qualifying to be taxed as section 163(j) interest dividends.
The fund will notify shareholders in January 2025 of amounts for use in preparing 2024 income tax returns.
Item 8: Changes in and Disagreements with Accountants for Open-End Management Investment Companies
(Unaudited)
Note: This is not applicable for any fund included in this document.
Item 9: Proxy Disclosures for Open-End Management Investment Companies
(Unaudited)
Note: This is not applicable for any fund included in this document.
Item 10: Remuneration Paid to Directors, Officers, and others of Open-End Management Investment Companies
(Unaudited)
Note: This information is disclosed as part of the financial statements for each Fund as part of Item 7: Financial Statements and Financial Highlights for Open-End Management Investment companies.
Item 11: Statement Regarding Basis for Approval of Investment Advisory Contract
(Unaudited)
Board Approval of Investment Advisory Contracts and Management Fees
Fidelity International Bond Index Fund
Each year, the Board of Trustees, including the Independent Trustees (together, the Board), considers the renewal of the fund's management contract with Fidelity Management & Research Company LLC (FMR) and the sub-advisory agreements (together, the Advisory Contracts) for the fund. FMR and the sub-advisers are referred to herein as the Investment Advisers. The Board, assisted by the advice of fund counsel and Independent Trustees' counsel, requests and considers a broad range of information relevant to the renewal of the Advisory Contracts throughout the year.
The Board meets regularly and, at each of its meetings, covers an extensive agenda of topics and materials and considers factors that are relevant to its annual consideration of the renewal of the fund's Advisory Contracts, including the services and support provided to the fund and its shareholders. The Board's Operations Committee, of which all the Independent Trustees are members, meets regularly throughout the year and requests, receives and considers, among other matters, information related to the annual consideration of the renewal of the fund's Advisory Contracts before making its recommendation to the Board. The Board also meets as needed to review matters specifically related to the Board's annual consideration of the renewal of the Advisory Contracts. Members of the Board may also meet from time to time with trustees of other Fidelity funds through joint ad hoc committees to discuss certain matters relevant to all of the Fidelity funds.
At its September 2024 meeting, the Board unanimously determined to renew the fund's Advisory Contracts. In reaching its determination, the Board considered all factors it believed relevant, including (i) the nature, extent, and quality of the services provided to the fund and its shareholders (including the investment performance of the fund); (ii) the competitiveness relative to peer funds of the fund's management fee and total expense ratio; (iii) the total costs of the services provided by and the profits realized by FMR and its affiliates (Fidelity) from its relationships with the fund; and (iv) the extent to which, if any, economies of scale exist and are realized as the fund grows, and whether any economies of scale are appropriately shared with fund shareholders. The Board also considered the broad range of investment choices available to shareholders from FMR's competitors and that the fund's shareholders have chosen to invest in the fund, which is part of the Fidelity family of funds. The Board's decision to renew the Advisory Contracts was not based on any single factor and the factors may have been weighed differently by different Trustees.
The Board reached a determination, with the assistance of fund counsel and Independent Trustees' counsel and through the exercise of its business judgment, that the renewal of the Advisory Contracts was in the best interests of the fund and its shareholders and that the compensation payable under the Advisory Contracts was fair and reasonable in light of all of the surrounding circumstances.
Nature, Extent, and Quality of Services Provided. The Board considered Fidelity's staffing as it relates to the fund, including the backgrounds and experience of investment personnel, and also considered the Investment Advisers' implementation of the fund's investment program. The Independent Trustees also had discussions with senior management of Fidelity's investment operations and investment groups. The Board considered the structure of the investment personnel compensation program and whether this structure provides appropriate incentives to act in the best interests of the fund. Additionally, the Board considered the portfolio managers' investments, if any, in the funds that they manage.
Resources Dedicated to Investment Management and Support Services. The Board reviewed the general qualifications and capabilities of Fidelity's investment staff, including its size, education, experience, and resources, as well as Fidelity's approach to recruiting, training, managing, and compensating investment personnel. The Board noted the resources devoted to Fidelity's global investment organization, and that Fidelity's analysts have extensive resources, tools and capabilities that allow them to conduct quantitative and fundamental analysis, as well as credit analysis of issuers, counterparties and guarantors. Further, the Board considered that Fidelity's investment professionals have sufficient access to global information and data so as to provide competitive investment results over time, and that those professionals also have access to sophisticated tools that permit them to assess portfolio construction and risk and performance attribution characteristics continuously, as well as to transmit new information and research conclusions rapidly around the world. Additionally, in its deliberations, the Board considered Fidelity's trading, risk management, compliance, cybersecurity, and technology and operations capabilities and resources, which are integral parts of the investment management process.
Shareholder and Administrative Services. The Board considered (i) the nature, extent, quality, and cost of advisory, administrative, and shareholder services performed by the Investment Advisers and their affiliates under the Advisory Contracts and under separate agreements covering transfer agency and pricing and bookkeeping services for the fund; (ii) the nature and extent of Fidelity's supervision of third party service providers, principally custodians, subcustodians, and pricing vendors; and (iii) the resources devoted by Fidelity to, and the record of compliance with, the fund's compliance policies and procedures, including with respect to liquidity and derivatives risk management. The Board also considered the fund's securities lending activities and any payments made to Fidelity relating to securities lending under a separate agreement.
The Board noted that the growth of fund assets over time across the complex allows Fidelity to reinvest in the development of services designed to enhance the value and convenience of the Fidelity funds as investment vehicles. These services include 24-hour access to account information and market information over the Internet and through telephone representatives, investor education materials and asset allocation tools. The Board also considered that it reviews customer service metrics such as telephone response times, continuity of services on the website and metrics addressing services at Fidelity Investor Centers.
Investment in a Large Fund Family. The Board considered the benefits to shareholders of investing in a fund that is part of a large family of funds offering a variety of investment disciplines and providing a large variety of fund investor services. The Board noted that Fidelity had taken, or had made recommendations to the Board that resulted in the Fidelity funds taking, a number of actions over the previous year that benefited particular funds and/or the Fidelity funds in general.
Investment Performance. The Board took into account discussions that occur with representatives of the Investment Advisers, and reports that it receives, at Board meetings throughout the year relating to fund investment performance. In this regard the Board noted that as part of regularly scheduled fund reviews and other reports to the Board on fund performance, the Board considered annualized return information for the fund for different time periods, measured against the securities market index the fund seeks to track (benchmark index) and an appropriate peer group of funds with similar objectives (peer group). The Board also periodically considers the fund's tracking error versus its benchmark index. In its evaluation of fund investment performance at meetings throughout the year, the Board gave particular attention to information indicating underperformance of certain Fidelity funds over different time periods and discussed with the Investment Advisers the reasons for such underperformance.
In addition to reviewing absolute and relative fund performance, the Independent Trustees periodically consider the appropriateness of fund performance metrics in evaluating the results achieved. In general, the Independent Trustees believe that an index fund's performance should be evaluated based on gross performance (before fees and expenses but after transaction costs) of the fund compared to the fund's benchmark index, over appropriate time periods.
Based on its review, the Board concluded that the nature, extent, and quality of services provided to the fund under the Advisory Contracts should continue to benefit the shareholders of the fund.
Competitiveness of Management Fee and Total Expense Ratio. The Board was provided with information regarding industry trends in management fees and expenses. In its review of the fund's management fee and total expense ratio, the Board considered the fund's unitary (subject to certain limited exceptions) fee rate as well as fund expenses paid by FMR under the fund's management contract, such as transfer agent fees, pricing and bookkeeping fees, and custodial, legal, and audit fees. The Board noted that Fidelity may agree to waive fees or reimburse expenses from time to time, and the extent to which, if any, it has done so for the fund.
Comparisons of Management Fees and Total Expense Ratios. Among other things, the Board reviewed data for selected groups of competitive funds and classes (referred to as "mapped groups") that were compiled by Fidelity based on combining similar investment objective categories (as classified by Morningstar) that have comparable investment mandates. The data reviewed by the Board included (i) gross management fee comparisons (before taking into account expense reimbursements or caps) relative to the total universe of funds within the mapped group; (ii) gross management fee comparisons relative to a subset of non-Fidelity funds in the mapped group that are similar in size and management fee structure to the fund (referred to as the "asset size peer group"); (iii) total expense comparisons of the fund relative to funds and classes in the mapped group that have a similar sales load structure to the fund (referred to as the "similar sales load structure group"); and (iv) total expense comparisons of the fund relative to funds and classes in the similar sales load structure group that are similar in size and management fee structure to the fund (referred to as the "total expense asset size peer group"). The total expense asset size peer group comparison excludes performance adjustments and fund-paid 12b-1 fees to eliminate variability in fee structures.
The information provided to the Board indicated that the fund's management fee rate ranked below the competitive median of the mapped group for 2023 and below the competitive median of the asset size peer group for 2023. Further, the information provided to the Board indicated that the total expense ratio of the fund ranked equal to the competitive median of the similar sales load structure group for 2023 and equal to the competitive median of the total expense asset size peer group for 2023.
Fees Charged to Other Fidelity Clients. The Board also considered Fidelity fee structures and other information with respect to clients of Fidelity, such as other funds advised or subadvised by Fidelity, pension plan clients, and other institutional clients with similar mandates. The Board noted that a joint ad hoc committee created by it and the boards of other Fidelity funds periodically reviews and compares Fidelity's institutional investment advisory business with its business of providing services to the Fidelity funds and also noted the most recent findings of the committee. The Board noted that the committee's review included a consideration of the differences in services provided, fees charged, and costs incurred, as well as competition in the markets serving the different categories of clients.
Based on its review, the Board concluded that the fund's management fee is fair and reasonable in light of the services that the fund receives and the other factors considered. Further, based on its review of total expense ratios and fees charged to other Fidelity clients, the Board concluded that the fund's total expense ratio was reasonable in light of the services that the fund and its shareholders receive and the other factors considered.
Costs of the Services and Profitability. The Board considered the revenues earned and the expenses incurred by Fidelity in conducting the business of developing, marketing, distributing, managing, administering and servicing the fund and servicing the fund's shareholders. The Board also considered the level of Fidelity's profits in respect of all the Fidelity funds.
On an annual basis, Fidelity presents to the Board information about the profitability of its relationships with the fund. Fidelity calculates profitability information for each Fidelity fund, as well as aggregate profitability information for groups of Fidelity funds and all Fidelity funds, using a series of detailed revenue and cost allocation methodologies which originate with the books and records of Fidelity on which Fidelity's audited financial statements are based. The Audit Committee of the Board reviews any significant changes from the prior year's methodologies.
A public accounting firm has been engaged annually by the Board as part of the Board's assessment of Fidelity's profitability analysis. The engagement includes the review and assessment of the methodologies used by Fidelity in determining the revenues and expenses attributable to Fidelity's fund business. After considering the reports issued under the engagement and information provided by Fidelity, the Board concluded that while other allocation methods may also be reasonable, Fidelity's profitability methodologies are reasonable in all material respects.
The Board also reviewed Fidelity's non-fund businesses and potential indirect benefits such businesses may have received as a result of their association with Fidelity's fund business (i.e., fall-out benefits) as well as cases where Fidelity's affiliates may benefit from the funds' business. The Board considered areas where potential indirect benefits to the Fidelity funds from their relationships with Fidelity may exist. The Board's consideration of these matters was informed by the findings of a joint ad hoc committee created by it and the boards of other Fidelity funds to evaluate potential fall-out benefits.
The Board considered the costs of the services provided by and the profits realized by Fidelity in connection with the operation of the fund and was satisfied that the profitability was not excessive.
Economies of Scale. The Board considered whether there have been economies of scale in respect of the management of the Fidelity funds, whether the Fidelity funds (including the fund) have appropriately benefited from any such economies of scale, and whether there is potential for realization of any further economies of scale. The Board considered the extent to which the fund will benefit from economies of scale as assets grow through increased services to the fund, through waivers or reimbursements, or through fee or expense ratio reductions. The Board recognized that, due to the fund's current contractual arrangements, its expense ratio will not decline if the fund's operating costs decrease as assets grow, or rise as assets decrease. The Board also noted that a committee created by it and the boards of other Fidelity funds periodically analyzes whether Fidelity attains economies of scale in respect of the management and servicing of the Fidelity funds, whether the Fidelity funds have appropriately benefited from such economies of scale, and whether there is potential for realization of any further economies of scale.
The Board concluded, taking into account the analysis of the committee, that economies of scale, if any, are being appropriately shared between fund shareholders and Fidelity.
Additional Information Requested by the Board. In order to develop fully the factual basis for consideration of the Fidelity funds' advisory contracts, the Board requested and received additional information on certain topics, including: (i) portfolio manager changes that have occurred during the past year; (ii) hiring, training, compensating, and retaining adviser and sub-adviser personnel; (iii) the terms of the funds' various management fee structures and arrangements for transfer agent and pricing and bookkeeping services; (iv) Fidelity's fund profitability methodology, profitability trends for certain funds, the allocation of various costs to different funds, and the impact of certain factors on fund profitability results; (v) the impact on fund profitability of recent industry trends, such as the growth in passively managed funds and the changes in flows for different types of funds; (vi) the types of management fee and total expense comparisons provided, and the challenges and limitations associated with such information; (vii) explanations regarding the relative total expense ratios and management fees of certain funds and classes, total expense and management fee competitive trends, and methodologies for total expense and management fee competitive comparisons; (viii) matters related to money market funds, exchange-traded funds, and target date funds; (ix) the arrangements with and compensation paid to certain fund sub-advisers and the treatment of such compensation within Fidelity's fund profitability methodology; and (x) the terms of management contracts between Fidelity and other funds and products not overseen by the Board.
Conclusion. Based on its evaluation of all of the conclusions noted above, and after considering all factors it believed relevant, the Board, including the Independent Trustees, concluded that the advisory and sub-advisory fee arrangements are fair and reasonable, and that the fund's Advisory Contracts should be renewed through September 30, 2025.
1.9896131.105
IBI-ANN-0325
Fidelity® SAI Municipal Income Fund
Annual Report
December 31, 2024
Offered exclusively to certain clients of the Adviser, or its affiliates, including Strategic Advisers LLC (Strategic Advisers) - not available for sale to the general public. Fidelity® SAI is a product name of Fidelity® funds dedicated to certain programs affiliated with Strategic Advisers.
Contents
To view a fund's proxy voting guidelines and proxy voting record for the 12-month period ended June 30, visit http://www.fidelity.com/proxyvotingresults or visit the Securities and Exchange Commission's (SEC) web site at http://www.sec.gov.
You may also call 1-800-544-3455 to request a free copy of the proxy voting guidelines.
Standard & Poor's, S&P and S&P 500 are registered service marks of The McGraw-Hill Companies, Inc. and have been licensed for use by Fidelity Distributors Corporation.
Other third-party marks appearing herein are the property of their respective owners.
All other marks appearing herein are registered or unregistered trademarks or service marks of FMR LLC or an affiliated company. © 2025 FMR LLC. All rights reserved.
This report and the financial statements contained herein are submitted for the general information of the shareholders of the Fund. This report is not authorized for distribution to prospective investors in the Fund unless preceded or accompanied by an effective prospectus.
A fund files its complete schedule of portfolio holdings with the SEC for the first and third quarters of each fiscal year on Form N-PORT. Forms N-PORT are available on the SEC's web site at http://www.sec.gov. A fund's Forms N-PORT may be reviewed and copied at the SEC's Public Reference Room in Washington, DC. Information regarding the operation of the SEC's Public Reference Room may be obtained by calling 1-800-SEC-0330.
For a complete list of a fund's portfolio holdings, view the most recent holdings listing, semiannual report, or annual report on Fidelity's web site at http://www.fidelity.com, http://www.institutional.fidelity.com, or http://www.401k.com, as applicable.
NOT FDIC INSURED •MAY LOSE VALUE •NO BANK GUARANTEE
Neither the Fund nor Fidelity Distributors Corporation is a bank.
Item 7: Financial Statements and Financial Highlights for Open-End Management Investment Companies (Annual Report)
Fidelity® SAI Municipal Income Fund
Schedule of Investments December 31, 2024
Showing Percentage of Net Assets
| Municipal Securities - 93.1% |
| | | Principal Amount (a) | Value ($) |
| Alabama - 3.9% | | | |
| Education - 0.5% | | | |
| Homewood Ala Edl Bldg Auth Lease Rev (Samford University Proj.) Series 2024 A, 5.25% 10/1/2037 | | 635,000 | 682,230 |
| Homewood Ala Edl Bldg Auth Lease Rev (Samford University Proj.) Series 2024 A, 5.5% 10/1/2054 | | 825,000 | 863,538 |
| Homewood Ala Edl Bldg Auth Rev (Samford University Proj.) Series 2019 A, 4% 12/1/2049 | | 4,220,000 | 3,634,385 |
| Homewood Ala Edl Bldg Auth Rev (Samford University Proj.) Series 2024 C, 5.5% 10/1/2049 | | 670,000 | 705,771 |
| University South AL Univ Rev Series 2024 A, 5.25% 4/1/2054 (Build America Mutual Assurance Co Insured) | | 3,500,000 | 3,757,867 |
| | | | 9,643,791 |
| Electric Utilities - 0.0% | | | |
| Mobile AL Indl Dev Board Poll Cont Rev (Alabama Power & Light Proj.) 3.78% tender 6/1/2034 (b) | | 795,000 | 797,890 |
| General Obligations - 3.2% | | | |
| Black Belt Energy Gas District 5.25% tender 2/1/2053 (Morgan Stanley Guaranteed) (b) | | 19,000,000 | 19,959,407 |
| Black Belt Energy Gas District 5.5% tender 11/1/2053 (Goldman Sachs Group Inc/The Guaranteed) (b) | | 15,000,000 | 15,768,146 |
| Black Belt Energy Gas District Series 2022 B 1, 4% tender 4/1/2053 (Goldman Sachs Group Inc/The Guaranteed) (b) | | 4,705,000 | 4,705,450 |
| Black Belt Energy Gas District Series 2022 E, 5% tender 5/1/2053 (Canadian Imperial Bank of Commerce/New York NY Guaranteed) (b) | | 2,605,000 | 2,698,682 |
| Energy Southeast Ala Coop Dist Energy Supply Rev Series 2023B 1, 5.75% tender 4/1/2054 (Morgan Stanley Guaranteed) (b) | | 1,460,000 | 1,607,253 |
| Jefferson Cntyl Ala Gen. Oblig. 5% 4/1/2026 | | 145,000 | 148,334 |
| Lower Ala Gas Dist Gas Proj Rev 4% tender 12/1/2050 (Goldman Sachs Group Inc/The Guaranteed) (b) | | 2,080,000 | 2,082,890 |
| Southeast Energy Auth Commodity Supply Rev Ala 5.5% tender 1/1/2053 (Morgan Stanley Guaranteed) (b) | | 7,400,000 | 7,882,104 |
| Southeast Energy Auth Commodity Supply Rev Ala Series 2022 B 1, 5% tender 5/1/2053 (Goldman Sachs Group Inc/The Guaranteed) (b) | | 1,970,000 | 2,034,759 |
| Southeast Energy Authority A Cooperative District Series 2024C, 5% tender 11/1/2055 (Pacific Life Insurance Co Guaranteed) (b) | | 14,805,000 | 15,738,740 |
| | | | 72,625,765 |
| Health Care - 0.2% | | | |
| Huntsville AL Hlth Care Auth (Huntsville Hospital Al Proj.) Series 2023 A, 5% tender 6/1/2053 (b) | | 915,000 | 973,932 |
| Infirmary Hlth Sys Spl Care 5% 2/1/2026 | | 1,840,000 | 1,862,034 |
| Infirmary Hlth Sys Spl Care Series 2021 A, 3% 2/1/2046 | | 1,000,000 | 758,750 |
| Montgomery Ala Med Clinic Brd Health Care Fac Rev (Jackson Hospital & Clinic Proj.) Series 2015, 5% (c)(d) | | 255,000 | 94,350 |
| Montgomery Ala Med Clinic Brd Health Care Fac Rev (Jackson Hospital & Clinic Proj.) Series 2015, 5% (c)(d) | | 460,000 | 170,200 |
| | | | 3,859,266 |
TOTAL ALABAMA | | | 86,926,712 |
| Alaska - 0.1% | | | |
| General Obligations - 0.1% | | | |
| Alaska Municipal Bond Bank Authority Series 2016, 5% 12/1/2029 (e) | | 1,690,000 | 1,729,364 |
| Housing - 0.0% | | | |
| Alaska Hsg Fin Corp Mtg Rev Series 2022A, 3% 6/1/2051 | | 175,000 | 169,663 |
| Alaska St Hsg Fin Corp (AK Hfc Cap Proj Bonds II 10/1/12 Proj.) Series 2021 A, 4% 12/1/2029 | | 290,000 | 299,099 |
| Alaska St Hsg Fin Corp (AK Hfc Cap Proj Bonds II 10/1/12 Proj.) Series 2021 A, 4% 6/1/2026 | | 175,000 | 176,920 |
| Alaska St Hsg Fin Corp (AK Hfc Cap Proj Bonds II 10/1/12 Proj.) Series 2021 A, 5% 12/1/2028 | | 400,000 | 427,247 |
| Alaska St Hsg Fin Corp (AK Hfc Cap Proj Bonds II 10/1/12 Proj.) Series 2021 A, 5% 6/1/2029 | | 300,000 | 322,127 |
| | | | 1,395,056 |
TOTAL ALASKA | | | 3,124,420 |
| Arizona - 3.3% | | | |
| Education - 0.0% | | | |
| Arizona Indl Dev Auth Rev (Provident Group Emu Properties LLC Proj.) Series 2018, 5% (c) | | 55,000 | 30,250 |
| Arizona Indl Dev Auth Rev (Provident Group Emu Properties LLC Proj.) Series 2018, 5% (c) | | 55,000 | 30,250 |
| Arizona St Univ Revs Series 2021 C, 5% 7/1/2037 | | 340,000 | 371,400 |
| Arizona St Univ Revs Series 2021 C, 5% 7/1/2038 | | 550,000 | 598,806 |
| Maricopa County Industrial Development Authority (Creighton University Proj.) Series 2020, 5% 7/1/2047 | | 175,000 | 180,485 |
| | | | 1,211,191 |
| Electric Utilities - 0.1% | | | |
| Coconino Cnty AZ Poll Ctl Corp (Nevada Power Co Proj.) Series 2017 B, 3.75% tender 3/1/2039 (b) | | 900,000 | 897,078 |
| Coconino Cnty AZ Poll Ctl Corp (Nevada Power Co Proj.) Series 2017A, 4.125% tender 9/1/2032 (b)(e) | | 545,000 | 543,917 |
| | | | 1,440,995 |
| General Obligations - 0.4% | | | |
| Industrial Development Authority of the City of Phoenix Arizona/The (Guam Govt Proj.) Series 2014, 5.375% 2/1/2041 | | 1,460,000 | 1,338,648 |
| Industrial Development Authority of the City of Phoenix Arizona/The Series 2014, 5.125% 2/1/2034 (Guam Govt Guaranteed) | | 990,000 | 937,401 |
| Maricopa Cnty AZ School District No 1 Phoenix Elementary 5% 7/1/2040 (Build America Mutual Assurance Co Insured) | | 1,000,000 | 1,102,853 |
| Pima Cnty AZ Unified Sch Dist No 1 Tucson Series 2024 A, 5% 7/1/2033 (Assured Guaranty Municipal Corp Insured) | | 1,395,000 | 1,582,034 |
| Pima Cnty AZ Unified Sch Dist No 1 Tucson Series 2024 A, 5% 7/1/2035 (Assured Guaranty Municipal Corp Insured) | | 1,300,000 | 1,459,140 |
| Pima Cnty AZ Unified Sch Dist No 1 Tucson Series 2024 A, 5% 7/1/2039 (Assured Guaranty Municipal Corp Insured) | | 1,500,000 | 1,655,872 |
| Salt Verde Finl Corp Gas Rev AZ 5.5% 12/1/2029 (Citigroup Inc Guaranteed) | | 450,000 | 482,044 |
| | | | 8,557,992 |
| Health Care - 1.5% | | | |
| Arizona Health Facs Auth Rev (Banner Health System Proj.) Series 2007B, S&P Muni 7 Day High Grade Rate Index + 0.81%, 4.08% tender 1/1/2037 (b)(f) | | 150,000 | 146,330 |
| Arizona Indl Dev Auth Hosp Rev (Phoenix Childrens Hospital Proj.) 3% 2/1/2045 | | 4,525,000 | 3,654,951 |
| Arizona Indl Dev Auth Hosp Rev (Phoenix Childrens Hospital Proj.) 5% 2/1/2029 | | 410,000 | 439,101 |
| Glendale Ariz Indl Dev Auth Rev (Humangood National Obligated Grp Proj.) Series 2018 A, 5% 7/1/2038 | | 15,000 | 14,755 |
| Glendale Ariz Indl Dev Auth Rev (Humangood National Obligated Grp Proj.) Series 2018 A, 5% 7/1/2048 | | 20,000 | 18,204 |
| Glendale Ariz Indl Dev Auth Sr Living Facs Rev (Royal Oaks Senior Living Cmnty Proj.) 5% 5/15/2056 | | 3,615,000 | 3,342,043 |
| Maricopa Cnty Ariz Indl Dev Auth Hosp Rev (Honorhealth Proj.) Series 2021 A, 3% 9/1/2051 | | 4,875,000 | 3,608,210 |
| Maricopa Cnty Ariz Indl Dev Auth Hosp Rev (Honorhealth Proj.) Series 2021 A, 4% 9/1/2051 | | 295,000 | 272,487 |
| Maricopa Cnty AZ Ida Rev (Banner Health System Proj.) 5% tender 1/1/2053 (b) | | 2,110,000 | 2,153,116 |
| Maricopa Cnty AZ Ida Rev (Banner Health System Proj.) Series 2017 D, 3% 1/1/2048 | | 1,260,000 | 1,018,451 |
| Maricopa Cnty AZ Ida Rev (Banner Health System Proj.) Series 2019 E, 3% 1/1/2049 | | 745,000 | 597,467 |
| Maricopa Cnty AZ Ida Rev (Banner Health System Proj.) Series 2023 A 2, 5% tender 1/1/2053 (b) | | 2,180,000 | 2,303,370 |
| Maricopa Cnty AZ Ida Sr Living (Christian Care Surprise Proj.) 5.75% 1/1/2036 (g) | | 250,000 | 223,818 |
| Maricopa Cnty AZ Ida Sr Living (Christian Care Surprise Proj.) 6% 1/1/2048 (g) | | 395,000 | 322,482 |
| Pima Cnty AZ Indl Dev Auth Rev (Tucson Medical Center Proj.) Series 2021, 3% 4/1/2051 | | 16,380,000 | 11,778,251 |
| Pima Cnty AZ Indl Dev Auth Rev (Tucson Medical Center Proj.) Series 2021, 4% 4/1/2046 | | 1,905,000 | 1,768,168 |
| Tempe AZ Indl Dev Auth Rev (Friendship Village of Tempe,Az Proj.) Series 2021A, 4% 12/1/2046 | | 480,000 | 404,731 |
| | | | 32,065,935 |
| Housing - 0.0% | | | |
| Arizona Indl Dev Auth Rev (Lihtc Cert 2019-2 Proj.) Series 2 Class A, 3.625% 5/20/2033 | | 902,417 | 854,812 |
| Industrial Development - 1.1% | | | |
| Chandler AZ Indl Deve Auth Idr (Intel Corp Proj.) 5% tender 9/1/2052 (b)(e) | | 17,910,000 | 18,259,832 |
| Chandler AZ Indl Deve Auth Idr (Intel Corp Proj.) Series 2005, 3.8% tender 12/1/2035 (b) | | 4,930,000 | 4,960,626 |
| Chandler AZ Indl Deve Auth Idr (Intel Corp Proj.) Series 2007, 4.1% tender 12/1/2037 (b)(e) | | 2,080,000 | 2,077,202 |
| | | | 25,297,660 |
| Special Tax - 0.0% | | | |
| Glendale AZ (Glendale AZ Excise Tax Proj.) 5% 7/1/2031 | | 190,000 | 197,612 |
| Transportation - 0.2% | | | |
| Phoenix AZ Cvc Imp Crp Apr Rev 5% 7/1/2029 | | 125,000 | 130,617 |
| Phoenix AZ Cvc Imp Crp Apr Rev 5% 7/1/2036 (e) | | 90,000 | 91,939 |
| Phoenix AZ Cvc Imp Crp Apr Rev 5% 7/1/2037 (e) | | 65,000 | 66,319 |
| Phoenix AZ Cvc Imp Crp Apr Rev Series 2019 B, 5% 7/1/2049 (e) | | 2,315,000 | 2,357,551 |
| Phoenix AZ Cvc Imp Crp Apr Rev Series 2019B, 5% 7/1/2035 (e) | | 720,000 | 750,490 |
| Phoenix AZ Cvc Imp Crp Apr Rev Series A, 5% 7/1/2033 (e) | | 55,000 | 56,404 |
| Phoenix AZ Cvc Imp Crp Apr Rev Series B, 5% 7/1/2033 | | 175,000 | 181,792 |
| Phoenix AZ Cvc Imp Crp Apr Rev Series B, 5% 7/1/2036 | | 205,000 | 212,125 |
| Phoenix AZ Cvc Imp Crp Apr Rev Series B, 5% 7/1/2037 | | 125,000 | 129,185 |
| | | | 3,976,422 |
| Water & Sewer - 0.0% | | | |
| Phoenix Arizona Civic Imp Wtr 5% 7/1/2045 | | 410,000 | 436,751 |
TOTAL ARIZONA | | | 74,039,370 |
| Arkansas - 0.0% | | | |
| Health Care - 0.0% | | | |
| Arkansas St Dev Fin Auth Hosp Rev (Washington Regl Med Center Proj.) Series 2024, 5% 2/1/2034 | | 250,000 | 257,816 |
| California - 2.7% | | | |
| Electric Utilities - 0.1% | | | |
| Los Angeles CA Wtr & Pwr Rev Series 2020 B, 5% 7/1/2050 | | 1,435,000 | 1,524,035 |
| General Obligations - 0.4% | | | |
| Abc Calif Uni Sch Dist 0% 8/1/2028 (National Public Finance Guarantee Corporation Insured) (h) | | 200,000 | 177,922 |
| California St Pub Wks Brd Lse 5% 8/1/2031 | | 190,000 | 213,569 |
| California St Pub Wks Brd Lse 5% 8/1/2034 | | 350,000 | 389,741 |
| Folsom Cordova Calif Uni Sch Dist Sch Facs Impt Dist No 4 (Folsom-Cordova CA Sch Fac Impr Dist Proj.) Gen. Oblig. Series A, 0% 10/1/2031 (National Public Finance Guarantee Corporation Insured) (h) | | 90,000 | 71,696 |
| Kern Calif Cmnty College Dist Gen. Oblig. 0% 11/1/2028 (Assured Guaranty Municipal Corp Insured) (h) | | 250,000 | 219,601 |
| Kern Calif Cmnty College Dist Gen. Oblig. 0% 11/1/2030 (Assured Guaranty Municipal Corp Insured) (h) | | 255,000 | 208,239 |
| Long Beach CA Uni Sch Dist Series 2009A, 5.5% 8/1/2029 | | 10,000 | 10,082 |
| Los Angeles CA Uni Sch Dist Cp (Los Angeles Unified School District/CA Proj.) Series 2023 A, 5% 10/1/2037 | | 1,225,000 | 1,387,703 |
| Monrovia Calif Uni Sch Dist 0% 8/1/2029 (National Public Finance Guarantee Corporation Insured) (h) | | 230,000 | 196,589 |
| Mt Diablo CA Unified Sch Dist 4% 8/1/2031 | | 285,000 | 303,929 |
| Poway CA Unified Sch Dist 0% 8/1/2032 (h) | | 300,000 | 232,814 |
| Poway CA Unified Sch Dist 0% 8/1/2037 (h) | | 395,000 | 249,937 |
| Poway CA Unified Sch Dist 0% 8/1/2038 (h) | | 2,625,000 | 1,590,174 |
| Poway CA Unified Sch Dist 0% 8/1/2039 (h) | | 1,410,000 | 814,388 |
| Poway CA Unified Sch Dist 0% 8/1/2041 (h) | | 200,000 | 104,588 |
| Poway CA Unified Sch Dist 0% 8/1/2046 (h) | | 60,000 | 23,100 |
| San Diego CA Uni Sch Dist 0% 7/1/2034 (h) | | 180,000 | 130,542 |
| San Diego CA Uni Sch Dist 0% 7/1/2047 (i) | | 440,000 | 349,451 |
| San Marcos Unified School District 0% 8/1/2047 (h) | | 1,075,000 | 405,514 |
| San Mateo Cnty Calif Cmnty Col Dist Gen. Oblig. 0% 9/1/2026 (National Public Finance Guarantee Corporation Insured) (h) | | 275,000 | 261,054 |
| State of California Gen. Oblig. 4% 11/1/2037 | | 575,000 | 592,562 |
| State of California Gen. Oblig. 5.25% 12/1/2033 | | 10,000 | 10,013 |
| State of California Gen. Oblig. Series 2016, 5% 9/1/2029 | | 110,000 | 113,468 |
| State of California Gen. Oblig. Series CU, 4.75% 12/1/2042 | | 1,825,000 | 1,897,525 |
| Washington Twp CA Health Care Dist (Washington Twp CA Hosp Dist Proj.) Gen. Oblig. Series 2013A, 5.5% 8/1/2038 | | 230,000 | 230,580 |
| | | | 10,184,781 |
| Health Care - 0.0% | | | |
| California Statewide Community Development Authority Rev (Beverly Hospital Proj.) Series 2015, 5% (c)(d) | | 50,873 | 43,242 |
| Housing - 0.2% | | | |
| California Hsg Fin Agy Mun Ctfs (Lihtc 2021-1 CA Proj.) Series 1 Class A, 3.5% 11/20/2035 | | 1,810,849 | 1,724,973 |
| California Hsg Fin Agy Mun Ctfs (Lihtc 2023-1 CA Proj.) Series 1 Class A, 4.375% 9/20/2036 | | 2,696,853 | 2,757,777 |
| | | | 4,482,750 |
| Special Tax - 0.0% | | | |
| Poway Calif Uni Sch Dist Pub Fing Auth Spl Tax Rev (Poway Del Sur Cfd 2006 Proj.) Series 2015A, 5% 9/1/2026 | | 65,000 | 65,653 |
| Poway Calif Uni Sch Dist Pub Fing Auth Spl Tax Rev (Poway Del Sur Cfd 2006 Proj.) Series 2015A, 5% 9/1/2029 | | 135,000 | 136,177 |
| Poway Calif Uni Sch Dist Pub Fing Auth Spl Tax Rev (Poway Del Sur Cfd 2006 Proj.) Series 2015A, 5% 9/1/2031 | | 60,000 | 60,496 |
| Sacramento CA Fin Auth 0% 12/1/2026 (National Public Finance Guarantee Corporation Insured) (h) | | 255,000 | 238,221 |
| | | | 500,547 |
| Tobacco Bonds - 0.1% | | | |
| Golden State Tobacco Securitization Corp. Tobacco Settlement Series 2021 B 2, 0% 6/1/2066 (h) | | 26,290,000 | 2,780,819 |
| Transportation - 1.4% | | | |
| Alameda Corridor CA Tran Auth Rev Series 2024A, 0% 10/1/2052 (Assured Guaranty Municipal Corp Insured) (h) | | 1,350,000 | 368,816 |
| Bay Area Toll Au CA Bridge Rev 2% tender 4/1/2056 (b) | | 1,000,000 | 949,886 |
| Foothill/Estrn Transn CA Toll Series B 1, 3.95% 1/15/2053 (b) | | 1,000,000 | 941,052 |
| Fresno Calif Arpt Rev Series 2023A, 5% 7/1/2033 (Build America Mutual Assurance Co Insured) (e) | | 1,000,000 | 1,096,610 |
| Los Angeles CA Dept Arpts Rev Series 2019 F, 5% 5/15/2031 (e) | | 1,330,000 | 1,405,867 |
| Los Angeles CA Hbr Dept Rev Series 2019 A, 5% 8/1/2025 (e) | | 255,000 | 257,127 |
| San Diego Cnty CA Reg Arpt Auth Arpt Rev Series 2023B, 5.25% 7/1/2036 (e) | | 4,000,000 | 4,453,561 |
| San Diego Cnty CA Reg Arpt Auth Arpt Rev Series 2023B, 5.25% 7/1/2038 (e) | | 2,500,000 | 2,762,878 |
| San Francisco CA City & County Airports Commission International Airport Revenue (Sfo Fuel CO LLC Proj.) Series 2019 A, 5% 1/1/2035 (e) | | 360,000 | 375,815 |
| San Francisco CA City & County Airports Commission International Airport Revenue 5% 5/1/2026 (e) | | 920,000 | 938,276 |
| San Francisco CA City & County Airports Commission International Airport Revenue 5% 5/1/2027 (e) | | 930,000 | 960,444 |
| San Francisco CA City & County Airports Commission International Airport Revenue 5% 5/1/2028 (e) | | 1,245,000 | 1,300,157 |
| San Francisco CA City & County Airports Commission International Airport Revenue 5% 5/1/2029 (e) | | 835,000 | 881,684 |
| San Francisco CA City & County Airports Commission International Airport Revenue 5% 5/1/2052 | | 2,525,000 | 2,699,499 |
| San Francisco CA City & County Airports Commission International Airport Revenue Series 2019 A, 5% 5/1/2049 (e) | | 3,960,000 | 4,044,149 |
| San Francisco CA City & County Airports Commission International Airport Revenue Series 2024 A, 5.25% 5/1/2044 (e) | | 2,200,000 | 2,370,357 |
| San Francisco CA City & County Airports Commission International Airport Revenue Series 2024 A, 5.25% 5/1/2049 (e) | | 1,840,000 | 1,959,463 |
| San Francisco CA City & County Airports Commission International Airport Revenue Series SECOND 2019E, 5% 5/1/2050 (e) | | 395,000 | 403,123 |
| | | | 28,168,764 |
| Water & Sewer - 0.5% | | | |
| Castaic Lake Wtr Agy CA Ctfs Series 1999 A, 0% 8/1/2026 (Ambac Assurance Corp Insured) (h) | | 10,445,000 | 9,948,193 |
| Los Angeles CA Dep Wtr & Pwr Wtrwks Rev Series 2020A, 5% 7/1/2040 | | 30,000 | 32,702 |
| San Diego County Water Authority 5% 5/1/2047 | | 685,000 | 743,953 |
| San Diego County Water Authority 5% 5/1/2052 | | 1,160,000 | 1,250,302 |
| | | | 11,975,150 |
TOTAL CALIFORNIA | | | 59,660,088 |
| Colorado - 2.5% | | | |
| Education - 0.0% | | | |
| University Colo Enterprise Sys Series 2021 C 3B, 2% tender 6/1/2051 (b) | | 260,000 | 252,139 |
| University Colo Enterprise Sys Series 2021C 3A, 2% tender 6/1/2051 (b) | | 305,000 | 300,774 |
| | | | 552,913 |
| Electric Utilities - 0.0% | | | |
| Arkansas River Pwr Auth Colo Pwr Rev 5% 10/1/2038 | | 125,000 | 127,099 |
| Arkansas River Pwr Auth Colo Pwr Rev 5% 10/1/2043 | | 160,000 | 161,707 |
| | | | 288,806 |
| Escrowed/Pre-Refunded - 0.0% | | | |
| Colorado Health Facilities Authority 4% 9/1/2035 (Pre-refunded to 9/1/2026 at 100) | | 85,000 | 86,134 |
| Colorado Health Facilities Authority 4% 9/1/2036 (Pre-refunded to 9/1/2026 at 100) | | 65,000 | 65,867 |
| Colorado Health Facilities Authority Series 2020A, 4% 9/1/2050 (Pre-refunded to 9/1/2030 at 100) | | 305,000 | 323,801 |
| | | | 475,802 |
| Health Care - 1.1% | | | |
| Colorado Health Facilities Authority (Advent Health Proj.) Series 2019 A, 5% 11/15/2039 | | 700,000 | 742,311 |
| Colorado Health Facilities Authority (Advent Health Proj.) Series A 1, 5% tender 11/15/2058 (b) | | 6,390,000 | 6,805,716 |
| Colorado Health Facilities Authority (CommonSpirit Health Proj.) Series 2019 A 1, 4% 8/1/2044 | | 4,960,000 | 4,627,767 |
| Colorado Health Facilities Authority (CommonSpirit Health Proj.) Series 2019 A 2, 3.25% 8/1/2049 | | 1,070,000 | 830,575 |
| Colorado Health Facilities Authority (CommonSpirit Health Proj.) Series 2019 A 2, 4% 8/1/2049 | | 1,240,000 | 1,109,595 |
| Colorado Health Facilities Authority (CommonSpirit Health Proj.) Series 2019 A 2, 5% 8/1/2044 | | 4,585,000 | 4,708,090 |
| Colorado Health Facilities Authority (IHC Health Services Inc Proj.) Series 2022 A, 5% 5/15/2047 | | 2,030,000 | 2,156,784 |
| Colorado Health Facilities Authority (Sanford Health, SD Proj.) 5% 11/1/2025 | | 540,000 | 547,999 |
| Denver CO Hlth Hsp Ath Hlcr Rv Series 2019 A, 4% 12/1/2038 | | 1,250,000 | 1,185,837 |
| Denver CO Hlth Hsp Ath Hlcr Rv Series 2019 A, 4% 12/1/2039 | | 1,720,000 | 1,622,183 |
| | | | 24,336,857 |
| Housing - 0.2% | | | |
| Colorado Hsg Fin Auth (CO Single Family Mortgage Proj.) Series 2019 F, 4.25% 11/1/2049 | | 105,000 | 105,661 |
| Colorado Hsg Fin Auth (CO Single Family Mortgage Proj.) Series 2019 H, 4.25% 11/1/2049 | | 165,000 | 166,026 |
| Colorado Hsg Fin Auth (CO Single Family Mortgage Proj.) Series 2021 E, 3% 11/1/2051 | | 460,000 | 449,152 |
| Colorado Hsg Fin Auth (CO Single Family Mortgage Proj.) Series 2022F, 5.25% 11/1/2052 | | 500,000 | 516,393 |
| Maiker Hsg Partners Colo Multifamily Hsg Rev Series 2023, 4.5% tender 5/1/2042 (b) | | 2,050,000 | 2,051,419 |
| | | | 3,288,651 |
| Special Tax - 0.1% | | | |
| Independence Metropolitan District No 3 Series 2024 A, 5.375% 12/1/2054 | | 500,000 | 496,162 |
| Regional Transn Dist CO Sales Series 2021 B, 5% 11/1/2028 | | 1,030,000 | 1,109,600 |
| Vauxmont Metropolitan District 5% 12/1/2033 (Assured Guaranty Municipal Corp Insured) | | 75,000 | 80,324 |
| Vauxmont Metropolitan District 5% 12/15/2032 (Assured Guaranty Municipal Corp Insured) | | 47,000 | 48,446 |
| | | | 1,734,532 |
| Transportation - 0.8% | | | |
| Denver CO City & Cnty Arpt Series 2017 A, 5% 11/15/2026 (e) | | 175,000 | 179,880 |
| Denver CO City & Cnty Arpt Series 2017 A, 5% 11/15/2027 (e) | | 150,000 | 155,995 |
| Denver CO City & Cnty Arpt Series 2018 A, 4% 12/1/2043 (e) | | 9,260,000 | 8,795,242 |
| Denver CO City & Cnty Arpt Series 2018 A, 5% 12/1/2027 (e) | | 3,220,000 | 3,346,169 |
| Denver CO City & Cnty Arpt Series 2018 A, 5% 12/1/2030 (e) | | 390,000 | 418,552 |
| Denver CO City & Cnty Arpt Series 2018 A, 5% 12/1/2034 (e) | | 260,000 | 281,327 |
| Denver CO City & Cnty Arpt Series 2018 A, 5% 12/1/2036 (e) | | 255,000 | 262,719 |
| Denver CO City & Cnty Arpt Series 2018 A, 5% 12/1/2037 (e) | | 505,000 | 519,224 |
| Denver CO City & Cnty Arpt Series 2022A, 5% 11/15/2033 (e) | | 3,815,000 | 4,119,329 |
| E-470 Pub Hwy Auth Colo Rev 5% 9/1/2036 | | 705,000 | 761,450 |
| | | | 18,839,887 |
| Water & Sewer - 0.3% | | | |
| Denver CO City & Cnty Brd Wtr 5% 9/15/2028 | | 770,000 | 828,247 |
| Denver CO City & Cnty Brd Wtr 5% 9/15/2029 | | 1,430,000 | 1,564,419 |
| Denver CO City & Cnty Brd Wtr Series 2020 A, 5% 9/15/2045 | | 1,550,000 | 1,646,326 |
| Denver CO City & Cnty Brd Wtr Series 2020 A, 5% 9/15/2046 | | 2,375,000 | 2,519,035 |
| | | | 6,558,027 |
TOTAL COLORADO | | | 56,075,475 |
| Connecticut - 1.9% | | | |
| Education - 0.2% | | | |
| Connecticut St Health & Edl Facs Auth Revenue (Connecticut College, CT Proj.) Series M, 4% 7/1/2052 | | 570,000 | 521,028 |
| Connecticut St Health & Edl Facs Auth Revenue (Greenwich Academy Proj.) Series G, 4% 3/1/2046 | | 305,000 | 300,841 |
| Connecticut St Health & Edl Facs Auth Revenue (Greenwich Academy Proj.) Series G, 4% 3/1/2051 | | 490,000 | 476,511 |
| Connecticut St Health & Edl Facs Auth Revenue (Yale University Proj.) Series 2010A 3, 2.95% tender 7/1/2049 (b) | | 3,115,000 | 3,088,569 |
| Connecticut State Health & Educational Facilities Authority (Sacred Heart University, CT Proj.) 5% 7/1/2026 | | 25,000 | 25,641 |
| Connecticut State Health & Educational Facilities Authority (Sacred Heart University, CT Proj.) 5% 7/1/2027 | | 20,000 | 20,827 |
| Connecticut State Health & Educational Facilities Authority (Sacred Heart University, CT Proj.) 5% 7/1/2028 | | 30,000 | 31,102 |
| Connecticut State Health & Educational Facilities Authority (Sacred Heart University, CT Proj.) 5% 7/1/2029 | | 20,000 | 20,725 |
| Connecticut State Health & Educational Facilities Authority (University of New Haven, CT Proj.) 5% 7/1/2043 | | 605,000 | 601,505 |
| Connecticut State Health & Educational Facilities Authority (University of New Haven, CT Proj.) Series K 1, 5% 7/1/2027 | | 25,000 | 25,549 |
| Connecticut State Health & Educational Facilities Authority (University of New Haven, CT Proj.) Series K 1, 5% 7/1/2029 | | 65,000 | 66,755 |
| Connecticut State Health & Educational Facilities Authority (University of New Haven, CT Proj.) Series K 1, 5% 7/1/2030 | | 50,000 | 51,279 |
| Connecticut State Health & Educational Facilities Authority (University of New Haven, CT Proj.) Series K 1, 5% 7/1/2031 | | 410,000 | 419,784 |
| Connecticut State Health & Educational Facilities Authority (University of New Haven, CT Proj.) Series K 1, 5% 7/1/2033 | | 80,000 | 81,533 |
| Connecticut State Health & Educational Facilities Authority (University of New Haven, CT Proj.) Series K 1, 5% 7/1/2034 | | 580,000 | 589,662 |
| | | | 6,321,311 |
| General Obligations - 0.3% | | | |
| Connecticut St Gen. Oblig. 5% 9/15/2028 | | 295,000 | 316,241 |
| Connecticut St Gen. Oblig. Series 2015 B, 5% 6/15/2032 | | 145,000 | 145,908 |
| Connecticut St Gen. Oblig. Series 2018 A, 5% 4/15/2037 | | 680,000 | 711,066 |
| Connecticut St Gen. Oblig. Series 2018 F, 5% 9/15/2025 | | 165,000 | 167,247 |
| Connecticut St Gen. Oblig. Series 2021 A, 3% 1/15/2039 | | 380,000 | 334,542 |
| Connecticut St Gen. Oblig. Series 2021 A, 3% 1/15/2040 | | 295,000 | 257,279 |
| Connecticut St Gen. Oblig. Series B, 5% 5/15/2026 | | 365,000 | 375,098 |
| Connecticut St Health & Edl Facs Auth Revenue (Connecticut St Univ Sys Proj.) Series Q 1, 5% 11/1/2026 (Connecticut St Guaranteed) | | 255,000 | 263,786 |
| New Britain Conn Gen. Oblig. Series 2017 C, 5% 3/1/2029 (Assured Guaranty Municipal Corp Insured) | | 55,000 | 57,080 |
| New Haven CT Gen. Oblig. Series 2024, 5% 8/1/2030 (Assured Guaranty Municipal Corp Insured) | | 2,470,000 | 2,708,751 |
| University Connecticut (Connecticut St Proj.) Series 2019 A, 5% 11/1/2036 | | 1,500,000 | 1,579,476 |
| University Connecticut (Connecticut St Proj.) Series 2019 A, 5% 11/1/2025 | | 260,000 | 264,131 |
| | | | 7,180,605 |
| Health Care - 0.4% | | | |
| Connecticut St Health & Edl Facs Auth Revenue (Bristol Hospital, CT Proj.) Series 2019A, 5% 7/1/2026 (d)(g) | | 350,000 | 227,500 |
| Connecticut St Health & Edl Facs Auth Revenue (Bristol Hospital, CT Proj.) Series 2019A, 5% 7/1/2027 (d)(g) | | 205,000 | 133,250 |
| Connecticut St Health & Edl Facs Auth Revenue (Bristol Hospital, CT Proj.) Series 2019A, 5% 7/1/2049 (d)(g) | | 420,000 | 273,000 |
| Connecticut St Health & Edl Facs Auth Revenue (Connecticut Childrens Med Ctr Proj.) Series E, 5% 7/15/2041 | | 1,750,000 | 1,845,345 |
| Connecticut St Health & Edl Facs Auth Revenue (Hartford HealthCare Corp Proj.) 4% 7/1/2040 | | 390,000 | 374,826 |
| Connecticut St Health & Edl Facs Auth Revenue (Nuvance Health Proj.) Series 2019 A, 4% 7/1/2049 | | 1,000,000 | 892,382 |
| Connecticut St Health & Edl Facs Auth Revenue (Nuvance Health Proj.) Series 2019 A, 5% 7/1/2026 | | 2,875,000 | 2,919,171 |
| Connecticut St Health & Edl Facs Auth Revenue (Stamford Hospital, CT Proj.) 4% 7/1/2039 | | 585,000 | 570,013 |
| Connecticut State Health & Educational Facilities Authority (Stamford Hospital, CT Proj.) 4% 7/1/2046 | | 445,000 | 409,188 |
| | | | 7,644,675 |
| Housing - 0.3% | | | |
| Connecticut St Hsg Fin Auth Hsg Mtg Fin Prog (CT Hsg Mortgage Proj.) 3% 11/15/2049 | | 285,000 | 277,664 |
| Connecticut St Hsg Fin Auth Hsg Mtg Fin Prog (CT Hsg Mortgage Proj.) 5% 11/15/2025 (e) | | 260,000 | 262,897 |
| Connecticut St Hsg Fin Auth Hsg Mtg Fin Prog (CT Hsg Mortgage Proj.) Series 2023 A, 5.25% 11/15/2053 | | 6,420,000 | 6,752,144 |
| | | | 7,292,705 |
| Special Tax - 0.7% | | | |
| Connecticut St Gen. Oblig. 4% 1/15/2036 | | 535,000 | 552,453 |
| Connecticut St Spl Tax Oblig Series 2024A 2, 5% 7/1/2036 | | 4,675,000 | 5,336,970 |
| Connecticut St Spl Tax Oblig Series 2024A 2, 5% 7/1/2043 | | 5,965,000 | 6,585,431 |
| Connecticut St Spl Tax Oblig Series A, 5% 9/1/2028 | | 425,000 | 437,617 |
| Harbor Point Infrastructure Impt Dist Conn Spl Oblig Rev Series 2017, 5% 4/1/2030 (g) | | 130,000 | 131,811 |
| Harbor Point Infrastructure Impt Dist Conn Spl Oblig Rev Series 2017, 5% 4/1/2039 (g) | | 295,000 | 296,538 |
| Steelpoint Harbor CT Infrastructure Impt Dist Spl Oblig Rev Series 2021, 4% 4/1/2051 (g) | | 655,000 | 546,210 |
| Steelpoint Harbor CT Infrastructure Impt Dist Spl Oblig Rev Series 2024, 6% 4/1/2052 (g) | | 405,000 | 430,676 |
| | | | 14,317,706 |
TOTAL CONNECTICUT | | | 42,757,002 |
| Delaware - 0.0% | | | |
| General Obligations - 0.0% | | | |
| Delaware St Gen. Oblig. Series 2019, 5% 2/1/2030 | | 294,000 | 318,176 |
| Delaware St Gen. Oblig. Series 2020 A, 5% 1/1/2031 | | 294,000 | 323,466 |
| | | | 641,642 |
TOTAL DELAWARE | | | 641,642 |
| District Of Columbia - 0.7% | | | |
| Education - 0.1% | | | |
| District Columbia Rev (Catholic Univ of Amer WA DC Proj.) 5% 10/1/2048 | | 2,100,000 | 2,116,933 |
| General Obligations - 0.2% | | | |
| District Columbia Gen. Oblig. Series 2021 D, 4% 2/1/2027 | | 380,000 | 387,846 |
| District Columbia Gen. Oblig. Series 2021 D, 5% 2/1/2028 | | 380,000 | 403,790 |
| District Columbia Gen. Oblig. Series 2021 D, 5% 2/1/2029 | | 505,000 | 545,936 |
| District Columbia Gen. Oblig. Series 2021 E, 5% 2/1/2027 | | 1,285,000 | 1,339,647 |
| District Columbia Gen. Oblig. Series 2021 E, 5% 2/1/2029 | | 1,070,000 | 1,156,735 |
| | | | 3,833,954 |
| Special Tax - 0.2% | | | |
| Washington Metropolitan Area Transit Authority Series 2024 A, 5% 7/15/2056 | | 4,430,000 | 4,687,779 |
| Transportation - 0.2% | | | |
| Metropolitan Wash DC Arpts Ath 5% 10/1/2027 (e) | | 225,000 | 233,610 |
| Metropolitan Wash DC Arpts Ath 5% 10/1/2028 (e) | | 115,000 | 120,660 |
| Metropolitan Wash DC Arpts Ath 5% 10/1/2028 (e) | | 335,000 | 345,081 |
| Metropolitan Wash DC Arpts Ath 5% 10/1/2030 (e) | | 415,000 | 427,177 |
| Metropolitan Wash DC Arpts Ath 5% 10/1/2031 (e) | | 75,000 | 77,145 |
| Metropolitan Wash DC Arpts Ath 5% 10/1/2032 (e) | | 115,000 | 118,169 |
| Metropolitan Wash DC Arpts Ath 5% 10/1/2033 (e) | | 55,000 | 56,443 |
| Metropolitan Wash DC Arpts Ath 5% 10/1/2035 (e) | | 125,000 | 127,735 |
| Metropolitan Wash DC Arpts Ath Series 2019A, 5% 10/1/2025 (e) | | 180,000 | 181,865 |
| Metropolitan Wash DC Arpts Auth Dulles Toll Rd Rev Series 2019 A, 5% 10/1/2031 | | 210,000 | 223,444 |
| Metropolitan Wash DC Arpts Auth Dulles Toll Rd Rev Series 2019 A, 5% 10/1/2032 | | 265,000 | 281,801 |
| Metropolitan Wash DC Arpts Auth Dulles Toll Rd Rev Series 2019 B, 3% 10/1/2050 (Assured Guaranty Municipal Corp Insured) | | 1,290,000 | 967,354 |
| Metropolitan Wash DC Arpts Auth Dulles Toll Rd Rev Series 2019 B, 4% 10/1/2049 | | 3,010,000 | 2,780,872 |
| | | | 5,941,356 |
TOTAL DISTRICT OF COLUMBIA | | | 16,580,022 |
| Florida - 4.1% | | | |
| Education - 0.6% | | | |
| Cap Proj Fin Auth FL Student Hsg Rev (Capfa Capital Corp 2000 F Proj.) 5% 10/1/2030 | | 220,000 | 231,372 |
| Florida Atlantic University Finance Corp Series 2024, 5% 7/1/2039 | | 1,045,000 | 1,146,525 |
| Florida Atlantic University Finance Corp Series 2024, 5% 7/1/2049 | | 1,435,000 | 1,519,569 |
| Florida Dev Fin Corp Student Hsg Rev (The Henry Stud Hsg Proj.) Series 2024A 1, 5% 6/1/2044 (g) | | 1,700,000 | 1,700,431 |
| Florida Higher Edl Facs Fing Auth Rev (Rollins College, FL Proj.) Series 2024, 5% 12/1/2036 | | 1,445,000 | 1,597,712 |
| Florida Higher Edl Facs Fing Auth Rev (Rollins College, FL Proj.) Series 2024, 5% 12/1/2038 | | 1,580,000 | 1,737,544 |
| Florida Higher Edl Facs Fing Auth Rev (Rollins College, FL Proj.) Series 2024, 5% 12/1/2040 | | 1,750,000 | 1,906,268 |
| Florida Higher Edl Facs Fing Auth Rev (Rollins College, FL Proj.) Series 2024, 5.25% 12/1/2054 | | 3,550,000 | 3,819,568 |
| Volusia Cnty FL Edl Fac Ath Rv (Embry Riddle Aeronaut Univ, FL Proj.) 5% 10/15/2044 | | 65,000 | 67,300 |
| Volusia Cnty FL Edl Fac Ath Rv (Embry Riddle Aeronaut Univ, FL Proj.) 5% 10/15/2049 | | 125,000 | 128,513 |
| | | | 13,854,802 |
| Electric Utilities - 0.0% | | | |
| Florida St Mun Pwr Agy Rev 5% 10/1/2030 | | 110,000 | 112,713 |
| Florida St Mun Pwr Agy Rev 5% 10/1/2031 | | 120,000 | 122,857 |
| Florida St Mun Pwr Agy Rev Series 2015B, 5% 10/1/2028 | | 50,000 | 50,581 |
| Florida St Mun Pwr Agy Rev Series 2015B, 5% 10/1/2030 | | 90,000 | 90,993 |
| | | | 377,144 |
| Escrowed/Pre-Refunded - 0.0% | | | |
| Greater Orlando Aviation Auth 5% 10/1/2029 (Pre-refunded to 10/1/2027 at 100) (e) | | 150,000 | 155,523 |
| Greater Orlando Aviation Auth 5% 10/1/2030 (Pre-refunded to 10/1/2027 at 100) (e) | | 165,000 | 171,076 |
| Greater Orlando Aviation Auth Series 2016 A, 5% 10/1/2046 (Pre-refunded to 10/1/2026 at 100) (e) | | 50,000 | 51,634 |
| Greater Orlando Aviation Auth Series 2017A, 5% 10/1/2025 (Escrowed to Maturity) (e) | | 35,000 | 35,329 |
| Greater Orlando Aviation Auth Series 2017A, 5% 10/1/2027 (Escrowed to Maturity) (e) | | 80,000 | 82,946 |
| | | | 496,508 |
| General Obligations - 0.1% | | | |
| Broward Cnty FL Sch Brd Ctfs Part (Broward County FL School District Proj.) Series 2015A, 5% 7/1/2027 | | 50,000 | 50,447 |
| Broward Cnty FL Sch Brd Ctfs Part (Broward County FL School District Proj.) Series A, 5% 7/1/2028 | | 35,000 | 35,846 |
| Broward Cnty FL Sch Brd Ctfs Part (Broward County FL School District Proj.) Series A, 5% 7/1/2032 | | 110,000 | 112,273 |
| Brvd Cnty FL Sch Bd Ctfs of Prtn (Brevard Cnty FL Sch Dist Proj.) Series C, 5% 7/1/2028 | | 90,000 | 90,787 |
| Duval Cnty FL Sch Brd Ctfs Part (Duval Cnty FL Sch Dist Proj.) Series 2015B, 5% 7/1/2028 | | 105,000 | 105,850 |
| Duval Cnty FL Sch Brd Ctfs Part (Duval Cnty FL Sch Dist Proj.) Series 2016 A, 5% 7/1/2033 | | 70,000 | 71,508 |
| Miami-Dade Cnty FL Sch Brd Ctf (Miami-Dade Cnty FL Sch Dist Proj.) Series 2015A, 5% 5/1/2029 | | 205,000 | 206,071 |
| Miami-Dade Cnty FL Sch Brd Ctf (Miami-Dade Cnty FL Sch Dist Proj.) Series 2016A, 5% 5/1/2032 | | 505,000 | 514,027 |
| Palm Beach Cnty FL Sch Brd (Palm Beach Cnty FL Sch Dist Proj.) Series 2015 D, 5% 8/1/2029 | | 300,000 | 302,532 |
| South Fla Wtr Mgmt Dist Ctfs Partn 5% 10/1/2029 | | 255,000 | 260,707 |
| South Fla Wtr Mgmt Dist Ctfs Partn 5% 10/1/2032 | | 315,000 | 321,351 |
| Volusia Cnty FL Sch Brd Ctfs (Volusia Cnty FL School Dist Proj.) Series 2016A, 5% 8/1/2029 (Build America Mutual Assurance Co Insured) | | 50,000 | 51,011 |
| | | | 2,122,410 |
| Health Care - 1.5% | | | |
| City of Tampa FL (H Lee Moffitt Cancer Ctr Proj.) 4% 7/1/2045 | | 1,230,000 | 1,164,514 |
| City of Tampa FL (H Lee Moffitt Cancer Ctr Proj.) 5% 7/1/2050 | | 1,320,000 | 1,354,164 |
| Escambia Cnty FL Hlth Fac Rev (Baptist Health Care Pensacola Proj.) Series 2020 A, 3% 8/15/2050 (Assured Guaranty Municipal Corp Insured) | | 710,000 | 520,579 |
| Escambia Cnty FL Hlth Fac Rev (Baptist Health Care Pensacola Proj.) Series 2020 A, 4% 8/15/2045 | | 3,620,000 | 3,288,192 |
| Florida Development Finance Corp (Tampa General Hospital, Fl Proj.) Series 2024 B, 5% tender 8/1/2056 (b) | | 2,965,000 | 3,173,978 |
| Hillsborough Cnty Fla Indl Dev (Tampa General Hospital, FL Proj.) Series 2020A, 3.5% 8/1/2055 | | 580,000 | 452,316 |
| Palm Beach Cnty FL Health Facs (Lifespace Proj.) 4% 5/15/2028 | | 1,280,000 | 1,277,419 |
| Palm Beach Cnty FL Health Facs (Lifespace Proj.) Series 2023C, 7.625% 5/15/2058 | | 1,450,000 | 1,634,972 |
| Palm Beach Cnty Fla Health Facs Auth Hosp Rev (Baptist Health Sys of So FL Proj.) Series 2019, 4% 8/15/2049 | | 5,725,000 | 5,321,636 |
| Palm Beach Cnty Fla Health Facs Auth Hosp Rev (Jupiter Medical Center Proj.) 5% 11/1/2031 | | 200,000 | 213,660 |
| Palm Beach Cnty Fla Health Facs Auth Hosp Rev (Jupiter Medical Center Proj.) 5% 11/1/2033 | | 350,000 | 372,264 |
| Palm Beach Cnty Fla Health Facs Auth Hosp Rev (Jupiter Medical Center Proj.) 5% 11/1/2036 | | 370,000 | 387,084 |
| Palm Beach Cnty Fla Health Facs Auth Hosp Rev (Jupiter Medical Center Proj.) 5% 11/1/2038 | | 400,000 | 414,737 |
| Palm Beach Cnty Fla Health Facs Auth Hosp Rev (Jupiter Medical Center Proj.) 5% 11/1/2040 | | 400,000 | 411,474 |
| Palm Beach Cnty Fla Health Facs Auth Hosp Rev (Jupiter Medical Center Proj.) 5% 11/1/2042 | | 500,000 | 510,723 |
| South Miami FL Hlth Fcs Hsp Rv (Baptist Health Sys of So FL Proj.) Series 2017, 4% 8/15/2033 | | 125,000 | 125,909 |
| South Miami FL Hlth Fcs Hsp Rv (Baptist Health Sys of So FL Proj.) Series 2017, 4% 8/15/2047 | | 10,390,000 | 9,860,629 |
| South Miami FL Hlth Fcs Hsp Rv (Baptist Health Sys of So FL Proj.) Series 2017, 5% 8/15/2027 | | 115,000 | 120,066 |
| South Miami FL Hlth Fcs Hsp Rv (Baptist Health Sys of So FL Proj.) Series 2017, 5% 8/15/2028 | | 75,000 | 78,197 |
| South Miami FL Hlth Fcs Hsp Rv (Baptist Health Sys of So FL Proj.) Series 2017, 5% 8/15/2032 | | 115,000 | 119,283 |
| South Miami FL Hlth Fcs Hsp Rv (Baptist Health Sys of So FL Proj.) Series 2017, 5% 8/15/2035 | | 215,000 | 221,751 |
| South Miami FL Hlth Fcs Hsp Rv (Baptist Health Sys of So FL Proj.) Series 2017, 5% 8/15/2042 | | 170,000 | 173,548 |
| Tallahassee FL Health Facs Rev (Tallahassee Mem Hlthcare FL Proj.) Series 2016A, 5% 12/1/2041 | | 55,000 | 53,929 |
| | | | 31,251,024 |
| Housing - 0.1% | | | |
| Fla Hsg Fin Corp Multifamily Mtg Rev Series 2023 B, 5% tender 2/1/2027 (b) | | 1,000,000 | 1,016,379 |
| Fla Hsg Fin Corp Multifamily Mtg Rev Series 2023 C, 5% tender 12/1/2026 (b) | | 625,000 | 633,525 |
| | | | 1,649,904 |
| Special Tax - 0.1% | | | |
| Miami-Dade Cnty FL Spl Oblig Series 2009, 0% 10/1/2037 (h) | | 3,000,000 | 1,828,733 |
| Tampa FL Tax Alloc 0% 9/1/2035 (h) | | 1,575,000 | 1,011,923 |
| Tampa FL Tax Alloc 0% 9/1/2037 (h) | | 235,000 | 137,178 |
| Tampa FL Tax Alloc 0% 9/1/2049 (h) | | 765,000 | 232,733 |
| | | | 3,210,567 |
| Transportation - 1.2% | | | |
| Broward Cnty FL Arpt Sys Rev 5% 10/1/2028 (e) | | 150,000 | 151,268 |
| Broward Cnty FL Arpt Sys Rev 5% 10/1/2030 (e) | | 175,000 | 176,314 |
| Broward Cnty FL Arpt Sys Rev 5% 10/1/2031 (e) | | 150,000 | 151,062 |
| Broward Cnty FL Arpt Sys Rev 5% 10/1/2032 (e) | | 140,000 | 140,951 |
| Broward Cnty FL Arpt Sys Rev Series 2017, 5% 10/1/2025 (e) | | 15,000 | 15,163 |
| Broward Cnty FL Arpt Sys Rev Series 2017, 5% 10/1/2026 (e) | | 50,000 | 51,331 |
| Broward Cnty FL Arpt Sys Rev Series 2017, 5% 10/1/2027 (e) | | 50,000 | 51,847 |
| Broward Cnty FL Arpt Sys Rev Series 2017, 5% 10/1/2029 (e) | | 135,000 | 139,181 |
| Broward Cnty FL Arpt Sys Rev Series 2017, 5% 10/1/2030 (e) | | 35,000 | 36,027 |
| Broward Cnty FL Arpt Sys Rev Series 2017, 5% 10/1/2032 (e) | | 175,000 | 179,822 |
| Broward Cnty FL Arpt Sys Rev Series 2017, 5% 10/1/2033 (e) | | 65,000 | 66,706 |
| Broward Cnty FL Arpt Sys Rev Series 2017, 5% 10/1/2034 (e) | | 65,000 | 66,570 |
| Broward Cnty FL Arpt Sys Rev Series 2017, 5% 10/1/2035 (e) | | 75,000 | 76,739 |
| Broward Cnty FL Arpt Sys Rev Series 2017, 5% 10/1/2036 (e) | | 100,000 | 102,192 |
| Broward Cnty FL Arpt Sys Rev Series 2017, 5% 10/1/2037 (e) | | 115,000 | 117,353 |
| Broward Cnty FL Arpt Sys Rev Series 2017, 5% 10/1/2042 (e) | | 655,000 | 663,505 |
| Broward Cnty FL Arpt Sys Rev Series 2019 A, 5% 10/1/2029 (e) | | 1,120,000 | 1,187,813 |
| Broward Cnty FL Arpt Sys Rev Series 2019 A, 5% 10/1/2049 (e) | | 705,000 | 716,750 |
| Broward Cnty FL Arpt Sys Rev Series Q 1, 5% 10/1/2025 | | 265,000 | 265,324 |
| Florida Dev Fin Corp Rev (Brightline FL Proj.) Series 2024, 5.25% 7/1/2053 (Assured Guaranty Municipal Corp Insured) (e) | | 5,260,000 | 5,439,558 |
| Florida Dev Fin Corp Rev (Brightline FL Proj.) Series 2024, 5.5% 7/1/2053 (e) | | 1,000,000 | 1,013,822 |
| Greater Orlando Aviation Auth 5% 10/1/2031 (e) | | 435,000 | 448,012 |
| Greater Orlando Aviation Auth 5% 10/1/2034 (e) | | 305,000 | 312,927 |
| Greater Orlando Aviation Auth 5% 10/1/2037 (e) | | 315,000 | 321,856 |
| Greater Orlando Aviation Auth Series 2016, 5% 10/1/2026 (e) | | 85,000 | 87,321 |
| Greater Orlando Aviation Auth Series 2016, 5% 10/1/2027 (e) | | 50,000 | 51,913 |
| Greater Orlando Aviation Auth Series 2017A, 5% 10/1/2025 (e) | | 15,000 | 15,168 |
| Greater Orlando Aviation Auth Series 2017A, 5% 10/1/2027 (e) | | 25,000 | 25,957 |
| Greater Orlando Aviation Auth Series 2019 A, 5% 10/1/2054 (e) | | 2,460,000 | 2,498,095 |
| Miami-Dade Cnty Fla Aviat Rev 4% 10/1/2039 | | 490,000 | 486,183 |
| Miami-Dade Cnty Fla Aviat Rev 5% 10/1/2029 (e) | | 80,000 | 80,608 |
| Miami-Dade Cnty Fla Aviat Rev 5% 10/1/2029 | | 75,000 | 76,695 |
| Miami-Dade Cnty Fla Aviat Rev 5% 10/1/2031 | | 90,000 | 91,972 |
| Miami-Dade Cnty Fla Aviat Rev 5% 10/1/2031 (e) | | 70,000 | 70,433 |
| Miami-Dade Cnty Fla Expwy Auth Toll Sys Rev 5% 7/1/2028 | | 50,000 | 50,059 |
| Miami-Dade Cnty Fla Expwy Auth Toll Sys Rev Series 2016 A, 5% 7/1/2032 | | 215,000 | 218,939 |
| Miami-Dade Cnty Fla Expwy Auth Toll Sys Rev Series 2016 A, 5% 7/1/2033 | | 185,000 | 188,443 |
| Osceola Cnty Fla Transn Rev (Osceola Parkway Proj.) Series 2019 A 2, 0% 10/1/2050 (h) | | 5,175,000 | 1,426,153 |
| Osceola Cnty Fla Transn Rev (Osceola Parkway Proj.) Series 2019 A 2, 0% 10/1/2051 (h) | | 2,600,000 | 678,214 |
| Palm Beach Cnty FL Arpt Sys 5% 10/1/2027 (e) | | 50,000 | 51,109 |
| Palm Beach Cnty FL Arpt Sys 5% 10/1/2029 (e) | | 55,000 | 56,056 |
| Palm Beach Cnty FL Arpt Sys 5% 10/1/2030 (e) | | 95,000 | 96,805 |
| Palm Beach Cnty FL Arpt Sys 5% 10/1/2031 (e) | | 65,000 | 66,203 |
| Palm Beach Cnty FL Arpt Sys 5% 10/1/2032 (e) | | 100,000 | 101,784 |
| Palm Beach Cnty FL Arpt Sys 5% 10/1/2033 (e) | | 215,000 | 218,654 |
| Palm Beach Cnty FL Arpt Sys 5% 10/1/2034 (e) | | 230,000 | 233,677 |
| Palm Beach Cnty FL Arpt Sys 5% 10/1/2035 (e) | | 240,000 | 243,605 |
| Palm Beach Cnty FL Arpt Sys Series 2024 B, 5% 10/1/2033 (e) | | 3,305,000 | 3,592,581 |
| Palm Beach Cnty FL Arpt Sys Series 2024 B, 5% 10/1/2034 (e) | | 3,175,000 | 3,461,313 |
| Palm Beach Cnty FL Arpt Sys Series 2024 B, 5.25% 10/1/2041 (e) | | 550,000 | 597,676 |
| Palm Beach Cnty FL Arpt Sys Series 2024 B, 5.25% 10/1/2042 (e) | | 1,340,000 | 1,454,898 |
| | | | 28,112,607 |
| Water & Sewer - 0.5% | | | |
| JEA FL Wtr & Swr Sys Rev Series 2024A, 5% 10/1/2028 | | 950,000 | 1,016,347 |
| JEA FL Wtr & Swr Sys Rev Series 2024A, 5% 10/1/2029 | | 750,000 | 814,827 |
| JEA FL Wtr & Swr Sys Rev Series 2024A, 5% 10/1/2030 | | 4,950,000 | 5,454,510 |
| JEA FL Wtr & Swr Sys Rev Series 2024A, 5% 10/1/2031 | | 3,400,000 | 3,796,889 |
| Miami-Dade Cnty FL Wtr & Swr Rev Series 2021, 5% 10/1/2032 | | 205,000 | 226,466 |
| | | | 11,309,039 |
TOTAL FLORIDA | | | 92,384,005 |
| Georgia - 3.7% | | | |
| Education - 0.1% | | | |
| Fulton Cnty GA Dev Auth Rev (University System of GA Proj.) 4% 6/15/2049 | | 110,000 | 106,516 |
| Private Colgs & Unvs Ath GA Rv (Emory University GA Proj.) Series 2020 B, 4% 9/1/2037 | | 395,000 | 403,249 |
| Private Colgs & Unvs Ath GA Rv (Emory University GA Proj.) Series 2020 B, 4% 9/1/2038 | | 515,000 | 524,265 |
| Private Colgs & Unvs Ath GA Rv (Emory University GA Proj.) Series 2020 B, 5% 9/1/2025 | | 365,000 | 369,658 |
| Private Colgs & Unvs Ath GA Rv (Savannah College of Art & Design Inc Proj.) Series 2021, 4% 4/1/2037 | | 295,000 | 296,462 |
| Private Colgs & Unvs Ath GA Rv (Savannah College of Art & Design Inc Proj.) Series 2021, 5% 4/1/2030 | | 160,000 | 171,965 |
| Private Colgs & Unvs Ath GA Rv (Savannah College of Art & Design Inc Proj.) Series 2021, 5% 4/1/2036 | | 165,000 | 177,768 |
| | | | 2,049,883 |
| Electric Utilities - 0.2% | | | |
| Burke Cnty GA Dev Auth Pcr (Georgia Power Co Proj.) Series NINTH 1994, 3.8% tender 10/1/2032 (b) | | 1,700,000 | 1,711,009 |
| Burke Cnty GA Dev Auth Pcr (Georgia Transmission Corp Proj.) Series 2012, 2.75% 1/1/2052 (b) | | 930,000 | 612,837 |
| Georgia Mun Elec Auth Pwr Rev 4% 1/1/2035 (Assured Guaranty Municipal Corp Insured) | | 325,000 | 327,854 |
| Georgia Mun Elec Auth Pwr Rev 4% 1/1/2037 (Assured Guaranty Municipal Corp Insured) | | 190,000 | 190,794 |
| Georgia Mun Elec Auth Pwr Rev 4% 1/1/2039 (Assured Guaranty Municipal Corp Insured) | | 295,000 | 293,425 |
| Georgia Mun Elec Auth Pwr Rev 4% 1/1/2039 (Assured Guaranty Municipal Corp Insured) | | 180,000 | 179,611 |
| Georgia Mun Elec Auth Pwr Rev 4% 1/1/2040 (Assured Guaranty Municipal Corp Insured) | | 210,000 | 207,663 |
| Georgia Mun Elec Auth Pwr Rev 4% 1/1/2041 (Assured Guaranty Municipal Corp Insured) | | 150,000 | 147,416 |
| Georgia Mun Elec Auth Pwr Rev 5% 1/1/2031 (Assured Guaranty Municipal Corp Insured) | | 155,000 | 167,158 |
| Georgia Mun Elec Auth Pwr Rev 5% 1/1/2033 (Assured Guaranty Municipal Corp Insured) | | 175,000 | 188,097 |
| Georgia Mun Elec Auth Pwr Rev 5% 1/1/2033 (Assured Guaranty Municipal Corp Insured) | | 295,000 | 317,077 |
| Georgia Mun Elec Auth Pwr Rev 5% 1/1/2034 (Assured Guaranty Municipal Corp Insured) | | 180,000 | 193,019 |
| Georgia Mun Elec Auth Pwr Rev 5% 1/1/2034 (Assured Guaranty Municipal Corp Insured) | | 260,000 | 278,805 |
| | | | 4,814,765 |
| General Obligations - 3.1% | | | |
| Georgia St Gen. Oblig. 5% 7/1/2033 | | 1,025,000 | 1,164,187 |
| Georgia St Gen. Oblig. Series 2022A, 5% 7/1/2035 | | 24,240,000 | 27,329,781 |
| Main Street Natural Gas Inc 4% tender 5/1/2052 (Citigroup Inc Guaranteed) (b) | | 1,390,000 | 1,396,171 |
| Main Street Natural Gas Inc 4% tender 7/1/2052 (Royal Bank of Canada Guaranteed) (b) | | 16,725,000 | 16,843,787 |
| Main Street Natural Gas Inc 5% tender 6/1/2053 (Citigroup Inc Guaranteed) (b) | | 6,860,000 | 7,179,897 |
| Main Street Natural Gas Inc Series 2022A, 4% tender 9/1/2052 (Citigroup Inc Guaranteed) (b) | | 5,470,000 | 5,492,664 |
| Main Street Natural Gas Inc Series 2022B, 5% tender 12/1/2052 (Citigroup Inc Guaranteed) (b) | | 1,790,000 | 1,863,883 |
| Main Street Natural Gas Inc Series 2023C, 5% tender 9/1/2053 (Royal Bank of Canada Guaranteed) (b) | | 5,550,000 | 5,850,911 |
| Main Street Natural Gas Inc Series 2024D, 5% tender 4/1/2054 (Toronto-Dominion Bank/The Guaranteed) (b) | | 1,550,000 | 1,646,179 |
| | | | 68,767,460 |
| Health Care - 0.2% | | | |
| Columbus GA Med Ctr Hosp Auth (Piedmont Hosp Og Proj.) 5% tender 7/1/2054 (b) | | 500,000 | 527,322 |
| Coweta Cnty GA Dev Auth Rev (Piedmont Hosp Og Proj.) Series 2019A, 5% 7/1/2044 | | 1,470,000 | 1,523,097 |
| Gainesville & Hall Cnty GA Hsp Ath Rev (Northeast Georgia Healthcare Proj.) Series 2020 A, 3% 2/15/2047 | | 2,845,000 | 2,242,923 |
| Glynn Brunswick Mem Hosp Auth GA Rev (Southeast GA Health System Proj.) 4% 8/1/2043 | | 115,000 | 101,203 |
| Glynn Brunswick Mem Hosp Auth GA Rev (Southeast GA Health System Proj.) 5% 8/1/2043 | | 140,000 | 139,925 |
| Savannah GA Candler Hosp (St Joseph Candler Health Proj.) 4% 7/1/2036 | | 415,000 | 415,391 |
| Savannah GA Candler Hosp (St Joseph Candler Health Proj.) 4% 7/1/2043 | | 435,000 | 420,686 |
| | | | 5,370,547 |
| Transportation - 0.1% | | | |
| Atlanta GA Arpt Rev 5% 7/1/2025 (e) | | 140,000 | 140,906 |
| Atlanta GA Arpt Rev Series 2022B, 5% 7/1/2034 (e) | | 1,005,000 | 1,079,385 |
| Georgia St Rd & Twy Auth Rev (GA St Garvee Proj.) 5% 6/1/2031 | | 585,000 | 643,692 |
| Georgia St Rd & Twy Auth Rev (GA St Garvee Proj.) 5% 6/1/2032 | | 880,000 | 965,187 |
| | | | 2,829,170 |
TOTAL GEORGIA | | | 83,831,825 |
| Hawaii - 0.2% | | | |
| General Obligations - 0.0% | | | |
| Honolulu HI City & Cnty Gen. Oblig. Series 2022 A, 5% 11/1/2025 | | 110,000 | 111,844 |
| Housing - 0.1% | | | |
| Honolulu HI City & Cnty Mfr Series 2023, 5% tender 6/1/2027 (b) | | 3,130,000 | 3,196,956 |
| Transportation - 0.0% | | | |
| Hawaii St Arpts Sys Rev Series 2018 A, 5% 7/1/2029 (e) | | 65,000 | 67,692 |
| Hawaii St Arpts Sys Rev Series 2018 A, 5% 7/1/2030 (e) | | 75,000 | 78,074 |
| Hawaii St Arpts Sys Rev Series 2018 A, 5% 7/1/2031 (e) | | 75,000 | 78,017 |
| Hawaii St Arpts Sys Rev Series 2018 A, 5% 7/1/2032 (e) | | 75,000 | 77,749 |
| Hawaii St Arpts Sys Rev Series 2018 A, 5% 7/1/2033 (e) | | 75,000 | 77,632 |
| Hawaii St Hbr Sys Rev Series 2020 A, 4% 7/1/2036 (e) | | 60,000 | 58,996 |
| | | | 438,160 |
| Water & Sewer - 0.1% | | | |
| Honolulu HI Cty & Cnty Wastewtr Sys Rev Series B, 5% 7/1/2027 | | 1,680,000 | 1,729,515 |
TOTAL HAWAII | | | 5,476,475 |
| Idaho - 0.0% | | | |
| Housing - 0.0% | | | |
| Idaho Hsg & Fin Assn (ID Single Family Hsg 7/1/19 Proj.) Series 2019 A, 4% 1/1/2050 | | 30,000 | 30,039 |
| Illinois - 10.0% | | | |
| Education - 0.1% | | | |
| Illinois Fin Auth Rev (Bradley University Proj.) Series 2017 C, 5% 8/1/2029 | | 60,000 | 61,925 |
| Illinois Fin Auth Rev (Bradley University Proj.) Series 2017 C, 5% 8/1/2030 | | 45,000 | 46,430 |
| Illinois Fin Auth Rev (Bradley University Proj.) Series 2017 C, 5% 8/1/2032 | | 60,000 | 61,708 |
| Illinois Fin Auth Rev (Depaul Univ, IL Proj.) 4% 10/1/2034 | | 50,000 | 50,172 |
| Illinois Fin Auth Rev (Depaul Univ, IL Proj.) 5% 10/1/2029 | | 50,000 | 51,334 |
| Illinois Fin Auth Rev (Depaul Univ, IL Proj.) 5% 10/1/2030 | | 50,000 | 51,341 |
| Illinois Fin Auth Rev (Illinois Institute of Tech, IL Proj.) Series 2019, 4% 9/1/2035 | | 145,000 | 130,367 |
| Illinois Fin Auth Rev (Rosalind Franklin University Proj.) Series A, 5% 8/1/2042 | | 45,000 | 45,372 |
| Illinois Fin Auth Rev (Rosalind Franklin University Proj.) Series C, 5% 8/1/2046 | | 50,000 | 50,210 |
| Illinois Finance Authority Rev (Lake Forest College Proj.) Series 2022A, 5% 10/1/2035 | | 330,000 | 340,828 |
| Illinois Finance Authority Rev (Lake Forest College Proj.) Series 2022A, 5.5% 10/1/2039 | | 750,000 | 785,238 |
| Illinois Finance Authority Rev (Univ of Chicago, IL Proj.) 5% 5/15/2033 | | 400,000 | 453,978 |
| Illinois Finance Authority Rev (Univ of Chicago, IL Proj.) 5% 5/15/2034 | | 450,000 | 504,879 |
| Northern IL Univ Revs Series 2020 B, 5% 4/1/2034 (Build America Mutual Assurance Co Insured) | | 395,000 | 414,966 |
| University of Illinois Series 2018A, 5% 4/1/2030 | | 210,000 | 221,612 |
| | | | 3,270,360 |
| Electric Utilities - 0.0% | | | |
| Illinois Mun Elec Agy Pwr Supp Series 2015A, 5% 2/1/2031 | | 205,000 | 206,318 |
| Escrowed/Pre-Refunded - 0.1% | | | |
| Illinois Fin Auth Rev 5% 7/1/2030 (Pre-refunded to 7/1/2026 at 100) | | 35,000 | 36,001 |
| Illinois Fin Auth Rev 5% 7/1/2033 (Pre-refunded to 7/1/2026 at 100) | | 30,000 | 30,858 |
| Illinois Fin Auth Rev 5% 7/1/2036 (Pre-refunded to 7/1/2026 at 100) | | 130,000 | 133,720 |
| Illinois Fin Auth Rev Series 2016 A, 5% 8/15/2035 (Pre-refunded to 8/15/2026 at 100) | | 25,000 | 25,674 |
| Illinois Fin Auth Rev Series 2016 A, 5% 8/15/2036 (Pre-refunded to 8/15/2026 at 100) | | 105,000 | 107,831 |
| Illinois Fin Auth Rev Series 2016 A, 5.25% 8/15/2031 (Pre-refunded to 8/15/2026 at 100) | | 30,000 | 30,926 |
| Illinois Fin Auth Rev Series 2016 C, 4% 2/15/2041 (Pre-refunded to 2/15/2027 at 100) | | 5,000 | 5,077 |
| Illinois Finance Authority Rev 4% 2/15/2041 (Pre-refunded to 2/15/2027 at 100) | | 55,000 | 55,846 |
| Railsplitter Tobacco Settlement Auth Settlement Rev Series 2017, 5% 6/1/2027 (Pre-refunded to 6/1/2026 at 100) | | 1,275,000 | 1,308,451 |
| Railsplitter Tobacco Settlement Auth Settlement Rev Series 2017, 5% 6/1/2028 (Pre-refunded to 6/1/2026 at 100) | | 140,000 | 143,673 |
| Will Cnty IL Cmnty Unif Sch Dist No 365 0% 11/1/2026 (Escrowed to Maturity) (h) | | 45,000 | 42,435 |
| | | | 1,920,492 |
| General Obligations - 4.0% | | | |
| Chicago IL Brd Ed 5% 12/1/2025 | | 165,000 | 165,898 |
| Chicago IL Brd Ed 5% 12/1/2026 | | 100,000 | 101,357 |
| Chicago IL Brd Ed 5% 12/1/2030 | | 130,000 | 131,757 |
| Chicago IL Brd Ed 6.5% 12/1/2046 | | 100,000 | 102,666 |
| Chicago IL Brd Ed 7% 12/1/2046 (g) | | 140,000 | 148,434 |
| Chicago IL Brd Ed Series 2018 A, 5% 12/1/2025 | | 100,000 | 100,544 |
| Chicago IL Brd Ed Series 2018 A, 5% 12/1/2026 | | 100,000 | 101,357 |
| Chicago IL Brd Ed Series 2018 A, 5% 12/1/2028 | | 240,000 | 246,471 |
| Chicago IL Brd Ed Series 2018 A, 5% 12/1/2030 | | 350,000 | 356,831 |
| Chicago IL Brd Ed Series 2018 A, 5% 12/1/2032 | | 100,000 | 101,703 |
| Chicago IL Brd Ed Series 2018 A, 5% 12/1/2035 | | 100,000 | 101,065 |
| Chicago IL Brd Ed Series 2019 A, 5% 12/1/2028 | | 165,000 | 169,449 |
| Chicago IL Brd Ed Series 2019 A, 5% 12/1/2030 | | 340,000 | 349,124 |
| Chicago IL Brd Ed Series 2019 B, 5% 12/1/2031 | | 190,000 | 194,928 |
| Chicago IL Brd Ed Series 2019 B, 5% 12/1/2033 | | 455,000 | 463,907 |
| Chicago IL Brd Ed Series 2022 A, 4% 12/1/2047 | | 1,500,000 | 1,247,346 |
| Chicago IL Brd Ed Series 2022 A, 5% 12/1/2047 | | 780,000 | 760,968 |
| Chicago IL Brd Ed Series 2022 B, 4% 12/1/2035 | | 585,000 | 550,406 |
| Chicago IL Brd Ed Series 2022 B, 4% 12/1/2036 | | 1,005,000 | 935,179 |
| Chicago IL Brd Ed Series 2023A, 6% 12/1/2049 | | 12,500,000 | 13,496,888 |
| Chicago IL Brd Ed Series D, 5% 12/1/2031 | | 150,000 | 152,004 |
| Chicago IL Gen. Oblig. 5.25% 1/1/2037 | | 1,950,000 | 2,056,974 |
| Chicago IL Gen. Oblig. 5.25% 1/1/2038 | | 2,290,000 | 2,408,446 |
| Chicago IL Gen. Oblig. 5.5% 1/1/2040 | | 2,250,000 | 2,377,791 |
| Chicago IL Gen. Oblig. 5.5% 1/1/2043 | | 5,725,000 | 5,925,240 |
| Chicago IL Gen. Oblig. Series 2019A, 5% 1/1/2040 | | 700,000 | 710,339 |
| Chicago IL Gen. Oblig. Series 2020A, 5% 1/1/2029 | | 870,000 | 908,429 |
| Chicago IL Gen. Oblig. Series 2020A, 5% 1/1/2030 | | 1,605,000 | 1,688,378 |
| Chicago IL Gen. Oblig. Series 2021 A, 5% 1/1/2032 | | 1,530,000 | 1,612,131 |
| Chicago IL Gen. Oblig. Series 2021 A, 5% 1/1/2034 | | 260,000 | 271,089 |
| Cook Cnty IL Gen. Oblig. 5% 11/15/2033 | | 550,000 | 597,217 |
| Cook Cnty IL Gen. Oblig. Series 2016 A, 5% 11/15/2026 | | 290,000 | 299,416 |
| Cook Cnty IL Gen. Oblig. Series 2016 A, 5% 11/15/2027 | | 140,000 | 144,524 |
| Cook Cnty IL Gen. Oblig. Series 2016 A, 5% 11/15/2028 | | 185,000 | 190,910 |
| Cook Cnty IL Gen. Oblig. Series 2016 A, 5% 11/15/2030 | | 255,000 | 262,865 |
| Cook Cnty IL Gen. Oblig. Series 2021 B, 4% 11/15/2025 | | 215,000 | 216,314 |
| Cook Cnty IL Gen. Oblig. Series 2021 B, 4% 11/15/2026 | | 110,000 | 111,592 |
| Cook Cnty IL Gen. Oblig. Series 2021 B, 4% 11/15/2027 | | 110,000 | 112,255 |
| Cook Cnty IL Gen. Oblig. Series 2021 B, 4% 11/15/2028 | | 55,000 | 56,309 |
| Cook Cnty IL High Sch Dist No 203 New Trier Twp 2% 12/15/2033 | | 175,000 | 142,483 |
| Cook Cnty IL High Sch Dist No 203 New Trier Twp 2% 12/15/2034 | | 180,000 | 143,403 |
| DuPage & Cook Cntys IL Cmnty Unit Sch Dist No 205 Series 2022, 4% 9/15/2042 | | 1,000,000 | 972,304 |
| Illinois St Gen. Oblig. 5% 2/1/2027 | | 140,000 | 144,677 |
| Illinois St Gen. Oblig. Series 2017D, 5% 11/1/2027 | | 1,050,000 | 1,097,333 |
| Illinois St Gen. Oblig. Series 2022A, 5% 3/1/2029 | | 645,000 | 685,226 |
| Illinois St Gen. Oblig. Series 2022A, 5% 3/1/2031 | | 705,000 | 767,055 |
| Illinois St Gen. Oblig. Series 2022A, 5% 3/1/2036 | | 1,820,000 | 1,963,802 |
| Illinois St Gen. Oblig. Series APRIL 2014, 5% 4/1/2028 | | 115,000 | 115,063 |
| Illinois St Gen. Oblig. Series FEBRUARY 2014, 5% 2/1/2026 | | 140,000 | 140,070 |
| Illinois St Gen. Oblig. Series JUNE 2016, 3.5% 6/1/2029 | | 1,375,000 | 1,376,138 |
| Illinois St Gen. Oblig. Series JUNE 2016, 5% 6/1/2026 | | 60,000 | 61,319 |
| Illinois St Gen. Oblig. Series MARCH 2021 A, 4% 3/1/2039 | | 1,180,000 | 1,160,248 |
| Illinois St Gen. Oblig. Series MARCH 2021 A, 5% 3/1/2034 | | 1,035,000 | 1,113,041 |
| Illinois St Gen. Oblig. Series MARCH 2021 A, 5% 3/1/2046 | | 2,165,000 | 2,248,041 |
| Illinois St Gen. Oblig. Series MAY 2020, 5.5% 5/1/2039 | | 6,230,000 | 6,710,032 |
| Illinois St Gen. Oblig. Series MAY 2023 B, 5.25% 5/1/2039 | | 3,810,000 | 4,121,733 |
| Illinois St Gen. Oblig. Series MAY 2023 B, 5.25% 5/1/2041 | | 1,330,000 | 1,430,037 |
| Illinois St Gen. Oblig. Series MAY 2023D, 4% 7/1/2037 | | 9,500,000 | 9,380,186 |
| Illinois St Gen. Oblig. Series MAY 2023D, 5% 7/1/2029 | | 3,210,000 | 3,424,635 |
| Illinois St Gen. Oblig. Series MAY 2024 B, 5% 5/1/2035 | | 1,875,000 | 2,068,251 |
| Illinois St Gen. Oblig. Series MAY 2024 B, 5% 5/1/2040 | | 1,415,000 | 1,523,034 |
| Illinois St Gen. Oblig. Series MAY 2024 B, 5.25% 5/1/2044 | | 1,250,000 | 1,349,390 |
| Illinois St Gen. Oblig. Series MAY 2024 B, 5.25% 5/1/2049 | | 925,000 | 987,379 |
| Illinois St Gen. Oblig. Series OCT 2020 C, 4.125% 10/1/2036 | | 3,000,000 | 2,985,542 |
| Peoria Ill Gen. Oblig. Series 2023 A, 4% 1/1/2039 (Assured Guaranty Municipal Corp Insured) | | 1,145,000 | 1,134,317 |
| Schaumburg IL Gen. Oblig. Series 2023, 4% 12/1/2030 | | 1,505,000 | 1,568,052 |
| Will Cnty IL Cmnty Unif Sch Dist No 365 0% 11/1/2026 (Assured Guaranty Municipal Corp Insured) (h) | | 265,000 | 248,104 |
| | | | 88,989,396 |
| Health Care - 1.4% | | | |
| Illinois Fin Auth Health Svcs Fac Lease Rev (University of Illinois Hospital And Health Sciences System Proj.) Series 2020, 4% 10/1/2055 | | 2,785,000 | 2,434,464 |
| Illinois Fin Auth Rev (Ascension Health Credit Group Proj.) Series 2016 C, 3.625% 2/15/2032 | | 60,000 | 59,379 |
| Illinois Fin Auth Rev (Ascension Health Credit Group Proj.) Series 2016 C, 3.75% 2/15/2034 | | 75,000 | 73,882 |
| Illinois Fin Auth Rev (Ascension Health Credit Group Proj.) Series 2016 C, 4% 2/15/2033 | | 15,000 | 15,104 |
| Illinois Fin Auth Rev (Ascension Health Credit Group Proj.) Series 2016 C, 4% 2/15/2036 | | 315,000 | 309,436 |
| Illinois Fin Auth Rev (Ascension Health Credit Group Proj.) Series 2016 C, 5% 2/15/2029 | | 310,000 | 320,954 |
| Illinois Fin Auth Rev (Ascension Health Credit Group Proj.) Series 2016 C, 5% 2/15/2031 | | 1,415,000 | 1,461,878 |
| Illinois Fin Auth Rev (Ascension Health Credit Group Proj.) Series 2016 C, 5% 2/15/2032 | | 320,000 | 330,121 |
| Illinois Fin Auth Rev (Ascension Health Credit Group Proj.) Series 2016 C, 5% 2/15/2034 | | 180,000 | 185,106 |
| Illinois Fin Auth Rev (Ascension Health Credit Group Proj.) Series 2016 C, 5% 2/15/2036 | | 125,000 | 128,098 |
| Illinois Fin Auth Rev (Carle Foundation Hospital,Il Proj.) Series 2016 A, 5% 2/15/2029 | | 260,000 | 264,151 |
| Illinois Fin Auth Rev (Mercy Alliance Inc Proj.) Series 2016, 5% 12/1/2029 | | 85,000 | 86,562 |
| Illinois Fin Auth Rev (Mercy Alliance Inc Proj.) Series 2016, 5% 12/1/2033 | | 115,000 | 116,831 |
| Illinois Fin Auth Rev (Osf Healthcare System Proj.) 4.125% 5/15/2047 | | 1,585,000 | 1,495,284 |
| Illinois Fin Auth Rev (Osf Healthcare System Proj.) 5% 5/15/2043 | | 2,105,000 | 2,129,983 |
| Illinois Fin Auth Rev (Osf Healthcare System Proj.) Series 2016, 5% 5/15/2029 | | 65,000 | 66,110 |
| Illinois Fin Auth Rev (Riverside Health System, IL Proj.) Series 2013, 5% 11/15/2028 | | 145,000 | 145,106 |
| Illinois Fin Auth Rev (Riverside Health System, IL Proj.) Series 2013, 5% 11/15/2029 | | 70,000 | 70,055 |
| Illinois Fin Auth Rev (Silver Cross Health System IL Proj.) Series 2015 C, 4.125% 8/15/2037 | | 45,000 | 42,420 |
| Illinois Finance Authority Rev (Ascension Health Credit Group Proj.) Series 2016 C, 4% 2/15/2041 | | 1,800,000 | 1,729,733 |
| Illinois Finance Authority Rev (Carle Foundation Hospital,Il Proj.) Series 2021A, 3% 8/15/2048 | | 4,100,000 | 3,154,056 |
| Illinois Finance Authority Rev (Endeavor Health Proj.) Series 2020A, 3.25% 8/15/2049 | | 465,000 | 369,355 |
| Illinois Finance Authority Rev (Osf Healthcare System Proj.) 3% 5/15/2050 (Build America Mutual Assurance Co Insured) | | 1,045,000 | 831,164 |
| Illinois Finance Authority Rev (Osf Healthcare System Proj.) Series 2020 A, 3% 5/15/2050 | | 2,650,000 | 2,026,217 |
| Illinois Finance Authority Rev (Osf Healthcare System Proj.) Series 2020 A, 4% 5/15/2050 | | 1,760,000 | 1,583,779 |
| Illinois Finance Authority Rev (University Of Chicago Hosps,Il Proj.) 5% tender 8/15/2052 (b) | | 2,905,000 | 2,921,307 |
| University of Illinois (University of Illinois Hospital And Health Sciences System Proj.) Series 2023, 5% 10/1/2028 | | 475,000 | 499,676 |
| University of Illinois (University of Illinois Hospital And Health Sciences System Proj.) Series 2023, 5% 10/1/2029 | | 970,000 | 1,028,580 |
| University of Illinois (University of Illinois Hospital And Health Sciences System Proj.) Series 2023, 5% 10/1/2030 | | 1,150,000 | 1,230,710 |
| University of Illinois (University of Illinois Hospital And Health Sciences System Proj.) Series 2023, 5% 10/1/2031 | | 1,825,000 | 1,963,949 |
| University of Illinois (University of Illinois Hospital And Health Sciences System Proj.) Series 2023, 5% 10/1/2032 | | 1,350,000 | 1,460,352 |
| University of Illinois (University of Illinois Hospital And Health Sciences System Proj.) Series 2023, 5.5% 10/1/2039 | | 1,360,000 | 1,513,598 |
| University of Illinois (University of Illinois Hospital And Health Sciences System Proj.) Series 2023, 5.5% 10/1/2040 | | 615,000 | 682,818 |
| University of Illinois (University of Illinois Hospital And Health Sciences System Proj.) Series 2023, 5.5% 10/1/2041 | | 1,660,000 | 1,841,615 |
| | | | 32,571,833 |
| Housing - 0.1% | | | |
| Illinois Housing Dev Auth (IL Hsg Revenue Bonds 3/1/2016 Proj.) Series 2019 D, 3.75% 4/1/2050 | | 45,000 | 44,849 |
| Illinois Housing Dev Auth Series 2019 D, 2.7% 10/1/2034 (IL Hsg Revenue Bonds 3/1/2016 Guaranteed) | | 310,000 | 270,999 |
| Illinois Housing Development Authority (IL Hsg Revenue Bonds 3/1/2016 Proj.) Series 2021 B, 3% 4/1/2051 | | 655,000 | 639,224 |
| Illinois Hsg Dev Auth Multifamily Hsg Rev Series 2019, 2.9% 7/1/2035 | | 421,394 | 367,455 |
| Illinois Hsg Dev Auth Multifamily Hsg Rev Series 2023, 4% tender 6/1/2026 (b) | | 1,665,000 | 1,667,268 |
| | | | 2,989,795 |
| Special Tax - 2.9% | | | |
| Chicago Ill Tran Auth Sales Tax Rcpts Rev 4% 12/1/2049 | | 6,000,000 | 5,578,331 |
| Chicago Ill Tran Auth Sales Tax Rcpts Rev Series 2024A, 5% 12/1/2039 | | 2,295,000 | 2,536,169 |
| Chicago Ill Tran Auth Sales Tax Rcpts Rev Series 2024A, 5% 12/1/2041 | | 6,000,000 | 6,564,113 |
| Chicago Ill Tran Auth Sales Tax Rcpts Rev Series 2024A, 5% 12/1/2042 | | 2,880,000 | 3,130,663 |
| Illinois St Sales Tax Rev Series FEBRUARY 2024A, 5% 6/15/2031 | | 2,845,000 | 3,112,224 |
| Illinois St Sales Tax Rev Series FEBRUARY 2024A, 5% 6/15/2032 | | 2,385,000 | 2,629,870 |
| Illinois St Sales Tax Rev Series FEBRUARY 2024A, 5% 6/15/2033 | | 3,445,000 | 3,828,757 |
| Metropolitan Pier & Exposition Auth Ill Dedicated St Tax Rev 0% 12/15/2031 (National Public Finance Guarantee Corporation Insured) (h) | | 485,000 | 378,520 |
| Metropolitan Pier & Exposition Auth Ill Dedicated St Tax Rev 0% 12/15/2036 (h) | | 65,000 | 40,559 |
| Metropolitan Pier & Exposition Auth Ill Dedicated St Tax Rev 0% 12/15/2036 (National Public Finance Guarantee Corporation Insured) (h) | | 2,445,000 | 1,534,623 |
| Metropolitan Pier & Exposition Auth Ill Dedicated St Tax Rev 0% 12/15/2039 (h) | | 515,000 | 276,204 |
| Metropolitan Pier & Exposition Auth Ill Dedicated St Tax Rev 0% 12/15/2040 (h) | | 430,000 | 218,126 |
| Metropolitan Pier & Exposition Auth Ill Dedicated St Tax Rev 0% 12/15/2041 (h) | | 1,225,000 | 586,861 |
| Metropolitan Pier & Exposition Auth Ill Dedicated St Tax Rev 0% 12/15/2051 (h) | | 660,000 | 182,465 |
| Metropolitan Pier & Exposition Auth Ill Dedicated St Tax Rev 0% 6/15/2028 (National Public Finance Guarantee Corporation Insured) (h) | | 335,000 | 297,199 |
| Metropolitan Pier & Exposition Auth Ill Dedicated St Tax Rev 0% 6/15/2029 (Financial Guaranty Ins CO Insured) (h) | | 445,000 | 381,043 |
| Metropolitan Pier & Exposition Auth Ill Dedicated St Tax Rev 0% 6/15/2035 (National Public Finance Guarantee Corporation Insured) (h) | | 260,000 | 174,341 |
| Metropolitan Pier & Exposition Auth Ill Dedicated St Tax Rev 0% 6/15/2043 (Assured Guaranty Municipal Corp Insured) (h) | | 3,150,000 | 1,410,161 |
| Metropolitan Pier & Exposition Auth Ill Dedicated St Tax Rev 0% 6/15/2044 (Assured Guaranty Municipal Corp Insured) (h) | | 15,000,000 | 6,340,578 |
| Metropolitan Pier & Exposition Auth Ill Dedicated St Tax Rev 0% 6/15/2045 (Assured Guaranty Municipal Corp Insured) (h) | | 1,540,000 | 618,022 |
| Metropolitan Pier & Exposition Auth Ill Dedicated St Tax Rev 0% 6/15/2047 (Assured Guaranty Municipal Corp Insured) (h) | | 185,000 | 66,871 |
| Metropolitan Pier & Exposition Auth Ill Dedicated St Tax Rev 4% 6/15/2052 | | 5,875,000 | 5,272,795 |
| Metropolitan Pier & Exposition Auth Ill Dedicated St Tax Rev 5% 6/15/2042 | | 675,000 | 704,265 |
| Metropolitan Pier & Exposition Auth Ill Dedicated St Tax Rev 5% 6/15/2050 | | 560,000 | 573,523 |
| Metropolitan Pier & Exposition Auth Ill Dedicated St Tax Rev Series 2017 B, 0% 12/15/2056 (Assured Guaranty Municipal Corp Insured) (h) | | 5,000,000 | 1,111,751 |
| Metropolitan Pier & Exposition Auth Ill Dedicated St Tax Rev Series 2017 B, 5% 12/15/2025 | | 50,000 | 50,730 |
| Metropolitan Pier & Exposition Auth Ill Dedicated St Tax Rev Series 2017 B, 5% 12/15/2026 | | 165,000 | 170,106 |
| Metropolitan Pier & Exposition Auth Ill Dedicated St Tax Rev Series 2017 B, 5% 12/15/2027 | | 20,000 | 20,907 |
| Metropolitan Pier & Exposition Auth Ill Dedicated St Tax Rev Series 2017 B, 5% 12/15/2031 | | 35,000 | 36,411 |
| Metropolitan Pier & Exposition Auth Ill Dedicated St Tax Rev Series 2017 B, 5% 12/15/2034 | | 20,000 | 20,690 |
| Sales Tax Securitization Corp Series 2023C, 5% 1/1/2033 | | 2,235,000 | 2,481,559 |
| Sales Tax Securitization Corp Series 2023D, 5% 1/1/2035 | | 1,255,000 | 1,381,928 |
| Sales Tax Securitization Corp Series 2024 A, 5% 1/1/2037 | | 9,830,000 | 10,925,390 |
| Sales Tax Securitization Corp Series 2024A, 5% 1/1/2040 | | 500,000 | 542,952 |
| Sales Tax Securitization Corp Series 2024A, 5% 1/1/2041 | | 500,000 | 540,450 |
| | | | 63,719,157 |
| Transportation - 1.4% | | | |
| Chicago IL Midway Arpt Rev Series A, 4% 1/1/2033 (e) | | 375,000 | 373,984 |
| Chicago IL Midway Arpt Rev Series A, 5% 1/1/2028 (e) | | 100,000 | 100,929 |
| Chicago IL Midway Arpt Rev Series B, 4% 1/1/2035 | | 80,000 | 79,968 |
| Chicago IL Midway Arpt Rev Series B, 5% 1/1/2036 | | 100,000 | 100,860 |
| Chicago IL Midway Arpt Rev Series B, 5% 1/1/2037 | | 135,000 | 136,101 |
| Chicago IL O'Hare Intl Arpt Rev 5% 1/1/2028 (e) | | 150,000 | 153,519 |
| Chicago IL O'Hare Intl Arpt Rev 5% 1/1/2029 (e) | | 125,000 | 127,888 |
| Chicago IL O'Hare Intl Arpt Rev 5% 1/1/2030 | | 30,000 | 30,888 |
| Chicago IL O'Hare Intl Arpt Rev 5% 1/1/2031 | | 30,000 | 30,882 |
| Chicago IL O'Hare Intl Arpt Rev 5% 1/1/2031 | | 180,000 | 185,290 |
| Chicago IL O'Hare Intl Arpt Rev 5% 1/1/2032 | | 30,000 | 30,861 |
| Chicago IL O'Hare Intl Arpt Rev 5% 1/1/2032 (e) | | 135,000 | 137,466 |
| Chicago IL O'Hare Intl Arpt Rev 5% 1/1/2033 | | 140,000 | 141,711 |
| Chicago IL O'Hare Intl Arpt Rev 5% 1/1/2034 (e) | | 205,000 | 208,256 |
| Chicago IL O'Hare Intl Arpt Rev 5% 1/1/2035 | | 105,000 | 107,697 |
| Chicago IL O'Hare Intl Arpt Rev 5% 1/1/2035 (e) | | 150,000 | 152,205 |
| Chicago IL O'Hare Intl Arpt Rev 5% 1/1/2036 (e) | | 190,000 | 192,590 |
| Chicago IL O'Hare Intl Arpt Rev 5% 1/1/2037 (e) | | 100,000 | 101,275 |
| Chicago IL O'Hare Intl Arpt Rev 5% 1/1/2037 | | 430,000 | 440,193 |
| Chicago IL O'Hare Intl Arpt Rev 5% 1/1/2037 (e) | | 100,000 | 101,275 |
| Chicago IL O'Hare Intl Arpt Rev 5.25% 1/1/2029 (e) | | 20,000 | 20,556 |
| Chicago IL O'Hare Intl Arpt Rev 5.25% 1/1/2031 (e) | | 20,000 | 20,546 |
| Chicago IL O'Hare Intl Arpt Rev Series 2018A, 5% 1/1/2037 (e) | | 1,030,000 | 1,062,444 |
| Chicago IL O'Hare Intl Arpt Rev Series 2018A, 5% 1/1/2039 (e) | | 1,005,000 | 1,030,572 |
| Chicago IL O'Hare Intl Arpt Rev Series 2018A, 5% 1/1/2053 (e) | | 285,000 | 287,934 |
| Chicago IL O'Hare Intl Arpt Rev Series 2022 C, 5% 1/1/2028 (e) | | 690,000 | 715,832 |
| Chicago IL O'Hare Intl Arpt Rev Series 2022 C, 5% 1/1/2029 (e) | | 500,000 | 523,989 |
| Chicago IL O'Hare Intl Arpt Rev Series 2022 C, 5% 1/1/2030 (e) | | 810,000 | 855,227 |
| Chicago IL O'Hare Intl Arpt Rev Series 2022 C, 5% 1/1/2031 (e) | | 600,000 | 640,135 |
| Chicago IL O'Hare Intl Arpt Rev Series 2022A, 4.5% 1/1/2048 (e) | | 4,700,000 | 4,682,802 |
| Chicago IL O'Hare Intl Arpt Rev Series 2022A, 5% 1/1/2030 (e) | | 225,000 | 237,563 |
| Chicago IL O'Hare Intl Arpt Rev Series 2022A, 5% 1/1/2031 (e) | | 230,000 | 245,385 |
| Chicago IL O'Hare Intl Arpt Rev Series 2024 A, 5% 1/1/2036 (e) | | 760,000 | 813,960 |
| Chicago IL O'Hare Intl Arpt Rev Series 2024 A, 5.25% 1/1/2040 (e) | | 1,695,000 | 1,832,476 |
| Chicago IL O'Hare Intl Arpt Rev Series 2024C, 5% 1/1/2038 (e) | | 2,565,000 | 2,740,679 |
| Chicago IL O'Hare Intl Arpt Rev Series 2024C, 5.25% 1/1/2042 (e) | | 1,870,000 | 2,019,500 |
| Chicago IL O'Hare Intl Arpt Rev Series C, 5% 1/1/2046 (e) | | 120,000 | 120,000 |
| Chicago IL O'Hare Intl Arpt Rev Spl (TrIPs Obligated Group Proj.) 5% 7/1/2038 (e) | | 135,000 | 136,756 |
| Chicago IL O'Hare Intl Arpt Rev Spl (TrIPs Obligated Group Proj.) 5% 7/1/2048 (e) | | 1,140,000 | 1,141,962 |
| Chicago IL Tran Auth Cap Grnt Rcpts Rev Series 5337, 5% 6/1/2025 | | 15,000 | 15,097 |
| Chicago IL Tran Auth Cap Grnt Rcpts Rev Series 5337, 5% 6/1/2026 | | 10,000 | 10,234 |
| Illinois St Toll Hwy Auth Hwy Rev 5% 12/1/2031 | | 355,000 | 360,750 |
| Illinois St Toll Hwy Auth Hwy Rev Series 2019 A, 5% 1/1/2044 | | 140,000 | 146,856 |
| Illinois St Toll Hwy Auth Hwy Rev Series 2020 A, 5% 1/1/2040 | | 335,000 | 358,568 |
| Illinois St Toll Hwy Auth Hwy Rev Series 2020 A, 5% 1/1/2041 | | 880,000 | 940,456 |
| Illinois St Toll Hwy Auth Hwy Rev Series 2020 A, 5% 1/1/2045 | | 2,975,000 | 3,160,459 |
| Illinois St Toll Hwy Auth Hwy Rev Series 2021 A, 5% 1/1/2043 | | 4,670,000 | 5,002,250 |
| | | | 32,056,826 |
| Water & Sewer - 0.0% | | | |
| Illinois Fin Auth Rev (IL Wtr State Rev Fund Proj.) Series 2017, 5% 1/1/2029 | | 170,000 | 176,341 |
TOTAL ILLINOIS | | | 225,900,518 |
| Indiana - 0.5% | | | |
| Education - 0.1% | | | |
| Indiana Fin Auth Edl Facs Rev (Depauw University Proj.) Series 2022A, 5% 7/1/2032 | | 1,005,000 | 1,061,141 |
| Purdue University Series DD, 5% 7/1/2034 | | 60,000 | 63,340 |
| Purdue University Series DD, 5% 7/1/2035 | | 120,000 | 126,259 |
| Purdue University Series DD, 5% 7/1/2036 | | 130,000 | 136,624 |
| Purdue University Series DD, 5% 7/1/2037 | | 120,000 | 125,902 |
| St Joseph Cnty Ind Eco Dev Rev (St Mary's College Proj.) Series 2019, 5% 4/1/2043 | | 495,000 | 507,813 |
| St Joseph Cnty Ind Eco Dev Rev (St Mary's College Proj.) Series 2020, 4% 4/1/2037 | | 245,000 | 241,512 |
| | | | 2,262,591 |
| Electric Utilities - 0.0% | | | |
| Indiana St Fin Auth Environmental Facs Rev (Indianapolis Pwr & Lt Co Proj.) 0.75% tender 12/1/2038 (b) | | 90,000 | 86,490 |
| Indiana St Fin Auth Environmental Facs Rev (Indianapolis Pwr & Lt Co Proj.) 0.95% tender 12/1/2038 (b)(e) | | 140,000 | 134,877 |
| | | | 221,367 |
| General Obligations - 0.1% | | | |
| Indiana St Fin Auth Rev (Indiana St Proj.) 5.25% 2/1/2032 | | 355,000 | 358,070 |
| Westfield Washington Ind Multi (Westfield-Wash Ind Schs Proj.) Series 2024 A, 5.25% 7/15/2039 (Build America Mutual Assurance Co Insured) | | 1,985,000 | 2,230,253 |
| | | | 2,588,323 |
| Health Care - 0.3% | | | |
| Indiana Fin Auth Health Sys Rev (Franciscan Alliance Proj.) Series 2016 A, 4% 11/1/2051 | | 3,100,000 | 2,880,432 |
| Indiana Fin Auth Health Sys Rev (Indiana University Health Proj.) Series 2023B1, 5% tender 10/1/2062 (b) | | 2,010,000 | 2,124,488 |
| Indiana St Fin Auth Rev (Community Foundation of Northwest Indiana Inc Proj.) 5% 9/1/2026 | | 65,000 | 66,739 |
| Indiana St Fin Auth Rev (Community Foundation of Northwest Indiana Inc Proj.) 5% 9/1/2027 | | 30,000 | 30,896 |
| Indiana St Fin Auth Rev (Community Foundation of Northwest Indiana Inc Proj.) 5% 9/1/2029 | | 75,000 | 76,958 |
| Indiana St Fin Auth Rev (Community Foundation of Northwest Indiana Inc Proj.) 5% 9/1/2030 | | 70,000 | 71,791 |
| Indiana St Hsg & Cmnty Dev Auth Multifamily Hsg Rev (Glasswater Creek Whitestown Proj Proj.) Series 2020, 5.375% 10/1/2040 (g) | | 180,000 | 155,607 |
| | | | 5,406,911 |
| Housing - 0.0% | | | |
| Indiana St Hsg & Cmnty Dev Single Fam Hsg Rev (IN Sfm Revenue Bonds 6/1/2016 Proj.) 3% 7/1/2050 | | 105,000 | 102,797 |
| Special Tax - 0.0% | | | |
| Indianapolis Ind Loc Pub Impt Bd Bank (Indianapolis Marion Cnty Bldg Auth Proj.) Series 2019 A, 5% 2/1/2049 | | 340,000 | 350,372 |
| Transportation - 0.0% | | | |
| Indianapolis Ind Loc Pub Impt Bd Bank (Indianapolis IN Arpt Auth Rev Proj.) Series 2016 A1, 4% 1/1/2032 (e) | | 50,000 | 49,883 |
| Indianapolis Ind Loc Pub Impt Bd Bank (Indianapolis IN Arpt Auth Rev Proj.) Series 2016 A1, 4% 1/1/2033 (e) | | 50,000 | 50,007 |
| Indianapolis Ind Loc Pub Impt Bd Bank (Indianapolis IN Arpt Auth Rev Proj.) Series 2016 A1, 4% 1/1/2034 (e) | | 65,000 | 64,791 |
| Indianapolis Ind Loc Pub Impt Bd Bank (Indianapolis IN Arpt Auth Rev Proj.) Series 2016 A1, 4% 1/1/2035 (e) | | 140,000 | 139,148 |
| Indianapolis Ind Loc Pub Impt Bd Bank (Indianapolis IN Arpt Auth Rev Proj.) Series A-1, 5% 1/1/2026 (e) | | 55,000 | 55,763 |
| | | | 359,592 |
| Water & Sewer - 0.0% | | | |
| Indiana Finance Authority Series 2021 2, 5% 10/1/2041 | | 515,000 | 552,986 |
TOTAL INDIANA | | | 11,844,939 |
| Iowa - 0.3% | | | |
| Education - 0.0% | | | |
| Iowa Student Ln Liquidity Corp Series 2019 B, 5% 12/1/2029 (e) | | 310,000 | 323,502 |
| Housing - 0.2% | | | |
| Iowa Fin Auth Single Family Mtg Rev (IA Single Family Mortgage Proj.) Series 2023 A, 5.25% 7/1/2053 | | 4,475,000 | 4,653,611 |
| Tobacco Bonds - 0.1% | | | |
| Tobacco Settlement Auth Iowa Tobacco Settlement Rev Series 2021 B1 CLASS 2, 4% 6/1/2049 | | 45,000 | 43,365 |
| Tobacco Settlement Auth Iowa Tobacco Settlement Rev Series 2021A 2 CL 1, 4% 6/1/2034 | | 295,000 | 296,905 |
| Tobacco Settlement Auth Iowa Tobacco Settlement Rev Series 2021A 2 CL 1, 4% 6/1/2036 | | 295,000 | 294,953 |
| Tobacco Settlement Auth Iowa Tobacco Settlement Rev Series 2021A 2 CL 1, 4% 6/1/2039 | | 295,000 | 289,231 |
| Tobacco Settlement Auth Iowa Tobacco Settlement Rev Series 2021A 2 CL 1, 5% 6/1/2032 | | 265,000 | 284,253 |
| | | | 1,208,707 |
TOTAL IOWA | | | 6,185,820 |
| Kentucky - 2.4% | | | |
| Education - 0.3% | | | |
| Boyle Cnty KY Edl Facs Rev (Centre College Proj.) 5% 6/1/2039 | | 6,010,000 | 6,348,356 |
| Electric Utilities - 0.4% | | | |
| Trimble Cnty KY Environmental Facs Rev (Kentucky Utilities Co Proj.) 4.7% tender 6/1/2054 (b)(e) | | 9,375,000 | 9,521,060 |
| General Obligations - 1.1% | | | |
| Kentucky Inc KY Pub Energy Auth Gas Supply Rev 5% tender 5/1/2055 (Goldman Sachs Group Inc/The Guaranteed) (b) | | 3,015,000 | 3,150,172 |
| Kentucky Inc KY Pub Energy Auth Gas Supply Rev Series 2020 A, 4% tender 12/1/2050 (BP PLC Guaranteed) (b) | | 2,760,000 | 2,769,313 |
| Kentucky Inc KY Pub Energy Auth Gas Supply Rev Series 2024 A1, 5% 8/1/2029 (Morgan Stanley Guaranteed) | | 2,405,000 | 2,512,081 |
| Kentucky Inc KY Pub Energy Auth Gas Supply Rev Series 2024 A1, 5% 8/1/2030 (Morgan Stanley Guaranteed) | | 2,400,000 | 2,526,207 |
| Kentucky Inc KY Pub Energy Auth Gas Supply Rev Series 2024 A1, 5% 8/1/2031 (Morgan Stanley Guaranteed) | | 2,605,000 | 2,761,315 |
| Kentucky Inc KY Pub Energy Auth Gas Supply Rev Series 2024 A1, 5.25% tender 4/1/2054 (Morgan Stanley Guaranteed) (b) | | 5,465,000 | 5,883,267 |
| Kentucky St Pty & Bldgs Commn (Kentucky St Proj.) 5% 5/1/2026 | | 50,000 | 51,323 |
| Kentucky St Pty & Bldgs Commn (Kentucky St Proj.) 5% 5/1/2029 | | 275,000 | 290,645 |
| Kentucky St Pty & Bldgs Commn (Kentucky St Proj.) 5% 5/1/2032 | | 70,000 | 73,599 |
| Kentucky St Pty & Bldgs Commn (Kentucky St Proj.) 5% 5/1/2033 | | 55,000 | 57,796 |
| Kentucky St Pty & Bldgs Commn (Kentucky St Proj.) 5% 5/1/2034 | | 65,000 | 68,313 |
| Kentucky St Pty & Bldgs Commn (Kentucky St Proj.) 5% 5/1/2035 | | 40,000 | 41,923 |
| Kentucky St Pty & Bldgs Commn (Kentucky St Proj.) 5% 5/1/2036 | | 30,000 | 31,414 |
| Kentucky St Pty & Bldgs Commn (Kentucky St Proj.) Series SR A, 5% 10/1/2037 | | 3,325,000 | 3,721,427 |
| | | | 23,938,795 |
| Health Care - 0.6% | | | |
| Ashland KY Med Ctr Rev (Royal Blue Health Proj.) Series 2019, 3% 2/1/2040 (Assured Guaranty Municipal Corp Insured) | | 655,000 | 569,981 |
| Kentucky Econ Dev Fin Auth (CommonSpirit Health Proj.) Series 2019 A 2, 5% 8/1/2049 | | 930,000 | 947,403 |
| Kentucky Econ Dev Fin Auth Hosp Sys Rev (Owensboro KY Hosp Rev Proj.) Series 2017 A, 5.25% 6/1/2041 | | 1,750,000 | 1,773,670 |
| Louisville & Jefferson Cnty KY Metro Govt Health Sys Rev (Norton Healthcare Inc Proj.) 5% 10/1/2037 | | 360,000 | 375,971 |
| Louisville & Jefferson Cnty KY Metro Govt Health Sys Rev (Norton Healthcare Inc Proj.) 5% tender 10/1/2047 (b) | | 130,000 | 133,386 |
| Louisville & Jefferson Cnty KY Metro Govt Health Sys Rev (Norton Healthcare Inc Proj.) 5% tender 10/1/2047 (b) | | 155,000 | 164,769 |
| Louisville & Jefferson Cnty KY Metro Govt Health Sys Rev (Norton Healthcare Inc Proj.) Series 2020A, 3% 10/1/2043 | | 1,950,000 | 1,522,303 |
| Louisville & Jefferson Cnty KY Metro Govt Health Sys Rev (Norton Healthcare Inc Proj.) Series 2023B, 5% tender 10/1/2047 (b) | | 8,260,000 | 8,788,042 |
| | | | 14,275,525 |
| Transportation - 0.0% | | | |
| Kenton KY Airport Delta (Cincinnati/Northern Kentucky International Airport Proj.) 5% 1/1/2028 | | 80,000 | 81,316 |
| Kenton KY Airport Delta (Cincinnati/Northern Kentucky International Airport Proj.) 5% 1/1/2031 | | 75,000 | 76,075 |
| Kenton KY Airport Delta (Cincinnati/Northern Kentucky International Airport Proj.) 5% 1/1/2032 | | 75,000 | 76,049 |
| | | | 233,440 |
TOTAL KENTUCKY | | | 54,317,176 |
| Louisiana - 0.4% | | | |
| Education - 0.0% | | | |
| Louisiana Pub Facs Auth Rev (Tulane Univ, LA Proj.) Series 2016 A, 5% 12/15/2028 | | 100,000 | 103,401 |
| Louisiana Pub Facs Auth Rev (Tulane Univ, LA Proj.) Series 2016 A, 5% 12/15/2029 | | 70,000 | 72,333 |
| | | | 175,734 |
| Health Care - 0.3% | | | |
| Louisiana Pub Facs Rev (Ochsner Clinic Foundation Proj.) Series 2020 A, 4% 5/15/2049 | | 6,440,000 | 6,044,031 |
| Housing - 0.0% | | | |
| Louisiana Hsg Corp Single Family Mtg Rev (LA Home Ownership Proj.) 5.75% 12/1/2053 | | 515,000 | 554,327 |
| Industrial Development - 0.1% | | | |
| St John Baptist Parish LA Rev (Marathon Oil Corp Proj.) 4.05% tender 6/1/2037 (b) | | 1,470,000 | 1,476,522 |
| Transportation - 0.0% | | | |
| New Orleans LA Aviation Board 5% 1/1/2027 (e) | | 20,000 | 20,498 |
| New Orleans LA Aviation Board 5% 1/1/2027 (e) | | 25,000 | 25,622 |
| New Orleans LA Aviation Board 5% 1/1/2028 (e) | | 10,000 | 10,225 |
| New Orleans LA Aviation Board 5% 1/1/2028 (e) | | 35,000 | 35,787 |
| New Orleans LA Aviation Board 5% 1/1/2031 (e) | | 30,000 | 30,649 |
| New Orleans LA Aviation Board 5% 1/1/2032 (e) | | 20,000 | 20,419 |
| New Orleans LA Aviation Board 5% 1/1/2033 (e) | | 35,000 | 35,706 |
| New Orleans LA Aviation Board 5% 1/1/2033 (e) | | 50,000 | 51,008 |
| New Orleans LA Aviation Board 5% 1/1/2034 (e) | | 10,000 | 10,188 |
| New Orleans LA Aviation Board 5% 1/1/2034 (e) | | 60,000 | 61,126 |
| New Orleans LA Aviation Board 5% 1/1/2035 (e) | | 20,000 | 20,359 |
| New Orleans LA Aviation Board 5% 1/1/2036 (e) | | 45,000 | 45,760 |
| New Orleans LA Aviation Board 5% 1/1/2037 (e) | | 80,000 | 81,280 |
| New Orleans LA Aviation Board 5% 1/1/2037 (e) | | 295,000 | 299,720 |
| New Orleans LA Aviation Board Series B, 5% 1/1/2029 (e) | | 265,000 | 265,000 |
| New Orleans LA Aviation Board Series B, 5% 1/1/2031 (e) | | 125,000 | 125,000 |
| | | | 1,138,347 |
TOTAL LOUISIANA | | | 9,388,961 |
| Maine - 0.2% | | | |
| Education - 0.0% | | | |
| Maine Health & Higher Edl Facs Auth Rev (University of New England Proj.) Series 2017 B, 4% 7/1/2025 | | 20,000 | 20,045 |
| Maine Health & Higher Edl Facs Auth Rev (University of New England Proj.) Series 2017 B, 4% 7/1/2031 | | 35,000 | 35,282 |
| Maine Health & Higher Edl Facs Auth Rev (University of New England Proj.) Series 2017 B, 4% 7/1/2032 | | 25,000 | 25,149 |
| Maine Health & Higher Edl Facs Auth Rev (University of New England Proj.) Series 2017 B, 4% 7/1/2034 | | 50,000 | 50,075 |
| Maine Health & Higher Edl Facs Auth Rev (University of New England Proj.) Series 2017 B, 5% 7/1/2026 | | 15,000 | 15,340 |
| Maine Health & Higher Edl Facs Auth Rev (University of New England Proj.) Series 2017 B, 5% 7/1/2028 | | 25,000 | 25,918 |
| Maine Health & Higher Edl Facs Auth Rev (University of New England Proj.) Series 2017 B, 5% 7/1/2029 | | 20,000 | 20,668 |
| Maine Health & Higher Edl Facs Auth Rev (University of New England Proj.) Series 2017 B, 5% 7/1/2033 | | 50,000 | 51,731 |
| Maine Health & Higher Edl Facs Auth Rev (University of New England Proj.) Series 2017 B, 5% 7/1/2035 | | 40,000 | 41,316 |
| | | | 285,524 |
| General Obligations - 0.2% | | | |
| Brunswick ME 2.25% 11/1/2035 | | 380,000 | 311,049 |
| Lewiston ME Gen. Oblig. 1.5% 2/15/2034 | | 1,435,000 | 1,083,912 |
| Lewiston ME Gen. Oblig. 1.75% 2/15/2040 | | 1,270,000 | 824,265 |
| South Portland ME Gen. Oblig. 2.5% 7/15/2032 | | 1,355,000 | 1,214,086 |
| | | | 3,433,312 |
| Health Care - 0.0% | | | |
| Maine Health & Higher Edl Facs Auth Rev (Northern Light Health Proj.) Series 2016A, 4% 7/1/2041 | | 120,000 | 104,013 |
| Housing - 0.0% | | | |
| Maine Hsg Auth Mtg (ME Mortgage Proj.) Series 2022E, 5% 11/15/2052 | | 325,000 | 334,256 |
| Transportation - 0.0% | | | |
| Maine St Tpk Auth Tpk Rev 5% 7/1/2032 | | 55,000 | 55,416 |
| Maine St Tpk Auth Tpk Rev 5% 7/1/2038 | | 35,000 | 35,161 |
| | | | 90,577 |
TOTAL MAINE | | | 4,247,682 |
| Maryland - 1.6% | | | |
| Education - 0.2% | | | |
| Maryland Health & Higher Educational Facilities Authority (MD Inst College of Art Proj.) Series 2024, 5.25% 6/1/2044 | | 2,790,000 | 2,890,269 |
| Maryland Health & Higher Educational Facilities Authority (Stevenson University Proj.) Series 2021 A, 5% 6/1/2029 | | 55,000 | 57,268 |
| Maryland Health & Higher Educational Facilities Authority (Stevenson University Proj.) Series 2021 A, 5% 6/1/2033 | | 130,000 | 135,729 |
| Westminster MD Edl Facs Rev (Mcdaniel College Proj.) 5% 11/1/2027 | | 130,000 | 132,680 |
| Westminster MD Edl Facs Rev (Mcdaniel College Proj.) 5% 11/1/2028 | | 140,000 | 142,808 |
| Westminster MD Edl Facs Rev (Mcdaniel College Proj.) 5% 11/1/2029 | | 145,000 | 147,892 |
| Westminster MD Edl Facs Rev (Mcdaniel College Proj.) 5% 11/1/2030 | | 155,000 | 157,923 |
| | | | 3,664,569 |
| General Obligations - 0.5% | | | |
| Anne Arundel Cnty MD Gen. Oblig. Series 2021, 3% 10/1/2037 | | 1,710,000 | 1,537,049 |
| Anne Arundel Cnty MD Gen. Oblig. Series 2021, 5% 4/1/2028 | | 1,240,000 | 1,322,707 |
| Maryland St Stad Auth Hagerstown Multi-Use Sports & Events Fac Lease Rev (State of Maryland Proj.) Series 2022 A, 5% 6/1/2047 | | 1,935,000 | 2,051,158 |
| Maryland St Stad Auth Hagerstown Multi-Use Sports & Events Fac Lease Rev (State of Maryland Proj.) Series 2022 A, 5% 6/1/2052 | | 455,000 | 478,977 |
| Prince Georges Cty MD Ctf Part (Prince Georges County MD Proj.) 5% 10/1/2027 | | 720,000 | 758,909 |
| Prince Georges Cty MD Ctf Part (Prince Georges County MD Proj.) 5% 10/1/2028 | | 1,055,000 | 1,130,962 |
| State of Maryland 4% 8/1/2028 | | 2,500,000 | 2,592,826 |
| State of Maryland Gen. Oblig. 4% 3/1/2029 | | 1,260,000 | 1,311,923 |
| | | | 11,184,511 |
| Health Care - 0.5% | | | |
| Maryland Health & Higher Educational Facilities Authority (Frederick Memorial Hospital MD Proj.) Series 2023, 5% 7/1/2026 | | 600,000 | 612,812 |
| Maryland Health & Higher Educational Facilities Authority (Greater Baltimore Med Ctr, MD Proj.) Series 2021 A, 3% 7/1/2046 | | 3,970,000 | 3,222,481 |
| Maryland Health & Higher Educational Facilities Authority (Greater Baltimore Med Ctr, MD Proj.) Series 2021 A, 3% 7/1/2051 | | 1,385,000 | 1,031,889 |
| Maryland Health & Higher Educational Facilities Authority (Lifebridge Health Proj.) Series 2024, 5% 7/1/2049 | | 1,000,000 | 1,062,817 |
| Maryland Health & Higher Educational Facilities Authority (Lifebridge Health Proj.) Series 2024, 5.25% 7/1/2054 | | 3,555,000 | 3,819,072 |
| Maryland Health & Higher Educational Facilities Authority (Univ Of Maryland Med Sys, Md Proj.) Series 2020 B 1, 5% tender 7/1/2045 (b) | | 1,540,000 | 1,539,916 |
| Maryland St Hlth & HI Ed Facs (Mercy Medical Center, MD Proj.) 4% 7/1/2042 | | 85,000 | 77,086 |
| | | | 11,366,073 |
| Housing - 0.1% | | | |
| Maryland Community Development Administration (Residential Revenue Bonds Proj.) 3.5% 3/1/2050 | | 895,000 | 886,144 |
| Maryland Community Development Administration (Residential Revenue Bonds Proj.) Series 2019 B, 4% 9/1/2049 | | 475,000 | 475,324 |
| Maryland Community Development Administration (Residential Revenue Bonds Proj.) Series 2023E, 6.25% 3/1/2054 | | 400,000 | 433,677 |
| Montgomery County Housing Opportunities Commission (Montgomery Cnty MD Mhsg 1996 Proj.) Series 2021 C, 0.8% 7/1/2025 | | 145,000 | 142,305 |
| | | | 1,937,450 |
| Special Tax - 0.1% | | | |
| Maryland St Stad Auth Rev (MD Stadium Auth Baltimore City Sch Proj.) Series 2018 A, 5% 5/1/2033 | | 1,000,000 | 1,051,264 |
| State of Maryland Built to Learn Revenue Series 2021, 4% 6/1/2046 | | 260,000 | 252,744 |
| | | | 1,304,008 |
| Transportation - 0.2% | | | |
| Maryland St Dept Transn Spl Transn Proj Rev (Bwi Airport Proj.) 4% 8/1/2051 (e) | | 530,000 | 488,561 |
| Maryland St Dept Transn Spl Transn Proj Rev (Bwi Airport Proj.) 5% 8/1/2046 (e) | | 1,175,000 | 1,211,566 |
| Maryland St Econ Dev Corp Econ (Ports America Chesapeake LLC Proj.) Series 2017A, 5% 6/1/2030 | | 65,000 | 67,581 |
| Maryland St Econ Dev Corp Econ (Ports America Chesapeake LLC Proj.) Series 2017A, 5% 6/1/2035 | | 100,000 | 103,227 |
| Maryland Trans Auth Psngr Fac Chrg Rev (Bwi Passenger Facilities Chrge Proj.) Series 2012B, 2.625% 6/1/2027 (e) | | 1,590,000 | 1,524,199 |
| Maryland Trans Auth Psngr Fac Chrg Rev Series 2012B, 2.5% 6/1/2026 (e) | | 1,940,000 | 1,903,953 |
| | | | 5,299,087 |
| Water & Sewer - 0.0% | | | |
| Baltimore MD Proj Rev (Baltimore Wtr Util Rev Proj.) Series 2020 A, 4% 7/1/2045 | | 585,000 | 572,633 |
| Baltimore MD Proj Rev (Baltimore Wtr Util Rev Proj.) Series 2020 A, 5% 7/1/2050 | | 645,000 | 672,964 |
| | | | 1,245,597 |
TOTAL MARYLAND | | | 36,001,295 |
| Massachusetts - 4.3% | | | |
| Education - 1.6% | | | |
| Massachusetts Development Finance Agency (Boston College,Ma Proj.) Series 2021 V, 5% 7/1/2055 | | 1,595,000 | 1,843,211 |
| Massachusetts Development Finance Agency (Northeastern University Proj.) Series 2022, 5% 10/1/2038 | | 2,500,000 | 2,767,496 |
| Massachusetts Development Finance Agency (President and Fellows of Harvard College Proj.) Series 2020 A, 5% 10/15/2029 | | 1,470,000 | 1,614,971 |
| Massachusetts Development Finance Agency (Simmons College, MA Proj.) 4% 10/1/2050 | | 930,000 | 716,244 |
| Massachusetts Development Finance Agency (Simmons College, MA Proj.) 5% 10/1/2045 | | 700,000 | 659,542 |
| Massachusetts Development Finance Agency (Suffolk Univ, MA Proj.) 4% 7/1/2045 | | 930,000 | 765,895 |
| Massachusetts Ed Ln Auth Ed Ln (Mefa Issue K Proj.) Series 2017 A, 5% 7/1/2025 (e) | | 1,140,000 | 1,149,313 |
| Massachusetts Ed Ln Auth Ed Ln (Mefa Issue L Proj.) Series 2019 B, 5% 7/1/2027 (e) | | 200,000 | 205,518 |
| Massachusetts St Dev Fin Agy Rev (Berklee College of Music Inc Proj.) 5% 10/1/2029 | | 50,000 | 51,411 |
| Massachusetts St Dev Fin Agy Rev (Berklee College of Music Inc Proj.) 5% 10/1/2030 | | 75,000 | 77,128 |
| Massachusetts St Dev Fin Agy Rev (Berklee College of Music Inc Proj.) 5% 10/1/2031 | | 80,000 | 82,200 |
| Massachusetts St Dev Fin Agy Rev (Emmanuel College Proj.) Series 2016A, 5% 10/1/2043 | | 320,000 | 318,881 |
| Massachusetts St Dev Fin Agy Rev (Lesley College Proj.) 5% 7/1/2039 | | 85,000 | 85,515 |
| Massachusetts St Dev Fin Agy Rev (Wentworth Inst of Tech, MA Proj.) Series 2017, 5% 10/1/2027 | | 50,000 | 50,780 |
| Massachusetts St Dev Fin Agy Rev (Wentworth Inst of Tech, MA Proj.) Series 2017, 5% 10/1/2028 | | 55,000 | 55,832 |
| Massachusetts St Dev Fin Agy Rev (Wentworth Inst of Tech, MA Proj.) Series 2017, 5% 10/1/2029 | | 55,000 | 55,789 |
| Massachusetts St Dev Fin Agy Rev (Wentworth Inst of Tech, MA Proj.) Series 2017, 5% 10/1/2031 | | 60,000 | 60,759 |
| Massachusetts St Dev Fin Agy Rev (Wentworth Inst of Tech, MA Proj.) Series 2017, 5% 10/1/2032 | | 65,000 | 65,736 |
| Massachusetts St Dev Fin Agy Rv (President and Fellows of Harvard College Proj.) Series 2024 B, 5% 2/15/2034 | | 20,000,000 | 23,233,436 |
| | | | 33,859,657 |
| General Obligations - 1.0% | | | |
| Massachusetts St Gen. Oblig. 5% 1/1/2049 | | 295,000 | 305,319 |
| Massachusetts St Gen. Oblig. Series 2019 C, 5% 5/1/2049 | | 460,000 | 477,294 |
| Massachusetts St Gen. Oblig. Series 2020 D, 5% 7/1/2045 | | 4,525,000 | 4,781,941 |
| Massachusetts St Gen. Oblig. Series 2020 E, 5% 11/1/2045 | | 13,710,000 | 14,529,946 |
| Massachusetts St Gen. Oblig. Series 2024 H, 5% 12/1/2036 | | 2,200,000 | 2,533,478 |
| | | | 22,627,978 |
| Health Care - 0.1% | | | |
| Massachusetts Development Finance Agency (Tufts Medicine Proj.) Series 2019 A, 5% 7/1/2026 | | 795,000 | 800,198 |
| Massachusetts Development Finance Agency (University of Mass Hlth Cr Inc Proj.) 4% 7/1/2044 | | 50,000 | 44,853 |
| Massachusetts St Dev Fin Agy Rev (Mass General Brigham Inc Proj.) 4% 7/1/2041 | | 250,000 | 248,511 |
| Massachusetts St Dev Fin Agy Rev (Mass General Brigham Inc Proj.) 5% 7/1/2034 | | 215,000 | 224,974 |
| Massachusetts St Dev Fin Agy Rev (University of Mass Hlth Cr Inc Proj.) 5% 7/1/2031 | | 85,000 | 86,418 |
| | | | 1,404,954 |
| Housing - 0.0% | | | |
| Massachusetts Housing Finance Agency (Single Family Housing Revenue Proj.) 3% 6/1/2047 | | 710,000 | 693,920 |
| Special Tax - 1.1% | | | |
| Mass Bay Tran Auth Sls Tax Series 2016, 0% 7/1/2032 (h) | | 2,230,000 | 1,704,174 |
| Mass Bay Tran Auth Sls Tax Series 2021 A 1, 5% 7/1/2034 | | 1,100,000 | 1,213,629 |
| Massachusetts St Transn Fd Rev Series 2021 B, 5% 6/1/2037 | | 1,500,000 | 1,580,037 |
| Massachusetts St Transn Fd Rev Series 2022B, 5% 6/1/2052 | | 20,000,000 | 21,145,445 |
| | | | 25,643,285 |
| Transportation - 0.3% | | | |
| Massachusetts Port Auth Spl Fac Rev (Bosfuel Corporation Proj.) Series 2019 A, 5% 7/1/2049 (e) | | 435,000 | 441,934 |
| Massachusetts St Port Auth Rev 5% 7/1/2041 (e) | | 2,040,000 | 2,127,384 |
| Massachusetts St Port Auth Rev 5% 7/1/2046 (e) | | 390,000 | 402,906 |
| Massachusetts St Port Auth Rev 5% 7/1/2051 (e) | | 2,645,000 | 2,719,168 |
| Massachusetts St Port Auth Rev Series 2016A, 5% 7/1/2033 | | 105,000 | 107,374 |
| Massachusetts St Port Auth Rev Series 2016A, 5% 7/1/2034 | | 55,000 | 56,197 |
| Massachusetts St Port Auth Rev Series 2016A, 5% 7/1/2038 | | 80,000 | 81,487 |
| Massachusetts St Port Auth Rev Series 2019 A, 5% 7/1/2040 (e) | | 145,000 | 149,826 |
| Massachusetts St Port Auth Rev Series 2021 E, 5% 7/1/2037 (e) | | 1,205,000 | 1,274,233 |
| | | | 7,360,509 |
| Water & Sewer - 0.2% | | | |
| Massachusetts Clean Water Trust/The Series 25B, 5% 2/1/2038 | | 1,200,000 | 1,349,875 |
| Massachusetts Clean Water Trust/The Series 25B, 5% 2/1/2039 | | 1,210,000 | 1,351,978 |
| Massachusetts Clean Water Trust/The Series 25B, 5% 2/1/2041 | | 1,000,000 | 1,108,555 |
| Massachusetts Clean Water Trust/The Series 25B, 5% 2/1/2043 | | 1,000,000 | 1,100,788 |
| | | | 4,911,196 |
TOTAL MASSACHUSETTS | | | 96,501,499 |
| Michigan - 1.2% | | | |
| Education - 0.1% | | | |
| Michigan Finance Authority (Calvin University Proj.) 4% 9/1/2039 | | 175,000 | 166,622 |
| Michigan Finance Authority (Calvin University Proj.) 4% 9/1/2040 | | 175,000 | 165,388 |
| Michigan Finance Authority (Calvin University Proj.) 4% 9/1/2041 | | 145,000 | 135,942 |
| Oakland Univ Mich Rev Series 2019, 5% 3/1/2040 | | 300,000 | 314,192 |
| Oakland Univ Mich Rev Series 2019, 5% 3/1/2041 | | 315,000 | 328,898 |
| Oakland Univ Mich Rev Series 2019, 5% 3/1/2044 | | 615,000 | 635,430 |
| Oakland Univ Mich Rev Series 2019, 5% 3/1/2050 | | 1,000,000 | 1,025,488 |
| University MI Univ Revs Series 2020 A, 4% 4/1/2045 | | 440,000 | 433,633 |
| | | | 3,205,593 |
| Electric Utilities - 0.2% | | | |
| Lansing Mich Brd Wtr & Lt Util Sys Rev 2% tender 7/1/2051 (b) | | 3,560,000 | 3,447,151 |
| Escrowed/Pre-Refunded - 0.0% | | | |
| Michigan St Bldg Auth Rev Series 2015 I, 5% 4/15/2030 (Pre-refunded to 10/15/2025 at 100) | | 10,000 | 10,142 |
| Michigan St Hosp Fin Auth Rev Series 2008C, 5% 12/1/2032 (Pre-refunded to 12/1/2027 at 100) | | 5,000 | 5,280 |
| | | | 15,422 |
| General Obligations - 0.0% | | | |
| Detroit MI Gen. Oblig. Series 2021A, 5% 4/1/2046 | | 160,000 | 163,913 |
| Portage MI Pub Schs 5% 11/1/2030 | | 145,000 | 148,294 |
| Portage MI Pub Schs 5% 11/1/2031 | | 130,000 | 132,800 |
| Portage MI Pub Schs 5% 11/1/2036 | | 15,000 | 15,286 |
| | | | 460,293 |
| Health Care - 0.1% | | | |
| Grand Traverse Cnty MI Hosp (Munson Healthcare Proj.) 3% 7/1/2051 | | 605,000 | 466,850 |
| Kalamazoo MI Hosp Fin Auth Hosp Fac Rev (Bronson Methodist Hsp, MI Proj.) Series 2016, 5% 5/15/2028 | | 120,000 | 122,432 |
| Michigan Fin Auth Rev (Trinity Health Proj.) Series MI 2019 A, 3% 12/1/2049 | | 815,000 | 650,617 |
| Michigan St Hosp Fin Auth Rev (Trinity Health Proj.) Series 2008C, 5% 12/1/2032 | | 70,000 | 72,867 |
| | | | 1,312,766 |
| Housing - 0.2% | | | |
| Michigan Hsg Dev Auth Rent Hsg Rev (MI Single Family Mortgage Proj.) 3.5% 12/1/2050 | | 1,055,000 | 1,045,280 |
| Michigan Hsg Dev Auth Rent Hsg Rev (Rental Hsg Rev Bonds 11/15/1990 Proj.) Series 2021 A, 2.45% 10/1/2046 | | 1,280,000 | 877,132 |
| Michigan Hsg Dev Rental Hsg Series 2019 A 1, 3.6% 10/1/2060 | | 4,335,000 | 3,528,299 |
| | | | 5,450,711 |
| Special Tax - 0.0% | | | |
| Michigan Fin Auth Rev (Wayne Cnty MI Proj.) Series 2018, 5% 11/1/2043 | | 155,000 | 159,765 |
| Tobacco Bonds - 0.1% | | | |
| Michigan Fin Auth Rev (Michigan Tobacco Settlement Fin Auth Tobacco Settlement Asset Backed Rev Proj.) 4% 6/1/2049 | | 1,725,000 | 1,532,113 |
| Transportation - 0.1% | | | |
| Wayne Cnty Mich Arpt Auth Rev 4% 12/1/2034 (Assured Guaranty Municipal Corp Insured) | | 60,000 | 60,327 |
| Wayne Cnty Mich Arpt Auth Rev 4% 12/1/2035 (Assured Guaranty Municipal Corp Insured) | | 60,000 | 60,235 |
| Wayne Cnty Mich Arpt Auth Rev 4% 12/1/2036 (Assured Guaranty Municipal Corp Insured) | | 65,000 | 65,206 |
| Wayne Cnty Mich Arpt Auth Rev 5% 12/1/2029 (e) | | 30,000 | 30,939 |
| Wayne Cnty Mich Arpt Auth Rev 5% 12/1/2030 (e) | | 35,000 | 36,085 |
| Wayne Cnty Mich Arpt Auth Rev 5% 12/1/2031 (e) | | 40,000 | 41,204 |
| Wayne Cnty Mich Arpt Auth Rev 5% 12/1/2032 (e) | | 30,000 | 30,869 |
| Wayne Cnty Mich Arpt Auth Rev 5% 12/1/2037 | | 20,000 | 20,610 |
| Wayne Cnty Mich Arpt Auth Rev Series 2018 B, 5% 12/1/2048 (e) | | 295,000 | 298,373 |
| Wayne Cnty Mich Arpt Auth Rev Series 2018D, 5% 12/1/2029 (e) | | 235,000 | 245,137 |
| Wayne Cnty Mich Arpt Auth Rev Series A, 5% 12/1/2034 | | 35,000 | 36,304 |
| Wayne Cnty Mich Arpt Auth Rev Series A, 5% 12/1/2035 | | 30,000 | 31,070 |
| Wayne Cnty Mich Arpt Auth Rev Series B, 5% 12/1/2032 (e) | | 25,000 | 25,724 |
| Wayne Cnty Mich Arpt Auth Rev Series B, 5% 12/1/2034 (e) | | 30,000 | 30,759 |
| Wayne Cnty Mich Arpt Auth Rev Series B, 5% 12/1/2035 (e) | | 30,000 | 30,729 |
| Wayne Cnty Mich Arpt Auth Rev Series B, 5% 12/1/2037 (e) | | 45,000 | 45,963 |
| Wayne Cnty Mich Arpt Auth Rev Series B, 5% 12/1/2042 (e) | | 50,000 | 50,620 |
| Wayne Cnty Mich Arpt Auth Rev Series JRA, 4% 12/1/2033 (Assured Guaranty Municipal Corp Insured) | | 75,000 | 75,535 |
| Wayne Cnty Mich Arpt Auth Rev Series JRA, 5% 12/1/2031 | | 20,000 | 20,826 |
| Wayne Cnty Mich Arpt Auth Rev Series JRA, 5% 12/1/2032 | | 20,000 | 20,803 |
| | | | 1,257,318 |
| Water & Sewer - 0.4% | | | |
| Great Lakes Sewer Auth Mich Series 2018 A, 5% 7/1/2048 | | 535,000 | 551,582 |
| Great Lakes Wtr Auth Mich Wtr Supply Sys Rev Series 2023B, 5.25% 7/1/2053 | | 2,750,000 | 2,971,952 |
| Michigan Fin Auth Rev (MI St Clean Wtr Revolving Fnd Proj.) Series 2024A, 5% 10/1/2036 | | 3,940,000 | 4,491,605 |
| Michigan Fin Auth Rev (MI St Clean Wtr Revolving Fnd Proj.) Series 2024A, 5% 10/1/2038 | | 1,850,000 | 2,094,458 |
| | | | 10,109,597 |
TOTAL MICHIGAN | | | 26,950,729 |
| Minnesota - 1.1% | | | |
| Education - 0.2% | | | |
| Minnesota Higher Ed Facs Auth Rev (St Catherine University Proj.) Series 2018A, 5% 10/1/2030 | | 40,000 | 41,112 |
| Minnesota Higher Ed Facs Auth Rev (St Catherine University Proj.) Series 2018A, 5% 10/1/2045 | | 85,000 | 83,289 |
| Minnesota St Office of Higher Ed Rev Series 2023, 5% 11/1/2027 (e) | | 1,125,000 | 1,158,889 |
| Minnesota St Office of Higher Ed Rev Series 2023, 5% 11/1/2028 (e) | | 1,400,000 | 1,455,438 |
| Minnesota St Office of Higher Ed Rev Series 2023, 5% 11/1/2029 (e) | | 2,000,000 | 2,089,424 |
| Moorhead MN Edl Facs Rev (Concordia College/MN Proj.) Series 2016, 5% 12/1/2025 | | 15,000 | 15,000 |
| | | | 4,843,152 |
| General Obligations - 0.1% | | | |
| Sauk Rapids Minn Isd No 47 Series 2020A, 2.5% 2/1/2037 (Minnesota St Guaranteed) | | 2,785,000 | 2,275,031 |
| Sauk Rapids Minn Isd No 47 Series 2020A, 2.5% 2/1/2038 (Minnesota St Guaranteed) | | 1,000,000 | 807,933 |
| | | | 3,082,964 |
| Health Care - 0.5% | | | |
| Maple Grove MN Health Care Sys Rev Series 2017, 5% 5/1/2025 (North Memorial Med Center, MN Guaranteed) | | 40,000 | 40,107 |
| Minnesota Agric & Ec Dev Brd (Healthpartners Oblig Group Pj Proj.) Series 2024, 5.25% 1/1/2054 | | 7,700,000 | 8,267,118 |
| | | | 8,307,225 |
| Housing - 0.3% | | | |
| Minneapolis MN Multifamily Rev Series 2019, 2.46% 1/1/2038 (Fannie Mae Guaranteed) | | 1,076,293 | 838,697 |
| Minnesota Housing Finance Agency (MN Residential Hsg 1995 Proj.) 6% 1/1/2053 | | 6,520,000 | 6,887,046 |
| Minnesota Housing Finance Agency (MN Residential Hsg 1995 Proj.) Series 2023 F, 5.75% 7/1/2053 | | 305,000 | 323,580 |
| Minnesota Housing Finance Agency (MN Residential Hsg 1995 Proj.) Series 2023 R, 6.25% 7/1/2054 | | 360,000 | 389,204 |
| | | | 8,438,527 |
TOTAL MINNESOTA | | | 24,671,868 |
| Mississippi - 0.0% | | | |
| Housing - 0.0% | | | |
| Mississippi Home Corp Single Family Mtg Rev (Sf Mortgage 7/15/2009 Proj.) Series 2021 B, 3% 6/1/2051 | | 305,000 | 297,607 |
| Mississippi Home Corp Single Family Mtg Rev (Sf Mortgage 7/15/2009 Proj.) Series 2021 B, 5% 6/1/2027 | | 210,000 | 218,158 |
| | | | 515,765 |
TOTAL MISSISSIPPI | | | 515,765 |
| Missouri - 0.2% | | | |
| Health Care - 0.1% | | | |
| Cape Girardeau Cnty MO Indl Dev Auth Health Care Facs Rev (Mercy Health Proj.) Series 2021, 4% 3/1/2046 | | 650,000 | 609,426 |
| Cape Girardeau Cnty MO Indl Dev Auth Health Care Facs Rev (Mercy Health Proj.) Series A, 5% 3/1/2030 | | 35,000 | 36,113 |
| Cape Girardeau Cnty MO Indl Dev Auth Health Care Facs Rev (Mercy Health Proj.) Series A, 5% 3/1/2031 | | 80,000 | 82,521 |
| Cape Girardeau Cnty MO Indl Dev Auth Health Care Facs Rev (Mercy Health Proj.) Series A, 5% 3/1/2036 | | 155,000 | 158,752 |
| Missouri Hlth & Edl Facs Rev (Mercy Health Proj.) 3.125% 2/1/2027 | | 50,000 | 49,819 |
| Missouri Hlth & Edl Facs Rev (Mercy Health Proj.) 3.25% 2/1/2028 | | 50,000 | 49,901 |
| Missouri Hlth & Edl Facs Rev (Mercy Health Proj.) 5% 2/1/2029 | | 65,000 | 65,495 |
| St Louis Cnty MO Indl Dev Auth Sr Living Facs Rev (Friendship Village of West County Proj.) Series 2018A, 5.125% 9/1/2048 | | 75,000 | 73,355 |
| St Louis Cnty MO Indl Dev Auth Sr Living Facs Rev (Friendship Village of West County Proj.) Series 2018A, 5.25% 9/1/2053 | | 1,335,000 | 1,308,153 |
| | | | 2,433,535 |
| Housing - 0.1% | | | |
| Missouri St Hsg Dev Com Sf Mtg (MO Hsg First Place Loan Prog 5/1/15 Proj.) Series 2019B, 4% 5/1/2050 | | 30,000 | 30,053 |
| Missouri St Hsg Dev Com Sf Mtg (MO Hsg First Place Loan Prog 5/1/15 Proj.) Series 2021 A, 3% 5/1/2052 | | 575,000 | 561,051 |
| Missouri St Hsg Dev Com Sf Mtg (MO Hsg First Place Loan Prog 5/1/15 Proj.) Series 2021C, 3.25% 11/1/2052 | | 350,000 | 343,455 |
| Missouri St Hsg Dev Com Sf Mtg (MO Hsg First Place Loan Prog 5/1/15 Proj.) Series 2023 E, 6.5% 5/1/2054 | | 915,000 | 1,017,705 |
| | | | 1,952,264 |
| Transportation - 0.0% | | | |
| Kansas City MO Indl Dev Auth Arpt Spl Oblig (Kansas City MO Arpt Rev Proj.) Series 2019 B, 5% 3/1/2038 (e) | | 145,000 | 149,246 |
TOTAL MISSOURI | | | 4,535,045 |
| Montana - 0.2% | | | |
| Health Care - 0.1% | | | |
| Montana Fac Fin Auth Health Facs Rev (Bozeman Health Proj.) Series 2021 A, 3% 6/1/2050 | | 2,510,000 | 1,959,891 |
| Housing - 0.1% | | | |
| Montana St Brd Hsg Single Family Mtg (MT Single Family Proj.) 6% 6/1/2053 | | 2,125,000 | 2,258,607 |
| Montana St Brd Hsg Single Family Mtg (MT Single Family Proj.) Series 2019B, 4% 6/1/2050 | | 20,000 | 20,056 |
| | | | 2,278,663 |
TOTAL MONTANA | | | 4,238,554 |
| Nebraska - 0.6% | | | |
| Education - 0.0% | | | |
| Douglas Cnty Neb Edl Facs Rev (Creighton University Proj.) Series 2017, 4% 7/1/2034 | | 50,000 | 50,573 |
| Douglas Cnty Neb Edl Facs Rev (Creighton University Proj.) Series 2017, 5% 7/1/2036 | | 35,000 | 36,164 |
| Douglas Cnty Neb Edl Facs Rev (Creighton University Proj.) Series 2021 A, 3% 7/1/2051 | | 440,000 | 322,127 |
| | | | 408,864 |
| Electric Utilities - 0.0% | | | |
| Nebraska Pub Pwr Dist Rev Series B, 5% 1/1/2037 | | 125,000 | 126,583 |
| Escrowed/Pre-Refunded - 0.0% | | | |
| Omaha NE Arpt Auth Arpt Rev Series A, 5% 12/15/2025 (Escrowed to Maturity) (e) | | 5,000 | 5,068 |
| Omaha NE Arpt Auth Arpt Rev Series A, 5% 12/15/2026 (Escrowed to Maturity) (e) | | 35,000 | 36,016 |
| Omaha NE Arpt Auth Arpt Rev Series A, 5% 12/15/2027 (Pre-refunded to 12/15/2026 at 100) (e) | | 20,000 | 20,580 |
| Omaha NE Arpt Auth Arpt Rev Series A, 5% 12/15/2030 (Pre-refunded to 12/15/2026 at 100) (e) | | 35,000 | 36,016 |
| Omaha NE Arpt Auth Arpt Rev Series A, 5% 12/15/2031 (Pre-refunded to 12/15/2026 at 100) (e) | | 20,000 | 20,580 |
| Omaha NE Arpt Auth Arpt Rev Series A, 5% 12/15/2033 (Pre-refunded to 12/15/2026 at 100) (e) | | 20,000 | 20,580 |
| Omaha NE Arpt Auth Arpt Rev Series A, 5% 12/15/2035 (Pre-refunded to 12/15/2026 at 100) (e) | | 45,000 | 46,307 |
| Omaha NE Arpt Auth Arpt Rev Series A, 5% 12/15/2036 (Pre-refunded to 12/15/2026 at 100) (e) | | 10,000 | 10,290 |
| | | | 195,437 |
| General Obligations - 0.5% | | | |
| Central Plains Energy Proj NE Gas Proj Rev 4% tender 12/1/2049 (Royal Bank of Canada Guaranteed) (b) | | 6,790,000 | 6,797,418 |
| Central Plains Energy Proj NE Gas Proj Rev Series 2023 A 1, 5% tender 5/1/2054 (Bank of Montreal Guaranteed) (b) | | 5,025,000 | 5,283,442 |
| | | | 12,080,860 |
| Housing - 0.1% | | | |
| Nebraska Invt Fin Auth Sfh Rev (NE Single Family Hsg Proj.) Series 2019 B, 4% 9/1/2049 (e) | | 65,000 | 64,717 |
| Nebraska Invt Fin Auth Sfh Rev (NE Single Family Hsg Proj.) Series 2019 E, 3.75% 9/1/2049 (e) | | 65,000 | 64,593 |
| Nebraska Invt Fin Auth Sfh Rev (NE Single Family Hsg Proj.) Series 2020 A, 3.5% 9/1/2050 | | 1,165,000 | 1,154,044 |
| | | | 1,283,354 |
| Transportation - 0.0% | | | |
| Omaha NE Arpt Auth Arpt Rev Series A, 5% 12/15/2025 (e) | | 15,000 | 15,191 |
| Omaha NE Arpt Auth Arpt Rev Series A, 5% 12/15/2026 (e) | | 40,000 | 41,085 |
| Omaha NE Arpt Auth Arpt Rev Series A, 5% 12/15/2027 (e) | | 30,000 | 30,767 |
| Omaha NE Arpt Auth Arpt Rev Series A, 5% 12/15/2030 (e) | | 40,000 | 40,922 |
| Omaha NE Arpt Auth Arpt Rev Series A, 5% 12/15/2031 (e) | | 20,000 | 20,433 |
| Omaha NE Arpt Auth Arpt Rev Series A, 5% 12/15/2033 (e) | | 20,000 | 20,383 |
| Omaha NE Arpt Auth Arpt Rev Series A, 5% 12/15/2035 (e) | | 55,000 | 55,911 |
| Omaha NE Arpt Auth Arpt Rev Series A, 5% 12/15/2036 (e) | | 15,000 | 15,235 |
| | | | 239,927 |
TOTAL NEBRASKA | | | 14,335,025 |
| Nevada - 0.6% | | | |
| General Obligations - 0.5% | | | |
| Clark Cnty NV School Dist Series 2024 B, 3% 6/15/2041 | | 4,790,000 | 4,142,250 |
| Clark Cnty NV School Dist Series 2024 B, 3% 6/15/2043 | | 4,280,000 | 3,608,515 |
| Nevada St Gen. Oblig. Series 2024A, 3% 5/1/2043 | | 2,850,000 | 2,427,237 |
| | | | 10,178,002 |
| Housing - 0.1% | | | |
| Nevada Hsg Div Single Family Mtg Rev (NV Single Fam Mort Rev 9/1/2008 Proj.) 3% 10/1/2051 | | 2,015,000 | 1,955,204 |
| Nevada Hsg Div Single Family Mtg Rev (NV Single Fam Mort Rev 9/1/2008 Proj.) Series 2019B, 4% 10/1/2049 | | 40,000 | 40,056 |
| | | | 1,995,260 |
| Transportation - 0.0% | | | |
| Clark Cnty NV Arpt Rev Series 2019 A, 5% 7/1/2026 | | 570,000 | 586,372 |
TOTAL NEVADA | | | 12,759,634 |
| New Hampshire - 0.6% | | | |
| Education - 0.1% | | | |
| New Hampshire Health and Education Facilities Authority Act (New Hampshire Higher Ed Ln Proj.) Series 2023 B, 5% 11/1/2043 (e) | | 1,205,000 | 1,233,686 |
| Health Care - 0.2% | | | |
| National Fin Auth NH Hosp Rev (St Lukes Hospital & Health Ntw Proj.) Series 2021 B, 3% 8/15/2051 (Assured Guaranty Municipal Corp Insured) | | 780,000 | 612,773 |
| National Fin Auth NH Hosp Rev (St Lukes Hospital & Health Ntw Proj.) Series 2021 B, 5% 8/15/2026 | | 190,000 | 194,672 |
| National Fin Auth NH Rev (Presbyterian Homes, PA Proj.) Series 2023 A, 5.25% 7/1/2048 | | 520,000 | 544,315 |
| New Hampshire Health and Education Facilities Authority Act (Catholic Medical Center, NH Proj.) Series 2017, 5% 7/1/2044 | | 665,000 | 657,633 |
| New Hampshire Health and Education Facilities Authority Act (Dartmouth-Hitchcock Oblgtd Grp Proj.) Series 2018 A 1, 5% 8/1/2028 | | 60,000 | 62,971 |
| New Hampshire Health and Education Facilities Authority Act (Dartmouth-Hitchcock Oblgtd Grp Proj.) Series 2018 A 1, 5% 8/1/2029 | | 55,000 | 57,370 |
| New Hampshire Health and Education Facilities Authority Act (Dartmouth-Hitchcock Oblgtd Grp Proj.) Series 2018 A 1, 5% 8/1/2030 | | 50,000 | 52,066 |
| New Hampshire Health and Education Facilities Authority Act (Mass General Brigham Inc Proj.) 5% 7/1/2033 | | 175,000 | 182,902 |
| New Hampshire Health and Education Facilities Authority Act (Mass General Brigham Inc Proj.) 5% 7/1/2034 | | 270,000 | 281,742 |
| New Hampshire Health and Education Facilities Authority Act (Mass General Brigham Inc Proj.) 5% 7/1/2035 | | 285,000 | 296,826 |
| New Hampshire Health and Education Facilities Authority Act (Mass General Brigham Inc Proj.) 5% 7/1/2036 | | 300,000 | 311,963 |
| New Hampshire Health and Education Facilities Authority Act (Mass General Brigham Inc Proj.) 5% 7/1/2037 | | 260,000 | 269,899 |
| NH Health & Ed Facs Auth Rev (Catholic Medical Center, NH Proj.) 4% 7/1/2032 | | 140,000 | 136,147 |
| NH Health & Ed Facs Auth Rev (Catholic Medical Center, NH Proj.) 5% 7/1/2025 | | 60,000 | 60,010 |
| NH Health & Ed Facs Auth Rev (Catholic Medical Center, NH Proj.) 5% 7/1/2027 | | 25,000 | 25,004 |
| NH Health & Ed Facs Auth Rev (Elliot Health System Proj.) Series 2016, 4% 10/1/2038 | | 120,000 | 112,669 |
| NH Health & Ed Facs Auth Rev (Elliot Health System Proj.) Series 2016, 5% 10/1/2025 | | 105,000 | 106,103 |
| | | | 3,965,065 |
| Housing - 0.3% | | | |
| National Fin Auth NH Hosp Rev (Lihtc 2020-1 Us Proj.) Series 1 Class A, 4.125% 1/20/2034 | | 409,355 | 406,354 |
| National Fin Auth NH Hosp Rev (Lihtc 2023-2 Us Proj.) Series 2 Class A, 3.875% 1/20/2038 | | 3,528,051 | 3,338,589 |
| New Hampshire Business Finance Authority (Lihtc 2022-2 Us Proj.) Series 2 Class A, 4% 10/20/2036 | | 2,358,262 | 2,273,350 |
| New Hampshire St Hsg Fin Auth Multi-Family Hsg (NH Mhsg Rev 2017 Proj.) Series 2023 4, 3.625% 4/1/2026 | | 415,000 | 416,623 |
| New Hampshire St Hsg Fin Auth Multi-Family Hsg (NH Mhsg Rev 2017 Proj.) Series 2023 4, 3.7% 1/1/2027 | | 1,335,000 | 1,340,785 |
| | | | 7,775,701 |
TOTAL NEW HAMPSHIRE | | | 12,974,452 |
| New Jersey - 7.1% | | | |
| Education - 1.0% | | | |
| Atlantic Cnty NJ Impt Auth Lse (Stockton University Proj.) Series 2016 A, 5% 7/1/2028 (Assured Guaranty Municipal Corp Insured) | | 55,000 | 56,337 |
| Atlantic Cnty NJ Impt Auth Lse (Stockton University Proj.) Series 2016 A, 5% 7/1/2030 (Assured Guaranty Municipal Corp Insured) | | 130,000 | 132,931 |
| Atlantic Cnty NJ Impt Auth Lse (Stockton University Proj.) Series 2016 A, 5% 7/1/2032 (Assured Guaranty Municipal Corp Insured) | | 65,000 | 66,389 |
| Atlantic Cnty NJ Impt Auth Lse (Stockton University Proj.) Series 2016 A, 5% 7/1/2033 (Assured Guaranty Municipal Corp Insured) | | 65,000 | 66,320 |
| Higher Ed Student Assistance Auth NJ Student Ln Rev (NJ Stud Loan 2010-1 Proj.) 5% 12/1/2025 (e) | | 2,500,000 | 2,528,246 |
| Higher Ed Student Assistance Auth NJ Student Ln Rev (NJ Stud Loan 2010-1 Proj.) 5% 12/1/2026 (e) | | 1,970,000 | 2,016,585 |
| Higher Ed Student Assistance Auth NJ Student Ln Rev (NJ Stud Loan 2012 Proj.) Series 1A, 5% 12/1/2025 (e) | | 1,000,000 | 1,011,298 |
| Higher Ed Student Assistance Auth NJ Student Ln Rev (NJ Stud Loan 2018 Proj.) Series 2018 B, 5% 12/1/2025 (e) | | 215,000 | 217,429 |
| Higher Ed Student Assistance Auth NJ Student Ln Rev (NJ Stud Loan 2018 Proj.) Series 2018 B, 5% 12/1/2026 (e) | | 305,000 | 312,212 |
| Higher Ed Student Assistance Auth NJ Student Ln Rev (NJ Stud Loan 2018 Proj.) Series 2018 B, 5% 12/1/2027 (e) | | 750,000 | 775,153 |
| Higher Ed Student Assistance Auth NJ Student Ln Rev (NJ Stud Loan 2018 Proj.) Series 2018 B, 5% 12/1/2028 (e) | | 1,000,000 | 1,041,676 |
| Higher Ed Student Assistance Auth NJ Student Ln Rev (NJ Stud Loan 2019 Proj.) 5% 12/1/2026 (e) | | 2,100,000 | 2,149,659 |
| Higher Ed Student Assistance Auth NJ Student Ln Rev (NJ Stud Loan 2019 Proj.) Series 2019A, 5% 12/1/2025 | | 95,000 | 96,381 |
| Higher Ed Student Assistance Auth NJ Student Ln Rev (NJ Stud Loan 2019 Proj.) Series 2020 A, 5% 12/1/2027 (e) | | 165,000 | 170,534 |
| Higher Ed Student Assistance Auth NJ Student Ln Rev (NJ Stud Loan 2019 Proj.) Series 2020B, 5% 12/1/2028 (e) | | 295,000 | 307,996 |
| Higher Ed Student Assistance Auth NJ Student Ln Rev (NJ Stud Loan 2019 Proj.) Series 2022A, 5% 12/1/2025 (e) | | 550,000 | 556,214 |
| Higher Ed Student Assistance Auth NJ Student Ln Rev (NJ Stud Loan 2019 Proj.) Series 2022A, 5% 12/1/2026 (e) | | 205,000 | 209,848 |
| Higher Ed Student Assistance Auth NJ Student Ln Rev (NJ Stud Loan 2021 Proj.) Series 2023A, 5% 12/1/2031 (e) | | 2,375,000 | 2,516,177 |
| Higher Ed Student Assistance Auth NJ Student Ln Rev (NJ Stud Loan 2021 Proj.) Series 2023B, 5% 12/1/2031 (e) | | 7,590,000 | 8,041,172 |
| New Jersey Educational Facilities Authority (Stockton University Proj.) Series 2016A, 5% 7/1/2031 | | 105,000 | 107,101 |
| New Jersey Educational Facilities Authority (Stockton University Proj.) Series 2016A, 5% 7/1/2032 | | 120,000 | 122,301 |
| | | | 22,501,959 |
| Electric Utilities - 0.3% | | | |
| New Jersey Eda Wtr Facs Rev (New Jersey American Wtr Co Inc Proj.) 3.75% tender 11/1/2034 (b)(e) | | 6,160,000 | 6,140,773 |
| Escrowed/Pre-Refunded - 0.1% | | | |
| New Jersey Health Care Series 2016 A, 5% 7/1/2029 (Pre-refunded to 7/1/2026 at 100) | | 35,000 | 35,898 |
| New Jersey Health Care Series 2017 A, 5% 7/1/2028 (Pre-refunded to 7/1/2026 at 100) | | 2,730,000 | 2,800,031 |
| | | | 2,835,929 |
| General Obligations - 3.9% | | | |
| New Jersey Econom Dev Auth Rev (New Jersey St Proj.) Series 2019 LLL, 5% 6/15/2044 | | 335,000 | 347,231 |
| New Jersey Economic Dev Auth Rev (New Jersey St Proj.) 4% 11/1/2044 | | 1,015,000 | 995,069 |
| New Jersey Economic Dev Auth Rev (New Jersey St Proj.) 4% 6/15/2046 | | 850,000 | 829,789 |
| New Jersey Economic Dev Auth Rev (New Jersey St Proj.) 4% 6/15/2050 | | 4,215,000 | 4,038,829 |
| New Jersey Economic Dev Auth Rev (New Jersey St Proj.) 5% 11/1/2031 | | 665,000 | 715,580 |
| New Jersey Economic Dev Auth Rev (New Jersey St Proj.) 5% 11/1/2036 | | 745,000 | 789,840 |
| New Jersey Economic Dev Auth Rev (New Jersey St Proj.) 5.25% 6/15/2027 | | 400,000 | 402,922 |
| New Jersey Economic Dev Auth Rev (New Jersey St Proj.) Series 2023 RRR, 5% 3/1/2025 | | 3,750,000 | 3,760,132 |
| New Jersey St Gen. Oblig. 2% 6/1/2036 | | 525,000 | 408,941 |
| New Jersey St Gen. Oblig. 5% 6/1/2026 | | 4,305,000 | 4,422,702 |
| New Jersey St Gen. Oblig. 5% 6/1/2029 | | 325,000 | 351,754 |
| New Jersey Trans Trust Fund Auth 0% 12/15/2027 (h) | | 690,000 | 625,521 |
| New Jersey Trans Trust Fund Auth 0% 12/15/2030 (Financial Guaranty Ins CO Insured) (h) | | 2,420,000 | 1,962,212 |
| New Jersey Trans Trust Fund Auth 0% 12/15/2033 (Assured Guaranty Municipal Corp Insured) (h) | | 1,650,000 | 1,192,455 |
| New Jersey Trans Trust Fund Auth 0% 12/15/2036 (h) | | 5,000,000 | 3,127,270 |
| New Jersey Trans Trust Fund Auth 0% 12/15/2036 (Ambac Assurance Corp Insured) (h) | | 3,000,000 | 1,876,362 |
| New Jersey Trans Trust Fund Auth 4% 6/15/2034 | | 170,000 | 173,769 |
| New Jersey Trans Trust Fund Auth 4% 6/15/2036 | | 280,000 | 282,481 |
| New Jersey Trans Trust Fund Auth 4% 6/15/2045 | | 2,510,000 | 2,423,379 |
| New Jersey Trans Trust Fund Auth 4% 6/15/2050 | | 3,210,000 | 3,051,904 |
| New Jersey Trans Trust Fund Auth 5% 6/15/2032 | | 360,000 | 395,345 |
| New Jersey Trans Trust Fund Auth 5% 6/15/2033 | | 1,280,000 | 1,405,963 |
| New Jersey Trans Trust Fund Auth 5% 6/15/2038 | | 315,000 | 336,886 |
| New Jersey Trans Trust Fund Auth 5% 6/15/2042 | | 5,500,000 | 6,018,926 |
| New Jersey Trans Trust Fund Auth 5% 6/15/2045 | | 1,670,000 | 1,806,800 |
| New Jersey Trans Trust Fund Auth 5.25% 6/15/2050 | | 3,365,000 | 3,652,558 |
| New Jersey Trans Trust Fund Auth 5.25% 6/15/2050 | | 25,000,000 | 26,901,303 |
| New Jersey Trans Trust Fund Auth 5.25% 6/15/2055 | | 7,095,000 | 7,659,102 |
| New Jersey Trans Trust Fund Auth Series 2018 A, 5% 12/15/2034 | | 115,000 | 121,000 |
| New Jersey Trans Trust Fund Auth Series 2019 BB, 5% 6/15/2033 | | 1,265,000 | 1,337,603 |
| New Jersey Trans Trust Fund Auth Series 2022 A, 4% 6/15/2040 | | 220,000 | 216,999 |
| New Jersey Trans Trust Fund Auth Series 2022 A, 4% 6/15/2041 | | 945,000 | 928,383 |
| New Jersey Trans Trust Fund Auth Series 2022 BB, 4% 6/15/2046 | | 1,750,000 | 1,686,724 |
| New Jersey Trans Trust Fund Auth Series 2022 BB, 4% 6/15/2050 | | 1,205,000 | 1,145,652 |
| New Jersey Trans Trust Fund Auth Series 2022AA, 5% 6/15/2029 | | 295,000 | 317,560 |
| New Jersey Trans Trust Fund Auth Series 2022AA, 5% 6/15/2030 | | 1,625,000 | 1,772,040 |
| New Jersey Trans Trust Fund Auth Series 2022AA, 5% 6/15/2033 | | 380,000 | 422,518 |
| | | | 87,903,504 |
| Health Care - 0.1% | | | |
| New Jersey Econom Dev Auth Rev (Black Horse EHT Urban Renewal LLC Proj.) Series 2019 A, 5% (g) | | 100,000 | 78,815 |
| New Jersey Economic Dev Auth Rev (White Horse HMT Urban Renewal LLC Proj.) 5% (c)(g) | | 100,000 | 65,771 |
| New Jersey Health Care (Atlanticare Regional Med Ctr Proj.) 3% 7/1/2039 | | 590,000 | 531,664 |
| New Jersey Health Care (St Joseph Hosp & Med Ctr, NJ Proj.) Series 2016, 4% 7/1/2048 | | 1,610,000 | 1,433,831 |
| New Jersey Health Care (St Joseph Hosp & Med Ctr, NJ Proj.) Series 2016, 5% 7/1/2041 | | 125,000 | 125,788 |
| New Jersey Health Care (Univ of Penn Health Systems Proj.) 5% 7/1/2028 | | 20,000 | 20,554 |
| New Jersey Health Care (Univ of Penn Health Systems Proj.) 5% 7/1/2030 | | 50,000 | 51,327 |
| New Jersey Health Care (Univ of Penn Health Systems Proj.) Series 2016A, 5% 7/1/2027 | | 40,000 | 41,135 |
| | | | 2,348,885 |
| Housing - 0.3% | | | |
| NJ Hsg & Mtg Fin Agy Multi Fam Rev (NJ Multifamily Rev Bonds 12/16/04 Proj.) Series 2023 C, 5% 11/1/2027 (e) | | 1,795,000 | 1,846,159 |
| NJ Hsg & Mtg Fin Agy Multi Fam Rev (NJ Multifamily Rev Bonds 12/16/04 Proj.) Series 2023 C, 5% 5/1/2026 (e) | | 1,675,000 | 1,705,311 |
| NJ Hsg & Mtg Fin Agy Multi Fam Rev (NJ Multifamily Rev Bonds 12/16/04 Proj.) Series 2023 C, 5% 5/1/2027 (e) | | 1,765,000 | 1,809,183 |
| NJ Hsg & Mtg Fin Agy Multi Fam Rev (NJ Multifamily Rev Bonds 12/16/04 Proj.) Series 2023 C, 5% 5/1/2028 (e) | | 1,835,000 | 1,890,033 |
| | | | 7,250,686 |
| Tobacco Bonds - 0.4% | | | |
| Tobacco Settlement Fin Corp NJ Series 2018 A, 5.25% 6/1/2046 | | 3,225,000 | 3,305,238 |
| Tobacco Settlement Fin Corp NJ Series 2018B, 5% 6/1/2046 | | 5,765,000 | 5,757,228 |
| | | | 9,062,466 |
| Transportation - 1.0% | | | |
| New Jersey Trans Trust Fund Auth (New Jersey St Grant Anticipati Proj.) Series 2016 A 1, 5% 6/15/2027 | | 135,000 | 138,033 |
| New Jersey Trans Trust Fund Auth (New Jersey St Grant Anticipati Proj.) Series 2016 A 1, 5% 6/15/2029 | | 115,000 | 117,362 |
| New Jersey Turnpike Authority 5% 1/1/2028 | | 245,000 | 247,537 |
| New Jersey Turnpike Authority 5% 1/1/2030 | | 2,380,000 | 2,602,342 |
| New Jersey Turnpike Authority 5% 1/1/2046 | | 7,000,000 | 7,597,584 |
| New Jersey Turnpike Authority Series 2015 E, 5% 1/1/2034 | | 235,000 | 235,000 |
| New Jersey Turnpike Authority Series 2024 C, 5% 1/1/2042 | | 1,915,000 | 2,111,812 |
| New Jersey Turnpike Authority Series 2024 C, 5% 1/1/2043 | | 2,015,000 | 2,218,259 |
| New Jersey Turnpike Authority Series 2024 C, 5% 1/1/2044 | | 2,685,000 | 2,953,109 |
| New Jersey Turnpike Authority Series 2024 C, 5% 1/1/2045 | | 2,395,000 | 2,626,782 |
| South Jersey Trans Auth NJ Trans Sys Rev Series 2022 A, 5% 11/1/2039 | | 750,000 | 803,063 |
| | | | 21,650,883 |
TOTAL NEW JERSEY | | | 159,695,085 |
| New Jersey,New York - 0.6% | | | |
| Transportation - 0.6% | | | |
| Port Auth NY & NJ 5% 1/15/2047 (e) | | 10,480,000 | 10,985,552 |
| Port Auth NY & NJ Series 227, 2% 10/1/2034 (e) | | 2,390,000 | 1,822,070 |
| | | | 12,807,622 |
TOTAL NEW JERSEY,NEW YORK | | | 12,807,622 |
| New Mexico - 0.5% | | | |
| Education - 0.1% | | | |
| New Mexico Edl Assistnce Fndtn Series 2021 1A, 5% 9/1/2026 (e) | | 945,000 | 964,818 |
| New Mexico Edl Assistnce Fndtn Series 2021 1A, 5% 9/1/2027 (e) | | 445,000 | 458,755 |
| New Mexico Edl Assistnce Fndtn Series 2021 1A, 5% 9/1/2029 (e) | | 175,000 | 183,130 |
| | | | 1,606,703 |
| Health Care - 0.0% | | | |
| Santa Fe New Mexico Retirement Fac Rev (El Castillo Retirement Res Proj.) Series 2019A, 5% 5/15/2034 | | 20,000 | 20,550 |
| Santa Fe New Mexico Retirement Fac Rev (El Castillo Retirement Res Proj.) Series 2019A, 5% 5/15/2039 | | 15,000 | 15,218 |
| Santa Fe New Mexico Retirement Fac Rev (El Castillo Retirement Res Proj.) Series 2019A, 5% 5/15/2044 | | 15,000 | 15,012 |
| Santa Fe New Mexico Retirement Fac Rev (El Castillo Retirement Res Proj.) Series 2019A, 5% 5/15/2049 | | 30,000 | 29,142 |
| | | | 79,922 |
| Housing - 0.4% | | | |
| New Mexico Mtg Fin Auth (NM Sf Mortgage 2005 Proj.) Series 2023 D, 6.5% 9/1/2054 | | 7,325,000 | 8,042,389 |
| New Mexico Mtg Fin Auth (NM SF Mortgage Proj.) Series 2019 D, 3.75% 1/1/2050 | | 65,000 | 64,803 |
| New Mexico Mtg Fin Auth (NM SF Mortgage Proj.) Series 2023 C, 5.75% 3/1/2054 | | 1,030,000 | 1,100,562 |
| | | | 9,207,754 |
TOTAL NEW MEXICO | | | 10,894,379 |
| New York - 8.3% | | | |
| Education - 0.4% | | | |
| New York St Dorm Auth Revs Non St Supportd Debt (Fordham University Proj.) Series 2017, 4% 7/1/2033 | | 65,000 | 65,811 |
| New York St Dorm Auth Revs Non St Supportd Debt (Fordham University Proj.) Series 2017, 4% 7/1/2034 | | 65,000 | 65,760 |
| New York St Dorm Auth Revs Non St Supported Debt (Teachers College, Columbia Uni Versity Proj.) 4% 7/1/2036 | | 445,000 | 451,587 |
| New York St Dorm Auth Revs Non St Supported Debt (Teachers College, Columbia Uni Versity Proj.) 4% 7/1/2038 | | 140,000 | 141,333 |
| New York St Dorm Auth Revs Non St Supported Debt (Teachers College, Columbia Uni Versity Proj.) 4% 7/1/2040 | | 235,000 | 236,129 |
| New York St Dorm Auth Revs Non St Supported Debt (Teachers College, Columbia Uni Versity Proj.) 5% 7/1/2034 | | 295,000 | 325,720 |
| New York St Dorm Auth Revs Non St Supported Debt (Teachers College, Columbia Uni Versity Proj.) 5% 7/1/2035 | | 295,000 | 323,744 |
| New York St Dorm Auth Revs Non St Supported Debt (Teachers College, Columbia Uni Versity Proj.) 5% 7/1/2037 | | 485,000 | 529,939 |
| New York St Dorm Auth Revs Non St Supported Debt (Teachers College, Columbia Uni Versity Proj.) 5% 7/1/2039 | | 145,000 | 157,496 |
| New York St Dorm Auth Revs Non St Supported Debt (Teachers College, Columbia Uni Versity Proj.) 5% 7/1/2041 | | 260,000 | 280,771 |
| New York St Dorm Auth Revs Non St Supported Debt (Wagner College, NY Proj.) 5% 7/1/2057 | | 3,730,000 | 3,451,397 |
| New York St Dorm Auth Revs Non St Supported Debt (Yeshiva University Proj.) 5% 7/15/2037 | | 120,000 | 124,770 |
| New York St Dorm Auth Revs Non St Supported Debt (Yeshiva University Proj.) 5% 7/15/2042 | | 340,000 | 346,732 |
| New York St Dorm Auth Revs Non St Supported Debt (Yeshiva University Proj.) 5% 7/15/2050 | | 880,000 | 884,635 |
| Onondaga NY Civic Dev Corp (Le Moyne College Proj.) Series 2018, 5% 1/1/2043 | | 50,000 | 50,347 |
| Schenectady County Capital Resource Corp (Union College, NY Proj.) 5% 1/1/2040 | | 785,000 | 803,551 |
| | | | 8,239,722 |
| Electric Utilities - 0.0% | | | |
| Long Island Pwr Auth NY Elec 1.5% tender 9/1/2051 (b) | | 630,000 | 607,487 |
| General Obligations - 0.3% | | | |
| City of New York NY Gen. Oblig. 5% 8/1/2025 | | 2,000,000 | 2,021,846 |
| City of New York NY Gen. Oblig. 5% 8/1/2025 | | 3,000,000 | 3,032,769 |
| City of New York NY Gen. Oblig. 5% tender 6/1/2044 (i) | | 500,000 | 503,019 |
| City of New York NY Gen. Oblig. Series A, 5% 8/1/2026 | | 295,000 | 304,131 |
| City of New York NY Gen. Oblig. Series E, 5% 8/1/2028 | | 220,000 | 226,031 |
| New York NY City Edl Constr Fd (City of New York NY Proj.) Series 2021 B, 5% 4/1/2046 | | 760,000 | 801,795 |
| New York NY City Transitional Fin Auth Bldg Aid Rev (New York St Proj.) Series 2015 S 2, 5% 7/15/2035 | | 90,000 | 90,747 |
| | | | 6,980,338 |
| Health Care - 0.0% | | | |
| New York St Dorm Auth Revs Non St Supportd Debt (Garnet Hlth Med Ctr Proj.) 5% 12/1/2025 (g) | | 100,000 | 100,056 |
| Suffolk Cnty NY Economic Dev Corp Rev (St Johnland Assisted Living Proj.) Series 2021, 4.625% 11/1/2031 (g) | | 100,000 | 93,756 |
| Suffolk Cnty NY Economic Dev Corp Rev (St Johnland Assisted Living Proj.) Series 2021, 5.375% 11/1/2054 (g) | | 260,000 | 219,027 |
| | | | 412,839 |
| Housing - 1.0% | | | |
| New York St Hsg Fin Agy (Affordable Housing Revenue Bonds 8/22/2007 Proj.) 0.75% 5/1/2025 | | 145,000 | 143,098 |
| New York St Hsg Fin Agy 1% tender 11/1/2061 (b) | | 135,000 | 127,596 |
| New York St Hsg Fin Agy 1.1% tender 11/1/2061 (b) | | 1,310,000 | 1,224,588 |
| New York St Hsg Fin Agy Series 2023 C2, 3.8% tender 11/1/2062 (b) | | 6,565,000 | 6,579,410 |
| New York St Hsg Fin Agy Series 2023 E 2, 3.8% tender 11/1/2063 (b) | | 1,335,000 | 1,336,640 |
| NY City Hsg Dev Corp Multifamily Hsg Rev (New York Mhsg 7/27/1993 Proj.) 0.6% tender 5/1/2061 (b) | | 490,000 | 481,706 |
| NY City Hsg Dev Corp Multifamily Hsg Rev (New York Mhsg 7/27/1993 Proj.) 0.7% tender 11/1/2060 (b) | | 220,000 | 216,440 |
| NY City Hsg Dev Corp Multifamily Hsg Rev (New York Mhsg 7/27/1993 Proj.) 3.4% tender 11/1/2062 (b) | | 4,100,000 | 4,071,244 |
| NY City Hsg Dev Corp Multifamily Hsg Rev (New York Mhsg 7/27/1993 Proj.) 3.7% tender 5/1/2063 (b) | | 2,045,000 | 2,048,214 |
| NY City Hsg Dev Corp Multifamily Hsg Rev (New York Mhsg 7/27/1993 Proj.) 3.73% tender 5/1/2063 (b) | | 2,280,000 | 2,279,241 |
| NY City Hsg Dev Corp Multifamily Hsg Rev (New York Mhsg 7/27/1993 Proj.) Series 2019 J, 3.05% 11/1/2049 | | 650,000 | 497,056 |
| NY City Hsg Dev Corp Multifamily Hsg Rev (New York Mhsg 7/27/1993 Proj.) Series 2021 K2, 0.9% tender 11/1/2060 (b) | | 2,435,000 | 2,359,154 |
| NY City Hsg Dev Corp Multifamily Hsg Rev (New York Mhsg 7/27/1993 Proj.) Series 2023 D, 4.3% tender 11/1/2063 (b) | | 1,635,000 | 1,667,346 |
| State of New York Mortgage Agency (NY Homeowner Mortgage Proj.) Series 221, 3.5% 10/1/2032 (e) | | 40,000 | 39,607 |
| State of New York Mortgage Agency (NY Homeowner Mortgage Proj.) Series 226, 1.8% 4/1/2028 (e) | | 1,000,000 | 915,559 |
| | | | 23,986,899 |
| Industrial Development - 0.1% | | | |
| MTA Hudson Rail Yards Trust Series 2016 A, 5% 11/15/2056 | | 1,300,000 | 1,299,986 |
| Other - 0.1% | | | |
| New York City Trust Cultural Resources Rev (American Museum of Natural History/The Proj.) Series 2024 A, 5% 7/15/2038 | | 1,400,000 | 1,594,198 |
| New York City Trust Cultural Resources Rev (Whitney Museum of American Art Proj.) 5% 7/1/2031 | | 1,000,000 | 1,113,335 |
| | | | 2,707,533 |
| Special Tax - 2.9% | | | |
| New York City Transitional Finance Authority (New York NY City Transitional Fin Auth Rev Proj.) Series FISCAL 2024D SUB D 1, 5% 11/1/2030 | | 7,000,000 | 7,762,052 |
| New York City Transitional Finance Authority (New York NY City Transitional Fin Auth Rev Proj.) Series FISCAL 2024D SUB D 1, 5% 11/1/2032 | | 5,005,000 | 5,660,126 |
| New York NY City Transitional Fin Auth Rev Series 2018 A 2, 5% 8/1/2039 | | 585,000 | 604,405 |
| New York St Dorm Auth Sales Tax Rev St Supported (New York State Sales Tax Rev Proj.) Series 2024 B, 5% 3/15/2036 | | 2,360,000 | 2,720,479 |
| New York St Dorm Auth Sales Tax Rev St Supported (New York State Sales Tax Rev Proj.) Series 2024 B, 5% 3/15/2038 | | 2,505,000 | 2,860,450 |
| New York St Dorm Auth St Pers Income Tax Rev (New York State Pit Proj.) 3% 3/15/2050 | | 675,000 | 509,820 |
| New York St Dorm Auth St Pers Income Tax Rev (New York State Pit Proj.) Series 2018A, 5.25% 3/15/2038 | | 585,000 | 621,103 |
| New York St Dorm Auth St Pers Income Tax Rev (New York State Pit Proj.) Series 2019 D, 3% 2/15/2049 | | 4,140,000 | 3,170,830 |
| New York St Dorm Auth St Pers Income Tax Rev (New York State Pit Proj.) Series 2021 A, 4% 3/15/2039 | | 9,000,000 | 9,071,643 |
| New York St Dorm Auth St Pers Income Tax Rev (New York State Pit Proj.) Series 2022 A, 5% 3/15/2041 | | 295,000 | 318,682 |
| New York State Urban Development Corp (New York State Pit Proj.) Series 2020 A, 3% 3/15/2050 | | 7,910,000 | 6,026,766 |
| New York State Urban Development Corp (New York State Pit Proj.) Series 2020 E, 3% 3/15/2048 | | 8,915,000 | 6,899,727 |
| New York State Urban Development Corp (New York State Pit Proj.) Series 2020 E, 3% 3/15/2050 | | 955,000 | 727,631 |
| New York State Urban Development Corp (New York State Pit Proj.) Series 2022A, 5% 3/15/2040 | | 12,000,000 | 13,125,023 |
| New York Urban Eev Corp Sales Tax Rev (New York State Sales Tax Rev Proj.) Series 2019 A, 3% 3/15/2049 | | 1,000,000 | 762,507 |
| New York Urban Eev Corp Sales Tax Rev (New York State Sales Tax Rev Proj.) Series 2019 A, 5% 3/15/2037 | | 1,315,000 | 1,405,713 |
| | | | 62,246,957 |
| Transportation - 2.6% | | | |
| Metropolitan Transn Auth NY Rv 4% 11/15/2046 | | 3,440,000 | 3,262,018 |
| Metropolitan Transn Auth NY Rv Series 2015A 1, 5% 11/15/2029 | | 145,000 | 145,730 |
| Metropolitan Transn Auth NY Rv Series 2017 D, 5% 11/15/2030 | | 2,120,000 | 2,221,840 |
| Metropolitan Transn Auth NY Rv Series 2017C 1, 5% 11/15/2030 | | 990,000 | 1,037,557 |
| Metropolitan Transn Auth NY Rv Series 2024A, 5% 11/15/2032 | | 10,555,000 | 11,752,606 |
| Metropolitan Transn Auth NY Rv Series 2024A, 5% 11/15/2033 | | 22,875,000 | 25,566,486 |
| Metropolitan Transn Auth NY Rv Series 2024A, 5.25% 11/15/2049 | | 2,915,000 | 3,127,896 |
| New York Transportation Development Corp (Delta Air Lines Inc Proj.) Series 2020, 5% 10/1/2040 (e) | | 1,705,000 | 1,743,427 |
| New York Transportation Development Corp (Jfk International Air Terminal Proj.) Series 2022, 5% 12/1/2032 (e) | | 415,000 | 441,822 |
| New York Transportation Development Corp (Jfk International Air Terminal Proj.) Series 2022, 5% 12/1/2033 (e) | | 640,000 | 679,057 |
| New York Transportation Development Corp (Jfk International Air Terminal Proj.) Series 2022, 5% 12/1/2034 (e) | | 700,000 | 739,755 |
| New York Transportation Development Corp (Jfk International Air Terminal Proj.) Series 2022, 5% 12/1/2035 (e) | | 350,000 | 368,519 |
| New York Transportation Development Corp (Jfk International Air Terminal Proj.) Series 2022, 5% 12/1/2036 (e) | | 240,000 | 251,925 |
| New York Transportation Development Corp (Jfk International Air Terminal Proj.) Series 2022, 5% 12/1/2037 (e) | | 635,000 | 666,218 |
| New York Transportation Development Corp (Jfk International Air Terminal Proj.) Series 2022, 5% 12/1/2038 (e) | | 1,550,000 | 1,620,804 |
| New York Transportation Development Corp (Jfk International Air Terminal Proj.) Series 2022, 5% 12/1/2039 (e) | | 1,185,000 | 1,234,425 |
| New York Transportation Development Corp (Jfk International Air Terminal Proj.) Series 2022, 5% 12/1/2040 (e) | | 1,000,000 | 1,037,659 |
| New York Transportation Development Corp (Jfk International Air Terminal Proj.) Series 2022, 5% 12/1/2041 (e) | | 910,000 | 939,466 |
| New York Transportation Development Corp (Jfk International Air Terminal Proj.) Series 2022, 5% 12/1/2042 (e) | | 455,000 | 468,169 |
| New York Transportation Development Corp (Jfk Intl Terminal 6 Proj.) 5.5% 12/31/2054 (e) | | 1,630,000 | 1,720,930 |
| New York Transportation Development Corp (Laguardia Gateway Prtnrs Terminal B Proj.) Series 2016 A, 5% 7/1/2041 (e) | | 215,000 | 215,004 |
| | | | 59,241,313 |
| Water & Sewer - 0.9% | | | |
| New York NY Cty Muni Wtr Fin Auth Series 2020 GG1, 5% 6/15/2048 | | 5,265,000 | 5,521,661 |
| New York NY Cty Muni Wtr Fin Auth Series FISCAL 2022 EE, 5% 6/15/2045 | | 3,785,000 | 4,052,423 |
| New York NY Cty Muni Wtr Fin Auth Series FISCAL 2024 SUB BB2, 5.25% 6/15/2047 | | 10,515,000 | 11,533,985 |
| | | | 21,108,069 |
TOTAL NEW YORK | | | 186,831,143 |
| North Carolina - 1.4% | | | |
| Education - 0.0% | | | |
| North Carolina St Ed Assistance Auth Rev Series 2023A, 5% 6/1/2043 (e) | | 375,000 | 375,808 |
| Escrowed/Pre-Refunded - 0.0% | | | |
| New Hanover Cnty NC Hosp Rev 5% 10/1/2027 (Escrowed to Maturity) | | 20,000 | 21,031 |
| Health Care - 0.3% | | | |
| Atrium Health Series 2018C, 3.45% tender 1/15/2048 (b) | | 2,620,000 | 2,622,541 |
| North Carolina Med Care Commn Health Care Facs Rev (Unc Rex Healthcare Proj.) Series 2020 A, 3% 7/1/2045 | | 565,000 | 462,779 |
| North Carolina Med Care Commn Health Care Facs Rev (Wake Baptist Proj.) 2.55% tender 6/1/2048 (b) | | 875,000 | 863,818 |
| North Carolina Med Care Retirement Fac Rev (Penick Village Proj.) 5.5% 9/1/2044 | | 1,380,000 | 1,408,087 |
| North Carolina Med Care Retirement Fac Rev (Penick Village Proj.) 5.5% 9/1/2054 | | 1,665,000 | 1,667,584 |
| | | | 7,024,809 |
| Housing - 0.3% | | | |
| NC Hsg Fin Agy Homeownership Rev (NC Homeownership Proj.) Series 45, 3% 7/1/2051 | | 6,015,000 | 5,892,077 |
| NC Hsg Fin Agy Homeownership Rev (NC Homeownership Proj.) Series 52 A, 6.25% 1/1/2055 | | 825,000 | 891,580 |
| | | | 6,783,657 |
| Transportation - 0.8% | | | |
| Charlotte NC Arpt Rev Series A, 5% 7/1/2030 | | 80,000 | 83,510 |
| Charlotte NC Arpt Rev Series A, 5% 7/1/2033 | | 75,000 | 77,911 |
| Charlotte NC Arpt Rev Series A, 5% 7/1/2037 | | 180,000 | 186,026 |
| Charlotte NC Arpt Rev Series B, 5% 7/1/2025 (e) | | 5,000 | 5,036 |
| Charlotte NC Arpt Rev Series B, 5% 7/1/2026 (e) | | 5,000 | 5,113 |
| Charlotte NC Arpt Rev Series B, 5% 7/1/2027 (e) | | 10,000 | 10,361 |
| Charlotte NC Arpt Rev Series B, 5% 7/1/2028 (e) | | 10,000 | 10,308 |
| Charlotte NC Arpt Rev Series B, 5% 7/1/2029 (e) | | 10,000 | 10,284 |
| Charlotte NC Arpt Rev Series B, 5% 7/1/2030 (e) | | 15,000 | 15,422 |
| Charlotte NC Arpt Rev Series B, 5% 7/1/2031 (e) | | 25,000 | 25,689 |
| Charlotte NC Arpt Rev Series B, 5% 7/1/2032 (e) | | 25,000 | 25,667 |
| Charlotte NC Arpt Rev Series B, 5% 7/1/2033 (e) | | 25,000 | 25,638 |
| Charlotte NC Arpt Rev Series B, 5% 7/1/2034 (e) | | 30,000 | 30,725 |
| Charlotte NC Arpt Rev Series B, 5% 7/1/2035 (e) | | 20,000 | 20,455 |
| Charlotte NC Arpt Rev Series B, 5% 7/1/2036 (e) | | 15,000 | 15,323 |
| Charlotte NC Arpt Rev Series B, 5% 7/1/2037 (e) | | 20,000 | 20,406 |
| Charlotte NC Arpt Rev Series B, 5% 7/1/2042 (e) | | 60,000 | 60,829 |
| Charlotte NC Arpt Rev Series C, 4% 7/1/2032 | | 75,000 | 75,712 |
| North Carolina Tpk Auth Triangle Expwy Sys Rev Series 2024B, 5% 1/1/2054 (Assured Guaranty Municipal Corp Insured) | | 16,075,000 | 16,991,822 |
| | | | 17,696,237 |
TOTAL NORTH CAROLINA | | | 31,901,542 |
| North Dakota - 0.4% | | | |
| Education - 0.0% | | | |
| University North Dakota Ctfs Partn (University ND Univ Revs Proj.) Series 2021 A, 3% 6/1/2061 (Assured Guaranty Municipal Corp Insured) | | 1,345,000 | 944,923 |
| Health Care - 0.1% | | | |
| Grand Forks ND Health Care Sys Rev (Altru Health System Proj.) 4% 12/1/2035 | | 530,000 | 506,668 |
| Grand Forks ND Health Care Sys Rev (Altru Health System Proj.) 4% 12/1/2036 | | 545,000 | 517,084 |
| Grand Forks ND Health Care Sys Rev (Altru Health System Proj.) 4% 12/1/2037 | | 405,000 | 381,175 |
| Grand Forks ND Health Care Sys Rev (Altru Health System Proj.) 4% 12/1/2038 | | 365,000 | 340,167 |
| Grand Forks ND Health Care Sys Rev (Altru Health System Proj.) 5% 12/1/2033 | | 550,000 | 574,539 |
| Grand Forks ND Health Care Sys Rev (Altru Health System Proj.) 5% 12/1/2034 | | 660,000 | 686,990 |
| | | | 3,006,623 |
| Housing - 0.3% | | | |
| North Dakota St Hsg Fin Agy (ND Single Family Hsg Proj.) 3% 1/1/2052 | | 185,000 | 181,085 |
| North Dakota St Hsg Fin Agy (ND Single Family Hsg Proj.) 5% 1/1/2053 | | 860,000 | 883,053 |
| North Dakota St Hsg Fin Agy (ND Single Family Hsg Proj.) Series 2019 C, 3.2% 7/1/2039 | | 2,765,000 | 2,395,975 |
| North Dakota St Hsg Fin Agy (ND Single Family Hsg Proj.) Series 2021 B, 3% 7/1/2052 | | 655,000 | 632,616 |
| North Dakota St Hsg Fin Agy (ND Single Family Hsg Proj.) Series 2023 F, 6.25% 1/1/2054 | | 300,000 | 324,527 |
| | | | 4,417,256 |
TOTAL NORTH DAKOTA | | | 8,368,802 |
| Ohio - 1.7% | | | |
| Education - 0.2% | | | |
| Ohio St Higher Edl Fac Commn (University of Dayton Proj.) 5% 12/1/2036 | | 345,000 | 360,200 |
| Ohio St Higher Edl Fac Commn (Xavier Univ, OH Proj.) 5% 5/1/2036 | | 1,160,000 | 1,256,258 |
| Ohio St Higher Edl Fac Commn (Xavier Univ, OH Proj.) 5% 5/1/2037 | | 495,000 | 534,055 |
| Ohio St Higher Edl Fac Commn (Xavier Univ, OH Proj.) 5% 5/1/2043 (j) | | 1,710,000 | 1,787,394 |
| | | | 3,937,907 |
| Electric Utilities - 0.5% | | | |
| American Mun Pwr Rev Series 2023A, 5% 2/15/2028 | | 2,535,000 | 2,679,138 |
| American Mun Pwr Rev Series 2023A, 5% 2/15/2029 | | 3,195,000 | 3,422,675 |
| American Mun Pwr Rev Series 2023A, 5% 2/15/2030 | | 1,275,000 | 1,385,254 |
| American Mun Pwr Rev Series 2023A, 5% 2/15/2031 | | 1,055,000 | 1,158,496 |
| American Mun Pwr Rev Series 2023A, 5% 2/15/2032 | | 1,400,000 | 1,554,045 |
| | | | 10,199,608 |
| General Obligations - 0.2% | | | |
| Columbus OH City Sch Dist 5% 12/1/2029 | | 105,000 | 107,903 |
| Lancaster Port Auth OH Gas Rev Series 2019, 5% tender 8/1/2049 (Royal Bank of Canada Guaranteed) (b) | | 685,000 | 685,916 |
| State of Ohio Gen. Oblig. Series 2021 A, 5% 3/1/2029 | | 260,000 | 281,240 |
| State of Ohio Gen. Oblig. Series 2021 A, 5% 3/1/2030 | | 355,000 | 390,195 |
| State of Ohio Gen. Oblig. Series 2021 B, 5% 2/1/2029 | | 475,000 | 513,104 |
| State of Ohio Gen. Oblig. Series 2021 B, 5% 2/1/2030 | | 395,000 | 433,597 |
| State of Ohio Gen. Oblig. Series 2021 C, 5% 3/15/2029 | | 595,000 | 644,015 |
| State of Ohio Gen. Oblig. Series 2021 C, 5% 3/15/2030 | | 595,000 | 654,386 |
| State of Ohio Gen. Oblig. Series 2021A, 5% 3/1/2029 | | 195,000 | 210,929 |
| State of Ohio Gen. Oblig. Series 2021A, 5% 3/1/2030 | | 240,000 | 263,794 |
| | | | 4,185,079 |
| Health Care - 0.3% | | | |
| Akron Bath Copley Hsp Dist OH (Summa Health System Proj.) 5.25% 11/15/2046 | | 715,000 | 720,774 |
| Allen Cnty OH Hosp Facs Rev (Mercy Health/OH Proj.) 4% 12/1/2040 | | 1,175,000 | 1,133,536 |
| Allen Cnty OH Hosp Facs Rev (Mercy Health/OH Proj.) 5% 8/1/2025 | | 150,000 | 151,441 |
| Allen Cnty OH Hosp Facs Rev (Mercy Health/OH Proj.) 5% 8/1/2026 | | 100,000 | 102,739 |
| Middleburg Heights OH Hosp Rev (Southwest General Hosp Ctr Proj.) Series 2021A, 4% 8/1/2041 | | 645,000 | 615,214 |
| Montgomery Cnty OH Hosp Rev (Kettering Med Ctr Inc, OH Proj.) Series 2021, 5% 8/1/2030 | | 410,000 | 443,218 |
| Ohio St Hosp Rev (Cleveland Clinic Foundation Proj.) Series 2019 C, 2.75% tender 1/1/2052 (b) | | 635,000 | 619,347 |
| Ohio St Hosp Rev (University Hosp Hlth Sys, OH Proj.) Series 2020 A, 4% 1/15/2050 | | 75,000 | 69,983 |
| Ohio St Hsg Fin Agy Res Mtg Rev (Cleveland Clinic Foundation/The Proj.) 5% 1/1/2026 | | 415,000 | 423,542 |
| Ohio St Hsg Fin Agy Res Mtg Rev (Cleveland Clinic Foundation/The Proj.) 5% 1/1/2027 | | 955,000 | 992,221 |
| Scioto Cnty OH Hsp Facs Rev (Southern OH Medical Center Proj.) 5% 2/15/2029 | | 110,000 | 111,405 |
| Scioto Cnty OH Hsp Facs Rev (Southern OH Medical Center Proj.) 5% 2/15/2034 | | 20,000 | 20,202 |
| Scioto Cnty OH Hsp Facs Rev (Southern OH Medical Center Proj.) Series 2019, 5% 2/15/2029 | | 145,000 | 148,522 |
| Washington Cnty OH Hosp Rev (Memorial Hospital, OH Proj.) Series 2022, 6% 12/1/2028 | | 260,000 | 268,969 |
| Washington Cnty OH Hosp Rev (Memorial Hospital, OH Proj.) Series 2022, 6% 12/1/2029 | | 270,000 | 281,232 |
| Washington Cnty OH Hosp Rev (Memorial Hospital, OH Proj.) Series 2022, 6% 12/1/2030 | | 290,000 | 304,780 |
| Washington Cnty OH Hosp Rev (Memorial Hospital, OH Proj.) Series 2022, 6% 12/1/2031 | | 310,000 | 327,822 |
| | | | 6,734,947 |
| Housing - 0.0% | | | |
| Ohio St Hsg Fin Agy Residential Mtg Rev (OH Residential Mortgage Proj.) Series 2019B, 4.5% 3/1/2050 | | 25,000 | 25,220 |
| Ohio St Hsg Fin Agy Residential Mtg Rev (OH Residential Mortgage Proj.) Series 2023 B, 6% 3/1/2055 | | 835,000 | 907,241 |
| | | | 932,461 |
| Special Tax - 0.0% | | | |
| Franklin Cnty Ohio Convention Facs Auth Hotel Proj Rev (Franklin Cnty OH Proj.) Series 2019, 5% 12/1/2046 | | 325,000 | 338,817 |
| Franklin Cnty Ohio Convention Facs Auth Hotel Proj Rev (Franklin Cnty OH Proj.) Series 2019, 5% 12/1/2051 | | 485,000 | 503,861 |
| | | | 842,678 |
| Tobacco Bonds - 0.5% | | | |
| Buckeye OH Tobacco Settlement Fing Auth Series 2020A 2 CL 1, 3% 6/1/2048 | | 9,705,000 | 7,006,746 |
| Buckeye OH Tobacco Settlement Fing Auth Series 2020A 2 CL 1, 4% 6/1/2048 | | 260,000 | 226,462 |
| Buckeye OH Tobacco Settlement Fing Auth Series 2020A 2 CL 1, 5% 6/1/2032 | | 685,000 | 721,572 |
| Buckeye OH Tobacco Settlement Fing Auth Series 2020A 2 CL 1, 5% 6/1/2033 | | 2,275,000 | 2,392,198 |
| | | | 10,346,978 |
| Transportation - 0.0% | | | |
| Ohio St Mjr New St Infst Proj Rev Series 2021 1A, 5% 12/15/2029 | | 585,000 | 639,181 |
| Ohio St Mjr New St Infst Proj Rev Series 2021 1A, 5% 12/15/2030 | | 530,000 | 586,916 |
| Ohio St Tpk Commn Tpk Rev Series 2013 A 2, 0% 2/15/2042 (h) | | 130,000 | 62,547 |
| Ohio St Tpk Commn Tpk Rev Series 2022A, 5% 2/15/2039 | | 195,000 | 215,868 |
| | | | 1,504,512 |
TOTAL OHIO | | | 38,684,170 |
| Oklahoma - 0.1% | | | |
| Education - 0.0% | | | |
| Oklahoma Dev Fin Auth Rev (Oklahoma City University Proj.) Series 2019, 5% 8/1/2044 | | 180,000 | 177,976 |
| Health Care - 0.1% | | | |
| Norman OK Reg Hos Auth Hos Rev Series 2019, 3.25% 9/1/2038 | | 2,015,000 | 1,509,737 |
| Housing - 0.0% | | | |
| Oklahoma Hsg Fin Agy Single Family Mtg Rev (OK Sf Mtge Rev Bonds 10/1/18 Proj.) 6% 3/1/2054 | | 150,000 | 162,898 |
| Oklahoma Hsg Fin Agy Single Family Mtg Rev (OK Sf Mtge Rev Bonds 10/1/18 Proj.) Series 2023D, 6.5% 9/1/2054 | | 215,000 | 239,060 |
| | | | 401,958 |
| Special Tax - 0.0% | | | |
| Oklahoma Cty OK Pub Ppty Auth Hotel Tax Rev 5% 10/1/2028 | | 65,000 | 65,736 |
| Oklahoma Cty OK Pub Ppty Auth Hotel Tax Rev 5% 10/1/2029 | | 70,000 | 70,787 |
| Oklahoma Cty OK Pub Ppty Auth Hotel Tax Rev 5% 10/1/2036 | | 50,000 | 50,489 |
| Oklahoma Cty OK Pub Ppty Auth Hotel Tax Rev 5% 10/1/2039 | | 100,000 | 100,536 |
| | | | 287,548 |
| Transportation - 0.0% | | | |
| Oklahoma City Okla Airp Trust Series 33, 5% 7/1/2047 (e) | | 115,000 | 116,234 |
TOTAL OKLAHOMA | | | 2,493,453 |
| Oregon - 1.7% | | | |
| Education - 0.4% | | | |
| University Oregon Gen Rev Series 2021 A, 3.5% 4/1/2052 | | 10,000,000 | 8,504,328 |
| General Obligations - 0.4% | | | |
| Oregon St Gen. Oblig. Series 2022 A, 5% 5/1/2040 | | 3,330,000 | 3,647,141 |
| Oregon St Gen. Oblig. Series 2022 D, 5% 12/1/2052 | | 550,000 | 568,040 |
| Washington Cnty OR Sch Dist 48j Beaverton 0% 6/15/2041 (Oregon St Guaranteed) (h) | | 4,250,000 | 2,001,869 |
| Washington Cnty OR Sch Dist 48j Beaverton 0% 6/15/2042 (Oregon St Guaranteed) (h) | | 4,155,000 | 1,852,793 |
| | | | 8,069,843 |
| Health Care - 0.1% | | | |
| Oregon St Facs Auth Rev (Legacy Health System, or Proj.) 5% 6/1/2030 | | 340,000 | 362,150 |
| Salem OR Hosp Fac Auth Rev (Salem Health Proj.) Series 2016 A, 4% 5/15/2041 | | 100,000 | 96,034 |
| Salem OR Hosp Fac Auth Rev (Salem Health Proj.) Series 2019 A, 3% 5/15/2049 | | 1,380,000 | 1,068,545 |
| | | | 1,526,729 |
| Housing - 0.0% | | | |
| Oregon St Hsg & Cmnty Svcs Dpt (OR Single Family Hsg Proj.) 3% 7/1/2052 | | 20,000 | 19,537 |
| Oregon St Hsg & Cmnty Svcs Dpt (OR Single Family Hsg Proj.) Series 2019A, 2.65% 7/1/2039 | | 440,000 | 357,747 |
| Oregon St Hsg & Cmnty Svcs Dpt (OR Single Family Hsg Proj.) Series 2019A, 4% 7/1/2050 | | 290,000 | 290,210 |
| Oregon St Hsg & Cmnty Svcs Dpt (OR Single Family Hsg Proj.) Series 2020 A, 3.5% 1/1/2051 | | 195,000 | 193,345 |
| Oregon St Hsg & Cmnty Svcs Dpt (OR Single Family Hsg Proj.) Series A, 3.5% 7/1/2036 | | 570,000 | 570,001 |
| | | | 1,430,840 |
| Transportation - 0.8% | | | |
| Port of Portland Arpt Rev 5% 7/1/2041 (e) | | 1,760,000 | 1,840,725 |
| Port of Portland Arpt Rev 5% 7/1/2045 (e) | | 785,000 | 810,709 |
| Port of Portland Arpt Rev 5% 7/1/2052 (e) | | 1,480,000 | 1,530,847 |
| Port of Portland Arpt Rev Series 28, 5% 7/1/2032 (e) | | 2,560,000 | 2,767,576 |
| Port of Portland Arpt Rev Series TWENTY NINE, 5% 7/1/2034 (e) | | 4,270,000 | 4,618,552 |
| Port of Portland Arpt Rev Series TWENTY NINE, 5% 7/1/2035 (e) | | 3,650,000 | 3,931,827 |
| Port of Portland Arpt Rev Series TWENTY NINE, 5% 7/1/2037 (e) | | 2,910,000 | 3,112,188 |
| | | | 18,612,424 |
TOTAL OREGON | | | 38,144,164 |
| Pennsylvania - 5.1% | | | |
| Education - 0.3% | | | |
| Allegheny Cnty High Ed Bldg Auth (Carnegie-Mellon Univ, PA Proj.) Series 2024A, 5% 8/1/2027 | | 3,040,000 | 3,198,219 |
| Allegheny Cnty PA Ida Rev (Pittsburgh Tech College Proj.) 3.5% 12/1/2031 | | 220,000 | 105,600 |
| Allegheny Cnty PA Ida Rev (Pittsburgh Tech College Proj.) 4% 12/1/2041 | | 335,000 | 160,800 |
| Allegheny Cnty PA Ida Rev (Pittsburgh Tech College Proj.) 4.25% 12/1/2050 | | 375,000 | 180,000 |
| Pennsylvania Higher Ed Assistance Agy Ed Ln Rev Series 2024 1A, 5% 6/1/2029 (e) | | 1,140,000 | 1,192,918 |
| Pennsylvania St Higher Edl Rev (Drexel University, PA Proj.) Series 2016, 5% 5/1/2028 | | 25,000 | 25,319 |
| Pennsylvania St Higher Edl Rev (Drexel University, PA Proj.) Series 2016, 5% 5/1/2032 | | 65,000 | 65,671 |
| Pennsylvania St Higher Edl Rev (Drexel University, PA Proj.) Series 2016, 5% 5/1/2033 | | 85,000 | 85,796 |
| Pennsylvania St Higher Edl Rev (Drexel University, PA Proj.) Series 2017, 5% 5/1/2035 | | 65,000 | 65,990 |
| Pennsylvania St Higher Edl Rev (Drexel University, PA Proj.) Series 2017, 5% 5/1/2037 | | 80,000 | 80,978 |
| Pennsylvania St Higher Edl Rev (Drexel University, PA Proj.) Series 2017, 5% 5/1/2041 | | 360,000 | 361,921 |
| Philadelphia PA Auth For Indl Dev Revs (St Josephs University, PA Proj.) Series 2017, 5% 11/1/2047 | | 400,000 | 400,985 |
| | | | 5,924,197 |
| Escrowed/Pre-Refunded - 0.0% | | | |
| Delaware Cnty PA Auth Rev Series 2017, 5% 7/1/2028 (Pre-refunded to 7/1/2027 at 100) | | 105,000 | 109,544 |
| Delaware Cnty PA Auth Rev Series 2017, 5% 7/1/2029 (Pre-refunded to 7/1/2027 at 100) | | 400,000 | 417,310 |
| Doylestown PA Hosp Auth Hosp 5% 7/1/2049 (Pre-refunded to 7/1/2029 at 100) | | 30,000 | 32,246 |
| | | | 559,100 |
| General Obligations - 1.2% | | | |
| Commonwealth Fing Auth PA Rev (Pennsylvania St Proj.) Series 2020 A, 5% 6/1/2026 | | 515,000 | 528,568 |
| Commonwealth Fing Auth PA Rev (Pennsylvania St Proj.) Series 2020 A, 5% 6/1/2028 | | 275,000 | 291,456 |
| Pennsylvania St Gen. Oblig. 5% 9/1/2029 | | 10,000,000 | 10,891,996 |
| Pennsylvania St Gen. Oblig. 5% 9/1/2031 | | 2,500,000 | 2,793,920 |
| Pennsylvania St Gen. Oblig. Series 2018, 3.2% 3/1/2029 | | 2,795,000 | 2,740,965 |
| Pennsylvania St Gen. Oblig. Series 2018, 3.35% 3/1/2030 | | 4,160,000 | 4,123,362 |
| Philadelphia PA Sch Dist 4% 9/1/2035 | | 385,000 | 389,089 |
| Philadelphia PA Sch Dist 5% 9/1/2025 | | 445,000 | 449,947 |
| Philadelphia PA Sch Dist 5% 9/1/2027 | | 490,000 | 502,374 |
| Philadelphia PA Sch Dist 5% 9/1/2028 | | 710,000 | 727,350 |
| Philadelphia PA Sch Dist 5% 9/1/2028 | | 410,000 | 420,019 |
| Philadelphia PA Sch Dist 5% 9/1/2029 | | 460,000 | 470,641 |
| Philadelphia PA Sch Dist 5% 9/1/2030 | | 400,000 | 427,650 |
| Philadelphia PA Sch Dist 5% 9/1/2031 | | 320,000 | 341,794 |
| Philadelphia PA Sch Dist 5% 9/1/2034 (Assured Guaranty Municipal Corp Insured) | | 185,000 | 197,240 |
| Philadelphia PA Sch Dist 5% 9/1/2036 | | 95,000 | 99,385 |
| Philadelphia PA Sch Dist 5% 9/1/2037 | | 55,000 | 57,433 |
| Philadelphia PA Sch Dist 5% 9/1/2038 | | 90,000 | 93,784 |
| Philadelphia PA Sch Dist Series B, 5% 9/1/2043 | | 130,000 | 134,343 |
| Philadelphia PA Sch Dist Series F, 5% 9/1/2030 | | 345,000 | 352,364 |
| State Pub Sch Bldg Auth PA Lease Rev (Philadelphia PA Sch Dist Proj.) Series 2015A, 5% 6/1/2026 | | 65,000 | 65,471 |
| | | | 26,099,151 |
| Health Care - 0.6% | | | |
| Dauphin Cnty PA Gen Auth Hlth Sys Rev (UPMC Proj.) Series 2016 A, 5% 6/1/2028 | | 55,000 | 56,109 |
| Dauphin Cnty PA Gen Auth Hlth Sys Rev (UPMC Proj.) Series 2016 A, 5% 6/1/2029 | | 60,000 | 61,197 |
| Doylestown PA Hosp Auth Hosp 5% 7/1/2046 | | 60,000 | 60,385 |
| Doylestown PA Hosp Auth Hosp 5% 7/1/2049 | | 255,000 | 259,806 |
| Dubois PA Hosp Auth Hosp Rev (Penn Highlands Healthcare Proj.) 4% 7/15/2033 | | 125,000 | 122,922 |
| Dubois PA Hosp Auth Hosp Rev (Penn Highlands Healthcare Proj.) 4% 7/15/2035 | | 130,000 | 126,504 |
| Dubois PA Hosp Auth Hosp Rev (Penn Highlands Healthcare Proj.) 4% 7/15/2037 | | 255,000 | 245,536 |
| Dubois PA Hosp Auth Hosp Rev (Penn Highlands Healthcare Proj.) 5% 7/15/2025 | | 20,000 | 20,118 |
| Dubois PA Hosp Auth Hosp Rev (Penn Highlands Healthcare Proj.) 5% 7/15/2026 | | 65,000 | 66,172 |
| Dubois PA Hosp Auth Hosp Rev (Penn Highlands Healthcare Proj.) 5% 7/15/2027 | | 105,000 | 108,045 |
| Dubois PA Hosp Auth Hosp Rev (Penn Highlands Healthcare Proj.) 5% 7/15/2028 | | 80,000 | 82,656 |
| Dubois PA Hosp Auth Hosp Rev (Penn Highlands Healthcare Proj.) 5% 7/15/2029 | | 85,000 | 87,072 |
| Dubois PA Hosp Auth Hosp Rev (Penn Highlands Healthcare Proj.) 5% 7/15/2030 | | 110,000 | 112,660 |
| Dubois PA Hosp Auth Hosp Rev (Penn Highlands Healthcare Proj.) 5% 7/15/2031 | | 75,000 | 76,761 |
| Dubois PA Hosp Auth Hosp Rev (Penn Highlands Healthcare Proj.) 5% 7/15/2032 | | 80,000 | 81,733 |
| Dubois PA Hosp Auth Hosp Rev (Penn Highlands Healthcare Proj.) 5% 7/15/2034 | | 85,000 | 86,368 |
| Dubois PA Hosp Auth Hosp Rev (Penn Highlands Healthcare Proj.) 5% 7/15/2036 | | 255,000 | 258,027 |
| Dubois PA Hosp Auth Hosp Rev (Penn Highlands Healthcare Proj.) 5% 7/15/2038 | | 305,000 | 307,354 |
| Geisinger Auth PA Hlth Sys Rev (Kaiser Permanente Hlth System Proj.) Series 2020 B, 5% tender 4/1/2043 (b) | | 1,890,000 | 1,949,475 |
| Lehigh Cnty PA Gen Purp Auth Hosp Rev (Lehigh Valley Health Proj.) Series 2019 A, 4% 7/1/2049 | | 6,500,000 | 5,906,974 |
| Monroe Cnty PA Hosp Auth Rev (Lehigh Valley Health Proj.) 5% 7/1/2026 | | 50,000 | 51,023 |
| Monroe Cnty PA Hosp Auth Rev (Lehigh Valley Health Proj.) 5% 7/1/2027 | | 50,000 | 51,137 |
| Monroe Cnty PA Hosp Auth Rev (Lehigh Valley Health Proj.) 5% 7/1/2028 | | 50,000 | 51,072 |
| Monroe Cnty PA Hosp Auth Rev (Lehigh Valley Health Proj.) 5% 7/1/2034 (Pre-refunded to 7/1/2026 at 100) | | 185,000 | 190,293 |
| Monroe Cnty PA Hosp Auth Rev (Lehigh Valley Health Proj.) 5% 7/1/2036 (Pre-refunded to 7/1/2026 at 100) | | 100,000 | 102,861 |
| Montgomery Cnty PA Higher Ed & Health Auth Rev (Holy Redeemer Hosp & Med Ctr Proj.) 5% 10/1/2028 | | 75,000 | 73,260 |
| Montgomery Cnty PA Higher Ed & Health Auth Rev (Holy Redeemer Hosp & Med Ctr Proj.) 5% 10/1/2029 | | 130,000 | 126,198 |
| Montgomery Cnty PA Higher Ed & Health Auth Rev (Holy Redeemer Hosp & Med Ctr Proj.) 5% 10/1/2036 | | 415,000 | 383,499 |
| Montgomery Cnty PA Higher Ed & Health Auth Rev (Holy Redeemer Hosp & Med Ctr Proj.) 5% 10/1/2040 | | 205,000 | 182,643 |
| Montgomery Cnty PA Higher Ed & Health Auth Rev (Holy Redeemer Hosp&Med Ctr, PA Proj.) 5% 10/1/2025 | | 55,000 | 54,997 |
| Montgomery Cnty PA Higher Ed & Health Auth Rev (Holy Redeemer Hosp&Med Ctr, PA Proj.) 5% 10/1/2027 | | 25,000 | 24,944 |
| Montgomery Cnty PA Higher Ed & Health Auth Rev (Holy Redeemer Hosp&Med Ctr, PA Proj.) 5% 10/1/2031 | | 230,000 | 220,451 |
| Northampton Cnty PA Gen Purp Auth Hosp Rev (St Lukes Hospital & Health Ntw Proj.) Series 2016 A, 5% 8/15/2036 | | 40,000 | 40,584 |
| Northampton Cnty PA Gen Purp Auth Hosp Rev (St Lukes Hospital & Health Ntw Proj.) Series 2018A, 4% 8/15/2048 | | 645,000 | 588,774 |
| Pennslyvania Dev Fing Auth Rev (Presbyterian Homes, PA Proj.) Series 2023B 2, 5% 7/1/2038 | | 555,000 | 582,583 |
| Southcentral PA Gen Auth Rev (Wellspan Health Group Proj.) Series 2019A, 4% 6/1/2044 | | 140,000 | 134,121 |
| Southcentral PA Gen Auth Rev (Wellspan Health Group Proj.) Series 2019A, 4% 6/1/2049 | | 335,000 | 316,143 |
| Southcentral PA Gen Auth Rev (Wellspan Health Group Proj.) Series 2019A, 5% 6/1/2044 | | 245,000 | 251,168 |
| Southcentral PA Gen Auth Rev (Wellspan Health Group Proj.) Series 2019A, 5% 6/1/2049 | | 390,000 | 396,661 |
| Union Cnty PA Hosp Auth Hosp Rev (Evangelical Community Hospital Proj.) 5% 8/1/2043 | | 280,000 | 284,263 |
| Union Cnty PA Hosp Auth Hosp Rev (Evangelical Community Hospital Proj.) 5% 8/1/2048 | | 875,000 | 878,255 |
| | | | 15,060,804 |
| Housing - 0.4% | | | |
| Pennsylvania Hsg Fin Agy Single Family Mtg Rev (PA Single Family Mortgage Proj.) 5% 10/1/2043 | | 710,000 | 730,266 |
| Pennsylvania Hsg Fin Agy Single Family Mtg Rev (PA Single Family Mortgage Proj.) 5% 4/1/2027 (e) | | 395,000 | 405,660 |
| Pennsylvania Hsg Fin Agy Single Family Mtg Rev (PA Single Family Mortgage Proj.) Series 2020 132A, 3.5% 4/1/2051 | | 50,000 | 49,662 |
| Pennsylvania Hsg Fin Agy Single Family Mtg Rev (PA Single Family Mortgage Proj.) Series 2021 134 A, 3% 10/1/2049 | | 3,625,000 | 3,563,636 |
| Pennsylvania Hsg Fin Agy Single Family Mtg Rev (PA Single Family Mortgage Proj.) Series 2021 137, 3% 10/1/2051 | | 1,030,000 | 993,636 |
| Pennsylvania Hsg Fin Agy Single Family Mtg Rev (PA Single Family Mortgage Proj.) Series 2023 142A, 4.5% 10/1/2038 | | 985,000 | 1,001,958 |
| Pennsylvania Hsg Fin Agy Single Family Mtg Rev (PA Single Family Mortgage Proj.) Series 2023 142A, 5% 10/1/2050 | | 2,425,000 | 2,470,193 |
| | | | 9,215,011 |
| Transportation - 2.6% | | | |
| Allegheny County Airport Authority (Pittsburgh Intl Airport Proj.) Series 2021 A, 4% 1/1/2046 (Assured Guaranty Municipal Corp Insured) (e) | | 4,145,000 | 3,876,788 |
| Allegheny County Airport Authority (Pittsburgh Intl Airport Proj.) Series 2021 A, 5% 1/1/2032 (e) | | 3,940,000 | 4,180,885 |
| Allegheny County Airport Authority (Pittsburgh Intl Airport Proj.) Series 2021 A, 5% 1/1/2033 (e) | | 4,640,000 | 4,913,140 |
| Allegheny County Airport Authority (Pittsburgh Intl Airport Proj.) Series 2021 A, 5% 1/1/2051 (e) | | 2,730,000 | 2,789,897 |
| Allegheny County Airport Authority (Pittsburgh Intl Airport Proj.) Series 2021 A, 5% 1/1/2056 (e) | | 1,655,000 | 1,686,644 |
| Allegheny County Airport Authority Series 2023A, 5% 1/1/2028 (Assured Guaranty Municipal Corp Insured) (e) | | 1,000,000 | 1,036,863 |
| Allegheny County Airport Authority Series 2023A, 5.25% 1/1/2038 (Assured Guaranty Municipal Corp Insured) (e) | | 1,000,000 | 1,089,422 |
| Allegheny County Airport Authority Series 2023A, 5.25% 1/1/2039 (Assured Guaranty Municipal Corp Insured) (e) | | 1,400,000 | 1,514,753 |
| Allegheny County Airport Authority Series 2023A, 5.25% 1/1/2040 (Assured Guaranty Municipal Corp Insured) (e) | | 1,600,000 | 1,724,375 |
| Allegheny County Airport Authority Series 2023A, 5.5% 1/1/2041 (Assured Guaranty Municipal Corp Insured) (e) | | 1,000,000 | 1,099,046 |
| Allegheny County Airport Authority Series 2023A, 5.5% 1/1/2042 (Assured Guaranty Municipal Corp Insured) (e) | | 1,000,000 | 1,095,381 |
| Allegheny County Airport Authority Series 2023A, 5.5% 1/1/2043 (Assured Guaranty Municipal Corp Insured) (e) | | 1,500,000 | 1,637,343 |
| Pennsylvania Turnpike Commission 5% 12/1/2027 | | 220,000 | 232,303 |
| Pennsylvania Turnpike Commission 5% 12/1/2028 | | 215,000 | 230,793 |
| Pennsylvania Turnpike Commission Series 2021 B, 5% 12/1/2046 | | 2,645,000 | 2,803,211 |
| Pennsylvania Turnpike Commission Series 2024 A, 5% 12/1/2040 | | 1,650,000 | 1,823,423 |
| Pennsylvania Turnpike Commission Series FIRST 2023, 5% 12/1/2036 | | 620,000 | 693,342 |
| Pennsylvania Turnpike Commission Series FIRST 2023, 5% 12/1/2038 | | 2,500,000 | 2,772,752 |
| Pennsylvania Turnpike Commission Series FIRST 2023, 5% 12/1/2039 | | 3,000,000 | 3,319,455 |
| Pennsylvania Turnpike Commission Series FIRST 2023, 5% 12/1/2040 | | 2,375,000 | 2,617,266 |
| Philadelphia PA Airport Rev 5% 7/1/2025 | | 50,000 | 50,441 |
| Philadelphia PA Airport Rev 5% 7/1/2026 (e) | | 150,000 | 153,490 |
| Philadelphia PA Airport Rev 5% 7/1/2026 | | 50,000 | 51,392 |
| Philadelphia PA Airport Rev 5% 7/1/2027 (e) | | 125,000 | 129,207 |
| Philadelphia PA Airport Rev 5% 7/1/2027 | | 40,000 | 41,881 |
| Philadelphia PA Airport Rev 5% 7/1/2028 (e) | | 150,000 | 154,327 |
| Philadelphia PA Airport Rev 5% 7/1/2029 (e) | | 115,000 | 118,132 |
| Philadelphia PA Airport Rev 5% 7/1/2032 (e) | | 805,000 | 823,580 |
| Philadelphia PA Airport Rev 5% 7/1/2034 (e) | | 205,000 | 208,977 |
| Philadelphia PA Airport Rev Series 2021, 4% 7/1/2046 (Assured Guaranty Municipal Corp Insured) (e) | | 1,620,000 | 1,520,069 |
| Philadelphia PA Airport Rev Series 2021, 5% 7/1/2026 (e) | | 3,765,000 | 3,852,586 |
| Philadelphia PA Airport Rev Series 2021, 5% 7/1/2027 (e) | | 5,190,000 | 5,364,662 |
| Philadelphia PA Airport Rev Series 2021, 5% 7/1/2028 (e) | | 550,000 | 575,484 |
| Philadelphia PA Airport Rev Series 2021, 5% 7/1/2034 (e) | | 1,100,000 | 1,167,959 |
| Philadelphia PA Airport Rev Series 2021, 5% 7/1/2035 (e) | | 590,000 | 624,410 |
| Philadelphia PA Airport Rev Series 2021, 5% 7/1/2051 (e) | | 1,000,000 | 1,023,515 |
| | | | 56,997,194 |
| Water & Sewer - 0.0% | | | |
| Capital Region Wtr PA Wtr Rev 5% 7/15/2027 | | 50,000 | 52,326 |
| Capital Region Wtr PA Wtr Rev 5% 7/15/2029 | | 80,000 | 84,843 |
| Capital Region Wtr PA Wtr Rev 5% 7/15/2032 | | 50,000 | 52,898 |
| Pittsburgh PA Wtr & Swr Auth Series 2019 A, 5% 9/1/2038 (Assured Guaranty Municipal Corp Insured) | | 200,000 | 211,420 |
| | | | 401,487 |
TOTAL PENNSYLVANIA | | | 114,256,944 |
| Puerto Rico - 0.9% | | | |
| General Obligations - 0.5% | | | |
| Puerto Rico Comwlth Gen. Oblig. Series 2022 A 1, 0% 7/1/2033 (h) | | 8,240,022 | 5,574,175 |
| Puerto Rico Comwlth Gen. Oblig. Series 2022 A 1, 4% 7/1/2033 | | 1,927,686 | 1,898,387 |
| Puerto Rico Comwlth Gen. Oblig. Series 2022 A 1, 4% 7/1/2035 | | 695,000 | 677,515 |
| Puerto Rico Comwlth Gen. Oblig. Series 2022 A 1, 4% 7/1/2037 | | 850,000 | 819,685 |
| Puerto Rico Comwlth Gen. Oblig. Series 2022 A 1, 5.625% 7/1/2027 | | 201,149 | 208,459 |
| Puerto Rico Comwlth Gen. Oblig. Series 2022 A 1, 5.625% 7/1/2029 | | 1,000,434 | 1,065,696 |
| | | | 10,243,917 |
| Special Tax - 0.3% | | | |
| Puerto Rico Sales Tax Fing Corp Sales Tax Rev Series A 1, 0% 7/1/2031 (h) | | 8,088,000 | 6,216,634 |
| Puerto Rico Sales Tax Fing Corp Sales Tax Rev Series A 1, 0% 7/1/2046 (h) | | 4,500,000 | 1,447,572 |
| Puerto Rico Sales Tax Fing Corp Sales Tax Rev Series A 1, 5% 7/1/2058 | | 10,000 | 9,962 |
| | | | 7,674,168 |
| Water & Sewer - 0.1% | | | |
| Puerto Rico Comwlth Aqueduct & Swr Auth Rev Series 2021 B, 5% 7/1/2033 (g) | | 400,000 | 417,230 |
| Puerto Rico Comwlth Aqueduct & Swr Auth Rev Series 2021 B, 5% 7/1/2037 (g) | | 945,000 | 973,860 |
| Puerto Rico Comwlth Aqueduct & Swr Auth Rev Series 2022 A, 4% 7/1/2042 (g) | | 1,125,000 | 1,056,710 |
| | | | 2,447,800 |
TOTAL PUERTO RICO | | | 20,365,885 |
| Rhode Island - 1.3% | | | |
| Education - 1.2% | | | |
| Rhode Island Health & Edl Bldg Corp Higher Ed Fac Rev (Brown University Proj.) Series 2022A, 5% 9/1/2033 | | 7,000,000 | 7,920,508 |
| Rhode Island Health & Edl Bldg Corp Higher Ed Fac Rev (Bryant University Proj.) Series 2024, 5% 6/1/2040 | | 1,000,000 | 1,089,254 |
| Rhode Island Health & Edl Bldg Corp Higher Ed Fac Rev (Bryant University Proj.) Series 2024, 5% 6/1/2045 | | 2,550,000 | 2,727,259 |
| Rhode Island Health & Edl Bldg Corp Higher Ed Fac Rev (Bryant University Proj.) Series 2024, 5% 6/1/2048 | | 3,005,000 | 3,181,306 |
| Rhode Island St Student Ln 3.5% 12/1/2034 (e) | | 70,000 | 65,325 |
| Rhode Island St Student Ln 5% 12/1/2028 (e) | | 500,000 | 519,076 |
| Rhode Island St Student Ln Series 2023 A, 5% 12/1/2028 (e) | | 2,940,000 | 3,052,169 |
| Rhode Island St Student Ln Series 2023 A, 5% 12/1/2029 (e) | | 4,380,000 | 4,594,676 |
| Rhode Island St Student Ln Series 2023 A, 5% 12/1/2030 (e) | | 1,605,000 | 1,679,753 |
| Rhode Island St Student Ln Series 2024 A, 5% 12/1/2029 (e) | | 1,825,000 | 1,912,784 |
| | | | 26,742,110 |
| Health Care - 0.1% | | | |
| Rhode Island Health & Edl Bldg Corp Rev (Care New England Health System Proj.) 5% 9/1/2031 | | 420,000 | 421,311 |
| Rhode Island Health & Edl Bldg Corp Rev (Care New England Health System Proj.) 5% 9/1/2036 | | 1,235,000 | 1,229,509 |
| | | | 1,650,820 |
| Housing - 0.0% | | | |
| Rhode Island Housing & Mortgage Finance Corp (RI Homeownership Proj.) Series 72 A, 3.5% 10/1/2050 | | 495,000 | 490,076 |
| Rhode Island Hsg & Mtg Fin Cp (RI Homeownership Proj.) 3% 4/1/2049 | | 465,000 | 456,646 |
| Rhode Island Hsg & Mtg Fin Cp (RI Homeownership Proj.) Series 70, 4% 10/1/2049 | | 45,000 | 45,025 |
| | | | 991,747 |
TOTAL RHODE ISLAND | | | 29,384,677 |
| South Carolina - 0.7% | | | |
| Electric Utilities - 0.6% | | | |
| South Carolina St Svc Auth Rev Series 2016 A, 5% 12/1/2029 | | 150,000 | 153,274 |
| South Carolina St Svc Auth Rev Series 2016 A, 5% 12/1/2038 | | 15,000 | 15,201 |
| South Carolina St Svc Auth Rev Series 2024 A, 5.25% 12/1/2049 | | 1,060,000 | 1,146,464 |
| South Carolina St Svc Auth Rev Series 2024 A, 5.5% 12/1/2054 | | 1,465,000 | 1,600,535 |
| South Carolina St Svc Auth Rev Series 2024B, 4.125% 12/1/2044 | | 365,000 | 358,617 |
| South Carolina St Svc Auth Rev Series 2024B, 5% 12/1/2039 | | 3,360,000 | 3,684,457 |
| South Carolina St Svc Auth Rev Series 2024B, 5% 12/1/2046 | | 540,000 | 576,585 |
| South Carolina St Svc Auth Rev Series 2024B, 5.25% 12/1/2054 | | 3,995,000 | 4,291,500 |
| South Carolina St Svc Auth Rev Series B, 5% 12/1/2031 | | 55,000 | 56,516 |
| | | | 11,883,149 |
| Escrowed/Pre-Refunded - 0.0% | | | |
| South Carolina St Ports Auth Series 2015, 5.25% 7/1/2055 (Pre-refunded to 7/1/2025 at 100) (e) | | 55,000 | 55,459 |
| Health Care - 0.1% | | | |
| Ctsc Jobs-Eco Dev Aut (Beaufort Mem Hosp Proj.) Series 2024, 5.25% 11/15/2039 | | 850,000 | 889,319 |
| South Carolina Jobs-Economic Dev Auth Hosp Rev (St Joseph Candler Health Proj.) 5% 7/1/2033 | | 365,000 | 384,191 |
| Spartanburg Cnty SC Regl Health Svcs Hosp Rev 4% 4/15/2048 | | 660,000 | 606,209 |
| Spartanburg Cnty SC Regl Health Svcs Hosp Rev 5% 4/15/2048 | | 650,000 | 657,366 |
| | | | 2,537,085 |
| Housing - 0.0% | | | |
| South Carolina Hsg Fin Dev Aut (SC Mortgage Proj.) Series 2019 A, 4% 1/1/2050 | | 75,000 | 75,157 |
| South Carolina Hsg Fin Dev Aut (SC Mortgage Proj.) Series 2023 B, 6% 1/1/2054 | | 505,000 | 548,868 |
| | | | 624,025 |
| Transportation - 0.0% | | | |
| Charleston Cnty SC Arpt Dist Series 2019, 5% 7/1/2043 | | 145,000 | 151,258 |
TOTAL SOUTH CAROLINA | | | 15,250,976 |
| South Dakota - 0.0% | | | |
| Health Care - 0.0% | | | |
| South Dakota St Hlth & Edl Fac (Avera Health SD Proj.) 5% 7/1/2026 | | 15,000 | 15,395 |
| South Dakota St Hlth & Edl Fac (Avera Health SD Proj.) 5% 7/1/2028 | | 15,000 | 15,687 |
| South Dakota St Hlth & Edl Fac (Avera Health SD Proj.) 5% 7/1/2029 | | 30,000 | 31,321 |
| South Dakota St Hlth & Edl Fac (Avera Health SD Proj.) 5% 7/1/2031 | | 35,000 | 36,455 |
| South Dakota St Hlth & Edl Fac (Regional Health Inc Proj.) Series 2020 A, 3% 9/1/2045 | | 730,000 | 581,137 |
| | | | 679,995 |
| Housing - 0.0% | | | |
| South Dakota Housing Development Authority (SD Mortgage Proj.) Series 2023G, 6.25% 5/1/2055 | | 425,000 | 459,768 |
TOTAL SOUTH DAKOTA | | | 1,139,763 |
| Tennessee - 1.8% | | | |
| Education - 0.2% | | | |
| Metro Gov Nashville & Davidson Cnty Tenn Hlth & Edl Facs Brd Rev (Lipscomb University Proj.) Series 2019 A, 5.25% 10/1/2058 | | 4,700,000 | 4,769,434 |
| Electric Utilities - 0.7% | | | |
| Metro Gov Nashville & Davidson Cnty Elec Rev Series 2024 A, 5% 5/15/2028 | | 1,000,000 | 1,067,684 |
| Metro Gov Nashville & Davidson Cnty Elec Rev Series 2024 A, 5% 5/15/2040 | | 1,750,000 | 1,946,245 |
| Metro Gov Nashville & Davidson Cnty Elec Rev Series 2024 A, 5% 5/15/2044 | | 1,585,000 | 1,731,616 |
| Metro Gov Nashville & Davidson Cnty Elec Rev Series 2024 B, 5% 5/15/2028 | | 3,000,000 | 3,203,053 |
| Metro Gov Nashville & Davidson Cnty Elec Rev Series 2024 B, 5% 5/15/2031 | | 4,365,000 | 4,873,581 |
| Metro Gov Nashville & Davidson Cnty Elec Rev Series 2024 B, 5% 5/15/2033 | | 1,755,000 | 2,004,676 |
| | | | 14,826,855 |
| Escrowed/Pre-Refunded - 0.0% | | | |
| Jackson TN Hosp Rev Series 2018 A, 5% 4/1/2041 (Pre-refunded to 10/1/2028 at 100) | | 30,000 | 32,068 |
| General Obligations - 0.1% | | | |
| Metropolitan Govt Nashville & Davidson Cnty TN Gen. Oblig. Series 2021 C, 5% 1/1/2027 | | 3,010,000 | 3,133,856 |
| Health Care - 0.2% | | | |
| Chatanooga TN Health Ed & Hsg Fac Brd Rev (CommonSpirit Health Proj.) Series 2019A 1, 4% 8/1/2044 | | 610,000 | 569,141 |
| Jackson TN Hosp Rev (West Tennessee Healthcare Proj.) Series 2018 A, 5% 4/1/2041 | | 560,000 | 573,598 |
| Metro Gov Nashville & Davidson Cnty Tenn Hlth & Edl Facs Brd Rev (Vanderbilt Hospital, TN Proj.) Series 2024A, 5% 7/1/2034 | | 2,570,000 | 2,855,728 |
| | | | 3,998,467 |
| Housing - 0.0% | | | |
| Tennessee Housing Development Agency (TN Gnrl Res Finance Prog 1/29/2013 Proj.) 3% 7/1/2051 | | 645,000 | 632,425 |
| Tennessee Housing Development Agency (TN Gnrl Res Finance Prog 1/29/2013 Proj.) Series 2021 3A, 3% 1/1/2052 | | 250,000 | 243,721 |
| Tennessee Housing Development Agency Series 2019 3, 2.6% 7/1/2039 | | 140,000 | 112,879 |
| Tennessee Housing Development Agency Series 2019 3, 2.8% 7/1/2044 | | 165,000 | 123,933 |
| Tennessee Housing Development Agency Series 2019 4, 2.9% 7/1/2039 | | 375,000 | 309,651 |
| | | | 1,422,609 |
| Transportation - 0.6% | | | |
| Memphis-Shelby Cnty TN Arpt Auth Series 2018, 5% 7/1/2037 (e) | | 235,000 | 240,163 |
| Metro Nashville Arpt Auth Rev 5% 7/1/2052 (e) | | 3,250,000 | 3,351,208 |
| Metro Nashville Arpt Auth Rev 5.5% 7/1/2039 (e) | | 2,000,000 | 2,189,920 |
| Metro Nashville Arpt Auth Rev 5.5% 7/1/2040 (e) | | 2,000,000 | 2,181,844 |
| Metro Nashville Arpt Auth Rev 5.5% 7/1/2042 (e) | | 3,500,000 | 3,797,165 |
| Metro Nashville Arpt Auth Rev Series 2015 B, 4% 7/1/2025 (e) | | 130,000 | 130,289 |
| Metro Nashville Arpt Auth Rev Series 2019 B, 5% 7/1/2038 (e) | | 965,000 | 1,010,215 |
| Metro Nashville Arpt Auth Rev Series 2019 B, 5% 7/1/2054 (e) | | 300,000 | 306,630 |
| | | | 13,207,434 |
TOTAL TENNESSEE | | | 41,390,723 |
| Texas - 7.2% | | | |
| Education - 0.5% | | | |
| Board of Regents of the University of Texas System Series 2020 C, 5% 8/15/2031 | | 880,000 | 984,438 |
| Houston TX Higher Ed (Rice University, TX Proj.) Series 2024, 5% 5/15/2034 | | 7,215,000 | 8,278,665 |
| Newark Higher Ed Fin Corp Tex Rev (Abilene Christian Univ, TX Proj.) 5% 4/1/2027 | | 35,000 | 35,513 |
| Southwest Hrg Ed Auth Tex Rev (Southern Methodist Univ, TX Proj.) 5% 10/1/2029 | | 20,000 | 20,903 |
| Southwest Hrg Ed Auth Tex Rev (Southern Methodist Univ, TX Proj.) 5% 10/1/2030 | | 35,000 | 36,528 |
| Southwest Hrg Ed Auth Tex Rev (Southern Methodist Univ, TX Proj.) 5% 10/1/2031 | | 30,000 | 31,285 |
| Southwest Hrg Ed Auth Tex Rev (Southern Methodist Univ, TX Proj.) 5% 10/1/2039 | | 65,000 | 67,036 |
| Southwest Hrg Ed Auth Tex Rev (Southern Methodist Univ, TX Proj.) 5% 10/1/2040 | | 50,000 | 51,531 |
| Texas A&M Univ Perm Univ Fund 5% 7/1/2038 | | 1,785,000 | 1,970,373 |
| University Houston TX Univ Rev Series 2017 A, 5% 2/15/2036 | | 150,000 | 152,366 |
| University North Tex Univ Rev Series 2017 A, 5% 4/15/2032 | | 105,000 | 108,816 |
| University TX Perm Univ Fd Series 2016 B, 5% 7/1/2029 | | 105,000 | 107,719 |
| | | | 11,845,173 |
| Electric Utilities - 0.1% | | | |
| Lower Colorado River Authority (Lcra Transmission Services Corp Proj.) 5% 5/15/2025 | | 295,000 | 296,939 |
| Lower Colorado River Authority (Lcra Transmission Services Corp Proj.) 5% 5/15/2026 | | 370,000 | 379,059 |
| Lower Colorado River Authority (Lcra Transmission Services Corp Proj.) 5% 5/15/2027 | | 440,000 | 458,892 |
| Lower Colorado River Authority Series 2015D, 5% 5/15/2028 | | 110,000 | 110,661 |
| San Antonio TX Elec & Gas Rev Series 2021 A, 5% 2/1/2046 | | 2,010,000 | 2,105,448 |
| | | | 3,350,999 |
| Escrowed/Pre-Refunded - 0.0% | | | |
| Central TX Regl Mobility Auth Rev Series A, 5% 1/1/2031 (Pre-refunded to 7/1/2025 at 100) | | 25,000 | 25,227 |
| Central TX Regl Mobility Auth Rev Series A, 5% 1/1/2040 (Pre-refunded to 7/1/2025 at 100) | | 295,000 | 297,683 |
| | | | 322,910 |
| General Obligations - 3.5% | | | |
| Bell Cnty TX Gen. Oblig. 2% 2/15/2035 | | 1,500,000 | 1,208,497 |
| Birdville TX Indpt Sch Dist 2.375% 2/15/2036 (Permanent Sch Fund of Texas Guaranteed) | | 1,785,000 | 1,470,397 |
| City of Coppell TX Gen. Oblig. Series 2020, 1.5% 2/1/2036 | | 1,485,000 | 1,047,389 |
| City of Waco TX Gen. Oblig. Series 2020, 2.375% 2/1/2040 | | 1,460,000 | 1,095,236 |
| Comal Tex Indpt Sch Dist 3% 2/15/2038 (Permanent Sch Fund of Texas Guaranteed) | | 1,925,000 | 1,771,589 |
| Conroe TX Isd Series 2024, 5% 2/15/2036 (Permanent Sch Fund of Texas Guaranteed) | | 1,715,000 | 1,935,945 |
| Conroe TX Isd Series 2024, 5% 2/15/2037 (Permanent Sch Fund of Texas Guaranteed) | | 3,050,000 | 3,428,115 |
| Conroe TX Isd Series 2024, 5% 2/15/2038 (Permanent Sch Fund of Texas Guaranteed) | | 1,355,000 | 1,516,470 |
| Corpus Christi TX Gen. Oblig. 5% 3/1/2039 | | 2,110,000 | 2,291,299 |
| Corpus Christi TX Gen. Oblig. 5% 3/1/2040 | | 2,215,000 | 2,391,538 |
| Dallas TX Gen. Oblig. Series 2024A, 5% 2/15/2028 | | 3,365,000 | 3,564,725 |
| Dallas TX Gen. Oblig. Series 2024A, 5% 2/15/2029 | | 2,710,000 | 2,914,136 |
| Dallas TX Gen. Oblig. Series 2024A, 5% 2/15/2030 | | 3,435,000 | 3,744,170 |
| Dallas TX Gen. Oblig. Series 2024A, 5% 2/15/2031 | | 1,445,000 | 1,595,330 |
| Dallas TX Gen. Oblig. Series 2024A, 5% 2/15/2032 | | 2,855,000 | 3,188,661 |
| Dallas TX Gen. Oblig. Series 2024A, 5% 2/15/2033 | | 1,445,000 | 1,629,995 |
| Denton TX Gen. Oblig. Series 2020, 2% 2/15/2038 | | 1,530,000 | 1,135,303 |
| Denton TX Gen. Oblig. Series 2023, 5% 2/15/2041 | | 2,185,000 | 2,373,139 |
| El Paso Independent School District Series 2020, 5% 8/15/2025 (Permanent Sch Fund of Texas Guaranteed) | | 220,000 | 222,581 |
| El Paso Independent School District Series 2020, 5% 8/15/2026 (Permanent Sch Fund of Texas Guaranteed) | | 380,000 | 392,174 |
| Fort Bend TX Indpt Sch Dist Series 2021 B, 0.72% tender 8/1/2051 (Permanent Sch Fund of Texas Guaranteed) (b) | | 505,000 | 477,137 |
| Fort Worth Tex Indpt Sch Dist Series 2019 A, 2.375% 2/15/2033 (Permanent Sch Fund of Texas Guaranteed) | | 380,000 | 333,278 |
| Harris Cnty TX Flood Ctl Dist (Harris Cnty TX Proj.) Gen. Oblig. Series 2021 A, 5% 10/1/2028 | | 500,000 | 536,397 |
| Harris Cnty TX Flood Ctl Dist (Harris Cnty TX Proj.) Gen. Oblig. Series 2021 A, 5% 10/1/2029 | | 500,000 | 544,384 |
| Harris Cnty TX Gen. Oblig. 0% 8/15/2025 (National Public Finance Guarantee Corporation Insured) (h) | | 150,000 | 146,902 |
| Harris Cnty TX Gen. Oblig. 0% 8/15/2028 (National Public Finance Guarantee Corporation Insured) (h) | | 255,000 | 225,379 |
| Houston TX Gen. Oblig. 5% 3/1/2032 | | 100,000 | 103,336 |
| Houston TX Gen. Oblig. Series 2023, 5% 3/1/2034 | | 3,000,000 | 3,361,911 |
| Houston TX Gen. Oblig. Series 2023, 5% 3/1/2035 | | 275,000 | 306,834 |
| Houston TX Gen. Oblig. Series 2023, 5% 3/1/2036 | | 1,000,000 | 1,111,058 |
| Houston TX Gen. Oblig. Series 2023, 5% 3/1/2037 | | 900,000 | 997,234 |
| Houston TX Gen. Oblig. Series 2023, 5% 3/1/2038 | | 1,450,000 | 1,599,527 |
| Houston TX Gen. Oblig. Series 2023, 5.25% 3/1/2039 | | 2,000,000 | 2,233,507 |
| Houston TX Gen. Oblig. Series 2023, 5.25% 3/1/2040 | | 1,800,000 | 2,001,367 |
| Houston TX Gen. Oblig. Series 2023, 5.25% 3/1/2041 | | 1,000,000 | 1,105,217 |
| Houston TX Gen. Oblig. Series 2023, 5.25% 3/1/2042 | | 2,750,000 | 3,029,425 |
| Houston TX Gen. Oblig. Series 2023, 5.25% 3/1/2043 | | 3,350,000 | 3,678,072 |
| Katy TX Ind Sch Dist Series 2023, 5% 2/15/2040 (Permanent Sch Fund of Texas Guaranteed) | | 1,170,000 | 1,275,899 |
| Mansfield TX Gen. Oblig. 2.5% 2/15/2038 | | 1,150,000 | 931,791 |
| New Braunfels TX Isd 2.5% 2/1/2035 (Permanent Sch Fund of Texas Guaranteed) | | 1,850,000 | 1,576,646 |
| Northside TX Indpt Sch Dist (Permanent Sch Fund Of Texas Proj.) Series 2020, 0.7% tender 6/1/2050 (Permanent Sch Fund of Texas Guaranteed) (b) | | 730,000 | 719,096 |
| Northside TX Indpt Sch Dist Series 2023 B, 3% tender 8/1/2053 (Permanent Sch Fund of Texas Guaranteed) (b) | | 5,135,000 | 5,094,954 |
| Northside TX Indpt Sch Dist Series 2024B, 3.45% tender 8/1/2054 (Permanent Sch Fund of Texas Guaranteed) (b) | | 4,345,000 | 4,350,906 |
| Prosper Tex Indpt Sch Dist Series 2019 B, 4% tender 2/15/2050 (Permanent Sch Fund of Texas Guaranteed) (b) | | 1,010,000 | 1,016,468 |
| Tarrant Cnty Tex Hosp Dist Gen. Oblig. Series 2023, 5% 8/15/2033 | | 1,000,000 | 1,113,991 |
| Weatherford Tex Indpt Sch Dist 0% 2/15/2033 (Permanent Sch Fund of Texas Guaranteed) (h) | | 350,000 | 263,715 |
| | | | 77,051,120 |
| Health Care - 0.2% | | | |
| Harris Cnty TX Cultural Ed Facs Fin Corp Med Facs Rev (Baylor College of Medicine Proj.) Series 2024A, 5% 5/15/2029 | | 1,725,000 | 1,844,080 |
| Harris Cnty TX Cultural Ed Facs Fin Corp Rev (Texas Childrens Hospital, TX Proj.) Series 2015 1, 5% 10/1/2029 | | 70,000 | 70,900 |
| Harris Cnty TX Cultural Ed Facs Fin Corp Rev (Texas Childrens Hospital, TX Proj.) Series 2021 A, 3% 10/1/2051 | | 1,000,000 | 769,523 |
| Irving TX Hosp Auth Hosp Rev Series 2017A, 5% 10/15/2028 | | 25,000 | 25,436 |
| Irving TX Hosp Auth Hosp Rev Series 2017A, 5% 10/15/2030 | | 95,000 | 96,606 |
| Irving TX Hosp Auth Hosp Rev Series 2017A, 5% 10/15/2032 | | 50,000 | 50,757 |
| Irving TX Hosp Auth Hosp Rev Series 2017A, 5% 10/15/2036 | | 35,000 | 35,330 |
| Irving TX Hosp Auth Hosp Rev Series 2017A, 5% 10/15/2037 | | 55,000 | 55,440 |
| Irving TX Hosp Auth Hosp Rev Series 2017A, 5% 10/15/2038 | | 80,000 | 80,534 |
| Irving TX Hosp Auth Hosp Rev Series 2017A, 5% 10/15/2044 | | 80,000 | 80,338 |
| New Hope Cultural Ed Facs Fin Corp Tex Cap Impt Rev (Childrens Med Ctr of Dallas Proj.) Series 2017A, 5% 8/15/2027 | | 40,000 | 41,795 |
| New Hope Cultural Ed Facs Fin Corp Tex Cap Impt Rev (Childrens Med Ctr of Dallas Proj.) Series 2017A, 5% 8/15/2029 | | 100,000 | 103,953 |
| Tarrant Cnty TX Cultural Ed Facs Fin Corp Rev (Texas Health Resources Proj.) Series 2016 A, 4% 2/15/2035 | | 255,000 | 253,167 |
| | | | 3,507,859 |
| Housing - 0.4% | | | |
| Houston Tex Fin Corp Multifamilty Hsg Rev 5% tender 8/1/2041 (b) | | 1,035,000 | 1,052,352 |
| Texas Dept Hsg & Cmnty Affrs Res Mtg Rev (TX Residential Mortgage Proj.) Series 2023B, 6% 1/1/2054 | | 2,135,000 | 2,324,153 |
| Texas St Dept Hsg & Cmnty Affairs Multifamily Hsg Rev Series 2019, 2.95% 7/1/2036 | | 1,042,862 | 901,008 |
| Texas St Dept Hsg & Cmnty Sfr (TX Single Family Mortgage Proj.) 3.5% 3/1/2051 | | 215,000 | 212,153 |
| Texas St Dept Hsg & Cmnty Sfr (TX Single Family Mortgage Proj.) Series 2018 A, 4.25% 9/1/2048 | | 3,195,000 | 3,139,332 |
| Texas St Dept Hsg & Cmnty Sfr (TX Single Family Mortgage Proj.) Series 2019 A, 4% 3/1/2050 | | 175,000 | 175,512 |
| Texas St Dept Hsg & Cmnty Sfr Series 2023 C, 6% 3/1/2054 | | 1,755,000 | 1,913,874 |
| | | | 9,718,384 |
| Special Tax - 0.1% | | | |
| Texas Transn Commn Gen. Oblig. Series 2014 B, 0.65% tender 10/1/2041 (Texas State Guaranteed) (b) | | 3,195,000 | 3,053,490 |
| Transportation - 1.5% | | | |
| Austin Tex Airport Sys 5% 11/15/2026 (e) | | 50,000 | 50,093 |
| Austin Tex Airport Sys 5% 11/15/2027 (e) | | 65,000 | 65,111 |
| Austin Tex Airport Sys 5% 11/15/2028 (e) | | 75,000 | 75,127 |
| Austin Tex Airport Sys Series 2017 B, 5% 11/15/2028 (e) | | 50,000 | 51,038 |
| Austin Tex Airport Sys Series 2017 B, 5% 11/15/2030 (e) | | 80,000 | 81,622 |
| Austin Tex Airport Sys Series 2017 B, 5% 11/15/2032 (e) | | 60,000 | 61,138 |
| Austin Tex Airport Sys Series 2017 B, 5% 11/15/2035 (e) | | 65,000 | 66,035 |
| Austin Tex Airport Sys Series 2017 B, 5% 11/15/2036 (e) | | 105,000 | 106,582 |
| Austin Tex Airport Sys Series 2017 B, 5% 11/15/2037 (e) | | 70,000 | 70,983 |
| Central TX Regl Mobility Auth Rev 5% 1/1/2027 | | 1,055,000 | 1,070,423 |
| Central TX Regl Mobility Auth Rev Series A, 5% 1/1/2028 | | 65,000 | 65,518 |
| City of Houston TX Airport System Revenue Series 2018 A, 5% 7/1/2041 (e) | | 880,000 | 895,847 |
| City of Houston TX Airport System Revenue Series 2018 C, 5% 7/1/2029 (e) | | 100,000 | 104,142 |
| City of Houston TX Airport System Revenue Series 2018 C, 5% 7/1/2030 (e) | | 105,000 | 109,303 |
| City of Houston TX Airport System Revenue Series 2018 C, 5% 7/1/2031 (e) | | 75,000 | 78,017 |
| City of Houston TX Airport System Revenue Series 2018 C, 5% 7/1/2032 (e) | | 90,000 | 93,388 |
| Dallas Fort Worth International Airport Series 2022B, 5% 11/1/2037 | | 3,000,000 | 3,310,943 |
| Grand Parkway Transportation Corp (Grand Parkway Trans Corp Tela Proj.) Series 2018 A, 5% 10/1/2038 | | 160,000 | 167,182 |
| Grand Parkway Transportation Corp (Grand Parkway Trans Corp Tela Proj.) Series 2023, 5% tender 10/1/2052 (b) | | 5,825,000 | 6,107,709 |
| Harris Cnty Tex Toll Rd Rev (Harris County Toll Road Auth Proj.) Series 2018 A, 5% 8/15/2043 | | 585,000 | 602,713 |
| Love Field TX Arpt Mod Rev Series 2015, 5% 11/1/2026 (e) | | 50,000 | 50,583 |
| Love Field TX Arpt Mod Rev Series 2015, 5% 11/1/2027 (e) | | 110,000 | 111,088 |
| Love Field TX Arpt Mod Rev Series 2015, 5% 11/1/2028 (e) | | 165,000 | 166,548 |
| Love Field TX Arpt Mod Rev Series 2015, 5% 11/1/2029 (e) | | 100,000 | 100,925 |
| Love Field TX Arpt Mod Rev Series 2015, 5% 11/1/2032 (e) | | 185,000 | 186,513 |
| Love Field TX Arpt Mod Rev Series 2017, 5% 11/1/2025 (e) | | 50,000 | 50,630 |
| Love Field TX Arpt Mod Rev Series 2017, 5% 11/1/2026 (e) | | 50,000 | 51,264 |
| Love Field TX Arpt Mod Rev Series 2017, 5% 11/1/2027 (e) | | 50,000 | 51,162 |
| Love Field TX Arpt Mod Rev Series 2017, 5% 11/1/2028 (e) | | 90,000 | 91,832 |
| Love Field TX Arpt Mod Rev Series 2017, 5% 11/1/2029 (e) | | 65,000 | 66,304 |
| Love Field TX Arpt Mod Rev Series 2017, 5% 11/1/2030 (e) | | 50,000 | 50,993 |
| Love Field TX Arpt Mod Rev Series 2017, 5% 11/1/2031 (e) | | 115,000 | 117,222 |
| Love Field TX Arpt Mod Rev Series 2017, 5% 11/1/2032 (e) | | 130,000 | 132,420 |
| Love Field TX Arpt Mod Rev Series 2017, 5% 11/1/2033 (e) | | 50,000 | 50,886 |
| Love Field TX Arpt Mod Rev Series 2017, 5% 11/1/2034 (e) | | 50,000 | 50,814 |
| North TX Twy Auth Rev 0% 1/1/2035 (Assured Guaranty Inc Insured) (h) | | 7,375,000 | 5,025,005 |
| North TX Twy Auth Rev 3% 1/1/2046 | | 9,330,000 | 7,269,233 |
| North TX Twy Auth Rev 5% 1/1/2030 | | 20,000 | 20,270 |
| North TX Twy Auth Rev 5% 1/1/2031 | | 30,000 | 30,416 |
| North TX Twy Auth Rev 5% 1/1/2031 | | 50,000 | 50,742 |
| North TX Twy Auth Rev 5% 1/1/2033 | | 60,000 | 61,824 |
| North TX Twy Auth Rev 5% 1/1/2034 | | 150,000 | 170,023 |
| North TX Twy Auth Rev 5% 1/1/2034 | | 75,000 | 77,188 |
| North TX Twy Auth Rev 5% 1/1/2035 | | 110,000 | 113,034 |
| North TX Twy Auth Rev 5% 1/1/2036 | | 65,000 | 65,796 |
| North TX Twy Auth Rev 5% 1/1/2037 | | 65,000 | 66,589 |
| North TX Twy Auth Rev Series 2015A, 5% 1/1/2032 | | 170,000 | 170,000 |
| North TX Twy Auth Rev Series 2018, 4% 1/1/2037 | | 625,000 | 625,016 |
| North TX Twy Auth Rev Series 2018, 4% 1/1/2038 | | 1,280,000 | 1,275,127 |
| North TX Twy Auth Rev Series A, 5% 1/1/2039 | | 1,650,000 | 1,708,992 |
| Texas Private Activity Bd Surface Transn Corp Rev (Lbj Infrastructure Group LLC Proj.) 4% 6/30/2036 | | 210,000 | 207,633 |
| Texas Private Activity Bd Surface Transn Corp Rev (Lbj Infrastructure Group LLC Proj.) 4% 6/30/2039 | | 530,000 | 515,192 |
| Texas Private Activity Bd Surface Transn Corp Rev (Lbj Infrastructure Group LLC Proj.) 4% 6/30/2040 | | 440,000 | 425,661 |
| | | | 32,439,839 |
| Water & Sewer - 0.9% | | | |
| Austin TX Wtr & Wastewtr Sys Series 2022, 5% 11/15/2037 | | 1,000,000 | 1,106,035 |
| Austin TX Wtr & Wastewtr Sys Series 2022, 5% 11/15/2038 | | 1,250,000 | 1,375,974 |
| Austin TX Wtr & Wastewtr Sys Series 2022, 5% 11/15/2039 | | 1,750,000 | 1,915,969 |
| Austin TX Wtr & Wastewtr Sys Series 2022, 5% 11/15/2040 | | 2,000,000 | 2,181,307 |
| Austin TX Wtr & Wastewtr Sys Series 2022, 5% 11/15/2041 | | 2,000,000 | 2,170,132 |
| Austin TX Wtr & Wastewtr Sys Series 2022, 5% 11/15/2042 | | 3,000,000 | 3,244,388 |
| City of El Paso TX Water & Sewer Revenue Series 2022, 5% 3/1/2036 | | 1,000,000 | 1,082,454 |
| Dallas TX Wtrwks & Swr Sys Rev Series 2017, 5% 10/1/2046 | | 585,000 | 601,599 |
| Houston TX Util Sys Rev 4% 11/15/2043 | | 1,030,000 | 999,629 |
| Houston TX Util Sys Rev 5% 11/15/2045 | | 1,030,000 | 1,081,762 |
| San Antonio TX Wtr Rev Series 2020 A, 5% 5/15/2050 | | 625,000 | 651,198 |
| Texas Wtr Dev Brd 3% 10/15/2038 | | 1,000,000 | 890,689 |
| Texas Wtr Dev Brd 5% 8/1/2030 | | 295,000 | 324,744 |
| Texas Wtr Dev Brd Series 2022, 4.45% 10/15/2036 | | 3,000,000 | 3,195,767 |
| | | | 20,821,647 |
TOTAL TEXAS | | | 162,111,421 |
| Utah - 0.5% | | | |
| Health Care - 0.0% | | | |
| Utah Cnty Utah Hosp Rev (IHC Health Services Inc Proj.) Series 2020 A, 5% 5/15/2050 | | 295,000 | 308,099 |
| Housing - 0.0% | | | |
| Utah Hsg Corp Series 2021E(G2), 2% 4/21/2051 | | 370,759 | 301,254 |
| Special Tax - 0.0% | | | |
| Mida Mountain Village Public Infrastructure District Series 2024 1, 5.125% 6/15/2054 (g) | | 1,000,000 | 964,054 |
| Transportation - 0.5% | | | |
| Salt Lake City UT Arpt Rev Series 2017A, 5% 7/1/2025 (e) | | 100,000 | 100,612 |
| Salt Lake City UT Arpt Rev Series 2017A, 5% 7/1/2027 (e) | | 215,000 | 221,924 |
| Salt Lake City UT Arpt Rev Series 2017A, 5% 7/1/2029 (e) | | 190,000 | 195,402 |
| Salt Lake City UT Arpt Rev Series 2017A, 5% 7/1/2030 (e) | | 140,000 | 143,767 |
| Salt Lake City UT Arpt Rev Series 2017A, 5% 7/1/2031 (e) | | 265,000 | 271,990 |
| Salt Lake City UT Arpt Rev Series 2017A, 5% 7/1/2033 (e) | | 205,000 | 209,990 |
| Salt Lake City UT Arpt Rev Series 2017A, 5% 7/1/2035 (e) | | 205,000 | 209,422 |
| Salt Lake City UT Arpt Rev Series 2017A, 5% 7/1/2036 (e) | | 275,000 | 280,598 |
| Salt Lake City UT Arpt Rev Series 2017A, 5% 7/1/2037 (e) | | 690,000 | 703,181 |
| Salt Lake City UT Arpt Rev Series 2017A, 5% 7/1/2042 (e) | | 1,240,000 | 1,255,961 |
| Salt Lake City UT Arpt Rev Series 2018A, 5% 7/1/2033 (e) | | 485,000 | 501,540 |
| Salt Lake City UT Arpt Rev Series 2023A, 5.25% 7/1/2037 (e) | | 815,000 | 891,689 |
| Salt Lake City UT Arpt Rev Series 2023A, 5.25% 7/1/2042 (e) | | 2,500,000 | 2,678,657 |
| Salt Lake City UT Arpt Rev Series 2023A, 5.25% 7/1/2043 (e) | | 2,715,000 | 2,898,322 |
| | | | 10,563,055 |
TOTAL UTAH | | | 12,136,462 |
| Vermont - 0.1% | | | |
| Education - 0.1% | | | |
| Vermont Edl & Hlth Bldgs Fin Agy (Champlain College Proj.) 5% 10/15/2041 | | 230,000 | 214,767 |
| Vermont Edl & Hlth Bldgs Fin Agy (Champlain College Proj.) 5% 10/15/2046 | | 290,000 | 260,393 |
| Vermont Edl & Hlth Bldgs Fin Agy (Middlebury College, VT Proj.) 5% 11/1/2049 | | 475,000 | 492,715 |
| Vermont St Stud Assit Corp 5% 6/15/2028 (e) | | 295,000 | 303,277 |
| Vermont St Stud Assit Corp Series 2019 A, 5% 6/15/2027 (e) | | 295,000 | 301,672 |
| Vermont St Stud Assit Corp Series 2019 A, 5% 6/15/2029 (e) | | 500,000 | 512,278 |
| | | | 2,085,102 |
| Housing - 0.0% | | | |
| Vermont Hsg Fin Agy (Vermont Hsg Purp Bond Prog 7/1/07 Proj.) Series 2021A, 3% 11/1/2051 | | 316,000 | 305,280 |
TOTAL VERMONT | | | 2,390,382 |
| Virginia - 0.5% | | | |
| General Obligations - 0.2% | | | |
| Arlington Cnty VA Gen. Oblig. Series 2021, 5% 6/15/2028 | | 1,340,000 | 1,433,699 |
| Virginia Comwlth Transn Brd Tr (Virginia St Proj.) 5% 5/15/2032 | | 45,000 | 47,297 |
| Virginia St Pub Bldg Auth Pub (Virginia St Proj.) Series 2019A, 4% 8/1/2036 | | 675,000 | 685,691 |
| Virginia St Pub Sch Auth Spl Oblig Stafford Cnty (County of Stafford VA Proj.) Series 2023, 5% 8/1/2039 | | 1,235,000 | 1,380,926 |
| | | | 3,547,613 |
| Health Care - 0.1% | | | |
| Fredericksburg VA Economic Dev Auth Hosp Facs Rev (Mary Washington Hospital,Va Proj.) 5% 6/15/2030 | | 65,000 | 65,340 |
| Lynchburg Economic Development Authority (Centra Health Proj.) Series 2021, 3% 1/1/2051 | | 2,250,000 | 1,681,647 |
| Stafford Cnty VA Economic Dev Auth Hosp Facs Rev (Mary Washington Hospital,Va Proj.) Series 2016, 3% 6/15/2029 | | 30,000 | 29,038 |
| Stafford Cnty VA Economic Dev Auth Hosp Facs Rev (Mary Washington Hospital,Va Proj.) Series 2016, 4% 6/15/2037 | | 35,000 | 33,494 |
| Stafford Cnty VA Economic Dev Auth Hosp Facs Rev (Mary Washington Hospital,Va Proj.) Series 2016, 5% 6/15/2027 | | 75,000 | 76,540 |
| Stafford Cnty VA Economic Dev Auth Hosp Facs Rev (Mary Washington Hospital,Va Proj.) Series 2016, 5% 6/15/2030 | | 30,000 | 30,582 |
| Stafford Cnty VA Economic Dev Auth Hosp Facs Rev (Mary Washington Hospital,Va Proj.) Series 2016, 5% 6/15/2033 | | 20,000 | 20,337 |
| Stafford Cnty VA Economic Dev Auth Hosp Facs Rev (Mary Washington Hospital,Va Proj.) Series 2016, 5% 6/15/2034 | | 40,000 | 40,627 |
| Stafford Cnty VA Economic Dev Auth Hosp Facs Rev (Mary Washington Hospital,Va Proj.) Series 2016, 5% 6/15/2035 | | 110,000 | 111,632 |
| Winchester Economic Development Authority (Valley Health Proj.) 5% 1/1/2034 | | 75,000 | 75,773 |
| Winchester Economic Development Authority (Valley Health Proj.) 5% 1/1/2035 | | 75,000 | 75,706 |
| Winchester Economic Development Authority (Valley Health Proj.) 5% 1/1/2044 | | 50,000 | 50,247 |
| | | | 2,290,963 |
| Housing - 0.0% | | | |
| Fairfax Cnty VA Redev & Hsg Auth Multi-Family Hsg Rev 5% tender 1/1/2045 (b) | | 740,000 | 761,661 |
| Transportation - 0.1% | | | |
| Virginia Small Business Fing Auth Rev (Elizabeth River Crossings Opco LLC Proj.) Series 2022, 4% 1/1/2035 (e) | | 955,000 | 945,268 |
| Virginia Small Business Fing Auth Rev (Elizabeth River Crossings Opco LLC Proj.) Series 2022, 4% 7/1/2035 (e) | | 720,000 | 711,290 |
| | | | 1,656,558 |
| Water & Sewer - 0.1% | | | |
| Chesapeake VA Wtr & Swr Sys 2% 7/1/2035 | | 1,345,000 | 1,075,456 |
| Chesapeake VA Wtr & Swr Sys 2% 7/1/2036 | | 1,370,000 | 1,070,754 |
| | | | 2,146,210 |
TOTAL VIRGINIA | | | 10,403,005 |
| Washington - 3.2% | | | |
| Education - 0.4% | | | |
| Washington St Higher Ed Facs (Gonzaga University Proj.) Series 2019 A, 3% 4/1/2049 | | 1,280,000 | 988,360 |
| Washington St Higher Ed Facs (Whitman College Proj.) Series 2024, 4% 1/1/2043 | | 865,000 | 837,991 |
| Washington St Higher Ed Facs (Whitworth University Proj.) 5% 10/1/2027 | | 110,000 | 111,921 |
| Washington St Higher Ed Facs (Whitworth University Proj.) 5% 10/1/2028 | | 110,000 | 111,813 |
| Washington St Higher Ed Facs (Whitworth University Proj.) Series 2016 A, 5% 10/1/2035 | | 115,000 | 115,962 |
| Washington St Higher Ed Facs (Whitworth University Proj.) Series 2016 A, 5% 10/1/2036 | | 175,000 | 176,292 |
| Washington St Higher Ed Facs (Whitworth University Proj.) Series 2016 A, 5% 10/1/2040 | | 170,000 | 170,536 |
| Washington St Higher Ed Facs (Whitworth University Proj.) Series 2019, 4% 10/1/2049 | | 1,280,000 | 1,063,111 |
| Washington St Hsg Fin Commn Nonprofit Rev (Seattle Academy Arts Sciences Proj.) Series 2023, 5.625% 7/1/2038 (g) | | 1,215,000 | 1,325,244 |
| Washington St Hsg Fin Commn Nonprofit Rev (Seattle Academy Arts Sciences Proj.) Series 2023, 5.875% 7/1/2043 (g) | | 1,350,000 | 1,468,565 |
| Washington St Hsg Fin Commn Nonprofit Rev (Seattle Academy Arts Sciences Proj.) Series 2023, 6.125% 7/1/2053 (g) | | 3,000,000 | 3,264,181 |
| | | | 9,633,976 |
| General Obligations - 1.7% | | | |
| City of Olympia WA Gen. Oblig. 2% 12/1/2030 | | 1,265,000 | 1,123,376 |
| Spokane Cnty WA Sch Dist 81 Series 2017 B, 5% 12/1/2029 (State of Washington Guaranteed) | | 2,325,000 | 2,446,428 |
| State of Washington Gen. Oblig. Series 2015C, 5% 2/1/2034 | | 210,000 | 210,281 |
| State of Washington Gen. Oblig. Series 2016D, 5% 2/1/2028 | | 1,000,000 | 1,019,360 |
| State of Washington Gen. Oblig. Series 2017D, 5% 2/1/2033 | | 180,000 | 186,197 |
| State of Washington Gen. Oblig. Series 2022C, 5% 2/1/2041 | | 3,225,000 | 3,497,436 |
| State of Washington Gen. Oblig. Series 2023A, 5% 8/1/2041 | | 2,985,000 | 3,252,834 |
| State of Washington Gen. Oblig. Series 2024 C, 5% 2/1/2030 | | 12,740,000 | 13,960,630 |
| State of Washington Gen. Oblig. Series 2024 C, 5% 2/1/2031 | | 6,630,000 | 7,366,845 |
| State of Washington Gen. Oblig. Series 2024 D, 5% 6/1/2032 | | 3,875,000 | 4,376,790 |
| State of Washington Gen. Oblig. Series R 2017A, 5% 8/1/2030 | | 105,000 | 107,801 |
| State of Washington Gen. Oblig. Series R 2022 D, 4% 7/1/2036 | | 850,000 | 874,711 |
| State of Washington Gen. Oblig. Series R 2022 D, 4% 7/1/2037 | | 590,000 | 604,703 |
| | | | 39,027,392 |
| Health Care - 0.2% | | | |
| Washington St Health Care Facs Auth Rev (CommonSpirit Health Proj.) Series 2019 A 2, 5% 8/1/2044 | | 340,000 | 349,128 |
| Washington St Health Care Facs Auth Rev (Overlake Hospital Med Ctr, WA Proj.) 5% 7/1/2025 | | 40,000 | 40,147 |
| Washington St Health Care Facs Auth Rev (Overlake Hospital Med Ctr, WA Proj.) 5% 7/1/2027 | | 80,000 | 81,998 |
| Washington St Health Care Facs Auth Rev (Overlake Hospital Med Ctr, WA Proj.) 5% 7/1/2028 | | 95,000 | 97,552 |
| Washington St Health Care Facs Auth Rev (Overlake Hospital Med Ctr, WA Proj.) 5% 7/1/2029 | | 35,000 | 35,874 |
| Washington St Health Care Facs Auth Rev (Overlake Hospital Med Ctr, WA Proj.) 5% 7/1/2030 | | 45,000 | 46,106 |
| Washington St Health Care Facs Auth Rev (Overlake Hospital Med Ctr, WA Proj.) 5% 7/1/2031 | | 55,000 | 56,317 |
| Washington St Health Care Facs Auth Rev (Overlake Hospital Med Ctr, WA Proj.) 5% 7/1/2032 | | 100,000 | 102,288 |
| Washington St Health Care Facs Auth Rev (Overlake Hospital Med Ctr, WA Proj.) 5% 7/1/2033 | | 145,000 | 148,124 |
| Washington St Health Care Facs Auth Rev (Overlake Hospital Med Ctr, WA Proj.) 5% 7/1/2034 | | 35,000 | 35,697 |
| Washington St Health Care Facs Auth Rev (Overlake Hospital Med Ctr, WA Proj.) 5% 7/1/2042 | | 485,000 | 488,348 |
| Washington St Health Care Facs Auth Rev (Providence Health Systems Proj.) 5% 10/1/2025 | | 260,000 | 260,148 |
| Washington St Health Care Facs Auth Rev (Seattle Children's Hospital Proj.) Series B, 5% 10/1/2038 | | 2,050,000 | 2,179,738 |
| Washington St Health Care Facs Auth Rev (Virginia Mason Medical Ctr WA Proj.) Series 2017, 4% 8/15/2042 | | 605,000 | 558,379 |
| | | | 4,479,844 |
| Housing - 0.3% | | | |
| King Cnty Wash Hsg Auth Hsg Rev (King Cnty WA Mhsg Rev 2019 Proj.) Series 2021, 4% 6/1/2026 | | 165,000 | 166,341 |
| King Cnty Wash Hsg Auth Hsg Rev (King Cnty WA Mhsg Rev 2019 Proj.) Series 2021, 4% 6/1/2028 | | 105,000 | 106,239 |
| Seattle Wash Hsg Auth Rev Series 2020 A, 3% 6/1/2052 | | 3,325,000 | 2,416,542 |
| Seattle Wash Hsg Auth Rev Series 2021, 1% 6/1/2026 | | 255,000 | 243,129 |
| Seattle Wash Hsg Auth Rev Series 2021, 3% 6/1/2046 | | 1,010,000 | 781,708 |
| Seattle Wash Hsg Auth Rev Series 2023, 4.375% 12/1/2030 | | 1,080,000 | 1,091,494 |
| Seattle Wash Hsg Auth Rev Series 2023, 5% 6/1/2027 | | 725,000 | 742,238 |
| Washington St Hsg Fin Commn Multifamily Hsg Rev Series 2023, 5% tender 12/1/2043 (b) | | 1,600,000 | 1,632,910 |
| | | | 7,180,601 |
| Special Tax - 0.3% | | | |
| Washington St Convention Ctr Pub Facs Dist Series 2021 B, 3% 7/1/2058 (Assured Guaranty Municipal Corp Insured) | | 1,940,000 | 1,393,476 |
| Washington St Convention Ctr Pub Facs Dist Series 2021, 3% 7/1/2043 | | 335,000 | 265,701 |
| Washington St Convention Ctr Pub Facs Dist Series 2021, 4% 7/1/2031 | | 4,190,000 | 4,229,503 |
| | | | 5,888,680 |
| Transportation - 0.3% | | | |
| Port Seattle WA Rev Series 2019, 4% 4/1/2044 (e) | | 185,000 | 172,827 |
| Port Seattle WA Rev Series 2019, 5% 4/1/2035 (e) | | 2,200,000 | 2,283,378 |
| Port Seattle WA Rev Series 2019, 5% 4/1/2044 (e) | | 440,000 | 450,338 |
| Port Seattle WA Rev Series 2021C, 5% 8/1/2025 (e) | | 465,000 | 468,398 |
| Port Seattle WA Rev Series 2021C, 5% 8/1/2026 (e) | | 640,000 | 653,560 |
| Port Seattle WA Rev Series 2021C, 5% 8/1/2027 (e) | | 395,000 | 408,712 |
| Port Seattle WA Rev Series 2021C, 5% 8/1/2028 (e) | | 1,105,000 | 1,157,236 |
| Port Seattle WA Rev Series B, 5% 10/1/2028 (e) | | 175,000 | 178,131 |
| Port Seattle WA Rev Series B, 5% 10/1/2030 (e) | | 100,000 | 101,569 |
| | | | 5,874,149 |
TOTAL WASHINGTON | | | 72,084,642 |
| West Virginia - 1.1% | | | |
| Health Care - 1.0% | | | |
| West Virginia St Hosp Fin Auth Hosp Rev (Cabell-Huntington Hsp, WV Proj.) Series 2018 A, 5% 1/1/2031 | | 80,000 | 83,005 |
| West Virginia St Hosp Fin Auth Hosp Rev (Cabell-Huntington Hsp, WV Proj.) Series 2018 A, 5% 1/1/2032 | | 70,000 | 72,538 |
| West Virginia St Hosp Fin Auth Hosp Rev (Cabell-Huntington Hsp, WV Proj.) Series 2018 A, 5% 1/1/2043 | | 725,000 | 730,914 |
| West Virginia St Hosp Fin Auth Hosp Rev (Vandalia Health Proj.) Series 2023B, 6% 9/1/2048 | | 3,440,000 | 3,849,844 |
| West Virginia St Hosp Fin Auth Hosp Rev (Vandalia Health Proj.) Series 2023B, 6% 9/1/2053 | | 11,390,000 | 12,661,279 |
| West Virginia St Hosp Fin Auth Hosp Rev (West Virginia United Health Sy Stem Proj.) Series 2023 A, 5% 6/1/2039 | | 1,125,000 | 1,216,208 |
| West Virginia St Hosp Fin Auth Hosp Rev (West Virginia United Health Sy Stem Proj.) Series 2023 A, 5% 6/1/2040 | | 1,030,000 | 1,108,127 |
| West Virginia St Hosp Fin Auth Hosp Rev (West Virginia United Health Sy Stem Proj.) Series 2023 A, 5% 6/1/2041 | | 1,030,000 | 1,103,176 |
| West Virginia St Hosp Fin Auth Hosp Rev (West Virginia United Health Sy Stem Proj.) Series 2023 A, 5% 6/1/2043 | | 1,830,000 | 1,944,424 |
| | | | 22,769,515 |
| Transportation - 0.1% | | | |
| West Virginia Parkways Authority Series 2021, 5% 6/1/2025 | | 295,000 | 297,156 |
| West Virginia Parkways Authority Series 2021, 5% 6/1/2026 | | 295,000 | 302,776 |
| West Virginia Parkways Authority Series 2021, 5% 6/1/2027 | | 295,000 | 308,479 |
| West Virginia Parkways Authority Series 2021, 5% 6/1/2028 | | 440,000 | 468,084 |
| | | | 1,376,495 |
TOTAL WEST VIRGINIA | | | 24,146,010 |
| Wisconsin - 1.6% | | | |
| Education - 0.2% | | | |
| Public Fin Auth WI Revenue (Roseman Univ of Hlth Sciences Proj.) Series 2020, 5% 4/1/2040 (g) | | 100,000 | 102,196 |
| Public Fin Auth Wis Edl Fac Rev (Queens University of Charlotte Proj.) 5.25% 3/1/2042 | | 500,000 | 511,498 |
| Public Fin Auth Wis Edl Fac Rev (Queens University of Charlotte Proj.) 5.25% 3/1/2047 | | 2,175,000 | 2,198,343 |
| Public Fin Auth Wis Edl Fac Rev (Wingate University Proj.) 5.25% 10/1/2043 | | 280,000 | 277,720 |
| Public Fin Auth Wis Edl Fac Rev (Wingate University Proj.) 5.25% 10/1/2048 | | 470,000 | 457,512 |
| Wisconsin Health & Educational Facilities Authority (Marquette University, WI Proj.) Series 2019, 5% 10/1/2030 | | 120,000 | 128,590 |
| Wisconsin Health & Educational Facilities Authority (Marquette University, WI Proj.) Series 2019, 5% 10/1/2032 | | 250,000 | 267,246 |
| | | | 3,943,105 |
| Electric Utilities - 0.0% | | | |
| Wisconsin Health & Educational Facilities Authority (Milwaukee Reg Med Center Thermal Proj.) 5% 4/1/2034 | | 585,000 | 614,863 |
| Escrowed/Pre-Refunded - 0.0% | | | |
| Wisconsin Health & Educational Facilities Authority Series 2017 A, 5% 9/1/2029 (Pre-refunded to 9/1/2027 at 100) | | 295,000 | 308,596 |
| Wisconsin Health & Educational Facilities Authority Series 2017 A, 5% 9/1/2031 (Pre-refunded to 9/1/2027 at 100) | | 50,000 | 52,304 |
| Wisconsin Health & Educational Facilities Authority Series 2017 A, 5% 9/1/2033 (Pre-refunded to 9/1/2027 at 100) | | 85,000 | 88,917 |
| Wisconsin Health & Educational Facilities Authority Series 2017 A, 5% 9/1/2035 (Pre-refunded to 9/1/2027 at 100) | | 95,000 | 99,378 |
| | | | 549,195 |
| General Obligations - 0.2% | | | |
| Howard Suamico WI Scd 2% 3/1/2037 | | 585,000 | 447,262 |
| Madison WI Gen. Oblig. 3% 10/1/2036 | | 1,385,000 | 1,273,083 |
| Wisconsin St Gen. Oblig. 5% 5/1/2036 | | 1,840,000 | 1,942,289 |
| | | | 3,662,634 |
| Health Care - 1.0% | | | |
| Public Fin Auth WI Hosp Rev (Renown Regional Medical Center Proj.) 3% 6/1/2045 | | 2,645,000 | 2,072,046 |
| Public Fin Auth WI Hosp Rev (Renown Regional Medical Center Proj.) 4% 6/1/2045 | | 900,000 | 844,265 |
| Public Fin Auth WI Hosp Rev (Renown Regional Medical Center Proj.) 5% 6/1/2034 | | 1,750,000 | 1,858,710 |
| Public Fin Auth WI Hosp Rev (WakeMed Proj.) 5% 10/1/2044 | | 690,000 | 709,732 |
| Public Fin Auth WI Revenue (Bayhealth Medical Center Inc Proj.) Series 2021 A, 3% 7/1/2050 | | 655,000 | 491,583 |
| Public Fin Auth WI Revenue (Prime Healthcare Foundation Inc Proj.) Series 2018A, 5% 12/1/2027 | | 625,000 | 634,448 |
| Public Fin Auth Wis Retirement Fac Rev (Southminster NC Proj.) 5% 10/1/2043 (g) | | 130,000 | 128,001 |
| Public Fin Auth Wis Retirement Fac Rev (Southminster NC Proj.) 5% 10/1/2048 (g) | | 110,000 | 105,305 |
| Public Fin Auth Wis Retirement Fac Rev (Southminster NC Proj.) 5% 10/1/2053 (g) | | 90,000 | 84,541 |
| Public Fin Auth Wis Sr Living Rev (Mary's Woods at Marylhurst Inc Proj.) 5% 5/15/2025 (g) | | 45,000 | 44,997 |
| Public Fin Auth Wis Sr Living Rev (Mary's Woods at Marylhurst Inc Proj.) 5% 5/15/2028 (g) | | 70,000 | 70,519 |
| Public Fin Auth Wis Sr Living Rev (Mary's Woods at Marylhurst Inc Proj.) 5.25% 5/15/2037 (g) | | 50,000 | 50,451 |
| Public Fin Auth Wis Sr Living Rev (Mary's Woods at Marylhurst Inc Proj.) 5.25% 5/15/2042 (g) | | 415,000 | 415,998 |
| Public Fin Auth Wis Sr Living Rev (Mary's Woods at Marylhurst Inc Proj.) 5.25% 5/15/2047 (g) | | 25,000 | 24,553 |
| Public Fin Auth Wis Sr Living Rev (Mary's Woods at Marylhurst Inc Proj.) 5.25% 5/15/2052 (g) | | 45,000 | 43,304 |
| Public Finance Authority (Blue Ridge Healthcare Proj.) Series 2020 A, 3% 1/1/2050 | | 1,290,000 | 971,802 |
| Wisconsin Health & Educational Facilities Authority (Ascension Health Credit Group Proj.) Series 2016 A, 5% 11/15/2036 | | 255,000 | 258,797 |
| Wisconsin Health & Educational Facilities Authority (Marshfield Clinic Proj.) 5% 2/15/2028 | | 120,000 | 121,397 |
| Wisconsin Health & Educational Facilities Authority (Medical College of WI Inc Proj.) Series 2016, 4% 12/1/2046 | | 1,610,000 | 1,540,370 |
| Wisconsin Health & Educational Facilities Authority (Prohealth Care Inc Proj.) Series 2015, 3.15% 8/15/2027 | | 1,000,000 | 982,966 |
| Wisconsin Health & Educational Facilities Authority (St Camillus Health System Proj.) Series 2019A, 5% 11/1/2026 | | 105,000 | 105,074 |
| Wisconsin Health & Educational Facilities Authority (St Camillus Health System Proj.) Series 2019A, 5% 11/1/2046 | | 300,000 | 276,114 |
| Wisconsin St Health & Edl Facs Auth Rev (Advocate Health Care Network Proj.) 5% tender 8/15/2054 (b) | | 1,235,000 | 1,321,082 |
| Wisconsin St Health & Edl Facs Auth Rev (Advocate Health Care Network Proj.) Series 2018C 4, 5% tender 8/15/2054 (b) | | 850,000 | 908,153 |
| Wisconsin St Health & Edl Facs Auth Rev (Aspirus Wausau Hospital Inc Proj.) Series 2021, 3% 8/15/2051 | | 6,800,000 | 5,217,282 |
| Wisconsin St Health & Edl Facs Auth Rev (Gundersen Clinic - LA Crosse Proj.) Series 2021 A, 3% 10/15/2038 | | 865,000 | 736,082 |
| Wisconsin St Health & Edl Facs Auth Rev (Gundersen Clinic - LA Crosse Proj.) Series 2021 A, 3% 10/15/2039 | | 450,000 | 378,365 |
| Wisconsin St Health & Edl Facs Auth Rev (Marshfield Clinic Proj.) Series 2024 A, 4.5% 2/15/2054 (Build America Mutual Assurance Co Insured) | | 795,000 | 760,694 |
| Wisconsin St Health & Edl Facs Auth Rev (Marshfield Clinic Proj.) Series 2024 A, 5.5% 2/15/2054 | | 850,000 | 920,228 |
| | | | 22,076,859 |
| Housing - 0.1% | | | |
| Wisconsin Hsg & Eda Hsg Rev (Wi Mhsg Rev 2007 Proj.) 0.81% tender 11/1/2052 (b) | | 70,000 | 69,071 |
| Wisconsin Hsg & Eda Hsg Rev (Wi Mhsg Rev 2007 Proj.) Series 2023 E, 3.875% tender 11/1/2054 (b) | | 1,365,000 | 1,368,687 |
| | | | 1,437,758 |
| Industrial Development - 0.1% | | | |
| Public Fin Auth WI Revenue (Mclemore Hotel Proj.) Series 2021 A, 4.5% 6/1/2056 (g) | | 2,640,000 | 2,097,821 |
| Public Fin Auth WI Revenue (Mclemore Hotel Proj.) Series 2021 B, 6.5% 6/1/2056 (g) | | 625,000 | 520,662 |
| | | | 2,618,483 |
TOTAL WISCONSIN | | | 34,902,897 |
| TOTAL MUNICIPAL SECURITIES (Cost $2,094,186,290) | | | 2,096,938,000 |
| | | | |
| Money Market Funds - 6.2% |
| | | Yield (%) | Shares | Value ($) |
Fidelity Municipal Cash Central Fund (k)(l) (Cost $138,724,561) | | 3.99 | 138,696,822 | 138,724,561 |
| | | | | |
| TOTAL INVESTMENT IN SECURITIES - 99.3% (Cost $2,232,910,851) | 2,235,662,561 |
NET OTHER ASSETS (LIABILITIES) - 0.7% | 15,620,604 |
| NET ASSETS - 100.0% | 2,251,283,165 |
| | |
Legend
| (a) | Amount is stated in United States dollars unless otherwise noted. |
| (b) | Coupon rates for floating and adjustable rate securities reflect the rates in effect at period end. |
| (c) | Non-income producing - Security is in default. |
| (e) | Private activity obligations whose interest is subject to the federal alternative minimum tax for individuals. |
| (f) | Coupon is indexed to a floating interest rate which may be multiplied by a specified factor and/or subject to caps or floors. |
| (g) | Security exempt from registration under Rule 144A of the Securities Act of 1933. These securities may be resold in transactions exempt from registration, normally to qualified institutional buyers. At the end of the period, the value of these securities amounted to $18,305,374 or 0.8% of net assets. |
| (h) | Security initially issued in zero coupon form which converts to coupon form at a specified rate and date. The rate shown is the rate at period end. |
| (i) | Security initially issued at one coupon which converts to a higher coupon at a specified date. The rate shown is the rate at period end. |
| (j) | Security or a portion of the security purchased on a delayed delivery or when-issued basis. |
| (k) | Information in this report regarding holdings by state and security types does not reflect the holdings of the Fidelity Central Fund. |
| (l) | Affiliated fund that is generally available only to investment companies and other accounts managed by Fidelity Investments. The rate quoted is the annualized seven-day yield of the fund at period end. A complete unaudited listing of the fund's holdings as of its most recent quarter end is available upon request. In addition, each Fidelity Central Fund's financial statements, which are not covered by the Fund's Report of Independent Registered Public Accounting Firm, are available on the SEC's website or upon request. |
Affiliated Central Funds
Fiscal year to date information regarding the Fund's investments in Fidelity Central Funds, including the ownership percentage, is presented below.
| Affiliate | Value, beginning of period ($) | Purchases ($) | Sales Proceeds ($) | Dividend Income ($) | Realized Gain (loss) ($) | Change in Unrealized appreciation (depreciation) ($) | Value, end of period ($) | Shares, end of period | % ownership, end of period |
| Fidelity Municipal Cash Central Fund | 158,260,767 | 773,697,997 | 793,237,890 | 3,036,111 | 3,676 | 11 | 138,724,561 | 138,696,822 | 4.4% |
| Total | 158,260,767 | 773,697,997 | 793,237,890 | 3,036,111 | 3,676 | 11 | 138,724,561 | 138,696,822 | |
| | | | | | | | | | |
Amounts in the dividend income column in the above table include any capital gain distributions from underlying funds, which are presented in the corresponding line item in the Statement of Operations, if applicable.
Amounts included in the purchases and sales proceeds columns may include in-kind transactions, if applicable.
Investment Valuation
The following is a summary of the inputs used, as of December 31, 2024, involving the Fund's assets and liabilities carried at fair value. The inputs or methodology used for valuing securities may not be an indication of the risk associated with investing in those securities. For more information on valuation inputs, and their aggregation into the levels used below, please refer to the Investment Valuation section in the accompanying Notes to Financial Statements.
| Valuation Inputs at Reporting Date: |
| Description | Total ($) | Level 1 ($) | Level 2 ($) | Level 3 ($) |
Investments in Securities: | | | | |
|
| Municipal Securities | | | | |
Education | 206,864,835 | - | 206,864,835 | - |
Electric Utilities | 70,389,848 | - | 70,389,848 | - |
Escrowed/Pre-Refunded | 7,479,353 | - | 7,479,353 | - |
General Obligations | 624,224,698 | - | 624,224,698 | - |
Health Care | 295,985,985 | - | 295,044,443 | 941,542 |
Housing | 149,976,883 | - | 149,976,883 | - |
Industrial Development | 30,692,651 | - | 30,692,651 | - |
Other | 2,707,533 | - | 2,707,533 | - |
Special Tax | 196,782,905 | - | 196,782,905 | - |
Tobacco Bonds | 24,931,083 | - | 24,931,083 | - |
Transportation | 390,972,814 | - | 390,972,814 | - |
Water & Sewer | 95,929,412 | - | 95,929,412 | - |
|
| Money Market Funds | 138,724,561 | 138,724,561 | - | - |
| Total Investments in Securities: | 2,235,662,561 | 138,724,561 | 2,095,996,458 | 941,542 |
Financial Statements
| Statement of Assets and Liabilities |
As of December 31, 2024 |
| Assets | | | | |
| Investment in securities, at value - See accompanying schedule: | | | | |
Unaffiliated issuers (cost $2,094,186,290) | $ | 2,096,938,000 | | |
Fidelity Central Funds (cost $138,724,561) | | 138,724,561 | | |
| | | | | |
| | | | | |
| Total Investment in Securities (cost $2,232,910,851) | | | $ | 2,235,662,561 |
| Cash | | | | 100,530 |
| Receivable for investments sold | | | | 628 |
| Receivable for fund shares sold | | | | 183,744 |
| Interest receivable | | | | 24,662,230 |
| Distributions receivable from Fidelity Central Funds | | | | 395,631 |
| Prepaid expenses | | | | 1,797 |
| Other receivables | | | | 224 |
Total assets | | | | 2,261,007,345 |
| Liabilities | | | | |
| Payable for investments purchased on a delayed delivery basis | $ | 1,776,553 | | |
| Payable for fund shares redeemed | | 1,165,338 | | |
| Distributions payable | | 6,054,764 | | |
| Accrued management fee | | 622,166 | | |
| Other payables and accrued expenses | | 105,359 | | |
| Total liabilities | | | | 9,724,180 |
| Net Assets | | | $ | 2,251,283,165 |
| Net Assets consist of: | | | | |
| Paid in capital | | | $ | 2,255,032,330 |
| Total accumulated earnings (loss) | | | | (3,749,165) |
| Net Assets | | | $ | 2,251,283,165 |
Net Asset Value, offering price and redemption price per share ($2,251,283,165 ÷ 228,596,290 shares) | | | $ | 9.85 |
| Statement of Operations |
| Year ended December 31, 2024 |
| Investment Income | | | | |
| Interest | | | $ | 72,863,446 |
| Income from Fidelity Central Funds | | | | 3,036,111 |
| Total income | | | | 75,899,557 |
| Expenses | | | | |
| Management fee | $ | 6,908,907 | | |
| Custodian fees and expenses | | 21,482 | | |
| Independent trustees' fees and expenses | | 5,246 | | |
| Registration fees | | 128,223 | | |
| Audit fees | | 68,546 | | |
| Legal | | 2,055 | | |
| Miscellaneous | | 12,246 | | |
| Total expenses before reductions | | 7,146,705 | | |
| Expense reductions | | (46,188) | | |
| Total expenses after reductions | | | | 7,100,517 |
| Net Investment income (loss) | | | | 68,799,040 |
| Realized and Unrealized Gain (Loss) | | | | |
| Net realized gain (loss) on: | | | | |
| Investment Securities: | | | | |
| Unaffiliated issuers | | 863,068 | | |
| Fidelity Central Funds | | 3,676 | | |
| Total net realized gain (loss) | | | | 866,744 |
| Change in net unrealized appreciation (depreciation) on: | | | | |
| Investment Securities: | | | | |
| Unaffiliated issuers | | (33,155,543) | | |
| Fidelity Central Funds | | 11 | | |
| Total change in net unrealized appreciation (depreciation) | | | | (33,155,532) |
| Net gain (loss) | | | | (32,288,788) |
| Net increase (decrease) in net assets resulting from operations | | | $ | 36,510,252 |
| Statement of Changes in Net Assets |
| |
| | Year ended December 31, 2024 | | Year ended December 31, 2023 |
| Increase (Decrease) in Net Assets | | | | |
| Operations | | | | |
| Net investment income (loss) | $ | 68,799,040 | $ | 46,560,140 |
| Net realized gain (loss) | | 866,744 | | 3,794,109 |
| Change in net unrealized appreciation (depreciation) | | (33,155,532) | | 77,889,625 |
| Net increase (decrease) in net assets resulting from operations | | 36,510,252 | | 128,243,874 |
| Distributions to shareholders | | (66,649,568) | | (45,020,842) |
| | | | | |
| Share transactions | | | | |
| Proceeds from sales of shares | | 984,057,973 | | 1,739,362,521 |
| Reinvestment of distributions | | 22,861 | | 27,360 |
| Cost of shares redeemed | | (625,587,744) | | (1,006,088,915) |
| | | | | |
Net increase (decrease) in net assets resulting from share transactions | | 358,493,090 | | 733,300,966 |
| Total increase (decrease) in net assets | | 328,353,774 | | 816,523,998 |
| | | | | |
| Net Assets | | | | |
| Beginning of period | | 1,922,929,391 | | 1,106,405,393 |
| End of period | $ | 2,251,283,165 | $ | 1,922,929,391 |
| | | | | |
| Other Information | | | | |
| Shares | | | | |
| Sold | | 99,208,861 | | 183,901,067 |
| Issued in reinvestment of distributions | | 2,309 | | 2,825 |
| Redeemed | | (63,170,893) | | (106,852,724) |
| Net increase (decrease) | | 36,040,277 | | 77,051,168 |
| | | | | |
Financial Highlights
Fidelity® SAI Municipal Income Fund |
| |
| Years ended December 31, | | 2024 | | 2023 | | 2022 | | 2021 | | 2020 |
Selected Per-Share Data | | | | | | | | | | |
| Net asset value, beginning of period | $ | 9.99 | $ | 9.58 | $ | 10.88 | $ | 10.85 | $ | 10.70 |
| Income from Investment Operations | | | | | | | | | | |
Net investment income (loss) A,B | | .329 | | .310 | | .218 | | .203 | | .265 |
| Net realized and unrealized gain (loss) | | (.150) | | .399 | | (1.297) | | .048 | | .183 |
| Total from investment operations | | .179 | | .709 | | (1.079) | | .251 | | .448 |
| Distributions from net investment income | | (.318) | | (.299) | | (.221) | | (.207) | | (.266) |
| Distributions from net realized gain | | (.001) | | - | | - | | (.014) | | (.032) |
| Total distributions | | (.319) | | (.299) | | (.221) | | (.221) | | (.298) |
| Net asset value, end of period | $ | 9.85 | $ | 9.99 | $ | 9.58 | $ | 10.88 | $ | 10.85 |
Total Return C | | | | 7.55% | | (9.94)% | | 2.33% | | 4.27% |
Ratios to Average Net Assets B,D,E | | | | | | | | | | |
| Expenses before reductions | | .35% | | .37% | | .38% | | .36% | | .37% |
| Expenses net of fee waivers, if any | | | | .36% | | .36% | | .36% | | .36% |
| Expenses net of all reductions | | .34% | | .36% | | .36% | | .36% | | .36% |
| Net investment income (loss) | | 3.32% | | 3.22% | | 2.16% | | 1.87% | | 2.49% |
| Supplemental Data | | | | | | | | | | |
| Net assets, end of period (000 omitted) | $ | 2,251,283 | $ | 1,922,929 | $ | 1,106,405 | $ | 2,513,106 | $ | 1,586,052 |
Portfolio turnover rate F | | | | 14% | | 26% G | | 4% | | 17% |
ACalculated based on average shares outstanding during the period.
BNet investment income (loss) is affected by the timing of the declaration of dividends by any underlying mutual funds or exchange-traded funds (ETFs). Net investment income (loss) of any mutual funds or ETFs is not included in the Fund's net investment income (loss) ratio.
CTotal returns would have been lower if certain expenses had not been reduced during the applicable periods shown.
DFees and expenses of any underlying mutual funds or exchange-traded funds (ETFs) are not included in the Fund's expense ratio. The Fund indirectly bears its proportionate share of these expenses.
EExpense ratios reflect operating expenses of the class. Expenses before reductions do not reflect amounts reimbursed, waived, or reduced through arrangements with the investment adviser, brokerage services, or other offset arrangements, if applicable, and do not represent the amount paid by the class during periods when reimbursements, waivers or reductions occur.
FAmount does not include the portfolio activity of any underlying mutual funds or exchange-traded funds (ETFs), derivatives or securities that mature within one year from acquisition.
GPortfolio turnover rate excludes securities received or delivered in-kind.
Notes to Financial Statements
For the period ended December 31, 2024
1. Organization.
Fidelity SAI Municipal Income Fund (the Fund) is a fund of Fidelity Salem Street Trust (the Trust) and is authorized to issue an unlimited number of shares. Shares are offered exclusively to certain clients of Fidelity Management & Research Company LLC (FMR) or its affiliates. The Trust is registered under the Investment Company Act of 1940, as amended (the 1940 Act), as an open-end management investment company organized as a Massachusetts business trust.
2. Investments in Fidelity Central Funds.
Funds may invest in Fidelity Central Funds, which are open-end investment companies generally available only to other investment companies and accounts managed by the investment adviser and its affiliates. The Schedule of Investments lists any Fidelity Central Funds held as an investment as of period end, but does not include the underlying holdings of each Fidelity Central Fund. An investing fund indirectly bears its proportionate share of the expenses of the underlying Fidelity Central Funds.
Based on its investment objective, each Fidelity Central Fund may invest or participate in various investment vehicles or strategies that are similar to those of the investing fund. These strategies are consistent with the investment objectives of the investing fund and may involve certain economic risks which may cause a decline in value of each of the Fidelity Central Funds and thus a decline in the value of the investing fund.
| Fidelity Central Fund | Investment Manager | Investment Objective | Investment Practices | Expense RatioA |
| Fidelity Money Market Central Funds | Fidelity Management & Research Company LLC (FMR) | Each fund seeks to obtain a high level of current income consistent with the preservation of capital and liquidity. | Short-term Investments | Less than .005% |
A Expenses expressed as a percentage of average net assets and are as of each underlying Central Fund's most recent annual or semi-annual shareholder report.
A complete unaudited list of holdings for each Fidelity Central Fund is available upon request or at the Securities and Exchange Commission website at www.sec.gov. In addition, the financial statements of the Fidelity Central Funds which contain the significant accounting policies (including investment valuation policies) of those funds, and are not covered by the Report of Independent Registered Public Accounting Firm, are available on the Securities and Exchange Commission website or upon request.
3. Significant Accounting Policies.
The Fund is an investment company and applies the accounting and reporting guidance of the Financial Accounting Standards Board (FASB) Accounting Standards Codification Topic 946 Financial Services - Investment Companies. The financial statements have been prepared in conformity with accounting principles generally accepted in the United States of America (GAAP), which require management to make certain estimates and assumptions at the date of the financial statements. Actual results could differ from those estimates. The Fund operates as a single operating segment. The Fund's income, expenses, assets, and performance are regularly monitored and assessed as a whole by the investment adviser and other individuals responsible for oversight functions of the Trust, using the information presented in the financial statements and financial highlights. Subsequent events, if any, through the date that the financial statements were issued have been evaluated in the preparation of the financial statements. The Fund's Schedule of Investments lists any underlying mutual funds or exchange-traded funds (ETFs) but does not include the underlying holdings of these funds. The following summarizes the significant accounting policies of the Fund:
Investment Valuation. Investments are valued as of 4:00 p.m. Eastern time on the last calendar day of the period. The Board of Trustees (the Board) has designated the Fund's investment adviser as the valuation designee responsible for the fair valuation function and performing fair value determinations as needed. The investment adviser has established a Fair Value Committee (the Committee) to carry out the day-to-day fair valuation responsibilities and has adopted policies and procedures to govern the fair valuation process and the activities of the Committee. In accordance with these fair valuation policies and procedures, which have been approved by the Board, the Fund attempts to obtain prices from one or more third party pricing services or brokers to value its investments. When current market prices, quotations or currency exchange rates are not readily available or reliable, investments will be fair valued in good faith by the Committee, in accordance with the policies and procedures. Factors used in determining fair value vary by investment type and may include market or investment specific events, transaction data, estimated cash flows, and market observations of comparable investments. The frequency that the fair valuation procedures are used cannot be predicted and they may be utilized to a significant extent. The Committee manages the Fund's fair valuation practices and maintains the fair valuation policies and procedures. The Fund's investment adviser reports to the Board information regarding the fair valuation process and related material matters.
The Fund categorizes the inputs to valuation techniques used to value its investments into a disclosure hierarchy consisting of three levels as shown below:
Level 1 - unadjusted quoted prices in active markets for identical investments
Level 2 - other significant observable inputs (including quoted prices for similar investments, interest rates, prepayment speeds, etc.)
Level 3 - unobservable inputs (including the Fund's own assumptions based on the best information available)
Valuation techniques used to value the Fund's investments by major category are as follows:
Debt securities, including restricted securities, are valued based on evaluated prices received from third party pricing services or from brokers who make markets in such securities. Municipal securities are valued by pricing services who utilize matrix pricing which considers yield or price of bonds of comparable quality, coupon, maturity and type or by broker-supplied prices. When independent prices are unavailable or unreliable, debt securities may be valued utilizing pricing methodologies which consider similar factors that would be used by third party pricing services. Debt securities are generally categorized as Level 2 in the hierarchy but may be Level 3 depending on the circumstances.
Investments in open-end mutual funds, including the Fidelity Central Funds, are valued at their closing net asset value (NAV) each business day and are categorized as Level 1 in the hierarchy.
Changes in valuation techniques may result in transfers in or out of an assigned level within the disclosure hierarchy. The aggregate value of investments by input level as of December 31, 2024 is included at the end of the Fund's Schedule of Investments.
Investment Transactions and Income. For financial reporting purposes, the Fund's investment holdings and NAV include trades executed through the end of the last business day of the period. The NAV per share for processing shareholder transactions is calculated as of the close of business of the New York Stock Exchange (NYSE), normally 4:00 p.m. Eastern time and includes trades executed through the end of the prior business day. Gains and losses on securities sold are determined on the basis of identified cost. Income and capital gain distributions from Fidelity Central Funds, if any, are recorded on the ex-dividend date. Interest income is accrued as earned and includes coupon interest and amortization of premium and accretion of discount on debt securities as applicable. Debt obligations may be placed on non-accrual status and related interest income may be reduced by ceasing current accruals and writing off interest receivables when the collection of all or a portion of interest has become doubtful based on consistently applied procedures. A debt obligation is removed from non-accrual status when the issuer resumes interest payments or when collectability of interest is reasonably assured.
Expenses. Expenses directly attributable to a fund are charged to that fund. Expenses attributable to more than one fund are allocated among the respective funds on the basis of relative net assets or other appropriate methods. Expenses included in the accompanying financial statements reflect the expenses of that fund and do not include any expenses associated with any underlying mutual funds or exchange-traded funds. Although not included in a fund's expenses, a fund indirectly bears its proportionate share of these expenses through the net asset value of each underlying mutual fund or exchange-traded fund. Expense estimates are accrued in the period to which they relate and adjustments are made when actual amounts are known.
Income Tax Information and Distributions to Shareholders. Each year, the Fund intends to qualify as a regulated investment company under Subchapter M of the Internal Revenue Code, including distributing substantially all of its taxable income and realized gains. As a result, no provision for U.S. Federal income taxes is required. During the period, the Fund incurred a corporate tax liability on undistributed income, which is included in Miscellaneous expense on the Statement of Operations. As of December 31, 2024, the Fund did not have any unrecognized tax benefits in the financial statements; nor is the Fund aware of any tax positions for which it is reasonably possible that the total amounts of unrecognized tax benefits will significantly change in the next twelve months. The Fund files a U.S. federal tax return, in addition to state and local tax returns as required. The Fund's federal income tax returns are subject to examination by the Internal Revenue Service (IRS) for a period of three fiscal years after they are filed. State and local tax returns may be subject to examination for an additional fiscal year depending on the jurisdiction.
Distributions are declared and recorded daily and paid monthly from net investment income. Distributions from realized gains, if any, are declared and recorded on the ex-dividend date. Income and capital gain distributions are determined in accordance with income tax regulations, which may differ from GAAP.
Capital accounts within the financial statements are adjusted for permanent book-tax differences. These adjustments have no impact on net assets or the results of operations. Capital accounts are not adjusted for temporary book-tax differences which will reverse in a subsequent period.
Book-tax differences are primarily due to market discount, capital loss carryforwards and losses deferred due to wash sales.
The Fund purchases municipal securities whose interest, in the opinion of the issuer, is free from federal income tax. There is no assurance that the IRS will agree with this opinion. In the event the IRS determines that the issuer does not comply with relevant tax requirements, interest payments from a security could become federally taxable, possibly retroactively to the date the security was issued.
As of period end, the cost and unrealized appreciation (depreciation) in securities, and derivatives if applicable, for federal income tax purposes were as follows:
| Gross unrealized appreciation | $46,233,851 |
| Gross unrealized depreciation | (39,578,598) |
| Net unrealized appreciation (depreciation) | $6,655,253 |
| Tax Cost | $2,229,007,308 |
The tax-based components of distributable earnings as of period end were as follows:
| Capital loss carryforward | $(10,403,136) |
| Net unrealized appreciation (depreciation) on securities and other investments | $6,655,253 |
Capital loss carryforwards are only available to offset future capital gains of the Fund to the extent provided by regulations and may be limited. The capital loss carryforward information presented below, including any applicable limitation, is estimated as of fiscal period end and is subject to adjustment.
Short-term | $(3,269,697) |
Long-term | (7,133,439) |
| Total capital loss carryforward | $(10,403,136) |
Due to large redemptions in a prior period, Fidelity SAI Municipal Income Fund is subject to an annual limit on its use of some of its unrealized capital losses to offset capital gains in future periods. If those capital losses are realized and the limitation prevents the Fund from using any of those capital losses in a future period, those capital losses will be available to offset capital gains in subsequent periods.
The tax character of distributions paid was as follows:
| | December 31, 2024 | December 31, 2023 |
| Tax-exempt Income | 66,426,167 | 45,020,842 |
| Ordinary Income | $223,401 | $- |
| Total | $66,649,568 | $ 45,020,842 |
Delayed Delivery Transactions and When-Issued Securities. During the period, certain Funds transacted in securities on a delayed delivery or when-issued basis. Payment and delivery may take place after the customary settlement period for that security. The price of the underlying securities and the date when the securities will be delivered and paid for are fixed at the time the transaction is negotiated. Securities purchased on a delayed delivery or when-issued basis are identified as such in the Schedule of Investments. Compensation for interest forgone in the purchase of a delayed delivery or when-issued debt security may be received. With respect to purchase commitments, each applicable Fund identifies securities as segregated in its records with a value at least equal to the amount of the commitment. Payables and receivables associated with the purchases and sales of delayed delivery securities having the same coupon, settlement date and broker are offset. Delayed delivery or when-issued securities that have been purchased from and sold to different brokers are reflected as both payables and receivables in the Statement of Assets and Liabilities under the caption "Delayed delivery", as applicable. Losses may arise due to changes in the value of the underlying securities or if the counterparty does not perform under the contract's terms, or if the issuer does not issue the securities due to political, economic, or other factors.
Restricted Securities (including Private Placements). Funds may invest in securities that are subject to legal or contractual restrictions on resale. These securities generally may be resold in transactions exempt from registration or to the public if the securities are registered. Disposal of these securities may involve time-consuming negotiations and expense, and prompt sale at an acceptable price may be difficult. Information regarding restricted securities held at period end is included at the end of the Schedule of Investments, if applicable.
New Accounting Pronouncement. FASB Accounting Standards Update (ASU) 2023-07 Segment Reporting (Topic 280): Improvements to Reportable Segment Disclosures became effective in this reporting period. ASU 2023-07 enhances segment information disclosure in the notes to financial statements.
4. Purchases and Sales of Investments.
Purchases and sales of securities, other than short-term securities and in-kind transactions, as applicable, are noted in the table below.
| | Purchases ($) | Sales ($) |
| Fidelity SAI Municipal Income Fund | 571,996,248 | 195,482,232 |
5. Fees and Other Transactions with Affiliates.
Management Fee. Fidelity Management & Research Company LLC (the investment adviser) and its affiliates provide the Fund with investment management related services for which the Fund pays a monthly management fee. Effective March 1, 2024, the Fund pays a monthly management fee that is based on an annual rate of .332% of the Fund's average net assets.
Prior to March 1, 2024, the management fee was the sum of an individual fund fee rate that was based on an annual rate of .25% of the Fund's average net assets and an annualized group fee rate that averaged .10% during the period. The group fee rate was based upon the monthly average net assets of a group of registered investment companies with which the investment adviser has management contracts. The group fee rate decreased as assets under management increased and increased as assets under management decreased.
For the reporting period, the total annualized management fee rate was .33% of the Fund's average net assets.
Interfund Trades. Funds may purchase from or sell securities to other Fidelity Funds under procedures adopted by the Board. The procedures have been designed to ensure these interfund trades are executed in accordance with Rule 17a-7 of the 1940 Act. Any interfund trades are included within the respective purchases and sales amounts shown in the Purchases and Sales of Investments note. Interfund trades during the period are noted in the table below.
| | Purchases ($) | Sales ($) | Realized Gain (Loss) ($) |
| Fidelity SAI Municipal Income Fund | 94,966,129 | - | - |
Sub-Advisory Arrangements. Effective March 1, 2024, the Fund's sub-advisory agreements with FMR Investment Management (UK) Limited, Fidelity Management & Research (Hong Kong) Limited, and Fidelity Management & Research (Japan) Limited were amended to provide that the investment adviser pays each sub-adviser monthly fees equal to 110% of the sub-adviser's costs for providing sub-advisory services.
6. Committed Line of Credit.
Certain Funds participate with other funds managed by the investment adviser or an affiliate in a $4.25 billion credit facility (the "line of credit") to be utilized for temporary or emergency purposes to fund shareholder redemptions or for other short-term liquidity purposes.
Commitment fees are charged based on the unused amount of the line of credit at an annual rate of .10%, and then allocated to each participating fund based on its pro-rata portion of the line of credit. The commitment fees are reflected in Miscellaneous expenses on the Statement of Operations, and are listed below.
Interest is charged to a participating fund based on its borrowings at an annual rate of .75% plus the highest of (i) daily SOFR plus a .10% spread adjustment, (ii) Federal Funds Effective Rate, or (iii) Overnight Bank Funding Rate. During the period, there were no borrowings on this line of credit.
The line of credit agreement will expire in March 2025 unless extended or renewed.
| | Amount ($) |
| Fidelity SAI Municipal Income Fund | 3,126 |
7. Expense Reductions.
Through arrangements with the Fund's custodian, credits realized as a result of certain uninvested cash balances were used to reduce the Fund's expenses by $610.
In addition, during the period the investment adviser or an affiliate reimbursed and/or waived a portion of operating expenses in the amount of $45,578.
8. Other.
A fund's organizational documents provide former and current trustees and officers with a limited indemnification against liabilities arising in connection with the performance of their duties to the fund. In the normal course of business, a fund may also enter into contracts that provide general indemnifications. A fund's maximum exposure under these arrangements is unknown as this would be dependent on future claims that may be made against a fund. The risk of material loss from such claims is considered remote.
9. Risk and Uncertainties.
Many factors affect a fund's performance. Developments that disrupt global economies and financial markets, such as pandemics, epidemics, outbreaks of infectious diseases, war, terrorism, and environmental disasters, may significantly affect a fund's investment performance. The effects of these developments to a fund will be impacted by the types of securities in which a fund invests, the financial condition, industry, economic sector, and geographic location of an issuer, and a fund's level of investment in the securities of that issuer. Significant concentrations in security types, issuers, industries, sectors, and geographic locations may magnify the factors that affect a fund's performance.
Report of Independent Registered Public Accounting Firm
To the Board of Trustees of Fidelity Salem Street Trust and Shareholders of Fidelity SAI Municipal Income Fund
Opinion on the Financial Statements
We have audited the accompanying statement of assets and liabilities, including the schedule of investments, of Fidelity SAI Municipal Income Fund (one of the funds constituting Fidelity Salem Street Trust, referred to hereafter as the "Fund") as of December 31, 2024, the related statement of operations for the year ended December 31, 2024, the statement of changes in net assets for each of the two years in the period ended December 31, 2024, including the related notes, and the financial highlights for each of the five years in the period ended December 31, 2024 (collectively referred to as the "financial statements"). In our opinion, the financial statements present fairly, in all material respects, the financial position of the Fund as of December 31, 2024, the results of its operations for the year then ended, the changes in its net assets for each of the two years in the period ended December 31, 2024 and the financial highlights for each of the five years in the period ended December 31, 2024 in conformity with accounting principles generally accepted in the United States of America.
Basis for Opinion
These financial statements are the responsibility of the Fund's management. Our responsibility is to express an opinion on the Fund's financial statements based on our audits. We are a public accounting firm registered with the Public Company Accounting Oversight Board (United States) (PCAOB) and are required to be independent with respect to the Fund in accordance with the U.S. federal securities laws and the applicable rules and regulations of the Securities and Exchange Commission and the PCAOB.
We conducted our audits of these financial statements in accordance with the standards of the PCAOB. Those standards require that we plan and perform the audit to obtain reasonable assurance about whether the financial statements are free of material misstatement, whether due to error or fraud.
Our audits included performing procedures to assess the risks of material misstatement of the financial statements, whether due to error or fraud, and performing procedures that respond to those risks. Such procedures included examining, on a test basis, evidence regarding the amounts and disclosures in the financial statements. Our audits also included evaluating the accounting principles used and significant estimates made by management, as well as evaluating the overall presentation of the financial statements. Our procedures included confirmation of securities owned as of December 31, 2024 by correspondence with the custodian and brokers; when replies were not received from brokers, we performed other auditing procedures. We believe that our audits provide a reasonable basis for our opinion.
/s/ PricewaterhouseCoopers LLP
Boston, Massachusetts
February 11, 2025
We have served as the auditor of one or more investment companies in the Fidelity group of funds since 1932.
Distributions
(Unaudited)
The dividend and capital gains distributions for the fund(s) are available on Fidelity.com or Institutional.Fidelity.com.
During fiscal year ended 2024, 100% of the fund's income dividends was free from federal income tax, and 16.21% of the fund's income dividends was subject to the federal alternative minimum tax.
The fund will notify shareholders in January 2025 of amounts for use in preparing 2024 income tax returns.
Item 8: Changes in and Disagreements with Accountants for Open-End Management Investment Companies
(Unaudited)
Note: This is not applicable for any fund included in this document.
Item 9: Proxy Disclosures for Open-End Management Investment Companies
(Unaudited)
Note: This is not applicable for any fund included in this document.
Item 10: Remuneration Paid to Directors, Officers, and others of Open-End Management Investment Companies
(Unaudited)
Note: This information is disclosed as part of the financial statements for each Fund as part of Item 7: Financial Statements and Financial Highlights for Open-End Management Investment companies.
Item 11: Statement Regarding Basis for Approval of Investment Advisory Contract
(Unaudited)
Board Approval of Investment Advisory Contracts and Management Fees
Fidelity SAI Municipal Income Fund
Each year, the Board of Trustees, including the Independent Trustees (together, the Board), considers the renewal of the fund's management contract with Fidelity Management & Research Company LLC (FMR) and the sub-advisory agreements (together, the Advisory Contracts) for the fund. FMR and the sub-advisers are referred to herein as the Investment Advisers. The Board, assisted by the advice of fund counsel and Independent Trustees' counsel, requests and considers a broad range of information relevant to the renewal of the Advisory Contracts throughout the year.
The Board meets regularly and, at each of its meetings, covers an extensive agenda of topics and materials and considers factors that are relevant to its annual consideration of the renewal of the fund's Advisory Contracts, including the services and support provided to the fund and its shareholders. The Board's Operations Committee, of which all the Independent Trustees are members, meets regularly throughout the year and requests, receives and considers, among other matters, information related to the annual consideration of the renewal of the fund's Advisory Contracts before making its recommendation to the Board. The Board also meets as needed to review matters specifically related to the Board's annual consideration of the renewal of the Advisory Contracts. Members of the Board may also meet from time to time with trustees of other Fidelity funds through joint ad hoc committees to discuss certain matters relevant to all of the Fidelity funds.
At its September 2024 meeting, the Board unanimously determined to renew the fund's Advisory Contracts. In reaching its determination, the Board considered all factors it believed relevant, including (i) the nature, extent, and quality of the services provided to the fund and its shareholders (including the investment performance of the fund); (ii) the competitiveness relative to peer funds of the fund's management fee and the total expense ratio; (iii) the total costs of the services provided by and the profits realized by FMR and its affiliates (Fidelity) from its relationships with the fund; and (iv) the extent to which, if any, economies of scale exist and are realized as the fund grows, and whether any economies of scale are appropriately shared with fund shareholders. The Board also considered the broad range of investment choices available to shareholders from FMR's competitors and that the fund's shareholders have chosen to invest in the fund, which is part of the Fidelity family of funds. The Board's decision to renew the Advisory Contracts was not based on any single factor and the factors may have been weighed differently by different Trustees.
The Board reached a determination, with the assistance of fund counsel and Independent Trustees' counsel and through the exercise of its business judgment, that the renewal of the Advisory Contracts was in the best interests of the fund and its shareholders and that the compensation payable under the Advisory Contracts was fair and reasonable in light of all of the surrounding circumstances.
Nature, Extent, and Quality of Services Provided. The Board considered Fidelity's staffing as it relates to the fund, including the backgrounds and experience of investment personnel, and also considered the Investment Advisers' implementation of the fund's investment program. The Independent Trustees also had discussions with senior management of Fidelity's investment operations and investment groups. The Board considered the structure of the investment personnel compensation program and whether this structure provides appropriate incentives to act in the best interests of the fund. Additionally, the Board considered the portfolio managers' investments, if any, in the funds that they manage.
Resources Dedicated to Investment Management and Support Services. The Board reviewed the general qualifications and capabilities of Fidelity's investment staff, including its size, education, experience, and resources, as well as Fidelity's approach to recruiting, training, managing, and compensating investment personnel. The Board noted the resources devoted to Fidelity's global investment organization, and that Fidelity's analysts have extensive resources, tools and capabilities that allow them to conduct quantitative and fundamental analysis, as well as credit analysis of issuers, counterparties and guarantors. Further, the Board considered that Fidelity's investment professionals have sufficient access to global information and data so as to provide competitive investment results over time, and that those professionals also have access to sophisticated tools that permit them to assess portfolio construction and risk and performance attribution characteristics continuously, as well as to transmit new information and research conclusions rapidly around the world. Additionally, in its deliberations, the Board considered Fidelity's trading, risk management, compliance, cybersecurity, and technology and operations capabilities and resources, which are integral parts of the investment management process.
Shareholder and Administrative Services. The Board considered (i) the nature, extent, quality, and cost of advisory, administrative, and shareholder services performed by the Investment Advisers and their affiliates under the Advisory Contracts and under separate agreements covering transfer agency and pricing and bookkeeping services for the fund; (ii) the nature and extent of Fidelity's supervision of third party service providers, principally custodians, subcustodians, and pricing vendors; and (iii) the resources devoted by Fidelity to, and the record of compliance with, the fund's compliance policies and procedures, including with respect to liquidity risk management.
The Board noted that the growth of fund assets over time across the complex allows Fidelity to reinvest in the development of services designed to enhance the value and convenience of the Fidelity funds as investment vehicles. These services include 24-hour access to account information and market information over the Internet and through telephone representatives, investor education materials and asset allocation tools. The Board also considered that it reviews customer service metrics such as telephone response times, continuity of services on the website and metrics addressing services at Fidelity Investor Centers.
Investment in a Large Fund Family. The Board considered the benefits to shareholders of investing in a fund that is part of a large family of funds offering a variety of investment disciplines and providing a large variety of fund investor services. The Board noted that Fidelity had taken, or had made recommendations to the Board that resulted in the Fidelity funds taking, a number of actions over the previous year that benefited particular funds and/or the Fidelity funds in general.
Investment Performance. The Board took into account discussions that occur with representatives of the Investment Advisers, and reports that it receives, at Board meetings throughout the year relating to fund investment performance. In this regard the Board noted that as part of regularly scheduled fund reviews and other reports to the Board on fund performance, the Board considered annualized return information for the fund for different time periods, measured against an appropriate securities market index (benchmark index). The Board also considered information about performance attribution. In its evaluation of fund investment performance at meetings throughout the year, the Board gave particular attention to information indicating underperformance of certain Fidelity funds over different time periods and discussed with the Investment Advisers the reasons for such underperformance.
In addition to reviewing absolute and relative fund performance, the Independent Trustees periodically consider the appropriateness of fund performance metrics in evaluating the results achieved. The Independent Trustees generally give greater weight to fund performance over longer time periods than over shorter time periods. Depending on the circumstances, the Independent Trustees may be satisfied with a fund's performance notwithstanding that it lags its benchmark index for certain periods.
Based on its review, the Board concluded that the nature, extent, and quality of services provided to the fund under the Advisory Contracts should continue to benefit the shareholders of the fund.
Competitiveness of Management Fee and Total Expense Ratio. The Board was provided with information regarding industry trends in management fees and expenses. The Board considered that, effective March 1, 2024, an amended Advisory Contract with FMR went into effect with a fixed management fee rate (the management fee). In its review of the fund's management fee and total expense ratio, the Board considered a pro forma management fee rate as if the new management fee structure had been in effect for the 12-month period ended December 31, 2023, as well as other third-party fund expenses, as applicable, such as custodial, legal, and audit fees. The Board also noted that Fidelity may agree to waive fees or reimburse expenses from time to time, and the extent to which, if any, it has done so for the fund.
Comparisons of Management Fees and Total Expense Ratios. Among other things, the Board reviewed data for selected groups of competitive funds and classes (referred to as "mapped groups") that were compiled by Fidelity based on combining similar investment objective categories (as classified by Morningstar) that have comparable investment mandates. The data reviewed by the Board included (i) gross management fee comparisons (before taking into account expense reimbursements or caps) relative to the total universe of funds within the mapped group; (ii) gross management fee comparisons relative to a subset of non-Fidelity funds in the mapped group that are similar in size and management fee structure to the fund (referred to as the "asset size peer group"); (iii) total expense comparisons of the fund relative to funds and classes in the mapped group that have a similar sales load structure to the fund (referred to as the "similar sales load structure group"); and (iv) total expense comparisons of the fund relative to funds and classes in the similar sales load structure group that are similar in size and management fee structure to the fund (referred to as the "total expense asset size peer group"). The total expense asset size peer group comparison excludes performance adjustments and fund-paid 12b-1 fees to eliminate variability in fee structures.
The information provided to the Board indicated that the fund's management fee rate ranked below the competitive median of the mapped group for 2023 and below the competitive median of the asset size peer group for 2023. Further, the information provided to the Board indicated that the total expense ratio of the fund ranked below the competitive median of the similar sales load structure group for 2023 and below the competitive median of the total expense asset size peer group for 2023.
Fees Charged to Other Fidelity Clients. The Board also considered Fidelity fee structures and other information with respect to clients of Fidelity, such as other funds advised or subadvised by Fidelity, pension plan clients, and other institutional clients with similar mandates. The Board noted that a joint ad hoc committee created by it and the boards of other Fidelity funds periodically reviews and compares Fidelity's institutional investment advisory business with its business of providing services to the Fidelity funds and also noted the most recent findings of the committee. The Board noted that the committee's review included a consideration of the differences in services provided, fees charged, and costs incurred, as well as competition in the markets serving the different categories of clients.
Based on its review, the Board concluded that the fund's management fee is fair and reasonable in light of the services that the fund receives and the other factors considered. Further, based on its review of total expense ratios and fees charged to other Fidelity clients, the Board concluded that the fund's total expense ratio was reasonable in light of the services that the fund and its shareholders receive and the other factors considered.
Costs of the Services and Profitability. The Board considered the revenues earned and the expenses incurred by Fidelity in conducting the business of developing, marketing, distributing, managing, administering and servicing the fund and servicing the fund's shareholders. The Board also considered the level of Fidelity's profits in respect of all the Fidelity funds.
On an annual basis, Fidelity presents to the Board information about the profitability of its relationships with the fund. Fidelity calculates profitability information for each Fidelity fund, as well as aggregate profitability information for groups of Fidelity funds and all Fidelity funds, using a series of detailed revenue and cost allocation methodologies which originate with the books and records of Fidelity on which Fidelity's audited financial statements are based. The Audit Committee of the Board reviews any significant changes from the prior year's methodologies.
A public accounting firm has been engaged annually by the Board as part of the Board's assessment of Fidelity's profitability analysis. The engagement includes the review and assessment of the methodologies used by Fidelity in determining the revenues and expenses attributable to Fidelity's fund business. After considering the reports issued under the engagement and information provided by Fidelity, the Board concluded that while other allocation methods may also be reasonable, Fidelity's profitability methodologies are reasonable in all material respects.
The Board also reviewed Fidelity's non-fund businesses and potential indirect benefits such businesses may have received as a result of their association with Fidelity's fund business (i.e., fall-out benefits) as well as cases where Fidelity's affiliates may benefit from the funds' business. The Board considered areas where potential indirect benefits to the Fidelity funds from their relationships with Fidelity may exist. The Board's consideration of these matters was informed by the findings of a joint ad hoc committee created by it and the boards of other Fidelity funds to evaluate potential fall-out benefits.
The Board considered the costs of the services provided by and the profits realized by Fidelity in connection with the operation of the fund and was satisfied that the profitability was not excessive.
Economies of Scale. The Board considered whether there have been economies of scale in respect of the management of the Fidelity funds, whether the Fidelity funds (including the fund) have appropriately benefited from any such economies of scale, and whether there is potential for realization of any further economies of scale. The Board considered the extent to which the fund will benefit from economies of scale as assets grow through increased services to the fund, through waivers or reimbursements, or through fee or expense ratio reductions. The Board also noted that a committee created by it and the boards of other Fidelity funds periodically analyzes whether Fidelity attains economies of scale in respect of the management and servicing of the Fidelity funds, whether the Fidelity funds have appropriately benefited from such economies of scale, and whether there is potential for realization of any further economies of scale.
The Board concluded, taking into account the analysis of the committee, that economies of scale, if any, are being appropriately shared between fund shareholders and Fidelity.
Additional Information Requested by the Board. In order to develop fully the factual basis for consideration of the Fidelity funds' advisory contracts, the Board requested and received additional information on certain topics, including: (i) portfolio manager changes that have occurred during the past year; (ii) hiring, training, compensating, and retaining adviser and sub-adviser personnel; (iii) the terms of the funds' various management fee structures and arrangements for transfer agent and pricing and bookkeeping services; (iv) Fidelity's fund profitability methodology, profitability trends for certain funds, the allocation of various costs to different funds, and the impact of certain factors on fund profitability results; (v) the impact on fund profitability of recent industry trends, such as the growth in passively managed funds and the changes in flows for different types of funds; (vi) the types of management fee and total expense comparisons provided, and the challenges and limitations associated with such information; (vii) explanations regarding the relative total expense ratios and management fees of certain funds and classes, total expense and management fee competitive trends, and methodologies for total expense and management fee competitive comparisons; (viii) matters related to money market funds, exchange-traded funds, and target date funds; (ix) the arrangements with and compensation paid to certain fund sub-advisers and the treatment of such compensation within Fidelity's fund profitability methodology; and (x) the terms of management contracts between Fidelity and other funds and products not overseen by the Board.
Conclusion. Based on its evaluation of all of the conclusions noted above, and after considering all factors it believed relevant, the Board, including the Independent Trustees, concluded that the advisory and sub-advisory fee arrangements are fair and reasonable in light of all of the surrounding circumstances and that the fund's Advisory Contracts should be renewed through September 30, 2025.
1.9887613.106
SIM-ANN-0325
Fidelity® SAI International Credit Fund
Annual Report
December 31, 2024
Offered exclusively to certain clients of the Adviser, or its affiliates, including Strategic Advisers LLC (Strategic Advisers) - not available for sale to the general public. Fidelity® SAI is a product name of Fidelity® funds dedicated to certain programs affiliated with Strategic Advisers.
Contents
To view a fund's proxy voting guidelines and proxy voting record for the 12-month period ended June 30, visit http://www.fidelity.com/proxyvotingresults or visit the Securities and Exchange Commission's (SEC) web site at http://www.sec.gov.
You may also call 1-800-544-3455 to request a free copy of the proxy voting guidelines.
Standard & Poor's, S&P and S&P 500 are registered service marks of The McGraw-Hill Companies, Inc. and have been licensed for use by Fidelity Distributors Corporation.
Other third-party marks appearing herein are the property of their respective owners.
All other marks appearing herein are registered or unregistered trademarks or service marks of FMR LLC or an affiliated company. © 2025 FMR LLC. All rights reserved.
This report and the financial statements contained herein are submitted for the general information of the shareholders of the Fund. This report is not authorized for distribution to prospective investors in the Fund unless preceded or accompanied by an effective prospectus.
A fund files its complete schedule of portfolio holdings with the SEC for the first and third quarters of each fiscal year on Form N-PORT. Forms N-PORT are available on the SEC's web site at http://www.sec.gov. A fund's Forms N-PORT may be reviewed and copied at the SEC's Public Reference Room in Washington, DC. Information regarding the operation of the SEC's Public Reference Room may be obtained by calling 1-800-SEC-0330.
For a complete list of a fund's portfolio holdings, view the most recent holdings listing, semiannual report, or annual report on Fidelity's web site at http://www.fidelity.com, http://www.institutional.fidelity.com, or http://www.401k.com, as applicable.
NOT FDIC INSURED •MAY LOSE VALUE •NO BANK GUARANTEE
Neither the Fund nor Fidelity Distributors Corporation is a bank.
Item 7: Financial Statements and Financial Highlights for Open-End Management Investment Companies (Annual Report)
Fidelity® SAI International Credit Fund
Schedule of Investments December 31, 2024
Showing Percentage of Net Assets
| Foreign Government and Government Agency Obligations - 8.9% |
| | | Principal Amount (a) | Value ($) |
| AUSTRALIA - 0.9% | | | |
| Australian Commonwealth 1.75% 11/21/2032 (b) | AUD | 12,670,000 | 6,527,996 |
| CANADA - 3.3% | | | |
| Canadian Government 1.5% 12/1/2031 | CAD | 850,000 | 532,707 |
| Canadian Government 1.5% 6/1/2031 | CAD | 4,300,000 | 2,718,592 |
| Canadian Government 2% 6/1/2032 | CAD | 16,500,000 | 10,617,761 |
| Canadian Government 2.75% 6/1/2033 | CAD | 780,000 | 525,459 |
| Canadian Government 3% 6/1/2034 | CAD | 6,775,000 | 4,630,452 |
| Canadian Government 3.25% 12/1/2033 | CAD | 6,200,000 | 4,330,906 |
TOTAL CANADA | | | 23,355,877 |
| GERMANY - 2.1% | | | |
| German Federal Republic 2.5% 7/4/2044 (b) | EUR | 11,140,000 | 11,386,963 |
| German Federal Republic 2.6% 5/15/2041 (b) | EUR | 830,000 | 859,069 |
| German Federal Republic 3.25% 7/4/2042 (b) | EUR | 2,350,000 | 2,654,829 |
TOTAL GERMANY | | | 14,900,861 |
| JAPAN - 2.6% | | | |
| Japan Government 0.005% 2/1/2025 | JPY | 1,050,850,000 | 6,678,235 |
| Japan Government 0.005% 4/1/2025 | JPY | 270,000,000 | 1,715,374 |
| Japan Government 0.1% 3/20/2025 | JPY | 320,000,000 | 2,033,503 |
| Japan Government 0.4% 6/20/2025 | JPY | 647,500,000 | 4,117,918 |
| Japan Government 0.9% 9/20/2034 | JPY | 295,250,000 | 1,844,569 |
| Japan Government 2.1% 3/20/2025 | JPY | 303,300,000 | 1,935,515 |
TOTAL JAPAN | | | 18,325,114 |
| TOTAL FOREIGN GOVERNMENT AND GOVERNMENT AGENCY OBLIGATIONS (Cost $64,910,520) | | | 63,109,848 |
| | | | |
| Non-Convertible Corporate Bonds - 54.5% |
| | | Principal Amount (a) | Value ($) |
| AUSTRALIA - 0.7% | | | |
| Financials - 0.7% | | | |
| Financial Services - 0.3% | | | |
| Cimic Finance Ltd 1.5% 5/28/2029 (b) | EUR | 2,689,000 | 2,515,974 |
| Insurance - 0.4% | | | |
| QBE Insurance Group Ltd 2.5% 9/13/2038 (b)(c) | GBP | 2,384,000 | 2,662,977 |
| TOTAL AUSTRALIA | | | 5,178,951 |
| BELGIUM - 0.6% | | | |
| Financials - 0.6% | | | |
| Banks - 0.6% | | | |
| KBC Group NV 6.324% 9/21/2034 (c)(d) | | 3,990,000 | 4,127,292 |
| CZECH REPUBLIC - 0.7% | | | |
| Real Estate - 0.7% | | | |
| Real Estate Management & Development - 0.7% | | | |
| CPI Property Group SA 1.5% 1/27/2031 (b) | EUR | 2,375,000 | 1,947,376 |
| CPI Property Group SA 6% 1/27/2032 (b) | EUR | 3,095,000 | 3,204,353 |
| | | | |
| TOTAL CZECH REPUBLIC | | | 5,151,729 |
| DENMARK - 2.2% | | | |
| Consumer Staples - 0.2% | | | |
| Tobacco - 0.2% | | | |
| Scandinavian Tobacco Group A/S 4.875% 9/12/2029 (b) | EUR | 1,630,000 | 1,722,387 |
| Financials - 1.7% | | | |
| Banks - 1.7% | | | |
| Danske Bank A/S 3.875% 1/9/2032 (b)(c) | EUR | 7,880,000 | 8,403,496 |
| Jyske Bank A/S 5% 10/26/2028 (b)(c) | EUR | 910,000 | 988,024 |
| Jyske Bank A/S 5.125% 5/1/2035 (b)(c) | EUR | 1,553,000 | 1,699,942 |
| | | | 11,091,462 |
| Industrials - 0.3% | | | |
| Transportation Infrastructure - 0.3% | | | |
| DSV Finance BV 3.25% 11/6/2030 (b) | EUR | 2,320,000 | 2,427,819 |
| TOTAL DENMARK | | | 15,241,668 |
| FINLAND - 0.4% | | | |
| Financials - 0.3% | | | |
| Banks - 0.3% | | | |
| Nordea Bank Abp 4.125% 5/5/2028 (b) | EUR | 2,220,000 | 2,384,058 |
| Real Estate - 0.1% | | | |
| Real Estate Management & Development - 0.1% | | | |
| Citycon Treasury BV 5% 3/11/2030 (b) | EUR | 700,000 | 729,123 |
| TOTAL FINLAND | | | 3,113,181 |
| FRANCE - 3.9% | | | |
| Consumer Discretionary - 0.3% | | | |
| Automobiles - 0.3% | | | |
| RCI Banque SA 5.5% 10/9/2034 (b)(c) | EUR | 2,300,000 | 2,435,846 |
| Financials - 2.1% | | | |
| Banks - 2.1% | | | |
| BNP Paribas SA 2.159% 9/15/2029 (c)(d) | | 2,555,000 | 2,287,721 |
| BNP Paribas SA 2.5% 3/31/2032 (b)(c) | EUR | 3,400,000 | 3,428,437 |
| BNP Paribas SA 4.125% 5/24/2033 (b) | EUR | 1,000,000 | 1,093,409 |
| BPCE SA 5.716% 1/18/2030 (c)(d) | | 3,785,000 | 3,804,081 |
| Societe Generale SA 4.75% 11/24/2025 (d) | | 255,000 | 253,622 |
| Societe Generale SA 6.691% 1/10/2034 (c)(d) | | 3,940,000 | 4,040,954 |
| | | | 14,908,224 |
| Utilities - 1.5% | | | |
| Electric Utilities - 0.4% | | | |
| Electricite de France SA 4.75% 10/12/2034 (b) | EUR | 1,300,000 | 1,458,952 |
| Electricite de France SA 5.5% 1/25/2035 (b) | GBP | 1,400,000 | 1,676,172 |
| | | | 3,135,124 |
| Multi-Utilities - 1.1% | | | |
| Engie SA 3.875% 3/6/2036 (b) | EUR | 1,600,000 | 1,689,682 |
| Engie SA 4.25% 9/6/2034 (b) | EUR | 5,200,000 | 5,639,663 |
| | | | 7,329,345 |
| TOTAL FRANCE | | | 27,808,539 |
| GERMANY - 11.8% | | | |
| Consumer Discretionary - 1.0% | | | |
| Automobile Components - 1.0% | | | |
| Robert Bosch GmbH 4.375% 6/2/2043 (b) | EUR | 1,500,000 | 1,620,525 |
| Schaeffler AG 4.75% 8/14/2029 (b) | EUR | 3,300,000 | 3,499,593 |
| ZF Europe Finance BV 2% 2/23/2026 (b) | EUR | 900,000 | 906,651 |
| ZF Finance GmbH 2% 5/6/2027 (b) | EUR | 1,100,000 | 1,070,926 |
| | | | 7,097,695 |
| Financials - 5.1% | | | |
| Banks - 0.4% | | | |
| Commerzbank AG 4.875% 10/16/2034 (b)(c) | EUR | 700,000 | 751,518 |
| Commerzbank AG 8.625% 2/28/2033 (b)(c) | GBP | 1,500,000 | 2,014,535 |
| | | | 2,766,053 |
| Capital Markets - 0.8% | | | |
| Deutsche Bank AG 3.25% 5/24/2028 (b)(c) | EUR | 100,000 | 103,716 |
| Deutsche Bank AG 4.5% 7/12/2035 (b)(c) | EUR | 3,000,000 | 3,214,158 |
| Deutsche Bank AG 6.125% 12/12/2030 (b)(c) | GBP | 1,700,000 | 2,194,624 |
| | | | 5,512,498 |
| Financial Services - 3.9% | | | |
| KfW 0.75% 1/15/2029 (b) | EUR | 18,000,000 | 17,479,757 |
| KfW 4% 3/15/2029 | | 9,475,000 | 9,323,324 |
| | | | 26,803,081 |
TOTAL FINANCIALS | | | 35,081,632 |
| | | | |
| Health Care - 1.5% | | | |
| Pharmaceuticals - 1.5% | | | |
| Bayer AG 4.625% 5/26/2033 (b) | EUR | 940,000 | 1,019,744 |
| Bayer US Finance LLC 6.375% 11/21/2030 (d) | | 1,750,000 | 1,800,339 |
| Bayer US Finance LLC 6.5% 11/21/2033 (d) | | 7,835,000 | 7,971,400 |
| | | | 10,791,483 |
| Real Estate - 0.8% | | | |
| Real Estate Management & Development - 0.8% | | | |
| Aroundtown SA 3% 10/16/2029 (b) | GBP | 300,000 | 325,319 |
| Aroundtown SA 3.625% 4/10/2031 (b) | GBP | 2,910,000 | 3,133,913 |
| Sirius Real Estate Ltd 1.125% 6/22/2026 (b) | EUR | 2,400,000 | 2,412,378 |
| | | | 5,871,610 |
| Utilities - 3.4% | | | |
| Electric Utilities - 2.7% | | | |
| Amprion GmbH 0.625% 9/23/2033 (b) | EUR | 4,200,000 | 3,431,273 |
| Amprion GmbH 3.125% 8/27/2030 (b) | EUR | 1,700,000 | 1,753,671 |
| Amprion GmbH 3.625% 5/21/2031 (b) | EUR | 500,000 | 528,391 |
| Amprion GmbH 4.125% 9/7/2034 (b) | EUR | 1,400,000 | 1,521,750 |
| EnBW Energie Baden-Wuerttemberg AG 1.375% 8/31/2081 (b)(c) | EUR | 3,700,000 | 3,514,842 |
| EnBW International Finance BV 3.5% 7/22/2031 (b) | EUR | 1,145,000 | 1,205,949 |
| EnBW International Finance BV 3.75% 11/20/2035 (b) | EUR | 6,950,000 | 7,216,609 |
| | | | 19,172,485 |
| Independent Power and Renewable Electricity Producers - 0.7% | | | |
| RWE Finance US LLC 5.875% 4/16/2034 (d) | | 5,166,000 | 5,181,803 |
TOTAL UTILITIES | | | 24,354,288 |
| | | | |
| TOTAL GERMANY | | | 83,196,708 |
| HONG KONG - 0.2% | | | |
| Financials - 0.2% | | | |
| Insurance - 0.2% | | | |
| Prudential Funding Asia PLC 2.95% 11/3/2033 (b)(c) | | 1,828,000 | 1,662,383 |
| IRELAND - 0.6% | | | |
| Financials - 0.6% | | | |
| Banks - 0.6% | | | |
| AIB Group PLC 5.25% 10/23/2031 (b)(c) | EUR | 3,345,000 | 3,805,589 |
| AIB Group PLC 6.608% 9/13/2029 (c)(d) | | 204,000 | 213,213 |
| | | | |
| TOTAL IRELAND | | | 4,018,802 |
| ITALY - 0.7% | | | |
| Financials - 0.3% | | | |
| Banks - 0.3% | | | |
| Intesa Sanpaolo SpA 6.625% 6/20/2033 (d) | | 2,020,000 | 2,111,996 |
| Utilities - 0.4% | | | |
| Electric Utilities - 0.4% | | | |
| Enel Finance International NV 5.5% 6/26/2034 (d) | | 1,435,000 | 1,419,761 |
| Enel SpA 3.375% (b)(c)(e) | EUR | 1,370,000 | 1,410,245 |
| | | | 2,830,006 |
| TOTAL ITALY | | | 4,942,002 |
| LUXEMBOURG - 3.5% | | | |
| Financials - 0.3% | | | |
| Financial Services - 0.3% | | | |
| CBRE Global Investors Open-Ended Funds SCA SICAV-SIF-Pan European Core Fund 4.75% 3/27/2034 (b) | EUR | 1,835,000 | 2,016,311 |
| Titanium 2l Bondco Sarl 6.25% 1/14/2031 pay-in-kind | EUR | 859,900 | 298,393 |
| | | | 2,314,704 |
| Real Estate - 3.2% | | | |
| Industrial REITs - 0.2% | | | |
| Prologis International Funding II SA 4.375% 7/1/2036 (b) | EUR | 1,560,000 | 1,698,774 |
| Real Estate Management & Development - 3.0% | | | |
| Blackstone Property Partners Europe Holdings Sarl 1% 5/4/2028 (b) | EUR | 7,314,000 | 6,969,770 |
| Blackstone Property Partners Europe Holdings Sarl 1.625% 4/20/2030 (b) | EUR | 3,720,000 | 3,435,658 |
| Blackstone Property Partners Europe Holdings Sarl 1.75% 3/12/2029 (b) | EUR | 1,807,000 | 1,740,082 |
| Logicor Financing Sarl 1.625% 1/17/2030 (b) | EUR | 600,000 | 564,741 |
| Logicor Financing Sarl 2% 1/17/2034 (b) | EUR | 6,260,000 | 5,507,349 |
| P3 Group Sarl 4% 4/19/2032 (b) | EUR | 2,310,000 | 2,404,916 |
| | | | 20,622,516 |
| TOTAL LUXEMBOURG | | | 24,635,994 |
| MEXICO - 0.7% | | | |
| Energy - 0.7% | | | |
| Oil, Gas & Consumable Fuels - 0.7% | | | |
| Petroleos Mexicanos 5.95% 1/28/2031 | | 6,110,000 | 5,139,549 |
| NETHERLANDS - 4.3% | | | |
| Communication Services - 0.5% | | | |
| Diversified Telecommunication Services - 0.2% | | | |
| Koninklijke KPN NV 3.875% 2/16/2036 (b) | EUR | 1,300,000 | 1,375,583 |
| Entertainment - 0.3% | | | |
| Universal Music Group NV 4% 6/13/2031 (b) | EUR | 2,210,000 | 2,385,479 |
TOTAL COMMUNICATION SERVICES | | | 3,761,062 |
| | | | |
| Consumer Staples - 0.5% | | | |
| Consumer Staples Distribution & Retail - 0.5% | | | |
| REWE International Finance BV 4.875% 9/13/2030 (b) | EUR | 3,100,000 | 3,447,603 |
| Financials - 3.1% | | | |
| Banks - 2.4% | | | |
| ABN AMRO Bank NV 3.875% 1/15/2032 (b) | EUR | 3,500,000 | 3,729,866 |
| Cooperatieve Rabobank UA 1.125% 5/7/2031 (b) | EUR | 700,000 | 638,126 |
| Cooperatieve Rabobank UA 3.822% 7/26/2034 (b) | EUR | 2,400,000 | 2,567,971 |
| Cooperatieve Rabobank UA 4% 1/10/2030 (b) | EUR | 500,000 | 539,633 |
| ING Groep NV 4.5% 5/23/2029 (b)(c) | EUR | 4,100,000 | 4,435,169 |
| ING Groep NV 4.75% 5/23/2034 (b)(c) | EUR | 3,900,000 | 4,374,740 |
| | | | 16,285,505 |
| Insurance - 0.7% | | | |
| Argentum Netherlands BV 5.625% 8/15/2052 (b)(c) | | 3,590,000 | 3,581,538 |
| Argentum Netherlands BV 5.75% 8/15/2050 (b)(c) | | 1,492,000 | 1,488,457 |
| | | | 5,069,995 |
TOTAL FINANCIALS | | | 21,355,500 |
| | | | |
| Industrials - 0.2% | | | |
| Transportation Infrastructure - 0.2% | | | |
| Royal Schiphol Group NV 3.375% 9/17/2036 (b) | EUR | 1,570,000 | 1,618,670 |
| TOTAL NETHERLANDS | | | 30,182,835 |
| NORWAY - 0.1% | | | |
| Financials - 0.1% | | | |
| Banks - 0.1% | | | |
| DNB Bank ASA 0.25% 2/23/2029 (b)(c) | EUR | 1,110,000 | 1,055,916 |
| POLAND - 0.5% | | | |
| Real Estate - 0.5% | | | |
| Real Estate Management & Development - 0.5% | | | |
| GTC Aurora Luxembourg SA 2.25% 6/23/2026 (b) | EUR | 4,068,000 | 3,836,278 |
| PORTUGAL - 0.4% | | | |
| Financials - 0.4% | | | |
| Insurance - 0.4% | | | |
| Fidelidade - Co De Seguros SA/Portugal 4.25% 9/4/2031 (b)(c) | EUR | 2,700,000 | 2,808,905 |
| SPAIN - 1.5% | | | |
| Financials - 1.0% | | | |
| Banks - 1.0% | | | |
| Banco Bilbao Vizcaya Argentaria SA 6.033% 3/13/2035 (c) | | 2,800,000 | 2,798,179 |
| CaixaBank SA 3.625% 9/19/2032 (b)(c) | EUR | 4,000,000 | 4,164,594 |
| | | | 6,962,773 |
| Health Care - 0.5% | | | |
| Health Care Equipment & Supplies - 0.5% | | | |
| Werfen SA/Spain 4.625% 6/6/2028 (b) | EUR | 3,200,000 | 3,466,070 |
| TOTAL SPAIN | | | 10,428,843 |
| SWEDEN - 1.5% | | | |
| Real Estate - 1.5% | | | |
| Real Estate Management & Development - 1.5% | | | |
| Heimstaden AB 4.375% 3/6/2027 (b) | EUR | 3,400,000 | 3,204,920 |
| Heimstaden Bostad AB 3.875% 11/5/2029 (b) | EUR | 3,725,000 | 3,828,203 |
| Samhallsbyggnadsbolaget I Norden Holding AB 2.25% 7/12/2027 (b) | EUR | 4,355,000 | 3,586,157 |
| | | | |
| TOTAL SWEDEN | | | 10,619,280 |
| SWITZERLAND - 1.9% | | | |
| Financials - 1.9% | | | |
| Capital Markets - 1.6% | | | |
| UBS Group AG 2.125% 11/15/2029 (b)(c) | GBP | 728,000 | 817,952 |
| UBS Group AG 2.875% 4/2/2032 (b)(c) | EUR | 3,000,000 | 3,025,231 |
| UBS Group AG 4.125% 6/9/2033 (b)(c) | EUR | 3,820,000 | 4,134,246 |
| UBS Group AG 4.75% 3/17/2032 (b)(c) | EUR | 2,870,000 | 3,203,604 |
| | | | 11,181,033 |
| Insurance - 0.3% | | | |
| Zurich Finance Ireland Designated Activity Co 3.5% 5/2/2052 (b)(c) | | 2,615,000 | 2,250,077 |
| TOTAL SWITZERLAND | | | 13,431,110 |
| UNITED KINGDOM - 16.3% | | | |
| Communication Services - 0.1% | | | |
| Wireless Telecommunication Services - 0.1% | | | |
| Vodafone Group PLC 4.875% 10/3/2078 (b)(c) | GBP | 525,000 | 652,712 |
| Consumer Discretionary - 1.5% | | | |
| Broadline Retail - 0.4% | | | |
| John Lewis PLC 4.25% 12/18/2034 (b) | GBP | 250,000 | 238,437 |
| John Lewis PLC 6.125% 1/21/2025 | GBP | 2,031,000 | 2,542,634 |
| | | | 2,781,071 |
| Hotels, Restaurants & Leisure - 0.4% | | | |
| Compass Group PLC 3.25% 9/16/2033 (b) | EUR | 2,645,000 | 2,739,084 |
| Whitbread Group PLC 2.375% 5/31/2027 (b) | GBP | 235,000 | 275,036 |
| | | | 3,014,120 |
| Household Durables - 0.7% | | | |
| Berkeley Group PLC/The 2.5% 8/11/2031 (b) | GBP | 4,507,000 | 4,509,563 |
TOTAL CONSUMER DISCRETIONARY | | | 10,304,754 |
| | | | |
| Consumer Staples - 2.2% | | | |
| Consumer Staples Distribution & Retail - 0.0% | | | |
| Tesco Corporate Treasury Services PLC 2.75% 4/27/2030 (b) | GBP | 500,000 | 556,848 |
| Household Products - 0.2% | | | |
| Reckitt Benckiser Treasury Services PLC 3.875% 9/14/2033 (b) | EUR | 1,240,000 | 1,326,074 |
| Tobacco - 2.0% | | | |
| BAT Capital Corp 2.125% 8/15/2025 (b) | GBP | 1,431,000 | 1,757,395 |
| BAT International Finance PLC 4.125% 4/12/2032 (b) | EUR | 5,175,000 | 5,499,168 |
| Imperial Brands Finance Netherlands BV 5.25% 2/15/2031 (b) | EUR | 1,975,000 | 2,221,395 |
| Imperial Brands Finance PLC 4.875% 6/7/2032 (b) | GBP | 3,750,000 | 4,421,525 |
| | | | 13,899,483 |
TOTAL CONSUMER STAPLES | | | 15,782,405 |
| | | | |
| Financials - 6.8% | | | |
| Banks - 6.3% | | | |
| Barclays PLC 5.262% 1/29/2034 (b)(c) | EUR | 6,380,000 | 7,306,274 |
| Barclays PLC 8.407% 11/14/2032 (b)(c) | GBP | 1,145,000 | 1,534,052 |
| HSBC Holdings PLC 4.787% 3/10/2032 (b)(c) | EUR | 3,310,000 | 3,698,835 |
| HSBC Holdings PLC 4.856% 5/23/2033 (b)(c) | EUR | 1,800,000 | 2,035,789 |
| HSBC Holdings PLC 6.254% 3/9/2034 (c) | | 1,200,000 | 1,245,361 |
| HSBC Holdings PLC 6.8% 9/14/2031 (c) | GBP | 1,300,000 | 1,742,900 |
| HSBC Holdings PLC 7.39% 11/3/2028 (c) | | 460,000 | 487,534 |
| HSBC Holdings PLC 8.201% 11/16/2034 (b)(c) | GBP | 485,000 | 664,781 |
| Lloyds Banking Group PLC 1.985% 12/15/2031 (c) | GBP | 1,172,000 | 1,381,353 |
| Lloyds Banking Group PLC 4.5% 1/11/2029 (b)(c) | EUR | 2,015,000 | 2,177,632 |
| Lloyds Banking Group PLC 4.75% 9/21/2031 (b)(c) | EUR | 6,205,000 | 6,880,636 |
| NatWest Group PLC 2.105% 11/28/2031 (b)(c) | GBP | 2,314,000 | 2,733,859 |
| NatWest Group PLC 4.771% 2/16/2029 (b)(c) | EUR | 2,710,000 | 2,948,477 |
| NatWest Group PLC 7.416% 6/6/2033 (b)(c) | GBP | 4,145,000 | 5,441,680 |
| Santander UK Group Holdings PLC 3.625% 1/14/2026 (b) | GBP | 550,000 | 678,761 |
| Virgin Money UK PLC 7.625% 8/23/2029 (b)(c) | GBP | 2,095,000 | 2,826,391 |
| | | | 43,784,315 |
| Insurance - 0.5% | | | |
| Admiral Group PLC 8.5% 1/6/2034 (b) | GBP | 2,665,000 | 3,736,641 |
TOTAL FINANCIALS | | | 47,520,956 |
| | | | |
| Industrials - 1.6% | | | |
| Ground Transportation - 0.8% | | | |
| Mobico Group PLC 4.875% 9/26/2031 (b) | EUR | 5,345,000 | 5,551,966 |
| Trading Companies & Distributors - 0.2% | | | |
| Travis Perkins PLC 3.75% 2/17/2026 (b) | GBP | 900,000 | 1,100,584 |
| Transportation Infrastructure - 0.6% | | | |
| Heathrow Funding Ltd 6% 3/5/2032 (b) | GBP | 3,500,000 | 4,338,216 |
TOTAL INDUSTRIALS | | | 10,990,766 |
| | | | |
| Real Estate - 0.6% | | | |
| Office REITs - 0.5% | | | |
| Great Portland Estates PLC 5.375% 9/25/2031 (b) | GBP | 2,815,000 | 3,453,727 |
| Real Estate Management & Development - 0.1% | | | |
| Tritax EuroBox PLC 0.95% 6/2/2026 (b) | EUR | 765,000 | 769,252 |
TOTAL REAL ESTATE | | | 4,222,979 |
| | | | |
| Utilities - 3.5% | | | |
| Electric Utilities - 0.9% | | | |
| NGG Finance PLC 2.125% 9/5/2082 (b)(c) | EUR | 3,521,000 | 3,502,360 |
| Scottish Hydro Electric Transmission PLC 3.375% 9/4/2032 (b) | EUR | 2,970,000 | 3,086,258 |
| | | | 6,588,618 |
| Gas Utilities - 0.3% | | | |
| Southern Gas Networks PLC 3.5% 10/16/2030 (b) | EUR | 2,345,000 | 2,420,478 |
| Water Utilities - 2.3% | | | |
| Anglian Water Osprey Financing PLC 2% 7/31/2028 (b) | GBP | 715,000 | 726,372 |
| Anglian Water Services Financing PLC 5.875% 6/20/2031 (b) | GBP | 730,000 | 916,567 |
| Anglian Water Services Financing PLC 6.25% 9/12/2044 (b) | GBP | 1,075,000 | 1,312,174 |
| Anglian Water Services Financing PLC 6.293% 7/30/2030 (b) | GBP | 1,945,000 | 2,475,766 |
| Northumbrian Water Finance PLC 4.5% 2/14/2031 (b) | GBP | 2,910,000 | 3,415,014 |
| Severn Trent Utilities Finance PLC 4.625% 11/30/2034 (b) | GBP | 2,995,000 | 3,499,090 |
| South West Water Finance PLC 5.75% 12/11/2032 (b) | GBP | 475,000 | 593,807 |
| Southern Water Services Finance Ltd 1.625% 3/30/2027 (b) | GBP | 345,000 | 354,264 |
| Southern Water Services Finance Ltd 2.375% 5/28/2028 (b) | GBP | 1,230,000 | 1,251,440 |
| SW Finance I PLC 7.375% 12/12/2041 (b) | GBP | 991,000 | 1,112,023 |
| | | | 15,656,517 |
TOTAL UTILITIES | | | 24,665,613 |
| | | | |
| TOTAL UNITED KINGDOM | | | 114,140,185 |
| UNITED STATES - 2.0% | | | |
| Communication Services - 0.4% | | | |
| Diversified Telecommunication Services - 0.1% | | | |
| Verizon Communications Inc 3.75% 2/28/2036 | EUR | 775,000 | 813,925 |
| Media - 0.3% | | | |
| Warnermedia Holdings Inc 4.693% 5/17/2033 | EUR | 2,235,000 | 2,315,541 |
TOTAL COMMUNICATION SERVICES | | | 3,129,466 |
| | | | |
| Financials - 1.1% | | | |
| Banks - 0.1% | | | |
| JPMorgan Chase & Co 3.761% 3/21/2034 (b)(c) | EUR | 900,000 | 952,995 |
| Capital Markets - 0.4% | | | |
| Blackstone Private Credit Fund 4.875% 4/14/2026 (b) | GBP | 1,169,000 | 1,440,099 |
| Morgan Stanley 3.955% 3/21/2035 (c) | EUR | 950,000 | 1,007,096 |
| | | | 2,447,195 |
| Consumer Finance - 0.6% | | | |
| Ford Motor Credit Co LLC 4.445% 2/14/2030 | EUR | 2,215,000 | 2,357,505 |
| Ford Motor Credit Co LLC 6.86% 6/5/2026 | GBP | 1,000,000 | 1,272,198 |
| | | | 3,629,703 |
TOTAL FINANCIALS | | | 7,029,893 |
| | | | |
| Industrials - 0.2% | | | |
| Building Products - 0.2% | | | |
| Carrier Global Corp 4.5% 11/29/2032 | EUR | 1,250,000 | 1,387,482 |
| Real Estate - 0.0% | | | |
| Diversified REITs - 0.0% | | | |
| WP Carey Inc 4.25% 7/23/2032 | EUR | 300,000 | 323,521 |
| Utilities - 0.3% | | | |
| Electric Utilities - 0.3% | | | |
| Duke Energy Corp 3.85% 6/15/2034 | EUR | 1,238,000 | 1,284,378 |
| Southern Co/The 1.875% 9/15/2081 (c) | EUR | 1,211,000 | 1,176,013 |
| | | | 2,460,391 |
| TOTAL UNITED STATES | | | 14,330,753 |
| TOTAL NON-CONVERTIBLE CORPORATE BONDS (Cost $386,028,320) | | | 385,050,903 |
| | | | |
| Preferred Securities - 3.7% |
| | | Principal Amount (a) | Value ($) |
| CZECH REPUBLIC - 0.2% | | | |
| Real Estate - 0.2% | | | |
| Real Estate Management & Development - 0.2% | | | |
| CPI Property Group SA 3.75% (b)(c)(e) | EUR | 1,740,000 | 1,609,233 |
| FINLAND - 0.2% | | | |
| Real Estate - 0.2% | | | |
| Real Estate Management & Development - 0.2% | | | |
| Citycon Oyj 7.875% (b)(c)(e) | EUR | 1,197,000 | 1,232,862 |
| GERMANY - 1.6% | | | |
| Consumer Discretionary - 1.0% | | | |
| Automobiles - 1.0% | | | |
| Volkswagen International Finance NV 3.748% (b)(c)(e) | EUR | 100,000 | 100,077 |
| Volkswagen International Finance NV 3.875% (b)(c)(e) | EUR | 7,000,000 | 6,899,954 |
| | | | 7,000,031 |
| Real Estate - 0.6% | | | |
| Real Estate Management & Development - 0.6% | | | |
| Aroundtown Finance Sarl 7.875% (c)(e) | | 890,000 | 828,248 |
| Aroundtown SA 5 year EUR Swap Annual Index + 3.98%, 6.2133% (b)(c)(e)(f) | EUR | 2,700,000 | 2,414,831 |
| Grand City Properties SA 1.5% (b)(c)(e) | EUR | 1,200,000 | 1,196,176 |
| | | | 4,439,255 |
| TOTAL GERMANY | | | 11,439,286 |
| IRELAND - 0.1% | | | |
| Financials - 0.1% | | | |
| Banks - 0.1% | | | |
| AIB Group PLC 6.25% (b)(c)(e) | EUR | 410,000 | 429,471 |
| SWEDEN - 0.4% | | | |
| Real Estate - 0.4% | | | |
| Real Estate Management & Development - 0.4% | | | |
| Heimstaden Bostad AB 3.625% (b)(c)(e) | EUR | 2,155,000 | 2,209,038 |
| Samhallsbyggnadsbolaget i Norden AB 2.624% (b)(c)(e)(g) | EUR | 647,000 | 268,078 |
| | | | |
| TOTAL SWEDEN | | | 2,477,116 |
| SWITZERLAND - 0.0% | | | |
| Financials - 0.0% | | | |
| Capital Markets - 0.0% | | | |
| Credit Suisse Group AG Claim 5 year USD Swap Index + 4.598%, 0% (b)(c)(e)(f)(g)(h) | | 611,000 | 61,100 |
| UBS Group AG 7% (b)(c)(e) | | 250,000 | 265,226 |
| | | | |
| TOTAL SWITZERLAND | | | 326,326 |
| UNITED KINGDOM - 1.2% | | | |
| Consumer Staples - 1.0% | | | |
| Tobacco - 1.0% | | | |
| British American Tobacco PLC 3% (b)(c)(e) | EUR | 6,742,000 | 6,847,098 |
| Financials - 0.1% | | | |
| Banks - 0.1% | | | |
| Barclays PLC 7.125% (c)(e) | GBP | 425,000 | 534,380 |
| Industrials - 0.1% | | | |
| Ground Transportation - 0.1% | | | |
| Mobico Group PLC 4.25% (b)(c)(e) | GBP | 525,000 | 651,426 |
| Utilities - 0.0% | | | |
| Electric Utilities - 0.0% | | | |
| SSE PLC 3.74% (b)(c)(e) | GBP | 337,000 | 423,693 |
| TOTAL UNITED KINGDOM | | | 8,456,597 |
| TOTAL PREFERRED SECURITIES (Cost $22,605,796) | | | 25,970,891 |
| | | | |
| U.S. Treasury Obligations - 24.3% |
| | | Yield (%) (i) | Principal Amount (a) | Value ($) |
| US Treasury Bonds 1.125% 8/15/2040 | | 4.51 | 700,000 | 417,386 |
| US Treasury Bonds 2.25% 5/15/2041 | | 4.12 to 4.83 | 16,900,000 | 11,992,992 |
| US Treasury Bonds 3.25% 5/15/2042 | | 4.15 | 580,200 | 471,929 |
| US Treasury Bonds 4% 11/15/2042 (j) | | 3.89 to 4.17 | 6,000,000 | 5,398,653 |
| US Treasury Bonds 4.125% 8/15/2044 | | 4.14 to 4.75 | 3,925,000 | 3,552,006 |
| US Treasury Bonds 4.5% 11/15/2054 | | 4.61 | 9,500,000 | 9,057,566 |
| US Treasury Bonds 4.5% 2/15/2044 | | 4.44 to 4.83 | 6,500,000 | 6,204,051 |
| US Treasury Bonds 4.625% 11/15/2044 | | 4.86 | 1,130,000 | 1,095,659 |
| US Treasury Bonds 4.625% 5/15/2044 | | 4.42 to 4.72 | 2,620,000 | 2,539,978 |
| US Treasury Bonds 6.25% 5/15/2030 | | 3.41 to 4.46 | 18,050,000 | 19,616,819 |
| US Treasury Notes 1% 7/31/2028 | | 4.19 | 15,000,000 | 13,353,586 |
| US Treasury Notes 3.5% 2/15/2033 | | 4.32 | 200,000 | 186,058 |
| US Treasury Notes 3.625% 9/30/2031 | | 3.66 to 4.23 | 11,500,000 | 10,927,996 |
| US Treasury Notes 3.75% 12/31/2028 | | 4.03 | 700,000 | 684,286 |
| US Treasury Notes 3.75% 12/31/2030 | | 4.07 | 1,600,000 | 1,541,544 |
| US Treasury Notes 3.75% 8/31/2031 | | 3.64 | 3,300,000 | 3,161,658 |
| US Treasury Notes 4% 2/15/2034 | | 4.19 to 4.50 | 3,500,000 | 3,350,757 |
| US Treasury Notes 4.125% 10/31/2031 | | 4.34 to 4.41 | 48,000,000 | 46,982,936 |
| US Treasury Notes 4.125% 7/31/2031 | | 3.59 to 3.97 | 1,200,000 | 1,176,540 |
| US Treasury Notes 4.25% 2/28/2029 | | 4.19 to 4.30 | 6,420,000 | 6,389,992 |
| US Treasury Notes 4.375% 11/30/2028 | | 3.89 to 3.91 | 3,700,000 | 3,701,498 |
| US Treasury Notes 4.375% 12/31/2029 | | 4.39 | 3,200,000 | 3,198,392 |
| US Treasury Notes 4.5% 11/15/2033 | | 3.94 to 4.14 | 4,250,000 | 4,230,762 |
| US Treasury Notes 4.625% 4/30/2029 | | 4.40 to 4.72 | 12,350,000 | 12,468,363 |
| TOTAL U.S. TREASURY OBLIGATIONS (Cost $175,861,857) | | | | 171,701,407 |
| | | | | |
| Money Market Funds - 6.8% |
| | | Yield (%) | Shares | Value ($) |
Fidelity Cash Central Fund (k) (Cost $48,295,811) | | 4.36 | 48,286,153 | 48,295,811 |
| | | | | |
| TOTAL INVESTMENT IN SECURITIES - 98.2% (Cost $697,702,304) | 694,128,860 |
NET OTHER ASSETS (LIABILITIES) - 1.8% | 12,404,489 |
| NET ASSETS - 100.0% | 706,533,349 |
| | |
| Futures Contracts |
| | Number of contracts | Expiration Date | Notional Amount ($) | Value ($) | Unrealized Appreciation/ (Depreciation) ($) |
| Purchased | | | | | |
| | | | | | |
| Interest Rate Contracts | | | | | |
| CBOT 5-Year U.S. Treasury Note Contracts (United States) | 129 | Mar 2025 | 13,713,305 | (85,900) | (85,900) |
| CBOT Long Term U.S. Treasury Bond Contracts (United States) | 25 | Mar 2025 | 2,846,094 | (128,164) | (128,164) |
| CBOT Ultra 10-Year U.S. Treasury Note Contracts (United States) | 54 | Mar 2025 | 6,010,875 | (160,800) | (160,800) |
| | | | | | |
| TOTAL PURCHASED | | | | | (374,864) |
| | | | | | |
| Sold | | | | | |
| | | | | | |
| Interest Rate Contracts | | | | | |
| ICE Long Gilt Contracts (United Kingdom) | 40 | Mar 2025 | 4,627,523 | 105,989 | 105,989 |
| | | | | | |
| TOTAL FUTURES CONTRACTS | | | | | (268,875) |
| The notional amount of futures purchased as a percentage of Net Assets is 3.2% |
| The notional amount of futures sold as a percentage of Net Assets is 0.7% |
| Forward Foreign Currency Contracts |
Currency Purchased
| Currency Sold | Counterparty | Settlement Date | Unrealized Appreciation/ (Depreciation) ($) |
| | | | | | | |
| EUR | 6,272,000 | USD | 6,607,554 | Bank of America NA | 1/09/25 | (109,106) |
| USD | 19,556,747 | EUR | 18,570,000 | Bank of America NA | 1/09/25 | 316,286 |
| USD | 227,866 | EUR | 215,000 | Bank of America NA | 1/09/25 | 5,103 |
| USD | 2,434,282 | CAD | 3,420,000 | Brown Brothers Harriman & Co | 1/09/25 | 54,522 |
| AUD | 1,559,000 | USD | 970,088 | Canadian Imperial Bank of Commerce | 1/02/25 | (5,145) |
| USD | 75,936,928 | GBP | 60,119,000 | BNP Paribas SA | 1/09/25 | 677,908 |
| USD | 894,179 | AUD | 1,437,000 | Canadian Imperial Bank of Commerce | 1/09/25 | 4,744 |
| USD | 4,330,507 | GBP | 3,418,000 | Bank of America NA | 1/09/25 | 51,738 |
| CAD | 850,000 | USD | 590,902 | Brown Brothers Harriman & Co | 1/02/25 | 423 |
| EUR | 2,302,000 | USD | 2,395,185 | Brown Brothers Harriman & Co | 1/09/25 | (10,072) |
| JPY | 290,600,000 | USD | 1,855,045 | Brown Brothers Harriman & Co | 1/09/25 | (6,787) |
| USD | 5,953,301 | AUD | 9,197,000 | Royal Bank of Canada | 1/09/25 | 260,790 |
| USD | 631,629 | EUR | 596,000 | Bank of America NA | 1/09/25 | 14,110 |
| USD | 6,148,492 | EUR | 5,831,000 | Brown Brothers Harriman & Co | 1/09/25 | 106,967 |
| EUR | 613,000 | USD | 637,931 | JPMorgan Chase Bank NA | 1/09/25 | (2,799) |
| USD | 19,465,412 | JPY | 2,904,800,000 | Brown Brothers Harriman & Co | 1/09/25 | 990,465 |
| USD | 280,652,705 | EUR | 267,272,000 | Goldman Sachs Bank USA | 1/09/25 | 3,730,983 |
| USD | 21,516,928 | CAD | 30,166,000 | BNP Paribas SA | 1/09/25 | 526,336 |
| CAD | 352,000 | USD | 249,386 | Bank of America NA | 1/09/25 | (4,452) |
| USD | 451,632 | GBP | 353,000 | Bank of America NA | 1/09/25 | 9,734 |
| USD | 1,784,016 | JPY | 272,950,000 | Bank of America NA | 1/09/25 | 48,015 |
| USD | 377,582 | CAD | 543,000 | Brown Brothers Harriman & Co | 1/09/25 | (257) |
| | | | | | | |
| TOTAL FORWARD FOREIGN CURRENCY CONTRACTS | | 6,659,506 |
| Unrealized Appreciation | | | 6,798,124 |
| Unrealized Depreciation | | | (138,618) |
| Credit Default Swaps |
| Underlying Reference | | Maturity Date | Clearinghouse / Counterparty | Fixed Payment Received/ (Paid) | Payment Frequency | Notional Amount(1) | Value ($) | Upfront Premium Received/ (Paid) ($) | Unrealized Appreciation/ (Depreciation) ($) |
| Buy Protection | | | | | | | | | | |
| BMW Finance NV 0.75% 7/13/2026 | | Dec 2029 | BNP Paribas SA | (1%) | Quarterly | EUR | 5,300,000 | (98,622) | 104,236 | 5,614 |
| Heidelberg Materials AG 3.75% 5/31/2032 | | Dec 2029 | BNP Paribas SA | (5%) | Quarterly | EUR | 2,420,000 | (507,073) | 513,224 | 6,151 |
| Generali 4.125% 5/4/2026 | | Dec 2029 | BNP Paribas SA | (1%) | Quarterly | EUR | 2,200,000 | 9,560 | (24,316) | (14,756) |
| AXA SA 8.6% 12/15/2030 | | Dec 2029 | BNP Paribas SA | (1%) | Quarterly | EUR | 3,300,000 | (26,650) | 21,409 | (5,241) |
| Societe Generale SA 2.625% 2/27/2025 | | Dec 2029 | BNP Paribas SA | (1%) | Quarterly | EUR | 2,200,000 | 35,963 | (60,359) | (24,396) |
| Intesa Sanpaolo SpA 6.184% 2/20/2034 | | Dec 2029 | JPMorgan Chase Bank NA | (1%) | Quarterly | EUR | 2,240,000 | 26,588 | (50,799) | (24,211) |
| UniCredit SpA 5.375% 4/16/2034 | | Dec 2029 | Goldman Sachs Bank USA | (1%) | Quarterly | EUR | 1,850,000 | 22,519 | (43,348) | (20,829) |
| | | | | | | | | | | |
| TOTAL CREDIT DEFAULT SWAPS | | | | | | | | (537,715) | 460,047 | (77,668) |
(1)Notional amount is stated in U.S. Dollars unless otherwise noted.
Currency Abbreviations
| AUD | - | Australian Dollar |
| CAD | - | Canadian Dollar |
| EUR | - | European Monetary Unit (Euro) |
| GBP | - | United Kingdom Pound |
| JPY | - | Japanese Yen |
| USD | - | United States Dollar |
Legend
| (a) | Amount is stated in United States dollars unless otherwise noted. |
| (b) | Security is exempt from registration under Regulation S of the Securities Act of 1933 and may be resold to qualified foreign investors outside of the United States. At the end of the period, the value of securities amounted to $360,978,955 or 51.1% of net assets. |
| (c) | Coupon rates for floating and adjustable rate securities reflect the rates in effect at period end. |
| (d) | Security exempt from registration under Rule 144A of the Securities Act of 1933. These securities may be resold in transactions exempt from registration, normally to qualified institutional buyers. At the end of the period, the value of these securities amounted to $33,212,182 or 4.7% of net assets. |
| (e) | Security is perpetual in nature with no stated maturity date. |
| (f) | Coupon is indexed to a floating interest rate which may be multiplied by a specified factor and/or subject to caps or floors. |
| (g) | Non-income producing - Security is in default. |
| (i) | Yield represents either the annualized yield at the date of purchase, or the stated coupon rate, or, for floating and adjustable rate securities, the rate at period end. |
| (j) | Security or a portion of the security was pledged to cover margin requirements for futures contracts. At period end, the value of securities pledged amounted to $606,449. |
| (k) | Affiliated fund that is generally available only to investment companies and other accounts managed by Fidelity Investments. The rate quoted is the annualized seven-day yield of the fund at period end. A complete unaudited listing of the fund's holdings as of its most recent quarter end is available upon request. In addition, each Fidelity Central Fund's financial statements, which are not covered by the Fund's Report of Independent Registered Public Accounting Firm, are available on the SEC's website or upon request. |
Affiliated Central Funds
Fiscal year to date information regarding the Fund's investments in Fidelity Central Funds, including the ownership percentage, is presented below.
| Affiliate | Value, beginning of period ($) | Purchases ($) | Sales Proceeds ($) | Dividend Income ($) | Realized Gain (loss) ($) | Change in Unrealized appreciation (depreciation) ($) | Value, end of period ($) | Shares, end of period | % ownership, end of period |
| Fidelity Cash Central Fund | 12,171,582 | 355,250,524 | 319,126,445 | 995,896 | 150 | - | 48,295,811 | 48,286,153 | 0.1% |
| Total | 12,171,582 | 355,250,524 | 319,126,445 | 995,896 | 150 | - | 48,295,811 | 48,286,153 | |
| | | | | | | | | | |
Amounts in the dividend income column in the above table include any capital gain distributions from underlying funds, which are presented in the corresponding line item in the Statement of Operations, if applicable.
Amounts included in the purchases and sales proceeds columns may include in-kind transactions, if applicable.
Investment Valuation
The following is a summary of the inputs used, as of December 31, 2024, involving the Fund's assets and liabilities carried at fair value. The inputs or methodology used for valuing securities may not be an indication of the risk associated with investing in those securities. For more information on valuation inputs, and their aggregation into the levels used below, please refer to the Investment Valuation section in the accompanying Notes to Financial Statements.
| Valuation Inputs at Reporting Date: |
| Description | Total ($) | Level 1 ($) | Level 2 ($) | Level 3 ($) |
Investments in Securities: | | | | |
|
| Foreign Government and Government Agency Obligations | 63,109,848 | - | 63,109,848 | - |
|
| Non-Convertible Corporate Bonds | | | | |
Communication Services | 7,543,240 | - | 7,543,240 | - |
Consumer Discretionary | 19,838,295 | - | 19,838,295 | - |
Consumer Staples | 20,952,395 | - | 20,952,395 | - |
Energy | 5,139,549 | - | 5,139,549 | - |
Financials | 183,044,557 | - | 183,044,557 | - |
Health Care | 14,257,553 | - | 14,257,553 | - |
Industrials | 16,424,737 | - | 16,424,737 | - |
Real Estate | 53,075,810 | - | 53,075,810 | - |
Utilities | 64,774,767 | - | 64,774,767 | - |
|
| Preferred Securities | | | | |
Consumer Discretionary | 7,000,031 | - | 7,000,031 | - |
Consumer Staples | 6,847,098 | - | 6,847,098 | - |
Financials | 1,290,177 | - | 1,229,077 | 61,100 |
Industrials | 651,426 | - | 651,426 | - |
Real Estate | 9,758,466 | - | 9,758,466 | - |
Utilities | 423,693 | - | 423,693 | - |
|
| U.S. Treasury Obligations | 171,701,407 | - | 171,701,407 | - |
|
| Money Market Funds | 48,295,811 | 48,295,811 | - | - |
| Total Investments in Securities: | 694,128,860 | 48,295,811 | 645,771,949 | 61,100 |
Derivative Instruments: Assets | | | | |
Futures Contracts | 105,989 | 105,989 | - | - |
Forward Foreign Currency Contracts | 6,798,124 | - | 6,798,124 | - |
Swaps | 94,630 | - | 94,630 | - |
| Total Assets | 6,998,743 | 105,989 | 6,892,754 | - |
| Liabilities | | | | |
Futures Contracts | (374,864) | (374,864) | - | - |
Forward Foreign Currency Contracts | (138,618) | - | (138,618) | - |
Swaps | (632,345) | - | (632,345) | - |
| Total Liabilities | (1,145,827) | (374,864) | (770,963) | - |
| Total Derivative Instruments: | 5,852,916 | (268,875) | 6,121,791 | - |
Value of Derivative Instruments
The following table is a summary of the Fund's value of derivative instruments by primary risk exposure as of December 31, 2024. For additional information on derivative instruments, please refer to the Derivative Instruments section in the accompanying Notes to Financial Statements.
Primary Risk Exposure / Derivative Type | Value |
| Asset ($) | Liability ($) |
| Credit Risk | | |
Swaps (a) | 94,630 | (632,345) |
| Total Credit Risk | 94,630 | (632,345) |
| Foreign Exchange Risk | | |
Forward Foreign Currency Contracts (b) | 6,798,124 | (138,618) |
| Total Foreign Exchange Risk | 6,798,124 | (138,618) |
| Interest Rate Risk | | |
Futures Contracts (c) | 105,989 | (374,864) |
| Total Interest Rate Risk | 105,989 | (374,864) |
| Total Value of Derivatives | 6,998,743 | (1,145,827) |
(a)For bi-lateral over-the-counter (OTC) swaps, reflects gross value which is presented in the Statement of Assets and Liabilities in the bi-lateral OTC swaps, at value line-items.
(b)Gross value is presented in the Statement of Assets and Liabilities in the unrealized appreciation/depreciation on forward foreign currency contracts line-items.
(c)Reflects gross cumulative appreciation (depreciation) on futures contracts as presented in the Schedule of Investments. In the Statement of Assets and Liabilities, the period end daily variation margin is included in receivable or payable for daily variation margin on futures contracts, and the net cumulative appreciation (depreciation) is included in Total accumulated earnings (loss).
The following table is a summary of the Fund's derivatives inclusive of potential netting arrangements.
| | | | | | | | | | | |
| Counterparty | | Value of Derivative Assets ($) | | Value of Derivative Liabilities ($) | | Collateral Received(a) ($) | | Collateral Pledged(a) ($) | | Net(b) ($) |
| Bank of America NA | | 444,986 | | (113,558) | | (326,618) | | - | | 4,810 |
| BNP Paribas SA | | 1,249,767 | | (632,345) | | (306,507) | | - | | 310,915 |
| Brown Brothers Harriman & Co | | 1,152,377 | | (17,116) | | (1,100,000) | | - | | 35,261 |
| Canadian Imperial Bank of Commerce | | 4,744 | | (5,145) | | - | | - | | (401) |
| Goldman Sachs Bank USA | | 3,753,502 | | - | | (2,600,000) | | - | | 1,153,502 |
| JPMorgan Chase Bank NA | | 26,588 | | (2,799) | | - | | - | | 23,789 |
| Royal Bank of Canada | | 260,790 | | - | | (256,892) | | - | | 3,898 |
| Total | $ | 6,892,754 | $ | (770,963) | $ | (4,590,017) | $ | - | $ | 1,531,774 |
| | | | | | | | | | | |
(a) Reflects collateral received from or pledged to an individual counterparty, excluding any excess or initial collateral amounts.
(b) Net represents the receivable / (payable) that would be due from / (to) the counterparty in an event of default. Netting may be allowed across transactions traded under the same legal agreement with the same legal entity. Please refer to Derivative Instruments - Risk Exposures and the Use of Derivative Instruments section in the accompanying Notes to Financial Statements.
Financial Statements
| Statement of Assets and Liabilities |
As of December 31, 2024 |
| Assets | | | | |
| Investment in securities, at value - See accompanying schedule: | | | | |
Unaffiliated issuers (cost $649,406,493) | $ | 645,833,049 | | |
Fidelity Central Funds (cost $48,295,811) | | 48,295,811 | | |
| | | | | |
| | | | | |
| Total Investment in Securities (cost $697,702,304) | | | $ | 694,128,860 |
| Foreign currency held at value (cost $3,485,582) | | | | 3,454,642 |
| Unrealized appreciation on forward foreign currency contracts | | | | 6,798,124 |
| Interest receivable | | | | 8,855,310 |
| Distributions receivable from Fidelity Central Funds | | | | 189,000 |
| Bi-lateral OTC swaps, at value | | | | 94,630 |
| Prepaid expenses | | | | 338 |
| Receivable from investment adviser for expense reductions | | | | 15,319 |
Total assets | | | | 713,536,223 |
| Liabilities | | | | |
| Payable for investments purchased | $ | 5,789,359 | | |
| Unrealized depreciation on forward foreign currency contracts | | 138,618 | | |
| Bi-lateral OTC swaps, at value | | 632,345 | | |
| Accrued management fee | | 234,943 | | |
| Payable for daily variation margin on futures contracts | | 60,388 | | |
| Other payables and accrued expenses | | 147,221 | | |
| Total liabilities | | | | 7,002,874 |
| Net Assets | | | $ | 706,533,349 |
| Net Assets consist of: | | | | |
| Paid in capital | | | $ | 694,370,841 |
| Total accumulated earnings (loss) | | | | 12,162,508 |
| Net Assets | | | $ | 706,533,349 |
Net Asset Value, offering price and redemption price per share ($706,533,349 ÷ 67,210,226 shares) | | | $ | 10.51 |
| Statement of Operations |
| Year ended December 31, 2024 |
| Investment Income | | | | |
| Dividends | | | $ | 890,460 |
| Interest | | | | 16,539,831 |
| Income from Fidelity Central Funds | | | | 995,896 |
| Income before foreign taxes withheld | | | $ | 18,426,187 |
| Less foreign taxes withheld | | | | (6,010) |
| Total income | | | | 18,420,177 |
| Expenses | | | | |
| Management fee | $ | 1,630,941 | | |
| Custodian fees and expenses | | 32,073 | | |
| Independent trustees' fees and expenses | | 960 | | |
| Registration fees | | 76,947 | | |
| Audit fees | | 104,146 | | |
| Legal | | 247 | | |
| Miscellaneous | | 1,158 | | |
| Total expenses before reductions | | 1,846,472 | | |
| Expense reductions | | (179,720) | | |
| Total expenses after reductions | | | | 1,666,752 |
| Net Investment income (loss) | | | | 16,753,425 |
| Realized and Unrealized Gain (Loss) | | | | |
| Net realized gain (loss) on: | | | | |
| Investment Securities: | | | | |
| Unaffiliated issuers | | 4,198,941 | | |
| Fidelity Central Funds | | 150 | | |
| Forward foreign currency contracts | | 9,869,140 | | |
| Foreign currency transactions | | 8,380 | | |
| Futures contracts | | 54,865 | | |
| Swaps | | (194,423) | | |
| Total net realized gain (loss) | | | | 13,937,053 |
| Change in net unrealized appreciation (depreciation) on: | | | | |
| Investment Securities: | | | | |
| Unaffiliated issuers | | (15,527,134) | | |
| Forward foreign currency contracts | | 9,798,296 | | |
| Assets and liabilities in foreign currencies | | (296,227) | | |
| Futures contracts | | (987,382) | | |
| Swaps | | (50,784) | | |
| Total change in net unrealized appreciation (depreciation) | | | | (7,063,231) |
| Net gain (loss) | | | | 6,873,822 |
| Net increase (decrease) in net assets resulting from operations | | | $ | 23,627,247 |
| Statement of Changes in Net Assets |
| |
| | Year ended December 31, 2024 | | For the period March 1, 2023 (commencement of operations) through December 31, 2023 |
| Increase (Decrease) in Net Assets | | | | |
| Operations | | | | |
| Net investment income (loss) | $ | 16,753,425 | $ | 8,810,788 |
| Net realized gain (loss) | | 13,937,053 | | (1,129,203) |
| Change in net unrealized appreciation (depreciation) | | (7,063,231) | | 9,584,117 |
| Net increase (decrease) in net assets resulting from operations | | 23,627,247 | | 17,265,702 |
| Distributions to shareholders | | (21,288,166) | | (7,442,276) |
| | | | | |
| Share transactions | | | | |
| Proceeds from sales of shares | | 365,000,000 | | 300,640,551 |
| Reinvestment of distributions | | 21,288,166 | | 7,442,276 |
| Cost of shares redeemed | | - | | (151) |
| | | | | |
Net increase (decrease) in net assets resulting from share transactions | | 386,288,166 | | 308,082,676 |
| Total increase (decrease) in net assets | | 388,627,247 | | 317,906,102 |
| | | | | |
| Net Assets | | | | |
| Beginning of period | | 317,906,102 | | - |
| End of period | $ | 706,533,349 | $ | 317,906,102 |
| | | | | |
| Other Information | | | | |
| Shares | | | | |
| Sold | | 34,426,139 | | 30,012,002 |
| Issued in reinvestment of distributions | | 2,029,276 | | 742,824 |
| Redeemed | | - | | (15) |
| Net increase (decrease) | | 36,455,415 | | 30,754,811 |
| | | | | |
Financial Highlights
Fidelity® SAI International Credit Fund |
| |
| Years ended December 31, | | 2024 | | 2023 A |
Selected Per-Share Data | | | | |
| Net asset value, beginning of period | $ | 10.34 | $ | 10.00 |
| Income from Investment Operations | | | | |
Net investment income (loss) B,C | | .430 | | .369 |
| Net realized and unrealized gain (loss) | | .201 | | .241 |
| Total from investment operations | | .631 | | .610 |
| Distributions from net investment income | | (.402) | | (.270) |
| Distributions from net realized gain | | (.059) | | - |
| Total distributions | | (.461) | | (.270) |
| Net asset value, end of period | $ | 10.51 | $ | 10.34 |
Total Return D,E | | | | 6.21% |
Ratios to Average Net Assets C,F,G | | | | |
| Expenses before reductions | | .45% | | .46% H,I |
| Expenses net of fee waivers, if any | | | | .41% H,I |
| Expenses net of all reductions | | .41% | | .41% H,I |
| Net investment income (loss) | | 4.11% | | 4.43% H,I |
| Supplemental Data | | | | |
| Net assets, end of period (000 omitted) | $ | 706,533 | $ | 317,906 |
Portfolio turnover rate J | | | | 95% H,K |
AFor the period March 1, 2023 (commencement of operations) through December 31, 2023.
BCalculated based on average shares outstanding during the period.
CNet investment income (loss) is affected by the timing of the declaration of dividends by any underlying mutual funds or exchange-traded funds (ETFs). Net investment income (loss) of any mutual funds or ETFs is not included in the Fund's net investment income (loss) ratio.
DTotal returns for periods of less than one year are not annualized.
ETotal returns would have been lower if certain expenses had not been reduced during the applicable periods shown.
FFees and expenses of any underlying mutual funds or exchange-traded funds (ETFs) are not included in the Fund's expense ratio. The Fund indirectly bears its proportionate share of these expenses. For additional expense information related to investments in Fidelity Central Funds, please refer to the "Investments in Fidelity Central Funds" note found in the Notes to Financial Statements section of the most recent Annual or Semi-Annual report.
GExpense ratios reflect operating expenses of the class. Expenses before reductions do not reflect amounts reimbursed, waived, or reduced through arrangements with the investment adviser, brokerage services, or other offset arrangements, if applicable, and do not represent the amount paid by the class during periods when reimbursements, waivers or reductions occur.
HAnnualized.
IAudit fees are not annualized.
JAmount does not include the portfolio activity of any underlying mutual funds or exchange-traded funds (ETFs), derivatives or securities that mature within one year from acquisition.
KPortfolio turnover rate excludes securities received or delivered in-kind.
Notes to Financial Statements
For the period ended December 31, 2024
1. Organization.
Fidelity SAI International Credit Fund (the Fund) is a fund of Fidelity Salem Street Trust (the Trust) and is authorized to issue an unlimited number of shares. Shares are offered exclusively to certain clients of Fidelity Management & Research Company LLC (FMR) or its affiliates. The Trust is registered under the Investment Company Act of 1940, as amended (the 1940 Act), as an open-end management investment company organized as a Massachusetts business trust.
2. Investments in Fidelity Central Funds.
Funds may invest in Fidelity Central Funds, which are open-end investment companies generally available only to other investment companies and accounts managed by the investment adviser and its affiliates. The Schedule of Investments lists any Fidelity Central Funds held as an investment as of period end, but does not include the underlying holdings of each Fidelity Central Fund. An investing fund indirectly bears its proportionate share of the expenses of the underlying Fidelity Central Funds.
Based on its investment objective, each Fidelity Central Fund may invest or participate in various investment vehicles or strategies that are similar to those of the investing fund. These strategies are consistent with the investment objectives of the investing fund and may involve certain economic risks which may cause a decline in value of each of the Fidelity Central Funds and thus a decline in the value of the investing fund.
| Fidelity Central Fund | Investment Manager | Investment Objective | Investment Practices | Expense RatioA |
| Fidelity Money Market Central Funds | Fidelity Management & Research Company LLC (FMR) | Each fund seeks to obtain a high level of current income consistent with the preservation of capital and liquidity. | Short-term Investments | Less than .005% |
A Expenses expressed as a percentage of average net assets and are as of each underlying Central Fund's most recent annual or semi-annual shareholder report.
A complete unaudited list of holdings for each Fidelity Central Fund is available upon request or at the Securities and Exchange Commission website at www.sec.gov. In addition, the financial statements of the Fidelity Central Funds which contain the significant accounting policies (including investment valuation policies) of those funds, and are not covered by the Report of Independent Registered Public Accounting Firm, are available on the Securities and Exchange Commission website or upon request.
3. Significant Accounting Policies.
The Fund is an investment company and applies the accounting and reporting guidance of the Financial Accounting Standards Board (FASB) Accounting Standards Codification Topic 946 Financial Services - Investment Companies. The financial statements have been prepared in conformity with accounting principles generally accepted in the United States of America (GAAP), which require management to make certain estimates and assumptions at the date of the financial statements. Actual results could differ from those estimates. The Fund operates as a single operating segment. The Fund's income, expenses, assets, and performance are regularly monitored and assessed as a whole by the investment adviser and other individuals responsible for oversight functions of the Trust, using the information presented in the financial statements and financial highlights. Subsequent events, if any, through the date that the financial statements were issued have been evaluated in the preparation of the financial statements. The Fund's Schedule of Investments lists any underlying mutual funds or exchange-traded funds (ETFs) but does not include the underlying holdings of these funds. The following summarizes the significant accounting policies of the Fund:
Investment Valuation. Investments are valued as of 4:00 p.m. Eastern time on the last calendar day of the period. The Board of Trustees (the Board) has designated the Fund's investment adviser as the valuation designee responsible for the fair valuation function and performing fair value determinations as needed. The investment adviser has established a Fair Value Committee (the Committee) to carry out the day-to-day fair valuation responsibilities and has adopted policies and procedures to govern the fair valuation process and the activities of the Committee. In accordance with these fair valuation policies and procedures, which have been approved by the Board, the Fund attempts to obtain prices from one or more third party pricing services or brokers to value its investments. When current market prices, quotations or currency exchange rates are not readily available or reliable, investments will be fair valued in good faith by the Committee, in accordance with the policies and procedures. Factors used in determining fair value vary by investment type and may include market or investment specific events, transaction data, estimated cash flows, and market observations of comparable investments. The frequency that the fair valuation procedures are used cannot be predicted and they may be utilized to a significant extent. The Committee manages the Fund's fair valuation practices and maintains the fair valuation policies and procedures. The Fund's investment adviser reports to the Board information regarding the fair valuation process and related material matters.
The Fund categorizes the inputs to valuation techniques used to value its investments into a disclosure hierarchy consisting of three levels as shown below:
Level 1 - unadjusted quoted prices in active markets for identical investments
Level 2 - other significant observable inputs (including quoted prices for similar investments, interest rates, prepayment speeds, etc.)
Level 3 - unobservable inputs (including the Fund's own assumptions based on the best information available)
Valuation techniques used to value the Fund's investments by major category are as follows:
Debt securities, including restricted securities, are valued based on evaluated prices received from third party pricing services or from brokers who make markets in such securities. Corporate bonds, foreign government and government agency obligations, preferred securities and U.S. government and government agency obligations are valued by pricing services who utilize matrix pricing which considers yield or price of bonds of comparable quality, coupon, maturity and type or by broker-supplied prices. Swaps are marked-to-market daily based on valuations from third party pricing services, registered derivatives clearing organizations (clearinghouses) or broker-supplied valuations. These pricing sources may utilize inputs such as interest rate curves, credit spread curves, default possibilities and recovery rates. When independent prices are unavailable or unreliable, debt securities and swaps may be valued utilizing pricing methodologies which consider similar factors that would be used by third party pricing services. For foreign debt securities, when significant market or security specific events arise, valuations may be determined in good faith in accordance with procedures adopted by the Board. Debt securities and swaps are generally categorized as Level 2 in the hierarchy but may be Level 3 depending on the circumstances. The Fund invests a significant portion of its assets in below investment grade securities. The value of these securities can be more volatile due to changes in the credit quality of the issuer and is sensitive to changes in economic, market and regulatory conditions.
The U.S. dollar value of forward foreign currency contracts is determined using currency exchange rates supplied by a pricing service and are categorized as Level 2 in the hierarchy. Futures contracts are valued at the settlement price established each day by the board of trade or exchange on which they are traded and are categorized as Level 1 in the hierarchy. Investments in open-end mutual funds, including the Fidelity Central Funds, are valued at their closing net asset value (NAV) each business day and are categorized as Level 1 in the hierarchy.
Changes in valuation techniques may result in transfers in or out of an assigned level within the disclosure hierarchy. The aggregate value of investments by input level as of December 31, 2024 is included at the end of the Fund's Schedule of Investments.
Foreign Currency. Foreign-denominated assets, including investment securities, and liabilities are translated into U.S. dollars at the exchange rates at period end. Purchases and sales of investment securities, income and dividends received, and expenses denominated in foreign currencies are translated into U.S. dollars at the exchange rate in effect on the transaction date.
The effects of exchange rate fluctuations on investments are included with the net realized and unrealized gain (loss) on investment securities. Other foreign currency transactions resulting in realized and unrealized gain (loss) are disclosed separately.
Realized gains and losses on foreign currency transactions arise from the disposition of foreign currency, realized changes in the value of foreign currency between the trade and settlement dates on security transactions, and the difference between the amounts of dividends, interest and foreign withholding taxes recorded on transaction date and the U.S. dollar equivalent of the amounts actually received or paid. Unrealized gains and losses on assets and liabilities in foreign currencies arise from changes in the value of foreign currency, and from assets and liabilities denominated in foreign currencies, other than investments, which are held at period end.
Investment Transactions and Income. For financial reporting purposes, the Fund's investment holdings and NAV include trades executed through the end of the last business day of the period. The NAV per share for processing shareholder transactions is calculated as of the close of business of the New York Stock Exchange (NYSE), normally 4:00 p.m. Eastern time and includes trades executed through the end of the prior business day. Gains and losses on securities sold are determined on the basis of identified cost. Dividend income is recorded on the ex-dividend date, except for certain dividends from foreign securities where the ex-dividend date may have passed, which are recorded as soon as the Fund is informed of the ex-dividend date. Non-cash dividends included in dividend income, if any, are recorded at the fair market value of the securities received. Income and capital gain distributions from Fidelity Central Funds, if any, are recorded on the ex-dividend date. Interest income is accrued as earned and includes coupon interest and amortization of premium and accretion of discount on debt securities as applicable. Paid in Kind (PIK) income is recorded at the fair market value of the securities received. Investment income is recorded net of foreign taxes withheld where recovery of such taxes is uncertain. Debt obligations may be placed on non-accrual status and related interest income may be reduced by ceasing current accruals and writing off interest receivables when the collection of all or a portion of interest has become doubtful based on consistently applied procedures. A debt obligation is removed from non-accrual status when the issuer resumes interest payments or when collectability of interest is reasonably assured. Funds may file withholding tax reclaims in certain jurisdictions to recover a portion of amounts previously withheld. Any withholding tax reclaims income is included in the Statement of Operations in foreign taxes withheld. Any receivables for withholding tax reclaims are included in the Statement of Assets and Liabilities in interest receivable.
Expenses. Expenses directly attributable to a fund are charged to that fund. Expenses attributable to more than one fund are allocated among the respective funds on the basis of relative net assets or other appropriate methods. Expenses included in the accompanying financial statements reflect the expenses of that fund and do not include any expenses associated with any underlying mutual funds or exchange-traded funds. Although not included in a fund's expenses, a fund indirectly bears its proportionate share of these expenses through the net asset value of each underlying mutual fund or exchange-traded fund. Expense estimates are accrued in the period to which they relate and adjustments are made when actual amounts are known.
Income Tax Information and Distributions to Shareholders. Each year, the Fund intends to qualify as a regulated investment company under Subchapter M of the Internal Revenue Code, including distributing substantially all of its taxable income and realized gains. As a result, no provision for U.S. Federal income taxes is required. As of December 31, 2024, the Fund did not have any unrecognized tax benefits in the financial statements; nor is the Fund aware of any tax positions for which it is reasonably possible that the total amounts of unrecognized tax benefits will significantly change in the next twelve months. The Fund files a U.S. federal tax return, in addition to state and local tax returns as required. The Fund's federal income tax returns are subject to examination by the Internal Revenue Service (IRS) for a period of three fiscal years after they are filed. State and local tax returns may be subject to examination for an additional fiscal year depending on the jurisdiction. Foreign taxes are provided for based on the Fund's understanding of the tax rules and rates that exist in the foreign markets in which it invests.
Distributions are declared and recorded on the ex-dividend date. Income and capital gain distributions are determined in accordance with income tax regulations, which may differ from GAAP.
Capital accounts within the financial statements are adjusted for permanent book-tax differences. These adjustments have no impact on net assets or the results of operations. Capital accounts are not adjusted for temporary book-tax differences which will reverse in a subsequent period.
Book-tax differences are primarily due to futures contracts, swaps, foreign currency transactions, passive foreign investment companies (PFIC), market discount and losses deferred due to wash sales.
As of period end, the cost and unrealized appreciation (depreciation) in securities, and derivatives if applicable, for federal income tax purposes were as follows:
| Gross unrealized appreciation | $16,994,430 |
| Gross unrealized depreciation | (7,327,612) |
| Net unrealized appreciation (depreciation) | $9,666,818 |
| Tax Cost | $694,014,991 |
The tax-based components of distributable earnings as of period end were as follows:
| Undistributed ordinary income | $2,714,322 |
| Net unrealized appreciation (depreciation) on securities and other investments | $9,448,185 |
The tax character of distributions paid was as follows:
| | December 31, 2024 | December 21, 2023A |
| Ordinary Income | $19,396,125 | $7,442,276 |
| Long-term Capital Gains | 1,892,041 | - |
| Total | $21,288,166 | $7,442,276 |
A For the period March 1, 2023 (commencement of operations) through December 31, 2023.
Restricted Securities (including Private Placements). Funds may invest in securities that are subject to legal or contractual restrictions on resale. These securities generally may be resold in transactions exempt from registration or to the public if the securities are registered. Disposal of these securities may involve time-consuming negotiations and expense, and prompt sale at an acceptable price may be difficult. Information regarding restricted securities held at period end is included at the end of the Schedule of Investments, if applicable.
New Accounting Pronouncement. FASB Accounting Standards Update (ASU) 2023-07 Segment Reporting (Topic 280): Improvements to Reportable Segment Disclosures became effective in this reporting period. ASU 2023-07 enhances segment information disclosure in the notes to financial statements.
4. Derivative Instruments.
Risk Exposures and the Use of Derivative Instruments. The Fund's investment objectives allow for various types of derivative instruments, including futures contracts, forward foreign currency contracts and swaps. Derivatives are investments whose value is primarily derived from underlying assets, indices or reference rates and may be transacted on an exchange or over-the-counter (OTC). Derivatives may involve a future commitment to buy or sell a specified asset based on specified terms, to exchange future cash flows at periodic intervals based on a notional principal amount, or for one party to make one or more payments upon the occurrence of specified events in exchange for periodic payments from the other party.
Derivatives were used to increase returns, to gain exposure to certain types of assets, to facilitate transactions in foreign-denominated securities and to manage exposure to certain risks as defined below. The success of any strategy involving derivatives depends on analysis of numerous economic factors, and if the strategies for investment do not work as intended, the objectives may not be achieved.
Derivatives were used to increase or decrease exposure to the following risk(s):
| Credit Risk | Credit risk relates to the ability of the issuer of a financial instrument to make further principal or interest payments on an obligation or commitment that it has to a fund. |
| Foreign Exchange Risk | Foreign exchange rate risk relates to fluctuations in the value of an asset or liability due to changes in currency exchange rates. |
| Interest Rate Risk | Interest rate risk relates to the fluctuations in the value of interest-bearing securities due to changes in the prevailing levels of market interest rates. |
Funds are also exposed to additional risks from investing in derivatives, such as liquidity risk and counterparty credit risk. Liquidity risk is the risk that a fund will be unable to close out the derivative in the open market in a timely manner. Counterparty credit risk is the risk that the counterparty will not be able to fulfill its obligation to a fund. Derivative counterparty credit risk is managed through formal evaluation of the creditworthiness of all potential counterparties. On certain OTC derivatives such as forward foreign currency contracts and bi-lateral swaps, a fund attempts to reduce its exposure to counterparty credit risk by entering into an International Swaps and Derivatives Association, Inc. (ISDA) Master Agreement with each of its counterparties. The ISDA Master Agreement gives a fund the right to terminate all transactions traded under such agreement upon the deterioration in the credit quality of the counterparty beyond specified levels. The ISDA Master Agreement gives each party the right, upon an event of default by the other party or a termination of the agreement, to close out all transactions traded under such agreement and to net amounts owed under each transaction to one net payable by one party to the other. To mitigate counterparty credit risk on bi-lateral OTC derivatives, a fund receives collateral in the form of cash or securities once net unrealized appreciation on outstanding derivative contracts under an ISDA Master Agreement exceeds certain applicable thresholds, subject to certain minimum transfer provisions. The collateral received is held in segregated accounts with the custodian bank in accordance with the collateral agreements entered into between a fund, the counterparty and the custodian bank. A fund could experience delays and costs in gaining access to the collateral even though it is held by the custodian bank. The maximum risk of loss to a fund from counterparty credit risk related to bi-lateral OTC derivatives is generally the aggregate unrealized appreciation and unpaid counterparty payments in excess of any collateral pledged by the counterparty to a fund. A fund may be required to pledge collateral for the benefit of the counterparties on bi-lateral OTC derivatives in an amount not less than each counterparty's unrealized appreciation on outstanding derivative contracts, subject to certain minimum transfer provisions, and any such pledged collateral is identified in the Schedule of Investments. Exchange-traded contracts are not covered by the ISDA Master Agreement; however counterparty credit risk related to these contracts may be mitigated by the protection provided by the exchange on which they trade. A summary of derivatives inclusive of potential netting arrangements is presented at the end of the Schedule of Investments.
Investing in derivatives may involve greater risks than investing in the underlying assets directly and, to varying degrees, may involve risk of loss in excess of any initial investment and collateral received and amounts recognized in the Statement of Assets and Liabilities. In addition, there may be the risk that the change in value of the derivative contract does not correspond to the change in value of the underlying instrument.
Net Realized Gain (Loss) and Change in Net Unrealized Appreciation (Depreciation) on Derivatives. The table below, which reflects the impacts of derivatives on the financial performance, summarizes the net realized gain (loss) and change in net unrealized appreciation (depreciation) for derivatives during the period as presented in the Statement of Operations.
| Primary Risk Exposure / Derivative Type | Net Realized Gain (Loss)($) | Change in Net Unrealized Appreciation (Depreciation)($) |
| Fidelity SAI International Credit Fund | | |
| Credit Risk | | |
| Swaps | (194,423) | (50,784) |
| Total Credit Risk | (194,423) | (50,784) |
| Foreign Exchange Risk | | |
| Forward Foreign Currency Contracts | 9,869,140 | 9,798,296 |
| Total Foreign Exchange Risk | 9,869,140 | 9,798,296 |
| Interest Rate Risk | | |
| Futures Contracts | 54,865 | (987,382) |
| Total Interest Rate Risk | 54,865 | (987,382) |
| Totals | 9,729,582 | 8,760,130 |
If there are any open positions at period end, a summary of the value of derivatives by primary risk exposure is included at the end of the Schedule of Investments.
Forward Foreign Currency Contracts. Forward foreign currency contracts represent obligations to purchase or sell foreign currency on a specified future date at a price fixed at the time the contracts are entered into. Forward foreign currency contracts were used to facilitate transactions in foreign-denominated securities and to manage exposure to certain foreign currencies.
Forward foreign currency contracts are valued daily and fluctuations in exchange rates on open contracts are recorded as unrealized appreciation or (depreciation) and reflected in total accumulated earnings (loss) in the Statement of Assets and Liabilities. When the contract is closed, a gain or loss is realized equal to the difference between the closing value and the value at the time it was opened. Non-deliverable forward foreign currency exchange contracts are settled with the counterparty in cash without the delivery of foreign currency. The net realized gain (loss) and change in net unrealized appreciation (depreciation) on forward foreign currency contracts during the period is presented in the Statement of Operations.
Any open forward foreign currency contracts at period end are presented in the Schedule of Investments under the caption "Forward Foreign Currency Contracts." The contract amount and unrealized appreciation (depreciation) reflects each contract's exposure to the underlying currency at period end, and is representative of volume of activity during the period, unless an average contract value is presented in the table below.
| | Average Contracts Amount ($) |
| Fidelity SAI International Credit Fund | 322,972,744 |
Futures Contracts. A futures contract is an agreement between two parties to buy or sell a specified underlying instrument for a fixed price at a specified future date. Futures contracts were used to manage exposure to the bond market and fluctuations in interest rates.
Upon entering into a futures contract, a fund is required to deposit either cash or securities (initial margin) with a clearing broker in an amount equal to a certain percentage of the face value of the contract. Futures contracts are marked-to-market daily and subsequent daily payments are made or received by a fund depending on the daily fluctuations in the value of the futures contracts and are recorded as unrealized appreciation or (depreciation). This receivable and/or payable, if any, is included in daily variation margin on futures contracts in the Statement of Assets and Liabilities. Realized gain or (loss) is recorded upon the expiration or closing of a futures contract. The net realized gain (loss) and change in net unrealized appreciation (depreciation) on futures contracts during the period is presented in the Statement of Operations.
Any open futures contracts at period end are presented in the Schedule of Investments under the caption "Futures Contracts". The notional amount at value reflects each contract's exposure to the underlying instrument or index at period end, and is representative of volume of activity during the period.
Any securities deposited to meet initial margin requirements are identified in the Schedule of Investments. Any cash deposited to meet initial margin requirements is presented as segregated cash with brokers for derivative instruments in the Statement of Assets and Liabilities.
Swaps. A swap is a contract between two parties to exchange future cash flows at periodic intervals based on a notional principal amount. A bi-lateral OTC swap is a transaction between a fund and a dealer counterparty where cash flows are exchanged between the two parties for the life of the swap.
Bi-lateral OTC swaps are marked-to-market daily and changes in value are reflected in the Statement of Assets and Liabilities in the bi-lateral OTC swaps at value line items. Any upfront premiums paid or received upon entering a bi-lateral OTC swap to compensate for differences between stated terms of the swap and prevailing market conditions (e.g. credit spreads, interest rates or other factors) are recorded in total accumulated earnings (loss) in the Statement of Assets and Liabilities and amortized to realized gain or (loss) ratably over the term of the swap. Any unamortized upfront premiums are presented in the Schedule of Investments.
Payments are exchanged at specified intervals, accrued daily commencing with the effective date of the contract and recorded as realized gain or (loss). Some swaps may be terminated prior to the effective date and realize a gain or loss upon termination. The net realized gain (loss) and change in net unrealized appreciation (depreciation) on swaps during the period is presented in the Statement of Operations.
Any open swaps at period end are included in the Schedule of Investments under the caption "Swaps", and are representative of volume of activity during the period.
Credit Default Swaps. Credit default swaps enable a fund to buy or sell protection against specified credit events on a single-name issuer or a traded credit index. Under the terms of a credit default swap the buyer of protection (buyer) receives credit protection in exchange for making periodic payments to the seller of protection (seller) based on a fixed percentage applied to a notional principal amount. In return for these payments, the seller will be required to make a payment upon the occurrence of one or more specified credit events. A fund enters into credit default swaps as a seller to gain credit exposure to an issuer and/or as a buyer to obtain a measure of protection against defaults of an issuer. Periodic payments are made over the life of the contract by the buyer provided that no credit event occurs.
For credit default swaps on most corporate and sovereign issuers, credit events include bankruptcy, failure to pay or repudiation/moratorium. For credit default swaps on corporate or sovereign issuers, the obligation that may be put to the seller is not limited to the specific reference obligation described in the Schedule of Investments. For credit default swaps on asset-backed securities, a credit event may be triggered by events such as failure to pay principal, maturity extension, rating downgrade or write-down. For credit default swaps on asset-backed securities, the reference obligation described represents the security that may be put to the seller. For credit default swaps on a traded credit index, a specified credit event may affect all or individual underlying securities included in the index.
As a seller, if an underlying credit event occurs, a fund will pay a net settlement amount of cash equal to the notional amount of the swap less the recovery value of the reference obligation or underlying securities comprising an index. Only in the event of the industry's inability to value the underlying asset will a fund be required to take delivery of the reference obligation or underlying securities comprising an index and pay an amount equal to the notional amount of the swap.
As a buyer, if an underlying credit event occurs, a fund will receive a net settlement amount of cash equal to the notional amount of the swap less the recovery value of the reference obligation or underlying securities comprising an index. Only in the event of the industry's inability to value the underlying asset will a fund be required to deliver the reference obligation or underlying securities comprising an index in exchange for payment of an amount equal to the notional amount of the swap.
Typically, the value of each credit default swap and credit rating disclosed for each reference obligation in the Schedule of Investments, where a fund is the seller, can be used as measures of the current payment/performance risk of the swap. As the value of the swap changes as a positive or negative percentage of the total notional amount, the payment/performance risk may decrease or increase, respectively. In addition to these measures, the investment adviser monitors a variety of factors including cash flow assumptions, market activity and market sentiment as part of its ongoing process of assessing payment/performance risk.
5. Purchases and Sales of Investments.
Purchases and sales of securities, other than short-term securities, U.S. government securities and in-kind transactions, as applicable, are noted in the table below.
| | Purchases ($) | Sales ($) |
| Fidelity SAI International Credit Fund | 439,415,003 | 198,903,929 |
6. Fees and Other Transactions with Affiliates.
Management Fee. Fidelity Management & Research Company LLC (the investment adviser) and its affiliates provide the Fund with investment management related services for which the Fund pays a monthly management fee that is based on an annual rate of .40% of the Fund's average net assets.
Interfund Trades. Funds may purchase from or sell securities to other Fidelity Funds under procedures adopted by the Board. The procedures have been designed to ensure these interfund trades are executed in accordance with Rule 17a-7 of the 1940 Act. Any interfund trades are included within the respective purchases and sales amounts shown in the Purchases and Sales of Investments note. During the period, there were no interfund trades.
Prior Fiscal Year Affiliated Exchanges In-Kind. Shares that were exchanged for investments, including accrued interest and cash, if any, are shown in the table below. The amount of in-kind exchanges is included in share transactions in the accompanying Statement of Changes in Net Assets.
| | Shares | Total Proceeds ($) |
| Fidelity SAI International Credit Fund | 2,565,606 | 25,630,401 |
Sub-Advisory Arrangements. Effective March 1, 2024, the Fund's sub-advisory agreements with FMR Investment Management (UK) Limited, Fidelity Management & Research (Hong Kong) Limited, and Fidelity Management & Research (Japan) Limited were amended to provide that the investment adviser pays each sub-adviser monthly fees equal to 110% of the sub-adviser's costs for providing sub-advisory services.
7. Committed Line of Credit.
Certain Funds participate with other funds managed by the investment adviser or an affiliate in a $4.25 billion credit facility (the "line of credit") to be utilized for temporary or emergency purposes to fund shareholder redemptions or for other short-term liquidity purposes.
Commitment fees are charged based on the unused amount of the line of credit at an annual rate of .10%, and then allocated to each participating fund based on its pro-rata portion of the line of credit. The commitment fees are reflected in Miscellaneous expenses on the Statement of Operations, and are listed below.
Interest is charged to a participating fund based on its borrowings at an annual rate of .75% plus the highest of (i) daily SOFR plus a .10% spread adjustment, (ii) Federal Funds Effective Rate, or (iii) Overnight Bank Funding Rate. During the period, there were no borrowings on this line of credit.
The line of credit agreement will expire in March 2025 unless extended or renewed.| | Amount ($) |
| Fidelity SAI International Credit Fund | 543 |
8. Expense Reductions.
The investment adviser contractually agreed to reimburse the Fund to the extent annual operating expenses exceeded .41% of average net assets. This reimbursement will remain in place through April 30, 2026. Some expenses, for example the compensation of the independent Trustees, and certain miscellaneous expenses such as proxy and shareholder meeting expenses, are excluded from this reimbursement. During the period this reimbursement reduced the Fund's expenses by $178,339.
Through arrangements with the Fund's custodian, credits realized as a result of certain uninvested cash balances were used to reduce the Fund's expenses by $1,381.
9. Other.
A fund's organizational documents provide former and current trustees and officers with a limited indemnification against liabilities arising in connection with the performance of their duties to the fund. In the normal course of business, a fund may also enter into contracts that provide general indemnifications. A fund's maximum exposure under these arrangements is unknown as this would be dependent on future claims that may be made against a fund. The risk of material loss from such claims is considered remote.
In addition, at the end of the period, the following mutual funds managed by the investment adviser or its affiliates were the owners of record of 10% or more of the total outstanding shares.
| | Strategic Advisers Fidelity Core Income Fund |
| Fidelity SAI International Credit Fund | 100% |
10. Risk and Uncertainties.
Many factors affect a fund's performance. Developments that disrupt global economies and financial markets, such as pandemics, epidemics, outbreaks of infectious diseases, war, terrorism, and environmental disasters, may significantly affect a fund's investment performance. The effects of these developments to a fund will be impacted by the types of securities in which a fund invests, the financial condition, industry, economic sector, and geographic location of an issuer, and a fund's level of investment in the securities of that issuer. Significant concentrations in security types, issuers, industries, sectors, and geographic locations may magnify the factors that affect a fund's performance.
Report of Independent Registered Public Accounting Firm
To the Board of Trustees of Fidelity Salem Street Trust and Shareholders of Fidelity SAI International Credit Fund
Opinion on the Financial Statements
We have audited the accompanying statement of assets and liabilities, including the schedule of investments, of Fidelity SAI International Credit Fund (one of the funds constituting Fidelity Salem Street Trust, referred to hereafter as the "Fund") as of December 31, 2024, the related statement of operations for the year ended December 31, 2024, and the statement of changes in net assets and the financial highlights for the year ended December 31, 2024 and for the period March 1, 2023 (commencement of operations) through December 31, 2023, including the related notes (collectively referred to as the "financial statements"). In our opinion, the financial statements present fairly, in all material respects, the financial position of the Fund as of December 31, 2024, the results of its operations for the year ended December 31, 2024, and the changes in its net assets and the financial highlights for the year ended December 31, 2024 and for the period March 1, 2023 (commencement of operations) through December 31, 2023 in conformity with accounting principles generally accepted in the United States of America.
Basis for Opinion
These financial statements are the responsibility of the Fund's management. Our responsibility is to express an opinion on the Fund's financial statements based on our audits. We are a public accounting firm registered with the Public Company Accounting Oversight Board (United States) (PCAOB) and are required to be independent with respect to the Fund in accordance with the U.S. federal securities laws and the applicable rules and regulations of the Securities and Exchange Commission and the PCAOB.
We conducted our audits of these financial statements in accordance with the standards of the PCAOB. Those standards require that we plan and perform the audit to obtain reasonable assurance about whether the financial statements are free of material misstatement, whether due to error or fraud.
Our audits included performing procedures to assess the risks of material misstatement of the financial statements, whether due to error or fraud, and performing procedures that respond to those risks. Such procedures included examining, on a test basis, evidence regarding the amounts and disclosures in the financial statements. Our audits also included evaluating the accounting principles used and significant estimates made by management, as well as evaluating the overall presentation of the financial statements. Our procedures included confirmation of securities owned as of December 31, 2024 by correspondence with the custodian and brokers; when replies were not received from brokers, we performed other auditing procedures. We believe that our audits provide a reasonable basis for our opinion.
/s/ PricewaterhouseCoopers LLP
Boston, Massachusetts
February 13, 2025
We have served as the auditor of one or more investment companies in the Fidelity group of funds since 1932.
Distributions
(Unaudited)
The dividend and capital gains distributions for the fund(s) are available on Fidelity.com or Institutional.Fidelity.com.
The fund hereby designates as a capital gain dividend with respect to the taxable year ended December 31, 2024, $1,440,326, or, if subsequently determined to be different, the net capital gain of such year.
A total of 22.61% of the dividends distributed during the fiscal year was derived from interest on U.S. Government securities which is generally exempt from state income tax.
The fund designates $15,365,065 of distributions paid during the fiscal year ended 2024 as qualifying to be taxed as section 163(j) interest dividends.
The amounts per share which represent income derived from sources within, and taxes paid to, foreign countries or possessions of the United States are as follows:
| | Pay Date | Income | Taxes |
| Fidelity SAI International Credit Fund | | | |
| | 04/08/2024 | $0.0592 | $0.0000 |
| | 07/08/2024 | $0.0475 | $0.0000 |
| | 10/07/2024 | $0.0548 | $0.0000 |
| | 12/19/2024 | $0.0755 | $0.0000 |
The fund will notify shareholders in January 2025 of amounts for use in preparing 2024 income tax returns.
Item 8: Changes in and Disagreements with Accountants for Open-End Management Investment Companies
(Unaudited)
Note: This is not applicable for any fund included in this document.
Item 9: Proxy Disclosures for Open-End Management Investment Companies
(Unaudited)
Note: This is not applicable for any fund included in this document.
Item 10: Remuneration Paid to Directors, Officers, and others of Open-End Management Investment Companies
(Unaudited)
Note: This information is disclosed as part of the financial statements for each Fund as part of Item 7: Financial Statements and Financial Highlights for Open-End Management Investment companies.
Item 11: Statement Regarding Basis for Approval of Investment Advisory Contract
(Unaudited)
Board Approval of Investment Advisory Contracts and Management Fees
Fidelity SAI International Credit Fund
Each year, the Board of Trustees, including the Independent Trustees (together, the Board), considers the renewal of the fund's management contract with Fidelity Management & Research Company LLC (FMR) and the sub-advisory agreements (together, the Advisory Contracts) for the fund. FMR and the sub-advisers are referred to herein as the Investment Advisers. The Board, assisted by the advice of fund counsel and Independent Trustees' counsel, requests and considers a broad range of information relevant to the renewal of the Advisory Contracts throughout the year.
The Board meets regularly and, at each of its meetings, covers an extensive agenda of topics and materials and considers factors that are relevant to its annual consideration of the renewal of the fund's Advisory Contracts, including the services and support provided to the fund and its shareholders. The Board's Operations Committee, of which all the Independent Trustees are members, meets regularly throughout the year and requests, receives and considers, among other matters, information related to the annual consideration of the renewal of the fund's Advisory Contracts before making its recommendation to the Board. The Board also meets as needed to review matters specifically related to the Board's annual consideration of the renewal of the Advisory Contracts. Members of the Board may also meet from time to time with trustees of other Fidelity funds through joint ad hoc committees to discuss certain matters relevant to all of the Fidelity funds.
At its September 2024 meeting, the Board unanimously determined to renew the fund's Advisory Contracts. In reaching its determination, the Board considered all factors it believed relevant, including (i) the nature, extent, and quality of the services provided to the fund and its shareholders (including the investment performance of the fund); (ii) the competitiveness relative to peer funds of the fund's management fee and the total expense ratio; (iii) the total costs of the services provided by and the profits realized by FMR and its affiliates (Fidelity) from its relationships with the fund; and (iv) the extent to which, if any, economies of scale exist and are realized as the fund grows, and whether any economies of scale are appropriately shared with fund shareholders. The Board also considered the broad range of investment choices available to shareholders from FMR's competitors and that the fund's shareholders have chosen to invest in the fund, which is part of the Fidelity family of funds. The Board's decision to renew the Advisory Contracts was not based on any single factor and the factors may have been weighed differently by different Trustees.
The Board reached a determination, with the assistance of fund counsel and Independent Trustees' counsel and through the exercise of its business judgment, that the renewal of the Advisory Contracts was in the best interests of the fund and its shareholders and that the compensation payable under the Advisory Contracts was fair and reasonable in light of all of the surrounding circumstances.
Nature, Extent, and Quality of Services Provided. The Board considered Fidelity's staffing as it relates to the fund, including the backgrounds and experience of investment personnel, and also considered the Investment Advisers' implementation of the fund's investment program. The Independent Trustees also had discussions with senior management of Fidelity's investment operations and investment groups. The Board considered the structure of the investment personnel compensation program and whether this structure provides appropriate incentives to act in the best interests of the fund. Additionally, the Board considered the portfolio managers' investments, if any, in the funds that they manage.
Resources Dedicated to Investment Management and Support Services. The Board reviewed the general qualifications and capabilities of Fidelity's investment staff, including its size, education, experience, and resources, as well as Fidelity's approach to recruiting, training, managing, and compensating investment personnel. The Board noted the resources devoted to Fidelity's global investment organization, and that Fidelity's analysts have extensive resources, tools and capabilities that allow them to conduct quantitative and fundamental analysis, as well as credit analysis of issuers, counterparties and guarantors. Further, the Board considered that Fidelity's investment professionals have sufficient access to global information and data so as to provide competitive investment results over time, and that those professionals also have access to sophisticated tools that permit them to assess portfolio construction and risk and performance attribution characteristics continuously, as well as to transmit new information and research conclusions rapidly around the world. Additionally, in its deliberations, the Board considered Fidelity's trading, risk management, compliance, cybersecurity, and technology and operations capabilities and resources, which are integral parts of the investment management process.
Shareholder and Administrative Services. The Board considered (i) the nature, extent, quality, and cost of advisory, administrative, and shareholder services performed by the Investment Advisers and their affiliates under the Advisory Contracts and under separate agreements covering transfer agency and pricing and bookkeeping services for the fund; (ii) the nature and extent of Fidelity's supervision of third party service providers, principally custodians, subcustodians, and pricing vendors; and (iii) the resources devoted by Fidelity to, and the record of compliance with, the fund's compliance policies and procedures, including with respect to liquidity and derivatives risk management. The Board also considered the fund's securities lending activities and any payments made to Fidelity relating to securities lending under a separate agreement.
The Board noted that the growth of fund assets over time across the complex allows Fidelity to reinvest in the development of services designed to enhance the value and convenience of the Fidelity funds as investment vehicles. These services include 24-hour access to account information and market information over the Internet and through telephone representatives, investor education materials and asset allocation tools. The Board also considered that it reviews customer service metrics such as telephone response times, continuity of services on the website and metrics addressing services at Fidelity Investor Centers.
Investment in a Large Fund Family. The Board considered the benefits to shareholders of investing in a fund that is part of a large family of funds offering a variety of investment disciplines and providing a large variety of fund investor services. The Board noted that Fidelity had taken, or had made recommendations to the Board that resulted in the Fidelity funds taking, a number of actions over the previous year that benefited particular funds and/or the Fidelity funds in general.
Investment Performance. The Board took into account discussions that occur with representatives of the Investment Advisers, and reports that it receives, at Board meetings throughout the year relating to fund investment performance. In this regard the Board noted that as part of regularly scheduled fund reviews and other reports to the Board on fund performance, the Board considered annualized return information for the fund for different time periods, measured against an appropriate securities market index (benchmark index). The Board also considered information about performance attribution. In its evaluation of fund investment performance at meetings throughout the year, the Board gave particular attention to information indicating underperformance of certain Fidelity funds over different time periods and discussed with the Investment Advisers the reasons for such underperformance.
In addition to reviewing absolute and relative fund performance, the Independent Trustees periodically consider the appropriateness of fund performance metrics in evaluating the results achieved. The Independent Trustees generally give greater weight to fund performance over longer time periods than over shorter time periods. Depending on the circumstances, the Independent Trustees may be satisfied with a fund's performance notwithstanding that it lags its benchmark index for certain periods.
Based on its review, the Board concluded that the nature, extent, and quality of services provided to the fund under the Advisory Contracts should continue to benefit the shareholders of the fund.
Competitiveness of Management Fee and Total Expense Ratio. The Board was provided with information regarding industry trends in management fees and expenses. In its review of the fund's management fee and total expense ratio, the Board considered the fund's management fee rate as well as other fund or class expenses, as applicable, such as transfer agent fees, pricing and bookkeeping fees, and custodial, legal, and audit fees. The Board noted that Fidelity may agree to waive fees or reimburse expenses from time to time, and the extent to which, if any, it has done so for the fund.
Comparisons of Management Fees and Total Expense Ratios. Among other things, the Board reviewed data for selected groups of competitive funds and classes (referred to as "mapped groups") that were compiled by Fidelity based on combining similar investment objective categories (as classified by Morningstar) that have comparable investment mandates. The data reviewed by the Board included (i) gross management fee comparisons (before taking into account expense reimbursements or caps) relative to the total universe of funds within the mapped group; (ii) gross management fee comparisons relative to a subset of non-Fidelity funds in the mapped group that are similar in size and management fee structure to the fund (referred to as the "asset size peer group"); (iii) total expense comparisons of the fund relative to funds and classes in the mapped group that have a similar sales load structure to the fund (referred to as the "similar sales load structure group"); and (iv) total expense comparisons of the fund relative to funds and classes in the similar sales load structure group that are similar in size and management fee structure to the fund (referred to as the "total expense asset size peer group"). The total expense asset size peer group comparison excludes performance adjustments and fund-paid 12b-1 fees to eliminate variability in fee structures.
The information provided to the Board indicated that the fund's management fee rate ranked below the competitive median of the mapped group for 2023 and below the competitive median of the asset size peer group for 2023. Further, the information provided to the Board indicated that the total expense ratio of the fund ranked below the competitive median of the similar sales load structure group for 2023 and below the competitive median of the total expense asset size peer group for 2023.
Fees Charged to Other Fidelity Clients. The Board also considered Fidelity fee structures and other information with respect to clients of Fidelity, such as other funds advised or subadvised by Fidelity, pension plan clients, and other institutional clients with similar mandates. The Board noted that a joint ad hoc committee created by it and the boards of other Fidelity funds periodically reviews and compares Fidelity's institutional investment advisory business with its business of providing services to the Fidelity funds and also noted the most recent findings of the committee. The Board noted that the committee's review included a consideration of the differences in services provided, fees charged, and costs incurred, as well as competition in the markets serving the different categories of clients.
Based on its review, the Board concluded that the fund's management fee is fair and reasonable in light of the services that the fund receives and the other factors considered. Further, based on its review of total expense ratios and fees charged to other Fidelity clients, the Board concluded that the fund's total expense ratio was reasonable in light of the services that the fund and its shareholders receive and the other factors considered.
Costs of the Services and Profitability. The Board considered the revenues earned and the expenses incurred by Fidelity in conducting the business of developing, marketing, distributing, managing, administering and servicing the fund and servicing the fund's shareholders. The Board also considered the level of Fidelity's profits in respect of all the Fidelity funds.
On an annual basis, Fidelity presents to the Board information about the profitability of its relationships with the fund. Fidelity calculates profitability information for each Fidelity fund, as well as aggregate profitability information for groups of Fidelity funds and all Fidelity funds, using a series of detailed revenue and cost allocation methodologies which originate with the books and records of Fidelity on which Fidelity's audited financial statements are based. The Audit Committee of the Board reviews any significant changes from the prior year's methodologies.
A public accounting firm has been engaged annually by the Board as part of the Board's assessment of Fidelity's profitability analysis. The engagement includes the review and assessment of the methodologies used by Fidelity in determining the revenues and expenses attributable to Fidelity's fund business. After considering the reports issued under the engagement and information provided by Fidelity, the Board concluded that while other allocation methods may also be reasonable, Fidelity's profitability methodologies are reasonable in all material respects.
The Board also reviewed Fidelity's non-fund businesses and potential indirect benefits such businesses may have received as a result of their association with Fidelity's fund business (i.e., fall-out benefits) as well as cases where Fidelity's affiliates may benefit from the funds' business. The Board considered areas where potential indirect benefits to the Fidelity funds from their relationships with Fidelity may exist. The Board's consideration of these matters was informed by the findings of a joint ad hoc committee created by it and the boards of other Fidelity funds to evaluate potential fall-out benefits.
The Board considered the costs of the services provided by and the profits realized by Fidelity in connection with the operation of the fund and was satisfied that the profitability was not excessive.
Economies of Scale. The Board considered whether there have been economies of scale in respect of the management of the Fidelity funds, whether the Fidelity funds (including the fund) have appropriately benefited from any such economies of scale, and whether there is potential for realization of any further economies of scale. The Board considered the extent to which the fund will benefit from economies of scale as assets grow through increased services to the fund, through waivers or reimbursements, or through fee or expense ratio reductions. The Board also noted that a committee created by it and the boards of other Fidelity funds periodically analyzes whether Fidelity attains economies of scale in respect of the management and servicing of the Fidelity funds, whether the Fidelity funds have appropriately benefited from such economies of scale, and whether there is potential for realization of any further economies of scale.
The Board concluded, taking into account the analysis of the committee, that economies of scale, if any, are being appropriately shared between fund shareholders and Fidelity.
Additional Information Requested by the Board. In order to develop fully the factual basis for consideration of the Fidelity funds' advisory contracts, the Board requested and received additional information on certain topics, including: (i) portfolio manager changes that have occurred during the past year; (ii) hiring, training, compensating, and retaining adviser and sub-adviser personnel; (iii) the terms of the funds' various management fee structures and arrangements for transfer agent and pricing and bookkeeping services; (iv) Fidelity's fund profitability methodology, profitability trends for certain funds, the allocation of various costs to different funds, and the impact of certain factors on fund profitability results; (v) the impact on fund profitability of recent industry trends, such as the growth in passively managed funds and the changes in flows for different types of funds; (vi) the types of management fee and total expense comparisons provided, and the challenges and limitations associated with such information; (vii) explanations regarding the relative total expense ratios and management fees of certain funds and classes, total expense and management fee competitive trends, and methodologies for total expense and management fee competitive comparisons; (viii) matters related to money market funds, exchange-traded funds, and target date funds; (ix) the arrangements with and compensation paid to certain fund sub-advisers and the treatment of such compensation within Fidelity's fund profitability methodology; and (x) the terms of management contracts between Fidelity and other funds and products not overseen by the Board.
Conclusion. Based on its evaluation of all of the conclusions noted above, and after considering all factors it believed relevant, the Board, including the Independent Trustees, concluded that the advisory and sub-advisory fee arrangements are fair and reasonable in light of all of the surrounding circumstances and that the fund's Advisory Contracts should be renewed through September 30, 2025.
1.9908914.101
ICR-ANN-0325
Item 8.
Changes in and Disagreements with Accountants for Open-End Management Investment Companies
See Item 7.
Item 9.
Proxy Disclosures for Open-End Management Investment Companies
See Item 7.
Item 10.
Remuneration Paid to Directors, Officers, and Others of Open-End Management Investment Companies
See Item 7.
Item 11.
Statement Regarding Basis for Approval of Investment Advisory Contract
See Item 7.
Item 12.
Disclosure of Proxy Voting Policies and Procedures for Closed-End Management Investment Companies
Not applicable.
Item 13.
Portfolio Managers of Closed-End Management Investment Companies
Not applicable.
Item 14.
Purchase of Equity Securities by Closed-End Management Investment Company and Affiliated Purchasers
Not applicable.
Item 15.
Submission of Matters to a Vote of Security Holders
There were no material changes to the procedures by which shareholders may recommend nominees to the trust’s Board of Trustees.
Item 16.
Controls and Procedures
(a)(i) The President and Treasurer and the Chief Financial Officer have concluded that the trust’s disclosure controls and procedures (as defined in Rule 30a-3(c) under the Investment Company Act) provide reasonable assurances that material information relating to the trust is made known to them by the appropriate persons, based on their evaluation of these controls and procedures as of a date within 90 days of the filing date of this report.
(a)(ii) There was no change in the trust’s internal control over financial reporting (as defined in Rule 30a-3(d) under the Investment Company Act) that occurred during the period covered by this report that has materially affected, or is reasonably likely to materially affect, the trust’s internal control over financial reporting.
Item 17.
Disclosure of Securities Lending Activities for Closed-End Management Investment Companies
Not applicable.
Item 18.
Recovery of Erroneously Awarded Compensation
(a)
Not applicable.
(b)
Not applicable.
Item 19.
Exhibits
SIGNATURES
Pursuant to the requirements of the Securities Exchange Act of 1934 and the Investment Company Act of 1940, the registrant has duly caused this report to be signed on its behalf by the undersigned, thereunto duly authorized.
Fidelity Salem Street Trust
|
By: | /s/Laura M. Del Prato |
| Laura M. Del Prato |
| President and Treasurer (Principal Executive Officer) |
|
|
Date: | February 21, 2025 |
Pursuant to the requirements of the Securities Exchange Act of 1934 and the Investment Company Act of 1940, this report has been signed below by the following persons on behalf of the registrant and in the capacities and on the dates indicated.
|
By: | /s/Laura M. Del Prato |
| Laura M. Del Prato |
| President and Treasurer (Principal Executive Officer) |
|
|
Date: | February 21, 2025 |
|
By: | /s/Stephanie Caron |
| Stephanie Caron |
| Chief Financial Officer (Principal Financial Officer) |
|
|
Date: | February 21, 2025 |