UNITED STATES
SECURITIES AND EXCHANGE COMMISSION
Washington, D.C. 20549
FORM N-CSR
CERTIFIED SHAREHOLDER REPORT OF REGISTERED
MANAGEMENT INVESTMENT COMPANIES
Investment Company Act file number 811-2105
Fidelity Salem Street Trust
(Exact name of registrant as specified in charter)
245 Summer St., Boston, Massachusetts 02210
(Address of principal executive offices) (Zip code)
William C. Coffey, Secretary
245 Summer St.
Boston, Massachusetts 02210
(Name and address of agent for service)
Registrant's telephone number, including area code:
617-563-7000
| |
Date of fiscal year end: | December 31 |
| |
Date of reporting period: | December 31, 2018 |
Item 1.
Reports to Stockholders
Fidelity® Series Inflation-Protected Bond Index Fund
Annual Report December 31, 2018 |
 |
Beginning on January 1, 2021, as permitted by regulations adopted by the Securities and Exchange Commission, paper copies of a fund’s shareholder reports will no longer be sent by mail, unless you specifically request paper copies of the reports from the fund or from your financial intermediary, such as a financial advisor, broker-dealer or bank. Instead, the reports will be made available on a website, and you will be notified by mail each time a report is posted and provided with a website link to access the report.
If you already elected to receive shareholder reports electronically, you will not be affected by this change and you need not take any action. You may elect to receive shareholder reports and other communications from a fund electronically, by contacting your financial intermediary. For Fidelity customers, visit Fidelity's web site or call Fidelity using the contact information listed below.
You may elect to receive all future reports in paper free of charge. If you wish to continue receiving paper copies of your shareholder reports, you may contact your financial intermediary or, if you are a Fidelity customer, visit Fidelity’s website, or call Fidelity at the applicable toll-free number listed below. Your election to receive reports in paper will apply to all funds held with the fund complex/your financial intermediary.
| Account Type | Website | Phone Number |
| Brokerage, Mutual Fund, or Annuity Contracts: | fidelity.com/mailpreferences | 1-800-343-3548 |
| Employer Provided Retirement Accounts: | netbenefits.fidelity.com/preferences (choose 'no' under Required Disclosures to continue to print) | 1-800-343-0860 |
| Advisor Sold Accounts Serviced Through Your Financial Intermediary: | Contact Your Financial Intermediary | Your Financial Intermediary's phone number |
| Advisor Sold Accounts Serviced by Fidelity: | institutional.fidelity.com | 1-877-208-0098 |
Contents
To view a fund's proxy voting guidelines and proxy voting record for the 12-month period ended June 30, visit http://www.fidelity.com/proxyvotingresults or visit the Securities and Exchange Commission's (SEC) web site at http://www.sec.gov.
You may also call 1-800-544-8544 to request a free copy of the proxy voting guidelines.
Standard & Poor's, S&P and S&P 500 are registered service marks of The McGraw-Hill Companies, Inc. and have been licensed for use by Fidelity Distributors Corporation.
Other third-party marks appearing herein are the property of their respective owners.
All other marks appearing herein are registered or unregistered trademarks or service marks of FMR LLC or an affiliated company. © 2019 FMR LLC. All rights reserved.
This report and the financial statements contained herein are submitted for the general information of the shareholders of the Fund. This report is not authorized for distribution to prospective investors in the Fund unless preceded or accompanied by an effective prospectus.
A fund files its complete schedule of portfolio holdings with the SEC for the first and third quarters of each fiscal year on Form N-Q. Forms N-Q are available on the SEC’s web site at http://www.sec.gov. A fund's Forms N-Q may be reviewed and copied at the SEC’s Public Reference Room in Washington, DC. Information regarding the operation of the SEC's Public Reference Room may be obtained by calling 1-800-SEC-0330.
For a complete list of a fund's portfolio holdings, view the most recent holdings listing, semiannual report, or annual report on Fidelity's web site at http://www.fidelity.com, http://www.institutional.fidelity.com, or http://www.401k.com, as applicable.
NOT FDIC INSURED •MAY LOSE VALUE •NO BANK GUARANTEE
Neither the Fund nor Fidelity Distributors Corporation is a bank.
Performance: The Bottom Line
Average annual total return reflects the change in the value of an investment, assuming reinvestment of distributions from dividend income and capital gains (the profits earned upon the sale of securities that have grown in value, if any) and assuming a constant rate of performance each year. The hypothetical investment and the average annual total returns do not reflect the deduction of taxes that a shareholder would pay on fund distributions or the redemption of fund shares. During periods of reimbursement by Fidelity, a fund’s total return will be greater than it would be had the reimbursement not occurred. How a fund did yesterday is no guarantee of how it will do tomorrow.
Average Annual Total Returns
| For the periods ended December 31, 2018 | Past 1 year | Past 5 years | Life of fundA |
| Fidelity® Series Inflation-Protected Bond Index Fund | (0.42)% | 1.05% | 2.12% |
A From September 29, 2009
$10,000 Over Life of Fund
Let's say hypothetically that $10,000 was invested in Fidelity® Series Inflation-Protected Bond Index Fund on September 29, 2009, when the fund started.
The chart shows how the value of your investment would have changed, and also shows how the Bloomberg Barclays U.S. 1-10 Year Treasury Inflation-Protected Securities (TIPS) Index (Series-L) performed over the same period.
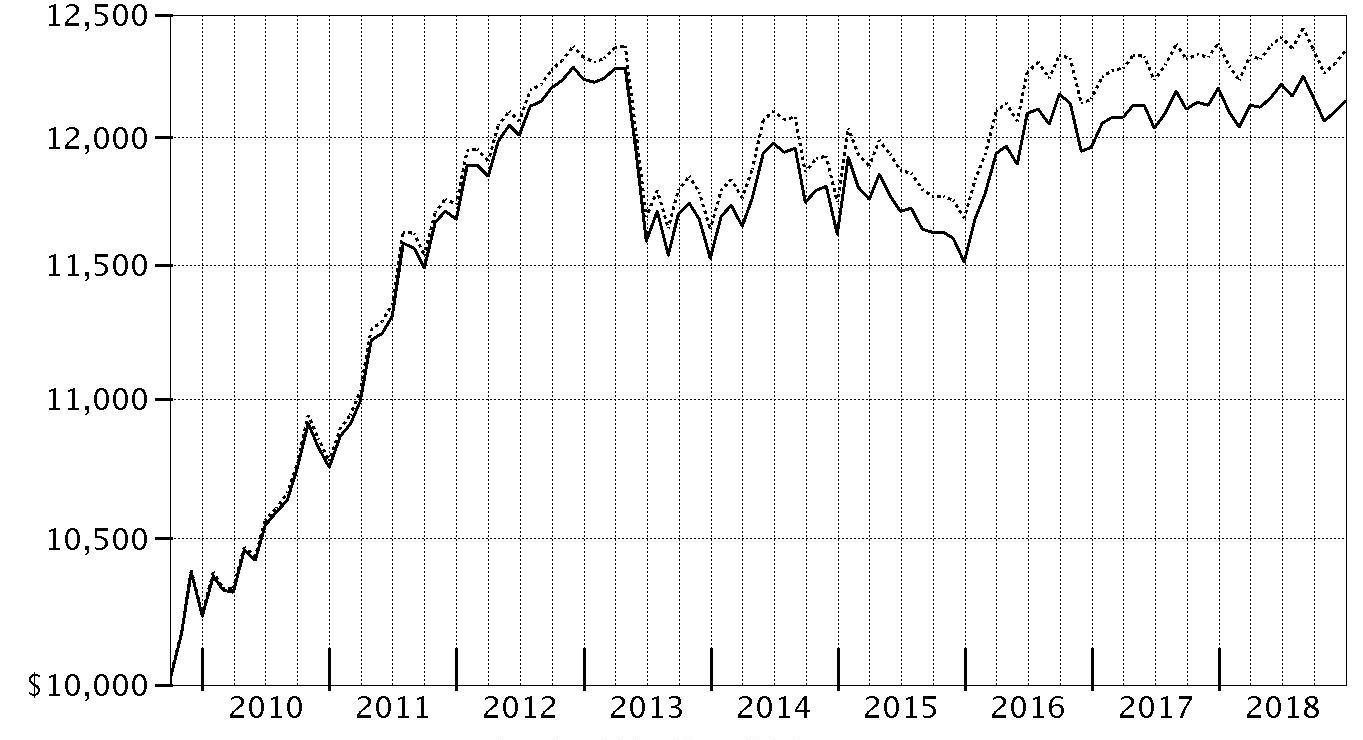
| Period Ending Values |
| $12,147 | Fidelity® Series Inflation-Protected Bond Index Fund |
| $12,351 | Bloomberg Barclays U.S. 1-10 Year Treasury Inflation-Protected Securities (TIPS) Index (Series-L) |
Management's Discussion of Fund Performance
Market Recap: U.S. taxable investment-grade bonds roughly broke even in 2018, as yields that gained early in the year fell notably in the fourth quarter. The Bloomberg Barclays U.S. Aggregate Bond Index gained 0.01% for the year. Longer-term bond yields advanced through mid-May, driven by policy-rate hikes, plans by the U.S. Federal Reserve to gradually reduce its balance sheet and tax reform that went into effect in January. Longer-term yields moderated in the summer, with spreads between shorter-term and longer-term Treasury bonds remaining tight, partly because of escalating global trade tension. Yields rose again in September and early October, amid increased inflation expectations and hints that central banks may curtail economic stimulus. Yields then declined notably and credit spreads widened in November and December due to broad market volatility, disappointing U.S. economic data, and signs of economic weakness in China and parts of Europe. Within the Bloomberg Barclays index, U.S. Treasuries (+0.86%) topped all major market segments. Conversely, investment-grade corporates (-2.51%) performed worst. Outside the index, most non-core fixed-income segments posted a negative return, while Treasury Inflation-Protected Securities (TIPS) returned -1.26%, as inflation expectations moderated near year-end.
Comments from Co-Portfolio Managers Brandon Bettencourt and Jay Small: For the year ending December 31, 2018, the fund returned -0.42%, net of fees. This was roughly in line with the -0.25% return of the benchmark Bloomberg Barclays U.S. 1-10 Year Treasury Inflation-Protected Securities (TIPS) Index (Series L). The fund's performance versus the benchmark was slightly curtailed by "pricing basis." The fund is typically priced at 4:00 p.m. Eastern Time, while the benchmark is priced at 3:00 p.m. Eastern. On December 31, 2018, the fund was priced at 4:00 p.m. Eastern, while the benchmark was priced at 1:00 p.m. Eastern due to the holiday-shortened trading hours for the U.S. bond market. This led to a fairly wide pricing dispersion on the last day of the period. We believe that the effects of pricing basis tend to smooth out over time. In managing the fund, we attempt to fully replicate the benchmark, holding all of its positions and in the same proportions. TIPS began the period on solid ground as improving economic growth pushed inflation expectations somewhat higher, but later faltered as economic growth and inflation expectations moderated. Longer-term inflation expectations, as measured by the 10-year breakeven rate, declined slightly by year end. TIPS underperformed comparable duration nominal U.S. Treasuries for the year.
The views expressed above reflect those of the portfolio manager(s) only through the end of the period as stated on the cover of this report and do not necessarily represent the views of Fidelity or any other person in the Fidelity organization. Any such views are subject to change at any time based upon market or other conditions and Fidelity disclaims any responsibility to update such views. These views may not be relied on as investment advice and, because investment decisions for a Fidelity fund are based on numerous factors, may not be relied on as an indication of trading intent on behalf of any Fidelity fund.
Investment Summary (Unaudited)
Coupon Distribution as of December 31, 2018
| | % of fund's investments |
| 0.01 - 0.99% | 79.8 |
| 1 - 1.99% | 11.1 |
| 2 - 2.99% | 7.4 |
| 3 - 3.99% | 1.8 |
Coupon distribution shows the range of stated interest rates on the fund's investments, excluding short-term investments.
The coupon rates on inflation-protected securities tend to be lower than their nominal bond counterparts since inflation-protected securities get adjusted for actual inflation, while nominal bond coupon rates include a component for expected inflation. Please refer to the fund's prospectus for more information.
Asset Allocation (% of fund's net assets)
| As of December 31, 2018* |
| | U.S. Government and U.S. Government Agency Obligations | 99.7% |
| | Short-Term Investments and Net Other Assets (Liabilities) | 0.3% |

* Inflation Protected Securities - 99.7%
Schedule of Investments December 31, 2018
Showing Percentage of Net Assets
| U.S. Treasury Inflation-Protected Obligations - 99.7% | | | |
| | | Principal Amount | Value |
| U.S. Treasury Inflation-Indexed Bonds: | | | |
| 1.75% 1/15/28 | | $99,215,992 | $105,435,617 |
| 2% 1/15/26 | | 123,178,099 | 131,508,142 |
| 2.375% 1/15/25 | | 169,102,053 | 182,890,938 |
| 2.375% 1/15/27 | | 99,105,338 | 109,445,085 |
| 3.625% 4/15/28 | | 83,539,408 | 102,605,170 |
| U.S. Treasury Inflation-Indexed Notes: | | | |
| 0.125% 4/15/20 | | 317,658,879 | 310,604,517 |
| 0.125% 4/15/21 | | 276,204,232 | 268,706,494 |
| 0.125% 1/15/22 | | 254,952,265 | 247,512,178 |
| 0.125% 4/15/22 | | 269,129,309 | 260,437,939 |
| 0.125% 7/15/22 | | 262,955,482 | 255,449,335 |
| 0.125% 1/15/23 | | 264,176,110 | 255,205,257 |
| 0.125% 7/15/24 | | 256,905,189 | 246,429,759 |
| 0.125% 7/15/26 | | 217,241,380 | 204,095,901 |
| 0.25% 1/15/25 | | 257,510,536 | 246,669,617 |
| 0.375% 7/15/23 | | 262,052,406 | 256,293,129 |
| 0.375% 7/15/25 | | 257,225,785 | 248,150,331 |
| 0.375% 1/15/27 | | 215,570,354 | 204,895,947 |
| 0.375% 7/15/27 | | 213,017,598 | 202,224,276 |
| 0.5% 1/15/28 | | 211,252,722 | 201,742,186 |
| 0.625% 7/15/21 | | 230,983,525 | 228,492,446 |
| 0.625% 4/15/23 | | 263,549,904 | 259,272,670 |
| 0.625% 1/15/24 | | 261,307,675 | 257,296,531 |
| 0.625% 1/15/26 | | 231,641,606 | 225,623,818 |
| 0.75% 7/15/28 | | 207,451,037 | 203,208,176 |
| 1.125% 1/15/21 | | 217,602,995 | 216,637,409 |
| 1.25% 7/15/20 | | 190,242,533 | 189,869,665 |
| 1.375% 1/15/20 | | 123,795,860 | 123,032,355 |
| TOTAL U.S. TREASURY INFLATION-PROTECTED OBLIGATIONS | | | |
| (Cost $5,853,083,371) | | | 5,743,734,888 |
| | | Shares | Value |
|
| Money Market Funds - 0.0% | | | |
| Fidelity Cash Central Fund, 2.42% (a) | | | |
| (Cost $47,731) | | 47,722 | 47,731 |
| TOTAL INVESTMENT IN SECURITIES - 99.7% | | | |
| (Cost $5,853,131,102) | | | 5,743,782,619 |
| NET OTHER ASSETS (LIABILITIES) - 0.3% | | | 17,018,063 |
| NET ASSETS - 100% | | | $5,760,800,682 |
Legend
(a) Affiliated fund that is generally available only to investment companies and other accounts managed by Fidelity Investments. The rate quoted is the annualized seven-day yield of the fund at period end. A complete unaudited listing of the fund's holdings as of its most recent quarter end is available upon request. In addition, each Fidelity Central Fund's financial statements, which are not covered by the Fund's Report of Independent Registered Public Accounting Firm, are available on the SEC's website or upon request.
Affiliated Central Funds
Information regarding fiscal year to date income earned by the Fund from investments in Fidelity Central Funds is as follows:
| Fund | Income earned |
| Fidelity Cash Central Fund | $29,484 |
| Total | $29,484 |
Amounts in the income column in the above table include any capital gain distributions from underlying funds, which are presented in the corresponding line-item in the Statement of Operations if applicable.
Investment Valuation
The following is a summary of the inputs used, as of December 31, 2018, involving the Fund's assets and liabilities carried at fair value. The inputs or methodology used for valuing securities may not be an indication of the risk associated with investing in those securities. For more information on valuation inputs, and their aggregation into the levels used below, please refer to the Investment Valuation section in the accompanying Notes to Financial Statements.
| | Valuation Inputs at Reporting Date: |
| Description | Total | Level 1 | Level 2 | Level 3 |
| Investments in Securities: | | | | |
| U.S. Government and Government Agency Obligations | $5,743,734,888 | $-- | $5,743,734,888 | $-- |
| Money Market Funds | 47,731 | 47,731 | -- | -- |
| Total Investments in Securities: | $5,743,782,619 | $47,731 | $5,743,734,888 | $-- |
Other Information
The composition of credit quality ratings as a percentage of Total Net Assets is as follows (Unaudited):
| U.S. Government and U.S. Government Agency Obligations | 99.7% |
| Short-Term Investments and Net Other Assets | 0.3% |
| | 100.0% |
We have used ratings from Moody's Investors Service, Inc. Where Moody's® ratings are not available, we have used S&P® ratings. All ratings are as of the date indicated and do not reflect subsequent changes.
See accompanying notes which are an integral part of the financial statements.
Financial Statements
Statement of Assets and Liabilities
| | | December 31, 2018 |
| Assets | | |
Investment in securities, at value — See accompanying schedule:
Unaffiliated issuers (cost $5,853,083,371) | $5,743,734,888 | |
| Fidelity Central Funds (cost $47,731) | 47,731 | |
| Total Investment in Securities (cost $5,853,131,102) | | $5,743,782,619 |
| Receivable for investments sold | | 108,814,330 |
| Receivable for fund shares sold | | 5,128,230 |
| Dividends receivable | | 540 |
| Interest receivable | | 15,267,068 |
| Distributions receivable from Fidelity Central Funds | | 3,064 |
| Total assets | | 5,872,995,851 |
| Liabilities | | |
| Payable for investments purchased | $79,025,521 | |
| Payable for fund shares redeemed | 33,150,279 | |
| Distributions payable | 28 | |
| Other payables and accrued expenses | 19,341 | |
| Total liabilities | | 112,195,169 |
| Net Assets | | $5,760,800,682 |
| Net Assets consist of: | | |
| Paid in capital | | $5,888,999,604 |
| Total distributable earnings (loss) | | (128,198,922) |
| Net Assets | | $5,760,800,682 |
| Net Asset Value and Maximum Offering Price | | |
| Net Asset Value, offering price and redemption price per share ($5,760,800,682 ÷ 603,617,486 shares) | | $9.54 |
See accompanying notes which are an integral part of the financial statements.
Statement of Operations
| | | Year ended December 31, 2018 |
| Investment Income | | |
| Interest | | $107,772,467 |
| Income from Fidelity Central Funds | | 29,484 |
| Total income | | 107,801,951 |
| Expenses | | |
| Custodian fees and expenses | $44,255 | |
| Independent trustees' fees and expenses | 17,455 | |
| Commitment fees | 8,243 | |
| Total expenses before reductions | 69,953 | |
| Expense reductions | (218) | |
| Total expenses after reductions | | 69,735 |
| Net investment income (loss) | | 107,732,216 |
| Realized and Unrealized Gain (Loss) | | |
| Net realized gain (loss) on: | | |
| Investment securities: | | |
| Unaffiliated issuers | (21,545,109) | |
| Fidelity Central Funds | 26 | |
| Total net realized gain (loss) | | (21,545,083) |
| Change in net unrealized appreciation (depreciation) on investment securities | | (112,480,750) |
| Net gain (loss) | | (134,025,833) |
| Net increase (decrease) in net assets resulting from operations | | $(26,293,617) |
See accompanying notes which are an integral part of the financial statements.
Statement of Changes in Net Assets
| | Year ended December 31, 2018 | Year ended December 31, 2017 |
| Increase (Decrease) in Net Assets | | |
| Operations | | |
| Net investment income (loss) | $107,732,216 | $50,851,761 |
| Net realized gain (loss) | (21,545,083) | (2,018,191) |
| Change in net unrealized appreciation (depreciation) | (112,480,750) | (5,424,071) |
| Net increase (decrease) in net assets resulting from operations | (26,293,617) | 43,409,499 |
| Distributions to shareholders | (101,903,392) | – |
| Distributions to shareholders from net investment income | – | (2,789,614) |
| Distributions to shareholders from net realized gain | – | (46,679,165) |
| Total distributions | (101,903,392) | (49,468,779) |
| Share transactions - net increase (decrease) | 3,486,701,134 | 157,979,534 |
| Total increase (decrease) in net assets | 3,358,504,125 | 151,920,254 |
| Net Assets | | |
| Beginning of period | 2,402,296,557 | 2,250,376,303 |
| End of period | $5,760,800,682 | $2,402,296,557 |
| Other Information | | |
| Undistributed net investment income end of period | | $3,588,006 |
See accompanying notes which are an integral part of the financial statements.
Financial Highlights
Fidelity Series Inflation-Protected Bond Index Fund
| Years ended December 31, | 2018 | 2017 | 2016 | 2015 | 2014 |
| Selected Per–Share Data | | | | | |
| Net asset value, beginning of period | $9.76 | $9.77 | $9.53 | $9.64 | $10.04 |
| Income from Investment Operations | | | | | |
| Net investment income (loss)A | .258 | .217 | .162 | .025 | .182 |
| Net realized and unrealized gain (loss) | (.300) | (.024) | .207 | (.114) | (.100) |
| Total from investment operations | (.042) | .193 | .369 | (.089) | .082 |
| Distributions from net investment income | (.030) | (.010) | (.006) | (.005) | (.016) |
| Distributions from net realized gain | (.148) | (.193) | (.123) | (.016) | (.466) |
| Total distributions | (.178) | (.203) | (.129) | (.021) | (.482) |
| Net asset value, end of period | $9.54 | $9.76 | $9.77 | $9.53 | $9.64 |
| Total ReturnB | (.42)% | 1.99% | 3.88% | (.92)% | .80% |
| Ratios to Average Net AssetsC,D | | | | | |
| Expenses before reductions | - %E | .06% | .20% | .20% | .20% |
| Expenses net of fee waivers, if any | - %E | .06% | .20% | .20% | .20% |
| Expenses net of all reductions | - %E | .06% | .20% | .20% | .20% |
| Net investment income (loss) | 2.67% | 2.21% | 1.65% | .26% | 1.82% |
| Supplemental Data | | | | | |
| Net assets, end of period (000 omitted) | $5,760,801 | $2,402,297 | $1,013,090 | $770,606 | $528,147 |
| Portfolio turnover rateF | 25% | 25% | 26% | 33% | 26% |
A Calculated based on average shares outstanding during the period.
B Total returns would have been lower if certain expenses had not been reduced during the applicable periods shown.
C Fees and expenses of any underlying Fidelity Central Funds are not included in the Fund's expense ratio. The Fund indirectly bears its proportionate share of the expenses of any underlying Fidelity Central Funds.
D Expense ratios reflect operating expenses of the fund. Expenses before reductions do not reflect amounts reimbursed by the investment adviser or reductions from expense offset arrangements and do not represent the amount paid by the fund during periods when reimbursements or reductions occur. Expenses net of fee waivers reflect expenses after reimbursement by the investment adviser but prior to reductions from expense offset arrangements. Expenses net of all reductions represent the net expenses paid by the fund.
E Amount represents less than .005%.
F Amount does not include the portfolio activity of any underlying Fidelity Central Funds.
See accompanying notes which are an integral part of the financial statements.
Notes to Financial Statements
For the period ended December 31, 2018
1. Organization.
Fidelity Series Inflation-Protected Bond Index Fund (the Fund) is a fund of Fidelity Salem Street Trust (the Trust) and is authorized to issue an unlimited number of shares. Shares of the Fund are only available for purchase by mutual funds for which Fidelity Management & Research Company (FMR) or an affiliate serves as an investment manager. The Trust is registered under the Investment Company Act of 1940, as amended (the 1940 Act), as an open-end management investment company organized as a Massachusetts business trust.
Effective August 28, 2017, the Fund no longer offered Class F, and all outstanding shares of Class F were exchanged for shares of Fidelity Series Inflation-Protected Bond Index.
2. Investments in Fidelity Central Funds.
The Fund invests in Fidelity Central Funds, which are open-end investment companies generally available only to other investment companies and accounts managed by the investment adviser and its affiliates. The Fund's Schedule of Investments lists each of the Fidelity Central Funds held as of period end, if any, as an investment of the Fund, but does not include the underlying holdings of each Fidelity Central Fund. As an Investing Fund, the Fund indirectly bears its proportionate share of the expenses of the underlying Fidelity Central Funds.
The Money Market Central Funds seek preservation of capital and current income and are managed by Fidelity Investments Money Management, Inc. (FIMM), an affiliate of the investment adviser. Annualized expenses of the Money Market Central Funds as of their most recent shareholder report date are less than .005%.
A complete unaudited list of holdings for each Fidelity Central Fund is available upon request or at the Securities and Exchange Commission (the SEC) website at www.sec.gov. In addition, the financial statements of the Fidelity Central Funds, which are not covered by the Fund's Report of Independent Registered Public Accounting Firm, are available on the SEC website or upon request.
3. Significant Accounting Policies.
The Fund is an investment company and applies the accounting and reporting guidance of the Financial Accounting Standards Board (FASB) Accounting Standards Codification Topic 946 Financial Services – Investments Companies. The financial statements have been prepared in conformity with accounting principles generally accepted in the United States of America (GAAP), which require management to make certain estimates and assumptions at the date of the financial statements. Actual results could differ from those estimates. Subsequent events, if any, through the date that the financial statements were issued have been evaluated in the preparation of the financial statements. The following summarizes the significant accounting policies of the Fund:
Investment Valuation. Investments are valued as of 4:00 p.m. Eastern time on the last calendar day of the period. The Board of Trustees (the Board) has delegated the day to day responsibility for the valuation of the Fund's investments to the Fair Value Committee (the Committee) established by the Fund's investment adviser. In accordance with valuation policies and procedures approved by the Board, the Fund attempts to obtain prices from one or more third party pricing vendors or brokers to value its investments. When current market prices, quotations or currency exchange rates are not readily available or reliable, investments will be fair valued in good faith by the Committee, in accordance with procedures adopted by the Board. Factors used in determining fair value vary by investment type and may include market or investment specific events, changes in interest rates and credit quality. The frequency with which these procedures are used cannot be predicted and they may be utilized to a significant extent. The Committee oversees the Fund's valuation policies and procedures and reports to the Board on the Committee's activities and fair value determinations. The Board monitors the appropriateness of the procedures used in valuing the Fund's investments and ratifies the fair value determinations of the Committee.
The Fund categorizes the inputs to valuation techniques used to value its investments into a disclosure hierarchy consisting of three levels as shown below:
- Level 1 – quoted prices in active markets for identical investments
- Level 2 – other significant observable inputs (including quoted prices for similar investments, interest rates, prepayment speeds, etc.)
- Level 3 – unobservable inputs (including the Fund's own assumptions based on the best information available)
Valuation techniques used to value the Fund's investments by major category are as follows:
Debt securities, including restricted securities, are valued based on evaluated prices received from third party pricing vendors or from brokers who make markets in such securities. U.S. government and government agency obligations are valued by pricing vendors who utilize matrix pricing which considers yield or price of bonds of comparable quality, coupon, maturity and type or by broker-supplied prices. When independent prices are unavailable or unreliable, debt securities may be valued utilizing pricing methodologies which consider similar factors that would be used by third party pricing vendors. Debt securities are generally categorized as Level 2 in the hierarchy but may be Level 3 depending on the circumstances.
Investments in open-end mutual funds, including the Fidelity Central Funds, are valued at their closing net asset value (NAV) each business day and are categorized as Level 1 in the hierarchy.
Changes in valuation techniques may result in transfers in or out of an assigned level within the disclosure hierarchy. The aggregate value of investments by input level as of December 31, 2018 is included at the end of the Fund's Schedule of Investments.
Investment Transactions and Income. For financial reporting purposes, the Fund's investment holdings and NAV include trades executed through the end of the last business day of the period. The NAV per share for processing shareholder transactions is calculated as of the close of business of the New York Stock Exchange (NYSE), normally 4:00 p.m. Eastern time and includes trades executed through the end of the prior business day. Gains and losses on securities sold are determined on the basis of identified cost. Income and capital gain distributions from Fidelity Central Funds, if any, are recorded on the ex-dividend date. Interest income is accrued as earned and includes coupon interest and amortization of premium and accretion of discount on debt securities as applicable. For Treasury Inflation-Protected Securities (TIPS) the principal amount is adjusted daily to keep pace with inflation. Interest is accrued based on the adjusted principal amount. The adjustments to principal due to inflation are reflected as increases or decreases to Interest in the accompanying Statement of Operations. Such adjustments may have a significant impact on the Fund's distributions.
Expenses. Expenses directly attributable to a fund are charged to that fund. Expenses attributable to more than one fund are allocated among the respective funds on the basis of relative net assets or other appropriate methods. Expense estimates are accrued in the period to which they relate and adjustments are made when actual amounts are known.
Income Tax Information and Distributions to Shareholders. Each year, the Fund intends to qualify as a regulated investment company under Subchapter M of the Internal Revenue Code, including distributing substantially all of its taxable income and realized gains. As a result, no provision for U.S. Federal income taxes is required. As of December 31, 2018, the Fund did not have any unrecognized tax benefits in the financial statements; nor is the Fund aware of any tax positions for which it is reasonably possible that the total amounts of unrecognized tax benefits will significantly change in the next twelve months. The Fund files a U.S. federal tax return, in addition to state and local tax returns as required. The Fund's federal income tax returns are subject to examination by the Internal Revenue Service (IRS) for a period of three fiscal years after they are filed. State and local tax returns may be subject to examination for an additional fiscal year depending on the jurisdiction.
Distributions are declared and recorded daily and paid monthly from net investment income. Distributions from realized gains, if any, are declared and recorded on the ex-dividend date. Income and capital gain distributions are determined in accordance with income tax regulations, which may differ from GAAP.
Capital accounts within the financial statements are adjusted for permanent book-tax differences. These adjustments have no impact on net assets or the results of operations. Capital accounts are not adjusted for temporary book-tax differences which will reverse in a subsequent period.
Book-tax differences are primarily due to market discount, capital loss carryforwards, certain losses related to deflation adjustments on U.S. Treasury inflation-indexed securities and losses deferred due to wash sales.
As of period end, the cost and unrealized appreciation (depreciation) in securities, and derivatives if applicable, for federal income tax purposes were as follows:
| Gross unrealized appreciation | $705,835 |
| Gross unrealized depreciation | (112,411,745) |
| Net unrealized appreciation (depreciation) | $(111,705,910) |
| Tax Cost | $5,855,488,529 |
The tax-based components of distributable earnings as of period end were as follows:
| Capital loss carryforward | $(15,234,560) |
| Net unrealized appreciation (depreciation) on securities and other investments | $(111,705,910) |
Capital loss carryforwards are only available to offset future capital gains of the Fund to the extent provided by regulations and may be limited. Under the Regulated Investment Company Modernization Act of 2010 (the Act), the Fund is permitted to carry forward capital losses incurred in taxable years beginning after December 22, 2010 for an unlimited period and such capital losses are required to be used prior to any losses that expire. The capital loss carryforward information presented below, including any applicable limitation, is estimated as of fiscal period end and is subject to adjustment.
| No expiration | |
| Short-term | $(5,849,051) |
| Long-term | (9,385,509) |
| Total capital loss carryforward | $(15,234,560) |
The tax character of distributions paid was as follows:
| | December 31, 2018 | December 31, 2017 |
| Ordinary Income | $101,903,392 | $ 49,468,779 |
New Rule Issuance. During August 2018, the U.S. Securities and Exchange Commission issued Final Rule Release No. 33-10532, Disclosure Update and Simplification. This Final Rule includes amendments specific to registered investment companies that are intended to eliminate overlap in disclosure requirements between Regulation S-X and GAAP. In accordance with these amendments, certain line-items in the Fund's financial statements have been combined or removed for the current period as outlined in the table below.
| Financial Statement | Current Line-Item Presentation | Prior Line-Item Presentation |
| Statement of Assets and Liabilities | Total distributable earnings (loss) | Undistributed/Distributions in excess of/Accumulated net investment income (loss)
Accumulated/Undistributed net realized gain (loss)
Net unrealized appreciation (depreciation) |
| Statement of Changes in Net Assets | N/A - removed | Undistributed/Distributions in excess of/Accumulated net investment income (loss) end of period |
| Statement of Changes in Net Assets | Distributions to shareholders | Distributions to shareholders from net investment income
Distributions to shareholders from net realized gain |
| Distributions to Shareholders Note to Financial Statements | Distributions to shareholders | Distributions to shareholders from net investment income
Distributions to shareholders from net realized gain |
4. Fees and Other Transactions with Affiliates.
Management Fee. Fidelity Management & Research Company (the investment adviser) and its affiliates provide the Fund with investment management related services for which the Fund does not pay a management fee. Under the management contract, the investment adviser or an affiliate pays all ordinary operating expenses of the Fund, except custody fees, fees and expenses of the independent Trustees, and certain miscellaneous expenses such as proxy and shareholder meeting expenses.
Interfund Trades. The Fund may purchase from or sell securities to other Fidelity Funds under procedures adopted by the Board. The procedures have been designed to ensure these interfund trades are executed in accordance with Rule 17a-7 of the 1940 Act.
5. Committed Line of Credit.
The Fund participates with other funds managed by the investment adviser or an affiliate in a $4.25 billion credit facility (the "line of credit") to be utilized for temporary or emergency purposes to fund shareholder redemptions or for other short-term liquidity purposes. The Fund has agreed to pay commitment fees on its pro-rata portion of the line of credit, which amounted to $8,243 and is reflected in Commitment fees on the Statement of Operations. During the period, the Fund did not borrow on this line of credit.
6. Security Lending.
The Fund lends portfolio securities from time to time in order to earn additional income. On the settlement date of the loan, the Fund receives collateral (in the form of U.S. Treasury obligations, letters of credit and/or cash) against the loaned securities and maintains collateral in an amount not less than 100% of the market value of the loaned securities during the period of the loan. The market value of the loaned securities is determined at the close of business of the Fund and any additional required collateral is delivered to the Fund on the next business day. The Fund or borrower may terminate the loan at any time, and if the borrower defaults on its obligation to return the securities loaned because of insolvency or other reasons, the Fund may apply collateral received from the borrower against the obligation. The Fund may experience delays and costs in recovering the securities loaned. Any cash collateral received is maintained at the Fund's custodian and/or invested in cash equivalents. At period end, there were no security loans outstanding. Security lending income represents the income earned on investing cash collateral, less rebates paid to borrowers, plus any premium payments received for lending certain types of securities. Security lending income is presented in the Statement of Operations as a component of interest income. Total security lending income during the period amounted to $16,326.
7. Expense Reductions.
Through arrangements with the Fund's custodian, credits realized as a result of certain uninvested cash balances were used to reduce the Fund's expenses. During the period, these credits reduced the Fund's expenses by $218.
8. Distributions to Shareholders.
Distributions to shareholders of each class were as follows:
| | Year ended
December 31, 2018 | Year ended
December 31, 2017 |
| Distributions to shareholders | | |
| Series Inflation-Protected Bond Index | $101,903,392 | $– |
| Total | $101,903,392 | $– |
| From net investment income | | |
| Series Inflation-Protected Bond Index | $– | $1,910,347 |
| Class F | – | 879,267 |
| Total | $– | $2,789,614 |
| From net realized gain | | |
| Series Inflation-Protected Bond Index | $– | $46,679,165 |
| Total | $– | $46,679,165 |
9. Share Transactions.
Transactions for each class of shares were as follows:
| | Shares | Shares | Dollars | Dollars |
| | Year ended December 31, 2018 | Year ended December 31, 2017 | Year ended December 31, 2018 | Year ended December 31, 2017 |
| Series Inflation-Protected Bond Index | | | | |
| Shares sold | 454,760,566 | 154,775,965 | $4,435,551,447 | $1,534,013,736 |
| Reinvestment of distributions | 10,691,348 | 4,947,523 | 101,903,253 | 48,066,686 |
| Shares redeemed | (108,094,367) | (17,113,454) | (1,050,753,566) | (169,298,426) |
| Net increase (decrease) | 357,357,547 | 142,610,034 | $3,486,701,134 | $1,412,781,996 |
| Class F | | | | |
| Shares sold | – | 12,892,638 | $– | $127,272,808 |
| Reinvestment of distributions | – | 72,698 | ��� | 718,532 |
| Shares redeemed | – | (139,393,057) | – | (1,382,793,802) |
| Net increase (decrease) | – | (126,427,721) | $– | $(1,254,802,462) |
10. Other.
The Fund's organizational documents provide former and current trustees and officers with a limited indemnification against liabilities arising in connection with the performance of their duties to the Fund. In the normal course of business, the Fund may also enter into contracts that provide general indemnifications. The Fund's maximum exposure under these arrangements is unknown as this would be dependent on future claims that may be made against the Fund. The risk of material loss from such claims is considered remote.
At the end of the period, mutual funds managed by the investment adviser or its affiliates were the owners of record of all of the outstanding shares of the Fund.
Report of Independent Registered Public Accounting Firm
To the Trustees of Fidelity Salem Street Trust and Shareholders of Fidelity Series Inflation-Protected Bond Index Fund:
Opinion on the Financial Statements and Financial Highlights
We have audited the accompanying statement of assets and liabilities of Fidelity Series Inflation-Protected Bond Index Fund (the "Fund"), a fund of Fidelity Salem Street Trust, including the schedule of investments, as of December 31, 2018, and the related statement of operations for the year then ended, the statement of changes in net assets for each of the two years in the period then ended, the financial highlights for each of the five years in the period then ended, and the related notes. In our opinion, the financial statements and financial highlights present fairly, in all material respects, the financial position of the Fund as of December 31, 2018, and the results of its operations for the year then ended, the changes in its net assets for each of the two years in the period then ended, and the financial highlights for each of the five years in the period then ended, in conformity with accounting principles generally accepted in the United States of America.
Basis for Opinion
These financial statements and financial highlights are the responsibility of the Fund's management. Our responsibility is to express an opinion on the Fund's financial statements and financial highlights based on our audits. We are a public accounting firm registered with the Public Company Accounting Oversight Board (United States) (PCAOB) and are required to be independent with respect to the Fund in accordance with the U.S. federal securities laws and the applicable rules and regulations of the Securities and Exchange Commission and the PCAOB.
We conducted our audits in accordance with the standards of the PCAOB. Those standards require that we plan and perform the audit to obtain reasonable assurance about whether the financial statements and financial highlights are free of material misstatement, whether due to error or fraud. The Fund is not required to have, nor were we engaged to perform, an audit of its internal control over financial reporting. As part of our audits we are required to obtain an understanding of internal control over financial reporting but not for the purpose of expressing an opinion on the effectiveness of the Fund’s internal control over financial reporting. Accordingly, we express no such opinion.
Our audits included performing procedures to assess the risks of material misstatement of the financial statements and financial highlights, whether due to error or fraud, and performing procedures that respond to those risks. Such procedures included examining, on a test basis, evidence regarding the amounts and disclosures in the financial statements and financial highlights. Our audits also included evaluating the accounting principles used and significant estimates made by management, as well as evaluating the overall presentation of the financial statements and financial highlights. Our procedures included confirmation of securities owned as of December 31, 2018, by correspondence with the custodian and brokers; when replies were not received from brokers, we performed other auditing procedures. We believe that our audits provide a reasonable basis for our opinion.
/s/ Deloitte & Touche LLP
Boston, Massachusetts
February 15, 2019
We have served as the auditor of one or more of the Fidelity investment companies since 1999.
Trustees and Officers
The Trustees, Members of the Advisory Board (if any), and officers of the trust and fund, as applicable, are listed below. The Board of Trustees governs the fund and is responsible for protecting the interests of shareholders. The Trustees are experienced executives who meet periodically throughout the year to oversee the fund's activities, review contractual arrangements with companies that provide services to the fund, oversee management of the risks associated with such activities and contractual arrangements, and review the fund's performance. Except for Jonathon Chiel each of the Trustees oversees 260 funds. Mr. Chiel oversees 154 funds.
The Trustees hold office without limit in time except that (a) any Trustee may resign; (b) any Trustee may be removed by written instrument, signed by at least two-thirds of the number of Trustees prior to such removal; (c) any Trustee who requests to be retired or who has become incapacitated by illness or injury may be retired by written instrument signed by a majority of the other Trustees; and (d) any Trustee may be removed at any special meeting of shareholders by a two-thirds vote of the outstanding voting securities of the trust. Each Trustee who is not an interested person (as defined in the 1940 Act) of the trust and the fund is referred to herein as an Independent Trustee. Each Independent Trustee shall retire not later than the last day of the calendar year in which his or her 75th birthday occurs. The Independent Trustees may waive this mandatory retirement age policy with respect to individual Trustees. Officers and Advisory Board Members hold office without limit in time, except that any officer or Advisory Board Member may resign or may be removed by a vote of a majority of the Trustees at any regular meeting or any special meeting of the Trustees. Except as indicated, each individual has held the office shown or other offices in the same company for the past five years.
The fund’s Statement of Additional Information (SAI) includes more information about the Trustees. To request a free copy, call Fidelity at 1-800-544-8544.
Experience, Skills, Attributes, and Qualifications of the Trustees. The Governance and Nominating Committee has adopted a statement of policy that describes the experience, qualifications, attributes, and skills that are necessary and desirable for potential Independent Trustee candidates (Statement of Policy). The Board believes that each Trustee satisfied at the time he or she was initially elected or appointed a Trustee, and continues to satisfy, the standards contemplated by the Statement of Policy. The Governance and Nominating Committee also engages professional search firms to help identify potential Independent Trustee candidates who have the experience, qualifications, attributes, and skills consistent with the Statement of Policy. From time to time, additional criteria based on the composition and skills of the current Independent Trustees, as well as experience or skills that may be appropriate in light of future changes to board composition, business conditions, and regulatory or other developments, have also been considered by the professional search firms and the Governance and Nominating Committee. In addition, the Board takes into account the Trustees' commitment and participation in Board and committee meetings, as well as their leadership of standing and ad hoc committees throughout their tenure.
In determining that a particular Trustee was and continues to be qualified to serve as a Trustee, the Board has considered a variety of criteria, none of which, in isolation, was controlling. The Board believes that, collectively, the Trustees have balanced and diverse experience, qualifications, attributes, and skills, which allow the Board to operate effectively in governing the fund and protecting the interests of shareholders. Information about the specific experience, skills, attributes, and qualifications of each Trustee, which in each case led to the Board's conclusion that the Trustee should serve (or continue to serve) as a trustee of the fund, is provided below.
Board Structure and Oversight Function. Abigail P. Johnson is an interested person and currently serves as Chairman. The Trustees have determined that an interested Chairman is appropriate and benefits shareholders because an interested Chairman has a personal and professional stake in the quality and continuity of services provided to the fund. Independent Trustees exercise their informed business judgment to appoint an individual of their choosing to serve as Chairman, regardless of whether the Trustee happens to be independent or a member of management. The Independent Trustees have determined that they can act independently and effectively without having an Independent Trustee serve as Chairman and that a key structural component for assuring that they are in a position to do so is for the Independent Trustees to constitute a substantial majority for the Board. The Independent Trustees also regularly meet in executive session. Arthur E. Johnson serves as Chairman of the Independent Trustees and as such (i) acts as a liaison between the Independent Trustees and management with respect to matters important to the Independent Trustees and (ii) with management prepares agendas for Board meetings.
Fidelity® funds are overseen by different Boards of Trustees. The fund's Board oversees Fidelity's investment-grade bond, money market, asset allocation and certain equity funds, and other Boards oversee Fidelity's high income and other equity funds. The asset allocation funds may invest in Fidelity® funds that are overseen by such other Boards. The use of separate Boards, each with its own committee structure, allows the Trustees of each group of Fidelity® funds to focus on the unique issues of the funds they oversee, including common research, investment, and operational issues. On occasion, the separate Boards establish joint committees to address issues of overlapping consequences for the Fidelity® funds overseen by each Board.
The Trustees operate using a system of committees to facilitate the timely and efficient consideration of all matters of importance to the Trustees, the fund, and fund shareholders and to facilitate compliance with legal and regulatory requirements and oversight of the fund's activities and associated risks. The Board, acting through its committees, has charged FMR and its affiliates with (i) identifying events or circumstances the occurrence of which could have demonstrably adverse effects on the fund's business and/or reputation; (ii) implementing processes and controls to lessen the possibility that such events or circumstances occur or to mitigate the effects of such events or circumstances if they do occur; and (iii) creating and maintaining a system designed to evaluate continuously business and market conditions in order to facilitate the identification and implementation processes described in (i) and (ii) above. Because the day-to-day operations and activities of the fund are carried out by or through FMR, its affiliates, and other service providers, the fund's exposure to risks is mitigated but not eliminated by the processes overseen by the Trustees. While each of the Board's committees has responsibility for overseeing different aspects of the fund's activities, oversight is exercised primarily through the Operations and Audit Committees. In addition, an ad hoc Board committee of Independent Trustees has worked with FMR to enhance the Board's oversight of investment and financial risks, legal and regulatory risks, technology risks, and operational risks, including the development of additional risk reporting to the Board. Appropriate personnel, including but not limited to the fund's Chief Compliance Officer (CCO), FMR's internal auditor, the independent accountants, the fund's Treasurer and portfolio management personnel, make periodic reports to the Board's committees, as appropriate, including an annual review of Fidelity's risk management program for the Fidelity® funds. The responsibilities of each standing committee, including their oversight responsibilities, are described further under "Standing Committees of the Trustees."
Interested Trustees*:
Correspondence intended for a Trustee who is an interested person may be sent to Fidelity Investments, 245 Summer Street, Boston, Massachusetts 02210.
Name, Year of Birth; Principal Occupations and Other Relevant Experience+
Jonathan Chiel (1957)
Year of Election or Appointment: 2016
Trustee
Mr. Chiel also serves as Trustee of other Fidelity® funds. Mr. Chiel is Executive Vice President and General Counsel for FMR LLC (diversified financial services company, 2012-present). Previously, Mr. Chiel served as general counsel (2004-2012) and senior vice president and deputy general counsel (2000-2004) for John Hancock Financial Services; a partner with Choate, Hall & Stewart (1996-2000) (law firm); and an Assistant United States Attorney for the United States Attorney’s Office of the District of Massachusetts (1986-95), including Chief of the Criminal Division (1993-1995). Mr. Chiel is a director on the boards of the Boston Bar Foundation and the Maimonides School.
Abigail P. Johnson (1961)
Year of Election or Appointment: 2009
Trustee
Chairman of the Board of Trustees
Ms. Johnson also serves as Trustee of other Fidelity® funds. Ms. Johnson serves as Chairman (2016-present), Chief Executive Officer (2014-present), and Director (2007-present) of FMR LLC (diversified financial services company), President of Fidelity Financial Services (2012-present) and President of Personal, Workplace and Institutional Services (2005-present). Ms. Johnson is Chairman and Director of FMR Co., Inc. (investment adviser firm, 2011-present) and Chairman and Director of FMR (investment adviser firm, 2011-present). Previously, Ms. Johnson served as Vice Chairman (2007-2016) and President (2013-2016) of FMR LLC, President and a Director of FMR (2001-2005), a Trustee of other investment companies advised by FMR, Fidelity Investments Money Management, Inc. (investment adviser firm), and FMR Co., Inc. (2001-2005), Senior Vice President of the Fidelity® funds (2001-2005), and managed a number of Fidelity® funds. Ms. Abigail P. Johnson and Mr. Arthur E. Johnson are not related.
Jennifer Toolin McAuliffe (1959)
Year of Election or Appointment: 2016
Trustee
Ms. McAuliffe also serves as Trustee of other Fidelity® funds. Ms. McAuliffe previously served as a Member of the Advisory Board of certain Fidelity® funds (2016) and as Co-Head of Fixed Income of Fidelity Investments Limited (now known as FIL Limited (FIL)) (diversified financial services company). Earlier roles at FIL included Director of Research for FIL’s credit and quantitative teams in London, Hong Kong and Tokyo. Ms. McAuliffe also was the Director of Research for taxable and municipal bonds at Fidelity Investments Money Management, Inc. Ms. McAuliffe is also a director or trustee of several not-for-profit entities.
* Determined to be an “Interested Trustee” by virtue of, among other things, his or her affiliation with the trust or various entities under common control with FMR.
+ The information includes the Trustee's principal occupation during the last five years and other information relating to the experience, attributes, and skills relevant to the Trustee's qualifications to serve as a Trustee, which led to the conclusion that the Trustee should serve as a Trustee for the fund.
Independent Trustees:
Correspondence intended for an Independent Trustee may be sent to Fidelity Investments, P.O. Box 55235, Boston, Massachusetts 02205-5235.
Name, Year of Birth; Principal Occupations and Other Relevant Experience+
Elizabeth S. Acton (1951)
Year of Election or Appointment: 2013
Trustee
Ms. Acton also serves as Trustee of other Fidelity® funds. Prior to her retirement in April 2012, Ms. Acton was Executive Vice President, Finance (2011-2012), Executive Vice President, Chief Financial Officer (2002-2011), and Treasurer (2004-2005) of Comerica Incorporated (financial services). Prior to joining Comerica, Ms. Acton held a variety of positions at Ford Motor Company (1983-2002), including Vice President and Treasurer (2000-2002) and Executive Vice President and Chief Financial Officer of Ford Motor Credit Company (1998-2000). Ms. Acton currently serves as a member of the Board of Directors and Audit and Finance Committees of Beazer Homes USA, Inc. (homebuilding, 2012-present). Previously, Ms. Acton served as a Member of the Advisory Board of certain Fidelity® funds (2013-2016).
Ann E. Dunwoody (1953)
Year of Election or Appointment: 2018
Trustee
General Dunwoody also serves as Trustee of other Fidelity® funds. General Dunwoody (United States Army, Retired) was the first woman in U.S. military history to achieve the rank of four-star general and prior to her retirement in 2012 held a variety of positions within the U.S. Army, including Commanding General, U.S. Army Material Command (2008-2012). She is the President of First to Four LLC (leadership and mentoring services, 2012-present). She also serves as a member of the Board of Directors and Nominating and Corporate Governance Committee of L3 Technologies, Inc. (communication, electronic, sensor, and aerospace systems, 2013-present), Board of Directors and Nomination and Corporate Governance Committees of Kforce Inc. (professional staffing services, 2016-present) and Board of Directors of Automattic Inc. (software engineering, 2018-present). Previously, General Dunwoody served as a Member of the Advisory Board of certain Fidelity® funds (2018), a member of the Board of Directors and Audit and Sustainability and Corporate Responsibility Committees of Republic Services, Inc. (waste collection, disposal and recycling, 2013-2016). Ms. Dunwoody also serves on several boards for non-profit organizations, including as a member of the Board of Directors, Chair of the Nomination and Governance Committee and member of the Audit Committee of Logistics Management Institute (consulting non-profit, 2012-present), a member of the Board of Directors of the Army Historical Foundation (2015-present), a member of the Council of Trustees for the Association of the United States Army (advocacy non-profit, 2013-present) and a member of the Board of Trustees of Florida Institute of Technology (2015-present) and ThanksUSA (military family education non-profit, 2014-present).
John Engler (1948)
Year of Election or Appointment: 2014
Trustee
Mr. Engler also serves as Trustee of other Fidelity® funds. He serves on the board of directors for Universal Forest Products (manufacturer and distributor of wood and wood-alternative products, 2003-present) and K12 Inc. (technology-based education company, 2012-present). Previously, Mr. Engler served as interim president of Michigan State University (2018-2019), a Member of the Advisory Board of certain Fidelity® funds (2014-2016), president of the Business Roundtable (2011-2017), a trustee of The Munder Funds (2003-2014), president and CEO of the National Association of Manufacturers (2004-2011), member of the Board of Trustees of the Annie E. Casey Foundation (2004-2015), and as governor of Michigan (1991-2003). He is a past chairman of the National Governors Association.
Robert F. Gartland (1951)
Year of Election or Appointment: 2010
Trustee
Mr. Gartland also serves as Trustee of other Fidelity® funds. Mr. Gartland is Chairman and an investor in Gartland & Mellina Group Corp. (consulting, 2009-present). Previously, Mr. Gartland served as a partner and investor of Vietnam Partners LLC (investments and consulting, 2008-2011). Prior to his retirement, Mr. Gartland held a variety of positions at Morgan Stanley (financial services, 1979-2007), including Managing Director (1987-2007), and Chase Manhattan Bank (1975-1978).
Arthur E. Johnson (1947)
Year of Election or Appointment: 2008
Trustee
Chairman of the Independent Trustees
Mr. Johnson also serves as Trustee of other Fidelity® funds. Mr. Johnson serves as a member of the Board of Directors of Eaton Corporation plc (diversified power management, 2009-present) and Booz Allen Hamilton (management consulting, 2011-present). Prior to his retirement, Mr. Johnson served as Senior Vice President of Corporate Strategic Development of Lockheed Martin Corporation (defense contractor, 1999-2009). He previously served on the Board of Directors of IKON Office Solutions, Inc. (1999-2008), AGL Resources, Inc. (holding company, 2002-2016), and Delta Airlines (2005-2007). Mr. Arthur E. Johnson is not related to Ms. Abigail P. Johnson.
Michael E. Kenneally (1954)
Year of Election or Appointment: 2009
Trustee
Vice Chairman of the Independent Trustees
Mr. Kenneally also serves as Trustee of other Fidelity® funds. Prior to his retirement, Mr. Kenneally served as Chairman and Global Chief Executive Officer of Credit Suisse Asset Management. Before joining Credit Suisse, he was an Executive Vice President and Chief Investment Officer for Bank of America Corporation. Earlier roles at Bank of America included Director of Research, Senior Portfolio Manager and Research Analyst, and Mr. Kenneally was awarded the Chartered Financial Analyst (CFA) designation in 1991.
Marie L. Knowles (1946)
Year of Election or Appointment: 2001
Trustee
Ms. Knowles also serves as Trustee of other Fidelity® funds. Prior to Ms. Knowles' retirement in June 2000, she served as Executive Vice President and Chief Financial Officer of Atlantic Richfield Company (ARCO) (diversified energy, 1996-2000). From 1993 to 1996, she was a Senior Vice President of ARCO and President of ARCO Transportation Company (pipeline and tanker operations). Ms. Knowles currently serves as a Director and Chairman of the Audit Committee of McKesson Corporation (healthcare service, since 2002). Ms. Knowles is a member of the Board of the Santa Catalina Island Company (real estate, 2009-present). Ms. Knowles is a Member of the Investment Company Institute Board of Governors and a Member of the Governing Council of the Independent Directors Council (2014-present). She also serves as a member of the Advisory Board for the School of Engineering of the University of Southern California. Previously, Ms. Knowles served as a Director of Phelps Dodge Corporation (copper mining and manufacturing, 1994-2007), URS Corporation (engineering and construction, 2000-2003) and America West (airline, 1999-2002). Ms. Knowles previously served as Chairman (2015-2018) and Vice Chairman (2012-2015) of the Independent Trustees of certain Fidelity® funds.
Mark A. Murray (1954)
Year of Election or Appointment: 2016
Trustee
Mr. Murray also serves as Trustee of other Fidelity® funds. Mr. Murray is Vice Chairman (2013-present) of Meijer, Inc. (regional retail chain). Previously, Mr. Murray served as a Member of the Advisory Board of certain Fidelity® funds (2016) and as Co-Chief Executive Officer (2013-2016) and President (2006-2013) of Meijer, Inc. Mr. Murray serves as a member of the Board of Directors and Nuclear Review and Public Policy and Responsibility Committees of DTE Energy Company (diversified energy company, 2009-present). Mr. Murray also serves as a member of the Board of Directors of Spectrum Health (not-for-profit health system, 2015-present). Mr. Murray previously served as President of Grand Valley State University (2001-2006), Treasurer for the State of Michigan (1999-2001), Vice President of Finance and Administration for Michigan State University (1998-1999), and a member of the Board of Directors and Audit Committee and Chairman of the Nominating and Corporate Governance Committee of Universal Forest Products, Inc. (manufacturer and distributor of wood and wood-alternative products, 2004-2016). Mr. Murray is also a director or trustee of many community and professional organizations.
+ The information includes the Trustee's principal occupation during the last five years and other information relating to the experience, attributes, and skills relevant to the Trustee's qualifications to serve as a Trustee, which led to the conclusion that the Trustee should serve as a Trustee for the fund.
Advisory Board Members and Officers:
Correspondence intended for an officer may be sent to Fidelity Investments, 245 Summer Street, Boston, Massachusetts 02210. Officers appear below in alphabetical order.
Name, Year of Birth; Principal Occupation
Elizabeth Paige Baumann (1968)
Year of Election or Appointment: 2017
Anti-Money Laundering (AML) Officer
Ms. Baumann also serves as AML Officer of other funds. She is Chief AML Officer (2012-present) and Senior Vice President (2014-present) of FMR LLC (diversified financial services company) and is an employee of Fidelity Investments. Previously, Ms. Baumann served as AML Officer of the funds (2012-2016), and Vice President (2007-2014) and Deputy Anti-Money Laundering Officer (2007-2012) of FMR LLC.
Craig S. Brown (1977)
Year of Election or Appointment: 2019
Assistant Treasurer
Mr. Brown also serves as Assistant Treasurer of other funds. Mr. Brown is an employee of Fidelity Investments (2013-present).
John J. Burke III (1964)
Year of Election or Appointment: 2018
Chief Financial Officer
Mr. Burke also serves as Chief Financial Officer of other funds. Mr. Burke serves as Head of Investment Operations for Fidelity Fund and Investment Operations (2018-present) and is an employee of Fidelity Investments (1998-present). Previously Mr. Burke served as head of Asset Management Investment Operations (2012-2018).
William C. Coffey (1969)
Year of Election or Appointment: 2018
Secretary and Chief Legal Officer (CLO)
Mr. Coffey also serves as Secretary and CLO of other funds. Mr. Coffey serves as CLO, Secretary, and Senior Vice President of Fidelity Management & Research Company and FMR Co., Inc. (investment adviser firms, 2018-present); Secretary of Fidelity SelectCo, LLC and Fidelity Investments Money Management, Inc. (investment adviser firms, 2018-present); and CLO of Fidelity Management & Research (Hong Kong) Limited, FMR Investment Management (UK) Limited, and Fidelity Management & Research (Japan) Limited (investment adviser firms, 2018-present). He is Senior Vice President and Deputy General Counsel of FMR LLC (diversified financial services company, 2010-present), and is an employee of Fidelity Investments. Previously, Mr. Coffey served as Assistant Secretary of certain funds (2009-2018) and as Vice President and Associate General Counsel of FMR LLC (2005-2009).
Jonathan Davis (1968)
Year of Election or Appointment: 2010
Assistant Treasurer
Mr. Davis also serves as Assistant Treasurer of other funds. Mr. Davis serves as Assistant Treasurer of FMR Capital, Inc. (2017-present) and is an employee of Fidelity Investments. Previously, Mr. Davis served as Vice President and Associate General Counsel of FMR LLC (diversified financial services company, 2003-2010).
Adrien E. Deberghes (1967)
Year of Election or Appointment: 2010
Assistant Treasurer
Mr. Deberghes also serves as an officer of other funds. He serves as Assistant Treasurer of FMR Capital, Inc. (2017-present), Executive Vice President of Fidelity Investments Money Management, Inc. (FIMM) (investment adviser firm, 2016-present), and is an employee of Fidelity Investments (2008-present). Previously, Mr. Deberghes served as President and Treasurer of certain Fidelity® funds (2013-2018). Prior to joining Fidelity Investments, Mr. Deberghes was Senior Vice President of Mutual Fund Administration at State Street Corporation (2007-2008), Senior Director of Mutual Fund Administration at Investors Bank & Trust (2005-2007), and Director of Finance for Dunkin' Brands (2000-2005). Previously, Mr. Deberghes served in other fund officer roles.
Laura M. Del Prato (1964)
Year of Election or Appointment: 2018
President and Treasurer
Ms. Del Prato also serves as an officer of other funds. Ms. Del Prato is an employee of Fidelity Investments (2017-present). Prior to joining Fidelity Investments, Ms. Del Prato served as a Managing Director and Treasurer of the JPMorgan Mutual Funds (2014-2017). Prior to JPMorgan, Ms. Del Prato served as a partner at Cohen Fund Audit Services (accounting firm, 2012-2013) and KPMG LLP (accounting firm, 2004-2012).
Colm A. Hogan (1973)
Year of Election or Appointment: 2016
Assistant Treasurer
Mr. Hogan also serves as an officer of other funds. Mr. Hogan serves as Assistant Treasurer of FMR Capital, Inc. (2017-present) and is an employee of Fidelity Investments (2005-present). Previously, Mr. Hogan served as Assistant Treasurer of certain Fidelity® funds (2016-2018).
Chris Maher (1972)
Year of Election or Appointment: 2013
Assistant Treasurer
Mr. Maher serves as Assistant Treasurer of other funds. Mr. Maher is Vice President of Valuation Oversight, serves as Assistant Treasurer of FMR Capital, Inc. (2017-present), and is an employee of Fidelity Investments. Previously, Mr. Maher served as Vice President of Asset Management Compliance (2013), Vice President of the Program Management Group of FMR (investment adviser firm, 2010-2013), and Vice President of Valuation Oversight (2008-2010).
John B. McGinty, Jr. (1962)
Year of Election or Appointment: 2016
Chief Compliance Officer
Mr. McGinty also serves as Chief Compliance Officer of other funds. Mr. McGinty is Senior Vice President of Asset Management Compliance for Fidelity Investments and is an employee of Fidelity Investments (2016-present). Mr. McGinty previously served as Vice President, Senior Attorney at Eaton Vance Management (investment management firm, 2015-2016), and prior to Eaton Vance as global CCO for all firm operations and registered investment companies at GMO LLC (investment management firm, 2009-2015). Before joining GMO LLC, Mr. McGinty served as Senior Vice President, Deputy General Counsel for Fidelity Investments (2007-2009).
Jason P. Pogorelec (1975)
Year of Election or Appointment: 2015
Assistant Secretary
Mr. Pogorelec also serves as Assistant Secretary of other funds. Mr. Pogorelec serves as Vice President, Associate General Counsel (2010-present) and is an employee of Fidelity Investments (2006-present).
Nancy D. Prior (1967)
Year of Election or Appointment: 2014
Vice President
Ms. Prior also serves as Vice President of other funds. Ms. Prior serves as President Fixed Income, High Income/Emerging Market Debt and Multi Asset Class Strategies of FIAM LLC (2018-present), President (2016-present) and Director (2014-present) of Fidelity Investments Money Management, Inc. (FIMM) (investment adviser firm), President, Fixed Income (2014-present), and is an employee of Fidelity Investments (2002-present). Previously, Ms. Prior served as Vice Chairman of FIAM LLC (investment adviser firm, 2014-2018), a Director of FMR Investment Management (UK) Limited (investment adviser firm, 2015-2018), President Multi-Asset Class Strategies of FMR's Global Asset Allocation Division (2017-2018), Vice President of Fidelity's Money Market Funds (2012-2014), President, Money Market and Short Duration Bond Group of Fidelity Management & Research (FMR) (investment adviser firm, 2013-2014), President, Money Market Group of FMR (2011-2013), Managing Director of Research (2009-2011), Senior Vice President and Deputy General Counsel (2007-2009), and Assistant Secretary of certain Fidelity® funds (2008-2009).
Stacie M. Smith (1974)
Year of Election or Appointment: 2013
Assistant Treasurer
Ms. Smith also serves as an officer of other funds. Ms. Smith serves as Assistant Treasurer of FMR Capital, Inc. (2017-present), is an employee of Fidelity Investments (2009-present), and has served in other fund officer roles. Prior to joining Fidelity Investments, Ms. Smith served as Senior Audit Manager of Ernst & Young LLP (accounting firm, 1996-2009). Previously, Ms. Smith served as Assistant Treasurer (2013-2018) and Deputy Treasurer (2013-2016) of certain Fidelity® funds.
Marc L. Spector (1972)
Year of Election or Appointment: 2016
Deputy Treasurer
Mr. Spector also serves as an officer of other funds. Mr. Spector serves as Assistant Treasurer of FMR Capital, Inc. (2017-present) and is an employee of Fidelity Investments (2016-present). Prior to joining Fidelity Investments, Mr. Spector served as Director at the Siegfried Group (accounting firm, 2013-2016), and prior to Siegfried Group as audit senior manager at Deloitte & Touche (accounting firm, 2005-2013).
Jim Wegmann (1979)
Year of Election or Appointment: 2019
Assistant Treasurer
Mr. Wegmann also serves as Assistant Treasurer of other funds. Mr. Wegmann is an employee of Fidelity Investments (2011-present).
Shareholder Expense Example
As a shareholder of the Fund, you incur two types of costs: (1) transaction costs and (2) ongoing costs, including other Fund expenses. This Example is intended to help you understand your ongoing costs (in dollars) of investing in the Fund and to compare these costs with the ongoing costs of investing in other mutual funds.
The Example is based on an investment of $1,000 invested at the beginning of the period and held for the entire period (July 1, 2018 to December 31, 2018).
Actual Expenses
The first line of the accompanying table provides information about actual account values and actual expenses. You may use the information in this line, together with the amount you invested, to estimate the expenses that you paid over the period. Simply divide your account value by $1,000.00 (for example, an $8,600 account value divided by $1,000.00 = 8.6), then multiply the result by the number in the first line under the heading entitled "Expenses Paid During Period" to estimate the expenses you paid on your account during this period. In addition, the Fund, as a shareholder in the underlying Fidelity Central Funds, will indirectly bear its pro-rata share of the fees and expenses incurred by the underlying Fidelity Central Funds. These fees and expenses are not included in the Fund's annualized expense ratio used to calculate the expense estimate in the table below.
Hypothetical Example for Comparison Purposes
The second line of the accompanying table provides information about hypothetical account values and hypothetical expenses based on the Fund's actual expense ratio and an assumed rate of return of 5% per year before expenses, which is not the Fund's actual return. The hypothetical account values and expenses may not be used to estimate the actual ending account balance or expenses you paid for the period. You may use this information to compare the ongoing costs of investing in the Fund and other funds. To do so, compare this 5% hypothetical example with the 5% hypothetical examples that appear in the shareholder reports of the other funds. In addition, the Fund, as a shareholder in the underlying Fidelity Central Funds, will indirectly bear its pro-rata share of the fees and expenses incurred by the underlying Fidelity Central Funds. These fees and expenses are not included in the Fund's annualized expense ratio used to calculate the expense estimate in the table below.
Please note that the expenses shown in the table are meant to highlight your ongoing costs only and do not reflect any transaction costs. Therefore, the second line of the table is useful in comparing ongoing costs only, and will not help you determine the relative total costs of owning different funds.
| | Annualized Expense Ratio-A | Beginning
Account Value
July 1, 2018 | Ending
Account Value
December 31, 2018 | Expenses Paid
During Period-B
July 1, 2018
to December 31, 2018 |
| Actual | - %C | $1,000.00 | $994.50 | $-D |
| Hypothetical-E | | $1,000.00 | $1,025.21 | $-D |
A Annualized expense ratio reflects expenses net of applicable fee waivers.
B Expenses are equal to the Fund's annualized expense ratio, multiplied by the average account value over the period, multiplied by 184/365 (to reflect the one-half year period).
C Amount represents less than .005%.
D Amount represents less than $.005.
E 5% return per year before expenses
Distributions (Unaudited)
A total of 99.9655% of the dividends distributed during the fiscal year was derived from interest on U.S. Government securities which is generally exempt from state income tax.
The fund will notify shareholders in January 2019 of amounts for use in preparing 2018 income tax returns.
Board Approval of Investment Advisory Contracts and Management Fees
Fidelity Series Inflation-Protected Bond Index Fund
Each year, the Board of Trustees, including the Independent Trustees (together, the Board), votes on the renewal of the management contract with Fidelity Management & Research Company (FMR) and the sub-advisory agreements (together, the Advisory Contracts) for the fund. FMR and the sub-advisers are referred to herein as the Investment Advisers. The Board, assisted by the advice of fund counsel and Independent Trustees' counsel, requests and considers a broad range of information relevant to the renewal of the Advisory Contracts throughout the year.
The Board meets regularly and, at each of its meetings, covers an extensive agenda of topics and materials and considers factors that are relevant to its annual consideration of the renewal of the fund's Advisory Contracts, including the services and support provided to the fund and its shareholders. The Board has established four standing committees (Committees) — Operations, Audit, Fair Valuation, and Governance and Nominating — each composed of and chaired by Independent Trustees with varying backgrounds, to which the Board has assigned specific subject matter responsibilities in order to enhance effective decision-making by the Board. The Operations Committee, of which all of the Independent Trustees are members, meets regularly throughout the year and considers, among other matters, information specifically related to the annual consideration of the renewal of the fund's Advisory Contracts. The Board, acting directly and through its Committees, requests and receives information concerning the annual consideration of the renewal of the fund's Advisory Contracts. The Board also meets as needed to review matters specifically related to the Board's annual consideration of the renewal of the Advisory Contracts. Members of the Board may also meet with trustees of other Fidelity funds through joint ad hoc committees to discuss certain matters relevant to all of the Fidelity funds.
At its September 2018 meeting, the Board unanimously determined to renew the fund's Advisory Contracts. In considering whether to renew the Advisory Contracts for the fund, the Board considered all factors it believed relevant and reached a determination, with the assistance of fund counsel and Independent Trustees' counsel and through the exercise of its business judgment, that the renewal of the Advisory Contracts was in the best interests of the fund and its shareholders and the fact that no fee is payable under the management contract was fair and reasonable.
Nature, Extent, and Quality of Services Provided. The Board considered Fidelity's staffing as it relates to the fund, including the backgrounds of investment personnel of Fidelity, and also considered the fund's investment objective, strategies, and related investment philosophy. The Independent Trustees also had discussions with senior management of Fidelity's investment operations and investment groups. The Board considered the structure of the investment personnel compensation program and whether this structure provides appropriate incentives to act in the best interests of the fund.
Resources Dedicated to Investment Management and Support Services. The Board reviewed the general qualifications and capabilities of Fidelity's investment staff, including its size, education, experience, and resources, as well as Fidelity's approach to recruiting, managing, and compensating investment personnel. The Board noted that Fidelity has continued to increase the resources devoted to non-U.S. offices, including expansion of Fidelity's global investment organization. The Board also noted that Fidelity's analysts have extensive resources, tools and capabilities that allow them to conduct sophisticated quantitative and fundamental analysis, as well as credit analysis of issuers, counterparties and guarantors. Further, the Board considered that Fidelity's investment professionals have sufficient access to global information and data so as to provide competitive investment results over time, and that those professionals also have access to sophisticated tools that permit them to assess portfolio construction and risk and performance attribution characteristics continuously, as well as to transmit new information and research conclusions rapidly around the world. Additionally, in its deliberations, the Board considered Fidelity's trading, risk management, compliance, and technology and operations capabilities and resources, which are integral parts of the investment management process.
Administrative Services. The Board considered (i) the nature, extent, quality, and cost of advisory and administrative services performed by the Investment Advisers and their affiliates under the Advisory Contracts and under separate agreements covering transfer agency, pricing and bookkeeping, and securities lending services for the fund; (ii) the nature and extent of the supervision of third party service providers, principally custodians, subcustodians, and pricing vendors; and (iii) the resources devoted to, and the record of compliance with, the fund's compliance policies and procedures.
The Board noted that the growth of fund assets over time across the complex allows Fidelity to reinvest in the development of services designed to enhance the value and convenience of the Fidelity funds as investment vehicles. These services include 24-hour access to account information and market information through telephone representatives and over the Internet, investor education materials and asset allocation tools, and the expanded availability of Fidelity Investor Centers.
Investment Performance. The Board considered whether the fund has operated in accordance with its investment objective, as well as its record of compliance with its investment restrictions. The Board reviewed the fund's absolute investment performance, as well as the fund's relative investment performance. In this regard, the Board noted that the fund is designed to offer an investment option for other investment companies managed by Fidelity and ultimately to enhance the performance of those investment companies.
Based on its review, the Board concluded that the nature, extent, and quality of services provided to the fund under the Advisory Contracts should continue to benefit the shareholders of the fund.
Competitiveness of Management Fee and Total Expense Ratio. The Board considered that the fund does not pay FMR a management fee for investment advisory services. The Board also noted that FMR or an affiliate undertakes to pay all operating expenses of the fund, except transfer agent fees, 12b-1 fees, Independent Trustee fees and expenses, custodian fees and expenses, proxy and shareholder meeting expenses, interest, taxes, brokerage expenses, and extraordinary expenses (such as litigation expenses).
The Board further considered that FMR has contractually agreed to reimburse the fund to the extent that total operating expenses (excluding interest, certain taxes, certain securities lending costs, brokerage commissions, fees and expenses of the Independent Trustees, proxy and shareholder meeting expenses, extraordinary expenses, and acquired fund fees and expenses, if any), as a percentage of its average net assets, exceed 0.014% through February 28, 2021.
Based on its review, the Board considered that the fund does not pay a management fee and concluded that the total expense ratio of each class of the fund was reasonable in light of the services that the fund and its shareholders receive and the other factors considered.
Costs of the Services and Profitability. The Board considered the level of Fidelity's profits in respect of all the Fidelity funds.
PricewaterhouseCoopers LLP (PwC), auditor to Fidelity and certain Fidelity funds, has been engaged annually by the Board as part of the Board's assessment of Fidelity's profitability analysis. PwC's engagement includes the review and assessment of the methodologies used by Fidelity in determining the revenues and expenses attributable to Fidelity's mutual fund business, and completion of agreed-upon procedures in respect of the mathematical accuracy of the fund profitability information and its conformity to established allocation methodologies. After considering PwC's reports issued under the engagement and information provided by Fidelity, the Board concluded that while other allocation methods may also be reasonable, Fidelity's profitability methodologies are reasonable in all material respects.
The Board also reviewed Fidelity's non-fund businesses and potential indirect benefits such businesses may have received as a result of their association with Fidelity's mutual fund business (i.e., fall-out benefits) as well as cases where Fidelity's affiliates may benefit from the fund's business. The Board noted that changes to fall-out benefits year-over-year reflect business developments at Fidelity's various businesses.
The Board concluded that the costs of the services provided by and the profits realized by Fidelity in connection with the operation of the fund were not relevant to the renewal of the Advisory Contracts because the fund pays no advisory fees and FMR or an affiliate bears all expenses of the fund, with limited exceptions.
Economies of Scale. The Board concluded that because the fund pays no advisory fees and FMR or an affiliate bears all expenses of the fund with certain limited exceptions, the realization of economies of scale was not a material factor in the Board's decision to renew the fund's Advisory Contracts.
Additional Information Requested by the Board. In order to develop fully the factual basis for consideration of the Fidelity funds' advisory contracts, the Board requested and received additional information on certain topics, including: (i) Fidelity's fund profitability methodology, profitability trends for certain funds, the allocation of various costs to different funds, and the impact of certain factors on fund profitability results; (ii) portfolio manager changes that have occurred during the past year and the amount of the investment that each portfolio manager has made in the Fidelity fund(s) that he or she manages; (iii) Fidelity's compensation structure for portfolio managers, research analysts, and other key personnel, including its effects on fund profitability, the rationale for the compensation structure, and the extent to which current market conditions have affected retention and recruitment; (iv) the arrangements with and compensation paid to certain fund sub-advisers on behalf of the Fidelity funds and the treatment of such compensation within Fidelity's fund profitability methodology; (v) the terms of Fidelity's voluntary expense limitation agreements; (vi) the methodology with respect to competitive fund data and peer group classifications; (vii) Fidelity's transfer agent fee, expense, and service structures for different funds and classes relative to competitive trends, and the impact of the increased use of omnibus accounts; (viii) new developments in the retail and institutional marketplaces and the competitive positioning of the funds relative to other investment products and services; (ix) the impact of recent changes to the money market fund landscape, including the full implementation of money market fund reform and rising interest rates, on Fidelity's money market funds; (x) the funds' share class structures and distribution channels; and (xi) explanations regarding the relative total expense ratios of certain funds and classes, total expense competitive trends and methodologies for total expense competitive comparisons, and actions that might be taken by Fidelity to reduce total expense ratios for certain classes. In addition, the Board considered its discussions with Fidelity throughout the year regarding enhanced information security initiatives and the funds' fair valuation policies.
Based on its evaluation of all of the conclusions noted above, and after considering all factors it believed relevant, the Board concluded that the advisory fee arrangements are fair and reasonable, and that the fund's Advisory Contracts should be renewed.

Corporate Headquarters
245 Summer St.
Boston, MA 02210
www.fidelity.com
SIB-S-ANN-0219
1.899329.109
Fidelity® Inflation-Protected Bond Index Fund
Annual Report December 31, 2018 |
|
Beginning on January 1, 2021, as permitted by regulations adopted by the Securities and Exchange Commission, paper copies of a fund’s shareholder reports will no longer be sent by mail, unless you specifically request paper copies of the reports from the fund or from your financial intermediary, such as a financial advisor, broker-dealer or bank. Instead, the reports will be made available on a website, and you will be notified by mail each time a report is posted and provided with a website link to access the report.
If you already elected to receive shareholder reports electronically, you will not be affected by this change and you need not take any action. You may elect to receive shareholder reports and other communications from a fund electronically, by contacting your financial intermediary. For Fidelity customers, visit Fidelity's web site or call Fidelity using the contact information listed below.
You may elect to receive all future reports in paper free of charge. If you wish to continue receiving paper copies of your shareholder reports, you may contact your financial intermediary or, if you are a Fidelity customer, visit Fidelity’s website, or call Fidelity at the applicable toll-free number listed below. Your election to receive reports in paper will apply to all funds held with the fund complex/your financial intermediary.
| Account Type | Website | Phone Number |
| Brokerage, Mutual Fund, or Annuity Contracts: | fidelity.com/mailpreferences | 1-800-343-3548 |
| Employer Provided Retirement Accounts: | netbenefits.fidelity.com/preferences (choose 'no' under Required Disclosures to continue to print) | 1-800-343-0860 |
| Advisor Sold Accounts Serviced Through Your Financial Intermediary: | Contact Your Financial Intermediary | Your Financial Intermediary's phone number |
| Advisor Sold Accounts Serviced by Fidelity: | institutional.fidelity.com | 1-877-208-0098 |
Contents
To view a fund's proxy voting guidelines and proxy voting record for the 12-month period ended June 30, visit http://www.fidelity.com/proxyvotingresults or visit the Securities and Exchange Commission's (SEC) web site at http://www.sec.gov.
You may also call 1-800-544-8544 to request a free copy of the proxy voting guidelines.
Standard & Poor's, S&P and S&P 500 are registered service marks of The McGraw-Hill Companies, Inc. and have been licensed for use by Fidelity Distributors Corporation.
Other third-party marks appearing herein are the property of their respective owners.
All other marks appearing herein are registered or unregistered trademarks or service marks of FMR LLC or an affiliated company. © 2019 FMR LLC. All rights reserved.
This report and the financial statements contained herein are submitted for the general information of the shareholders of the Fund. This report is not authorized for distribution to prospective investors in the Fund unless preceded or accompanied by an effective prospectus.
A fund files its complete schedule of portfolio holdings with the SEC for the first and third quarters of each fiscal year on Form N-Q. Forms N-Q are available on the SEC’s web site at http://www.sec.gov. A fund's Forms N-Q may be reviewed and copied at the SEC’s Public Reference Room in Washington, DC. Information regarding the operation of the SEC's Public Reference Room may be obtained by calling 1-800-SEC-0330.
For a complete list of a fund's portfolio holdings, view the most recent holdings listing, semiannual report, or annual report on Fidelity's web site at http://www.fidelity.com, http://www.institutional.fidelity.com, or http://www.401k.com, as applicable.
NOT FDIC INSURED •MAY LOSE VALUE •NO BANK GUARANTEE
Neither the Fund nor Fidelity Distributors Corporation is a bank.
Note to Shareholders
In July, the Board of Trustees approved a proposal to consolidate the Fund’s share classes into a single share class. The consolidation took place in November 2018, and the surviving class name is Fidelity Inflation-Protected Bond Index Fund. The changes do not impact how the Fund is managed. As part of this initiative, effective August 1, 2018, the Board of Trustees approved a change in the expense contract limiting the total expenses paid by each class, with certain exceptions, to .05% of each class’ average net assets on an annual basis. Also, purchase minimums and eligibility requirements were removed.
Performance: The Bottom Line
Average annual total return reflects the change in the value of an investment, assuming reinvestment of distributions from dividend income and capital gains (the profits earned upon the sale of securities that have grown in value, if any) and assuming a constant rate of performance each year. The hypothetical investment and the average annual total returns do not reflect the deduction of taxes that a shareholder would pay on fund distributions or the redemption of fund shares. During periods of reimbursement by Fidelity, a fund’s total return will be greater than it would be had the reimbursement not occurred. How a fund did yesterday is no guarantee of how it will do tomorrow.
Average Annual Total Returns
| For the periods ended December 31, 2018 | Past 1 year | Past 5 years | Life of fundA |
| Fidelity® Inflation-Protected Bond Index Fund | (1.37)% | 1.66% | 0.38% |
A From May 16, 2012
$10,000 Over Life of Fund
Let's say hypothetically that $10,000 was invested in Fidelity® Inflation-Protected Bond Index Fund on May 16, 2012, when the fund started.
The chart shows how the value of your investment would have changed, and also shows how the Bloomberg Barclays U.S. Treasury Inflation-Protected Securities (TIPS) Index (Series-L) performed over the same period.
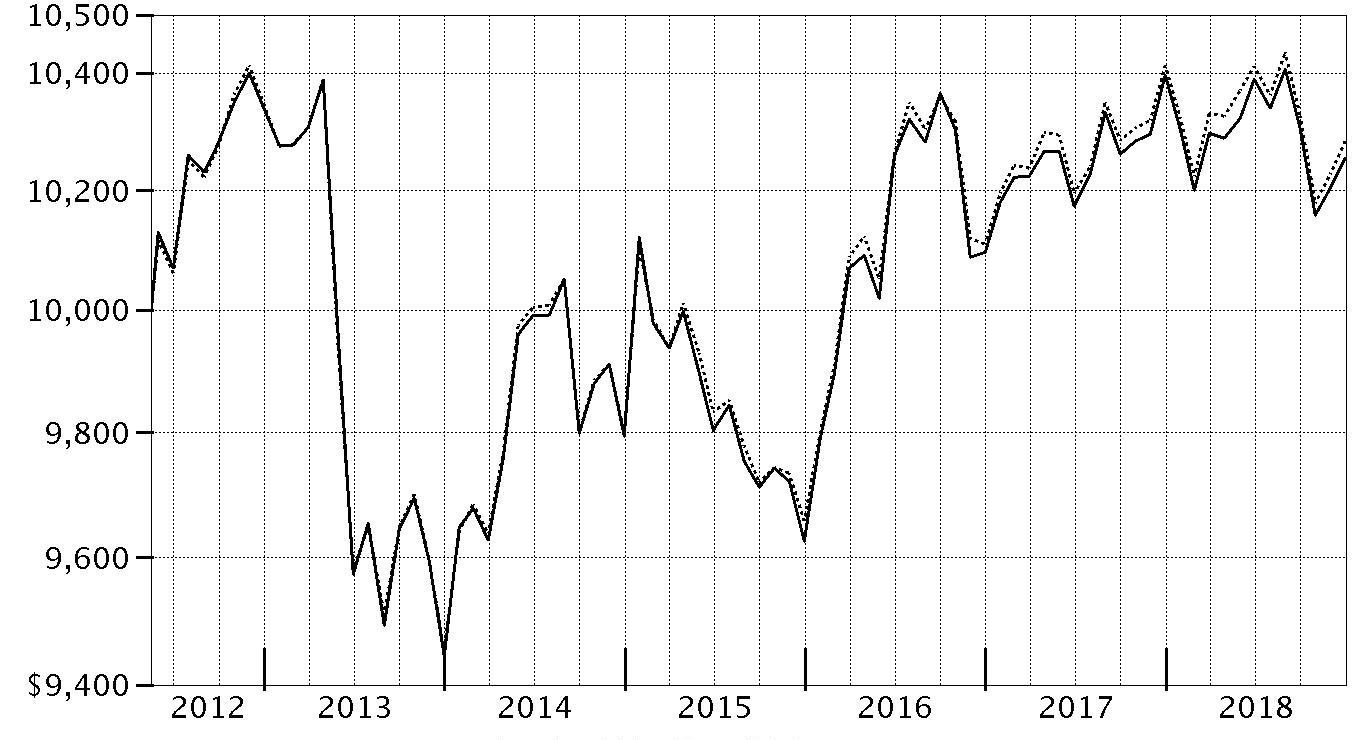
| Period Ending Values |
| $10,254 | Fidelity® Inflation-Protected Bond Index Fund |
| $10,283 | Bloomberg Barclays U.S. Treasury Inflation-Protected Securities (TIPS) Index (Series-L) |
Management's Discussion of Fund Performance
Market Recap: U.S. taxable investment-grade bonds roughly broke even in 2018, as yields that gained early in the year fell notably in the fourth quarter. The Bloomberg Barclays U.S. Aggregate Bond Index gained 0.01% for the year. Longer-term bond yields advanced through mid-May, driven by policy-rate hikes, plans by the U.S. Federal Reserve to gradually reduce its balance sheet and tax reform that went into effect in January. Longer-term yields moderated in the summer, with spreads between shorter-term and longer-term Treasury bonds remaining tight, partly because of escalating global trade tension. Yields rose again in September and early October, amid increased inflation expectations and hints that central banks may curtail economic stimulus. Yields then declined notably and credit spreads widened in November and December due to broad market volatility, disappointing U.S. economic data, and signs of economic weakness in China and parts of Europe. Within the Bloomberg Barclays index, U.S. Treasuries (+0.86%) topped all major market segments. Conversely, investment-grade corporates (-2.51%) performed worst. Outside the index, most non-core fixed-income segments posted a negative return, while Treasury Inflation-Protected Securities (TIPS) returned -1.26%, as inflation expectations moderated near year-end.
Comments from Co-Portfolio Managers Brandon Bettencourt and Jay Small: For the fiscal year ending December 31, 2018, the fund returned -1.37%, net of fees. This was roughly in line with the -1.26% return of the benchmark Bloomberg Barclays U.S. Treasury Inflation-Protected Securities (TIPS) Index (Series L). The fund's performance versus the benchmark was slightly curtailed by "pricing basis." The fund is typically priced at 4:00 p.m. Eastern Time, while the benchmark is priced at 3:00 p.m. Eastern. On December 31, 2018, the fund was priced at 4:00 p.m. Eastern, while the benchmark was priced at 1:00 p.m. Eastern due to the holiday-shortened trading hours for the U.S. bond market. This led to a fairly wide pricing dispersion on the last day of the period. We believe that the effects of pricing basis tend to smooth out over time. In managing the fund, we attempt to fully replicate the benchmark, holding all of its positions and in the same proportions. TIPS began the period on solid ground as improving economic growth pushed inflation expectations somewhat higher, but later faltered as economic growth and inflation expectations moderated. Longer-term inflation expectations, as measured by the 10-year breakeven rate, declined slightly by year end. TIPS underperformed comparable duration nominal U.S. Treasuries for the year.
The views expressed above reflect those of the portfolio manager(s) only through the end of the period as stated on the cover of this report and do not necessarily represent the views of Fidelity or any other person in the Fidelity organization. Any such views are subject to change at any time based upon market or other conditions and Fidelity disclaims any responsibility to update such views. These views may not be relied on as investment advice and, because investment decisions for a Fidelity fund are based on numerous factors, may not be relied on as an indication of trading intent on behalf of any Fidelity fund.
Investment Summary (Unaudited)
Coupon Distribution as of December 31, 2018
| | % of fund's investments |
| 0.01 - 0.99% | 72.2 |
| 1 - 1.99% | 14.0 |
| 2 - 2.99% | 9.7 |
| 3 - 3.99% | 4.1 |
Coupon distribution shows the range of stated interest rates on the fund's investments, excluding short-term investments.
The coupon rates on inflation-protected securities tend to be lower than their nominal bond counterparts since inflation-protected securities get adjusted for actual inflation, while nominal bond coupon rates include a component for expected inflation. Please refer to the fund's prospectus for more information.
Asset Allocation (% of fund's net assets)
| As of December 31, 2018* |
| | U.S. Government and U.S. Government Agency Obligations | 100.0% |

* Inflation Protected Securities - 100.0%
Schedule of Investments December 31, 2018
Showing Percentage of Net Assets
| U.S. Treasury Inflation-Protected Obligations - 100.0% | | | |
| | | Principal Amount | Value |
| U.S. Treasury Inflation-Indexed Bonds: | | | |
| 0.625% 2/15/43 | | $61,576,281 | $54,111,607 |
| 0.75% 2/15/42 | | 83,308,032 | 75,783,126 |
| 0.75% 2/15/45 | | 103,554,993 | 92,838,298 |
| 0.875% 2/15/47 | | 74,611,832 | 68,654,118 |
| 1% 2/15/46 | | 76,068,247 | 72,292,199 |
| 1% 2/15/48 | | 73,090,462 | 69,419,516 |
| 1.375% 2/15/44 | | 92,927,565 | 96,167,530 |
| 1.75% 1/15/28 | | 70,700,433 | 75,132,482 |
| 2% 1/15/26 | | 87,776,675 | 93,712,661 |
| 2.125% 2/15/40 | | 37,260,138 | 43,893,410 |
| 2.125% 2/15/41 | | 47,414,856 | 56,120,801 |
| 2.375% 1/15/25 | | 120,501,614 | 130,327,531 |
| 2.375% 1/15/27 | | 70,622,209 | 77,990,286 |
| 2.5% 1/15/29 | | 68,216,361 | 77,711,608 |
| 3.375% 4/15/32 | | 27,519,505 | 35,353,508 |
| 3.625% 4/15/28 | | 59,529,841 | 73,116,025 |
| 3.875% 4/15/29 | | 72,438,076 | 92,288,344 |
| U.S. Treasury Inflation-Indexed Notes: | | | |
| 0.125% 4/15/20 | | 226,362,349 | 221,335,441 |
| 0.125% 4/15/21 | | 196,821,243 | 191,478,407 |
| 0.125% 1/15/22 | | 181,677,958 | 176,376,182 |
| 0.125% 4/15/22 | | 191,779,771 | 185,586,358 |
| 0.125% 7/15/22 | | 187,381,073 | 182,032,222 |
| 0.125% 1/15/23 | | 188,251,320 | 181,858,710 |
| 0.125% 7/15/24 | | 183,069,483 | 175,604,738 |
| 0.125% 7/15/26 | | 154,805,425 | 145,438,004 |
| 0.25% 1/15/25 | | 183,501,094 | 175,775,893 |
| 0.375% 7/15/23 | | 186,737,088 | 182,633,059 |
| 0.375% 7/15/25 | | 183,297,925 | 176,830,798 |
| 0.375% 1/15/27 | | 153,614,357 | 146,007,828 |
| 0.375% 7/15/27 | | 151,795,521 | 144,104,241 |
| 0.5% 1/15/28 | | 150,537,736 | 143,760,571 |
| 0.625% 7/15/21 | | 164,598,090 | 162,822,955 |
| 0.625% 4/15/23 | | 187,804,008 | 184,756,078 |
| 0.625% 1/15/24 | | 186,207,228 | 183,348,897 |
| 0.625% 1/15/26 | | 165,066,635 | 160,778,390 |
| 0.75% 7/15/28 | | 147,828,723 | 144,805,279 |
| 1.125% 1/15/21 | | 155,062,928 | 154,374,856 |
| 1.25% 7/15/20 | | 135,565,329 | 135,299,626 |
| 1.375% 1/15/20 | | 88,217,121 | 87,673,047 |
| TOTAL U.S. TREASURY INFLATION-PROTECTED OBLIGATIONS | | | |
| (Cost $5,041,199,927) | | | 4,927,594,630 |
| | | Shares | Value |
|
| Money Market Funds - 0.0% | | | |
| Fidelity Cash Central Fund, 2.42% (a) | | | |
| (Cost $690,906) | | 690,775 | 690,913 |
| TOTAL INVESTMENT IN SECURITIES - 100.0% | | | |
| (Cost $5,041,890,833) | | | 4,928,285,543 |
| NET OTHER ASSETS (LIABILITIES) - 0.0% | | | 1,653,705 |
| NET ASSETS - 100% | | | $4,929,939,248 |
Legend
(a) Affiliated fund that is generally available only to investment companies and other accounts managed by Fidelity Investments. The rate quoted is the annualized seven-day yield of the fund at period end. A complete unaudited listing of the fund's holdings as of its most recent quarter end is available upon request. In addition, each Fidelity Central Fund's financial statements, which are not covered by the Fund's Report of Independent Registered Public Accounting Firm, are available on the SEC's website or upon request.
Affiliated Central Funds
Information regarding fiscal year to date income earned by the Fund from investments in Fidelity Central Funds is as follows:
| Fund | Income earned |
| Fidelity Cash Central Fund | $69,338 |
| Total | $69,338 |
Amounts in the income column in the above table include any capital gain distributions from underlying funds, which are presented in the corresponding line-item in the Statement of Operations if applicable.
Investment Valuation
The following is a summary of the inputs used, as of December 31, 2018, involving the Fund's assets and liabilities carried at fair value. The inputs or methodology used for valuing securities may not be an indication of the risk associated with investing in those securities. For more information on valuation inputs, and their aggregation into the levels used below, please refer to the Investment Valuation section in the accompanying Notes to Financial Statements.
| | Valuation Inputs at Reporting Date: |
| Description | Total | Level 1 | Level 2 | Level 3 |
| Investments in Securities: | | | | |
| U.S. Government and Government Agency Obligations | $4,927,594,630 | $-- | $4,927,594,630 | $-- |
| Money Market Funds | 690,913 | 690,913 | -- | -- |
| Total Investments in Securities: | $4,928,285,543 | $690,913 | $4,927,594,630 | $-- |
Other Information
The composition of credit quality ratings as a percentage of Total Net Assets is as follows (Unaudited):
| U.S. Government and U.S. Government Agency Obligations | 100.0% |
| Short-Term Investments and Net Other Assets | 0.0% |
| | 100.0% |
We have used ratings from Moody's Investors Service, Inc. Where Moody's® ratings are not available, we have used S&P® ratings. All ratings are as of the date indicated and do not reflect subsequent changes.
See accompanying notes which are an integral part of the financial statements.
Financial Statements
Statement of Assets and Liabilities
| | | December 31, 2018 |
| Assets | | |
Investment in securities, at value — See accompanying schedule:
Unaffiliated issuers (cost $5,041,199,927) | $4,927,594,630 | |
| Fidelity Central Funds (cost $690,906) | 690,913 | |
| Total Investment in Securities (cost $5,041,890,833) | | $4,928,285,543 |
| Receivable for investments sold | | 46,993,594 |
| Receivable for fund shares sold | | 18,125,539 |
| Interest receivable | | 15,050,676 |
| Distributions receivable from Fidelity Central Funds | | 1,530 |
| Total assets | | 5,008,456,882 |
| Liabilities | | |
| Payable for investments purchased | $57,071,038 | |
| Payable for fund shares redeemed | 20,975,081 | |
| Distributions payable | 264,873 | |
| Accrued management fee | 206,642 | |
| Total liabilities | | 78,517,634 |
| Net Assets | | $4,929,939,248 |
| Net Assets consist of: | | |
| Paid in capital | | $5,096,072,666 |
| Total distributable earnings (loss) | | (166,133,418) |
| Net Assets | | $4,929,939,248 |
| Net Asset Value and Maximum Offering Price | | |
| Net Asset Value, offering price and redemption price per share ($4,929,939,248 ÷ 519,441,283 shares) | | $9.49 |
See accompanying notes which are an integral part of the financial statements.
Statement of Operations
| | | Year ended December 31, 2018 |
| Investment Income | | |
| Interest | | $113,383,703 |
| Income from Fidelity Central Funds | | 69,338 |
| Total income | | 113,453,041 |
| Expenses | | |
| Management fee | $2,023,677 | |
| Transfer agent fees | 214,663 | |
| Independent trustees' fees and expenses | 18,191 | |
| Interest | 1,761 | |
| Commitment fees | 8,195 | |
| Total expenses before reductions | 2,266,487 | |
| Expense reductions | (930) | |
| Total expenses after reductions | | 2,265,557 |
| Net investment income (loss) | | 111,187,484 |
| Realized and Unrealized Gain (Loss) | | |
| Net realized gain (loss) on: | | |
| Investment securities: | | |
| Unaffiliated issuers | (47,337,343) | |
| Fidelity Central Funds | 74 | |
| Total net realized gain (loss) | | (47,337,269) |
| Change in net unrealized appreciation (depreciation) on: | | |
| Investment securities: | | |
| Unaffiliated issuers | (142,572,112) | |
| Fidelity Central Funds | 7 | |
| Total change in net unrealized appreciation (depreciation) | | (142,572,105) |
| Net gain (loss) | | (189,909,374) |
| Net increase (decrease) in net assets resulting from operations | | $(78,721,890) |
See accompanying notes which are an integral part of the financial statements.
Statement of Changes in Net Assets
| | Year ended December 31, 2018 | Year ended December 31, 2017 |
| Increase (Decrease) in Net Assets | | |
| Operations | | |
| Net investment income (loss) | $111,187,484 | $31,242,983 |
| Net realized gain (loss) | (47,337,269) | (3,115,968) |
| Change in net unrealized appreciation (depreciation) | (142,572,105) | 20,120,313 |
| Net increase (decrease) in net assets resulting from operations | (78,721,890) | 48,247,328 |
| Distributions to shareholders | (107,364,662) | – |
| Distributions to shareholders from net investment income | – | (1,735,485) |
| Distributions to shareholders from net realized gain | – | (28,614,160) |
| Distributions to shareholders from tax return of capital | – | (1,451,713) |
| Total distributions | (107,364,662) | (31,801,358) |
| Share transactions - net increase (decrease) | 2,373,826,601 | 1,613,684,467 |
| Total increase (decrease) in net assets | 2,187,740,049 | 1,630,130,437 |
| Net Assets | | |
| Beginning of period | 2,742,199,199 | 1,112,068,762 |
| End of period | $4,929,939,248 | $2,742,199,199 |
| Other Information | | |
| Undistributed net investment income end of period | | $463,685 |
See accompanying notes which are an integral part of the financial statements.
Financial Highlights
Fidelity Inflation-Protected Bond Index Fund
| Years ended December 31, | 2018 | 2017 | 2016 | 2015 | 2014 |
| Selected Per–Share Data | | | | | |
| Net asset value, beginning of period | $9.84 | $9.68 | $9.38 | $9.58 | $9.34 |
| Income from Investment Operations | | | | | |
| Net investment income (loss)A | .262 | .219 | .173 | .041 | .111 |
| Net realized and unrealized gain (loss) | (.398) | .068 | .283 | (.205) | .233 |
| Total from investment operations | (.136) | .287 | .456 | (.164) | .344 |
| Distributions from net investment income | (.031) | (.013) | (.010) | – | – |
| Distributions from net realized gain | (.183) | (.108) | (.146) | (.036) | (.104) |
| Tax return of capital | – | (.006) | – | – | – |
| Total distributions | (.214) | (.127) | (.156) | (.036) | (.104) |
| Net asset value, end of period | $9.49 | $9.84 | $9.68 | $9.38 | $9.58 |
| Total ReturnB | (1.37)% | 2.98% | 4.88% | (1.71)% | 3.69% |
| Ratios to Average Net AssetsC,D | | | | | |
| Expenses before reductions | .05% | .05% | .05% | .05% | .05% |
| Expenses net of fee waivers, if any | .05% | .05% | .05% | .05% | .05% |
| Expenses net of all reductions | .05% | .05% | .05% | .05% | .05% |
| Net investment income (loss) | 2.71% | 2.22% | 1.78% | .43% | 1.14% |
| Supplemental Data | | | | | |
| Net assets, end of period (000 omitted) | $4,929,939 | $1,441,076 | $504,388 | $91 | $93 |
| Portfolio turnover rateE | 41%F,G | 33% | 19% | 25% | 42% |
A Calculated based on average shares outstanding during the period.
B Total returns would have been lower if certain expenses had not been reduced during the applicable periods shown.
C Fees and expenses of any underlying Fidelity Central Funds are not included in the Fund's expense ratio. The Fund indirectly bears its proportionate share of the expenses of any underlying Fidelity Central Funds.
D Expense ratios reflect operating expenses of the fund. Expenses before reductions do not reflect amounts reimbursed by the investment adviser or reductions from expense offset arrangements and do not represent the amount paid by the fund during periods when reimbursements or reductions occur. Expenses net of fee waivers reflect expenses after reimbursement by the investment adviser but prior to reductions from expense offset arrangements. Expenses net of all reductions represent the net expenses paid by the fund.
E Amount does not include the portfolio activity of any underlying Fidelity Central Funds.
F The portfolio turnover rate does not include the assets acquired in the merger.
G Portfolio turnover rate excludes securities received or delivered in-kind.
See accompanying notes which are an integral part of the financial statements.
Notes to Financial Statements
For the period ended December 31, 2018
1. Organization.
Fidelity Inflation-Protected Bond Index Fund (the Fund) is a fund of Fidelity Salem Street Trust (the Trust) and is authorized to issue an unlimited number of shares. The Trust is registered under the Investment Company Act of 1940, as amended (the 1940 Act), as an open-end management investment company organized as a Massachusetts business trust. Effective November 2, 2018, the Fund's publicly offered share classes, were consolidated into a single share class. The surviving class is Fidelity Inflation-Protected Bond Index Fund (formerly Institutional Premium Class).
2. Investments in Fidelity Central Funds.
The Fund invests in Fidelity Central Funds, which are open-end investment companies generally available only to other investment companies and accounts managed by the investment adviser and its affiliates. The Fund's Schedule of Investments lists each of the Fidelity Central Funds held as of period end, if any, as an investment of the Fund, but does not include the underlying holdings of each Fidelity Central Fund. As an Investing Fund, the Fund indirectly bears its proportionate share of the expenses of the underlying Fidelity Central Funds.
The Money Market Central Funds seek preservation of capital and current income and are managed by Fidelity Investments Money Management, Inc. (FIMM), an affiliate of the investment adviser. Annualized expenses of the Money Market Central Funds as of their most recent shareholder report date are less than .005%.
A complete unaudited list of holdings for each Fidelity Central Fund is available upon request or at the Securities and Exchange Commission (the SEC) website at www.sec.gov. In addition, the financial statements of the Fidelity Central Funds, which are not covered by the Fund's Report of Independent Registered Public Accounting Firm, are available on the SEC website or upon request.
3. Significant Accounting Policies.
The Fund is an investment company and applies the accounting and reporting guidance of the Financial Accounting Standards Board (FASB) Accounting Standards Codification Topic 946 Financial Services – Investments Companies. The financial statements have been prepared in conformity with accounting principles generally accepted in the United States of America (GAAP), which require management to make certain estimates and assumptions at the date of the financial statements. Actual results could differ from those estimates. Subsequent events, if any, through the date that the financial statements were issued have been evaluated in the preparation of the financial statements. The following summarizes the significant accounting policies of the Fund:
Investment Valuation. Investments are valued as of 4:00 p.m. Eastern time on the last calendar day of the period. The Board of Trustees (the Board) has delegated the day to day responsibility for the valuation of the Fund's investments to the Fair Value Committee (the Committee) established by the Fund's investment adviser. In accordance with valuation policies and procedures approved by the Board, the Fund attempts to obtain prices from one or more third party pricing vendors or brokers to value its investments. When current market prices, quotations or currency exchange rates are not readily available or reliable, investments will be fair valued in good faith by the Committee, in accordance with procedures adopted by the Board. Factors used in determining fair value vary by investment type and may include market or investment specific events, changes in interest rates and credit quality. The frequency with which these procedures are used cannot be predicted and they may be utilized to a significant extent. The Committee oversees the Fund's valuation policies and procedures and reports to the Board on the Committee's activities and fair value determinations. The Board monitors the appropriateness of the procedures used in valuing the Fund's investments and ratifies the fair value determinations of the Committee.
The Fund categorizes the inputs to valuation techniques used to value its investments into a disclosure hierarchy consisting of three levels as shown below:
- Level 1 – quoted prices in active markets for identical investments
- Level 2 – other significant observable inputs (including quoted prices for similar investments, interest rates, prepayment speeds, etc.)
- Level 3 – unobservable inputs (including the Fund's own assumptions based on the best information available)
Valuation techniques used to value the Fund's investments by major category are as follows:
Debt securities, including restricted securities, are valued based on evaluated prices received from third party pricing vendors or from brokers who make markets in such securities. U.S. government and government agency obligations are valued by pricing vendors who utilize matrix pricing which considers yield or price of bonds of comparable quality, coupon, maturity and type or by broker-supplied prices. When independent prices are unavailable or unreliable, debt securities may be valued utilizing pricing methodologies which consider similar factors that would be used by third party pricing vendors. Debt securities are generally categorized as Level 2 in the hierarchy but may be Level 3 depending on the circumstances.
Investments in open-end mutual funds , including the Fidelity Central Funds, are valued at their closing net asset value (NAV) each business day and are categorized as Level 1 in the hierarchy.
Changes in valuation techniques may result in transfers in or out of an assigned level within the disclosure hierarchy. The aggregate value of investments by input level as of December 31, 2018 is included at the end of the Fund's Schedule of Investments.
Investment Transactions and Income. For financial reporting purposes, the Fund's investment holdings and NAV include trades executed through the end of the last business day of the period. The NAV per share for processing shareholder transactions is calculated as of the close of business of the New York Stock Exchange (NYSE), normally 4:00 p.m. Eastern time and includes trades executed through the end of the prior business day. Gains and losses on securities sold are determined on the basis of identified cost. Income and capital gain distributions from Fidelity Central Funds, if any, are recorded on the ex-dividend date. Interest income is accrued as earned and includes coupon interest and amortization of premium and accretion of discount on debt securities as applicable. For Treasury Inflation-Protected Securities (TIPS) the principal amount is adjusted daily to keep pace with inflation. Interest is accrued based on the adjusted principal amount. The adjustments to principal due to inflation are reflected as increases or decreases to Interest in the accompanying Statement of Operations. Such adjustments may have a significant impact on the Fund's distributions.
Class Allocations and Expenses. Investment income, realized and unrealized capital gains and losses, common expenses of the Fund, and certain fund-level expense reductions, if any, are allocated daily on a pro-rata basis to each class based on the relative net assets of each class to the total net assets of the Fund. Each class differs with respect to transfer agent fees incurred. Certain expense reductions may also differ by class. For the reporting period, the allocated portion of income and expenses to each class as a percent of its average net assets may vary due to the timing of recording these transactions in relation to fluctuating net assets of the classes. Expenses directly attributable to a fund are charged to that fund. Expenses attributable to more than one fund are allocated among the respective funds on the basis of relative net assets or other appropriate methods. Expense estimates are accrued in the period to which they relate and adjustments are made when actual amounts are known.
Income Tax Information and Distributions to Shareholders. Each year, the Fund intends to qualify as a regulated investment company under Subchapter M of the Internal Revenue Code, including distributing substantially all of its taxable income and realized gains. As a result, no provision for U.S. Federal income taxes is required. As of December 31, 2018, the Fund did not have any unrecognized tax benefits in the financial statements; nor is the Fund aware of any tax positions for which it is reasonably possible that the total amounts of unrecognized tax benefits will significantly change in the next twelve months. The Fund files a U.S. federal tax return, in addition to state and local tax returns as required. The Fund's federal income tax returns are subject to examination by the Internal Revenue Service (IRS) for a period of three fiscal years after they are filed. State and local tax returns may be subject to examination for an additional fiscal year depending on the jurisdiction.
Distributions are declared and recorded daily and paid monthly from net investment income. Distributions from realized gains, if any, are declared and recorded on the ex-dividend date. Income and capital gain distributions are determined in accordance with income tax regulations, which may differ from GAAP.
Capital accounts within the financial statements are adjusted for permanent book-tax differences. These adjustments have no impact on net assets or the results of operations. Capital accounts are not adjusted for temporary book-tax differences which will reverse in a subsequent period.
Book-tax differences are primarily due to market discount, capital loss carryforwards and losses deferred due to wash sales.
As of period end, the cost and unrealized appreciation (depreciation) in securities, and derivatives if applicable, for federal income tax purposes were as follows:
| Gross unrealized appreciation | $14,663,246 |
| Gross unrealized depreciation | (134,512,671) |
| Net unrealized appreciation (depreciation) | $(119,849,425) |
| Tax Cost | $5,048,134,968 |
The tax-based components of distributable earnings as of period end were as follows:
| Capital loss carryforward | $(44,780,450) |
| Net unrealized appreciation (depreciation) on securities and other investments | $(119,849,425) |
Capital loss carryforwards are only available to offset future capital gains of the Fund to the extent provided by regulations and may be limited. Under the Regulated Investment Company Modernization Act of 2010 (the Act), the Fund is permitted to carry forward capital losses incurred in taxable years beginning after December 22, 2010 for an unlimited period and such capital losses are required to be used prior to any losses that expire. The capital loss carryforward information presented below, including any applicable limitation, is estimated as of fiscal period end and is subject to adjustment.
| No expiration | |
| Short-term | $(32,452,459) |
| Long-term | (12,327,991) |
| Total capital loss carryforward | $(44,780,450) |
The tax character of distributions paid was as follows:
| | December 31, 2018 | December 31, 2017 |
| Ordinary Income | $107,364,662 | $ 29,164,001 |
| Long-term Capital Gains | – | 1,185,644 |
| Tax Return of Capital | – | 1,451,713 |
| Total | $107,364,662 | $ 31,801,358 |
New Rule Issuance. During August 2018, the U.S. Securities and Exchange Commission issued Final Rule Release No. 33-10532, Disclosure Update and Simplification. This Final Rule includes amendments specific to registered investment companies that are intended to eliminate overlap in disclosure requirements between Regulation S-X and GAAP. In accordance with these amendments, certain line-items in the Fund's financial statements have been combined or removed for the current period as outlined in the table below.
| Financial Statement | Current Line-Item Presentation | Prior Line-Item Presentation |
| Statement of Assets and Liabilities | Total distributable earnings (loss) | Undistributed/Distributions in excess of/Accumulated net investment income (loss)
Accumulated/Undistributed net realized gain (loss)
Net unrealized appreciation (depreciation) |
| Statement of Changes in Net Assets | N/A - removed | Undistributed/Distributions in excess of/Accumulated net investment income (loss) end of period |
| Statement of Changes in Net Assets | Distributions to shareholders | Distributions to shareholders from net investment income
Distributions to shareholders from net realized gain |
| Distributions to Shareholders Note to Financial Statements | Distributions to shareholders | Distributions to shareholders from net investment income
Distributions to shareholders from net realized gain |
4. Fees and Other Transactions with Affiliates.
Management Fee and Expense Contract. Fidelity Management & Research Company (the investment adviser) and its affiliates provide the Fund with investment management related services for which the Fund pays a monthly management fee. The management fee is based on an annual rate of .05% of the Fund's average net assets. Under the management contract, the investment adviser pays all other fund-level expenses, except the compensation of the independent Trustees and certain other expenses such as interest expense, including commitment fees.
Effective August 1, 2018, the Board approved an amendment to the expense contract. Under the expense contract, the investment adviser pays class-level expenses as necessary so that the total expenses do not exceed .05% of each class' average net assets on an annual basis with certain exceptions. Prior to August 1, 2018 the investment adviser paid class-level expenses as necessary so that the total expenses do not exceed certain amounts of each class' average net assets on an annual basis with certain exceptions, as noted in the following table:
| Investor Class | .19% |
| Premium Class | .09% |
| Institutional Class | .06% |
| Fidelity Inflation-Protected Bond Index Fund | .05% |
Transfer Agent Fees. Fidelity Investments Institutional Operations Company, Inc. (FIIOC), an affiliate of the investment adviser, is the transfer, dividend disbursing and shareholder servicing agent for each class. FIIOC receives transfer agent fees at an annual rate of .17%, .12%, .035% and .015% of class-level average net assets for Investor Class, Premium Class, Institutional Class and Fidelity Inflation-Protected Bond Index Fund, respectively. FIIOC pays for typesetting, printing and mailing of shareholder reports, except proxy statements.
Effective August 1, 2018, under the amended expense contract, Investor Class, Premium Class, Institutional Class and Fidelity Inflation-Protected Bond Index Fund do not pay transfer agent fees. Prior to August 1, 2018, under the expense contract, Investor Class, Premium Class and Institutional Class paid portion of the transfer agent fees at an annual rate of .14%, .04% and .01% of class-level average net assets, respectively, and Fidelity Inflation-Protected Bond Index Fund did not pay transfer agent fees.
For the period, the total transfer agent fees paid by each applicable class were as follows:
| | Amount |
| Investor Class | $2,470 |
| Premium Class | 188,705 |
| Institutional Class | 23,488 |
| | $214,663 |
Interfund Lending Program. Pursuant to an Exemptive Order issued by the SEC, the Fund, along with other registered investment companies having management contracts with Fidelity Management & Research Company (FMR) or other affiliated entities of FMR, may participate in an interfund lending program. This program provides an alternative credit facility allowing the funds to borrow from, or lend money to, other participating affiliated funds. At period end, there were no interfund loans outstanding. The Fund's activity in this program during the period for which loans were outstanding was as follows:
| Borrower or Lender | Average Loan Balance | Weighted Average Interest Rate | Interest Expense |
| Borrower | $12,886,500 | 2.46% | $1,761 |
Interfund Trades. The Fund may purchase from or sell securities to other Fidelity Funds under procedures adopted by the Board. The procedures have been designed to ensure these interfund trades are executed in accordance with Rule 17a-7 of the 1940 Act.
5. Committed Line of Credit.
The Fund participates with other funds managed by the investment adviser or an affiliate in a $4.25 billion credit facility (the "line of credit") to be utilized for temporary or emergency purposes to fund shareholder redemptions or for other short-term liquidity purposes. The Fund has agreed to pay commitment fees on its pro-rata portion of the line of credit, which amounted to $8,195 and is reflected in Commitment fees on the Statement of Operations. During the period, the Fund did not borrow on this line of credit.
6. Expense Reductions.
Through arrangements with the Fund's custodian, credits realized as a result of certain uninvested cash balances were used to reduce the Fund's expenses. During the period, these credits reduced the Fund's expenses by $930.
7. Distributions to Shareholders.
Distributions to shareholders of each class were as follows:
| | Year ended
December 31, 2018 | Year ended
December 31, 2017 |
| Distributions to shareholders | | |
| Investor Class | $897,490 | $– |
| Premium Class | 2,065,133 | – |
| Institutional Class | 1,265,015 | – |
| Fidelity Inflation-Protected Bond Index Fund | 103,137,024 | – |
| Total | $107,364,662 | $– |
| From net investment income | | |
| Investor Class | $– | $2,127 |
| Premium Class | – | 661,901 |
| Institutional Class | – | 241,051 |
| Fidelity Inflation-Protected Bond Index Fund | – | 830,406 |
| Total | $– | $1,735,485 |
| Tax return of capital | | |
| Investor Class | $– | $6,270 |
| Premium Class | – | 468,397 |
| Institutional Class | – | 181,141 |
| Fidelity Inflation-Protected Bond Index Fund | – | 795,905 |
| Total | $– | $1,451,713 |
| From net realized gain | | |
| Investor Class | $– | $123,590 |
| Premium Class | – | 9,232,402 |
| Institutional Class | – | 3,570,406 |
| Fidelity Inflation-Protected Bond Index Fund | – | 15,687,762 |
| Total | $– | $28,614,160 |
8. Share Transactions.
Share transactions for each class were as follows and may contain automatic conversions between classes or exchanges between affiliated funds:
| | Shares | Shares | Dollars | Dollars |
| | Year ended December 31, 2018 | Year ended December 31, 2017 | Year ended December 31, 2018 | Year ended December 31, 2017 |
| Investor Class | | | | |
| Shares sold | 5,411,704 | 2,317,849 | $52,349,363 | $22,699,489 |
| Issued in exchange for the shares of Fidelity Inflation Protected Bond Fund | 133,675,885 | – | 1,318,047,978 | – |
| Reinvestment of distributions | 89,972 | 11,065 | 869,846 | 108,017 |
| Shares redeemed | (140,368,403) | (2,072,392) | (1,342,638,029) | (20,305,189) |
| Net increase (decrease) | (1,190,842) | 256,522 | $28,629,158 | $2,502,317 |
| Premium Class | | | | |
| Shares sold | 67,978,692(a) | 69,171,679 | $665,397,294(a) | $678,945,024 |
| Reinvestment of distributions | 178,574 | 923,465 | 1,737,548 | 9,017,006 |
| Shares redeemed | (165,524,792) | (22,435,106) | (1,589,476,442) | (220,334,018) |
| Net increase (decrease) | (97,367,526) | 47,660,038 | $(922,341,600) | $467,628,012 |
| Institutional Class | | | | |
| Shares sold | 42,835,410 | 31,379,441 | $418,301,855 | $308,515,624 |
| Reinvestment of distributions | 117,383 | 374,810 | 1,142,165 | 3,659,843 |
| Shares redeemed | (76,606,036) | (10,273,168) | (733,887,748) | (100,972,907) |
| Net increase (decrease) | (33,653,243) | 21,481,083 | $(314,443,728) | $211,202,560 |
| Fidelity Inflation-Protected Bond Index Fund | | | | |
| Shares sold | 510,450,836 | 126,205,555 | $4,909,765,829 | $1,245,516,991 |
| Reinvestment of distributions | 9,059,088 | 1,770,644 | 85,876,074 | 17,305,378 |
| Shares redeemed | (146,483,186) | (33,693,514) | (1,413,659,132) | (330,470,791) |
| Net increase (decrease) | 373,026,738 | 94,282,685 | $3,581,982,771 | $932,351,578 |
(a) Amount includes in-kind exchanges (see the Unaffiliated Exchanges In-Kind note for additional details).
9. Other.
The Fund's organizational documents provide former and current trustees and officers with a limited indemnification against liabilities arising in connection with the performance of their duties to the Fund. In the normal course of business, the Fund may also enter into contracts that provide general indemnifications. The Fund's maximum exposure under these arrangements is unknown as this would be dependent on future claims that may be made against the Fund. The risk of material loss from such claims is considered remote.
Mutual funds managed by the investment adviser or its affiliates were the owners of record, in the aggregate, of approximately 25% of the total outstanding shares of the Fund.
Unaffiliated Exchanges In-Kind. During the period, the Fund received investments, including accrued interest, and cash valued at $245,692,741 in exchange for 24,943,426 shares of the Fund. The amount of in-kind exchanges is included in share transactions in the accompanying Statement of Changes in Net Assets as well as the Notes to Financial Statements.
10. Merger Information.
On August 24, 2018, the Fund acquired all of the assets and assumed all of the liabilities of Fidelity Inflation-Protected Bond Fund ("Target Fund") pursuant to an Agreement and Plan of Reorganization approved by the Board of Trustees ("The Board"). The acquisition was accomplished by an exchange of Investor Class shares for Class A, Class M, Class C, Inflation-Protected Bond and Class I shares then outstanding of the Target Fund at its respective net asset value on the acquisition date. The reorganization provides shareholders of the Target Fund access to a larger portfolio with a similar investment objective. The reorganization qualified as a tax-free reorganization for federal income tax purposes with no gain or loss recognized to the funds or their shareholders. The Target Fund's net assets of $1,318,047,978, including securities of $1,307,123,297 and unrealized appreciation of $9,324,286, was combined with the Fund's net assets of $4,476,409,501 for total net assets after the acquisition of $5,794,457,479.
Pro forma results of operations of the combined entity for the entire period ended December 31, 2018, as though the acquisition had occurred as of the beginning of the year (rather than on the actual acquisition date), are as follows:
| Net investment income (loss) | $151,947,980 |
| Total net realized gain (loss) | (19,920,752) |
| Total change in net unrealized appreciation (depreciation) | (207,028,162) |
| Net increase (decrease) in net assets resulting from operations | $(75,000,934) |
Because the combined investment portfolios have been managed as a single portfolio since the acquisition was completed, it is not practicable to separate the amounts of revenue and earnings of the acquired fund that have been included in the Fund's accompanying Statement of Operations since August 24, 2018.
Report of Independent Registered Public Accounting Firm
To the Board of Trustees of Fidelity Salem Street Trust and Shareholders of Fidelity Inflation-Protected Bond Index Fund:
Opinion on the Financial Statements
We have audited the accompanying statement of assets and liabilities, including the schedule of investments, of Fidelity Inflation-Protected Bond Index Fund (one of the funds constituting Fidelity Salem Street Trust, referred to hereafter as the "Fund") as of December 31, 2018, the related statement of operations for the year ended December 31, 2018, the statement of changes in net assets for each of the two years in the period ended December 31, 2018, including the related notes, and the financial highlights for each of the five years in the period ended December 31, 2018 (collectively referred to as the “financial statements”). In our opinion, the financial statements present fairly, in all material respects, the financial position of the Fund as of December 31, 2018, the results of its operations for the year then ended, the changes in its net assets for each of the two years in the period ended December 31, 2018 and the financial highlights for each of the five years in the period ended December 31, 2018, in conformity with accounting principles generally accepted in the United States of America.
Basis for Opinion
These financial statements are the responsibility of the Fund’s management. Our responsibility is to express an opinion on the Fund’s financial statements based on our audits. We are a public accounting firm registered with the Public Company Accounting Oversight Board (United States) (PCAOB) and are required to be independent with respect to the Fund in accordance with the U.S. federal securities laws and the applicable rules and regulations of the Securities and Exchange Commission and the PCAOB.
We conducted our audits of these financial statements in accordance with the standards of the PCAOB. Those standards require that we plan and perform the audit to obtain reasonable assurance about whether the financial statements are free of material misstatement, whether due to error or fraud.
Our audits included performing procedures to assess the risks of material misstatement of the financial statements, whether due to error or fraud, and performing procedures that respond to those risks. Such procedures included examining, on a test basis, evidence regarding the amounts and disclosures in the financial statements. Our audits also included evaluating the accounting principles used and significant estimates made by management, as well as evaluating the overall presentation of the financial statements. Our procedures included confirmation of securities owned as of December 31, 2018 by correspondence with the custodian and brokers; when replies were not received from brokers, we performed other auditing procedures. We believe that our audits provide a reasonable basis for our opinion.
PricewaterhouseCoopers LLP
Boston, Massachusetts
February 19, 2019
We have served as the auditor of one or more investment companies in the Fidelity group of funds since 1932.
Trustees and Officers
The Trustees, Members of the Advisory Board (if any), and officers of the trust and fund, as applicable, are listed below. The Board of Trustees governs the fund and is responsible for protecting the interests of shareholders. The Trustees are experienced executives who meet periodically throughout the year to oversee the fund's activities, review contractual arrangements with companies that provide services to the fund, oversee management of the risks associated with such activities and contractual arrangements, and review the fund's performance. Except for Jonathan Chiel, each of the Trustees oversees 260 funds. Mr. Chiel oversees 154 funds.
The Trustees hold office without limit in time except that (a) any Trustee may resign; (b) any Trustee may be removed by written instrument, signed by at least two-thirds of the number of Trustees prior to such removal; (c) any Trustee who requests to be retired or who has become incapacitated by illness or injury may be retired by written instrument signed by a majority of the other Trustees; and (d) any Trustee may be removed at any special meeting of shareholders by a two-thirds vote of the outstanding voting securities of the trust. Each Trustee who is not an interested person (as defined in the 1940 Act) of the trust and the fund is referred to herein as an Independent Trustee. Each Independent Trustee shall retire not later than the last day of the calendar year in which his or her 75th birthday occurs. The Independent Trustees may waive this mandatory retirement age policy with respect to individual Trustees. Officers and Advisory Board Members hold office without limit in time, except that any officer or Advisory Board Member may resign or may be removed by a vote of a majority of the Trustees at any regular meeting or any special meeting of the Trustees. Except as indicated, each individual has held the office shown or other offices in the same company for the past five years.
The fund’s Statement of Additional Information (SAI) includes more information about the Trustees. To request a free copy, call Fidelity at 1-800-544-8544.
Experience, Skills, Attributes, and Qualifications of the Trustees. The Governance and Nominating Committee has adopted a statement of policy that describes the experience, qualifications, attributes, and skills that are necessary and desirable for potential Independent Trustee candidates (Statement of Policy). The Board believes that each Trustee satisfied at the time he or she was initially elected or appointed a Trustee, and continues to satisfy, the standards contemplated by the Statement of Policy. The Governance and Nominating Committee also engages professional search firms to help identify potential Independent Trustee candidates who have the experience, qualifications, attributes, and skills consistent with the Statement of Policy. From time to time, additional criteria based on the composition and skills of the current Independent Trustees, as well as experience or skills that may be appropriate in light of future changes to board composition, business conditions, and regulatory or other developments, have also been considered by the professional search firms and the Governance and Nominating Committee. In addition, the Board takes into account the Trustees' commitment and participation in Board and committee meetings, as well as their leadership of standing and ad hoc committees throughout their tenure.
In determining that a particular Trustee was and continues to be qualified to serve as a Trustee, the Board has considered a variety of criteria, none of which, in isolation, was controlling. The Board believes that, collectively, the Trustees have balanced and diverse experience, qualifications, attributes, and skills, which allow the Board to operate effectively in governing the fund and protecting the interests of shareholders. Information about the specific experience, skills, attributes, and qualifications of each Trustee, which in each case led to the Board's conclusion that the Trustee should serve (or continue to serve) as a trustee of the fund, is provided below.
Board Structure and Oversight Function. Abigail P. Johnson is an interested person and currently serves as Chairman. The Trustees have determined that an interested Chairman is appropriate and benefits shareholders because an interested Chairman has a personal and professional stake in the quality and continuity of services provided to the fund. Independent Trustees exercise their informed business judgment to appoint an individual of their choosing to serve as Chairman, regardless of whether the Trustee happens to be independent or a member of management. The Independent Trustees have determined that they can act independently and effectively without having an Independent Trustee serve as Chairman and that a key structural component for assuring that they are in a position to do so is for the Independent Trustees to constitute a substantial majority for the Board. The Independent Trustees also regularly meet in executive session. Arthur E. Johnson serves as Chairman of the Independent Trustees and as such (i) acts as a liaison between the Independent Trustees and management with respect to matters important to the Independent Trustees and (ii) with management prepares agendas for Board meetings.
Fidelity® funds are overseen by different Boards of Trustees. The fund's Board oversees Fidelity's investment-grade bond, money market, asset allocation and certain equity funds, and other Boards oversee Fidelity's high income and other equity funds. The asset allocation funds may invest in Fidelity® funds that are overseen by such other Boards. The use of separate Boards, each with its own committee structure, allows the Trustees of each group of Fidelity® funds to focus on the unique issues of the funds they oversee, including common research, investment, and operational issues. On occasion, the separate Boards establish joint committees to address issues of overlapping consequences for the Fidelity® funds overseen by each Board.
The Trustees operate using a system of committees to facilitate the timely and efficient consideration of all matters of importance to the Trustees, the fund, and fund shareholders and to facilitate compliance with legal and regulatory requirements and oversight of the fund's activities and associated risks. The Board, acting through its committees, has charged FMR and its affiliates with (i) identifying events or circumstances the occurrence of which could have demonstrably adverse effects on the fund's business and/or reputation; (ii) implementing processes and controls to lessen the possibility that such events or circumstances occur or to mitigate the effects of such events or circumstances if they do occur; and (iii) creating and maintaining a system designed to evaluate continuously business and market conditions in order to facilitate the identification and implementation processes described in (i) and (ii) above. Because the day-to-day operations and activities of the fund are carried out by or through FMR, its affiliates, and other service providers, the fund's exposure to risks is mitigated but not eliminated by the processes overseen by the Trustees. While each of the Board's committees has responsibility for overseeing different aspects of the fund's activities, oversight is exercised primarily through the Operations and Audit Committees. In addition, an ad hoc Board committee of Independent Trustees has worked with FMR to enhance the Board's oversight of investment and financial risks, legal and regulatory risks, technology risks, and operational risks, including the development of additional risk reporting to the Board. Appropriate personnel, including but not limited to the fund's Chief Compliance Officer (CCO), FMR's internal auditor, the independent accountants, the fund's Treasurer and portfolio management personnel, make periodic reports to the Board's committees, as appropriate, including an annual review of Fidelity's risk management program for the Fidelity® funds. The responsibilities of each standing committee, including their oversight responsibilities, are described further under "Standing Committees of the Trustees."
Interested Trustees*:
Correspondence intended for a Trustee who is an interested person may be sent to Fidelity Investments, 245 Summer Street, Boston, Massachusetts 02210.
Name, Year of Birth; Principal Occupations and Other Relevant Experience+
Jonathan Chiel (1957)
Year of Election or Appointment: 2016
Trustee
Mr. Chiel also serves as Trustee of other Fidelity® funds. Mr. Chiel is Executive Vice President and General Counsel for FMR LLC (diversified financial services company, 2012-present). Previously, Mr. Chiel served as general counsel (2004-2012) and senior vice president and deputy general counsel (2000-2004) for John Hancock Financial Services; a partner with Choate, Hall & Stewart (1996-2000) (law firm); and an Assistant United States Attorney for the United States Attorney’s Office of the District of Massachusetts (1986-95), including Chief of the Criminal Division (1993-1995). Mr. Chiel is a director on the boards of the Boston Bar Foundation and the Maimonides School.
Abigail P. Johnson (1961)
Year of Election or Appointment: 2009
Trustee
Chairman of the Board of Trustees
Ms. Johnson also serves as Trustee of other Fidelity® funds. Ms. Johnson serves as Chairman (2016-present), Chief Executive Officer (2014-present), and Director (2007-present) of FMR LLC (diversified financial services company), President of Fidelity Financial Services (2012-present) and President of Personal, Workplace and Institutional Services (2005-present). Ms. Johnson is Chairman and Director of FMR Co., Inc. (investment adviser firm, 2011-present) and Chairman and Director of FMR (investment adviser firm, 2011-present). Previously, Ms. Johnson served as Vice Chairman (2007-2016) and President (2013-2016) of FMR LLC, President and a Director of FMR (2001-2005), a Trustee of other investment companies advised by FMR, Fidelity Investments Money Management, Inc. (investment adviser firm), and FMR Co., Inc. (2001-2005), Senior Vice President of the Fidelity® funds (2001-2005), and managed a number of Fidelity® funds. Ms. Abigail P. Johnson and Mr. Arthur E. Johnson are not related.
Jennifer Toolin McAuliffe (1959)
Year of Election or Appointment: 2016
Trustee
Ms. McAuliffe also serves as Trustee of other Fidelity® funds. Ms. McAuliffe previously served as a Member of the Advisory Board of certain Fidelity® funds (2016) and as Co-Head of Fixed Income of Fidelity Investments Limited (now known as FIL Limited (FIL)) (diversified financial services company). Earlier roles at FIL included Director of Research for FIL’s credit and quantitative teams in London, Hong Kong and Tokyo. Ms. McAuliffe also was the Director of Research for taxable and municipal bonds at Fidelity Investments Money Management, Inc. Ms. McAuliffe is also a director or trustee of several not-for-profit entities.
* Determined to be an “Interested Trustee” by virtue of, among other things, his or her affiliation with the trust or various entities under common control with FMR.
+ The information includes the Trustee's principal occupation during the last five years and other information relating to the experience, attributes, and skills relevant to the Trustee's qualifications to serve as a Trustee, which led to the conclusion that the Trustee should serve as a Trustee for the fund.
Independent Trustees:
Correspondence intended for an Independent Trustee may be sent to Fidelity Investments, P.O. Box 55235, Boston, Massachusetts 02205-5235.
Name, Year of Birth; Principal Occupations and Other Relevant Experience+
Elizabeth S. Acton (1951)
Year of Election or Appointment: 2013
Trustee
Ms. Acton also serves as Trustee of other Fidelity® funds. Prior to her retirement in April 2012, Ms. Acton was Executive Vice President, Finance (2011-2012), Executive Vice President, Chief Financial Officer (2002-2011), and Treasurer (2004-2005) of Comerica Incorporated (financial services). Prior to joining Comerica, Ms. Acton held a variety of positions at Ford Motor Company (1983-2002), including Vice President and Treasurer (2000-2002) and Executive Vice President and Chief Financial Officer of Ford Motor Credit Company (1998-2000). Ms. Acton currently serves as a member of the Board of Directors and Audit and Finance Committees of Beazer Homes USA, Inc. (homebuilding, 2012-present). Previously, Ms. Acton served as a Member of the Advisory Board of certain Fidelity® funds (2013-2016).
Ann E. Dunwoody (1953)
Year of Election or Appointment: 2018
Trustee
General Dunwoody also serves as Trustee of other Fidelity® funds. General Dunwoody (United States Army, Retired) was the first woman in U.S. military history to achieve the rank of four-star general and prior to her retirement in 2012 held a variety of positions within the U.S. Army, including Commanding General, U.S. Army Material Command (2008-2012). She is the President of First to Four LLC (leadership and mentoring services, 2012-present). She also serves as a member of the Board of Directors and Nominating and Corporate Governance Committee of L3 Technologies, Inc. (communication, electronic, sensor, and aerospace systems, 2013-present), Board of Directors and Nomination and Corporate Governance Committees of Kforce Inc. (professional staffing services, 2016-present) and Board of Directors of Automattic Inc. (software engineering, 2018-present). Previously, General Dunwoody served as a Member of the Advisory Board of certain Fidelity® funds (2018), a member of the Board of Directors and Audit and Sustainability and Corporate Responsibility Committees of Republic Services, Inc. (waste collection, disposal and recycling, 2013-2016). Ms. Dunwoody also serves on several boards for non-profit organizations, including as a member of the Board of Directors, Chair of the Nomination and Governance Committee and member of the Audit Committee of Logistics Management Institute (consulting non-profit, 2012-present), a member of the Board of Directors of the Army Historical Foundation (2015-present), a member of the Council of Trustees for the Association of the United States Army (advocacy non-profit, 2013-present) and a member of the Board of Trustees of Florida Institute of Technology (2015-present) and ThanksUSA (military family education non-profit, 2014-present).
John Engler (1948)
Year of Election or Appointment: 2014
Trustee
Mr. Engler also serves as Trustee of other Fidelity® funds. He serves on the board of directors for Universal Forest Products (manufacturer and distributor of wood and wood-alternative products, 2003-present) and K12 Inc. (technology-based education company, 2012-present). Previously, Mr. Engler served as interim president of Michigan State University (2018-2019), a Member of the Advisory Board of certain Fidelity® funds (2014-2016), president of the Business Roundtable (2011-2017), a trustee of The Munder Funds (2003-2014), president and CEO of the National Association of Manufacturers (2004-2011), member of the Board of Trustees of the Annie E. Casey Foundation (2004-2015), and as governor of Michigan (1991-2003). He is a past chairman of the National Governors Association.
Robert F. Gartland (1951)
Year of Election or Appointment: 2010
Trustee
Mr. Gartland also serves as Trustee of other Fidelity® funds. Mr. Gartland is Chairman and an investor in Gartland & Mellina Group Corp. (consulting, 2009-present). Previously, Mr. Gartland served as a partner and investor of Vietnam Partners LLC (investments and consulting, 2008-2011). Prior to his retirement, Mr. Gartland held a variety of positions at Morgan Stanley (financial services, 1979-2007), including Managing Director (1987-2007), and Chase Manhattan Bank (1975-1978).
Arthur E. Johnson (1947)
Year of Election or Appointment: 2008
Trustee
Chairman of the Independent Trustees
Mr. Johnson also serves as Trustee of other Fidelity® funds. Mr. Johnson serves as a member of the Board of Directors of Eaton Corporation plc (diversified power management, 2009-present) and Booz Allen Hamilton (management consulting, 2011-present). Prior to his retirement, Mr. Johnson served as Senior Vice President of Corporate Strategic Development of Lockheed Martin Corporation (defense contractor, 1999-2009). He previously served on the Board of Directors of IKON Office Solutions, Inc. (1999-2008), AGL Resources, Inc. (holding company, 2002-2016), and Delta Airlines (2005-2007). Mr. Arthur E. Johnson is not related to Ms. Abigail P. Johnson.
Michael E. Kenneally (1954)
Year of Election or Appointment: 2009
Trustee
Vice Chairman of the Independent Trustees
Mr. Kenneally also serves as Trustee of other Fidelity® funds. Prior to his retirement, Mr. Kenneally served as Chairman and Global Chief Executive Officer of Credit Suisse Asset Management. Before joining Credit Suisse, he was an Executive Vice President and Chief Investment Officer for Bank of America Corporation. Earlier roles at Bank of America included Director of Research, Senior Portfolio Manager and Research Analyst, and Mr. Kenneally was awarded the Chartered Financial Analyst (CFA) designation in 1991.
Marie L. Knowles (1946)
Year of Election or Appointment: 2001
Trustee
Ms. Knowles also serves as Trustee of other Fidelity® funds. Prior to Ms. Knowles' retirement in June 2000, she served as Executive Vice President and Chief Financial Officer of Atlantic Richfield Company (ARCO) (diversified energy, 1996-2000). From 1993 to 1996, she was a Senior Vice President of ARCO and President of ARCO Transportation Company (pipeline and tanker operations). Ms. Knowles currently serves as a Director and Chairman of the Audit Committee of McKesson Corporation (healthcare service, since 2002). Ms. Knowles is a member of the Board of the Santa Catalina Island Company (real estate, 2009-present). Ms. Knowles is a Member of the Investment Company Institute Board of Governors and a Member of the Governing Council of the Independent Directors Council (2014-present). She also serves as a member of the Advisory Board for the School of Engineering of the University of Southern California. Previously, Ms. Knowles served as a Director of Phelps Dodge Corporation (copper mining and manufacturing, 1994-2007), URS Corporation (engineering and construction, 2000-2003) and America West (airline, 1999-2002). Ms. Knowles previously served as Chairman (2015-2018) and Vice Chairman (2012-2015) of the Independent Trustees of certain Fidelity® funds.
Mark A. Murray (1954)
Year of Election or Appointment: 2016
Trustee
Mr. Murray also serves as Trustee of other Fidelity® funds. Mr. Murray is Vice Chairman (2013-present) of Meijer, Inc. (regional retail chain). Previously, Mr. Murray served as a Member of the Advisory Board of certain Fidelity® funds (2016) and as Co-Chief Executive Officer (2013-2016) and President (2006-2013) of Meijer, Inc. Mr. Murray serves as a member of the Board of Directors and Nuclear Review and Public Policy and Responsibility Committees of DTE Energy Company (diversified energy company, 2009-present). Mr. Murray also serves as a member of the Board of Directors of Spectrum Health (not-for-profit health system, 2015-present). Mr. Murray previously served as President of Grand Valley State University (2001-2006), Treasurer for the State of Michigan (1999-2001), Vice President of Finance and Administration for Michigan State University (1998-1999), and a member of the Board of Directors and Audit Committee and Chairman of the Nominating and Corporate Governance Committee of Universal Forest Products, Inc. (manufacturer and distributor of wood and wood-alternative products, 2004-2016). Mr. Murray is also a director or trustee of many community and professional organizations.
+ The information includes the Trustee's principal occupation during the last five years and other information relating to the experience, attributes, and skills relevant to the Trustee's qualifications to serve as a Trustee, which led to the conclusion that the Trustee should serve as a Trustee for the fund.
Advisory Board Members and Officers:
Correspondence intended for an officer may be sent to Fidelity Investments, 245 Summer Street, Boston, Massachusetts 02210. Officers appear below in alphabetical order.
Name, Year of Birth; Principal Occupation
Elizabeth Paige Baumann (1968)
Year of Election or Appointment: 2017
Anti-Money Laundering (AML) Officer
Ms. Baumann also serves as AML Officer of other funds. She is Chief AML Officer (2012-present) and Senior Vice President (2014-present) of FMR LLC (diversified financial services company) and is an employee of Fidelity Investments. Previously, Ms. Baumann served as AML Officer of the funds (2012-2016), and Vice President (2007-2014) and Deputy Anti-Money Laundering Officer (2007-2012) of FMR LLC.
Craig S. Brown (1977)
Year of Election or Appointment: 2019
Assistant Treasurer
Mr. Brown also serves as Assistant Treasurer of other funds. Mr. Brown is an employee of Fidelity Investments (2013-present).
John J. Burke III (1964)
Year of Election or Appointment: 2018
Chief Financial Officer
Mr. Burke also serves as Chief Financial Officer of other funds. Mr. Burke serves as Head of Investment Operations for Fidelity Fund and Investment Operations (2018-present) and is an employee of Fidelity Investments (1998-present). Previously Mr. Burke served as head of Asset Management Investment Operations (2012-2018).
William C. Coffey (1969)
Year of Election or Appointment: 2018
Secretary and Chief Legal Officer (CLO)
Mr. Coffey also serves as Secretary and CLO of other funds. Mr. Coffey serves as CLO, Secretary, and Senior Vice President of Fidelity Management & Research Company and FMR Co., Inc. (investment adviser firms, 2018-present); Secretary of Fidelity SelectCo, LLC and Fidelity Investments Money Management, Inc. (investment adviser firms, 2018-present); and CLO of Fidelity Management & Research (Hong Kong) Limited, FMR Investment Management (UK) Limited, and Fidelity Management & Research (Japan) Limited (investment adviser firms, 2018-present). He is Senior Vice President and Deputy General Counsel of FMR LLC (diversified financial services company, 2010-present), and is an employee of Fidelity Investments. Previously, Mr. Coffey served as Assistant Secretary of certain funds (2009-2018) and as Vice President and Associate General Counsel of FMR LLC (2005-2009).
Jonathan Davis (1968)
Year of Election or Appointment: 2010
Assistant Treasurer
Mr. Davis also serves as Assistant Treasurer of other funds. Mr. Davis serves as Assistant Treasurer of FMR Capital, Inc. (2017-present) and is an employee of Fidelity Investments. Previously, Mr. Davis served as Vice President and Associate General Counsel of FMR LLC (diversified financial services company, 2003-2010).
Adrien E. Deberghes (1967)
Year of Election or Appointment: 2010
Assistant Treasurer
Mr. Deberghes also serves as an officer of other funds. He serves as Assistant Treasurer of FMR Capital, Inc. (2017-present), Executive Vice President of Fidelity Investments Money Management, Inc. (FIMM) (investment adviser firm, 2016-present), and is an employee of Fidelity Investments (2008-present). Previously, Mr. Deberghes served as President and Treasurer of certain Fidelity® funds (2013-2018). Prior to joining Fidelity Investments, Mr. Deberghes was Senior Vice President of Mutual Fund Administration at State Street Corporation (2007-2008), Senior Director of Mutual Fund Administration at Investors Bank & Trust (2005-2007), and Director of Finance for Dunkin' Brands (2000-2005). Previously, Mr. Deberghes served in other fund officer roles.
Laura M. Del Prato (1964)
Year of Election or Appointment: 2018
President and Treasurer
Ms. Del Prato also serves as an officer of other funds. Ms. Del Prato is an employee of Fidelity Investments (2017-present). Prior to joining Fidelity Investments, Ms. Del Prato served as a Managing Director and Treasurer of the JPMorgan Mutual Funds (2014-2017). Prior to JPMorgan, Ms. Del Prato served as a partner at Cohen Fund Audit Services (accounting firm, 2012-2013) and KPMG LLP (accounting firm, 2004-2012).
Colm A. Hogan (1973)
Year of Election or Appointment: 2016
Assistant Treasurer
Mr. Hogan also serves as an officer of other funds. Mr. Hogan serves as Assistant Treasurer of FMR Capital, Inc. (2017-present) and is an employee of Fidelity Investments (2005-present). Previously, Mr. Hogan served as Assistant Treasurer of certain Fidelity® funds (2016-2018).
Chris Maher (1972)
Year of Election or Appointment: 2013
Assistant Treasurer
Mr. Maher serves as Assistant Treasurer of other funds. Mr. Maher is Vice President of Valuation Oversight, serves as Assistant Treasurer of FMR Capital, Inc. (2017-present), and is an employee of Fidelity Investments. Previously, Mr. Maher served as Vice President of Asset Management Compliance (2013), Vice President of the Program Management Group of FMR (investment adviser firm, 2010-2013), and Vice President of Valuation Oversight (2008-2010).
John B. McGinty, Jr. (1962)
Year of Election or Appointment: 2016
Chief Compliance Officer
Mr. McGinty also serves as Chief Compliance Officer of other funds. Mr. McGinty is Senior Vice President of Asset Management Compliance for Fidelity Investments and is an employee of Fidelity Investments (2016-present). Mr. McGinty previously served as Vice President, Senior Attorney at Eaton Vance Management (investment management firm, 2015-2016), and prior to Eaton Vance as global CCO for all firm operations and registered investment companies at GMO LLC (investment management firm, 2009-2015). Before joining GMO LLC, Mr. McGinty served as Senior Vice President, Deputy General Counsel for Fidelity Investments (2007-2009).
Jason P. Pogorelec (1975)
Year of Election or Appointment: 2015
Assistant Secretary
Mr. Pogorelec also serves as Assistant Secretary of other funds. Mr. Pogorelec serves as Vice President, Associate General Counsel (2010-present) and is an employee of Fidelity Investments (2006-present).
Nancy D. Prior (1967)
Year of Election or Appointment: 2014
Vice President
Ms. Prior also serves as Vice President of other funds. Ms. Prior serves as President Fixed Income, High Income/Emerging Market Debt and Multi Asset Class Strategies of FIAM LLC (2018-present), President (2016-present) and Director (2014-present) of Fidelity Investments Money Management, Inc. (FIMM) (investment adviser firm), President, Fixed Income (2014-present), and is an employee of Fidelity Investments (2002-present). Previously, Ms. Prior served as Vice Chairman of FIAM LLC (investment adviser firm, 2014-2018), a Director of FMR Investment Management (UK) Limited (investment adviser firm, 2015-2018), President Multi-Asset Class Strategies of FMR's Global Asset Allocation Division (2017-2018), Vice President of Fidelity's Money Market Funds (2012-2014), President, Money Market and Short Duration Bond Group of Fidelity Management & Research (FMR) (investment adviser firm, 2013-2014), President, Money Market Group of FMR (2011-2013), Managing Director of Research (2009-2011), Senior Vice President and Deputy General Counsel (2007-2009), and Assistant Secretary of certain Fidelity® funds (2008-2009).
Stacie M. Smith (1974)
Year of Election or Appointment: 2013
Assistant Treasurer
Ms. Smith also serves as an officer of other funds. Ms. Smith serves as Assistant Treasurer of FMR Capital, Inc. (2017-present), is an employee of Fidelity Investments (2009-present), and has served in other fund officer roles. Prior to joining Fidelity Investments, Ms. Smith served as Senior Audit Manager of Ernst & Young LLP (accounting firm, 1996-2009). Previously, Ms. Smith served as Assistant Treasurer (2013-2018) and Deputy Treasurer (2013-2016) of certain Fidelity® funds.
Marc L. Spector (1972)
Year of Election or Appointment: 2016
Deputy Treasurer
Mr. Spector also serves as an officer of other funds. Mr. Spector serves as Assistant Treasurer of FMR Capital, Inc. (2017-present) and is an employee of Fidelity Investments (2016-present). Prior to joining Fidelity Investments, Mr. Spector served as Director at the Siegfried Group (accounting firm, 2013-2016), and prior to Siegfried Group as audit senior manager at Deloitte & Touche (accounting firm, 2005-2013).
Jim Wegmann (1979)
Year of Election or Appointment: 2019
Assistant Treasurer
Mr. Wegmann also serves as Assistant Treasurer of other funds. Mr. Wegmann is an employee of Fidelity Investments (2011-present).
Shareholder Expense Example
As a shareholder of the Fund, you incur two types of costs: (1) transaction costs and (2) ongoing costs, including management fees and other Fund expenses. This Example is intended to help you understand your ongoing costs (in dollars) of investing in the Fund and to compare these costs with the ongoing costs of investing in other mutual funds.
The Example is based on an investment of $1,000 invested at the beginning of the period and held for the entire period (July 1, 2018 to December 31, 2018).
Actual Expenses
The first line of the accompanying table provides information about actual account values and actual expenses. You may use the information in this line, together with the amount you invested, to estimate the expenses that you paid over the period. Simply divide your account value by $1,000.00 (for example, an $8,600 account value divided by $1,000.00 = 8.6), then multiply the result by the number in the first line under the heading entitled "Expenses Paid During Period" to estimate the expenses you paid on your account during this period. A small balance maintenance fee of $12.00 that is charged once a year may apply for certain accounts with a value of less than $2,000. This fee, which was eliminated effective August 1, 2018, is not included in the table below. If it was, the estimate of expenses you paid during the period would be higher, and your ending account value lower, by this amount. In addition, the Fund, as a shareholder in the underlying Fidelity Central Funds, will indirectly bear its pro-rata share of the fees and expenses incurred by the underlying Fidelity Central Funds. These fees and expenses are not included in the Fund's annualized expense ratio used to calculate the expense estimate in the table below.
Hypothetical Example for Comparison Purposes
The second line of the accompanying table provides information about hypothetical account values and hypothetical expenses based on the Fund's actual expense ratio and an assumed rate of return of 5% per year before expenses, which is not the Fund's actual return. The hypothetical account values and expenses may not be used to estimate the actual ending account balance or expenses you paid for the period. You may use this information to compare the ongoing costs of investing in the Fund and other funds. To do so, compare this 5% hypothetical example with the 5% hypothetical examples that appear in the shareholder reports of the other funds. A small balance maintenance fee of $12.00 that is charged once a year may apply for certain accounts with a value of less than $2,000. This fee, which was eliminated effective August 1, 2018, is not included in the table below. If it was, the estimate of expenses you paid during the period would be higher, and your ending account value lower, by this amount. In addition, the Fund, as a shareholder in the underlying Fidelity Central Funds, will indirectly bear its pro-rata share of the fees and expenses incurred by the underlying Fidelity Central Funds. These fees and expenses are not included in the Fund's annualized expense ratio used to calculate the expense estimate in the table below.
Please note that the expenses shown in the table are meant to highlight your ongoing costs only and do not reflect any transaction costs. Therefore, the second line of the table is useful in comparing ongoing costs only, and will not help you determine the relative total costs of owning different funds.
| | Annualized Expense Ratio-A | Beginning
Account Value
July 1, 2018 | Ending
Account Value
December 31, 2018 | Expenses Paid
During Period-B
July 1, 2018
to December 31, 2018 |
| | .05% | | | |
| Actual | | $1,000.00 | $987.00 | $.25 |
| Hypothetical-C | | $1,000.00 | $1,024.95 | $.26 |
A Annualized expense ratio reflects expenses net of applicable fee waivers.
B Expenses are equal to the Fund's annualized expense ratio, multiplied by the average account value over the period, multiplied by 184/365 (to reflect the one-half year period).
C 5% return per year before expenses
Distributions (Unaudited)
Fidelity Inflation-Protected Bond Index Fund designates a total of 99.96% and Fidelity Inflation-Protected Bond Fund designates a total of 99.95% of the dividends distributed during the fiscal year was derived from interest on U.S. Government securities which is generally exempt from state income tax.
Fidelity Inflation-Protected Bond Index Fund designates $106,831,757 of distributions paid during the period January 1, 2018 to December 31, 2018 as qualifying to be taxed as interest-related dividends for nonresident alien shareholders.
Fidelity Inflation-Protected Bond Fund designates $27,839,652 of distributions paid during the period April 1, 2018 to August 24, 2018 as qualifying to be taxed as interest-related dividends for nonresident alien shareholders.
Fidelity Inflation-Protected Bond Fund hereby designates as a capital gain dividend with respect to the taxable year ended August 24th, 2018, $23,549,530, or, if subsequently determined to be different, the net capital gain of such year.
The fund will notify shareholders in January 2019 of amounts for use in preparing 2018 income tax returns.
Board Approval of Investment Advisory Contracts and Management Fees
Fidelity Inflation-Protected Bond Index Fund
Each year, the Board of Trustees, including the Independent Trustees (together, the Board), votes on the renewal of the management contract with Fidelity Management & Research Company (FMR) and the sub-advisory agreements (together, the Advisory Contracts) for the fund. FMR and the sub-advisers are referred to herein as the Investment Advisers. The Board, assisted by the advice of fund counsel and Independent Trustees' counsel, requests and considers a broad range of information relevant to the renewal of the Advisory Contracts throughout the year.
The Board meets regularly and, at each of its meetings, covers an extensive agenda of topics and materials and considers factors that are relevant to its annual consideration of the renewal of the fund's Advisory Contracts, including the services and support provided to the fund and its shareholders. The Board has established four standing committees (Committees) — Operations, Audit, Fair Valuation, and Governance and Nominating — each composed of and chaired by Independent Trustees with varying backgrounds, to which the Board has assigned specific subject matter responsibilities in order to enhance effective decision-making by the Board. The Operations Committee, of which all of the Independent Trustees are members, meets regularly throughout the year and considers, among other matters, information specifically related to the annual consideration of the renewal of the fund's Advisory Contracts. The Board, acting directly and through its Committees, requests and receives information concerning the annual consideration of the renewal of the fund's Advisory Contracts. The Board also meets as needed to review matters specifically related to the Board's annual consideration of the renewal of the Advisory Contracts. Members of the Board may also meet with trustees of other Fidelity funds through joint ad hoc committees to discuss certain matters relevant to all of the Fidelity funds.
At its September 2018 meeting, the Board unanimously determined to renew the fund's Advisory Contracts. In reaching its determination, the Board considered all factors it believed relevant, including (i) the nature, extent, and quality of the services to be provided to the fund and its shareholders (including the investment performance of the fund); (ii) the competitiveness of the fund's management fee and total expense ratio relative to peer funds; (iii) the total costs of the services to be provided by and the profits to be realized by Fidelity from its relationships with the fund; and (iv) the extent to which, if any, economies of scale exist and would be realized as the fund grows, and whether any economies of scale are appropriately shared with fund shareholders.
In considering whether to renew the Advisory Contracts for the fund, the Board reached a determination, with the assistance of fund counsel and Independent Trustees' counsel and through the exercise of its business judgment, that the renewal of the Advisory Contracts was in the best interests of the fund and its shareholders and that the compensation payable under the Advisory Contracts was fair and reasonable. The Board's decision to renew the Advisory Contracts was not based on any single factor, but rather was based on a comprehensive consideration of all the information provided to the Board at its meetings throughout the year. The Board, in reaching its determination to renew the Advisory Contracts, was aware that shareholders of the fund have a broad range of investment choices available to them, including a wide choice among funds offered by Fidelity's competitors, and that the fund's shareholders, who have the opportunity to review and weigh the disclosure provided by the fund in its prospectus and other public disclosures, have chosen to invest in this fund, which is part of the Fidelity family of funds.
Nature, Extent, and Quality of Services Provided. The Board considered Fidelity's staffing as it relates to the fund, including the backgrounds of investment personnel of Fidelity, and also considered the fund's investment objective, strategies, and related investment philosophy. The Independent Trustees also had discussions with senior management of Fidelity's investment operations and investment groups. The Board considered the structure of the investment personnel compensation program and whether this structure provides appropriate incentives to act in the best interests of the fund. Additionally, the Board considered the portfolio managers' investments, if any, in the funds that they manage.
Resources Dedicated to Investment Management and Support Services. The Board reviewed the general qualifications and capabilities of Fidelity's investment staff, including its size, education, experience, and resources, as well as Fidelity's approach to recruiting, managing, and compensating investment personnel. The Board noted that Fidelity has continued to increase the resources devoted to non-U.S. offices, including expansion of Fidelity's global investment organization. The Board also noted that Fidelity's analysts have extensive resources, tools and capabilities that allow them to conduct sophisticated quantitative and fundamental analysis, as well as credit analysis of issuers, counterparties and guarantors. Further, the Board considered that Fidelity's investment professionals have sufficient access to global information and data so as to provide competitive investment results over time, and that those professionals also have access to sophisticated tools that permit them to assess portfolio construction and risk and performance attribution characteristics continuously, as well as to transmit new information and research conclusions rapidly around the world. Additionally, in its deliberations, the Board considered Fidelity's trading, risk management, compliance, and technology and operations capabilities and resources, which are integral parts of the investment management process.
Shareholder and Administrative Services. The Board considered (i) the nature, extent, quality, and cost of advisory, administrative, and shareholder services performed by the Investment Advisers and their affiliates under the Advisory Contracts and under separate agreements covering transfer agency, pricing and bookkeeping, and securities lending services for the fund; (ii) the nature and extent of the supervision of third party service providers, principally custodians, subcustodians, and pricing vendors; and (iii) the resources devoted to, and the record of compliance with, the fund's compliance policies and procedures.
The Board noted that the growth of fund assets over time across the complex allows Fidelity to reinvest in the development of services designed to enhance the value and convenience of the Fidelity funds as investment vehicles. These services include 24-hour access to account information and market information through telephone representatives and over the Internet, investor education materials and asset allocation tools, and the expanded availability of Fidelity Investor Centers.
Investment in a Large Fund Family. The Board considered the benefits to shareholders of investing in a Fidelity fund, including the benefits of investing in a fund that is part of a large family of funds offering a variety of investment disciplines and providing a large variety of mutual fund investor services. The Board noted that Fidelity had taken, or had made recommendations that resulted in the Fidelity funds taking, a number of actions over the previous year that benefited particular funds, including: (i) continuing to dedicate additional resources to Fidelity's investment research process, which includes meetings with management of issuers of securities in which the funds invest, and to the support of the senior management team that oversees asset management; (ii) continuing efforts to enhance Fidelity's global research capabilities; (iii) launching new funds and making other enhancements to meet client needs; (iv) launching new share classes of existing funds; (v) eliminating purchase minimums and broadening eligibility requirements for certain funds and share classes; (vi) reducing management fees and total expenses for certain growth equity funds and index funds; (vii) lowering expense caps for certain existing funds and classes, and converting certain voluntary expense caps to contractual caps, to reduce expenses borne by shareholders; (viii) eliminating short-term redemption fees for funds that had such fees; (ix) rationalizing product lines and gaining increased efficiencies from fund mergers and share class consolidations; (x) continuing to develop, acquire and implement systems and technology to improve services to the funds and shareholders, strengthen information security, and increase efficiency; and (xi) continuing to implement enhancements to further strengthen Fidelity's product line to increase investors' probability of success in achieving their investment goals, including retirement income goals.
Investment Performance. The Board considered whether the fund has operated in accordance with its investment objective, as well as its record of compliance with its investment restrictions and its performance history.
The Board took into account discussions that occur at Board meetings throughout the year with representatives of the Investment Advisers about fund investment performance. In this regard the Board noted that as part of regularly scheduled fund reviews and other reports to the Board on fund performance, the Board considers annualized return information for the fund for different time periods, measured against the securities market index the fund seeks to track. The Board also periodically considers the fund's tracking error versus its benchmark index. In its evaluation of fund investment performance at meetings throughout the year, the Board gave particular attention to information indicating underperformance of certain Fidelity funds for specific time periods and discussed with the Investment Advisers the reasons for such underperformance.
In addition to reviewing absolute and relative fund performance, the Independent Trustees periodically consider the appropriateness of fund performance metrics in evaluating the results achieved. In general, the Independent Trustees believe that an index fund's performance should be evaluated based on gross performance (before fees and expenses but after transaction costs) compared to a fund's benchmark index, over appropriate time periods, taking into account relevant factors including the following: general market conditions; the characteristics of the fund's benchmark index; the extent to which statistical sampling is employed; and fund cash flows and other factors. Depending on the circumstances, the Independent Trustees may be satisfied with a fund's performance notwithstanding that it lags its benchmark index for certain periods.
The Independent Trustees recognize that shareholders evaluate performance on a net basis (after fees and expenses) over their own holding periods, for which one-, three-, and five-year periods are often used as a proxy. For this reason, the performance information reviewed by the Board also included net cumulative calendar year total return information for the fund and its benchmark index for the most recent one-, three-, and five-year periods.
Based on its review, the Board concluded that the nature, extent, and quality of services provided to the fund under the Advisory Contracts should continue to benefit the shareholders of the fund.
Competitiveness of Management Fee and Total Expense Ratio. The Board considered the fund's management fee and total expense ratio compared to "mapped groups" of competitive funds and classes created for the purpose of facilitating the Trustees' competitive analysis of management fees and total expenses. Fidelity creates "mapped groups" by combining similar Lipper investment objective categories that have comparable investment mandates. Combining Lipper investment objective categories aids the Board's management fee and total expense ratio comparisons by broadening the competitive group used for comparison.
Management Fee. The Board considered two proprietary management fee comparisons for the 12-month periods shown in basis points (BP) in the chart below. The group of Lipper funds used by the Board for management fee comparisons is referred to below as the "Total Mapped Group." The Total Mapped Group comparison focuses on a fund's standing in terms of gross management fees before expense reimbursements or caps relative to the total universe of funds with comparable investment mandates, regardless of whether their management fee structures also are comparable. Funds with comparable investment mandates offer exposure to similar types of securities. Funds with comparable management fee structures have similar management fee contractual arrangements (
e.g., flat rate charged for advisory services, all-inclusive fee rate,
etc.). "TMG %" represents the percentage of funds in the Total Mapped Group that had management fees that were lower than the fund's. For example, a hypothetical TMG % of 20% would mean that 80% of the funds in the Total Mapped Group had higher, and 20% had lower, management fees than the fund. The fund's actual TMG %s and the number of funds in the Total Mapped Group are in the chart below. The "Asset-Size Peer Group" (ASPG) comparison focuses on a fund's standing relative to a subset of non-Fidelity funds within the Total Mapped Group that are similar in size and management fee structure. For example, if a fund is in the first quartile of the ASPG, the fund's management fee ranks in the least expensive or lowest 25% of funds in the ASPG. The ASPG represents at least 15% of the funds in the Total Mapped Group with comparable asset size and management fee structures, subject to a minimum of 50 funds (or all funds in the Total Mapped Group if fewer than 50). Additional information, such as the ASPG quartile in which the fund's management fee rate ranked, is also included in the chart and was considered by the Board. Because the vast majority of competitor funds' management fees do not cover non-management expenses, in prior years, the fund was compared on the basis of a hypothetical "net management fee," which was derived by subtracting payments made by FMR for "fund-level" non-management expenses (including pricing and bookkeeping fees and fees paid to non-affiliated custodians), as well as "class-level" expenses paid by FMR under expense limitation arrangements in effect for the fund, from the fund's management fee. Fidelity no longer calculates a hypothetical net management fee for the fund and, as a result, the chart does not include hypothetical net management fees for 2016 and 2017. With respect to the historical net management fee information, the Board considered that "fund-level" non-management expenses and "class-level" expenses paid by FMR may exceed the fund's management fee and result in a negative net management fee. The Board noted that a hypothetical net management fee is truly a hypothetical number derived for purposes of providing a more meaningful competitive comparison and a negative net management fee is not intended to suggest that Fidelity pays the fund to manage the fund's assets.
Fidelity Inflation-Protected Bond Index Fund

The Board noted that the fund's management fee rate ranked below the median of its Total Mapped Group and below the median of its ASPG for 2017.
The Board noted that it and the boards of other Fidelity funds formed an ad hoc Committee on Group Fee, which meets periodically, to conduct an in-depth review of the "group fee" component of the management fee of funds with such management fee structures. The Committee's focus included the mechanics of the group fee, the competitive landscape of group fee structures, Fidelity funds with no group fee component (such as the fund) and investment products not included in group fee assets. The Board also considered that, for funds subject to the group fee, FMR agreed to voluntarily waive fees over a specified period of time in amounts designed to account for assets converted from certain funds to certain collective investment trusts.
Based on its review, the Board concluded that the fund's management fee is fair and reasonable in light of the services that the fund receives and the other factors considered.
Total Expense Ratio. In its review of each class's total expense ratio, the Board considered the fund's management fee rate as well as other "fund-level" expenses, such as pricing and bookkeeping fees and custodial, legal, and audit fees, paid by FMR under the fund's management contract. The Board also considered other "class-level" expenses, such as transfer agent fees. The Board also noted that Fidelity may agree to waive fees and expenses from time to time, and the extent to which, if any, it has done so for the fund. As part of its review, the Board also considered the current and historical total expense ratios of each class of the fund compared to competitive fund median expenses. Each class of the fund is compared to those funds and classes in the Total Mapped Group (used by the Board for management fee comparisons) that have a similar sales load structure.
The Board noted that the total expense ratio of each of Institutional Premium Class and Premium Class ranked below the competitive median for 2017, the total expense ratio of Institutional Class ranked equal to the competitive median for 2017, and the total expense ratio of Investor Class ranked above the competitive median for 2017 due to a drop in the competitive median, compared to the prior year, as a result of competitor fee reductions and the inclusion of lower fee Fidelity and competitor classes in the mapped group. The Board considered that, in general, various factors can affect total expense ratios.
At its July 2018 meeting, the Board approved a proposal for the fund to consolidate all classes into a single class by exchanging all shares of higher cost classes for shares of the lowest cost class available. The exchanges are expected to take place in November 2018. In connection with the class consolidation, the Board approved amended and restated expense contracts that reduce each class's total expense ratio to equal the total expense ratio of the lowest cost class. The Board considered that, effective August 1, 2018, contractual arrangements for the fund oblige FMR to pay all "class-level" expenses of each class of the fund to the extent necessary to limit total class operating expenses, with certain exceptions, to 0.05%. These contractual arrangements may not be amended to increase the fees or expenses payable except by a vote of a majority of the Board.
Fees Charged to Other Fidelity Clients. The Board also considered Fidelity fee structures and other information with respect to clients of Fidelity, such as other funds advised or subadvised by Fidelity, pension plan clients, and other institutional clients with similar mandates. The Board noted that a joint ad hoc committee created by it and the boards of other Fidelity funds periodically reviews and compares Fidelity's institutional investment advisory business with its business of providing services to the Fidelity funds and also noted the most recent findings of the committee. The Board noted that the committee's review included a consideration of the differences in services provided, fees charged, and costs incurred, as well as competition in the markets serving the different categories of clients.
Based on its review of total expense ratios and fees charged to other Fidelity clients, the Board concluded that the total expense ratio of each class of the fund was reasonable in light of the services that the fund and its shareholders receive and the other factors considered.
Costs of the Services and Profitability. The Board considered the revenues earned and the expenses incurred by Fidelity in conducting the business of developing, marketing, distributing, managing, administering and servicing the fund and servicing the fund's shareholders. The Board also considered the level of Fidelity's profits in respect of all the Fidelity funds.
On an annual basis, Fidelity presents to the Board information about the profitability of its relationships with the fund. Fidelity calculates profitability information for each fund, as well as aggregate profitability information for groups of Fidelity funds and all Fidelity funds, using a series of detailed revenue and cost allocation methodologies which originate with the books and records of Fidelity on which Fidelity's audited financial statements are based. The Audit Committee of the Board reviews any significant changes from the prior year's methodologies.
PricewaterhouseCoopers LLP (PwC), auditor to Fidelity and certain Fidelity funds, has been engaged annually by the Board as part of the Board's assessment of Fidelity's profitability analysis. PwC's engagement includes the review and assessment of the methodologies used by Fidelity in determining the revenues and expenses attributable to Fidelity's mutual fund business, and completion of agreed-upon procedures in respect of the mathematical accuracy of the fund profitability information and its conformity to established allocation methodologies. After considering PwC's reports issued under the engagement and information provided by Fidelity, the Board concluded that while other allocation methods may also be reasonable, Fidelity's profitability methodologies are reasonable in all material respects.
The Board also reviewed Fidelity's non-fund businesses and potential indirect benefits such businesses may have received as a result of their association with Fidelity's mutual fund business (i.e., fall-out benefits) as well as cases where Fidelity's affiliates may benefit from the fund's business. The Board noted that changes to fall-out benefits year-over-year reflect business developments at Fidelity's various businesses.
The Board considered the costs of the services provided by and the profits realized by Fidelity in connection with the operation of the fund and was satisfied that the profitability was not excessive.
Economies of Scale. The Board considered whether there have been economies of scale in respect of the management of the Fidelity funds, whether the Fidelity funds (including the fund) have appropriately benefited from any such economies of scale, and whether there is potential for realization of any further economies of scale. The Board considered the extent to which the fund will benefit from economies of scale as assets grow through increased services to the fund, through waivers or reimbursements, or through fee or expense ratio reductions. The Board recognized that, due to the fund's current contractual arrangements, the expense ratio of each class will not decline if the class's operating costs decrease as assets grow, or rise as assets decrease. The Board also noted that a committee (the Economies of Scale Committee) created by it and the boards of other Fidelity funds periodically analyzes whether Fidelity attains economies of scale in respect of the management and servicing of the Fidelity funds, whether the Fidelity funds have appropriately benefited from such economies of scale, and whether there is potential for realization of any further economies of scale.
The Board concluded, taking into account the analysis of the Economies of Scale Committee, that economies of scale, if any, are being appropriately shared between fund shareholders and Fidelity.
Additional Information Requested by the Board. In order to develop fully the factual basis for consideration of the Fidelity funds' advisory contracts, the Board requested and received additional information on certain topics, including: (i) Fidelity's fund profitability methodology, profitability trends for certain funds, the allocation of various costs to different funds, and the impact of certain factors on fund profitability results; (ii) portfolio manager changes that have occurred during the past year and the amount of the investment that each portfolio manager has made in the Fidelity fund(s) that he or she manages; (iii) Fidelity's compensation structure for portfolio managers, research analysts, and other key personnel, including its effects on fund profitability, the rationale for the compensation structure, and the extent to which current market conditions have affected retention and recruitment; (iv) the arrangements with and compensation paid to certain fund sub-advisers on behalf of the Fidelity funds and the treatment of such compensation within Fidelity's fund profitability methodology; (v) the terms of Fidelity's voluntary expense limitation agreements; (vi) the methodology with respect to competitive fund data and peer group classifications; (vii) Fidelity's transfer agent fee, expense, and service structures for different funds and classes relative to competitive trends, and the impact of the increased use of omnibus accounts; (viii) new developments in the retail and institutional marketplaces and the competitive positioning of the funds relative to other investment products and services; (ix) the impact of recent changes to the money market fund landscape, including the full implementation of money market fund reform and rising interest rates, on Fidelity's money market funds; (x) the funds' share class structures and distribution channels; and (xi) explanations regarding the relative total expense ratios of certain funds and classes, total expense competitive trends and methodologies for total expense competitive comparisons, and actions that might be taken by Fidelity to reduce total expense ratios for certain classes. In addition, the Board considered its discussions with Fidelity throughout the year regarding enhanced information security initiatives and the funds' fair valuation policies.
Based on its evaluation of all of the conclusions noted above, and after considering all factors it believed relevant, the Board concluded that the advisory fee arrangements are fair and reasonable, and that the fund's Advisory Contracts should be renewed.
Corporate Headquarters
245 Summer St.
Boston, MA 02210
www.fidelity.com
PIB-I-PIB-AI-ANN-0219
1.939238.106
Fidelity Flex℠ Funds Fidelity Flex℠ Inflation-Protected Bond Index Fund
Annual Report December 31, 2018 |
|
Beginning on January 1, 2021, as permitted by regulations adopted by the Securities and Exchange Commission, paper copies of a fund’s shareholder reports will no longer be sent by mail, unless you specifically request paper copies of the reports from the fund or from your financial intermediary, such as a financial advisor, broker-dealer or bank. Instead, the reports will be made available on a website, and you will be notified by mail each time a report is posted and provided with a website link to access the report.
If you already elected to receive shareholder reports electronically, you will not be affected by this change and you need not take any action. You may elect to receive shareholder reports and other communications from a fund electronically, by contacting your financial intermediary. For Fidelity customers, visit Fidelity's web site or call Fidelity using the contact information listed below.
You may elect to receive all future reports in paper free of charge. If you wish to continue receiving paper copies of your shareholder reports, you may contact your financial intermediary or, if you are a Fidelity customer, visit Fidelity’s website, or call Fidelity at the applicable toll-free number listed below. Your election to receive reports in paper will apply to all funds held with the fund complex/your financial intermediary.
| Account Type | Website | Phone Number |
| Brokerage, Mutual Fund, or Annuity Contracts: | fidelity.com/mailpreferences | 1-800-343-3548 |
| Employer Provided Retirement Accounts: | netbenefits.fidelity.com/preferences (choose 'no' under Required Disclosures to continue to print) | 1-800-343-0860 |
| Advisor Sold Accounts Serviced Through Your Financial Intermediary: | Contact Your Financial Intermediary | Your Financial Intermediary's phone number |
| Advisor Sold Accounts Serviced by Fidelity: | institutional.fidelity.com | 1-877-208-0098 |
Contents
To view a fund's proxy voting guidelines and proxy voting record for the 12-month period ended June 30, visit http://www.fidelity.com/proxyvotingresults or visit the Securities and Exchange Commission's (SEC) web site at http://www.sec.gov.
You may also call 1-800-835-5092 to request a free copy of the proxy voting guidelines.
Standard & Poor's, S&P and S&P 500 are registered service marks of The McGraw-Hill Companies, Inc. and have been licensed for use by Fidelity Distributors Corporation.
Other third-party marks appearing herein are the property of their respective owners.
All other marks appearing herein are registered or unregistered trademarks or service marks of FMR LLC or an affiliated company. © 2019 FMR LLC. All rights reserved.
This report and the financial statements contained herein are submitted for the general information of the shareholders of the Fund. This report is not authorized for distribution to prospective investors in the Fund unless preceded or accompanied by an effective prospectus.
A fund files its complete schedule of portfolio holdings with the SEC for the first and third quarters of each fiscal year on Form N-Q. Forms N-Q are available on the SEC’s web site at http://www.sec.gov. A fund's Forms N-Q may be reviewed and copied at the SEC’s Public Reference Room in Washington, DC. Information regarding the operation of the SEC's Public Reference Room may be obtained by calling 1-800-SEC-0330.
For a complete list of a fund's portfolio holdings, view the most recent holdings listing, semiannual report, or annual report on Fidelity's web site at http://www.fidelity.com, http://www.institutional.fidelity.com, or http://www.401k.com, as applicable.
NOT FDIC INSURED •MAY LOSE VALUE •NO BANK GUARANTEE
Neither the Fund nor Fidelity Distributors Corporation is a bank.
Performance: The Bottom Line
Average annual total return reflects the change in the value of an investment, assuming reinvestment of distributions from dividend income and capital gains (the profits earned upon the sale of securities that have grown in value, if any) and assuming a constant rate of performance each year. The hypothetical investment and the average annual total returns do not reflect the deduction of taxes that a shareholder would pay on fund distributions or the redemption of fund shares. During periods of reimbursement by Fidelity, a fund’s total return will be greater than it would be had the reimbursement not occurred. How a fund did yesterday is no guarantee of how it will do tomorrow.
Average Annual Total Returns
| For the periods ended December 31, 2018 | Past 1 year | Life of fundA |
| Fidelity Flex℠ Inflation-Protected Bond Index Fund | (1.35)% | 1.07% |
A From March 9, 2017
$10,000 Over Life of Fund
Let's say hypothetically that $10,000 was invested in Fidelity Flex℠ Inflation-Protected Bond Index Fund on March 9, 2017, when the fund started.
The chart shows how the value of your investment would have changed, and also shows how the Bloomberg Barclays U.S. Treasury Inflation-Protected Securities (TIPS) Index (Series-L) performed over the same period.
| Period Ending Values |
| $10,196 | Fidelity Flex℠ Inflation-Protected Bond Index Fund |
| $10,205 | Bloomberg Barclays U.S. Treasury Inflation-Protected Securities (TIPS) Index (Series-L) |
Management's Discussion of Fund Performance
Market Recap: U.S. taxable investment-grade bonds roughly broke even in 2018, as yields that gained early in the year fell notably in the fourth quarter. The Bloomberg Barclays U.S. Aggregate Bond Index gained 0.01% for the year. Longer-term bond yields advanced through mid-May, driven by policy-rate hikes, plans by the U.S. Federal Reserve to gradually reduce its balance sheet and tax reform that went into effect in January. Longer-term yields moderated in the summer, with spreads between shorter-term and longer-term Treasury bonds remaining tight, partly because of escalating global trade tension. Yields rose again in September and early October, amid increased inflation expectations and hints that central banks may curtail economic stimulus. Yields then declined notably and credit spreads widened in November and December due to broad market volatility, disappointing U.S. economic data, and signs of economic weakness in China and parts of Europe. Within the Bloomberg Barclays index, U.S. Treasuries (+0.86%) topped all major market segments. Conversely, investment-grade corporates (-2.51%) performed worst. Outside the index, most non-core fixed-income segments posted a negative return, while Treasury Inflation-Protected Securities (TIPS) returned -1.26%, as inflation expectations moderated near year-end.
Comments from Co-Portfolio Managers Brandon Bettencourt and Jay Small: For the fiscal year ending December 31, 2018, the fund returned -1.35%, net of fees. This was roughly in line with the -1.26% return of the benchmark Bloomberg Barclays U.S. Treasury Inflation-Protected Securities (TIPS) Index (Series L). The fund's performance versus the benchmark was slightly curtailed by "pricing basis." The fund is typically priced at 4:00 p.m. Eastern Time, while the benchmark is priced at 3:00 p.m. Eastern. On December 31, 2018, the fund was priced at 4:00 p.m. Eastern, while the benchmark was priced at 1:00 p.m. Eastern due to the holiday-shortened trading hours for the U.S. bond market. This led to a fairly wide pricing dispersion on the last day of the period. We believe that the effects of pricing basis tend to smooth out over time. In managing the fund, we attempt to fully replicate the benchmark, holding all of its positions and in the same proportions. TIPS began the period on solid ground as improving economic growth pushed inflation expectations somewhat higher, but later faltered as economic growth and inflation expectations moderated. Longer-term inflation expectations, as measured by the 10-year breakeven rate, declined slightly by year end. TIPS underperformed comparable duration nominal U.S. Treasuries for the year.
The views expressed above reflect those of the portfolio manager(s) only through the end of the period as stated on the cover of this report and do not necessarily represent the views of Fidelity or any other person in the Fidelity organization. Any such views are subject to change at any time based upon market or other conditions and Fidelity disclaims any responsibility to update such views. These views may not be relied on as investment advice and, because investment decisions for a Fidelity fund are based on numerous factors, may not be relied on as an indication of trading intent on behalf of any Fidelity fund.
Investment Summary (Unaudited)
Coupon Distribution as of December 31, 2018
| | % of fund's investments |
| 0.01 - 0.99% | 72.3 |
| 1 - 1.99% | 14.0 |
| 2 - 2.99% | 9.7 |
| 3 - 3.99% | 4.0 |
Coupon distribution shows the range of stated interest rates on the fund's investments, excluding short-term investments.
The coupon rates on inflation-protected securities tend to be lower than their nominal bond counterparts since inflation-protected securities get adjusted for actual inflation, while nominal bond coupon rates include a component for expected inflation. Please refer to the fund's prospectus for more information.
Asset Allocation (% of fund's net assets)
| As of December 31, 2018* |
| | U.S. Government and U.S. Government Agency Obligations | 99.5% |
| | Net Other Assets (Liabilities) | 0.5% |

* Inflation Protected Securities - 99.5%
Schedule of Investments December 31, 2018
Showing Percentage of Net Assets
| U.S. Treasury Inflation-Protected Obligations - 99.5% | | | |
| | | Principal Amount | Value |
| U.S. Treasury Inflation-Indexed Bonds: | | | |
| 0.625% 2/15/43 | | $53,897 | $47,363 |
| 0.75% 2/15/42 | | 72,745 | 66,175 |
| 0.75% 2/15/45 | | 91,282 | 81,836 |
| 0.875% 2/15/47 | | 64,952 | 59,765 |
| 1% 2/15/46 | | 66,171 | 62,887 |
| 1% 2/15/48 | | 63,581 | 60,388 |
| 1.375% 2/15/44 | | 81,380 | 84,218 |
| 1.75% 1/15/28 | | 61,563 | 65,422 |
| 2% 1/15/26 | | 76,447 | 81,617 |
| 2.125% 2/15/40 | | 32,760 | 38,592 |
| 2.125% 2/15/41 | | 41,572 | 49,205 |
| 2.375% 1/15/25 | | 105,986 | 114,628 |
| 2.375% 1/15/27 | | 61,446 | 67,856 |
| 2.5% 1/15/29 | | 60,070 | 68,432 |
| 3.375% 4/15/32 | | 24,220 | 31,115 |
| 3.625% 4/15/28 | | 51,596 | 63,372 |
| 3.875% 4/15/29 | | 63,070 | 80,353 |
| U.S. Treasury Inflation-Indexed Notes: | | | |
| 0.125% 4/15/20 | | 198,696 | 194,281 |
| 0.125% 4/15/21 | | 172,852 | 168,160 |
| 0.125% 1/15/22 | | 159,775 | 155,113 |
| 0.125% 4/15/22 | | 168,454 | 163,014 |
| 0.125% 7/15/22 | | 163,852 | 159,175 |
| 0.125% 1/15/23 | | 165,433 | 159,815 |
| 0.125% 7/15/24 | | 160,818 | 154,261 |
| 0.125% 7/15/26 | | 136,095 | 127,860 |
| 0.25% 1/15/25 | | 161,220 | 154,433 |
| 0.375% 7/15/23 | | 164,086 | 160,479 |
| 0.375% 7/15/25 | | 161,023 | 155,342 |
| 0.375% 1/15/27 | | 135,049 | 128,362 |
| 0.375% 7/15/27 | | 133,359 | 126,602 |
| 0.5% 1/15/28 | | 132,252 | 126,298 |
| 0.625% 7/15/21 | | 144,741 | 143,180 |
| 0.625% 4/15/23 | | 164,931 | 162,254 |
| 0.625% 1/15/24 | | 163,655 | 161,143 |
| 0.625% 1/15/26 | | 144,742 | 140,982 |
| 0.75% 7/15/28 | | 129,960 | 127,302 |
| 1.125% 1/15/21 | | 136,412 | 135,806 |
| 1.25% 7/15/20 | | 118,276 | 118,044 |
| 1.375% 1/15/20 | | 77,182 | 76,706 |
| TOTAL U.S. TREASURY INFLATION-PROTECTED OBLIGATIONS | | | |
| (Cost $4,421,556) | | | 4,321,836 |
| TOTAL INVESTMENT IN SECURITIES - 99.5% | | | |
| (Cost $4,421,556) | | | 4,321,836 |
| NET OTHER ASSETS (LIABILITIES) - 0.5% | | | 21,902 |
| NET ASSETS - 100% | | | $4,343,738 |
Investment Valuation
All investments are categorized as Level 2 under the Fair Value Hierarchy. The inputs or methodology used for valuing securities may not be an indication of the risk associated with investing in those securities. For more information on valuation inputs please refer to the Investment Valuation section in the accompanying Notes to Financial Statements.
Other Information
The composition of credit quality ratings as a percentage of Total Net Assets is as follows (Unaudited):
| U.S. Government and U.S. Government Agency Obligations | 99.5% |
| Short-Term Investments and Net Other Assets | 0.5% |
| | 100.0% |
We have used ratings from Moody's Investors Service, Inc. Where Moody's® ratings are not available, we have used S&P® ratings. All ratings are as of the date indicated and do not reflect subsequent changes.
See accompanying notes which are an integral part of the financial statements.
Financial Statements
Statement of Assets and Liabilities
| | | December 31, 2018 |
| Assets | | |
Investment in securities, at value — See accompanying schedule:
Unaffiliated issuers (cost $4,421,556) | | $4,321,836 |
| Cash | | 2,333 |
| Receivable for investments sold | | 42,865 |
| Receivable for fund shares sold | | 13,916 |
| Interest receivable | | 13,220 |
| Total assets | | 4,394,170 |
| Liabilities | | |
| Payable for investments purchased | $50,088 | |
| Payable for fund shares redeemed | 344 | |
| Total liabilities | | 50,432 |
| Net Assets | | $4,343,738 |
| Net Assets consist of: | | |
| Paid in capital | | $4,474,933 |
| Total distributable earnings (loss) | | (131,195) |
| Net Assets, for 444,386 shares outstanding | | $4,343,738 |
| Net Asset Value, offering price and redemption price per share ($4,343,738 ÷ 444,386 shares) | | $9.77 |
See accompanying notes which are an integral part of the financial statements.
Statement of Operations
| | | Year ended December 31, 2018 |
| Investment Income | | |
| Interest | | $125,595 |
| Expenses | | |
| Independent trustees' fees and expenses | $18 | |
| Commitment fees | 9 | |
| Total expenses | | 27 |
| Net investment income (loss) | | 125,568 |
| Realized and Unrealized Gain (Loss) | | |
| Net realized gain (loss) on: | | |
| Investment securities: | | |
| Unaffiliated issuers | (35,872) | |
| Total net realized gain (loss) | | (35,872) |
| Change in net unrealized appreciation (depreciation) on investment securities | | (120,837) |
| Net gain (loss) | | (156,709) |
| Net increase (decrease) in net assets resulting from operations | | $(31,141) |
See accompanying notes which are an integral part of the financial statements.
Statement of Changes in Net Assets
| | Year ended December 31, 2018 | For the period
March 9, 2017 (commencement of operations) to December 31, 2017 |
| Increase (Decrease) in Net Assets | | |
| Operations | | |
| Net investment income (loss) | $125,568 | $29,825 |
| Net realized gain (loss) | (35,872) | (1,138) |
| Change in net unrealized appreciation (depreciation) | (120,837) | 21,117 |
| Net increase (decrease) in net assets resulting from operations | (31,141) | 49,804 |
| Distributions to shareholders | (120,483) | – |
| Distributions to shareholders from net investment income | – | (2,743) |
| Distributions to shareholders from net realized gain | – | (26,689) |
| Total distributions | (120,483) | (29,432) |
| Share transactions | | |
| Proceeds from sales of shares | 4,342,756 | 2,914,686 |
| Reinvestment of distributions | 120,483 | 29,432 |
| Cost of shares redeemed | (2,140,408) | (791,959) |
| Net increase (decrease) in net assets resulting from share transactions | 2,322,831 | 2,152,159 |
| Total increase (decrease) in net assets | 2,171,207 | 2,172,531 |
| Net Assets | | |
| Beginning of period | 2,172,531 | – |
| End of period | $4,343,738 | $2,172,531 |
| Other Information | | |
| Undistributed net investment income end of period | | $613 |
| Shares | | |
| Sold | 432,435 | 287,633 |
| Issued in reinvestment of distributions | 12,320 | 2,909 |
| Redeemed | (213,522) | (77,389) |
| Net increase (decrease) | 231,233 | 213,153 |
See accompanying notes which are an integral part of the financial statements.
Financial Highlights
Fidelity Flex Inflation-Protected Bond Index Fund
| | | |
| Years ended December 31, | 2018 | 2017 A |
| Selected Per–Share Data | | |
| Net asset value, beginning of period | $10.19 | $10.00 |
| Income from Investment Operations | | |
| Net investment income (loss)B | .310 | .208 |
| Net realized and unrealized gain (loss) | (.449) | .126 |
| Total from investment operations | (.139) | .334 |
| Distributions from net investment income | (.038) | (.018) |
| Distributions from net realized gain | (.243) | (.126) |
| Total distributions | (.281) | (.144) |
| Net asset value, end of period | $9.77 | $10.19 |
| Total ReturnC | (1.35)% | 3.36% |
| Ratios to Average Net AssetsD,E | | |
| Expenses before reductions | - %F | - %F,G |
| Expenses net of fee waivers, if any | - %F | - %F,G |
| Expenses net of all reductions | - %F | - %F,G |
| Net investment income (loss) | 3.09% | 2.50%G |
| Supplemental Data | | |
| Net assets, end of period (000 omitted) | $4,344 | $2,173 |
| Portfolio turnover rateH | 47% | 42%G |
A For the period March 9, 2017 (commencement of operations) to December 31, 2017.
B Calculated based on average shares outstanding during the period.
C Total returns for periods of less than one year are not annualized.
D Fees and expenses of any underlying Fidelity Central Funds are not included in the Fund's expense ratio. The Fund indirectly bears its proportionate share of the expenses of any underlying Fidelity Central Funds.
E Expense ratios reflect operating expenses of the Fund. Expenses before reductions do not reflect amounts reimbursed by the investment adviser or reductions from expense offset arrangements and do not represent the amount paid by the Fund during periods when reimbursements or reductions occur. Expenses net of fee waivers reflect expenses after reimbursement by the investment adviser but prior to reductions from expense offset arrangements. Expenses net of all reductions represent the net expenses paid by the Fund.
F Amount represents less than .005%.
G Annualized
H Amount does not include the portfolio activity of any underlying Fidelity Central Funds.
See accompanying notes which are an integral part of the financial statements.
Notes to Financial Statements
For the period ended December 31, 2018
1. Organization.
Fidelity Flex Inflation-Protected Bond Index Fund (the Fund) is a fund of Fidelity Salem Street Trust (the Trust) and is authorized to issue an unlimited number of shares. Share transactions on the Statement of Changes in Net Assets may contain exchanges between affiliated funds. The Trust is registered under the Investment Company Act of 1940, as amended (the 1940 Act), as an open-end management investment company organized as a Massachusetts business trust. The Fund is available only to certain fee-based accounts offered by Fidelity.
2. Significant Accounting Policies.
The Fund is an investment company and applies the accounting and reporting guidance of the Financial Accounting Standards Board (FASB) Accounting Standards Codification Topic 946 Financial Services – Investments Companies. The financial statements have been prepared in conformity with accounting principles generally accepted in the United States of America (GAAP), which require management to make certain estimates and assumptions at the date of the financial statements. Actual results could differ from those estimates. Subsequent events, if any, through the date that the financial statements were issued have been evaluated in the preparation of the financial statements. The following summarizes the significant accounting policies of the Fund:
Investment Valuation. Investments are valued as of 4:00 p.m. Eastern time on the last calendar day of the period. The Board of Trustees (the Board) has delegated the day to day responsibility for the valuation of the Fund's investments to the Fair Value Committee (the Committee) established by the Fund's investment adviser. In accordance with valuation policies and procedures approved by the Board, the Fund attempts to obtain prices from one or more third party pricing vendors or brokers to value its investments. When current market prices, quotations or currency exchange rates are not readily available or reliable, investments will be fair valued in good faith by the Committee, in accordance with procedures adopted by the Board. Factors used in determining fair value vary by investment type and may include market or investment specific events, changes in interest rates and credit quality. The frequency with which these procedures are used cannot be predicted and they may be utilized to a significant extent. The Committee oversees the Fund's valuation policies and procedures and reports to the Board on the Committee's activities and fair value determinations. The Board monitors the appropriateness of the procedures used in valuing the Fund's investments and ratifies the fair value determinations of the Committee.
The Fund categorizes the inputs to valuation techniques used to value its investments into a disclosure hierarchy consisting of three levels as shown below:
- Level 1 – quoted prices in active markets for identical investments
- Level 2 – other significant observable inputs (including quoted prices for similar investments, interest rates, prepayment speeds, etc.)
- Level 3 – unobservable inputs (including the Fund's own assumptions based on the best information available)
Valuation techniques used to value the Fund's investments by major category are as follows:
Debt securities, including restricted securities, are valued based on evaluated prices received from third party pricing vendors or from brokers who make markets in such securities. U.S. government and government agency obligations are valued by pricing vendors who utilize matrix pricing which considers yield or price of bonds of comparable quality, coupon, maturity and type or by broker-supplied prices. When independent prices are unavailable or unreliable, debt securities may be valued utilizing pricing methodologies which consider similar factors that would be used by third party pricing vendors. Debt securities are generally categorized as Level 2 in the hierarchy but may be Level 3 depending on the circumstances.
Changes in valuation techniques may result in transfers in or out of an assigned level within the disclosure hierarchy.
Investment Transactions and Income. For financial reporting purposes, the Fund's investment holdings and NAV include trades executed through the end of the last business day of the period. The NAV per share for processing shareholder transactions is calculated as of the close of business of the New York Stock Exchange (NYSE), normally 4:00 p.m. Eastern time and includes trades executed through the end of the prior business day. Gains and losses on securities sold are determined on the basis of identified cost. Interest income is accrued as earned and includes coupon interest and amortization of premium and accretion of discount on debt securities as applicable. For Treasury Inflation-Protected Securities (TIPS) the principal amount is adjusted daily to keep pace with inflation. Interest is accrued based on the adjusted principal amount. The adjustments to principal due to inflation are reflected as increases or decreases to Interest in the accompanying Statement of Operations. Such adjustments may have a significant impact on the Fund's distributions.
Expenses. Expenses directly attributable to a fund are charged to that fund. Expenses attributable to more than one fund are allocated among the respective funds on the basis of relative net assets or other appropriate methods. Expense estimates are accrued in the period to which they relate and adjustments are made when actual amounts are known.
Income Tax Information and Distributions to Shareholders. Each year, the Fund intends to qualify as a regulated investment company under Subchapter M of the Internal Revenue Code, including distributing substantially all of its taxable income and realized gains. As a result, no provision for U.S. Federal income taxes is required. As of December 31, 2018, the Fund did not have any unrecognized tax benefits in the financial statements; nor is the Fund aware of any tax positions for which it is reasonably possible that the total amounts of unrecognized tax benefits will significantly change in the next twelve months. The Fund files a U.S. federal tax return, in addition to state and local tax returns as required. The Fund's federal income tax returns are subject to examination by the Internal Revenue Service (IRS) for a period of three fiscal years after they are filed. State and local tax returns may be subject to examination for an additional fiscal year depending on the jurisdiction.
Distributions are declared and recorded daily and paid monthly from net investment income. Distributions from realized gains, if any, are declared and recorded on the ex-dividend date. Income and capital gain distributions are determined in accordance with income tax regulations, which may differ from GAAP.
Capital accounts within the financial statements are adjusted for permanent book-tax differences. These adjustments have no impact on net assets or the results of operations. Capital accounts are not adjusted for temporary book-tax differences which will reverse in a subsequent period.
Book-tax differences are primarily due to market discount, capital loss carryforwards and losses deferred due to wash sales.
As of period end, the cost and unrealized appreciation (depreciation) in securities, and derivatives if applicable, for federal income tax purposes were as follows:
| Gross unrealized appreciation | $969 |
| Gross unrealized depreciation | (114,082) |
| Net unrealized appreciation (depreciation) | $(113,113) |
| Tax Cost | $4,434,949 |
The tax-based components of distributable earnings as of period end were as follows:
| Capital loss carryforward | $(17,303) |
| Net unrealized appreciation (depreciation) on securities and other investments | $(113,113) |
Capital loss carryforwards are only available to offset future capital gains of the Fund to the extent provided by regulations and may be limited. Under the Regulated Investment Company Modernization Act of 2010 (the Act), the Fund is permitted to carry forward capital losses incurred in taxable years beginning after December 22, 2010 for an unlimited period and such capital losses are required to be used prior to any losses that expire. The capital loss carryforward information presented below, including any applicable limitation, is estimated as of fiscal period end and is subject to adjustment.
| No expiration | |
| Short-term | $(15,857) |
| Long-term | (1,446) |
| Total capital loss carryforward | $(17,303) |
The tax character of distributions paid was as follows:
| | December 31, 2018 | December 31, 2017(a) |
| Ordinary Income | $ 120,483 | $ 29,432 |
(a) For the period March 9, 2017 (commencement of operations) to December 31, 2017.
New Rule Issuance. During August 2018, the U.S. Securities and Exchange Commission issued Final Rule Release No. 33-10532, Disclosure Update and Simplification. This Final Rule includes amendments specific to registered investment companies that are intended to eliminate overlap in disclosure requirements between Regulation S-X and GAAP. In accordance with these amendments, certain line-items in the Fund's financial statements have been combined or removed for the current period as outlined in the table below.
| Financial Statement | Current Line-Item Presentation | Prior Line-Item Presentation |
| Statement of Assets and Liabilities | Total distributable earnings (loss) | Undistributed/Distributions in excess of/Accumulated net investment income (loss)
Accumulated/Undistributed net realized gain (loss)
Net unrealized appreciation (depreciation) |
| Statement of Changes in Net Assets | N/A - removed | Undistributed/Distributions in excess of/Accumulated net investment income (loss) end of period |
| Statement of Changes in Net Assets | Distributions to shareholders | Distributions to shareholders from net investment income
Distributions to shareholders from net realized gain |
3. Fees and Other Transactions with Affiliates.
Management Fee. Fidelity Management & Research Company (the investment adviser) and its affiliates provide the Fund with investment management related services and the Fund does not pay any fees for these services. Under the management contract, the investment adviser or an affiliate pays all other expenses of the Fund, excluding fees and expenses of the independent Trustees, and certain miscellaneous expenses such as proxy and shareholder meeting expenses.
Interfund Trades. The Fund may purchase from or sell securities to other Fidelity Funds under procedures adopted by the Board. The procedures have been designed to ensure these interfund trades are executed in accordance with Rule 17a-7 of the 1940 Act.
4. Committed Line of Credit.
The Fund participates with other funds managed by the investment adviser or an affiliate in a $4.25 billion credit facility (the "line of credit") to be utilized for temporary or emergency purposes to fund shareholder redemptions or for other short-term liquidity purposes. The Fund has agreed to pay commitment fees on its pro-rata portion of the line of credit, which amounted to $9 and is reflected in Commitment fees on the Statement of Operations. During the period, the Fund did not borrow on this line of credit.
5. Other.
The Fund's organizational documents provide former and current trustees and officers with a limited indemnification against liabilities arising in connection with the performance of their duties to the Fund. In the normal course of business, the Fund may also enter into contracts that provide general indemnifications. The Fund's maximum exposure under these arrangements is unknown as this would be dependent on future claims that may be made against the Fund. The risk of material loss from such claims is considered remote.
At the end of the period, the investment adviser or its affiliates were the owners of record of 14% of the total outstanding shares of the Fund.
Report of Independent Registered Public Accounting Firm
To the Board of Trustees of Fidelity Salem Street Trust and Shareholders of Fidelity Flex Inflation-Protected Bond Index Fund:
Opinion on the Financial Statements
We have audited the accompanying statement of assets and liabilities, including the schedule of investments, of Fidelity Flex Inflation-Protected Bond Index Fund (one of the funds constituting Fidelity Salem Street Trust, referred to hereafter as the "Fund") as of December 31, 2018, the related statement of operations for the year ended December 31, 2018 and the statement of changes in net assets and the financial highlights for the year ended December 31, 2018 and for the period March 9, 2017 (commencement of operations) through December 31, 2017, including the related notes (collectively referred to as the “financial statements”). In our opinion, the financial statements present fairly, in all material respects, the financial position of the Fund as of December 31, 2018, the results of its operations for the year ended December 31, 2018, and the changes in its net assets and the financial highlights for the year ended December 31, 2018 and for the period March 9, 2017 (commencement of operations) through December 31, 2017 in conformity with accounting principles generally accepted in the United States of America.
Basis for Opinion
These financial statements are the responsibility of the Fund’s management. Our responsibility is to express an opinion on the Fund’s financial statements based on our audits. We are a public accounting firm registered with the Public Company Accounting Oversight Board (United States) (PCAOB) and are required to be independent with respect to the Fund in accordance with the U.S. federal securities laws and the applicable rules and regulations of the Securities and Exchange Commission and the PCAOB.
We conducted our audits of these financial statements in accordance with the standards of the PCAOB. Those standards require that we plan and perform the audit to obtain reasonable assurance about whether the financial statements are free of material misstatement, whether due to error or fraud.
Our audits included performing procedures to assess the risks of material misstatement of the financial statements, whether due to error or fraud, and performing procedures that respond to those risks. Such procedures included examining, on a test basis, evidence regarding the amounts and disclosures in the financial statements. Our audits also included evaluating the accounting principles used and significant estimates made by management, as well as evaluating the overall presentation of the financial statements. Our procedures included confirmation of securities owned as of December 31, 2018 by correspondence with the custodian and brokers; when replies were not received from brokers, we performed other auditing procedures. We believe that our audits provide a reasonable basis for our opinion.
PricewaterhouseCoopers LLP
Boston, Massachusetts
February 15, 2019
We have served as the auditor of one or more investment companies in the Fidelity group of funds since 1932.
Trustees and Officers
The Trustees, Members of the Advisory Board (if any), and officers of the trust and fund, as applicable, are listed below. The Board of Trustees governs the fund and is responsible for protecting the interests of shareholders. The Trustees are experienced executives who meet periodically throughout the year to oversee the fund's activities, review contractual arrangements with companies that provide services to the fund, oversee management of the risks associated with such activities and contractual arrangements, and review the fund's performance. Except for Jonathan Chiel, each of the Trustees oversees 260 funds. Mr. Chiel oversees 154 funds.
The Trustees hold office without limit in time except that (a) any Trustee may resign; (b) any Trustee may be removed by written instrument, signed by at least two-thirds of the number of Trustees prior to such removal; (c) any Trustee who requests to be retired or who has become incapacitated by illness or injury may be retired by written instrument signed by a majority of the other Trustees; and (d) any Trustee may be removed at any special meeting of shareholders by a two-thirds vote of the outstanding voting securities of the trust. Each Trustee who is not an interested person (as defined in the 1940 Act) of the trust and the fund is referred to herein as an Independent Trustee. Each Independent Trustee shall retire not later than the last day of the calendar year in which his or her 75th birthday occurs. The Independent Trustees may waive this mandatory retirement age policy with respect to individual Trustees. Officers and Advisory Board Members hold office without limit in time, except that any officer or Advisory Board Member may resign or may be removed by a vote of a majority of the Trustees at any regular meeting or any special meeting of the Trustees. Except as indicated, each individual has held the office shown or other offices in the same company for the past five years.
The fund’s Statement of Additional Information (SAI) includes more information about the Trustees. To request a free copy, call Fidelity at 1-800-835-5092.
Experience, Skills, Attributes, and Qualifications of the Trustees. The Governance and Nominating Committee has adopted a statement of policy that describes the experience, qualifications, attributes, and skills that are necessary and desirable for potential Independent Trustee candidates (Statement of Policy). The Board believes that each Trustee satisfied at the time he or she was initially elected or appointed a Trustee, and continues to satisfy, the standards contemplated by the Statement of Policy. The Governance and Nominating Committee also engages professional search firms to help identify potential Independent Trustee candidates who have the experience, qualifications, attributes, and skills consistent with the Statement of Policy. From time to time, additional criteria based on the composition and skills of the current Independent Trustees, as well as experience or skills that may be appropriate in light of future changes to board composition, business conditions, and regulatory or other developments, have also been considered by the professional search firms and the Governance and Nominating Committee. In addition, the Board takes into account the Trustees' commitment and participation in Board and committee meetings, as well as their leadership of standing and ad hoc committees throughout their tenure.
In determining that a particular Trustee was and continues to be qualified to serve as a Trustee, the Board has considered a variety of criteria, none of which, in isolation, was controlling. The Board believes that, collectively, the Trustees have balanced and diverse experience, qualifications, attributes, and skills, which allow the Board to operate effectively in governing the fund and protecting the interests of shareholders. Information about the specific experience, skills, attributes, and qualifications of each Trustee, which in each case led to the Board's conclusion that the Trustee should serve (or continue to serve) as a trustee of the fund, is provided below.
Board Structure and Oversight Function. Abigail P. Johnson is an interested person and currently serves as Chairman. The Trustees have determined that an interested Chairman is appropriate and benefits shareholders because an interested Chairman has a personal and professional stake in the quality and continuity of services provided to the fund. Independent Trustees exercise their informed business judgment to appoint an individual of their choosing to serve as Chairman, regardless of whether the Trustee happens to be independent or a member of management. The Independent Trustees have determined that they can act independently and effectively without having an Independent Trustee serve as Chairman and that a key structural component for assuring that they are in a position to do so is for the Independent Trustees to constitute a substantial majority for the Board. The Independent Trustees also regularly meet in executive session. Arthur E. Johnson serves as Chairman of the Independent Trustees and as such (i) acts as a liaison between the Independent Trustees and management with respect to matters important to the Independent Trustees and (ii) with management prepares agendas for Board meetings.
Fidelity® funds are overseen by different Boards of Trustees. The fund's Board oversees Fidelity's investment-grade bond, money market, asset allocation and certain equity funds, and other Boards oversee Fidelity's high income and other equity funds. The asset allocation funds may invest in Fidelity® funds that are overseen by such other Boards. The use of separate Boards, each with its own committee structure, allows the Trustees of each group of Fidelity® funds to focus on the unique issues of the funds they oversee, including common research, investment, and operational issues. On occasion, the separate Boards establish joint committees to address issues of overlapping consequences for the Fidelity® funds overseen by each Board.
The Trustees operate using a system of committees to facilitate the timely and efficient consideration of all matters of importance to the Trustees, the fund, and fund shareholders and to facilitate compliance with legal and regulatory requirements and oversight of the fund's activities and associated risks. The Board, acting through its committees, has charged FMR and its affiliates with (i) identifying events or circumstances the occurrence of which could have demonstrably adverse effects on the fund's business and/or reputation; (ii) implementing processes and controls to lessen the possibility that such events or circumstances occur or to mitigate the effects of such events or circumstances if they do occur; and (iii) creating and maintaining a system designed to evaluate continuously business and market conditions in order to facilitate the identification and implementation processes described in (i) and (ii) above. Because the day-to-day operations and activities of the fund are carried out by or through FMR, its affiliates, and other service providers, the fund's exposure to risks is mitigated but not eliminated by the processes overseen by the Trustees. While each of the Board's committees has responsibility for overseeing different aspects of the fund's activities, oversight is exercised primarily through the Operations and Audit Committees. In addition, an ad hoc Board committee of Independent Trustees has worked with FMR to enhance the Board's oversight of investment and financial risks, legal and regulatory risks, technology risks, and operational risks, including the development of additional risk reporting to the Board. Appropriate personnel, including but not limited to the fund's Chief Compliance Officer (CCO), FMR's internal auditor, the independent accountants, the fund's Treasurer and portfolio management personnel, make periodic reports to the Board's committees, as appropriate, including an annual review of Fidelity's risk management program for the Fidelity® funds. The responsibilities of each standing committee, including their oversight responsibilities, are described further under "Standing Committees of the Trustees."
Interested Trustees*:
Correspondence intended for a Trustee who is an interested person may be sent to Fidelity Investments, 245 Summer Street, Boston, Massachusetts 02210.
Name, Year of Birth; Principal Occupations and Other Relevant Experience+
Jonathan Chiel (1957)
Year of Election or Appointment: 2016
Trustee
Mr. Chiel also serves as Trustee of other Fidelity® funds. Mr. Chiel is Executive Vice President and General Counsel for FMR LLC (diversified financial services company, 2012-present). Previously, Mr. Chiel served as general counsel (2004-2012) and senior vice president and deputy general counsel (2000-2004) for John Hancock Financial Services; a partner with Choate, Hall & Stewart (1996-2000) (law firm); and an Assistant United States Attorney for the United States Attorney’s Office of the District of Massachusetts (1986-95), including Chief of the Criminal Division (1993-1995). Mr. Chiel is a director on the boards of the Boston Bar Foundation and the Maimonides School.
Abigail P. Johnson (1961)
Year of Election or Appointment: 2009
Trustee
Chairman of the Board of Trustees
Ms. Johnson also serves as Trustee of other Fidelity® funds. Ms. Johnson serves as Chairman (2016-present), Chief Executive Officer (2014-present), and Director (2007-present) of FMR LLC (diversified financial services company), President of Fidelity Financial Services (2012-present) and President of Personal, Workplace and Institutional Services (2005-present). Ms. Johnson is Chairman and Director of FMR Co., Inc. (investment adviser firm, 2011-present) and Chairman and Director of FMR (investment adviser firm, 2011-present). Previously, Ms. Johnson served as Vice Chairman (2007-2016) and President (2013-2016) of FMR LLC, President and a Director of FMR (2001-2005), a Trustee of other investment companies advised by FMR, Fidelity Investments Money Management, Inc. (investment adviser firm), and FMR Co., Inc. (2001-2005), Senior Vice President of the Fidelity® funds (2001-2005), and managed a number of Fidelity® funds. Ms. Abigail P. Johnson and Mr. Arthur E. Johnson are not related.
Jennifer Toolin McAuliffe (1959)
Year of Election or Appointment: 2016
Trustee
Ms. McAuliffe also serves as Trustee of other Fidelity® funds. Ms. McAuliffe previously served as a Member of the Advisory Board of certain Fidelity® funds (2016) and as Co-Head of Fixed Income of Fidelity Investments Limited (now known as FIL Limited (FIL)) (diversified financial services company). Earlier roles at FIL included Director of Research for FIL’s credit and quantitative teams in London, Hong Kong and Tokyo. Ms. McAuliffe also was the Director of Research for taxable and municipal bonds at Fidelity Investments Money Management, Inc. Ms. McAuliffe is also a director or trustee of several not-for-profit entities.
* Determined to be an “Interested Trustee” by virtue of, among other things, his or her affiliation with the trust or various entities under common control with FMR.
+ The information includes the Trustee's principal occupation during the last five years and other information relating to the experience, attributes, and skills relevant to the Trustee's qualifications to serve as a Trustee, which led to the conclusion that the Trustee should serve as a Trustee for the fund.
Independent Trustees:
Correspondence intended for an Independent Trustee may be sent to Fidelity Investments, P.O. Box 55235, Boston, Massachusetts 02205-5235.
Name, Year of Birth; Principal Occupations and Other Relevant Experience+
Elizabeth S. Acton (1951)
Year of Election or Appointment: 2013
Trustee
Ms. Acton also serves as Trustee of other Fidelity® funds. Prior to her retirement in April 2012, Ms. Acton was Executive Vice President, Finance (2011-2012), Executive Vice President, Chief Financial Officer (2002-2011), and Treasurer (2004-2005) of Comerica Incorporated (financial services). Prior to joining Comerica, Ms. Acton held a variety of positions at Ford Motor Company (1983-2002), including Vice President and Treasurer (2000-2002) and Executive Vice President and Chief Financial Officer of Ford Motor Credit Company (1998-2000). Ms. Acton currently serves as a member of the Board of Directors and Audit and Finance Committees of Beazer Homes USA, Inc. (homebuilding, 2012-present). Previously, Ms. Acton served as a Member of the Advisory Board of certain Fidelity® funds (2013-2016).
Ann E. Dunwoody (1953)
Year of Election or Appointment: 2018
Trustee
General Dunwoody also serves as Trustee of other Fidelity® funds. General Dunwoody (United States Army, Retired) was the first woman in U.S. military history to achieve the rank of four-star general and prior to her retirement in 2012 held a variety of positions within the U.S. Army, including Commanding General, U.S. Army Material Command (2008-2012). She is the President of First to Four LLC (leadership and mentoring services, 2012-present). She also serves as a member of the Board of Directors and Nominating and Corporate Governance Committee of L3 Technologies, Inc. (communication, electronic, sensor, and aerospace systems, 2013-present), Board of Directors and Nomination and Corporate Governance Committees of Kforce Inc. (professional staffing services, 2016-present) and Board of Directors of Automattic Inc. (software engineering, 2018-present). Previously, General Dunwoody served as a Member of the Advisory Board of certain Fidelity® funds (2018), a member of the Board of Directors and Audit and Sustainability and Corporate Responsibility Committees of Republic Services, Inc. (waste collection, disposal and recycling, 2013-2016). Ms. Dunwoody also serves on several boards for non-profit organizations, including as a member of the Board of Directors, Chair of the Nomination and Governance Committee and member of the Audit Committee of Logistics Management Institute (consulting non-profit, 2012-present), a member of the Board of Directors of the Army Historical Foundation (2015-present), a member of the Council of Trustees for the Association of the United States Army (advocacy non-profit, 2013-present) and a member of the Board of Trustees of Florida Institute of Technology (2015-present) and ThanksUSA (military family education non-profit, 2014-present).
John Engler (1948)
Year of Election or Appointment: 2014
Trustee
Mr. Engler also serves as Trustee of other Fidelity® funds. He serves on the board of directors for Universal Forest Products (manufacturer and distributor of wood and wood-alternative products, 2003-present) and K12 Inc. (technology-based education company, 2012-present). Previously, Mr. Engler served as interim president of Michigan State University (2018-2019), a Member of the Advisory Board of certain Fidelity® funds (2014-2016), president of the Business Roundtable (2011-2017), a trustee of The Munder Funds (2003-2014), president and CEO of the National Association of Manufacturers (2004-2011), member of the Board of Trustees of the Annie E. Casey Foundation (2004-2015), and as governor of Michigan (1991-2003). He is a past chairman of the National Governors Association.
Robert F. Gartland (1951)
Year of Election or Appointment: 2010
Trustee
Mr. Gartland also serves as Trustee of other Fidelity® funds. Mr. Gartland is Chairman and an investor in Gartland & Mellina Group Corp. (consulting, 2009-present). Previously, Mr. Gartland served as a partner and investor of Vietnam Partners LLC (investments and consulting, 2008-2011). Prior to his retirement, Mr. Gartland held a variety of positions at Morgan Stanley (financial services, 1979-2007), including Managing Director (1987-2007), and Chase Manhattan Bank (1975-1978).
Arthur E. Johnson (1947)
Year of Election or Appointment: 2008
Trustee
Chairman of the Independent Trustees
Mr. Johnson also serves as Trustee of other Fidelity® funds. Mr. Johnson serves as a member of the Board of Directors of Eaton Corporation plc (diversified power management, 2009-present) and Booz Allen Hamilton (management consulting, 2011-present). Prior to his retirement, Mr. Johnson served as Senior Vice President of Corporate Strategic Development of Lockheed Martin Corporation (defense contractor, 1999-2009). He previously served on the Board of Directors of IKON Office Solutions, Inc. (1999-2008), AGL Resources, Inc. (holding company, 2002-2016), and Delta Airlines (2005-2007). Mr. Arthur E. Johnson is not related to Ms. Abigail P. Johnson.
Michael E. Kenneally (1954)
Year of Election or Appointment: 2009
Trustee
Vice Chairman of the Independent Trustees
Mr. Kenneally also serves as Trustee of other Fidelity® funds. Prior to his retirement, Mr. Kenneally served as Chairman and Global Chief Executive Officer of Credit Suisse Asset Management. Before joining Credit Suisse, he was an Executive Vice President and Chief Investment Officer for Bank of America Corporation. Earlier roles at Bank of America included Director of Research, Senior Portfolio Manager and Research Analyst, and Mr. Kenneally was awarded the Chartered Financial Analyst (CFA) designation in 1991.
Marie L. Knowles (1946)
Year of Election or Appointment: 2001
Trustee
Ms. Knowles also serves as Trustee of other Fidelity® funds. Prior to Ms. Knowles' retirement in June 2000, she served as Executive Vice President and Chief Financial Officer of Atlantic Richfield Company (ARCO) (diversified energy, 1996-2000). From 1993 to 1996, she was a Senior Vice President of ARCO and President of ARCO Transportation Company (pipeline and tanker operations). Ms. Knowles currently serves as a Director and Chairman of the Audit Committee of McKesson Corporation (healthcare service, since 2002). Ms. Knowles is a member of the Board of the Santa Catalina Island Company (real estate, 2009-present). Ms. Knowles is a Member of the Investment Company Institute Board of Governors and a Member of the Governing Council of the Independent Directors Council (2014-present). She also serves as a member of the Advisory Board for the School of Engineering of the University of Southern California. Previously, Ms. Knowles served as a Director of Phelps Dodge Corporation (copper mining and manufacturing, 1994-2007), URS Corporation (engineering and construction, 2000-2003) and America West (airline, 1999-2002). Ms. Knowles previously served as Chairman (2015-2018) and Vice Chairman (2012-2015) of the Independent Trustees of certain Fidelity® funds.
Mark A. Murray (1954)
Year of Election or Appointment: 2016
Trustee
Mr. Murray also serves as Trustee of other Fidelity® funds. Mr. Murray is Vice Chairman (2013-present) of Meijer, Inc. (regional retail chain). Previously, Mr. Murray served as a Member of the Advisory Board of certain Fidelity® funds (2016) and as Co-Chief Executive Officer (2013-2016) and President (2006-2013) of Meijer, Inc. Mr. Murray serves as a member of the Board of Directors and Nuclear Review and Public Policy and Responsibility Committees of DTE Energy Company (diversified energy company, 2009-present). Mr. Murray also serves as a member of the Board of Directors of Spectrum Health (not-for-profit health system, 2015-present). Mr. Murray previously served as President of Grand Valley State University (2001-2006), Treasurer for the State of Michigan (1999-2001), Vice President of Finance and Administration for Michigan State University (1998-1999), and a member of the Board of Directors and Audit Committee and Chairman of the Nominating and Corporate Governance Committee of Universal Forest Products, Inc. (manufacturer and distributor of wood and wood-alternative products, 2004-2016). Mr. Murray is also a director or trustee of many community and professional organizations.
+ The information includes the Trustee's principal occupation during the last five years and other information relating to the experience, attributes, and skills relevant to the Trustee's qualifications to serve as a Trustee, which led to the conclusion that the Trustee should serve as a Trustee for the fund.
Advisory Board Members and Officers:
Correspondence intended for an officer may be sent to Fidelity Investments, 245 Summer Street, Boston, Massachusetts 02210. Officers appear below in alphabetical order.
Name, Year of Birth; Principal Occupation
Elizabeth Paige Baumann (1968)
Year of Election or Appointment: 2017
Anti-Money Laundering (AML) Officer
Ms. Baumann also serves as AML Officer of other funds. She is Chief AML Officer (2012-present) and Senior Vice President (2014-present) of FMR LLC (diversified financial services company) and is an employee of Fidelity Investments. Previously, Ms. Baumann served as AML Officer of the funds (2012-2016), and Vice President (2007-2014) and Deputy Anti-Money Laundering Officer (2007-2012) of FMR LLC.
Craig S. Brown (1977)
Year of Election or Appointment: 2019
Assistant Treasurer
Mr. Brown also serves as Assistant Treasurer of other funds. Mr. Brown is an employee of Fidelity Investments (2013-present).
John J. Burke III (1964)
Year of Election or Appointment: 2018
Chief Financial Officer
Mr. Burke also serves as Chief Financial Officer of other funds. Mr. Burke serves as Head of Investment Operations for Fidelity Fund and Investment Operations (2018-present) and is an employee of Fidelity Investments (1998-present). Previously Mr. Burke served as head of Asset Management Investment Operations (2012-2018).
William C. Coffey (1969)
Year of Election or Appointment: 2018
Secretary and Chief Legal Officer (CLO)
Mr. Coffey also serves as Secretary and CLO of other funds. Mr. Coffey serves as CLO, Secretary, and Senior Vice President of Fidelity Management & Research Company and FMR Co., Inc. (investment adviser firms, 2018-present); Secretary of Fidelity SelectCo, LLC and Fidelity Investments Money Management, Inc. (investment adviser firms, 2018-present); and CLO of Fidelity Management & Research (Hong Kong) Limited, FMR Investment Management (UK) Limited, and Fidelity Management & Research (Japan) Limited (investment adviser firms, 2018-present). He is Senior Vice President and Deputy General Counsel of FMR LLC (diversified financial services company, 2010-present), and is an employee of Fidelity Investments. Previously, Mr. Coffey served as Assistant Secretary of certain funds (2009-2018) and as Vice President and Associate General Counsel of FMR LLC (2005-2009).
Jonathan Davis (1968)
Year of Election or Appointment: 2010
Assistant Treasurer
Mr. Davis also serves as Assistant Treasurer of other funds. Mr. Davis serves as Assistant Treasurer of FMR Capital, Inc. (2017-present) and is an employee of Fidelity Investments. Previously, Mr. Davis served as Vice President and Associate General Counsel of FMR LLC (diversified financial services company, 2003-2010).
Adrien E. Deberghes (1967)
Year of Election or Appointment: 2010
Assistant Treasurer
Mr. Deberghes also serves as an officer of other funds. He serves as Assistant Treasurer of FMR Capital, Inc. (2017-present), Executive Vice President of Fidelity Investments Money Management, Inc. (FIMM) (investment adviser firm, 2016-present), and is an employee of Fidelity Investments (2008-present). Previously, Mr. Deberghes served as President and Treasurer of certain Fidelity® funds (2013-2018). Prior to joining Fidelity Investments, Mr. Deberghes was Senior Vice President of Mutual Fund Administration at State Street Corporation (2007-2008), Senior Director of Mutual Fund Administration at Investors Bank & Trust (2005-2007), and Director of Finance for Dunkin' Brands (2000-2005). Previously, Mr. Deberghes served in other fund officer roles.
Laura M. Del Prato (1964)
Year of Election or Appointment: 2018
President and Treasurer
Ms. Del Prato also serves as an officer of other funds. Ms. Del Prato is an employee of Fidelity Investments (2017-present). Prior to joining Fidelity Investments, Ms. Del Prato served as a Managing Director and Treasurer of the JPMorgan Mutual Funds (2014-2017). Prior to JPMorgan, Ms. Del Prato served as a partner at Cohen Fund Audit Services (accounting firm, 2012-2013) and KPMG LLP (accounting firm, 2004-2012).
Colm A. Hogan (1973)
Year of Election or Appointment: 2016
Assistant Treasurer
Mr. Hogan also serves as an officer of other funds. Mr. Hogan serves as Assistant Treasurer of FMR Capital, Inc. (2017-present) and is an employee of Fidelity Investments (2005-present). Previously, Mr. Hogan served as Assistant Treasurer of certain Fidelity® funds (2016-2018).
Chris Maher (1972)
Year of Election or Appointment: 2013
Assistant Treasurer
Mr. Maher serves as Assistant Treasurer of other funds. Mr. Maher is Vice President of Valuation Oversight, serves as Assistant Treasurer of FMR Capital, Inc. (2017-present), and is an employee of Fidelity Investments. Previously, Mr. Maher served as Vice President of Asset Management Compliance (2013), Vice President of the Program Management Group of FMR (investment adviser firm, 2010-2013), and Vice President of Valuation Oversight (2008-2010).
John B. McGinty, Jr. (1962)
Year of Election or Appointment: 2016
Chief Compliance Officer
Mr. McGinty also serves as Chief Compliance Officer of other funds. Mr. McGinty is Senior Vice President of Asset Management Compliance for Fidelity Investments and is an employee of Fidelity Investments (2016-present). Mr. McGinty previously served as Vice President, Senior Attorney at Eaton Vance Management (investment management firm, 2015-2016), and prior to Eaton Vance as global CCO for all firm operations and registered investment companies at GMO LLC (investment management firm, 2009-2015). Before joining GMO LLC, Mr. McGinty served as Senior Vice President, Deputy General Counsel for Fidelity Investments (2007-2009).
Jason P. Pogorelec (1975)
Year of Election or Appointment: 2015
Assistant Secretary
Mr. Pogorelec also serves as Assistant Secretary of other funds. Mr. Pogorelec serves as Vice President, Associate General Counsel (2010-present) and is an employee of Fidelity Investments (2006-present).
Nancy D. Prior (1967)
Year of Election or Appointment: 2014
Vice President
Ms. Prior also serves as Vice President of other funds. Ms. Prior serves as President Fixed Income, High Income/Emerging Market Debt and Multi Asset Class Strategies of FIAM LLC (2018-present), President (2016-present) and Director (2014-present) of Fidelity Investments Money Management, Inc. (FIMM) (investment adviser firm), President, Fixed Income (2014-present), and is an employee of Fidelity Investments (2002-present). Previously, Ms. Prior served as Vice Chairman of FIAM LLC (investment adviser firm, 2014-2018), a Director of FMR Investment Management (UK) Limited (investment adviser firm, 2015-2018), President Multi-Asset Class Strategies of FMR's Global Asset Allocation Division (2017-2018), Vice President of Fidelity's Money Market Funds (2012-2014), President, Money Market and Short Duration Bond Group of Fidelity Management & Research (FMR) (investment adviser firm, 2013-2014), President, Money Market Group of FMR (2011-2013), Managing Director of Research (2009-2011), Senior Vice President and Deputy General Counsel (2007-2009), and Assistant Secretary of certain Fidelity® funds (2008-2009).
Stacie M. Smith (1974)
Year of Election or Appointment: 2013
Assistant Treasurer
Ms. Smith also serves as an officer of other funds. Ms. Smith serves as Assistant Treasurer of FMR Capital, Inc. (2017-present), is an employee of Fidelity Investments (2009-present), and has served in other fund officer roles. Prior to joining Fidelity Investments, Ms. Smith served as Senior Audit Manager of Ernst & Young LLP (accounting firm, 1996-2009). Previously, Ms. Smith served as Assistant Treasurer (2013-2018) and Deputy Treasurer (2013-2016) of certain Fidelity® funds.
Marc L. Spector (1972)
Year of Election or Appointment: 2016
Deputy Treasurer
Mr. Spector also serves as an officer of other funds. Mr. Spector serves as Assistant Treasurer of FMR Capital, Inc. (2017-present) and is an employee of Fidelity Investments (2016-present). Prior to joining Fidelity Investments, Mr. Spector served as Director at the Siegfried Group (accounting firm, 2013-2016), and prior to Siegfried Group as audit senior manager at Deloitte & Touche (accounting firm, 2005-2013).
Jim Wegmann (1979)
Year of Election or Appointment: 2019
Assistant Treasurer
Mr. Wegmann also serves as Assistant Treasurer of other funds. Mr. Wegmann is an employee of Fidelity Investments (2011-present).
Shareholder Expense Example
As a shareholder of the Fund, you incur two types of costs: (1) transaction costs and (2) ongoing costs, including other Fund expenses. This Example is intended to help you understand your ongoing costs (in dollars) of investing in the Fund and to compare these costs with the ongoing costs of investing in other mutual funds.
The Example is based on an investment of $1,000 invested at the beginning of the period and held for the entire period (July 1, 2018 to December 31, 2018).
Actual Expenses
The first line of the accompanying table provides information about actual account values and actual expenses. You may use the information in this line, together with the amount you invested, to estimate the expenses that you paid over the period. Simply divide your account value by $1,000.00 (for example, an $8,600 account value divided by $1,000.00 = 8.6), then multiply the result by the number in the first line under the heading entitled "Expenses Paid During Period" to estimate the expenses you paid on your account during this period.
Hypothetical Example for Comparison Purposes
The second line of the accompanying table provides information about hypothetical account values and hypothetical expenses based on the Fund's actual expense ratio and an assumed rate of return of 5% per year before expenses, which is not the Fund's actual return. The hypothetical account values and expenses may not be used to estimate the actual ending account balance or expenses you paid for the period. You may use this information to compare the ongoing costs of investing in the Fund and other funds. To do so, compare this 5% hypothetical example with the 5% hypothetical examples that appear in the shareholder reports of the other funds.
Please note that the expenses shown in the table are meant to highlight your ongoing costs only and do not reflect any transaction costs. Therefore, the second line of the table is useful in comparing ongoing costs only, and will not help you determine the relative total costs of owning different funds.
| | Annualized Expense Ratio-A | Beginning
Account Value
July 1, 2018 | Ending
Account Value
December 31, 2018 | Expenses Paid
During Period-B
July 1, 2018
to December 31, 2018 |
| Actual | - %-C | $1,000.00 | $987.50 | $--D |
| Hypothetical-E | | $1,000.00 | $1,025.21 | $--D |
A Annualized expense ratio reflects expenses net of applicable fee waivers.
B Expenses are equal to the Fund's annualized expense ratio, multiplied by the average account value over the period, multiplied by 184/365 (to reflect the one-half year period).
C Amount represents less than .005%.
D Amount represents less than $.005.
E 5% return per year before expenses
Distributions (Unaudited)
A total of 100% of the dividends distributed during the fiscal year was derived from interest on U.S. Government securities which is generally exempt from state income tax.
The fund designates $120,137 of distributions paid during the period January 1, 2018 to December 31, 2018 as qualifying to be taxed as interest-related dividends for nonresident alien shareholders.
The fund will notify shareholders in January 2019 of amounts for use in preparing 2018 income tax returns.
Board Approval of Investment Advisory Contracts and Management Fees
Fidelity Flex Inflation-Protected Bond Index Fund
Each year, the Board of Trustees, including the Independent Trustees (together, the Board), votes on the renewal of the management contract with Fidelity Management & Research Company (FMR) and the sub-advisory agreements (together, the Advisory Contracts) for the fund. FMR and the sub-advisers are referred to herein as the Investment Advisers. The Board, assisted by the advice of fund counsel and Independent Trustees' counsel, requests and considers a broad range of information relevant to the renewal of the Advisory Contracts throughout the year.
The Board meets regularly and, at each of its meetings, covers an extensive agenda of topics and materials and considers factors that are relevant to its annual consideration of the renewal of the fund's Advisory Contracts, including the services and support provided to the fund and its shareholders. The Board has established four standing committees (Committees) — Operations, Audit, Fair Valuation, and Governance and Nominating — each composed of and chaired by Independent Trustees with varying backgrounds, to which the Board has assigned specific subject matter responsibilities in order to enhance effective decision-making by the Board. The Operations Committee, of which all of the Independent Trustees are members, meets regularly throughout the year and considers, among other matters, information specifically related to the annual consideration of the renewal of the fund's Advisory Contracts. The Board, acting directly and through its Committees, requests and receives information concerning the annual consideration of the renewal of the fund's Advisory Contracts. The Board also meets as needed to review matters specifically related to the Board's annual consideration of the renewal of the Advisory Contracts. Members of the Board may also meet with trustees of other Fidelity funds through joint ad hoc committees to discuss certain matters relevant to all of the Fidelity funds.
At its September 2018 meeting, the Board unanimously determined to renew the fund's Advisory Contracts. In considering whether to renew the Advisory Contracts for the fund, the Board considered all factors it believed relevant and reached a determination, with the assistance of fund counsel and Independent Trustees' counsel and through the exercise of its business judgment, that the renewal of the Advisory Contracts was in the best interests of the fund and its shareholders and the fact that no fee is payable under the management contract was fair and reasonable.
Nature, Extent, and Quality of Services Provided. The Board considered Fidelity's staffing as it relates to the fund, including the backgrounds of investment personnel of Fidelity, and also considered the fund's investment objective, strategies, and related investment philosophy. The Independent Trustees also had discussions with senior management of Fidelity's investment operations and investment groups. The Board considered the structure of the investment personnel compensation program and whether this structure provides appropriate incentives to act in the best interests of the fund. Additionally, the Board considered the portfolio managers' investments, if any, in the funds that they manage.
Resources Dedicated to Investment Management and Support Services. The Board reviewed the general qualifications and capabilities of Fidelity's investment staff, including its size, education, experience, and resources, as well as Fidelity's approach to recruiting, managing, and compensating investment personnel. The Board noted that Fidelity has continued to increase the resources devoted to non-U.S. offices, including expansion of Fidelity's global investment organization. The Board also noted that Fidelity's analysts have extensive resources, tools and capabilities that allow them to conduct sophisticated quantitative and fundamental analysis, as well as credit analysis of issuers, counterparties and guarantors. Further, the Board considered that Fidelity's investment professionals have sufficient access to global information and data so as to provide competitive investment results over time, and that those professionals also have access to sophisticated tools that permit them to assess portfolio construction and risk and performance attribution characteristics continuously, as well as to transmit new information and research conclusions rapidly around the world. Additionally, in its deliberations, the Board considered Fidelity's trading, risk management, compliance, and technology and operations capabilities and resources, which are integral parts of the investment management process.
Shareholder and Administrative Services. The Board considered (i) the nature, extent, quality, and cost of advisory, administrative, and shareholder services performed by the Investment Advisers and their affiliates under the Advisory Contracts and under separate agreements covering transfer agency, pricing and bookkeeping, and securities lending services for the fund; (ii) the nature and extent of the supervision of third party service providers, principally custodians, subcustodians, and pricing vendors; and (iii) the resources devoted to, and the record of compliance with, the fund's compliance policies and procedures.
The Board noted that the growth of fund assets over time across the complex allows Fidelity to reinvest in the development of services designed to enhance the value and convenience of the Fidelity funds as investment vehicles. These services include 24-hour access to account information and market information through telephone representatives and over the Internet, investor education materials and asset allocation tools, and the expanded availability of Fidelity Investor Centers.
Investment in a Large Fund Family. The Board considered the benefits to shareholders of investing in a Fidelity fund, including the benefits of investing in a fund that is part of a large family of funds offering a variety of investment disciplines and providing a large variety of mutual fund investor services. The Board noted that Fidelity had taken, or had made recommendations that resulted in the Fidelity funds taking, a number of actions over the previous year that benefited particular funds, including: (i) continuing to dedicate additional resources to Fidelity's investment research process, which includes meetings with management of issuers of securities in which the funds invest, and to the support of the senior management team that oversees asset management; (ii) continuing efforts to enhance Fidelity's global research capabilities; (iii) launching new funds and making other enhancements to meet client needs; (iv) launching new share classes of existing funds; (v) eliminating purchase minimums and broadening eligibility requirements for certain funds and share classes; (vi) reducing management fees and total expenses for certain growth equity funds and index funds; (vii) lowering expense caps for certain existing funds and classes, and converting certain voluntary expense caps to contractual caps, to reduce expenses borne by shareholders; (viii) eliminating short-term redemption fees for funds that had such fees; (ix) rationalizing product lines and gaining increased efficiencies from fund mergers and share class consolidations; (x) continuing to develop, acquire and implement systems and technology to improve services to the funds and shareholders, strengthen information security, and increase efficiency; and (xi) continuing to implement enhancements to further strengthen Fidelity's product line to increase investors' probability of success in achieving their investment goals, including retirement income goals.
Investment Performance. The Board considered whether the fund has operated in accordance with its investment objective, as well as its record of compliance with its investment restrictions. As the fund recently commenced operations, the Board did not believe that it was appropriate to assign significant weight to its limited investment performance.
Based on its review, the Board concluded that the nature, extent, and quality of services provided to the fund under the Advisory Contracts should continue to benefit the shareholders of the fund.
Competitiveness of Management Fee and Total Expense Ratio. The Board noted that the fund is available exclusively to certain Fidelity fee-based programs. The Board considered that the fund does not pay FMR a management fee for investment advisory services, but that FMR is indirectly compensated for its services out of the program fees. The Board also noted that FMR or an affiliate undertakes to pay all operating expenses of the fund, except Independent Trustee fees and expenses, proxy and shareholder meeting expenses, interest, taxes, brokerage expenses, and extraordinary expenses (such as litigation expenses).
Based on its review, the Board considered that the fund does not pay a management fee and concluded that the total expense ratio of the fund was reasonable in light of the services that the fund and its shareholders receive and the other factors considered.
Costs of the Services and Profitability. The Board considered the level of Fidelity's profits in respect of all the Fidelity funds.
PricewaterhouseCoopers LLP (PwC), auditor to Fidelity and certain Fidelity funds, has been engaged annually by the Board as part of the Board's assessment of Fidelity's profitability analysis. PwC's engagement includes the review and assessment of the methodologies used by Fidelity in determining the revenues and expenses attributable to Fidelity's mutual fund business, and completion of agreed-upon procedures in respect of the mathematical accuracy of the fund profitability information and its conformity to established allocation methodologies. After considering PwC's reports issued under the engagement and information provided by Fidelity, the Board concluded that while other allocation methods may also be reasonable, Fidelity's profitability methodologies are reasonable in all material respects.
The Board also reviewed Fidelity's non-fund businesses and potential indirect benefits such businesses may have received as a result of their association with Fidelity's mutual fund business (i.e., fall-out benefits) as well as cases where Fidelity's affiliates may benefit from the fund's business. The Board noted that changes to fall-out benefits year-over-year reflect business developments at Fidelity's various businesses.
The Board concluded that the costs of the services provided by and the profits realized by Fidelity in connection with the operation of the fund were not relevant to the renewal of the Advisory Contracts because the fund pays no advisory fees and FMR or an affiliate bears all expenses of the fund, with limited exceptions.
Economies of Scale. The Board concluded that because the fund pays no advisory fees and FMR bears all expenses of the fund with certain limited exceptions, the realization of economies of scale was not a material factor in the Board's decision to renew the fund's Advisory Contract.
Additional Information Requested by the Board. In order to develop fully the factual basis for consideration of the Fidelity funds' advisory contracts, the Board requested and received additional information on certain topics, including: (i) Fidelity's fund profitability methodology, profitability trends for certain funds, the allocation of various costs to different funds, and the impact of certain factors on fund profitability results; (ii) portfolio manager changes that have occurred during the past year and the amount of the investment that each portfolio manager has made in the Fidelity fund(s) that he or she manages; (iii) Fidelity's compensation structure for portfolio managers, research analysts, and other key personnel, including its effects on fund profitability, the rationale for the compensation structure, and the extent to which current market conditions have affected retention and recruitment; (iv) the arrangements with and compensation paid to certain fund sub-advisers on behalf of the Fidelity funds and the treatment of such compensation within Fidelity's fund profitability methodology; (v) the terms of Fidelity's voluntary expense limitation agreements; (vi) the methodology with respect to competitive fund data and peer group classifications; (vii) Fidelity's transfer agent fee, expense, and service structures for different funds and classes relative to competitive trends, and the impact of the increased use of omnibus accounts; (viii) new developments in the retail and institutional marketplaces and the competitive positioning of the funds relative to other investment products and services; (ix) the impact of recent changes to the money market fund landscape, including the full implementation of money market fund reform and rising interest rates, on Fidelity's money market funds; (x) the funds' share class structures and distribution channels; and (xi) explanations regarding the relative total expense ratios of certain funds and classes, total expense competitive trends and methodologies for total expense competitive comparisons, and actions that might be taken by Fidelity to reduce total expense ratios for certain classes. In addition, the Board considered its discussions with Fidelity throughout the year regarding enhanced information security initiatives and the funds' fair valuation policies.
Based on its evaluation of all of the conclusions noted above, and after considering all factors it believed relevant, the Board concluded that the advisory fee arrangements are fair and reasonable, and that the fund's Advisory Contracts should be renewed.
Corporate Headquarters
245 Summer St.
Boston, MA 02210
www.fidelity.com
ZXF-ANN-0219
1.9881643.101
Fidelity® SAI Municipal Income Fund
Annual Report December 31, 2018 |
|
Beginning on January 1, 2021, as permitted by regulations adopted by the Securities and Exchange Commission, paper copies of a fund’s shareholder reports will no longer be sent by mail, unless you specifically request paper copies of the reports from the fund or from your financial intermediary, such as a financial advisor, broker-dealer or bank. Instead, the reports will be made available on a website, and you will be notified by mail each time a report is posted and provided with a website link to access the report.
If you already elected to receive shareholder reports electronically, you will not be affected by this change and you need not take any action. You may elect to receive shareholder reports and other communications from a fund electronically, by contacting your financial intermediary. For Fidelity customers, visit Fidelity's web site or call Fidelity using the contact information listed below.
You may elect to receive all future reports in paper free of charge. If you wish to continue receiving paper copies of your shareholder reports, you may contact your financial intermediary or, if you are a Fidelity customer, visit Fidelity’s website, or call Fidelity at the applicable toll-free number listed below. Your election to receive reports in paper will apply to all funds held with the fund complex/your financial intermediary.
| Account Type | Website | Phone Number |
| Brokerage, Mutual Fund, or Annuity Contracts: | fidelity.com/mailpreferences | 1-800-343-3548 |
| Employer Provided Retirement Accounts: | netbenefits.fidelity.com/preferences (choose 'no' under Required Disclosures to continue to print) | 1-800-343-0860 |
| Advisor Sold Accounts Serviced Through Your Financial Intermediary: | Contact Your Financial Intermediary | Your Financial Intermediary's phone number |
| Advisor Sold Accounts Serviced by Fidelity: | institutional.fidelity.com | 1-877-208-0098 |
Contents
To view a fund's proxy voting guidelines and proxy voting record for the 12-month period ended June 30, visit http://www.fidelity.com/proxyvotingresults or visit the Securities and Exchange Commission's (SEC) web site at http://www.sec.gov.
You may also call 1-800-544-3455 to request a free copy of the proxy voting guidelines.
Standard & Poor's, S&P and S&P 500 are registered service marks of The McGraw-Hill Companies, Inc. and have been licensed for use by Fidelity Distributors Corporation.
Other third-party marks appearing herein are the property of their respective owners.
All other marks appearing herein are registered or unregistered trademarks or service marks of FMR LLC or an affiliated company. © 2019 FMR LLC. All rights reserved.
This report and the financial statements contained herein are submitted for the general information of the shareholders of the Fund. This report is not authorized for distribution to prospective investors in the Fund unless preceded or accompanied by an effective prospectus.
A fund files its complete schedule of portfolio holdings with the SEC for the first and third quarters of each fiscal year on Form N-Q. Forms N-Q are available on the SEC’s web site at http://www.sec.gov. A fund's Forms N-Q may be reviewed and copied at the SEC’s Public Reference Room in Washington, DC. Information regarding the operation of the SEC's Public Reference Room may be obtained by calling 1-800-SEC-0330.
For a complete list of a fund's portfolio holdings, view the most recent holdings listing, semiannual report, or annual report on Fidelity's web site at http://www.fidelity.com, http://www.institutional.fidelity.com, or http://www.401k.com, as applicable.
NOT FDIC INSURED •MAY LOSE VALUE •NO BANK GUARANTEE
Neither the Fund nor Fidelity Distributors Corporation is a bank.
Investment Summary (Unaudited)
Top Five States as of December 31, 2018
| | % of fund's net assets |
| Illinois | 22.8 |
| Florida | 11.7 |
| Texas | 9.1 |
| Pennsylvania | 6.2 |
| New Jersey | 5.9 |
Top Five Sectors as of December 31, 2018
| | % of fund's net assets |
| Transportation | 25.4 |
| General Obligations | 24.8 |
| Health Care | 23.4 |
| Education | 6.9 |
| Electric Utilities | 5.2 |
Quality Diversification (% of fund's net assets)
| As of December 31, 2018 |
| | AAA | 2.8% |
| | AA,A | 69.8% |
| | BBB | 19.3% |
| | BB and Below | 3.1% |
| | Not Rated | 2.4% |
| | Short-Term Investments and Net Other Assets | 2.6% |

We have used ratings from Moody's Investors Service, Inc. Where Moody's® ratings are not available, we have used S&P® ratings. All ratings are as of the date indicated and do not reflect subsequent changes.
Schedule of Investments December 31, 2018
Showing Percentage of Net Assets
| Municipal Bonds - 97.4% | | | |
| | | Principal Amount | Value |
| Alabama - 0.3% | | | |
| Auburn Univ. Gen. Fee Rev. Series 2018 A, 5% 6/1/43 | | 535,000 | 612,238 |
| Birmingham Gen. Oblig. Series 2013 A, 5% 3/1/32 | | 600,000 | 654,690 |
| Jefferson County Gen. Oblig. Series 2018 A: | | | |
| 5% 4/1/25 | | $530,000 | $609,118 |
| 5% 4/1/26 | | 500,000 | 581,260 |
| Montgomery Med. Clinic Facilities: | | | |
| 4% 3/1/36 | | 85,000 | 84,266 |
| 5% 3/1/33 | | 860,000 | 929,170 |
|
| TOTAL ALABAMA | | | 3,470,742 |
|
| Alaska - 0.2% | | | |
| Alaska Int'l. Arpts. Revs. Series 2016 B, 5% 10/1/35 | | 2,305,000 | 2,594,969 |
| Arizona - 2.0% | | | |
| Arizona Ctfs. of Prtn. Series 2010 A: | | | |
| 5.25% 10/1/26 (FSA Insured) | | 530,000 | 542,487 |
| 5.25% 10/1/28 (FSA Insured) | | 1,710,000 | 1,750,288 |
| Arizona Health Facilities Auth. Rev. (Banner Health Sys. Proj.) Series 2007 B, 3 month U.S. LIBOR + 0.810% 2.42%, tender 1/1/37 (a)(b) | | 515,000 | 490,393 |
| Arizona Indl. Dev. Auth. Rev. (Provident Group-Eastern Michigan Univ. Parking Proj.) Series 2018: | | | |
| 5% 5/1/48 | | 190,000 | 200,228 |
| 5% 5/1/51 | | 190,000 | 199,717 |
| Arizona State Lottery Rev. Series 2019, 5% 7/1/23 (c) | | 4,110,000 | 4,499,628 |
| Chandler Indl. Dev. Auth. Indl. Dev. Rev. Bonds (Intel Corp. Proj.) Series 2007, 2.7%, tender 8/14/23 (a)(d) | | 1,255,000 | 1,258,778 |
| Glendale Gen. Oblig. Series 2017: | | | |
| 5% 7/1/30 | | 435,000 | 508,693 |
| 5% 7/1/31 | | 645,000 | 751,612 |
| Glendale Indl. Dev. Auth. (Terraces of Phoenix Proj.) Series 2018 A: | | | |
| 5% 7/1/38 | | 50,000 | 51,006 |
| 5% 7/1/48 | | 60,000 | 60,496 |
| Maricopa County Indl. Dev. Auth. Rev. Series 2016 A: | | | |
| 5% 1/1/32 | | 1,720,000 | 1,974,766 |
| 5% 1/1/33 | | 1,035,000 | 1,182,746 |
| Maricopa County Indl. Dev. Auth. Sr. Living Facilities Series 2016: | | | |
| 5.75% 1/1/36 (e) | | 155,000 | 154,501 |
| 6% 1/1/48 (e) | | 945,000 | 947,967 |
| Phoenix Civic Impt. Board Arpt. Rev.: | | | |
| Series 2013, 5% 7/1/22 (d) | | 170,000 | 185,807 |
| Series 2017 A 5% 7/1/36 (d) | | 300,000 | 339,171 |
| Series 2017 A: | | | |
| 5% 7/1/31 (d) | | 355,000 | 408,467 |
| 5% 7/1/33 (d) | | 190,000 | 217,237 |
| 5% 7/1/37 (d) | | 225,000 | 253,490 |
| Series 2017 B: | | | |
| 5% 7/1/29 | | 430,000 | 510,006 |
| 5% 7/1/33 | | 600,000 | 698,190 |
| 5% 7/1/36 | | 690,000 | 793,921 |
| 5% 7/1/37 | | 430,000 | 493,025 |
| Phoenix Civic Impt. Corp. Excise Tax Rev. Series 2011 C, 5% 7/1/23 | | 345,000 | 370,761 |
| Pima County Swr. Sys. Rev. Series 2012 A, 5% 7/1/26 | | 170,000 | 186,165 |
| Salt Verde Finl. Corp. Sr. Gas Rev.: | | | |
| Series 2007: | | | |
| 5.25% 12/1/21 | | 600,000 | 648,846 |
| 5.5% 12/1/29 | | 1,530,000 | 1,830,064 |
| 5.25% 12/1/22 | | 260,000 | 286,580 |
| Scottsdale Indl. Dev. Auth. Hosp. Rev. (Scottsdale Healthcare Proj.) Series 2006 C, 5% 9/1/35 (FSA Insured) | | 180,000 | 187,241 |
| Tempe Indl. Dev. Auth. Rev. (Mirabella At Asu, Inc. Proj.): | | | |
| Series 2017 A: | | | |
| 6.125% 10/1/47 (e) | | 90,000 | 96,697 |
| 6.125% 10/1/52 (e) | | 90,000 | 96,369 |
| Series 2017 B, 6% 10/1/37 (e) | | 45,000 | 48,515 |
|
| TOTAL ARIZONA | | | 22,223,858 |
|
| California - 3.2% | | | |
| ABC Unified School District Series 1997 C, 0% 8/1/28 (Nat'l. Pub. Fin. Guarantee Corp. Insured) | | 675,000 | 511,353 |
| Bay Area Toll Auth. San Francisco Bay Toll Bridge Rev. Bonds Series B, 2.85%, tender 4/1/25 (a) | | 1,420,000 | 1,464,091 |
| Cabrillo Unified School District Series A, 0% 8/1/20 (AMBAC Insured) | | 735,000 | 712,281 |
| California Edl. Facilities Auth. Rev. (Loyola Marymount Univ. Proj.) Series 2001 A, 0% 10/1/22 (Nat'l. Pub. Fin. Guarantee Corp. Insured) | | 860,000 | 794,115 |
| California Gen. Oblig.: | | | |
| Series 2007, 5.625% 5/1/20 | | 20,000 | 20,065 |
| Series 2009, 6% 4/1/38 | | 1,345,000 | 1,357,952 |
| Series 2016, 5% 9/1/29 | | 380,000 | 447,591 |
| 5.25% 12/1/33 | | 30,000 | 30,071 |
| 5.25% 4/1/35 | | 1,660,000 | 1,807,308 |
| 5.5% 3/1/40 | | 1,190,000 | 1,234,875 |
| 5.6% 3/1/36 | | 510,000 | 530,053 |
| California Health Facilities Fing. Auth. Rev. (Catholic Healthcare West Proj.) Series 2009 E, 5.625% 7/1/25 | | 1,550,000 | 1,577,125 |
| California Pub. Works Board Lease Rev.: | | | |
| (Coalinga State Hosp. Proj.) Series 2013 E: | | | |
| 5% 6/1/26 | | 415,000 | 463,215 |
| 5% 6/1/28 | | 1,065,000 | 1,181,639 |
| (Various Cap. Projs.) Series 2011 A, 5.25% 10/1/26 | | 860,000 | 937,142 |
| (Various Judicial Council Projs.) Series 2011 D, 5% 12/1/22 | | 705,000 | 768,062 |
| Folsom Cordova Union School District No. 4 Series A, 0% 10/1/31 (Nat'l. Pub. Fin. Guarantee Corp. Insured) | | 315,000 | 204,977 |
| Golden State Tobacco Securitization Corp. Tobacco Settlement Rev. Series 2017 A1: | | | |
| 5% 6/1/22 | | 570,000 | 619,031 |
| 5% 6/1/23 | | 655,000 | 721,535 |
| 5% 6/1/24 | | 365,000 | 400,628 |
| Kern Cmnty. College District Gen. Oblig. Series 2006: | | | |
| 0% 11/1/28 (FSA Insured) | | 850,000 | 652,426 |
| 0% 11/1/30 (FSA Insured) | | 860,000 | 604,700 |
| Long Beach Unified School District Series 2009, 5.5% 8/1/29 | | 30,000 | 30,635 |
| Los Angeles Cmnty. Redev. Agcy. Lease Rev. (Vermont Manchester Social Svcs. Proj.) Series 2005, 5% 9/1/19 (AMBAC Insured) | | 440,000 | 441,039 |
| Los Angeles Muni. Impt. Corp. Lease Rev. Series 2012 C: | | | |
| 5% 3/1/25 | | 250,000 | 273,583 |
| 5% 3/1/27 | | 345,000 | 376,654 |
| Madera County Ctfs. of Prtn. (Children's Hosp. Central California Proj.) Series 2010, 5.375% 3/15/36 (Pre-Refunded to 3/15/20 @ 100) | | 690,000 | 720,484 |
| Monrovia Unified School District Series B, 0% 8/1/29 (Nat'l. Pub. Fin. Guarantee Corp. Insured) | | 780,000 | 566,288 |
| Oakland Gen. Oblig. Series 2012: | | | |
| 5% 1/15/26 | | 780,000 | 830,419 |
| 5% 1/15/28 | | 750,000 | 797,858 |
| Oakland Unified School District Alameda County Series 2015 A, 5% 8/1/29 | | 300,000 | 347,790 |
| Poway Unified School District: | | | |
| (District #2007-1 School Facilities Proj.) Series 2008 A, 0% 8/1/32 | | 1,015,000 | 643,906 |
| Series 2011, 0% 8/1/46 | | 200,000 | 64,332 |
| Series B: | | | |
| 0% 8/1/37 | | 1,345,000 | 663,502 |
| 0% 8/1/39 | | 4,095,000 | 1,827,312 |
| Poway Unified School District Pub. Fing.: | | | |
| 5% 9/1/24 | | 170,000 | 189,259 |
| 5% 9/1/26 | | 220,000 | 244,413 |
| 5% 9/1/29 | | 455,000 | 496,633 |
| 5% 9/1/31 | | 205,000 | 222,107 |
| Sacramento City Fing. Auth. Rev. Series A, 0% 12/1/26 (Nat'l. Pub. Fin. Guarantee Corp. Insured) | | 860,000 | 683,752 |
| San Bernardino County Ctfs. of Prtn. (Arrowhead Proj.) Series 2009 A, 5.25% 8/1/26 | | 655,000 | 667,576 |
| San Diego Unified School District: | | | |
| Series 2008 C, 0% 7/1/34 | | 620,000 | 361,615 |
| Series 2008 E, 0% 7/1/47 (f) | | 1,495,000 | 976,594 |
| San Jose Fing. Auth. Lease Rev. (Civic Ctr. Proj.) Series 2013 A: | | | |
| 5% 6/1/27 | | 795,000 | 891,275 |
| 5% 6/1/31 | | 995,000 | 1,104,410 |
| San Marcos Unified School District Series 2010 B, 0% 8/1/47 | | 3,665,000 | 1,164,041 |
| San Mateo County Cmnty. College District Series A, 0% 9/1/26 (Nat'l. Pub. Fin. Guarantee Corp. Insured) | | 935,000 | 774,704 |
| Union Elementary School District Series B, 0% 9/1/22 (Nat'l. Pub. Fin. Guarantee Corp. Insured) | | 260,000 | 241,030 |
| Univ. of California Regents Med. Ctr. Pool Rev. Series 2013 J, 5% 5/15/48 | | 515,000 | 559,043 |
| Washington Township Health Care District Gen. Oblig.: | | | |
| Series 2013 A, 5.5% 8/1/38 | | 775,000 | 896,644 |
| Series 2013 B, 5.5% 8/1/38 | | 170,000 | 196,683 |
| Washington Township Health Care District Rev.: | | | |
| Series 2009 A, 5.75% 7/1/24 | | 300,000 | 304,806 |
| Series 2010 A: | | | |
| 5.25% 7/1/30 | | 190,000 | 197,874 |
| 5.5% 7/1/38 | | 655,000 | 681,783 |
| West Contra Costa Unified School District Series 2012, 5% 8/1/26 | | 345,000 | 381,187 |
|
| TOTAL CALIFORNIA | | | 35,859,466 |
|
| Colorado - 1.0% | | | |
| Arkansas River Pwr. Auth. Rev. Series 2018 A: | | | |
| 5% 10/1/38 | | 430,000 | 460,805 |
| 5% 10/1/43 | | 540,000 | 572,449 |
| Colorado Health Facilities Auth. (Parkview Med. Ctr., Inc. Proj.) Series 2016: | | | |
| 4% 9/1/35 | | 285,000 | 292,179 |
| 4% 9/1/36 | | 225,000 | 229,759 |
| 5% 9/1/46 | | 1,255,000 | 1,362,917 |
| Denver City & County Arpt. Rev.: | | | |
| Series 2017 A: | | | |
| 5% 11/15/23 (d) | | 390,000 | 438,017 |
| 5% 11/15/26 (d) | | 595,000 | 693,223 |
| 5% 11/15/27 (d) | | 505,000 | 594,718 |
| Series 2018 A: | | | |
| 5% 12/1/34 (d) | | 880,000 | 1,051,899 |
| 5% 12/1/36 (d) | | 860,000 | 978,035 |
| 5% 12/1/37 (d) | | 1,720,000 | 1,945,217 |
| E-470 Pub. Hwy. Auth. Rev.: | | | |
| Series 2000 B, 0% 9/1/20 (Nat'l. Pub. Fin. Guarantee Corp. Insured) | | 2,335,000 | 2,245,383 |
| Series 2010 C: | | | |
| 5.25% 9/1/25 | | 170,000 | 177,839 |
| 5.375% 9/1/26 | | 170,000 | 178,012 |
|
| TOTAL COLORADO | | | 11,220,452 |
|
| Connecticut - 0.9% | | | |
| Connecticut Gen. Oblig.: | | | |
| Series 2014 C, 5% 6/15/25 | | 290,000 | 327,407 |
| Series 2018 F: | | | |
| 5% 9/15/23 | | 450,000 | 498,105 |
| 5% 9/15/24 | | 560,000 | 627,603 |
| 5% 9/15/25 | | 560,000 | 633,668 |
| Connecticut Health & Edl. Facilities Auth. Rev.: | | | |
| (Sacred Heart Univ., CT. Proj.) Series 2017 I-1: | | | |
| 5% 7/1/26 | | 85,000 | 98,559 |
| 5% 7/1/27 | | 60,000 | 70,214 |
| 5% 7/1/28 | | 110,000 | 127,821 |
| 5% 7/1/29 | | 70,000 | 80,940 |
| Series 2016 K, 4% 7/1/46 | | 1,520,000 | 1,495,072 |
| Series K1: | | | |
| 5% 7/1/27 | | 85,000 | 95,763 |
| 5% 7/1/29 | | 220,000 | 247,977 |
| 5% 7/1/30 | | 170,000 | 190,448 |
| 5% 7/1/33 | | 275,000 | 303,867 |
| 5% 7/1/34 | | 130,000 | 142,990 |
| Series K3, 5% 7/1/43 | | 2,060,000 | 2,207,949 |
| Connecticut State Revolving Fund Gen. Rev. Series 2017 A, 5% 5/1/35 | | 650,000 | 754,494 |
| Eastern Connecticut Resources Recovery Auth. Solid Waste Rev. (Wheelabrator Lisbon Proj.) Series A, 5.5% 1/1/20 (d) | | 260,000 | 263,987 |
| Hbr. Point Infra Impt. District Series 2017: | | | |
| 5% 4/1/30 (e) | | 785,000 | 832,822 |
| 5% 4/1/39 (e) | | 1,010,000 | 1,045,098 |
| New Britain Gen. Oblig. Series 2017 C, 5% 3/1/29 (FSA Insured) | | 185,000 | 215,973 |
|
| TOTAL CONNECTICUT | | | 10,260,757 |
|
| District Of Columbia - 1.4% | | | |
| District of Columbia Rev.: | | | |
| Series 2018, 5% 10/1/48 | | 7,155,000 | 7,885,168 |
| Series B, 4.75% 6/1/32 | | 465,000 | 479,801 |
| Metropolitan Washington DC Arpts. Auth. Sys. Rev. Series 2017 A: | | | |
| 5% 10/1/28 (d) | | 1,145,000 | 1,337,200 |
| 5% 10/1/29 (d) | | 1,390,000 | 1,615,138 |
| 5% 10/1/30 (d) | | 1,420,000 | 1,640,498 |
| 5% 10/1/31 (d) | | 250,000 | 287,368 |
| 5% 10/1/32 (d) | | 385,000 | 441,272 |
| 5% 10/1/33 (d) | | 190,000 | 216,676 |
| 5% 10/1/35 (d) | | 430,000 | 486,859 |
| 5% 10/1/42 (d) | | 860,000 | 953,671 |
|
| TOTAL DISTRICT OF COLUMBIA | | | 15,343,651 |
|
| Florida - 11.7% | | | |
| Brevard County School Board Ctfs. of Prtn. Series 2015 C: | | | |
| 5% 7/1/25 | | 345,000 | 401,349 |
| 5% 7/1/26 | | 300,000 | 345,480 |
| 5% 7/1/28 | | 300,000 | 343,347 |
| Broward County Arpt. Sys. Rev.: | | | |
| Series 2012 P-1, 5% 10/1/22 (d) | | 165,000 | 180,890 |
| Series 2012 Q1, 5% 10/1/25 | | 900,000 | 988,371 |
| Series 2017: | | | |
| 5% 10/1/25 (d) | | 45,000 | 51,580 |
| 5% 10/1/26 (d) | | 170,000 | 196,767 |
| 5% 10/1/27 (d) | | 170,000 | 198,536 |
| 5% 10/1/28 (d) | | 170,000 | 196,965 |
| 5% 10/1/29 (d) | | 460,000 | 529,897 |
| 5% 10/1/30 (d) | | 125,000 | 143,270 |
| 5% 10/1/32 (d) | | 600,000 | 682,764 |
| 5% 10/1/33 (d) | | 225,000 | 255,119 |
| 5% 10/1/34 (d) | | 220,000 | 248,376 |
| 5% 10/1/35 (d) | | 260,000 | 292,692 |
| 5% 10/1/36 (d) | | 345,000 | 386,714 |
| 5% 10/1/37 (d) | | 385,000 | 430,003 |
| 5% 10/1/42 (d) | | 730,000 | 808,358 |
| 5% 10/1/47 (d) | | 1,035,000 | 1,141,998 |
| Series A: | | | |
| 5% 10/1/23 (d) | | 245,000 | 273,278 |
| 5% 10/1/28 (d) | | 515,000 | 578,783 |
| 5% 10/1/30 (d) | | 600,000 | 668,490 |
| 5% 10/1/31 (d) | | 515,000 | 572,129 |
| 5% 10/1/32 (d) | | 480,000 | 531,710 |
| Broward County School Board Ctfs. of Prtn.: | | | |
| (Broward County School District Proj.) Series 2016 A, 5% 7/1/28 | | 115,000 | 133,939 |
| (Broward County School District) Series 2012 A, 5% 7/1/24 | | 375,000 | 409,733 |
| Series 2012 A: | | | |
| 5% 7/1/24 (Pre-Refunded to 7/1/22 @ 100) | | 385,000 | 423,931 |
| 5% 7/1/27 | | 980,000 | 1,062,516 |
| Series 2015 A: | | | |
| 5% 7/1/24 | | 385,000 | 440,502 |
| 5% 7/1/27 | | 170,000 | 195,332 |
| Series 2015 B, 5% 7/1/24 | | 475,000 | 543,476 |
| Series 2016, 5% 7/1/32 | | 380,000 | 434,507 |
| Central Florida Expressway Auth. Sr. Lien Rev. Series 2018: | | | |
| 5% 7/1/38 | | 3,325,000 | 3,791,232 |
| 5% 7/1/39 | | 4,380,000 | 4,978,877 |
| Citizens Property Ins. Corp. Series 2011 A1, 5% 6/1/19 | | 295,000 | 298,794 |
| Collier County Indl. Dev. Auth. Healthcare Facilities Rev. (NCH Healthcare Sys. Proj.) Series 2011, 6.25% 10/1/39 | | 2,015,000 | 2,188,048 |
| Duval County School Board Ctfs. of Prtn.: | | | |
| Series 2015 B: | | | |
| 5% 7/1/28 | | 355,000 | 406,294 |
| 5% 7/1/32 | | 2,105,000 | 2,383,597 |
| Series 2016 A, 5% 7/1/33 | | 230,000 | 262,492 |
| Florida Board of Ed. Pub. Ed. Cap. Outlay Series 2011 E, 5% 6/1/24 | | 1,136,000 | 1,216,372 |
| Florida Mid-Bay Bridge Auth. Rev.: | | | |
| Series 2015 A, 5% 10/1/35 | | 1,100,000 | 1,198,989 |
| Series 2015 C: | | | |
| 5% 10/1/30 | | 565,000 | 621,907 |
| 5% 10/1/40 | | 345,000 | 369,409 |
| Florida Muni. Pwr. Agcy. Rev.: | | | |
| (Requirements Pwr. Supply Proj.) Series 2016 A: | | | |
| 5% 10/1/30 | | 375,000 | 435,750 |
| 5% 10/1/31 | | 410,000 | 474,555 |
| (St. Lucie Proj.) Series 2012 A, 5% 10/1/26 | | 635,000 | 695,674 |
| Series 2015 B: | | | |
| 5% 10/1/28 | | 170,000 | 195,879 |
| 5% 10/1/30 | | 310,000 | 354,504 |
| Greater Orlando Aviation Auth. Arpt. Facilities Rev.: | | | |
| Series 2016 A, 5% 10/1/46 (d) | | 170,000 | 186,917 |
| Series 2016: | | | |
| 5% 10/1/20 (d) | | 35,000 | 36,759 |
| 5% 10/1/21 (d) | | 265,000 | 284,427 |
| 5% 10/1/22 (d) | | 170,000 | 186,179 |
| 5% 10/1/24 (d) | | 515,000 | 583,181 |
| 5% 10/1/26 (d) | | 295,000 | 341,672 |
| 5% 10/1/27 (d) | | 170,000 | 198,679 |
| Series 2017 A: | | | |
| 5% 10/1/24 (d) | | 400,000 | 452,956 |
| 5% 10/1/25 (d) | | 170,000 | 194,971 |
| 5% 10/1/27 (d) | | 345,000 | 403,202 |
| 5% 10/1/29 (d) | | 515,000 | 594,969 |
| 5% 10/1/30 (d) | | 555,000 | 638,411 |
| 5% 10/1/31 (d) | | 1,485,000 | 1,702,048 |
| 5% 10/1/32 (d) | | 1,165,000 | 1,329,521 |
| 5% 10/1/34 (d) | | 1,035,000 | 1,172,696 |
| 5% 10/1/35 (d) | | 1,365,000 | 1,541,058 |
| 5% 10/1/36 (d) | | 1,290,000 | 1,450,128 |
| 5% 10/1/37 (d) | | 1,075,000 | 1,203,248 |
| Halifax Hosp. Med. Ctr. Rev.: | | | |
| 4% 6/1/27 | | 240,000 | 251,753 |
| 5% 6/1/24 | | 45,000 | 50,273 |
| Highlands County Health Facilities Auth. Rev. Series 2008: | | | |
| 6% 11/15/37 | | 2,230,000 | 2,307,582 |
| 6% 11/15/37 (Pre-Refunded to 11/15/19 @ 100) | | 5,000 | 5,180 |
| Jacksonville Sales Tax Rev. Series 2012, 5% 10/1/25 | | 170,000 | 186,822 |
| Lake County School Board Ctfs. of Prtn. Series 2014 A: | | | |
| 5% 6/1/27 (FSA Insured) | | 170,000 | 190,194 |
| 5% 6/1/28 (FSA Insured) | | 170,000 | 189,559 |
| 5% 6/1/30 (FSA Insured) | | 385,000 | 426,226 |
| Lee County Arpt. Rev. Series 2011 A, 5.375% 10/1/32 (d) | | 1,085,000 | 1,156,686 |
| Miami-Dade County Aviation Rev.: | | | |
| Series 2010, 5.5% 10/1/30 (Pre-Refunded to 10/1/20 @ 100) | | 520,000 | 552,880 |
| Series 2012 A: | | | |
| 5% 10/1/21 (d) | | 325,000 | 348,468 |
| 5% 10/1/22 (d) | | 170,000 | 185,924 |
| 5% 10/1/23 (d) | | 1,325,000 | 1,445,628 |
| 5% 10/1/24 (d) | | 1,560,000 | 1,697,358 |
| 5% 10/1/30 (d) | | 1,205,000 | 1,292,350 |
| 5% 10/1/31 (d) | | 690,000 | 739,011 |
| Series 2014 A: | | | |
| 5% 10/1/28 (d) | | 860,000 | 952,493 |
| 5% 10/1/33 (d) | | 1,445,000 | 1,579,631 |
| 5% 10/1/36 (d) | | 2,730,000 | 2,967,947 |
| 5% 10/1/37 | | 2,225,000 | 2,451,950 |
| Series 2015 A: | | | |
| 5% 10/1/29 (d) | | 275,000 | 305,861 |
| 5% 10/1/31 (d) | | 230,000 | 254,044 |
| 5% 10/1/35 (d) | | 945,000 | 1,028,907 |
| Series 2016 A: | | | |
| 5% 10/1/29 | | 250,000 | 289,930 |
| 5% 10/1/31 | | 300,000 | 344,976 |
| Series 2017 B, 5% 10/1/40 (d) | | 2,240,000 | 2,482,211 |
| Miami-Dade County Cap. Asset Acquisition Series 2012 A, 5% 10/1/26 | | 645,000 | 706,875 |
| Miami-Dade County Expressway Auth.: | | | |
| Series 2014 A, 5% 7/1/44 | | 600,000 | 654,336 |
| Series 2014 B: | | | |
| 5% 7/1/26 | | 430,000 | 487,465 |
| 5% 7/1/27 | | 300,000 | 339,267 |
| 5% 7/1/28 | | 170,000 | 191,786 |
| Series A: | | | |
| 5% 7/1/32 | | 740,000 | 847,219 |
| 5% 7/1/33 | | 630,000 | 719,000 |
| Miami-Dade County School Board Ctfs. of Prtn.: | | | |
| Series 2011 B, 5.625% 5/1/31 | | 1,135,000 | 1,219,489 |
| Series 2015 A: | | | |
| 5% 5/1/26 | | 945,000 | 1,072,377 |
| 5% 5/1/27 (FSA Insured) | | 135,000 | 154,464 |
| 5% 5/1/28 | | 2,015,000 | 2,286,602 |
| 5% 5/1/29 | | 700,000 | 790,874 |
| Series 2015 B: | | | |
| 5% 5/1/26 | | 1,465,000 | 1,662,467 |
| 5% 5/1/27 | | 3,810,000 | 4,345,000 |
| 5% 5/1/28 | | 2,925,000 | 3,319,261 |
| Series 2016 A: | | | |
| 5% 5/1/30 | | 1,295,000 | 1,467,831 |
| 5% 5/1/32 | | 1,720,000 | 1,936,290 |
| Series 2016 B, 5% 8/1/26 | | 1,865,000 | 2,189,230 |
| Miami-Dade County Transit Sales Surtax Rev. Series 2012, 5% 7/1/42 | | 380,000 | 409,089 |
| Orange County Health Facilities Auth. Series 2012 A, 5% 10/1/42 | | 2,075,000 | 2,206,265 |
| Orange County School Board Ctfs. of Prtn.: | | | |
| Series 2015 C, 5% 8/1/30 | | 1,720,000 | 1,956,930 |
| Series 2016 C, 5% 8/1/33 | | 650,000 | 742,248 |
| Orlando Utils. Commission Util. Sys. Rev.: | | | |
| Series 2009 B, 5% 10/1/33 | | 365,000 | 367,741 |
| Series 2012 A, 5% 10/1/25 | | 190,000 | 223,299 |
| Palm Beach County Arpt. Sys. Rev. Series 2016: | | | |
| 5% 10/1/21 (d) | | 205,000 | 220,314 |
| 5% 10/1/23 (d) | | 230,000 | 256,876 |
| 5% 10/1/24 (d) | | 235,000 | 266,650 |
| 5% 10/1/27 (d) | | 170,000 | 196,767 |
| 5% 10/1/29 (d) | | 180,000 | 206,312 |
| 5% 10/1/30 (d) | | 320,000 | 365,347 |
| 5% 10/1/31 (d) | | 225,000 | 255,881 |
| 5% 10/1/32 (d) | | 345,000 | 391,334 |
| 5% 10/1/33 (d) | | 740,000 | 837,199 |
| 5% 10/1/34 (d) | | 775,000 | 873,379 |
| 5% 10/1/35 (d) | | 815,000 | 915,481 |
| Palm Beach County Health Facilities Auth. Hosp. Rev. Series 2014: | | | |
| 5% 12/1/22 | | 115,000 | 125,781 |
| 5% 12/1/23 | | 240,000 | 265,922 |
| 5% 12/1/24 | | 265,000 | 297,934 |
| 5% 12/1/25 | | 95,000 | 105,818 |
| 5% 12/1/31 | | 85,000 | 92,510 |
| Palm Beach County School Board Ctfs. of Prtn. Series 2015 D: | | | |
| 5% 8/1/28 | | 810,000 | 931,581 |
| 5% 8/1/29 | | 1,030,000 | 1,177,887 |
| 5% 8/1/30 | | 2,840,000 | 3,229,364 |
| 5% 8/1/31 | | 2,855,000 | 3,237,227 |
| South Florida Wtr. Mgmt. District Ctfs. of Prtn. Series 2015: | | | |
| 5% 10/1/29 | | 860,000 | 994,229 |
| 5% 10/1/32 | | 1,080,000 | 1,231,729 |
| South Lake County Hosp. District (South Lake Hosp., Inc.): | | | |
| Series 2009 A: | | | |
| 6% 4/1/29 | | 240,000 | 241,882 |
| 6.25% 4/1/39 | | 570,000 | 574,668 |
| Series 2010, 5.25% 10/1/34 | | 600,000 | 621,570 |
| South Miami Health Facilities Auth. Hosp. Rev. (Baptist Med. Ctr., FL. Proj.) Series 2017: | | | |
| 4% 8/15/33 | | 430,000 | 446,835 |
| 5% 8/15/26 | | 585,000 | 683,192 |
| 5% 8/15/27 | | 385,000 | 453,954 |
| 5% 8/15/28 | | 260,000 | 304,385 |
| 5% 8/15/30 | | 560,000 | 648,614 |
| 5% 8/15/31 | | 540,000 | 622,339 |
| 5% 8/15/32 | | 400,000 | 459,352 |
| 5% 8/15/34 | | 1,115,000 | 1,270,464 |
| 5% 8/15/35 | | 740,000 | 840,788 |
| 5% 8/15/42 | | 1,135,000 | 1,268,714 |
| 5% 8/15/47 | | 1,685,000 | 1,876,854 |
| Tallahassee Health Facilities Rev.: | | | |
| (Tallahassee Memorial Healthcare, Inc. Proj.) Series 2016 A, 5% 12/1/41 | | 190,000 | 204,455 |
| Series 2015 A, 5% 12/1/40 | | 380,000 | 407,953 |
| Tampa Tax Allocation (H. Lee Moffitt Cancer Ctr. Proj.) Series 2012 A: | | | |
| 5% 9/1/22 | | 395,000 | 434,129 |
| 5% 9/1/25 | | 70,000 | 76,623 |
| Volusia County School Board Ctfs. of Prtn.: | | | |
| (Florida Master Lease Prog.) Series 2016 A: | | | |
| 5% 8/1/29 (Build America Mutual Assurance Insured) | | 170,000 | 193,858 |
| 5% 8/1/32 (Build America Mutual Assurance Insured) | | 860,000 | 969,512 |
| (Master Lease Prog.) Series 2014 B: | | | |
| 5% 8/1/25 | | 305,000 | 349,246 |
| 5% 8/1/26 | | 60,000 | 68,400 |
|
| TOTAL FLORIDA | | | 129,936,755 |
|
| Georgia - 1.5% | | | |
| Atlanta Wtr. & Wastewtr. Rev. 5% 11/1/27 | | 170,000 | 196,665 |
| Bartow County Dev. Auth. Poll. Cont. Rev. Bonds (Georgia Pwr. Co. Plant Bowen Proj.) Series 1997 1, 2.05%, tender 11/19/21 (a) | | 345,000 | 336,489 |
| Burke County Indl. Dev. Auth. Poll. Cont. Rev. Bonds: | | | |
| (Oglethorpe Pwr. Corp. Vogtle Proj.) Series 2013 A, 2.4%, tender 4/1/20 (a) | | 1,310,000 | 1,303,764 |
| 2.2%, tender 4/2/19 (a) | | 515,000 | 514,768 |
| 2.2%, tender 4/2/19 (a) | | 1,120,000 | 1,119,496 |
| 2.2%, tender 4/2/19 (a) | | 705,000 | 704,683 |
| DeKalb County Hosp. Auth. Rev. (DeKalb Med. Ctr., Inc. Proj.) Series 2010, 6% 9/1/30 (Pre-Refunded to 9/1/20 @ 100) | | 1,575,000 | 1,677,375 |
| DeKalb County Wtr. & Swr. Rev. Series 2011 A, 5.25% 10/1/36 | | 515,000 | 554,166 |
| Georgia Muni. Gas Auth. Rev. (Gas Portfolio III Proj.) Series S: | | | |
| 5% 10/1/22 | | 590,000 | 650,835 |
| 5% 10/1/23 | | 690,000 | 760,104 |
| Glynn-Brunswick Memorial Hosp. Auth. Rev. (Southeast Georgia Health Sys. Proj.) Series 2017: | | | |
| 4% 8/1/43 | | 385,000 | 373,258 |
| 5% 8/1/39 | | 355,000 | 383,869 |
| 5% 8/1/43 | | 470,000 | 507,370 |
| Main Street Natural Gas, Inc. Bonds Series 2018 C, 4%, tender 12/1/23 (a) | | 4,415,000 | 4,661,887 |
| Main Street Natural Gas, Inc. Georgia Gas Proj. Rev. Series A, 5.25% 9/15/19 | | 330,000 | 337,501 |
| Private Colleges & Univs. Auth. Rev. (The Savannah College of Art and Design Projs.) Series 2014: | | | |
| 5% 4/1/25 | | 600,000 | 671,712 |
| 5% 4/1/30 | | 345,000 | 377,537 |
| 5% 4/1/44 | | 655,000 | 697,143 |
| Valdosta & Lowndes County Hosp. (South Georgia Med. Ctr. Proj.) 5% 10/1/20 | | 180,000 | 180,520 |
|
| TOTAL GEORGIA | | | 16,009,142 |
|
| Hawaii - 0.7% | | | |
| Hawaii Arpts. Sys. Rev.: | | | |
| Series 2015 A: | | | |
| 5% 7/1/41 (d) | | 1,290,000 | 1,414,885 |
| 5% 7/1/45 (d) | | 3,420,000 | 3,742,711 |
| Series 2018 A: | | | |
| 5% 7/1/29 (d) | | 220,000 | 257,506 |
| 5% 7/1/30 (d) | | 260,000 | 301,753 |
| 5% 7/1/31 (d) | | 250,000 | 288,810 |
| 5% 7/1/32 (d) | | 260,000 | 299,437 |
| 5% 7/1/33 (d) | | 260,000 | 298,288 |
| State of Hawaii Dept. of Trans. Series 2013: | | | |
| 5% 8/1/22 (d) | | 270,000 | 294,605 |
| 5.25% 8/1/24 (d) | | 345,000 | 385,158 |
| 5.25% 8/1/25 (d) | | 430,000 | 476,715 |
|
| TOTAL HAWAII | | | 7,759,868 |
|
| Idaho - 0.1% | | | |
| Idaho Health Facilities Auth. Rev. Series 2015 ID, 5% 12/1/25 | | 475,000 | 550,112 |
| Illinois - 22.8% | | | |
| Boone & Winnebago County Cmnty. Unit School District 200: | | | |
| 0% 1/1/21 (Nat'l. Pub. Fin. Guarantee Corp. Insured) | | 310,000 | 294,664 |
| 0% 1/1/22 (Nat'l. Pub. Fin. Guarantee Corp. Insured) | | 335,000 | 309,607 |
| Chicago Board of Ed.: | | | |
| Series 1998 B1, 0% 12/1/21 (Nat'l. Pub. Fin. Guarantee Corp. Insured) | | 430,000 | 392,156 |
| Series 1999 A, 5.25% 12/1/21 (Nat'l. Pub. Fin. Guarantee Corp. Insured) | | 410,000 | 435,523 |
| Series 2010 F, 5% 12/1/20 | | 225,000 | 231,559 |
| Series 2011 A: | | | |
| 5% 12/1/41 | | 995,000 | 995,219 |
| 5.25% 12/1/41 | | 615,000 | 619,256 |
| 5.5% 12/1/39 | | 1,360,000 | 1,380,346 |
| Series 2012 A, 5% 12/1/42 | | 1,585,000 | 1,584,937 |
| Series 2015 C, 5.25% 12/1/39 | | 295,000 | 299,626 |
| Series 2016 B, 6.5% 12/1/46 | | 140,000 | 155,798 |
| Series 2017 A, 7% 12/1/46 (e) | | 480,000 | 556,939 |
| Series 2017 C: | | | |
| 5% 12/1/22 | | 455,000 | 473,646 |
| 5% 12/1/23 | | 390,000 | 407,573 |
| 5% 12/1/24 | | 990,000 | 1,039,500 |
| 5% 12/1/25 | | 565,000 | 594,273 |
| 5% 12/1/26 | | 165,000 | 173,915 |
| 5% 12/1/30 | | 440,000 | 455,985 |
| Series 2017 D: | | | |
| 5% 12/1/23 | | 510,000 | 532,981 |
| 5% 12/1/24 | | 215,000 | 225,750 |
| 5% 12/1/31 | | 515,000 | 531,423 |
| Series 2018 A: | | | |
| 5% 12/1/25 | | 170,000 | 178,808 |
| 5% 12/1/26 | | 170,000 | 179,185 |
| 5% 12/1/28 | | 815,000 | 856,581 |
| 5% 12/1/30 | | 345,000 | 358,659 |
| 5% 12/1/32 | | 200,000 | 206,462 |
| 5% 12/1/35 | | 170,000 | 173,456 |
| Series 2018 C, 5% 12/1/46 | | 1,315,000 | 1,305,151 |
| Chicago Midway Arpt. Rev.: | | | |
| Series 2014 A: | | | |
| 5% 1/1/27 (d) | | 1,780,000 | 1,953,514 |
| 5% 1/1/28 (d) | | 3,295,000 | 3,603,346 |
| 5% 1/1/33 (d) | | 925,000 | 999,074 |
| 5% 1/1/34 (d) | | 450,000 | 484,961 |
| Series 2016 A, 5% 1/1/28 (d) | | 345,000 | 386,855 |
| Series 2016 B: | | | |
| 4% 1/1/35 | | 270,000 | 274,118 |
| 5% 1/1/36 | | 345,000 | 378,879 |
| 5% 1/1/37 | | 465,000 | 507,943 |
| 5% 1/1/46 | | 1,220,000 | 1,316,953 |
| Chicago O'Hare Int'l. Arpt. Rev.: | | | |
| Series 2013 B, 5% 1/1/27 | | 1,080,000 | 1,185,484 |
| Series 2013 D, 5% 1/1/27 | | 550,000 | 603,719 |
| Series 2015 A: | | | |
| 5% 1/1/31 (d) | | 1,040,000 | 1,141,972 |
| 5% 1/1/32 (d) | | 2,100,000 | 2,298,702 |
| Series 2015 C: | | | |
| 5% 1/1/24 (d) | | 245,000 | 271,769 |
| 5% 1/1/46 (d) | | 410,000 | 439,557 |
| Series 2016 B, 5% 1/1/34 | | 1,050,000 | 1,168,997 |
| Series 2016 C: | | | |
| 5% 1/1/33 | | 470,000 | 525,140 |
| 5% 1/1/34 | | 545,000 | 606,765 |
| Series 2016 G: | | | |
| 5% 1/1/37 (d) | | 345,000 | 377,792 |
| 5% 1/1/42 (d) | | 345,000 | 374,301 |
| 5.25% 1/1/29 (d) | | 60,000 | 68,981 |
| 5.25% 1/1/31 (d) | | 70,000 | 79,734 |
| Series 2017 A, 5% 1/1/31 | | 610,000 | 696,614 |
| Series 2017 B: | | | |
| 5% 1/1/35 | | 360,000 | 404,309 |
| 5% 1/1/37 | | 1,470,000 | 1,638,874 |
| Series 2017 C: | | | |
| 5% 1/1/30 | | 105,000 | 120,553 |
| 5% 1/1/31 | | 105,000 | 119,909 |
| 5% 1/1/32 | | 110,000 | 124,782 |
| Series 2017 D: | | | |
| 5% 1/1/28 (d) | | 515,000 | 585,771 |
| 5% 1/1/29 (d) | | 430,000 | 486,481 |
| 5% 1/1/32 (d) | | 465,000 | 518,075 |
| 5% 1/1/34 (d) | | 700,000 | 774,214 |
| 5% 1/1/35 (d) | | 515,000 | 568,086 |
| 5% 1/1/36 (d) | | 640,000 | 703,162 |
| 5% 1/1/37 (d) | | 345,000 | 377,792 |
| Chicago O'Hare Int'l. Arpt. Spl. Facilities Rev. Series 2018: | | | |
| 5% 7/1/38 (d) | | 455,000 | 500,846 |
| 5% 7/1/48 (d) | | 1,875,000 | 2,038,894 |
| Chicago Transit Auth.: | | | |
| Series 2014, 5.25% 12/1/49 | | 3,100,000 | 3,352,929 |
| Series 2017, 5% 12/1/46 | | 705,000 | 754,851 |
| Chicago Transit Auth. Cap. Grant Receipts Rev. Series 2017: | | | |
| 5% 6/1/22 | | 350,000 | 378,791 |
| 5% 6/1/23 | | 310,000 | 341,353 |
| 5% 6/1/24 | | 50,000 | 55,833 |
| 5% 6/1/25 | | 50,000 | 56,414 |
| 5% 6/1/26 | | 40,000 | 45,450 |
| Cook County Forest Preservation District: | | | |
| Series 2012 A, 5% 11/15/22 | | 345,000 | 373,280 |
| Series 2012 C, 5% 12/15/21 | | 170,000 | 181,064 |
| Cook County Gen. Oblig.: | | | |
| Series 2010 A: | | | |
| 5.25% 11/15/22 | | 120,000 | 126,158 |
| 5.25% 11/15/33 | | 3,100,000 | 3,219,846 |
| Series 2010 G, 5% 11/15/25 | | 585,000 | 608,991 |
| Series 2012 C, 5% 11/15/24 | | 1,910,000 | 2,070,211 |
| Series 2016 A: | | | |
| 5% 11/15/26 | | 920,000 | 1,041,854 |
| 5% 11/15/27 | | 480,000 | 540,005 |
| 5% 11/15/28 | | 630,000 | 704,113 |
| 5% 11/15/29 | | 780,000 | 864,911 |
| 5% 11/15/30 | | 860,000 | 949,870 |
| Grundy & Will Counties Cmnty. School Gen. Obligan Series 2017, 5% 2/1/25 | | 155,000 | 175,600 |
| Illinois Fin. Auth. Rev.: | | | |
| (Bradley Univ. Proj.) Series 2017 C: | | | |
| 5% 8/1/29 | | 110,000 | 125,367 |
| 5% 8/1/30 | | 155,000 | 175,781 |
| 5% 8/1/32 | | 210,000 | 236,143 |
| (Depaul Univ. Proj.) Series 2016 A: | | | |
| 4% 10/1/34 | | 170,000 | 176,652 |
| 5% 10/1/29 | | 170,000 | 195,614 |
| 5% 10/1/30 | | 170,000 | 194,723 |
| 5% 10/1/35 | | 345,000 | 388,291 |
| (OSF Healthcare Sys.) Series 2018 A: | | | |
| 4.125% 5/15/47 | | 5,390,000 | 5,331,950 |
| 5% 5/15/43 | | 7,175,000 | 7,921,128 |
| (Palos Cmnty. Hosp. Proj.) Series 2010 C: | | | |
| 5.375% 5/15/25 | | 5,205,000 | 5,421,112 |
| 5.375% 5/15/30 | | 1,250,000 | 1,295,375 |
| (Presence Health Proj.) Series 2016 C: | | | |
| 3.625% 2/15/32 | | 200,000 | 201,326 |
| 4% 2/15/33 | | 45,000 | 47,193 |
| 5% 2/15/25 | | 40,000 | 46,104 |
| 5% 2/15/26 | | 525,000 | 613,048 |
| 5% 2/15/29 | | 1,060,000 | 1,235,769 |
| 5% 2/15/36 | | 240,000 | 269,746 |
| (Rosalind Franklin Univ. Research Bldg. Proj.) Series 2017 C, 5% 8/1/46 | | 170,000 | 181,472 |
| (Rush Univ. Med. Ctr. Proj.) Series 2015 A, 5% 11/15/34 | | 85,000 | 94,056 |
| Series 2009, 5% 8/15/23 (Pre-Refunded to 8/15/20 @ 100) | | 320,000 | 335,453 |
| Series 2010, 5.25% 5/1/25 | | 1,205,000 | 1,256,839 |
| Series 2012 A: | | | |
| 5% 5/15/20 | | 85,000 | 88,443 |
| 5% 5/15/22 | | 375,000 | 408,885 |
| 5% 5/15/23 | | 50,000 | 54,247 |
| Series 2012: | | | |
| 4% 9/1/32 | | 1,510,000 | 1,543,507 |
| 5% 9/1/32 | | 325,000 | 350,880 |
| 5% 9/1/38 | | 4,520,000 | 4,829,439 |
| 5% 11/15/43 | | 900,000 | 943,074 |
| Series 2013: | | | |
| 5% 11/15/24 | | 85,000 | 93,079 |
| 5% 11/15/27 | | 15,000 | 16,253 |
| 5% 11/15/28 | | 495,000 | 535,194 |
| 5% 11/15/29 | | 240,000 | 258,941 |
| 5% 5/15/43 | | 2,030,000 | 2,113,372 |
| Series 2014, 5% 8/1/38 | | 2,300,000 | 2,508,679 |
| Series 2015 A: | | | |
| 5% 11/15/21 | | 105,000 | 113,426 |
| 5% 11/15/45 | | 555,000 | 594,549 |
| Series 2015 B, 5% 11/15/27 | | 545,000 | 619,224 |
| Series 2015 C: | | | |
| 4.125% 8/15/37 | | 150,000 | 150,989 |
| 5% 8/15/35 | | 1,285,000 | 1,397,926 |
| 5% 8/15/44 | | 6,275,000 | 6,700,257 |
| Series 2016 A: | | | |
| 5% 8/15/22 | | 170,000 | 183,138 |
| 5% 7/1/24 | | 240,000 | 271,942 |
| 5% 8/15/25 | | 410,000 | 459,651 |
| 5% 8/15/26 | | 545,000 | 616,335 |
| 5% 7/1/28 | | 210,000 | 240,427 |
| 5% 2/15/29 | | 885,000 | 997,032 |
| 5% 2/15/30 | | 935,000 | 1,048,911 |
| 5% 7/1/30 | | 120,000 | 135,743 |
| 5% 2/15/31 | | 755,000 | 843,403 |
| 5% 7/1/31 | | 215,000 | 240,303 |
| 5% 2/15/32 | | 730,000 | 812,030 |
| 5% 7/1/33 | | 110,000 | 122,173 |
| 5% 7/1/34 | | 860,000 | 951,556 |
| 5% 8/15/34 | | 110,000 | 119,869 |
| 5% 8/15/35 | | 90,000 | 97,826 |
| 5% 7/1/36 | | 445,000 | 489,282 |
| 5% 8/15/36 | | 350,000 | 378,980 |
| 5.25% 8/15/27 | | 390,000 | 445,634 |
| 5.25% 8/15/28 | | 500,000 | 568,420 |
| 5.25% 8/15/30 | | 385,000 | 434,080 |
| 5.25% 8/15/31 | | 105,000 | 117,935 |
| Series 2016 B: | | | |
| 5% 8/15/31 | | 1,270,000 | 1,444,879 |
| 5% 8/15/32 | | 1,040,000 | 1,176,822 |
| 5% 8/15/34 | | 1,295,000 | 1,454,518 |
| 5% 8/15/36 | | 1,805,000 | 2,002,882 |
| Series 2016 C: | | | |
| 3.75% 2/15/34 | | 250,000 | 249,993 |
| 4% 2/15/36 | | 1,070,000 | 1,093,048 |
| 4% 2/15/41 | | 3,080,000 | 3,103,285 |
| 5% 2/15/22 | | 225,000 | 245,079 |
| 5% 2/15/24 | | 115,000 | 130,440 |
| 5% 2/15/30 | | 1,335,000 | 1,545,823 |
| 5% 2/15/31 | | 8,825,000 | 10,163,400 |
| 5% 2/15/32 | | 760,000 | 869,934 |
| 5% 2/15/34 | | 605,000 | 685,519 |
| 5% 2/15/41 | | 1,840,000 | 2,040,339 |
| Series 2016: | | | |
| 5% 5/15/29 | | 215,000 | 244,747 |
| 5% 12/1/29 | | 295,000 | 331,642 |
| 5% 5/15/30 | | 455,000 | 514,086 |
| 5% 12/1/46 | | 805,000 | 857,228 |
| Series 2017 A, 5% 8/1/42 | | 150,000 | 160,685 |
| Series 2017: | | | |
| 5% 7/1/26 | | 300,000 | 357,288 |
| 5% 1/1/29 | | 575,000 | 674,941 |
| 5% 7/1/32 | | 1,460,000 | 1,683,000 |
| 5% 7/1/33 | | 1,175,000 | 1,351,744 |
| 5% 7/1/34 | | 965,000 | 1,107,193 |
| 5% 7/1/35 | | 810,000 | 927,491 |
| Series 2018 A: | | | |
| 4.25% 1/1/44 | | 530,000 | 533,943 |
| 5% 1/1/38 | | 2,140,000 | 2,325,602 |
| 5% 1/1/44 | | 3,200,000 | 3,447,264 |
| Illinois Gen. Oblig.: | | | |
| Series 2006, 5% 1/1/19 | | 895,000 | 895,000 |
| Series 2010, 5% 1/1/21 (FSA Insured) | | 535,000 | 548,696 |
| Series 2012 A, 4% 1/1/23 | | 435,000 | 439,898 |
| Series 2012: | | | |
| 5% 8/1/19 | | 510,000 | 517,406 |
| 5% 8/1/21 | | 415,000 | 432,393 |
| 5% 3/1/23 | | 885,000 | 923,276 |
| 5% 8/1/23 | | 790,000 | 837,297 |
| Series 2013: | | | |
| 5% 1/1/22 | | 505,000 | 513,928 |
| 5.5% 7/1/24 | | 170,000 | 184,100 |
| 5.5% 7/1/25 | | 900,000 | 971,928 |
| Series 2014: | | | |
| 5% 2/1/22 | | 180,000 | 188,291 |
| 5% 2/1/23 | | 760,000 | 801,770 |
| 5% 2/1/25 | | 625,000 | 659,913 |
| 5% 2/1/26 | | 470,000 | 494,257 |
| 5% 4/1/28 | | 395,000 | 412,546 |
| 5% 5/1/28 | | 370,000 | 386,672 |
| 5.25% 2/1/31 | | 75,000 | 78,286 |
| Series 2016: | | | |
| 5% 11/1/20 | | 805,000 | 831,219 |
| 5% 2/1/23 | | 310,000 | 327,038 |
| 5% 2/1/24 | | 1,725,000 | 1,831,174 |
| 5% 6/1/25 | | 1,515,000 | 1,617,535 |
| 5% 11/1/25 | | 515,000 | 550,556 |
| 5% 6/1/26 | | 205,000 | 219,522 |
| 5% 2/1/27 | | 2,070,000 | 2,220,489 |
| Series 2017 D: | | | |
| 5% 11/1/22 | | 4,110,000 | 4,334,899 |
| 5% 11/1/23 | | 4,305,000 | 4,571,652 |
| 5% 11/1/24 | | 6,025,000 | 6,428,675 |
| 5% 11/1/25 | | 8,065,000 | 8,621,808 |
| 5% 11/1/26 | | 1,810,000 | 1,940,573 |
| 5% 11/1/27 | | 600,000 | 644,226 |
| Illinois Muni. Elec. Agcy. Pwr. Supply Series 2015 A: | | | |
| 5% 2/1/25 | | 1,395,000 | 1,592,183 |
| 5% 2/1/26 | | 1,785,000 | 2,045,931 |
| 5% 2/1/31 | | 700,000 | 789,677 |
| Illinois Toll Hwy. Auth. Toll Hwy. Rev.: | | | |
| Series 2015 A: | | | |
| 5% 1/1/37 | | 630,000 | 703,458 |
| 5% 1/1/40 | | 2,685,000 | 2,979,679 |
| Series 2015 B, 5% 1/1/40 | | 1,495,000 | 1,647,684 |
| Series 2016 A: | | | |
| 5% 12/1/31 | | 1,210,000 | 1,366,550 |
| 5% 12/1/32 | | 1,775,000 | 2,001,064 |
| Joliet School District #86 Gen. Oblig. Series 2002, 0% 11/1/19 (FSA Insured) | | 345,000 | 338,780 |
| Kane, McHenry, Cook & DeKalb Counties Unit School District #300: | | | |
| 0% 12/1/21 (AMBAC Insured) | | 535,000 | 497,812 |
| 0% 12/1/21 (Escrowed to Maturity) | | 330,000 | 311,517 |
| 6.5% 1/1/20 (AMBAC Insured) | | 540,000 | 563,425 |
| Kendall, Kane & Will Counties Cmnty. Unit School District #308 Series 2016: | | | |
| 5% 2/1/34 | | 1,205,000 | 1,340,563 |
| 5% 2/1/35 | | 860,000 | 954,454 |
| 5% 2/1/36 | | 1,480,000 | 1,636,628 |
| Lake County Cmnty. High School District #117, Antioch Series 2000 B, 0% 12/1/20 (Nat'l. Pub. Fin. Guarantee Corp. Insured) | | 310,000 | 294,289 |
| McHenry & Kane Counties Cmnty. Consolidated School District #158: | | | |
| Series 2003: | | | |
| 0% 1/1/19 | | 475,000 | 475,000 |
| 0% 1/1/19 (Escrowed to Maturity) | | 30,000 | 30,000 |
| Series 2004, 0% 1/1/24 (FSA Insured) | | 880,000 | 762,511 |
| 0% 1/1/19 (Escrowed to Maturity) | | 10,000 | 10,000 |
| Metropolitan Pier & Exposition: | | | |
| (McCormick Place Expansion Proj.): | | | |
| Series 1992 A, 0% 6/15/20 (Nat'l. Pub. Fin. Guarantee Corp. Insured) | | 620,000 | 593,290 |
| Series 1994 A, 0% 6/15/19 (Nat'l. Pub. Fin. Guarantee Corp. Insured) | | 1,145,000 | 1,130,652 |
| Series 1996 A, 0% 6/15/23 (Nat'l. Pub. Fin. Guarantee Corp. Insured) | | 1,085,000 | 927,740 |
| Series 2010 B1: | | | |
| 0% 6/15/43 (FSA Insured) | | 8,730,000 | 2,892,074 |
| 0% 6/15/44 (FSA Insured) | | 10,070,000 | 3,180,710 |
| 0% 6/15/45 (FSA Insured) | | 5,250,000 | 1,580,723 |
| 0% 6/15/47 (FSA Insured) | | 625,000 | 170,900 |
| Series 2012 B, 0% 12/15/51 | | 2,255,000 | 439,522 |
| Series A: | | | |
| 0% 6/15/22 (Nat'l. Pub. Fin. Guarantee Corp. Insured) | | 220,000 | 195,512 |
| 0% 12/15/24 (Nat'l. Pub. Fin. Guarantee Corp. Insured) | | 530,000 | 425,632 |
| Series 1993: | | | |
| 0% 6/15/19 | | 480,000 | 473,985 |
| 0% 6/15/19 (Escrowed to Maturity) | | 95,000 | 94,207 |
| Series 1996 A, 0% 6/15/24 | | 525,000 | 430,379 |
| Series 2002, 5.5% 6/15/20 | | 45,000 | 45,328 |
| Series 2017 B: | | | |
| 5% 12/15/25 | | 170,000 | 182,784 |
| 5% 12/15/26 | | 570,000 | 614,517 |
| 5% 12/15/27 | | 60,000 | 64,757 |
| 5% 12/15/31 | | 115,000 | 122,775 |
| 5% 12/15/34 | | 70,000 | 73,926 |
| Series A, 0% 12/15/19 (Nat'l. Pub. Fin. Guarantee Corp. Insured) | | 370,000 | 359,983 |
| Railsplitter Tobacco Settlement Auth. Rev. Series 2017: | | | |
| 5% 6/1/27 | | 4,130,000 | 4,701,592 |
| 5% 6/1/28 | | 475,000 | 537,695 |
| Univ. of Illinois Rev.: | | | |
| (Auxiliary Facilities Sys. Proj.): | | | |
| Series 1991, 0% 4/1/20 (Nat'l. Pub. Fin. Guarantee Corp. Insured) | | 1,375,000 | 1,334,616 |
| Series 1999 A: | | | |
| 0% 4/1/20 (Nat'l. Pub. Fin. Guarantee Corp. Insured) | | 275,000 | 266,923 |
| 0% 4/1/21 (Nat'l. Pub. Fin. Guarantee Corp. Insured) | | 855,000 | 808,984 |
| Series 2010 A: | | | |
| 5% 4/1/25 | | 1,055,000 | 1,089,446 |
| 5.25% 4/1/30 | | 725,000 | 749,338 |
| Series 2013: | | | |
| 6% 10/1/42 | | 945,000 | 1,057,909 |
| 6.25% 10/1/38 | | 935,000 | 1,059,551 |
| Series 2018 A, 5% 4/1/30 | | 715,000 | 827,791 |
| Will County Cmnty. Unit School District #365-U: | | | |
| Series 2007 B, 0% 11/1/26 (FSA Insured) | | 1,060,000 | 835,089 |
| Series 2012, 0% 11/1/25 | | 205,000 | 167,735 |
| 0% 11/1/19 (Escrowed to Maturity) | | 250,000 | 245,936 |
| 0% 11/1/19 (FSA Insured) | | 1,620,000 | 1,590,793 |
| Will County Illinois Series 2016: | | | |
| 5% 11/15/31 | | 280,000 | 315,434 |
| 5% 11/15/32 | | 215,000 | 241,497 |
| 5% 11/15/33 | | 260,000 | 291,187 |
| 5% 11/15/34 | | 260,000 | 290,334 |
|
| TOTAL ILLINOIS | | | 253,035,885 |
|
| Indiana - 1.5% | | | |
| Crown Point Multi-School Bldg. Corp. 0% 1/15/21 (Nat'l. Pub. Fin. Guarantee Corp. Insured) | | 1,285,000 | 1,231,069 |
| Indiana Fin. Auth. Rev.: | | | |
| Series 2012: | | | |
| 5% 3/1/30 | | 785,000 | 843,522 |
| 5% 3/1/41 | | 1,440,000 | 1,529,309 |
| Series 2015 A, 5.25% 2/1/32 | | 1,215,000 | 1,410,080 |
| Series 2016: | | | |
| 4% 9/1/21 | | 70,000 | 73,423 |
| 5% 9/1/22 | | 50,000 | 54,935 |
| 5% 9/1/23 | | 75,000 | 84,005 |
| 5% 9/1/24 | | 115,000 | 131,062 |
| 5% 9/1/26 | | 225,000 | 262,793 |
| 5% 9/1/27 | | 110,000 | 127,071 |
| 5% 9/1/28 | | 530,000 | 608,302 |
| 5% 9/1/29 | | 260,000 | 297,066 |
| 5% 9/1/30 | | 240,000 | 272,626 |
| Indiana Fin. Auth. Wastewtr. Util. Rev.: | | | |
| (CWA Auth. Proj.): | | | |
| Series 2012 A: | | | |
| 5% 10/1/24 | | 70,000 | 77,778 |
| 5% 10/1/26 | | 440,000 | 487,885 |
| Series 2015 A: | | | |
| 5% 10/1/30 | | 830,000 | 936,572 |
| 5% 10/1/45 | | 2,980,000 | 3,249,481 |
| Series 2011 A, 5.25% 10/1/25 | | 300,000 | 325,650 |
| Indianapolis Local Pub. Impt. Series 2016: | | | |
| 4% 1/1/32 (d) | | 170,000 | 176,129 |
| 4% 1/1/33 (d) | | 170,000 | 175,561 |
| 4% 1/1/34 (d) | | 170,000 | 174,770 |
| 4% 1/1/35 (d) | | 480,000 | 491,563 |
| 5% 1/1/26 (d) | | 180,000 | 207,216 |
| Lake Central Multi-District School Bldg. Corp. Series 2012 B, 5% 1/15/30 | | 370,000 | 406,023 |
| Purdue Univ. Rev. Series 2018 DD: | | | |
| 5% 7/1/34 | | 205,000 | 243,690 |
| 5% 7/1/35 | | 405,000 | 479,945 |
| 5% 7/1/36 | | 440,000 | 518,606 |
| 5% 7/1/37 | | 410,000 | 481,385 |
| 5% 7/1/38 | | 540,000 | 631,573 |
| Zionsville Cmnty. Schools Bldg. Series 2005, 5% 7/15/20 (FSA Insured) | | 335,000 | 348,383 |
|
| TOTAL INDIANA | | | 16,337,473 |
|
| Iowa - 0.1% | | | |
| Iowa Fin. Auth. Rev. Series A: | | | |
| 5% 5/15/43 | | 240,000 | 247,939 |
| 5% 5/15/48 | | 415,000 | 427,272 |
|
| TOTAL IOWA | | | 675,211 |
|
| Kansas - 0.3% | | | |
| Kansas Dev. Fin. Agcy. Series 2009, 5.75% 11/15/38 (Pre-Refunded to 11/15/19 @ 100) | | 45,000 | 46,441 |
| Wyandotte County/Kansas City Unified Govt. Util. Sys. Rev.: | | | |
| Series 2012 A: | | | |
| 5% 9/1/23 | | 320,000 | 350,989 |
| 5% 9/1/25 | | 690,000 | 755,798 |
| 5% 9/1/26 | | 335,000 | 366,698 |
| Series 2016 A: | | | |
| 5% 9/1/40 | | 775,000 | 862,978 |
| 5% 9/1/45 | | 1,170,000 | 1,298,349 |
|
| TOTAL KANSAS | | | 3,681,253 |
|
| Kentucky - 0.8% | | | |
| Kenton County Arpt. Board Arpt. Rev. Series 2016: | | | |
| 5% 1/1/21 | | 110,000 | 116,222 |
| 5% 1/1/22 | | 125,000 | 135,165 |
| 5% 1/1/23 | | 75,000 | 82,716 |
| 5% 1/1/28 | | 275,000 | 314,504 |
| 5% 1/1/31 | | 260,000 | 293,288 |
| 5% 1/1/32 | | 260,000 | 291,892 |
| Kentucky Econ. Dev. Fin. Auth. Rev. Louisville Arena Auth., Inc. Series 2017 A, 5% 12/1/47 (FSA Insured) | | 280,000 | 300,194 |
| Kentucky State Property & Buildings Commission Rev. (Proj. No. 119) Series 2018: | | | |
| 5% 5/1/26 | | 175,000 | 201,215 |
| 5% 5/1/27 | | 505,000 | 584,154 |
| 5% 5/1/29 | | 935,000 | 1,080,364 |
| 5% 5/1/32 | | 245,000 | 280,525 |
| 5% 5/1/33 | | 190,000 | 216,725 |
| 5% 5/1/34 | | 215,000 | 244,315 |
| 5% 5/1/35 | | 130,000 | 146,834 |
| 5% 5/1/36 | | 110,000 | 123,682 |
| Louisville & Jefferson County Series 2013 A: | | | |
| 5.5% 10/1/33 | | 585,000 | 653,310 |
| 5.75% 10/1/38 | | 1,510,000 | 1,691,578 |
| Louisville/Jefferson County Metropolitan Gov. Series 2012 A: | | | |
| 5% 12/1/28 | | 130,000 | 138,672 |
| 5% 12/1/30 | | 125,000 | 132,670 |
| Pikeville Hosp. Rev. (Pikeville Med. Ctr., Inc. Proj.) Series 2011, 6.5% 3/1/41 | | 515,000 | 550,854 |
| Trimble County Poll. Cont. Rev. Bonds (Louisville Gas and Elec. Co. Proj.) Series 2001 B, 2.55%, tender 5/3/21 (a) | | 1,400,000 | 1,406,300 |
|
| TOTAL KENTUCKY | | | 8,985,179 |
|
| Louisiana - 0.8% | | | |
| Louisiana Pub. Facilities Auth. Rev. (Tulane Univ. of Louisiana Proj.) Series 2016 A: | | | |
| 5% 12/15/24 | | 260,000 | 298,202 |
| 5% 12/15/25 | | 535,000 | 621,317 |
| 5% 12/15/26 | | 215,000 | 252,348 |
| 5% 12/15/28 | | 345,000 | 398,754 |
| 5% 12/15/29 | | 245,000 | 280,545 |
| 5% 12/15/30 | | 480,000 | 545,630 |
| New Orleans Aviation Board Rev.: | | | |
| (North Term. Proj.): | | | |
| Series 2015 B: | | | |
| 5% 1/1/27 (d) | | 240,000 | 266,990 |
| 5% 1/1/29 (d) | | 895,000 | 986,344 |
| 5% 1/1/30 (d) | | 1,205,000 | 1,322,451 |
| 5% 1/1/31 (d) | | 430,000 | 470,196 |
| 5% 1/1/40 (d) | | 1,425,000 | 1,531,704 |
| Series 2017 B: | | | |
| 5% 1/1/27 (d) | | 70,000 | 80,476 |
| 5% 1/1/28 (d) | | 40,000 | 45,710 |
| 5% 1/1/32 (d) | | 70,000 | 78,302 |
| 5% 1/1/33 (d) | | 120,000 | 133,876 |
| 5% 1/1/34 (d) | | 35,000 | 38,891 |
| 5% 1/1/35 (d) | | 70,000 | 77,524 |
| Series 2017 D2: | | | |
| 5% 1/1/27 (d) | | 85,000 | 97,720 |
| 5% 1/1/28 (d) | | 125,000 | 142,844 |
| 5% 1/1/31 (d) | | 110,000 | 123,621 |
| 5% 1/1/33 (d) | | 175,000 | 195,235 |
| 5% 1/1/34 (d) | | 210,000 | 233,348 |
| 5% 1/1/36 (d) | | 160,000 | 176,610 |
| 5% 1/1/37 (d) | | 265,000 | 291,346 |
|
| TOTAL LOUISIANA | | | 8,689,984 |
|
| Maine - 1.0% | | | |
| Maine Health & Higher Edl. Facilities Auth. Rev.: | | | |
| (Eastern Maine Healthcare Systems Proj.) Series 2013, 5% 7/1/43 | | 650,000 | 677,580 |
| Series 2013, 5% 7/1/25 | | 305,000 | 329,138 |
| Series 2016 A: | | | |
| 4% 7/1/41 | | 400,000 | 386,732 |
| 4% 7/1/46 | | 555,000 | 526,584 |
| 5% 7/1/41 | | 1,790,000 | 1,894,232 |
| 5% 7/1/46 | | 4,775,000 | 5,037,291 |
| Series 2017 B: | | | |
| 4% 7/1/25 | | 75,000 | 81,425 |
| 4% 7/1/31 | | 120,000 | 125,815 |
| 4% 7/1/32 | | 85,000 | 88,544 |
| 4% 7/1/34 | | 175,000 | 180,990 |
| 5% 7/1/26 | | 55,000 | 63,854 |
| 5% 7/1/28 | | 90,000 | 104,581 |
| 5% 7/1/29 | | 70,000 | 80,884 |
| 5% 7/1/33 | | 170,000 | 192,738 |
| 5% 7/1/35 | | 130,000 | 146,563 |
| Series 2017 D, 5.75% 7/1/38 | | 30,000 | 30,086 |
| Maine Tpk. Auth. Tpk. Rev. Series 2015: | | | |
| 5% 7/1/32 | | 180,000 | 204,395 |
| 5% 7/1/36 | | 450,000 | 505,008 |
| 5% 7/1/38 | | 115,000 | 128,337 |
|
| TOTAL MAINE | | | 10,784,777 |
|
| Maryland - 0.6% | | | |
| Baltimore Proj. Rev. (Wtr. Projs.) Series 2009 A: | | | |
| 5.375% 7/1/34 (Pre-Refunded to 7/1/19 @ 100) | | 30,000 | 30,530 |
| 5.375% 7/1/34 (Pre-Refunded to 7/1/19 @ 100) | | 55,000 | 55,972 |
| City of Westminster Series 2016: | | | |
| 5% 11/1/27 | | 445,000 | 497,768 |
| 5% 11/1/28 | | 475,000 | 528,552 |
| 5% 11/1/29 | | 500,000 | 552,385 |
| 5% 11/1/30 | | 530,000 | 581,717 |
| Maryland Econ. Dev. Auth. Rev. (Ports America Chesapeake LLC. Proj.) Series 2017 A: | | | |
| 5% 6/1/30 | | 215,000 | 246,229 |
| 5% 6/1/35 | | 345,000 | 386,769 |
| Maryland Econ. Dev. Corp. (Purple Line Lt. Rail Proj.) Series 2016 D: | | | |
| 5% 3/31/41 (d) | | 310,000 | 326,225 |
| 5% 3/31/46 (d) | | 515,000 | 540,220 |
| Maryland Health & Higher Edl. Facilities Auth. Rev.: | | | |
| (Medstar Health, Inc. Proj.) Series 2017 A, 5% 5/15/45 | | 550,000 | 602,267 |
| (Univ. of Maryland Med. Sys. Proj.) Series 2008 F, 5.25% 7/1/21 | | 170,000 | 170,136 |
| Series 2010, 5.625% 7/1/30 (Pre-Refunded to 7/1/20 @ 100) | | 580,000 | 612,126 |
| Series 2015, 5% 7/1/24 | | 130,000 | 146,446 |
| Series 2016 A: | | | |
| 4% 7/1/42 | | 295,000 | 291,015 |
| 5% 7/1/35 | | 120,000 | 131,693 |
| Rockville Mayor & Council Econ. Dev. (Rfdg.-Ingleside King Farm Proj.) Series 2017: | | | |
| 2.5% 11/1/24 | | 305,000 | 291,214 |
| 3% 11/1/25 | | 220,000 | 213,365 |
| 5% 11/1/30 | | 80,000 | 85,835 |
|
| TOTAL MARYLAND | | | 6,290,464 |
|
| Massachusetts - 2.0% | | | |
| Massachusetts Dev. Fin. Agcy. Rev.: | | | |
| (Lawrence Gen. Hosp. MA. Proj.) Series 2017: | | | |
| 5% 7/1/29 | | 125,000 | 137,806 |
| 5% 7/1/30 | | 130,000 | 142,619 |
| 5% 7/1/31 | | 140,000 | 152,949 |
| 5% 7/1/32 | | 170,000 | 184,950 |
| 5% 7/1/34 | | 170,000 | 183,666 |
| 5% 7/1/37 | | 170,000 | 181,509 |
| 5% 7/1/42 | | 155,000 | 163,895 |
| (Lawrence Gen. Hosp.) Series 2017, 5% 7/1/47 | | 240,000 | 252,898 |
| (Lesley Univ. Proj.) Series 2016, 5% 7/1/39 | | 285,000 | 316,139 |
| (Partners Healthcare Sys., Inc. Proj.): | | | |
| Series 2017 S: | | | |
| 5% 7/1/30 | | 670,000 | 786,486 |
| 5% 7/1/32 | | 2,470,000 | 2,867,472 |
| 5% 7/1/34 | | 725,000 | 833,018 |
| Series 2017, 4% 7/1/41 | | 1,720,000 | 1,742,068 |
| (Tufts Med. Ctr. Proj.) Series 2011, 6.75% 1/1/36 | | 275,000 | 299,849 |
| (Univ. of Massachusetts Health Cr., Inc. Proj.) Series 2017 L, 4% 7/1/44 | | 170,000 | 169,461 |
| (Wentworth Institute of Technology Proj.) Series 2017: | | | |
| 5% 10/1/27 | | 175,000 | 199,148 |
| 5% 10/1/28 | | 180,000 | 203,643 |
| 5% 10/1/29 | | 190,000 | 214,119 |
| 5% 10/1/31 | | 210,000 | 234,515 |
| 5% 10/1/32 | | 220,000 | 244,728 |
| Series 2016: | | | |
| 5% 10/1/29 | | 170,000 | 198,446 |
| 5% 10/1/30 | | 260,000 | 301,725 |
| 5% 7/1/31 | | 290,000 | 324,745 |
| 5% 10/1/31 | | 280,000 | 323,240 |
| Series 2017, 5% 7/1/27 | | 110,000 | 122,120 |
| Series BB1, 5% 10/1/46 | | 70,000 | 78,172 |
| Massachusetts Edl. Fing. Auth. Rev. Series 2017 B, 4.25% 7/1/46 (d) | | 1,720,000 | 1,743,151 |
| Massachusetts Gen. Oblig.: | | | |
| Series 2016 B, 5% 7/1/31 | | 415,000 | 482,425 |
| Series 2017 A: | | | |
| 5% 4/1/36 | | 365,000 | 419,100 |
| 5% 4/1/42 | | 1,380,000 | 1,560,821 |
| Series 2017 D, 5% 2/1/33 | | 930,000 | 1,079,897 |
| Series 2017 F, 5% 11/1/46 | | 515,000 | 583,660 |
| Series 2018 A, 5% 1/1/36 | | 1,935,000 | 2,244,716 |
| Massachusetts Health & Edl. Facilities Auth. Rev. (Blood Research Institute Proj.) Series A, 6.5% 2/1/22 | | 200,000 | 200,832 |
| Massachusetts Port Auth. Rev.: | | | |
| Series 2016 A: | | | |
| 5% 7/1/33 | | 360,000 | 416,102 |
| 5% 7/1/34 | | 185,000 | 213,153 |
| 5% 7/1/38 | | 270,000 | 307,168 |
| Series 2016 B, 5% 7/1/43 (d) | | 1,480,000 | 1,631,389 |
| Series 2017 A, 5% 7/1/25 (d) | | 310,000 | 358,605 |
|
| TOTAL MASSACHUSETTS | | | 22,100,405 |
|
| Michigan - 2.3% | | | |
| Detroit Downtown Dev. Auth. Tax Series A, 5% 7/1/37 (FSA Insured) | | 405,000 | 430,961 |
| Detroit School District School Bldg. and Site Impt. Series 2012 A, 5% 5/1/23 | | 690,000 | 749,333 |
| Great Lakes Wtr. Auth. Sew Disp. Sys. Series 2018 A: | | | |
| 5% 7/1/43 | | 420,000 | 475,595 |
| 5% 7/1/48 | | 1,815,000 | 2,047,393 |
| Kalamazoo Hosp. Fin. Auth. Hosp. Facilities Rev. Series 2016, 5% 5/15/28 | | 405,000 | 457,310 |
| Lansing Board of Wtr. & Lt. Util. Rev. 5.5% 7/1/41 | | 515,000 | 556,030 |
| Michigan Bldg. Auth. Rev. (Facilities Prog.): | | | |
| Series 2015 I, 5% 4/15/30 | | 860,000 | 988,716 |
| Series 2016 I, 5% 4/15/24 | | 50,000 | 57,214 |
| Michigan Fin. Auth. Rev.: | | | |
| (Charter County of Wayne Criminal Justice Ctr. Proj.) Series 2018, 5% 11/1/43 | | 535,000 | 604,550 |
| (Trinity Health Proj.) Series 2017: | | | |
| 5% 12/1/35 | | 330,000 | 376,002 |
| 5% 12/1/42 | | 445,000 | 497,154 |
| Series 2012 A: | | | |
| 5% 6/1/20 (Escrowed to Maturity) | | 355,000 | 369,789 |
| 5% 6/1/21 (Escrowed to Maturity) | | 60,000 | 64,171 |
| 5% 6/1/27 (Pre-Refunded to 6/1/22 @ 100) | | 600,000 | 659,472 |
| Series 2012, 5% 11/15/42 | | 1,785,000 | 1,901,596 |
| Series 2015 MI, 5% 12/1/24 | | 765,000 | 877,623 |
| Series 2016, 5% 11/15/41 | | 325,000 | 350,145 |
| Series MI, 5.5% 12/1/27 | | 820,000 | 964,336 |
| Michigan Hosp. Fin. Auth. Rev.: | | | |
| (Trinity Health Proj.) Series 2008 C, 5% 12/1/32 | | 255,000 | 294,828 |
| Series 2012 A, 5% 6/1/26 | | 345,000 | 375,384 |
| 6.5% 12/1/33 (Pre-Refunded to 12/1/18 @ 100) | | 35,000 | 35,132 |
| Portage Pub. Schools Series 2016: | | | |
| 5% 11/1/30 | | 490,000 | 565,161 |
| 5% 11/1/31 | | 435,000 | 499,850 |
| 5% 11/1/36 | | 45,000 | 50,816 |
| Univ. of Michigan Rev. Series 2017 A, 5% 4/1/42 | | 4,000,000 | 4,567,760 |
| Wayne County Arpt. Auth. Rev.: | | | |
| Series 2015 F, 5% 12/1/27 (d) | | 1,205,000 | 1,369,687 |
| Series 2015 G, 5% 12/1/28 (d) | | 945,000 | 1,069,712 |
| Series 2017 A: | | | |
| 4% 12/1/33 (FSA Insured) | | 255,000 | 270,295 |
| 4% 12/1/34 (FSA Insured) | | 210,000 | 220,437 |
| 4% 12/1/35 (FSA Insured) | | 205,000 | 215,672 |
| 4% 12/1/36 (FSA Insured) | | 215,000 | 224,841 |
| 5% 12/1/31 | | 65,000 | 74,988 |
| 5% 12/1/32 | | 65,000 | 74,714 |
| 5% 12/1/34 | | 120,000 | 137,630 |
| 5% 12/1/35 | | 110,000 | 125,701 |
| 5% 12/1/37 | | 75,000 | 84,464 |
| Series 2017 B: | | | |
| 5% 12/1/29 (d) | | 105,000 | 120,339 |
| 5% 12/1/30 (d) | | 120,000 | 136,529 |
| 5% 12/1/31 (d) | | 140,000 | 158,588 |
| 5% 12/1/32 (d) | | 90,000 | 101,801 |
| 5% 12/1/32 (d) | | 110,000 | 124,332 |
| 5% 12/1/34 (d) | | 105,000 | 117,991 |
| 5% 12/1/35 (d) | | 110,000 | 123,250 |
| 5% 12/1/37 (d) | | 145,000 | 161,054 |
| 5% 12/1/42 (d) | | 170,000 | 186,505 |
| Series 2018 B, 5% 12/1/48 (d) | | 1,000,000 | 1,100,910 |
| Series 2018 D, 5% 12/1/29 (d) | | 800,000 | 932,544 |
|
| TOTAL MICHIGAN | | | 25,948,305 |
|
| Minnesota - 0.2% | | | |
| Maple Grove Health Care Sys. Rev.: | | | |
| Series 2015, 5% 9/1/29 | | 485,000 | 535,144 |
| Series 2017: | | | |
| 4% 5/1/21 | | 85,000 | 88,412 |
| 5% 5/1/25 | | 140,000 | 160,185 |
| Minnesota Higher Ed. Facilities Auth. Rev. Series 2018 A: | | | |
| 5% 10/1/30 | | 130,000 | 147,701 |
| 5% 10/1/45 | | 285,000 | 309,955 |
| Moorhead Edl. Facilities Rev. (The Concordia College Corp. Proj.) Series 2016, 5% 12/1/25 | | 205,000 | 226,002 |
| Saint Paul Hsg. & Redev. Auth. Hosp. Rev. (HealthEast Care Sys. Proj.) Series 2015 A, 5% 11/15/44 (Pre-Refunded to 11/15/25 @ 100) | | 260,000 | 305,068 |
|
| TOTAL MINNESOTA | | | 1,772,467 |
|
| Missouri - 0.4% | | | |
| Cape Girardeau County Indl. Dev. Auth. (Southeast Hosp. Proj.) Series 2017 A: | | | |
| 5% 3/1/30 | | 120,000 | 132,947 |
| 5% 3/1/31 | | 130,000 | 143,248 |
| 5% 3/1/36 | | 260,000 | 281,135 |
| Kansas City Spl. Oblig.: | | | |
| 5% 9/1/26 | | 205,000 | 208,973 |
| 5% 9/1/27 | | 85,000 | 86,647 |
| 5% 9/1/28 | | 170,000 | 173,295 |
| 5% 9/1/29 | | 170,000 | 173,283 |
| 5% 9/1/30 | | 240,000 | 244,620 |
| Missouri Dev. Fin. Board Infrastructure Facilities Rev. (City of Branson-Branson Landing Proj.) Series 2005 A, 6% 6/1/20 | | 145,000 | 148,977 |
| Missouri Health & Edl. Facilities Auth. Edl. Facilities Rev. Series 2015 B: | | | |
| 3.125% 2/1/27 | | 170,000 | 173,500 |
| 3.25% 2/1/28 | | 170,000 | 174,153 |
| 4% 2/1/40 | | 140,000 | 142,101 |
| 5% 2/1/29 | | 215,000 | 244,337 |
| 5% 2/1/31 | | 445,000 | 500,585 |
| 5% 2/1/33 | | 495,000 | 554,316 |
| 5% 2/1/36 | | 465,000 | 515,736 |
| Saint Louis County Indl. Dev. Auth. Sr. Living Facilities Rev. Series 2018 A: | | | |
| 5% 9/1/38 | | 315,000 | 315,936 |
| 5.125% 9/1/48 | | 560,000 | 560,594 |
|
| TOTAL MISSOURI | | | 4,774,383 |
|
| Nebraska - 0.3% | | | |
| Douglas County Neb Edl. Facilities Rev. (Creighton Univ. Proj.) Series 2017: | | | |
| 4% 7/1/34 | | 170,000 | 182,663 |
| 5% 7/1/36 | | 120,000 | 136,721 |
| Nebraska Pub. Pwr. District Rev. Series 2016 B: | | | |
| 5% 1/1/37 | | 425,000 | 477,700 |
| 5% 1/1/40 | | 195,000 | 217,228 |
| Omaha Arpt. Auth. Arpt. Rev.: | | | |
| Series 2017 A: | | | |
| 5% 12/15/22 (d) | | 130,000 | 143,697 |
| 5% 12/15/23 (d) | | 130,000 | 146,267 |
| 5% 12/15/25 (d) | | 70,000 | 80,858 |
| 5% 12/15/26 (d) | | 250,000 | 292,058 |
| 5% 12/15/27 (d) | | 170,000 | 197,540 |
| 5% 12/15/30 (d) | | 260,000 | 297,125 |
| 5% 12/15/31 (d) | | 135,000 | 153,866 |
| 5% 12/15/33 (d) | | 140,000 | 158,929 |
| 5% 12/15/35 (d) | | 345,000 | 389,571 |
| 5% 12/15/36 (d) | | 85,000 | 95,663 |
| Series 2017 C, 5% 12/15/21 (d) | | 70,000 | 75,755 |
|
| TOTAL NEBRASKA | | | 3,045,641 |
|
| Nevada - 0.4% | | | |
| Clark County Arpt. Rev. (Sub Lien Proj.) Series 2017 A-1, 5% 7/1/21 (d) | | 1,200,000 | 1,280,520 |
| Clark County McCarran Int'l. Arpt. Passenger Facility Charge Rev. (Clark County Arpt. Rev. Proj.) Series 2017 B: | | | |
| 5% 7/1/20 (d) | | 335,000 | 349,016 |
| 5% 7/1/22 (d) | | 385,000 | 419,169 |
| 5% 7/1/23 (d) | | 690,000 | 763,520 |
| Las Vegas Valley Wtr. District Wtr. Impt. Gen. Oblig.: | | | |
| Series 2011 C, 5% 6/1/24 | | 930,000 | 994,654 |
| Series 2016 B, 5% 6/1/36 | | 780,000 | 887,952 |
|
| TOTAL NEVADA | | | 4,694,831 |
|
| New Hampshire - 1.6% | | | |
| New Hampshire Health & Ed. Facilities Auth.: | | | |
| (Concord Hosp.) Series 2017, 5% 10/1/42 | | 515,000 | 567,025 |
| (Dartmouth-Hitchcock Oblgtd Grp Proj.) Series 2018 A: | | | |
| 5% 8/1/28 | | 85,000 | 99,822 |
| 5% 8/1/30 | | 170,000 | 197,280 |
| (Dartmouth-Hitchcock Oblgtd Grp Proj.) Series 2018 A, 5% 8/1/29 | | 145,000 | 169,147 |
| (Partners Healthcare Sys., Inc. Proj.): | | | |
| Series 2017: | | | |
| 5% 7/1/29 | | 735,000 | 869,196 |
| 5% 7/1/34 | | 920,000 | 1,056,289 |
| Series 2017: | | | |
| 5% 7/1/28 | | 695,000 | 826,167 |
| 5% 7/1/30 | | 440,000 | 516,498 |
| 5% 7/1/31 | | 990,000 | 1,155,261 |
| 5% 7/1/32 | | 660,000 | 766,207 |
| 5% 7/1/33 | | 600,000 | 692,958 |
| 5% 7/1/35 | | 965,000 | 1,103,072 |
| 5% 7/1/36 | | 1,015,000 | 1,153,416 |
| 5% 7/1/37 | | 890,000 | 1,006,181 |
| Series 2017 B, 4.125% 7/1/24 (e) | | 365,000 | 365,664 |
| Series 2017 C, 3.5% 7/1/22 (e) | | 115,000 | 115,016 |
| New Hampshire Health & Ed. Facilities Auth. Rev.: | | | |
| (Covenant Health Sys., Inc. Proj.) Series 2012, 5% 7/1/42 | | 65,000 | 67,315 |
| Series 2012: | | | |
| 4% 7/1/32 | | 475,000 | 486,519 |
| 5% 7/1/24 | | 170,000 | 184,850 |
| 5% 7/1/25 | | 205,000 | 222,405 |
| 5% 7/1/27 | | 85,000 | 91,595 |
| Series 2016: | | | |
| 3% 10/1/20 | | 95,000 | 96,129 |
| 4% 10/1/38 | | 415,000 | 407,194 |
| 5% 10/1/22 | | 185,000 | 200,118 |
| 5% 10/1/24 | | 365,000 | 406,092 |
| 5% 10/1/25 | | 360,000 | 404,352 |
| 5% 10/1/29 | | 1,150,000 | 1,278,432 |
| 5% 10/1/31 | | 895,000 | 986,612 |
| 5% 10/1/33 | | 695,000 | 760,705 |
| 5% 10/1/38 | | 1,285,000 | 1,380,398 |
| New Hampshire Tpk. Sys. Rev. Series 2012 B, 5% 2/1/24 | | 305,000 | 330,559 |
|
| TOTAL NEW HAMPSHIRE | | | 17,962,474 |
|
| New Jersey - 5.9% | | | |
| Atlantic County Impt. Auth. (Atlantic City Campus Proj.) Series 2016 A: | | | |
| 5% 7/1/28 (FSA Insured) | | 180,000 | 206,341 |
| 5% 7/1/30 (FSA Insured) | | 435,000 | 494,882 |
| 5% 7/1/32 (FSA Insured) | | 215,000 | 243,053 |
| 5% 7/1/33 (FSA Insured) | | 225,000 | 253,555 |
| New Jersey Econ. Dev. Auth. Rev.: | | | |
| (New Jersey Gen. Oblig. Proj.): | | | |
| Series 2015 XX, 5% 6/15/25 | | 2,265,000 | 2,510,617 |
| Series 2017 B: | | | |
| 5% 11/1/23 | | 3,100,000 | 3,394,128 |
| 5% 11/1/24 | | 1,205,000 | 1,330,224 |
| Series 2009 AA, 5.5% 12/15/29 | | 285,000 | 289,016 |
| Series 2013 NN: | | | |
| 5% 3/1/27 | | 13,685,000 | 14,631,403 |
| 5% 3/1/29 | | 430,000 | 456,639 |
| Series 2013: | | | |
| 5% 3/1/23 | | 3,420,000 | 3,709,264 |
| 5% 3/1/24 | | 3,100,000 | 3,350,821 |
| 5% 3/1/25 | | 380,000 | 409,351 |
| Series 2015 XX: | | | |
| 5% 6/15/22 | | 565,000 | 607,138 |
| 5% 6/15/23 | | 860,000 | 937,125 |
| 5.25% 6/15/27 | | 2,925,000 | 3,250,289 |
| Series 2016 AAA: | | | |
| 5.5% 6/15/31 | | 345,000 | 387,932 |
| 5.5% 6/15/32 | | 860,000 | 962,615 |
| Series 2016 BBB: | | | |
| 5% 6/15/21 | | 690,000 | 729,220 |
| 5% 6/15/22 | | 1,115,000 | 1,198,157 |
| 5% 6/15/23 | | 1,790,000 | 1,950,527 |
| New Jersey Econ. Dev. Auth. Spl. Facilities Rev. (Port Newark Container Term. LLC. Proj.) Series 2017: | | | |
| 5% 10/1/21 (d) | | 260,000 | 276,487 |
| 5% 10/1/22 (d) | | 165,000 | 178,179 |
| 5% 10/1/23 (d) | | 260,000 | 284,268 |
| 5% 10/1/37 (d) | | 955,000 | 1,017,572 |
| 5% 10/1/47 (d) | | 1,550,000 | 1,629,438 |
| New Jersey Edl. Facility Series 2016 A: | | | |
| 5% 7/1/31 | | 360,000 | 399,586 |
| 5% 7/1/32 | | 415,000 | 459,181 |
| New Jersey Health Care Facilities Fing. Auth. Rev.: | | | |
| Series 2016 A: | | | |
| 5% 7/1/20 | | 85,000 | 88,301 |
| 5% 7/1/21 | | 60,000 | 63,830 |
| 5% 7/1/22 | | 60,000 | 65,220 |
| 5% 7/1/23 | | 200,000 | 221,130 |
| 5% 7/1/24 | | 330,000 | 369,590 |
| 5% 7/1/25 | | 345,000 | 390,661 |
| 5% 7/1/26 | | 190,000 | 216,703 |
| 5% 7/1/26 | | 60,000 | 68,432 |
| 5% 7/1/27 | | 85,000 | 96,518 |
| 5% 7/1/27 | | 130,000 | 152,279 |
| 5% 7/1/28 | | 65,000 | 75,609 |
| 5% 7/1/29 | | 120,000 | 134,802 |
| 5% 7/1/29 | | 85,000 | 95,485 |
| 5% 7/1/30 | | 145,000 | 161,861 |
| 5% 7/1/30 | | 170,000 | 195,374 |
| Series 2016: | | | |
| 4% 7/1/48 | | 500,000 | 484,000 |
| 5% 7/1/41 | | 625,000 | 664,294 |
| New Jersey Higher Ed. Student Assistance Auth. Student Ln. Rev.: | | | |
| Series 2017 1A: | | | |
| 5% 12/1/22 (d) | | 210,000 | 228,379 |
| 5% 12/1/23 (d) | | 350,000 | 386,617 |
| 5% 12/1/26 (d) | | 170,000 | 194,167 |
| Series 2017 1B, 5% 12/1/21 (d) | | 220,000 | 235,090 |
| Series 2018 B: | | | |
| 5% 12/1/25 (d) | | 725,000 | 821,164 |
| 5% 12/1/26 (d) | | 215,000 | 245,564 |
| Series 2018 C, 4% 12/1/48 (d) | | 380,000 | 369,637 |
| New Jersey Trans. Trust Fund Auth.: | | | |
| Series 2001 A, 6% 6/15/35 | | 670,000 | 717,128 |
| Series 2005 B, 5.25% 12/15/22 (AMBAC Insured) | | 70,000 | 76,810 |
| Series 2010 D, 5.25% 12/15/23 | | 1,085,000 | 1,202,299 |
| Series 2014 AA: | | | |
| 5% 6/15/23 | | 4,455,000 | 4,854,524 |
| 5% 6/15/24 | | 1,720,000 | 1,890,830 |
| Series 2016 A: | | | |
| 5% 6/15/27 | | 465,000 | 521,391 |
| 5% 6/15/28 | | 1,905,000 | 2,122,646 |
| 5% 6/15/29 | | 385,000 | 427,373 |
| Series 2016 A-2, 5% 6/15/23 | | 925,000 | 1,013,227 |
| South Jersey Port Corp. Rev.: | | | |
| (New Jersey Gen. Oblig. Proj.) Series 2017 B: | | | |
| 5% 1/1/42 (d) | | 515,000 | 550,370 |
| 5% 1/1/48 (d) | | 345,000 | 366,825 |
| (New Jersey Gen. Oblig. Proj.) Series 2017 B, 5% 1/1/37 (d) | | 170,000 | 184,205 |
|
| TOTAL NEW JERSEY | | | 65,499,343 |
|
| New York - 4.8% | | | |
| Dorm. Auth. New York Univ. Rev.: | | | |
| (Fordham Univ. Proj.) Series 2017: | | | |
| 4% 7/1/33 | | 215,000 | 227,704 |
| 4% 7/1/34 | | 215,000 | 226,395 |
| Series 2017 4% 12/1/20 (e) | | 200,000 | 205,636 |
| Series 2017: | | | |
| 4% 12/1/21 (e) | | 200,000 | 208,026 |
| 5% 12/1/22 (e) | | 300,000 | 326,487 |
| 5% 12/1/23 (e) | | 200,000 | 221,214 |
| 5% 12/1/24 (e) | | 200,000 | 224,508 |
| 5% 12/1/25 (e) | | 200,000 | 227,066 |
| Hudson Yards Infrastructure Corp. New York Rev.: | | | |
| Series 2012 A: | | | |
| 5.75% 2/15/47 | | 1,135,000 | 1,216,391 |
| 5.75% 2/15/47 (Pre-Refunded to 2/15/21 @ 100) | | 50,000 | 54,126 |
| Series 2017 A, 5% 2/15/42 | | 5,000,000 | 5,627,300 |
| Long Island Pwr. Auth. Elec. Sys. Rev. Series 2012 A, 5% 9/1/42 | | 2,240,000 | 2,415,930 |
| MTA Hudson Rail Yards Trust Oblig. Series 2016 A, 5% 11/15/56 | | 4,420,000 | 4,695,852 |
| New York City Gen. Oblig.: | | | |
| Series 2009, 5.625% 4/1/29 | | 25,000 | 25,226 |
| Series 2012 A1, 5% 8/1/24 | | 1,275,000 | 1,368,623 |
| Series 2012 E, 5% 8/1/24 | | 860,000 | 935,551 |
| Series 2015 C, 5% 8/1/27 | | 120,000 | 138,204 |
| Series 2016 C and D, 5% 8/1/28 | | 450,000 | 522,873 |
| Series 2016 E, 5% 8/1/28 | | 755,000 | 885,117 |
| New York City Indl. Dev. Agcy. Rev.: | | | |
| (Queens Baseball Stadium Proj.) 5% 1/1/19 (AMBAC Insured) | | 645,000 | 645,000 |
| (Yankee Stadium Proj.) Series 2006, 5% 3/1/31 | | 815,000 | 820,917 |
| New York City Muni. Wtr. Fin. Auth. Wtr. & Swr. Sys. Rev.: | | | |
| Series 2011 EE, 5.375% 6/15/43 | | 3,640,000 | 3,861,530 |
| Series 2012 EE, 5.25% 6/15/30 | | 1,240,000 | 1,372,382 |
| Series 2013 2, 5% 6/15/47 | | 365,000 | 396,302 |
| Series 2013 BB, 5% 6/15/47 | | 1,545,000 | 1,695,498 |
| New York City Transitional Fin. Auth. Bldg. Aid Rev.: | | | |
| Series 2015 S1, 5% 7/15/43 | | 860,000 | 945,802 |
| Series 2015 S2, 5% 7/15/35 | | 305,000 | 342,677 |
| New York City Transitional Fin. Auth. Rev. Series 2018 A2, 5% 8/1/39 | | 2,000,000 | 2,276,180 |
| New York Dorm. Auth. Mental Health Svcs. Facilities Impt. Rev. Series 2012 A, 5% 5/15/23 | | 965,000 | 1,059,445 |
| New York Dorm. Auth. Revs. Series 2010 A, 5% 7/1/26 | | 690,000 | 719,498 |
| New York Dorm. Auth. Sales Tax Rev. Series 2016 A, 5% 3/15/34 | | 1,170,000 | 1,340,153 |
| New York Metropolitan Trans. Auth. Rev.: | | | |
| Series 2012 D, 5% 11/15/25 | | 5,250,000 | 5,732,738 |
| Series 2012 F, 5% 11/15/24 | | 2,135,000 | 2,339,576 |
| Series 2014 B, 5% 11/15/44 | | 1,720,000 | 1,853,025 |
| Series 2015 A1, 5% 11/15/45 | | 1,280,000 | 1,386,394 |
| New York State Dorm. Auth.: | | | |
| Series 2017 A, 5% 2/15/31 | | 2,000,000 | 2,330,040 |
| Series A: | | | |
| 5% 2/15/34 | | 10,000 | 10,039 |
| 5% 2/15/39 | | 40,000 | 40,157 |
| New York Trans. Dev. Corp. (Laguardia Arpt. Term. Redev. Proj.) Series 2016 A, 5% 7/1/41 (d) | | 740,000 | 779,908 |
| New York Urban Dev. Corp. Rev.: | | | |
| (New York State Gen. Oblig. Proj.) Series 2017 A, 5% 3/15/34 | | 1,085,000 | 1,248,466 |
| Gen. Oblig. (New York State Gen. Oblig. Proj.) Series 2017 A, 5% 3/15/32 | | 930,000 | 1,078,940 |
| Onondaga Civic Dev. Corp. (Le Moyne College Proj.) Series 2018, 5% 1/1/43 | | 170,000 | 183,804 |
| Rockland County Gen. Oblig. Series 2014 A: | | | |
| 4% 3/1/23 (FSA Insured) | | 195,000 | 209,524 |
| 4% 3/1/24 (FSA Insured) | | 235,000 | 255,285 |
| Triborough Bridge & Tunnel Auth. Revs. Series 2015 A, 5.25% 11/15/45 | | 860,000 | 985,835 |
|
| TOTAL NEW YORK | | | 53,661,344 |
|
| North Carolina - 0.6% | | | |
| Charlotte Int'l. Arpt. Rev.: | | | |
| Series 2017 A: | | | |
| 5% 7/1/30 | | 265,000 | 313,196 |
| 5% 7/1/33 | | 215,000 | 251,423 |
| 5% 7/1/37 | | 605,000 | 696,119 |
| Series 2017 B: | | | |
| 5% 7/1/20 (d) | | 35,000 | 36,512 |
| 5% 7/1/21 (d) | | 35,000 | 37,445 |
| 5% 7/1/22 (d) | | 25,000 | 27,342 |
| 5% 7/1/23 (d) | | 30,000 | 33,467 |
| 5% 7/1/24 (d) | | 35,000 | 39,716 |
| 5% 7/1/25 (d) | | 15,000 | 17,264 |
| 5% 7/1/26 (d) | | 15,000 | 17,481 |
| 5% 7/1/27 (d) | | 35,000 | 41,249 |
| 5% 7/1/28 (d) | | 30,000 | 35,157 |
| 5% 7/1/29 (d) | | 40,000 | 46,644 |
| 5% 7/1/30 (d) | | 45,000 | 52,180 |
| 5% 7/1/31 (d) | | 85,000 | 98,285 |
| 5% 7/1/32 (d) | | 85,000 | 97,940 |
| 5% 7/1/33 (d) | | 90,000 | 103,336 |
| 5% 7/1/34 (d) | | 95,000 | 108,618 |
| 5% 7/1/35 (d) | | 65,000 | 74,057 |
| 5% 7/1/36 (d) | | 55,000 | 62,400 |
| 5% 7/1/37 (d) | | 65,000 | 73,487 |
| 5% 7/1/42 (d) | | 205,000 | 229,184 |
| Series 2017 C, 4% 7/1/32 | | 250,000 | 269,988 |
| Nash Health Care Sys. Health Care Facilities Rev.: | | | |
| Series 2012, 5% 11/1/41 | | 935,000 | 982,554 |
| 5% 11/1/30 (FSA Insured) | | 220,000 | 220,444 |
| North Carolina Med. Care Cmnty. Health: | | | |
| Series 2012 A, 5% 11/15/26 | | 225,000 | 242,519 |
| Series 2017, 5% 10/1/31 | | 295,000 | 304,039 |
| North Carolina Med. Care Commission Health Care Facilities Rev. (Rex Healthcare Proj.) Series 2010 A, 5% 7/1/30 | | 1,625,000 | 1,685,921 |
| North Carolina Muni. Pwr. Agcy. #1 Catawba Elec. Rev. Series 2009 A, 5% 1/1/30 | | 165,000 | 165,371 |
|
| TOTAL NORTH CAROLINA | | | 6,363,338 |
|
| North Dakota - 0.1% | | | |
| Cass County Health Care Facilities Rev. (Essentia Health Obligated Group Proj.) Series 2008, 5.125% 2/15/37 (Assured Guaranty Corp. Insured) | | 920,000 | 947,646 |
| McLean County Solid Waste Facilities Rev. (Great River Energy Projs.) Series 2010 B, 5.15% 7/1/40 | | 395,000 | 408,434 |
|
| TOTAL NORTH DAKOTA | | | 1,356,080 |
|
| Ohio - 2.1% | | | |
| Akron Bath Copley Hosp. District Rev. Series 2016, 5.25% 11/15/46 | | 1,515,000 | 1,654,486 |
| Allen County Hosp. Facilities Rev.: | | | |
| (Mercy Health) Series 2017 A: | | | |
| 5% 8/1/25 | | 515,000 | 590,283 |
| 5% 8/1/26 | | 345,000 | 399,810 |
| 5% 8/1/27 | | 430,000 | 502,756 |
| 5% 8/1/28 | | 430,000 | 502,730 |
| 5% 8/1/29 | | 860,000 | 999,492 |
| 5% 8/1/30 | | 730,000 | 843,997 |
| Bonds (Mercy Health) Series 2017 B, 5%, tender 5/5/22 (a) | | 630,000 | 689,239 |
| American Muni. Pwr., Inc. Rev.: | | | |
| (Greenup Hydroelectric Proj.) Series 2016, 5% 2/15/46 | | 2,115,000 | 2,320,240 |
| (Prairie State Energy Campus Proj.) Series 2015, 5% 2/15/28 | | 2,425,000 | 2,703,317 |
| Series 2012 B: | | | |
| 5% 2/15/42 | | 335,000 | 355,810 |
| 5% 2/15/42 (Pre-Refunded to 2/15/22 @ 100) | | 95,000 | 103,689 |
| Chillicothe Hosp. Facilities Rev. (Adena Health Sys. Oblig. Group Proj.) Series 2017, 5% 12/1/47 | | 1,000,000 | 1,077,420 |
| Columbus City School District 5% 12/1/29 | | 360,000 | 419,738 |
| Franklin County Hosp. Facilities Rev. (Ohiohealth Corp. Proj.) Series 2015, 5% 5/15/40 | | 1,150,000 | 1,255,179 |
| Hamilton County Convention Facilities Auth. Rev. Series 2014: | | | |
| 5% 12/1/25 | | 620,000 | 687,270 |
| 5% 12/1/26 | | 115,000 | 127,254 |
| Lake County Hosp. Facilities Rev.: | | | |
| Series 2015: | | | |
| 5% 8/15/29 | | 240,000 | 267,689 |
| 5% 8/15/30 | | 260,000 | 288,681 |
| 5.75% 8/15/38 | | 30,000 | 30,087 |
| 6% 8/15/43 | | 140,000 | 140,434 |
| Muskingum County Hosp. Facilities (Genesis Healthcare Sys. Obligated Group Proj.) Series 2013: | | | |
| 5% 2/15/33 | | 765,000 | 792,272 |
| 5% 2/15/44 | | 915,000 | 934,041 |
| 5% 2/15/48 | | 2,340,000 | 2,381,652 |
| Ohio Higher Edl. Facility Commission Rev. (Univ. of Dayton Proj.) Series 2018 B, 5% 12/1/36 | | 1,175,000 | 1,337,479 |
| Ohio Tpk. Commission Tpk. Rev. (Infrastructure Proj.) Series 2005 A, 0% 2/15/42 | | 450,000 | 179,321 |
| Scioto County Hosp. Facilities Rev. Series 2016: | | | |
| 5% 2/15/29 | | 380,000 | 430,707 |
| 5% 2/15/34 | | 75,000 | 82,876 |
| Univ. of Akron Gen. Receipts Series 2016 A, 5% 1/1/35 | | 775,000 | 871,697 |
| Wood County Hosp. Facilities Rev. (Wood County Hosp. Assoc. Proj.) Series 2012: | | | |
| 5% 12/1/32 | | 130,000 | 135,664 |
| 5% 12/1/42 | | 170,000 | 174,728 |
|
| TOTAL OHIO | | | 23,280,038 |
|
| Oklahoma - 0.3% | | | |
| Canadian Cny Edl. Facilities Auth. (Mustang Pub. Schools Proj.) Series 2017: | | | |
| 5% 9/1/26 | | 480,000 | 561,355 |
| 5% 9/1/28 | | 250,000 | 288,238 |
| Oklahoma City Pub. Property Auth. Hotel Tax Rev. Series 2015: | | | |
| 5% 10/1/28 | | 220,000 | 253,785 |
| 5% 10/1/29 | | 240,000 | 275,892 |
| 5% 10/1/36 | | 170,000 | 192,165 |
| 5% 10/1/39 | | 345,000 | 388,629 |
| Oklahoma Dev. Fin. Auth. Health Sys. Rev. (OU Medicine Proj.) Series 2018 B: | | | |
| 5% 8/15/22 | | 85,000 | 91,843 |
| 5% 8/15/23 | | 45,000 | 49,340 |
| 5% 8/15/33 | | 190,000 | 209,988 |
| 5% 8/15/38 | | 550,000 | 589,441 |
| Oklahoma Pwr. Auth. Pwr. Supply Sys. Rev. Series 2014 A, 5% 1/1/38 | | 225,000 | 252,934 |
|
| TOTAL OKLAHOMA | | | 3,153,610 |
|
| Oregon - 0.0% | | | |
| Clackamas County Hosp. Facility Auth. (Willamette View Proj.) Series 2017 B, 3% 11/15/22 | | 140,000 | 140,092 |
| Oregon Facilities Auth. Rev. (Legacy Health Sys. Proj.) Series 2009 A, 5% 3/15/30 | | 170,000 | 175,171 |
| Oregon State Dept. of Administrative Svcs. Lottery Rev. Series 2011 A, 5.25% 4/1/31 | | 135,000 | 144,364 |
|
| TOTAL OREGON | | | 459,627 |
|
| Pennsylvania - 6.2% | | | |
| Allegheny County Hosp. Dev. Auth. Rev. (Univ. of Pittsburgh Med. Ctr. Proj.) Series 2009 A, 5.625% 8/15/39 | | 1,260,000 | 1,284,532 |
| Cap. Region Wtr. Wtr. Rev. Series 2018: | | | |
| 5% 7/15/27 | | 170,000 | 199,764 |
| 5% 7/15/29 | | 270,000 | 317,420 |
| 5% 7/15/32 | | 170,000 | 196,634 |
| Centre County Pennsylvania Hosp. Auth. Rev. (Mount Nittany Med. Ctr. Proj.): | | | |
| Series 2011, 7% 11/15/46 (Pre-Refunded to 11/15/21 @ 100) | | 535,000 | 609,312 |
| Series 2018 A, 5% 11/15/23 | | 225,000 | 251,273 |
| Dauphin County Gen. Auth. (Pinnacle Health Sys. Proj.) Series 2016 A: | | | |
| 5% 6/1/21 | | 60,000 | 63,981 |
| 5% 6/1/23 | | 85,000 | 94,535 |
| 5% 6/1/28 | | 185,000 | 212,199 |
| 5% 6/1/29 | | 200,000 | 228,396 |
| Delaware County Auth. Rev. (Cabrini College) Series 2017, 5% 7/1/47 | | 690,000 | 726,577 |
| Doylestown Hosp. Auth. Hosp. Rev. Series 2016 A, 5% 7/1/46 | | 250,000 | 258,680 |
| Dubois Hosp. Auth. Hosp. Rev. (Penn Highlands Healthcare Proj.) Series 2018: | | | |
| 4% 7/15/33 | | 430,000 | 443,158 |
| 4% 7/15/35 | | 445,000 | 454,826 |
| 4% 7/15/37 | | 860,000 | 869,099 |
| 5% 7/15/25 | | 70,000 | 80,261 |
| 5% 7/15/26 | | 215,000 | 248,660 |
| 5% 7/15/27 | | 365,000 | 424,970 |
| 5% 7/15/28 | | 270,000 | 314,075 |
| 5% 7/15/29 | | 285,000 | 329,808 |
| 5% 7/15/30 | | 380,000 | 436,825 |
| 5% 7/15/31 | | 260,000 | 297,778 |
| 5% 7/15/32 | | 270,000 | 307,862 |
| 5% 7/15/34 | | 295,000 | 334,141 |
| 5% 7/15/36 | | 865,000 | 971,144 |
| 5% 7/15/38 | | 1,035,000 | 1,145,880 |
| 5% 7/15/43 | | 1,205,000 | 1,323,367 |
| Lehigh County Gen. Purp. Auth. Rev. (Muhlenberg College Proj.) Series 2017, 5% 2/1/39 | | 445,000 | 496,242 |
| Lehigh County Indl. Dev. Auth. Poll. Cont. Rev. Bonds (PPL Elec. Utils. Corp. Proj.) Series 2016 A, 1.8%, tender 9/1/22 (a) | | 860,000 | 833,177 |
| Monroe County Hosp. Auth. Rev. Series 2016: | | | |
| 5% 7/1/26 | | 170,000 | 194,631 |
| 5% 7/1/27 | | 170,000 | 194,878 |
| 5% 7/1/28 | | 170,000 | 193,892 |
| 5% 7/1/34 | | 635,000 | 708,387 |
| 5% 7/1/36 | | 345,000 | 382,453 |
| Montgomery County Higher Ed. & Health Auth. Hosp. Rev. (Abington Memorial Hosp. Proj.): | | | |
| Series 1993 A, 6% 6/1/22 (AMBAC Insured) | | 345,000 | 379,983 |
| Series 2012 A, 5% 6/1/27 (Pre-Refunded to 6/1/22 @ 100) | | 705,000 | 773,660 |
| Montgomery County Higher Ed. & Health Auth. Rev.: | | | |
| Series 2014 A: | | | |
| 5% 10/1/21 | | 225,000 | 238,408 |
| 5% 10/1/22 | | 240,000 | 258,814 |
| 5% 10/1/23 | | 70,000 | 76,599 |
| 5% 10/1/24 | | 200,000 | 221,956 |
| 5% 10/1/25 | | 180,000 | 198,959 |
| 5% 10/1/27 | | 85,000 | 93,060 |
| Series 2016 A: | | | |
| 5% 10/1/28 | | 260,000 | 293,387 |
| 5% 10/1/29 | | 450,000 | 505,809 |
| 5% 10/1/31 | | 785,000 | 873,807 |
| 5% 10/1/36 | | 1,410,000 | 1,535,349 |
| 5% 10/1/40 | | 690,000 | 740,273 |
| Northampton County Gen. Purp. Auth. Hosp. Rev.: | | | |
| (St Lukes Hosp. & Health Ntw Proj.) Series 2016 A, 5% 8/15/36 | | 130,000 | 144,126 |
| (St. Luke's Univ. Health Network Proj.) Series 2018 A, 4% 8/15/48 | | 2,190,000 | 2,196,877 |
| Series 2016 A, 5% 8/15/46 | | 5,165,000 | 5,639,199 |
| Pennsylvania Econ. Dev. Fin. Auth. Unemployment Compensation Rev. Series 2012 B, 5% 7/1/21 | | 165,000 | 165,000 |
| Pennsylvania Higher Edl. Facilities Auth. Rev.: | | | |
| (Drexel Univ. Proj.): | | | |
| Series 2016, 5% 5/1/35 | | 600,000 | 666,708 |
| Series 2017: | | | |
| 5% 5/1/35 | | 215,000 | 243,135 |
| 5% 5/1/37 | | 270,000 | 302,038 |
| 5% 5/1/41 | | 1,220,000 | 1,349,100 |
| Series 2016: | | | |
| 5% 5/1/28 | | 85,000 | 97,490 |
| 5% 5/1/32 | | 215,000 | 241,735 |
| 5% 5/1/33 | | 295,000 | 330,657 |
| Series 2018 A, 5% 2/15/48 | | 325,000 | 373,425 |
| Philadelphia Arpt. Rev.: | | | |
| Series 2017 A: | | | |
| 5% 7/1/25 | | 170,000 | 197,098 |
| 5% 7/1/26 | | 170,000 | 199,135 |
| 5% 7/1/27 | | 140,000 | 165,462 |
| Series 2017 B: | | | |
| 5% 7/1/22 (d) | | 380,000 | 413,592 |
| 5% 7/1/22 | | 50,000 | 54,843 |
| 5% 7/1/23 (d) | | 260,000 | 288,171 |
| 5% 7/1/23 | | 85,000 | 95,170 |
| 5% 7/1/25 (d) | | 600,000 | 685,926 |
| 5% 7/1/26 (d) | | 515,000 | 593,749 |
| 5% 7/1/27 (d) | | 430,000 | 499,312 |
| 5% 7/1/28 (d) | | 515,000 | 594,233 |
| 5% 7/1/29 (d) | | 385,000 | 441,737 |
| 5% 7/1/32 (d) | | 515,000 | 582,656 |
| 5% 7/1/33 (d) | | 385,000 | 434,053 |
| 5% 7/1/34 (d) | | 690,000 | 775,187 |
| 5% 7/1/37 (d) | | 775,000 | 861,591 |
| 5% 7/1/42 (d) | | 2,325,000 | 2,556,035 |
| 5% 7/1/47 (d) | | 3,270,000 | 3,584,934 |
| Philadelphia Gas Works Rev. Series 9, 5.25% 8/1/40 | | 480,000 | 500,669 |
| Philadelphia School District: | | | |
| Series 2016 D: | | | |
| 5% 9/1/25 | | 1,515,000 | 1,720,146 |
| 5% 9/1/26 | | 1,580,000 | 1,808,752 |
| 5% 9/1/27 | | 1,670,000 | 1,905,620 |
| 5% 9/1/28 | | 1,395,000 | 1,583,618 |
| Series 2016 F: | | | |
| 5% 9/1/28 | | 2,410,000 | 2,735,856 |
| 5% 9/1/29 | | 1,565,000 | 1,770,891 |
| Series 2018 A: | | | |
| 5% 9/1/36 | | 325,000 | 361,836 |
| 5% 9/1/37 | | 190,000 | 210,552 |
| 5% 9/1/38 | | 300,000 | 330,912 |
| Series 2018 B, 5% 9/1/43 | | 440,000 | 479,367 |
| Series F, 5% 9/1/30 | | 1,170,000 | 1,316,262 |
| Philadelphia Wtr. & Wastewtr. Rev. Series 2018 A, 5% 10/1/34 | | 3,590,000 | 4,153,163 |
| Scranton-Lackawanna Health & Welfare Auth. Rev. (Marywood Univ. Proj.) Series 2016, 5% 6/1/36 | | 690,000 | 695,920 |
| State Pub. School Bldg. Auth. Lease Rev. (Philadelphia School District Proj.) Series 2015 A, 5% 6/1/26 | | 220,000 | 247,806 |
| Union County Hosp. Auth. Rev. Series 2018 B: | | | |
| 5% 8/1/43 | | 960,000 | 1,059,648 |
| 5% 8/1/48 | | 1,110,000 | 1,221,766 |
|
| TOTAL PENNSYLVANIA | | | 68,494,039 |
|
| Rhode Island - 0.3% | | | |
| Rhode Island Health & Edl. Bldg. Corp. Higher Ed. Facilities Rev.: | | | |
| Series 2016 B: | | | |
| 5% 9/1/31 | | 135,000 | 144,931 |
| 5% 9/1/36 | | 1,210,000 | 1,274,408 |
| Series 2016, 5% 5/15/39 | | 1,085,000 | 1,168,654 |
| Rhode Island Student Ln. Auth. Student Ln. Rev. Series A, 3.5% 12/1/34 (d) | | 635,000 | 638,480 |
|
| TOTAL RHODE ISLAND | | | 3,226,473 |
|
| South Carolina - 3.3% | | | |
| Scago Edl. Facilities Corp. for Colleton School District (School District of Colleton County Proj.) Series 2015: | | | |
| 5% 12/1/25 | | 470,000 | 536,801 |
| 5% 12/1/26 | | 240,000 | 272,746 |
| 5% 12/1/28 | | 975,000 | 1,101,896 |
| South Carolina Jobs-Econ. Dev. Auth. Econ. Dev. Rev.: | | | |
| (Bon Secours Health Sys. Proj.) Series 2013, 5% 11/1/28 (Pre-Refunded to 11/1/22 @ 100) | | 550,000 | 608,141 |
| Series 2013, 5% 11/1/27 (Pre-Refunded to 11/1/22 @ 100) | | 1,565,000 | 1,730,436 |
| South Carolina Ports Auth. Ports Rev.: | | | |
| Series 2015 (AMT), 5% 7/1/45 (d) | | 900,000 | 972,927 |
| Series 2015, 5.25% 7/1/55 (d) | | 1,095,000 | 1,185,622 |
| South Carolina Pub. Svc. Auth. Rev.: | | | |
| Series 2013 E, 5.5% 12/1/53 | | 6,965,000 | 7,416,820 |
| Series 2014 A: | | | |
| 5% 12/1/49 | | 2,330,000 | 2,427,324 |
| 5.5% 12/1/54 | | 2,700,000 | 2,885,733 |
| Series 2014 C, 5% 12/1/46 | | 810,000 | 847,892 |
| Series 2015 A, 5% 12/1/50 | | 1,075,000 | 1,125,934 |
| Series 2015 C, 5% 12/1/22 | | 1,455,000 | 1,589,704 |
| Series 2015 E, 5.25% 12/1/55 | | 1,290,000 | 1,376,056 |
| Series 2016 A: | | | |
| 5% 12/1/29 | | 515,000 | 572,484 |
| 5% 12/1/38 | | 50,000 | 53,776 |
| Series 2016 B: | | | |
| 5% 12/1/31 | | 190,000 | 210,370 |
| 5% 12/1/41 | | 2,600,000 | 2,782,026 |
| Spartanburg County Reg'l. Health Series 2017 A: | | | |
| 4% 4/15/43 | | 3,225,000 | 3,227,322 |
| 4% 4/15/48 | | 2,250,000 | 2,204,213 |
| 5% 4/15/48 | | 2,635,000 | 2,867,354 |
|
| TOTAL SOUTH CAROLINA | | | 35,995,577 |
|
| South Dakota - 0.0% | | | |
| South Dakota Health & Edl. Facilities Auth. Rev.: | | | |
| (Avera Health Proj.) Series 2017, 5% 7/1/31 | | 115,000 | 131,948 |
| Series 2017: | | | |
| 5% 7/1/26 | | 50,000 | 58,458 |
| 5% 7/1/28 | | 50,000 | 58,388 |
| 5% 7/1/29 | | 100,000 | 116,201 |
|
| TOTAL SOUTH DAKOTA | | | 364,995 |
|
| Tennessee - 0.4% | | | |
| Greeneville Health & Edl. Facilities Board Series 2018 A: | | | |
| 5% 7/1/23 | | 170,000 | 188,573 |
| 5% 7/1/24 | | 255,000 | 282,629 |
| 5% 7/1/25 | | 255,000 | 281,829 |
| Jackson Hosp. Rev. Series 2018 A, 5% 4/1/41 | | 2,000,000 | 2,193,820 |
| Memphis-Shelby County Arpt. Auth. Arpt. Rev. Series 2010 B: | | | |
| 5.75% 7/1/23 (d) | | 1,000,000 | 1,050,550 |
| 5.75% 7/1/24 (d) | | 690,000 | 724,673 |
|
| TOTAL TENNESSEE | | | 4,722,074 |
|
| Texas - 9.1% | | | |
| Argyle Independent School District 5.25% 8/15/40 (FSA Insured) | | 20,000 | 20,047 |
| Arlington Spl. Tax Rev. Series 2018 C, 5% 2/15/45 | | 535,000 | 558,786 |
| Austin Arpt. Sys. Rev.: | | | |
| Series 2014: | | | |
| 5% 11/15/26 (d) | | 170,000 | 192,260 |
| 5% 11/15/27 (d) | | 215,000 | 241,905 |
| 5% 11/15/28 (d) | | 260,000 | 291,338 |
| 5% 11/15/39 (d) | | 1,960,000 | 2,153,883 |
| 5% 11/15/44 (d) | | 4,795,000 | 5,255,847 |
| Series 2017 B: | | | |
| 5% 11/15/28 (d) | | 170,000 | 194,815 |
| 5% 11/15/30 (d) | | 265,000 | 301,286 |
| 5% 11/15/32 (d) | | 210,000 | 236,720 |
| 5% 11/15/35 (d) | | 215,000 | 239,661 |
| 5% 11/15/37 (d) | | 245,000 | 271,137 |
| 5% 11/15/41 (d) | | 980,000 | 1,074,639 |
| Austin Cmnty. College District Rev. (Convention Ctr. Proj.) Series 2002, 0% 2/1/22 (AMBAC Insured) | | 500,000 | 467,440 |
| Central Reg'l. Mobility Auth.: | | | |
| Series 2015 A: | | | |
| 5% 1/1/28 | | 225,000 | 251,939 |
| 5% 1/1/30 | | 285,000 | 316,809 |
| 5% 1/1/31 | | 80,000 | 88,582 |
| 5% 1/1/32 | | 170,000 | 187,396 |
| 5% 1/1/40 | | 1,000,000 | 1,079,230 |
| 5% 1/1/45 | | 1,205,000 | 1,296,146 |
| Series 2016: | | | |
| 5% 1/1/40 | | 170,000 | 184,273 |
| 5% 1/1/46 | | 120,000 | 129,536 |
| Coppell Independent School District 0% 8/15/20 | | 345,000 | 334,398 |
| Corpus Christi Util. Sys. Rev.: | | | |
| 5% 7/15/23 | | 275,000 | 301,331 |
| 5% 7/15/24 | | 390,000 | 426,227 |
| Cypress-Fairbanks Independent School District Series 2014 C, 5% 2/15/44 | | 755,000 | 827,986 |
| Dallas Area Rapid Transit Sales Tax Rev. Series 2016 A, 5% 12/1/33 | | 450,000 | 513,626 |
| Dallas Fort Worth Int'l. Arpt. Rev.: | | | |
| Series 2012 D, 5% 11/1/42 (d) | | 475,000 | 496,218 |
| Series 2012 H, 5% 11/1/42 (d) | | 645,000 | 673,812 |
| Dallas Gen. Oblig. Series 2017: | | | |
| 5% 2/15/29 | | 1,135,000 | 1,331,321 |
| 5% 2/15/30 | | 285,000 | 332,937 |
| Dallas Independent School District Series 2016 A, 4% 2/15/29 | | 250,000 | 269,815 |
| Dallas Wtrwks. & Swr. Sys. Rev. Series 2017, 5% 10/1/46 | | 2,000,000 | 2,266,080 |
| DeSoto Independent School District 0% 8/15/20 | | 575,000 | 556,882 |
| Grand Parkway Trans. Corp.: | | | |
| Series 2013 B: | | | |
| 5% 4/1/53 | | 260,000 | 279,016 |
| 5.25% 10/1/51 | | 10,345,000 | 11,342,775 |
| 5.5% 4/1/53 | | 1,110,000 | 1,215,350 |
| Series 2018 A: | | | |
| 5% 10/1/38 | | 550,000 | 629,134 |
| 5% 10/1/43 | | 170,000 | 192,568 |
| Harris County Cultural Ed. Facilities Fin. Corp. Med. Facilities Rev. (Baylor College of Medicine Proj.) Series 2012 A, 5% 11/15/37 | | 940,000 | 1,015,256 |
| Harris County Cultural Ed. Facilities Fin. Corp. Rev. (Texas Childrens Hosp., Proj.) Series 2015-1 5% 10/1/29 | | 230,000 | 263,019 |
| Harris County Gen. Oblig. Series 2002: | | | |
| 0% 8/15/24 (Nat'l. Pub. Fin. Guarantee Corp. Insured) | | 170,000 | 149,425 |
| 0% 8/15/25 (Nat'l. Pub. Fin. Guarantee Corp. Insured) | | 515,000 | 438,646 |
| 0% 8/15/28 (Nat'l. Pub. Fin. Guarantee Corp. Insured) | | 860,000 | 658,218 |
| Harris County Toll Road Rev. Series 2018 A, 5% 8/15/43 | | 2,000,000 | 2,262,380 |
| Houston Arpt. Sys. Rev.: | | | |
| Series 2011 A: | | | |
| 5% 7/1/23 (d) | | 515,000 | 548,393 |
| 5% 7/1/24 (d) | | 215,000 | 228,726 |
| 5% 7/1/25 (d) | | 260,000 | 276,338 |
| Series 2012 A: | | | |
| 5% 7/1/21 (d) | | 650,000 | 694,759 |
| 5% 7/1/23 (d) | | 105,000 | 113,804 |
| Series 2018 C: | | | |
| 5% 7/1/29 (d) | | 345,000 | 404,440 |
| 5% 7/1/30 (d) | | 365,000 | 423,944 |
| 5% 7/1/31 (d) | | 260,000 | 300,825 |
| 5% 7/1/32 (d) | | 300,000 | 344,973 |
| Houston Gen. Oblig. Series 2017 A: | | | |
| 5% 3/1/29 | | 655,000 | 770,955 |
| 5% 3/1/30 | | 860,000 | 1,005,357 |
| 5% 3/1/31 | | 800,000 | 930,120 |
| 5% 3/1/32 | | 340,000 | 392,880 |
| Houston Independent School District Series 2017, 5% 2/15/35 | | 585,000 | 675,090 |
| Houston Util. Sys. Rev.: | | | |
| Series 2014 C, 5% 5/15/28 | | 515,000 | 583,696 |
| Series 2016 B, 5% 11/15/33 | | 480,000 | 551,525 |
| Series 2018 D, 5% 11/15/43 | | 610,000 | 697,254 |
| Irving Hosp. Auth. Hosp. Rev. Series 2017 A: | | | |
| 5% 10/15/28 | | 80,000 | 90,664 |
| 5% 10/15/30 | | 325,000 | 364,153 |
| 5% 10/15/32 | | 170,000 | 188,567 |
| 5% 10/15/36 | | 115,000 | 125,411 |
| 5% 10/15/37 | | 195,000 | 211,986 |
| 5% 10/15/38 | | 275,000 | 298,018 |
| 5% 10/15/44 | | 270,000 | 289,678 |
| Laredo Independent School District Series 2018, 5% 8/1/40 | | 1,000,000 | 1,137,280 |
| Love Field Arpt. Modernization Rev.: | | | |
| Series 2015: | | | |
| 5% 11/1/26 (d) | | 170,000 | 193,429 |
| 5% 11/1/27 (d) | | 370,000 | 419,025 |
| 5% 11/1/28 (d) | | 570,000 | 642,510 |
| 5% 11/1/29 (d) | | 345,000 | 387,073 |
| 5% 11/1/32 (d) | | 635,000 | 705,402 |
| Series 2017: | | | |
| 5% 11/1/22 (d) | | 130,000 | 142,636 |
| 5% 11/1/23 (d) | | 190,000 | 212,203 |
| 5% 11/1/24 (d) | | 170,000 | 192,613 |
| 5% 11/1/25 (d) | | 170,000 | 194,796 |
| 5% 11/1/26 (d) | | 170,000 | 196,508 |
| 5% 11/1/27 (d) | | 170,000 | 195,475 |
| 5% 11/1/28 (d) | | 300,000 | 343,371 |
| 5% 11/1/29 (d) | | 215,000 | 244,954 |
| 5% 11/1/30 (d) | | 170,000 | 192,923 |
| 5% 11/1/31 (d) | | 385,000 | 434,911 |
| 5% 11/1/32 (d) | | 445,000 | 502,690 |
| 5% 11/1/33 (d) | | 170,000 | 191,410 |
| 5% 11/1/34 (d) | | 170,000 | 190,658 |
| 5% 11/1/36 (d) | | 170,000 | 189,414 |
| Lower Colorado River Auth. Rev. Series 2015 D: | | | |
| 5% 5/15/28 | | 380,000 | 432,227 |
| 5% 5/15/30 | | 860,000 | 971,740 |
| Midway Independent School District Series 2000, 0% 8/15/19 | | 620,000 | 612,924 |
| New Hope Cultural Ed. Facilities Finc (Childrens Med. Ctr. of Dallas) Series 2017 A: | | | |
| 5% 8/15/27 | | 130,000 | 154,384 |
| 5% 8/15/29 | | 345,000 | 405,341 |
| 5% 8/15/47 | | 395,000 | 439,355 |
| Newark Higher Ed. Fin. Corp. (Abilene Christian Univ. Proj.) Series 2016 A: | | | |
| 5% 4/1/27 | | 125,000 | 142,035 |
| 5% 4/1/30 | | 590,000 | 660,989 |
| North Texas Tollway Auth. Rev.: | | | |
| (Sr. Lien Proj.) Series 2017 A, 5% 1/1/35 | | 380,000 | 430,776 |
| (Sr. Lien Proj.) Series 2017 A: | | | |
| 5% 1/1/31 | | 170,000 | 193,608 |
| 5% 1/1/33 | | 205,000 | 234,577 |
| 5% 1/1/34 | | 260,000 | 295,927 |
| 5% 1/1/34 | | 515,000 | 624,721 |
| 5% 1/1/36 | | 1,035,000 | 1,168,608 |
| 5% 1/1/37 | | 1,375,000 | 1,546,298 |
| 5% 1/1/38 | | 560,000 | 601,647 |
| (Sub Lien Proj.) Series 2017 B: | | | |
| 5% 1/1/26 | | 155,000 | 170,511 |
| 5% 1/1/30 | | 75,000 | 85,517 |
| 5% 1/1/31 | | 100,000 | 113,479 |
| Series 2008 I, 6.2% 1/1/42 (Assured Guaranty Corp. Insured) | | 1,430,000 | 1,702,672 |
| Series 2009, 6.25% 1/1/39 | | 385,000 | 386,220 |
| Series 2014 A, 5% 1/1/25 | | 1,035,000 | 1,165,617 |
| Series 2015 A, 5% 1/1/32 | | 575,000 | 640,332 |
| Series 2015 B, 5% 1/1/40 | | 1,720,000 | 1,843,221 |
| Series 2016 A, 5% 1/1/36 | | 215,000 | 240,510 |
| Series 2017 A, 5% 1/1/39 | | 5,620,000 | 6,344,306 |
| San Antonio Arpt. Sys. Rev.: | | | |
| Series 2007 (AMT), 5.25% 7/1/20 (FSA Insured) (d) | | 555,000 | 556,637 |
| Series 2007 (AMT-SUB LIEN), 5.25% 7/1/20 (FSA Insured) (d) | | 480,000 | 481,416 |
| San Antonio Gen. Oblig. Series 2018, 5% 8/1/37 | | 375,000 | 437,025 |
| San Antonio Independent School District Series 2016, 5% 8/15/31 | | 745,000 | 864,461 |
| Southwest Higher Ed. Auth. Rev. (Southern Methodist Univ., TX. Proj.) Series 2017: | | | |
| 5% 10/1/29 | | 75,000 | 88,738 |
| 5% 10/1/30 | | 120,000 | 141,263 |
| 5% 10/1/31 | | 110,000 | 128,930 |
| 5% 10/1/39 | | 215,000 | 245,010 |
| 5% 10/1/40 | | 170,000 | 193,310 |
| Tarrant County Cultural Ed. Facilities Fin. Corp. Hosp. Rev.: | | | |
| (Hendrick Med. Ctr. Proj.) Series 2009 B: | | | |
| 5.25% 9/1/26 (Assured Guaranty Corp. Insured) | | 305,000 | 311,124 |
| 5.25% 9/1/27 (Assured Guaranty Corp. Insured) | | 410,000 | 418,175 |
| 5.25% 9/1/28 (Assured Guaranty Corp. Insured) | | 215,000 | 219,259 |
| (Scott & White Healthcare Proj.) Series 2013 A, 5% 8/15/43 | | 690,000 | 746,587 |
| Tarrant County Cultural Ed. Facilities Fin. Corp. Rev. Series 2016 A: | | | |
| 4% 2/15/35 | | 860,000 | 892,001 |
| 5% 2/15/25 | | 145,000 | 166,859 |
| Texas Gen. Oblig. Series 2017 B, 5% 10/1/36 | | 665,000 | 768,261 |
| Texas Private Activity Bond Surface Trans. Corp. Series 2013, 6.75% 6/30/43 (d) | | 2,580,000 | 2,944,735 |
| Texas State Univ. Sys. Fing. Rev. Series 2017 A: | | | |
| 5% 3/15/29 | | 735,000 | 866,866 |
| 5% 3/15/31 | | 560,000 | 652,809 |
| Texas Wtr. Dev. Board Rev. Series 2018 A, 5% 10/15/43 | | 2,000,000 | 2,288,800 |
| Univ. of Houston Univ. Revs. Series 2017 A: | | | |
| 5% 2/15/32 | | 1,065,000 | 1,218,893 |
| 5% 2/15/33 | | 690,000 | 786,359 |
| 5% 2/15/34 | | 860,000 | 976,539 |
| 5% 2/15/35 | | 860,000 | 972,987 |
| 5% 2/15/36 | | 515,000 | 580,549 |
| Univ. of North Texas Univ. Rev.: | | | |
| Series 2017 A, 5% 4/15/32 | | 360,000 | 417,308 |
| Series 2018 A, 5% 4/15/44 | | 170,000 | 192,358 |
| Univ. of Texas Permanent Univ. Fund Rev. Series 2016 B, 5% 7/1/29 | | 350,000 | 410,246 |
| Weatherford Independent School District 0% 2/15/33 | | 1,200,000 | 746,604 |
|
| TOTAL TEXAS | | | 100,552,583 |
|
| Utah - 1.7% | | | |
| Salt Lake City Arpt. Rev.: | | | |
| Series 2017 A: | | | |
| 5% 7/1/22 (d) | | 345,000 | 376,592 |
| 5% 7/1/24 (d) | | 300,000 | 338,937 |
| 5% 7/1/25 (d) | | 345,000 | 394,849 |
| 5% 7/1/27 (d) | | 730,000 | 853,063 |
| 5% 7/1/29 (d) | | 640,000 | 737,946 |
| 5% 7/1/30 (d) | | 475,000 | 544,236 |
| 5% 7/1/31 (d) | | 905,000 | 1,032,551 |
| 5% 7/1/32 (d) | | 990,000 | 1,125,571 |
| 5% 7/1/33 (d) | | 690,000 | 781,742 |
| 5% 7/1/34 (d) | | 1,625,000 | 1,833,325 |
| 5% 7/1/35 (d) | | 690,000 | 776,278 |
| 5% 7/1/36 (d) | | 930,000 | 1,041,898 |
| 5% 7/1/37 (d) | | 730,000 | 814,972 |
| 5% 7/1/42 (d) | | 4,220,000 | 4,662,087 |
| Series 2018 A: | | | |
| 5% 7/1/33 (d) | | 1,655,000 | 1,894,346 |
| 5.25% 7/1/48 (d) | | 1,215,000 | 1,376,060 |
| Utah Associated Muni. Pwr. Sys. Rev. (Payson Pwr. Proj.) 5% 9/1/22 | | 545,000 | 599,794 |
|
| TOTAL UTAH | | | 19,184,247 |
|
| Vermont - 0.2% | | | |
| Vermont Edl. & Health Bldg. Fin. Agcy. Rev. (Champlain College Proj.) Series 2016 A: | | | |
| 5% 10/15/41 | | 790,000 | 843,981 |
| 5% 10/15/46 | | 980,000 | 1,042,906 |
|
| TOTAL VERMONT | | | 1,886,887 |
|
| Virginia - 0.5% | | | |
| Fredericksburg Econ. Dev. Auth. Rev. Series 2014: | | | |
| 5% 6/15/25 | | 805,000 | 898,670 |
| 5% 6/15/30 | | 215,000 | 237,377 |
| Stafford County Econ. Dev. Auth. Hosp. Facilities Rev.: | | | |
| (Mary Washington Hosp. Proj.) Series 2016, 3% 6/15/29 | | 110,000 | 108,636 |
| Series 2016: | | | |
| 4% 6/15/37 | | 125,000 | 125,719 |
| 5% 6/15/27 | | 260,000 | 296,530 |
| 5% 6/15/30 | | 110,000 | 123,651 |
| 5% 6/15/33 | | 75,000 | 83,411 |
| 5% 6/15/34 | | 140,000 | 155,116 |
| 5% 6/15/35 | | 380,000 | 419,976 |
| Virginia College Bldg. Auth. Edl. Facilities Rev. Series 2015 A: | | | |
| 5% 1/1/35 | | 170,000 | 192,209 |
| 5% 1/1/40 | | 385,000 | 432,571 |
| Virginia Commonwealth Trans. Board Rev. (Virginia Gen. Oblig. Proj.) Series 2017 A, 5% 5/15/32 | | 150,000 | 177,428 |
| Virginia Small Bus. Fing. Auth. (95 Express Lane LLC Proj.) Series 2012: | | | |
| 5% 7/1/34 (d) | | 1,035,000 | 1,078,470 |
| 5% 1/1/40 (d) | | 205,000 | 213,042 |
| Winchester Econ. Dev. Auth. Series 2015: | | | |
| 5% 1/1/31 | | 430,000 | 487,375 |
| 5% 1/1/34 | | 260,000 | 290,503 |
| 5% 1/1/35 | | 260,000 | 289,983 |
| 5% 1/1/44 | | 170,000 | 185,149 |
|
| TOTAL VIRGINIA | | | 5,795,816 |
|
| Washington - 1.4% | | | |
| Clark County School District #37, Vancouver Series 2001 C, 0% 12/1/19 (Nat'l. Pub. Fin. Guarantee Corp. Insured) | | 350,000 | 343,897 |
| Port of Seattle Rev. Series 2016 B: | | | |
| 5% 10/1/28 (d) | | 600,000 | 685,140 |
| 5% 10/1/30 (d) | | 345,000 | 390,813 |
| Port of Seattle Spl. Facility Rev. Series 2013: | | | |
| 5% 6/1/21 (d) | | 230,000 | 245,541 |
| 5% 6/1/22 (d) | | 170,000 | 185,264 |
| 5% 6/1/24 (d) | | 270,000 | 298,021 |
| Spokane Pub. Facilities District Hotel/Motel Tax & Sales/Use Tax Rev. Series 2013 B: | | | |
| 5% 12/1/25 | | 965,000 | 1,071,111 |
| 5% 12/1/27 | | 710,000 | 784,933 |
| Washington Gen. Oblig.: | | | |
| Series 2015 C: | | | |
| 5% 2/1/33 | | 580,000 | 654,304 |
| 5% 2/1/34 | | 715,000 | 804,039 |
| Series 2017 A, 5% 8/1/35 | | 130,000 | 148,925 |
| Series 2017 D, 5% 2/1/33 | | 610,000 | 707,362 |
| Series R-2017 A, 5% 8/1/30 | | 350,000 | 408,478 |
| Washington Health Care Facilities Auth. Rev.: | | | |
| (Catholic Health Initiatives Proj.) Series 2008 D, 6.375% 10/1/36 | | 1,375,000 | 1,379,510 |
| (Overlake Hosp. Med. Ctr., WA. Proj.) Series 2017 B: | | | |
| 5% 7/1/25 | | 140,000 | 159,600 |
| 5% 7/1/27 | | 265,000 | 307,715 |
| 5% 7/1/28 | | 325,000 | 380,377 |
| 5% 7/1/29 | | 125,000 | 145,544 |
| 5% 7/1/30 | | 150,000 | 173,240 |
| 5% 7/1/31 | | 180,000 | 206,514 |
| 5% 7/1/32 | | 345,000 | 393,783 |
| 5% 7/1/33 | | 490,000 | 556,003 |
| 5% 7/1/34 | | 115,000 | 129,630 |
| 5% 7/1/42 | | 975,000 | 1,073,573 |
| (Providence Health Systems Proj.) Series 2012 A, 5% 10/1/25 | | 885,000 | 973,235 |
| Series 2015: | | | |
| 5% 1/1/25 | | 345,000 | 391,917 |
| 5% 1/1/27 | | 400,000 | 455,744 |
| Washington Higher Ed. Facilities Auth. Rev. (Whitworth Univ. Proj.) Series 2016 A: | | | |
| 5% 10/1/27 | | 370,000 | 414,000 |
| 5% 10/1/28 | | 380,000 | 422,989 |
| 5% 10/1/35 | | 390,000 | 423,029 |
| 5% 10/1/36 | | 590,000 | 637,489 |
| 5% 10/1/40 | | 580,000 | 618,663 |
|
| TOTAL WASHINGTON | | | 15,970,383 |
|
| West Virginia - 0.2% | | | |
| West Virginia Econ. Dev. Auth. Solid Waste Disp. Facilities Rev. Bonds (Appalachian Pwr. Co. Amos Proj.) Series 2011 A, 1.7%, tender 9/1/20 (a)(d) | | 535,000 | 524,230 |
| West Virginia Hosp. Fin. Auth. Hosp. Rev. Series 2018 A: | | | |
| 5% 1/1/31 | | 280,000 | 321,014 |
| 5% 1/1/32 | | 230,000 | 261,379 |
| West Virginia Univ. Revs. (West Virginia Univ. Projs.) Series 2014 A, 5% 10/1/44 | | 1,310,000 | 1,460,414 |
|
| TOTAL WEST VIRGINIA | | | 2,567,037 |
|
| Wisconsin - 2.0% | | | |
| Pub. Fin. Auth. Rev. (Denver Great Hall LLC. Proj.) Series 2017: | | | |
| 5% 9/30/37 (d) | | 430,000 | 470,059 |
| 5% 9/30/49 (d) | | 3,340,000 | 3,589,264 |
| Pub. Fin. Auth. Sr Liv Rev. (Mary's Woods At Marylhurst, Inc. Proj.): | | | |
| Series 2017 A: | | | |
| 5% 5/15/21 (e) | | 50,000 | 52,162 |
| 5% 5/15/25 (e) | | 190,000 | 203,332 |
| 5% 5/15/28 (e) | | 230,000 | 245,196 |
| 5.25% 5/15/37 (e) | | 70,000 | 73,077 |
| 5.25% 5/15/42 (e) | | 85,000 | 88,080 |
| 5.25% 5/15/47 (e) | | 85,000 | 87,783 |
| 5.25% 5/15/52 (e) | | 160,000 | 164,349 |
| Series 2017 B-1 3.95% 11/15/24 (e) | | 70,000 | 70,354 |
| Series 2017 B-2, 3.5% 11/15/23 (e) | | 95,000 | 95,015 |
| Series 2017 B-3, 3% 11/15/22 (e) | | 130,000 | 130,009 |
| Pub. Fin. Auth. Wis Edl. Facilities: | | | |
| Series 2016: | | | |
| 5% 1/1/37 | | 1,110,000 | 1,150,693 |
| 5% 1/1/42 | | 890,000 | 912,918 |
| Series 2018 A: | | | |
| 5.25% 10/1/43 | | 1,595,000 | 1,693,587 |
| 5.25% 10/1/48 | | 1,595,000 | 1,681,975 |
| Pub. Fin. Auth. Wisconsin Retirement Facility Rev. Series 2018: | | | |
| 5% 10/1/43 (e) | | 150,000 | 150,909 |
| 5% 10/1/48 (e) | | 180,000 | 180,400 |
| 5% 10/1/53 (e) | | 310,000 | 308,962 |
| Wisconsin Health & Edl. Facilities: | | | |
| (Ascension Health Cr. Group Proj.) Series 2016 A, 5% 11/15/36 | | 860,000 | 957,859 |
| Series 2010: | | | |
| 5.75% 7/1/30 (Pre-Refunded to 7/1/20 @ 100) | | 200,000 | 211,292 |
| 5.75% 7/1/30 (Pre-Refunded to 7/1/20 @ 100) | | 340,000 | 359,196 |
| Series 2014: | | | |
| 4% 5/1/33 | | 605,000 | 611,050 |
| 5% 5/1/22 | | 135,000 | 145,126 |
| Series 2016 A: | | | |
| 5% 2/15/28 | | 410,000 | 464,710 |
| 5% 2/15/29 | | 530,000 | 597,819 |
| 5% 2/15/30 | | 585,000 | 656,271 |
| Series 2016: | | | |
| 4% 2/15/38 (Pre-Refunded to 8/15/25 @ 100) | | 205,000 | 226,140 |
| 5% 2/15/29 (Pre-Refunded to 8/15/25 @ 100) | | 75,000 | 87,311 |
| Series 2017 A: | | | |
| 5% 9/1/31 | | 170,000 | 188,770 |
| 5% 9/1/33 | | 295,000 | 324,792 |
| 5% 9/1/35 | | 325,000 | 355,547 |
| Series 2018, 5% 4/1/34 | | 2,000,000 | 2,317,400 |
| Wisconsin Health & Edl. Facilities Auth. Rev.: | | | |
| (Agnesian HealthCare, Inc. Proj.): | | | |
| Series 2010, 5.5% 7/1/40 (Pre-Refunded to 7/1/20 @ 100) | | 495,000 | 521,136 |
| Series 2013 B: | | | |
| 5% 7/1/27 (Pre-Refunded to 7/1/23 @ 100) | | 205,000 | 230,652 |
| 5% 7/1/36 (Pre-Refunded to 7/1/23 @ 100) | | 1,020,000 | 1,147,633 |
| Series 2012: | | | |
| 4% 10/1/23 | | 430,000 | 457,662 |
| 5% 6/1/27 | | 385,000 | 412,751 |
|
| TOTAL WISCONSIN | | | 21,621,241 |
|
| Wyoming - 0.2% | | | |
| Campbell County Solid Waste Facilities Rev. (Basin Elec. Pwr. Coop. - Dry Fork Station Facilities Proj.) Series 2009 A, 5.75% 7/15/39 | | 1,775,000 | 1,809,062 |
| TOTAL MUNICIPAL BONDS | | | |
| (Cost $1,057,412,876) | | | 1,079,972,298 |
| | | Shares | Value |
|
| Money Market Funds - 0.7% | | | |
| Fidelity Municipal Cash Central Fund, 1.77% (g)(h) | | | |
| (Cost $8,000,000) | | 7,999,200 | 8,000,000 |
| TOTAL INVESTMENT IN SECURITIES - 98.1% | | | |
| (Cost $1,065,412,876) | | | 1,087,972,298 |
| NET OTHER ASSETS (LIABILITIES) - 1.9% | | | 20,520,663 |
| NET ASSETS - 100% | | | $1,108,492,961 |
Legend
(a) Coupon rates for floating and adjustable rate securities reflect the rates in effect at period end.
(b) Coupon is indexed to a floating interest rate which may be multiplied by a specified factor and/or subject to caps or floors.
(c) Security or a portion of the security purchased on a delayed delivery or when-issued basis.
(d) Private activity obligations whose interest is subject to the federal alternative minimum tax for individuals.
(e) Security exempt from registration under Rule 144A of the Securities Act of 1933. These securities may be resold in transactions exempt from registration, normally to qualified institutional buyers. At the end of the period, the value of these securities amounted to $7,522,153 or 0.7% of net assets.
(f) Security initially issued in zero coupon form which converts to coupon form at a specified rate and date. The rate shown is the rate at period end.
(g) Information in this report regarding holdings by state and security types does not reflect the holdings of the Fidelity Municipal Cash Central Fund.
(h) Affiliated fund that is available only to investment companies and other accounts managed by Fidelity Investments. The rate quoted is the annualized seven-day yield of the fund at period end. A complete unaudited listing of the fund's holdings as of its most recent quarter end is available upon request. In addition, each Fidelity Central Fund's financial statements, which are not covered by the Fund's Report of Independent Registered Public Accounting Firm, are available on the SEC's website or upon request.
Affiliated Central Funds
Information regarding fiscal year to date income earned by the Fund from investments in Fidelity Central Funds is as follows:
| Fund | Income earned |
| Fidelity Municipal Cash Central Fund | $125,758 |
| Total | $125,758 |
Amounts in the income column in the above table include any capital gain distributions from underlying funds, which are presented in the corresponding line-item in the Statement of Operations if applicable.
Investment Valuation
The following is a summary of the inputs used, as of December 31, 2018, involving the Fund's assets and liabilities carried at fair value. The inputs or methodology used for valuing securities may not be an indication of the risk associated with investing in those securities. For more information on valuation inputs, and their aggregation into the levels used below, please refer to the Investment Valuation section in the accompanying Notes to Financial Statements.
| | Valuation Inputs at Reporting Date: |
| Description | Total | Level 1 | Level 2 | Level 3 |
| Investments in Securities: | | | | |
| Municipal Securities | $1,079,972,298 | $-- | $1,079,972,298 | $-- |
| Money Market Funds | 8,000,000 | 8,000,000 | -- | -- |
| Total Investments in Securities: | $1,087,972,298 | $8,000,000 | $1,079,972,298 | $-- |
Other Information
The distribution of municipal securities by revenue source, as a percentage of total Net Assets, is as follows (Unaudited):
| Transportation | 25.4% |
| General Obligations | 24.8% |
| Health Care | 23.4% |
| Education | 6.9% |
| Electric Utilities | 5.2% |
| Others* (Individually Less Than 5%) | 14.3% |
| | 100.0% |
* Includes net other assets
See accompanying notes which are an integral part of the financial statements.
Financial Statements
Statement of Assets and Liabilities
| | | December 31, 2018 |
| Assets | | |
Investment in securities, at value — See accompanying schedule:
Unaffiliated issuers (cost $1,057,412,876) | $1,079,972,298 | |
| Fidelity Central Funds (cost $8,000,000) | 8,000,000 | |
| Total Investment in Securities (cost $1,065,412,876) | | $1,087,972,298 |
| Cash | | 12,044,085 |
| Receivable for fund shares sold | | 1,028,033 |
| Interest receivable | | 13,511,873 |
| Distributions receivable from Fidelity Central Funds | | 41,220 |
| Prepaid expenses | | 19,956 |
| Receivable from investment adviser for expense reductions | | 152,771 |
| Other receivables | | 2,194 |
| Total assets | | 1,114,772,430 |
| Liabilities | | |
| Payable for investments purchased on a delayed delivery basis | $4,471,844 | |
| Payable for fund shares redeemed | 876,712 | |
| Distributions payable | 332,484 | |
| Accrued management fee | 338,077 | |
| Other affiliated payables | 109,265 | |
| Other payables and accrued expenses | 151,087 | |
| Total liabilities | | 6,279,469 |
| Net Assets | | $1,108,492,961 |
| Net Assets consist of: | | |
| Paid in capital | | $1,085,849,169 |
| Total distributable earnings (loss) | | 22,643,792 |
| Net Assets, for 108,664,194 shares outstanding | | $1,108,492,961 |
| Net Asset Value, offering price and redemption price per share ($1,108,492,961 ÷ 108,664,194 shares) | | $10.20 |
See accompanying notes which are an integral part of the financial statements.
Statement of Operations
| | | For the period
October 2, 2018 (commencement of operations) to
December 31, 2018 |
| Investment Income | | |
| Interest | | $8,033,031 |
| Income from Fidelity Central Funds | | 125,758 |
| Total income | | 8,158,789 |
| Expenses | | |
| Management fee | $876,217 | |
| Transfer agent fees | 276,244 | |
| Accounting fees and expenses | 51,138 | |
| Custodian fees and expenses | 2,261 | |
| Independent trustees' fees and expenses | 583 | |
| Registration fees | 264,079 | |
| Audit | 48,571 | |
| Legal | 11 | |
| Total expenses before reductions | 1,519,104 | |
| Expense reductions | (620,132) | |
| Total expenses after reductions | | 898,972 |
| Net investment income (loss) | | 7,259,817 |
| Realized and Unrealized Gain (Loss) | | |
| Net realized gain (loss) on: | | |
| Investment securities: | | |
| Unaffiliated issuers | 188,683 | |
| Total net realized gain (loss) | | 188,683 |
| Change in net unrealized appreciation (depreciation) on investment securities | | 22,559,422 |
| Net gain (loss) | | 22,748,105 |
| Net increase (decrease) in net assets resulting from operations | | $30,007,922 |
See accompanying notes which are an integral part of the financial statements.
Statement of Changes in Net Assets
| | For the period
October 2, 2018 (commencement of operations) to
December 31, 2018 |
| Increase (Decrease) in Net Assets | |
| Operations | |
| Net investment income (loss) | $7,259,817 |
| Net realized gain (loss) | 188,683 |
| Change in net unrealized appreciation (depreciation) | 22,559,422 |
| Net increase (decrease) in net assets resulting from operations | 30,007,922 |
| Distributions to shareholders | (7,363,827) |
| Total distributions | (7,363,827) |
| Share transactions | |
| Proceeds from sales of shares | 1,232,074,965 |
| Reinvestment of distributions | 6,646,229 |
| Cost of shares redeemed | (152,872,328) |
| Net increase (decrease) in net assets resulting from share transactions | 1,085,848,866 |
| Total increase (decrease) in net assets | 1,108,492,961 |
| Net Assets | |
| Beginning of period | – |
| End of period | $1,108,492,961 |
| Other Information | |
| Shares | |
| Sold | 123,160,154 |
| Issued in reinvestment of distributions | 657,535 |
| Redeemed | (15,153,495) |
| Net increase (decrease) | 108,664,194 |
See accompanying notes which are an integral part of the financial statements.
Financial Highlights
Fidelity SAI Municipal Income Fund
| | |
| Years ended December 31, | 2018 A |
| Selected Per–Share Data | |
| Net asset value, beginning of period | $10.00 |
| Income from Investment Operations | |
| Net investment income (loss)B | .074 |
| Net realized and unrealized gain (loss) | .193 |
| Total from investment operations | .267 |
| Distributions from net investment income | (.066) |
| Distributions from net realized gain | (.001) |
| Total distributions | (.067) |
| Net asset value, end of period | $10.20 |
| Total ReturnC,D | 2.67% |
| Ratios to Average Net AssetsE,F | |
| Expenses before reductions | .59%G,H |
| Expenses net of fee waivers, if any | .36%G |
| Expenses net of all reductions | .36%G |
| Net investment income (loss) | 2.90%G |
| Supplemental Data | |
| Net assets, end of period (000 omitted) | $1,108,493 |
| Portfolio turnover rateI | 7%J,K |
A For the period October 2, 2018 (commencement of operations) to December 31, 2018.
B Calculated based on average shares outstanding during the period.
C Total returns for periods of less than one year are not annualized.
D Total returns would have been lower if certain expenses had not been reduced during the applicable periods shown.
E Fees and expenses of any underlying Fidelity Central Funds are not included in the Fund's expense ratio. The Fund indirectly bears its proportionate share of the expenses of any underlying Fidelity Central Funds.
F Expense ratios reflect operating expenses of the Fund. Expenses before reductions do not reflect amounts reimbursed by the investment adviser or reductions from expense offset arrangements and do not represent the amount paid by the Fund during periods when reimbursements or reductions occur. Expense ratios before reductions for start-up periods may not be representative of longer term operating periods. Expenses net of fee waivers reflect expenses after reimbursement by the investment adviser but prior to reductions from expense offset arrangements. Expenses net of all reductions represent the net expenses paid by the Fund.
G Annualized
H Audit fees are not annualized.
I Amount does not include the portfolio activity of any underlying Fidelity Central Funds.
J Portfolio turnover rate excludes securities received or delivered in-kind.
K Amount not annualized.
See accompanying notes which are an integral part of the financial statements.
Notes to Financial Statements
For the period ended December 31, 2018
1. Organization.
Fidelity SAI Municipal Income Fund (the Fund) is a fund of Fidelity Salem Street Trust (the Trust) and is authorized to issue an unlimited number of shares. Shares are offered exclusively to certain clients of Fidelity Management & Research Company (FMR) or its affiliates. The Trust is registered under the Investment Company Act of 1940, as amended (the 1940 Act), as an open-end management investment company organized as a Massachusetts business trust.
2. Investments in Fidelity Central Funds.
The Fund invests in Fidelity Central Funds, which are open-end investment companies generally available only to other investment companies and accounts managed by the investment adviser and its affiliates. The Fund's Schedule of Investments lists each of the Fidelity Central Funds held as of period end, if any, as an investment of the Fund, but does not include the underlying holdings of each Fidelity Central Fund. As an Investing Fund, the Fund indirectly bears its proportionate share of the expenses of the underlying Fidelity Central Funds.
The Money Market Central Funds seek preservation of capital and current income and are managed by Fidelity Investments Money Management, Inc. (FIMM), an affiliate of the investment adviser. Annualized expenses of the Money Market Central Funds as of their most recent shareholder report date are less than .005%.
A complete unaudited list of holdings for each Fidelity Central Fund is available upon request or at the Securities and Exchange Commission (the SEC) website at www.sec.gov. In addition, the financial statements of the Fidelity Central Funds, which are not covered by the Fund's Report of Independent Registered Public Accounting Firm, are available on the SEC website or upon request.
3. Significant Accounting Policies.
The Fund is an investment company and applies the accounting and reporting guidance of the Financial Accounting Standards Board (FASB) Accounting Standards Codification Topic 946 Financial Services – Investments Companies. The financial statements have been prepared in conformity with accounting principles generally accepted in the United States of America (GAAP), which require management to make certain estimates and assumptions at the date of the financial statements. Actual results could differ from those estimates. Subsequent events, if any, through the date that the financial statements were issued have been evaluated in the preparation of the financial statements. The following summarizes the significant accounting policies of the Fund:
Investment Valuation. Investments are valued as of 4:00 p.m. Eastern time on the last calendar day of the period. The Board of Trustees (the Board) has delegated the day to day responsibility for the valuation of the Fund's investments to the Fair Value Committee (the Committee) established by the Fund's investment adviser. In accordance with valuation policies and procedures approved by the Board, the Fund attempts to obtain prices from one or more third party pricing vendors or brokers to value its investments. When current market prices, quotations or currency exchange rates are not readily available or reliable, investments will be fair valued in good faith by the Committee, in accordance with procedures adopted by the Board. Factors used in determining fair value vary by investment type and may include market or investment specific events, changes in interest rates and credit quality. The frequency with which these procedures are used cannot be predicted and they may be utilized to a significant extent. The Committee oversees the Fund's valuation policies and procedures and reports to the Board on the Committee's activities and fair value determinations. The Board monitors the appropriateness of the procedures used in valuing the Fund's investments and ratifies the fair value determinations of the Committee.
The Fund categorizes the inputs to valuation techniques used to value its investments into a disclosure hierarchy consisting of three levels as shown below:
- Level 1 – quoted prices in active markets for identical investments
- Level 2 – other significant observable inputs (including quoted prices for similar investments, interest rates, prepayment speeds, etc.)
- Level 3 – unobservable inputs (including the Fund's own assumptions based on the best information available)
Valuation techniques used to value the Fund's investments by major category are as follows:
Debt securities, including restricted securities, are valued based on evaluated prices received from third party pricing vendors or from brokers who make markets in such securities. Municipal securities are valued by pricing vendors who utilize matrix pricing which considers yield or price of bonds of comparable quality, coupon, maturity and type or by broker-supplied prices. When independent prices are unavailable or unreliable, debt securities may be valued utilizing pricing methodologies which consider similar factors that would be used by third party pricing vendors. Debt securities are generally categorized as Level 2 in the hierarchy but may be Level 3 depending on the circumstances.
Investments in open-end mutual funds, including the Fidelity Central Funds, are valued at their closing net asset value (NAV) each business day and are categorized as Level 1 in the hierarchy.
Changes in valuation techniques may result in transfers in or out of an assigned level within the disclosure hierarchy. The aggregate value of investments by input level as of December 31, 2018 is included at the end of the Fund's Schedule of Investments.
Investment Transactions and Income. For financial reporting purposes, the Fund's investment holdings and NAV include trades executed through the end of the last business day of the period. The NAV per share for processing shareholder transactions is calculated as of the close of business of the New York Stock Exchange (NYSE), normally 4:00 p.m. Eastern time and includes trades executed through the end of the prior business day. Gains and losses on securities sold are determined on the basis of identified cost. Income and capital gain distributions from Fidelity Central Funds, if any, are recorded on the ex-dividend date. Interest income is accrued as earned and includes coupon interest and amortization of premium and accretion of discount on debt securities as applicable. Debt obligations may be placed on non-accrual status and related interest income may be reduced by ceasing current accruals and writing off interest receivables when the collection of all or a portion of interest has become doubtful based on consistently applied procedures. A debt obligation is removed from non-accrual status when the issuer resumes interest payments or when collectability of interest is reasonably assured.
Expenses. Expenses directly attributable to a fund are charged to that fund. Expenses attributable to more than one fund are allocated among the respective funds on the basis of relative net assets or other appropriate methods. Expense estimates are accrued in the period to which they relate and adjustments are made when actual amounts are known.
Income Tax Information and Distributions to Shareholders. Each year, the Fund intends to qualify as a regulated investment company under Subchapter M of the Internal Revenue Code, including distributing substantially all of its taxable income and realized gains. As a result, no provision for U.S. Federal income taxes is required. As of December 31, 2018, the Fund did not have any unrecognized tax benefits in the financial statements; nor is the Fund aware of any tax positions for which it is reasonably possible that the total amounts of unrecognized tax benefits will significantly change in the next twelve months. The Fund files a U.S. federal tax return, in addition to state and local tax returns as required. The Fund's federal income tax returns are subject to examination by the Internal Revenue Service (IRS) for a period of three fiscal years after they are filed. State and local tax returns may be subject to examination for an additional fiscal year depending on the jurisdiction.
Distributions are declared and recorded daily and paid monthly from net investment income. Distributions from realized gains, if any, are declared and recorded on the ex-dividend date. Income and capital gain distributions are determined in accordance with income tax regulations, which may differ from GAAP. In addition, the Fund claimed a portion of the payment made to redeeming shareholders as a distribution for income tax purposes.
Capital accounts within the financial statements are adjusted for permanent book-tax differences. These adjustments have no impact on net assets or the results of operations. Capital accounts are not adjusted for temporary book-tax differences which will reverse in a subsequent period.
Book-tax differences are primarily due to market discount.
As of period end, the cost and unrealized appreciation (depreciation) in securities, and derivatives if applicable, for federal income tax purposes were as follows:
| Gross unrealized appreciation | $22,675,050 |
| Gross unrealized depreciation | (107,483) |
| Net unrealized appreciation (depreciation) | $22,567,567 |
| Tax Cost | $1,065,404,731 |
The tax-based components of distributable earnings as of period end were as follows:
| Undistributed tax-exempt income | $314 |
| Undistributed ordinary income | $75,911 |
| Net unrealized appreciation (depreciation) on securities and other investments | $22,567,567 |
The tax character of distributions paid was as follows:
| | December 31, 2018(a) |
| Tax-exempt Income | $7,251,289 |
| Ordinary Income | $112,538 |
| Total | $7,363,827 |
(a) For the period October 2, 2018 (commencement of operations) to December 31, 2018.
Delayed Delivery Transactions and When-Issued Securities. During the period, the Fund transacted in securities on a delayed delivery or when-issued basis. Payment and delivery may take place after the customary settlement period for that security. The price of the underlying securities and the date when the securities will be delivered and paid for are fixed at the time the transaction is negotiated. The securities purchased on a delayed delivery or when-issued basis are identified as such in the Fund's Schedule of Investments. The Fund may receive compensation for interest forgone in the purchase of a delayed delivery or when-issued security. With respect to purchase commitments, the Fund identifies securities as segregated in its records with a value at least equal to the amount of the commitment. Losses may arise due to changes in the value of the underlying securities or if the counterparty does not perform under the contract's terms, or if the issuer does not issue the securities due to political, economic, or other factors.
Restricted Securities. The Fund may invest in securities that are subject to legal or contractual restrictions on resale. These securities generally may be resold in transactions exempt from registration or to the public if the securities are registered. Disposal of these securities may involve time-consuming negotiations and expense, and prompt sale at an acceptable price may be difficult. Information regarding restricted securities is included at the end of the Fund's Schedule of Investments.
4. Purchases and Sales of Investments.
Purchases and sales of securities, other than short-term securities and in-kind transactions, aggregated $106,467,826 and $49,694,469, respectively.
5. Fees and Other Transactions with Affiliates.
Management Fee. Fidelity Management & Research Company (the investment adviser) and its affiliates provide the Fund with investment management related services for which the Fund pays a monthly management fee. The management fee is the sum of an individual fund fee rate that is based on an annual rate of .25% of the Fund's average net assets and an annualized group fee rate that averaged .11% during the period. The group fee rate is based upon the average net assets of all the mutual funds advised by the investment adviser, including any mutual funds previously advised by the investment adviser that are currently advised by Fidelity SelectCo, LLC, an affiliate of the investment adviser. The group fee rate decreases as assets under management increase and increases as assets under management decrease. For the reporting period, the total annualized management fee rate was .35% of the Fund's average net assets.
Transfer Agent Fees. Fidelity Investments Institutional Operations Company, Inc. (FIIOC), an affiliate of the investment adviser, is the Fund's transfer, dividend disbursing and shareholder servicing agent. FIIOC receives account fees and asset-based fees that vary according to account size and type of account. FIIOC pays for typesetting, printing and mailing of shareholder reports, except proxy statements. For the period, the transfer agent fees were equivalent to an annualized rate of .11% of average net assets.
Accounting Fees. Fidelity Service Company, Inc. (FSC), an affiliate of the investment adviser, maintains the Fund's accounting records. The fee is based on the level of average net assets for each month. For the period, the fees were equivalent to an annualized rate of .02%.
Interfund Trades. The Fund may purchase from or sell securities to other Fidelity Funds under procedures adopted by the Board. The procedures have been designed to ensure these interfund trades are executed in accordance with Rule 17a-7 of the 1940 Act. Interfund trades are included within the respective purchases and sales amounts shown in the Purchases and Sales of Investments note.
Affiliated Exchanges In-Kind. During the period, the Fund received investments, including accrued interest, and cash valued at $1,042,641,709 in exchange for 104,264,171 shares of the Fund. The amount of in-kind exchanges is included in share transactions in the accompanying Statement of Changes in Net Assets.
6. Expense Reductions.
The investment adviser contractually agreed to reimburse the Fund to the extent annual operating expenses exceeded .36% of average net assets. This reimbursement will remain in place through February 29, 2020. Some expenses, for example the compensation of the independent Trustees, and certain miscellaneous expenses such as proxy and shareholder meeting expenses, are excluded from this reimbursement. During the period this reimbursement reduced the Fund's expenses by $617,937.
In addition, through arrangements with the Fund's custodian, credits realized as a result of certain uninvested cash balances were used to reduce the Fund's expenses. During the period, these credits reduced the Fund's custody expenses by $2,195.
7. Other.
The Fund's organizational documents provide former and current trustees and officers with a limited indemnification against liabilities arising in connection with the performance of their duties to the Fund. In the normal course of business, the Fund may also enter into contracts that provide general indemnifications. The Fund's maximum exposure under these arrangements is unknown as this would be dependent on future claims that may be made against the Fund. The risk of material loss from such claims is considered remote.
Report of Independent Registered Public Accounting Firm
To the Board of Trustees of Fidelity Salem Street Trust and Shareholders of Fidelity SAI Municipal Income Fund:
Opinion on the Financial Statements
We have audited the accompanying statement of assets and liabilities, including the schedule of investments, of Fidelity SAI Municipal Income Fund (one of the funds constituting Fidelity Salem Street Trust, referred to hereafter as the "Fund") as of December 31, 2018, and the related statements of operations and changes in net assets, including the related notes, and the financial highlights for the period October 2, 2018 (commencement of operations) through December 31, 2018 (collectively referred to as the “financial statements”). In our opinion, the financial statements present fairly, in all material respects, the financial position of the Fund as of December 31, 2018, and the results of its operations, changes in its net assets, and the financial highlights for the period October 2, 2018 (commencement of operations) through December 31, 2018 in conformity with accounting principles generally accepted in the United States of America.
Basis for Opinion
These financial statements are the responsibility of the Fund’s management. Our responsibility is to express an opinion on the Fund’s financial statements based on our audit. We are a public accounting firm registered with the Public Company Accounting Oversight Board (United States) (PCAOB) and are required to be independent with respect to the Fund in accordance with the U.S. federal securities laws and the applicable rules and regulations of the Securities and Exchange Commission and the PCAOB.
We conducted our audit of these financial statements in accordance with the standards of the PCAOB. Those standards require that we plan and perform the audit to obtain reasonable assurance about whether the financial statements are free of material misstatement, whether due to error or fraud.
Our audit included performing procedures to assess the risks of material misstatement of the financial statements, whether due to error or fraud, and performing procedures that respond to those risks. Such procedures included examining, on a test basis, evidence regarding the amounts and disclosures in the financial statements. Our audit also included evaluating the accounting principles used and significant estimates made by management, as well as evaluating the overall presentation of the financial statements. Our procedures included confirmation of securities owned as of December 31, 2018 by correspondence with the custodian and brokers; when replies were not received from brokers, we performed other auditing procedures. We believe that our audit provides a reasonable basis for our opinion.
PricewaterhouseCoopers LLP
Boston, Massachusetts
February 14, 2019
We have served as the auditor of one or more investment companies in the Fidelity group of funds since 1932.
Trustees and Officers
The Trustees, Members of the Advisory Board (if any), and officers of the trust and fund, as applicable, are listed below. The Board of Trustees governs the fund and is responsible for protecting the interests of shareholders. The Trustees are experienced executives who meet periodically throughout the year to oversee the fund's activities, review contractual arrangements with companies that provide services to the fund, oversee management of the risks associated with such activities and contractual arrangements, and review the fund's performance. Except for Jonathan Chiel, each of the Trustees oversees 260 funds. Mr. Chiel oversees 154 funds.
The Trustees hold office without limit in time except that (a) any Trustee may resign; (b) any Trustee may be removed by written instrument, signed by at least two-thirds of the number of Trustees prior to such removal; (c) any Trustee who requests to be retired or who has become incapacitated by illness or injury may be retired by written instrument signed by a majority of the other Trustees; and (d) any Trustee may be removed at any special meeting of shareholders by a two-thirds vote of the outstanding voting securities of the trust. Each Trustee who is not an interested person (as defined in the 1940 Act) of the trust and the fund is referred to herein as an Independent Trustee. Each Independent Trustee shall retire not later than the last day of the calendar year in which his or her 75th birthday occurs. The Independent Trustees may waive this mandatory retirement age policy with respect to individual Trustees. Officers and Advisory Board Members hold office without limit in time, except that any officer or Advisory Board Member may resign or may be removed by a vote of a majority of the Trustees at any regular meeting or any special meeting of the Trustees. Except as indicated, each individual has held the office shown or other offices in the same company for the past five years.
The fund’s Statement of Additional Information (SAI) includes more information about the Trustees. To request a free copy, call Fidelity at 1-800-544-3455.
Experience, Skills, Attributes, and Qualifications of the Trustees. The Governance and Nominating Committee has adopted a statement of policy that describes the experience, qualifications, attributes, and skills that are necessary and desirable for potential Independent Trustee candidates (Statement of Policy). The Board believes that each Trustee satisfied at the time he or she was initially elected or appointed a Trustee, and continues to satisfy, the standards contemplated by the Statement of Policy. The Governance and Nominating Committee also engages professional search firms to help identify potential Independent Trustee candidates who have the experience, qualifications, attributes, and skills consistent with the Statement of Policy. From time to time, additional criteria based on the composition and skills of the current Independent Trustees, as well as experience or skills that may be appropriate in light of future changes to board composition, business conditions, and regulatory or other developments, have also been considered by the professional search firms and the Governance and Nominating Committee. In addition, the Board takes into account the Trustees' commitment and participation in Board and committee meetings, as well as their leadership of standing and ad hoc committees throughout their tenure.
In determining that a particular Trustee was and continues to be qualified to serve as a Trustee, the Board has considered a variety of criteria, none of which, in isolation, was controlling. The Board believes that, collectively, the Trustees have balanced and diverse experience, qualifications, attributes, and skills, which allow the Board to operate effectively in governing the fund and protecting the interests of shareholders. Information about the specific experience, skills, attributes, and qualifications of each Trustee, which in each case led to the Board's conclusion that the Trustee should serve (or continue to serve) as a trustee of the fund, is provided below.
Board Structure and Oversight Function. Abigail P. Johnson is an interested person and currently serves as Chairman. The Trustees have determined that an interested Chairman is appropriate and benefits shareholders because an interested Chairman has a personal and professional stake in the quality and continuity of services provided to the fund. Independent Trustees exercise their informed business judgment to appoint an individual of their choosing to serve as Chairman, regardless of whether the Trustee happens to be independent or a member of management. The Independent Trustees have determined that they can act independently and effectively without having an Independent Trustee serve as Chairman and that a key structural component for assuring that they are in a position to do so is for the Independent Trustees to constitute a substantial majority for the Board. The Independent Trustees also regularly meet in executive session. Arthur E. Johnson serves as Chairman of the Independent Trustees and as such (i) acts as a liaison between the Independent Trustees and management with respect to matters important to the Independent Trustees and (ii) with management prepares agendas for Board meetings.
Fidelity® funds are overseen by different Boards of Trustees. The fund's Board oversees Fidelity's investment-grade bond, money market, asset allocation and certain equity funds, and other Boards oversee Fidelity's high income and other equity funds. The asset allocation funds may invest in Fidelity® funds that are overseen by such other Boards. The use of separate Boards, each with its own committee structure, allows the Trustees of each group of Fidelity® funds to focus on the unique issues of the funds they oversee, including common research, investment, and operational issues. On occasion, the separate Boards establish joint committees to address issues of overlapping consequences for the Fidelity® funds overseen by each Board.
The Trustees operate using a system of committees to facilitate the timely and efficient consideration of all matters of importance to the Trustees, the fund, and fund shareholders and to facilitate compliance with legal and regulatory requirements and oversight of the fund's activities and associated risks. The Board, acting through its committees, has charged FMR and its affiliates with (i) identifying events or circumstances the occurrence of which could have demonstrably adverse effects on the fund's business and/or reputation; (ii) implementing processes and controls to lessen the possibility that such events or circumstances occur or to mitigate the effects of such events or circumstances if they do occur; and (iii) creating and maintaining a system designed to evaluate continuously business and market conditions in order to facilitate the identification and implementation processes described in (i) and (ii) above. Because the day-to-day operations and activities of the fund are carried out by or through FMR, its affiliates, and other service providers, the fund's exposure to risks is mitigated but not eliminated by the processes overseen by the Trustees. While each of the Board's committees has responsibility for overseeing different aspects of the fund's activities, oversight is exercised primarily through the Operations and Audit Committees. In addition, an ad hoc Board committee of Independent Trustees has worked with FMR to enhance the Board's oversight of investment and financial risks, legal and regulatory risks, technology risks, and operational risks, including the development of additional risk reporting to the Board. Appropriate personnel, including but not limited to the fund's Chief Compliance Officer (CCO), FMR's internal auditor, the independent accountants, the fund's Treasurer and portfolio management personnel, make periodic reports to the Board's committees, as appropriate, including an annual review of Fidelity's risk management program for the Fidelity® funds. The responsibilities of each standing committee, including their oversight responsibilities, are described further under "Standing Committees of the Trustees."
Interested Trustees*:
Correspondence intended for a Trustee who is an interested person may be sent to Fidelity Investments, 245 Summer Street, Boston, Massachusetts 02210.
Name, Year of Birth; Principal Occupations and Other Relevant Experience+
Jonathan Chiel (1957)
Year of Election or Appointment: 2016
Trustee
Mr. Chiel also serves as Trustee of other Fidelity® funds. Mr. Chiel is Executive Vice President and General Counsel for FMR LLC (diversified financial services company, 2012-present). Previously, Mr. Chiel served as general counsel (2004-2012) and senior vice president and deputy general counsel (2000-2004) for John Hancock Financial Services; a partner with Choate, Hall & Stewart (1996-2000) (law firm); and an Assistant United States Attorney for the United States Attorney’s Office of the District of Massachusetts (1986-95), including Chief of the Criminal Division (1993-1995). Mr. Chiel is a director on the boards of the Boston Bar Foundation and the Maimonides School.
Abigail P. Johnson (1961)
Year of Election or Appointment: 2009
Trustee
Chairman of the Board of Trustees
Ms. Johnson also serves as Trustee of other Fidelity® funds. Ms. Johnson serves as Chairman (2016-present), Chief Executive Officer (2014-present), and Director (2007-present) of FMR LLC (diversified financial services company), President of Fidelity Financial Services (2012-present) and President of Personal, Workplace and Institutional Services (2005-present). Ms. Johnson is Chairman and Director of FMR Co., Inc. (investment adviser firm, 2011-present) and Chairman and Director of FMR (investment adviser firm, 2011-present). Previously, Ms. Johnson served as Vice Chairman (2007-2016) and President (2013-2016) of FMR LLC, President and a Director of FMR (2001-2005), a Trustee of other investment companies advised by FMR, Fidelity Investments Money Management, Inc. (investment adviser firm), and FMR Co., Inc. (2001-2005), Senior Vice President of the Fidelity® funds (2001-2005), and managed a number of Fidelity® funds. Ms. Abigail P. Johnson and Mr. Arthur E. Johnson are not related.
Jennifer Toolin McAuliffe (1959)
Year of Election or Appointment: 2016
Trustee
Ms. McAuliffe also serves as Trustee of other Fidelity® funds. Ms. McAuliffe previously served as a Member of the Advisory Board of certain Fidelity® funds (2016) and as Co-Head of Fixed Income of Fidelity Investments Limited (now known as FIL Limited (FIL)) (diversified financial services company). Earlier roles at FIL included Director of Research for FIL’s credit and quantitative teams in London, Hong Kong and Tokyo. Ms. McAuliffe also was the Director of Research for taxable and municipal bonds at Fidelity Investments Money Management, Inc. Ms. McAuliffe is also a director or trustee of several not-for-profit entities.
* Determined to be an “Interested Trustee” by virtue of, among other things, his or her affiliation with the trust or various entities under common control with FMR.
+ The information includes the Trustee's principal occupation during the last five years and other information relating to the experience, attributes, and skills relevant to the Trustee's qualifications to serve as a Trustee, which led to the conclusion that the Trustee should serve as a Trustee for the fund.
Independent Trustees:
Correspondence intended for an Independent Trustee may be sent to Fidelity Investments, P.O. Box 55235, Boston, Massachusetts 02205-5235.
Name, Year of Birth; Principal Occupations and Other Relevant Experience+
Elizabeth S. Acton (1951)
Year of Election or Appointment: 2013
Trustee
Ms. Acton also serves as Trustee of other Fidelity® funds. Prior to her retirement in April 2012, Ms. Acton was Executive Vice President, Finance (2011-2012), Executive Vice President, Chief Financial Officer (2002-2011), and Treasurer (2004-2005) of Comerica Incorporated (financial services). Prior to joining Comerica, Ms. Acton held a variety of positions at Ford Motor Company (1983-2002), including Vice President and Treasurer (2000-2002) and Executive Vice President and Chief Financial Officer of Ford Motor Credit Company (1998-2000). Ms. Acton currently serves as a member of the Board of Directors and Audit and Finance Committees of Beazer Homes USA, Inc. (homebuilding, 2012-present). Previously, Ms. Acton served as a Member of the Advisory Board of certain Fidelity® funds (2013-2016).
Ann E. Dunwoody (1953)
Year of Election or Appointment: 2018
Trustee
General Dunwoody also serves as Trustee of other Fidelity® funds. General Dunwoody (United States Army, Retired) was the first woman in U.S. military history to achieve the rank of four-star general and prior to her retirement in 2012 held a variety of positions within the U.S. Army, including Commanding General, U.S. Army Material Command (2008-2012). She is the President of First to Four LLC (leadership and mentoring services, 2012-present). She also serves as a member of the Board of Directors and Nominating and Corporate Governance Committee of L3 Technologies, Inc. (communication, electronic, sensor, and aerospace systems, 2013-present), Board of Directors and Nomination and Corporate Governance Committees of Kforce Inc. (professional staffing services, 2016-present) and Board of Directors of Automattic Inc. (software engineering, 2018-present). Previously, General Dunwoody served as a Member of the Advisory Board of certain Fidelity® funds (2018), a member of the Board of Directors and Audit and Sustainability and Corporate Responsibility Committees of Republic Services, Inc. (waste collection, disposal and recycling, 2013-2016). Ms. Dunwoody also serves on several boards for non-profit organizations, including as a member of the Board of Directors, Chair of the Nomination and Governance Committee and member of the Audit Committee of Logistics Management Institute (consulting non-profit, 2012-present), a member of the Board of Directors of the Army Historical Foundation (2015-present), a member of the Council of Trustees for the Association of the United States Army (advocacy non-profit, 2013-present) and a member of the Board of Trustees of Florida Institute of Technology (2015-present) and ThanksUSA (military family education non-profit, 2014-present).
John Engler (1948)
Year of Election or Appointment: 2014
Trustee
Mr. Engler also serves as Trustee of other Fidelity® funds. He serves on the board of directors for Universal Forest Products (manufacturer and distributor of wood and wood-alternative products, 2003-present) and K12 Inc. (technology-based education company, 2012-present). Previously, Mr. Engler served as interim president of Michigan State University (2018-2019), a Member of the Advisory Board of certain Fidelity® funds (2014-2016), president of the Business Roundtable (2011-2017), a trustee of The Munder Funds (2003-2014), president and CEO of the National Association of Manufacturers (2004-2011), member of the Board of Trustees of the Annie E. Casey Foundation (2004-2015), and as governor of Michigan (1991-2003). He is a past chairman of the National Governors Association.
Robert F. Gartland (1951)
Year of Election or Appointment: 2010
Trustee
Mr. Gartland also serves as Trustee of other Fidelity® funds. Mr. Gartland is Chairman and an investor in Gartland & Mellina Group Corp. (consulting, 2009-present). Previously, Mr. Gartland served as a partner and investor of Vietnam Partners LLC (investments and consulting, 2008-2011). Prior to his retirement, Mr. Gartland held a variety of positions at Morgan Stanley (financial services, 1979-2007), including Managing Director (1987-2007), and Chase Manhattan Bank (1975-1978).
Arthur E. Johnson (1947)
Year of Election or Appointment: 2008
Trustee
Chairman of the Independent Trustees
Mr. Johnson also serves as Trustee of other Fidelity® funds. Mr. Johnson serves as a member of the Board of Directors of Eaton Corporation plc (diversified power management, 2009-present) and Booz Allen Hamilton (management consulting, 2011-present). Prior to his retirement, Mr. Johnson served as Senior Vice President of Corporate Strategic Development of Lockheed Martin Corporation (defense contractor, 1999-2009). He previously served on the Board of Directors of IKON Office Solutions, Inc. (1999-2008), AGL Resources, Inc. (holding company, 2002-2016), and Delta Airlines (2005-2007). Mr. Arthur E. Johnson is not related to Ms. Abigail P. Johnson.
Michael E. Kenneally (1954)
Year of Election or Appointment: 2009
Trustee
Vice Chairman of the Independent Trustees
Mr. Kenneally also serves as Trustee of other Fidelity® funds. Prior to his retirement, Mr. Kenneally served as Chairman and Global Chief Executive Officer of Credit Suisse Asset Management. Before joining Credit Suisse, he was an Executive Vice President and Chief Investment Officer for Bank of America Corporation. Earlier roles at Bank of America included Director of Research, Senior Portfolio Manager and Research Analyst, and Mr. Kenneally was awarded the Chartered Financial Analyst (CFA) designation in 1991.
Marie L. Knowles (1946)
Year of Election or Appointment: 2001
Trustee
Ms. Knowles also serves as Trustee of other Fidelity® funds. Prior to Ms. Knowles' retirement in June 2000, she served as Executive Vice President and Chief Financial Officer of Atlantic Richfield Company (ARCO) (diversified energy, 1996-2000). From 1993 to 1996, she was a Senior Vice President of ARCO and President of ARCO Transportation Company (pipeline and tanker operations). Ms. Knowles currently serves as a Director and Chairman of the Audit Committee of McKesson Corporation (healthcare service, since 2002). Ms. Knowles is a member of the Board of the Santa Catalina Island Company (real estate, 2009-present). Ms. Knowles is a Member of the Investment Company Institute Board of Governors and a Member of the Governing Council of the Independent Directors Council (2014-present). She also serves as a member of the Advisory Board for the School of Engineering of the University of Southern California. Previously, Ms. Knowles served as a Director of Phelps Dodge Corporation (copper mining and manufacturing, 1994-2007), URS Corporation (engineering and construction, 2000-2003) and America West (airline, 1999-2002). Ms. Knowles previously served as Chairman (2015-2018) and Vice Chairman (2012-2015) of the Independent Trustees of certain Fidelity® funds.
Mark A. Murray (1954)
Year of Election or Appointment: 2016
Trustee
Mr. Murray also serves as Trustee of other Fidelity® funds. Mr. Murray is Vice Chairman (2013-present) of Meijer, Inc. (regional retail chain). Previously, Mr. Murray served as a Member of the Advisory Board of certain Fidelity® funds (2016) and as Co-Chief Executive Officer (2013-2016) and President (2006-2013) of Meijer, Inc. Mr. Murray serves as a member of the Board of Directors and Nuclear Review and Public Policy and Responsibility Committees of DTE Energy Company (diversified energy company, 2009-present). Mr. Murray also serves as a member of the Board of Directors of Spectrum Health (not-for-profit health system, 2015-present). Mr. Murray previously served as President of Grand Valley State University (2001-2006), Treasurer for the State of Michigan (1999-2001), Vice President of Finance and Administration for Michigan State University (1998-1999), and a member of the Board of Directors and Audit Committee and Chairman of the Nominating and Corporate Governance Committee of Universal Forest Products, Inc. (manufacturer and distributor of wood and wood-alternative products, 2004-2016). Mr. Murray is also a director or trustee of many community and professional organizations.
+ The information includes the Trustee's principal occupation during the last five years and other information relating to the experience, attributes, and skills relevant to the Trustee's qualifications to serve as a Trustee, which led to the conclusion that the Trustee should serve as a Trustee for the fund.
Advisory Board Members and Officers:
Correspondence intended for an officer may be sent to Fidelity Investments, 245 Summer Street, Boston, Massachusetts 02210. Officers appear below in alphabetical order.
Name, Year of Birth; Principal Occupation
Elizabeth Paige Baumann (1968)
Year of Election or Appointment: 2017
Anti-Money Laundering (AML) Officer
Ms. Baumann also serves as AML Officer of other funds. She is Chief AML Officer (2012-present) and Senior Vice President (2014-present) of FMR LLC (diversified financial services company) and is an employee of Fidelity Investments. Previously, Ms. Baumann served as AML Officer of the funds (2012-2016), and Vice President (2007-2014) and Deputy Anti-Money Laundering Officer (2007-2012) of FMR LLC.
Craig S. Brown (1977)
Year of Election or Appointment: 2019
Assistant Treasurer
Mr. Brown also serves as Assistant Treasurer of other funds. Mr. Brown is an employee of Fidelity Investments (2013-present).
John J. Burke III (1964)
Year of Election or Appointment: 2018
Chief Financial Officer
Mr. Burke also serves as Chief Financial Officer of other funds. Mr. Burke serves as Head of Investment Operations for Fidelity Fund and Investment Operations (2018-present) and is an employee of Fidelity Investments (1998-present). Previously Mr. Burke served as head of Asset Management Investment Operations (2012-2018).
William C. Coffey (1969)
Year of Election or Appointment: 2018
Secretary and Chief Legal Officer (CLO)
Mr. Coffey also serves as Secretary and CLO of other funds. Mr. Coffey serves as CLO, Secretary, and Senior Vice President of Fidelity Management & Research Company and FMR Co., Inc. (investment adviser firms, 2018-present); Secretary of Fidelity SelectCo, LLC and Fidelity Investments Money Management, Inc. (investment adviser firms, 2018-present); and CLO of Fidelity Management & Research (Hong Kong) Limited, FMR Investment Management (UK) Limited, and Fidelity Management & Research (Japan) Limited (investment adviser firms, 2018-present). He is Senior Vice President and Deputy General Counsel of FMR LLC (diversified financial services company, 2010-present), and is an employee of Fidelity Investments. Previously, Mr. Coffey served as Assistant Secretary of certain funds (2009-2018) and as Vice President and Associate General Counsel of FMR LLC (2005-2009).
Jonathan Davis (1968)
Year of Election or Appointment: 2010
Assistant Treasurer
Mr. Davis also serves as Assistant Treasurer of other funds. Mr. Davis serves as Assistant Treasurer of FMR Capital, Inc. (2017-present) and is an employee of Fidelity Investments. Previously, Mr. Davis served as Vice President and Associate General Counsel of FMR LLC (diversified financial services company, 2003-2010).
Adrien E. Deberghes (1967)
Year of Election or Appointment: 2010
Assistant Treasurer
Mr. Deberghes also serves as an officer of other funds. He serves as Assistant Treasurer of FMR Capital, Inc. (2017-present), Executive Vice President of Fidelity Investments Money Management, Inc. (FIMM) (investment adviser firm, 2016-present), and is an employee of Fidelity Investments (2008-present). Previously, Mr. Deberghes served as President and Treasurer of certain Fidelity® funds (2013-2018). Prior to joining Fidelity Investments, Mr. Deberghes was Senior Vice President of Mutual Fund Administration at State Street Corporation (2007-2008), Senior Director of Mutual Fund Administration at Investors Bank & Trust (2005-2007), and Director of Finance for Dunkin' Brands (2000-2005). Previously, Mr. Deberghes served in other fund officer roles.
Laura M. Del Prato (1964)
Year of Election or Appointment: 2018
President and Treasurer
Ms. Del Prato also serves as an officer of other funds. Ms. Del Prato is an employee of Fidelity Investments (2017-present). Prior to joining Fidelity Investments, Ms. Del Prato served as a Managing Director and Treasurer of the JPMorgan Mutual Funds (2014-2017). Prior to JPMorgan, Ms. Del Prato served as a partner at Cohen Fund Audit Services (accounting firm, 2012-2013) and KPMG LLP (accounting firm, 2004-2012).
Colm A. Hogan (1973)
Year of Election or Appointment: 2016
Assistant Treasurer
Mr. Hogan also serves as an officer of other funds. Mr. Hogan serves as Assistant Treasurer of FMR Capital, Inc. (2017-present) and is an employee of Fidelity Investments (2005-present). Previously, Mr. Hogan served as Assistant Treasurer of certain Fidelity® funds (2016-2018).
Chris Maher (1972)
Year of Election or Appointment: 2013
Assistant Treasurer
Mr. Maher serves as Assistant Treasurer of other funds. Mr. Maher is Vice President of Valuation Oversight, serves as Assistant Treasurer of FMR Capital, Inc. (2017-present), and is an employee of Fidelity Investments. Previously, Mr. Maher served as Vice President of Asset Management Compliance (2013), Vice President of the Program Management Group of FMR (investment adviser firm, 2010-2013), and Vice President of Valuation Oversight (2008-2010).
John B. McGinty, Jr. (1962)
Year of Election or Appointment: 2016
Chief Compliance Officer
Mr. McGinty also serves as Chief Compliance Officer of other funds. Mr. McGinty is Senior Vice President of Asset Management Compliance for Fidelity Investments and is an employee of Fidelity Investments (2016-present). Mr. McGinty previously served as Vice President, Senior Attorney at Eaton Vance Management (investment management firm, 2015-2016), and prior to Eaton Vance as global CCO for all firm operations and registered investment companies at GMO LLC (investment management firm, 2009-2015). Before joining GMO LLC, Mr. McGinty served as Senior Vice President, Deputy General Counsel for Fidelity Investments (2007-2009).
Jason P. Pogorelec (1975)
Year of Election or Appointment: 2015
Assistant Secretary
Mr. Pogorelec also serves as Assistant Secretary of other funds. Mr. Pogorelec serves as Vice President, Associate General Counsel (2010-present) and is an employee of Fidelity Investments (2006-present).
Nancy D. Prior (1967)
Year of Election or Appointment: 2014
Vice President
Ms. Prior also serves as Vice President of other funds. Ms. Prior serves as President Fixed Income, High Income/Emerging Market Debt and Multi Asset Class Strategies of FIAM LLC (2018-present), President (2016-present) and Director (2014-present) of Fidelity Investments Money Management, Inc. (FIMM) (investment adviser firm), President, Fixed Income (2014-present), and is an employee of Fidelity Investments (2002-present). Previously, Ms. Prior served as Vice Chairman of FIAM LLC (investment adviser firm, 2014-2018), a Director of FMR Investment Management (UK) Limited (investment adviser firm, 2015-2018), President Multi-Asset Class Strategies of FMR's Global Asset Allocation Division (2017-2018), Vice President of Fidelity's Money Market Funds (2012-2014), President, Money Market and Short Duration Bond Group of Fidelity Management & Research (FMR) (investment adviser firm, 2013-2014), President, Money Market Group of FMR (2011-2013), Managing Director of Research (2009-2011), Senior Vice President and Deputy General Counsel (2007-2009), and Assistant Secretary of certain Fidelity® funds (2008-2009).
Stacie M. Smith (1974)
Year of Election or Appointment: 2013
Assistant Treasurer
Ms. Smith also serves as an officer of other funds. Ms. Smith serves as Assistant Treasurer of FMR Capital, Inc. (2017-present), is an employee of Fidelity Investments (2009-present), and has served in other fund officer roles. Prior to joining Fidelity Investments, Ms. Smith served as Senior Audit Manager of Ernst & Young LLP (accounting firm, 1996-2009). Previously, Ms. Smith served as Assistant Treasurer (2013-2018) and Deputy Treasurer (2013-2016) of certain Fidelity® funds.
Marc L. Spector (1972)
Year of Election or Appointment: 2016
Deputy Treasurer
Mr. Spector also serves as an officer of other funds. Mr. Spector serves as Assistant Treasurer of FMR Capital, Inc. (2017-present) and is an employee of Fidelity Investments (2016-present). Prior to joining Fidelity Investments, Mr. Spector served as Director at the Siegfried Group (accounting firm, 2013-2016), and prior to Siegfried Group as audit senior manager at Deloitte & Touche (accounting firm, 2005-2013).
Jim Wegmann (1979)
Year of Election or Appointment: 2019
Assistant Treasurer
Mr. Wegmann also serves as Assistant Treasurer of other funds. Mr. Wegmann is an employee of Fidelity Investments (2011-present).
Shareholder Expense Example
As a shareholder of the Fund, you incur two types of costs: (1) transaction costs and (2) ongoing costs, including management fees and other Fund expenses. This Example is intended to help you understand your ongoing costs (in dollars) of investing in the Fund and to compare these costs with the ongoing costs of investing in other mutual funds.
The actual expense Example is based on an investment of $1,000 invested at the beginning of the period and held for the entire period (October 2, 2018 to December 31, 2018). The hypothetical expense Example is based on an investment of $1,000 invested for the one-half year period (July 1, 2018 to December 31, 2018).
Actual Expenses
The first line of the accompanying table provides information about actual account values and actual expenses. You may use the information in this line, together with the amount you invested, to estimate the expenses that you paid over the period. Simply divide your account value by $1,000.00 (for example, an $8,600 account value divided by $1,000.00 = 8.6), then multiply the result by the number in the first line under the heading entitled "Expenses Paid During Period" to estimate the expenses you paid on your account during this period. In addition, the Fund, as a shareholder in the underlying Fidelity Central Funds, will indirectly bear its pro-rata share of the fees and expenses incurred by the underlying Fidelity Central Funds. These fees and expenses are not included in the Fund's annualized expense ratio used to calculate the expense estimate in the table below.
Hypothetical Example for Comparison Purposes
The second line of the accompanying table provides information about hypothetical account values and hypothetical expenses based on the Fund's actual expense ratio and an assumed rate of return of 5% per year before expenses, which is not the Fund's actual return. The hypothetical account values and expenses may not be used to estimate the actual ending account balance or expenses you paid for the period. You may use this information to compare the ongoing costs of investing in the Fund and other funds. To do so, compare this 5% hypothetical example with the 5% hypothetical examples that appear in the shareholder reports of the other funds. In addition, the Fund, as a shareholder in the underlying Fidelity Central Funds, will indirectly bear its pro-rata share of the fees and expenses incurred by the underlying Fidelity Central Funds. These fees and expenses are not included in the Fund's annualized expense ratio used to calculate the expense estimate in the table below.
Please note that the expenses shown in the table are meant to highlight your ongoing costs only and do not reflect any transaction costs. Therefore, the second line of the table is useful in comparing ongoing costs only, and will not help you determine the relative total costs of owning different funds.
| | Annualized Expense Ratio-A | Beginning
Account Value | Ending
Account Value
December 31, 2018 | Expenses Paid
During Period |
| Actual | .36% | $1,000.00 | $1,026.70 | $.91-B |
| Hypothetical-C | | $1,000.00 | $1,023.39 | $1.84-D |
A Annualized expense ratio reflects expenses net of applicable fee waivers.
B Actual expenses are equal to the Fund's annualized expense ratio, multiplied by the average account value over the period, multiplied by 91/365 (to reflect the period October 2, 2018 to December 31, 2018).
C 5% return per year before expenses
D Hypothetical expenses are equal to the Fund's annualized expense ratio, multiplied by the average account value over the period, multiplied by 184/365 (to reflect the one-half year period).
Distributions (Unaudited)
The Board of Trustees of Fidelity SAI Municipal Income Fund voted to pay on February 11, 2019 to shareholders of record at the opening of business on February 8, 2019, a distribution of $0.001 per share derived from capital gains realized from sales of portfolio securities.
During fiscal year ended 2018, 100% of the fund's income dividends was free from federal income tax, and 18.33% of the fund's income dividends was subject to the federal alternative minimum tax.
The fund will notify shareholders in January 2019 of amounts for use in preparing 2018 income tax returns.
Board Approval of Investment Advisory Contracts and Management Fees
Fidelity SAI Municipal Income Fund
On March 8, 2018, the Board of Trustees, including the Independent Trustees (together, the Board), voted to approve the management contract with Fidelity Management & Research Company (FMR) and the sub-advisory agreements with affiliates of FMR (together, the Advisory Contracts) for the fund. FMR and the sub-advisers are collectively referred to herein as the Investment Advisers. The Board, assisted by the advice of fund counsel and Independent Trustees' counsel, considered a broad range of information.
Nature, Extent, and Quality of Services Provided. The Board considered Fidelity's staffing as it relates to the fund, including the backgrounds of investment personnel of Fidelity, and also considered the fund's investment objective, strategies, and related investment philosophy. The Board considered the structure of the investment personnel compensation program and whether this structure provides appropriate incentives to act in the best interests of the fund.
Resources Dedicated to Investment Management and Support Services. The Board reviewed the general qualifications and capabilities of Fidelity's investment staff, including its size, education, experience, and resources, as well as Fidelity's approach to recruiting, managing, and compensating investment personnel. The Board noted that Fidelity has continued to increase the resources devoted to non-U.S. offices, including expansion of Fidelity's global investment organization. The Board also noted that Fidelity's analysts have extensive resources, tools and capabilities that allow them to conduct sophisticated quantitative and fundamental analysis, as well as credit analysis of issuers, counterparties and guarantors. Further, the Board considered that Fidelity's investment professionals have sufficient access to global information and data so as to provide competitive investment results over time, and that those professionals also have access to sophisticated tools that permit them to assess portfolio construction and risk and performance attribution characteristics continuously, as well as to transmit new information and research conclusions rapidly around the world. Additionally, in its deliberations, the Board considered Fidelity's trading, risk management, compliance, and technology and operationscapabilities and resources, which are integral parts of the investment management process. The Board also considered its familiarity with Fidelity's management of other fixed income index funds overseen by the Board.
Shareholder and Administrative Services. The Board considered the nature, extent, quality, and cost of advisory, administrative, and shareholder services to be performed by the Investment Advisers and their affiliates under the Advisory Contracts and under separate agreements covering transfer agency and pricing and bookkeeping services for the fund. The Board also considered the nature and extent of the supervision of third party service providers, principally custodians, subcustodians, and pricing vendors.
The Board noted that the growth of fund assets over time across the complex allows Fidelity to reinvest in the development of services designed to enhance the value or convenience of the Fidelity funds as investment vehicles. These services include 24-hour access to account information and market information through telephone representatives and over the Internet, investor education materials and asset allocation tools, and the expanded availability of Fidelity Investor Centers.
Investment Performance. The fund is a new fund and therefore had no historical performance for the Board to review at the time it approved the fund's Advisory Contracts. The Board considered the Investment Advisers' strength in fundamental, research-driven security selection, which the Board is familiar with through its supervision of other Fidelity funds.
Based on its review, the Board concluded that the nature, extent, and quality of services to be provided to the fund under the Advisory Contracts should benefit the shareholders of the fund.
Competitiveness of Management Fee and Total Expense Ratio ..In reviewing the Advisory Contracts, the Board considered the fund's proposed management fee rate and the projected total expense ratio of the fund. The Board noted that the fund's proposed management fee rate is lower than the median fee rate of funds with similar Lipper investment objective categories and comparable investment mandates, regardless of whether their management fee structures are comparable. The Board also considered that the projected total expense ratio of the fund is below the median for those funds and classes used by the Board for management fee comparisons that have a similar sales load structure, after taking into account the contractual expense cap discussed below.
The Board also noted that FMR has contractually agreed to reimburse the fund to the extent that total operating expenses (excluding interest, certain taxes, certain securities lending costs, brokerage commissions, fees and expenses of the Independent Trustees, proxy and shareholder meeting expenses, extraordinary expenses, and acquired fund fees and expenses, if any), as a percentage of its average net assets, exceed 0.36% through February 29, 2020.
Based on its review, the Board concluded that the fund's management fee and projected total expense ratio were reasonable in light of the services that the fund and its shareholders will receive and the other factors considered.
Costs of the Services and Profitability. The fund is a new fund and therefore no revenue, cost, or profitability data was available for the Board to review in respect of the fund at the time it approved the Advisory Contracts. In connection with its future renewal of the fund's Advisory Contracts, the Board will consider the revenues earned and the expenses incurred by Fidelity in conducting the business of developing, marketing, distributing, managing, administering and servicing the fund and servicing the fund's shareholders.
Economies of Scale. The Board will consider economies of scale when there is operating experience to permit assessment thereof. The Board noted that the fund and its shareholders would have access to the very considerable number and variety of services available through Fidelity and its affiliates.
Based on its evaluation of all of the conclusions noted above, and after considering all factors it believed relevant, the Board concluded that the advisory fee structures are fair and reasonable, and that the fund's Advisory Contracts should be approved.
Corporate Headquarters
245 Summer St.
Boston, MA 02210
www.fidelity.com
SIM-ANN-0219
1.9887613.100
Item 2.
Code of Ethics
As of the end of the period, December 31, 2018, Fidelity Salem Street Trust (the trust) has adopted a code of ethics, as defined in Item 2 of Form N-CSR, that applies to its President and Treasurer and its Chief Financial Officer. A copy of the code of ethics is filed as an exhibit to this Form N-CSR.
Item 3.
Audit Committee Financial Expert
The Board of Trustees of the trust has determined that Elizabeth S. Acton is an audit committee financial expert, as defined in Item 3 of Form N-CSR. Ms. Acton is independent for purposes of Item 3 of Form N-CSR.
Item 4.
Principal Accountant Fees and Services
Fees and Services
The following table presents fees billed by Deloitte & Touche LLP, the member firms of Deloitte Touche Tohmatsu, and their respective affiliates (collectively, “Deloitte Entities”) in each of the last two fiscal years for services rendered to Fidelity Series Inflation-Protected Bond Index Fund (the “Fund”):
Services Billed by Deloitte Entities
December 31, 2018 FeesA
| | | | |
| Audit Fees | Audit-Related Fees | Tax Fees | All Other Fees |
Fidelity Series Inflation-Protected Bond Index Fund | $48,000 | $100 | $6,300 | $1,400 |
| | | | |
| Audit Fees | Audit-Related Fees | Tax Fees | All Other Fees |
Fidelity Series Inflation-Protected Bond Index Fund | $50,000 | $100 | $6,400 | $1,400 |
AAmounts may reflect rounding.
The following table presents fees billed by PricewaterhouseCoopers LLP (“PwC”) in each of the last two fiscal years for services rendered to Fidelity Flex Inflation-Protected Bond Index Fund, Fidelity Inflation-Protected Bond Index Fund and Fidelity SAI Municipal Income Fund (the “Funds”):
Services Billed by PwC
December 31, 2018 FeesA,B
| | | | |
| Audit Fees | Audit-Related Fees | Tax Fees | All Other Fees |
Fidelity Flex Inflation-Protected Bond Index Fund | $31,000 | $2,700 | $3,200 | $1,600 |
Fidelity Inflation-Protected Bond Index Fund | $55,000 | $4,000 | $11,400 | $2,300 |
Fidelity SAI Municipal Income Fund | $48,000 | $700 | $2,200 | $400 |
December 31, 2017 FeesA,B,C
| | | | |
| Audit Fees | Audit-Related Fees | Tax Fees | All Other Fees |
Fidelity Flex Inflation-Protected Bond Index Fund | $48,000 | $3,200 | $2,400 | $1,600 |
Fidelity Inflation-Protected Bond Index Fund | $36,000 | $3,300 | $2,400 | $1,700 |
Fidelity SAI Municipal Income Fund | $- | $- | $- | $- |
AAmounts may reflect rounding
BFidelity SAI Municipal Income Fund commenced operations on October 2, 2018.
CFidelity Flex Inflation-Protected Bond Index Fund commenced operations on March 9, 2017.
The following table presents fees billed by PwC and Deloitte Entities that were required to be approved by the Audit Committee for services that relate directly to the operations and financial reporting of the Funds and that are rendered on behalf of Fidelity Management & Research Company (“FMR”) and entities controlling, controlled by, or under common control with FMR (not including any sub-adviser whose role is primarily portfolio management and is subcontracted with or overseen by another investment adviser) that provide ongoing services to the Funds (“Fund Service Providers”):
Services Billed by Deloitte Entities
| | |
| December 31, 2018A | December 31, 2017A |
Audit-Related Fees | $290,000 | $- |
Tax Fees | $5,000 | $25,000 |
All Other Fees | $- | $- |
A Amounts may reflect rounding.
Services Billed by PwC
| | |
| December 31, 2018A,B | December 31, 2017A,B,C |
Audit-Related Fees | $7,930,000 | $8,470,000 |
Tax Fees | $20,000 | $160,000 |
All Other Fees | $- | $- |
A Amounts may reflect rounding.
BMay include amounts billed prior to the Fidelity SAI Municipal Income Fund’s commencement of operations.
CMay include amounts billed prior to the Fidelity Flex Inflation-Protected Bond Index Fund’s commencement of operations.
“Audit-Related Fees” represent fees billed for assurance and related services that are reasonably related to the performance of the fund audit or the review of the fund's financial statements and that are not reported under Audit Fees.
“Tax Fees” represent fees billed for tax compliance, tax advice or tax planning that relate directly to the operations and financial reporting of the fund.
“All Other Fees” represent fees billed for services provided to the fund or Fund Service Provider, a significant portion of which are assurance related, that relate directly to the operations and financial reporting of the fund, excluding those services that are reported under Audit Fees, Audit-Related Fees or Tax Fees.
Assurance services must be performed by an independent public accountant.
* * *
The aggregate non-audit fees billed by PwC and Deloitte Entities for services rendered to the Funds, FMR (not including any sub-adviser whose role is primarily portfolio management and is subcontracted with or overseen by another investment adviser), and any Fund Service Provider for each of the last two fiscal years of the Funds are as follows:
| | |
Billed By | December 31, 2018A,B | December 31, 2017A,B,C |
Deloitte Entities | $765,000 | $315,000 |
PwC | $11,155,000 | $10,730,000 |
A Amounts may reflect rounding.
BMay include amounts billed prior to the Fidelity SAI Municipal Income Fund’s commencement of operations.
CMay include amounts billed prior to the Fidelity Flex Inflation-Protected Bond Index Fund’s commencement of operations.
The trust's Audit Committee has considered non-audit services that were not pre-approved that were provided by PwC and Deloitte Entities to Fund Service Providers to be compatible with maintaining the independence of PwC and Deloitte Entities in their audits of the Funds, taking into account representations from PwC and Deloitte Entities, in accordance with Public Company Accounting Oversight Board rules, regarding their independence from the Funds and their related entities and FMR’s review of the appropriateness and permissibility under applicable law of such non-audit services prior to their provision to the Fund Service Providers.
Audit Committee Pre-Approval Policies and Procedures
The trust’s Audit Committee must pre-approve all audit and non-audit services provided by a fund’s independent registered public accounting firm relating to the operations or financial reporting of the fund. Prior to the commencement of any audit or non-audit services to a fund, the Audit Committee reviews the services to determine whether they are appropriate and permissible under applicable law.
The Audit Committee has adopted policies and procedures to, among other purposes, provide a framework for the Committee’s consideration of non-audit services by the audit firms that audit the Fidelity funds. The policies and procedures require that any non-audit service provided by a fund audit firm to a Fidelity fund and any non-audit service provided by a fund auditor to a Fund Service Provider that relates directly to the operations and financial reporting of a Fidelity fund (“Covered Service”) are subject to approval by the Audit Committee before such service is provided.
All Covered Services must be approved in advance of provision of the service either: (i) by formal resolution of the Audit Committee, or (ii) by oral or written approval of the service by the Chair of the Audit Committee (or if the Chair is unavailable, such other member of the Audit Committee as may be designated by the Chair to act in the Chair’s absence). The approval contemplated by (ii) above is permitted where the Treasurer determines that action on such an engagement is necessary before the next meeting of the Audit Committee.
Non-audit services provided by a fund audit firm to a Fund Service Provider that do not relate directly to the operations and financial reporting of a Fidelity fund are reported to the Audit Committee periodically.
Non-Audit Services Approved Pursuant to Rule 2-01(c)(7)(i)(C) and (ii) of Regulation S-X (“De Minimis Exception”)
There were no non-audit services approved or required to be approved by the Audit Committee pursuant to the De Minimis Exception during the Funds’ last two fiscal years relating to services provided to (i) the Funds or (ii) any Fund Service Provider that relate directly to the operations and financial reporting of the Funds.
Item 5.
Audit Committee of Listed Registrants
Not applicable.
Item 6.
Investments
(a)
Not applicable.
(b)
Not applicable
Item 7.
Disclosure of Proxy Voting Policies and Procedures for Closed-End Management Investment Companies
Not applicable.
Item 8.
Portfolio Managers of Closed-End Management Investment Companies
Not applicable.
Item 9.
Purchase of Equity Securities by Closed-End Management Investment Company and Affiliated Purchasers
Not applicable.
Item 10.
Submission of Matters to a Vote of Security Holders
There were no material changes to the procedures by which shareholders may recommend nominees to the trust’s Board of Trustees.
Item 11.
Controls and Procedures
(a)(i) The President and Treasurer and the Chief Financial Officer have concluded that the trust’s disclosure controls and procedures (as defined in Rule 30a-3(c) under the Investment Company Act) provide reasonable assurances that material information relating to the trust is made known to them by the appropriate persons, based on their evaluation of these controls and procedures as of a date within 90 days of the filing date of this report.
(a)(ii) There was no change in the trust’s internal control over financial reporting (as defined in Rule 30a-3(d) under the Investment Company Act) that occurred during the period covered by this report that has materially affected, or is reasonably likely to materially affect, the trust’s internal control over financial reporting.
Item 12.
Disclosure of Securities Lending Activities for Closed-End Management
Investment Companies
Not applicable.
Item 13.
Exhibits
| | |
(a) | (1) | Code of Ethics pursuant to Item 2 of Form N-CSR is filed and attached hereto as EX-99.CODE ETH. |
(a) | (2) | Certification pursuant to Rule 30a-2(a) under the Investment Company Act of 1940 (17 CFR 270.30a-2(a)) is filed and attached hereto as Exhibit 99.CERT. |
(a) | (3) | Not applicable. |
(b) | | Certification pursuant to Rule 30a-2(b) under the Investment Company Act of 1940 (17 CFR 270.30a-2(b)) is furnished and attached hereto as Exhibit 99.906CERT. |
SIGNATURES
Pursuant to the requirements of the Securities Exchange Act of 1934 and the Investment Company Act of 1940, the registrant has duly caused this report to be signed on its behalf by the undersigned, thereunto duly authorized.
Fidelity Salem Street Trust
| |
By: | /s/Laura M. Del Prato |
| Laura M. Del Prato |
| President and Treasurer |
| |
Date: | February 26, 2019 |
Pursuant to the requirements of the Securities Exchange Act of 1934 and the Investment Company Act of 1940, this report has been signed below by the following persons on behalf of the registrant and in the capacities and on the dates indicated.
| |
By: | /s/Laura M. Del Prato |
| Laura M. Del Prato |
| President and Treasurer |
| |
Date: | February 26, 2019 |
| |
By: | /s/John J. Burke III |
| John J. Burke III |
| Chief Financial Officer |
| |
Date: | February 26, 2019 |