UNITED STATES
SECURITIES AND EXCHANGE COMMISSION
Washington, D.C. 20549
FORM N-CSR
CERTIFIED SHAREHOLDER REPORT OF REGISTERED
MANAGEMENT INVESTMENT COMPANIES
Investment Company Act file number 811-02105
Fidelity Salem Street Trust
(Exact name of registrant as specified in charter)
245 Summer St., Boston, Massachusetts 02210
(Address of principal executive offices) (Zip code)
Cynthia Lo Bessette, Secretary
245 Summer St.
Boston, Massachusetts 02210
(Name and address of agent for service)
Registrant's telephone number, including area code:
617-563-7000
| |
Date of fiscal year end: | July 31 |
|
|
Date of reporting period: | July 31, 2020 |
Item 1.
Reports to Stockholders
Fidelity® Real Estate Index Fund
Annual Report
July 31, 2020

See the inside front cover for important information about access to your fund’s shareholder reports.

Beginning on January 1, 2021, as permitted by regulations adopted by the Securities and Exchange Commission, paper copies of a fund’s shareholder reports will no longer be sent by mail, unless you specifically request paper copies of the reports from the fund or from your financial intermediary, such as a financial advisor, broker-dealer or bank. Instead, the reports will be made available on a website, and you will be notified by mail each time a report is posted and provided with a website link to access the report.
If you already elected to receive shareholder reports electronically, you will not be affected by this change and you need not take any action. You may elect to receive shareholder reports and other communications from a fund electronically, by contacting your financial intermediary. For Fidelity customers, visit Fidelity's web site or call Fidelity using the contact information listed below.
You may elect to receive all future reports in paper free of charge. If you wish to continue receiving paper copies of your shareholder reports, you may contact your financial intermediary or, if you are a Fidelity customer, visit Fidelity’s website, or call Fidelity at the applicable toll-free number listed below. Your election to receive reports in paper will apply to all funds held with the fund complex/your financial intermediary.
| Account Type | Website | Phone Number |
| Brokerage, Mutual Fund, or Annuity Contracts: | fidelity.com/mailpreferences | 1-800-343-3548 |
| Employer Provided Retirement Accounts: | netbenefits.fidelity.com/preferences (choose 'no' under Required Disclosures to continue to print) | 1-800-343-0860 |
| Advisor Sold Accounts Serviced Through Your Financial Intermediary: | Contact Your Financial Intermediary | Your Financial Intermediary's phone number |
| Advisor Sold Accounts Serviced by Fidelity: | institutional.fidelity.com | 1-877-208-0098 |
Contents
To view a fund's proxy voting guidelines and proxy voting record for the 12-month period ended June 30, visit http://www.fidelity.com/proxyvotingresults or visit the Securities and Exchange Commission's (SEC) web site at http://www.sec.gov.
You may also call 1-800-544-8544 to request a free copy of the proxy voting guidelines.
Standard & Poor's, S&P and S&P 500 are registered service marks of The McGraw-Hill Companies, Inc. and have been licensed for use by Fidelity Distributors Corporation.
Other third-party marks appearing herein are the property of their respective owners.
All other marks appearing herein are registered or unregistered trademarks or service marks of FMR LLC or an affiliated company. © 2020 FMR LLC. All rights reserved.
This report and the financial statements contained herein are submitted for the general information of the shareholders of the Fund. This report is not authorized for distribution to prospective investors in the Fund unless preceded or accompanied by an effective prospectus.
A fund files its complete schedule of portfolio holdings with the SEC for the first and third quarters of each fiscal year on Form N-PORT. Forms N-PORT are available on the SEC’s web site at http://www.sec.gov. A fund's Forms N-PORT may be reviewed and copied at the SEC’s Public Reference Room in Washington, DC. Information regarding the operation of the SEC's Public Reference Room may be obtained by calling 1-800-SEC-0330.
For a complete list of a fund's portfolio holdings, view the most recent holdings listing, semiannual report, or annual report on Fidelity's web site at http://www.fidelity.com, http://www.institutional.fidelity.com, or http://www.401k.com, as applicable.
NOT FDIC INSURED •MAY LOSE VALUE •NO BANK GUARANTEE
Neither the Fund nor Fidelity Distributors Corporation is a bank.
Note to Shareholders:
Early in 2020, the outbreak and spread of a new coronavirus emerged as a public health emergency that had a major influence on financial markets, primarily based on its impact on the global economy and the outlook for corporate earnings. The virus causes a respiratory disease known as COVID-19. On March 11, the World Health Organization declared the COVID-19 outbreak a pandemic, citing sustained risk of further global spread.
In the weeks following, as the crisis worsened, we witnessed an escalating human tragedy with wide-scale social and economic consequences from coronavirus-containment measures. The outbreak of COVID-19 prompted a number of measures to limit the spread, including travel and border restrictions, quarantines, and restrictions on large gatherings. In turn, these resulted in lower consumer activity, diminished demand for a wide range of products and services, disruption in manufacturing and supply chains, and – given the wide variability in outcomes regarding the outbreak – significant market uncertainty and volatility. Amid the turmoil, the U.S. government took unprecedented action – in concert with the U.S. Federal Reserve and central banks around the world – to help support consumers, businesses, and the broader economy, and to limit disruption to the financial system.
The situation continues to unfold, and the extent and duration of its impact on financial markets and the economy remain highly uncertain. Extreme events such as the coronavirus crisis are “exogenous shocks” that can have significant adverse effects on mutual funds and their investments. Although multiple asset classes may be affected by market disruption, the duration and impact may not be the same for all types of assets.
Fidelity is committed to helping you stay informed amid news about COVID-19 and during increased market volatility, and we’re taking extra steps to be responsive to customer needs. We encourage you to visit our websites, where we offer ongoing updates, commentary, and analysis on the markets and our funds.
Performance: The Bottom Line
Average annual total return reflects the change in the value of an investment, assuming reinvestment of distributions from dividend income and capital gains (the profits earned upon the sale of securities that have grown in value, if any) and assuming a constant rate of performance each year. The hypothetical investment and the average annual total returns do not reflect the deduction of taxes that a shareholder would pay on fund distributions or the redemption of fund shares. During periods of reimbursement by Fidelity, a fund’s total return will be greater than it would be had the reimbursement not occurred. How a fund did yesterday is no guarantee of how it will do tomorrow.
Average Annual Total Returns
| For the periods ended July 31, 2020 | Past 1 year | Past 5 years | Life of fundA |
| Fidelity® Real Estate Index Fund | (16.34)% | 1.88% | 6.63% |
A From September 8, 2011
$10,000 Over Life of Fund
Let's say hypothetically that $10,000 was invested in Fidelity® Real Estate Index Fund on September 8, 2011, when the fund started.
The chart shows how the value of your investment would have changed, and also shows how the Dow Jones U.S. Select Real Estate Securities Index℠ performed over the same period.
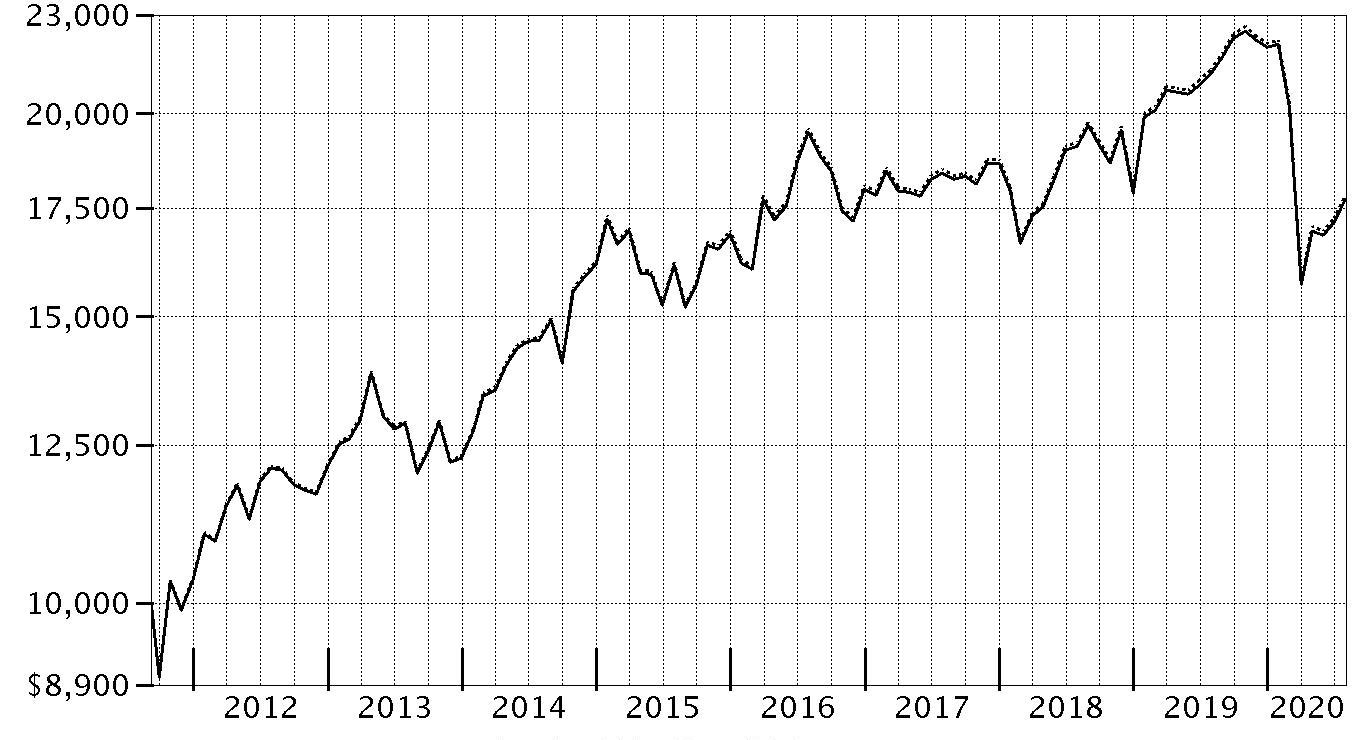
| Period Ending Values |
| $17,712 | Fidelity® Real Estate Index Fund |
| $17,819 | Dow Jones U.S. Select Real Estate Securities Index℠ |
Management's Discussion of Fund Performance
Market Recap: The S&P 500
® index gained 11.96% for the 12 months ending July 31, 2020, in what was a bumpy ride for U.S. equity investors, marked by a steep but brief decline due to the early-2020 outbreak and spread of the coronavirus, followed by a historic rebound. Declared a pandemic on March 11, the COVID-19 crisis and containment efforts caused broad contraction in economic activity, along with extreme uncertainty, volatility and dislocation in financial markets. By mid-March, U.S. stocks entered bear-market territory less than a month after hitting an all-time high and extending the longest-running bull market in American history. Stocks slid in late February, after a surge in COVID-19 cases outside China. The sudden downtrend continued in March (-12%), capping the index’s worst quarter since 2008. A historically rapid and expansive U.S. monetary/fiscal-policy response provided a partial offset to the economic disruption and fueled a sharp uptrend. Aggressive support for financial markets by the U.S. Federal Reserve, plans for reopening the economy and improving infection data boosted stocks in April (+13%) and May (+5%). In June and July, the index gained amid progress on potential treatments and signs of an early recovery in economic activity. For the full 12 months, growth stocks widely topped value, while large-caps handily bested smaller-caps. The information technology sector (+39%) led the way, followed by consumer discretionary (+22%). In contrast, energy (-38%) fell hard along with the price of crude oil.
Comments from the Geode Capital Management, LLC, passive equity index team: For the fiscal year ending July 31, 2020, the fund returned -16.34%, roughly in line with the -16.30% return of the Dow Jones U.S. Select Real Estate Securities Index℠. In an often-challenging market environment for real estate securities, most sectors within the Dow Jones real estate index lost ground. The weakest-performing categories tended to be those involving businesses that heavily depend on social interaction, which became severely limited in the COVID-19 pandemic. Hotel and retail real estate investment trusts (REITs), for example, were particularly poor performers, returning about -52% and -46% in the index, respectively. By far, the biggest individual detractor was mall owner Simon Property Group (-59%). In March, Simon announced the temporary closure of all its retail U.S. properties, a move the company would not begin to reverse until early May. Hotel REIT Host Hotels & Resorts (-35%) also significantly lagged the index, reflecting a sharp drop in demand for lodging as consumers curtailed their travel. Several health care REITs were also meaningful detractors, led by Welltower (-33%) and Ventas (-39%), both of which were hampered by worries about a potential oversupply of senior housing properties. Investor concern about the impact of COVID-19 on demand for senior-housing facilities also appeared to weigh on both stocks. Various apartment REITs also struggled this period, most notably Equity Residential (-30%), AvalonBay Communities (-24%) and Essex Property Trust (-25%). On the positive side, meanwhile, were many real estate owners whose business models remained largely unaffected by social distancing efforts. For example, industrial REITs were particularly strong performers, benefiting from growth in e-commerce and demand for specialized warehouse space. Prologis (+34%) and Duke Realty (+24%) were two particularly strong-performing firms in this category. Data center operators such as Digital Realty Trust (+45%) benefited from growth in data consumption associated with more people working from home. Alexandria Real Estate Equity (+23%), an owner of laboratory space, also contributed this period, helped by demand growth amid a national focus on drug and vaccine research.
The views expressed above reflect those of the portfolio manager(s) only through the end of the period as stated on the cover of this report and do not necessarily represent the views of Fidelity or any other person in the Fidelity organization. Any such views are subject to change at any time based upon market or other conditions and Fidelity disclaims any responsibility to update such views. These views may not be relied on as investment advice and, because investment decisions for a Fidelity fund are based on numerous factors, may not be relied on as an indication of trading intent on behalf of any Fidelity fund.
Investment Summary (Unaudited)
Top Ten Stocks as of July 31, 2020
| | % of fund's net assets |
| Prologis (REIT), Inc. | 11.1 |
| Digital Realty Trust, Inc. | 6.1 |
| Public Storage | 4.2 |
| Alexandria Real Estate Equities, Inc. | 3.2 |
| Welltower, Inc. | 3.2 |
| AvalonBay Communities, Inc. | 3.1 |
| Realty Income Corp. | 2.9 |
| Simon Property Group, Inc. | 2.7 |
| Equity Residential (SBI) | 2.6 |
| Invitation Homes, Inc. | 2.3 |
| | 41.4 |
Top Five REIT Sectors as of July 31, 2020
| | % of fund's net assets |
| REITs - Apartments | 17.7 |
| REITs - Warehouse/Industrial | 16.2 |
| REITs - Diversified | 13.7 |
| REITs - Office Property | 12.1 |
| REITs - Health Care | 9.6 |
Asset Allocation (% of fund's net assets)
| As of July 31, 2020 |
| | Stocks and Equity Futures | 100.1% |
| | Short-Term Investments and Net Other Assets (Liabilities)* | (0.1)% |

* Short-Term Investments and Net Other Assets (Liabilities) are not included in the pie chart
Schedule of Investments July 31, 2020
Showing Percentage of Net Assets
| Common Stocks - 100.0% | | | |
| | | Shares | Value |
| Equity Real Estate Investment Trusts (REITs) - 100.0% | | | |
| REITs - Apartments - 17.7% | | | |
| American Campus Communities, Inc. | | 410,315 | $14,623,627 |
| American Homes 4 Rent Class A | | 766,302 | 22,222,758 |
| Apartment Investment & Management Co. Class A | | 439,494 | 17,061,157 |
| AvalonBay Communities, Inc. | | 415,433 | 63,611,101 |
| Camden Property Trust (SBI) | | 287,160 | 26,077,000 |
| Equity Residential (SBI) | | 1,026,849 | 55,069,912 |
| Essex Property Trust, Inc. | | 193,248 | 42,657,564 |
| Front Yard Residential Corp. Class B | | 159,983 | 1,387,053 |
| Independence Realty Trust, Inc. | | 291,583 | 3,353,205 |
| Investors Real Estate Trust | | 36,333 | 2,626,876 |
| Invitation Homes, Inc. | | 1,625,462 | 48,471,277 |
| Mid-America Apartment Communities, Inc. | | 338,981 | 40,403,111 |
| UDR, Inc. | | 867,443 | 31,401,437 |
| | | | 368,966,078 |
| REITs - Diversified - 13.7% | | | |
| Apple Hospitality (REIT), Inc. | | 624,753 | 5,510,321 |
| Cousins Properties, Inc. | | 443,641 | 13,628,652 |
| Digital Realty Trust, Inc. | | 793,307 | 127,357,506 |
| Duke Realty Corp. | | 1,090,845 | 43,841,061 |
| EPR Properties | | 230,278 | 6,592,859 |
| Global Net Lease, Inc. | | 265,844 | 4,426,303 |
| NexPoint Residential Trust, Inc. | | 67,374 | 2,575,708 |
| PS Business Parks, Inc. | | 58,439 | 8,061,660 |
| Store Capital Corp. | | 663,875 | 15,727,199 |
| Vornado Realty Trust | | 465,617 | 16,073,099 |
| Washington REIT (SBI) | | 232,314 | 5,194,541 |
| WP Carey, Inc. | | 510,320 | 36,421,538 |
| | | | 285,410,447 |
| REITs - Health Care - 9.6% | | | |
| CareTrust (REIT), Inc. | | 290,373 | 5,232,521 |
| Community Healthcare Trust, Inc. | | 68,891 | 3,150,385 |
| Diversified Healthcare Trust (SBI) | | 708,919 | 2,761,240 |
| HCP, Inc. | | 1,596,034 | 43,555,768 |
| Healthcare Realty Trust, Inc. | | 396,575 | 11,619,648 |
| Healthcare Trust of America, Inc. | | 652,429 | 18,013,565 |
| LTC Properties, Inc. | | 117,122 | 4,351,082 |
| Universal Health Realty Income Trust (SBI) | | 38,822 | 2,701,235 |
| Ventas, Inc. | | 1,102,792 | 42,303,101 |
| Welltower, Inc. | | 1,233,603 | 66,071,777 |
| | | | 199,760,322 |
| REITs - Health Care Facilities - 1.4% | | | |
| National Health Investors, Inc. | | 134,205 | 8,320,710 |
| Omega Healthcare Investors, Inc. | | 670,917 | 21,724,292 |
| | | | 30,045,002 |
| REITs - Hotels - 2.7% | | | |
| Chatham Lodging Trust | | 128,347 | 668,688 |
| DiamondRock Hospitality Co. | | 590,173 | 2,726,599 |
| Hersha Hospitality Trust | | 106,919 | 508,934 |
| Hospitality Properties Trust (SBI) | | 488,558 | 3,273,339 |
| Host Hotels & Resorts, Inc. | | 2,076,569 | 22,385,414 |
| Park Hotels & Resorts, Inc. | | 695,880 | 5,754,928 |
| Pebblebrook Hotel Trust | | 383,837 | 4,068,672 |
| RLJ Lodging Trust (a) | | 492,780 | 3,947,168 |
| Ryman Hospitality Properties, Inc. | | 163,678 | 5,240,970 |
| Summit Hotel Properties, Inc. | | 311,029 | 1,611,130 |
| Sunstone Hotel Investors, Inc. | | 620,347 | 4,640,196 |
| Xenia Hotels & Resorts, Inc. | | 333,418 | 2,654,007 |
| | | | 57,480,045 |
| REITs - Industrial Buildings - 0.7% | | | |
| Stag Industrial, Inc. | | 449,152 | 14,642,355 |
| REITs - Management/Investment - 1.8% | | | |
| American Assets Trust, Inc. | | 143,216 | 3,866,832 |
| Empire State Realty Trust, Inc. | | 427,033 | 2,818,418 |
| Lexington Corporate Properties Trust | | 813,870 | 9,440,892 |
| National Retail Properties, Inc. | | 510,264 | 18,088,859 |
| Retail Properties America, Inc. | | 637,640 | 4,055,390 |
| | | | 38,270,391 |
| REITs - Manufactured Homes - 3.9% | | | |
| Equity Lifestyle Properties, Inc. | | 538,234 | 36,772,147 |
| Sun Communities, Inc. | | 291,555 | 43,712,841 |
| | | | 80,484,988 |
| REITs - Office Buildings - 0.2% | | | |
| Government Properties Income Trust | | 145,109 | 3,649,491 |
| REITs - Office Property - 12.1% | | | |
| Alexandria Real Estate Equities, Inc. | | 374,684 | 66,525,144 |
| Boston Properties, Inc. | | 428,109 | 38,140,231 |
| Brandywine Realty Trust (SBI) | | 519,142 | 5,622,308 |
| City Office REIT, Inc. | | 143,732 | 1,243,282 |
| Columbia Property Trust, Inc. | | 327,963 | 3,922,437 |
| Corporate Office Properties Trust (SBI) | | 333,627 | 8,834,443 |
| Douglas Emmett, Inc. | | 492,422 | 14,349,177 |
| Easterly Government Properties, Inc. | | 228,736 | 5,592,595 |
| Equity Commonwealth | | 340,930 | 10,763,160 |
| Franklin Street Properties Corp. | | 303,270 | 1,592,168 |
| Highwoods Properties, Inc. (SBI) | | 310,459 | 11,902,998 |
| Hudson Pacific Properties, Inc. | | 460,393 | 10,851,463 |
| JBG SMITH Properties | | 343,053 | 9,951,968 |
| Kilroy Realty Corp. | | 312,678 | 18,219,747 |
| Mack-Cali Realty Corp. | | 264,789 | 3,818,257 |
| Paramount Group, Inc. | | 546,126 | 3,893,878 |
| Piedmont Office Realty Trust, Inc. Class A | | 370,661 | 6,008,415 |
| SL Green Realty Corp. | | 225,870 | 10,502,955 |
| VEREIT, Inc. | | 3,210,358 | 20,899,431 |
| | | | 252,634,057 |
| REITs - Regional Malls - 3.3% | | | |
| Pennsylvania Real Estate Investment Trust (SBI) (a) | | 186,821 | 220,449 |
| Simon Property Group, Inc. | | 904,324 | 56,384,601 |
| Tanger Factory Outlet Centers, Inc. (a) | | 280,678 | 1,804,760 |
| Taubman Centers, Inc. | | 182,693 | 7,073,873 |
| The Macerich Co. (a) | | 338,873 | 2,585,601 |
| | | | 68,069,284 |
| REITs - Shopping Centers - 7.1% | | | |
| Acadia Realty Trust (SBI) | | 248,925 | 2,997,057 |
| Brixmor Property Group, Inc. | | 877,585 | 10,101,003 |
| Federal Realty Investment Trust (SBI) | | 208,383 | 15,899,623 |
| Kimco Realty Corp. | | 1,277,747 | 14,246,879 |
| Kite Realty Group Trust | | 247,058 | 2,438,462 |
| Ramco-Gershenson Properties Trust (SBI) | | 237,517 | 1,477,356 |
| Realty Income Corp. | | 1,017,076 | 61,075,414 |
| Regency Centers Corp. | | 503,011 | 20,638,541 |
| Retail Opportunity Investments Corp. (a) | | 362,287 | 3,938,060 |
| Seritage Growth Properties (a)(b) | | 112,492 | 1,047,301 |
| SITE Centers Corp. | | 440,943 | 3,232,112 |
| Urban Edge Properties | | 333,546 | 3,495,562 |
| Washington Prime Group, Inc. (a) | | 573,219 | 420,685 |
| Weingarten Realty Investors (SBI) | | 355,163 | 6,059,081 |
| | | | 147,067,136 |
| REITs - Single Tenant - 1.7% | | | |
| Agree Realty Corp. | | 164,536 | 11,018,976 |
| Essential Properties Realty Trust, Inc. | | 282,830 | 4,553,563 |
| Four Corners Property Trust, Inc. | | 217,923 | 5,491,660 |
| Getty Realty Corp. | | 106,507 | 3,155,802 |
| Spirit Realty Capital, Inc. | | 304,663 | 10,498,687 |
| | | | 34,718,688 |
| REITs - Storage - 7.9% | | | |
| CubeSmart | | 571,973 | 16,970,439 |
| Extra Space Storage, Inc. | | 381,036 | 39,376,260 |
| Life Storage, Inc. | | 139,114 | 13,651,257 |
| National Storage Affiliates Trust | | 186,126 | 5,736,403 |
| Public Storage | | 442,464 | 88,439,704 |
| | | | 164,174,063 |
| REITs - Warehouse/Industrial - 16.2% | | | |
| Americold Realty Trust | | 595,284 | 24,019,709 |
| EastGroup Properties, Inc. | | 116,752 | 15,488,320 |
| First Industrial Realty Trust, Inc. | | 379,453 | 16,665,576 |
| Industrial Logistics Properties Trust (a) | | 194,251 | 4,100,639 |
| Monmouth Real Estate Investment Corp. Class A | | 293,284 | 4,232,088 |
| Prologis (REIT), Inc. | | 2,183,202 | 230,153,151 |
| QTS Realty Trust, Inc. Class A (a) | | 179,363 | 12,905,168 |
| Rexford Industrial Realty, Inc. | | 372,280 | 17,471,100 |
| Terreno Realty Corp. | | 203,240 | 12,348,862 |
| | | | 337,384,613 |
| TOTAL COMMON STOCKS | | | |
| (Cost $2,224,480,393) | | | 2,082,756,960 |
|
| Money Market Funds - 0.9% | | | |
| Fidelity Securities Lending Cash Central Fund 0.13% (c)(d) | | | |
| (Cost $18,543,381) | | 18,541,527 | 18,543,381 |
| TOTAL INVESTMENT IN SECURITIES - 100.9% | | | |
| (Cost $2,243,023,774) | | | 2,101,300,341 |
| NET OTHER ASSETS (LIABILITIES) - (0.9)% | | | (18,711,543) |
| NET ASSETS - 100% | | | $2,082,588,798 |
| Futures Contracts | | | | | |
| | Number of contracts | Expiration Date | Notional Amount | Value | Unrealized Appreciation/(Depreciation) |
| Purchased | | | | | |
| Equity Index Contracts | | | | | |
| CME E-mini S&P MidCap 400 Index Contracts (United States) | 11 | Sept. 2020 | $2,046,550 | $160,587 | $160,587 |
The notional amount of futures purchased as a percentage of Net Assets is 0.1%
Legend
(a) Security or a portion of the security is on loan at period end.
(b) Non-income producing
(c) Affiliated fund that is generally available only to investment companies and other accounts managed by Fidelity Investments. The rate quoted is the annualized seven-day yield of the fund at period end. A complete unaudited listing of the fund's holdings as of its most recent quarter end is available upon request. In addition, each Fidelity Central Fund's financial statements, which are not covered by the Fund's Report of Independent Registered Public Accounting Firm, are available on the SEC's website or upon request.
(d) Investment made with cash collateral received from securities on loan.
Affiliated Central Funds
Information regarding fiscal year to date income earned by the Fund from investments in Fidelity Central Funds is as follows:
| Fund | Income earned |
| Fidelity Cash Central Fund | $91,254 |
| Fidelity Securities Lending Cash Central Fund | 388,380 |
| Total | $479,634 |
Amounts in the income column in the above table include any capital gain distributions from underlying funds, which are presented in the corresponding line-item in the Statement of Operations, if applicable. Amount for Fidelity Securities Lending Cash Central Fund represents the income earned on investing cash collateral, less rebates paid to borrowers and any lending agent fees associated with the loan, plus any premium payments received for lending certain types of securities.
Investment Valuation
The following is a summary of the inputs used, as of July 31, 2020, involving the Fund's assets and liabilities carried at fair value. The inputs or methodology used for valuing securities may not be an indication of the risk associated with investing in those securities. For more information on valuation inputs, and their aggregation into the levels used below, please refer to the Investment Valuation section in the accompanying Notes to Financial Statements.
| | Valuation Inputs at Reporting Date: |
| Description | Total | Level 1 | Level 2 | Level 3 |
| Investments in Securities: | | | | |
| Common Stocks | $2,082,756,960 | $2,082,756,960 | $-- | $-- |
| Money Market Funds | 18,543,381 | 18,543,381 | -- | -- |
| Total Investments in Securities: | $2,101,300,341 | $2,101,300,341 | $-- | $-- |
| Derivative Instruments: | | | | |
| Assets | | | | |
| Futures Contracts | $160,587 | $160,587 | $-- | $-- |
| Total Assets | $160,587 | $160,587 | $-- | $-- |
| Total Derivative Instruments: | $160,587 | $160,587 | $-- | $-- |
Value of Derivative Instruments
The following table is a summary of the Fund's value of derivative instruments by primary risk exposure as of July 31, 2020. For additional information on derivative instruments, please refer to the Derivative Instruments section in the accompanying Notes to Financial Statements.
| Primary Risk Exposure / Derivative Type | Value |
| | Asset | Liability |
| Equity Risk | | |
| Futures Contracts(a) | $160,587 | $0 |
| Total Equity Risk | 160,587 | 0 |
| Total Value of Derivatives | $160,587 | $0 |
(a) Reflects gross cumulative appreciation (depreciation) on futures contracts as presented in the Schedule of Investments. In the Statement of Assets and Liabilities, the period end daily variation margin is included in receivable or payable for daily variation margin on futures contracts, and the net cumulative appreciation (depreciation) is included in Total accumulated earnings (loss).
See accompanying notes which are an integral part of the financial statements.
Financial Statements
Statement of Assets and Liabilities
| | | July 31, 2020 |
| Assets | | |
Investment in securities, at value (including securities loaned of $17,672,078) — See accompanying schedule:
Unaffiliated issuers (cost $2,224,480,393) | $2,082,756,960 | |
| Fidelity Central Funds (cost $18,543,381) | 18,543,381 | |
| Total Investment in Securities (cost $2,243,023,774) | | $2,101,300,341 |
| Segregated cash with brokers for derivative instruments | | 240,000 |
| Receivable for fund shares sold | | 2,424,524 |
| Dividends receivable | | 1,403,286 |
| Distributions receivable from Fidelity Central Funds | | 94,170 |
| Total assets | | 2,105,462,321 |
| Liabilities | | |
| Payable to custodian bank | $56,499 | |
| Payable for fund shares redeemed | 4,153,772 | |
| Accrued management fee | 117,746 | |
| Payable for daily variation margin on futures contracts | 12,159 | |
| Other payables and accrued expenses | 2 | |
| Collateral on securities loaned | 18,533,345 | |
| Total liabilities | | 22,873,523 |
| Net Assets | | $2,082,588,798 |
| Net Assets consist of: | | |
| Paid in capital | | $2,355,414,987 |
| Total accumulated earnings (loss) | | (272,826,189) |
| Net Assets | | $2,082,588,798 |
| Net Asset Value and Maximum Offering Price | | |
| Net Asset Value, offering price and redemption price per share ($2,082,588,798 ÷ 153,337,315 shares) | | $13.58 |
See accompanying notes which are an integral part of the financial statements.
Statement of Operations
| | | Year ended July 31, 2020 |
| Investment Income | | |
| Dividends | | $75,643,424 |
| Interest | | 6,156 |
| Income from Fidelity Central Funds (including $388,380 from security lending) | | 479,634 |
| Total income | | 76,129,214 |
| Expenses | | |
| Management fee | $1,573,058 | |
| Independent trustees' fees and expenses | 8,030 | |
| Interest | 3,724 | |
| Commitment fees | 5,541 | |
| Total expenses before reductions | 1,590,353 | |
| Expense reductions | (855) | |
| Total expenses after reductions | | 1,589,498 |
| Net investment income (loss) | | 74,539,716 |
| Realized and Unrealized Gain (Loss) | | |
| Net realized gain (loss) on: | | |
| Investment securities: | | |
| Unaffiliated issuers | (141,191,166) | |
| Fidelity Central Funds | 11,042 | |
| Futures contracts | 2,236,031 | |
| Total net realized gain (loss) | | (138,944,093) |
| Change in net unrealized appreciation (depreciation) on: | | |
| Investment securities: | | |
| Unaffiliated issuers | (345,688,448) | |
| Futures contracts | 19,360 | |
| Total change in net unrealized appreciation (depreciation) | | (345,669,088) |
| Net gain (loss) | | (484,613,181) |
| Net increase (decrease) in net assets resulting from operations | | $(410,073,465) |
See accompanying notes which are an integral part of the financial statements.
Statement of Changes in Net Assets
| | Year ended July 31, 2020 | Year ended July 31, 2019 |
| Increase (Decrease) in Net Assets | | |
| Operations | | |
| Net investment income (loss) | $74,539,716 | $56,962,102 |
| Net realized gain (loss) | (138,944,093) | 19,215,358 |
| Change in net unrealized appreciation (depreciation) | (345,669,088) | 110,537,005 |
| Net increase (decrease) in net assets resulting from operations | (410,073,465) | 186,714,465 |
| Distributions to shareholders | (83,652,157) | (60,280,960) |
| Share transactions - net increase (decrease) | 319,819,251 | 762,656,425 |
| Total increase (decrease) in net assets | (173,906,371) | 889,089,930 |
| Net Assets | | |
| Beginning of period | 2,256,495,169 | 1,367,405,239 |
| End of period | $2,082,588,798 | $2,256,495,169 |
See accompanying notes which are an integral part of the financial statements.
Financial Highlights
Fidelity Real Estate Index Fund
| Years ended July 31, | 2020 | 2019 | 2018 | 2017 | 2016 |
| Selected Per–Share Data | | | | | |
| Net asset value, beginning of period | $16.82 | $15.76 | $15.70 | $17.28 | $14.69 |
| Income from Investment Operations | | | | | |
| Net investment income (loss)A | .51 | .53 | .46 | .39 | .41 |
| Net realized and unrealized gain (loss) | (3.15) | 1.13 | .13 | (1.37) | 2.56 |
| Total from investment operations | (2.64) | 1.66 | .59 | (.98) | 2.97 |
| Distributions from net investment income | (.47) | (.50) | (.44) | (.39) | (.38) |
| Distributions from net realized gain | (.13) | (.10) | (.09) | (.21) | – |
| Total distributions | (.60) | (.60) | (.53) | (.60) | (.38) |
| Redemption fees added to paid in capitalA | – | – | –B | –B | –B |
| Net asset value, end of period | $13.58 | $16.82 | $15.76 | $15.70 | $17.28 |
| Total ReturnC | (16.34)% | 10.84% | 3.90% | (5.61)% | 20.71% |
| Ratios to Average Net AssetsD,E | | | | | |
| Expenses before reductions | .07% | .07% | .07% | .07% | .14% |
| Expenses net of fee waivers, if any | .07% | .07% | .07% | .07% | .07% |
| Expenses net of all reductions | .07% | .07% | .07% | .07% | .07% |
| Net investment income (loss) | 3.32% | 3.33% | 3.12% | 2.49% | 2.69% |
| Supplemental Data | | | | | |
| Net assets, end of period (000 omitted) | $2,082,589 | $2,256,495 | $380,099 | $45,866 | $19,098 |
| Portfolio turnover rateF | 26% | 10% | 6% | 8% | 5% |
A Calculated based on average shares outstanding during the period.
B Amount represents less than $.005 per share.
C Total returns would have been lower if certain expenses had not been reduced during the applicable periods shown.
D Fees and expenses of any underlying mutual funds or exchange-traded funds (ETFs) are not included in the Fund's expense ratio. The Fund indirectly bears its proportionate share of these expenses. For additional expense information related to investments in Fidelity Central Funds, please refer to the "Investments in Fidelity Central Funds" note found in the Notes to Financial Statements section of the most recent Annual or Semi-Annual report.
E Expense ratios reflect operating expenses of the Fund. Expenses before reductions do not reflect amounts reimbursed by the investment adviser or reductions from expense offset arrangements and do not represent the amount paid by the Fund during periods when reimbursements or reductions occur. Expenses net of fee waivers reflect expenses after reimbursement by the investment adviser but prior to reductions from expense offset arrangements. Expenses net of all reductions represent the net expenses paid by the Fund.
F Amount does not include the portfolio activity of any underlying Fidelity Central Funds.
See accompanying notes which are an integral part of the financial statements.
Notes to Financial Statements
For the period ended July 31, 2020
1. Organization.
Fidelity Real Estate Index Fund (the Fund) is a fund of Fidelity Salem Street Trust (the Trust) and is authorized to issue an unlimited number of shares. The Trust is registered under the Investment Company Act of 1940, as amended (the 1940 Act), as an open-end management investment company organized as a Massachusetts business trust.
Effective after the close of business November 2, 2018, the Fund's publicly offered shares classes were consolidated into a single share class. The surviving class is Fidelity Real Estate Index Fund (formerly Institutional Class). All prior fiscal period dollar and share amounts for the classes that closed, which are presented in the Notes to Financial Statements, are for the period August 1, 2018 through November 2, 2018.
Effective January 1, 2020, investment advisers Fidelity Investments Money Management, Inc., FMR Co., Inc., and Fidelity SelectCo, LLC, merged with and into Fidelity Management & Research Company. In connection with the merger transactions, the resulting, merged investment adviser was then redomiciled from Massachusetts to Delaware, changed its corporate structure from a corporation to a limited liability company, and changed its name to "Fidelity Management & Research Company LLC".
2. Investments in Fidelity Central Funds.
The Fund invests in Fidelity Central Funds, which are open-end investment companies generally available only to other investment companies and accounts managed by the investment adviser and its affiliates. The Fund's Schedule of Investments lists each of the Fidelity Central Funds held as of period end, if any, as an investment of the Fund, but does not include the underlying holdings of each Fidelity Central Fund. As an Investing Fund, the Fund indirectly bears its proportionate share of the expenses of the underlying Fidelity Central Funds.
The Money Market Central Funds seek preservation of capital and current income and are managed by the investment adviser. Annualized expenses of the Money Market Central Funds as of their most recent shareholder report date ranged from less than .005% to .01%.
A complete unaudited list of holdings for each Fidelity Central Fund is available upon request or at the Securities and Exchange Commission (the SEC) website at www.sec.gov. In addition, the financial statements of the Fidelity Central Funds, which are not covered by the Fund's Report of Independent Registered Public Accounting Firm, are available on the SEC website or upon request.
3. Significant Accounting Policies.
The Fund is an investment company and applies the accounting and reporting guidance of the Financial Accounting Standards Board (FASB) Accounting Standards Codification Topic 946 Financial Services – Investment Companies. The financial statements have been prepared in conformity with accounting principles generally accepted in the United States of America (GAAP), which require management to make certain estimates and assumptions at the date of the financial statements. Actual results could differ from those estimates. Subsequent events, if any, through the date that the financial statements were issued have been evaluated in the preparation of the financial statements. The following summarizes the significant accounting policies of the Fund:
Investment Valuation. Investments are valued as of 4:00 p.m. Eastern time on the last calendar day of the period. The Board of Trustees (the Board) has delegated the day to day responsibility for the valuation of the Fund's investments to the Fair Value Committee (the Committee) established by the Fund's investment adviser. In accordance with valuation policies and procedures approved by the Board, the Fund attempts to obtain prices from one or more third party pricing vendors or brokers to value its investments. When current market prices, quotations or currency exchange rates are not readily available or reliable, investments will be fair valued in good faith by the Committee, in accordance with procedures adopted by the Board. Factors used in determining fair value vary by investment type and may include market or investment specific events. The frequency with which these procedures are used cannot be predicted and they may be utilized to a significant extent. The Committee oversees the Fund's valuation policies and procedures and reports to the Board on the Committee's activities and fair value determinations. The Board monitors the appropriateness of the procedures used in valuing the Fund's investments and ratifies the fair value determinations of the Committee.
The Fund categorizes the inputs to valuation techniques used to value its investments into a disclosure hierarchy consisting of three levels as shown below:
- Level 1 – quoted prices in active markets for identical investments
- Level 2 – other significant observable inputs (including quoted prices for similar investments, interest rates, prepayment speeds, etc.)
- Level 3 – unobservable inputs (including the Fund's own assumptions based on the best information available)
Valuation techniques used to value the Fund's investments by major category are as follows:
Equity securities, including restricted securities, for which market quotations are readily available, are valued at the last reported sale price or official closing price as reported by a third party pricing vendor on the primary market or exchange on which they are traded and are categorized as Level 1 in the hierarchy. In the event there were no sales during the day or closing prices are not available, securities are valued at the last quoted bid price or may be valued using the last available price and are generally categorized as Level 2 in the hierarchy. For foreign equity securities, when market or security specific events arise, comparisons to the valuation of American Depositary Receipts (ADRs), futures contracts, Exchange-Traded Funds (ETFs) and certain indexes as well as quoted prices for similar securities may be used and would be categorized as Level 2 in the hierarchy. For equity securities, including restricted securities, where observable inputs are limited, assumptions about market activity and risk are used and these securities may be categorized as Level 3 in the hierarchy.
Futures contracts are valued at the settlement price established each day by the board of trade or exchange on which they are traded and are categorized as Level 1 in the hierarchy. Investments in open-end mutual funds, including the Fidelity Central Funds, are valued at their closing net asset value (NAV) each business day and are categorized as Level 1 in the hierarchy.
Changes in valuation techniques may result in transfers in or out of an assigned level within the disclosure hierarchy. The aggregate value of investments by input level as of July 31, 2020 is included at the end of the Fund's Schedule of Investments.
Investment Transactions and Income. For financial reporting purposes, the Fund's investment holdings and NAV include trades executed through the end of the last business day of the period. The NAV per share for processing shareholder transactions is calculated as of the close of business of the New York Stock Exchange (NYSE), normally 4:00 p.m. Eastern time and includes trades executed through the end of the prior business day. Gains and losses on securities sold are determined on the basis of identified cost. Dividend income is recorded on the ex-dividend date, except for certain dividends from foreign securities where the ex-dividend date may have passed, which are recorded as soon as the Fund is informed of the ex-dividend date. Non-cash dividends included in dividend income, if any, are recorded at the fair market value of the securities received. Income and capital gain distributions from Fidelity Central Funds, if any, are recorded on the ex-dividend date. Certain distributions received by the Fund represent a return of capital or capital gain. The Fund determines the components of these distributions subsequent to the ex-dividend date, based upon receipt of tax filings or other correspondence relating to the underlying investment. These distributions are recorded as a reduction of cost of investments and/or as a realized gain. Interest income is accrued as earned and includes coupon interest and amortization of premium and accretion of discount on debt securities as applicable.
Expenses. Expenses directly attributable to a fund are charged to that fund. Expenses attributable to more than one fund are allocated among the respective funds on the basis of relative net assets or other appropriate methods. Expense estimates are accrued in the period to which they relate and adjustments are made when actual amounts are known.
Income Tax Information and Distributions to Shareholders. Each year, the Fund intends to qualify as a regulated investment company under Subchapter M of the Internal Revenue Code, including distributing substantially all of its taxable income and realized gains. As a result, no provision for U.S. Federal income taxes is required. As of July 31, 2020, the Fund did not have any unrecognized tax benefits in the financial statements; nor is the Fund aware of any tax positions for which it is reasonably possible that the total amounts of unrecognized tax benefits will significantly change in the next twelve months. The Fund files a U.S. federal tax return, in addition to state and local tax returns as required. The Fund's federal income tax returns are subject to examination by the Internal Revenue Service (IRS) for a period of three fiscal years after they are filed. State and local tax returns may be subject to examination for an additional fiscal year depending on the jurisdiction.
Distributions are declared and recorded on the ex-dividend date. Income and capital gain distributions are determined in accordance with income tax regulations, which may differ from GAAP.
Capital accounts within the financial statements are adjusted for permanent book-tax differences. These adjustments have no impact on net assets or the results of operations. Capital accounts are not adjusted for temporary book-tax differences which will reverse in a subsequent period.
Book-tax differences are primarily due to futures contracts, foreign currency transactions and losses deferred due to wash sales and excise tax regulations.
As of period end, the cost and unrealized appreciation (depreciation) in securities, and derivatives if applicable, for federal income tax purposes were as follows:
| Gross unrealized appreciation | $293,878,309 |
| Gross unrealized depreciation | (460,979,256) |
| Net unrealized appreciation (depreciation) | $(167,100,947) |
| Tax Cost | $2,268,401,288 |
The tax-based components of distributable earnings as of period end were as follows:
| Undistributed ordinary income | $14,647,519 |
| Net unrealized appreciation (depreciation) on securities and other investments | $(167,100,947) |
The Fund intends to elect to defer to its next fiscal year $120,372,763 of capital losses recognized during the period November 1, 2019 to July 31, 2020.
The tax character of distributions paid was as follows:
| | July 31, 2020 | July 31, 2019 |
| Ordinary Income | $68,573,048 | $ 51,233,791 |
| Long-term Capital Gains | 15,079,109 | 9,047,169 |
| Total | $83,652,157 | $ 60,280,960 |
4. Derivative Instruments.
Risk Exposures and the Use of Derivative Instruments. The Fund's investment objective allows the Fund to enter into various types of derivative contracts, including futures contracts. Derivatives are investments whose value is primarily derived from underlying assets, indices or reference rates and may be transacted on an exchange or over-the-counter (OTC). Derivatives may involve a future commitment to buy or sell a specified asset based on specified terms, to exchange future cash flows at periodic intervals based on a notional principal amount, or for one party to make one or more payments upon the occurrence of specified events in exchange for periodic payments from the other party.
The Fund used derivatives to increase returns and to manage exposure to certain risks as defined below. The success of any strategy involving derivatives depends on analysis of numerous economic factors, and if the strategies for investment do not work as intended, the Fund may not achieve its objectives.
The Fund's use of derivatives increased or decreased its exposure to the following risk:
| Equity Risk | Equity risk relates to the fluctuations in the value of financial instruments as a result of changes in market prices (other than those arising from interest rate risk or foreign exchange risk), whether caused by factors specific to an individual investment, its issuer, or all factors affecting all instruments traded in a market or market segment.
|
The Fund is also exposed to additional risks from investing in derivatives, such as liquidity risk and counterparty credit risk. Liquidity risk is the risk that the Fund will be unable to close out the derivative in the open market in a timely manner. Counterparty credit risk is the risk that the counterparty will not be able to fulfill its obligation to the Fund. Counterparty credit risk related to exchange-traded futures contracts may be mitigated by the protection provided by the exchange on which they trade.
Investing in derivatives may involve greater risks than investing in the underlying assets directly and, to varying degrees, may involve risk of loss in excess of any initial investment and collateral received and amounts recognized in the Statement of Assets and Liabilities. In addition, there may be the risk that the change in value of the derivative contract does not correspond to the change in value of the underlying instrument.
Futures Contracts. A futures contract is an agreement between two parties to buy or sell a specified underlying instrument for a fixed price at a specified future date. The Fund used futures contracts to manage its exposure to the stock market.
Upon entering into a futures contract, a fund is required to deposit either cash or securities (initial margin) with a clearing broker in an amount equal to a certain percentage of the face value of the contract. Futures contracts are marked-to-market daily and subsequent daily payments (variation margin) are made or received by a fund depending on the daily fluctuations in the value of the futures contracts and are recorded as unrealized appreciation or (depreciation). This receivable and/or payable, if any, is included in daily variation margin on futures contracts in the Statement of Assets and Liabilities. Realized gain or (loss) is recorded upon the expiration or closing of a futures contract. The net realized gain (loss) and change in net unrealized appreciation (depreciation) on futures contracts during the period is presented in the Statement of Operations.
Any open futures contracts at period end are presented in the Schedule of Investments under the caption "Futures Contracts". The notional amount at value reflects each contract's exposure to the underlying instrument or index at period end and is representative of volume of activity during the period. Cash deposited to meet initial margin requirements is presented as segregated cash with brokers for derivative instruments in the Statement of Assets and Liabilities.
5. Purchases and Sales of Investments.
Purchases and sales of securities, other than short-term securities, are noted in the table below.
| | Purchases ($) | Sales ($) |
| Fidelity Real Estate Index Fund | 910,374,671 | 574,571,174 |
6. Fees and Other Transactions with Affiliates.
Management Fee. Fidelity Management & Research Company LLC (the investment adviser) and its affiliates provide the Fund with investment management related services for which the Fund pays a monthly management fee. The management fee is based on an annual rate of .07% of the Fund's average net assets. Under the management contract, the investment adviser pays all other operating expenses, except the compensation of the independent Trustees and certain other expenses such as interest expense, including commitment fees.
Sub-Adviser. Geode Capital Management, LLC (Geode), serves as sub-adviser for the Fund. Geode provides discretionary investment advisory services to the Fund and is paid by the investment adviser for providing these services.
Interfund Lending Program. Pursuant to an Exemptive Order issued by the SEC, the fund, along with other registered investment companies having management contracts with Fidelity Management & Research Company LLC (FMR), or other affiliated entities of FMR, may participate in an interfund lending program. This program provides an alternative credit facility allowing the fund to borrow from, or lend money to, other participating affiliated funds. At period end, there were no interfund loans outstanding. Activity in this program during the period for which loans were outstanding was as follows:
| | Borrower or Lender | Average Loan Balance | Weighted Average Interest Rate | Interest Expense |
| Fidelity Real Estate Index Fund | Borrower | $26,386,667 | 1.69% | $3,724 |
Interfund Trades. Funds may purchase from or sell securities to other Fidelity Funds under procedures adopted by the Board. The procedures have been designed to ensure these interfund trades are executed in accordance with Rule 17a-7 of the 1940 Act. Interfund trades are included within the respective purchases and sales amounts shown in the Purchases and Sales of Investments note.
7. Committed Line of Credit.
Certain Funds participate with other funds managed by the investment adviser or an affiliate in a $4.25 billion credit facility (the "line of credit") to be utilized for temporary or emergency purposes to fund shareholder redemptions or for other short-term liquidity purposes. The participating funds have agreed to pay commitment fees on their pro-rata portion of the line of credit, which are reflected in Commitment fees on the Statement of Operations, and are as follows:
| | Amount |
| Fidelity Real Estate Index Fund | $5,541 |
During the period, there were no borrowings on this line of credit.
8. Security Lending.
The Fund lends portfolio securities from time to time in order to earn additional income. Lending agents are used, including National Financial Services (NFS), an affiliate of the Fund. Pursuant to a securities lending agreement, NFS will receive a fee, which is capped at 9.9% of daily lending revenue, for its services as lending agent. The Fund may lend securities to certain qualified borrowers, including NFS. On the settlement date of the loan, the Fund receives collateral (in the form of U.S. Treasury obligations, letters of credit and/or cash) against the loaned securities and maintains collateral in an amount not less than 100% of the market value of the loaned securities during the period of the loan. The market value of the loaned securities is determined at the close of business of the Fund and any additional required collateral is delivered to the Fund on the next business day. The Fund or borrower may terminate the loan at any time, and if the borrower defaults on its obligation to return the securities loaned because of insolvency or other reasons, the Fund may apply collateral received from the borrower against the obligation. The Fund may experience delays and costs in recovering the securities loaned. Any cash collateral received is invested in the Fidelity Securities Lending Cash Central Fund. The value of loaned securities and cash collateral at period end are disclosed on the Fund's Statement of Assets and Liabilities. The value of securities loaned to NFS, as affiliated borrower, at period end was $72,978. Total fees paid by the Fund to NFS, as lending agent, amounted to $34,895. Security lending income represents the income earned on investing cash collateral, less rebates paid to borrowers and any lending agent fees associated with the loan, plus any premium payments received for lending certain types of securities. Net income from the Fidelity Securities Lending Cash Central Fund during the period is presented in the Statement of Operations as a component of income from Fidelity Central Funds (and includes $21,399 from securities loaned to NFS, as affiliated borrower).
9. Expense Reductions.
Through arrangements with the Fund's custodian, credits realized as a result of certain uninvested cash balances were used to reduce the Fund's expenses. During the period, custodian credits reduced the Fund's expenses by $855.
10. Distributions to Shareholders.
Distributions to shareholders of each class were as follows:
| | Year ended
July 31, 2020 | Year ended
July 31, 2019 |
| Distributions to shareholders | | |
| Investor Class | $– | $427,706 |
| Premium Class | – | 11,530,768 |
| Fidelity Real Estate Index Fund | 83,652,157 | 48,322,486 |
| Total | $83,652,157 | $60,280,960 |
11. Share Transactions.
Share transactions for each class were as follows and may contain automatic conversions between classes or exchanges between affiliated funds:
| | Shares | Shares | Dollars | Dollars |
| | Year ended July 31, 2020 | Year ended July 31, 2019 | Year ended July 31, 2020 | Year ended July 31, 2019 |
| Investor Class | | | | |
| Shares sold | – | 398,814 | $– | $6,238,275 |
| Reinvestment of distributions | – | 26,242 | – | 415,680 |
| Shares redeemed | – | (2,660,628) | – | (40,117,896) |
| Net increase (decrease) | – | (2,235,572) | $– | $(33,463,941) |
| Premium Class | | | | |
| Shares sold | – | 5,615,265 | $– | $87,786,180 |
| Reinvestment of distributions | – | 675,441 | – | 10,705,751 |
| Shares redeemed | – | (66,713,459) | – | (1,008,259,232) |
| Net increase (decrease) | – | (60,422,753) | $– | $(909,767,301) |
| Fidelity Real Estate Index Fund | | | | |
| Shares sold | 66,698,457 | 127,547,047 | $995,506,925 | $1,986,947,471 |
| Reinvestment of distributions | 4,516,826 | 2,719,968 | 74,858,894 | 43,119,946 |
| Shares redeemed | (52,070,823) | (20,192,675) | (750,546,568) | (324,179,750) |
| Net increase (decrease) | 19,144,460 | 110,074,340 | $319,819,251 | $1,705,887,667 |
12. Other.
The Fund's organizational documents provide former and current trustees and officers with a limited indemnification against liabilities arising in connection with the performance of their duties to the Fund. In the normal course of business, the Fund may also enter into contracts that provide general indemnifications. The Fund's maximum exposure under these arrangements is unknown as this would be dependent on future claims that may be made against the Fund. The risk of material loss from such claims is considered remote.
13. Coronavirus (COVID-19) Pandemic.
An outbreak of COVID-19 first detected in China during December 2019 has since spread globally and was declared a pandemic by the World Health Organization during March 2020. Developments that disrupt global economies and financial markets, such as the COVID-19 pandemic, may magnify factors that affect the Fund's performance.
Report of Independent Registered Public Accounting Firm
To the Board of Trustees of Fidelity Salem Street Trust and Shareholders of Fidelity Real Estate Index Fund:
Opinion on the Financial Statements and Financial Highlights
We have audited the accompanying statement of assets and liabilities of Fidelity Real Estate Index Fund (the "Fund"), a fund of Fidelity Salem Street Trust, including the schedule of investments, as of July 31, 2020, the related statement of operations for the year then ended, the statement of changes in net assets for each of the two years in the period then ended, the financial highlights for each of the five years in the period then ended, and the related notes. In our opinion, the financial statements and financial highlights present fairly, in all material respects, the financial position of the Fund as of July 31, 2020, and the results of its operations for the year then ended, the changes in its net assets for each of the two years in the period then ended, and the financial highlights for each of the five years in the period then ended in conformity with accounting principles generally accepted in the United States of America.
Basis for Opinion
These financial statements and financial highlights are the responsibility of the Fund's management. Our responsibility is to express an opinion on the Fund's financial statements and financial highlights based on our audits. We are a public accounting firm registered with the Public Company Accounting Oversight Board (United States) (PCAOB) and are required to be independent with respect to the Fund in accordance with the U.S. federal securities laws and the applicable rules and regulations of the Securities and Exchange Commission and the PCAOB.
We conducted our audits in accordance with the standards of the PCAOB. Those standards require that we plan and perform the audit to obtain reasonable assurance about whether the financial statements and financial highlights are free of material misstatement, whether due to error or fraud. The Fund is not required to have, nor were we engaged to perform, an audit of its internal control over financial reporting. As part of our audits we are required to obtain an understanding of internal control over financial reporting but not for the purpose of expressing an opinion on the effectiveness of the Fund’s internal control over financial reporting. Accordingly, we express no such opinion.
Our audits included performing procedures to assess the risks of material misstatement of the financial statements and financial highlights, whether due to error or fraud, and performing procedures that respond to those risks. Such procedures included examining, on a test basis, evidence regarding the amounts and disclosures in the financial statements and financial highlights. Our audits also included evaluating the accounting principles used and significant estimates made by management, as well as evaluating the overall presentation of the financial statements and financial highlights. Our procedures included confirmation of securities owned as of July 31, 2020, by correspondence with the custodian and brokers; when replies were not received from brokers, we performed other auditing procedures. We believe that our audits provide a reasonable basis for our opinion.
/s/ Deloitte & Touche LLP
Boston, Massachusetts
September 14, 2020
We have served as the auditor of one or more of the Fidelity investment companies since 1999.
Trustees and Officers
The Trustees, Members of the Advisory Board (if any), and officers of the trust and fund, as applicable, are listed below. The Board of Trustees governs the fund and is responsible for protecting the interests of shareholders. The Trustees are experienced executives who meet periodically throughout the year to oversee the fund's activities, review contractual arrangements with companies that provide services to the fund, oversee management of the risks associated with such activities and contractual arrangements, and review the fund's performance. Except for Jonathan Chiel, each of the Trustees oversees 280 funds. Mr. Chiel oversees 174 funds.
The Trustees hold office without limit in time except that (a) any Trustee may resign; (b) any Trustee may be removed by written instrument, signed by at least two-thirds of the number of Trustees prior to such removal; (c) any Trustee who requests to be retired or who has become incapacitated by illness or injury may be retired by written instrument signed by a majority of the other Trustees; and (d) any Trustee may be removed at any special meeting of shareholders by a two-thirds vote of the outstanding voting securities of the trust. Each Trustee who is not an interested person (as defined in the 1940 Act) of the trust and the fund is referred to herein as an Independent Trustee. Each Independent Trustee shall retire not later than the last day of the calendar year in which his or her 75th birthday occurs. The Independent Trustees may waive this mandatory retirement age policy with respect to individual Trustees. Officers and Advisory Board Members hold office without limit in time, except that any officer or Advisory Board Member may resign or may be removed by a vote of a majority of the Trustees at any regular meeting or any special meeting of the Trustees. Except as indicated, each individual has held the office shown or other offices in the same company for the past five years.
The fund’s Statement of Additional Information (SAI) includes more information about the Trustees. To request a free copy, call Fidelity at 1-800-544-8544.
Experience, Skills, Attributes, and Qualifications of the Trustees. The Governance and Nominating Committee has adopted a statement of policy that describes the experience, qualifications, attributes, and skills that are necessary and desirable for potential Independent Trustee candidates (Statement of Policy). The Board believes that each Trustee satisfied at the time he or she was initially elected or appointed a Trustee, and continues to satisfy, the standards contemplated by the Statement of Policy. The Governance and Nominating Committee also engages professional search firms to help identify potential Independent Trustee candidates who have the experience, qualifications, attributes, and skills consistent with the Statement of Policy. From time to time, additional criteria based on the composition and skills of the current Independent Trustees, as well as experience or skills that may be appropriate in light of future changes to board composition, business conditions, and regulatory or other developments, have also been considered by the professional search firms and the Governance and Nominating Committee. In addition, the Board takes into account the Trustees' commitment and participation in Board and committee meetings, as well as their leadership of standing and ad hoc committees throughout their tenure.
In determining that a particular Trustee was and continues to be qualified to serve as a Trustee, the Board has considered a variety of criteria, none of which, in isolation, was controlling. The Board believes that, collectively, the Trustees have balanced and diverse experience, qualifications, attributes, and skills, which allow the Board to operate effectively in governing the fund and protecting the interests of shareholders. Information about the specific experience, skills, attributes, and qualifications of each Trustee, which in each case led to the Board's conclusion that the Trustee should serve (or continue to serve) as a trustee of the fund, is provided below.
Board Structure and Oversight Function. Abigail P. Johnson is an interested person and currently serves as Chairman. The Trustees have determined that an interested Chairman is appropriate and benefits shareholders because an interested Chairman has a personal and professional stake in the quality and continuity of services provided to the fund. Independent Trustees exercise their informed business judgment to appoint an individual of their choosing to serve as Chairman, regardless of whether the Trustee happens to be independent or a member of management. The Independent Trustees have determined that they can act independently and effectively without having an Independent Trustee serve as Chairman and that a key structural component for assuring that they are in a position to do so is for the Independent Trustees to constitute a substantial majority for the Board. The Independent Trustees also regularly meet in executive session. Arthur E. Johnson serves as Chairman of the Independent Trustees and as such (i) acts as a liaison between the Independent Trustees and management with respect to matters important to the Independent Trustees and (ii) with management prepares agendas for Board meetings.
Fidelity® funds are overseen by different Boards of Trustees. The fund's Board oversees Fidelity's investment-grade bond, money market, asset allocation and certain equity funds, and other Boards oversee Fidelity's high income and other equity funds. The asset allocation funds may invest in Fidelity® funds that are overseen by such other Boards. The use of separate Boards, each with its own committee structure, allows the Trustees of each group of Fidelity® funds to focus on the unique issues of the funds they oversee, including common research, investment, and operational issues. On occasion, the separate Boards establish joint committees to address issues of overlapping consequences for the Fidelity® funds overseen by each Board.
The Trustees operate using a system of committees to facilitate the timely and efficient consideration of all matters of importance to the Trustees, the fund, and fund shareholders and to facilitate compliance with legal and regulatory requirements and oversight of the fund's activities and associated risks. The Board, acting through its committees, has charged FMR and its affiliates with (i) identifying events or circumstances the occurrence of which could have demonstrably adverse effects on the fund's business and/or reputation; (ii) implementing processes and controls to lessen the possibility that such events or circumstances occur or to mitigate the effects of such events or circumstances if they do occur; and (iii) creating and maintaining a system designed to evaluate continuously business and market conditions in order to facilitate the identification and implementation processes described in (i) and (ii) above. Because the day-to-day operations and activities of the fund are carried out by or through FMR, its affiliates, and other service providers, the fund's exposure to risks is mitigated but not eliminated by the processes overseen by the Trustees. While each of the Board's committees has responsibility for overseeing different aspects of the fund's activities, oversight is exercised primarily through the Operations and Audit Committees. In addition, an ad hoc Board committee of Independent Trustees has worked with FMR to enhance the Board's oversight of investment and financial risks, legal and regulatory risks, technology risks, and operational risks, including the development of additional risk reporting to the Board. Appropriate personnel, including but not limited to the fund's Chief Compliance Officer (CCO), FMR's internal auditor, the independent accountants, the fund's Treasurer and portfolio management personnel, make periodic reports to the Board's committees, as appropriate, including an annual review of Fidelity's risk management program for the Fidelity® funds. The responsibilities of each standing committee, including their oversight responsibilities, are described further under "Standing Committees of the Trustees."
Interested Trustees*:
Correspondence intended for a Trustee who is an interested person may be sent to Fidelity Investments, 245 Summer Street, Boston, Massachusetts 02210.
Name, Year of Birth; Principal Occupations and Other Relevant Experience+
Jonathan Chiel (1957)
Year of Election or Appointment: 2016
Trustee
Mr. Chiel also serves as Trustee of other Fidelity® funds. Mr. Chiel is Executive Vice President and General Counsel for FMR LLC (diversified financial services company, 2012-present). Previously, Mr. Chiel served as general counsel (2004-2012) and senior vice president and deputy general counsel (2000-2004) for John Hancock Financial Services; a partner with Choate, Hall & Stewart (1996-2000) (law firm); and an Assistant United States Attorney for the United States Attorney’s Office of the District of Massachusetts (1986-95), including Chief of the Criminal Division (1993-1995). Mr. Chiel is a director on the boards of the Boston Bar Foundation and the Maimonides School.
Abigail P. Johnson (1961)
Year of Election or Appointment: 2009
Trustee
Chairman of the Board of Trustees
Ms. Johnson also serves as Trustee of other Fidelity® funds. Ms. Johnson serves as Chairman (2016-present), Chief Executive Officer (2014-present), and Director (2007-present) of FMR LLC (diversified financial services company), President of Fidelity Financial Services (2012-present) and President of Personal, Workplace and Institutional Services (2005-present). Ms. Johnson is Chairman and Director of Fidelity Management & Research Company LLC (investment adviser firm, 2011-present). Previously, Ms. Johnson served as Chairman and Director of FMR Co., Inc. (investment adviser firm, 2011-2019), Vice Chairman (2007-2016) and President (2013-2016) of FMR LLC, President and a Director of Fidelity Management & Research Company (2001-2005), a Trustee of other investment companies advised by Fidelity Management & Research Company, Fidelity Investments Money Management, Inc. (investment adviser firm), and FMR Co., Inc. (2001-2005), Senior Vice President of the Fidelity® funds (2001-2005), and managed a number of Fidelity® funds. Ms. Abigail P. Johnson and Mr. Arthur E. Johnson are not related.
Jennifer Toolin McAuliffe (1959)
Year of Election or Appointment: 2016
Trustee
Ms. McAuliffe also serves as Trustee of other Fidelity® funds. Previously, Ms. McAuliffe served as Co-Head of Fixed Income of Fidelity Investments Limited (now known as FIL Limited (FIL)) (diversified financial services company), Director of Research for FIL’s credit and quantitative teams in London, Hong Kong and Tokyo and Director of Research for taxable and municipal bonds at Fidelity Investments Money Management, Inc. Ms. McAuliffe previously served as a member of the Advisory Board of certain Fidelity® funds (2016). Ms. McAuliffe was previously a lawyer at Ropes & Gray LLP and currently serves as director or trustee of several not-for-profit entities.
* Determined to be an “Interested Trustee” by virtue of, among other things, his or her affiliation with the trust or various entities under common control with FMR.
+ The information includes the Trustee's principal occupation during the last five years and other information relating to the experience, attributes, and skills relevant to the Trustee's qualifications to serve as a Trustee, which led to the conclusion that the Trustee should serve as a Trustee for the fund.
Independent Trustees:
Correspondence intended for an Independent Trustee may be sent to Fidelity Investments, P.O. Box 55235, Boston, Massachusetts 02205-5235.
Name, Year of Birth; Principal Occupations and Other Relevant Experience+
Elizabeth S. Acton (1951)
Year of Election or Appointment: 2013
Trustee
Ms. Acton also serves as Trustee of other Fidelity® funds. Prior to her retirement, Ms. Acton served as Executive Vice President, Finance (2011-2012), Executive Vice President, Chief Financial Officer (2002-2011) and Treasurer (2004-2005) of Comerica Incorporated (financial services). Prior to joining Comerica, Ms. Acton held a variety of positions at Ford Motor Company (1983-2002), including Vice President and Treasurer (2000-2002) and Executive Vice President and Chief Financial Officer of Ford Motor Credit Company (1998-2000). Ms. Acton currently serves as a member of the Board and Audit and Finance Committees of Beazer Homes USA, Inc. (homebuilding, 2012-present). Ms. Acton previously served as a member of the Advisory Board of certain Fidelity® funds (2013-2016).
Ann E. Dunwoody (1953)
Year of Election or Appointment: 2018
Trustee
General Dunwoody also serves as Trustee of other Fidelity® funds. General Dunwoody (United States Army, Retired) was the first woman in U.S. military history to achieve the rank of four-star general and prior to her retirement in 2012 held a variety of positions within the U.S. Army, including Commanding General, U.S. Army Material Command (2008-2012). General Dunwoody currently serves as President of First to Four LLC (leadership and mentoring services, 2012-present), a member of the Board and Nomination and Corporate Governance Committees of Kforce Inc. (professional staffing services, 2016-present) and a member of the Board of Automattic Inc. (software engineering, 2018-present). Previously, General Dunwoody served as a member of the Advisory Board and Nominating and Corporate Governance Committee of L3 Technologies, Inc. (communication, electronic, sensor and aerospace systems, 2013-2019) and a member of the Board and Audit and Sustainability and Corporate Responsibility Committees of Republic Services, Inc. (waste collection, disposal and recycling, 2013-2016). Ms. Dunwoody also serves on several boards for non-profit organizations, including as a member of the Board, Chair of the Nomination and Governance Committee and a member of the Audit Committee of Logistics Management Institute (consulting non-profit, 2012-present), a member of the Council of Trustees for the Association of the United States Army (advocacy non-profit, 2013-present), a member of the Board of Florida Institute of Technology (2015-present) and a member of the Board of ThanksUSA (military family education non-profit, 2014-present). General Dunwoody previously served as a member of the Advisory Board of certain Fidelity® funds (2018).
John Engler (1948)
Year of Election or Appointment: 2014
Trustee
Mr. Engler also serves as Trustee of other Fidelity® funds. Previously, Mr. Engler served as Governor of Michigan (1991-2003), President of the Business Roundtable (2011-2017) and interim President of Michigan State University (2018-2019). Mr. Engler currently serves as a member of the Board of K12 Inc. (technology-based education company, 2012-present). Previously, Mr. Engler served as a member of the Board of Universal Forest Products (manufacturer and distributor of wood and wood-alternative products, 2003-2019) and Trustee of The Munder Funds (2003-2014). Mr. Engler previously served as a member of the Advisory Board of certain Fidelity® funds (2014-2016).
Robert F. Gartland (1951)
Year of Election or Appointment: 2010
Trustee
Mr. Gartland also serves as Trustee of other Fidelity® funds. Prior to his retirement, Mr. Gartland held a variety of positions at Morgan Stanley (financial services, 1979-2007), including Managing Director (1987-2007) and Chase Manhattan Bank (1975-1978). Mr. Gartland previously served as Chairman and an investor in Gartland & Mellina Group Corp. (consulting, 2009-2019), as a member of the Board of National Securities Clearing Corporation (1993-1996) and as Chairman of TradeWeb (2003-2004).
Arthur E. Johnson (1947)
Year of Election or Appointment: 2008
Trustee
Chairman of the Independent Trustees
Mr. Johnson also serves as Trustee of other Fidelity® funds. Prior to his retirement, Mr. Johnson served as Senior Vice President of Corporate Strategic Development of Lockheed Martin Corporation (defense contractor, 1999-2009). Mr. Johnson currently serves as a member of the Board of Booz Allen Hamilton (management consulting, 2011-present). Mr. Johnson previously served as a member of the Board of Eaton Corporation plc (diversified power management, 2009-2019) and a member of the Board of AGL Resources, Inc. (holding company, 2002-2016). Mr. Johnson previously served as Vice Chairman (2015-2018) of the Independent Trustees of certain Fidelity® funds. Mr. Arthur E. Johnson is not related to Ms. Abigail P. Johnson.
Michael E. Kenneally (1954)
Year of Election or Appointment: 2009
Trustee
Vice Chairman of the Independent Trustees
Mr. Kenneally also serves as Trustee of other Fidelity® funds. Prior to his retirement, Mr. Kenneally served as Chairman and Global Chief Executive Officer of Credit Suisse Asset Management and Executive Vice President and Chief Investment Officer of Bank of America Corporation. Earlier roles at Bank of America included Director of Research, Senior Portfolio Manager for various institutional equity accounts and mutual funds and Portfolio Manager for a number of institutional fixed-income clients. Mr. Kenneally began his career as a Research Analyst in 1983 and was awarded the Chartered Financial Analyst (CFA) designation in 1991.
Marie L. Knowles (1946)
Year of Election or Appointment: 2001
Trustee
Ms. Knowles also serves as Trustee of other Fidelity® funds. Prior to her retirement, Ms. Knowles held several positions at Atlantic Richfield Company (diversified energy), including Executive Vice President and Chief Financial Officer (1996-2000), Senior Vice President (1993-1996) and President of ARCO Transportation Company (pipeline and tanker operations, 1993-1996). Ms. Knowles currently serves as a member of the Board of McKesson Corporation (healthcare service, since 2002), a member of the Board of the Santa Catalina Island Company (real estate, 2009-present), a member of the Investment Company Institute Board of Governors and a member of the Governing Council of the Independent Directors Council (2014-present). Ms. Knowles also serves as a member of the Advisory Board for the School of Engineering of the University of Southern California. Ms. Knowles previously served as Chairman (2015-2018) and Vice Chairman (2012-2015) of the Independent Trustees of certain Fidelity® funds.
Mark A. Murray (1954)
Year of Election or Appointment: 2016
Trustee
Mr. Murray also serves as Trustee of other Fidelity® funds. Previously, Mr. Murray served as Co-Chief Executive Officer (2013-2016), President (2006-2013) and Vice Chairman (2013-2020) of Meijer, Inc. Mr. Murray serves as a member of the Board and Nuclear Review and Public Policy and Responsibility Committees of DTE Energy Company (diversified energy company, 2009-present) and a member of the Board and Audit Committee and Chairman of the Nominating and Corporate Governance Committee of Universal Forest Products, Inc. (manufacturer and distributor of wood and wood-alternative products, 2004-2016). Mr. Murray previously served as a member of the Board of Spectrum Health (not-for-profit health system, 2015-2019). Mr. Murray also serves as a member of the Board of many community and professional organizations. Mr. Murray previously served as a member of the Advisory Board of certain Fidelity® funds (2016).
+ The information includes the Trustee's principal occupation during the last five years and other information relating to the experience, attributes, and skills relevant to the Trustee's qualifications to serve as a Trustee, which led to the conclusion that the Trustee should serve as a Trustee for the fund.
Advisory Board Members and Officers:
Correspondence intended for an officer may be sent to Fidelity Investments, 245 Summer Street, Boston, Massachusetts 02210. Officers appear below in alphabetical order.
Name, Year of Birth; Principal Occupation
Elizabeth Paige Baumann (1968)
Year of Election or Appointment: 2017
Anti-Money Laundering (AML) Officer
Ms. Baumann also serves as AML Officer of other funds. She is Chief AML Officer (2012-present) and Senior Vice President (2014-present) of FMR LLC (diversified financial services company) and is an employee of Fidelity Investments. Previously, Ms. Baumann served as AML Officer of certain funds (2017-2019), as AML Officer of the funds (2012-2016), and Vice President (2007-2014) and Deputy Anti-Money Laundering Officer (2007-2012) of FMR LLC.
Craig S. Brown (1977)
Year of Election or Appointment: 2019
Assistant Treasurer
Mr. Brown also serves as Assistant Treasurer of other funds. Mr. Brown is an employee of Fidelity Investments (2013-present).
John J. Burke III (1964)
Year of Election or Appointment: 2018
Chief Financial Officer
Mr. Burke also serves as Chief Financial Officer of other funds. Mr. Burke serves as Head of Investment Operations for Fidelity Fund and Investment Operations (2018-present) and is an employee of Fidelity Investments (1998-present). Previously Mr. Burke served as head of Asset Management Investment Operations (2012-2018).
David J. Carter (1973)
Year of Election or Appointment: 2020
Assistant Secretary
Mr. Carter also serves as Assistant Secretary of other funds. Mr. Carter serves as Vice President, Associate General Counsel (2010-present) and is an employee of Fidelity Investments (2005-present).
Jonathan Davis (1968)
Year of Election or Appointment: 2010
Assistant Treasurer
Mr. Davis also serves as Assistant Treasurer of other funds. Mr. Davis serves as Assistant Treasurer of FMR Capital, Inc. (2017-present) and is an employee of Fidelity Investments. Previously, Mr. Davis served as Vice President and Associate General Counsel of FMR LLC (diversified financial services company, 2003-2010).
Laura M. Del Prato (1964)
Year of Election or Appointment: 2018
President and Treasurer
Ms. Del Prato also serves as an officer of other funds. Ms. Del Prato is an employee of Fidelity Investments (2017-present). Previously, Ms. Del Prato served as President and Treasurer of The North Carolina Capital Management Trust: Cash Portfolio and Term Portfolio (2018-2020). Prior to joining Fidelity Investments, Ms. Del Prato served as a Managing Director and Treasurer of the JPMorgan Mutual Funds (2014-2017). Prior to JPMorgan, Ms. Del Prato served as a partner at Cohen Fund Audit Services (accounting firm, 2012-2013) and KPMG LLP (accounting firm, 2004-2012).
Colm A. Hogan (1973)
Year of Election or Appointment: 2016
Assistant Treasurer
Mr. Hogan also serves as an officer of other funds. Mr. Hogan serves as Assistant Treasurer of FMR Capital, Inc. (2017-present) and is an employee of Fidelity Investments (2005-present). Previously, Mr. Hogan served as Deputy Treasurer of certain Fidelity® funds (2016-2020) and Assistant Treasurer of certain Fidelity® funds (2016-2018).
Cynthia Lo Bessette (1969)
Year of Election or Appointment: 2019
Secretary and Chief Legal Officer (CLO)
Ms. Lo Bessette also serves as an officer of other funds. Ms. Lo Bessette serves as CLO, Secretary, and Senior Vice President of Fidelity Management & Research Company LLC (investment adviser firm, 2019-present); and CLO of Fidelity Management & Research (Hong Kong) Limited, FMR Investment Management (UK) Limited, and Fidelity Management & Research (Japan) Limited (investment adviser firms, 2019-present). She is a Senior Vice President and Deputy General Counsel of FMR LLC (diversified financial services company, 2019-present), and is an employee of Fidelity Investments. Previously, Ms. Lo Bessette served as CLO, Secretary, and Senior Vice President of FMR Co., Inc. (investment adviser firm, 2019); Secretary of Fidelity SelectCo, LLC and Fidelity Investments Money Management, Inc. (investment adviser firms, 2019). Prior to joining Fidelity Investments, Ms. Lo Bessette was Executive Vice President, General Counsel (2016-2019) and Senior Vice President, Deputy General Counsel (2015-2016) of OppenheimerFunds (investment management company) and Deputy Chief Legal Officer (2013-2015) of Jennison Associates LLC (investment adviser firm).
Chris Maher (1972)
Year of Election or Appointment: 2013
Assistant Treasurer
Mr. Maher also serves as an officer of other funds. Mr. Maher serves as Assistant Treasurer of FMR Capital, Inc. (2017-present), and is an employee of Fidelity Investments (2008-present). Previously, Mr. Maher served as Assistant Treasurer of certain funds (2013-2020); Vice President of Asset Management Compliance (2013), Vice President of the Program Management Group of FMR (investment adviser firm, 2010-2013), and Vice President of Valuation Oversight (2008-2010).
Jamie Pagliocco (1964)
Year of Election or Appointment: 2020
Vice President
Mr. Pagliocco also serves as Vice President of other funds. Mr. Pagliocco serves as President of Fixed Income (2020-present), and is an employee of Fidelity Investments (2001-present). Previously, Mr. Pagliocco served as Co-Chief Investment Officer – Bond (2017-2020), Global Head of Bond Trading (2016-2019), and as a portfolio manager.
Kenneth B. Robins (1969)
Year of Election or Appointment: 2020
Chief Compliance Officer
Mr. Robins also serves as an officer of other funds. Mr. Robins serves as Compliance Officer of Fidelity Management & Research Company LLC (investment adviser firm, 2016-present) and is an employee of Fidelity Investments (2004-present). Previously, Mr. Robins served as Compliance Officer of FMR Co., Inc. (investment adviser firm, 2016-2019), as Executive Vice President of Fidelity Investments Money Management, Inc. (investment adviser firm, 2013-2016) and served in other fund officer roles.
Stacie M. Smith (1974)
Year of Election or Appointment: 2013
Assistant Treasurer
Ms. Smith also serves as an officer of other funds. Ms. Smith serves as Assistant Treasurer of FMR Capital, Inc. (2017-present), is an employee of Fidelity Investments (2009-present), and has served in other fund officer roles. Prior to joining Fidelity Investments, Ms. Smith served as Senior Audit Manager of Ernst & Young LLP (accounting firm, 1996-2009). Previously, Ms. Smith served as Assistant Treasurer (2013-2019) and Deputy Treasurer (2013-2016) of certain Fidelity® funds.
Marc L. Spector (1972)
Year of Election or Appointment: 2016
Deputy Treasurer
Mr. Spector also serves as an officer of other funds. Mr. Spector serves as Assistant Treasurer of FMR Capital, Inc. (2017-present) and is an employee of Fidelity Investments (2016-present). Prior to joining Fidelity Investments, Mr. Spector served as Director at the Siegfried Group (accounting firm, 2013-2016), and prior to Siegfried Group as audit senior manager at Deloitte & Touche LLP (accounting firm, 2005-2013).
Jim Wegmann (1979)
Year of Election or Appointment: 2019
Assistant Treasurer
Mr. Wegmann also serves as Assistant Treasurer of other funds. Mr. Wegmann is an employee of Fidelity Investments (2011-present).
Shareholder Expense Example
As a shareholder, you incur two types of costs: (1) transaction costs, which may include sales charges (loads) on purchase payments or redemption proceeds, as applicable and (2) ongoing costs, which generally include management fees, distribution and/or service (12b-1) fees and other Fund expenses. This Example is intended to help you understand your ongoing costs (in dollars) of investing in a fund and to compare these costs with the ongoing costs of investing in other mutual funds.
The Example is based on an investment of $1,000 invested at the beginning of the period and held for the entire period (February 1, 2020 to July 31, 2020).
Actual Expenses
The first line of the accompanying table provides information about actual account values and actual expenses. You may use the information in this line, together with the amount you invested, to estimate the expenses that you paid over the period. Simply divide your account value by $1,000.00 (for example, an $8,600 account value divided by $1,000.00 = 8.6), then multiply the result by the number in the first line for a class/Fund under the heading entitled "Expenses Paid During Period" to estimate the expenses you paid on your account during this period. If any fund is a shareholder of any underlying mutual funds or exchange-traded funds (ETFs) (the Underlying Funds), such fund indirectly bears its proportional share of the expenses of the Underlying Funds in addition to the direct expenses incurred presented in the table. These fees and expenses are not included in the annualized expense ratio used to calculate the expense estimate in the table below.
Hypothetical Example for Comparison Purposes
The second line of the accompanying table provides information about hypothetical account values and hypothetical expenses based on the actual expense ratio and an assumed rate of return of 5% per year before expenses, which is not the actual return. The hypothetical account values and expenses may not be used to estimate the actual ending account balance or expenses you paid for the period. You may use this information to compare the ongoing costs of investing in the Fund and other funds. To do so, compare this 5% hypothetical example with the 5% hypothetical examples that appear in the shareholder reports of the other funds. If any fund is a shareholder of any Underlying Funds, such fund indirectly bears its proportional share of the expenses of the Underlying Funds in addition to the direct expenses as presented in the table. These fees and expenses are not included in the annualized expense ratio used to calculate the expense estimate in the table below.
Please note that the expenses shown in the table are meant to highlight your ongoing costs only and do not reflect any transaction costs. Therefore, the second line of the table is useful in comparing ongoing costs only, and will not help you determine the relative total costs of owning different funds.
| | Annualized Expense Ratio-A | Beginning
Account Value
February 1, 2020 | Ending
Account Value
July 31, 2020 | Expenses Paid
During Period-B
February 1, 2020
to July 31, 2020 |
| Fidelity Real Estate Index Fund | .07% | | | |
| Actual | | $1,000.00 | $802.70 | $.31 |
| Hypothetical-C | | $1,000.00 | $1,024.52 | $.35 |
A Annualized expense ratio reflects expenses net of applicable fee waivers.
B Expenses are equal to the Fund's annualized expense ratio, multiplied by the average account value over the period, multiplied by 182/ 366 (to reflect the one-half year period). The fees and expenses of any Underlying Funds are not included in each annualized expense ratio.
C 5% return per year before expenses
Distributions (Unaudited)
The fund hereby designates as a capital gain dividend with respect to the taxable year ended July 31, 2020, $313,799, or, if subsequently determined to be different, the net capital gain of such year.
The fund designates 1% of the dividends distributed in December during the fiscal year as qualifying for the dividends–received deduction for corporate shareholders.
The fund designates 1% and 2% of the dividends distributed in September and December, respectively, during the fiscal year as amounts which may be taken into account as a dividend for the purposes of the maximum rate under section 1(h)(11) of the Internal Revenue Code.
A total of 0.03% of the dividends distributed during the fiscal year was derived from interest on U.S. Government securities which is generally exempt from state income tax.
The fund designates 99% and 94% of the dividends distributed in September and December, respectively, during the fiscal year as a section 199A dividend.
The fund will notify shareholders in January 2021 of amounts for use in preparing 2020 income tax returns.
Liquidity Risk Management Program
The Securities and Exchange Commission adopted Rule 22e-4 under the Investment Company Act of 1940 (the Liquidity Rule) to promote effective liquidity risk management throughout the open-end investment company industry, thereby reducing the risk that funds will be unable to meet their redemption obligations and mitigating dilution of the interests of fund shareholders.
The Fund has adopted and implemented a liquidity risk management program pursuant to the Liquidity Rule (the Program) effective December 1, 2018. The Program is reasonably designed to assess and manage the Fund’s liquidity risk and to comply with the requirements of the Liquidity Rule. The Fund’s Board of Trustees (the Board) has designated the Fund’s investment adviser as administrator of the Program. The Fidelity advisers have established a Liquidity Risk Management Committee (the LRM Committee) to manage the Program for each of the Fidelity Funds. The LRM Committee monitors the adequacy and effectiveness of implementation of the Program and on a periodic basis assesses each Fund’s liquidity risk based on a variety of factors including (1) the Fund’s investment strategy, (2) portfolio liquidity and cash flow projections during normal and reasonably foreseeable stressed conditions, (3) shareholder redemptions, (4) borrowings and other funding sources and (5) in the case of exchange-traded funds, certain additional factors including the effect of the Fund’s prices and spreads, market participants, and basket compositions on the overall liquidity of the Fund’s portfolio, as applicable.
In accordance with the Program, each of the Fund’s portfolio investments is classified into one of four liquidity categories described below based on a determination of a reasonable expectation for how long it would take to convert the investment to cash (or sell or dispose of the investment) without significantly changing its market value.
- Highly liquid investments – cash or convertible to cash within three business days or less
- Moderately liquid investments – convertible to cash in three to seven calendar days
- Less liquid investments – can be sold or disposed of, but not settled, within seven calendar days
- Illiquid investments – cannot be sold or disposed of within seven calendar days
Liquidity classification determinations take into account a variety of factors including various market, trading and investment-specific considerations, as well as market depth, and generally utilize analysis from a third-party liquidity metrics service.
The Liquidity Rule places a 15% limit on a fund’s illiquid investments and requires funds that do not primarily hold assets that are highly liquid investments to determine and maintain a minimum percentage of the fund’s net assets to be invested in highly liquid investments (highly liquid investment minimum or HLIM). The Program includes provisions reasonably designed to comply with the 15% limit on illiquid investments and for determining, periodically reviewing and complying with the HLIM requirement as applicable.
At a recent meeting of the Fund’s Board of Trustees, the LRM Committee provided a written report to the Board pertaining to the operation, adequacy, and effectiveness of implementation of the Program for the annual period from December 1, 2018 through November 30, 2019. The report concluded that the Program has been implemented and is operating effectively and is reasonably designed to assess and manage the Fund’s liquidity risk.

URX-I-ANN-0920
1.929343.108
Fidelity® SAI Small-Mid Cap 500 Index Fund
Offered exclusively to certain clients of the Adviser or its affiliates - not available for sale to the general public. Fidelity SAI is a product name of Fidelity® funds dedicated to certain programs affiliated with Strategic Advisers LLC.
Annual Report
July 31, 2020
See the inside front cover for important information about access to your fund’s shareholder reports.
Beginning on January 1, 2021, as permitted by regulations adopted by the Securities and Exchange Commission, paper copies of a fund’s shareholder reports will no longer be sent by mail, unless you specifically request paper copies of the reports from the fund or from your financial intermediary, such as a financial advisor, broker-dealer or bank. Instead, the reports will be made available on a website, and you will be notified by mail each time a report is posted and provided with a website link to access the report.
If you already elected to receive shareholder reports electronically, you will not be affected by this change and you need not take any action. You may elect to receive shareholder reports and other communications from a fund electronically, by contacting your financial intermediary. For Fidelity customers, visit Fidelity's web site or call Fidelity using the contact information listed below.
You may elect to receive all future reports in paper free of charge. If you wish to continue receiving paper copies of your shareholder reports, you may contact your financial intermediary or, if you are a Fidelity customer, visit Fidelity’s website, or call Fidelity at the applicable toll-free number listed below. Your election to receive reports in paper will apply to all funds held with the fund complex/your financial intermediary.
| Account Type | Website | Phone Number |
| Brokerage, Mutual Fund, or Annuity Contracts: | fidelity.com/mailpreferences | 1-800-343-3548 |
| Employer Provided Retirement Accounts: | netbenefits.fidelity.com/preferences (choose 'no' under Required Disclosures to continue to print) | 1-800-343-0860 |
| Advisor Sold Accounts Serviced Through Your Financial Intermediary: | Contact Your Financial Intermediary | Your Financial Intermediary's phone number |
| Advisor Sold Accounts Serviced by Fidelity: | institutional.fidelity.com | 1-877-208-0098 |
Contents
To view a fund's proxy voting guidelines and proxy voting record for the 12-month period ended June 30, visit http://www.fidelity.com/proxyvotingresults or visit the Securities and Exchange Commission's (SEC) web site at http://www.sec.gov.
You may also call 1-800-544-3455 to request a free copy of the proxy voting guidelines.
Standard & Poor's, S&P and S&P 500 are registered service marks of The McGraw-Hill Companies, Inc. and have been licensed for use by Fidelity Distributors Corporation.
Other third-party marks appearing herein are the property of their respective owners.
All other marks appearing herein are registered or unregistered trademarks or service marks of FMR LLC or an affiliated company. © 2020 FMR LLC. All rights reserved.
This report and the financial statements contained herein are submitted for the general information of the shareholders of the Fund. This report is not authorized for distribution to prospective investors in the Fund unless preceded or accompanied by an effective prospectus.
A fund files its complete schedule of portfolio holdings with the SEC for the first and third quarters of each fiscal year on Form N-PORT. Forms N-PORT are available on the SEC’s web site at http://www.sec.gov. A fund's Forms N-PORT may be reviewed and copied at the SEC’s Public Reference Room in Washington, DC. Information regarding the operation of the SEC's Public Reference Room may be obtained by calling 1-800-SEC-0330.
For a complete list of a fund's portfolio holdings, view the most recent holdings listing, semiannual report, or annual report on Fidelity's web site at http://www.fidelity.com, http://www.institutional.fidelity.com, or http://www.401k.com, as applicable.
NOT FDIC INSURED •MAY LOSE VALUE •NO BANK GUARANTEE
Neither the Fund nor Fidelity Distributors Corporation is a bank.
Note to Shareholders:
Early in 2020, the outbreak and spread of a new coronavirus emerged as a public health emergency that had a major influence on financial markets, primarily based on its impact on the global economy and the outlook for corporate earnings. The virus causes a respiratory disease known as COVID-19. On March 11, the World Health Organization declared the COVID-19 outbreak a pandemic, citing sustained risk of further global spread.
In the weeks following, as the crisis worsened, we witnessed an escalating human tragedy with wide-scale social and economic consequences from coronavirus-containment measures. The outbreak of COVID-19 prompted a number of measures to limit the spread, including travel and border restrictions, quarantines, and restrictions on large gatherings. In turn, these resulted in lower consumer activity, diminished demand for a wide range of products and services, disruption in manufacturing and supply chains, and – given the wide variability in outcomes regarding the outbreak – significant market uncertainty and volatility. Amid the turmoil, the U.S. government took unprecedented action – in concert with the U.S. Federal Reserve and central banks around the world – to help support consumers, businesses, and the broader economy, and to limit disruption to the financial system.
The situation continues to unfold, and the extent and duration of its impact on financial markets and the economy remain highly uncertain. Extreme events such as the coronavirus crisis are “exogenous shocks” that can have significant adverse effects on mutual funds and their investments. Although multiple asset classes may be affected by market disruption, the duration and impact may not be the same for all types of assets.
Fidelity is committed to helping you stay informed amid news about COVID-19 and during increased market volatility, and we’re taking extra steps to be responsive to customer needs. We encourage you to visit our websites, where we offer ongoing updates, commentary, and analysis on the markets and our funds.
Performance: The Bottom Line
Average annual total return reflects the change in the value of an investment, assuming reinvestment of distributions from dividend income and capital gains (the profits earned upon the sale of securities that have grown in value, if any) and assuming a constant rate of performance each year. The hypothetical investment and the average annual total returns do not reflect the deduction of taxes that a shareholder would pay on fund distributions or the redemption of fund shares. During periods of reimbursement by Fidelity, a fund’s total return will be greater than it would be had the reimbursement not occurred. How a fund did yesterday is no guarantee of how it will do tomorrow.
Average Annual Total Returns
| For the periods ended July 31, 2020 | Past 1 year | Life of fundA |
| Fidelity® SAI Small-Mid Cap 500 Index Fund | (0.03)% | 7.24% |
A From August 12, 2015
$10,000 Over Life of Fund
Let's say hypothetically that $10,000 was invested in Fidelity® SAI Small-Mid Cap 500 Index Fund on August 12, 2015, when the fund started.
The chart shows how the value of your investment would have changed, and also shows how the Russell SMID 500™ Index performed over the same period.
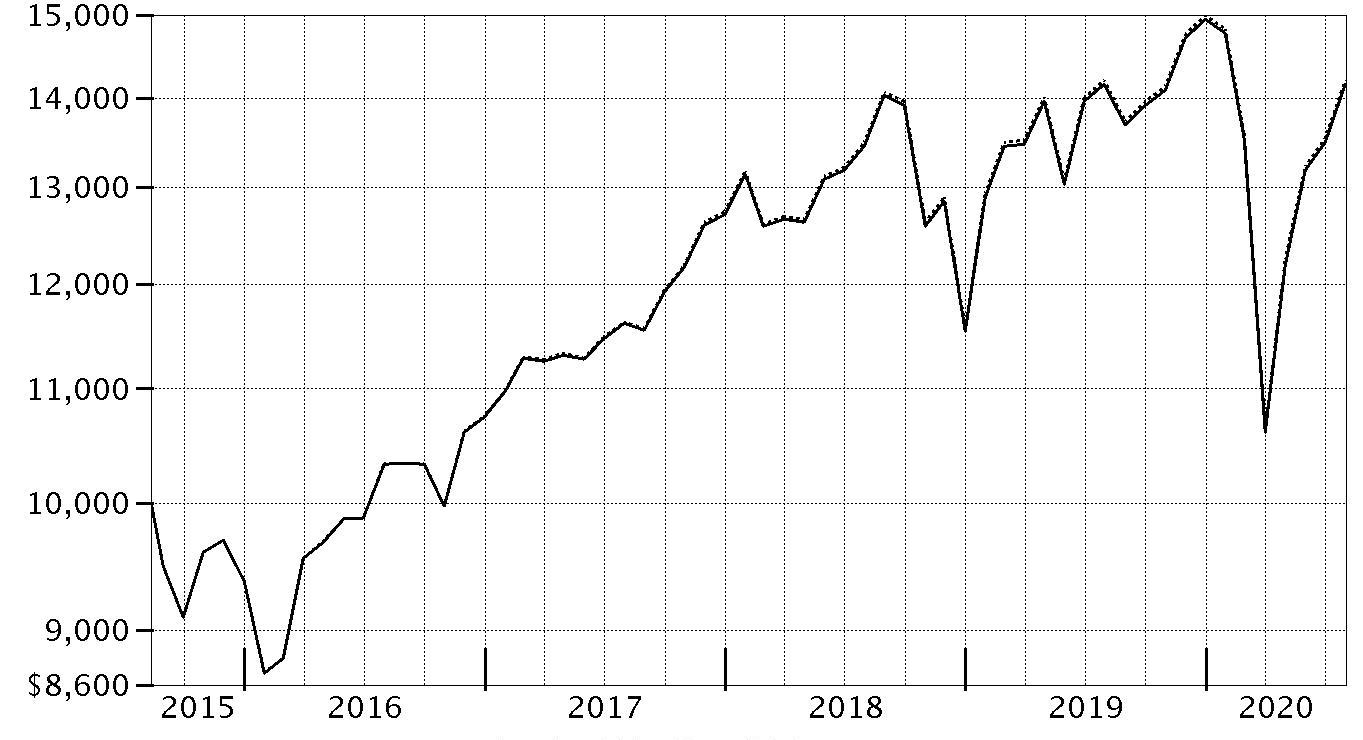
| Period Ending Values |
| $14,159 | Fidelity® SAI Small-Mid Cap 500 Index Fund |
| $14,207 | Russell SMID 500™ Index |
Management's Discussion of Fund Performance
Market Recap: The S&P 500
® index gained 11.96% for the 12 months ending July 31, 2020, in what was a bumpy ride for U.S. equity investors, marked by a steep but brief decline due to the early-2020 outbreak and spread of the coronavirus, followed by a historic rebound. Declared a pandemic on March 11, the COVID-19 crisis and containment efforts caused broad contraction in economic activity, along with extreme uncertainty, volatility and dislocation in financial markets. By mid-March, U.S. stocks entered bear-market territory less than a month after hitting an all-time high and extending the longest-running bull market in American history. Stocks slid in late February, after a surge in COVID-19 cases outside China. The sudden downtrend continued in March (-12%), capping the index’s worst quarter since 2008. A historically rapid and expansive U.S. monetary/fiscal-policy response provided a partial offset to the economic disruption and fueled a sharp uptrend. Aggressive support for financial markets by the U.S. Federal Reserve, plans for reopening the economy and improving infection data boosted stocks in April (+13%) and May (+5%). In June and July, the index gained amid progress on potential treatments and signs of an early recovery in economic activity. For the full 12 months, growth stocks widely topped value, while large-caps handily bested smaller-caps. The information technology sector (+39%) led the way, followed by consumer discretionary (+22%). In contrast, energy (-38%) fell hard along with the price of crude oil.
Comments from the Geode Capital Management, LLC, passive equity index team: For the fiscal year ending July 31, 2020, the fund returned -0.03%, roughly in line with the 0.00% result of the benchmark Russell SMID 500 Index. By sector, financials returned about -18% and detracted most, followed by real estate, which returned roughly -15%. The energy sector returned -49% and industrials (-9%) also hurt. Consumer discretionary (-4%) and utilities (-8%) hampered results. Other notable detractors included the materials (-5%) sector and communication services (+0%). Conversely, information technology gained roughly 25% and contributed most, driven by the software & services industry (+30%). Health care stocks also helped, gaining 31%. Turning to individual stocks, the biggest individual detractor was Spirit Aerosystem (-75%), from the capital goods industry. Sage Therapeutics, within the pharmaceuticals, biotechnology & life sciences group, returned -71% and hindered the fund. In retailing, Kohl's (-62%) and Macy's (-71%) hurt. Another detractor was Alliance Data Systems (-71%), a stock in the software & services segment. Conversely, the biggest individual contributor was Dexcom (+143%), from the health care equipment & services category. In software & services, DocuSign (+243%) and RingCentral (+103%) helped. Other contributors from the pharmaceuticals, biotechnology & life sciences group were Seattle Genetics (+118%) and Moderna (+365%).
The views expressed above reflect those of the portfolio manager(s) only through the end of the period as stated on the cover of this report and do not necessarily represent the views of Fidelity or any other person in the Fidelity organization. Any such views are subject to change at any time based upon market or other conditions and Fidelity disclaims any responsibility to update such views. These views may not be relied on as investment advice and, because investment decisions for a Fidelity fund are based on numerous factors, may not be relied on as an indication of trading intent on behalf of any Fidelity fund.
Investment Summary (Unaudited)
Top Five Stocks as of July 31, 2020
| | % of fund's net assets |
| Teradyne, Inc. | 0.6 |
| Etsy, Inc. | 0.5 |
| Catalent, Inc. | 0.5 |
| PerkinElmer, Inc. | 0.5 |
| NVR, Inc. | 0.5 |
| | 2.6 |
Top Five Market Sectors as of July 31, 2020
| | % of fund's net assets |
| Information Technology | 19.7 |
| Industrials | 14.7 |
| Health Care | 12.8 |
| Financials | 12.7 |
| Consumer Discretionary | 11.7 |
Asset Allocation (% of fund's net assets)
| As of July 31, 2020 * |
| | Stocks and Equity Futures | 100.2% |
| | Short-Term Investments and Net Other Assets (Liabilities)** | (0.2)% |

* Foreign investments - 6.4%
** Short-Term Investments and Net Other Assets (Liabilities) are not included in the pie chart
Schedule of Investments July 31, 2020
Showing Percentage of Net Assets
| Common Stocks - 99.6% | | | |
| | | Shares | Value |
| COMMUNICATION SERVICES - 3.4% | | | |
| Diversified Telecommunication Services - 0.3% | | | |
| GCI Liberty, Inc. (a) | | 75,521 | $5,920,091 |
| Entertainment - 0.7% | | | |
| Lions Gate Entertainment Corp.: | | | |
| Class A (a)(b) | | 44,588 | 341,544 |
| Class B (a) | | 87,862 | 624,699 |
| Madison Square Garden Entertainment Corp. (a) | | 14,309 | 1,013,936 |
| The Madison Square Garden Co. (a) | | 14,349 | 2,205,298 |
| World Wrestling Entertainment, Inc. Class A | | 35,184 | 1,639,926 |
| Zynga, Inc. (a) | | 679,205 | 6,676,585 |
| | | | 12,501,988 |
| Interactive Media & Services - 0.6% | | | |
| TripAdvisor, Inc. | | 77,017 | 1,558,054 |
| Zillow Group, Inc.: | | | |
| Class A (a) | | 43,827 | 2,984,180 |
| Class C (a)(b) | | 103,971 | 7,110,577 |
| | | | 11,652,811 |
| Media - 1.7% | | | |
| Cable One, Inc. | | 3,890 | 7,089,758 |
| Interpublic Group of Companies, Inc. | | 297,383 | 5,367,763 |
| John Wiley & Sons, Inc. Class A | | 33,143 | 1,121,228 |
| Liberty Media Corp.: | | | |
| Liberty Formula One Group Series C (a) | | 151,617 | 5,373,306 |
| Liberty Media Class A (a) | | 19,249 | 636,949 |
| News Corp.: | | | |
| Class A | | 297,081 | 3,778,870 |
| Class B | | 92,721 | 1,183,120 |
| Nexstar Broadcasting Group, Inc. Class A | | 33,480 | 2,934,522 |
| The New York Times Co. Class A | | 124,633 | 5,750,567 |
| | | | 33,236,083 |
| Wireless Telecommunication Services - 0.1% | | | |
| Telephone & Data Systems, Inc. | | 77,139 | 1,498,039 |
| U.S. Cellular Corp. (a) | | 11,119 | 329,901 |
| | | | 1,827,940 |
|
| TOTAL COMMUNICATION SERVICES | | | 65,138,913 |
|
| CONSUMER DISCRETIONARY - 11.7% | | | |
| Auto Components - 0.8% | | | |
| BorgWarner, Inc. | | 158,449 | 5,799,233 |
| Gentex Corp. | | 187,803 | 5,068,803 |
| Lear Corp. | | 45,865 | 5,062,579 |
| | | | 15,930,615 |
| Automobiles - 0.4% | | | |
| Harley-Davidson, Inc. (b) | | 117,071 | 3,047,358 |
| Thor Industries, Inc. | | 42,216 | 4,812,202 |
| | | | 7,859,560 |
| Distributors - 0.5% | | | |
| Pool Corp. | | 29,684 | 9,400,923 |
| Diversified Consumer Services - 1.6% | | | |
| Bright Horizons Family Solutions, Inc. (a) | | 44,143 | 4,733,895 |
| Chegg, Inc. (a) | | 92,691 | 7,505,190 |
| Frontdoor, Inc. (a) | | 65,518 | 2,751,428 |
| Graham Holdings Co. | | 3,168 | 1,262,036 |
| Grand Canyon Education, Inc. (a) | | 35,699 | 3,167,929 |
| H&R Block, Inc. | | 147,636 | 2,140,722 |
| Service Corp. International | | 133,120 | 5,772,083 |
| ServiceMaster Global Holdings, Inc. (a) | | 101,249 | 4,140,072 |
| | | | 31,473,355 |
| Hotels, Restaurants & Leisure - 1.8% | | | |
| ARAMARK Holdings Corp. | | 174,708 | 3,689,833 |
| Choice Hotels International, Inc. (b) | | 26,607 | 2,236,052 |
| Dunkin' Brands Group, Inc. | | 62,746 | 4,312,533 |
| Extended Stay America, Inc. unit | | 135,614 | 1,547,356 |
| Hyatt Hotels Corp. Class A | | 26,817 | 1,287,216 |
| Norwegian Cruise Line Holdings Ltd. (a)(b) | | 195,908 | 2,672,185 |
| Planet Fitness, Inc. (a) | | 61,347 | 3,202,313 |
| Six Flags Entertainment Corp. | | 58,672 | 1,020,306 |
| Vail Resorts, Inc. | | 30,581 | 5,872,469 |
| Wendy's Co. | | 137,231 | 3,181,015 |
| Wyndham Destinations, Inc. | | 64,306 | 1,710,540 |
| Wyndham Hotels & Resorts, Inc. | | 70,158 | 3,098,177 |
| | | | 33,829,995 |
| Household Durables - 2.0% | | | |
| Leggett & Platt, Inc. | | 101,050 | 4,051,095 |
| Mohawk Industries, Inc. (a) | | 44,468 | 3,550,770 |
| Newell Brands, Inc. | | 294,007 | 4,821,715 |
| NVR, Inc. (a) | | 2,564 | 10,076,905 |
| PulteGroup, Inc. | | 204,773 | 8,928,103 |
| Tempur Sealy International, Inc. (a) | | 36,169 | 2,927,881 |
| Toll Brothers, Inc. | | 88,617 | 3,385,169 |
| | | | 37,741,638 |
| Internet & Direct Marketing Retail - 1.0% | | | |
| Etsy, Inc. (a) | | 90,373 | 10,698,356 |
| GrubHub, Inc. (a) | | 70,391 | 5,085,046 |
| Liberty Interactive Corp. QVC Group Series A (a) | | 291,393 | 3,179,098 |
| | | | 18,962,500 |
| Leisure Products - 0.6% | | | |
| Brunswick Corp. | | 60,379 | 4,044,185 |
| Mattel, Inc. (a)(b) | | 263,130 | 2,923,374 |
| Polaris, Inc. | | 44,474 | 4,608,841 |
| | | | 11,576,400 |
| Multiline Retail - 0.4% | | | |
| Kohl's Corp. | | 118,510 | 2,256,430 |
| Nordstrom, Inc. (b) | | 83,809 | 1,147,345 |
| Ollie's Bargain Outlet Holdings, Inc. (a)(b) | | 40,663 | 4,273,681 |
| | | | 7,677,456 |
| Specialty Retail - 1.4% | | | |
| AutoNation, Inc. (a) | | 45,015 | 2,311,070 |
| Dick's Sporting Goods, Inc. | | 47,179 | 2,152,306 |
| Five Below, Inc. (a) | | 41,795 | 4,551,893 |
| Floor & Decor Holdings, Inc. Class A (a) | | 62,172 | 4,097,135 |
| Foot Locker, Inc. | | 79,167 | 2,326,718 |
| Gap, Inc. (b) | | 139,716 | 1,868,003 |
| L Brands, Inc. | | 175,575 | 4,285,786 |
| Penske Automotive Group, Inc. (b) | | 24,448 | 1,095,759 |
| Williams-Sonoma, Inc. | | 58,811 | 5,123,614 |
| | | | 27,812,284 |
| Textiles, Apparel & Luxury Goods - 1.2% | | | |
| Capri Holdings Ltd. (a) | | 108,697 | 1,628,281 |
| Carter's, Inc. | | 32,791 | 2,581,308 |
| Columbia Sportswear Co. (b) | | 22,049 | 1,672,196 |
| Hanesbrands, Inc. | | 265,416 | 3,750,328 |
| PVH Corp. | | 53,748 | 2,615,378 |
| Ralph Lauren Corp. (b) | | 36,560 | 2,606,728 |
| Skechers U.S.A., Inc. Class A (sub. vtg.) (a) | | 102,376 | 2,997,569 |
| Tapestry, Inc. | | 211,645 | 2,827,577 |
| Under Armour, Inc.: | | | |
| Class A (sub. vtg.) (a) | | 143,857 | 1,513,376 |
| Class C (non-vtg.) (a) | | 145,335 | 1,379,229 |
| | | | 23,571,970 |
|
| TOTAL CONSUMER DISCRETIONARY | | | 225,836,696 |
|
| CONSUMER STAPLES - 3.3% | | | |
| Beverages - 0.3% | | | |
| Boston Beer Co., Inc. Class A (a)(b) | | 6,637 | 5,378,890 |
| Food & Staples Retailing - 0.7% | | | |
| Casey's General Stores, Inc. | | 28,178 | 4,485,656 |
| Grocery Outlet Holding Corp. (a) | | 53,229 | 2,341,544 |
| Sprouts Farmers Market LLC (a) | | 90,199 | 2,379,450 |
| U.S. Foods Holding Corp. (a) | | 168,156 | 3,413,567 |
| | | | 12,620,217 |
| Food Products - 1.7% | | | |
| Beyond Meat, Inc. (a)(b) | | 39,450 | 4,966,755 |
| Bunge Ltd. | | 105,683 | 4,590,870 |
| Flowers Foods, Inc. | | 149,203 | 3,394,368 |
| Ingredion, Inc. | | 51,380 | 4,444,370 |
| Lamb Weston Holdings, Inc. | | 111,717 | 6,711,957 |
| Pilgrim's Pride Corp. (a) | | 40,218 | 617,346 |
| Post Holdings, Inc. (a) | | 48,785 | 4,329,181 |
| Seaboard Corp. | | 194 | 524,431 |
| The Hain Celestial Group, Inc. (a) | | 62,276 | 2,116,138 |
| TreeHouse Foods, Inc. (a) | | 43,021 | 1,885,180 |
| | | | 33,580,596 |
| Household Products - 0.3% | | | |
| Energizer Holdings, Inc. | | 47,458 | 2,379,070 |
| Reynolds Consumer Products, Inc. | | 37,606 | 1,280,860 |
| Spectrum Brands Holdings, Inc. | | 32,488 | 1,759,550 |
| | | | 5,419,480 |
| Personal Products - 0.3% | | | |
| Coty, Inc. Class A | | 219,456 | 814,182 |
| Herbalife Nutrition Ltd. (a) | | 77,634 | 3,977,966 |
| Nu Skin Enterprises, Inc. Class A | | 39,292 | 1,762,246 |
| | | | 6,554,394 |
|
| TOTAL CONSUMER STAPLES | | | 63,553,577 |
|
| ENERGY - 2.4% | | | |
| Energy Equipment & Services - 0.2% | | | |
| Helmerich & Payne, Inc. | | 80,101 | 1,428,201 |
| National Oilwell Varco, Inc. | | 296,893 | 3,417,238 |
| | | | 4,845,439 |
| Oil, Gas & Consumable Fuels - 2.2% | | | |
| Antero Midstream GP LP | | 220,196 | 1,248,511 |
| Apache Corp. | | 289,025 | 4,436,534 |
| Cimarex Energy Co. | | 76,877 | 1,880,411 |
| Continental Resources, Inc. (b) | | 57,510 | 994,348 |
| Devon Energy Corp. | | 292,154 | 3,064,695 |
| Diamondback Energy, Inc. | | 120,581 | 4,806,359 |
| EQT Corp. | | 195,134 | 2,833,346 |
| Equitrans Midstream Corp. | | 312,303 | 3,013,724 |
| HollyFrontier Corp. | | 114,262 | 3,142,205 |
| Marathon Oil Corp. | | 602,967 | 3,310,289 |
| Murphy Oil Corp. | | 111,434 | 1,472,043 |
| Noble Energy, Inc. | | 364,443 | 3,640,786 |
| Parsley Energy, Inc. Class A | | 230,310 | 2,528,804 |
| Targa Resources Corp. | | 176,291 | 3,222,599 |
| WPX Energy, Inc. (a) | | 307,877 | 1,838,026 |
| | | | 41,432,680 |
|
| TOTAL ENERGY | | | 46,278,119 |
|
| FINANCIALS - 12.7% | | | |
| Banks - 3.6% | | | |
| Associated Banc-Corp. | | 116,146 | 1,491,315 |
| Bank of Hawaii Corp. | | 30,190 | 1,709,660 |
| Bank OZK | | 93,430 | 2,246,992 |
| BOK Financial Corp. | | 24,054 | 1,339,808 |
| Comerica, Inc. | | 106,488 | 4,101,918 |
| Commerce Bancshares, Inc. | | 76,996 | 4,408,791 |
| Cullen/Frost Bankers, Inc. | | 42,850 | 3,087,771 |
| East West Bancorp, Inc. | | 107,913 | 3,740,265 |
| First Citizens Bancshares, Inc. | | 5,015 | 2,135,738 |
| First Hawaiian, Inc. | | 99,263 | 1,725,191 |
| First Horizon National Corp. | | 417,556 | 3,870,744 |
| FNB Corp., Pennsylvania | | 246,821 | 1,828,944 |
| PacWest Bancorp | | 89,392 | 1,633,639 |
| Peoples United Financial, Inc. | | 323,693 | 3,492,647 |
| Pinnacle Financial Partners, Inc. | | 56,515 | 2,239,124 |
| Popular, Inc. | | 66,419 | 2,464,809 |
| Prosperity Bancshares, Inc. | | 68,332 | 3,796,526 |
| Signature Bank | | 39,823 | 4,083,052 |
| Sterling Bancorp | | 148,034 | 1,665,383 |
| Synovus Financial Corp. | | 111,858 | 2,253,939 |
| TCF Financial Corp. | | 115,459 | 3,173,968 |
| Umpqua Holdings Corp. | | 168,432 | 1,827,487 |
| Webster Financial Corp. | | 68,526 | 1,868,704 |
| Western Alliance Bancorp. | | 74,784 | 2,688,485 |
| Wintrust Financial Corp. | | 43,695 | 1,870,146 |
| Zions Bancorp NA | | 123,578 | 4,012,578 |
| | | | 68,757,624 |
| Capital Markets - 2.3% | | | |
| Affiliated Managers Group, Inc. | | 35,889 | 2,468,804 |
| Ares Management Corp. | | 75,092 | 2,999,174 |
| Carlyle Group LP | | 89,143 | 2,537,901 |
| Eaton Vance Corp. (non-vtg.) | | 84,755 | 3,063,046 |
| Evercore, Inc. Class A | | 30,249 | 1,672,770 |
| FactSet Research Systems, Inc. | | 28,436 | 9,847,387 |
| Invesco Ltd. | | 288,555 | 2,897,092 |
| Lazard Ltd. Class A | | 77,183 | 2,263,006 |
| Legg Mason, Inc. | | 63,659 | 3,182,313 |
| LPL Financial | | 60,109 | 4,749,813 |
| Morningstar, Inc. | | 16,561 | 2,782,910 |
| SEI Investments Co. | | 88,318 | 4,621,681 |
| Virtu Financial, Inc. Class A | | 48,003 | 1,190,474 |
| | | | 44,276,371 |
| Consumer Finance - 0.8% | | | |
| Ally Financial, Inc. | | 285,949 | 5,747,575 |
| Credit Acceptance Corp. (a)(b) | | 7,736 | 3,619,984 |
| LendingTree, Inc. (a)(b) | | 6,043 | 2,092,630 |
| OneMain Holdings, Inc. | | 49,836 | 1,430,293 |
| Santander Consumer U.S.A. Holdings, Inc. (b) | | 58,058 | 1,065,945 |
| SLM Corp. | | 286,449 | 1,939,260 |
| | | | 15,895,687 |
| Diversified Financial Services - 0.4% | | | |
| Jefferies Financial Group, Inc. | | 173,477 | 2,810,327 |
| Voya Financial, Inc. | | 96,177 | 4,751,144 |
| | | | 7,561,471 |
| Insurance - 4.7% | | | |
| Alleghany Corp. | | 10,641 | 5,558,007 |
| American Financial Group, Inc. | | 56,434 | 3,429,494 |
| American National Group, Inc. | | 5,666 | 417,301 |
| Assurant, Inc. | | 45,632 | 4,904,071 |
| Assured Guaranty Ltd. | | 64,347 | 1,404,695 |
| Athene Holding Ltd. (a) | | 88,414 | 2,851,352 |
| Axis Capital Holdings Ltd. | | 63,490 | 2,547,219 |
| Brighthouse Financial, Inc. (a) | | 75,214 | 2,131,565 |
| Brown & Brown, Inc. | | 180,491 | 8,206,926 |
| Erie Indemnity Co. Class A | | 19,242 | 4,043,129 |
| Everest Re Group Ltd. | | 30,621 | 6,699,569 |
| First American Financial Corp. | | 83,042 | 4,235,972 |
| Globe Life, Inc. | | 80,309 | 6,392,596 |
| Hanover Insurance Group, Inc. | | 28,983 | 2,952,788 |
| Kemper Corp. | | 47,262 | 3,711,012 |
| Mercury General Corp. | | 20,788 | 892,013 |
| Old Republic International Corp. | | 216,626 | 3,481,180 |
| Primerica, Inc. | | 30,551 | 3,655,733 |
| Reinsurance Group of America, Inc. | | 51,848 | 4,420,042 |
| RenaissanceRe Holdings Ltd. | | 37,468 | 6,758,478 |
| Unum Group | | 155,576 | 2,680,574 |
| W.R. Berkley Corp. | | 106,621 | 6,583,847 |
| White Mountains Insurance Group Ltd. | | 2,309 | 2,032,220 |
| | | | 89,989,783 |
| Mortgage Real Estate Investment Trusts - 0.6% | | | |
| AGNC Investment Corp. | | 434,773 | 5,912,913 |
| New Residential Investment Corp. | | 317,066 | 2,514,333 |
| Starwood Property Trust, Inc. | | 209,212 | 3,127,719 |
| | | | 11,554,965 |
| Thrifts & Mortgage Finance - 0.3% | | | |
| MGIC Investment Corp. | | 258,414 | 2,137,084 |
| New York Community Bancorp, Inc. | | 344,284 | 3,625,311 |
| TFS Financial Corp. | | 37,280 | 539,814 |
| | | | 6,302,209 |
|
| TOTAL FINANCIALS | | | 244,338,110 |
|
| HEALTH CARE - 12.8% | | | |
| Biotechnology - 3.5% | | | |
| ACADIA Pharmaceuticals, Inc. (a) | | 83,731 | 3,480,698 |
| Acceleron Pharma, Inc. (a) | | 38,353 | 3,803,467 |
| Agios Pharmaceuticals, Inc. (a)(b) | | 47,019 | 2,130,901 |
| Alkermes PLC (a) | | 120,773 | 2,175,122 |
| bluebird bio, Inc. (a) | | 49,474 | 3,003,072 |
| Exelixis, Inc. (a) | | 232,584 | 5,370,365 |
| Global Blood Therapeutics, Inc. (a)(b) | | 44,809 | 3,023,711 |
| Immunomedics, Inc. (a)(b) | | 157,686 | 6,659,080 |
| Ionis Pharmaceuticals, Inc. (a)(b) | | 100,012 | 5,756,691 |
| Iovance Biotherapeutics, Inc. (a) | | 103,558 | 3,010,431 |
| Neurocrine Biosciences, Inc. (a) | | 70,427 | 8,476,594 |
| Repligen Corp. (a) | | 39,983 | 6,033,835 |
| Sage Therapeutics, Inc. (a) | | 39,187 | 1,785,752 |
| Sarepta Therapeutics, Inc. (a)(b) | | 56,987 | 8,748,644 |
| United Therapeutics Corp. (a) | | 33,219 | 3,702,922 |
| | | | 67,161,285 |
| Health Care Equipment & Supplies - 2.2% | | | |
| Envista Holdings Corp. (a) | | 122,134 | 2,671,071 |
| Globus Medical, Inc. (a) | | 56,734 | 2,733,444 |
| Haemonetics Corp. (a) | | 38,132 | 3,342,651 |
| Hill-Rom Holdings, Inc. | | 51,034 | 4,961,525 |
| ICU Medical, Inc. (a) | | 14,889 | 2,735,556 |
| Integra LifeSciences Holdings Corp. (a) | | 54,622 | 2,608,201 |
| Novocure Ltd. (a) | | 76,099 | 5,767,543 |
| Penumbra, Inc. (a) | | 24,510 | 5,439,014 |
| Quidel Corp. (a) | | 28,451 | 8,036,554 |
| Tandem Diabetes Care, Inc. (a) | | 44,773 | 4,676,988 |
| | | | 42,972,547 |
| Health Care Providers & Services - 1.8% | | | |
| Acadia Healthcare Co., Inc. (a) | | 67,248 | 2,004,663 |
| Amedisys, Inc. (a) | | 24,190 | 5,664,330 |
| Chemed Corp. | | 11,865 | 5,839,834 |
| Encompass Health Corp. | | 74,582 | 5,077,543 |
| Guardant Health, Inc. (a) | | 56,864 | 4,843,676 |
| Molina Healthcare, Inc. (a) | | 44,997 | 8,310,946 |
| Premier, Inc. (a) | | 47,168 | 1,649,465 |
| | | | 33,390,457 |
| Health Care Technology - 0.4% | | | |
| Change Healthcare, Inc. (a) | | 185,496 | 2,162,883 |
| Livongo Health, Inc. (b) | | 41,253 | 5,249,444 |
| | | | 7,412,327 |
| Life Sciences Tools & Services - 3.1% | | | |
| 10X Genomics, Inc. (a) | | 41,655 | 4,097,602 |
| Adaptive Biotechnologies Corp. (a) | | 54,453 | 2,032,186 |
| Avantor, Inc. (a) | | 315,344 | 6,962,796 |
| Bio-Techne Corp. | | 29,080 | 8,001,653 |
| Bruker Corp. | | 79,036 | 3,526,586 |
| Charles River Laboratories International, Inc. (a) | | 37,399 | 7,442,027 |
| PerkinElmer, Inc. | | 85,231 | 10,134,818 |
| PPD, Inc. | | 47,439 | 1,393,283 |
| PRA Health Sciences, Inc. (a) | | 48,341 | 5,151,217 |
| QIAGEN NV (a) | | 172,188 | 8,514,697 |
| Syneos Health, Inc. (a) | | 47,881 | 2,987,296 |
| | | | 60,244,161 |
| Pharmaceuticals - 1.8% | | | |
| Catalent, Inc. (a) | | 117,557 | 10,267,428 |
| Horizon Pharma PLC (a) | | 140,632 | 8,605,272 |
| Jazz Pharmaceuticals PLC (a) | | 41,394 | 4,480,901 |
| Nektar Therapeutics (a)(b) | | 132,640 | 2,939,302 |
| Perrigo Co. PLC | | 104,576 | 5,544,620 |
| Reata Pharmaceuticals, Inc. (a)(b) | | 18,146 | 2,680,164 |
| | | | 34,517,687 |
|
| TOTAL HEALTH CARE | | | 245,698,464 |
|
| INDUSTRIALS - 14.7% | | | |
| Aerospace & Defense - 1.8% | | | |
| Axon Enterprise, Inc. (a) | | 47,398 | 3,940,196 |
| BWX Technologies, Inc. | | 72,814 | 3,969,819 |
| Curtiss-Wright Corp. | | 31,746 | 2,829,204 |
| Hexcel Corp. | | 63,783 | 2,379,106 |
| Howmet Aerospace, Inc. | | 302,167 | 4,466,028 |
| Huntington Ingalls Industries, Inc. | | 30,291 | 5,261,850 |
| Mercury Systems, Inc. (a) | | 41,793 | 3,236,032 |
| Spirit AeroSystems Holdings, Inc. Class A | | 80,321 | 1,571,882 |
| Textron, Inc. | | 174,312 | 6,090,461 |
| Virgin Galactic Holdings, Inc. (a)(b) | | 46,285 | 1,039,098 |
| | | | 34,783,676 |
| Air Freight & Logistics - 0.3% | | | |
| XPO Logistics, Inc. (a) | | 69,522 | 5,215,540 |
| Airlines - 0.5% | | | |
| Alaska Air Group, Inc. | | 91,735 | 3,159,353 |
| American Airlines Group, Inc. (b) | | 378,132 | 4,204,828 |
| Copa Holdings SA Class A | | 24,102 | 998,787 |
| JetBlue Airways Corp. (a) | | 206,222 | 2,132,335 |
| | | | 10,495,303 |
| Building Products - 2.1% | | | |
| A.O. Smith Corp. | | 101,603 | 4,891,168 |
| Allegion PLC | | 70,549 | 7,016,804 |
| Armstrong World Industries, Inc. | | 36,479 | 2,598,764 |
| Fortune Brands Home & Security, Inc. | | 105,445 | 8,066,543 |
| Lennox International, Inc. | | 26,473 | 7,098,470 |
| Owens Corning | | 81,838 | 4,948,744 |
| Trex Co., Inc. (a) | | 44,274 | 6,168,696 |
| | | | 40,789,189 |
| Commercial Services & Supplies - 0.8% | | | |
| ADT, Inc. (b) | | 85,226 | 733,796 |
| Clean Harbors, Inc. (a) | | 39,386 | 2,347,406 |
| IAA Spinco, Inc. (a) | | 102,791 | 4,455,990 |
| MSA Safety, Inc. | | 27,854 | 3,301,535 |
| Stericycle, Inc. (a) | | 69,934 | 4,226,461 |
| | | | 15,065,188 |
| Construction & Engineering - 1.0% | | | |
| AECOM (a) | | 116,979 | 4,233,470 |
| Jacobs Engineering Group, Inc. | | 95,882 | 8,183,529 |
| Quanta Services, Inc. | | 104,670 | 4,183,660 |
| Valmont Industries, Inc. | | 16,033 | 1,943,200 |
| | | | 18,543,859 |
| Electrical Equipment - 1.4% | | | |
| Acuity Brands, Inc. | | 30,100 | 2,982,910 |
| Generac Holdings, Inc. (a) | | 46,783 | 7,372,065 |
| GrafTech International Ltd. | | 52,428 | 318,238 |
| Hubbell, Inc. Class B | | 41,359 | 5,582,224 |
| nVent Electric PLC | | 118,881 | 2,158,879 |
| Regal Beloit Corp. | | 30,988 | 2,849,966 |
| Sensata Technologies, Inc. PLC (a) | | 118,122 | 4,486,274 |
| Vertiv Holdings Co. (a) | | 152,567 | 2,212,222 |
| | | | 27,962,778 |
| Industrial Conglomerates - 0.3% | | | |
| Carlisle Companies, Inc. | | 41,355 | 4,924,553 |
| Machinery - 3.8% | | | |
| AGCO Corp. | | 47,280 | 3,102,986 |
| Allison Transmission Holdings, Inc. | | 86,232 | 3,221,628 |
| Colfax Corp. (a)(b) | | 75,815 | 2,204,700 |
| Crane Co. | | 37,232 | 2,106,214 |
| Donaldson Co., Inc. | | 97,186 | 4,697,971 |
| Flowserve Corp. | | 99,557 | 2,774,654 |
| Gates Industrial Corp. PLC (a) | | 34,350 | 362,049 |
| Graco, Inc. | | 126,438 | 6,731,559 |
| ITT, Inc. | | 66,161 | 3,819,475 |
| Lincoln Electric Holdings, Inc. | | 43,680 | 3,948,235 |
| Middleby Corp. (a) | | 42,164 | 3,502,142 |
| Nordson Corp. | | 43,980 | 8,515,847 |
| Oshkosh Corp. | | 51,839 | 4,080,766 |
| Pentair PLC | | 126,358 | 5,414,440 |
| Snap-On, Inc. | | 41,186 | 6,007,802 |
| Timken Co. | | 48,454 | 2,212,410 |
| Toro Co. | | 81,841 | 5,839,355 |
| Trinity Industries, Inc. (b) | | 69,604 | 1,359,366 |
| Woodward, Inc. | | 42,586 | 3,191,395 |
| | | | 73,092,994 |
| Marine - 0.1% | | | |
| Kirby Corp. (a) | | 45,595 | 2,108,313 |
| Professional Services - 1.0% | | | |
| CoreLogic, Inc. | | 60,615 | 4,131,518 |
| FTI Consulting, Inc. (a) | | 27,956 | 3,339,065 |
| Manpower, Inc. | | 44,320 | 3,048,773 |
| Nielsen Holdings PLC | | 272,763 | 3,935,970 |
| Robert Half International, Inc. | | 85,459 | 4,347,299 |
| | | | 18,802,625 |
| Road & Rail - 0.6% | | | |
| AMERCO | | 6,823 | 2,167,872 |
| Knight-Swift Transportation Holdings, Inc. Class A | | 95,678 | 4,161,036 |
| Landstar System, Inc. | | 29,189 | 3,554,636 |
| Ryder System, Inc. | | 40,167 | 1,471,317 |
| Schneider National, Inc. Class B | | 45,302 | 1,138,439 |
| | | | 12,493,300 |
| Trading Companies & Distributors - 0.9% | | | |
| Air Lease Corp. Class A | | 81,496 | 2,136,825 |
| HD Supply Holdings, Inc. (a) | | 123,203 | 4,324,425 |
| MSC Industrial Direct Co., Inc. Class A | | 34,195 | 2,257,212 |
| Univar, Inc. (a) | | 127,598 | 2,254,657 |
| Watsco, Inc. | | 24,942 | 5,888,058 |
| | | | 16,861,177 |
| Transportation Infrastructure - 0.1% | | | |
| Macquarie Infrastructure Co. LLC | | 56,250 | 1,685,250 |
|
| TOTAL INDUSTRIALS | | | 282,823,745 |
|
| INFORMATION TECHNOLOGY - 19.7% | | | |
| Communications Equipment - 0.9% | | | |
| Ciena Corp. (a) | | 117,000 | 6,962,670 |
| CommScope Holding Co., Inc. (a) | | 148,253 | 1,375,788 |
| EchoStar Holding Corp. Class A (a) | | 36,980 | 1,009,554 |
| Lumentum Holdings, Inc. (a) | | 57,263 | 5,315,724 |
| ViaSat, Inc. (a)(b) | | 44,143 | 1,675,668 |
| | | | 16,339,404 |
| Electronic Equipment & Components - 2.5% | | | |
| Arrow Electronics, Inc. (a) | | 59,684 | 4,274,568 |
| Avnet, Inc. | | 75,023 | 2,004,615 |
| Cognex Corp. | | 126,129 | 8,434,246 |
| Coherent, Inc. (a) | | 18,467 | 2,563,774 |
| Dolby Laboratories, Inc. Class A | | 48,241 | 3,357,574 |
| FLIR Systems, Inc. | | 99,844 | 4,159,501 |
| Jabil, Inc. | | 112,505 | 3,921,924 |
| Littelfuse, Inc. | | 18,022 | 3,201,608 |
| National Instruments Corp. | | 98,641 | 3,501,756 |
| SYNNEX Corp. | | 31,788 | 3,965,235 |
| Trimble, Inc. (a) | | 190,958 | 8,499,541 |
| | | | 47,884,342 |
| IT Services - 3.7% | | | |
| Alliance Data Systems Corp. | | 35,850 | 1,590,306 |
| Amdocs Ltd. | | 101,548 | 6,306,131 |
| Black Knight, Inc. (a) | | 110,599 | 8,286,077 |
| Booz Allen Hamilton Holding Corp. Class A | | 105,370 | 8,615,051 |
| CACI International, Inc. Class A (a) | | 19,006 | 3,949,827 |
| DXC Technology Co. | | 194,083 | 3,476,027 |
| Euronet Worldwide, Inc. (a) | | 38,472 | 3,698,698 |
| Fastly, Inc. Class A (a) | | 55,775 | 5,381,730 |
| Genpact Ltd. | | 143,620 | 5,718,948 |
| MongoDB, Inc. Class A (a)(b) | | 32,005 | 7,331,705 |
| Sabre Corp. | | 211,348 | 1,597,791 |
| Science Applications International Corp. | | 44,404 | 3,551,432 |
| StoneCo Ltd. Class A (a) | | 118,828 | 5,669,284 |
| Switch, Inc. Class A | | 67,800 | 1,219,722 |
| WEX, Inc. (a) | | 33,145 | 5,249,174 |
| | | | 71,641,903 |
| Semiconductors & Semiconductor Equipment - 3.8% | | | |
| Cirrus Logic, Inc. (a)(b) | | 44,710 | 3,063,976 |
| Cree, Inc. (a) | | 82,852 | 5,710,160 |
| Enphase Energy, Inc. (a) | | 80,890 | 4,882,520 |
| Entegris, Inc. | | 102,570 | 7,375,809 |
| First Solar, Inc. (a)(b) | | 63,641 | 3,789,822 |
| Inphi Corp. (a) | | 36,600 | 4,782,156 |
| MKS Instruments, Inc. | | 41,788 | 5,325,463 |
| Monolithic Power Systems, Inc. | | 33,325 | 8,831,458 |
| ON Semiconductor Corp. (a) | | 310,650 | 6,399,390 |
| SolarEdge Technologies, Inc. (a)(b) | | 37,407 | 6,549,966 |
| Teradyne, Inc. | | 126,665 | 11,268,117 |
| Universal Display Corp. | | 32,864 | 5,733,125 |
| | | | 73,711,962 |
| Software - 8.4% | | | |
| 2U, Inc. (a)(b) | | 46,912 | 2,209,321 |
| Alteryx, Inc. Class A (a)(b) | | 40,323 | 7,076,283 |
| Anaplan, Inc. (a) | | 99,777 | 4,530,874 |
| Aspen Technology, Inc. (a) | | 51,749 | 5,033,108 |
| Avalara, Inc. (a) | | 58,894 | 7,918,298 |
| Bill.Com Holdings, Inc. (a) | | 12,353 | 1,150,188 |
| CDK Global, Inc. | | 93,226 | 4,238,054 |
| Ceridian HCM Holding, Inc. (a) | | 81,256 | 6,361,532 |
| Cloudflare, Inc. (a) | | 83,478 | 3,474,354 |
| Dynatrace, Inc. | | 116,267 | 4,863,449 |
| Elastic NV (a) | | 41,842 | 4,024,782 |
| Everbridge, Inc. (a) | | 26,255 | 3,749,214 |
| Fair Isaac Corp. (a) | | 21,425 | 9,409,646 |
| FireEye, Inc. (a)(b) | | 167,743 | 2,532,919 |
| Five9, Inc. (a) | | 47,252 | 5,708,987 |
| Globant SA (a) | | 27,689 | 4,788,536 |
| Guidewire Software, Inc. (a) | | 63,590 | 7,481,999 |
| HubSpot, Inc. (a) | | 31,686 | 7,433,852 |
| LogMeIn, Inc. | | 37,131 | 3,186,211 |
| Manhattan Associates, Inc. (a) | | 48,418 | 4,637,960 |
| Medallia, Inc. (b) | | 62,691 | 1,926,494 |
| New Relic, Inc. (a) | | 38,547 | 2,733,368 |
| Nuance Communications, Inc. (a) | | 215,232 | 5,886,595 |
| Nutanix, Inc. Class A (a) | | 136,420 | 3,027,160 |
| Pagerduty, Inc. (a)(b) | | 52,506 | 1,600,383 |
| Parametric Technology Corp. (a) | | 79,876 | 6,834,191 |
| Paylocity Holding Corp. (a) | | 26,491 | 3,528,601 |
| Pegasystems, Inc. | | 30,176 | 3,527,273 |
| Pluralsight, Inc. (a)(b) | | 72,023 | 1,524,727 |
| Proofpoint, Inc. (a) | | 43,351 | 5,014,410 |
| RealPage, Inc. (a) | | 67,243 | 4,236,981 |
| Smartsheet, Inc. (a) | | 84,563 | 4,037,038 |
| SolarWinds, Inc. (a)(b) | | 35,475 | 651,321 |
| Teradata Corp. (a) | | 84,163 | 1,767,423 |
| Zendesk, Inc. (a) | | 86,535 | 7,887,665 |
| Zscaler, Inc. (a)(b) | | 53,838 | 6,990,864 |
| | | | 160,984,061 |
| Technology Hardware, Storage & Peripherals - 0.4% | | | |
| NCR Corp. (a) | | 97,330 | 1,793,792 |
| Pure Storage, Inc. Class A (a) | | 184,881 | 3,301,975 |
| Xerox Holdings Corp. | | 138,393 | 2,304,243 |
| | | | 7,400,010 |
|
| TOTAL INFORMATION TECHNOLOGY | | | 377,961,682 |
|
| MATERIALS - 6.1% | | | |
| Chemicals - 2.8% | | | |
| Albemarle Corp. U.S. (b) | | 80,805 | 6,663,180 |
| Ashland Global Holdings, Inc. | | 42,339 | 3,195,748 |
| Axalta Coating Systems Ltd. (a) | | 161,236 | 3,579,439 |
| Cabot Corp. | | 42,666 | 1,556,456 |
| CF Industries Holdings, Inc. | | 163,459 | 5,121,170 |
| Element Solutions, Inc. (a) | | 166,164 | 1,804,541 |
| Huntsman Corp. | | 153,276 | 2,835,606 |
| NewMarket Corp. | | 5,268 | 1,974,499 |
| Olin Corp. | | 109,408 | 1,229,746 |
| RPM International, Inc. | | 97,885 | 7,986,437 |
| The Chemours Co. LLC | | 124,979 | 2,315,861 |
| The Mosaic Co. | | 264,386 | 3,561,279 |
| The Scotts Miracle-Gro Co. Class A | | 31,020 | 4,918,841 |
| Valvoline, Inc. | | 141,836 | 2,910,475 |
| W.R. Grace & Co. | | 43,016 | 1,984,328 |
| Westlake Chemical Corp. | | 25,989 | 1,416,401 |
| | | | 53,054,007 |
| Construction Materials - 0.1% | | | |
| Eagle Materials, Inc. | | 31,573 | 2,533,102 |
| Containers & Packaging - 2.4% | | | |
| Aptargroup, Inc. | | 49,183 | 5,665,882 |
| Ardagh Group SA | | 13,825 | 188,158 |
| Avery Dennison Corp. | | 63,730 | 7,223,158 |
| Berry Global Group, Inc. (a) | | 101,673 | 5,082,633 |
| Crown Holdings, Inc. (a) | | 99,273 | 7,105,961 |
| Graphic Packaging Holding Co. | | 212,787 | 2,966,251 |
| Packaging Corp. of America | | 71,723 | 6,894,015 |
| Sealed Air Corp. | | 118,981 | 4,245,242 |
| Silgan Holdings, Inc. | | 60,217 | 2,303,300 |
| Sonoco Products Co. | | 76,681 | 3,967,475 |
| | | | 45,642,075 |
| Metals & Mining - 0.8% | | | |
| Reliance Steel & Aluminum Co. | | 48,545 | 4,770,032 |
| Royal Gold, Inc. | | 50,187 | 7,022,667 |
| Steel Dynamics, Inc. | | 155,140 | 4,252,387 |
| | | | 16,045,086 |
|
| TOTAL MATERIALS | | | 117,274,270 |
|
| REAL ESTATE - 9.8% | | | |
| Equity Real Estate Investment Trusts (REITs) - 9.5% | | | |
| American Campus Communities, Inc. | | 104,766 | 3,733,860 |
| American Homes 4 Rent Class A | | 198,733 | 5,763,257 |
| Americold Realty Trust | | 153,305 | 6,185,857 |
| Apartment Investment & Management Co. Class A | | 113,323 | 4,399,199 |
| Apple Hospitality (REIT), Inc. | | 160,725 | 1,417,595 |
| Brandywine Realty Trust (SBI) | | 129,212 | 1,399,366 |
| Brixmor Property Group, Inc. | | 226,683 | 2,609,121 |
| Camden Property Trust (SBI) | | 72,218 | 6,558,117 |
| CoreSite Realty Corp. | | 30,765 | 3,970,223 |
| Corporate Office Properties Trust (SBI) | | 85,875 | 2,273,970 |
| Cousins Properties, Inc. | | 113,281 | 3,479,992 |
| CubeSmart | | 147,879 | 4,387,570 |
| CyrusOne, Inc. | | 88,025 | 7,343,046 |
| Douglas Emmett, Inc. | | 127,330 | 3,710,396 |
| Empire State Realty Trust, Inc. | | 111,366 | 735,016 |
| EPR Properties | | 59,672 | 1,708,409 |
| Equity Commonwealth | | 89,372 | 2,821,474 |
| Equity Lifestyle Properties, Inc. | | 133,141 | 9,096,193 |
| Federal Realty Investment Trust (SBI) | | 57,600 | 4,394,880 |
| First Industrial Realty Trust, Inc. | | 96,627 | 4,243,858 |
| Gaming & Leisure Properties | | 155,634 | 5,635,507 |
| Healthcare Trust of America, Inc. | | 166,384 | 4,593,862 |
| Highwoods Properties, Inc. (SBI) | | 78,707 | 3,017,626 |
| Hudson Pacific Properties, Inc. | | 114,935 | 2,709,018 |
| Iron Mountain, Inc. | | 218,943 | 6,172,003 |
| JBG SMITH Properties | | 93,212 | 2,704,080 |
| Kilroy Realty Corp. | | 87,944 | 5,124,497 |
| Kimco Realty Corp. | | 316,122 | 3,524,760 |
| Lamar Advertising Co. Class A | | 65,785 | 4,324,048 |
| Life Storage, Inc. | | 35,698 | 3,503,045 |
| Medical Properties Trust, Inc. | | 398,124 | 8,014,236 |
| National Retail Properties, Inc. | | 131,081 | 4,646,821 |
| Omega Healthcare Investors, Inc. | | 172,225 | 5,576,646 |
| Outfront Media, Inc. | | 110,126 | 1,586,916 |
| Paramount Group, Inc. | | 145,442 | 1,037,001 |
| Park Hotels & Resorts, Inc. | | 183,465 | 1,517,256 |
| Rayonier, Inc. | | 104,435 | 2,901,204 |
| Regency Centers Corp. | | 128,981 | 5,292,090 |
| Rexford Industrial Realty, Inc. | | 88,854 | 4,169,918 |
| SL Green Realty Corp. | | 59,165 | 2,751,173 |
| Spirit Realty Capital, Inc. | | 78,704 | 2,712,140 |
| Store Capital Corp. | | 172,040 | 4,075,628 |
| Taubman Centers, Inc. | | 45,947 | 1,779,068 |
| VEREIT, Inc. | | 826,493 | 5,380,469 |
| VICI Properties, Inc. | | 359,444 | 7,803,529 |
| Weingarten Realty Investors (SBI) | | 92,925 | 1,585,301 |
| | | | 182,369,241 |
| Real Estate Management & Development - 0.3% | | | |
| Howard Hughes Corp. (a) | | 29,880 | 1,589,317 |
| Jones Lang LaSalle, Inc. | | 39,422 | 3,899,230 |
| | | | 5,488,547 |
|
| TOTAL REAL ESTATE | | | 187,857,788 |
|
| UTILITIES - 3.0% | | | |
| Electric Utilities - 1.6% | | | |
| Hawaiian Electric Industries, Inc. | | 81,897 | 2,969,585 |
| IDACORP, Inc. | | 38,562 | 3,595,907 |
| NRG Energy, Inc. | | 186,231 | 6,296,470 |
| OGE Energy Corp. | | 152,973 | 5,032,812 |
| PG&E Corp. (a) | | 730,241 | 6,827,753 |
| Pinnacle West Capital Corp. | | 86,164 | 7,158,505 |
| | | | 31,881,032 |
| Gas Utilities - 0.4% | | | |
| National Fuel Gas Co. | | 63,299 | 2,568,040 |
| UGI Corp. | | 159,206 | 5,307,928 |
| | | | 7,875,968 |
| Independent Power and Renewable Electricity Producers - 0.4% | | | |
| Vistra Corp. | | 373,528 | 6,970,032 |
| Multi-Utilities - 0.2% | | | |
| MDU Resources Group, Inc. | | 152,599 | 3,201,527 |
| Water Utilities - 0.4% | | | |
| Essential Utilities, Inc. | | 171,262 | 7,766,732 |
|
| TOTAL UTILITIES | | | 57,695,291 |
|
| TOTAL COMMON STOCKS | | | |
| (Cost $1,717,358,427) | | | 1,914,456,655 |
|
| Money Market Funds - 5.3% | | | |
| Fidelity Cash Central Fund 0.14% (c) | | 16,826,268 | 16,831,316 |
| Fidelity Securities Lending Cash Central Fund 0.13% (c)(d) | | 85,058,356 | 85,066,861 |
| TOTAL MONEY MARKET FUNDS | | | |
| (Cost $101,898,177) | | | 101,898,177 |
| TOTAL INVESTMENT IN SECURITIES - 104.9% | | | |
| (Cost $1,819,256,604) | | | 2,016,354,832 |
| NET OTHER ASSETS (LIABILITIES) - (4.9)% | | | (94,545,180) |
| NET ASSETS - 100% | | | $1,921,809,652 |
| Futures Contracts | | | | | |
| | Number of contracts | Expiration Date | Notional Amount | Value | Unrealized Appreciation/(Depreciation) |
| Purchased | | | | | |
| Equity Index Contracts | | | | | |
| CME E-mini S&P MidCap 400 Index Contracts (United States) | 57 | Sept. 2020 | $10,604,850 | $311,414 | $311,414 |
The notional amount of futures purchased as a percentage of Net Assets is 0.6%
Legend
(a) Non-income producing
(b) Security or a portion of the security is on loan at period end.
(c) Affiliated fund that is generally available only to investment companies and other accounts managed by Fidelity Investments. The rate quoted is the annualized seven-day yield of the fund at period end. A complete unaudited listing of the fund's holdings as of its most recent quarter end is available upon request. In addition, each Fidelity Central Fund's financial statements, which are not covered by the Fund's Report of Independent Registered Public Accounting Firm, are available on the SEC's website or upon request.
(d) Investment made with cash collateral received from securities on loan.
Affiliated Central Funds
Information regarding fiscal year to date income earned by the Fund from investments in Fidelity Central Funds is as follows:
| Fund | Income earned |
| Fidelity Cash Central Fund | $39,922 |
| Fidelity Securities Lending Cash Central Fund | 492,190 |
| Total | $532,112 |
Amounts in the income column in the above table include any capital gain distributions from underlying funds, which are presented in the corresponding line-item in the Statement of Operations, if applicable. Amount for Fidelity Securities Lending Cash Central Fund represents the income earned on investing cash collateral, less rebates paid to borrowers and any lending agent fees associated with the loan, plus any premium payments received for lending certain types of securities.
Investment Valuation
The following is a summary of the inputs used, as of July 31, 2020, involving the Fund's assets and liabilities carried at fair value. The inputs or methodology used for valuing securities may not be an indication of the risk associated with investing in those securities. For more information on valuation inputs, and their aggregation into the levels used below, please refer to the Investment Valuation section in the accompanying Notes to Financial Statements.
| | Valuation Inputs at Reporting Date: |
| Description | Total | Level 1 | Level 2 | Level 3 |
| Investments in Securities: | | | | |
| Equities: | | | | |
| Communication Services | $65,138,913 | $65,138,913 | $-- | $-- |
| Consumer Discretionary | 225,836,696 | 225,836,696 | -- | -- |
| Consumer Staples | 63,553,577 | 63,553,577 | -- | -- |
| Energy | 46,278,119 | 46,278,119 | -- | -- |
| Financials | 244,338,110 | 244,338,110 | -- | -- |
| Health Care | 245,698,464 | 245,698,464 | -- | -- |
| Industrials | 282,823,745 | 282,823,745 | -- | -- |
| Information Technology | 377,961,682 | 377,961,682 | -- | -- |
| Materials | 117,274,270 | 117,274,270 | -- | -- |
| Real Estate | 187,857,788 | 187,857,788 | -- | -- |
| Utilities | 57,695,291 | 57,695,291 | -- | -- |
| Money Market Funds | 101,898,177 | 101,898,177 | -- | -- |
| Total Investments in Securities: | $2,016,354,832 | $2,016,354,832 | $-- | $-- |
| Derivative Instruments: | | | | |
| Assets | | | | |
| Futures Contracts | $311,414 | $311,414 | $-- | $-- |
| Total Assets | $311,414 | $311,414 | $-- | $-- |
| Total Derivative Instruments: | $311,414 | $311,414 | $-- | $-- |
Value of Derivative Instruments
The following table is a summary of the Fund's value of derivative instruments by primary risk exposure as of July 31, 2020. For additional information on derivative instruments, please refer to the Derivative Instruments section in the accompanying Notes to Financial Statements.
| Primary Risk Exposure / Derivative Type | Value |
| | Asset | Liability |
| Equity Risk | | |
| Futures Contracts(a) | $311,414 | $0 |
| Total Equity Risk | 311,414 | 0 |
| Total Value of Derivatives | $311,414 | $0 |
(a) Reflects gross cumulative appreciation (depreciation) on futures contracts as presented in the Schedule of Investments. In the Statement of Assets and Liabilities, the period end daily variation margin is included in receivable or payable for daily variation margin on futures contracts, and the net cumulative appreciation (depreciation) is included in Total accumulated earnings (loss).
See accompanying notes which are an integral part of the financial statements.
Financial Statements
Statement of Assets and Liabilities
| | | July 31, 2020 |
| Assets | | |
Investment in securities, at value (including securities loaned of $82,662,520) — See accompanying schedule:
Unaffiliated issuers (cost $1,717,358,427) | $1,914,456,655 | |
| Fidelity Central Funds (cost $101,898,177) | 101,898,177 | |
| Total Investment in Securities (cost $1,819,256,604) | | $2,016,354,832 |
| Segregated cash with brokers for derivative instruments | | 660,000 |
| Receivable for investments sold | | 19,455 |
| Receivable for fund shares sold | | 537,347 |
| Dividends receivable | | 895,153 |
| Distributions receivable from Fidelity Central Funds | | 52,041 |
| Prepaid expenses | | 206 |
| Receivable from investment adviser for expense reductions | | 123,545 |
| Total assets | | 2,018,642,579 |
| Liabilities | | |
| Payable to custodian bank | $4,733 | |
| Payable for investments purchased | 9,974,601 | |
| Payable for fund shares redeemed | 1,526,300 | |
| Accrued management fee | 167,479 | |
| Payable for daily variation margin on futures contracts | 55,841 | |
| Other payables and accrued expenses | 46,441 | |
| Collateral on securities loaned | 85,057,532 | |
| Total liabilities | | 96,832,927 |
| Net Assets | | $1,921,809,652 |
| Net Assets consist of: | | |
| Paid in capital | | $1,629,001,648 |
| Total accumulated earnings (loss) | | 292,808,004 |
| Net Assets | | $1,921,809,652 |
| Net Asset Value, offering price and redemption price per share ($1,921,809,652 ÷ 157,696,589 shares) | | $12.19 |
See accompanying notes which are an integral part of the financial statements.
Statement of Operations
| | | Year ended July 31, 2020 |
| Investment Income | | |
| Dividends | | $27,291,586 |
| Interest | | 5,405 |
| Income from Fidelity Central Funds (including $492,190 from security lending) | | 532,112 |
| Total income | | 27,829,103 |
| Expenses | | |
| Management fee | $1,785,670 | |
| Custodian fees and expenses | 114,805 | |
| Independent trustees' fees and expenses | 5,814 | |
| Registration fees | 35,008 | |
| Audit | 54,728 | |
| Legal | 10,086 | |
| Interest | 15,753 | |
| Miscellaneous | 11,099 | |
| Total expenses before reductions | 2,032,963 | |
| Expense reductions | (1,196,258) | |
| Total expenses after reductions | | 836,705 |
| Net investment income (loss) | | 26,992,398 |
| Realized and Unrealized Gain (Loss) | | |
| Net realized gain (loss) on: | | |
| Investment securities: | | |
| Unaffiliated issuers | 123,800,895 | |
| Fidelity Central Funds | 1,383 | |
| Futures contracts | 1,668,705 | |
| Total net realized gain (loss) | | 125,470,983 |
| Change in net unrealized appreciation (depreciation) on: | | |
| Investment securities: | | |
| Unaffiliated issuers | (83,515,183) | |
| Futures contracts | 196,603 | |
| Total change in net unrealized appreciation (depreciation) | | (83,318,580) |
| Net gain (loss) | | 42,152,403 |
| Net increase (decrease) in net assets resulting from operations | | $69,144,801 |
See accompanying notes which are an integral part of the financial statements.
Statement of Changes in Net Assets
| | Year ended July 31, 2020 | Year ended July 31, 2019 |
| Increase (Decrease) in Net Assets | | |
| Operations | | |
| Net investment income (loss) | $26,992,398 | $30,662,558 |
| Net realized gain (loss) | 125,470,983 | 45,831,529 |
| Change in net unrealized appreciation (depreciation) | (83,318,580) | 20,864,344 |
| Net increase (decrease) in net assets resulting from operations | 69,144,801 | 97,358,431 |
| Distributions to shareholders | (82,587,160) | (136,561,154) |
| Share transactions | | |
| Proceeds from sales of shares | 1,441,606,281 | 816,434,043 |
| Reinvestment of distributions | 31,118,897 | 17,561,702 |
| Cost of shares redeemed | (1,399,758,420) | (1,213,960,114) |
| Net increase (decrease) in net assets resulting from share transactions | 72,966,758 | (379,964,369) |
| Total increase (decrease) in net assets | 59,524,399 | (419,167,092) |
| Net Assets | | |
| Beginning of period | 1,862,285,253 | 2,281,452,345 |
| End of period | $1,921,809,652 | $1,862,285,253 |
| Other Information | | |
| Shares | | |
| Sold | 130,546,747 | 69,853,539 |
| Issued in reinvestment of distributions | 2,475,641 | 1,408,093 |
| Redeemed | (120,871,335) | (101,839,298) |
| Net increase (decrease) | 12,151,053 | (30,577,666) |
See accompanying notes which are an integral part of the financial statements.
Financial Highlights
Fidelity SAI Small-Mid Cap 500 Index Fund
| | | | | | |
| Years ended July 31, | 2020 | 2019 | 2018 | 2017 | 2016 A |
| Selected Per–Share Data | | | | | |
| Net asset value, beginning of period | $12.80 | $12.95 | $11.37 | $10.26 | $10.00 |
| Income from Investment Operations | | | | | |
| Net investment income (loss)B | .20 | .19 | .17 | .15 | .14 |
| Net realized and unrealized gain (loss) | (.20)C,D | .46 | 1.62 | 1.11 | .18 |
| Total from investment operations | – | .65 | 1.79 | 1.26 | .32 |
| Distributions from net investment income | (.22) | (.18) | (.13) | (.09) | (.05) |
| Distributions from net realized gain | (.39) | (.63) | (.08) | (.06) | (.01) |
| Total distributions | (.61) | (.80)E | (.21) | (.15) | (.06) |
| Net asset value, end of period | $12.19 | $12.80 | $12.95 | $11.37 | $10.26 |
| Total ReturnF,G | (.03)%D | 5.26% | 15.91% | 12.41% | 3.26% |
| Ratios to Average Net AssetsH,I | | | | | |
| Expenses before reductions | .13% | .22% | .23% | .29% | .35%J |
| Expenses net of fee waivers, if any | .05% | .08% | .13% | .15% | .15%J |
| Expenses net of all reductions | .05% | .08% | .13% | .15% | .15%J |
| Net investment income (loss) | 1.66% | 1.53% | 1.37% | 1.38% | 1.48%J |
| Supplemental Data | | | | | |
| Net assets, end of period (000 omitted) | $1,921,810 | $1,862,285 | $2,281,452 | $1,460,960 | $355,719 |
| Portfolio turnover rateK | 79% | 41% | 39% | 22% | 99%J |
A For the period August 12, 2015 (commencement of operations) to July 31, 2016.
B Calculated based on average shares outstanding during the period.
C The amount shown for a share outstanding does not correspond with the aggregate net gain (loss) on investments for the period due to the timing of sales and repurchases of shares in relation to fluctuating market values of the investments of the Fund.
D Amount includes a reimbursement from the investment adviser for an operational error which amounted to less than $.02 per share. Excluding this reimbursement, the total return would have been (.16%).
E Total distributions of $.80 per share is comprised of distributions from net investment income of $.176 and distributions from net realized gain of $.626 per share.
F Total returns for periods of less than one year are not annualized.
G Total returns would have been lower if certain expenses had not been reduced during the applicable periods shown.
H Fees and expenses of any underlying mutual funds or exchange-traded funds (ETFs) are not included in the Fund's expense ratio. The Fund indirectly bears its proportionate share of these expenses. For additional expense information related to investments in Fidelity Central Funds, please refer to the "Investments in Fidelity Central Funds" note found in the Notes to Financial Statements section of the most recent Annual or Semi-Annual report.
I Expense ratios reflect operating expenses of the Fund. Expenses before reductions do not reflect amounts reimbursed by the investment adviser or reductions from expense offset arrangements and do not represent the amount paid by the Fund during periods when reimbursements or reductions occur. Expense ratios before reductions for start-up periods may not be representative of longer term operating periods. Expenses net of fee waivers reflect expenses after reimbursement by the investment adviser but prior to reductions from expense offset arrangements. Expenses net of all reductions represent the net expenses paid by the Fund.
J Annualized
K Amount does not include the portfolio activity of any underlying Fidelity Central Funds.
See accompanying notes which are an integral part of the financial statements.
Notes to Financial Statements
For the period ended July 31, 2020
1. Organization.
Fidelity SAI Small-Mid Cap 500 Index Fund (the Fund) is a fund of Fidelity Salem Street Trust (the Trust) and is authorized to issue an unlimited number of shares. Shares are offered exclusively to certain clients of Fidelity Management & Research Company LLC (FMR) or its affiliates. The Trust is registered under the Investment Company Act of 1940, as amended (the 1940 Act), as an open-end management investment company organized as a Massachusetts business trust.
Effective January 1, 2020:
Investment advisers Fidelity Investments Money Management, Inc., FMR Co., Inc., and Fidelity SelectCo, LLC, merged with and into Fidelity Management & Research Company. In connection with the merger transactions, the resulting, merged investment adviser was then redomiciled from Massachusetts to Delaware, changed its corporate structure from a corporation to a limited liability company, and changed its name to "Fidelity Management & Research Company LLC".
2. Investments in Fidelity Central Funds.
The Fund invests in Fidelity Central Funds, which are open-end investment companies generally available only to other investment companies and accounts managed by the investment adviser and its affiliates. The Fund's Schedule of Investments lists each of the Fidelity Central Funds held as of period end, if any, as an investment of the Fund, but does not include the underlying holdings of each Fidelity Central Fund. As an Investing Fund, the Fund indirectly bears its proportionate share of the expenses of the underlying Fidelity Central Funds.
The Money Market Central Funds seek preservation of capital and current income and are managed by the investment adviser. Annualized expenses of the Money Market Central Funds as of their most recent shareholder report date ranged from less than .005% to .01%.
A complete unaudited list of holdings for each Fidelity Central Fund is available upon request or at the Securities and Exchange Commission (the SEC) website at www.sec.gov. In addition, the financial statements of the Fidelity Central Funds, which are not covered by the Fund's Report of Independent Registered Public Accounting Firm, are available on the SEC website or upon request.
3. Significant Accounting Policies.
The Fund is an investment company and applies the accounting and reporting guidance of the Financial Accounting Standards Board (FASB) Accounting Standards Codification Topic 946 Financial Services – Investment Companies. The financial statements have been prepared in conformity with accounting principles generally accepted in the United States of America (GAAP), which require management to make certain estimates and assumptions at the date of the financial statements. Actual results could differ from those estimates. Subsequent events, if any, through the date that the financial statements were issued have been evaluated in the preparation of the financial statements. The following summarizes the significant accounting policies of the Fund:
Investment Valuation. Investments are valued as of 4:00 p.m. Eastern time on the last calendar day of the period. The Board of Trustees (the Board) has delegated the day to day responsibility for the valuation of the Fund's investments to the Fair Value Committee (the Committee) established by the Fund's investment adviser. In accordance with valuation policies and procedures approved by the Board, the Fund attempts to obtain prices from one or more third party pricing vendors or brokers to value its investments. When current market prices, quotations or currency exchange rates are not readily available or reliable, investments will be fair valued in good faith by the Committee, in accordance with procedures adopted by the Board. Factors used in determining fair value vary by investment type and may include market or investment specific events. The frequency with which these procedures are used cannot be predicted and they may be utilized to a significant extent. The Committee oversees the Fund's valuation policies and procedures and reports to the Board on the Committee's activities and fair value determinations. The Board monitors the appropriateness of the procedures used in valuing the Fund's investments and ratifies the fair value determinations of the Committee.
The Fund categorizes the inputs to valuation techniques used to value its investments into a disclosure hierarchy consisting of three levels as shown below:
- Level 1 – quoted prices in active markets for identical investments
- Level 2 – other significant observable inputs (including quoted prices for similar investments, interest rates, prepayment speeds, etc.)
- Level 3 – unobservable inputs (including the Fund's own assumptions based on the best information available)
Valuation techniques used to value the Fund's investments by major category are as follows:
Equity securities, including restricted securities, for which market quotations are readily available, are valued at the last reported sale price or official closing price as reported by a third party pricing vendor on the primary market or exchange on which they are traded and are categorized as Level 1 in the hierarchy. In the event there were no sales during the day or closing prices are not available, securities are valued at the last quoted bid price or may be valued using the last available price and are generally categorized as Level 2 in the hierarchy. For foreign equity securities, when market or security specific events arise, comparisons to the valuation of American Depositary Receipts (ADRs), futures contracts, Exchange-Traded Funds (ETFs) and certain indexes as well as quoted prices for similar securities may be used and would be categorized as Level 2 in the hierarchy. For equity securities, including restricted securities, where observable inputs are limited, assumptions about market activity and risk are used and these securities may be categorized as Level 3 in the hierarchy.
Futures contracts are valued at the settlement price established each day by the board of trade or exchange on which they are traded and are categorized as Level 1 in the hierarchy. Investments in open-end mutual funds, including the Fidelity Central Funds, are valued at their closing net asset value (NAV) each business day and are categorized as Level 1 in the hierarchy.
Changes in valuation techniques may result in transfers in or out of an assigned level within the disclosure hierarchy. The aggregate value of investments by input level as of July 31, 2020 is included at the end of the Fund's Schedule of Investments.
Investment Transactions and Income. For financial reporting purposes, the Fund's investment holdings and NAV include trades executed through the end of the last business day of the period. The NAV per share for processing shareholder transactions is calculated as of the close of business of the New York Stock Exchange (NYSE), normally 4:00 p.m. Eastern time and includes trades executed through the end of the prior business day. Gains and losses on securities sold are determined on the basis of identified cost and include proceeds received from litigation. Dividend income is recorded on the ex-dividend date, except for certain dividends from foreign securities where the ex-dividend date may have passed, which are recorded as soon as the Fund is informed of the ex-dividend date. Non-cash dividends included in dividend income, if any, are recorded at the fair market value of the securities received. Income and capital gain distributions from Fidelity Central Funds, if any, are recorded on the ex-dividend date. Certain distributions received by the Fund represent a return of capital or capital gain. The Fund determines the components of these distributions subsequent to the ex-dividend date, based upon receipt of tax filings or other correspondence relating to the underlying investment. These distributions are recorded as a reduction of cost of investments and/or as a realized gain. Interest income is accrued as earned and includes coupon interest and amortization of premium and accretion of discount on debt securities as applicable.
Expenses. Expenses directly attributable to a fund are charged to that fund. Expenses attributable to more than one fund are allocated among the respective funds on the basis of relative net assets or other appropriate methods. Expense estimates are accrued in the period to which they relate and adjustments are made when actual amounts are known.
Income Tax Information and Distributions to Shareholders. Each year, the Fund intends to qualify as a regulated investment company under Subchapter M of the Internal Revenue Code, including distributing substantially all of its taxable income and realized gains. As a result, no provision for U.S. Federal income taxes is required. As of July 31, 2020, the Fund did not have any unrecognized tax benefits in the financial statements; nor is the Fund aware of any tax positions for which it is reasonably possible that the total amounts of unrecognized tax benefits will significantly change in the next twelve months. The Fund files a U.S. federal tax return, in addition to state and local tax returns as required. The Fund's federal income tax returns are subject to examination by the Internal Revenue Service (IRS) for a period of three fiscal years after they are filed. State and local tax returns may be subject to examination for an additional fiscal year depending on the jurisdiction.
Distributions are declared and recorded on the ex-dividend date. Income and capital gain distributions are determined in accordance with income tax regulations, which may differ from GAAP. In addition, the Fund claimed a portion of the payment made to redeeming shareholders as a distribution for income tax purposes.
Capital accounts within the financial statements are adjusted for permanent book-tax differences. These adjustments have no impact on net assets or the results of operations. Capital accounts are not adjusted for temporary book-tax differences which will reverse in a subsequent period.
Book-tax differences are primarily due to futures contracts, partnerships and losses deferred due to wash sales.
As of period end, the cost and unrealized appreciation (depreciation) in securities, and derivatives if applicable, for federal income tax purposes were as follows:
| Gross unrealized appreciation | $331,383,289 |
| Gross unrealized depreciation | (180,051,258) |
| Net unrealized appreciation (depreciation) | $151,332,031 |
| Tax Cost | $1,865,022,801 |
The tax-based components of distributable earnings as of period end were as follows:
| Undistributed ordinary income | $31,088,327 |
| Undistributed long-term capital gain | $110,387,647 |
| Net unrealized appreciation (depreciation) on securities and other investments | $151,332,031 |
The tax character of distributions paid was as follows:
| | July 31, 2020 | July 31, 2019 |
| Ordinary Income | $30,336,554 | $ 62,420,911 |
| Long-term Capital Gains | 52,250,606 | 74,140,243 |
| Total | $82,587,160 | $ 136,561,154 |
4. Derivative Instruments.
Risk Exposures and the Use of Derivative Instruments. The Fund's investment objective allows the Fund to enter into various types of derivative contracts, including futures contracts. Derivatives are investments whose value is primarily derived from underlying assets, indices or reference rates and may be transacted on an exchange or over-the-counter (OTC). Derivatives may involve a future commitment to buy or sell a specified asset based on specified terms, to exchange future cash flows at periodic intervals based on a notional principal amount, or for one party to make one or more payments upon the occurrence of specified events in exchange for periodic payments from the other party.
The Fund used derivatives to increase returns and to manage exposure to certain risks as defined below. The success of any strategy involving derivatives depends on analysis of numerous economic factors, and if the strategies for investment do not work as intended, the Fund may not achieve its objectives.
The Fund's use of derivatives increased or decreased its exposure to the following risk:
| Equity Risk | Equity risk relates to the fluctuations in the value of financial instruments as a result of changes in market prices (other than those arising from interest rate risk or foreign exchange risk), whether caused by factors specific to an individual investment, its issuer, or all factors affecting all instruments traded in a market or market segment.
|
The Fund is also exposed to additional risks from investing in derivatives, such as liquidity risk and counterparty credit risk. Liquidity risk is the risk that the Fund will be unable to close out the derivative in the open market in a timely manner. Counterparty credit risk is the risk that the counterparty will not be able to fulfill its obligation to the Fund. Counterparty credit risk related to exchange-traded futures contracts may be mitigated by the protection provided by the exchange on which they trade.
Investing in derivatives may involve greater risks than investing in the underlying assets directly and, to varying degrees, may involve risk of loss in excess of any initial investment and collateral received and amounts recognized in the Statement of Assets and Liabilities. In addition, there may be the risk that the change in value of the derivative contract does not correspond to the change in value of the underlying instrument.
Futures Contracts. A futures contract is an agreement between two parties to buy or sell a specified underlying instrument for a fixed price at a specified future date. The Fund used futures contracts to manage its exposure to the stock market.
Upon entering into a futures contract, a fund is required to deposit either cash or securities (initial margin) with a clearing broker in an amount equal to a certain percentage of the face value of the contract. Futures contracts are marked-to-market daily and subsequent daily payments (variation margin) are made or received by a fund depending on the daily fluctuations in the value of the futures contracts and are recorded as unrealized appreciation or (depreciation). This receivable and/or payable, if any, is included in daily variation margin on futures contracts in the Statement of Assets and Liabilities. Realized gain or (loss) is recorded upon the expiration or closing of a futures contract. The net realized gain (loss) and change in net unrealized appreciation (depreciation) on futures contracts during the period is presented in the Statement of Operations.
Any open futures contracts at period end are presented in the Schedule of Investments under the caption "Futures Contracts". The notional amount at value reflects each contract's exposure to the underlying instrument or index at period end and is representative of volume of activity during the period. Cash deposited to meet initial margin requirements is presented as segregated cash with brokers for derivative instruments in the Statement of Assets and Liabilities.
5. Purchases and Sales of Investments.
Purchases and sales of securities, other than short-term securities, are noted in the table below.
| | Purchases ($) | Sales ($) |
| Fidelity SAI Small-Mid Cap 500 Index Fund | 1,362,150,059 | 1,306,122,013 |
6. Fees and Other Transactions with Affiliates.
Management Fee. Fidelity Management & Research Company LLC (the investment adviser) and its affiliates provide the Fund with investment management related services for which the Fund pays a monthly management fee that is based on an annual rate of .11% of the Fund's average net assets.
Sub-Adviser. Geode Capital Management, LLC (Geode), serves as sub-adviser for the Fund. Geode provides discretionary investment advisory services to the Fund and is paid by the investment adviser for providing these services.
Interfund Lending Program. Pursuant to an Exemptive Order issued by the SEC, the fund, along with other registered investment companies having management contracts with Fidelity Management & Research Company LLC (FMR), or other affiliated entities of FMR, may participate in an interfund lending program. This program provides an alternative credit facility allowing the fund to borrow from, or lend money to, other participating affiliated funds. At period end, there were no interfund loans outstanding. Activity in this program during the period for which loans were outstanding was as follows:
| | Borrower or Lender | Average Loan Balance | Weighted Average Interest Rate | Interest Expense |
| Fidelity SAI Small-Mid Cap 500 Index Fund | Borrower | $8,556,815 | 1.02% | $15,753 |
Interfund Trades. Funds may purchase from or sell securities to other Fidelity Funds under procedures adopted by the Board. The procedures have been designed to ensure these interfund trades are executed in accordance with Rule 17a-7 of the 1940 Act. Interfund trades are included within the respective purchases and sales amounts shown in the Purchases and Sales of Investments note.
Other. During the period, the investment adviser reimbursed the Fund $2,173,838 for an operational error which is included in Net Realized Gain (Loss) in the accompanying Statement of Operations.
7. Committed Line of Credit.
Certain Funds participate with other funds managed by the investment adviser or an affiliate in a $4.25 billion credit facility (the "line of credit") to be utilized for temporary or emergency purposes to fund shareholder redemptions or for other short-term liquidity purposes. The participating funds have agreed to pay commitment fees on their pro-rata portion of the line of credit, which are reflected in Miscellaneous expenses on the Statement of Operations, and are as follows:
| | Amount |
| Fidelity SAI Small-Mid Cap 500 Index Fund | $3,973 |
During the period, there were no borrowings on this line of credit.
8. Security Lending.
The Fund lends portfolio securities from time to time in order to earn additional income. Lending agents are used, including National Financial Services (NFS), an affiliate of the Fund. Pursuant to a securities lending agreement, NFS will receive a fee, which is capped at 9.9% of daily lending revenue, for its services as lending agent. The Fund may lend securities to certain qualified borrowers, including NFS. On the settlement date of the loan, the Fund receives collateral (in the form of U.S. Treasury obligations, letters of credit and/or cash) against the loaned securities and maintains collateral in an amount not less than 100% of the market value of the loaned securities during the period of the loan. The market value of the loaned securities is determined at the close of business of the Fund and any additional required collateral is delivered to the Fund on the next business day. The Fund or borrower may terminate the loan at any time, and if the borrower defaults on its obligation to return the securities loaned because of insolvency or other reasons, the Fund may apply collateral received from the borrower against the obligation. The Fund may experience delays and costs in recovering the securities loaned. Any cash collateral received is invested in the Fidelity Securities Lending Cash Central Fund. The value of loaned securities and cash collateral at period end are disclosed on the Fund's Statement of Assets and Liabilities. The value of securities loaned to NFS, as affiliated borrower, at period end was $46,794. Total fees paid by the Fund to NFS, as lending agent, amounted to $48,935. Security lending income represents the income earned on investing cash collateral, less rebates paid to borrowers and any lending agent fees associated with the loan, plus any premium payments received for lending certain types of securities. Net income from the Fidelity Securities Lending Cash Central Fund during the period is presented in the Statement of Operations as a component of income from Fidelity Central Funds (and includes $45 from securities loaned to NFS, as affiliated borrower).
9. Expense Reductions.
The investment adviser contractually agreed to reimburse the Fund to the extent annual operating expenses exceeded .05% of average net assets. This reimbursement will remain in place through November 30, 2020. Some expenses, for example the compensation of the independent Trustees, and certain miscellaneous expenses such as proxy and shareholder meeting expenses, are excluded from this reimbursement. During the period this reimbursement reduced the Fund's expenses by $1,196,258.
10. Other.
The Fund's organizational documents provide former and current trustees and officers with a limited indemnification against liabilities arising in connection with the performance of their duties to the Fund. In the normal course of business, the Fund may also enter into contracts that provide general indemnifications. The Fund's maximum exposure under these arrangements is unknown as this would be dependent on future claims that may be made against the Fund. The risk of material loss from such claims is considered remote.
11. Coronavirus (COVID-19) Pandemic.
An outbreak of COVID-19 first detected in China during December 2019 has since spread globally and was declared a pandemic by the World Health Organization during March 2020. Developments that disrupt global economies and financial markets, such as the COVID-19 pandemic, may magnify factors that affect the Fund's performance.
Report of Independent Registered Public Accounting Firm
To the Board of Trustees of Fidelity Salem Street Trust and Shareholders of Fidelity SAI Small-Mid Cap 500 Index Fund
Opinion on the Financial Statements and Financial Highlights
We have audited the accompanying statement of assets and liabilities of Fidelity SAI Small-Mid Cap 500 Index Fund (the "Fund"), a fund of Fidelity Salem Street Trust, including the schedule of investments, as of July 31, 2020, the related statement of operations for the year then ended, the statement of changes in net assets for each of the two years in the period then ended, the financial highlights for each of the four years in the period then ended and for the period from August 12, 2015 (commencement of operations) through July 31, 2016, and the related notes. In our opinion, the financial statements and financial highlights present fairly, in all material respects, the financial position of the Fund as of July 31, 2020, and the results of its operations for the year then ended, the changes in its net assets for each of the two years in the period then ended, and the financial highlights for each of the four years in the period then ended and for the period from August 12, 2015 (commencement of operations) through July 31, 2016 in conformity with accounting principles generally accepted in the United States of America.
Basis for Opinion
These financial statements and financial highlights are the responsibility of the Fund's management. Our responsibility is to express an opinion on the Fund's financial statements and financial highlights based on our audits. We are a public accounting firm registered with the Public Company Accounting Oversight Board (United States) (PCAOB) and are required to be independent with respect to the Fund in accordance with the U.S. federal securities laws and the applicable rules and regulations of the Securities and Exchange Commission and the PCAOB.
We conducted our audits in accordance with the standards of the PCAOB. Those standards require that we plan and perform the audit to obtain reasonable assurance about whether the financial statements and financial highlights are free of material misstatement, whether due to error or fraud. The Fund is not required to have, nor were we engaged to perform, an audit of its internal control over financial reporting. As part of our audits we are required to obtain an understanding of internal control over financial reporting but not for the purpose of expressing an opinion on the effectiveness of the Fund’s internal control over financial reporting. Accordingly, we express no such opinion.
Our audits included performing procedures to assess the risks of material misstatement of the financial statements and financial highlights, whether due to error or fraud, and performing procedures that respond to those risks. Such procedures included examining, on a test basis, evidence regarding the amounts and disclosures in the financial statements and financial highlights. Our audits also included evaluating the accounting principles used and significant estimates made by management, as well as evaluating the overall presentation of the financial statements and financial highlights. Our procedures included confirmation of securities owned as of July 31, 2020, by correspondence with the custodian and brokers; when replies were not received from brokers, we performed other auditing procedures. We believe that our audits provide a reasonable basis for our opinion.
/s/ Deloitte & Touche LLP
Boston, Massachusetts
September 14, 2020
We have served as the auditor of one or more of the Fidelity investment companies since 1999.
Trustees and Officers
The Trustees, Members of the Advisory Board (if any), and officers of the trust and fund, as applicable, are listed below. The Board of Trustees governs the fund and is responsible for protecting the interests of shareholders. The Trustees are experienced executives who meet periodically throughout the year to oversee the fund's activities, review contractual arrangements with companies that provide services to the fund, oversee management of the risks associated with such activities and contractual arrangements, and review the fund's performance. Except for Jonathan Chiel each of the Trustees oversees 311 funds. Mr. Chiel oversees174 funds.
The Trustees hold office without limit in time except that (a) any Trustee may resign; (b) any Trustee may be removed by written instrument, signed by at least two-thirds of the number of Trustees prior to such removal; (c) any Trustee who requests to be retired or who has become incapacitated by illness or injury may be retired by written instrument signed by a majority of the other Trustees; and (d) any Trustee may be removed at any special meeting of shareholders by a two-thirds vote of the outstanding voting securities of the trust. Each Trustee who is not an interested person (as defined in the 1940 Act) of the trust and the fund is referred to herein as an Independent Trustee. Each Independent Trustee shall retire not later than the last day of the calendar year in which his or her 75th birthday occurs. The Independent Trustees may waive this mandatory retirement age policy with respect to individual Trustees. Officers and Advisory Board Members hold office without limit in time, except that any officer or Advisory Board Member may resign or may be removed by a vote of a majority of the Trustees at any regular meeting or any special meeting of the Trustees. Except as indicated, each individual has held the office shown or other offices in the same company for the past five years.
The fund’s Statement of Additional Information (SAI) includes more information about the Trustees. To request a free copy, call Fidelity at 1-800-544-3455.
Experience, Skills, Attributes, and Qualifications of the Trustees. The Governance and Nominating Committee has adopted a statement of policy that describes the experience, qualifications, attributes, and skills that are necessary and desirable for potential Independent Trustee candidates (Statement of Policy). The Board believes that each Trustee satisfied at the time he or she was initially elected or appointed a Trustee, and continues to satisfy, the standards contemplated by the Statement of Policy. The Governance and Nominating Committee also engages professional search firms to help identify potential Independent Trustee candidates who have the experience, qualifications, attributes, and skills consistent with the Statement of Policy. From time to time, additional criteria based on the composition and skills of the current Independent Trustees, as well as experience or skills that may be appropriate in light of future changes to board composition, business conditions, and regulatory or other developments, have also been considered by the professional search firms and the Governance and Nominating Committee. In addition, the Board takes into account the Trustees' commitment and participation in Board and committee meetings, as well as their leadership of standing and ad hoc committees throughout their tenure.
In determining that a particular Trustee was and continues to be qualified to serve as a Trustee, the Board has considered a variety of criteria, none of which, in isolation, was controlling. The Board believes that, collectively, the Trustees have balanced and diverse experience, qualifications, attributes, and skills, which allow the Board to operate effectively in governing the fund and protecting the interests of shareholders. Information about the specific experience, skills, attributes, and qualifications of each Trustee, which in each case led to the Board's conclusion that the Trustee should serve (or continue to serve) as a trustee of the fund, is provided below.
Board Structure and Oversight Function. Abigail P. Johnson is an interested person and currently serves as Chairman. The Trustees have determined that an interested Chairman is appropriate and benefits shareholders because an interested Chairman has a personal and professional stake in the quality and continuity of services provided to the fund. Independent Trustees exercise their informed business judgment to appoint an individual of their choosing to serve as Chairman, regardless of whether the Trustee happens to be independent or a member of management. The Independent Trustees have determined that they can act independently and effectively without having an Independent Trustee serve as Chairman and that a key structural component for assuring that they are in a position to do so is for the Independent Trustees to constitute a substantial majority for the Board. The Independent Trustees also regularly meet in executive session. Arthur E. Johnson serves as Chairman of the Independent Trustees and as such (i) acts as a liaison between the Independent Trustees and management with respect to matters important to the Independent Trustees and (ii) with management prepares agendas for Board meetings.
Fidelity® funds are overseen by different Boards of Trustees. The fund's Board oversees Fidelity's investment-grade bond, money market, asset allocation and certain equity funds, and other Boards oversee Fidelity's high income and other equity funds. The asset allocation funds may invest in Fidelity® funds that are overseen by such other Boards. The use of separate Boards, each with its own committee structure, allows the Trustees of each group of Fidelity® funds to focus on the unique issues of the funds they oversee, including common research, investment, and operational issues. On occasion, the separate Boards establish joint committees to address issues of overlapping consequences for the Fidelity® funds overseen by each Board.
The Trustees operate using a system of committees to facilitate the timely and efficient consideration of all matters of importance to the Trustees, the fund, and fund shareholders and to facilitate compliance with legal and regulatory requirements and oversight of the fund's activities and associated risks. The Board, acting through its committees, has charged FMR and its affiliates with (i) identifying events or circumstances the occurrence of which could have demonstrably adverse effects on the fund's business and/or reputation; (ii) implementing processes and controls to lessen the possibility that such events or circumstances occur or to mitigate the effects of such events or circumstances if they do occur; and (iii) creating and maintaining a system designed to evaluate continuously business and market conditions in order to facilitate the identification and implementation processes described in (i) and (ii) above. Because the day-to-day operations and activities of the fund are carried out by or through FMR, its affiliates, and other service providers, the fund's exposure to risks is mitigated but not eliminated by the processes overseen by the Trustees. While each of the Board's committees has responsibility for overseeing different aspects of the fund's activities, oversight is exercised primarily through the Operations and Audit Committees. In addition, an ad hoc Board committee of Independent Trustees has worked with FMR to enhance the Board's oversight of investment and financial risks, legal and regulatory risks, technology risks, and operational risks, including the development of additional risk reporting to the Board. Appropriate personnel, including but not limited to the fund's Chief Compliance Officer (CCO), FMR's internal auditor, the independent accountants, the fund's Treasurer and portfolio management personnel, make periodic reports to the Board's committees, as appropriate, including an annual review of Fidelity's risk management program for the Fidelity® funds. The responsibilities of each standing committee, including their oversight responsibilities, are described further under "Standing Committees of the Trustees."
Interested Trustees*:
Correspondence intended for a Trustee who is an interested person may be sent to Fidelity Investments, 245 Summer Street, Boston, Massachusetts 02210.
Name, Year of Birth; Principal Occupations and Other Relevant Experience+
Jonathan Chiel (1957)
Year of Election or Appointment: 2016
Trustee
Mr. Chiel also serves as Trustee of other Fidelity® funds. Mr. Chiel is Executive Vice President and General Counsel for FMR LLC (diversified financial services company, 2012-present). Previously, Mr. Chiel served as general counsel (2004-2012) and senior vice president and deputy general counsel (2000-2004) for John Hancock Financial Services; a partner with Choate, Hall & Stewart (1996-2000) (law firm); and an Assistant United States Attorney for the United States Attorney’s Office of the District of Massachusetts (1986-95), including Chief of the Criminal Division (1993-1995). Mr. Chiel is a director on the boards of the Boston Bar Foundation and the Maimonides School.
Abigail P. Johnson (1961)
Year of Election or Appointment: 2009
Trustee
Chairman of the Board of Trustees
Ms. Johnson also serves as Trustee of other Fidelity® funds. Ms. Johnson serves as Chairman (2016-present), Chief Executive Officer (2014-present), and Director (2007-present) of FMR LLC (diversified financial services company), President of Fidelity Financial Services (2012-present) and President of Personal, Workplace and Institutional Services (2005-present). Ms. Johnson is Chairman and Director of Fidelity Management & Research Company LLC (investment adviser firm, 2011-present). Previously, Ms. Johnson served as Chairman and Director of FMR Co., Inc. (investment adviser firm, 2011-2019), Vice Chairman (2007-2016) and President (2013-2016) of FMR LLC, President and a Director of Fidelity Management & Research Company (2001-2005), a Trustee of other investment companies advised by Fidelity Management & Research Company, Fidelity Investments Money Management, Inc. (investment adviser firm), and FMR Co., Inc. (2001-2005), Senior Vice President of the Fidelity® funds (2001-2005), and managed a number of Fidelity® funds. Ms. Abigail P. Johnson and Mr. Arthur E. Johnson are not related.
Jennifer Toolin McAuliffe (1959)
Year of Election or Appointment: 2016
Trustee
Ms. McAuliffe also serves as Trustee of other Fidelity® funds. Previously, Ms. McAuliffe served as Co-Head of Fixed Income of Fidelity Investments Limited (now known as FIL Limited (FIL)) (diversified financial services company), Director of Research for FIL’s credit and quantitative teams in London, Hong Kong and Tokyo and Director of Research for taxable and municipal bonds at Fidelity Investments Money Management, Inc. Ms. McAuliffe previously served as a member of the Advisory Board of certain Fidelity® funds (2016). Ms. McAuliffe was previously a lawyer at Ropes & Gray LLP and currently serves as director or trustee of several not-for-profit entities.
* Determined to be an “Interested Trustee” by virtue of, among other things, his or her affiliation with the trust or various entities under common control with FMR.
+ The information includes the Trustee's principal occupation during the last five years and other information relating to the experience, attributes, and skills relevant to the Trustee's qualifications to serve as a Trustee, which led to the conclusion that the Trustee should serve as a Trustee for the fund.
Independent Trustees:
Correspondence intended for an Independent Trustee may be sent to Fidelity Investments, P.O. Box 55235, Boston, Massachusetts 02205-5235.
Name, Year of Birth; Principal Occupations and Other Relevant Experience+
Elizabeth S. Acton (1951)
Year of Election or Appointment: 2013
Trustee
Ms. Acton also serves as Trustee of other Fidelity® funds. Prior to her retirement, Ms. Acton served as Executive Vice President, Finance (2011-2012), Executive Vice President, Chief Financial Officer (2002-2011) and Treasurer (2004-2005) of Comerica Incorporated (financial services). Prior to joining Comerica, Ms. Acton held a variety of positions at Ford Motor Company (1983-2002), including Vice President and Treasurer (2000-2002) and Executive Vice President and Chief Financial Officer of Ford Motor Credit Company (1998-2000). Ms. Acton currently serves as a member of the Board and Audit and Finance Committees of Beazer Homes USA, Inc. (homebuilding, 2012-present). Ms. Acton previously served as a member of the Advisory Board of certain Fidelity® funds (2013-2016).
Ann E. Dunwoody (1953)
Year of Election or Appointment: 2018
Trustee
General Dunwoody also serves as Trustee of other Fidelity® funds. General Dunwoody (United States Army, Retired) was the first woman in U.S. military history to achieve the rank of four-star general and prior to her retirement in 2012 held a variety of positions within the U.S. Army, including Commanding General, U.S. Army Material Command (2008-2012). General Dunwoody currently serves as President of First to Four LLC (leadership and mentoring services, 2012-present), a member of the Board and Nomination and Corporate Governance Committees of Kforce Inc. (professional staffing services, 2016-present) and a member of the Board of Automattic Inc. (software engineering, 2018-present). Previously, General Dunwoody served as a member of the Advisory Board and Nominating and Corporate Governance Committee of L3 Technologies, Inc. (communication, electronic, sensor and aerospace systems, 2013-2019) and a member of the Board and Audit and Sustainability and Corporate Responsibility Committees of Republic Services, Inc. (waste collection, disposal and recycling, 2013-2016). Ms. Dunwoody also serves on several boards for non-profit organizations, including as a member of the Board, Chair of the Nomination and Governance Committee and a member of the Audit Committee of Logistics Management Institute (consulting non-profit, 2012-present), a member of the Council of Trustees for the Association of the United States Army (advocacy non-profit, 2013-present), a member of the Board of Florida Institute of Technology (2015-present) and a member of the Board of ThanksUSA (military family education non-profit, 2014-present). General Dunwoody previously served as a member of the Advisory Board of certain Fidelity® funds (2018).
John Engler (1948)
Year of Election or Appointment: 2014
Trustee
Mr. Engler also serves as Trustee of other Fidelity® funds. Previously, Mr. Engler served as Governor of Michigan (1991-2003), President of the Business Roundtable (2011-2017) and interim President of Michigan State University (2018-2019). Mr. Engler currently serves as a member of the Board of K12 Inc. (technology-based education company, 2012-present). Previously, Mr. Engler served as a member of the Board of Universal Forest Products (manufacturer and distributor of wood and wood-alternative products, 2003-2019) and Trustee of The Munder Funds (2003-2014). Mr. Engler previously served as a member of the Advisory Board of certain Fidelity® funds (2014-2016).
Robert F. Gartland (1951)
Year of Election or Appointment: 2010
Trustee
Mr. Gartland also serves as Trustee of other Fidelity® funds. Prior to his retirement, Mr. Gartland held a variety of positions at Morgan Stanley (financial services, 1979-2007), including Managing Director (1987-2007) and Chase Manhattan Bank (1975-1978). Mr. Gartland previously served as Chairman and an investor in Gartland & Mellina Group Corp. (consulting, 2009-2019), as a member of the Board of National Securities Clearing Corporation (1993-1996) and as Chairman of TradeWeb (2003-2004).
Arthur E. Johnson (1947)
Year of Election or Appointment: 2008
Trustee
Chairman of the Independent Trustees
Mr. Johnson also serves as Trustee of other Fidelity® funds. Prior to his retirement, Mr. Johnson served as Senior Vice President of Corporate Strategic Development of Lockheed Martin Corporation (defense contractor, 1999-2009). Mr. Johnson currently serves as a member of the Board of Booz Allen Hamilton (management consulting, 2011-present). Mr. Johnson previously served as a member of the Board of Eaton Corporation plc (diversified power management, 2009-2019) and a member of the Board of AGL Resources, Inc. (holding company, 2002-2016). Mr. Johnson previously served as Vice Chairman (2015-2018) of the Independent Trustees of certain Fidelity® funds. Mr. Arthur E. Johnson is not related to Ms. Abigail P. Johnson.
Michael E. Kenneally (1954)
Year of Election or Appointment: 2009
Trustee
Vice Chairman of the Independent Trustees
Mr. Kenneally also serves as Trustee of other Fidelity® funds. Prior to his retirement, Mr. Kenneally served as Chairman and Global Chief Executive Officer of Credit Suisse Asset Management and Executive Vice President and Chief Investment Officer of Bank of America Corporation. Earlier roles at Bank of America included Director of Research, Senior Portfolio Manager for various institutional equity accounts and mutual funds and Portfolio Manager for a number of institutional fixed-income clients. Mr. Kenneally began his career as a Research Analyst in 1983 and was awarded the Chartered Financial Analyst (CFA) designation in 1991.
Marie L. Knowles (1946)
Year of Election or Appointment: 2001
Trustee
Ms. Knowles also serves as Trustee of other Fidelity® funds. Prior to her retirement, Ms. Knowles held several positions at Atlantic Richfield Company (diversified energy), including Executive Vice President and Chief Financial Officer (1996-2000), Senior Vice President (1993-1996) and President of ARCO Transportation Company (pipeline and tanker operations, 1993-1996). Ms. Knowles currently serves as a member of the Board of McKesson Corporation (healthcare service, since 2002), a member of the Board of the Santa Catalina Island Company (real estate, 2009-present), a member of the Investment Company Institute Board of Governors and a member of the Governing Council of the Independent Directors Council (2014-present). Ms. Knowles also serves as a member of the Advisory Board for the School of Engineering of the University of Southern California. Ms. Knowles previously served as Chairman (2015-2018) and Vice Chairman (2012-2015) of the Independent Trustees of certain Fidelity® funds.
Mark A. Murray (1954)
Year of Election or Appointment: 2016
Trustee
Mr. Murray also serves as Trustee of other Fidelity® funds. Previously, Mr. Murray served as Co-Chief Executive Officer (2013-2016), President (2006-2013) and Vice Chairman (2013-2020) of Meijer, Inc. Mr. Murray serves as a member of the Board and Nuclear Review and Public Policy and Responsibility Committees of DTE Energy Company (diversified energy company, 2009-present) and a member of the Board and Audit Committee and Chairman of the Nominating and Corporate Governance Committee of Universal Forest Products, Inc. (manufacturer and distributor of wood and wood-alternative products, 2004-2016). Mr. Murray previously served as a member of the Board of Spectrum Health (not-for-profit health system, 2015-2019). Mr. Murray also serves as a member of the Board of many community and professional organizations. Mr. Murray previously served as a member of the Advisory Board of certain Fidelity® funds (2016).
+ The information includes the Trustee's principal occupation during the last five years and other information relating to the experience, attributes, and skills relevant to the Trustee's qualifications to serve as a Trustee, which led to the conclusion that the Trustee should serve as a Trustee for the fund.
Advisory Board Members and Officers:
Correspondence intended for an officer may be sent to Fidelity Investments, 245 Summer Street, Boston, Massachusetts 02210. Officers appear below in alphabetical order.
Name, Year of Birth; Principal Occupation
Elizabeth Paige Baumann (1968)
Year of Election or Appointment: 2017
Anti-Money Laundering (AML) Officer
Ms. Baumann also serves as AML Officer of other funds. She is Chief AML Officer (2012-present) and Senior Vice President (2014-present) of FMR LLC (diversified financial services company) and is an employee of Fidelity Investments. Previously, Ms. Baumann served as AML Officer of certain funds (2017-2019), as AML Officer of the funds (2012-2016), and Vice President (2007-2014) and Deputy Anti-Money Laundering Officer (2007-2012) of FMR LLC.
Craig S. Brown (1977)
Year of Election or Appointment: 2019
Assistant Treasurer
Mr. Brown also serves as Assistant Treasurer of other funds. Mr. Brown is an employee of Fidelity Investments (2013-present).
John J. Burke III (1964)
Year of Election or Appointment: 2018
Chief Financial Officer
Mr. Burke also serves as Chief Financial Officer of other funds. Mr. Burke serves as Head of Investment Operations for Fidelity Fund and Investment Operations (2018-present) and is an employee of Fidelity Investments (1998-present). Previously Mr. Burke served as head of Asset Management Investment Operations (2012-2018).
David J. Carter (1973)
Year of Election or Appointment: 2020
Assistant Secretary
Mr. Carter also serves as Assistant Secretary of other funds. Mr. Carter serves as Vice President, Associate General Counsel (2010-present) and is an employee of Fidelity Investments (2005-present).
Jonathan Davis (1968)
Year of Election or Appointment: 2010
Assistant Treasurer
Mr. Davis also serves as Assistant Treasurer of other funds. Mr. Davis serves as Assistant Treasurer of FMR Capital, Inc. (2017-present) and is an employee of Fidelity Investments. Previously, Mr. Davis served as Vice President and Associate General Counsel of FMR LLC (diversified financial services company, 2003-2010).
Laura M. Del Prato (1964)
Year of Election or Appointment: 2018
President and Treasurer
Ms. Del Prato also serves as an officer of other funds. Ms. Del Prato is an employee of Fidelity Investments (2017-present). Previously, Ms. Del Prato served as President and Treasurer of The North Carolina Capital Management Trust: Cash Portfolio and Term Portfolio (2018-2020). Prior to joining Fidelity Investments, Ms. Del Prato served as a Managing Director and Treasurer of the JPMorgan Mutual Funds (2014-2017). Prior to JPMorgan, Ms. Del Prato served as a partner at Cohen Fund Audit Services (accounting firm, 2012-2013) and KPMG LLP (accounting firm, 2004-2012).
Colm A. Hogan (1973)
Year of Election or Appointment: 2016
Assistant Treasurer
Mr. Hogan also serves as an officer of other funds. Mr. Hogan serves as Assistant Treasurer of FMR Capital, Inc. (2017-present) and is an employee of Fidelity Investments (2005-present). Previously, Mr. Hogan served as Deputy Treasurer of certain Fidelity® funds (2016-2020) and Assistant Treasurer of certain Fidelity® funds (2016-2018).
Cynthia Lo Bessette (1969)
Year of Election or Appointment: 2019
Secretary and Chief Legal Officer (CLO)
Ms. Lo Bessette also serves as an officer of other funds. Ms. Lo Bessette serves as CLO, Secretary, and Senior Vice President of Fidelity Management & Research Company LLC (investment adviser firm, 2019-present); and CLO of Fidelity Management & Research (Hong Kong) Limited, FMR Investment Management (UK) Limited, and Fidelity Management & Research (Japan) Limited (investment adviser firms, 2019-present). She is a Senior Vice President and Deputy General Counsel of FMR LLC (diversified financial services company, 2019-present), and is an employee of Fidelity Investments. Previously, Ms. Lo Bessette served as CLO, Secretary, and Senior Vice President of FMR Co., Inc. (investment adviser firm, 2019); Secretary of Fidelity SelectCo, LLC and Fidelity Investments Money Management, Inc. (investment adviser firms, 2019). Prior to joining Fidelity Investments, Ms. Lo Bessette was Executive Vice President, General Counsel (2016-2019) and Senior Vice President, Deputy General Counsel (2015-2016) of OppenheimerFunds (investment management company) and Deputy Chief Legal Officer (2013-2015) of Jennison Associates LLC (investment adviser firm).
Chris Maher (1972)
Year of Election or Appointment: 2013
Assistant Treasurer
Mr. Maher also serves as an officer of other funds. Mr. Maher serves as Assistant Treasurer of FMR Capital, Inc. (2017-present), and is an employee of Fidelity Investments (2008-present). Previously, Mr. Maher served as Assistant Treasurer of certain funds (2013-2020); Vice President of Asset Management Compliance (2013), Vice President of the Program Management Group of FMR (investment adviser firm, 2010-2013), and Vice President of Valuation Oversight (2008-2010).
Jamie Pagliocco (1964)
Year of Election or Appointment: 2020
Vice President
Mr. Pagliocco also serves as Vice President of other funds. Mr. Pagliocco serves as President of Fixed Income (2020-present), and is an employee of Fidelity Investments (2001-present). Previously, Mr. Pagliocco served as Co-Chief Investment Officer – Bond (2017-2020), Global Head of Bond Trading (2016-2019), and as a portfolio manager.
Kenneth B. Robins (1969)
Year of Election or Appointment: 2020
Chief Compliance Officer
Mr. Robins also serves as an officer of other funds. Mr. Robins serves as Compliance Officer of Fidelity Management & Research Company LLC (investment adviser firm, 2016-present) and is an employee of Fidelity Investments (2004-present). Previously, Mr. Robins served as Compliance Officer of FMR Co., Inc. (investment adviser firm, 2016-2019), as Executive Vice President of Fidelity Investments Money Management, Inc. (investment adviser firm, 2013-2016) and served in other fund officer roles.
Stacie M. Smith (1974)
Year of Election or Appointment: 2013
Assistant Treasurer
Ms. Smith also serves as an officer of other funds. Ms. Smith serves as Assistant Treasurer of FMR Capital, Inc. (2017-present), is an employee of Fidelity Investments (2009-present), and has served in other fund officer roles. Prior to joining Fidelity Investments, Ms. Smith served as Senior Audit Manager of Ernst & Young LLP (accounting firm, 1996-2009). Previously, Ms. Smith served as Assistant Treasurer (2013-2019) and Deputy Treasurer (2013-2016) of certain Fidelity® funds.
Marc L. Spector (1972)
Year of Election or Appointment: 2016
Deputy Treasurer
Mr. Spector also serves as an officer of other funds. Mr. Spector serves as Assistant Treasurer of FMR Capital, Inc. (2017-present) and is an employee of Fidelity Investments (2016-present). Prior to joining Fidelity Investments, Mr. Spector served as Director at the Siegfried Group (accounting firm, 2013-2016), and prior to Siegfried Group as audit senior manager at Deloitte & Touche LLP (accounting firm, 2005-2013).
Jim Wegmann (1979)
Year of Election or Appointment: 2019
Assistant Treasurer
Mr. Wegmann also serves as Assistant Treasurer of other funds. Mr. Wegmann is an employee of Fidelity Investments (2011-present).
Shareholder Expense Example
As a shareholder, you incur two types of costs: (1) transaction costs, which may include sales charges (loads) on purchase payments or redemption proceeds, as applicable and (2) ongoing costs, which generally include management fees, distribution and/or service (12b-1) fees and other Fund expenses. This Example is intended to help you understand your ongoing costs (in dollars) of investing in a fund and to compare these costs with the ongoing costs of investing in other mutual funds.
The Example is based on an investment of $1,000 invested at the beginning of the period and held for the entire period (February 1, 2020 to July 31, 2020).
Actual Expenses
The first line of the accompanying table provides information about actual account values and actual expenses. You may use the information in this line, together with the amount you invested, to estimate the expenses that you paid over the period. Simply divide your account value by $1,000.00 (for example, an $8,600 account value divided by $1,000.00 = 8.6), then multiply the result by the number in the first line for a class/Fund under the heading entitled "Expenses Paid During Period" to estimate the expenses you paid on your account during this period. If any fund is a shareholder of any underlying mutual funds or exchange-traded funds (ETFs) (the Underlying Funds), such fund indirectly bears its proportional share of the expenses of the Underlying Funds in addition to the direct expenses incurred presented in the table. These fees and expenses are not included in the annualized expense ratio used to calculate the expense estimate in the table below.
Hypothetical Example for Comparison Purposes
The second line of the accompanying table provides information about hypothetical account values and hypothetical expenses based on the actual expense ratio and an assumed rate of return of 5% per year before expenses, which is not the actual return. The hypothetical account values and expenses may not be used to estimate the actual ending account balance or expenses you paid for the period. You may use this information to compare the ongoing costs of investing in the Fund and other funds. To do so, compare this 5% hypothetical example with the 5% hypothetical examples that appear in the shareholder reports of the other funds. If any fund is a shareholder of any Underlying Funds, such fund indirectly bears its proportional share of the expenses of the Underlying Funds in addition to the direct expenses as presented in the table. These fees and expenses are not included in the annualized expense ratio used to calculate the expense estimate in the table below.
Please note that the expenses shown in the table are meant to highlight your ongoing costs only and do not reflect any transaction costs. Therefore, the second line of the table is useful in comparing ongoing costs only, and will not help you determine the relative total costs of owning different funds.
| | Annualized Expense Ratio-A | Beginning
Account Value
February 1, 2020 | Ending
Account Value
July 31, 2020 | Expenses Paid
During Period-B
February 1, 2020
to July 31, 2020 |
| Fidelity SAI Small-Mid Cap 500 Index Fund | .05% | | | |
| Actual | | $1,000.00 | $958.30 | $.24 |
| Hypothetical-C | | $1,000.00 | $1,024.61 | $.25 |
A Annualized expense ratio reflects expenses net of applicable fee waivers.
B Expenses are equal to the annualized expense ratio, multiplied by the average account value over the period, multiplied by 182/ 366 (to reflect the one-half year period). The fees and expenses of any Underlying Funds are not included in each annualized expense ratio.
C 5% return per year before expenses
Distributions (Unaudited)
The Board of Trustees of Fidelity SAI Small-Mid Cap 500 Index Fund voted to pay on September 14, 2020, to shareholders of record at the opening of business on September 11, 2020, a distribution of $.818 per share derived from capital gains realized from sales of portfolio securities and a dividend of $.067 per share from net investment income.
The fund hereby designates as a capital gain dividend with respect to the taxable year ended July 31, 2020, $122,761,064, or, if subsequently determined to be different, the net capital gain of such year.
The fund designates 70% and 55% of the dividends distributed in September and December, respectively during the fiscal year as qualifying for the dividends–received deduction for corporate shareholders.
The fund designates 71% and 61% of the dividends distributed in September and December, respectively during the fiscal year as amounts which may be taken into account as a dividend for the purposes of the maximum rate under section 1(h)(11) of the Internal Revenue Code.
The fund designates 30% and 31% of the dividends distributed in September and December, respectively during the fiscal year as a section 199A dividend.
The fund will notify shareholders in January 2021 of amounts for use in preparing 2020 income tax returns.
Liquidity Risk Management Program
The Securities and Exchange Commission adopted Rule 22e-4 under the Investment Company Act of 1940 (the Liquidity Rule) to promote effective liquidity risk management throughout the open-end investment company industry, thereby reducing the risk that funds will be unable to meet their redemption obligations and mitigating dilution of the interests of fund shareholders.
The Fund has adopted and implemented a liquidity risk management program pursuant to the Liquidity Rule (the Program) effective December 1, 2018. The Program is reasonably designed to assess and manage the Fund’s liquidity risk and to comply with the requirements of the Liquidity Rule. The Fund’s Board of Trustees (the Board) has designated the Fund’s investment adviser as administrator of the Program. The Fidelity advisers have established a Liquidity Risk Management Committee (the LRM Committee) to manage the Program for each of the Fidelity Funds. The LRM Committee monitors the adequacy and effectiveness of implementation of the Program and on a periodic basis assesses each Fund’s liquidity risk based on a variety of factors including (1) the Fund’s investment strategy, (2) portfolio liquidity and cash flow projections during normal and reasonably foreseeable stressed conditions, (3) shareholder redemptions, (4) borrowings and other funding sources and (5) in the case of exchange-traded funds, certain additional factors including the effect of the Fund’s prices and spreads, market participants, and basket compositions on the overall liquidity of the Fund’s portfolio, as applicable.
In accordance with the Program, each of the Fund’s portfolio investments is classified into one of four liquidity categories described below based on a determination of a reasonable expectation for how long it would take to convert the investment to cash (or sell or dispose of the investment) without significantly changing its market value.
- Highly liquid investments – cash or convertible to cash within three business days or less
- Moderately liquid investments – convertible to cash in three to seven calendar days
- Less liquid investments – can be sold or disposed of, but not settled, within seven calendar days
- Illiquid investments – cannot be sold or disposed of within seven calendar days
Liquidity classification determinations take into account a variety of factors including various market, trading and investment-specific considerations, as well as market depth, and generally utilize analysis from a third-party liquidity metrics service.
The Liquidity Rule places a 15% limit on a fund’s illiquid investments and requires funds that do not primarily hold assets that are highly liquid investments to determine and maintain a minimum percentage of the fund’s net assets to be invested in highly liquid investments (highly liquid investment minimum or HLIM). The Program includes provisions reasonably designed to comply with the 15% limit on illiquid investments and for determining, periodically reviewing and complying with the HLIM requirement as applicable.
At a recent meeting of the Fund’s Board of Trustees, the LRM Committee provided a written report to the Board pertaining to the operation, adequacy, and effectiveness of implementation of the Program for the annual period from December 1, 2018 through November 30, 2019. The report concluded that the Program has been implemented and is operating effectively and is reasonably designed to assess and manage the Fund’s liquidity risk.
SV3-ANN-0920
1.9868212.104
Fidelity® SAI U.S. Quality Index Fund
Offered exclusively to certain clients of the Adviser or its affiliates - not available for sale to the general public. Fidelity SAI is a product name of Fidelity® funds dedicated to certain programs affiliated with Strategic Advisers LLC.
Annual Report
July 31, 2020
See the inside front cover for important information about access to your fund’s shareholder reports.
Beginning on January 1, 2021, as permitted by regulations adopted by the Securities and Exchange Commission, paper copies of a fund’s shareholder reports will no longer be sent by mail, unless you specifically request paper copies of the reports from the fund or from your financial intermediary, such as a financial advisor, broker-dealer or bank. Instead, the reports will be made available on a website, and you will be notified by mail each time a report is posted and provided with a website link to access the report.
If you already elected to receive shareholder reports electronically, you will not be affected by this change and you need not take any action. You may elect to receive shareholder reports and other communications from a fund electronically, by contacting your financial intermediary. For Fidelity customers, visit Fidelity's web site or call Fidelity using the contact information listed below.
You may elect to receive all future reports in paper free of charge. If you wish to continue receiving paper copies of your shareholder reports, you may contact your financial intermediary or, if you are a Fidelity customer, visit Fidelity’s website, or call Fidelity at the applicable toll-free number listed below. Your election to receive reports in paper will apply to all funds held with the fund complex/your financial intermediary.
| Account Type | Website | Phone Number |
| Brokerage, Mutual Fund, or Annuity Contracts: | fidelity.com/mailpreferences | 1-800-343-3548 |
| Employer Provided Retirement Accounts: | netbenefits.fidelity.com/preferences (choose 'no' under Required Disclosures to continue to print) | 1-800-343-0860 |
| Advisor Sold Accounts Serviced Through Your Financial Intermediary: | Contact Your Financial Intermediary | Your Financial Intermediary's phone number |
| Advisor Sold Accounts Serviced by Fidelity: | institutional.fidelity.com | 1-877-208-0098 |
Contents
To view a fund's proxy voting guidelines and proxy voting record for the 12-month period ended June 30, visit http://www.fidelity.com/proxyvotingresults or visit the Securities and Exchange Commission's (SEC) web site at http://www.sec.gov.
You may also call 1-800-544-3455 to request a free copy of the proxy voting guidelines.
The funds or securities referred to herein are not sponsored, endorsed, or promoted by MSCI, and MSCI bears no liability with respect to any such funds or securities or any index on which such funds or securities are based. The prospectus contains a more detailed description of the limited relationship MSCI has with Fidelity and any related funds.
Standard & Poor's, S&P and S&P 500 are registered service marks of The McGraw-Hill Companies, Inc. and have been licensed for use by Fidelity Distributors Corporation.
Other third-party marks appearing herein are the property of their respective owners.
All other marks appearing herein are registered or unregistered trademarks or service marks of FMR LLC or an affiliated company. © 2020 FMR LLC. All rights reserved.
This report and the financial statements contained herein are submitted for the general information of the shareholders of the Fund. This report is not authorized for distribution to prospective investors in the Fund unless preceded or accompanied by an effective prospectus.
A fund files its complete schedule of portfolio holdings with the SEC for the first and third quarters of each fiscal year on Form N-PORT. Forms N-PORT are available on the SEC’s web site at http://www.sec.gov. A fund's Forms N-PORT may be reviewed and copied at the SEC’s Public Reference Room in Washington, DC. Information regarding the operation of the SEC's Public Reference Room may be obtained by calling 1-800-SEC-0330.
For a complete list of a fund's portfolio holdings, view the most recent holdings listing, semiannual report, or annual report on Fidelity's web site at http://www.fidelity.com, http://www.institutional.fidelity.com, or http://www.401k.com, as applicable.
NOT FDIC INSURED •MAY LOSE VALUE •NO BANK GUARANTEE
Neither the Fund nor Fidelity Distributors Corporation is a bank.
Note to Shareholders:
Early in 2020, the outbreak and spread of a new coronavirus emerged as a public health emergency that had a major influence on financial markets, primarily based on its impact on the global economy and the outlook for corporate earnings. The virus causes a respiratory disease known as COVID-19. On March 11, the World Health Organization declared the COVID-19 outbreak a pandemic, citing sustained risk of further global spread.
In the weeks following, as the crisis worsened, we witnessed an escalating human tragedy with wide-scale social and economic consequences from coronavirus-containment measures. The outbreak of COVID-19 prompted a number of measures to limit the spread, including travel and border restrictions, quarantines, and restrictions on large gatherings. In turn, these resulted in lower consumer activity, diminished demand for a wide range of products and services, disruption in manufacturing and supply chains, and – given the wide variability in outcomes regarding the outbreak – significant market uncertainty and volatility. Amid the turmoil, the U.S. government took unprecedented action – in concert with the U.S. Federal Reserve and central banks around the world – to help support consumers, businesses, and the broader economy, and to limit disruption to the financial system.
The situation continues to unfold, and the extent and duration of its impact on financial markets and the economy remain highly uncertain. Extreme events such as the coronavirus crisis are “exogenous shocks” that can have significant adverse effects on mutual funds and their investments. Although multiple asset classes may be affected by market disruption, the duration and impact may not be the same for all types of assets.
Fidelity is committed to helping you stay informed amid news about COVID-19 and during increased market volatility, and we’re taking extra steps to be responsive to customer needs. We encourage you to visit our websites, where we offer ongoing updates, commentary, and analysis on the markets and our funds.
Performance: The Bottom Line
Average annual total return reflects the change in the value of an investment, assuming reinvestment of distributions from dividend income and capital gains (the profits earned upon the sale of securities that have grown in value, if any) and assuming a constant rate of performance each year. The hypothetical investment and the average annual total returns do not reflect the deduction of taxes that a shareholder would pay on fund distributions or the redemption of fund shares. During periods of reimbursement by Fidelity, a fund’s total return will be greater than it would be had the reimbursement not occurred. How a fund did yesterday is no guarantee of how it will do tomorrow.
Average Annual Total Returns
| For the periods ended July 31, 2020 | Past 1 year | Life of fundA |
| Fidelity® SAI U.S. Quality Index Fund | 20.14% | 15.35% |
A From October 8, 2015
$10,000 Over Life of Fund
Let's say hypothetically that $10,000 was invested in Fidelity® SAI U.S. Quality Index Fund on October 8, 2015, when the fund started.
The chart shows how the value of your investment would have changed, and also shows how the Fidelity U.S. Quality Focus Index℠ and Fidelity SAI U.S. Quality Index Fund Linked Index performed over the same period.
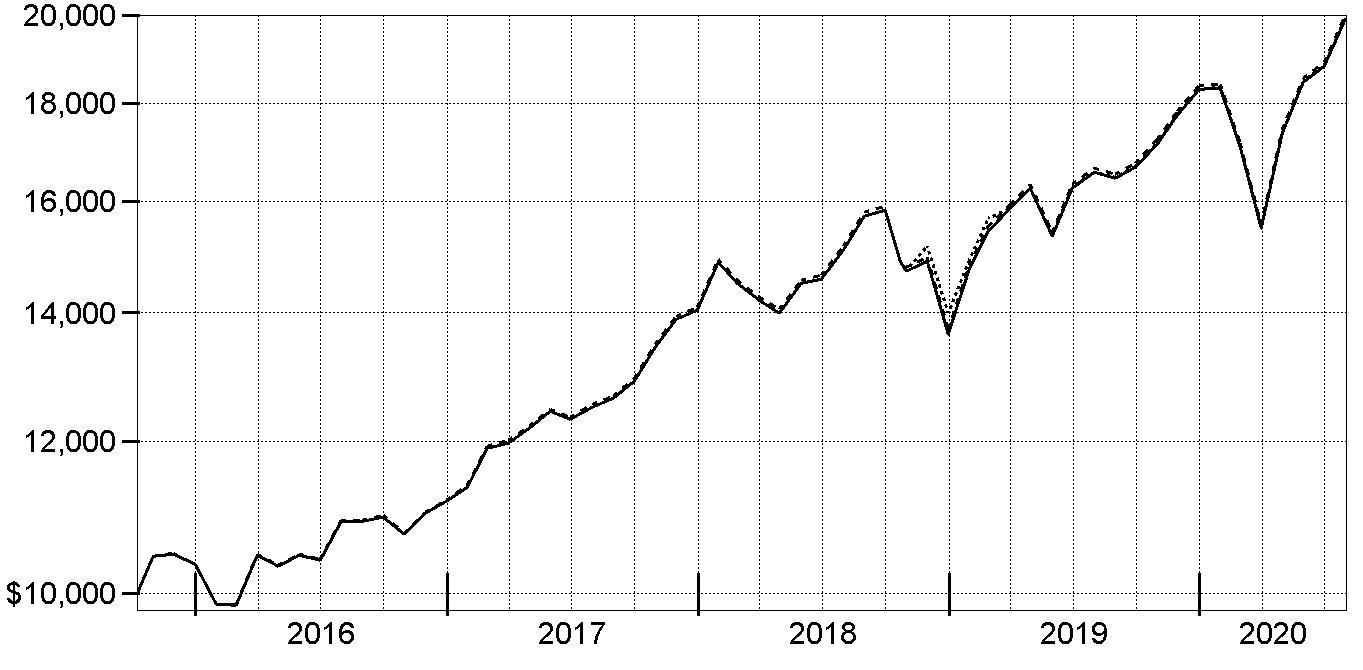
| Period Ending Values |
| $19,890 | Fidelity® SAI U.S. Quality Index Fund |
| $19,914 | Fidelity U.S. Quality Focus Index℠ |
| $19,994 | Fidelity SAI U.S. Quality Index Fund Linked Index |
Management's Discussion of Fund Performance
Market Recap: The S&P 500
® index gained 11.96% for the 12 months ending July 31, 2020, in what was a bumpy ride for U.S. equity investors, marked by a steep but brief decline due to the early-2020 outbreak and spread of the coronavirus, followed by a historic rebound. Declared a pandemic on March 11, the COVID-19 crisis and containment efforts caused broad contraction in economic activity, along with extreme uncertainty, volatility and dislocation in financial markets. By mid-March, U.S. stocks entered bear-market territory less than a month after hitting an all-time high and extending the longest-running bull market in American history. Stocks slid in late February, after a surge in COVID-19 cases outside China. The sudden downtrend continued in March (-12%), capping the index’s worst quarter since 2008. A historically rapid and expansive U.S. monetary/fiscal-policy response provided a partial offset to the economic disruption and fueled a sharp uptrend. Aggressive support for financial markets by the U.S. Federal Reserve, plans for reopening the economy and improving infection data boosted stocks in April (+13%) and May (+5%). In June and July, the index gained amid progress on potential treatments and signs of an early recovery in economic activity. For the full 12 months, growth stocks widely topped value, while large-caps handily bested smaller-caps. The information technology sector (+39%) led the way, followed by consumer discretionary (+22%). In contrast, energy (-38%) fell hard along with the price of crude oil.
Comments from the Geode Capital Management, LLC, passive equity index team: For the fiscal year ending July 31, 2020, the fund gained 20.14%, roughly in line with the 20.16% advance of the benchmark Fidelity SAI U.S. Quality Index Fund Linked Index. By sector, information technology rose about 29% and contributed most, followed by health care, which gained approximately 23%, benefiting from the pharmaceuticals, biotechnology & life sciences industry (+24%). The communication services sector rose roughly 24%, boosted by the media & entertainment industry (+24%), and consumer discretionary (+13%) also contributed. Other notable contributors included consumer staples (+7%), lifted by the household & personal products industry (+15%), and financials (+13%), driven by the diversified financials industry (+15%). Industrials (+12%) also helped, boosted by the capital goods industry (+13%). Conversely, stocks in the real estate sector returned approximately -44% and detracted most. Turning to individual stocks, the top contributor was Apple (+101%), from the technology hardware & equipment industry. In software & services, Microsoft (+52%) was helpful and Alphabet (+22%) from the media & entertainment category also contributed. AbbVie, within the pharmaceuticals, biotechnology & life sciences group, rose 50%, and Home Depot, within the retailing segment, gained 27% and boosted the fund. Conversely, the biggest individual detractor was Simon Property Group (-59%), from the real estate sector. In software & services, Automatic Data Processing (-18%) and Accenture (-9%) hurt. 3M, within the capital goods group, returned roughly -6% and hindered the fund. Another detractor was Aon (-20%), a stock in the insurance category.
The views expressed above reflect those of the portfolio manager(s) only through the end of the period as stated on the cover of this report and do not necessarily represent the views of Fidelity or any other person in the Fidelity organization. Any such views are subject to change at any time based upon market or other conditions and Fidelity disclaims any responsibility to update such views. These views may not be relied on as investment advice and, because investment decisions for a Fidelity fund are based on numerous factors, may not be relied on as an indication of trading intent on behalf of any Fidelity fund.
Investment Summary (Unaudited)
Top Five Stocks as of July 31, 2020
| | % of fund's net assets |
| Apple, Inc. | 9.4 |
| Microsoft Corp. | 8.1 |
| Alphabet, Inc. Class A | 5.8 |
| Facebook, Inc. Class A | 5.1 |
| Procter & Gamble Co. | 4.2 |
| | 32.6 |
Top Five Market Sectors as of July 31, 2020
| | % of fund's net assets |
| Information Technology | 37.1 |
| Health Care | 19.3 |
| Consumer Staples | 11.5 |
| Communication Services | 11.0 |
| Consumer Discretionary | 7.4 |
Asset Allocation (% of fund's net assets)
| As of July 31, 2020 * |
| | Stocks and Equity Futures | 100.0% |

* Foreign investments - 1.7%
Schedule of Investments July 31, 2020
Showing Percentage of Net Assets
| Common Stocks - 99.8% | | | |
| | | Shares | Value |
| COMMUNICATION SERVICES - 11.0% | | | |
| Interactive Media & Services - 11.0% | | | |
| Alphabet, Inc. Class A (a) | | 323,998 | $482,092,824 |
| Facebook, Inc. Class A (a) | | 1,664,984 | 422,356,491 |
| Match Group, Inc. (a) | | 100,284 | 10,299,167 |
| | | | 914,748,482 |
| CONSUMER DISCRETIONARY - 7.4% | | | |
| Auto Components - 0.1% | | | |
| Gentex Corp. | | 470,325 | 12,694,072 |
| Diversified Consumer Services - 0.1% | | | |
| Frontdoor, Inc. (a) | | 149,718 | 6,287,407 |
| Household Durables - 0.2% | | | |
| Garmin Ltd. | | 215,009 | 21,197,737 |
| Internet & Direct Marketing Retail - 2.2% | | | |
| Amazon.com, Inc. (a) | | 16,058 | 50,818,431 |
| The Booking Holdings, Inc. (a) | | 77,974 | 129,602,925 |
| | | | 180,421,356 |
| Specialty Retail - 3.9% | | | |
| The Home Depot, Inc. | | 1,226,850 | 325,716,407 |
| Textiles, Apparel & Luxury Goods - 0.9% | | | |
| NIKE, Inc. Class B | | 742,849 | 72,509,491 |
|
| TOTAL CONSUMER DISCRETIONARY | | | 618,826,470 |
|
| CONSUMER STAPLES - 11.5% | | | |
| Beverages - 0.9% | | | |
| Brown-Forman Corp. Class B (non-vtg.) | | 338,739 | 23,488,162 |
| Monster Beverage Corp. (a) | | 711,327 | 55,824,943 |
| | | | 79,313,105 |
| Food Products - 0.5% | | | |
| The Hershey Co. | | 276,330 | 40,181,145 |
| Household Products - 7.4% | | | |
| Clorox Co. | | 233,762 | 55,287,051 |
| Colgate-Palmolive Co. | | 1,520,432 | 117,377,350 |
| Kimberly-Clark Corp. | | 609,985 | 92,742,119 |
| Procter & Gamble Co. | | 2,672,457 | 350,412,562 |
| | | | 615,819,082 |
| Tobacco - 2.7% | | | |
| Philip Morris International, Inc. | | 2,898,032 | 222,597,838 |
|
| TOTAL CONSUMER STAPLES | | | 957,911,170 |
|
| FINANCIALS - 6.0% | | | |
| Capital Markets - 3.5% | | | |
| Ameriprise Financial, Inc. | | 236,222 | 36,290,786 |
| Eaton Vance Corp. (non-vtg.) | | 210,357 | 7,602,302 |
| FactSet Research Systems, Inc. | | 70,547 | 24,430,426 |
| LPL Financial | | 150,281 | 11,875,205 |
| MarketAxess Holdings, Inc. | | 70,661 | 36,510,539 |
| Moody's Corp. | | 302,482 | 85,088,187 |
| SEI Investments Co. | | 234,659 | 12,279,705 |
| T. Rowe Price Group, Inc. | | 435,459 | 60,136,888 |
| TD Ameritrade Holding Corp. | | 492,453 | 17,674,138 |
| | | | 291,888,176 |
| Insurance - 2.4% | | | |
| Aon PLC | | 436,207 | 89,518,401 |
| Erie Indemnity Co. Class A | | 34,350 | 7,217,622 |
| Primerica, Inc. | | 74,075 | 8,863,815 |
| Progressive Corp. | | 1,089,082 | 98,387,668 |
| | | | 203,987,506 |
| Thrifts & Mortgage Finance - 0.1% | | | |
| Essent Group Ltd. | | 186,049 | 6,666,136 |
|
| TOTAL FINANCIALS | | | 502,541,818 |
|
| HEALTH CARE - 19.3% | | | |
| Biotechnology - 7.5% | | | |
| AbbVie, Inc. | | 2,801,553 | 265,895,395 |
| Amgen, Inc. | | 1,103,483 | 269,989,186 |
| Biogen, Inc. (a) | | 336,127 | 92,330,726 |
| | | | 628,215,307 |
| Health Care Equipment & Supplies - 1.1% | | | |
| Edwards Lifesciences Corp. (a) | | 1,165,604 | 91,395,010 |
| Health Care Technology - 0.5% | | | |
| Cerner Corp. | | 585,313 | 40,649,988 |
| Life Sciences Tools & Services - 2.0% | | | |
| Bio-Techne Corp. | | 70,858 | 19,497,287 |
| Illumina, Inc. (a) | | 273,830 | 104,646,873 |
| Mettler-Toledo International, Inc. (a) | | 45,376 | 42,426,560 |
| | | | 166,570,720 |
| Pharmaceuticals - 8.2% | | | |
| Jazz Pharmaceuticals PLC (a) | | 105,180 | 11,385,735 |
| Merck & Co., Inc. | | 3,536,543 | 283,772,210 |
| Pfizer, Inc. | | 6,612,901 | 254,464,430 |
| Zoetis, Inc. Class A | | 887,199 | 134,570,344 |
| | | | 684,192,719 |
|
| TOTAL HEALTH CARE | | | 1,611,023,744 |
|
| INDUSTRIALS - 6.6% | | | |
| Aerospace & Defense - 2.1% | | | |
| Lockheed Martin Corp. | | 462,352 | 175,217,537 |
| Electrical Equipment - 0.6% | | | |
| Rockwell Automation, Inc. | | 215,309 | 46,967,505 |
| Industrial Conglomerates - 1.0% | | | |
| Roper Technologies, Inc. | | 184,352 | 79,723,022 |
| Machinery - 1.8% | | | |
| Allison Transmission Holdings, Inc. | | 221,674 | 8,281,741 |
| IDEX Corp. | | 141,411 | 23,307,361 |
| Illinois Tool Works, Inc. | | 544,957 | 100,811,595 |
| Snap-On, Inc. (b) | | 101,970 | 14,874,364 |
| | | | 147,275,061 |
| Professional Services - 0.1% | | | |
| Robert Half International, Inc. | | 218,569 | 11,118,605 |
| Road & Rail - 0.1% | | | |
| Landstar System, Inc. | | 73,370 | 8,934,999 |
| Trading Companies & Distributors - 0.9% | | | |
| Fastenal Co. | | 1,068,605 | 50,267,179 |
| W.W. Grainger, Inc. | | 81,371 | 27,790,638 |
| | | | 78,057,817 |
|
| TOTAL INDUSTRIALS | | | 547,294,546 |
|
| INFORMATION TECHNOLOGY - 37.1% | | | |
| Communications Equipment - 0.3% | | | |
| Arista Networks, Inc. (a)(b) | | 100,849 | 26,197,545 |
| IT Services - 9.8% | | | |
| Automatic Data Processing, Inc. | | 806,152 | 107,145,662 |
| MasterCard, Inc. Class A | | 1,009,882 | 311,578,893 |
| Paychex, Inc. | | 593,980 | 42,719,042 |
| VeriSign, Inc. (a) | | 192,489 | 40,746,072 |
| Visa, Inc. Class A (b) | | 1,659,558 | 315,979,843 |
| | | | 818,169,512 |
| Semiconductors & Semiconductor Equipment - 3.6% | | | |
| Intel Corp. | | 912,111 | 43,535,058 |
| Maxim Integrated Products, Inc. | | 481,068 | 32,755,920 |
| Texas Instruments, Inc. | | 1,741,189 | 222,088,657 |
| | | | 298,379,635 |
| Software - 14.0% | | | |
| Adobe, Inc. (a) | | 733,187 | 325,769,648 |
| Cadence Design Systems, Inc. (a) | | 496,731 | 54,267,862 |
| Check Point Software Technologies Ltd. (a) | | 217,944 | 27,319,280 |
| Fortinet, Inc. (a) | | 264,543 | 36,586,297 |
| Manhattan Associates, Inc. (a) | | 118,805 | 11,380,331 |
| Microsoft Corp. | | 3,304,499 | 677,455,340 |
| Paycom Software, Inc. (a) | | 91,203 | 25,935,397 |
| Qualys, Inc. (a) | | 61,977 | 7,652,920 |
| | | | 1,166,367,075 |
| Technology Hardware, Storage & Peripherals - 9.4% | | | |
| Apple, Inc. | | 1,834,664 | 779,805,586 |
|
| TOTAL INFORMATION TECHNOLOGY | | | 3,088,919,353 |
|
| REAL ESTATE - 0.9% | | | |
| Equity Real Estate Investment Trusts (REITs) - 0.6% | | | |
| Simon Property Group, Inc. | | 571,938 | 35,660,334 |
| Vornado Realty Trust | | 294,508 | 10,166,416 |
| | | | 45,826,750 |
| Real Estate Management & Development - 0.3% | | | |
| CBRE Group, Inc. (a) | | 624,580 | 27,362,850 |
|
| TOTAL REAL ESTATE | | | 73,189,600 |
|
| TOTAL COMMON STOCKS | | | |
| (Cost $6,259,190,127) | | | 8,314,455,183 |
| | | Principal Amount | Value |
|
| U.S. Treasury Obligations - 0.0% | | | |
| U.S. Treasury Bills, yield at date of purchase 0.13% 11/5/20 (c) | | | |
| (Cost $179,935) | | 180,000 | 179,955 |
| | | Shares | Value |
|
| Money Market Funds - 1.0% | | | |
| Fidelity Securities Lending Cash Central Fund 0.13% (d)(e) | | | |
| (Cost $82,978,300) | | 82,970,003 | 82,978,300 |
| TOTAL INVESTMENT IN SECURITIES - 100.8% | | | |
| (Cost $6,342,348,362) | | | 8,397,613,438 |
| NET OTHER ASSETS (LIABILITIES) - (0.8)% | | | (65,278,554) |
| NET ASSETS - 100% | | | $8,332,334,884 |
| Futures Contracts | | | | | |
| | Number of contracts | Expiration Date | Notional Amount | Value | Unrealized Appreciation/(Depreciation) |
| Purchased | | | | | |
| Equity Index Contracts | | | | | |
| CME E-mini S&P 500 Index Contracts (United States) | 111 | Sept. 2020 | $18,112,425 | $1,284,129 | $1,284,129 |
The notional amount of futures purchased as a percentage of Net Assets is 0.2%
Legend
(a) Non-income producing
(b) Security or a portion of the security is on loan at period end.
(c) Security or a portion of the security was pledged to cover margin requirements for futures contracts. At period end, the value of securities pledged amounted to $179,955.
(d) Affiliated fund that is generally available only to investment companies and other accounts managed by Fidelity Investments. The rate quoted is the annualized seven-day yield of the fund at period end. A complete unaudited listing of the fund's holdings as of its most recent quarter end is available upon request. In addition, each Fidelity Central Fund's financial statements, which are not covered by the Fund's Report of Independent Registered Public Accounting Firm, are available on the SEC's website or upon request.
(e) Investment made with cash collateral received from securities on loan.
Affiliated Central Funds
Information regarding fiscal year to date income earned by the Fund from investments in Fidelity Central Funds is as follows:
| Fund | Income earned |
| Fidelity Cash Central Fund | $331,246 |
| Fidelity Securities Lending Cash Central Fund | 603,410 |
| Total | $934,656 |
Amounts in the income column in the above table include any capital gain distributions from underlying funds, which are presented in the corresponding line-item in the Statement of Operations, if applicable. Amount for Fidelity Securities Lending Cash Central Fund represents the income earned on investing cash collateral, less rebates paid to borrowers and any lending agent fees associated with the loan, plus any premium payments received for lending certain types of securities.
Investment Valuation
The following is a summary of the inputs used, as of July 31, 2020, involving the Fund's assets and liabilities carried at fair value. The inputs or methodology used for valuing securities may not be an indication of the risk associated with investing in those securities. For more information on valuation inputs, and their aggregation into the levels used below, please refer to the Investment Valuation section in the accompanying Notes to Financial Statements.
| | Valuation Inputs at Reporting Date: |
| Description | Total | Level 1 | Level 2 | Level 3 |
| Investments in Securities: | | | | |
| Equities: | | | | |
| Communication Services | $914,748,482 | $914,748,482 | $-- | $-- |
| Consumer Discretionary | 618,826,470 | 618,826,470 | -- | -- |
| Consumer Staples | 957,911,170 | 957,911,170 | -- | -- |
| Financials | 502,541,818 | 502,541,818 | -- | -- |
| Health Care | 1,611,023,744 | 1,611,023,744 | -- | -- |
| Industrials | 547,294,546 | 547,294,546 | -- | -- |
| Information Technology | 3,088,919,353 | 3,088,919,353 | -- | -- |
| Real Estate | 73,189,600 | 73,189,600 | -- | -- |
| U.S. Government and Government Agency Obligations | 179,955 | -- | 179,955 | -- |
| Money Market Funds | 82,978,300 | 82,978,300 | -- | -- |
| Total Investments in Securities: | $8,397,613,438 | $8,397,433,483 | $179,955 | $-- |
| Derivative Instruments: | | | | |
| Assets | | | | |
| Futures Contracts | $1,284,129 | $1,284,129 | $-- | $-- |
| Total Assets | $1,284,129 | $1,284,129 | $-- | $-- |
| Total Derivative Instruments: | $1,284,129 | $1,284,129 | $-- | $-- |
Value of Derivative Instruments
The following table is a summary of the Fund's value of derivative instruments by primary risk exposure as of July 31, 2020. For additional information on derivative instruments, please refer to the Derivative Instruments section in the accompanying Notes to Financial Statements.
| Primary Risk Exposure / Derivative Type | Value |
| | Asset | Liability |
| Equity Risk | | |
| Futures Contracts(a) | $1,284,129 | $0 |
| Total Equity Risk | 1,284,129 | 0 |
| Total Value of Derivatives | $1,284,129 | $0 |
(a) Reflects gross cumulative appreciation (depreciation) on futures contracts as presented in the Schedule of Investments. In the Statement of Assets and Liabilities, the period end daily variation margin is included in receivable or payable for daily variation margin on futures contracts, and the net cumulative appreciation (depreciation) is included in Total accumulated earnings (loss).
See accompanying notes which are an integral part of the financial statements.
Financial Statements
Statement of Assets and Liabilities
| | | July 31, 2020 |
| Assets | | |
Investment in securities, at value (including securities loaned of $80,366,317) — See accompanying schedule:
Unaffiliated issuers (cost $6,259,370,062) | $8,314,635,138 | |
| Fidelity Central Funds (cost $82,978,300) | 82,978,300 | |
| Total Investment in Securities (cost $6,342,348,362) | | $8,397,613,438 |
| Segregated cash with brokers for derivative instruments | | 2,245,854 |
| Receivable for investments sold | | 44,909,262 |
| Receivable for fund shares sold | | 3,730,273 |
| Dividends receivable | | 12,128,977 |
| Distributions receivable from Fidelity Central Funds | | 45,540 |
| Receivable for daily variation margin on futures contracts | | 148,133 |
| Prepaid expenses | | 1,309 |
| Total assets | | 8,460,822,786 |
| Liabilities | | |
| Payable to custodian bank | $479,814 | |
| Payable for investments purchased | 15,163,617 | |
| Payable for fund shares redeemed | 3,656,652 | |
| Accrued management fee | 698,623 | |
| Notes payable to affiliates | 25,482,000 | |
| Other payables and accrued expenses | 42,221 | |
| Collateral on securities loaned | 82,964,975 | |
| Total liabilities | | 128,487,902 |
| Net Assets | | $8,332,334,884 |
| Net Assets consist of: | | |
| Paid in capital | | $5,816,292,650 |
| Total accumulated earnings (loss) | | 2,516,042,234 |
| Net Assets | | $8,332,334,884 |
| Net Asset Value, offering price and redemption price per share ($8,332,334,884 ÷ 522,099,741 shares) | | $15.96 |
See accompanying notes which are an integral part of the financial statements.
Statement of Operations
| | | Year ended July 31, 2020 |
| Investment Income | | |
| Dividends | | $174,433,853 |
| Interest | | 15,616 |
| Income from Fidelity Central Funds (including $603,410 from security lending) | | 934,656 |
| Total income | | 175,384,125 |
| Expenses | | |
| Management fee | $9,092,629 | |
| Custodian fees and expenses | 111,789 | |
| Independent trustees' fees and expenses | 32,156 | |
| Registration fees | 175,184 | |
| Audit | 54,189 | |
| Legal | 14,384 | |
| Interest | 75,627 | |
| Miscellaneous | 53,242 | |
| Total expenses before reductions | 9,609,200 | |
| Expense reductions | (8,515) | |
| Total expenses after reductions | | 9,600,685 |
| Net investment income (loss) | | 165,783,440 |
| Realized and Unrealized Gain (Loss) | | |
| Net realized gain (loss) on: | | |
| Investment securities: | | |
| Unaffiliated issuers | 571,430,557 | |
| Fidelity Central Funds | (3,370) | |
| Futures contracts | 10,907,796 | |
| Total net realized gain (loss) | | 582,334,983 |
| Change in net unrealized appreciation (depreciation) on: | | |
| Investment securities: | | |
| Unaffiliated issuers | 807,397,753 | |
| Fidelity Central Funds | (118) | |
| Futures contracts | 1,194,910 | |
| Total change in net unrealized appreciation (depreciation) | | 808,592,545 |
| Net gain (loss) | | 1,390,927,528 |
| Net increase (decrease) in net assets resulting from operations | | $1,556,710,968 |
See accompanying notes which are an integral part of the financial statements.
Statement of Changes in Net Assets
| | Year ended July 31, 2020 | Year ended July 31, 2019 |
| Increase (Decrease) in Net Assets | | |
| Operations | | |
| Net investment income (loss) | $165,783,440 | $133,760,106 |
| Net realized gain (loss) | 582,334,983 | 968,738,185 |
| Change in net unrealized appreciation (depreciation) | 808,592,545 | (345,749,271) |
| Net increase (decrease) in net assets resulting from operations | 1,556,710,968 | 756,749,020 |
| Distributions to shareholders | (1,171,850,303) | (197,565,929) |
| Share transactions | | |
| Proceeds from sales of shares | 2,521,381,744 | 1,813,165,441 |
| Reinvestment of distributions | 869,380,021 | 138,985,268 |
| Cost of shares redeemed | (4,176,043,929) | (1,026,220,857) |
| Net increase (decrease) in net assets resulting from share transactions | (785,282,164) | 925,929,852 |
| Total increase (decrease) in net assets | (400,421,499) | 1,485,112,943 |
| Net Assets | | |
| Beginning of period | 8,732,756,383 | 7,247,643,440 |
| End of period | $8,332,334,884 | $8,732,756,383 |
| Other Information | | |
| Shares | | |
| Sold | 178,961,257 | 127,001,447 |
| Issued in reinvestment of distributions | 63,065,977 | 9,901,495 |
| Redeemed | (294,683,737) | (71,472,984) |
| Net increase (decrease) | (52,656,503) | 65,429,958 |
See accompanying notes which are an integral part of the financial statements.
Financial Highlights
Fidelity SAI U.S. Quality Index Fund
| | | | | | |
| Years ended July 31, | 2020 | 2019 | 2018 | 2017 | 2016 A |
| Selected Per–Share Data | | | | | |
| Net asset value, beginning of period | $15.19 | $14.23 | $12.27 | $10.87 | $10.00 |
| Income from Investment Operations | | | | | |
| Net investment income (loss)B | .26 | .25 | .21 | .21 | .13 |
| Net realized and unrealized gain (loss) | 2.45 | 1.10 | 2.25 | 1.36 | .77 |
| Total from investment operations | 2.71 | 1.35 | 2.46 | 1.57 | .90 |
| Distributions from net investment income | (.24) | (.19) | (.19) | (.14) | (.03) |
| Distributions from net realized gain | (1.69) | (.20) | (.31) | (.03) | – |
| Total distributions | (1.94)C | (.39) | (.50) | (.17) | (.03) |
| Net asset value, end of period | $15.96 | $15.19 | $14.23 | $12.27 | $10.87 |
| Total ReturnD,E | 20.14% | 9.70% | 20.71% | 14.70% | 9.01% |
| Ratios to Average Net AssetsF,G | | | | | |
| Expenses before reductions | .11% | .19% | .20% | .21% | .25%H |
| Expenses net of fee waivers, if any | .11% | .15% | .15% | .15% | .15%H |
| Expenses net of all reductions | .11% | .15% | .15% | .15% | .15%H |
| Net investment income (loss) | 1.83% | 1.76% | 1.55% | 1.84% | 1.56%H |
| Supplemental Data | | | | | |
| Net assets, end of period (000 omitted) | $8,332,335 | $8,732,756 | $7,247,643 | $5,093,881 | $3,598,609 |
| Portfolio turnover rateI | 60% | 99% | 34% | 31% | 25%H |
A For the period October 8, 2015 (commencement of operations) to July 31, 2016.
B Calculated based on average shares outstanding during the period.
C Total distributions of $1.94 per share is comprised of distributions from net investment income of $.244 and distributions from net realized gain of $1.693 per share.
D Total returns for periods of less than one year are not annualized.
E Total returns would have been lower if certain expenses had not been reduced during the applicable periods shown.
F Fees and expenses of any underlying mutual funds or exchange-traded funds (ETFs) are not included in the Fund's expense ratio. The Fund indirectly bears its proportionate share of these expenses. For additional expense information related to investments in Fidelity Central Funds, please refer to the "Investments in Fidelity Central Funds" note found in the Notes to Financial Statements section of the most recent Annual or Semi-Annual report.
G Expense ratios reflect operating expenses of the Fund. Expenses before reductions do not reflect amounts reimbursed by the investment adviser or reductions from expense offset arrangements and do not represent the amount paid by the Fund during periods when reimbursements or reductions occur. Expense ratios before reductions for start-up periods may not be representative of longer term operating periods. Expenses net of fee waivers reflect expenses after reimbursement by the investment adviser but prior to reductions from expense offset arrangements. Expenses net of all reductions represent the net expenses paid by the Fund.
H Annualized
I Amount does not include the portfolio activity of any underlying Fidelity Central Funds.
See accompanying notes which are an integral part of the financial statements.
Notes to Financial Statements
For the period ended July 31, 2020
1. Organization.
Fidelity SAI U.S. Quality Index Fund (the Fund) is a fund of Fidelity Salem Street Trust (the Trust) and is authorized to issue an unlimited number of shares. Shares are offered exclusively to certain clients of Fidelity Management & Research Company LLC (FMR) or its affiliates. The Trust is registered under the Investment Company Act of 1940, as amended (the 1940 Act), as an open-end management investment company organized as a Massachusetts business trust.
Effective January 1, 2020:
Investment advisers Fidelity Investments Money Management, Inc., FMR Co., Inc., and Fidelity SelectCo, LLC, merged with and into Fidelity Management & Research Company. In connection with the merger transactions, the resulting, merged investment adviser was then redomiciled from Massachusetts to Delaware, changed its corporate structure from a corporation to a limited liability company, and changed its name to "Fidelity Management & Research Company LLC".
2. Investments in Fidelity Central Funds.
The Fund invests in Fidelity Central Funds, which are open-end investment companies generally available only to other investment companies and accounts managed by the investment adviser and its affiliates. The Fund's Schedule of Investments lists each of the Fidelity Central Funds held as of period end, if any, as an investment of the Fund, but does not include the underlying holdings of each Fidelity Central Fund. As an Investing Fund, the Fund indirectly bears its proportionate share of the expenses of the underlying Fidelity Central Funds.
The Money Market Central Funds seek preservation of capital and current income and are managed by the investment adviser. Annualized expenses of the Money Market Central Funds as of their most recent shareholder report date ranged from less than .005% to .01%.
A complete unaudited list of holdings for each Fidelity Central Fund is available upon request or at the Securities and Exchange Commission (the SEC) website at www.sec.gov. In addition, the financial statements of the Fidelity Central Funds, which are not covered by the Fund's Report of Independent Registered Public Accounting Firm, are available on the SEC website or upon request.
3. Significant Accounting Policies.
The Fund is an investment company and applies the accounting and reporting guidance of the Financial Accounting Standards Board (FASB) Accounting Standards Codification Topic 946 Financial Services – Investment Companies. The financial statements have been prepared in conformity with accounting principles generally accepted in the United States of America (GAAP), which require management to make certain estimates and assumptions at the date of the financial statements. Actual results could differ from those estimates. Subsequent events, if any, through the date that the financial statements were issued have been evaluated in the preparation of the financial statements. The following summarizes the significant accounting policies of the Fund:
Investment Valuation. Investments are valued as of 4:00 p.m. Eastern time on the last calendar day of the period. The Board of Trustees (the Board) has delegated the day to day responsibility for the valuation of the Fund's investments to the Fair Value Committee (the Committee) established by the Fund's investment adviser. In accordance with valuation policies and procedures approved by the Board, the Fund attempts to obtain prices from one or more third party pricing vendors or brokers to value its investments. When current market prices, quotations or currency exchange rates are not readily available or reliable, investments will be fair valued in good faith by the Committee, in accordance with procedures adopted by the Board. Factors used in determining fair value vary by investment type and may include market or investment specific events, changes in interest rates and credit quality. The frequency with which these procedures are used cannot be predicted and they may be utilized to a significant extent. The Committee oversees the Fund's valuation policies and procedures and reports to the Board on the Committee's activities and fair value determinations. The Board monitors the appropriateness of the procedures used in valuing the Fund's investments and ratifies the fair value determinations of the Committee.
The Fund categorizes the inputs to valuation techniques used to value its investments into a disclosure hierarchy consisting of three levels as shown below:
- Level 1 – quoted prices in active markets for identical investments
- Level 2 – other significant observable inputs (including quoted prices for similar investments, interest rates, prepayment speeds, etc.)
- Level 3 – unobservable inputs (including the Fund's own assumptions based on the best information available)
Valuation techniques used to value the Fund's investments by major category are as follows:
Equity securities, including restricted securities, for which market quotations are readily available, are valued at the last reported sale price or official closing price as reported by a third party pricing vendor on the primary market or exchange on which they are traded and are categorized as Level 1 in the hierarchy. In the event there were no sales during the day or closing prices are not available, securities are valued at the last quoted bid price or may be valued using the last available price and are generally categorized as Level 2 in the hierarchy. For foreign equity securities, when market or security specific events arise, comparisons to the valuation of American Depositary Receipts (ADRs), futures contracts, Exchange-Traded Funds (ETFs) and certain indexes as well as quoted prices for similar securities may be used and would be categorized as Level 2 in the hierarchy. For equity securities, including restricted securities, where observable inputs are limited, assumptions about market activity and risk are used and these securities may be categorized as Level 3 in the hierarchy.
Debt securities, including restricted securities, are valued based on evaluated prices received from third party pricing vendors or from brokers who make markets in such securities. U.S. government and government agency obligations are valued by pricing vendors who utilize matrix pricing which considers yield or price of bonds of comparable quality, coupon, maturity and type or by broker-supplied prices. When independent prices are unavailable or unreliable, debt securities may be valued utilizing pricing methodologies which consider similar factors that would be used by third party pricing vendors. Debt securities are generally categorized as Level 2 in the hierarchy but may be Level 3 depending on the circumstances.
Futures contracts are valued at the settlement price established each day by the board of trade or exchange on which they are traded and are categorized as Level 1 in the hierarchy. Investments in open-end mutual funds, including the Fidelity Central Funds, are valued at their closing net asset value (NAV) each business day and are categorized as Level 1 in the hierarchy
Changes in valuation techniques may result in transfers in or out of an assigned level within the disclosure hierarchy. The aggregate value of investments by input level as of July 31, 2020 is included at the end of the Fund's Schedule of Investments.
Investment Transactions and Income. For financial reporting purposes, the Fund's investment holdings and NAV include trades executed through the end of the last business day of the period. The NAV per share for processing shareholder transactions is calculated as of the close of business of the New York Stock Exchange (NYSE), normally 4:00 p.m. Eastern time and includes trades executed through the end of the prior business day. Gains and losses on securities sold are determined on the basis of identified cost. Dividend income is recorded on the ex-dividend date. Non-cash dividends included in dividend income, if any, are recorded at the fair market value of the securities received. Income and capital gain distributions from Fidelity Central Funds, if any, are recorded on the ex-dividend date. Certain distributions received by the Fund represent a return of capital or capital gain. The Fund determines the components of these distributions subsequent to the ex-dividend date, based upon receipt of tax filings or other correspondence relating to the underlying investment. These distributions are recorded as a reduction of cost of investments and/or as a realized gain. Interest income is accrued as earned and includes coupon interest and amortization of premium and accretion of discount on debt securities as applicable.
Expenses. Expenses directly attributable to a fund are charged to that fund. Expenses attributable to more than one fund are allocated among the respective funds on the basis of relative net assets or other appropriate methods. Expense estimates are accrued in the period to which they relate and adjustments are made when actual amounts are known.
Income Tax Information and Distributions to Shareholders. Each year, the Fund intends to qualify as a regulated investment company under Subchapter M of the Internal Revenue Code, including distributing substantially all of its taxable income and realized gains. As a result, no provision for U.S. Federal income taxes is required. As of July 31, 2020, the Fund did not have any unrecognized tax benefits in the financial statements; nor is the Fund aware of any tax positions for which it is reasonably possible that the total amounts of unrecognized tax benefits will significantly change in the next twelve months. The Fund files a U.S. federal tax return, in addition to state and local tax returns as required. The Fund's federal income tax returns are subject to examination by the Internal Revenue Service (IRS) for a period of three fiscal years after they are filed. State and local tax returns may be subject to examination for an additional fiscal year depending on the jurisdiction.
Distributions are declared and recorded on the ex-dividend date. Income and capital gain distributions are determined in accordance with income tax regulations, which may differ from GAAP. In addition, the Fund claimed a portion of the payment made to redeeming shareholders as a distribution for income tax purposes.
Capital accounts within the financial statements are adjusted for permanent book-tax differences. These adjustments have no impact on net assets or the results of operations. Capital accounts are not adjusted for temporary book-tax differences which will reverse in a subsequent period.
Book-tax differences are primarily due to futures contracts, market discount, partnerships and losses deferred due to wash sales.
As of period end, the cost and unrealized appreciation (depreciation) in securities, and derivatives if applicable, for federal income tax purposes were as follows:
| Gross unrealized appreciation | $2,213,182,675 |
| Gross unrealized depreciation | (173,591,438) |
| Net unrealized appreciation (depreciation) | $2,039,591,237 |
| Tax Cost | $6,358,022,201 |
The tax-based components of distributable earnings as of period end were as follows:
| Undistributed ordinary income | $93,689,724 |
| Undistributed long-term capital gain | $382,761,271 |
| Net unrealized appreciation (depreciation) on securities and other investments | $2,039,591,237 |
The tax character of distributions paid was as follows:
| | July 31, 2020 | July 31, 2019 |
| Ordinary Income | $337,926,456 | $ 125,627,312 |
| Long-term Capital Gains | 833,923,847 | 71,938,617 |
| Total | $1,171,850,303 | $ 197,565,929 |
4. Derivative Instruments.
Risk Exposures and the Use of Derivative Instruments. The Fund's investment objective allows the Fund to enter into various types of derivative contracts, including futures contracts. Derivatives are investments whose value is primarily derived from underlying assets, indices or reference rates and may be transacted on an exchange or over-the-counter (OTC). Derivatives may involve a future commitment to buy or sell a specified asset based on specified terms, to exchange future cash flows at periodic intervals based on a notional principal amount, or for one party to make one or more payments upon the occurrence of specified events in exchange for periodic payments from the other party.
The Fund used derivatives to increase returns and to manage exposure to certain risks as defined below. The success of any strategy involving derivatives depends on analysis of numerous economic factors, and if the strategies for investment do not work as intended, the Fund may not achieve its objectives.
The Fund's use of derivatives increased or decreased its exposure to the following risk:
| Equity Risk | Equity risk relates to the fluctuations in the value of financial instruments as a result of changes in market prices (other than those arising from interest rate risk or foreign exchange risk), whether caused by factors specific to an individual investment, its issuer, or all factors affecting all instruments traded in a market or market segment.
|
The Fund is also exposed to additional risks from investing in derivatives, such as liquidity risk and counterparty credit risk. Liquidity risk is the risk that the Fund will be unable to close out the derivative in the open market in a timely manner. Counterparty credit risk is the risk that the counterparty will not be able to fulfill its obligation to the Fund. Counterparty credit risk related to exchange-traded futures contracts may be mitigated by the protection provided by the exchange on which they trade.
Investing in derivatives may involve greater risks than investing in the underlying assets directly and, to varying degrees, may involve risk of loss in excess of any initial investment and collateral received and amounts recognized in the Statement of Assets and Liabilities. In addition, there may be the risk that the change in value of the derivative contract does not correspond to the change in value of the underlying instrument.
Futures Contracts. A futures contract is an agreement between two parties to buy or sell a specified underlying instrument for a fixed price at a specified future date. The Fund used futures contracts to manage its exposure to the stock market.
Upon entering into a futures contract, a fund is required to deposit either cash or securities (initial margin) with a clearing broker in an amount equal to a certain percentage of the face value of the contract. Futures contracts are marked-to-market daily and subsequent daily payments (variation margin) are made or received by a fund depending on the daily fluctuations in the value of the futures contracts and are recorded as unrealized appreciation or (depreciation). This receivable and/or payable, if any, is included in daily variation margin on futures contracts in the Statement of Assets and Liabilities. Realized gain or (loss) is recorded upon the expiration or closing of a futures contract. The net realized gain (loss) and change in net unrealized appreciation (depreciation) on futures contracts during the period is presented in the Statement of Operations.
Any open futures contracts at period end are presented in the Schedule of Investments under the caption "Futures Contracts". The notional amount at value reflects each contract's exposure to the underlying instrument or index at period end and is representative of volume of activity during the period. Securities deposited to meet initial margin requirements are identified in the Schedule of Investments. Cash deposited to meet initial margin requirements is presented as segregated cash with brokers for derivative instruments in the Statement of Assets and Liabilities.
5. Purchases and Sales of Investments.
Purchases and sales of securities, other than short-term securities are noted in the table below.
| | Purchases ($) | Sales ($) |
| Fidelity SAI U.S. Quality Index Fund | 5,357,409,397 | 7,125,019,444 |
6. Fees and Other Transactions with Affiliates.
Management Fee. Fidelity Management & Research Company LLC (the investment adviser) and its affiliates provide the Fund with investment management related services for which the Fund pays a monthly management fee that is based on an annual rate of .10% of the Fund's average net assets.
Sub-Adviser. Geode Capital Management, LLC (Geode), serves as sub-adviser for the Fund. Geode provides discretionary investment advisory services to the Fund and is paid by the investment adviser for providing these services.
Interfund Lending Program. Pursuant to an Exemptive Order issued by the SEC, the fund, along with other registered investment companies having management contracts with Fidelity Management & Research Company LLC (FMR), or other affiliated entities of FMR, may participate in an interfund lending program. This program provides an alternative credit facility allowing the fund to borrow from, or lend money to, other participating affiliated funds. Any open loans, including accrued interest, at period end are presented under the caption "Notes payable to affiliates" in the Statement of Assets and Liabilities. Activity in this program during the period for which loans were outstanding was as follows:
| | Borrower or Lender | Average Loan Balance | Weighted Average Interest Rate | Interest Expense |
| Fidelity SAI U.S. Quality Index Fund | Borrower | $77,162,017 | .61% | $75,627 |
Interfund Trades. Funds may purchase from or sell securities to other Fidelity Funds under procedures adopted by the Board. The procedures have been designed to ensure these interfund trades are executed in accordance with Rule 17a-7 of the 1940 Act. Interfund trades are included within the respective purchases and sales amounts shown in the Purchases and Sales of Investments note.
7. Committed Line of Credit.
Certain Funds participate with other funds managed by the investment adviser or an affiliate in a $4.25 billion credit facility (the "line of credit") to be utilized for temporary or emergency purposes to fund shareholder redemptions or for other short-term liquidity purposes. The participating funds have agreed to pay commitment fees on their pro-rata portion of the line of credit, which are reflected in Miscellaneous expenses on the Statement of Operations, and are as follows:
| | Amount |
| Fidelity SAI U.S. Quality Index Fund | $22,232 |
During the period, there were no borrowings on this line of credit.
8. Security Lending.
The Fund lends portfolio securities from time to time in order to earn additional income. Lending agents are used, including National Financial Services (NFS), an affiliate of the Fund. Pursuant to a securities lending agreement, NFS will receive a fee, which is capped at 9.9% of daily lending revenue, for its services as lending agent. The Fund may lend securities to certain qualified borrowers, including NFS. On the settlement date of the loan, the Fund receives collateral (in the form of U.S. Treasury obligations, letters of credit and/or cash) against the loaned securities and maintains collateral in an amount not less than 100% of the market value of the loaned securities during the period of the loan. The market value of the loaned securities is determined at the close of business of the Fund and any additional required collateral is delivered to the Fund on the next business day. The Fund or borrower may terminate the loan at any time, and if the borrower defaults on its obligation to return the securities loaned because of insolvency or other reasons, the Fund may apply collateral received from the borrower against the obligation. The Fund may experience delays and costs in recovering the securities loaned. Any cash collateral received is invested in the Fidelity Securities Lending Cash Central Fund. The value of loaned securities and cash collateral at period end are disclosed on the Fund's Statement of Assets and Liabilities. At period end, there were no security loans outstanding with NFS, as affiliated borrower. Total fees paid by the Fund to NFS, as lending agent, amounted to $59,998. Security lending income represents the income earned on investing cash collateral, less rebates paid to borrowers and any lending agent fees associated with the loan, plus any premium payments received for lending certain types of securities. Net income from the Fidelity Securities Lending Cash Central Fund during the period is presented in the Statement of Operations as a component of income from Fidelity Central Funds (and includes $105 from securities loaned to NFS, as affiliated borrower).
9. Expense Reductions.
Through arrangements with the Fund's custodian, credits realized as a result of certain uninvested cash balances were used to reduce the Fund's expenses by $8,515.
10. Other.
The Fund's organizational documents provide former and current trustees and officers with a limited indemnification against liabilities arising in connection with the performance of their duties to the Fund. In the normal course of business, the Fund may also enter into contracts that provide general indemnifications. The Fund's maximum exposure under these arrangements is unknown as this would be dependent on future claims that may be made against the Fund. The risk of material loss from such claims is considered remote.
At the end of the period, Strategic Advisers Core Fund and Strategic Advisers Fidelity U.S. Total Stock Fund were the owners of record of approximately 25% and 49%, respectively, of the total outstanding shares of the Fund.
11. Coronavirus (COVID-19) Pandemic.
An outbreak of COVID-19 first detected in China during December 2019 has since spread globally and was declared a pandemic by the World Health Organization during March 2020. Developments that disrupt global economies and financial markets, such as the COVID-19 pandemic, may magnify factors that affect the Fund's performance.
Report of Independent Registered Public Accounting Firm
To the Board of Trustees of Fidelity Salem Street Trust and Shareholders of Fidelity SAI U.S. Quality Index Fund
Opinion on the Financial Statements and Financial Highlights
We have audited the accompanying statement of assets and liabilities of Fidelity SAI U.S. Quality Index Fund (the "Fund"), a fund of Fidelity Salem Street Trust, including the schedule of investments, as of July 31, 2020, the related statement of operations for the year then ended, the statement of changes in net assets for each of the two years in the period then ended, the financial highlights for each of the four years in the period then ended and for the period from October 8, 2015 (commencement of operations) through July 31, 2016, and the related notes. In our opinion, the financial statements and financial highlights present fairly, in all material respects, the financial position of the Fund as of July 31, 2020, and the results of its operations for the year then ended, the changes in its net assets for each of the two years in the period then ended, and the financial highlights for each of the four years in the period then ended and for the period from October 8, 2015 (commencement of operations) through July 31, 2016 in conformity with accounting principles generally accepted in the United States of America.
Basis for Opinion
These financial statements and financial highlights are the responsibility of the Fund's management. Our responsibility is to express an opinion on the Fund's financial statements and financial highlights based on our audits. We are a public accounting firm registered with the Public Company Accounting Oversight Board (United States) (PCAOB) and are required to be independent with respect to the Fund in accordance with the U.S. federal securities laws and the applicable rules and regulations of the Securities and Exchange Commission and the PCAOB.
We conducted our audits in accordance with the standards of the PCAOB. Those standards require that we plan and perform the audit to obtain reasonable assurance about whether the financial statements and financial highlights are free of material misstatement, whether due to error or fraud. The Fund is not required to have, nor were we engaged to perform, an audit of its internal control over financial reporting. As part of our audits we are required to obtain an understanding of internal control over financial reporting but not for the purpose of expressing an opinion on the effectiveness of the Fund’s internal control over financial reporting. Accordingly, we express no such opinion.
Our audits included performing procedures to assess the risks of material misstatement of the financial statements and financial highlights, whether due to error or fraud, and performing procedures that respond to those risks. Such procedures included examining, on a test basis, evidence regarding the amounts and disclosures in the financial statements and financial highlights. Our audits also included evaluating the accounting principles used and significant estimates made by management, as well as evaluating the overall presentation of the financial statements and financial highlights. Our procedures included confirmation of securities owned as of July 31, 2020, by correspondence with the custodian and brokers; when replies were not received from brokers, we performed other auditing procedures. We believe that our audits provide a reasonable basis for our opinion.
/s/ Deloitte & Touche LLP
Boston, Massachusetts
September 14, 2020
We have served as the auditor of one or more of the Fidelity investment companies since 1999.
Trustees and Officers
The Trustees, Members of the Advisory Board (if any), and officers of the trust and fund, as applicable, are listed below. The Board of Trustees governs the fund and is responsible for protecting the interests of shareholders. The Trustees are experienced executives who meet periodically throughout the year to oversee the fund's activities, review contractual arrangements with companies that provide services to the fund, oversee management of the risks associated with such activities and contractual arrangements, and review the fund's performance. Except for Jonathan Chiel, each of the Trustees oversees 280 funds. Mr. Chiel oversees 174 funds.
The Trustees hold office without limit in time except that (a) any Trustee may resign; (b) any Trustee may be removed by written instrument, signed by at least two-thirds of the number of Trustees prior to such removal; (c) any Trustee who requests to be retired or who has become incapacitated by illness or injury may be retired by written instrument signed by a majority of the other Trustees; and (d) any Trustee may be removed at any special meeting of shareholders by a two-thirds vote of the outstanding voting securities of the trust. Each Trustee who is not an interested person (as defined in the 1940 Act) of the trust and the fund is referred to herein as an Independent Trustee. Each Independent Trustee shall retire not later than the last day of the calendar year in which his or her 75th birthday occurs. The Independent Trustees may waive this mandatory retirement age policy with respect to individual Trustees. Officers and Advisory Board Members hold office without limit in time, except that any officer or Advisory Board Member may resign or may be removed by a vote of a majority of the Trustees at any regular meeting or any special meeting of the Trustees. Except as indicated, each individual has held the office shown or other offices in the same company for the past five years.
The fund’s Statement of Additional Information (SAI) includes more information about the Trustees. To request a free copy, call Fidelity at 1-800-544-3455.
Experience, Skills, Attributes, and Qualifications of the Trustees. The Governance and Nominating Committee has adopted a statement of policy that describes the experience, qualifications, attributes, and skills that are necessary and desirable for potential Independent Trustee candidates (Statement of Policy). The Board believes that each Trustee satisfied at the time he or she was initially elected or appointed a Trustee, and continues to satisfy, the standards contemplated by the Statement of Policy. The Governance and Nominating Committee also engages professional search firms to help identify potential Independent Trustee candidates who have the experience, qualifications, attributes, and skills consistent with the Statement of Policy. From time to time, additional criteria based on the composition and skills of the current Independent Trustees, as well as experience or skills that may be appropriate in light of future changes to board composition, business conditions, and regulatory or other developments, have also been considered by the professional search firms and the Governance and Nominating Committee. In addition, the Board takes into account the Trustees' commitment and participation in Board and committee meetings, as well as their leadership of standing and ad hoc committees throughout their tenure.
In determining that a particular Trustee was and continues to be qualified to serve as a Trustee, the Board has considered a variety of criteria, none of which, in isolation, was controlling. The Board believes that, collectively, the Trustees have balanced and diverse experience, qualifications, attributes, and skills, which allow the Board to operate effectively in governing the fund and protecting the interests of shareholders. Information about the specific experience, skills, attributes, and qualifications of each Trustee, which in each case led to the Board's conclusion that the Trustee should serve (or continue to serve) as a trustee of the fund, is provided below.
Board Structure and Oversight Function. Abigail P. Johnson is an interested person and currently serves as Chairman. The Trustees have determined that an interested Chairman is appropriate and benefits shareholders because an interested Chairman has a personal and professional stake in the quality and continuity of services provided to the fund. Independent Trustees exercise their informed business judgment to appoint an individual of their choosing to serve as Chairman, regardless of whether the Trustee happens to be independent or a member of management. The Independent Trustees have determined that they can act independently and effectively without having an Independent Trustee serve as Chairman and that a key structural component for assuring that they are in a position to do so is for the Independent Trustees to constitute a substantial majority for the Board. The Independent Trustees also regularly meet in executive session. Arthur E. Johnson serves as Chairman of the Independent Trustees and as such (i) acts as a liaison between the Independent Trustees and management with respect to matters important to the Independent Trustees and (ii) with management prepares agendas for Board meetings.
Fidelity® funds are overseen by different Boards of Trustees. The fund's Board oversees Fidelity's investment-grade bond, money market, asset allocation and certain equity funds, and other Boards oversee Fidelity's high income and other equity funds. The asset allocation funds may invest in Fidelity® funds that are overseen by such other Boards. The use of separate Boards, each with its own committee structure, allows the Trustees of each group of Fidelity® funds to focus on the unique issues of the funds they oversee, including common research, investment, and operational issues. On occasion, the separate Boards establish joint committees to address issues of overlapping consequences for the Fidelity® funds overseen by each Board.
The Trustees operate using a system of committees to facilitate the timely and efficient consideration of all matters of importance to the Trustees, the fund, and fund shareholders and to facilitate compliance with legal and regulatory requirements and oversight of the fund's activities and associated risks. The Board, acting through its committees, has charged FMR and its affiliates with (i) identifying events or circumstances the occurrence of which could have demonstrably adverse effects on the fund's business and/or reputation; (ii) implementing processes and controls to lessen the possibility that such events or circumstances occur or to mitigate the effects of such events or circumstances if they do occur; and (iii) creating and maintaining a system designed to evaluate continuously business and market conditions in order to facilitate the identification and implementation processes described in (i) and (ii) above. Because the day-to-day operations and activities of the fund are carried out by or through FMR, its affiliates, and other service providers, the fund's exposure to risks is mitigated but not eliminated by the processes overseen by the Trustees. While each of the Board's committees has responsibility for overseeing different aspects of the fund's activities, oversight is exercised primarily through the Operations and Audit Committees. In addition, an ad hoc Board committee of Independent Trustees has worked with FMR to enhance the Board's oversight of investment and financial risks, legal and regulatory risks, technology risks, and operational risks, including the development of additional risk reporting to the Board. Appropriate personnel, including but not limited to the fund's Chief Compliance Officer (CCO), FMR's internal auditor, the independent accountants, the fund's Treasurer and portfolio management personnel, make periodic reports to the Board's committees, as appropriate, including an annual review of Fidelity's risk management program for the Fidelity® funds. The responsibilities of each standing committee, including their oversight responsibilities, are described further under "Standing Committees of the Trustees."
Interested Trustees*:
Correspondence intended for a Trustee who is an interested person may be sent to Fidelity Investments, 245 Summer Street, Boston, Massachusetts 02210.
Name, Year of Birth; Principal Occupations and Other Relevant Experience+
Jonathan Chiel (1957)
Year of Election or Appointment: 2016
Trustee
Mr. Chiel also serves as Trustee of other Fidelity® funds. Mr. Chiel is Executive Vice President and General Counsel for FMR LLC (diversified financial services company, 2012-present). Previously, Mr. Chiel served as general counsel (2004-2012) and senior vice president and deputy general counsel (2000-2004) for John Hancock Financial Services; a partner with Choate, Hall & Stewart (1996-2000) (law firm); and an Assistant United States Attorney for the United States Attorney’s Office of the District of Massachusetts (1986-95), including Chief of the Criminal Division (1993-1995). Mr. Chiel is a director on the boards of the Boston Bar Foundation and the Maimonides School.
Abigail P. Johnson (1961)
Year of Election or Appointment: 2009
Trustee
Chairman of the Board of Trustees
Ms. Johnson also serves as Trustee of other Fidelity® funds. Ms. Johnson serves as Chairman (2016-present), Chief Executive Officer (2014-present), and Director (2007-present) of FMR LLC (diversified financial services company), President of Fidelity Financial Services (2012-present) and President of Personal, Workplace and Institutional Services (2005-present). Ms. Johnson is Chairman and Director of Fidelity Management & Research Company LLC (investment adviser firm, 2011-present). Previously, Ms. Johnson served as Chairman and Director of FMR Co., Inc. (investment adviser firm, 2011-2019), Vice Chairman (2007-2016) and President (2013-2016) of FMR LLC, President and a Director of Fidelity Management & Research Company (2001-2005), a Trustee of other investment companies advised by Fidelity Management & Research Company, Fidelity Investments Money Management, Inc. (investment adviser firm), and FMR Co., Inc. (2001-2005), Senior Vice President of the Fidelity® funds (2001-2005), and managed a number of Fidelity® funds. Ms. Abigail P. Johnson and Mr. Arthur E. Johnson are not related.
Jennifer Toolin McAuliffe (1959)
Year of Election or Appointment: 2016
Trustee
Ms. McAuliffe also serves as Trustee of other Fidelity® funds. Previously, Ms. McAuliffe served as Co-Head of Fixed Income of Fidelity Investments Limited (now known as FIL Limited (FIL)) (diversified financial services company), Director of Research for FIL’s credit and quantitative teams in London, Hong Kong and Tokyo and Director of Research for taxable and municipal bonds at Fidelity Investments Money Management, Inc. Ms. McAuliffe previously served as a member of the Advisory Board of certain Fidelity® funds (2016). Ms. McAuliffe was previously a lawyer at Ropes & Gray LLP and currently serves as director or trustee of several not-for-profit entities.
* Determined to be an “Interested Trustee” by virtue of, among other things, his or her affiliation with the trust[s] or various entities under common control with FMR.
+ The information includes the Trustee's principal occupation during the last five years and other information relating to the experience, attributes, and skills relevant to the Trustee's qualifications to serve as a Trustee, which led to the conclusion that the Trustee should serve as a Trustee for the fund.
Independent Trustees:
Correspondence intended for an Independent Trustee may be sent to Fidelity Investments, P.O. Box 55235, Boston, Massachusetts 02205-5235.
Name, Year of Birth; Principal Occupations and Other Relevant Experience+
Elizabeth S. Acton (1951)
Year of Election or Appointment: 2013
Trustee
Ms. Acton also serves as Trustee of other Fidelity® funds. Prior to her retirement, Ms. Acton served as Executive Vice President, Finance (2011-2012), Executive Vice President, Chief Financial Officer (2002-2011) and Treasurer (2004-2005) of Comerica Incorporated (financial services). Prior to joining Comerica, Ms. Acton held a variety of positions at Ford Motor Company (1983-2002), including Vice President and Treasurer (2000-2002) and Executive Vice President and Chief Financial Officer of Ford Motor Credit Company (1998-2000). Ms. Acton currently serves as a member of the Board and Audit and Finance Committees of Beazer Homes USA, Inc. (homebuilding, 2012-present). Ms. Acton previously served as a member of the Advisory Board of certain Fidelity® funds (2013-2016).
Ann E. Dunwoody (1953)
Year of Election or Appointment: 2018
Trustee
General Dunwoody also serves as Trustee of other Fidelity® funds. General Dunwoody (United States Army, Retired) was the first woman in U.S. military history to achieve the rank of four-star general and prior to her retirement in 2012 held a variety of positions within the U.S. Army, including Commanding General, U.S. Army Material Command (2008-2012). General Dunwoody currently serves as President of First to Four LLC (leadership and mentoring services, 2012-present), a member of the Board and Nomination and Corporate Governance Committees of Kforce Inc. (professional staffing services, 2016-present) and a member of the Board of Automattic Inc. (software engineering, 2018-present). Previously, General Dunwoody served as a member of the Advisory Board and Nominating and Corporate Governance Committee of L3 Technologies, Inc. (communication, electronic, sensor and aerospace systems, 2013-2019) and a member of the Board and Audit and Sustainability and Corporate Responsibility Committees of Republic Services, Inc. (waste collection, disposal and recycling, 2013-2016). Ms. Dunwoody also serves on several boards for non-profit organizations, including as a member of the Board, Chair of the Nomination and Governance Committee and a member of the Audit Committee of Logistics Management Institute (consulting non-profit, 2012-present), a member of the Council of Trustees for the Association of the United States Army (advocacy non-profit, 2013-present), a member of the Board of Florida Institute of Technology (2015-present) and a member of the Board of ThanksUSA (military family education non-profit, 2014-present). General Dunwoody previously served as a member of the Advisory Board of certain Fidelity® funds (2018).
John Engler (1948)
Year of Election or Appointment: 2014
Trustee
Mr. Engler also serves as Trustee of other Fidelity® funds. Previously, Mr. Engler served as Governor of Michigan (1991-2003), President of the Business Roundtable (2011-2017) and interim President of Michigan State University (2018-2019). Mr. Engler currently serves as a member of the Board of K12 Inc. (technology-based education company, 2012-present). Previously, Mr. Engler served as a member of the Board of Universal Forest Products (manufacturer and distributor of wood and wood-alternative products, 2003-2019) and Trustee of The Munder Funds (2003-2014). Mr. Engler previously served as a member of the Advisory Board of certain Fidelity® funds (2014-2016).
Robert F. Gartland (1951)
Year of Election or Appointment: 2010
Trustee
Mr. Gartland also serves as Trustee of other Fidelity® funds. Prior to his retirement, Mr. Gartland held a variety of positions at Morgan Stanley (financial services, 1979-2007), including Managing Director (1987-2007) and Chase Manhattan Bank (1975-1978). Mr. Gartland previously served as Chairman and an investor in Gartland & Mellina Group Corp. (consulting, 2009-2019), as a member of the Board of National Securities Clearing Corporation (1993-1996) and as Chairman of TradeWeb (2003-2004).
Arthur E. Johnson (1947)
Year of Election or Appointment: 2008
Trustee
Chairman of the Independent Trustees
Mr. Johnson also serves as Trustee of other Fidelity® funds. Prior to his retirement, Mr. Johnson served as Senior Vice President of Corporate Strategic Development of Lockheed Martin Corporation (defense contractor, 1999-2009). Mr. Johnson currently serves as a member of the Board of Booz Allen Hamilton (management consulting, 2011-present). Mr. Johnson previously served as a member of the Board of Eaton Corporation plc (diversified power management, 2009-2019) and a member of the Board of AGL Resources, Inc. (holding company, 2002-2016). Mr. Johnson previously served as Vice Chairman (2015-2018) of the Independent Trustees of certain Fidelity® funds. Mr. Arthur E. Johnson is not related to Ms. Abigail P. Johnson.
Michael E. Kenneally (1954)
Year of Election or Appointment: 2009
Trustee
Vice Chairman of the Independent Trustees
Mr. Kenneally also serves as Trustee of other Fidelity® funds. Prior to his retirement, Mr. Kenneally served as Chairman and Global Chief Executive Officer of Credit Suisse Asset Management and Executive Vice President and Chief Investment Officer of Bank of America Corporation. Earlier roles at Bank of America included Director of Research, Senior Portfolio Manager for various institutional equity accounts and mutual funds and Portfolio Manager for a number of institutional fixed-income clients. Mr. Kenneally began his career as a Research Analyst in 1983 and was awarded the Chartered Financial Analyst (CFA) designation in 1991.
Marie L. Knowles (1946)
Year of Election or Appointment: 2001
Trustee
Ms. Knowles also serves as Trustee of other Fidelity® funds. Prior to her retirement, Ms. Knowles held several positions at Atlantic Richfield Company (diversified energy), including Executive Vice President and Chief Financial Officer (1996-2000), Senior Vice President (1993-1996) and President of ARCO Transportation Company (pipeline and tanker operations, 1993-1996). Ms. Knowles currently serves as a member of the Board of McKesson Corporation (healthcare service, since 2002), a member of the Board of the Santa Catalina Island Company (real estate, 2009-present), a member of the Investment Company Institute Board of Governors and a member of the Governing Council of the Independent Directors Council (2014-present). Ms. Knowles also serves as a member of the Advisory Board for the School of Engineering of the University of Southern California. Ms. Knowles previously served as Chairman (2015-2018) and Vice Chairman (2012-2015) of the Independent Trustees of certain Fidelity® funds.
Mark A. Murray (1954)
Year of Election or Appointment: 2016
Trustee
Mr. Murray also serves as Trustee of other Fidelity® funds. Previously, Mr. Murray served as Co-Chief Executive Officer (2013-2016), President (2006-2013) and Vice Chairman (2013-2020) of Meijer, Inc. Mr. Murray serves as a member of the Board and Nuclear Review and Public Policy and Responsibility Committees of DTE Energy Company (diversified energy company, 2009-present) and a member of the Board and Audit Committee and Chairman of the Nominating and Corporate Governance Committee of Universal Forest Products, Inc. (manufacturer and distributor of wood and wood-alternative products, 2004-2016). Mr. Murray previously served as a member of the Board of Spectrum Health (not-for-profit health system, 2015-2019). Mr. Murray also serves as a member of the Board of many community and professional organizations. Mr. Murray previously served as a member of the Advisory Board of certain Fidelity® funds (2016).
+ The information includes the Trustee's principal occupation during the last five years and other information relating to the experience, attributes, and skills relevant to the Trustee's qualifications to serve as a Trustee, which led to the conclusion that the Trustee should serve as a Trustee for the fund.
Advisory Board Members and Officers:
Correspondence intended for an officer may be sent to Fidelity Investments, 245 Summer Street, Boston, Massachusetts 02210. Officers appear below in alphabetical order.
Name, Year of Birth; Principal Occupation
Elizabeth Paige Baumann (1968)
Year of Election or Appointment: 2017
Anti-Money Laundering (AML) Officer
Ms. Baumann also serves as AML Officer of other funds. She is Chief AML Officer (2012-present) and Senior Vice President (2014-present) of FMR LLC (diversified financial services company) and is an employee of Fidelity Investments. Previously, Ms. Baumann served as AML Officer of certain funds (2017-2019), as AML Officer of the funds (2012-2016), and Vice President (2007-2014) and Deputy Anti-Money Laundering Officer (2007-2012) of FMR LLC.
Craig S. Brown (1977)
Year of Election or Appointment: 2019
Assistant Treasurer
Mr. Brown also serves as Assistant Treasurer of other funds. Mr. Brown is an employee of Fidelity Investments (2013-present).
John J. Burke III (1964)
Year of Election or Appointment: 2018
Chief Financial Officer
Mr. Burke also serves as Chief Financial Officer of other funds. Mr. Burke serves as Head of Investment Operations for Fidelity Fund and Investment Operations (2018-present) and is an employee of Fidelity Investments (1998-present). Previously Mr. Burke served as head of Asset Management Investment Operations (2012-2018).
David J. Carter (1973)
Year of Election or Appointment: 2020
Assistant Secretary
Mr. Carter also serves as Assistant Secretary of other funds. Mr. Carter serves as Vice President, Associate General Counsel (2010-present) and is an employee of Fidelity Investments (2005-present).
Jonathan Davis (1968)
Year of Election or Appointment: 2010
Assistant Treasurer
Mr. Davis also serves as Assistant Treasurer of other funds. Mr. Davis serves as Assistant Treasurer of FMR Capital, Inc. (2017-present) and is an employee of Fidelity Investments. Previously, Mr. Davis served as Vice President and Associate General Counsel of FMR LLC (diversified financial services company, 2003-2010).
Laura M. Del Prato (1964)
Year of Election or Appointment: 2018
President and Treasurer
Ms. Del Prato also serves as an officer of other funds. Ms. Del Prato is an employee of Fidelity Investments (2017-present). Previously, Ms. Del Prato served as President and Treasurer of The North Carolina Capital Management Trust: Cash Portfolio and Term Portfolio (2018-2020). Prior to joining Fidelity Investments, Ms. Del Prato served as a Managing Director and Treasurer of the JPMorgan Mutual Funds (2014-2017). Prior to JPMorgan, Ms. Del Prato served as a partner at Cohen Fund Audit Services (accounting firm, 2012-2013) and KPMG LLP (accounting firm, 2004-2012).
Colm A. Hogan (1973)
Year of Election or Appointment: 2016
Assistant Treasurer
Mr. Hogan also serves as an officer of other funds. Mr. Hogan serves as Assistant Treasurer of FMR Capital, Inc. (2017-present) and is an employee of Fidelity Investments (2005-present). Previously, Mr. Hogan served as Deputy Treasurer of certain Fidelity® funds (2016-2020) and Assistant Treasurer of certain Fidelity® funds (2016-2018).
Cynthia Lo Bessette (1969)
Year of Election or Appointment: 2019
Secretary and Chief Legal Officer (CLO)
Ms. Lo Bessette also serves as an officer of other funds. Ms. Lo Bessette serves as CLO, Secretary, and Senior Vice President of Fidelity Management & Research Company LLC (investment adviser firm, 2019-present); and CLO of Fidelity Management & Research (Hong Kong) Limited, FMR Investment Management (UK) Limited, and Fidelity Management & Research (Japan) Limited (investment adviser firms, 2019-present). She is a Senior Vice President and Deputy General Counsel of FMR LLC (diversified financial services company, 2019-present), and is an employee of Fidelity Investments. Previously, Ms. Lo Bessette served as CLO, Secretary, and Senior Vice President of FMR Co., Inc. (investment adviser firm, 2019); Secretary of Fidelity SelectCo, LLC and Fidelity Investments Money Management, Inc. (investment adviser firms, 2019). Prior to joining Fidelity Investments, Ms. Lo Bessette was Executive Vice President, General Counsel (2016-2019) and Senior Vice President, Deputy General Counsel (2015-2016) of OppenheimerFunds (investment management company) and Deputy Chief Legal Officer (2013-2015) of Jennison Associates LLC (investment adviser firm).
Chris Maher (1972)
Year of Election or Appointment: 2013
Assistant Treasurer
Mr. Maher also serves as an officer of other funds. Mr. Maher serves as Assistant Treasurer of FMR Capital, Inc. (2017-present), and is an employee of Fidelity Investments (2008-present). Previously, Mr. Maher served as Assistant Treasurer of certain funds (2013-2020); Vice President of Asset Management Compliance (2013), Vice President of the Program Management Group of FMR (investment adviser firm, 2010-2013), and Vice President of Valuation Oversight (2008-2010).
Jamie Pagliocco (1964)
Year of Election or Appointment: 2020
Vice President
Mr. Pagliocco also serves as Vice President of other funds. Mr. Pagliocco serves as President of Fixed Income (2020-present), and is an employee of Fidelity Investments (2001-present). Previously, Mr. Pagliocco served as Co-Chief Investment Officer – Bond (2017-2020), Global Head of Bond Trading (2016-2019), and as a portfolio manager.
Kenneth B. Robins (1969)
Year of Election or Appointment: 2020
Chief Compliance Officer
Mr. Robins also serves as an officer of other funds. Mr. Robins serves as Compliance Officer of Fidelity Management & Research Company LLC (investment adviser firm, 2016-present) and is an employee of Fidelity Investments (2004-present). Previously, Mr. Robins served as Compliance Officer of FMR Co., Inc. (investment adviser firm, 2016-2019), as Executive Vice President of Fidelity Investments Money Management, Inc. (investment adviser firm, 2013-2016) and served in other fund officer roles.
Stacie M. Smith (1974)
Year of Election or Appointment: 2013
Assistant Treasurer
Ms. Smith also serves as an officer of other funds. Ms. Smith serves as Assistant Treasurer of FMR Capital, Inc. (2017-present), is an employee of Fidelity Investments (2009-present), and has served in other fund officer roles. Prior to joining Fidelity Investments, Ms. Smith served as Senior Audit Manager of Ernst & Young LLP (accounting firm, 1996-2009). Previously, Ms. Smith served as Assistant Treasurer (2013-2019) and Deputy Treasurer (2013-2016) of certain Fidelity® funds.
Marc L. Spector (1972)
Year of Election or Appointment: 2016
Deputy Treasurer
Mr. Spector also serves as an officer of other funds. Mr. Spector serves as Assistant Treasurer of FMR Capital, Inc. (2017-present) and is an employee of Fidelity Investments (2016-present). Prior to joining Fidelity Investments, Mr. Spector served as Director at the Siegfried Group (accounting firm, 2013-2016), and prior to Siegfried Group as audit senior manager at Deloitte & Touche LLP (accounting firm, 2005-2013).
Jim Wegmann (1979)
Year of Election or Appointment: 2019
Assistant Treasurer
Mr. Wegmann also serves as Assistant Treasurer of other funds. Mr. Wegmann is an employee of Fidelity Investments (2011-present).
Shareholder Expense Example
As a shareholder, you incur two types of costs: (1) transaction costs, which may include sales charges (loads) on purchase payments or redemption proceeds, as applicable and (2) ongoing costs, which generally include management fees, distribution and/or service (12b-1) fees and other Fund expenses. This Example is intended to help you understand your ongoing costs (in dollars) of investing in a fund and to compare these costs with the ongoing costs of investing in other mutual funds.
The Example is based on an investment of $1,000 invested at the beginning of the period and held for the entire period (February 1, 2020 to July 31, 2020).
Actual Expenses
The first line of the accompanying table provides information about actual account values and actual expenses. You may use the information in this line, together with the amount you invested, to estimate the expenses that you paid over the period. Simply divide your account value by $1,000.00 (for example, an $8,600 account value divided by $1,000.00 = 8.6), then multiply the result by the number in the first line for a class/Fund under the heading entitled "Expenses Paid During Period" to estimate the expenses you paid on your account during this period. If any fund is a shareholder of any underlying mutual funds or exchange-traded funds (ETFs) (the Underlying Funds), such fund indirectly bears its proportional share of the expenses of the Underlying Funds in addition to the direct expenses incurred presented in the table. These fees and expenses are not included in the annualized expense ratio used to calculate the expense estimate in the table below.
Hypothetical Example for Comparison Purposes
The second line of the accompanying table provides information about hypothetical account values and hypothetical expenses based on the actual expense ratio and an assumed rate of return of 5% per year before expenses, which is not the actual return. The hypothetical account values and expenses may not be used to estimate the actual ending account balance or expenses you paid for the period. You may use this information to compare the ongoing costs of investing in the Fund and other funds. To do so, compare this 5% hypothetical example with the 5% hypothetical examples that appear in the shareholder reports of the other funds. If any fund is a shareholder of any Underlying Funds, such fund indirectly bears its proportional share of the expenses of the Underlying Funds in addition to the direct expenses as presented in the table. These fees and expenses are not included in the annualized expense ratio used to calculate the expense estimate in the table below.
Please note that the expenses shown in the table are meant to highlight your ongoing costs only and do not reflect any transaction costs. Therefore, the second line of the table is useful in comparing ongoing costs only, and will not help you determine the relative total costs of owning different funds.
| | Annualized Expense Ratio-A | Beginning
Account Value
February 1, 2020 | Ending
Account Value
July 31, 2020 | Expenses Paid
During Period-B
February 1, 2020
to July 31, 2020 |
| Fidelity SAI U.S. Quality Index Fund | .11% | | | |
| Actual | | $1,000.00 | $1,085.70 | $.57 |
| Hypothetical-C | | $1,000.00 | $1,024.32 | $.55 |
A Annualized expense ratio reflects expenses net of applicable fee waivers.
B Expenses are equal to the annualized expense ratio, multiplied by the average account value over the period, multiplied by 182/ 366 (to reflect the one-half year period). The fees and expenses of any Underlying Funds are not included in each annualized expense ratio.
C 5% return per year before expenses
Distributions (Unaudited)
The Board of Trustees of Fidelity SAI U.S. Quality Index Fund voted to pay on September 14, 2020, to shareholders of record at the opening of business on September 11, 2020, a distribution of $0.743 per share derived from capital gains realized from sales of portfolio securities and a dividend of $0.182 per share from net investment income.
The fund hereby designates as a capital gain dividend with respect to the taxable year ended July 31, 2020, $ 501,392,023, or, if subsequently determined to be different, the net capital gain of such year.
The fund designates 40% and 53% of the dividends distributed in September and December, respectively during the fiscal year as qualifying for the dividends–received deduction for corporate shareholders.
The fund designates 41% and 56% of the dividends distributed in September and December, respectively during the fiscal year as amounts which may be taken into account as a dividend for the purposes of the maximum rate under section 1(h)(11) of the Internal Revenue Code.
The fund designates 2% and 4% of the dividends distributed in September and December, respectively during the fiscal year as a section 199A dividend.
The fund will notify shareholders in January 2021 of amounts for use in preparing 2020 income tax returns.
Liquidity Risk Management Program
The Securities and Exchange Commission adopted Rule 22e-4 under the Investment Company Act of 1940 (the Liquidity Rule) to promote effective liquidity risk management throughout the open-end investment company industry, thereby reducing the risk that funds will be unable to meet their redemption obligations and mitigating dilution of the interests of fund shareholders.
The Fund has adopted and implemented a liquidity risk management program pursuant to the Liquidity Rule (the Program) effective December 1, 2018. The Program is reasonably designed to assess and manage the Fund’s liquidity risk and to comply with the requirements of the Liquidity Rule. The Fund’s Board of Trustees (the Board) has designated the Fund’s investment adviser as administrator of the Program. The Fidelity advisers have established a Liquidity Risk Management Committee (the LRM Committee) to manage the Program for each of the Fidelity Funds. The LRM Committee monitors the adequacy and effectiveness of implementation of the Program and on a periodic basis assesses each Fund’s liquidity risk based on a variety of factors including (1) the Fund’s investment strategy, (2) portfolio liquidity and cash flow projections during normal and reasonably foreseeable stressed conditions, (3) shareholder redemptions, (4) borrowings and other funding sources and (5) in the case of exchange-traded funds, certain additional factors including the effect of the Fund’s prices and spreads, market participants, and basket compositions on the overall liquidity of the Fund’s portfolio, as applicable.
In accordance with the Program, each of the Fund’s portfolio investments is classified into one of four liquidity categories described below based on a determination of a reasonable expectation for how long it would take to convert the investment to cash (or sell or dispose of the investment) without significantly changing its market value.
- Highly liquid investments – cash or convertible to cash within three business days or less
- Moderately liquid investments – convertible to cash in three to seven calendar days
- Less liquid investments – can be sold or disposed of, but not settled, within seven calendar days
- Illiquid investments – cannot be sold or disposed of within seven calendar days
Liquidity classification determinations take into account a variety of factors including various market, trading and investment-specific considerations, as well as market depth, and generally utilize analysis from a third-party liquidity metrics service.
The Liquidity Rule places a 15% limit on a fund’s illiquid investments and requires funds that do not primarily hold assets that are highly liquid investments to determine and maintain a minimum percentage of the fund’s net assets to be invested in highly liquid investments (highly liquid investment minimum or HLIM). The Program includes provisions reasonably designed to comply with the 15% limit on illiquid investments and for determining, periodically reviewing and complying with the HLIM requirement as applicable.
At a recent meeting of the Fund’s Board of Trustees, the LRM Committee provided a written report to the Board pertaining to the operation, adequacy, and effectiveness of implementation of the Program for the annual period from December 1, 2018 through November 30, 2019. The report concluded that the Program has been implemented and is operating effectively and is reasonably designed to assess and manage the Fund’s liquidity risk.
SV4-ANN-0920
1.9868208.104
Fidelity® SAI U.S. Large Cap Index Fund
Offered exclusively to certain clients of the Adviser or its affiliates - not available for sale to the general public. Fidelity SAI is a product name of Fidelity® funds dedicated to certain programs affiliated with Strategic Advisers LLC.
Annual Report
July 31, 2020
See the inside front cover for important information about access to your fund’s shareholder reports.
Beginning on January 1, 2021, as permitted by regulations adopted by the Securities and Exchange Commission, paper copies of a fund’s shareholder reports will no longer be sent by mail, unless you specifically request paper copies of the reports from the fund or from your financial intermediary, such as a financial advisor, broker-dealer or bank. Instead, the reports will be made available on a website, and you will be notified by mail each time a report is posted and provided with a website link to access the report.
If you already elected to receive shareholder reports electronically, you will not be affected by this change and you need not take any action. You may elect to receive shareholder reports and other communications from a fund electronically, by contacting your financial intermediary. For Fidelity customers, visit Fidelity's web site or call Fidelity using the contact information listed below.
You may elect to receive all future reports in paper free of charge. If you wish to continue receiving paper copies of your shareholder reports, you may contact your financial intermediary or, if you are a Fidelity customer, visit Fidelity’s website, or call Fidelity at the applicable toll-free number listed below. Your election to receive reports in paper will apply to all funds held with the fund complex/your financial intermediary.
| Account Type | Website | Phone Number |
| Brokerage, Mutual Fund, or Annuity Contracts: | fidelity.com/mailpreferences | 1-800-343-3548 |
| Employer Provided Retirement Accounts: | netbenefits.fidelity.com/preferences (choose 'no' under Required Disclosures to continue to print) | 1-800-343-0860 |
| Advisor Sold Accounts Serviced Through Your Financial Intermediary: | Contact Your Financial Intermediary | Your Financial Intermediary's phone number |
| Advisor Sold Accounts Serviced by Fidelity: | institutional.fidelity.com | 1-877-208-0098 |
Contents
To view a fund's proxy voting guidelines and proxy voting record for the 12-month period ended June 30, visit http://www.fidelity.com/proxyvotingresults or visit the Securities and Exchange Commission's (SEC) web site at http://www.sec.gov.
You may also call 1-800-544-3455 to request a free copy of the proxy voting guidelines.
Standard & Poor's, S&P and S&P 500 are registered service marks of The McGraw-Hill Companies, Inc. and have been licensed for use by Fidelity Distributors Corporation.
Other third-party marks appearing herein are the property of their respective owners.
All other marks appearing herein are registered or unregistered trademarks or service marks of FMR LLC or an affiliated company. © 2020 FMR LLC. All rights reserved.
This report and the financial statements contained herein are submitted for the general information of the shareholders of the Fund. This report is not authorized for distribution to prospective investors in the Fund unless preceded or accompanied by an effective prospectus.
A fund files its complete schedule of portfolio holdings with the SEC for the first and third quarters of each fiscal year on Form N-PORT. Forms N-PORT are available on the SEC’s web site at http://www.sec.gov. A fund's Forms N-PORT may be reviewed and copied at the SEC’s Public Reference Room in Washington, DC. Information regarding the operation of the SEC's Public Reference Room may be obtained by calling 1-800-SEC-0330.
For a complete list of a fund's portfolio holdings, view the most recent holdings listing, semiannual report, or annual report on Fidelity's web site at http://www.fidelity.com, http://www.institutional.fidelity.com, or http://www.401k.com, as applicable.
NOT FDIC INSURED •MAY LOSE VALUE •NO BANK GUARANTEE
Neither the Fund nor Fidelity Distributors Corporation is a bank.
Note to Shareholders:
Early in 2020, the outbreak and spread of a new coronavirus emerged as a public health emergency that had a major influence on financial markets, primarily based on its impact on the global economy and the outlook for corporate earnings. The virus causes a respiratory disease known as COVID-19. On March 11, the World Health Organization declared the COVID-19 outbreak a pandemic, citing sustained risk of further global spread.
In the weeks following, as the crisis worsened, we witnessed an escalating human tragedy with wide-scale social and economic consequences from coronavirus-containment measures. The outbreak of COVID-19 prompted a number of measures to limit the spread, including travel and border restrictions, quarantines, and restrictions on large gatherings. In turn, these resulted in lower consumer activity, diminished demand for a wide range of products and services, disruption in manufacturing and supply chains, and – given the wide variability in outcomes regarding the outbreak – significant market uncertainty and volatility. Amid the turmoil, the U.S. government took unprecedented action – in concert with the U.S. Federal Reserve and central banks around the world – to help support consumers, businesses, and the broader economy, and to limit disruption to the financial system.
The situation continues to unfold, and the extent and duration of its impact on financial markets and the economy remain highly uncertain. Extreme events such as the coronavirus crisis are “exogenous shocks” that can have significant adverse effects on mutual funds and their investments. Although multiple asset classes may be affected by market disruption, the duration and impact may not be the same for all types of assets.
Fidelity is committed to helping you stay informed amid news about COVID-19 and during increased market volatility, and we’re taking extra steps to be responsive to customer needs. We encourage you to visit our websites, where we offer ongoing updates, commentary, and analysis on the markets and our funds.
Performance: The Bottom Line
Average annual total return reflects the change in the value of an investment, assuming reinvestment of distributions from dividend income and capital gains (the profits earned upon the sale of securities that have grown in value, if any) and assuming a constant rate of performance each year. The hypothetical investment and the average annual total returns do not reflect the deduction of taxes that a shareholder would pay on fund distributions or the redemption of fund shares. During periods of reimbursement by Fidelity, a fund’s total return will be greater than it would be had the reimbursement not occurred. How a fund did yesterday is no guarantee of how it will do tomorrow.
Average Annual Total Returns
| For the periods ended July 31, 2020 | Past 1 year | Life of fundA |
| Fidelity® SAI U.S. Large Cap Index Fund | 11.84% | 15.08% |
A From February 2, 2016
$10,000 Over Life of Fund
Let's say hypothetically that $10,000 was invested in Fidelity® SAI U.S. Large Cap Index Fund on February 2, 2016, when the fund started.
The chart shows how the value of your investment would have changed, and also shows how the S&P 500® Index performed over the same period.
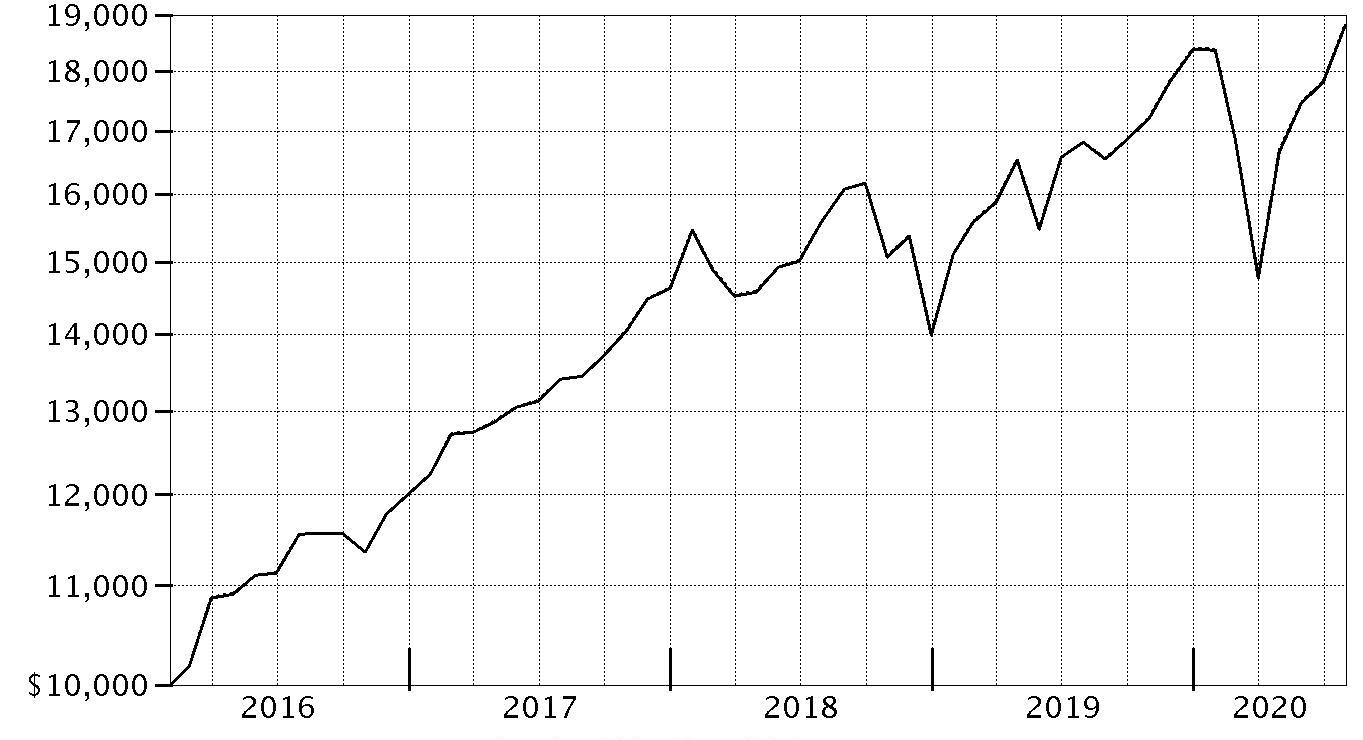
| Period Ending Values |
| $18,807 | Fidelity® SAI U.S. Large Cap Index Fund |
| $18,834 | S&P 500® Index |
Management's Discussion of Fund Performance
Market Recap: The S&P 500
® index gained 11.96% for the 12 months ending July 31, 2020, in what was a bumpy ride for U.S. equity investors, marked by a steep but brief decline due to the early-2020 outbreak and spread of the coronavirus, followed by a historic rebound. Declared a pandemic on March 11, the COVID-19 crisis and containment efforts caused broad contraction in economic activity, along with extreme uncertainty, volatility and dislocation in financial markets. By mid-March, U.S. stocks entered bear-market territory less than a month after hitting an all-time high and extending the longest-running bull market in American history. Stocks slid in late February, after a surge in COVID-19 cases outside China. The sudden downtrend continued in March (-12%), capping the index’s worst quarter since 2008. A historically rapid and expansive U.S. monetary/fiscal-policy response provided a partial offset to the economic disruption and fueled a sharp uptrend. Aggressive support for financial markets by the U.S. Federal Reserve, plans for reopening the economy and improving infection data boosted stocks in April (+13%) and May (+5%). In June and July, the index gained amid progress on potential treatments and signs of an early recovery in economic activity. For the full 12 months, growth stocks widely topped value, while large-caps handily bested smaller-caps. The information technology sector (+39%) led the way, followed by consumer discretionary (+22%). In contrast, energy (-38%) fell hard along with the price of crude oil.
Comments from the Geode Capital Management, LLC, passive equity index team: For the fiscal year ending July 31, 2020, the fund gained 11.84%, roughly in line with the 11.96% advance of the benchmark S&P 500
® index. By sector, information technology rose approximately 38% and contributed most, followed by health care, which gained 19%. The consumer discretionary sector rose about 21%, boosted by the retailing industry (+41%), and communication services gained roughly 15%, lifted by the media & entertainment industry (+18%). Consumer staples advanced 8%. Other notable contributors included the utilities (+5%) and materials (+6%) sectors. Conversely, stocks in the energy sector returned roughly -38% and detracted most. Financials (-13%) and industrials (-6%) also hurt. Turning to individual stocks, the top contributor was Apple (+101%), from the technology hardware & equipment segment. In retailing, Amazon.com (+70%) was helpful and Microsoft (+52%) from the software & services category also contributed. Alphabet, within the media & entertainment group, rose 22% and Nvidia, within the semiconductors & semiconductor equipment industry, gained approximately 150% and boosted the fund. Conversely, the biggest individual detractor was Exxon Mobil (-40%), from the energy sector. Boeing, within the capital goods segment, returned about -53% and hindered the fund. In banks, Wells Fargo (-47%) and JPMorgan Chase (-14%) hurt. Another detractor was Chevron (-29%), a stock in the energy sector.
The views expressed above reflect those of the portfolio manager(s) only through the end of the period as stated on the cover of this report and do not necessarily represent the views of Fidelity or any other person in the Fidelity organization. Any such views are subject to change at any time based upon market or other conditions and Fidelity disclaims any responsibility to update such views. These views may not be relied on as investment advice and, because investment decisions for a Fidelity fund are based on numerous factors, may not be relied on as an indication of trading intent on behalf of any Fidelity fund.
Investment Summary (Unaudited)
Top Five Stocks as of July 31, 2020
| | % of fund's net assets |
| Apple, Inc. | 6.4 |
| Microsoft Corp. | 5.7 |
| Amazon.com, Inc. | 4.9 |
| Facebook, Inc. Class A | 2.3 |
| Alphabet, Inc. Class A | 1.6 |
| | 20.9 |
Top Five Market Sectors as of July 31, 2020
| | % of fund's net assets |
| Information Technology | 27.4 |
| Health Care | 14.5 |
| Consumer Discretionary | 11.1 |
| Communication Services | 10.8 |
| Financials | 9.8 |
Asset Allocation (% of fund's net assets)
| As of July 31, 2020* |
| | Stocks and Equity Futures | 100.0% |

* Foreign investments - 3.0%
Schedule of Investments July 31, 2020
Showing Percentage of Net Assets
| Common Stocks - 99.5% | | | |
| | | Shares | Value |
| COMMUNICATION SERVICES - 10.8% | | | |
| Diversified Telecommunication Services - 1.7% | | | |
| AT&T, Inc. | | 4,039,326 | $119,483,263 |
| CenturyLink, Inc. | | 560,063 | 5,404,608 |
| Verizon Communications, Inc. | | 2,345,900 | 134,842,332 |
| | | | 259,730,203 |
| Entertainment - 2.0% | | | |
| Activision Blizzard, Inc. | | 436,806 | 36,093,280 |
| Electronic Arts, Inc. (a) | | 163,666 | 23,178,379 |
| Live Nation Entertainment, Inc. (a)(b) | | 80,333 | 3,760,388 |
| Netflix, Inc. (a) | | 249,333 | 121,893,917 |
| Take-Two Interactive Software, Inc. (a) | | 64,599 | 10,595,528 |
| The Walt Disney Co. | | 1,024,028 | 119,749,834 |
| | | | 315,271,326 |
| Interactive Media & Services - 5.6% | | | |
| Alphabet, Inc.: | | | |
| Class A (a) | | 170,103 | 253,104,759 |
| Class C (a) | | 165,803 | 245,879,217 |
| Facebook, Inc. Class A (a) | | 1,363,187 | 345,799,646 |
| Twitter, Inc. (a) | | 444,833 | 16,191,921 |
| | | | 860,975,543 |
| Media - 1.3% | | | |
| Charter Communications, Inc. Class A (a) | | 85,448 | 49,559,840 |
| Comcast Corp. Class A | | 2,582,222 | 110,519,102 |
| Discovery Communications, Inc.: | | | |
| Class A (a)(b) | | 90,242 | 1,904,106 |
| Class C (non-vtg.) (a) | | 179,938 | 3,409,825 |
| DISH Network Corp. Class A (a) | | 145,725 | 4,679,230 |
| Fox Corp.: | | | |
| Class A | | 196,325 | 5,059,295 |
| Class B | | 88,293 | 2,275,311 |
| Interpublic Group of Companies, Inc. | | 220,560 | 3,981,108 |
| News Corp.: | | | |
| Class A | | 222,810 | 2,834,143 |
| Class B | | 65,891 | 840,769 |
| Omnicom Group, Inc. | | 121,526 | 6,529,592 |
| ViacomCBS, Inc. Class B (b) | | 306,520 | 7,990,976 |
| | | | 199,583,297 |
| Wireless Telecommunication Services - 0.2% | | | |
| T-Mobile U.S., Inc. | | 330,085 | 35,444,527 |
|
| TOTAL COMMUNICATION SERVICES | | | 1,671,004,896 |
|
| CONSUMER DISCRETIONARY - 11.1% | | | |
| Auto Components - 0.1% | | | |
| Aptiv PLC | | 151,981 | 11,816,523 |
| BorgWarner, Inc. | | 117,400 | 4,296,840 |
| | | | 16,113,363 |
| Automobiles - 0.2% | | | |
| Ford Motor Co. | | 2,214,656 | 14,638,876 |
| General Motors Co. | | 714,014 | 17,771,808 |
| | | | 32,410,684 |
| Distributors - 0.1% | | | |
| Genuine Parts Co. | | 81,788 | 7,373,188 |
| LKQ Corp. (a) | | 172,291 | 4,856,883 |
| | | | 12,230,071 |
| Diversified Consumer Services - 0.0% | | | |
| H&R Block, Inc. | | 108,600 | 1,574,700 |
| Hotels, Restaurants & Leisure - 1.5% | | | |
| Carnival Corp. (b) | | 268,002 | 3,719,868 |
| Chipotle Mexican Grill, Inc. (a) | | 14,549 | 16,806,423 |
| Darden Restaurants, Inc. | | 73,646 | 5,589,731 |
| Domino's Pizza, Inc. | | 22,179 | 8,574,623 |
| Hilton Worldwide Holdings, Inc. | | 157,210 | 11,798,611 |
| Las Vegas Sands Corp. | | 190,534 | 8,314,904 |
| Marriott International, Inc. Class A | | 152,592 | 12,791,024 |
| McDonald's Corp. | | 421,547 | 81,898,151 |
| MGM Mirage, Inc. | | 279,527 | 4,497,589 |
| Norwegian Cruise Line Holdings Ltd. (a)(b) | | 154,688 | 2,109,944 |
| Royal Caribbean Cruises Ltd. (b) | | 97,321 | 4,740,506 |
| Starbucks Corp. | | 662,242 | 50,681,380 |
| Wynn Resorts Ltd. | | 54,966 | 3,981,187 |
| Yum! Brands, Inc. | | 170,651 | 15,537,774 |
| | | | 231,041,715 |
| Household Durables - 0.4% | | | |
| D.R. Horton, Inc. | | 187,546 | 12,408,043 |
| Garmin Ltd. | | 82,300 | 8,113,957 |
| Leggett & Platt, Inc. | | 75,170 | 3,013,565 |
| Lennar Corp. Class A | | 155,687 | 11,263,954 |
| Mohawk Industries, Inc. (a) | | 33,795 | 2,698,531 |
| Newell Brands, Inc. | | 215,869 | 3,540,252 |
| NVR, Inc. (a) | | 1,962 | 7,710,954 |
| PulteGroup, Inc. | | 142,902 | 6,230,527 |
| Whirlpool Corp. | | 35,242 | 5,748,675 |
| | | | 60,728,458 |
| Internet & Direct Marketing Retail - 5.3% | | | |
| Amazon.com, Inc. (a) | | 237,523 | 751,684,288 |
| eBay, Inc. | | 374,466 | 20,700,480 |
| Expedia, Inc. | | 76,797 | 6,221,325 |
| The Booking Holdings, Inc. (a) | | 23,205 | 38,569,727 |
| | | | 817,175,820 |
| Leisure Products - 0.0% | | | |
| Hasbro, Inc. | | 72,237 | 5,255,964 |
| Multiline Retail - 0.5% | | | |
| Dollar General Corp. | | 142,712 | 27,172,365 |
| Dollar Tree, Inc. (a) | | 134,500 | 12,555,575 |
| Kohl's Corp. | | 89,089 | 1,696,255 |
| Target Corp. | | 283,477 | 35,684,085 |
| | | | 77,108,280 |
| Specialty Retail - 2.4% | | | |
| Advance Auto Parts, Inc. | | 39,178 | 5,882,185 |
| AutoZone, Inc. (a) | | 13,237 | 15,982,619 |
| Best Buy Co., Inc. | | 128,870 | 12,834,163 |
| CarMax, Inc. (a)(b) | | 92,265 | 8,946,937 |
| Gap, Inc. | | 120,141 | 1,606,285 |
| L Brands, Inc. | | 132,753 | 3,240,501 |
| Lowe's Companies, Inc. | | 428,025 | 63,737,203 |
| O'Reilly Automotive, Inc. (a) | | 42,081 | 20,088,628 |
| Ross Stores, Inc. | | 201,478 | 18,066,532 |
| The Home Depot, Inc. | | 609,733 | 161,878,014 |
| Tiffany & Co., Inc. | | 61,917 | 7,761,915 |
| TJX Companies, Inc. | | 679,100 | 35,306,409 |
| Tractor Supply Co. | | 65,555 | 9,357,321 |
| Ulta Beauty, Inc. (a) | | 31,926 | 6,161,399 |
| | | | 370,850,111 |
| Textiles, Apparel & Luxury Goods - 0.6% | | | |
| Hanesbrands, Inc. | | 197,708 | 2,793,614 |
| NIKE, Inc. Class B | | 702,990 | 68,618,854 |
| PVH Corp. | | 40,147 | 1,953,553 |
| Ralph Lauren Corp. (b) | | 27,023 | 1,926,740 |
| Tapestry, Inc. | | 156,396 | 2,089,451 |
| Under Armour, Inc.: | | | |
| Class A (sub. vtg.) (a) | | 105,831 | 1,113,342 |
| Class C (non-vtg.) (a)(b) | | 112,592 | 1,068,498 |
| VF Corp. (b) | | 180,774 | 10,911,519 |
| | | | 90,475,571 |
|
| TOTAL CONSUMER DISCRETIONARY | | | 1,714,964,737 |
|
| CONSUMER STAPLES - 7.0% | | | |
| Beverages - 1.7% | | | |
| Brown-Forman Corp. Class B (non-vtg.) | | 103,397 | 7,169,548 |
| Constellation Brands, Inc. Class A (sub. vtg.) | | 95,220 | 16,968,204 |
| Molson Coors Beverage Co. Class B | | 106,402 | 3,992,203 |
| Monster Beverage Corp. (a) | | 211,956 | 16,634,307 |
| PepsiCo, Inc. | | 786,609 | 108,284,595 |
| The Coca-Cola Co. | | 2,191,383 | 103,520,933 |
| | | | 256,569,790 |
| Food & Staples Retailing - 1.5% | | | |
| Costco Wholesale Corp. | | 250,308 | 81,482,763 |
| Kroger Co. | | 445,721 | 15,506,634 |
| Sysco Corp. | | 287,776 | 15,208,962 |
| Walgreens Boots Alliance, Inc. | | 417,752 | 17,006,684 |
| Walmart, Inc. | | 802,742 | 103,874,815 |
| | | | 233,079,858 |
| Food Products - 1.1% | | | |
| Archer Daniels Midland Co. | | 314,943 | 13,489,009 |
| Campbell Soup Co. | | 95,866 | 4,752,078 |
| Conagra Brands, Inc. | | 276,142 | 10,341,518 |
| General Mills, Inc. | | 343,637 | 21,741,913 |
| Hormel Foods Corp. | | 158,892 | 8,081,247 |
| Kellogg Co. | | 141,816 | 9,783,886 |
| Lamb Weston Holdings, Inc. | | 82,769 | 4,972,762 |
| McCormick & Co., Inc. (non-vtg.) (b) | | 70,095 | 13,661,516 |
| Mondelez International, Inc. | | 809,257 | 44,905,671 |
| The Hershey Co. | | 83,564 | 12,151,041 |
| The J.M. Smucker Co. | | 64,659 | 7,070,462 |
| The Kraft Heinz Co. | | 353,295 | 12,146,282 |
| Tyson Foods, Inc. Class A | | 166,857 | 10,253,363 |
| | | | 173,350,748 |
| Household Products - 1.8% | | | |
| Church & Dwight Co., Inc. | | 139,407 | 13,429,076 |
| Clorox Co. | | 70,924 | 16,774,235 |
| Colgate-Palmolive Co. | | 485,581 | 37,486,853 |
| Kimberly-Clark Corp. | | 193,062 | 29,353,146 |
| Procter & Gamble Co. | | 1,403,475 | 184,023,642 |
| | | | 281,066,952 |
| Personal Products - 0.2% | | | |
| Coty, Inc. Class A | | 170,522 | 632,637 |
| Estee Lauder Companies, Inc. Class A | | 127,413 | 25,169,164 |
| | | | 25,801,801 |
| Tobacco - 0.7% | | | |
| Altria Group, Inc. | | 1,053,553 | 43,353,706 |
| Philip Morris International, Inc. | | 882,772 | 67,805,717 |
| | | | 111,159,423 |
|
| TOTAL CONSUMER STAPLES | | | 1,081,028,572 |
|
| ENERGY - 2.5% | | | |
| Energy Equipment & Services - 0.2% | | | |
| Baker Hughes Co. Class A | | 371,378 | 5,752,645 |
| Halliburton Co. | | 497,378 | 7,127,427 |
| National Oilwell Varco, Inc. | | 220,304 | 2,535,699 |
| Schlumberger Ltd. | | 786,798 | 14,272,516 |
| TechnipFMC PLC | | 237,874 | 1,910,128 |
| | | | 31,598,415 |
| Oil, Gas & Consumable Fuels - 2.3% | | | |
| Apache Corp. | | 214,425 | 3,291,424 |
| Cabot Oil & Gas Corp. | | 225,644 | 4,219,543 |
| Chevron Corp. | | 1,058,428 | 88,844,446 |
| Concho Resources, Inc. | | 111,513 | 5,858,893 |
| ConocoPhillips Co. | | 607,989 | 22,732,709 |
| Devon Energy Corp. | | 216,973 | 2,276,047 |
| Diamondback Energy, Inc. | | 89,179 | 3,554,675 |
| EOG Resources, Inc. | | 329,982 | 15,459,657 |
| Exxon Mobil Corp. | | 2,397,061 | 100,868,327 |
| Hess Corp. | | 148,004 | 7,283,277 |
| HollyFrontier Corp. | | 84,435 | 2,321,963 |
| Kinder Morgan, Inc. | | 1,102,616 | 15,546,886 |
| Marathon Oil Corp. | | 448,476 | 2,462,133 |
| Marathon Petroleum Corp. | | 368,645 | 14,082,239 |
| Noble Energy, Inc. | | 272,512 | 2,722,395 |
| Occidental Petroleum Corp. | | 510,243 | 8,031,225 |
| Occidental Petroleum Corp. warrants 8/3/27 (a) | | 64,746 | 362,578 |
| ONEOK, Inc. | | 249,395 | 6,960,614 |
| Phillips 66 Co. | | 247,563 | 15,353,857 |
| Pioneer Natural Resources Co. | | 93,468 | 9,058,919 |
| The Williams Companies, Inc. | | 687,791 | 13,157,442 |
| Valero Energy Corp. | | 231,135 | 12,996,721 |
| | | | 357,445,970 |
|
| TOTAL ENERGY | | | 389,044,385 |
|
| FINANCIALS - 9.8% | | | |
| Banks - 3.5% | | | |
| Bank of America Corp. | | 4,426,430 | 110,129,578 |
| Citigroup, Inc. | | 1,180,203 | 59,021,952 |
| Citizens Financial Group, Inc. | | 241,874 | 6,000,894 |
| Comerica, Inc. | | 79,020 | 3,043,850 |
| Fifth Third Bancorp | | 403,586 | 8,015,218 |
| First Republic Bank | | 97,196 | 10,932,606 |
| Huntington Bancshares, Inc. | | 574,951 | 5,329,796 |
| JPMorgan Chase & Co. | | 1,727,388 | 166,934,776 |
| KeyCorp | | 552,970 | 6,641,170 |
| M&T Bank Corp. | | 72,714 | 7,704,048 |
| Peoples United Financial, Inc. | | 241,139 | 2,601,890 |
| PNC Financial Services Group, Inc. | | 240,509 | 25,655,095 |
| Regions Financial Corp. | | 542,546 | 5,892,050 |
| SVB Financial Group (a) | | 29,201 | 6,548,908 |
| Truist Financial Corp. | | 763,881 | 28,614,982 |
| U.S. Bancorp | | 777,033 | 28,625,896 |
| Wells Fargo & Co. | | 2,115,141 | 51,313,321 |
| Zions Bancorp NA | | 93,140 | 3,024,256 |
| | | | 536,030,286 |
| Capital Markets - 2.6% | | | |
| Ameriprise Financial, Inc. | | 69,355 | 10,655,009 |
| Bank of New York Mellon Corp. | | 456,811 | 16,376,674 |
| BlackRock, Inc. Class A | | 87,452 | 50,285,775 |
| Cboe Global Markets, Inc. | | 62,203 | 5,455,203 |
| Charles Schwab Corp. | | 649,572 | 21,533,312 |
| CME Group, Inc. | | 203,286 | 33,782,067 |
| E*TRADE Financial Corp. | | 125,318 | 6,362,395 |
| Franklin Resources, Inc. (b) | | 157,744 | 3,320,511 |
| Goldman Sachs Group, Inc. | | 175,462 | 34,734,458 |
| Intercontinental Exchange, Inc. | | 310,222 | 30,023,285 |
| Invesco Ltd. | | 213,249 | 2,141,020 |
| MarketAxess Holdings, Inc. | | 21,491 | 11,104,400 |
| Moody's Corp. | | 91,410 | 25,713,633 |
| Morgan Stanley | | 678,884 | 33,183,850 |
| MSCI, Inc. | | 48,195 | 18,120,356 |
| Northern Trust Corp. | | 117,949 | 9,241,304 |
| Raymond James Financial, Inc. | | 69,118 | 4,802,319 |
| S&P Global, Inc. | | 136,566 | 47,832,242 |
| State Street Corp. | | 199,534 | 12,728,274 |
| T. Rowe Price Group, Inc. | | 128,997 | 17,814,486 |
| The NASDAQ OMX Group, Inc. | | 65,104 | 8,548,806 |
| | | | 403,759,379 |
| Consumer Finance - 0.4% | | | |
| American Express Co. | | 374,203 | 34,920,624 |
| Capital One Financial Corp. | | 258,143 | 16,469,523 |
| Discover Financial Services | | 173,648 | 8,583,421 |
| Synchrony Financial | | 304,470 | 6,737,921 |
| | | | 66,711,489 |
| Diversified Financial Services - 1.4% | | | |
| Berkshire Hathaway, Inc. Class B (a) | | 1,102,106 | 215,770,313 |
| Insurance - 1.9% | | | |
| AFLAC, Inc. | | 406,825 | 14,470,765 |
| Allstate Corp. | | 178,093 | 16,810,198 |
| American International Group, Inc. | | 488,324 | 15,694,733 |
| Aon PLC | | 131,008 | 26,885,462 |
| Arthur J. Gallagher & Co. | | 107,505 | 11,555,712 |
| Assurant, Inc. | | 33,710 | 3,622,814 |
| Chubb Ltd. | | 255,889 | 32,559,316 |
| Cincinnati Financial Corp. | | 85,551 | 6,666,989 |
| Everest Re Group Ltd. | | 22,665 | 4,958,875 |
| Globe Life, Inc. | | 55,478 | 4,416,049 |
| Hartford Financial Services Group, Inc. | | 203,030 | 8,592,230 |
| Lincoln National Corp. | | 109,384 | 4,076,742 |
| Loews Corp. | | 137,226 | 4,996,399 |
| Marsh & McLennan Companies, Inc. | | 289,255 | 33,727,133 |
| MetLife, Inc. | | 437,437 | 16,556,990 |
| Principal Financial Group, Inc. | | 144,424 | 6,127,910 |
| Progressive Corp. | | 331,822 | 29,976,799 |
| Prudential Financial, Inc. | | 223,975 | 14,193,296 |
| The Travelers Companies, Inc. | | 143,351 | 16,402,221 |
| Unum Group | | 115,181 | 1,984,569 |
| W.R. Berkley Corp. | | 80,041 | 4,942,532 |
| Willis Towers Watson PLC | | 72,985 | 15,327,580 |
| | | | 294,545,314 |
|
| TOTAL FINANCIALS | | | 1,516,816,781 |
|
| HEALTH CARE - 14.5% | | | |
| Biotechnology - 2.3% | | | |
| AbbVie, Inc. | | 999,098 | 94,824,391 |
| Alexion Pharmaceuticals, Inc. (a) | | 125,194 | 12,831,133 |
| Amgen, Inc. | | 333,487 | 81,594,264 |
| Biogen, Inc. (a) | | 92,515 | 25,412,945 |
| Gilead Sciences, Inc. | | 710,916 | 49,429,989 |
| Incyte Corp. (a) | | 102,283 | 10,101,469 |
| Regeneron Pharmaceuticals, Inc. (a) | | 57,183 | 36,143,659 |
| Vertex Pharmaceuticals, Inc. (a) | | 146,988 | 39,980,736 |
| | | | 350,318,586 |
| Health Care Equipment & Supplies - 4.0% | | | |
| Abbott Laboratories | | 1,002,786 | 100,920,383 |
| Abiomed, Inc. (a) | | 25,487 | 7,644,571 |
| Align Technology, Inc. (a) | | 40,633 | 11,938,788 |
| Baxter International, Inc. | | 288,468 | 24,917,866 |
| Becton, Dickinson & Co. | | 167,171 | 47,031,889 |
| Boston Scientific Corp. (a) | | 809,955 | 31,239,964 |
| Danaher Corp. | | 356,730 | 72,701,574 |
| Dentsply Sirona, Inc. (b) | | 124,209 | 5,539,721 |
| DexCom, Inc. (a) | | 52,326 | 22,790,066 |
| Edwards Lifesciences Corp. (a) | | 351,296 | 27,545,119 |
| Hologic, Inc. (a) | | 146,382 | 10,214,536 |
| IDEXX Laboratories, Inc. (a) | | 48,150 | 19,151,663 |
| Intuitive Surgical, Inc. (a) | | 66,112 | 45,315,809 |
| Medtronic PLC | | 760,277 | 73,351,525 |
| ResMed, Inc. | | 82,014 | 16,608,655 |
| STERIS PLC | | 48,162 | 7,688,100 |
| Stryker Corp. | | 182,746 | 35,324,802 |
| Teleflex, Inc. | | 26,319 | 9,819,619 |
| The Cooper Companies, Inc. | | 27,855 | 7,881,015 |
| Varian Medical Systems, Inc. (a) | | 51,486 | 7,348,082 |
| West Pharmaceutical Services, Inc. | | 41,727 | 11,219,138 |
| Zimmer Biomet Holdings, Inc. | | 117,240 | 15,810,986 |
| | | | 612,003,871 |
| Health Care Providers & Services - 2.7% | | | |
| AmerisourceBergen Corp. | | 84,187 | 8,434,696 |
| Anthem, Inc. | | 142,931 | 39,134,508 |
| Cardinal Health, Inc. | | 165,533 | 9,041,412 |
| Centene Corp. (a) | | 328,328 | 21,423,402 |
| Cigna Corp. | | 209,187 | 36,124,503 |
| CVS Health Corp. | | 741,029 | 46,640,365 |
| DaVita HealthCare Partners, Inc. (a) | | 48,289 | 4,219,976 |
| HCA Holdings, Inc. | | 149,295 | 18,906,719 |
| Henry Schein, Inc. (a) | | 80,943 | 5,563,212 |
| Humana, Inc. | | 74,951 | 29,414,520 |
| Laboratory Corp. of America Holdings (a) | | 55,107 | 10,631,242 |
| McKesson Corp. | | 91,762 | 13,778,982 |
| Quest Diagnostics, Inc. | | 75,819 | 9,634,320 |
| UnitedHealth Group, Inc. | | 537,655 | 162,791,181 |
| Universal Health Services, Inc. Class B | | 44,023 | 4,838,128 |
| | | | 420,577,166 |
| Health Care Technology - 0.1% | | | |
| Cerner Corp. | | 172,542 | 11,983,042 |
| Life Sciences Tools & Services - 1.2% | | | |
| Agilent Technologies, Inc. | | 175,055 | 16,863,048 |
| Bio-Rad Laboratories, Inc. Class A (a) | | 12,118 | 6,360,617 |
| Illumina, Inc. (a) | | 83,337 | 31,848,068 |
| IQVIA Holdings, Inc. (a) | | 100,684 | 15,947,339 |
| Mettler-Toledo International, Inc. (a) | | 13,554 | 12,672,990 |
| PerkinElmer, Inc. | | 63,153 | 7,509,523 |
| Thermo Fisher Scientific, Inc. | | 223,905 | 92,685,475 |
| Waters Corp. (a) | | 35,100 | 7,481,565 |
| | | | 191,368,625 |
| Pharmaceuticals - 4.2% | | | |
| Bristol-Myers Squibb Co. | | 1,282,779 | 75,247,816 |
| Eli Lilly & Co. | | 477,459 | 71,757,313 |
| Johnson & Johnson | | 1,493,605 | 217,707,865 |
| Merck & Co., Inc. | | 1,430,972 | 114,821,193 |
| Mylan NV (a) | | 292,969 | 4,719,731 |
| Perrigo Co. PLC | | 77,191 | 4,092,667 |
| Pfizer, Inc. | | 3,149,159 | 121,179,638 |
| Zoetis, Inc. Class A | | 269,255 | 40,840,598 |
| | | | 650,366,821 |
|
| TOTAL HEALTH CARE | | | 2,236,618,111 |
|
| INDUSTRIALS - 7.9% | | | |
| Aerospace & Defense - 1.6% | | | |
| General Dynamics Corp. | | 131,728 | 19,329,767 |
| Harris Corp. | | 122,383 | 20,600,730 |
| Howmet Aerospace, Inc. | | 218,255 | 3,225,809 |
| Huntington Ingalls Industries, Inc. | | 22,906 | 3,979,001 |
| Lockheed Martin Corp. | | 139,904 | 53,019,419 |
| Northrop Grumman Corp. | | 87,891 | 28,565,454 |
| Raytheon Technologies Corp. | | 833,808 | 47,260,237 |
| Teledyne Technologies, Inc. (a) | | 20,786 | 6,375,066 |
| Textron, Inc. | | 128,980 | 4,506,561 |
| The Boeing Co. | | 303,929 | 48,020,782 |
| TransDigm Group, Inc. | | 28,508 | 12,303,483 |
| | | | 247,186,309 |
| Air Freight & Logistics - 0.6% | | | |
| C.H. Robinson Worldwide, Inc. (b) | | 76,315 | 7,152,242 |
| Expeditors International of Washington, Inc. | | 94,347 | 7,973,265 |
| FedEx Corp. | | 136,258 | 22,945,847 |
| United Parcel Service, Inc. Class B | | 399,172 | 56,985,795 |
| | | | 95,057,149 |
| Airlines - 0.2% | | | |
| Alaska Air Group, Inc. | | 69,519 | 2,394,234 |
| American Airlines Group, Inc. (b) | | 282,574 | 3,142,223 |
| Delta Air Lines, Inc. | | 321,707 | 8,033,024 |
| Southwest Airlines Co. | | 303,999 | 9,390,529 |
| United Airlines Holdings, Inc. (a)(b) | | 143,219 | 4,494,212 |
| | | | 27,454,222 |
| Building Products - 0.4% | | | |
| A.O. Smith Corp. | | 76,422 | 3,678,955 |
| Allegion PLC (b) | | 52,276 | 5,199,371 |
| Carrier Global Corp. | | 461,593 | 12,573,793 |
| Fortune Brands Home & Security, Inc. | | 79,210 | 6,059,565 |
| Johnson Controls International PLC | | 421,743 | 16,228,671 |
| Masco Corp. | | 149,537 | 8,547,535 |
| Trane Technologies PLC | | 135,615 | 15,171,250 |
| | | | 67,459,140 |
| Commercial Services & Supplies - 0.4% | | | |
| Cintas Corp. (b) | | 47,782 | 14,423,952 |
| Copart, Inc. (a) | | 117,135 | 10,922,839 |
| Republic Services, Inc. | | 119,130 | 10,394,093 |
| Rollins, Inc. | | 79,782 | 4,180,577 |
| Waste Management, Inc. | | 220,127 | 24,125,919 |
| | | | 64,047,380 |
| Construction & Engineering - 0.1% | | | |
| Jacobs Engineering Group, Inc. | | 73,739 | 6,293,624 |
| Quanta Services, Inc. | | 78,261 | 3,128,092 |
| | | | 9,421,716 |
| Electrical Equipment - 0.5% | | | |
| AMETEK, Inc. | | 130,071 | 12,129,121 |
| Eaton Corp. PLC | | 226,766 | 21,118,718 |
| Emerson Electric Co. | | 338,718 | 21,003,903 |
| Rockwell Automation, Inc. | | 65,662 | 14,323,509 |
| | | | 68,575,251 |
| Industrial Conglomerates - 1.1% | | | |
| 3M Co. | | 326,090 | 49,066,762 |
| General Electric Co. | | 4,958,955 | 30,100,857 |
| Honeywell International, Inc. | | 397,890 | 59,432,829 |
| Roper Technologies, Inc. | | 59,186 | 25,594,986 |
| | | | 164,195,434 |
| Machinery - 1.5% | | | |
| Caterpillar, Inc. | | 306,838 | 40,772,633 |
| Cummins, Inc. | | 83,637 | 16,163,687 |
| Deere & Co. | | 177,365 | 31,271,223 |
| Dover Corp. | | 81,608 | 8,399,911 |
| Flowserve Corp. | | 73,738 | 2,055,078 |
| Fortive Corp. | | 168,057 | 11,795,921 |
| Gardner Denver Holdings, Inc. (a) | | 196,042 | 6,192,967 |
| IDEX Corp. | | 42,745 | 7,045,231 |
| Illinois Tool Works, Inc. | | 162,985 | 30,150,595 |
| Otis Worldwide Corp. | | 230,787 | 14,479,576 |
| PACCAR, Inc. | | 196,003 | 16,675,935 |
| Parker Hannifin Corp. | | 72,772 | 13,020,366 |
| Pentair PLC | | 93,799 | 4,019,287 |
| Snap-On, Inc. | | 30,798 | 4,492,504 |
| Stanley Black & Decker, Inc. | | 87,378 | 13,396,795 |
| Westinghouse Air Brake Co. | | 102,499 | 6,374,413 |
| Xylem, Inc. | | 102,003 | 7,444,179 |
| | | | 233,750,301 |
| Professional Services - 0.3% | | | |
| Equifax, Inc. | | 68,810 | 11,185,754 |
| IHS Markit Ltd. | | 226,138 | 18,256,121 |
| Nielsen Holdings PLC | | 202,541 | 2,922,667 |
| Robert Half International, Inc. | | 65,183 | 3,315,859 |
| Verisk Analytics, Inc. | | 91,976 | 17,356,791 |
| | | | 53,037,192 |
| Road & Rail - 1.0% | | | |
| CSX Corp. | | 433,952 | 30,958,136 |
| J.B. Hunt Transport Services, Inc. | | 47,833 | 6,189,590 |
| Kansas City Southern | | 53,869 | 9,257,388 |
| Norfolk Southern Corp. | | 145,231 | 27,914,851 |
| Old Dominion Freight Lines, Inc. | | 53,493 | 9,779,590 |
| Union Pacific Corp. | | 384,688 | 66,685,665 |
| | | | 150,785,220 |
| Trading Companies & Distributors - 0.2% | | | |
| Fastenal Co. | | 324,746 | 15,276,052 |
| United Rentals, Inc. (a) | | 40,849 | 6,346,709 |
| W.W. Grainger, Inc. | | 24,553 | 8,385,586 |
| | | | 30,008,347 |
|
| TOTAL INDUSTRIALS | | | 1,210,977,661 |
|
| INFORMATION TECHNOLOGY - 27.4% | | | |
| Communications Equipment - 0.9% | | | |
| Arista Networks, Inc. (a) | | 30,475 | 7,916,491 |
| Cisco Systems, Inc. | | 2,404,243 | 113,239,845 |
| F5 Networks, Inc. (a) | | 34,504 | 4,689,094 |
| Juniper Networks, Inc. | | 187,761 | 4,765,374 |
| Motorola Solutions, Inc. | | 96,416 | 13,478,957 |
| | | | 144,089,761 |
| Electronic Equipment & Components - 0.5% | | | |
| Amphenol Corp. Class A | | 167,752 | 17,741,452 |
| CDW Corp. | | 80,686 | 9,379,748 |
| Corning, Inc. | | 430,304 | 13,339,424 |
| FLIR Systems, Inc. | | 74,373 | 3,098,379 |
| IPG Photonics Corp. (a) | | 20,081 | 3,594,700 |
| Keysight Technologies, Inc. (a) | | 106,042 | 10,592,535 |
| TE Connectivity Ltd. | | 187,000 | 16,656,090 |
| Zebra Technologies Corp. Class A (a) | | 30,100 | 8,450,575 |
| | | | 82,852,903 |
| IT Services - 5.6% | | | |
| Accenture PLC Class A | | 361,139 | 81,176,824 |
| Akamai Technologies, Inc. (a)(b) | | 91,998 | 10,344,255 |
| Automatic Data Processing, Inc. | | 243,643 | 32,382,591 |
| Broadridge Financial Solutions, Inc. | | 65,092 | 8,744,459 |
| Cognizant Technology Solutions Corp. Class A | | 306,467 | 20,937,825 |
| DXC Technology Co. | | 143,989 | 2,578,843 |
| Fidelity National Information Services, Inc. | | 350,262 | 51,246,833 |
| Fiserv, Inc. (a) | | 318,817 | 31,814,748 |
| FleetCor Technologies, Inc. (a) | | 47,509 | 12,284,402 |
| Gartner, Inc. (a) | | 50,555 | 6,301,175 |
| Global Payments, Inc. | | 169,569 | 30,186,673 |
| IBM Corp. | | 503,359 | 61,882,955 |
| Jack Henry & Associates, Inc. | | 43,435 | 7,744,461 |
| Leidos Holdings, Inc. | | 75,697 | 7,203,327 |
| MasterCard, Inc. Class A | | 501,043 | 154,586,797 |
| Paychex, Inc. | | 180,988 | 13,016,657 |
| PayPal Holdings, Inc. (a) | | 665,651 | 130,514,192 |
| The Western Union Co. | | 232,959 | 5,656,245 |
| VeriSign, Inc. (a) | | 57,641 | 12,201,447 |
| Visa, Inc. Class A | | 956,448 | 182,107,699 |
| | | | 862,912,408 |
| Semiconductors & Semiconductor Equipment - 4.7% | | | |
| Advanced Micro Devices, Inc. (a) | | 663,971 | 51,411,275 |
| Analog Devices, Inc. | | 208,869 | 23,988,605 |
| Applied Materials, Inc. | | 519,570 | 33,423,938 |
| Broadcom, Inc. | | 226,648 | 71,790,754 |
| Intel Corp. | | 2,400,339 | 114,568,180 |
| KLA-Tencor Corp. | | 87,900 | 17,565,057 |
| Lam Research Corp. | | 82,295 | 31,038,382 |
| Maxim Integrated Products, Inc. | | 151,159 | 10,292,416 |
| Microchip Technology, Inc. | | 139,085 | 14,149,117 |
| Micron Technology, Inc. (a)(b) | | 630,530 | 31,561,179 |
| NVIDIA Corp. | | 348,731 | 148,067,695 |
| Qorvo, Inc. (a) | | 65,048 | 8,335,901 |
| Qualcomm, Inc. | | 637,742 | 67,351,933 |
| Skyworks Solutions, Inc. | | 94,584 | 13,769,539 |
| Texas Instruments, Inc. | | 520,301 | 66,364,393 |
| Xilinx, Inc. | | 137,855 | 14,798,734 |
| | | | 718,477,098 |
| Software - 9.0% | | | |
| Adobe, Inc. (a) | | 273,142 | 121,362,453 |
| ANSYS, Inc. (a)(b) | | 48,707 | 15,128,394 |
| Autodesk, Inc. (a) | | 124,268 | 29,380,683 |
| Cadence Design Systems, Inc. (a) | | 158,280 | 17,292,090 |
| Citrix Systems, Inc. | | 65,789 | 9,392,038 |
| Fortinet, Inc. (a) | | 76,064 | 10,519,651 |
| Intuit, Inc. | | 147,836 | 45,292,515 |
| Microsoft Corp. | | 4,299,190 | 881,376,942 |
| Nortonlifelock, Inc. | | 307,226 | 6,589,998 |
| Oracle Corp. | | 1,179,965 | 65,429,059 |
| Paycom Software, Inc. (a) | | 27,350 | 7,777,520 |
| Salesforce.com, Inc. (a) | | 510,794 | 99,528,211 |
| ServiceNow, Inc. (a) | | 108,114 | 47,483,669 |
| Synopsys, Inc. (a) | | 85,486 | 17,030,521 |
| Tyler Technologies, Inc. (a) | | 22,543 | 8,053,487 |
| | | | 1,381,637,231 |
| Technology Hardware, Storage & Peripherals - 6.7% | | | |
| Apple, Inc. | | 2,309,783 | 981,750,162 |
| Hewlett Packard Enterprise Co. | | 728,555 | 7,190,838 |
| HP, Inc. | | 810,696 | 14,252,036 |
| NetApp, Inc. | | 125,394 | 5,554,954 |
| Seagate Technology LLC (b) | | 128,037 | 5,789,833 |
| Western Digital Corp. | | 169,923 | 7,323,681 |
| Xerox Holdings Corp. | | 103,394 | 1,721,510 |
| | | | 1,023,583,014 |
|
| TOTAL INFORMATION TECHNOLOGY | | | 4,213,552,415 |
|
| MATERIALS - 2.6% | | | |
| Chemicals - 1.8% | | | |
| Air Products & Chemicals, Inc. | | 125,208 | 35,888,369 |
| Albemarle Corp. U.S. (b) | | 60,260 | 4,969,040 |
| Celanese Corp. Class A | | 67,035 | 6,515,802 |
| CF Industries Holdings, Inc. | | 120,893 | 3,787,578 |
| Corteva, Inc. | | 424,291 | 12,117,751 |
| Dow, Inc. | | 419,935 | 17,242,531 |
| DuPont de Nemours, Inc. | | 416,016 | 22,248,536 |
| Eastman Chemical Co. | | 77,060 | 5,750,988 |
| Ecolab, Inc. | | 140,197 | 26,228,055 |
| FMC Corp. | | 73,389 | 7,782,903 |
| International Flavors & Fragrances, Inc. (b) | | 60,580 | 7,630,051 |
| Linde PLC | | 297,738 | 72,978,561 |
| LyondellBasell Industries NV Class A | | 145,675 | 9,107,601 |
| PPG Industries, Inc. | | 133,752 | 14,398,403 |
| Sherwin-Williams Co. | | 45,814 | 29,683,807 |
| The Mosaic Co. | | 198,008 | 2,667,168 |
| | | | 278,997,144 |
| Construction Materials - 0.1% | | | |
| Martin Marietta Materials, Inc. | | 35,286 | 7,310,553 |
| Vulcan Materials Co. | | 75,078 | 8,815,659 |
| | | | 16,126,212 |
| Containers & Packaging - 0.3% | | | |
| Amcor PLC | | 892,540 | 9,193,162 |
| Avery Dennison Corp. | | 47,218 | 5,351,688 |
| Ball Corp. | | 184,804 | 13,607,119 |
| International Paper Co. | | 222,804 | 7,751,351 |
| Packaging Corp. of America | | 53,767 | 5,168,084 |
| Sealed Air Corp. | | 88,506 | 3,157,894 |
| WestRock Co. | | 146,836 | 3,944,015 |
| | | | 48,173,313 |
| Metals & Mining - 0.4% | | | |
| Freeport-McMoRan, Inc. | | 823,155 | 10,635,163 |
| Newmont Corp. | | 455,001 | 31,486,069 |
| Nucor Corp. | | 170,739 | 7,162,501 |
| | | | 49,283,733 |
|
| TOTAL MATERIALS | | | 392,580,402 |
|
| REAL ESTATE - 2.8% | | | |
| Equity Real Estate Investment Trusts (REITs) - 2.7% | | | |
| Alexandria Real Estate Equities, Inc. | | 71,538 | 12,701,572 |
| American Tower Corp. | | 251,314 | 65,690,966 |
| Apartment Investment & Management Co. Class A | | 84,634 | 3,285,492 |
| AvalonBay Communities, Inc. | | 79,779 | 12,215,760 |
| Boston Properties, Inc. | | 81,910 | 7,297,362 |
| Crown Castle International Corp. | | 236,258 | 39,384,209 |
| Digital Realty Trust, Inc. | | 152,110 | 24,419,739 |
| Duke Realty Corp. | | 208,825 | 8,392,677 |
| Equinix, Inc. | | 50,179 | 39,414,601 |
| Equity Residential (SBI) | | 198,296 | 10,634,614 |
| Essex Property Trust, Inc. | | 37,083 | 8,185,701 |
| Extra Space Storage, Inc. | | 73,177 | 7,562,111 |
| Federal Realty Investment Trust (SBI) | | 39,979 | 3,050,398 |
| HCP, Inc. | | 305,131 | 8,327,025 |
| Host Hotels & Resorts, Inc. | | 399,351 | 4,305,004 |
| Iron Mountain, Inc. | | 163,137 | 4,598,832 |
| Kimco Realty Corp. | | 245,620 | 2,738,663 |
| Mid-America Apartment Communities, Inc. | | 64,819 | 7,725,777 |
| Prologis (REIT), Inc. | | 418,705 | 44,139,881 |
| Public Storage | | 85,215 | 17,032,774 |
| Realty Income Corp. | | 194,680 | 11,690,534 |
| Regency Centers Corp. | | 96,002 | 3,938,962 |
| SBA Communications Corp. Class A | | 63,280 | 19,714,251 |
| Simon Property Group, Inc. | | 173,329 | 10,807,063 |
| SL Green Realty Corp. | | 43,342 | 2,015,403 |
| UDR, Inc. | | 167,156 | 6,051,047 |
| Ventas, Inc. | | 211,500 | 8,113,140 |
| Vornado Realty Trust | | 90,194 | 3,113,497 |
| Welltower, Inc. | | 236,673 | 12,676,206 |
| Weyerhaeuser Co. | | 423,022 | 11,764,242 |
| | | | 420,987,503 |
| Real Estate Management & Development - 0.1% | | | |
| CBRE Group, Inc. (a) | | 190,023 | 8,324,908 |
|
| TOTAL REAL ESTATE | | | 429,312,411 |
|
| UTILITIES - 3.1% | | | |
| Electric Utilities - 1.9% | | | |
| Alliant Energy Corp. | | 141,462 | 7,617,729 |
| American Electric Power Co., Inc. | | 280,954 | 24,409,284 |
| Duke Energy Corp. | | 416,609 | 35,303,447 |
| Edison International | | 214,268 | 11,928,300 |
| Entergy Corp. | | 113,479 | 11,930,047 |
| Evergy, Inc. | | 128,553 | 8,334,091 |
| Eversource Energy | | 190,735 | 17,179,501 |
| Exelon Corp. | | 552,433 | 21,329,438 |
| FirstEnergy Corp. | | 307,144 | 8,907,176 |
| NextEra Energy, Inc. | | 277,474 | 77,886,952 |
| NRG Energy, Inc. | | 138,268 | 4,674,841 |
| Pinnacle West Capital Corp. | | 63,786 | 5,299,341 |
| PPL Corp. | | 435,840 | 11,602,061 |
| Southern Co. | | 598,635 | 32,691,457 |
| Xcel Energy, Inc. | | 297,648 | 20,549,618 |
| | | | 299,643,283 |
| Gas Utilities - 0.1% | | | |
| Atmos Energy Corp. | | 69,342 | 7,349,559 |
| Independent Power and Renewable Electricity Producers - 0.0% | | | |
| The AES Corp. | | 376,963 | 5,741,146 |
| Multi-Utilities - 1.0% | | | |
| Ameren Corp. | | 139,966 | 11,230,872 |
| CenterPoint Energy, Inc. | | 308,802 | 5,870,326 |
| CMS Energy Corp. | | 162,257 | 10,413,654 |
| Consolidated Edison, Inc. | | 189,414 | 14,552,678 |
| Dominion Energy, Inc. | | 475,779 | 38,552,372 |
| DTE Energy Co. | | 109,196 | 12,626,333 |
| NiSource, Inc. | | 217,048 | 5,306,824 |
| Public Service Enterprise Group, Inc. | | 286,647 | 16,035,033 |
| Sempra Energy | | 165,841 | 20,640,571 |
| WEC Energy Group, Inc. | | 178,820 | 17,034,393 |
| | | | 152,263,056 |
| Water Utilities - 0.1% | | | |
| American Water Works Co., Inc. | | 102,617 | 15,112,406 |
|
| TOTAL UTILITIES | | | 480,109,450 |
|
| TOTAL COMMON STOCKS | | | |
| (Cost $10,918,954,349) | | | 15,336,009,821 |
| | | Principal Amount | Value |
|
| U.S. Treasury Obligations - 0.0% | | | |
| U.S. Treasury Bills, yield at date of purchase 0.13% 11/5/20 (c) | | | |
| (Cost $489,824) | | 490,000 | 489,878 |
| | | Shares | Value |
|
| Money Market Funds - 0.7% | | | |
| Fidelity Cash Central Fund 0.14% (d) | | 48,330,095 | $48,344,594 |
| Fidelity Securities Lending Cash Central Fund 0.13% (d)(e) | | 58,716,999 | 58,722,871 |
| TOTAL MONEY MARKET FUNDS | | | |
| (Cost $107,066,932) | | | 107,067,465 |
| TOTAL INVESTMENT IN SECURITIES - 100.2% | | | |
| (Cost $11,026,511,105) | | | 15,443,567,164 |
| NET OTHER ASSETS (LIABILITIES) - (0.2)% | | | (37,122,678) |
| NET ASSETS - 100% | | | $15,406,444,486 |
| Futures Contracts | | | | | |
| | Number of contracts | Expiration Date | Notional Amount | Value | Unrealized Appreciation/(Depreciation) |
| Purchased | | | | | |
| Equity Index Contracts | | | | | |
| CME E-mini S&P 500 Index Contracts (United States) | 447 | Sept. 2020 | $72,939,225 | $2,605,274 | $2,605,274 |
The notional amount of futures purchased as a percentage of Net Assets is 0.5%
Legend
(a) Non-income producing
(b) Security or a portion of the security is on loan at period end.
(c) Security or a portion of the security was pledged to cover margin requirements for futures contracts. At period end, the value of securities pledged amounted to $489,878.
(d) Affiliated fund that is generally available only to investment companies and other accounts managed by Fidelity Investments. The rate quoted is the annualized seven-day yield of the fund at period end. A complete unaudited listing of the fund's holdings as of its most recent quarter end is available upon request. In addition, each Fidelity Central Fund's financial statements, which are not covered by the Fund's Report of Independent Registered Public Accounting Firm, are available on the SEC's website or upon request.
(e) Investment made with cash collateral received from securities on loan.
Affiliated Central Funds
Information regarding fiscal year to date income earned by the Fund from investments in Fidelity Central Funds is as follows:
| Fund | Income earned |
| Fidelity Cash Central Fund | $661,736 |
| Fidelity Securities Lending Cash Central Fund | 759,708 |
| Total | $1,421,444 |
Amounts in the income column in the above table include any capital gain distributions from underlying funds, which are presented in the corresponding line-item in the Statement of Operations, if applicable. Amount for Fidelity Securities Lending Cash Central Fund represents the income earned on investing cash collateral, less rebates paid to borrowers and any lending agent fees associated with the loan, plus any premium payments received for lending certain types of securities.
Investment Valuation
The following is a summary of the inputs used, as of July 31, 2020, involving the Fund's assets and liabilities carried at fair value. The inputs or methodology used for valuing securities may not be an indication of the risk associated with investing in those securities. For more information on valuation inputs, and their aggregation into the levels used below, please refer to the Investment Valuation section in the accompanying Notes to Financial Statements.
| | Valuation Inputs at Reporting Date: |
| Description | Total | Level 1 | Level 2 | Level 3 |
| Investments in Securities: | | | | |
| Equities: | | | | |
| Communication Services | $1,671,004,896 | $1,671,004,896 | $-- | $-- |
| Consumer Discretionary | 1,714,964,737 | 1,714,964,737 | -- | -- |
| Consumer Staples | 1,081,028,572 | 1,081,028,572 | -- | -- |
| Energy | 389,044,385 | 389,044,385 | -- | -- |
| Financials | 1,516,816,781 | 1,516,816,781 | -- | -- |
| Health Care | 2,236,618,111 | 2,236,618,111 | -- | -- |
| Industrials | 1,210,977,661 | 1,210,977,661 | -- | -- |
| Information Technology | 4,213,552,415 | 4,213,552,415 | -- | -- |
| Materials | 392,580,402 | 392,580,402 | -- | -- |
| Real Estate | 429,312,411 | 429,312,411 | -- | -- |
| Utilities | 480,109,450 | 480,109,450 | -- | -- |
| U.S. Government and Government Agency Obligations | 489,878 | -- | 489,878 | -- |
| Money Market Funds | 107,067,465 | 107,067,465 | -- | -- |
| Total Investments in Securities: | $15,443,567,164 | $15,443,077,286 | $489,878 | $-- |
| Derivative Instruments: | | | | |
| Assets | | | | |
| Futures Contracts | $2,605,274 | $2,605,274 | $-- | $-- |
| Total Assets | $2,605,274 | $2,605,274 | $-- | $-- |
| Total Derivative Instruments: | $2,605,274 | $2,605,274 | $-- | $-- |
Value of Derivative Instruments
The following table is a summary of the Fund's value of derivative instruments by primary risk exposure as of July 31, 2020. For additional information on derivative instruments, please refer to the Derivative Instruments section in the accompanying Notes to Financial Statements.
| Primary Risk Exposure / Derivative Type | Value |
| | Asset | Liability |
| Equity Risk | | |
| Futures Contracts(a) | $2,605,274 | $0 |
| Total Equity Risk | 2,605,274 | 0 |
| Total Value of Derivatives | $2,605,274 | $0 |
(a) Reflects gross cumulative appreciation (depreciation) on futures contracts as presented in the Schedule of Investments. In the Statement of Assets and Liabilities, the period end daily variation margin is included in receivable or payable for daily variation margin on futures contracts, and the net cumulative appreciation (depreciation) is included in Total accumulated earnings (loss).
See accompanying notes which are an integral part of the financial statements.
Financial Statements
Statement of Assets and Liabilities
| | | July 31, 2020 |
| Assets | | |
Investment in securities, at value (including securities loaned of $57,113,924) — See accompanying schedule:
Unaffiliated issuers (cost $10,919,444,173) | $15,336,499,699 | |
| Fidelity Central Funds (cost $107,066,932) | 107,067,465 | |
| Total Investment in Securities (cost $11,026,511,105) | | $15,443,567,164 |
| Segregated cash with brokers for derivative instruments | | 4,550,631 |
| Receivable for investments sold | | 70,772,987 |
| Receivable for fund shares sold | | 26,782,883 |
| Dividends receivable | | 14,877,990 |
| Distributions receivable from Fidelity Central Funds | | 110,489 |
| Receivable for daily variation margin on futures contracts | | 305,263 |
| Prepaid expenses | | 2,477 |
| Receivable from investment adviser for expense reductions | | 46,801 |
| Total assets | | 15,561,016,685 |
| Liabilities | | |
| Payable for fund shares redeemed | $95,554,791 | |
| Accrued management fee | 192,229 | |
| Other payables and accrued expenses | 72,132 | |
| Collateral on securities loaned | 58,753,047 | |
| Total liabilities | | 154,572,199 |
| Net Assets | | $15,406,444,486 |
| Net Assets consist of: | | |
| Paid in capital | | $11,161,345,636 |
| Total accumulated earnings (loss) | | 4,245,098,850 |
| Net Assets | | $15,406,444,486 |
| Net Asset Value, offering price and redemption price per share ($15,406,444,486 ÷ 871,352,659 shares) | | $17.68 |
See accompanying notes which are an integral part of the financial statements.
Statement of Operations
| | | Year ended July 31, 2020 |
| Investment Income | | |
| Dividends | | $285,243,817 |
| Interest | | 28,025 |
| Income from Fidelity Central Funds (including $759,708 from security lending) | | 1,421,444 |
| Total income | | 286,693,286 |
| Expenses | | |
| Management fee | $2,159,782 | |
| Custodian fees and expenses | 233,902 | |
| Independent trustees' fees and expenses | 50,820 | |
| Registration fees | 141,711 | |
| Audit | 54,091 | |
| Legal | 26,273 | |
| Interest | 354,174 | |
| Miscellaneous | 86,651 | |
| Total expenses before reductions | 3,107,404 | |
| Expense reductions | (510,013) | |
| Total expenses after reductions | | 2,597,391 |
| Net investment income (loss) | | 284,095,895 |
| Realized and Unrealized Gain (Loss) | | |
| Net realized gain (loss) on: | | |
| Investment securities: | | |
| Unaffiliated issuers | 16,592,971 | |
| Fidelity Central Funds | (28,300) | |
| Futures contracts | 5,092,004 | |
| Total net realized gain (loss) | | 21,656,675 |
| Change in net unrealized appreciation (depreciation) on: | | |
| Investment securities: | | |
| Unaffiliated issuers | 1,358,332,978 | |
| Fidelity Central Funds | 533 | |
| Futures contracts | 2,520,871 | |
| Total change in net unrealized appreciation (depreciation) | | 1,360,854,382 |
| Net gain (loss) | | 1,382,511,057 |
| Net increase (decrease) in net assets resulting from operations | | $1,666,606,952 |
See accompanying notes which are an integral part of the financial statements.
Statement of Changes in Net Assets
| | Year ended July 31, 2020 | Year ended July 31, 2019 |
| Increase (Decrease) in Net Assets | | |
| Operations | | |
| Net investment income (loss) | $284,095,895 | $263,358,895 |
| Net realized gain (loss) | 21,656,675 | 2,241,432 |
| Change in net unrealized appreciation (depreciation) | 1,360,854,382 | 789,272,776 |
| Net increase (decrease) in net assets resulting from operations | 1,666,606,952 | 1,054,873,103 |
| Distributions to shareholders | (277,507,662) | (252,730,587) |
| Share transactions | | |
| Proceeds from sales of shares | 17,656,249,318 | 8,580,156,047 |
| Reinvestment of distributions | 184,843,686 | 50,761,849 |
| Cost of shares redeemed | (17,870,724,118) | (9,078,580,860) |
| Net increase (decrease) in net assets resulting from share transactions | (29,631,114) | (447,662,964) |
| Total increase (decrease) in net assets | 1,359,468,176 | 354,479,552 |
| Net Assets | | |
| Beginning of period | 14,046,976,310 | 13,692,496,758 |
| End of period | $15,406,444,486 | $14,046,976,310 |
| Other Information | | |
| Shares | | |
| Sold | 1,091,411,412 | 572,376,419 |
| Issued in reinvestment of distributions | 11,014,839 | 3,587,315 |
| Redeemed | (1,104,319,712) | (603,215,389) |
| Net increase (decrease) | (1,893,461) | (27,251,655) |
See accompanying notes which are an integral part of the financial statements.
Financial Highlights
Fidelity SAI U.S. Large Cap Index Fund
| | | | | | |
| Years ended July 31, | 2020 | 2019 | 2018 | 2017 | 2016 A |
| Selected Per–Share Data | | | | | |
| Net asset value, beginning of period | $16.09 | $15.21 | $13.30 | $11.55 | $10.00 |
| Income from Investment Operations | | | | | |
| Net investment income (loss)B | .32 | .30 | .27 | .25 | .07 |
| Net realized and unrealized gain (loss) | 1.56 | .87 | 1.86 | 1.59 | 1.48 |
| Total from investment operations | 1.88 | 1.17 | 2.13 | 1.84 | 1.55 |
| Distributions from net investment income | (.29) | (.28) | (.19) | (.09) | – |
| Distributions from net realized gain | – | (.01) | (.03) | –C | – |
| Total distributions | (.29) | (.29) | (.22) | (.09) | – |
| Net asset value, end of period | $17.68 | $16.09 | $15.21 | $13.30 | $11.55 |
| Total ReturnD,E | 11.84% | 7.97% | 16.22% | 16.03% | 15.50% |
| Ratios to Average Net AssetsF,G | | | | | |
| Expenses before reductions | .02% | .09% | .09% | .09% | .22%H |
| Expenses net of fee waivers, if any | .02% | .02% | .02% | .02% | .02%H |
| Expenses net of all reductions | .02% | .02% | .02% | .02% | .02%H |
| Net investment income (loss) | 1.97% | 2.00% | 1.87% | 2.05% | 1.33%H |
| Supplemental Data | | | | | |
| Net assets, end of period (000 omitted) | $15,406,444 | $14,046,976 | $13,692,497 | $8,155,030 | $2,439,831 |
| Portfolio turnover rateI | 80% | 41% | 26% | 17% | - %J |
A For the period February 2, 2016 (commencement of operations) to July 31, 2016.
B Calculated based on average shares outstanding during the period.
C Amount represents less than $.005 per share.
D Total returns for periods of less than one year are not annualized.
E Total returns would have been lower if certain expenses had not been reduced during the applicable periods shown.
F Fees and expenses of any underlying mutual funds or exchange-traded funds (ETFs) are not included in the Fund's expense ratio. The Fund indirectly bears its proportionate share of these expenses. For additional expense information related to investments in Fidelity Central Funds, please refer to the "Investments in Fidelity Central Funds" note found in the Notes to Financial Statements section of the most recent Annual or Semi-Annual report.
G Expense ratios reflect operating expenses of the Fund. Expenses before reductions do not reflect amounts reimbursed by the investment adviser or reductions from expense offset arrangements and do not represent the amount paid by the Fund during periods when reimbursements or reductions occur. Expense ratios before reductions for start-up periods may not be representative of longer term operating periods. Expenses net of fee waivers reflect expenses after reimbursement by the investment adviser but prior to reductions from expense offset arrangements. Expenses net of all reductions represent the net expenses paid by the Fund.
H Annualized
I Amount does not include the portfolio activity of any underlying Fidelity Central Funds.
J Amount not annualized.
See accompanying notes which are an integral part of the financial statements.
Notes to Financial Statements
For the period ended July 31, 2020
1. Organization.
Fidelity SAI U.S. Large Cap Index Fund (the Fund) is a fund of Fidelity Salem Street Trust (the Trust) and is authorized to issue an unlimited number of shares. Shares are offered exclusively to certain clients of Fidelity Management & Research Company LLC (FMR) or its affiliates. The Trust is registered under the Investment Company Act of 1940, as amended (the 1940 Act), as an open-end management investment company organized as a Massachusetts business trust.
Effective January 1, 2020:
Investment advisers Fidelity Investments Money Management, Inc., FMR Co., Inc., and Fidelity SelectCo, LLC, merged with and into Fidelity Management & Research Company. In connection with the merger transactions, the resulting, merged investment adviser was then redomiciled from Massachusetts to Delaware, changed its corporate structure from a corporation to a limited liability company, and changed its name to "Fidelity Management & Research Company LLC".
2. Investments in Fidelity Central Funds.
The Fund invests in Fidelity Central Funds, which are open-end investment companies generally available only to other investment companies and accounts managed by the investment adviser and its affiliates. The Fund's Schedule of Investments lists each of the Fidelity Central Funds held as of period end, if any, as an investment of the Fund, but does not include the underlying holdings of each Fidelity Central Fund. As an Investing Fund, the Fund indirectly bears its proportionate share of the expenses of the underlying Fidelity Central Funds.
The Money Market Central Funds seek preservation of capital and current income and are managed by the investment adviser. Annualized expenses of the Money Market Central Funds as of their most recent shareholder report date ranged from less than .005% to .01%.
A complete unaudited list of holdings for each Fidelity Central Fund is available upon request or at the Securities and Exchange Commission (the SEC) website at www.sec.gov. In addition, the financial statements of the Fidelity Central Funds, which are not covered by the Fund's Report of Independent Registered Public Accounting Firm, are available on the SEC website or upon request.
3. Significant Accounting Policies.
The Fund is an investment company and applies the accounting and reporting guidance of the Financial Accounting Standards Board (FASB) Accounting Standards Codification Topic 946 Financial Services – Investment Companies. The financial statements have been prepared in conformity with accounting principles generally accepted in the United States of America (GAAP), which require management to make certain estimates and assumptions at the date of the financial statements. Actual results could differ from those estimates. Subsequent events, if any, through the date that the financial statements were issued have been evaluated in the preparation of the financial statements. The following summarizes the significant accounting policies of the Fund:
Investment Valuation. Investments are valued as of 4:00 p.m. Eastern time on the last calendar day of the period. The Board of Trustees (the Board) has delegated the day to day responsibility for the valuation of the Fund's investments to the Fair Value Committee (the Committee) established by the Fund's investment adviser. In accordance with valuation policies and procedures approved by the Board, the Fund attempts to obtain prices from one or more third party pricing vendors or brokers to value its investments. When current market prices, quotations or currency exchange rates are not readily available or reliable, investments will be fair valued in good faith by the Committee, in accordance with procedures adopted by the Board. Factors used in determining fair value vary by investment type and may include market or investment specific events, changes in interest rates and credit quality. The frequency with which these procedures are used cannot be predicted and they may be utilized to a significant extent. The Committee oversees the Fund's valuation policies and procedures and reports to the Board on the Committee's activities and fair value determinations. The Board monitors the appropriateness of the procedures used in valuing the Fund's investments and ratifies the fair value determinations of the Committee.
The Fund categorizes the inputs to valuation techniques used to value its investments into a disclosure hierarchy consisting of three levels as shown below:
- Level 1 – quoted prices in active markets for identical investments
- Level 2 – other significant observable inputs (including quoted prices for similar investments, interest rates, prepayment speeds, etc.)
- Level 3 – unobservable inputs (including the Fund's own assumptions based on the best information available)
Valuation techniques used to value the Fund's investments by major category are as follows:
Equity securities, including restricted securities, for which market quotations are readily available, are valued at the last reported sale price or official closing price as reported by a third party pricing vendor on the primary market or exchange on which they are traded and are categorized as Level 1 in the hierarchy. In the event there were no sales during the day or closing prices are not available, securities are valued at the last quoted bid price or may be valued using the last available price and are generally categorized as Level 2 in the hierarchy. For foreign equity securities, when market or security specific events arise, comparisons to the valuation of American Depositary Receipts (ADRs), futures contracts, Exchange-Traded Funds (ETFs) and certain indexes as well as quoted prices for similar securities may be used and would be categorized as Level 2 in the hierarchy. For equity securities, including restricted securities, where observable inputs are limited, assumptions about market activity and risk are used and these securities may be categorized as Level 3 in the hierarchy.
Debt securities, including restricted securities, are valued based on evaluated prices received from third party pricing vendors or from brokers who make markets in such securities. U.S. government and government agency obligations are valued by pricing vendors who utilize matrix pricing which considers yield or price of bonds of comparable quality, coupon, maturity and type or by broker-supplied prices. When independent prices are unavailable or unreliable, debt securities may be valued utilizing pricing methodologies which consider similar factors that would be used by third party pricing vendors. Debt securities are generally categorized as Level 2 in the hierarchy but may be Level 3 depending on the circumstances.
Futures contracts are valued at the settlement price established each day by the board of trade or exchange on which they are traded and are categorized as Level 1 in the hierarchy. Investments in open-end mutual funds, including the Fidelity Central Funds, are valued at their closing net asset value (NAV) each business day and are categorized as Level 1 in the hierarchy.
Changes in valuation techniques may result in transfers in or out of an assigned level within the disclosure hierarchy. The aggregate value of investments by input level as of July 31, 2020 is included at the end of the Fund's Schedule of Investments.
Investment Transactions and Income. For financial reporting purposes, the Fund's investment holdings and NAV include trades executed through the end of the last business day of the period. The NAV per share for processing shareholder transactions is calculated as of the close of business of the New York Stock Exchange (NYSE), normally 4:00 p.m. Eastern time and includes trades executed through the end of the prior business day. Gains and losses on securities sold are determined on the basis of identified cost and include proceeds received from litigation. Dividend income is recorded on the ex-dividend date, except for certain dividends from foreign securities where the ex-dividend date may have passed, which are recorded as soon as the Fund is informed of the ex-dividend date. Non-cash dividends included in dividend income, if any, are recorded at the fair market value of the securities received. Income and capital gain distributions from Fidelity Central Funds, if any, are recorded on the ex-dividend date. Certain distributions received by the Fund represent a return of capital or capital gain. The Fund determines the components of these distributions subsequent to the ex-dividend date, based upon receipt of tax filings or other correspondence relating to the underlying investment. These distributions are recorded as a reduction of cost of investments and/or as a realized gain. Interest income is accrued as earned and includes coupon interest and amortization of premium and accretion of discount on debt securities as applicable.
Expenses. Expenses directly attributable to a fund are charged to that fund. Expenses attributable to more than one fund are allocated among the respective funds on the basis of relative net assets or other appropriate methods. Expense estimates are accrued in the period to which they relate and adjustments are made when actual amounts are known.
Income Tax Information and Distributions to Shareholders. Each year, the Fund intends to qualify as a regulated investment company under Subchapter M of the Internal Revenue Code, including distributing substantially all of its taxable income and realized gains. As a result, no provision for U.S. Federal income taxes is required. As of July 31, 2020, the Fund did not have any unrecognized tax benefits in the financial statements; nor is the Fund aware of any tax positions for which it is reasonably possible that the total amounts of unrecognized tax benefits will significantly change in the next twelve months. The Fund files a U.S. federal tax return, in addition to state and local tax returns as required. The Fund's federal income tax returns are subject to examination by the Internal Revenue Service (IRS) for a period of three fiscal years after they are filed. State and local tax returns may be subject to examination for an additional fiscal year depending on the jurisdiction.
Distributions are declared and recorded on the ex-dividend date. Income and capital gain distributions are determined in accordance with income tax regulations, which may differ from GAAP. In addition, the Fund claimed a portion of the payment made to redeeming shareholders as a distribution for income tax purposes.
Capital accounts within the financial statements are adjusted for permanent book-tax differences. These adjustments have no impact on net assets or the results of operations. Capital accounts are not adjusted for temporary book-tax differences which will reverse in a subsequent period.
Book-tax differences are primarily due to futures contracts, certain deemed distributions and losses deferred due to wash sales.
As of period end, the cost and unrealized appreciation (depreciation) in securities, and derivatives if applicable, for federal income tax purposes were as follows:
| Gross unrealized appreciation | $5,062,865,320 |
| Gross unrealized depreciation | (973,109,035) |
| Net unrealized appreciation (depreciation) | $4,089,756,285 |
| Tax Cost | $11,353,810,879 |
The tax-based components of distributable earnings as of period end were as follows:
| Undistributed ordinary income | $150,690,771 |
| Undistributed long-term capital gain | $4,651,794 |
| Net unrealized appreciation (depreciation) on securities and other investments | $4,089,756,285 |
The tax character of distributions paid was as follows:
| | July 31, 2020 | July 31, 2019 |
| Ordinary Income | $277,507,662 | $ 252,730,587 |
4. Derivative Instruments.
Risk Exposures and the Use of Derivative Instruments. The Fund's investment objective allows the Fund to enter into various types of derivative contracts, including futures contracts. Derivatives are investments whose value is primarily derived from underlying assets, indices or reference rates and may be transacted on an exchange or over-the-counter (OTC). Derivatives may involve a future commitment to buy or sell a specified asset based on specified terms, to exchange future cash flows at periodic intervals based on a notional principal amount, or for one party to make one or more payments upon the occurrence of specified events in exchange for periodic payments from the other party.
The Fund used derivatives to increase returns and to manage exposure to certain risks as defined below. The success of any strategy involving derivatives depends on analysis of numerous economic factors, and if the strategies for investment do not work as intended, the Fund may not achieve its objectives.
The Fund's use of derivatives increased or decreased its exposure to the following risk:
| Equity Risk | Equity risk relates to the fluctuations in the value of financial instruments as a result of changes in market prices (other than those arising from interest rate risk or foreign exchange risk), whether caused by factors specific to an individual investment, its issuer, or all factors affecting all instruments traded in a market or market segment.
|
The Fund is also exposed to additional risks from investing in derivatives, such as liquidity risk and counterparty credit risk. Liquidity risk is the risk that the Fund will be unable to close out the derivative in the open market in a timely manner. Counterparty credit risk is the risk that the counterparty will not be able to fulfill its obligation to the Fund. Counterparty credit risk related to exchange-traded futures contracts may be mitigated by the protection provided by the exchange on which they trade.
Investing in derivatives may involve greater risks than investing in the underlying assets directly and, to varying degrees, may involve risk of loss in excess of any initial investment and collateral received and amounts recognized in the Statement of Assets and Liabilities. In addition, there may be the risk that the change in value of the derivative contract does not correspond to the change in value of the underlying instrument.
Futures Contracts. A futures contract is an agreement between two parties to buy or sell a specified underlying instrument for a fixed price at a specified future date. The Fund used futures contracts to manage its exposure to the stock market.
Upon entering into a futures contract, a fund is required to deposit either cash or securities (initial margin) with a clearing broker in an amount equal to a certain percentage of the face value of the contract. Futures contracts are marked-to-market daily and subsequent daily payments (variation margin) are made or received by a fund depending on the daily fluctuations in the value of the futures contracts and are recorded as unrealized appreciation or (depreciation). This receivable and/or payable, if any, is included in daily variation margin on futures contracts in the Statement of Assets and Liabilities. Realized gain or (loss) is recorded upon the expiration or closing of a futures contract. The net realized gain (loss) and change in net unrealized appreciation (depreciation) on futures contracts during the period is presented in the Statement of Operations.
Any open futures contracts at period end are presented in the Schedule of Investments under the caption "Futures Contracts". The notional amount at value reflects each contract's exposure to the underlying instrument or index at period end and is representative of volume of activity during the period. Securities deposited to meet initial margin requirements are identified in the Schedule of Investments. Cash deposited to meet initial margin requirements is presented as segregated cash with brokers for derivative instruments in the Statement of Assets and Liabilities.
5. Purchases and Sales of Investments.
Purchases and sales of securities, other than short-term securities, are noted in the table below.
| | Purchases ($) | Sales ($) |
| Fidelity SAI U.S. Large Cap Index Fund | 11,338,959,287 | 11,373,684,602 |
6. Fees and Other Transactions with Affiliates.
Management Fee. Fidelity Management & Research Company LLC (the investment adviser) and its affiliates provide the Fund with investment management related services for which the Fund pays a monthly management fee that is based on an annual rate of .015% of the Fund's average net assets.
Sub-Adviser. Geode Capital Management, LLC (Geode), serves as sub-adviser for the Fund. Geode provides discretionary investment advisory services to the Fund and is paid by the investment adviser for providing these services.
Interfund Lending Program. Pursuant to an Exemptive Order issued by the SEC, the fund, along with other registered investment companies having management contracts with Fidelity Management & Research Company LLC (FMR), or other affiliated entities of FMR, may participate in an interfund lending program. This program provides an alternative credit facility allowing the fund to borrow from, or lend money to, other participating affiliated funds. At period end, there were no interfund loans outstanding. Activity in this program during the period for which loans were outstanding was as follows:
| | Borrower or Lender | Average Loan Balance | Weighted Average Interest Rate | Interest Expense |
| Fidelity SAI U.S. Large Cap Index Fund | Borrower | $148,781,971 | 1.25% | $352,231 |
Interfund Trades. Funds may purchase from or sell securities to other Fidelity Funds under procedures adopted by the Board. The procedures have been designed to ensure these interfund trades are executed in accordance with Rule 17a-7 of the 1940 Act. Interfund trades are included within the respective purchases and sales amounts shown in the Purchases and Sales of Investments note.
7. Committed Line of Credit.
Certain Funds participate with other funds managed by the investment adviser or an affiliate in a $4.25 billion credit facility (the "line of credit") to be utilized for temporary or emergency purposes to fund shareholder redemptions or for other short-term liquidity purposes. The participating funds have agreed to pay commitment fees on their pro-rata portion of the line of credit, which are reflected in Miscellaneous expenses on the Statement of Operations, and are as follows:
| | Amount |
| Fidelity SAI U.S. Large Cap Index Fund | $34,716 |
During the period, there were no borrowings on this line of credit.
8. Security Lending.
The Fund lends portfolio securities from time to time in order to earn additional income. Lending agents are used, including National Financial Services (NFS), an affiliate of the Fund. Pursuant to a securities lending agreement, NFS will receive a fee, which is capped at 9.9% of daily lending revenue, for its services as lending agent. The Fund may lend securities to certain qualified borrowers, including NFS. On the settlement date of the loan, the Fund receives collateral (in the form of U.S. Treasury obligations, letters of credit and/or cash) against the loaned securities and maintains collateral in an amount not less than 100% of the market value of the loaned securities during the period of the loan. The market value of the loaned securities is determined at the close of business of the Fund and any additional required collateral is delivered to the Fund on the next business day. The Fund or borrower may terminate the loan at any time, and if the borrower defaults on its obligation to return the securities loaned because of insolvency or other reasons, the Fund may apply collateral received from the borrower against the obligation. The Fund may experience delays and costs in recovering the securities loaned. Any cash collateral received is invested in the Fidelity Securities Lending Cash Central Fund. The value of loaned securities and cash collateral at period end are disclosed on the Fund's Statement of Assets and Liabilities. At period end, there were no security loans outstanding with NFS, as affiliated borrower. Total fees paid by the Fund to NFS, as lending agent, amounted to $66,212. Security lending income represents the income earned on investing cash collateral, less rebates paid to borrowers and any lending agent fees associated with the loan, plus any premium payments received for lending certain types of securities. Net income from the Fidelity Securities Lending Cash Central Fund during the period is presented in the Statement of Operations as a component of income from Fidelity Central Funds (and includes $6,422 from securities loaned to NFS, as affiliated borrower).
9. Bank Borrowings.
The Fund is permitted to have bank borrowings for temporary or emergency purposes to fund shareholder redemptions or for other short-term liquidity requirements. The Fund has established borrowing arrangements with certain banks. The interest rate on the borrowings is the bank's base rate, as revised from time to time. Any open loans, including accrued interest, at period end are presented under the caption "Notes payable" in the Statement of Assets and Liabilities, if applicable. Activity in this program during the period for which loans were outstanding was as follows:
| | Average Loan Balance | Weighted Average Interest Rate | Interest Expense |
| Fidelity SAI U.S. Large Cap Index Fund | $107,577,000 | .65% | $1,943 |
10. Expense Reductions.
The investment adviser contractually agreed to reimburse the Fund to the extent annual operating expenses exceeded .015% of average net assets. This reimbursement will remain in place through November 30, 2021. Some expenses, for example the compensation of the independent Trustees, and certain miscellaneous expenses such as proxy and shareholder meeting expenses, are excluded from this reimbursement. During the period this reimbursement reduced the Fund's expenses by $508,860.
In addition, through arrangements with the Fund's custodian, credits realized as a result of certain uninvested cash balances were used to reduce the Fund's expenses by $1,153.
11. Other.
The Fund's organizational documents provide former and current trustees and officers with a limited indemnification against liabilities arising in connection with the performance of their duties to the Fund. In the normal course of business, the Fund may also enter into contracts that provide general indemnifications. The Fund's maximum exposure under these arrangements is unknown as this would be dependent on future claims that may be made against the Fund. The risk of material loss from such claims is considered remote.
At the end of the period, Strategic Advisers Fidelity U.S. Total Stock Fund were the owners of record of approximately 19% of the total outstanding shares of the Fund.
12. Coronavirus (COVID-19) Pandemic.
An outbreak of COVID-19 first detected in China during December 2019 has since spread globally and was declared a pandemic by the World Health Organization during March 2020. Developments that disrupt global economies and financial markets, such as the COVID-19 pandemic, may magnify factors that affect the Fund's performance.
Report of Independent Registered Public Accounting Firm
To the Board of Trustees of Fidelity Salem Street Trust and Shareholders of Fidelity SAI U.S. Large Cap Index Fund
Opinion on the Financial Statements and Financial Highlights
We have audited the accompanying statement of assets and liabilities of Fidelity SAI U.S. Large Cap Index Fund (the "Fund"), a fund of Fidelity Salem Street Trust, including the schedule of investments, as of July 31, 2020, the related statement of operations for the year then ended, the statement of changes in net assets for each of the two years in the period then ended, the financial highlights for each of the four years in the period then ended and for the period from February 2, 2016 (commencement of operations) through July 31, 2016, and the related notes. In our opinion, the financial statements and financial highlights present fairly, in all material respects, the financial position of the Fund as of July 31, 2020, and the results of its operations for the year then ended, the changes in its net assets for each of the two years in the period then ended, and the financial highlights for each of the four years in the period then ended and for the period from February 2, 2016 (commencement of operations) through July 31, 2016 in conformity with accounting principles generally accepted in the United States of America.
Basis for Opinion
These financial statements and financial highlights are the responsibility of the Fund's management. Our responsibility is to express an opinion on the Fund's financial statements and financial highlights based on our audits. We are a public accounting firm registered with the Public Company Accounting Oversight Board (United States) (PCAOB) and are required to be independent with respect to the Fund in accordance with the U.S. federal securities laws and the applicable rules and regulations of the Securities and Exchange Commission and the PCAOB.
We conducted our audits in accordance with the standards of the PCAOB. Those standards require that we plan and perform the audit to obtain reasonable assurance about whether the financial statements and financial highlights are free of material misstatement, whether due to error or fraud. The Fund is not required to have, nor were we engaged to perform, an audit of its internal control over financial reporting. As part of our audits we are required to obtain an understanding of internal control over financial reporting but not for the purpose of expressing an opinion on the effectiveness of the Fund’s internal control over financial reporting. Accordingly, we express no such opinion.
Our audits included performing procedures to assess the risks of material misstatement of the financial statements and financial highlights, whether due to error or fraud, and performing procedures that respond to those risks. Such procedures included examining, on a test basis, evidence regarding the amounts and disclosures in the financial statements and financial highlights. Our audits also included evaluating the accounting principles used and significant estimates made by management, as well as evaluating the overall presentation of the financial statements and financial highlights. Our procedures included confirmation of securities owned as of July 31, 2020, by correspondence with the custodian and brokers; when replies were not received from brokers, we performed other auditing procedures. We believe that our audits provide a reasonable basis for our opinion.
/s/ Deloitte & Touche LLP
Boston, Massachusetts
September 14, 2020
We have served as the auditor of one or more of the Fidelity investment companies since 1999.
Trustees and Officers
The Trustees, Members of the Advisory Board (if any), and officers of the trust and fund, as applicable, are listed below. The Board of Trustees governs the fund and is responsible for protecting the interests of shareholders. The Trustees are experienced executives who meet periodically throughout the year to oversee the fund's activities, review contractual arrangements with companies that provide services to the fund, oversee management of the risks associated with such activities and contractual arrangements, and review the fund's performance. Except for Jonathan Chiel, each of the Trustees oversees 311 funds. Mr. Chiel oversees 174 funds.
The Trustees hold office without limit in time except that (a) any Trustee may resign; (b) any Trustee may be removed by written instrument, signed by at least two-thirds of the number of Trustees prior to such removal; (c) any Trustee who requests to be retired or who has become incapacitated by illness or injury may be retired by written instrument signed by a majority of the other Trustees; and (d) any Trustee may be removed at any special meeting of shareholders by a two-thirds vote of the outstanding voting securities of the trust. Each Trustee who is not an interested person (as defined in the 1940 Act) of the trust and the fund is referred to herein as an Independent Trustee. Each Independent Trustee shall retire not later than the last day of the calendar year in which his or her 75th birthday occurs. The Independent Trustees may waive this mandatory retirement age policy with respect to individual Trustees. Officers and Advisory Board Members hold office without limit in time, except that any officer or Advisory Board Member may resign or may be removed by a vote of a majority of the Trustees at any regular meeting or any special meeting of the Trustees. Except as indicated, each individual has held the office shown or other offices in the same company for the past five years.
The fund’s Statement of Additional Information (SAI) includes more information about the Trustees. To request a free copy, call Fidelity at 1-800-544-3455.
Experience, Skills, Attributes, and Qualifications of the Trustees. The Governance and Nominating Committee has adopted a statement of policy that describes the experience, qualifications, attributes, and skills that are necessary and desirable for potential Independent Trustee candidates (Statement of Policy). The Board believes that each Trustee satisfied at the time he or she was initially elected or appointed a Trustee, and continues to satisfy, the standards contemplated by the Statement of Policy. The Governance and Nominating Committee also engages professional search firms to help identify potential Independent Trustee candidates who have the experience, qualifications, attributes, and skills consistent with the Statement of Policy. From time to time, additional criteria based on the composition and skills of the current Independent Trustees, as well as experience or skills that may be appropriate in light of future changes to board composition, business conditions, and regulatory or other developments, have also been considered by the professional search firms and the Governance and Nominating Committee. In addition, the Board takes into account the Trustees' commitment and participation in Board and committee meetings, as well as their leadership of standing and ad hoc committees throughout their tenure.
In determining that a particular Trustee was and continues to be qualified to serve as a Trustee, the Board has considered a variety of criteria, none of which, in isolation, was controlling. The Board believes that, collectively, the Trustees have balanced and diverse experience, qualifications, attributes, and skills, which allow the Board to operate effectively in governing the fund and protecting the interests of shareholders. Information about the specific experience, skills, attributes, and qualifications of each Trustee, which in each case led to the Board's conclusion that the Trustee should serve (or continue to serve) as a trustee of the fund, is provided below.
Board Structure and Oversight Function. Abigail P. Johnson is an interested person and currently serves as Chairman. The Trustees have determined that an interested Chairman is appropriate and benefits shareholders because an interested Chairman has a personal and professional stake in the quality and continuity of services provided to the fund. Independent Trustees exercise their informed business judgment to appoint an individual of their choosing to serve as Chairman, regardless of whether the Trustee happens to be independent or a member of management. The Independent Trustees have determined that they can act independently and effectively without having an Independent Trustee serve as Chairman and that a key structural component for assuring that they are in a position to do so is for the Independent Trustees to constitute a substantial majority for the Board. The Independent Trustees also regularly meet in executive session. Arthur E. Johnson serves as Chairman of the Independent Trustees and as such (i) acts as a liaison between the Independent Trustees and management with respect to matters important to the Independent Trustees and (ii) with management prepares agendas for Board meetings.
Fidelity® funds are overseen by different Boards of Trustees. The fund's Board oversees Fidelity's investment-grade bond, money market, asset allocation and certain equity funds, and other Boards oversee Fidelity's high income and other equity funds. The asset allocation funds may invest in Fidelity® funds that are overseen by such other Boards. The use of separate Boards, each with its own committee structure, allows the Trustees of each group of Fidelity® funds to focus on the unique issues of the funds they oversee, including common research, investment, and operational issues. On occasion, the separate Boards establish joint committees to address issues of overlapping consequences for the Fidelity® funds overseen by each Board.
The Trustees operate using a system of committees to facilitate the timely and efficient consideration of all matters of importance to the Trustees, the fund, and fund shareholders and to facilitate compliance with legal and regulatory requirements and oversight of the fund's activities and associated risks. The Board, acting through its committees, has charged FMR and its affiliates with (i) identifying events or circumstances the occurrence of which could have demonstrably adverse effects on the fund's business and/or reputation; (ii) implementing processes and controls to lessen the possibility that such events or circumstances occur or to mitigate the effects of such events or circumstances if they do occur; and (iii) creating and maintaining a system designed to evaluate continuously business and market conditions in order to facilitate the identification and implementation processes described in (i) and (ii) above. Because the day-to-day operations and activities of the fund are carried out by or through FMR, its affiliates, and other service providers, the fund's exposure to risks is mitigated but not eliminated by the processes overseen by the Trustees. While each of the Board's committees has responsibility for overseeing different aspects of the fund's activities, oversight is exercised primarily through the Operations and Audit Committees. In addition, an ad hoc Board committee of Independent Trustees has worked with FMR to enhance the Board's oversight of investment and financial risks, legal and regulatory risks, technology risks, and operational risks, including the development of additional risk reporting to the Board. Appropriate personnel, including but not limited to the fund's Chief Compliance Officer (CCO), FMR's internal auditor, the independent accountants, the fund's Treasurer and portfolio management personnel, make periodic reports to the Board's committees, as appropriate, including an annual review of Fidelity's risk management program for the Fidelity® funds. The responsibilities of each standing committee, including their oversight responsibilities, are described further under "Standing Committees of the Trustees."
Interested Trustees*:
Correspondence intended for a Trustee who is an interested person may be sent to Fidelity Investments, 245 Summer Street, Boston, Massachusetts 02210.
Name, Year of Birth; Principal Occupations and Other Relevant Experience+
Jonathan Chiel (1957)
Year of Election or Appointment: 2016
Trustee
Mr. Chiel also serves as Trustee of other Fidelity® funds. Mr. Chiel is Executive Vice President and General Counsel for FMR LLC (diversified financial services company, 2012-present). Previously, Mr. Chiel served as general counsel (2004-2012) and senior vice president and deputy general counsel (2000-2004) for John Hancock Financial Services; a partner with Choate, Hall & Stewart (1996-2000) (law firm); and an Assistant United States Attorney for the United States Attorney’s Office of the District of Massachusetts (1986-95), including Chief of the Criminal Division (1993-1995). Mr. Chiel is a director on the boards of the Boston Bar Foundation and the Maimonides School.
Abigail P. Johnson (1961)
Year of Election or Appointment: 2009
Trustee
Chairman of the Board of Trustees
Ms. Johnson also serves as Trustee of other Fidelity® funds. Ms. Johnson serves as Chairman (2016-present), Chief Executive Officer (2014-present), and Director (2007-present) of FMR LLC (diversified financial services company), President of Fidelity Financial Services (2012-present) and President of Personal, Workplace and Institutional Services (2005-present). Ms. Johnson is Chairman and Director of Fidelity Management & Research Company LLC (investment adviser firm, 2011-present). Previously, Ms. Johnson served as Chairman and Director of FMR Co., Inc. (investment adviser firm, 2011-2019), Vice Chairman (2007-2016) and President (2013-2016) of FMR LLC, President and a Director of Fidelity Management & Research Company (2001-2005), a Trustee of other investment companies advised by Fidelity Management & Research Company, Fidelity Investments Money Management, Inc. (investment adviser firm), and FMR Co., Inc. (2001-2005), Senior Vice President of the Fidelity® funds (2001-2005), and managed a number of Fidelity® funds. Ms. Abigail P. Johnson and Mr. Arthur E. Johnson are not related.
Jennifer Toolin McAuliffe (1959)
Year of Election or Appointment: 2016
Trustee
Ms. McAuliffe also serves as Trustee of other Fidelity® funds. Previously, Ms. McAuliffe served as Co-Head of Fixed Income of Fidelity Investments Limited (now known as FIL Limited (FIL)) (diversified financial services company), Director of Research for FIL’s credit and quantitative teams in London, Hong Kong and Tokyo and Director of Research for taxable and municipal bonds at Fidelity Investments Money Management, Inc. Ms. McAuliffe previously served as a member of the Advisory Board of certain Fidelity® funds (2016). Ms. McAuliffe was previously a lawyer at Ropes & Gray LLP and currently serves as director or trustee of several not-for-profit entities.
* Determined to be an “Interested Trustee” by virtue of, among other things, his or her affiliation with the trust or various entities under common control with FMR.
+ The information includes the Trustee's principal occupation during the last five years and other information relating to the experience, attributes, and skills relevant to the Trustee's qualifications to serve as a Trustee, which led to the conclusion that the Trustee should serve as a Trustee for the fund.
Independent Trustees:
Correspondence intended for an Independent Trustee may be sent to Fidelity Investments, P.O. Box 55235, Boston, Massachusetts 02205-5235.
Name, Year of Birth; Principal Occupations and Other Relevant Experience+
Elizabeth S. Acton (1951)
Year of Election or Appointment: 2013
Trustee
Ms. Acton also serves as Trustee of other Fidelity® funds. Prior to her retirement, Ms. Acton served as Executive Vice President, Finance (2011-2012), Executive Vice President, Chief Financial Officer (2002-2011) and Treasurer (2004-2005) of Comerica Incorporated (financial services). Prior to joining Comerica, Ms. Acton held a variety of positions at Ford Motor Company (1983-2002), including Vice President and Treasurer (2000-2002) and Executive Vice President and Chief Financial Officer of Ford Motor Credit Company (1998-2000). Ms. Acton currently serves as a member of the Board and Audit and Finance Committees of Beazer Homes USA, Inc. (homebuilding, 2012-present). Ms. Acton previously served as a member of the Advisory Board of certain Fidelity® funds (2013-2016).
Ann E. Dunwoody (1953)
Year of Election or Appointment: 2018
Trustee
General Dunwoody also serves as Trustee of other Fidelity® funds. General Dunwoody (United States Army, Retired) was the first woman in U.S. military history to achieve the rank of four-star general and prior to her retirement in 2012 held a variety of positions within the U.S. Army, including Commanding General, U.S. Army Material Command (2008-2012). General Dunwoody currently serves as President of First to Four LLC (leadership and mentoring services, 2012-present), a member of the Board and Nomination and Corporate Governance Committees of Kforce Inc. (professional staffing services, 2016-present) and a member of the Board of Automattic Inc. (software engineering, 2018-present). Previously, General Dunwoody served as a member of the Advisory Board and Nominating and Corporate Governance Committee of L3 Technologies, Inc. (communication, electronic, sensor and aerospace systems, 2013-2019) and a member of the Board and Audit and Sustainability and Corporate Responsibility Committees of Republic Services, Inc. (waste collection, disposal and recycling, 2013-2016). Ms. Dunwoody also serves on several boards for non-profit organizations, including as a member of the Board, Chair of the Nomination and Governance Committee and a member of the Audit Committee of Logistics Management Institute (consulting non-profit, 2012-present), a member of the Council of Trustees for the Association of the United States Army (advocacy non-profit, 2013-present), a member of the Board of Florida Institute of Technology (2015-present) and a member of the Board of ThanksUSA (military family education non-profit, 2014-present). General Dunwoody previously served as a member of the Advisory Board of certain Fidelity® funds (2018).
John Engler (1948)
Year of Election or Appointment: 2014
Trustee
Mr. Engler also serves as Trustee of other Fidelity® funds. Previously, Mr. Engler served as Governor of Michigan (1991-2003), President of the Business Roundtable (2011-2017) and interim President of Michigan State University (2018-2019). Mr. Engler currently serves as a member of the Board of K12 Inc. (technology-based education company, 2012-present). Previously, Mr. Engler served as a member of the Board of Universal Forest Products (manufacturer and distributor of wood and wood-alternative products, 2003-2019) and Trustee of The Munder Funds (2003-2014). Mr. Engler previously served as a member of the Advisory Board of certain Fidelity® funds (2014-2016).
Robert F. Gartland (1951)
Year of Election or Appointment: 2010
Trustee
Mr. Gartland also serves as Trustee of other Fidelity® funds. Prior to his retirement, Mr. Gartland held a variety of positions at Morgan Stanley (financial services, 1979-2007), including Managing Director (1987-2007) and Chase Manhattan Bank (1975-1978). Mr. Gartland previously served as Chairman and an investor in Gartland & Mellina Group Corp. (consulting, 2009-2019), as a member of the Board of National Securities Clearing Corporation (1993-1996) and as Chairman of TradeWeb (2003-2004).
Arthur E. Johnson (1947)
Year of Election or Appointment: 2008
Trustee
Chairman of the Independent Trustees
Mr. Johnson also serves as Trustee of other Fidelity® funds. Prior to his retirement, Mr. Johnson served as Senior Vice President of Corporate Strategic Development of Lockheed Martin Corporation (defense contractor, 1999-2009). Mr. Johnson currently serves as a member of the Board of Booz Allen Hamilton (management consulting, 2011-present). Mr. Johnson previously served as a member of the Board of Eaton Corporation plc (diversified power management, 2009-2019) and a member of the Board of AGL Resources, Inc. (holding company, 2002-2016). Mr. Johnson previously served as Vice Chairman (2015-2018) of the Independent Trustees of certain Fidelity® funds. Mr. Arthur E. Johnson is not related to Ms. Abigail P. Johnson.
Michael E. Kenneally (1954)
Year of Election or Appointment: 2009
Trustee
Vice Chairman of the Independent Trustees
Mr. Kenneally also serves as Trustee of other Fidelity® funds. Prior to his retirement, Mr. Kenneally served as Chairman and Global Chief Executive Officer of Credit Suisse Asset Management and Executive Vice President and Chief Investment Officer of Bank of America Corporation. Earlier roles at Bank of America included Director of Research, Senior Portfolio Manager for various institutional equity accounts and mutual funds and Portfolio Manager for a number of institutional fixed-income clients. Mr. Kenneally began his career as a Research Analyst in 1983 and was awarded the Chartered Financial Analyst (CFA) designation in 1991.
Marie L. Knowles (1946)
Year of Election or Appointment: 2001
Trustee
Ms. Knowles also serves as Trustee of other Fidelity® funds. Prior to her retirement, Ms. Knowles held several positions at Atlantic Richfield Company (diversified energy), including Executive Vice President and Chief Financial Officer (1996-2000), Senior Vice President (1993-1996) and President of ARCO Transportation Company (pipeline and tanker operations, 1993-1996). Ms. Knowles currently serves as a member of the Board of McKesson Corporation (healthcare service, since 2002), a member of the Board of the Santa Catalina Island Company (real estate, 2009-present), a member of the Investment Company Institute Board of Governors and a member of the Governing Council of the Independent Directors Council (2014-present). Ms. Knowles also serves as a member of the Advisory Board for the School of Engineering of the University of Southern California. Ms. Knowles previously served as Chairman (2015-2018) and Vice Chairman (2012-2015) of the Independent Trustees of certain Fidelity® funds.
Mark A. Murray (1954)
Year of Election or Appointment: 2016
Trustee
Mr. Murray also serves as Trustee of other Fidelity® funds. Previously, Mr. Murray served as Co-Chief Executive Officer (2013-2016), President (2006-2013) and Vice Chairman (2013-2020) of Meijer, Inc. Mr. Murray serves as a member of the Board and Nuclear Review and Public Policy and Responsibility Committees of DTE Energy Company (diversified energy company, 2009-present) and a member of the Board and Audit Committee and Chairman of the Nominating and Corporate Governance Committee of Universal Forest Products, Inc. (manufacturer and distributor of wood and wood-alternative products, 2004-2016). Mr. Murray previously served as a member of the Board of Spectrum Health (not-for-profit health system, 2015-2019). Mr. Murray also serves as a member of the Board of many community and professional organizations. Mr. Murray previously served as a member of the Advisory Board of certain Fidelity® funds (2016).
+ The information includes the Trustee's principal occupation during the last five years and other information relating to the experience, attributes, and skills relevant to the Trustee's qualifications to serve as a Trustee, which led to the conclusion that the Trustee should serve as a Trustee for the fund.
Advisory Board Members and Officers:
Correspondence intended for an officer may be sent to Fidelity Investments, 245 Summer Street, Boston, Massachusetts 02210. Officers appear below in alphabetical order.
Name, Year of Birth; Principal Occupation
Elizabeth Paige Baumann (1968)
Year of Election or Appointment: 2017
Anti-Money Laundering (AML) Officer
Ms. Baumann also serves as AML Officer of other funds. She is Chief AML Officer (2012-present) and Senior Vice President (2014-present) of FMR LLC (diversified financial services company) and is an employee of Fidelity Investments. Previously, Ms. Baumann served as AML Officer of certain funds (2017-2019), as AML Officer of the funds (2012-2016), and Vice President (2007-2014) and Deputy Anti-Money Laundering Officer (2007-2012) of FMR LLC.
Craig S. Brown (1977)
Year of Election or Appointment: 2019
Assistant Treasurer
Mr. Brown also serves as Assistant Treasurer of other funds. Mr. Brown is an employee of Fidelity Investments (2013-present).
John J. Burke III (1964)
Year of Election or Appointment: 2018
Chief Financial Officer
Mr. Burke also serves as Chief Financial Officer of other funds. Mr. Burke serves as Head of Investment Operations for Fidelity Fund and Investment Operations (2018-present) and is an employee of Fidelity Investments (1998-present). Previously Mr. Burke served as head of Asset Management Investment Operations (2012-2018).
David J. Carter (1973)
Year of Election or Appointment: 2020
Assistant Secretary
Mr. Carter also serves as Assistant Secretary of other funds. Mr. Carter serves as Vice President, Associate General Counsel (2010-present) and is an employee of Fidelity Investments (2005-present).
Jonathan Davis (1968)
Year of Election or Appointment: 2010
Assistant Treasurer
Mr. Davis also serves as Assistant Treasurer of other funds. Mr. Davis serves as Assistant Treasurer of FMR Capital, Inc. (2017-present) and is an employee of Fidelity Investments. Previously, Mr. Davis served as Vice President and Associate General Counsel of FMR LLC (diversified financial services company, 2003-2010).
Laura M. Del Prato (1964)
Year of Election or Appointment: 2018
President and Treasurer
Ms. Del Prato also serves as an officer of other funds. Ms. Del Prato is an employee of Fidelity Investments (2017-present). Previously, Ms. Del Prato served as President and Treasurer of The North Carolina Capital Management Trust: Cash Portfolio and Term Portfolio (2018-2020). Prior to joining Fidelity Investments, Ms. Del Prato served as a Managing Director and Treasurer of the JPMorgan Mutual Funds (2014-2017). Prior to JPMorgan, Ms. Del Prato served as a partner at Cohen Fund Audit Services (accounting firm, 2012-2013) and KPMG LLP (accounting firm, 2004-2012).
Colm A. Hogan (1973)
Year of Election or Appointment: 2016
Assistant Treasurer
Mr. Hogan also serves as an officer of other funds. Mr. Hogan serves as Assistant Treasurer of FMR Capital, Inc. (2017-present) and is an employee of Fidelity Investments (2005-present). Previously, Mr. Hogan served as Deputy Treasurer of certain Fidelity® funds (2016-2020) and Assistant Treasurer of certain Fidelity® funds (2016-2018).
Cynthia Lo Bessette (1969)
Year of Election or Appointment: 2019
Secretary and Chief Legal Officer (CLO)
Ms. Lo Bessette also serves as an officer of other funds. Ms. Lo Bessette serves as CLO, Secretary, and Senior Vice President of Fidelity Management & Research Company LLC (investment adviser firm, 2019-present); and CLO of Fidelity Management & Research (Hong Kong) Limited, FMR Investment Management (UK) Limited, and Fidelity Management & Research (Japan) Limited (investment adviser firms, 2019-present). She is a Senior Vice President and Deputy General Counsel of FMR LLC (diversified financial services company, 2019-present), and is an employee of Fidelity Investments. Previously, Ms. Lo Bessette served as CLO, Secretary, and Senior Vice President of FMR Co., Inc. (investment adviser firm, 2019); Secretary of Fidelity SelectCo, LLC and Fidelity Investments Money Management, Inc. (investment adviser firms, 2019). Prior to joining Fidelity Investments, Ms. Lo Bessette was Executive Vice President, General Counsel (2016-2019) and Senior Vice President, Deputy General Counsel (2015-2016) of OppenheimerFunds (investment management company) and Deputy Chief Legal Officer (2013-2015) of Jennison Associates LLC (investment adviser firm).
Chris Maher (1972)
Year of Election or Appointment: 2013
Assistant Treasurer
Mr. Maher also serves as an officer of other funds. Mr. Maher serves as Assistant Treasurer of FMR Capital, Inc. (2017-present), and is an employee of Fidelity Investments (2008-present). Previously, Mr. Maher served as Assistant Treasurer of certain funds (2013-2020); Vice President of Asset Management Compliance (2013), Vice President of the Program Management Group of FMR (investment adviser firm, 2010-2013), and Vice President of Valuation Oversight (2008-2010).
Jamie Pagliocco (1964)
Year of Election or Appointment: 2020
Vice President
Mr. Pagliocco also serves as Vice President of other funds. Mr. Pagliocco serves as President of Fixed Income (2020-present), and is an employee of Fidelity Investments (2001-present). Previously, Mr. Pagliocco served as Co-Chief Investment Officer – Bond (2017-2020), Global Head of Bond Trading (2016-2019), and as a portfolio manager.
Kenneth B. Robins (1969)
Year of Election or Appointment: 2020
Chief Compliance Officer
Mr. Robins also serves as an officer of other funds. Mr. Robins serves as Compliance Officer of Fidelity Management & Research Company LLC (investment adviser firm, 2016-present) and is an employee of Fidelity Investments (2004-present). Previously, Mr. Robins served as Compliance Officer of FMR Co., Inc. (investment adviser firm, 2016-2019), as Executive Vice President of Fidelity Investments Money Management, Inc. (investment adviser firm, 2013-2016) and served in other fund officer roles.
Stacie M. Smith (1974)
Year of Election or Appointment: 2013
Assistant Treasurer
Ms. Smith also serves as an officer of other funds. Ms. Smith serves as Assistant Treasurer of FMR Capital, Inc. (2017-present), is an employee of Fidelity Investments (2009-present), and has served in other fund officer roles. Prior to joining Fidelity Investments, Ms. Smith served as Senior Audit Manager of Ernst & Young LLP (accounting firm, 1996-2009). Previously, Ms. Smith served as Assistant Treasurer (2013-2019) and Deputy Treasurer (2013-2016) of certain Fidelity® funds.
Marc L. Spector (1972)
Year of Election or Appointment: 2016
Deputy Treasurer
Mr. Spector also serves as an officer of other funds. Mr. Spector serves as Assistant Treasurer of FMR Capital, Inc. (2017-present) and is an employee of Fidelity Investments (2016-present). Prior to joining Fidelity Investments, Mr. Spector served as Director at the Siegfried Group (accounting firm, 2013-2016), and prior to Siegfried Group as audit senior manager at Deloitte & Touche LLP (accounting firm, 2005-2013).
Jim Wegmann (1979)
Year of Election or Appointment: 2019
Assistant Treasurer
Mr. Wegmann also serves as Assistant Treasurer of other funds. Mr. Wegmann is an employee of Fidelity Investments (2011-present).
Shareholder Expense Example
As a shareholder, you incur two types of costs: (1) transaction costs, which may include sales charges (loads) on purchase payments or redemption proceeds, as applicable and (2) ongoing costs, which generally include management fees, distribution and/or service (12b-1) fees and other Fund expenses. This Example is intended to help you understand your ongoing costs (in dollars) of investing in a fund and to compare these costs with the ongoing costs of investing in other mutual funds.
The Example is based on an investment of $1,000 invested at the beginning of the period and held for the entire period (February 1, 2020 to July 31, 2020).
Actual Expenses
The first line of the accompanying table provides information about actual account values and actual expenses. You may use the information in this line, together with the amount you invested, to estimate the expenses that you paid over the period. Simply divide your account value by $1,000.00 (for example, an $8,600 account value divided by $1,000.00 = 8.6), then multiply the result by the number in the first line for a class/Fund under the heading entitled "Expenses Paid During Period" to estimate the expenses you paid on your account during this period. If any fund is a shareholder of any underlying mutual funds or exchange-traded funds (ETFs) (the Underlying Funds), such fund indirectly bears its proportional share of the expenses of the Underlying Funds in addition to the direct expenses incurred presented in the table. These fees and expenses are not included in the annualized expense ratio used to calculate the expense estimate in the table below.
Hypothetical Example for Comparison Purposes
The second line of the accompanying table provides information about hypothetical account values and hypothetical expenses based on the actual expense ratio and an assumed rate of return of 5% per year before expenses, which is not the actual return. The hypothetical account values and expenses may not be used to estimate the actual ending account balance or expenses you paid for the period. You may use this information to compare the ongoing costs of investing in the Fund and other funds. To do so, compare this 5% hypothetical example with the 5% hypothetical examples that appear in the shareholder reports of the other funds. If any fund is a shareholder of any Underlying Funds, such fund indirectly bears its proportional share of the expenses of the Underlying Funds in addition to the direct expenses as presented in the table. These fees and expenses are not included in the annualized expense ratio used to calculate the expense estimate in the table below.
Please note that the expenses shown in the table are meant to highlight your ongoing costs only and do not reflect any transaction costs. Therefore, the second line of the table is useful in comparing ongoing costs only, and will not help you determine the relative total costs of owning different funds.
| | Annualized Expense Ratio-A | Beginning
Account Value
February 1, 2020 | Ending
Account Value
July 31, 2020 | Expenses Paid
During Period-B
February 1, 2020
to July 31, 2020 |
| Fidelity SAI U.S. Large Cap Index Fund | .02% | | | |
| Actual | | $1,000.00 | $1,023.70 | $.10 |
| Hypothetical-C | | $1,000.00 | $1,024.76 | $.10 |
A Annualized expense ratio reflects expenses net of applicable fee waivers.
B Expenses are equal to the annualized expense ratio, multiplied by the average account value over the period, multiplied by 182/ 366 (to reflect the one-half year period). The fees and expenses of any Underlying Funds are not included in each annualized expense ratio.
C 5% return per year before expenses
Distributions (Unaudited)
The Board of Trustees of Fidelity SAI U.S. Large Cap Index Fund voted to pay on September 14, 2020, to shareholders of record at the opening of business on September 11, 2020, a distribution of $.007 per share derived from capital gains realized from sales of portfolio securities and a dividend of $.212 per share from net investment income.
The fund hereby designates as a capital gain dividend with respect to the taxable year ended July 31, 2020, $122,695,878, or, if subsequently determined to be different, the net capital gain of such year.
The fund designates 100% and 89% of the dividends distributed in September and December, respectively during the fiscal year as qualifying for the dividends–received deduction for corporate shareholders.
The fund designates 100% and 94% of the dividends distributed in September and December, respectively during the fiscal year as amounts which may be taken into account as a dividend for the purposes of the maximum rate under section 1(h)(11) of the Internal Revenue Code.
The fund designates 1% and 5% of the dividends distributed in September and December, respectively during the fiscal year as a section 199A dividend.
The fund will notify shareholders in January 2021 of amounts for use in preparing 2020 income tax returns.
Liquidity Risk Management Program
The Securities and Exchange Commission adopted Rule 22e-4 under the Investment Company Act of 1940 (the Liquidity Rule) to promote effective liquidity risk management throughout the open-end investment company industry, thereby reducing the risk that funds will be unable to meet their redemption obligations and mitigating dilution of the interests of fund shareholders.
The Fund has adopted and implemented a liquidity risk management program pursuant to the Liquidity Rule (the Program) effective December 1, 2018. The Program is reasonably designed to assess and manage the Fund’s liquidity risk and to comply with the requirements of the Liquidity Rule. The Fund’s Board of Trustees (the Board) has designated the Fund’s investment adviser as administrator of the Program. The Fidelity advisers have established a Liquidity Risk Management Committee (the LRM Committee) to manage the Program for each of the Fidelity Funds. The LRM Committee monitors the adequacy and effectiveness of implementation of the Program and on a periodic basis assesses each Fund’s liquidity risk based on a variety of factors including (1) the Fund’s investment strategy, (2) portfolio liquidity and cash flow projections during normal and reasonably foreseeable stressed conditions, (3) shareholder redemptions, (4) borrowings and other funding sources and (5) in the case of exchange-traded funds, certain additional factors including the effect of the Fund’s prices and spreads, market participants, and basket compositions on the overall liquidity of the Fund’s portfolio, as applicable.
In accordance with the Program, each of the Fund’s portfolio investments is classified into one of four liquidity categories described below based on a determination of a reasonable expectation for how long it would take to convert the investment to cash (or sell or dispose of the investment) without significantly changing its market value.
- Highly liquid investments – cash or convertible to cash within three business days or less
- Moderately liquid investments – convertible to cash in three to seven calendar days
- Less liquid investments – can be sold or disposed of, but not settled, within seven calendar days
- Illiquid investments – cannot be sold or disposed of within seven calendar days
Liquidity classification determinations take into account a variety of factors including various market, trading and investment-specific considerations, as well as market depth, and generally utilize analysis from a third-party liquidity metrics service.
The Liquidity Rule places a 15% limit on a fund’s illiquid investments and requires funds that do not primarily hold assets that are highly liquid investments to determine and maintain a minimum percentage of the fund’s net assets to be invested in highly liquid investments (highly liquid investment minimum or HLIM). The Program includes provisions reasonably designed to comply with the 15% limit on illiquid investments and for determining, periodically reviewing and complying with the HLIM requirement as applicable.
At a recent meeting of the Fund’s Board of Trustees, the LRM Committee provided a written report to the Board pertaining to the operation, adequacy, and effectiveness of implementation of the Program for the annual period from December 1, 2018 through November 30, 2019. The report concluded that the Program has been implemented and is operating effectively and is reasonably designed to assess and manage the Fund’s liquidity risk.
SV9-ANN-0920
1.9870993.104
Fidelity® SAI Real Estate Index Fund
Offered exclusively to certain clients of the Adviser or its affiliates - not available for sale to the general public. Fidelity SAI is a product name of Fidelity® funds dedicated to certain programs affiliated with Strategic Advisers LLC.
Annual Report
July 31, 2020
See the inside front cover for important information about access to your fund’s shareholder reports.
Beginning on January 1, 2021, as permitted by regulations adopted by the Securities and Exchange Commission, paper copies of a fund’s shareholder reports will no longer be sent by mail, unless you specifically request paper copies of the reports from the fund or from your financial intermediary, such as a financial advisor, broker-dealer or bank. Instead, the reports will be made available on a website, and you will be notified by mail each time a report is posted and provided with a website link to access the report.
If you already elected to receive shareholder reports electronically, you will not be affected by this change and you need not take any action. You may elect to receive shareholder reports and other communications from a fund electronically, by contacting your financial intermediary. For Fidelity customers, visit Fidelity's web site or call Fidelity using the contact information listed below.
You may elect to receive all future reports in paper free of charge. If you wish to continue receiving paper copies of your shareholder reports, you may contact your financial intermediary or, if you are a Fidelity customer, visit Fidelity’s website, or call Fidelity at the applicable toll-free number listed below. Your election to receive reports in paper will apply to all funds held with the fund complex/your financial intermediary.
| Account Type | Website | Phone Number |
| Brokerage, Mutual Fund, or Annuity Contracts: | fidelity.com/mailpreferences | 1-800-343-3548 |
| Employer Provided Retirement Accounts: | netbenefits.fidelity.com/preferences (choose 'no' under Required Disclosures to continue to print) | 1-800-343-0860 |
| Advisor Sold Accounts Serviced Through Your Financial Intermediary: | Contact Your Financial Intermediary | Your Financial Intermediary's phone number |
| Advisor Sold Accounts Serviced by Fidelity: | institutional.fidelity.com | 1-877-208-0098 |
Contents
To view a fund's proxy voting guidelines and proxy voting record for the 12-month period ended June 30, visit http://www.fidelity.com/proxyvotingresults or visit the Securities and Exchange Commission's (SEC) web site at http://www.sec.gov.
You may also call 1-800-544-3455 to request a free copy of the proxy voting guidelines.
Standard & Poor's, S&P and S&P 500 are registered service marks of The McGraw-Hill Companies, Inc. and have been licensed for use by Fidelity Distributors Corporation.
Other third-party marks appearing herein are the property of their respective owners.
All other marks appearing herein are registered or unregistered trademarks or service marks of FMR LLC or an affiliated company. © 2020 FMR LLC. All rights reserved.
This report and the financial statements contained herein are submitted for the general information of the shareholders of the Fund. This report is not authorized for distribution to prospective investors in the Fund unless preceded or accompanied by an effective prospectus.
A fund files its complete schedule of portfolio holdings with the SEC for the first and third quarters of each fiscal year on Form N-PORT. Forms N-PORT are available on the SEC’s web site at http://www.sec.gov. A fund's Forms N-PORT may be reviewed and copied at the SEC’s Public Reference Room in Washington, DC. Information regarding the operation of the SEC's Public Reference Room may be obtained by calling 1-800-SEC-0330.
For a complete list of a fund's portfolio holdings, view the most recent holdings listing, semiannual report, or annual report on Fidelity's web site at http://www.fidelity.com, http://www.institutional.fidelity.com, or http://www.401k.com, as applicable.
NOT FDIC INSURED •MAY LOSE VALUE •NO BANK GUARANTEE
Neither the Fund nor Fidelity Distributors Corporation is a bank.
Note to Shareholders:
Early in 2020, the outbreak and spread of a new coronavirus emerged as a public health emergency that had a major influence on financial markets, primarily based on its impact on the global economy and the outlook for corporate earnings. The virus causes a respiratory disease known as COVID-19. On March 11, the World Health Organization declared the COVID-19 outbreak a pandemic, citing sustained risk of further global spread.
In the weeks following, as the crisis worsened, we witnessed an escalating human tragedy with wide-scale social and economic consequences from coronavirus-containment measures. The outbreak of COVID-19 prompted a number of measures to limit the spread, including travel and border restrictions, quarantines, and restrictions on large gatherings. In turn, these resulted in lower consumer activity, diminished demand for a wide range of products and services, disruption in manufacturing and supply chains, and – given the wide variability in outcomes regarding the outbreak – significant market uncertainty and volatility. Amid the turmoil, the U.S. government took unprecedented action – in concert with the U.S. Federal Reserve and central banks around the world – to help support consumers, businesses, and the broader economy, and to limit disruption to the financial system.
The situation continues to unfold, and the extent and duration of its impact on financial markets and the economy remain highly uncertain. Extreme events such as the coronavirus crisis are “exogenous shocks” that can have significant adverse effects on mutual funds and their investments. Although multiple asset classes may be affected by market disruption, the duration and impact may not be the same for all types of assets.
Fidelity is committed to helping you stay informed amid news about COVID-19 and during increased market volatility, and we’re taking extra steps to be responsive to customer needs. We encourage you to visit our websites, where we offer ongoing updates, commentary, and analysis on the markets and our funds.
Performance: The Bottom Line
Average annual total return reflects the change in the value of an investment, assuming reinvestment of distributions from dividend income and capital gains (the profits earned upon the sale of securities that have grown in value, if any) and assuming a constant rate of performance each year. The hypothetical investment and the average annual total returns do not reflect the deduction of taxes that a shareholder would pay on fund distributions or the redemption of fund shares. During periods of reimbursement by Fidelity, a fund’s total return will be greater than it would be had the reimbursement not occurred. How a fund did yesterday is no guarantee of how it will do tomorrow.
Average Annual Total Returns
| For the periods ended July 31, 2020 | Past 1 year | Life of fundA |
| Fidelity® SAI Real Estate Index Fund | (16.04)% | 2.31% |
A From February 2, 2016
$10,000 Over Life of Fund
Let's say hypothetically that $10,000 was invested in Fidelity® SAI Real Estate Index Fund on February 2, 2016, when the fund started.
The chart shows how the value of your investment would have changed, and also shows how the Dow Jones U.S. Select Real Estate Securities Index℠ performed over the same period.
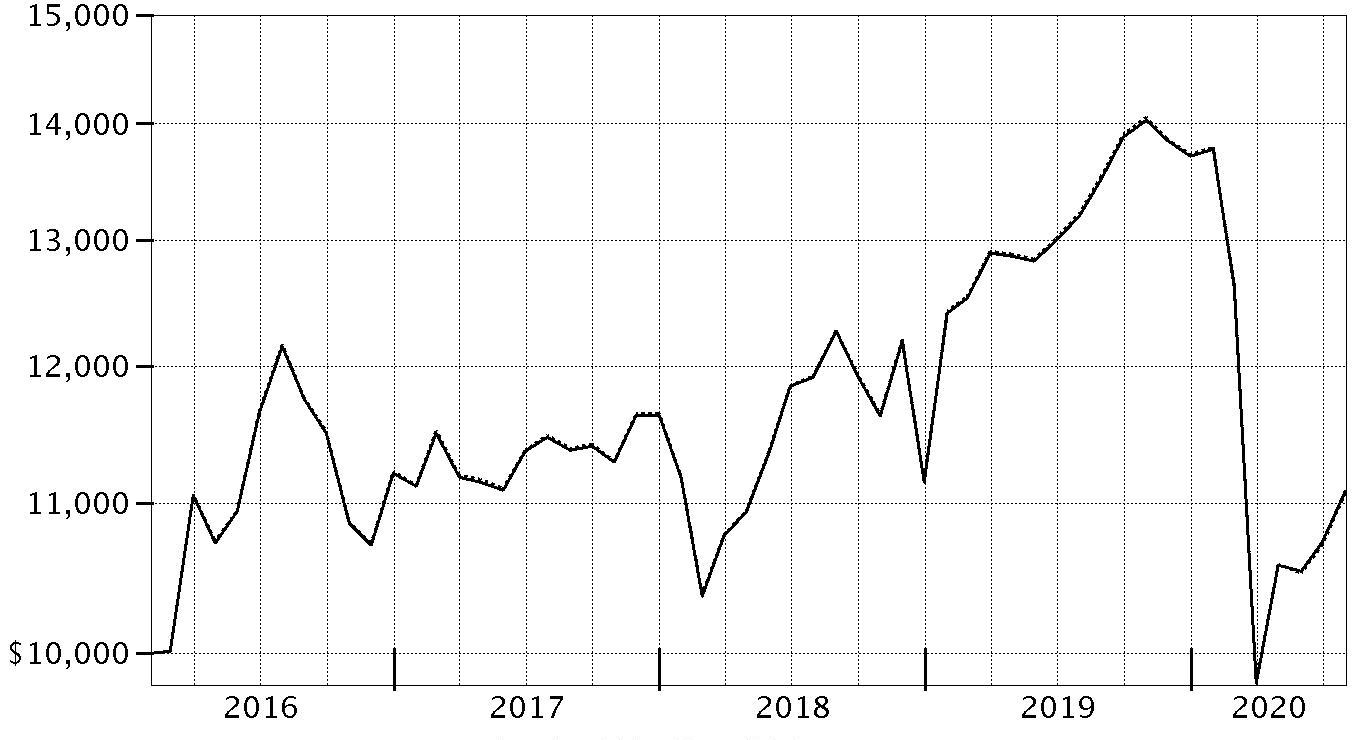
| Period Ending Values |
| $11,083 | Fidelity® SAI Real Estate Index Fund |
| $11,068 | Dow Jones U.S. Select Real Estate Securities Index℠ |
Management's Discussion of Fund Performance
Market Recap: The S&P 500
® index gained 11.96% for the 12 months ending July 31, 2020, in what was a bumpy ride for U.S. equity investors, marked by a steep but brief decline due to the early-2020 outbreak and spread of the coronavirus, followed by a historic rebound. Declared a pandemic on March 11, the COVID-19 crisis and containment efforts caused broad contraction in economic activity, along with extreme uncertainty, volatility and dislocation in financial markets. By mid-March, U.S. stocks entered bear-market territory less than a month after hitting an all-time high and extending the longest-running bull market in American history. Stocks slid in late February, after a surge in COVID-19 cases outside China. The sudden downtrend continued in March (-12%), capping the index’s worst quarter since 2008. A historically rapid and expansive U.S. monetary/fiscal-policy response provided a partial offset to the economic disruption and fueled a sharp uptrend. Aggressive support for financial markets by the U.S. Federal Reserve, plans for reopening the economy and improving infection data boosted stocks in April (+13%) and May (+5%). In June and July, the index gained amid progress on potential treatments and signs of an early recovery in economic activity. For the full 12 months, growth stocks widely topped value, while large-caps handily bested smaller-caps. The information technology sector (+39%) led the way, followed by consumer discretionary (+22%). In contrast, energy (-38%) fell hard along with the price of crude oil.
Comments from the Geode Capital Management, LLC, passive equity index team: For the fiscal year ending July 31, 2020, the fund returned -16.04%, compared with the -16.30% result of the Dow Jones U.S. Select Real Estate Securities Index℠. In an often-challenging market environment for real estate securities, most sectors within the Dow Jones real estate index lost ground. The weakest-performing categories tended to be those involving businesses that heavily depend on social interaction, which became severely limited in the COVID-19 pandemic. Hotel and retail real estate investment trusts (REITs), for example, were particularly poor performers, returning about -52% and -46% in the index, respectively. By far, the biggest individual detractor was mall owner Simon Property Group (-61%). In March, Simon announced the temporary closure of all its retail U.S. properties, a move the company would not begin to reverse until early May. Hotel REIT Host Hotels & Resorts (-35%) also significantly lagged the index, reflecting a sharp drop in demand for lodging as consumers curtailed their travel. Several health care REITs also were meaningful detractors, led by Welltower (-35%) and Ventas (-40%), both of which were hampered by worries about a potential oversupply of senior housing properties. Investor concern about the impact of COVID-19 on demand for senior-housing facilities also appeared to weigh on both stocks. Various apartment REITs also struggled this period, most notably Equity Residential (-31%), AvalonBay Communities (-25%) and Essex Property Trust (-28%). On the positive side, meanwhile, were many real estate owners whose business models remained largely unaffected by social distancing efforts. For example, industrial REITs were particularly strong performers, benefiting from growth in e-commerce and demand for specialized warehouse space. Prologis (+31%) and Duke Realty (+22%) were two particularly strong-performing firms in this category. Data center operators such as Digital Realty Trust (+43%) benefited from growth in data consumption associated with more people working from home. Manufactured housing community owners Sun Communities (+10%) and Equity Lifestyle Properties (+10%) also contributed this period.
The views expressed above reflect those of the portfolio manager(s) only through the end of the period as stated on the cover of this report and do not necessarily represent the views of Fidelity or any other person in the Fidelity organization. Any such views are subject to change at any time based upon market or other conditions and Fidelity disclaims any responsibility to update such views. These views may not be relied on as investment advice and, because investment decisions for a Fidelity fund are based on numerous factors, may not be relied on as an indication of trading intent on behalf of any Fidelity fund.
Investment Summary (Unaudited)
Top Ten Stocks as of July 31, 2020
| | % of fund's net assets |
| Prologis (REIT), Inc. | 11.0 |
| Digital Realty Trust, Inc. | 6.1 |
| Public Storage | 4.2 |
| Alexandria Real Estate Equities, Inc. | 3.2 |
| Welltower, Inc. | 3.2 |
| AvalonBay Communities, Inc. | 3.1 |
| Realty Income Corp. | 2.9 |
| Simon Property Group, Inc. | 2.7 |
| Equity Residential (SBI) | 2.6 |
| Invitation Homes, Inc. | 2.3 |
| | 41.3 |
Top Five REIT Sectors as of July 31, 2020
| | % of fund's net assets |
| REITs - Apartments | 17.7 |
| REITs - Warehouse/Industrial | 16.2 |
| REITs - Diversified | 13.7 |
| REITs - Office Property | 12.1 |
| REITs - Health Care | 9.6 |
Asset Allocation (% of fund's net assets)
| As of July 31, 2020 |
| | Stocks and Equity Futures | 100.0% |

Schedule of Investments July 31, 2020
Showing Percentage of Net Assets
| Common Stocks - 99.8% | | | |
| | | Shares | Value |
| Equity Real Estate Investment Trusts (REITs) - 99.8% | | | |
| REITs - Apartments - 17.7% | | | |
| American Campus Communities, Inc. | | 112,575 | $4,012,173 |
| American Homes 4 Rent Class A | | 210,635 | 6,108,415 |
| Apartment Investment & Management Co. Class A | | 120,771 | 4,688,330 |
| AvalonBay Communities, Inc. | | 114,038 | 17,461,499 |
| Camden Property Trust (SBI) | | 78,842 | 7,159,642 |
| Equity Residential (SBI) | | 281,652 | 15,104,997 |
| Essex Property Trust, Inc. | | 53,034 | 11,706,725 |
| Front Yard Residential Corp. Class B | | 44,257 | 383,708 |
| Independence Realty Trust, Inc. | | 80,179 | 922,059 |
| Investors Real Estate Trust | | 10,023 | 724,663 |
| Invitation Homes, Inc. | | 446,403 | 13,311,737 |
| Mid-America Apartment Communities, Inc. | | 93,084 | 11,094,682 |
| UDR, Inc. | | 238,437 | 8,631,419 |
| | | | 101,310,049 |
| REITs - Diversified - 13.7% | | | |
| Apple Hospitality (REIT), Inc. | | 171,275 | 1,510,646 |
| Cousins Properties, Inc. | | 121,920 | 3,745,382 |
| Digital Realty Trust, Inc. | | 217,729 | 34,954,214 |
| Duke Realty Corp. | | 299,547 | 12,038,794 |
| EPR Properties | | 63,312 | 1,812,623 |
| Global Net Lease, Inc. | | 73,064 | 1,216,516 |
| NexPoint Residential Trust, Inc. | | 18,536 | 708,631 |
| PS Business Parks, Inc. | | 16,037 | 2,212,304 |
| Store Capital Corp. | | 182,023 | 4,312,125 |
| Vornado Realty Trust | | 127,620 | 4,405,442 |
| Washington REIT (SBI) | | 63,841 | 1,427,485 |
| WP Carey, Inc. | | 140,120 | 10,000,364 |
| | | | 78,344,526 |
| REITs - Health Care - 9.6% | | | |
| CareTrust (REIT), Inc. | | 79,602 | 1,434,428 |
| Community Healthcare Trust, Inc. | | 18,921 | 865,257 |
| Diversified Healthcare Trust (SBI) | | 195,278 | 760,608 |
| HCP, Inc. | | 438,236 | 11,959,460 |
| Healthcare Realty Trust, Inc. | | 108,925 | 3,191,503 |
| Healthcare Trust of America, Inc. | | 179,286 | 4,950,086 |
| LTC Properties, Inc. | | 32,182 | 1,195,561 |
| Universal Health Realty Income Trust (SBI) | | 10,633 | 739,844 |
| Ventas, Inc. | | 302,677 | 11,610,690 |
| Welltower, Inc. | | 338,512 | 18,130,703 |
| | | | 54,838,140 |
| REITs - Health Care Facilities - 1.4% | | | |
| National Health Investors, Inc. | | 36,824 | 2,283,088 |
| Omega Healthcare Investors, Inc. | | 184,168 | 5,963,360 |
| | | | 8,246,448 |
| REITs - Hotels - 2.7% | | | |
| Chatham Lodging Trust | | 33,750 | 175,838 |
| DiamondRock Hospitality Co. | | 161,384 | 745,594 |
| Hersha Hospitality Trust | | 30,276 | 144,114 |
| Hospitality Properties Trust (SBI) | | 133,517 | 894,564 |
| Host Hotels & Resorts, Inc. | | 569,740 | 6,141,797 |
| Park Hotels & Resorts, Inc. | | 191,399 | 1,582,870 |
| Pebblebrook Hotel Trust | | 104,734 | 1,110,180 |
| RLJ Lodging Trust | | 135,094 | 1,082,103 |
| Ryman Hospitality Properties, Inc. | | 44,894 | 1,437,506 |
| Summit Hotel Properties, Inc. | | 83,928 | 434,747 |
| Sunstone Hotel Investors, Inc. | | 168,881 | 1,263,230 |
| Xenia Hotels & Resorts, Inc. | | 91,292 | 726,684 |
| | | | 15,739,227 |
| REITs - Industrial Buildings - 0.7% | | | |
| Stag Industrial, Inc. | | 123,693 | 4,032,392 |
| REITs - Management/Investment - 1.8% | | | |
| American Assets Trust, Inc. | | 39,245 | 1,059,615 |
| Empire State Realty Trust, Inc. | | 116,230 | 767,118 |
| Lexington Corporate Properties Trust | | 224,225 | 2,601,010 |
| National Retail Properties, Inc. | | 139,984 | 4,962,433 |
| Retail Properties America, Inc. | | 174,717 | 1,111,200 |
| | | | 10,501,376 |
| REITs - Manufactured Homes - 3.8% | | | |
| Equity Lifestyle Properties, Inc. | | 147,726 | 10,092,640 |
| Sun Communities, Inc. | | 79,996 | 11,993,800 |
| | | | 22,086,440 |
| REITs - Office Buildings - 0.2% | | | |
| Government Properties Income Trust | | 39,879 | 1,002,957 |
| REITs - Office Property - 12.1% | | | |
| Alexandria Real Estate Equities, Inc. | | 102,976 | 18,283,389 |
| Boston Properties, Inc. | | 117,557 | 10,473,153 |
| Brandywine Realty Trust (SBI) | | 143,300 | 1,551,939 |
| City Office REIT, Inc. | | 39,386 | 340,689 |
| Columbia Property Trust, Inc. | | 89,456 | 1,069,894 |
| Corporate Office Properties Trust (SBI) | | 91,854 | 2,432,294 |
| Douglas Emmett, Inc. | | 135,191 | 3,939,466 |
| Easterly Government Properties, Inc. | | 62,762 | 1,534,531 |
| Equity Commonwealth | | 93,535 | 2,952,900 |
| Franklin Street Properties Corp. | | 82,366 | 432,422 |
| Highwoods Properties, Inc. (SBI) | | 85,339 | 3,271,897 |
| Hudson Pacific Properties, Inc. | | 126,481 | 2,981,157 |
| JBG SMITH Properties | | 94,242 | 2,733,960 |
| Kilroy Realty Corp. | | 85,734 | 4,995,720 |
| Mack-Cali Realty Corp. | | 72,609 | 1,047,022 |
| Paramount Group, Inc. | | 149,435 | 1,065,472 |
| Piedmont Office Realty Trust, Inc. Class A | | 101,522 | 1,645,672 |
| SL Green Realty Corp. | | 61,879 | 2,877,374 |
| VEREIT, Inc. | | 880,454 | 5,731,756 |
| | | | 69,360,707 |
| REITs - Regional Malls - 3.3% | | | |
| Pennsylvania Real Estate Investment Trust (SBI) (a) | | 50,179 | 59,211 |
| Simon Property Group, Inc. | | 248,217 | 15,476,330 |
| Tanger Factory Outlet Centers, Inc. (a) | | 76,464 | 491,664 |
| Taubman Centers, Inc. | | 50,069 | 1,938,672 |
| The Macerich Co. (a) | | 92,650 | 706,920 |
| | | | 18,672,797 |
| REITs - Shopping Centers - 7.0% | | | |
| Acadia Realty Trust (SBI) | | 67,905 | 817,576 |
| Brixmor Property Group, Inc. | | 241,441 | 2,778,986 |
| Federal Realty Investment Trust (SBI) | | 57,163 | 4,361,537 |
| Kimco Realty Corp. | | 350,199 | 3,904,719 |
| Kite Realty Group Trust | | 66,579 | 657,135 |
| Ramco-Gershenson Properties Trust (SBI) | | 63,515 | 395,063 |
| Realty Income Corp. | | 279,091 | 16,759,415 |
| Regency Centers Corp. | | 137,994 | 5,661,894 |
| Retail Opportunity Investments Corp. | | 99,551 | 1,082,119 |
| Seritage Growth Properties (a)(b) | | 31,046 | 289,038 |
| SITE Centers Corp. | | 121,223 | 888,565 |
| Urban Edge Properties | | 92,093 | 965,135 |
| Washington Prime Group, Inc. (a) | | 153,229 | 112,455 |
| Weingarten Realty Investors (SBI) | | 97,233 | 1,658,795 |
| | | | 40,332,432 |
| REITs - Single Tenant - 1.7% | | | |
| Agree Realty Corp. | | 45,081 | 3,019,075 |
| Essential Properties Realty Trust, Inc. | | 77,599 | 1,249,344 |
| Four Corners Property Trust, Inc. | | 60,006 | 1,512,151 |
| Getty Realty Corp. | | 29,356 | 869,818 |
| Spirit Realty Capital, Inc. | | 83,451 | 2,875,721 |
| | | | 9,526,109 |
| REITs - Storage - 7.9% | | | |
| CubeSmart | | 157,237 | 4,665,222 |
| Extra Space Storage, Inc. | | 104,616 | 10,811,017 |
| Life Storage, Inc. | | 38,305 | 3,758,870 |
| National Storage Affiliates Trust | | 51,122 | 1,575,580 |
| Public Storage | | 121,422 | 24,269,829 |
| | | | 45,080,518 |
| REITs - Warehouse/Industrial - 16.2% | | | |
| Americold Realty Trust | | 163,358 | 6,591,495 |
| EastGroup Properties, Inc. | | 32,016 | 4,247,243 |
| First Industrial Realty Trust, Inc. | | 104,175 | 4,575,366 |
| Industrial Logistics Properties Trust | | 53,686 | 1,133,311 |
| Monmouth Real Estate Investment Corp. Class A | | 81,081 | 1,169,999 |
| Prologis (REIT), Inc. | | 599,184 | 63,165,973 |
| QTS Realty Trust, Inc. Class A | | 49,305 | 3,547,495 |
| Rexford Industrial Realty, Inc. | | 101,689 | 4,772,265 |
| Terreno Realty Corp. | | 55,861 | 3,394,114 |
| | | | 92,597,261 |
| TOTAL COMMON STOCKS | | | |
| (Cost $561,495,750) | | | 571,671,379 |
|
| Money Market Funds - 6.2% | | | |
| Fidelity Cash Central Fund 0.14% (c) | | 34,224,540 | 34,234,808 |
| Fidelity Securities Lending Cash Central Fund 0.13% (c)(d) | | 1,196,063 | 1,196,182 |
| TOTAL MONEY MARKET FUNDS | | | |
| (Cost $35,430,990) | | | 35,430,990 |
| TOTAL INVESTMENT IN SECURITIES - 106.0% | | | |
| (Cost $596,926,740) | | | 607,102,369 |
| NET OTHER ASSETS (LIABILITIES) - (6.0)% | | | (34,274,614) |
| NET ASSETS - 100% | | | $572,827,755 |
| Futures Contracts | | | | | |
| | Number of contracts | Expiration Date | Notional Amount | Value | Unrealized Appreciation/(Depreciation) |
| Purchased | | | | | |
| Equity Index Contracts | | | | | |
| CME E-mini S&P MidCap 400 Index Contracts (United States) | 7 | Sept. 2020 | $1,302,350 | $6,221 | $6,221 |
The notional amount of futures purchased as a percentage of Net Assets is 0.2%
Legend
(a) Security or a portion of the security is on loan at period end.
(b) Non-income producing
(c) Affiliated fund that is generally available only to investment companies and other accounts managed by Fidelity Investments. The rate quoted is the annualized seven-day yield of the fund at period end. A complete unaudited listing of the fund's holdings as of its most recent quarter end is available upon request. In addition, each Fidelity Central Fund's financial statements, which are not covered by the Fund's Report of Independent Registered Public Accounting Firm, are available on the SEC's website or upon request.
(d) Investment made with cash collateral received from securities on loan.
Affiliated Central Funds
Information regarding fiscal year to date income earned by the Fund from investments in Fidelity Central Funds is as follows:
| Fund | Income earned |
| Fidelity Cash Central Fund | $6,100 |
| Fidelity Securities Lending Cash Central Fund | 26,317 |
| Total | $32,417 |
Amounts in the income column in the above table include any capital gain distributions from underlying funds, which are presented in the corresponding line-item in the Statement of Operations, if applicable. Amount for Fidelity Securities Lending Cash Central Fund represents the income earned on investing cash collateral, less rebates paid to borrowers and any lending agent fees associated with the loan, plus any premium payments received for lending certain types of securities.
Investment Valuation
The following is a summary of the inputs used, as of July 31, 2020, involving the Fund's assets and liabilities carried at fair value. The inputs or methodology used for valuing securities may not be an indication of the risk associated with investing in those securities. For more information on valuation inputs, and their aggregation into the levels used below, please refer to the Investment Valuation section in the accompanying Notes to Financial Statements.
| | Valuation Inputs at Reporting Date: |
| Description | Total | Level 1 | Level 2 | Level 3 |
| Investments in Securities: | | | | |
| Common Stocks | $571,671,379 | $571,671,379 | $-- | $-- |
| Money Market Funds | 35,430,990 | 35,430,990 | -- | -- |
| Total Investments in Securities: | $607,102,369 | $607,102,369 | $-- | $-- |
| Derivative Instruments: | | | | |
| Assets | | | | |
| Futures Contracts | $6,221 | $6,221 | $-- | $-- |
| Total Assets | $6,221 | $6,221 | $-- | $-- |
| Total Derivative Instruments: | $6,221 | $6,221 | $-- | $-- |
Value of Derivative Instruments
The following table is a summary of the Fund's value of derivative instruments by primary risk exposure as of July 31, 2020. For additional information on derivative instruments, please refer to the Derivative Instruments section in the accompanying Notes to Financial Statements.
| Primary Risk Exposure / Derivative Type | Value |
| | Asset | Liability |
| Equity Risk | | |
| Futures Contracts(a) | $6,221 | $0 |
| Total Equity Risk | 6,221 | 0 |
| Total Value of Derivatives | $6,221 | $0 |
(a) Reflects gross cumulative appreciation (depreciation) on futures contracts as presented in the Schedule of Investments. In the Statement of Assets and Liabilities, the period end daily variation margin is included in receivable or payable for daily variation margin on futures contracts, and the net cumulative appreciation (depreciation) is included in Total accumulated earnings (loss).
See accompanying notes which are an integral part of the financial statements.
Financial Statements
Statement of Assets and Liabilities
| | | July 31, 2020 |
| Assets | | |
Investment in securities, at value (including securities loaned of $1,091,538) — See accompanying schedule:
Unaffiliated issuers (cost $561,495,750) | $571,671,379 | |
| Fidelity Central Funds (cost $35,430,990) | 35,430,990 | |
| Total Investment in Securities (cost $596,926,740) | | $607,102,369 |
| Segregated cash with brokers for derivative instruments | | 105,000 |
| Cash | | 417,299 |
| Receivable for fund shares sold | | 284,732 |
| Dividends receivable | | 337,108 |
| Distributions receivable from Fidelity Central Funds | | 15,875 |
| Prepaid expenses | | 72 |
| Receivable from investment adviser for expense reductions | | 40,417 |
| Total assets | | 608,302,872 |
| Liabilities | | |
| Payable for investments purchased | $33,810,078 | |
| Payable for fund shares redeemed | 428,277 | |
| Accrued management fee | 22,066 | |
| Payable for daily variation margin on futures contracts | 8,890 | |
| Other payables and accrued expenses | 9,206 | |
| Collateral on securities loaned | 1,196,600 | |
| Total liabilities | | 35,475,117 |
| Net Assets | | $572,827,755 |
| Net Assets consist of: | | |
| Paid in capital | | $587,635,015 |
| Total accumulated earnings (loss) | | (14,807,260) |
| Net Assets | | $572,827,755 |
| Net Asset Value, offering price and redemption price per share ($572,827,755 ÷ 59,259,190 shares) | | $9.67 |
See accompanying notes which are an integral part of the financial statements.
Statement of Operations
| | | Year ended July 31, 2020 |
| Investment Income | | |
| Dividends | | $4,709,426 |
| Interest | | 156 |
| Income from Fidelity Central Funds (including $26,317 from security lending) | | 32,417 |
| Total income | | 4,741,999 |
| Expenses | | |
| Management fee | $90,791 | |
| Custodian fees and expenses | 6,948 | |
| Independent trustees' fees and expenses | 377 | |
| Registration fees | 57,950 | |
| Audit | 51,697 | |
| Legal | 172 | |
| Miscellaneous | 655 | |
| Total expenses before reductions | 208,590 | |
| Expense reductions | (116,804) | |
| Total expenses after reductions | | 91,786 |
| Net investment income (loss) | | 4,650,213 |
| Realized and Unrealized Gain (Loss) | | |
| Net realized gain (loss) on: | | |
| Investment securities: | | |
| Unaffiliated issuers | (27,212,768) | |
| Fidelity Central Funds | (10) | |
| Futures contracts | 100,798 | |
| Total net realized gain (loss) | | (27,111,980) |
| Change in net unrealized appreciation (depreciation) on: | | |
| Investment securities: | | |
| Unaffiliated issuers | 8,170,407 | |
| Fidelity Central Funds | 19 | |
| Futures contracts | (873) | |
| Total change in net unrealized appreciation (depreciation) | | 8,169,553 |
| Net gain (loss) | | (18,942,427) |
| Net increase (decrease) in net assets resulting from operations | | $(14,292,214) |
See accompanying notes which are an integral part of the financial statements.
Statement of Changes in Net Assets
| | Year ended July 31, 2020 | Year ended July 31, 2019 |
| Increase (Decrease) in Net Assets | | |
| Operations | | |
| Net investment income (loss) | $4,650,213 | $3,243,572 |
| Net realized gain (loss) | (27,111,980) | 526,063 |
| Change in net unrealized appreciation (depreciation) | 8,169,553 | 6,498,235 |
| Net increase (decrease) in net assets resulting from operations | (14,292,214) | 10,267,870 |
| Distributions to shareholders | (3,402,434) | (3,330,211) |
| Share transactions | | |
| Proceeds from sales of shares | 565,703,735 | – |
| Reinvestment of distributions | 3,402,425 | 2,428,308 |
| Cost of shares redeemed | (83,279,953) | (106,293) |
| Net increase (decrease) in net assets resulting from share transactions | 485,826,207 | 2,322,015 |
| Total increase (decrease) in net assets | 468,131,559 | 9,259,674 |
| Net Assets | | |
| Beginning of period | 104,696,196 | 95,436,522 |
| End of period | $572,827,755 | $104,696,196 |
| Other Information | | |
| Shares | | |
| Sold | 59,600,408 | – |
| Issued in reinvestment of distributions | 289,184 | 226,848 |
| Redeemed | (9,440,066) | (9,533) |
| Net increase (decrease) | 50,449,526 | 217,315 |
See accompanying notes which are an integral part of the financial statements.
Financial Highlights
Fidelity SAI Real Estate Index Fund
| | | | | | |
| Years ended July 31, | 2020 | 2019 | 2018 | 2017 | 2016 A |
| Selected Per–Share Data | | | | | |
| Net asset value, beginning of period | $11.88 | $11.11 | $11.08 | $12.05 | $10.00 |
| Income from Investment Operations | | | | | |
| Net investment income (loss)B | .36 | .37 | .33 | .28 | .06 |
| Net realized and unrealized gain (loss) | (2.20) | .79 | .08 | (.96) | 2.08 |
| Total from investment operations | (1.84) | 1.16 | .41 | (.68) | 2.14 |
| Distributions from net investment income | (.30) | (.37) | (.33) | (.24) | (.09) |
| Distributions from net realized gain | (.07) | (.02) | (.05) | (.05) | – |
| Total distributions | (.37) | (.39) | (.38) | (.29) | (.09) |
| Net asset value, end of period | $9.67 | $11.88 | $11.11 | $11.08 | $12.05 |
| Total ReturnC,D | (16.04)% | 10.79% | 3.87% | (5.60)% | 21.52% |
| Ratios to Average Net AssetsE,F | | | | | |
| Expenses before reductions | .16% | .15% | .15% | .15% | .77%G |
| Expenses net of fee waivers, if any | .07% | .07% | .07% | .09% | .09%G |
| Expenses net of all reductions | .07% | .07% | .07% | .09% | .09%G |
| Net investment income (loss) | 3.52% | 3.31% | 3.11% | 2.55% | 1.06%G |
| Supplemental Data | | | | | |
| Net assets, end of period (000 omitted) | $572,828 | $104,696 | $95,437 | $98,222 | $105,295 |
| Portfolio turnover rateH | 82% | 9% | 8% | 6% | 1%I |
A For the period February 2, 2016 (commencement of operations) to July 31, 2016.
B Calculated based on average shares outstanding during the period.
C Total returns for periods of less than one year are not annualized.
D Total returns would have been lower if certain expenses had not been reduced during the applicable periods shown.
E Fees and expenses of any underlying mutual funds or exchange-traded funds (ETFs) are not included in the Fund's expense ratio. The Fund indirectly bears its proportionate share of these expenses. For additional expense information related to investments in Fidelity Central Funds, please refer to the "Investments in Fidelity Central Funds" note found in the Notes to Financial Statements section of the most recent Annual or Semi-Annual report.
F Expense ratios reflect operating expenses of the Fund. Expenses before reductions do not reflect amounts reimbursed by the investment adviser or reductions from expense offset arrangements and do not represent the amount paid by the Fund during periods when reimbursements or reductions occur. Expense ratios before reductions for start-up periods may not be representative of longer term operating periods. Expenses net of fee waivers reflect expenses after reimbursement by the investment adviser but prior to reductions from expense offset arrangements. Expenses net of all reductions represent the net expenses paid by the Fund.
G Annualized
H Amount does not include the portfolio activity of any underlying Fidelity Central Funds.
I Amount not annualized.
See accompanying notes which are an integral part of the financial statements.
Notes to Financial Statements
For the period ended July 31, 2020
1. Organization.
Fidelity SAI Real Estate Index Fund (the Fund) is a fund of Fidelity Salem Street Trust (the Trust) and is authorized to issue an unlimited number of shares. Shares are offered exclusively to certain clients of Fidelity Management & Research Company LLC (FMR) or its affiliates. The Trust is registered under the Investment Company Act of 1940, as amended (the 1940 Act), as an open-end management investment company organized as a Massachusetts business trust.
Effective January 1, 2020:
Investment advisers Fidelity Investments Money Management, Inc., FMR Co., Inc., and Fidelity SelectCo, LLC, merged with and into Fidelity Management & Research Company. In connection with the merger transactions, the resulting, merged investment adviser was then redomiciled from Massachusetts to Delaware, changed its corporate structure from a corporation to a limited liability company, and changed its name to "Fidelity Management & Research Company LLC".
2. Investments in Fidelity Central Funds.
The Fund invests in Fidelity Central Funds, which are open-end investment companies generally available only to other investment companies and accounts managed by the investment adviser and its affiliates. The Fund's Schedule of Investments lists each of the Fidelity Central Funds held as of period end, if any, as an investment of the Fund, but does not include the underlying holdings of each Fidelity Central Fund. As an Investing Fund, the Fund indirectly bears its proportionate share of the expenses of the underlying Fidelity Central Funds.
The Money Market Central Funds seek preservation of capital and current income and are managed by the investment adviser. Annualized expenses of the Money Market Central Funds as of their most recent shareholder report date ranged from less than .005% to .01%.
A complete unaudited list of holdings for each Fidelity Central Fund is available upon request or at the Securities and Exchange Commission (the SEC) website at www.sec.gov. In addition, the financial statements of the Fidelity Central Funds, which are not covered by the Fund's Report of Independent Registered Public Accounting Firm, are available on the SEC website or upon request.
3. Significant Accounting Policies.
The Fund is an investment company and applies the accounting and reporting guidance of the Financial Accounting Standards Board (FASB) Accounting Standards Codification Topic 946 Financial Services – Investment Companies. The financial statements have been prepared in conformity with accounting principles generally accepted in the United States of America (GAAP), which require management to make certain estimates and assumptions at the date of the financial statements. Actual results could differ from those estimates. Subsequent events, if any, through the date that the financial statements were issued have been evaluated in the preparation of the financial statements. The following summarizes the significant accounting policies of the Fund:
Investment Valuation. Investments are valued as of 4:00 p.m. Eastern time on the last calendar day of the period. The Board of Trustees (the Board) has delegated the day to day responsibility for the valuation of the Fund's investments to the Fair Value Committee (the Committee) established by the Fund's investment adviser. In accordance with valuation policies and procedures approved by the Board, the Fund attempts to obtain prices from one or more third party pricing vendors or brokers to value its investments. When current market prices, quotations or currency exchange rates are not readily available or reliable, investments will be fair valued in good faith by the Committee, in accordance with procedures adopted by the Board. Factors used in determining fair value vary by investment type and may include market or investment specific events. The frequency with which these procedures are used cannot be predicted and they may be utilized to a significant extent. The Committee oversees the Fund's valuation policies and procedures and reports to the Board on the Committee's activities and fair value determinations. The Board monitors the appropriateness of the procedures used in valuing the Fund's investments and ratifies the fair value determinations of the Committee.
The Fund categorizes the inputs to valuation techniques used to value its investments into a disclosure hierarchy consisting of three levels as shown below:
- Level 1 – quoted prices in active markets for identical investments
- Level 2 – other significant observable inputs (including quoted prices for similar investments, interest rates, prepayment speeds, etc.)
- Level 3 – unobservable inputs (including the Fund's own assumptions based on the best information available)
Valuation techniques used to value the Fund's investments by major category are as follows:
Equity securities, including restricted securities, for which market quotations are readily available, are valued at the last reported sale price or official closing price as reported by a third party pricing vendor on the primary market or exchange on which they are traded and are categorized as Level 1 in the hierarchy. In the event there were no sales during the day or closing prices are not available, securities are valued at the last quoted bid price or may be valued using the last available price and are generally categorized as Level 2 in the hierarchy. For foreign equity securities, when market or security specific events arise, comparisons to the valuation of American Depositary Receipts (ADRs), futures contracts, Exchange-Traded Funds (ETFs) and certain indexes as well as quoted prices for similar securities may be used and would be categorized as Level 2 in the hierarchy. For equity securities, including restricted securities, where observable inputs are limited, assumptions about market activity and risk are used and these securities may be categorized as Level 3 in the hierarchy.
Futures contracts are valued at the settlement price established each day by the board of trade or exchange on which they are traded and are categorized as Level 1 in the hierarchy. Investments in open-end mutual funds, including the Fidelity Central Funds, are valued at their closing net asset value (NAV) each business day and are categorized as Level 1 in the hierarchy.
Changes in valuation techniques may result in transfers in or out of an assigned level within the disclosure hierarchy. The aggregate value of investments by input level as of July 31, 2020 is included at the end of the Fund's Schedule of Investments.
Investment Transactions and Income. For financial reporting purposes, the Fund's investment holdings and NAV include trades executed through the end of the last business day of the period. The NAV per share for processing shareholder transactions is calculated as of the close of business of the New York Stock Exchange (NYSE), normally 4:00 p.m. Eastern time and includes trades executed through the end of the prior business day. Gains and losses on securities sold are determined on the basis of identified cost. Dividend income is recorded on the ex-dividend date, except for certain dividends from foreign securities where the ex-dividend date may have passed, which are recorded as soon as the Fund is informed of the ex-dividend date. Non-cash dividends included in dividend income, if any, are recorded at the fair market value of the securities received. Income and capital gain distributions from Fidelity Central Funds, if any, are recorded on the ex-dividend date. Certain distributions received by the Fund represent a return of capital or capital gain. The Fund determines the components of these distributions subsequent to the ex-dividend date, based upon receipt of tax filings or other correspondence relating to the underlying investment. These distributions are recorded as a reduction of cost of investments and/or as a realized gain. Interest income is accrued as earned and includes coupon interest and amortization of premium and accretion of discount on debt securities as applicable.
Expenses. Expenses directly attributable to a fund are charged to that fund. Expenses attributable to more than one fund are allocated among the respective funds on the basis of relative net assets or other appropriate methods. Expense estimates are accrued in the period to which they relate and adjustments are made when actual amounts are known.
Income Tax Information and Distributions to Shareholders. Each year, the Fund intends to qualify as a regulated investment company under Subchapter M of the Internal Revenue Code, including distributing substantially all of its taxable income and realized gains. As a result, no provision for U.S. Federal income taxes is required. As of July 31, 2020, the Fund did not have any unrecognized tax benefits in the financial statements; nor is the Fund aware of any tax positions for which it is reasonably possible that the total amounts of unrecognized tax benefits will significantly change in the next twelve months. The Fund files a U.S. federal tax return, in addition to state and local tax returns as required. The Fund's federal income tax returns are subject to examination by the Internal Revenue Service (IRS) for a period of three fiscal years after they are filed. State and local tax returns may be subject to examination for an additional fiscal year depending on the jurisdiction.
Distributions are declared and recorded on the ex-dividend date. Income and capital gain distributions are determined in accordance with income tax regulations, which may differ from GAAP.
Capital accounts within the financial statements are adjusted for permanent book-tax differences. These adjustments have no impact on net assets or the results of operations. Capital accounts are not adjusted for temporary book-tax differences which will reverse in a subsequent period.
Book-tax differences are primarily due to the short-term gain distributions from the Underlying Funds, futures contracts, capital loss carryforwards and losses deferred due to wash sales.
As of period end, the cost and unrealized appreciation (depreciation) in securities, and derivatives if applicable, for federal income tax purposes were as follows:
| Gross unrealized appreciation | $21,376,241 |
| Gross unrealized depreciation | (23,310,482) |
| Net unrealized appreciation (depreciation) | $(1,934,241) |
| Tax Cost | $609,036,610 |
The tax-based components of distributable earnings as of period end were as follows:
| Undistributed ordinary income | $2,146,137 |
| Capital loss carryforward | $(15,019,157) |
| Net unrealized appreciation (depreciation) on securities and other investments | $(1,934,241) |
Capital loss carryforwards are only available to offset future capital gains of the Fund to the extent provided by regulations and may be limited. The capital loss carryforward information presented below, including any applicable limitation, is estimated as of fiscal period end and is subject to adjustment.
| No expiration | |
| Short-term | $(1,180,283) |
| Long-term | (13,838,874) |
| Total capital loss carryforward | $(15,019,157) |
Due to large redemptions and then subscriptions in the period, approximately $12,380,505 of the Fund's realized capital losses are subject to limitation. Due to this limitation, the Fund will only be permitted to use approximately $70,663 of those capital losses per year to offset capital gains.
The tax character of distributions paid was as follows:
| | July 31, 2020 | July 31, 2019 |
| Ordinary Income | $2,829,806 | $ 3,192,733 |
| Long-term Capital Gains | 572,628 | 137,478 |
| Total | $3,402,434 | $ 3,330,211 |
4. Derivative Instruments.
Risk Exposures and the Use of Derivative Instruments. The Fund's investment objective allows the Fund to enter into various types of derivative contracts, including futures contracts. Derivatives are investments whose value is primarily derived from underlying assets, indices or reference rates and may be transacted on an exchange or over-the-counter (OTC). Derivatives may involve a future commitment to buy or sell a specified asset based on specified terms, to exchange future cash flows at periodic intervals based on a notional principal amount, or for one party to make one or more payments upon the occurrence of specified events in exchange for periodic payments from the other party.
The Fund used derivatives to increase returns and to manage exposure to certain risks as defined below. The success of any strategy involving derivatives depends on analysis of numerous economic factors, and if the strategies for investment do not work as intended, the Fund may not achieve its objectives.
The Fund's use of derivatives increased or decreased its exposure to the following risk:
| Equity Risk | Equity risk relates to the fluctuations in the value of financial instruments as a result of changes in market prices (other than those arising from interest rate risk or foreign exchange risk), whether caused by factors specific to an individual investment, its issuer, or all factors affecting all instruments traded in a market or market segment.
|
The Fund is also exposed to additional risks from investing in derivatives, such as liquidity risk and counterparty credit risk. Liquidity risk is the risk that the Fund will be unable to close out the derivative in the open market in a timely manner. Counterparty credit risk is the risk that the counterparty will not be able to fulfill its obligation to the Fund. Counterparty credit risk related to exchange-traded futures contracts may be mitigated by the protection provided by the exchange on which they trade.
Investing in derivatives may involve greater risks than investing in the underlying assets directly and, to varying degrees, may involve risk of loss in excess of any initial investment and collateral received and amounts recognized in the Statement of Assets and Liabilities. In addition, there may be the risk that the change in value of the derivative contract does not correspond to the change in value of the underlying instrument.
Futures Contracts. A futures contract is an agreement between two parties to buy or sell a specified underlying instrument for a fixed price at a specified future date. The Fund used futures contracts to manage its exposure to the stock market.
Upon entering into a futures contract, a fund is required to deposit either cash or securities (initial margin) with a clearing broker in an amount equal to a certain percentage of the face value of the contract. Futures contracts are marked-to-market daily and subsequent daily payments (variation margin) are made or received by a fund depending on the daily fluctuations in the value of the futures contracts and are recorded as unrealized appreciation or (depreciation). This receivable and/or payable, if any, is included in daily variation margin on futures contracts in the Statement of Assets and Liabilities. Realized gain or (loss) is recorded upon the expiration or closing of a futures contract. The net realized gain (loss) and change in net unrealized appreciation (depreciation) on futures contracts during the period is presented in the Statement of Operations.
Any open futures contracts at period end are presented in the Schedule of Investments under the caption "Futures Contracts". The notional amount at value reflects each contract's exposure to the underlying instrument or index at period end and is representative of volume of activity during the period. Cash deposited to meet initial margin requirements is presented as segregated cash with brokers for derivative instruments in the Statement of Assets and Liabilities.
5. Purchases and Sales of Investments.
Purchases and sales of securities, other than short-term securities, are noted in the table below.
| | Purchases ($) | Sales ($) |
| Fidelity SAI Real Estate Index Fund | 617,967,186 | 130,640,591 |
6. Fees and Other Transactions with Affiliates.
Management Fee. Fidelity Management & Research Company LLC (the investment adviser) and its affiliates provide the Fund with investment management related services for which the Fund pays a monthly management fee that is based on an annual rate of .07% of the Fund's average net assets.
Sub-Adviser. Geode Capital Management, LLC (Geode), serves as sub-adviser for the Fund. Geode provides discretionary investment advisory services to the Fund and is paid by the investment adviser for providing these services.
Interfund Trades. Funds may purchase from or sell securities to other Fidelity Funds under procedures adopted by the Board. The procedures have been designed to ensure these interfund trades are executed in accordance with Rule 17a-7 of the 1940 Act. Interfund trades are included within the respective purchases and sales amounts shown in the Purchases and Sales of Investments note.
7. Committed Line of Credit.
Certain Funds participate with other funds managed by the investment adviser or an affiliate in a $4.25 billion credit facility (the "line of credit") to be utilized for temporary or emergency purposes to fund shareholder redemptions or for other short-term liquidity purposes. The participating funds have agreed to pay commitment fees on their pro-rata portion of the line of credit, which are reflected in Miscellaneous expenses on the Statement of Operations, and are as follows:
| | Amount |
| Fidelity SAI Real Estate Index Fund | $263 |
During the period, there were no borrowings on this line of credit.
8. Security Lending.
The Fund lends portfolio securities from time to time in order to earn additional income. Lending agents are used, including National Financial Services (NFS), an affiliate of the Fund. Pursuant to a securities lending agreement, NFS will receive a fee, which is capped at 9.9% of daily lending revenue, for its services as lending agent. The Fund may lend securities to certain qualified borrowers, including NFS. On the settlement date of the loan, the Fund receives collateral (in the form of U.S. Treasury obligations, letters of credit and/or cash) against the loaned securities and maintains collateral in an amount not less than 100% of the market value of the loaned securities during the period of the loan. The market value of the loaned securities is determined at the close of business of the Fund and any additional required collateral is delivered to the Fund on the next business day. The Fund or borrower may terminate the loan at any time, and if the borrower defaults on its obligation to return the securities loaned because of insolvency or other reasons, the Fund may apply collateral received from the borrower against the obligation. The Fund may experience delays and costs in recovering the securities loaned. Any cash collateral received is invested in the Fidelity Securities Lending Cash Central Fund. The value of loaned securities and cash collateral at period end are disclosed on the Fund's Statement of Assets and Liabilities. The value of securities loaned to NFS, as affiliated borrower, at period end was $122,351. Total fees paid by the Fund to NFS, as lending agent, amounted to $1,856. Security lending income represents the income earned on investing cash collateral, less rebates paid to borrowers and any lending agent fees associated with the loan, plus any premium payments received for lending certain types of securities. Net income from the Fidelity Securities Lending Cash Central Fund during the period is presented in the Statement of Operations as a component of income from Fidelity Central Funds (and includes $1,697 from securities loaned to NFS, as affiliated borrower).
9. Expense Reductions.
The investment adviser contractually agreed to reimburse the Fund to the extent annual operating expenses exceeded .07% of average net assets. This reimbursement will remain in place through November 30, 2021. Some expenses, for example the compensation of the independent Trustees, and certain miscellaneous expenses such as proxy and shareholder meeting expenses, are excluded from this reimbursement. During the period this reimbursement reduced the Fund's expenses by $116,609.
Through arrangements with the Fund's custodian, credits realized as a result of certain uninvested cash balances were used to reduce the Fund's expenses by $195.
10. Other.
The Fund's organizational documents provide former and current trustees and officers with a limited indemnification against liabilities arising in connection with the performance of their duties to the Fund. In the normal course of business, the Fund may also enter into contracts that provide general indemnifications. The Fund's maximum exposure under these arrangements is unknown as this would be dependent on future claims that may be made against the Fund. The risk of material loss from such claims is considered remote.
11. Coronavirus (COVID-19) Pandemic.
An outbreak of COVID-19 first detected in China during December 2019 has since spread globally and was declared a pandemic by the World Health Organization during March 2020. Developments that disrupt global economies and financial markets, such as the COVID-19 pandemic, may magnify factors that affect the Fund's performance.
Report of Independent Registered Public Accounting Firm
To the Board of Trustees of Fidelity Salem Street Trust and Shareholders of Fidelity SAI Real Estate Index Fund
Opinion on the Financial Statements and Financial Highlights
We have audited the accompanying statement of assets and liabilities of Fidelity SAI Real Estate Index Fund (the "Fund"), a fund of Fidelity Salem Street Trust, including the schedule of investments, as of July 31, 2020, the related statement of operations for the year then ended, the statement of changes in net assets for each of the two years in the period then ended, the financial highlights for each of the four years in the period then ended and for the period from February 2, 2016 (commencement of operations) through July 31, 2016, and the related notes. In our opinion, the financial statements and financial highlights present fairly, in all material respects, the financial position of the Fund as of July 31, 2020, and the results of its operations for the year then ended, the changes in its net assets for each of the two years in the period then ended, and the financial highlights for each of the four years in the period then ended and for the period from February 2, 2016 (commencement of operations) through July 31, 2016 in conformity with accounting principles generally accepted in the United States of America.
Basis for Opinion
These financial statements and financial highlights are the responsibility of the Fund's management. Our responsibility is to express an opinion on the Fund's financial statements and financial highlights based on our audits. We are a public accounting firm registered with the Public Company Accounting Oversight Board (United States) (PCAOB) and are required to be independent with respect to the Fund in accordance with the U.S. federal securities laws and the applicable rules and regulations of the Securities and Exchange Commission and the PCAOB.
We conducted our audits in accordance with the standards of the PCAOB. Those standards require that we plan and perform the audit to obtain reasonable assurance about whether the financial statements and financial highlights are free of material misstatement, whether due to error or fraud. The Fund is not required to have, nor were we engaged to perform, an audit of its internal control over financial reporting. As part of our audits we are required to obtain an understanding of internal control over financial reporting but not for the purpose of expressing an opinion on the effectiveness of the Fund’s internal control over financial reporting. Accordingly, we express no such opinion.
Our audits included performing procedures to assess the risks of material misstatement of the financial statements and financial highlights, whether due to error or fraud, and performing procedures that respond to those risks. Such procedures included examining, on a test basis, evidence regarding the amounts and disclosures in the financial statements and financial highlights. Our audits also included evaluating the accounting principles used and significant estimates made by management, as well as evaluating the overall presentation of the financial statements and financial highlights. Our procedures included confirmation of securities owned as of July 31, 2020, by correspondence with the custodian and brokers; when replies were not received from brokers, we performed other auditing procedures. We believe that our audits provide a reasonable basis for our opinion.
/s/ Deloitte & Touche LLP
Boston, Massachusetts
September 14, 2020
We have served as the auditor of one or more of the Fidelity investment companies since 1999.
Trustees and Officers
The Trustees, Members of the Advisory Board (if any), and officers of the trust and fund, as applicable, are listed below. The Board of Trustees governs the fund and is responsible for protecting the interests of shareholders. The Trustees are experienced executives who meet periodically throughout the year to oversee the fund's activities, review contractual arrangements with companies that provide services to the fund, oversee management of the risks associated with such activities and contractual arrangements, and review the fund's performance. Except for Jonathan Chiel, each of the Trustees oversees 311 funds. Mr. Chiel oversees 174 funds.
The Trustees hold office without limit in time except that (a) any Trustee may resign; (b) any Trustee may be removed by written instrument, signed by at least two-thirds of the number of Trustees prior to such removal; (c) any Trustee who requests to be retired or who has become incapacitated by illness or injury may be retired by written instrument signed by a majority of the other Trustees; and (d) any Trustee may be removed at any special meeting of shareholders by a two-thirds vote of the outstanding voting securities of the trust. Each Trustee who is not an interested person (as defined in the 1940 Act) of the trust and the fund is referred to herein as an Independent Trustee. Each Independent Trustee shall retire not later than the last day of the calendar year in which his or her 75th birthday occurs. The Independent Trustees may waive this mandatory retirement age policy with respect to individual Trustees. Officers and Advisory Board Members hold office without limit in time, except that any officer or Advisory Board Member may resign or may be removed by a vote of a majority of the Trustees at any regular meeting or any special meeting of the Trustees. Except as indicated, each individual has held the office shown or other offices in the same company for the past five years.
The fund’s Statement of Additional Information (SAI) includes more information about the Trustees. To request a free copy, call Fidelity at 1-800-544-3455.
Experience, Skills, Attributes, and Qualifications of the Trustees. The Governance and Nominating Committee has adopted a statement of policy that describes the experience, qualifications, attributes, and skills that are necessary and desirable for potential Independent Trustee candidates (Statement of Policy). The Board believes that each Trustee satisfied at the time he or she was initially elected or appointed a Trustee, and continues to satisfy, the standards contemplated by the Statement of Policy. The Governance and Nominating Committee also engages professional search firms to help identify potential Independent Trustee candidates who have the experience, qualifications, attributes, and skills consistent with the Statement of Policy. From time to time, additional criteria based on the composition and skills of the current Independent Trustees, as well as experience or skills that may be appropriate in light of future changes to board composition, business conditions, and regulatory or other developments, have also been considered by the professional search firms and the Governance and Nominating Committee. In addition, the Board takes into account the Trustees' commitment and participation in Board and committee meetings, as well as their leadership of standing and ad hoc committees throughout their tenure.
In determining that a particular Trustee was and continues to be qualified to serve as a Trustee, the Board has considered a variety of criteria, none of which, in isolation, was controlling. The Board believes that, collectively, the Trustees have balanced and diverse experience, qualifications, attributes, and skills, which allow the Board to operate effectively in governing the fund and protecting the interests of shareholders. Information about the specific experience, skills, attributes, and qualifications of each Trustee, which in each case led to the Board's conclusion that the Trustee should serve (or continue to serve) as a trustee of the fund, is provided below.
Board Structure and Oversight Function. Abigail P. Johnson is an interested person and currently serves as Chairman. The Trustees have determined that an interested Chairman is appropriate and benefits shareholders because an interested Chairman has a personal and professional stake in the quality and continuity of services provided to the fund. Independent Trustees exercise their informed business judgment to appoint an individual of their choosing to serve as Chairman, regardless of whether the Trustee happens to be independent or a member of management. The Independent Trustees have determined that they can act independently and effectively without having an Independent Trustee serve as Chairman and that a key structural component for assuring that they are in a position to do so is for the Independent Trustees to constitute a substantial majority for the Board. The Independent Trustees also regularly meet in executive session. Arthur E. Johnson serves as Chairman of the Independent Trustees and as such (i) acts as a liaison between the Independent Trustees and management with respect to matters important to the Independent Trustees and (ii) with management prepares agendas for Board meetings.
Fidelity® funds are overseen by different Boards of Trustees. The fund's Board oversees Fidelity's investment-grade bond, money market, asset allocation and certain equity funds, and other Boards oversee Fidelity's high income and other equity funds. The asset allocation funds may invest in Fidelity® funds that are overseen by such other Boards. The use of separate Boards, each with its own committee structure, allows the Trustees of each group of Fidelity® funds to focus on the unique issues of the funds they oversee, including common research, investment, and operational issues. On occasion, the separate Boards establish joint committees to address issues of overlapping consequences for the Fidelity® funds overseen by each Board.
The Trustees operate using a system of committees to facilitate the timely and efficient consideration of all matters of importance to the Trustees, the fund, and fund shareholders and to facilitate compliance with legal and regulatory requirements and oversight of the fund's activities and associated risks. The Board, acting through its committees, has charged FMR and its affiliates with (i) identifying events or circumstances the occurrence of which could have demonstrably adverse effects on the fund's business and/or reputation; (ii) implementing processes and controls to lessen the possibility that such events or circumstances occur or to mitigate the effects of such events or circumstances if they do occur; and (iii) creating and maintaining a system designed to evaluate continuously business and market conditions in order to facilitate the identification and implementation processes described in (i) and (ii) above. Because the day-to-day operations and activities of the fund are carried out by or through FMR, its affiliates, and other service providers, the fund's exposure to risks is mitigated but not eliminated by the processes overseen by the Trustees. While each of the Board's committees has responsibility for overseeing different aspects of the fund's activities, oversight is exercised primarily through the Operations and Audit Committees. In addition, an ad hoc Board committee of Independent Trustees has worked with FMR to enhance the Board's oversight of investment and financial risks, legal and regulatory risks, technology risks, and operational risks, including the development of additional risk reporting to the Board. Appropriate personnel, including but not limited to the fund's Chief Compliance Officer (CCO), FMR's internal auditor, the independent accountants, the fund's Treasurer and portfolio management personnel, make periodic reports to the Board's committees, as appropriate, including an annual review of Fidelity's risk management program for the Fidelity® funds. The responsibilities of each standing committee, including their oversight responsibilities, are described further under "Standing Committees of the Trustees."
Interested Trustees*:
Correspondence intended for a Trustee who is an interested person may be sent to Fidelity Investments, 245 Summer Street, Boston, Massachusetts 02210.
Name, Year of Birth; Principal Occupations and Other Relevant Experience+
Jonathan Chiel (1957)
Year of Election or Appointment: 2016
Trustee
Mr. Chiel also serves as Trustee of other Fidelity® funds. Mr. Chiel is Executive Vice President and General Counsel for FMR LLC (diversified financial services company, 2012-present). Previously, Mr. Chiel served as general counsel (2004-2012) and senior vice president and deputy general counsel (2000-2004) for John Hancock Financial Services; a partner with Choate, Hall & Stewart (1996-2000) (law firm); and an Assistant United States Attorney for the United States Attorney’s Office of the District of Massachusetts (1986-95), including Chief of the Criminal Division (1993-1995). Mr. Chiel is a director on the boards of the Boston Bar Foundation and the Maimonides School.
Abigail P. Johnson (1961)
Year of Election or Appointment: 2009
Trustee
Chairman of the Board of Trustees
Ms. Johnson also serves as Trustee of other Fidelity® funds. Ms. Johnson serves as Chairman (2016-present), Chief Executive Officer (2014-present), and Director (2007-present) of FMR LLC (diversified financial services company), President of Fidelity Financial Services (2012-present) and President of Personal, Workplace and Institutional Services (2005-present). Ms. Johnson is Chairman and Director of Fidelity Management & Research Company LLC (investment adviser firm, 2011-present). Previously, Ms. Johnson served as Chairman and Director of FMR Co., Inc. (investment adviser firm, 2011-2019), Vice Chairman (2007-2016) and President (2013-2016) of FMR LLC, President and a Director of Fidelity Management & Research Company (2001-2005), a Trustee of other investment companies advised by Fidelity Management & Research Company, Fidelity Investments Money Management, Inc. (investment adviser firm), and FMR Co., Inc. (2001-2005), Senior Vice President of the Fidelity® funds (2001-2005), and managed a number of Fidelity® funds. Ms. Abigail P. Johnson and Mr. Arthur E. Johnson are not related.
Jennifer Toolin McAuliffe (1959)
Year of Election or Appointment: 2016
Trustee
Ms. McAuliffe also serves as Trustee of other Fidelity® funds. Previously, Ms. McAuliffe served as Co-Head of Fixed Income of Fidelity Investments Limited (now known as FIL Limited (FIL)) (diversified financial services company), Director of Research for FIL’s credit and quantitative teams in London, Hong Kong and Tokyo and Director of Research for taxable and municipal bonds at Fidelity Investments Money Management, Inc. Ms. McAuliffe previously served as a member of the Advisory Board of certain Fidelity® funds (2016). Ms. McAuliffe was previously a lawyer at Ropes & Gray LLP and currently serves as director or trustee of several not-for-profit entities.
* Determined to be an “Interested Trustee” by virtue of, among other things, his or her affiliation with the trust or various entities under common control with FMR.
+ The information includes the Trustee's principal occupation during the last five years and other information relating to the experience, attributes, and skills relevant to the Trustee's qualifications to serve as a Trustee, which led to the conclusion that the Trustee should serve as a Trustee for the fund.
Independent Trustees:
Correspondence intended for an Independent Trustee may be sent to Fidelity Investments, P.O. Box 55235, Boston, Massachusetts 02205-5235.
Name, Year of Birth; Principal Occupations and Other Relevant Experience+
Elizabeth S. Acton (1951)
Year of Election or Appointment: 2013
Trustee
Ms. Acton also serves as Trustee of other Fidelity® funds. Prior to her retirement, Ms. Acton served as Executive Vice President, Finance (2011-2012), Executive Vice President, Chief Financial Officer (2002-2011) and Treasurer (2004-2005) of Comerica Incorporated (financial services). Prior to joining Comerica, Ms. Acton held a variety of positions at Ford Motor Company (1983-2002), including Vice President and Treasurer (2000-2002) and Executive Vice President and Chief Financial Officer of Ford Motor Credit Company (1998-2000). Ms. Acton currently serves as a member of the Board and Audit and Finance Committees of Beazer Homes USA, Inc. (homebuilding, 2012-present). Ms. Acton previously served as a member of the Advisory Board of certain Fidelity® funds (2013-2016).
Ann E. Dunwoody (1953)
Year of Election or Appointment: 2018
Trustee
General Dunwoody also serves as Trustee of other Fidelity® funds. General Dunwoody (United States Army, Retired) was the first woman in U.S. military history to achieve the rank of four-star general and prior to her retirement in 2012 held a variety of positions within the U.S. Army, including Commanding General, U.S. Army Material Command (2008-2012). General Dunwoody currently serves as President of First to Four LLC (leadership and mentoring services, 2012-present), a member of the Board and Nomination and Corporate Governance Committees of Kforce Inc. (professional staffing services, 2016-present) and a member of the Board of Automattic Inc. (software engineering, 2018-present). Previously, General Dunwoody served as a member of the Advisory Board and Nominating and Corporate Governance Committee of L3 Technologies, Inc. (communication, electronic, sensor and aerospace systems, 2013-2019) and a member of the Board and Audit and Sustainability and Corporate Responsibility Committees of Republic Services, Inc. (waste collection, disposal and recycling, 2013-2016). Ms. Dunwoody also serves on several boards for non-profit organizations, including as a member of the Board, Chair of the Nomination and Governance Committee and a member of the Audit Committee of Logistics Management Institute (consulting non-profit, 2012-present), a member of the Council of Trustees for the Association of the United States Army (advocacy non-profit, 2013-present), a member of the Board of Florida Institute of Technology (2015-present) and a member of the Board of ThanksUSA (military family education non-profit, 2014-present). General Dunwoody previously served as a member of the Advisory Board of certain Fidelity® funds (2018).
John Engler (1948)
Year of Election or Appointment: 2014
Trustee
Mr. Engler also serves as Trustee of other Fidelity® funds. Previously, Mr. Engler served as Governor of Michigan (1991-2003), President of the Business Roundtable (2011-2017) and interim President of Michigan State University (2018-2019). Mr. Engler currently serves as a member of the Board of K12 Inc. (technology-based education company, 2012-present). Previously, Mr. Engler served as a member of the Board of Universal Forest Products (manufacturer and distributor of wood and wood-alternative products, 2003-2019) and Trustee of The Munder Funds (2003-2014). Mr. Engler previously served as a member of the Advisory Board of certain Fidelity® funds (2014-2016).
Robert F. Gartland (1951)
Year of Election or Appointment: 2010
Trustee
Mr. Gartland also serves as Trustee of other Fidelity® funds. Prior to his retirement, Mr. Gartland held a variety of positions at Morgan Stanley (financial services, 1979-2007), including Managing Director (1987-2007) and Chase Manhattan Bank (1975-1978). Mr. Gartland previously served as Chairman and an investor in Gartland & Mellina Group Corp. (consulting, 2009-2019), as a member of the Board of National Securities Clearing Corporation (1993-1996) and as Chairman of TradeWeb (2003-2004).
Arthur E. Johnson (1947)
Year of Election or Appointment: 2008
Trustee
Chairman of the Independent Trustees
Mr. Johnson also serves as Trustee of other Fidelity® funds. Prior to his retirement, Mr. Johnson served as Senior Vice President of Corporate Strategic Development of Lockheed Martin Corporation (defense contractor, 1999-2009). Mr. Johnson currently serves as a member of the Board of Booz Allen Hamilton (management consulting, 2011-present). Mr. Johnson previously served as a member of the Board of Eaton Corporation plc (diversified power management, 2009-2019) and a member of the Board of AGL Resources, Inc. (holding company, 2002-2016). Mr. Johnson previously served as Vice Chairman (2015-2018) of the Independent Trustees of certain Fidelity® funds. Mr. Arthur E. Johnson is not related to Ms. Abigail P. Johnson.
Michael E. Kenneally (1954)
Year of Election or Appointment: 2009
Trustee
Vice Chairman of the Independent Trustees
Mr. Kenneally also serves as Trustee of other Fidelity® funds. Prior to his retirement, Mr. Kenneally served as Chairman and Global Chief Executive Officer of Credit Suisse Asset Management and Executive Vice President and Chief Investment Officer of Bank of America Corporation. Earlier roles at Bank of America included Director of Research, Senior Portfolio Manager for various institutional equity accounts and mutual funds and Portfolio Manager for a number of institutional fixed-income clients. Mr. Kenneally began his career as a Research Analyst in 1983 and was awarded the Chartered Financial Analyst (CFA) designation in 1991.
Marie L. Knowles (1946)
Year of Election or Appointment: 2001
Trustee
Ms. Knowles also serves as Trustee of other Fidelity® funds. Prior to her retirement, Ms. Knowles held several positions at Atlantic Richfield Company (diversified energy), including Executive Vice President and Chief Financial Officer (1996-2000), Senior Vice President (1993-1996) and President of ARCO Transportation Company (pipeline and tanker operations, 1993-1996). Ms. Knowles currently serves as a member of the Board of McKesson Corporation (healthcare service, since 2002), a member of the Board of the Santa Catalina Island Company (real estate, 2009-present), a member of the Investment Company Institute Board of Governors and a member of the Governing Council of the Independent Directors Council (2014-present). Ms. Knowles also serves as a member of the Advisory Board for the School of Engineering of the University of Southern California. Ms. Knowles previously served as Chairman (2015-2018) and Vice Chairman (2012-2015) of the Independent Trustees of certain Fidelity® funds.
Mark A. Murray (1954)
Year of Election or Appointment: 2016
Trustee
Mr. Murray also serves as Trustee of other Fidelity® funds. Previously, Mr. Murray served as Co-Chief Executive Officer (2013-2016), President (2006-2013) and Vice Chairman (2013-2020) of Meijer, Inc. Mr. Murray serves as a member of the Board and Nuclear Review and Public Policy and Responsibility Committees of DTE Energy Company (diversified energy company, 2009-present) and a member of the Board and Audit Committee and Chairman of the Nominating and Corporate Governance Committee of Universal Forest Products, Inc. (manufacturer and distributor of wood and wood-alternative products, 2004-2016). Mr. Murray previously served as a member of the Board of Spectrum Health (not-for-profit health system, 2015-2019). Mr. Murray also serves as a member of the Board of many community and professional organizations. Mr. Murray previously served as a member of the Advisory Board of certain Fidelity® funds (2016).
+ The information includes the Trustee's principal occupation during the last five years and other information relating to the experience, attributes, and skills relevant to the Trustee's qualifications to serve as a Trustee, which led to the conclusion that the Trustee should serve as a Trustee for the fund.
Advisory Board Members and Officers:
Correspondence intended for an officer may be sent to Fidelity Investments, 245 Summer Street, Boston, Massachusetts 02210. Officers appear below in alphabetical order.
Name, Year of Birth; Principal Occupation
Elizabeth Paige Baumann (1968)
Year of Election or Appointment: 2017
Anti-Money Laundering (AML) Officer
Ms. Baumann also serves as AML Officer of other funds. She is Chief AML Officer (2012-present) and Senior Vice President (2014-present) of FMR LLC (diversified financial services company) and is an employee of Fidelity Investments. Previously, Ms. Baumann served as AML Officer of certain funds (2017-2019), as AML Officer of the funds (2012-2016), and Vice President (2007-2014) and Deputy Anti-Money Laundering Officer (2007-2012) of FMR LLC.
Craig S. Brown (1977)
Year of Election or Appointment: 2019
Assistant Treasurer
Mr. Brown also serves as Assistant Treasurer of other funds. Mr. Brown is an employee of Fidelity Investments (2013-present).
John J. Burke III (1964)
Year of Election or Appointment: 2018
Chief Financial Officer
Mr. Burke also serves as Chief Financial Officer of other funds. Mr. Burke serves as Head of Investment Operations for Fidelity Fund and Investment Operations (2018-present) and is an employee of Fidelity Investments (1998-present). Previously Mr. Burke served as head of Asset Management Investment Operations (2012-2018).
David J. Carter (1973)
Year of Election or Appointment: 2020
Assistant Secretary
Mr. Carter also serves as Assistant Secretary of other funds. Mr. Carter serves as Vice President, Associate General Counsel (2010-present) and is an employee of Fidelity Investments (2005-present).
Jonathan Davis (1968)
Year of Election or Appointment: 2010
Assistant Treasurer
Mr. Davis also serves as Assistant Treasurer of other funds. Mr. Davis serves as Assistant Treasurer of FMR Capital, Inc. (2017-present) and is an employee of Fidelity Investments. Previously, Mr. Davis served as Vice President and Associate General Counsel of FMR LLC (diversified financial services company, 2003-2010).
Laura M. Del Prato (1964)
Year of Election or Appointment: 2018
President and Treasurer
Ms. Del Prato also serves as an officer of other funds. Ms. Del Prato is an employee of Fidelity Investments (2017-present). Previously, Ms. Del Prato served as President and Treasurer of The North Carolina Capital Management Trust: Cash Portfolio and Term Portfolio (2018-2020). Prior to joining Fidelity Investments, Ms. Del Prato served as a Managing Director and Treasurer of the JPMorgan Mutual Funds (2014-2017). Prior to JPMorgan, Ms. Del Prato served as a partner at Cohen Fund Audit Services (accounting firm, 2012-2013) and KPMG LLP (accounting firm, 2004-2012).
Colm A. Hogan (1973)
Year of Election or Appointment: 2016
Assistant Treasurer
Mr. Hogan also serves as an officer of other funds. Mr. Hogan serves as Assistant Treasurer of FMR Capital, Inc. (2017-present) and is an employee of Fidelity Investments (2005-present). Previously, Mr. Hogan served as Deputy Treasurer of certain Fidelity® funds (2016-2020) and Assistant Treasurer of certain Fidelity® funds (2016-2018).
Cynthia Lo Bessette (1969)
Year of Election or Appointment: 2019
Secretary and Chief Legal Officer (CLO)
Ms. Lo Bessette also serves as an officer of other funds. Ms. Lo Bessette serves as CLO, Secretary, and Senior Vice President of Fidelity Management & Research Company LLC (investment adviser firm, 2019-present); and CLO of Fidelity Management & Research (Hong Kong) Limited, FMR Investment Management (UK) Limited, and Fidelity Management & Research (Japan) Limited (investment adviser firms, 2019-present). She is a Senior Vice President and Deputy General Counsel of FMR LLC (diversified financial services company, 2019-present), and is an employee of Fidelity Investments. Previously, Ms. Lo Bessette served as CLO, Secretary, and Senior Vice President of FMR Co., Inc. (investment adviser firm, 2019); Secretary of Fidelity SelectCo, LLC and Fidelity Investments Money Management, Inc. (investment adviser firms, 2019). Prior to joining Fidelity Investments, Ms. Lo Bessette was Executive Vice President, General Counsel (2016-2019) and Senior Vice President, Deputy General Counsel (2015-2016) of OppenheimerFunds (investment management company) and Deputy Chief Legal Officer (2013-2015) of Jennison Associates LLC (investment adviser firm).
Chris Maher (1972)
Year of Election or Appointment: 2013
Assistant Treasurer
Mr. Maher also serves as an officer of other funds. Mr. Maher serves as Assistant Treasurer of FMR Capital, Inc. (2017-present), and is an employee of Fidelity Investments (2008-present). Previously, Mr. Maher served as Assistant Treasurer of certain funds (2013-2020); Vice President of Asset Management Compliance (2013), Vice President of the Program Management Group of FMR (investment adviser firm, 2010-2013), and Vice President of Valuation Oversight (2008-2010).
Jamie Pagliocco (1964)
Year of Election or Appointment: 2020
Vice President
Mr. Pagliocco also serves as Vice President of other funds. Mr. Pagliocco serves as President of Fixed Income (2020-present), and is an employee of Fidelity Investments (2001-present). Previously, Mr. Pagliocco served as Co-Chief Investment Officer – Bond (2017-2020), Global Head of Bond Trading (2016-2019), and as a portfolio manager.
Kenneth B. Robins (1969)
Year of Election or Appointment: 2020
Chief Compliance Officer
Mr. Robins also serves as an officer of other funds. Mr. Robins serves as Compliance Officer of Fidelity Management & Research Company LLC (investment adviser firm, 2016-present) and is an employee of Fidelity Investments (2004-present). Previously, Mr. Robins served as Compliance Officer of FMR Co., Inc. (investment adviser firm, 2016-2019), as Executive Vice President of Fidelity Investments Money Management, Inc. (investment adviser firm, 2013-2016) and served in other fund officer roles.
Stacie M. Smith (1974)
Year of Election or Appointment: 2013
Assistant Treasurer
Ms. Smith also serves as an officer of other funds. Ms. Smith serves as Assistant Treasurer of FMR Capital, Inc. (2017-present), is an employee of Fidelity Investments (2009-present), and has served in other fund officer roles. Prior to joining Fidelity Investments, Ms. Smith served as Senior Audit Manager of Ernst & Young LLP (accounting firm, 1996-2009). Previously, Ms. Smith served as Assistant Treasurer (2013-2019) and Deputy Treasurer (2013-2016) of certain Fidelity® funds.
Marc L. Spector (1972)
Year of Election or Appointment: 2016
Deputy Treasurer
Mr. Spector also serves as an officer of other funds. Mr. Spector serves as Assistant Treasurer of FMR Capital, Inc. (2017-present) and is an employee of Fidelity Investments (2016-present). Prior to joining Fidelity Investments, Mr. Spector served as Director at the Siegfried Group (accounting firm, 2013-2016), and prior to Siegfried Group as audit senior manager at Deloitte & Touche LLP (accounting firm, 2005-2013).
Jim Wegmann (1979)
Year of Election or Appointment: 2019
Assistant Treasurer
Mr. Wegmann also serves as Assistant Treasurer of other funds. Mr. Wegmann is an employee of Fidelity Investments (2011-present).
Shareholder Expense Example
As a shareholder, you incur two types of costs: (1) transaction costs, which may include sales charges (loads) on purchase payments or redemption proceeds, as applicable and (2) ongoing costs, which generally include management fees, distribution and/or service (12b-1) fees and other Fund expenses. This Example is intended to help you understand your ongoing costs (in dollars) of investing in a fund and to compare these costs with the ongoing costs of investing in other mutual funds.
The Example is based on an investment of $1,000 invested at the beginning of the period and held for the entire period (February 1, 2020 to July 31, 2020).
Actual Expenses
The first line of the accompanying table provides information about actual account values and actual expenses. You may use the information in this line, together with the amount you invested, to estimate the expenses that you paid over the period. Simply divide your account value by $1,000.00 (for example, an $8,600 account value divided by $1,000.00 = 8.6), then multiply the result by the number in the first line for a class/Fund under the heading entitled "Expenses Paid During Period" to estimate the expenses you paid on your account during this period. If any fund is a shareholder of any underlying mutual funds or exchange-traded funds (ETFs) (the Underlying Funds), such fund indirectly bears its proportional share of the expenses of the Underlying Funds in addition to the direct expenses incurred presented in the table. These fees and expenses are not included in the annualized expense ratio used to calculate the expense estimate in the table below.
Hypothetical Example for Comparison Purposes
The second line of the accompanying table provides information about hypothetical account values and hypothetical expenses based on the actual expense ratio and an assumed rate of return of 5% per year before expenses, which is not the actual return. The hypothetical account values and expenses may not be used to estimate the actual ending account balance or expenses you paid for the period. You may use this information to compare the ongoing costs of investing in the Fund and other funds. To do so, compare this 5% hypothetical example with the 5% hypothetical examples that appear in the shareholder reports of the other funds. If any fund is a shareholder of any Underlying Funds, such fund indirectly bears its proportional share of the expenses of the Underlying Funds in addition to the direct expenses as presented in the table. These fees and expenses are not included in the annualized expense ratio used to calculate the expense estimate in the table below.
Please note that the expenses shown in the table are meant to highlight your ongoing costs only and do not reflect any transaction costs. Therefore, the second line of the table is useful in comparing ongoing costs only, and will not help you determine the relative total costs of owning different funds.
| | Annualized Expense Ratio-A | Beginning
Account Value
February 1, 2020 | Ending
Account Value
July 31, 2020 | Expenses Paid
During Period-B
February 1, 2020
to July 31, 2020 |
| Fidelity SAI Real Estate Index Fund | .07% | | | |
| Actual | | $1,000.00 | $804.80 | $.31 |
| Hypothetical-C | | $1,000.00 | $1,024.52 | $.35 |
A Annualized expense ratio reflects expenses net of applicable fee waivers.
B Expenses are equal to the annualized expense ratio, multiplied by the average account value over the period, multiplied by 182/ 366 (to reflect the one-half year period). The fees and expenses of any Underlying Funds are not included in each annualized expense ratio.
C 5% return per year before expenses
Distributions (Unaudited)
A total of 0.05% of the dividends distributed during the fiscal year was derived from interest on U.S. Government securities which is generally exempt from state income tax.
The fund designates 0%, 1%, 0%, and 0% of the dividends distributed in September, December, March, and June, respectively during the fiscal year as qualifying for the dividends–received deduction for corporate shareholders.
The fund designates 1%, 2%, 0%, and 0% of the dividends distributed in September, December, March, and June, respectively during the fiscal year as amounts which may be taken into account as a dividend for the purposes of the maximum rate under section 1(h)(11) of the Internal Revenue Code.
The fund designates 97% and 89% of the dividends distributed in September and December, respectively during the fiscal year as a section 199A dividend.
The fund will notify shareholders in January 2021 of amounts for use in preparing 2020 income tax returns.
Liquidity Risk Management Program
The Securities and Exchange Commission adopted Rule 22e-4 under the Investment Company Act of 1940 (the Liquidity Rule) to promote effective liquidity risk management throughout the open-end investment company industry, thereby reducing the risk that funds will be unable to meet their redemption obligations and mitigating dilution of the interests of fund shareholders.
The Fund has adopted and implemented a liquidity risk management program pursuant to the Liquidity Rule (the Program) effective December 1, 2018. The Program is reasonably designed to assess and manage the Fund’s liquidity risk and to comply with the requirements of the Liquidity Rule. The Fund’s Board of Trustees (the Board) has designated the Fund’s investment adviser as administrator of the Program. The Fidelity advisers have established a Liquidity Risk Management Committee (the LRM Committee) to manage the Program for each of the Fidelity Funds. The LRM Committee monitors the adequacy and effectiveness of implementation of the Program and on a periodic basis assesses each Fund’s liquidity risk based on a variety of factors including (1) the Fund’s investment strategy, (2) portfolio liquidity and cash flow projections during normal and reasonably foreseeable stressed conditions, (3) shareholder redemptions, (4) borrowings and other funding sources and (5) in the case of exchange-traded funds, certain additional factors including the effect of the Fund’s prices and spreads, market participants, and basket compositions on the overall liquidity of the Fund’s portfolio, as applicable.
In accordance with the Program, each of the Fund’s portfolio investments is classified into one of four liquidity categories described below based on a determination of a reasonable expectation for how long it would take to convert the investment to cash (or sell or dispose of the investment) without significantly changing its market value.
- Highly liquid investments – cash or convertible to cash within three business days or less
- Moderately liquid investments – convertible to cash in three to seven calendar days
- Less liquid investments – can be sold or disposed of, but not settled, within seven calendar days
- Illiquid investments – cannot be sold or disposed of within seven calendar days
Liquidity classification determinations take into account a variety of factors including various market, trading and investment-specific considerations, as well as market depth, and generally utilize analysis from a third-party liquidity metrics service.
The Liquidity Rule places a 15% limit on a fund’s illiquid investments and requires funds that do not primarily hold assets that are highly liquid investments to determine and maintain a minimum percentage of the fund’s net assets to be invested in highly liquid investments (highly liquid investment minimum or HLIM). The Program includes provisions reasonably designed to comply with the 15% limit on illiquid investments and for determining, periodically reviewing and complying with the HLIM requirement as applicable.
At a recent meeting of the Fund’s Board of Trustees, the LRM Committee provided a written report to the Board pertaining to the operation, adequacy, and effectiveness of implementation of the Program for the annual period from December 1, 2018 through November 30, 2019. The report concluded that the Program has been implemented and is operating effectively and is reasonably designed to assess and manage the Fund’s liquidity risk.
SV8-ANN-0920
1.9870987.104
Fidelity® SAI U.S. Momentum Index Fund
Offered exclusively to certain clients of the Adviser or its affiliates - not available for sale to the general public. Fidelity SAI is a product name of Fidelity® funds dedicated to certain programs affiliated with Strategic Advisers LLC.
Annual Report
July 31, 2020
See the inside front cover for important information about access to your fund’s shareholder reports.
Beginning on January 1, 2021, as permitted by regulations adopted by the Securities and Exchange Commission, paper copies of a fund’s shareholder reports will no longer be sent by mail, unless you specifically request paper copies of the reports from the fund or from your financial intermediary, such as a financial advisor, broker-dealer or bank. Instead, the reports will be made available on a website, and you will be notified by mail each time a report is posted and provided with a website link to access the report.
If you already elected to receive shareholder reports electronically, you will not be affected by this change and you need not take any action. You may elect to receive shareholder reports and other communications from a fund electronically, by contacting your financial intermediary. For Fidelity customers, visit Fidelity's web site or call Fidelity using the contact information listed below.
You may elect to receive all future reports in paper free of charge. If you wish to continue receiving paper copies of your shareholder reports, you may contact your financial intermediary or, if you are a Fidelity customer, visit Fidelity’s website, or call Fidelity at the applicable toll-free number listed below. Your election to receive reports in paper will apply to all funds held with the fund complex/your financial intermediary.
| Account Type | Website | Phone Number |
| Brokerage, Mutual Fund, or Annuity Contracts: | fidelity.com/mailpreferences | 1-800-343-3548 |
| Employer Provided Retirement Accounts: | netbenefits.fidelity.com/preferences (choose 'no' under Required Disclosures to continue to print) | 1-800-343-0860 |
| Advisor Sold Accounts Serviced Through Your Financial Intermediary: | Contact Your Financial Intermediary | Your Financial Intermediary's phone number |
| Advisor Sold Accounts Serviced by Fidelity: | institutional.fidelity.com | 1-877-208-0098 |
Contents
To view a fund's proxy voting guidelines and proxy voting record for the 12-month period ended June 30, visit http://www.fidelity.com/proxyvotingresults or visit the Securities and Exchange Commission's (SEC) web site at http://www.sec.gov.
You may also call 1-800-544-3455 to request a free copy of the proxy voting guidelines.
The funds or securities referred to herein are not sponsored, endorsed, or promoted by MSCI, and MSCI bears no liability with respect to any such funds or securities or any index on which such funds or securities are based. The prospectus contains a more detailed description of the limited relationship MSCI has with Fidelity and any related funds.
Standard & Poor's, S&P and S&P 500 are registered service marks of The McGraw-Hill Companies, Inc. and have been licensed for use by Fidelity Distributors Corporation.
Other third-party marks appearing herein are the property of their respective owners.
All other marks appearing herein are registered or unregistered trademarks or service marks of FMR LLC or an affiliated company. © 2020 FMR LLC. All rights reserved.
This report and the financial statements contained herein are submitted for the general information of the shareholders of the Fund. This report is not authorized for distribution to prospective investors in the Fund unless preceded or accompanied by an effective prospectus.
A fund files its complete schedule of portfolio holdings with the SEC for the first and third quarters of each fiscal year on Form N-PORT. Forms N-PORT are available on the SEC’s web site at http://www.sec.gov. A fund's Forms N-PORT may be reviewed and copied at the SEC’s Public Reference Room in Washington, DC. Information regarding the operation of the SEC's Public Reference Room may be obtained by calling 1-800-SEC-0330.
For a complete list of a fund's portfolio holdings, view the most recent holdings listing, semiannual report, or annual report on Fidelity's web site at http://www.fidelity.com, http://www.institutional.fidelity.com, or http://www.401k.com, as applicable.
NOT FDIC INSURED •MAY LOSE VALUE •NO BANK GUARANTEE
Neither the Fund nor Fidelity Distributors Corporation is a bank.
Note to Shareholders:
Early in 2020, the outbreak and spread of a new coronavirus emerged as a public health emergency that had a major influence on financial markets, primarily based on its impact on the global economy and the outlook for corporate earnings. The virus causes a respiratory disease known as COVID-19. On March 11, the World Health Organization declared the COVID-19 outbreak a pandemic, citing sustained risk of further global spread.
In the weeks following, as the crisis worsened, we witnessed an escalating human tragedy with wide-scale social and economic consequences from coronavirus-containment measures. The outbreak of COVID-19 prompted a number of measures to limit the spread, including travel and border restrictions, quarantines, and restrictions on large gatherings. In turn, these resulted in lower consumer activity, diminished demand for a wide range of products and services, disruption in manufacturing and supply chains, and – given the wide variability in outcomes regarding the outbreak – significant market uncertainty and volatility. Amid the turmoil, the U.S. government took unprecedented action – in concert with the U.S. Federal Reserve and central banks around the world – to help support consumers, businesses, and the broader economy, and to limit disruption to the financial system.
The situation continues to unfold, and the extent and duration of its impact on financial markets and the economy remain highly uncertain. Extreme events such as the coronavirus crisis are “exogenous shocks” that can have significant adverse effects on mutual funds and their investments. Although multiple asset classes may be affected by market disruption, the duration and impact may not be the same for all types of assets.
Fidelity is committed to helping you stay informed amid news about COVID-19 and during increased market volatility, and we’re taking extra steps to be responsive to customer needs. We encourage you to visit our websites, where we offer ongoing updates, commentary, and analysis on the markets and our funds.
Performance: The Bottom Line
Average annual total return reflects the change in the value of an investment, assuming reinvestment of distributions from dividend income and capital gains (the profits earned upon the sale of securities that have grown in value, if any) and assuming a constant rate of performance each year. The hypothetical investment and the average annual total returns do not reflect the deduction of taxes that a shareholder would pay on fund distributions or the redemption of fund shares. During periods of reimbursement by Fidelity, a fund’s total return will be greater than it would be had the reimbursement not occurred. How a fund did yesterday is no guarantee of how it will do tomorrow.
Average Annual Total Returns
| For the periods ended July 31, 2020 | Past 1 year | Life of fundA |
| Fidelity® SAI U.S. Momentum Index Fund | 16.76% | 16.05% |
A From February 9, 2017
$10,000 Over Life of Fund
Let's say hypothetically that $10,000 was invested in Fidelity® SAI U.S. Momentum Index Fund on February 9, 2017, when the fund started.
The chart shows how the value of your investment would have changed, and also shows how the MSCI USA Custom Momentum Composite Index performed over the same period.
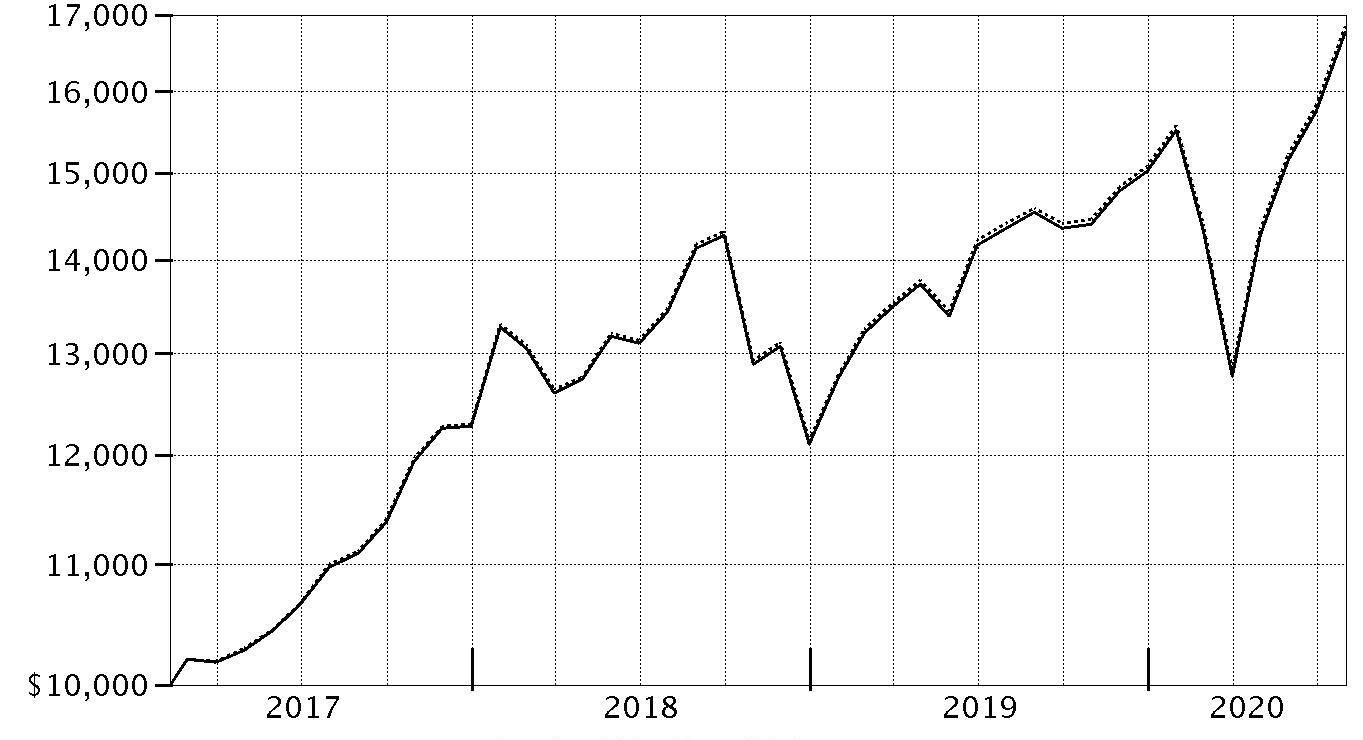
| Period Ending Values |
| $16,770 | Fidelity® SAI U.S. Momentum Index Fund |
| $16,851 | MSCI USA Custom Momentum Composite Index |
Management's Discussion of Fund Performance
Market Recap: The S&P 500
® index gained 11.96% for the 12 months ending July 31, 2020, in what was a bumpy ride for U.S. equity investors, marked by a steep but brief decline due to the early-2020 outbreak and spread of the coronavirus, followed by a historic rebound. Declared a pandemic on March 11, the COVID-19 crisis and containment efforts caused broad contraction in economic activity, along with extreme uncertainty, volatility and dislocation in financial markets. By mid-March, U.S. stocks entered bear-market territory less than a month after hitting an all-time high and extending the longest-running bull market in American history. Stocks slid in late February, after a surge in COVID-19 cases outside China. The sudden downtrend continued in March (-12%), capping the index’s worst quarter since 2008. A historically rapid and expansive U.S. monetary/fiscal-policy response provided a partial offset to the economic disruption and fueled a sharp uptrend. Aggressive support for financial markets by the U.S. Federal Reserve, plans for reopening the economy and improving infection data boosted stocks in April (+13%) and May (+5%). In June and July, the index gained amid progress on potential treatments and signs of an early recovery in economic activity. For the full 12 months, growth stocks widely topped value, while large-caps handily bested smaller-caps. The information technology sector (+39%) led the way, followed by consumer discretionary (+22%). In contrast, energy (-38%) fell hard along with the price of crude oil.
Comments from the Geode Capital Management, LLC, passive equity index team: For the fiscal year ending July 31, 2020, the fund gained 16.76%, roughly in line with the 16.89% advance of the benchmark MSCI USA Custom Momentum Composite Index. By sector, information technology advanced 30% and contributed most. Consumer discretionary stocks also helped (+33%), benefiting from the automobiles & components industry (+93%). The health care sector rose 8%. Other notable contributors included the communication services (+3%), driven by the media & entertainment industry (-1%), and utilities (+24%) sectors. Conversely, stocks in the industrials sector gained 1% and detracted most. Consumer staples (+7%) and financials (+13%) also hurt. Other notable detractors included the materials (+17%), real estate (+15%), and energy (+34%) sectors. Turning to individual stocks, the top contributor was Tesla (+125%), from the automobiles & components category. In technology hardware & equipment, Apple (+45%) was helpful and Nvidia (+81%) from the semiconductors & semiconductor equipment group also contributed. Microsoft, within the software & services segment, rose 51% and Amazon.com, within the retailing industry, gained approximately 27% and boosted the fund. Conversely, the biggest individual detractor was Starbucks (-31%), from the consumer services category, followed by Disney (-33%), which is in the media & entertainment group. Within technology hardware & equipment, Cisco Systems returned roughly -27% and hurt. Other detractors were Visa (+13%), a stock in the software & services industry, and Procter & Gamble (-6%), from the household & personal products segment.
The views expressed above reflect those of the portfolio manager(s) only through the end of the period as stated on the cover of this report and do not necessarily represent the views of Fidelity or any other person in the Fidelity organization. Any such views are subject to change at any time based upon market or other conditions and Fidelity disclaims any responsibility to update such views. These views may not be relied on as investment advice and, because investment decisions for a Fidelity fund are based on numerous factors, may not be relied on as an indication of trading intent on behalf of any Fidelity fund.
Investment Summary (Unaudited)
Top Five Stocks as of July 31, 2020
| | % of fund's net assets |
| Apple, Inc. | 5.5 |
| Amazon.com, Inc. | 5.0 |
| Microsoft Corp. | 4.9 |
| NVIDIA Corp. | 4.6 |
| Tesla, Inc. | 4.1 |
| | 24.1 |
Top Five Market Sectors as of July 31, 2020
| | % of fund's net assets |
| Information Technology | 35.5 |
| Health Care | 25.8 |
| Consumer Discretionary | 11.3 |
| Communication Services | 11.0 |
| Real Estate | 4.0 |
Asset Allocation (% of fund's net assets)
| As of July 31, 2020* |
| | Stocks and Equity Futures | 100.0% |

* Foreign investments - 0.5%
Schedule of Investments July 31, 2020
Showing Percentage of Net Assets
| Common Stocks - 99.7% | | | |
| | | Shares | Value |
| COMMUNICATION SERVICES - 11.0% | | | |
| Entertainment - 4.3% | | | |
| Activision Blizzard, Inc. | | 184,982 | $15,285,063 |
| Electronic Arts, Inc. (a) | | 55,876 | 7,913,159 |
| Netflix, Inc. (a) | | 107,188 | 52,402,069 |
| Roku, Inc. Class A (a) | | 6,521 | 1,010,038 |
| Take-Two Interactive Software, Inc. (a) | | 6,390 | 1,048,088 |
| | | | 77,658,417 |
| Interactive Media & Services - 4.9% | | | |
| Alphabet, Inc.: | | | |
| Class A (a) | | 28,399 | 42,256,292 |
| Class C (a) | | 29,347 | 43,520,427 |
| InterActiveCorp (a) | | 2,862 | 378,986 |
| Match Group, Inc. (a) | | 2,927 | 300,603 |
| Snap, Inc. Class A (a) | | 31,222 | 699,997 |
| Zillow Group, Inc. Class C (a)(b) | | 25,337 | 1,732,797 |
| | | | 88,889,102 |
| Media - 1.2% | | | |
| Cable One, Inc. | | 712 | 1,297,663 |
| Charter Communications, Inc. Class A (a) | | 28,832 | 16,722,560 |
| Liberty Broadband Corp. Class C (a) | | 19,328 | 2,653,155 |
| | | | 20,673,378 |
| Wireless Telecommunication Services - 0.6% | | | |
| T-Mobile U.S., Inc. | | 99,542 | 10,688,820 |
|
| TOTAL COMMUNICATION SERVICES | | | 197,909,717 |
|
| CONSUMER DISCRETIONARY - 11.3% | | | |
| Automobiles - 4.1% | | | |
| Tesla, Inc. (a) | | 51,370 | 73,498,141 |
| Hotels, Restaurants & Leisure - 0.2% | | | |
| Domino's Pizza, Inc. | | 10,290 | 3,978,217 |
| Internet & Direct Marketing Retail - 5.6% | | | |
| Amazon.com, Inc. (a) | | 28,653 | 90,677,576 |
| eBay, Inc. | | 60,383 | 3,337,972 |
| MercadoLibre, Inc. (a) | | 5,505 | 6,191,033 |
| Wayfair LLC Class A (a) | | 2,523 | 671,345 |
| | | | 100,877,926 |
| Multiline Retail - 0.7% | | | |
| Dollar General Corp. | | 45,860 | 8,731,744 |
| Target Corp. | | 27,167 | 3,419,782 |
| | | | 12,151,526 |
| Specialty Retail - 0.2% | | | |
| Best Buy Co., Inc. | | 4,273 | 425,548 |
| Tiffany & Co., Inc. | | 25,072 | 3,143,026 |
| Tractor Supply Co. | | 4,580 | 653,749 |
| | | | 4,222,323 |
| Textiles, Apparel & Luxury Goods - 0.5% | | | |
| lululemon athletica, Inc. (a) | | 24,208 | 7,881,883 |
|
| TOTAL CONSUMER DISCRETIONARY | | | 202,610,016 |
|
| CONSUMER STAPLES - 3.5% | | | |
| Beverages - 0.2% | | | |
| Brown-Forman Corp. Class B (non-vtg.) | | 13,852 | 960,498 |
| Monster Beverage Corp. (a) | | 41,366 | 3,246,404 |
| | | | 4,206,902 |
| Food & Staples Retailing - 2.0% | | | |
| Costco Wholesale Corp. | | 76,383 | 24,864,958 |
| Kroger Co. | | 179,880 | 6,258,025 |
| Walmart, Inc. | | 43,514 | 5,630,712 |
| | | | 36,753,695 |
| Food Products - 0.5% | | | |
| Campbell Soup Co. | | 30,135 | 1,493,792 |
| Conagra Brands, Inc. | | 25,849 | 968,045 |
| General Mills, Inc. | | 41,126 | 2,602,042 |
| Hormel Foods Corp. | | 59,514 | 3,026,882 |
| The J.M. Smucker Co. | | 6,850 | 749,048 |
| | | | 8,839,809 |
| Household Products - 0.5% | | | |
| Clorox Co. | | 35,522 | 8,401,308 |
| Tobacco - 0.3% | | | |
| Philip Morris International, Inc. | | 70,626 | 5,424,783 |
|
| TOTAL CONSUMER STAPLES | | | 63,626,497 |
|
| ENERGY - 0.0% | | | |
| Oil, Gas & Consumable Fuels - 0.0% | | | |
| Cabot Oil & Gas Corp. | | 22,595 | 422,527 |
| FINANCIALS - 3.5% | | | |
| Capital Markets - 3.3% | | | |
| BlackRock, Inc. Class A | | 21,026 | 12,090,160 |
| FactSet Research Systems, Inc. | | 6,924 | 2,397,781 |
| KKR & Co. LP | | 10,274 | 363,391 |
| MarketAxess Holdings, Inc. | | 8,849 | 4,572,278 |
| Moody's Corp. | | 33,393 | 9,393,451 |
| MSCI, Inc. | | 26,289 | 9,884,138 |
| S&P Global, Inc. | | 52,154 | 18,266,939 |
| State Street Corp. | | 16,001 | 1,020,704 |
| The NASDAQ OMX Group, Inc. | | 6,381 | 837,889 |
| Tradeweb Markets, Inc. Class A | | 6,522 | 352,645 |
| | | | 59,179,376 |
| Insurance - 0.2% | | | |
| Arthur J. Gallagher & Co. | | 19,603 | 2,107,126 |
| Brown & Brown, Inc. | | 41,187 | 1,872,773 |
| | | | 3,979,899 |
|
| TOTAL FINANCIALS | | | 63,159,275 |
|
| HEALTH CARE - 25.8% | | | |
| Biotechnology - 8.3% | | | |
| AbbVie, Inc. | | 284,636 | 27,014,803 |
| Alnylam Pharmaceuticals, Inc. (a) | | 25,779 | 3,757,547 |
| Amgen, Inc. | | 112,433 | 27,508,982 |
| Biogen, Inc. (a) | | 33,486 | 9,198,269 |
| BioMarin Pharmaceutical, Inc. (a) | | 42,321 | 5,070,479 |
| Gilead Sciences, Inc. | | 288,656 | 20,070,252 |
| Incyte Corp. (a) | | 25,659 | 2,534,083 |
| Moderna, Inc. (a)(b) | | 54,222 | 4,017,850 |
| Neurocrine Biosciences, Inc. (a) | | 10,184 | 1,225,746 |
| Regeneron Pharmaceuticals, Inc. (a) | | 31,747 | 20,066,326 |
| Sarepta Therapeutics, Inc. (a) | | 14,041 | 2,155,574 |
| Seattle Genetics, Inc. (a)(b) | | 36,990 | 6,150,327 |
| Vertex Pharmaceuticals, Inc. (a) | | 77,033 | 20,952,976 |
| | | | 149,723,214 |
| Health Care Equipment & Supplies - 2.8% | | | |
| Align Technology, Inc. (a) | | 3,374 | 991,349 |
| Baxter International, Inc. | | 18,828 | 1,626,363 |
| Danaher Corp. | | 75,340 | 15,354,292 |
| DexCom, Inc. (a) | | 32,967 | 14,358,447 |
| Insulet Corp. (a) | | 14,229 | 2,893,609 |
| Masimo Corp. (a) | | 8,728 | 1,921,207 |
| ResMed, Inc. | | 31,388 | 6,356,384 |
| STERIS PLC | | 6,736 | 1,075,268 |
| West Pharmaceutical Services, Inc. | | 21,238 | 5,710,261 |
| | | | 50,287,180 |
| Health Care Providers & Services - 5.6% | | | |
| AmerisourceBergen Corp. | | 28,259 | 2,831,269 |
| Cardinal Health, Inc. | | 31,409 | 1,715,560 |
| Centene Corp. (a) | | 133,749 | 8,727,122 |
| Cigna Corp. | | 63,168 | 10,908,482 |
| CVS Health Corp. | | 34,237 | 2,154,877 |
| DaVita HealthCare Partners, Inc. (a) | | 23,263 | 2,032,954 |
| Humana, Inc. | | 30,702 | 12,049,000 |
| McKesson Corp. | | 26,704 | 4,009,873 |
| Molina Healthcare, Inc. (a) | | 2,166 | 400,060 |
| UnitedHealth Group, Inc. | | 183,186 | 55,465,057 |
| | | | 100,294,254 |
| Health Care Technology - 0.7% | | | |
| Cerner Corp. | | 8,094 | 562,128 |
| Teladoc Health, Inc. (a) | | 14,020 | 3,331,573 |
| Veeva Systems, Inc. Class A (a) | | 29,641 | 7,842,119 |
| | | | 11,735,820 |
| Life Sciences Tools & Services - 1.6% | | | |
| Agilent Technologies, Inc. | | 5,636 | 542,916 |
| Avantor, Inc. (a) | | 15,214 | 335,925 |
| Bio-Rad Laboratories, Inc. Class A (a) | | 5,288 | 2,775,618 |
| Mettler-Toledo International, Inc. (a) | | 1,186 | 1,108,910 |
| Thermo Fisher Scientific, Inc. | | 59,634 | 24,685,494 |
| | | | 29,448,863 |
| Pharmaceuticals - 6.8% | | | |
| Bristol-Myers Squibb Co. | | 461,448 | 27,068,540 |
| Catalent, Inc. (a) | | 20,107 | 1,756,145 |
| Eli Lilly & Co. | | 240,275 | 36,110,930 |
| Johnson & Johnson | | 307,780 | 44,862,013 |
| Zoetis, Inc. Class A | | 79,771 | 12,099,665 |
| | | | 121,897,293 |
|
| TOTAL HEALTH CARE | | | 463,386,624 |
|
| INDUSTRIALS - 2.3% | | | |
| Aerospace & Defense - 0.1% | | | |
| Teledyne Technologies, Inc. (a) | | 5,117 | 1,569,384 |
| Building Products - 0.0% | | | |
| Allegion PLC | | 1,986 | 197,528 |
| Trane Technologies PLC | | 4,640 | 519,077 |
| | | | 716,605 |
| Commercial Services & Supplies - 0.1% | | | |
| Copart, Inc. (a) | | 9,262 | 863,682 |
| Rollins, Inc. | | 26,541 | 1,390,748 |
| | | | 2,254,430 |
| Electrical Equipment - 0.3% | | | |
| Eaton Corp. PLC | | 28,477 | 2,652,063 |
| Rockwell Automation, Inc. | | 14,446 | 3,151,250 |
| | | | 5,803,313 |
| Industrial Conglomerates - 0.2% | | | |
| General Electric Co. | | 555,331 | 3,370,859 |
| Machinery - 0.4% | | | |
| Gardner Denver Holdings, Inc. (a) | | 20,463 | 646,426 |
| Illinois Tool Works, Inc. | | 34,175 | 6,322,033 |
| Nordson Corp. | | 1,696 | 328,396 |
| | | | 7,296,855 |
| Professional Services - 0.6% | | | |
| CoStar Group, Inc. (a)(b) | | 7,005 | 5,952,569 |
| IHS Markit Ltd. | | 50,872 | 4,106,897 |
| Verisk Analytics, Inc. | | 4,737 | 893,919 |
| | | | 10,953,385 |
| Road & Rail - 0.4% | | | |
| Kansas City Southern | | 12,304 | 2,114,442 |
| Old Dominion Freight Lines, Inc. | | 26,010 | 4,755,148 |
| | | | 6,869,590 |
| Trading Companies & Distributors - 0.2% | | | |
| Fastenal Co. | | 64,660 | 3,041,606 |
| United Rentals, Inc. (a) | | 2,979 | 462,847 |
| | | | 3,504,453 |
|
| TOTAL INDUSTRIALS | | | 42,338,874 |
|
| INFORMATION TECHNOLOGY - 35.5% | | | |
| Electronic Equipment & Components - 0.0% | | | |
| Zebra Technologies Corp. Class A (a) | | 1,419 | 398,384 |
| IT Services - 4.7% | | | |
| Akamai Technologies, Inc. (a) | | 32,226 | 3,623,491 |
| Black Knight, Inc. (a) | | 17,964 | 1,345,863 |
| Booz Allen Hamilton Holding Corp. Class A | | 7,788 | 636,747 |
| EPAM Systems, Inc. (a) | | 10,532 | 3,055,123 |
| Fidelity National Information Services, Inc. | | 39,860 | 5,831,917 |
| Fiserv, Inc. (a) | | 36,795 | 3,671,773 |
| Global Payments, Inc. | | 27,640 | 4,920,473 |
| GoDaddy, Inc. (a) | | 3,551 | 249,564 |
| Jack Henry & Associates, Inc. | | 16,458 | 2,934,461 |
| Leidos Holdings, Inc. | | 23,382 | 2,225,031 |
| MasterCard, Inc. Class A | | 38,168 | 11,775,973 |
| MongoDB, Inc. Class A (a)(b) | | 11,081 | 2,538,435 |
| Okta, Inc. (a) | | 29,932 | 6,614,373 |
| PayPal Holdings, Inc. (a) | | 106,518 | 20,884,984 |
| Square, Inc. (a) | | 34,993 | 4,543,841 |
| Twilio, Inc. Class A (a) | | 9,787 | 2,715,110 |
| Visa, Inc. Class A | | 38,013 | 7,237,675 |
| | | | 84,804,834 |
| Semiconductors & Semiconductor Equipment - 10.4% | | | |
| Advanced Micro Devices, Inc. (a) | | 301,452 | 23,341,428 |
| Applied Materials, Inc. | | 113,944 | 7,330,018 |
| Intel Corp. | | 756,124 | 36,089,799 |
| KLA-Tencor Corp. | | 15,057 | 3,008,840 |
| Lam Research Corp. | | 26,148 | 9,861,980 |
| Marvell Technology Group Ltd. | | 42,695 | 1,557,087 |
| Micron Technology, Inc. (a) | | 168,296 | 8,424,056 |
| NVIDIA Corp. | | 194,704 | 82,669,371 |
| Qorvo, Inc. (a) | | 22,848 | 2,927,971 |
| Qualcomm, Inc. | | 30,414 | 3,212,023 |
| Skyworks Solutions, Inc. | | 36,226 | 5,273,781 |
| Teradyne, Inc. | | 29,875 | 2,657,680 |
| | | | 186,354,034 |
| Software - 14.8% | | | |
| Adobe, Inc. (a) | | 124,443 | 55,292,514 |
| ANSYS, Inc. (a) | | 18,599 | 5,776,849 |
| Autodesk, Inc. (a) | | 41,804 | 9,883,720 |
| Avalara, Inc. (a) | | 11,164 | 1,501,000 |
| Cadence Design Systems, Inc. (a) | | 57,260 | 6,255,655 |
| Citrix Systems, Inc. | | 40,143 | 5,730,815 |
| Coupa Software, Inc. (a) | | 9,857 | 3,020,678 |
| Crowdstrike Holdings, Inc. (a) | | 16,612 | 1,880,478 |
| Datadog, Inc. Class A (a) | | 19,087 | 1,791,506 |
| DocuSign, Inc. (a) | | 51,990 | 11,272,992 |
| Dynatrace, Inc. | | 23,435 | 980,286 |
| Fair Isaac Corp. (a) | | 993 | 436,116 |
| Fortinet, Inc. (a) | | 39,850 | 5,511,255 |
| Microsoft Corp. | | 430,761 | 88,310,313 |
| Nortonlifelock, Inc. | | 172,006 | 3,689,529 |
| Parametric Technology Corp. (a) | | 2,480 | 212,189 |
| Paycom Software, Inc. (a) | | 8,306 | 2,361,977 |
| RingCentral, Inc. (a) | | 24,689 | 7,166,476 |
| Salesforce.com, Inc. (a) | | 66,577 | 12,972,528 |
| ServiceNow, Inc. (a) | | 45,393 | 19,936,606 |
| Slack Technologies, Inc. Class A (a)(b) | | 27,191 | 803,494 |
| Splunk, Inc. (a) | | 29,068 | 6,099,048 |
| Synopsys, Inc. (a) | | 27,448 | 5,468,191 |
| The Trade Desk, Inc. (a) | | 1,526 | 688,714 |
| Tyler Technologies, Inc. (a) | | 11,494 | 4,106,232 |
| Zoom Video Communications, Inc. Class A (a) | | 21,585 | 5,480,647 |
| | | | 266,629,808 |
| Technology Hardware, Storage & Peripherals - 5.6% | | | |
| Apple, Inc. | | 231,756 | 98,505,570 |
| HP, Inc. | | 64,820 | 1,139,536 |
| | | | 99,645,106 |
|
| TOTAL INFORMATION TECHNOLOGY | | | 637,832,166 |
|
| MATERIALS - 0.9% | | | |
| Chemicals - 0.0% | | | |
| FMC Corp. | | 2,836 | 300,758 |
| Containers & Packaging - 0.0% | | | |
| Crown Holdings, Inc. (a) | | 8,750 | 626,325 |
| Metals & Mining - 0.9% | | | |
| Newmont Corp. | | 233,850 | 16,182,420 |
|
| TOTAL MATERIALS | | | 17,109,503 |
|
| REAL ESTATE - 4.0% | | | |
| Equity Real Estate Investment Trusts (REITs) - 4.0% | | | |
| American Tower Corp. | | 80,087 | 20,933,941 |
| Crown Castle International Corp. | | 85,089 | 14,184,336 |
| Digital Realty Trust, Inc. | | 54,060 | 8,678,792 |
| Equinix, Inc. | | 20,388 | 16,014,366 |
| Medical Properties Trust, Inc. | | 31,553 | 635,162 |
| Prologis (REIT), Inc. | | 19,970 | 2,105,237 |
| SBA Communications Corp. Class A | | 27,016 | 8,416,565 |
| Sun Communities, Inc. | | 1,862 | 279,170 |
| | | | 71,247,569 |
| UTILITIES - 1.9% | | | |
| Electric Utilities - 1.6% | | | |
| Eversource Energy | | 35,657 | 3,211,626 |
| NextEra Energy, Inc. | | 87,774 | 24,638,162 |
| Southern Co. | | 22,736 | 1,241,613 |
| | | | 29,091,401 |
| Multi-Utilities - 0.2% | | | |
| Ameren Corp. | | 9,937 | 797,345 |
| WEC Energy Group, Inc. | | 15,432 | 1,470,052 |
| | | | 2,267,397 |
| Water Utilities - 0.1% | | | |
| American Water Works Co., Inc. | | 13,448 | 1,980,487 |
| Essential Utilities, Inc. | | 5,534 | 250,967 |
| | | | 2,231,454 |
|
| TOTAL UTILITIES | | | 33,590,252 |
|
| TOTAL COMMON STOCKS | | | |
| (Cost $1,365,389,013) | | | 1,793,233,020 |
|
| Money Market Funds - 1.9% | | | |
| Fidelity Cash Central Fund 0.14% (c) | | 28,546,721 | 28,555,285 |
| Fidelity Securities Lending Cash Central Fund 0.13% (c)(d) | | 5,731,705 | 5,732,278 |
| TOTAL MONEY MARKET FUNDS | | | |
| (Cost $34,287,491) | | | 34,287,563 |
| TOTAL INVESTMENT IN SECURITIES - 101.6% | | | |
| (Cost $1,399,676,504) | | | 1,827,520,583 |
| NET OTHER ASSETS (LIABILITIES) - (1.6)% | | | (29,133,456) |
| NET ASSETS - 100% | | | $1,798,387,127 |
| Futures Contracts | | | | | |
| | Number of contracts | Expiration Date | Notional Amount | Value | Unrealized Appreciation/(Depreciation) |
| Purchased | | | | | |
| Equity Index Contracts | | | | | |
| CME E-mini S&P 500 Index Contracts (United States) | 33 | Sept. 2020 | $5,384,775 | $128,171 | $128,171 |
The notional amount of futures purchased as a percentage of Net Assets is 0.3%
Legend
(a) Non-income producing
(b) Security or a portion of the security is on loan at period end.
(c) Affiliated fund that is generally available only to investment companies and other accounts managed by Fidelity Investments. The rate quoted is the annualized seven-day yield of the fund at period end. A complete unaudited listing of the fund's holdings as of its most recent quarter end is available upon request. In addition, each Fidelity Central Fund's financial statements, which are not covered by the Fund's Report of Independent Registered Public Accounting Firm, are available on the SEC's website or upon request.
(d) Investment made with cash collateral received from securities on loan.
Affiliated Central Funds
Information regarding fiscal year to date income earned by the Fund from investments in Fidelity Central Funds is as follows:
| Fund | Income earned |
| Fidelity Cash Central Fund | $70,505 |
| Fidelity Securities Lending Cash Central Fund | 306,184 |
| Total | $376,689 |
Amounts in the income column in the above table include any capital gain distributions from underlying funds, which are presented in the corresponding line-item in the Statement of Operations, if applicable. Amount for Fidelity Securities Lending Cash Central Fund represents the income earned on investing cash collateral, less rebates paid to borrowers and any lending agent fees associated with the loan, plus any premium payments received for lending certain types of securities.
Investment Valuation
The following is a summary of the inputs used, as of July 31, 2020, involving the Fund's assets and liabilities carried at fair value. The inputs or methodology used for valuing securities may not be an indication of the risk associated with investing in those securities. For more information on valuation inputs, and their aggregation into the levels used below, please refer to the Investment Valuation section in the accompanying Notes to Financial Statements.
| | Valuation Inputs at Reporting Date: |
| Description | Total | Level 1 | Level 2 | Level 3 |
| Investments in Securities: | | | | |
| Equities: | | | | |
| Communication Services | $197,909,717 | $197,909,717 | $-- | $-- |
| Consumer Discretionary | 202,610,016 | 202,610,016 | -- | -- |
| Consumer Staples | 63,626,497 | 63,626,497 | -- | -- |
| Energy | 422,527 | 422,527 | -- | -- |
| Financials | 63,159,275 | 63,159,275 | -- | -- |
| Health Care | 463,386,624 | 463,386,624 | -- | -- |
| Industrials | 42,338,874 | 42,338,874 | -- | -- |
| Information Technology | 637,832,166 | 637,832,166 | -- | -- |
| Materials | 17,109,503 | 17,109,503 | -- | -- |
| Real Estate | 71,247,569 | 71,247,569 | -- | -- |
| Utilities | 33,590,252 | 33,590,252 | -- | -- |
| Money Market Funds | 34,287,563 | 34,287,563 | -- | -- |
| Total Investments in Securities: | $1,827,520,583 | $1,827,520,583 | $-- | $-- |
| Derivative Instruments: | | | | |
| Assets | | | | |
| Futures Contracts | $128,171 | $128,171 | $-- | $-- |
| Total Assets | $128,171 | $128,171 | $-- | $-- |
| Total Derivative Instruments: | $128,171 | $128,171 | $-- | $-- |
Value of Derivative Instruments
The following table is a summary of the Fund's value of derivative instruments by primary risk exposure as of July 31, 2020. For additional information on derivative instruments, please refer to the Derivative Instruments section in the accompanying Notes to Financial Statements.
| Primary Risk Exposure / Derivative Type | Value |
| | Asset | Liability |
| Equity Risk | | |
| Futures Contracts(a) | $128,171 | $0 |
| Total Equity Risk | 128,171 | 0 |
| Total Value of Derivatives | $128,171 | $0 |
(a) Reflects gross cumulative appreciation (depreciation) on futures contracts as presented in the Schedule of Investments. In the Statement of Assets and Liabilities, the period end daily variation margin is included in receivable or payable for daily variation margin on futures contracts, and the net cumulative appreciation (depreciation) is included in Total accumulated earnings (loss).
See accompanying notes which are an integral part of the financial statements.
Financial Statements
Statement of Assets and Liabilities
| | | July 31, 2020 |
| Assets | | |
Investment in securities, at value (including securities loaned of $5,501,404) — See accompanying schedule:
Unaffiliated issuers (cost $1,365,389,013) | $1,793,233,020 | |
| Fidelity Central Funds (cost $34,287,491) | 34,287,563 | |
| Total Investment in Securities (cost $1,399,676,504) | | $1,827,520,583 |
| Segregated cash with brokers for derivative instruments | | 408,000 |
| Receivable for investments sold | | 62,953,453 |
| Receivable for fund shares sold | | 378,062 |
| Dividends receivable | | 708,777 |
| Distributions receivable from Fidelity Central Funds | | 7,608 |
| Receivable for daily variation margin on futures contracts | | 25,011 |
| Total assets | | 1,892,001,494 |
| Liabilities | | |
| Payable for investments purchased | $86,765,252 | |
| Payable for fund shares redeemed | 936,983 | |
| Accrued management fee | 136,855 | |
| Other payables and accrued expenses | 33,383 | |
| Collateral on securities loaned | 5,741,894 | |
| Total liabilities | | 93,614,367 |
| Net Assets | | $1,798,387,127 |
| Net Assets consist of: | | |
| Paid in capital | | $1,221,606,876 |
| Total accumulated earnings (loss) | | 576,780,251 |
| Net Assets | | $1,798,387,127 |
| Net Asset Value, offering price and redemption price per share ($1,798,387,127 ÷ 114,282,746 shares) | | $15.74 |
See accompanying notes which are an integral part of the financial statements.
Statement of Operations
| | | Year ended July 31, 2020 |
| Investment Income | | |
| Dividends | | $41,871,360 |
| Interest | | 7,916 |
| Income from Fidelity Central Funds (including $306,184 from security lending) | | 376,689 |
| Total income | | 42,255,965 |
| Expenses | | |
| Management fee | $2,888,031 | |
| Custodian fees and expenses | 71,173 | |
| Independent trustees' fees and expenses | 11,255 | |
| Registration fees | 40,629 | |
| Audit | 53,899 | |
| Legal | 6,280 | |
| Interest | 59,220 | |
| Miscellaneous | 21,184 | |
| Total expenses before reductions | 3,151,671 | |
| Expense reductions | (268) | |
| Total expenses after reductions | | 3,151,403 |
| Net investment income (loss) | | 39,104,562 |
| Realized and Unrealized Gain (Loss) | | |
| Net realized gain (loss) on: | | |
| Investment securities: | | |
| Unaffiliated issuers | 261,276,579 | |
| Fidelity Central Funds | (8,843) | |
| Futures contracts | (1,910,301) | |
| Total net realized gain (loss) | | 259,357,435 |
| Change in net unrealized appreciation (depreciation) on: | | |
| Investment securities: | | |
| Unaffiliated issuers | (77,698,402) | |
| Fidelity Central Funds | 72 | |
| Futures contracts | 11,863 | |
| Total change in net unrealized appreciation (depreciation) | | (77,686,467) |
| Net gain (loss) | | 181,670,968 |
| Net increase (decrease) in net assets resulting from operations | | $220,775,530 |
See accompanying notes which are an integral part of the financial statements.
Statement of Changes in Net Assets
| | Year ended July 31, 2020 | Year ended July 31, 2019 |
| Increase (Decrease) in Net Assets | | |
| Operations | | |
| Net investment income (loss) | $39,104,562 | $50,829,329 |
| Net realized gain (loss) | 259,357,435 | 2,394,458 |
| Change in net unrealized appreciation (depreciation) | (77,686,467) | 231,016,197 |
| Net increase (decrease) in net assets resulting from operations | 220,775,530 | 284,239,984 |
| Distributions to shareholders | (74,889,307) | (89,188,479) |
| Share transactions | | |
| Proceeds from sales of shares | 671,359,872 | 1,499,718,974 |
| Reinvestment of distributions | 61,020,034 | 49,465,140 |
| Cost of shares redeemed | (2,735,369,594) | (601,491,539) |
| Net increase (decrease) in net assets resulting from share transactions | (2,002,989,688) | 947,692,575 |
| Total increase (decrease) in net assets | (1,857,103,465) | 1,142,744,080 |
| Net Assets | | |
| Beginning of period | 3,655,490,592 | 2,512,746,512 |
| End of period | $1,798,387,127 | $3,655,490,592 |
| Other Information | | |
| Shares | | |
| Sold | 49,727,677 | 118,738,023 |
| Issued in reinvestment of distributions | 4,423,533 | 3,757,326 |
| Redeemed | (205,333,165) | (45,864,276) |
| Net increase (decrease) | (151,181,955) | 76,631,073 |
See accompanying notes which are an integral part of the financial statements.
Financial Highlights
Fidelity SAI U.S. Momentum Index Fund
| | | | | |
| Years ended July 31, | 2020 | 2019 | 2018 | 2017 A |
| Selected Per–Share Data | | | | |
| Net asset value, beginning of period | $13.77 | $13.31 | $10.98 | $10.00 |
| Income from Investment Operations | | | | |
| Net investment income (loss)B | .19 | .20 | .15 | .07 |
| Net realized and unrealized gain (loss) | 2.07 | .71C | 2.29 | .91 |
| Total from investment operations | 2.26 | .91 | 2.44 | .98 |
| Distributions from net investment income | (.22) | (.12) | (.06) | – |
| Distributions from net realized gain | (.08) | (.33) | (.04) | – |
| Total distributions | (.29)D | (.45) | (.11)E | – |
| Net asset value, end of period | $15.74 | $13.77 | $13.31 | $10.98 |
| Total ReturnF,G | 16.76% | 6.94%C | 22.33% | 9.80% |
| Ratios to Average Net AssetsH,I | | | | |
| Expenses before reductions | .11% | .21% | .23% | .35%J |
| Expenses net of fee waivers, if any | .11% | .15% | .15% | .15%J |
| Expenses net of all reductions | .11% | .15% | .15% | .15%J |
| Net investment income (loss) | 1.36% | 1.54% | 1.19% | 1.40%J |
| Supplemental Data | | | | |
| Net assets, end of period (000 omitted) | $1,798,387 | $3,655,491 | $2,512,747 | $744,177 |
| Portfolio turnover rateK | 163% | 161% | 153% | 47%L |
A For the period February 9, 2017 (commencement of operations) to July 31, 2017.
B Calculated based on average shares outstanding during the period.
C Amount includes a reimbursement from the investment adviser for an operational error which amounted to less than $.01 per share. Excluding this reimbursement, the total return would have been 6.91%.
D Total distributions of $.29 per share is comprised of distributions from net investment income of $.217 and distributions from net realized gain of $.077 per share.
E Total distributions of $.11 per share is comprised of distributions from net investment income of $.064 and distributions from net realized gain of $.043 per share.
F Total returns for periods of less than one year are not annualized.
G Total returns would have been lower if certain expenses had not been reduced during the applicable periods shown.
H Fees and expenses of any underlying mutual funds or exchange-traded funds (ETFs) are not included in the Fund's expense ratio. The Fund indirectly bears its proportionate share of these expenses. For additional expense information related to investments in Fidelity Central Funds, please refer to the "Investments in Fidelity Central Funds" note found in the Notes to Financial Statements section of the most recent Annual or Semi-Annual report.
I Expense ratios reflect operating expenses of the Fund. Expenses before reductions do not reflect amounts reimbursed by the investment adviser or reductions from expense offset arrangements and do not represent the amount paid by the Fund during periods when reimbursements or reductions occur. Expense ratios before reductions for start-up periods may not be representative of longer term operating periods. Expenses net of fee waivers reflect expenses after reimbursement by the investment adviser but prior to reductions from expense offset arrangements. Expenses net of all reductions represent the net expenses paid by the Fund.
J Annualized
K Amount does not include the portfolio activity of any underlying Fidelity Central Funds.
L Amount not annualized.
See accompanying notes which are an integral part of the financial statements.
Notes to Financial Statements
For the period ended July 31, 2020
1. Organization.
Fidelity SAI U.S. Momentum Index Fund (the Fund) is a fund of Fidelity Salem Street Trust (the Trust) and is authorized to issue an unlimited number of shares. Shares are offered exclusively to certain clients of Fidelity Management & Research Company LLC (FMR) or its affiliates. The Trust is registered under the Investment Company Act of 1940, as amended (the 1940 Act), as an open-end management investment company organized as a Massachusetts business trust.
Effective January 1, 2020:
Investment advisers Fidelity Investments Money Management, Inc., FMR Co., Inc., and Fidelity SelectCo, LLC, merged with and into Fidelity Management & Research Company. In connection with the merger transactions, the resulting, merged investment adviser was then redomiciled from Massachusetts to Delaware, changed its corporate structure from a corporation to a limited liability company, and changed its name to "Fidelity Management & Research Company LLC".
2. Investments in Fidelity Central Funds.
The Fund invests in Fidelity Central Funds, which are open-end investment companies generally available only to other investment companies and accounts managed by the investment adviser and its affiliates. The Fund's Schedule of Investments lists each of the Fidelity Central Funds held as of period end, if any, as an investment of the Fund, but does not include the underlying holdings of each Fidelity Central Fund. As an Investing Fund, the Fund indirectly bears its proportionate share of the expenses of the underlying Fidelity Central Funds.
The Money Market Central Funds seek preservation of capital and current income and are managed by the investment adviser. Annualized expenses of the Money Market Central Funds as of their most recent shareholder report date ranged from less than .005% to .01%.
A complete unaudited list of holdings for each Fidelity Central Fund is available upon request or at the Securities and Exchange Commission (the SEC) website at www.sec.gov. In addition, the financial statements of the Fidelity Central Funds, which are not covered by the Fund's Report of Independent Registered Public Accounting Firm, are available on the SEC website or upon request.
3. Significant Accounting Policies.
The Fund is an investment company and applies the accounting and reporting guidance of the Financial Accounting Standards Board (FASB) Accounting Standards Codification Topic 946 Financial Services – Investment Companies. The financial statements have been prepared in conformity with accounting principles generally accepted in the United States of America (GAAP), which require management to make certain estimates and assumptions at the date of the financial statements. Actual results could differ from those estimates. Subsequent events, if any, through the date that the financial statements were issued have been evaluated in the preparation of the financial statements. The following summarizes the significant accounting policies of the Fund:
Investment Valuation. Investments are valued as of 4:00 p.m. Eastern time on the last calendar day of the period. The Board of Trustees (the Board) has delegated the day to day responsibility for the valuation of the Fund's investments to the Fair Value Committee (the Committee) established by the Fund's investment adviser. In accordance with valuation policies and procedures approved by the Board, the Fund attempts to obtain prices from one or more third party pricing vendors or brokers to value its investments. When current market prices, quotations or currency exchange rates are not readily available or reliable, investments will be fair valued in good faith by the Committee, in accordance with procedures adopted by the Board. Factors used in determining fair value vary by investment type and may include market or investment specific events. The frequency with which these procedures are used cannot be predicted and they may be utilized to a significant extent. The Committee oversees the Fund's valuation policies and procedures and reports to the Board on the Committee's activities and fair value determinations. The Board monitors the appropriateness of the procedures used in valuing the Fund's investments and ratifies the fair value determinations of the Committee.
The Fund categorizes the inputs to valuation techniques used to value its investments into a disclosure hierarchy consisting of three levels as shown below:
- Level 1 – quoted prices in active markets for identical investments
- Level 2 – other significant observable inputs (including quoted prices for similar investments, interest rates, prepayment speeds, etc.)
- Level 3 – unobservable inputs (including the Fund's own assumptions based on the best information available)
Valuation techniques used to value the Fund's investments by major category are as follows:
Equity securities, including restricted securities, for which market quotations are readily available, are valued at the last reported sale price or official closing price as reported by a third party pricing vendor on the primary market or exchange on which they are traded and are categorized as Level 1 in the hierarchy. In the event there were no sales during the day or closing prices are not available, securities are valued at the last quoted bid price or may be valued using the last available price and are generally categorized as Level 2 in the hierarchy. For foreign equity securities, when market or security specific events arise, comparisons to the valuation of American Depositary Receipts (ADRs), futures contracts, Exchange-Traded Funds (ETFs) and certain indexes as well as quoted prices for similar securities may be used and would be categorized as Level 2 in the hierarchy. For equity securities, including restricted securities, where observable inputs are limited, assumptions about market activity and risk are used and these securities may be categorized as Level 3 in the hierarchy.
Futures contracts are valued at the settlement price established each day by the board of trade or exchange on which they are traded and are categorized as Level 1 in the hierarchy. Investments in open-end mutual funds, including the Fidelity Central Funds, are valued at their closing net asset value (NAV) each business day and are categorized as Level 1 in the hierarchy.
Changes in valuation techniques may result in transfers in or out of an assigned level within the disclosure hierarchy. The aggregate value of investments by input level as of July 31, 2020 is included at the end of the Fund's Schedule of Investments.
Investment Transactions and Income. For financial reporting purposes, the Fund's investment holdings and NAV include trades executed through the end of the last business day of the period. The NAV per share for processing shareholder transactions is calculated as of the close of business of the New York Stock Exchange (NYSE), normally 4:00 p.m. Eastern time and includes trades executed through the end of the prior business day. Gains and losses on securities sold are determined on the basis of identified cost. Dividend income is recorded on the ex-dividend date, except for certain dividends from foreign securities where the ex-dividend date may have passed, which are recorded as soon as the Fund is informed of the ex-dividend date. Non-cash dividends included in dividend income, if any, are recorded at the fair market value of the securities received. Income and capital gain distributions from Fidelity Central Funds, if any, are recorded on the ex-dividend date. Certain distributions received by the Fund represent a return of capital or capital gain. The Fund determines the components of these distributions subsequent to the ex-dividend date, based upon receipt of tax filings or other correspondence relating to the underlying investment. These distributions are recorded as a reduction of cost of investments and/or as a realized gain. Interest income is accrued as earned and includes coupon interest and amortization of premium and accretion of discount on debt securities as applicable.
Expenses. Expenses directly attributable to a fund are charged to that fund. Expenses attributable to more than one fund are allocated among the respective funds on the basis of relative net assets or other appropriate methods. Expense estimates are accrued in the period to which they relate and adjustments are made when actual amounts are known.
Income Tax Information and Distributions to Shareholders. Each year, the Fund intends to qualify as a regulated investment company under Subchapter M of the Internal Revenue Code, including distributing substantially all of its taxable income and realized gains. As a result, no provision for U.S. Federal income taxes is required. As of July 31, 2020, the Fund did not have any unrecognized tax benefits in the financial statements; nor is the Fund aware of any tax positions for which it is reasonably possible that the total amounts of unrecognized tax benefits will significantly change in the next twelve months. The Fund files a U.S. federal tax return, in addition to state and local tax returns as required. The Fund's federal income tax returns are subject to examination by the Internal Revenue Service (IRS) for a period of three fiscal years after they are filed. State and local tax returns may be subject to examination for an additional fiscal year depending on the jurisdiction.
Distributions are declared and recorded on the ex-dividend date. Income and capital gain distributions are determined in accordance with income tax regulations, which may differ from GAAP. In addition, the Fund claimed a portion of the payment made to redeeming shareholders as a distribution for income tax purposes.
Capital accounts within the financial statements are adjusted for permanent book-tax differences. These adjustments have no impact on net assets or the results of operations. Capital accounts are not adjusted for temporary book-tax differences which will reverse in a subsequent period.
Book-tax differences are primarily due to futures contracts, losses deferred due to wash sales and excise tax regulations.
As of period end, the cost and unrealized appreciation (depreciation) in securities, and derivatives if applicable, for federal income tax purposes were as follows:
| Gross unrealized appreciation | $433,620,378 |
| Gross unrealized depreciation | (15,527,297) |
| Net unrealized appreciation (depreciation) | $418,093,081 |
| Tax Cost | $1,409,427,502 |
The tax-based components of distributable earnings as of period end were as follows:
| Undistributed ordinary income | $16,255,803 |
| Undistributed long-term capital gain | $142,431,367 |
| Net unrealized appreciation (depreciation) on securities and other investments | $418,093,081 |
The tax character of distributions paid was as follows:
| | July 31, 2020 | July 31, 2019 |
| Ordinary Income | $55,904,171 | $ 80,137,946 |
| Long-term Capital Gains | 18,985,136 | 9,050,533 |
| Total | $74,889,307 | $ 89,188,479 |
4. Derivative Instruments.
Risk Exposures and the Use of Derivative Instruments. The Fund's investment objective allows the Fund to enter into various types of derivative contracts, including futures contracts. Derivatives are investments whose value is primarily derived from underlying assets, indices or reference rates and may be transacted on an exchange or over-the-counter (OTC). Derivatives may involve a future commitment to buy or sell a specified asset based on specified terms, to exchange future cash flows at periodic intervals based on a notional principal amount, or for one party to make one or more payments upon the occurrence of specified events in exchange for periodic payments from the other party.
The Fund used derivatives to increase returns and to manage exposure to certain risks as defined below. The success of any strategy involving derivatives depends on analysis of numerous economic factors, and if the strategies for investment do not work as intended, the Fund may not achieve its objectives.
The Fund's use of derivatives increased or decreased its exposure to the following risk:
| Equity Risk | Equity risk relates to the fluctuations in the value of financial instruments as a result of changes in market prices (other than those arising from interest rate risk or foreign exchange risk), whether caused by factors specific to an individual investment, its issuer, or all factors affecting all instruments traded in a market or market segment.
|
The Fund is also exposed to additional risks from investing in derivatives, such as liquidity risk and counterparty credit risk. Liquidity risk is the risk that the Fund will be unable to close out the derivative in the open market in a timely manner. Counterparty credit risk is the risk that the counterparty will not be able to fulfill its obligation to the Fund. Counterparty credit risk related to exchange-traded futures contracts may be mitigated by the protection provided by the exchange on which they trade.
Investing in derivatives may involve greater risks than investing in the underlying assets directly and, to varying degrees, may involve risk of loss in excess of any initial investment and collateral received and amounts recognized in the Statement of Assets and Liabilities. In addition, there may be the risk that the change in value of the derivative contract does not correspond to the change in value of the underlying instrument.
Futures Contracts. A futures contract is an agreement between two parties to buy or sell a specified underlying instrument for a fixed price at a specified future date. The Fund used futures contracts to manage its exposure to the stock market.
Upon entering into a futures contract, a fund is required to deposit either cash or securities (initial margin) with a clearing broker in an amount equal to a certain percentage of the face value of the contract. Futures contracts are marked-to-market daily and subsequent daily payments (variation margin) are made or received by a fund depending on the daily fluctuations in the value of the futures contracts and are recorded as unrealized appreciation or (depreciation). This receivable and/or payable, if any, is included in daily variation margin on futures contracts in the Statement of Assets and Liabilities. Realized gain or (loss) is recorded upon the expiration or closing of a futures contract. The net realized gain (loss) and change in net unrealized appreciation (depreciation) on futures contracts during the period is presented in the Statement of Operations.
Any open futures contracts at period end are presented in the Schedule of Investments under the caption "Futures Contracts". The notional amount at value reflects each contract's exposure to the underlying instrument or index at period end and is representative of volume of activity during the period. Cash deposited to meet initial margin requirements is presented as segregated cash with brokers for derivative instruments in the Statement of Assets and Liabilities.
5. Purchases and Sales of Investments.
Purchases and sales of securities, other than short-term securities are noted in the table below.
| | Purchases ($) | Sales ($) |
| Fidelity SAI U.S. Momentum Index Fund | 4,666,978,101 | 6,689,003,533 |
6. Fees and Other Transactions with Affiliates.
Management Fee. Fidelity Management & Research Company LLC (the investment adviser) and its affiliates provide the Fund with investment management related services for which the Fund pays a monthly management fee that is based on an annual rate of .10% of the Fund's average net assets.
Sub-Adviser. Geode Capital Management, LLC (Geode), serves as sub-adviser for the Fund. Geode provides discretionary investment advisory services to the Fund and is paid by the investment adviser for providing these services.
Interfund Lending Program. Pursuant to an Exemptive Order issued by the SEC, the fund, along with other registered investment companies having management contracts with Fidelity Management & Research Company LLC (FMR), or other affiliated entities of FMR, may participate in an interfund lending program. This program provides an alternative credit facility allowing the fund to borrow from, or lend money to, other participating affiliated funds. At period end, there were no interfund loans outstanding. Activity in this program during the period for which loans were outstanding was as follows:
| | Borrower or Lender | Average Loan Balance | Weighted Average Interest Rate | Interest Expense |
| Fidelity SAI U.S. Momentum Index Fund | Borrower | $34,873,232 | .65% | $35,273 |
Interfund Trades. Funds may purchase from or sell securities to other Fidelity Funds under procedures adopted by the Board. The procedures have been designed to ensure these interfund trades are executed in accordance with Rule 17a-7 of the 1940 Act. Interfund trades are included within the respective purchases and sales amounts shown in the Purchases and Sales of Investments note.
7. Committed Line of Credit.
Certain Funds participate with other funds managed by the investment adviser or an affiliate in a $4.25 billion credit facility (the "line of credit") to be utilized for temporary or emergency purposes to fund shareholder redemptions or for other short-term liquidity purposes. The participating funds have agreed to pay commitment fees on their pro-rata portion of the line of credit, which are reflected in Miscellaneous expenses on the Statement of Operations, and are as follows:
| | Amount |
| Fidelity SAI U.S. Momentum Index Fund | $7,490 |
During the period, there were no borrowings on this line of credit.
8. Security Lending.
The Fund lends portfolio securities from time to time in order to earn additional income. Lending agents are used, including National Financial Services (NFS), an affiliate of the Fund. Pursuant to a securities lending agreement, NFS will receive a fee, which is capped at 9.9% of daily lending revenue, for its services as lending agent. The Fund may lend securities to certain qualified borrowers, including NFS. On the settlement date of the loan, the Fund receives collateral (in the form of U.S. Treasury obligations, letters of credit and/or cash) against the loaned securities and maintains collateral in an amount not less than 100% of the market value of the loaned securities during the period of the loan. The market value of the loaned securities is determined at the close of business of the Fund and any additional required collateral is delivered to the Fund on the next business day. The Fund or borrower may terminate the loan at any time, and if the borrower defaults on its obligation to return the securities loaned because of insolvency or other reasons, the Fund may apply collateral received from the borrower against the obligation. The Fund may experience delays and costs in recovering the securities loaned. Any cash collateral received is invested in the Fidelity Securities Lending Cash Central Fund. The value of loaned securities and cash collateral at period end are disclosed on the Fund's Statement of Assets and Liabilities. At period end, there were no security loans outstanding with NFS, as affiliated borrower. Total fees paid by the Fund to NFS, as lending agent, amounted to $27,447. Security lending income represents the income earned on investing cash collateral, less rebates paid to borrowers and any lending agent fees associated with the loan, plus any premium payments received for lending certain types of securities. Net income from the Fidelity Securities Lending Cash Central Fund during the period is presented in the Statement of Operations as a component of income from Fidelity Central Funds (and includes $15,763 from securities loaned to NFS, as affiliated borrower).
9. Bank Borrowings.
The Fund is permitted to have bank borrowings for temporary or emergency purposes to fund shareholder redemptions or for other short-term liquidity requirements. The Fund has established borrowing arrangements with certain banks. The interest rate on the borrowings is the bank's base rate, as revised from time to time. Any open loans, including accrued interest, at period end are presented under the caption "Notes payable" in the Statement of Assets and Liabilities, if applicable. Activity in this program during the period for which loans were outstanding was as follows:
| | Average Loan Balance | Weighted Average Interest Rate | Interest Expense |
| Fidelity SAI U.S. Momentum Index Fund | $223,923,429 | .55% | $23,947 |
10. Expense Reductions.
Through arrangements with the Fund's custodian, credits realized as a result of certain uninvested cash balances were used to reduce the Fund's expenses by $268.
11. Other.
The Fund's organizational documents provide former and current trustees and officers with a limited indemnification against liabilities arising in connection with the performance of their duties to the Fund. In the normal course of business, the Fund may also enter into contracts that provide general indemnifications. The Fund's maximum exposure under these arrangements is unknown as this would be dependent on future claims that may be made against the Fund. The risk of material loss from such claims is considered remote.
At the end of the period, Strategic Advisers Fidelity U.S. Total Stock Fund was the owner of record of approximately 40% of the total outstanding shares of the Fund.
12. Coronavirus (COVID-19) Pandemic.
An outbreak of COVID-19 first detected in China during December 2019 has since spread globally and was declared a pandemic by the World Health Organization during March 2020. Developments that disrupt global economies and financial markets, such as the COVID-19 pandemic, may magnify factors that affect the Fund's performance.
Report of Independent Registered Public Accounting Firm
To the Board of Trustees of Fidelity Salem Street Trust and Shareholders of Fidelity SAI U.S. Momentum Index Fund
Opinion on the Financial Statements and Financial Highlights
We have audited the accompanying statement of assets and liabilities of Fidelity SAI U.S. Momentum Index Fund (the "Fund"), a fund of Fidelity Salem Street Trust, including the schedule of investments, as of July 31, 2020, the related statement of operations for the year then ended, the statement of changes in net assets for each of the two years in the period then ended, the financial highlights for each of the three years in the period then ended and for the period from February 9, 2017 (commencement of operations) to July 31, 2017, and the related notes. In our opinion, the financial statements and financial highlights present fairly, in all material respects, the financial position of the Fund as of July 31, 2020, and the results of its operations for the year then ended, the changes in its net assets for each of the two years in the period then ended, and the financial highlights for each of the three years in the period then ended and for the period from February 9, 2017 (commencement of operations) to July 31, 2017 in conformity with accounting principles generally accepted in the United States of America.
Basis for Opinion
These financial statements and financial highlights are the responsibility of the Fund's management. Our responsibility is to express an opinion on the Fund's financial statements and financial highlights based on our audits. We are a public accounting firm registered with the Public Company Accounting Oversight Board (United States) (PCAOB) and are required to be independent with respect to the Fund in accordance with the U.S. federal securities laws and the applicable rules and regulations of the Securities and Exchange Commission and the PCAOB.
We conducted our audits in accordance with the standards of the PCAOB. Those standards require that we plan and perform the audit to obtain reasonable assurance about whether the financial statements and financial highlights are free of material misstatement, whether due to error or fraud. The Fund is not required to have, nor were we engaged to perform, an audit of its internal control over financial reporting. As part of our audits we are required to obtain an understanding of internal control over financial reporting but not for the purpose of expressing an opinion on the effectiveness of the Fund’s internal control over financial reporting. Accordingly, we express no such opinion.
Our audits included performing procedures to assess the risks of material misstatement of the financial statements and financial highlights, whether due to error or fraud, and performing procedures that respond to those risks. Such procedures included examining, on a test basis, evidence regarding the amounts and disclosures in the financial statements and financial highlights. Our audits also included evaluating the accounting principles used and significant estimates made by management, as well as evaluating the overall presentation of the financial statements and financial highlights. Our procedures included confirmation of securities owned as of July 31, 2020, by correspondence with the custodian and brokers; when replies were not received from brokers, we performed other auditing procedures. We believe that our audits provide a reasonable basis for our opinion.
/s/ Deloitte & Touche LLP
Boston, Massachusetts
September 14, 2020
We have served as the auditor of one or more of the Fidelity investment companies since 1999.
Trustees and Officers
The Trustees, Members of the Advisory Board (if any), and officers of the trust and fund, as applicable, are listed below. The Board of Trustees governs the fund and is responsible for protecting the interests of shareholders. The Trustees are experienced executives who meet periodically throughout the year to oversee the fund's activities, review contractual arrangements with companies that provide services to the fund, oversee management of the risks associated with such activities and contractual arrangements, and review the fund's performance. Except for Jonathan Chiel, each of the Trustees oversees 280 funds. Mr. Chiel oversees 174 funds.
The Trustees hold office without limit in time except that (a) any Trustee may resign; (b) any Trustee may be removed by written instrument, signed by at least two-thirds of the number of Trustees prior to such removal; (c) any Trustee who requests to be retired or who has become incapacitated by illness or injury may be retired by written instrument signed by a majority of the other Trustees; and (d) any Trustee may be removed at any special meeting of shareholders by a two-thirds vote of the outstanding voting securities of the trust. Each Trustee who is not an interested person (as defined in the 1940 Act) of the trust and the fund is referred to herein as an Independent Trustee. Each Independent Trustee shall retire not later than the last day of the calendar year in which his or her 75th birthday occurs. The Independent Trustees may waive this mandatory retirement age policy with respect to individual Trustees. Officers and Advisory Board Members hold office without limit in time, except that any officer or Advisory Board Member may resign or may be removed by a vote of a majority of the Trustees at any regular meeting or any special meeting of the Trustees. Except as indicated, each individual has held the office shown or other offices in the same company for the past five years.
The fund’s Statement of Additional Information (SAI) includes more information about the Trustees. To request a free copy, call Fidelity at 1-800-544-3455
Experience, Skills, Attributes, and Qualifications of the Trustees. The Governance and Nominating Committee has adopted a statement of policy that describes the experience, qualifications, attributes, and skills that are necessary and desirable for potential Independent Trustee candidates (Statement of Policy). The Board believes that each Trustee satisfied at the time he or she was initially elected or appointed a Trustee, and continues to satisfy, the standards contemplated by the Statement of Policy. The Governance and Nominating Committee also engages professional search firms to help identify potential Independent Trustee candidates who have the experience, qualifications, attributes, and skills consistent with the Statement of Policy. From time to time, additional criteria based on the composition and skills of the current Independent Trustees, as well as experience or skills that may be appropriate in light of future changes to board composition, business conditions, and regulatory or other developments, have also been considered by the professional search firms and the Governance and Nominating Committee. In addition, the Board takes into account the Trustees' commitment and participation in Board and committee meetings, as well as their leadership of standing and ad hoc committees throughout their tenure.
In determining that a particular Trustee was and continues to be qualified to serve as a Trustee, the Board has considered a variety of criteria, none of which, in isolation, was controlling. The Board believes that, collectively, the Trustees have balanced and diverse experience, qualifications, attributes, and skills, which allow the Board to operate effectively in governing the fund and protecting the interests of shareholders. Information about the specific experience, skills, attributes, and qualifications of each Trustee, which in each case led to the Board's conclusion that the Trustee should serve (or continue to serve) as a trustee of the fund, is provided below.
Board Structure and Oversight Function. Abigail P. Johnson is an interested person and currently serves as Chairman. The Trustees have determined that an interested Chairman is appropriate and benefits shareholders because an interested Chairman has a personal and professional stake in the quality and continuity of services provided to the fund. Independent Trustees exercise their informed business judgment to appoint an individual of their choosing to serve as Chairman, regardless of whether the Trustee happens to be independent or a member of management. The Independent Trustees have determined that they can act independently and effectively without having an Independent Trustee serve as Chairman and that a key structural component for assuring that they are in a position to do so is for the Independent Trustees to constitute a substantial majority for the Board. The Independent Trustees also regularly meet in executive session. Arthur E. Johnson serves as Chairman of the Independent Trustees and as such (i) acts as a liaison between the Independent Trustees and management with respect to matters important to the Independent Trustees and (ii) with management prepares agendas for Board meetings.
Fidelity® funds are overseen by different Boards of Trustees. The fund's Board oversees Fidelity's investment-grade bond, money market, asset allocation and certain equity funds, and other Boards oversee Fidelity's high income and other equity funds. The asset allocation funds may invest in Fidelity® funds that are overseen by such other Boards. The use of separate Boards, each with its own committee structure, allows the Trustees of each group of Fidelity® funds to focus on the unique issues of the funds they oversee, including common research, investment, and operational issues. On occasion, the separate Boards establish joint committees to address issues of overlapping consequences for the Fidelity® funds overseen by each Board.
The Trustees operate using a system of committees to facilitate the timely and efficient consideration of all matters of importance to the Trustees, the fund, and fund shareholders and to facilitate compliance with legal and regulatory requirements and oversight of the fund's activities and associated risks. The Board, acting through its committees, has charged FMR and its affiliates with (i) identifying events or circumstances the occurrence of which could have demonstrably adverse effects on the fund's business and/or reputation; (ii) implementing processes and controls to lessen the possibility that such events or circumstances occur or to mitigate the effects of such events or circumstances if they do occur; and (iii) creating and maintaining a system designed to evaluate continuously business and market conditions in order to facilitate the identification and implementation processes described in (i) and (ii) above. Because the day-to-day operations and activities of the fund are carried out by or through FMR, its affiliates, and other service providers, the fund's exposure to risks is mitigated but not eliminated by the processes overseen by the Trustees. While each of the Board's committees has responsibility for overseeing different aspects of the fund's activities, oversight is exercised primarily through the Operations and Audit Committees. In addition, an ad hoc Board committee of Independent Trustees has worked with FMR to enhance the Board's oversight of investment and financial risks, legal and regulatory risks, technology risks, and operational risks, including the development of additional risk reporting to the Board. Appropriate personnel, including but not limited to the fund's Chief Compliance Officer (CCO), FMR's internal auditor, the independent accountants, the fund's Treasurer and portfolio management personnel, make periodic reports to the Board's committees, as appropriate, including an annual review of Fidelity's risk management program for the Fidelity® funds. The responsibilities of each standing committee, including their oversight responsibilities, are described further under "Standing Committees of the Trustees."
Interested Trustees*:
Correspondence intended for a Trustee who is an interested person may be sent to Fidelity Investments, 245 Summer Street, Boston, Massachusetts 02210.
Name, Year of Birth; Principal Occupations and Other Relevant Experience+
Jonathan Chiel (1957)
Year of Election or Appointment: 2016
Trustee [Include if document contains trusts for which the individual serves as Trustee and trusts for which he/she does not serve as Trustee: of Name(s) of Trust(s)]
Mr. Chiel also serves as Trustee of other Fidelity® funds. Mr. Chiel is Executive Vice President and General Counsel for FMR LLC (diversified financial services company, 2012-present). Previously, Mr. Chiel served as general counsel (2004-2012) and senior vice president and deputy general counsel (2000-2004) for John Hancock Financial Services; a partner with Choate, Hall & Stewart (1996-2000) (law firm); and an Assistant United States Attorney for the United States Attorney’s Office of the District of Massachusetts (1986-95), including Chief of the Criminal Division (1993-1995). Mr. Chiel is a director on the boards of the Boston Bar Foundation and the Maimonides School.
Abigail P. Johnson (1961)
Year of Election or Appointment: 2009
Trustee
Chairman of the Board of Trustees
Ms. Johnson also serves as Trustee of other Fidelity® funds. Ms. Johnson serves as Chairman (2016-present), Chief Executive Officer (2014-present), and Director (2007-present) of FMR LLC (diversified financial services company), President of Fidelity Financial Services (2012-present) and President of Personal, Workplace and Institutional Services (2005-present). Ms. Johnson is Chairman and Director of Fidelity Management & Research Company LLC (investment adviser firm, 2011-present). Previously, Ms. Johnson served as Chairman and Director of FMR Co., Inc. (investment adviser firm, 2011-2019), Vice Chairman (2007-2016) and President (2013-2016) of FMR LLC, President and a Director of Fidelity Management & Research Company (2001-2005), a Trustee of other investment companies advised by Fidelity Management & Research Company, Fidelity Investments Money Management, Inc. (investment adviser firm), and FMR Co., Inc. (2001-2005), Senior Vice President of the Fidelity® funds (2001-2005), and managed a number of Fidelity® funds. Ms. Abigail P. Johnson and Mr. Arthur E. Johnson are not related.
Jennifer Toolin McAuliffe (1959)
Year of Election or Appointment: 2016
Trustee
Ms. McAuliffe also serves as Trustee of other Fidelity® funds. Previously, Ms. McAuliffe served as Co-Head of Fixed Income of Fidelity Investments Limited (now known as FIL Limited (FIL)) (diversified financial services company), Director of Research for FIL’s credit and quantitative teams in London, Hong Kong and Tokyo and Director of Research for taxable and municipal bonds at Fidelity Investments Money Management, Inc. Ms. McAuliffe previously served as a member of the Advisory Board of certain Fidelity® funds (2016). Ms. McAuliffe was previously a lawyer at Ropes & Gray LLP and currently serves as director or trustee of several not-for-profit entities.
* Determined to be an “Interested Trustee” by virtue of, among other things, his or her affiliation with the trust[s] or various entities under common control with FMR.
+ The information includes the Trustee's principal occupation during the last five years and other information relating to the experience, attributes, and skills relevant to the Trustee's qualifications to serve as a Trustee, which led to the conclusion that the Trustee should serve as a Trustee for the fund.
Independent Trustees:
Correspondence intended for an Independent Trustee may be sent to Fidelity Investments, P.O. Box 55235, Boston, Massachusetts 02205-5235.
Name, Year of Birth; Principal Occupations and Other Relevant Experience+
Elizabeth S. Acton (1951)
Year of Election or Appointment: 2013
Trustee
Ms. Acton also serves as Trustee of other Fidelity® funds. Prior to her retirement, Ms. Acton served as Executive Vice President, Finance (2011-2012), Executive Vice President, Chief Financial Officer (2002-2011) and Treasurer (2004-2005) of Comerica Incorporated (financial services). Prior to joining Comerica, Ms. Acton held a variety of positions at Ford Motor Company (1983-2002), including Vice President and Treasurer (2000-2002) and Executive Vice President and Chief Financial Officer of Ford Motor Credit Company (1998-2000). Ms. Acton currently serves as a member of the Board and Audit and Finance Committees of Beazer Homes USA, Inc. (homebuilding, 2012-present). Ms. Acton previously served as a member of the Advisory Board of certain Fidelity® funds (2013-2016).
Ann E. Dunwoody (1953)
Year of Election or Appointment: 2018
Trustee
General Dunwoody also serves as Trustee of other Fidelity® funds. General Dunwoody (United States Army, Retired) was the first woman in U.S. military history to achieve the rank of four-star general and prior to her retirement in 2012 held a variety of positions within the U.S. Army, including Commanding General, U.S. Army Material Command (2008-2012). General Dunwoody currently serves as President of First to Four LLC (leadership and mentoring services, 2012-present), a member of the Board and Nomination and Corporate Governance Committees of Kforce Inc. (professional staffing services, 2016-present) and a member of the Board of Automattic Inc. (software engineering, 2018-present). Previously, General Dunwoody served as a member of the Advisory Board and Nominating and Corporate Governance Committee of L3 Technologies, Inc. (communication, electronic, sensor and aerospace systems, 2013-2019) and a member of the Board and Audit and Sustainability and Corporate Responsibility Committees of Republic Services, Inc. (waste collection, disposal and recycling, 2013-2016). Ms. Dunwoody also serves on several boards for non-profit organizations, including as a member of the Board, Chair of the Nomination and Governance Committee and a member of the Audit Committee of Logistics Management Institute (consulting non-profit, 2012-present), a member of the Council of Trustees for the Association of the United States Army (advocacy non-profit, 2013-present), a member of the Board of Florida Institute of Technology (2015-present) and a member of the Board of ThanksUSA (military family education non-profit, 2014-present). General Dunwoody previously served as a member of the Advisory Board of certain Fidelity® funds (2018).
John Engler (1948)
Year of Election or Appointment: 2014
Trustee
Mr. Engler also serves as Trustee of other Fidelity® funds. Previously, Mr. Engler served as Governor of Michigan (1991-2003), President of the Business Roundtable (2011-2017) and interim President of Michigan State University (2018-2019). Mr. Engler currently serves as a member of the Board of K12 Inc. (technology-based education company, 2012-present). Previously, Mr. Engler served as a member of the Board of Universal Forest Products (manufacturer and distributor of wood and wood-alternative products, 2003-2019) and Trustee of The Munder Funds (2003-2014). Mr. Engler previously served as a member of the Advisory Board of certain Fidelity® funds (2014-2016).
Robert F. Gartland (1951)
Year of Election or Appointment: 2010
Trustee
Mr. Gartland also serves as Trustee of other Fidelity® funds. Prior to his retirement, Mr. Gartland held a variety of positions at Morgan Stanley (financial services, 1979-2007), including Managing Director (1987-2007) and Chase Manhattan Bank (1975-1978). Mr. Gartland previously served as Chairman and an investor in Gartland & Mellina Group Corp. (consulting, 2009-2019), as a member of the Board of National Securities Clearing Corporation (1993-1996) and as Chairman of TradeWeb (2003-2004).
Arthur E. Johnson (1947)
Year of Election or Appointment: 2008
Trustee
Chairman of the Independent Trustees
Mr. Johnson also serves as Trustee of other Fidelity® funds. Prior to his retirement, Mr. Johnson served as Senior Vice President of Corporate Strategic Development of Lockheed Martin Corporation (defense contractor, 1999-2009). Mr. Johnson currently serves as a member of the Board of Booz Allen Hamilton (management consulting, 2011-present). Mr. Johnson previously served as a member of the Board of Eaton Corporation plc (diversified power management, 2009-2019) and a member of the Board of AGL Resources, Inc. (holding company, 2002-2016). Mr. Johnson previously served as Vice Chairman (2015-2018) of the Independent Trustees of certain Fidelity® funds. Mr. Arthur E. Johnson is not related to Ms. Abigail P. Johnson.
Michael E. Kenneally (1954)
Year of Election or Appointment: 2009
Trustee
Vice Chairman of the Independent Trustees
Mr. Kenneally also serves as Trustee of other Fidelity® funds. Prior to his retirement, Mr. Kenneally served as Chairman and Global Chief Executive Officer of Credit Suisse Asset Management and Executive Vice President and Chief Investment Officer of Bank of America Corporation. Earlier roles at Bank of America included Director of Research, Senior Portfolio Manager for various institutional equity accounts and mutual funds and Portfolio Manager for a number of institutional fixed-income clients. Mr. Kenneally began his career as a Research Analyst in 1983 and was awarded the Chartered Financial Analyst (CFA) designation in 1991.
Marie L. Knowles (1946)
Year of Election or Appointment: 2001
Trustee
Ms. Knowles also serves as Trustee of other Fidelity® funds. Prior to her retirement, Ms. Knowles held several positions at Atlantic Richfield Company (diversified energy), including Executive Vice President and Chief Financial Officer (1996-2000), Senior Vice President (1993-1996) and President of ARCO Transportation Company (pipeline and tanker operations, 1993-1996). Ms. Knowles currently serves as a member of the Board of McKesson Corporation (healthcare service, since 2002), a member of the Board of the Santa Catalina Island Company (real estate, 2009-present), a member of the Investment Company Institute Board of Governors and a member of the Governing Council of the Independent Directors Council (2014-present). Ms. Knowles also serves as a member of the Advisory Board for the School of Engineering of the University of Southern California. Ms. Knowles previously served as Chairman (2015-2018) and Vice Chairman (2012-2015) of the Independent Trustees of certain Fidelity® funds.
Mark A. Murray (1954)
Year of Election or Appointment: 2016
Trustee
Mr. Murray also serves as Trustee of other Fidelity® funds. Previously, Mr. Murray served as Co-Chief Executive Officer (2013-2016), President (2006-2013) and Vice Chairman (2013-2020) of Meijer, Inc. Mr. Murray serves as a member of the Board and Nuclear Review and Public Policy and Responsibility Committees of DTE Energy Company (diversified energy company, 2009-present) and a member of the Board and Audit Committee and Chairman of the Nominating and Corporate Governance Committee of Universal Forest Products, Inc. (manufacturer and distributor of wood and wood-alternative products, 2004-2016). Mr. Murray previously served as a member of the Board of Spectrum Health (not-for-profit health system, 2015-2019). Mr. Murray also serves as a member of the Board of many community and professional organizations. Mr. Murray previously served as a member of the Advisory Board of certain Fidelity® funds (2016).
+ The information includes the Trustee's principal occupation during the last five years and other information relating to the experience, attributes, and skills relevant to the Trustee's qualifications to serve as a Trustee, which led to the conclusion that the Trustee should serve as a Trustee for the fund.
Advisory Board Members and Officers:
Correspondence intended for an officer may be sent to Fidelity Investments, 245 Summer Street, Boston, Massachusetts 02210. Officers appear below in alphabetical order.
Name, Year of Birth; Principal Occupation
Elizabeth Paige Baumann (1968)
Year of Election or Appointment: 2017
Anti-Money Laundering (AML) Officer
Ms. Baumann also serves as AML Officer of other funds. She is Chief AML Officer (2012-present) and Senior Vice President (2014-present) of FMR LLC (diversified financial services company) and is an employee of Fidelity Investments. Previously, Ms. Baumann served as AML Officer of certain funds (2017-2019), as AML Officer of the funds (2012-2016), and Vice President (2007-2014) and Deputy Anti-Money Laundering Officer (2007-2012) of FMR LLC.
Craig S. Brown (1977)
Year of Election or Appointment: 2019
Assistant Treasurer
Mr. Brown also serves as Assistant Treasurer of other funds. Mr. Brown is an employee of Fidelity Investments (2013-present).
John J. Burke III (1964)
Year of Election or Appointment: 2018
Chief Financial Officer
Mr. Burke also serves as Chief Financial Officer of other funds. Mr. Burke serves as Head of Investment Operations for Fidelity Fund and Investment Operations (2018-present) and is an employee of Fidelity Investments (1998-present). Previously Mr. Burke served as head of Asset Management Investment Operations (2012-2018).
David J. Carter (1973)
Year of Election or Appointment: 2020
Assistant Secretary
Mr. Carter also serves as Assistant Secretary of other funds. Mr. Carter serves as Vice President, Associate General Counsel (2010-present) and is an employee of Fidelity Investments (2005-present).
Jonathan Davis (1968)
Year of Election or Appointment: 2010
Assistant Treasurer
Mr. Davis also serves as Assistant Treasurer of other funds. Mr. Davis serves as Assistant Treasurer of FMR Capital, Inc. (2017-present) and is an employee of Fidelity Investments. Previously, Mr. Davis served as Vice President and Associate General Counsel of FMR LLC (diversified financial services company, 2003-2010).
Laura M. Del Prato (1964)
Year of Election or Appointment: 2018
President and Treasurer
Ms. Del Prato also serves as an officer of other funds. Ms. Del Prato is an employee of Fidelity Investments (2017-present). Previously, Ms. Del Prato served as President and Treasurer of The North Carolina Capital Management Trust: Cash Portfolio and Term Portfolio (2018-2020). Prior to joining Fidelity Investments, Ms. Del Prato served as a Managing Director and Treasurer of the JPMorgan Mutual Funds (2014-2017). Prior to JPMorgan, Ms. Del Prato served as a partner at Cohen Fund Audit Services (accounting firm, 2012-2013) and KPMG LLP (accounting firm, 2004-2012).
Colm A. Hogan (1973)
Year of Election or Appointment: 2016
Assistant Treasurer
Mr. Hogan also serves as an officer of other funds. Mr. Hogan serves as Assistant Treasurer of FMR Capital, Inc. (2017-present) and is an employee of Fidelity Investments (2005-present). Previously, Mr. Hogan served as Deputy Treasurer of certain Fidelity® funds (2016-2020) and Assistant Treasurer of certain Fidelity® funds (2016-2018).
Cynthia Lo Bessette (1969)
Year of Election or Appointment: 2019
Secretary and Chief Legal Officer (CLO)
Ms. Lo Bessette also serves as an officer of other funds. Ms. Lo Bessette serves as CLO, Secretary, and Senior Vice President of Fidelity Management & Research Company LLC (investment adviser firm, 2019-present); and CLO of Fidelity Management & Research (Hong Kong) Limited, FMR Investment Management (UK) Limited, and Fidelity Management & Research (Japan) Limited (investment adviser firms, 2019-present). She is a Senior Vice President and Deputy General Counsel of FMR LLC (diversified financial services company, 2019-present), and is an employee of Fidelity Investments. Previously, Ms. Lo Bessette served as CLO, Secretary, and Senior Vice President of FMR Co., Inc. (investment adviser firm, 2019); Secretary of Fidelity SelectCo, LLC and Fidelity Investments Money Management, Inc. (investment adviser firms, 2019). Prior to joining Fidelity Investments, Ms. Lo Bessette was Executive Vice President, General Counsel (2016-2019) and Senior Vice President, Deputy General Counsel (2015-2016) of OppenheimerFunds (investment management company) and Deputy Chief Legal Officer (2013-2015) of Jennison Associates LLC (investment adviser firm).
Chris Maher (1972)
Year of Election or Appointment: 2013
Assistant Treasurer
Mr. Maher also serves as an officer of other funds. Mr. Maher serves as Assistant Treasurer of FMR Capital, Inc. (2017-present), and is an employee of Fidelity Investments (2008-present). Previously, Mr. Maher served as Assistant Treasurer of certain funds (2013-2020); Vice President of Asset Management Compliance (2013), Vice President of the Program Management Group of FMR (investment adviser firm, 2010-2013), and Vice President of Valuation Oversight (2008-2010).
Jamie Pagliocco (1964)
Year of Election or Appointment: 2020
Vice President
Mr. Pagliocco also serves as Vice President of other funds. Mr. Pagliocco serves as President of Fixed Income (2020-present), and is an employee of Fidelity Investments (2001-present). Previously, Mr. Pagliocco served as Co-Chief Investment Officer – Bond (2017-2020), Global Head of Bond Trading (2016-2019), and as a portfolio manager.
Kenneth B. Robins (1969)
Year of Election or Appointment: 2020
Chief Compliance Officer
Mr. Robins also serves as an officer of other funds. Mr. Robins serves as Compliance Officer of Fidelity Management & Research Company LLC (investment adviser firm, 2016-present) and is an employee of Fidelity Investments (2004-present). Previously, Mr. Robins served as Compliance Officer of FMR Co., Inc. (investment adviser firm, 2016-2019), as Executive Vice President of Fidelity Investments Money Management, Inc. (investment adviser firm, 2013-2016) and served in other fund officer roles.
Stacie M. Smith (1974)
Year of Election or Appointment: 2013
Assistant Treasurer
Ms. Smith also serves as an officer of other funds. Ms. Smith serves as Assistant Treasurer of FMR Capital, Inc. (2017-present), is an employee of Fidelity Investments (2009-present), and has served in other fund officer roles. Prior to joining Fidelity Investments, Ms. Smith served as Senior Audit Manager of Ernst & Young LLP (accounting firm, 1996-2009). Previously, Ms. Smith served as Assistant Treasurer (2013-2019) and Deputy Treasurer (2013-2016) of certain Fidelity® funds.
Marc L. Spector (1972)
Year of Election or Appointment: 2016
Deputy Treasurer
Mr. Spector also serves as an officer of other funds. Mr. Spector serves as Assistant Treasurer of FMR Capital, Inc. (2017-present) and is an employee of Fidelity Investments (2016-present). Prior to joining Fidelity Investments, Mr. Spector served as Director at the Siegfried Group (accounting firm, 2013-2016), and prior to Siegfried Group as audit senior manager at Deloitte & Touche LLP (accounting firm, 2005-2013).
Jim Wegmann (1979)
Year of Election or Appointment: 2019
Assistant Treasurer
Mr. Wegmann also serves as Assistant Treasurer of other funds. Mr. Wegmann is an employee of Fidelity Investments (2011-present).
Shareholder Expense Example
As a shareholder, you incur two types of costs: (1) transaction costs, which may include sales charges (loads) on purchase payments or redemption proceeds, as applicable and (2) ongoing costs, which generally include management fees, distribution and/or service (12b-1) fees and other Fund expenses. This Example is intended to help you understand your ongoing costs (in dollars) of investing in a fund and to compare these costs with the ongoing costs of investing in other mutual funds.
The Example is based on an investment of $1,000 invested at the beginning of the period and held for the entire period (February 1, 2020 to July 31, 2020).
Actual Expenses
The first line of the accompanying table provides information about actual account values and actual expenses. You may use the information in this line, together with the amount you invested, to estimate the expenses that you paid over the period. Simply divide your account value by $1,000.00 (for example, an $8,600 account value divided by $1,000.00 = 8.6), then multiply the result by the number in the first line for a class/Fund under the heading entitled "Expenses Paid During Period" to estimate the expenses you paid on your account during this period. If any fund is a shareholder of any underlying mutual funds or exchange-traded funds (ETFs) (the Underlying Funds), such fund indirectly bears its proportional share of the expenses of the Underlying Funds in addition to the direct expenses incurred presented in the table. These fees and expenses are not included in the annualized expense ratio used to calculate the expense estimate in the table below.
Hypothetical Example for Comparison Purposes
The second line of the accompanying table provides information about hypothetical account values and hypothetical expenses based on the actual expense ratio and an assumed rate of return of 5% per year before expenses, which is not the actual return. The hypothetical account values and expenses may not be used to estimate the actual ending account balance or expenses you paid for the period. You may use this information to compare the ongoing costs of investing in the Fund and other funds. To do so, compare this 5% hypothetical example with the 5% hypothetical examples that appear in the shareholder reports of the other funds. If any fund is a shareholder of any Underlying Funds, such fund indirectly bears its proportional share of the expenses of the Underlying Funds in addition to the direct expenses as presented in the table. These fees and expenses are not included in the annualized expense ratio used to calculate the expense estimate in the table below.
Please note that the expenses shown in the table are meant to highlight your ongoing costs only and do not reflect any transaction costs. Therefore, the second line of the table is useful in comparing ongoing costs only, and will not help you determine the relative total costs of owning different funds.
| | Annualized Expense Ratio-A | Beginning
Account Value
February 1, 2020 | Ending
Account Value
July 31, 2020 | Expenses Paid
During Period-B
February 1, 2020
to July 31, 2020 |
| Fidelity SAI U.S. Momentum Index Fund | .11% | | | |
| Actual | | $1,000.00 | $1,081.00 | $.57 |
| Hypothetical-C | | $1,000.00 | $1,024.32 | $.55 |
A Annualized expense ratio reflects expenses net of applicable fee waivers.
B Expenses are equal to the annualized expense ratio, multiplied by the average account value over the period, multiplied by 182/ 366 (to reflect the one-half year period). The fees and expenses of any Underlying Funds are not included in each annualized expense ratio.
C 5% return per year before expenses
Distributions (Unaudited)
The Board of Trustees of Fidelity SAI U.S Momentum Index Fund voted to pay on September 14, 2020, to shareholders of record at the opening of business on September 11, 2020, a distribution of $1.121 per share derived from capital gains realized from sales of portfolio securities and a dividend of $0.128 per share from net investment income.
The fund hereby designates as a capital gain dividend with respect to the taxable year ended July 31, 2020, $253,354,586, or, if subsequently determined to be different, the net capital gain of such year.
The fund designates 100% and 91% of the dividends distributed in September and December, respectively during the fiscal year as qualifying for the dividends–received deduction for corporate shareholders.
The fund designates 100% and 95% of the dividends distributed in September and December, respectively during the fiscal year as amounts which may be taken into account as a dividend for the purposes of the maximum rate under section 1(h)(11) of the Internal Revenue Code.
The fund designates 1% and 6% of the dividends distributed in September and December, respectively during the fiscal year as a section 199A dividend.
The fund will notify shareholders in January 2021 of amounts for use in preparing 2020 income tax returns.
Liquidity Risk Management Program
The Securities and Exchange Commission adopted Rule 22e-4 under the Investment Company Act of 1940 (the Liquidity Rule) to promote effective liquidity risk management throughout the open-end investment company industry, thereby reducing the risk that funds will be unable to meet their redemption obligations and mitigating dilution of the interests of fund shareholders.
The Fund has adopted and implemented a liquidity risk management program pursuant to the Liquidity Rule (the Program) effective December 1, 2018. The Program is reasonably designed to assess and manage the Fund’s liquidity risk and to comply with the requirements of the Liquidity Rule. The Fund’s Board of Trustees (the Board) has designated the Fund’s investment adviser as administrator of the Program. The Fidelity advisers have established a Liquidity Risk Management Committee (the LRM Committee) to manage the Program for each of the Fidelity Funds. The LRM Committee monitors the adequacy and effectiveness of implementation of the Program and on a periodic basis assesses each Fund’s liquidity risk based on a variety of factors including (1) the Fund’s investment strategy, (2) portfolio liquidity and cash flow projections during normal and reasonably foreseeable stressed conditions, (3) shareholder redemptions, (4) borrowings and other funding sources and (5) in the case of exchange-traded funds, certain additional factors including the effect of the Fund’s prices and spreads, market participants, and basket compositions on the overall liquidity of the Fund’s portfolio, as applicable.
In accordance with the Program, each of the Fund’s portfolio investments is classified into one of four liquidity categories described below based on a determination of a reasonable expectation for how long it would take to convert the investment to cash (or sell or dispose of the investment) without significantly changing its market value.
- Highly liquid investments – cash or convertible to cash within three business days or less
- Moderately liquid investments – convertible to cash in three to seven calendar days
- Less liquid investments – can be sold or disposed of, but not settled, within seven calendar days
- Illiquid investments – cannot be sold or disposed of within seven calendar days
Liquidity classification determinations take into account a variety of factors including various market, trading and investment-specific considerations, as well as market depth, and generally utilize analysis from a third-party liquidity metrics service.
The Liquidity Rule places a 15% limit on a fund’s illiquid investments and requires funds that do not primarily hold assets that are highly liquid investments to determine and maintain a minimum percentage of the fund’s net assets to be invested in highly liquid investments (highly liquid investment minimum or HLIM). The Program includes provisions reasonably designed to comply with the 15% limit on illiquid investments and for determining, periodically reviewing and complying with the HLIM requirement as applicable.
At a recent meeting of the Fund’s Board of Trustees, the LRM Committee provided a written report to the Board pertaining to the operation, adequacy, and effectiveness of implementation of the Program for the annual period from December 1, 2018 through November 30, 2019. The report concluded that the Program has been implemented and is operating effectively and is reasonably designed to assess and manage the Fund’s liquidity risk.
SY1-ANN-0920
1.9878817.103
Fidelity® SAI U.S. Value Index Fund
Offered exclusively to certain clients of the Adviser or its affiliates - not available for sale to the general public. Fidelity SAI is a product name of Fidelity® funds dedicated to certain programs affiliated with Strategic Advisers LLC.
Annual Report
July 31, 2020
See the inside front cover for important information about access to your fund’s shareholder reports.
Beginning on January 1, 2021, as permitted by regulations adopted by the Securities and Exchange Commission, paper copies of a fund’s shareholder reports will no longer be sent by mail, unless you specifically request paper copies of the reports from the fund or from your financial intermediary, such as a financial advisor, broker-dealer or bank. Instead, the reports will be made available on a website, and you will be notified by mail each time a report is posted and provided with a website link to access the report.
If you already elected to receive shareholder reports electronically, you will not be affected by this change and you need not take any action. You may elect to receive shareholder reports and other communications from a fund electronically, by contacting your financial intermediary. For Fidelity customers, visit Fidelity's web site or call Fidelity using the contact information listed below.
You may elect to receive all future reports in paper free of charge. If you wish to continue receiving paper copies of your shareholder reports, you may contact your financial intermediary or, if you are a Fidelity customer, visit Fidelity’s website, or call Fidelity at the applicable toll-free number listed below. Your election to receive reports in paper will apply to all funds held with the fund complex/your financial intermediary.
| Account Type | Website | Phone Number |
| Brokerage, Mutual Fund, or Annuity Contracts: | fidelity.com/mailpreferences | 1-800-343-3548 |
| Employer Provided Retirement Accounts: | netbenefits.fidelity.com/preferences (choose 'no' under Required Disclosures to continue to print) | 1-800-343-0860 |
| Advisor Sold Accounts Serviced Through Your Financial Intermediary: | Contact Your Financial Intermediary | Your Financial Intermediary's phone number |
| Advisor Sold Accounts Serviced by Fidelity: | institutional.fidelity.com | 1-877-208-0098 |
Contents
To view a fund's proxy voting guidelines and proxy voting record for the 12-month period ended June 30, visit http://www.fidelity.com/proxyvotingresults or visit the Securities and Exchange Commission's (SEC) web site at http://www.sec.gov.
You may also call 1-800-544-3455 to request a free copy of the proxy voting guidelines.
Standard & Poor's, S&P and S&P 500 are registered service marks of The McGraw-Hill Companies, Inc. and have been licensed for use by Fidelity Distributors Corporation.
Other third-party marks appearing herein are the property of their respective owners.
All other marks appearing herein are registered or unregistered trademarks or service marks of FMR LLC or an affiliated company. © 2020 FMR LLC. All rights reserved.
This report and the financial statements contained herein are submitted for the general information of the shareholders of the Fund. This report is not authorized for distribution to prospective investors in the Fund unless preceded or accompanied by an effective prospectus.
A fund files its complete schedule of portfolio holdings with the SEC for the first and third quarters of each fiscal year on Form N-PORT. Forms N-PORT are available on the SEC’s web site at http://www.sec.gov. A fund's Forms N-PORT may be reviewed and copied at the SEC’s Public Reference Room in Washington, DC. Information regarding the operation of the SEC's Public Reference Room may be obtained by calling 1-800-SEC-0330.
For a complete list of a fund's portfolio holdings, view the most recent holdings listing, semiannual report, or annual report on Fidelity's web site at http://www.fidelity.com, http://www.institutional.fidelity.com, or http://www.401k.com, as applicable.
NOT FDIC INSURED •MAY LOSE VALUE •NO BANK GUARANTEE
Neither the Fund nor Fidelity Distributors Corporation is a bank.
Note to Shareholders:
Early in 2020, the outbreak and spread of a new coronavirus emerged as a public health emergency that had a major influence on financial markets, primarily based on its impact on the global economy and the outlook for corporate earnings. The virus causes a respiratory disease known as COVID-19. On March 11, the World Health Organization declared the COVID-19 outbreak a pandemic, citing sustained risk of further global spread.
In the weeks following, as the crisis worsened, we witnessed an escalating human tragedy with wide-scale social and economic consequences from coronavirus-containment measures. The outbreak of COVID-19 prompted a number of measures to limit the spread, including travel and border restrictions, quarantines, and restrictions on large gatherings. In turn, these resulted in lower consumer activity, diminished demand for a wide range of products and services, disruption in manufacturing and supply chains, and – given the wide variability in outcomes regarding the outbreak – significant market uncertainty and volatility. Amid the turmoil, the U.S. government took unprecedented action – in concert with the U.S. Federal Reserve and central banks around the world – to help support consumers, businesses, and the broader economy, and to limit disruption to the financial system.
The situation continues to unfold, and the extent and duration of its impact on financial markets and the economy remain highly uncertain. Extreme events such as the coronavirus crisis are “exogenous shocks” that can have significant adverse effects on mutual funds and their investments. Although multiple asset classes may be affected by market disruption, the duration and impact may not be the same for all types of assets.
Fidelity is committed to helping you stay informed amid news about COVID-19 and during increased market volatility, and we’re taking extra steps to be responsive to customer needs. We encourage you to visit our websites, where we offer ongoing updates, commentary, and analysis on the markets and our funds.
Performance: The Bottom Line
Average annual total return reflects the change in the value of an investment, assuming reinvestment of distributions from dividend income and capital gains (the profits earned upon the sale of securities that have grown in value, if any) and assuming a constant rate of performance each year. The hypothetical investment and the average annual total returns do not reflect the deduction of taxes that a shareholder would pay on fund distributions or the redemption of fund shares. During periods of reimbursement by Fidelity, a fund’s total return will be greater than it would be had the reimbursement not occurred. How a fund did yesterday is no guarantee of how it will do tomorrow.
Average Annual Total Returns
| For the periods ended July 31, 2020 | Past 1 year | Life of fundA |
| Fidelity® SAI U.S. Value Index Fund | (10.13)% | (2.44)% |
A From December 19, 2017
$10,000 Over Life of Fund
Let's say hypothetically that $10,000 was invested in Fidelity® SAI U.S. Value Index Fund on December 19, 2017, when the fund started.
The chart shows how the value of your investment would have changed, and also shows how the Fidelity U.S. Value Focus Index℠ performed over the same period.
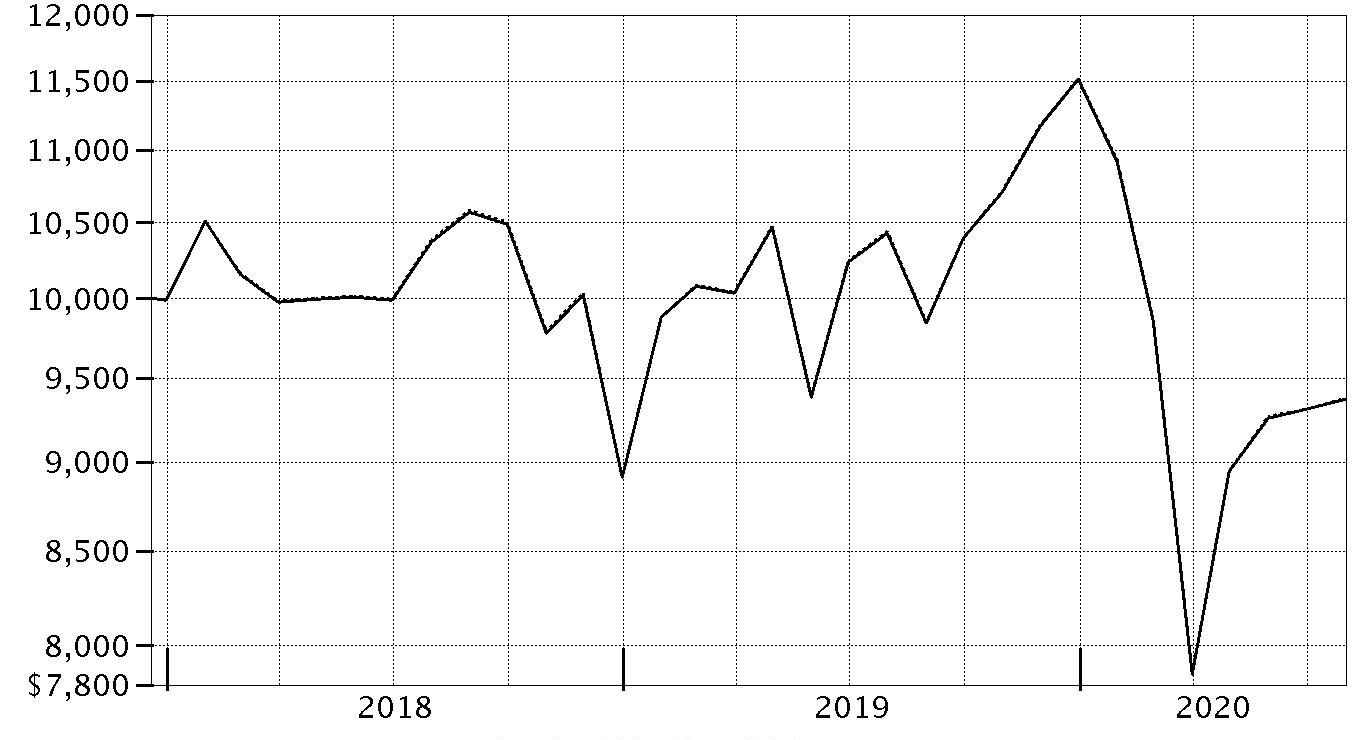
| Period Ending Values |
| $9,375 | Fidelity® SAI U.S. Value Index Fund |
| $9,377 | Fidelity U.S. Value Focus Index℠ |
Management's Discussion of Fund Performance
Market Recap: The S&P 500
® index gained 11.96% for the 12 months ending July 31, 2020, in what was a bumpy ride for U.S. equity investors, marked by a steep but brief decline due to the early-2020 outbreak and spread of the coronavirus, followed by a historic rebound. Declared a pandemic on March 11, the COVID-19 crisis and containment efforts caused broad contraction in economic activity, along with extreme uncertainty, volatility and dislocation in financial markets. By mid-March, U.S. stocks entered bear-market territory less than a month after hitting an all-time high and extending the longest-running bull market in American history. Stocks slid in late February, after a surge in COVID-19 cases outside China. The sudden downtrend continued in March (-12%), capping the index’s worst quarter since 2008. A historically rapid and expansive U.S. monetary/fiscal-policy response provided a partial offset to the economic disruption and fueled a sharp uptrend. Aggressive support for financial markets by the U.S. Federal Reserve, plans for reopening the economy and improving infection data boosted stocks in April (+13%) and May (+5%). In June and July, the index gained amid progress on potential treatments and signs of an early recovery in economic activity. For the full 12 months, growth stocks widely topped value, while large-caps handily bested smaller-caps. The information technology sector (+39%) led the way, followed by consumer discretionary (+22%). In contrast, energy (-38%) fell hard along with the price of crude oil.
Comments from the Geode Capital Management, LLC, passive equity index team: For the fiscal year ending July 31, 2020, the fund returned -10.13%, roughly in line with the -10.19% result of the benchmark Fidelity U.S. Value Focus Index. By sector, financials returned roughly -26% and detracted most, followed by energy, which returned roughly -37%. The industrials sector returned -29%, hampered by the transportation industry (-50%), and materials (-16%) also hurt. Other notable detractors included consumer discretionary (-17%), especially in the automobiles & components industry (-25%); communication services (-3%), hampered by the media & entertainment industry (-7%); and utilities (-9%) sectors. Conversely, health care advanced 22% and contributed most. Information technology stocks also helped, gaining about 8%. The consumer staples sector rose 6%, boosted by the food, beverage & tobacco industry (+5%) and real estate (+20%) also contributed. Turning to individual stocks, the biggest individual detractor was Wells Fargo (-47%), from the banks group. In energy, Chevron (-29%), Exxon Mobil (-41%), and ConocoPhillips (-34%) hurt. Citigroup, within the banks category, returned about -27% and hindered the fund. In contrast, the biggest individual contributor was AbbVie (+49%), from the pharmaceuticals, biotechnology & life sciences category. Also in pharmaceuticals, biotechnology & life sciences, Bristol-Myers Squibb (+33%) and Gilead Sciences (+12%) helped. Apple, within the technology hardware & equipment group, advanced 102% and lifted the fund. Another contributor was Microsoft (+52%), a stock in the software & services industry.
The views expressed above reflect those of the portfolio manager(s) only through the end of the period as stated on the cover of this report and do not necessarily represent the views of Fidelity or any other person in the Fidelity organization. Any such views are subject to change at any time based upon market or other conditions and Fidelity disclaims any responsibility to update such views. These views may not be relied on as investment advice and, because investment decisions for a Fidelity fund are based on numerous factors, may not be relied on as an indication of trading intent on behalf of any Fidelity fund.
Investment Summary (Unaudited)
Top Five Stocks as of July 31, 2020
| | % of fund's net assets |
| Verizon Communications, Inc. | 3.9 |
| Comcast Corp. Class A | 3.8 |
| AT&T, Inc. | 3.6 |
| AbbVie, Inc. | 3.4 |
| Chevron Corp. | 3.4 |
| | 18.1 |
Top Five Market Sectors as of July 31, 2020
| | % of fund's net assets |
| Financials | 20.1 |
| Information Technology | 17.2 |
| Health Care | 13.8 |
| Communication Services | 13.6 |
| Energy | 11.9 |
Asset Allocation (% of fund's net assets)
| As of July 31, 2020 * |
| | Stocks and Equity Futures | 100.0% |

* Foreign investments - 4.0%
Schedule of Investments July 31, 2020
Showing Percentage of Net Assets
| Common Stocks - 99.6% | | | |
| | | Shares | Value |
| COMMUNICATION SERVICES - 13.6% | | | |
| Diversified Telecommunication Services - 8.0% | | | |
| AT&T, Inc. | | 2,792,937 | $82,615,076 |
| CenturyLink, Inc. | | 531,029 | 5,124,430 |
| Liberty Global PLC Class A (a) | | 292,174 | 6,838,332 |
| Verizon Communications, Inc. | | 1,546,032 | 88,865,919 |
| | | | 183,443,757 |
| Media - 5.6% | | | |
| Comcast Corp. Class A | | 2,041,174 | 87,362,247 |
| Discovery Communications, Inc. Class A (a)(b) | | 241,409 | 5,093,730 |
| DISH Network Corp. Class A (a) | | 138,247 | 4,439,111 |
| Fox Corp. Class A | | 269,781 | 6,952,256 |
| Interpublic Group of Companies, Inc. | | 209,462 | 3,780,789 |
| News Corp. Class A | | 274,739 | 3,494,680 |
| Nexstar Broadcasting Group, Inc. Class A | | 24,334 | 2,132,875 |
| Omnicom Group, Inc. | | 115,202 | 6,189,803 |
| ViacomCBS, Inc. Class B (b) | | 290,624 | 7,576,568 |
| | | | 127,022,059 |
|
| TOTAL COMMUNICATION SERVICES | | | 310,465,816 |
|
| CONSUMER DISCRETIONARY - 6.4% | | | |
| Auto Components - 0.3% | | | |
| BorgWarner, Inc. | | 111,453 | 4,079,180 |
| Lear Corp. | | 29,315 | 3,235,790 |
| | | | 7,314,970 |
| Automobiles - 1.4% | | | |
| Ford Motor Co. | | 2,100,021 | 13,881,139 |
| General Motors Co. | | 677,043 | 16,851,600 |
| Harley-Davidson, Inc. | | 82,348 | 2,143,518 |
| | | | 32,876,257 |
| Distributors - 0.2% | | | |
| LKQ Corp. (a) | | 163,417 | 4,606,725 |
| Household Durables - 1.9% | | | |
| D.R. Horton, Inc. | | 177,853 | 11,766,754 |
| Lennar Corp. Class A | | 153,841 | 11,130,396 |
| Mohawk Industries, Inc. (a) | | 31,982 | 2,553,763 |
| Newell Brands, Inc. | | 205,202 | 3,365,313 |
| PulteGroup, Inc. | | 135,511 | 5,908,280 |
| Toll Brothers, Inc. | | 62,137 | 2,373,633 |
| Whirlpool Corp. (b) | | 33,420 | 5,451,470 |
| | | | 42,549,609 |
| Internet & Direct Marketing Retail - 1.3% | | | |
| Amazon.com, Inc. (a) | | 8,852 | 28,013,747 |
| Liberty Interactive Corp. QVC Group Series A (a) | | 208,252 | 2,272,029 |
| | | | 30,285,776 |
| Multiline Retail - 0.1% | | | |
| Kohl's Corp. | | 84,802 | 1,614,630 |
| Specialty Retail - 0.8% | | | |
| Aaron's, Inc. Class A | | 36,324 | 1,895,386 |
| Best Buy Co., Inc. | | 122,206 | 12,170,496 |
| Foot Locker, Inc. | | 56,015 | 1,646,281 |
| Lithia Motors, Inc. Class A (sub. vtg.) | | 11,915 | 2,730,322 |
| | | | 18,442,485 |
| Textiles, Apparel & Luxury Goods - 0.4% | | | |
| Hanesbrands, Inc. | | 187,109 | 2,643,850 |
| PVH Corp. | | 38,137 | 1,855,746 |
| Ralph Lauren Corp. | | 25,686 | 1,831,412 |
| Tapestry, Inc. | | 148,434 | 1,983,078 |
| | | | 8,314,086 |
|
| TOTAL CONSUMER DISCRETIONARY | | | 146,004,538 |
|
| CONSUMER STAPLES - 4.7% | | | |
| Beverages - 0.2% | | | |
| Molson Coors Beverage Co. Class B | | 101,101 | 3,793,310 |
| Food & Staples Retailing - 1.4% | | | |
| Kroger Co. | | 422,666 | 14,704,550 |
| U.S. Foods Holding Corp. (a) | | 118,427 | 2,404,068 |
| Walgreens Boots Alliance, Inc. | | 396,149 | 16,127,226 |
| | | | 33,235,844 |
| Food Products - 1.3% | | | |
| Nomad Foods Ltd. (a) | | 99,381 | 2,291,726 |
| The J.M. Smucker Co. | | 61,308 | 6,704,030 |
| The Kraft Heinz Co. | | 335,006 | 11,517,506 |
| Tyson Foods, Inc. Class A | | 158,225 | 9,722,926 |
| | | | 30,236,188 |
| Tobacco - 1.8% | | | |
| Altria Group, Inc. | | 999,085 | 41,112,348 |
|
| TOTAL CONSUMER STAPLES | | | 108,377,690 |
|
| ENERGY - 11.9% | | | |
| Energy Equipment & Services - 0.9% | | | |
| Baker Hughes Co. Class A | | 352,156 | 5,454,896 |
| Schlumberger Ltd. | | 746,108 | 13,534,399 |
| TechnipFMC PLC | | 226,121 | 1,815,752 |
| | | | 20,805,047 |
| Oil, Gas & Consumable Fuels - 11.0% | | | |
| Chevron Corp. | | 909,732 | 76,362,904 |
| ConocoPhillips Co. | | 576,551 | 21,557,242 |
| Diamondback Energy, Inc. | | 80,264 | 3,199,323 |
| EOG Resources, Inc. | | 312,916 | 14,660,115 |
| EQT Corp. | | 137,388 | 1,994,874 |
| Equitrans Midstream Corp. (b) | | 218,501 | 2,108,535 |
| Exxon Mobil Corp. | | 1,785,976 | 75,153,870 |
| HollyFrontier Corp. | | 80,070 | 2,201,925 |
| Kinder Morgan, Inc. | | 706,007 | 9,954,699 |
| Marathon Oil Corp. | | 424,883 | 2,332,608 |
| Marathon Petroleum Corp. | | 349,589 | 13,354,300 |
| Phillips 66 Co. | | 234,763 | 14,560,001 |
| Valero Energy Corp. | | 219,185 | 12,324,773 |
| | | | 249,765,169 |
|
| TOTAL ENERGY | | | 270,570,216 |
|
| FINANCIALS - 20.1% | | | |
| Banks - 10.6% | | | |
| Bank of America Corp. | | 2,660,050 | 66,182,044 |
| Citigroup, Inc. | | 1,119,209 | 55,971,642 |
| Citizens Financial Group, Inc. | | 229,356 | 5,690,322 |
| Comerica, Inc. | | 74,747 | 2,879,254 |
| East West Bancorp, Inc. | | 76,065 | 2,636,413 |
| Fifth Third Bancorp | | 382,734 | 7,601,097 |
| First Horizon National Corp. | | 167,662 | 1,554,227 |
| KeyCorp | | 524,392 | 6,297,948 |
| Peoples United Financial, Inc. | | 228,302 | 2,463,379 |
| Pinnacle Financial Partners, Inc. | | 38,330 | 1,518,635 |
| Popular, Inc. | | 47,378 | 1,758,198 |
| Regions Financial Corp. | | 514,496 | 5,587,427 |
| Synovus Financial Corp. | | 79,183 | 1,595,537 |
| Truist Financial Corp. | | 724,418 | 27,136,698 |
| Valley National Bancorp | | 210,576 | 1,573,003 |
| Wells Fargo & Co. | | 2,005,837 | 48,661,606 |
| Zions Bancorp NA | | 88,095 | 2,860,445 |
| | | | 241,967,875 |
| Capital Markets - 4.1% | | | |
| Ameriprise Financial, Inc. | | 65,770 | 10,104,245 |
| Bank of New York Mellon Corp. | | 433,184 | 15,529,646 |
| Goldman Sachs Group, Inc. | | 166,391 | 32,938,762 |
| Invesco Ltd. | | 202,301 | 2,031,102 |
| Morgan Stanley | | 643,792 | 31,468,553 |
| Stifel Financial Corp. | | 36,833 | 1,785,664 |
| | | | 93,857,972 |
| Consumer Finance - 0.4% | | | |
| Ally Financial, Inc. | | 200,614 | 4,032,341 |
| Synchrony Financial | | 288,705 | 6,389,042 |
| | | | 10,421,383 |
| Diversified Financial Services - 0.4% | | | |
| AXA Equitable Holdings, Inc. | | 218,000 | 4,460,280 |
| Jefferies Financial Group, Inc. | | 121,403 | 1,966,729 |
| Voya Financial, Inc. | | 67,814 | 3,350,012 |
| | | | 9,777,021 |
| Insurance - 4.3% | | | |
| AFLAC, Inc. | | 385,742 | 13,720,843 |
| Allstate Corp. | | 159,657 | 15,070,024 |
| American International Group, Inc. | | 463,042 | 14,882,170 |
| Athene Holding Ltd. (a) | | 63,695 | 2,054,164 |
| Hartford Financial Services Group, Inc. | | 192,506 | 8,146,854 |
| Lincoln National Corp. | | 103,880 | 3,871,608 |
| MetLife, Inc. | | 414,743 | 15,698,023 |
| Principal Financial Group, Inc. | | 136,929 | 5,809,897 |
| Prudential Financial, Inc. | | 212,358 | 13,457,126 |
| Reinsurance Group of America, Inc. | | 36,462 | 3,108,386 |
| Unum Group | | 109,361 | 1,884,290 |
| | | | 97,703,385 |
| Mortgage Real Estate Investment Trusts - 0.1% | | | |
| Starwood Property Trust, Inc. | | 151,744 | 2,268,573 |
| Thrifts & Mortgage Finance - 0.2% | | | |
| Essent Group Ltd. | | 59,473 | 2,130,918 |
| Radian Group, Inc. | | 104,758 | 1,562,989 |
| | | | 3,693,907 |
|
| TOTAL FINANCIALS | | | 459,690,116 |
|
| HEALTH CARE - 13.8% | | | |
| Biotechnology - 5.4% | | | |
| AbbVie, Inc. | | 812,647 | 77,128,327 |
| Alexion Pharmaceuticals, Inc. (a) | | 118,720 | 12,167,613 |
| Biogen, Inc. (a) | | 87,732 | 24,099,103 |
| Gilead Sciences, Inc. | | 99,860 | 6,943,266 |
| United Therapeutics Corp. (a) | | 23,661 | 2,637,492 |
| | | | 122,975,801 |
| Health Care Equipment & Supplies - 0.1% | | | |
| Envista Holdings Corp. (a) | | 85,599 | 1,872,050 |
| Health Care Providers & Services - 7.5% | | | |
| AmerisourceBergen Corp. | | 79,827 | 7,997,867 |
| Anthem, Inc. | | 135,541 | 37,111,126 |
| Cardinal Health, Inc. | | 156,976 | 8,574,029 |
| Cigna Corp. | | 198,369 | 34,256,343 |
| CVS Health Corp. | | 702,711 | 44,228,630 |
| DaVita HealthCare Partners, Inc. (a) | | 45,839 | 4,005,870 |
| HCA Holdings, Inc. | | 141,577 | 17,929,311 |
| McKesson Corp. | | 87,014 | 13,066,022 |
| Universal Health Services, Inc. Class B | | 41,756 | 4,588,984 |
| | | | 171,758,182 |
| Pharmaceuticals - 0.8% | | | |
| Bristol-Myers Squibb Co. | | 127,993 | 7,508,069 |
| Jazz Pharmaceuticals PLC (a) | | 29,746 | 3,220,005 |
| Mylan NV (a) | | 277,918 | 4,477,259 |
| Perrigo Co. PLC | | 73,284 | 3,885,518 |
| | | | 19,090,851 |
|
| TOTAL HEALTH CARE | | | 315,696,884 |
|
| INDUSTRIALS - 6.0% | | | |
| Aerospace & Defense - 2.3% | | | |
| Howmet Aerospace, Inc. | | 206,320 | 3,049,410 |
| Raytheon Technologies Corp. | | 790,713 | 44,817,613 |
| Textron, Inc. | | 122,385 | 4,276,132 |
| | | | 52,143,155 |
| Airlines - 0.4% | | | |
| Alaska Air Group, Inc. | | 65,903 | 2,269,699 |
| Delta Air Lines, Inc. | | 305,185 | 7,620,469 |
| | | | 9,890,168 |
| Building Products - 0.2% | | | |
| Owens Corning | | 57,977 | 3,505,869 |
| Construction & Engineering - 0.2% | | | |
| EMCOR Group, Inc. | | 29,486 | 2,019,791 |
| Quanta Services, Inc. | | 74,001 | 2,957,820 |
| | | | 4,977,611 |
| Electrical Equipment - 0.3% | | | |
| Acuity Brands, Inc. | | 21,312 | 2,112,019 |
| nVent Electric PLC | | 84,009 | 1,525,603 |
| Regal Beloit Corp. | | 21,784 | 2,003,474 |
| | | | 5,641,096 |
| Machinery - 1.7% | | | |
| AGCO Corp. | | 33,408 | 2,192,567 |
| Allison Transmission Holdings, Inc. | | 60,846 | 2,273,207 |
| Crane Co. | | 26,494 | 1,498,766 |
| Cummins, Inc. | | 79,312 | 15,327,837 |
| Middleby Corp. (a) | | 29,881 | 2,481,916 |
| Oshkosh Corp. | | 36,596 | 2,880,837 |
| Snap-On, Inc. | | 29,221 | 4,262,467 |
| Timken Co. | | 36,321 | 1,658,417 |
| Westinghouse Air Brake Co. | | 97,187 | 6,044,060 |
| | | | 38,620,074 |
| Marine - 0.1% | | | |
| Kirby Corp. (a) | | 32,277 | 1,492,488 |
| Professional Services - 0.2% | | | |
| Manpower, Inc. | | 31,209 | 2,146,867 |
| Nielsen Holdings PLC | | 191,647 | 2,765,466 |
| | | | 4,912,333 |
| Road & Rail - 0.1% | | | |
| Knight-Swift Transportation Holdings, Inc. Class A (b) | | 65,735 | 2,858,815 |
| Trading Companies & Distributors - 0.5% | | | |
| AerCap Holdings NV (a) | | 69,695 | 1,876,886 |
| Air Lease Corp. Class A | | 56,819 | 1,489,794 |
| HD Supply Holdings, Inc. (a) | | 87,086 | 3,056,719 |
| United Rentals, Inc. (a) | | 38,735 | 6,018,257 |
| | | | 12,441,656 |
|
| TOTAL INDUSTRIALS | | | 136,483,265 |
|
| INFORMATION TECHNOLOGY - 17.2% | | | |
| Communications Equipment - 0.2% | | | |
| Juniper Networks, Inc. | | 178,140 | 4,521,193 |
| Electronic Equipment & Components - 1.1% | | | |
| Arrow Electronics, Inc. (a) | | 42,293 | 3,029,025 |
| Flextronics International Ltd. (a) | | 270,953 | 3,113,250 |
| Jabil, Inc. | | 73,735 | 2,570,402 |
| SYNNEX Corp. | | 22,139 | 2,761,619 |
| TE Connectivity Ltd. | | 150,968 | 13,446,720 |
| | | | 24,921,016 |
| IT Services - 4.3% | | | |
| Amdocs Ltd. | | 71,771 | 4,456,979 |
| CACI International, Inc. Class A (a) | | 13,487 | 2,802,868 |
| Cognizant Technology Solutions Corp. Class A | | 290,623 | 19,855,363 |
| DXC Technology Co. | | 136,421 | 2,443,300 |
| IBM Corp. | | 477,343 | 58,684,548 |
| KBR, Inc. | | 76,501 | 1,701,382 |
| Perspecta, Inc. | | 73,382 | 1,570,375 |
| Science Applications International Corp. | | 26,559 | 2,124,189 |
| The Western Union Co. | | 220,908 | 5,363,646 |
| | | | 99,002,650 |
| Semiconductors & Semiconductor Equipment - 4.4% | | | |
| Intel Corp. | | 1,466,943 | 70,017,189 |
| Micron Technology, Inc. (a) | | 597,927 | 29,929,236 |
| | | | 99,946,425 |
| Software - 2.8% | | | |
| j2 Global, Inc. (a) | | 24,369 | 1,382,210 |
| LogMeIn, Inc. | | 26,220 | 2,249,938 |
| Microsoft Corp. | | 254,396 | 52,153,724 |
| SS&C Technologies Holdings, Inc. | | 120,023 | 6,901,323 |
| Verint Systems, Inc. (a) | | 34,475 | 1,547,583 |
| | | | 64,234,778 |
| Technology Hardware, Storage & Peripherals - 4.4% | | | |
| Apple, Inc. | | 128,498 | 54,616,790 |
| Dell Technologies, Inc. (a) | | 83,173 | 4,976,241 |
| Hewlett Packard Enterprise Co. | | 690,703 | 6,817,239 |
| HP, Inc. | | 768,765 | 13,514,889 |
| NetApp, Inc. | | 118,908 | 5,267,624 |
| Seagate Technology LLC | | 121,409 | 5,490,115 |
| Western Digital Corp. | | 161,123 | 6,944,401 |
| Xerox Holdings Corp. | | 98,450 | 1,639,193 |
| | | | 99,266,492 |
|
| TOTAL INFORMATION TECHNOLOGY | | | 391,892,554 |
|
| MATERIALS - 4.6% | | | |
| Chemicals - 3.4% | | | |
| Celanese Corp. Class A | | 63,562 | 6,178,226 |
| CF Industries Holdings, Inc. | | 114,940 | 3,601,070 |
| Corteva, Inc. | | 402,334 | 11,490,659 |
| Dow, Inc. | | 398,227 | 16,351,201 |
| DuPont de Nemours, Inc. | | 394,500 | 21,097,860 |
| Eastman Chemical Co. | | 73,059 | 5,452,393 |
| Huntsman Corp. | | 105,520 | 1,952,120 |
| LyondellBasell Industries NV Class A | | 138,142 | 8,636,638 |
| The Mosaic Co. | | 187,465 | 2,525,154 |
| | | | 77,285,321 |
| Containers & Packaging - 0.6% | | | |
| Berry Global Group, Inc. (a) | | 71,180 | 3,558,288 |
| International Paper Co. | | 211,304 | 7,351,266 |
| WestRock Co. | | 139,379 | 3,743,720 |
| | | | 14,653,274 |
| Metals & Mining - 0.6% | | | |
| Nucor Corp. | | 161,894 | 6,791,453 |
| Reliance Steel & Aluminum Co. | | 34,214 | 3,361,868 |
| Steel Dynamics, Inc. | | 113,077 | 3,099,441 |
| | | | 13,252,762 |
|
| TOTAL MATERIALS | | | 105,191,357 |
|
| UTILITIES - 1.3% | | | |
| Electric Utilities - 1.1% | | | |
| Exelon Corp. | | 523,856 | 20,226,080 |
| NRG Energy, Inc. | | 131,225 | 4,436,717 |
| | | | 24,662,797 |
| Independent Power and Renewable Electricity Producers - 0.2% | | | |
| Vistra Corp. | | 241,653 | 4,509,245 |
|
| TOTAL UTILITIES | | | 29,172,042 |
|
| TOTAL COMMON STOCKS | | | |
| (Cost $2,373,745,114) | | | 2,273,544,478 |
| | | Principal Amount | Value |
|
| U.S. Treasury Obligations - 0.0% | | | |
| U.S. Treasury Bills, yield at date of purchase 0.13% 11/5/20 (c) | | | |
| (Cost $119,957) | | 120,000 | 119,970 |
| | | Shares | Value |
|
| Money Market Funds - 1.4% | | | |
| Fidelity Cash Central Fund 0.14% (d) | | 8,344,069 | $8,346,573 |
| Fidelity Securities Lending Cash Central Fund 0.13% (d)(e) | | 22,680,861 | 22,683,129 |
| TOTAL MONEY MARKET FUNDS | | | |
| (Cost $31,029,535) | | | 31,029,702 |
| TOTAL INVESTMENT IN SECURITIES - 101.0% | | | |
| (Cost $2,404,894,606) | | | 2,304,694,150 |
| NET OTHER ASSETS (LIABILITIES) - (1.0)% | | | (22,393,231) |
| NET ASSETS - 100% | | | $2,282,300,919 |
| Futures Contracts | | | | | |
| | Number of contracts | Expiration Date | Notional Amount | Value | Unrealized Appreciation/(Depreciation) |
| Purchased | | | | | |
| Equity Index Contracts | | | | | |
| CME E-mini S&P 500 Index Contracts (United States) | 54 | Sept. 2020 | $8,811,450 | $475,596 | $475,596 |
The notional amount of futures purchased as a percentage of Net Assets is 0.4%
Legend
(a) Non-income producing
(b) Security or a portion of the security is on loan at period end.
(c) Security or a portion of the security was pledged to cover margin requirements for futures contracts. At period end, the value of securities pledged amounted to $119,970.
(d) Affiliated fund that is generally available only to investment companies and other accounts managed by Fidelity Investments. The rate quoted is the annualized seven-day yield of the fund at period end. A complete unaudited listing of the fund's holdings as of its most recent quarter end is available upon request. In addition, each Fidelity Central Fund's financial statements, which are not covered by the Fund's Report of Independent Registered Public Accounting Firm, are available on the SEC's website or upon request.
(e) Investment made with cash collateral received from securities on loan.
Affiliated Central Funds
Information regarding fiscal year to date income earned by the Fund from investments in Fidelity Central Funds is as follows:
| Fund | Income earned |
| Fidelity Cash Central Fund | $72,693 |
| Fidelity Securities Lending Cash Central Fund | 118,558 |
| Total | $191,251 |
Amounts in the income column in the above table include any capital gain distributions from underlying funds, which are presented in the corresponding line-item in the Statement of Operations, if applicable. Amount for Fidelity Securities Lending Cash Central Fund represents the income earned on investing cash collateral, less rebates paid to borrowers and any lending agent fees associated with the loan, plus any premium payments received for lending certain types of securities.
Investment Valuation
The following is a summary of the inputs used, as of July 31, 2020, involving the Fund's assets and liabilities carried at fair value. The inputs or methodology used for valuing securities may not be an indication of the risk associated with investing in those securities. For more information on valuation inputs, and their aggregation into the levels used below, please refer to the Investment Valuation section in the accompanying Notes to Financial Statements.
| | Valuation Inputs at Reporting Date: |
| Description | Total | Level 1 | Level 2 | Level 3 |
| Investments in Securities: | | | | |
| Equities: | | | | |
| Communication Services | $310,465,816 | $310,465,816 | $-- | $-- |
| Consumer Discretionary | 146,004,538 | 146,004,538 | -- | -- |
| Consumer Staples | 108,377,690 | 108,377,690 | -- | -- |
| Energy | 270,570,216 | 270,570,216 | -- | -- |
| Financials | 459,690,116 | 459,690,116 | -- | -- |
| Health Care | 315,696,884 | 315,696,884 | -- | -- |
| Industrials | 136,483,265 | 136,483,265 | -- | -- |
| Information Technology | 391,892,554 | 391,892,554 | -- | -- |
| Materials | 105,191,357 | 105,191,357 | -- | -- |
| Utilities | 29,172,042 | 29,172,042 | -- | -- |
| U.S. Government and Government Agency Obligations | 119,970 | -- | 119,970 | -- |
| Money Market Funds | 31,029,702 | 31,029,702 | -- | -- |
| Total Investments in Securities: | $2,304,694,150 | $2,304,574,180 | $119,970 | $-- |
| Derivative Instruments: | | | | |
| Assets | | | | |
| Futures Contracts | $475,596 | $475,596 | $-- | $-- |
| Total Assets | $475,596 | $475,596 | $-- | $-- |
| Total Derivative Instruments: | $475,596 | $475,596 | $-- | $-- |
Value of Derivative Instruments
The following table is a summary of the Fund's value of derivative instruments by primary risk exposure as of July 31, 2020. For additional information on derivative instruments, please refer to the Derivative Instruments section in the accompanying Notes to Financial Statements.
| Primary Risk Exposure / Derivative Type | Value |
| | Asset | Liability |
| Equity Risk | | |
| Futures Contracts(a) | $475,596 | $0 |
| Total Equity Risk | 475,596 | 0 |
| Total Value of Derivatives | $475,596 | $0 |
(a) Reflects gross cumulative appreciation (depreciation) on futures contracts as presented in the Schedule of Investments. In the Statement of Assets and Liabilities, the period end daily variation margin is included in receivable or payable for daily variation margin on futures contracts, and the net cumulative appreciation (depreciation) is included in Total accumulated earnings (loss).
See accompanying notes which are an integral part of the financial statements.
Financial Statements
Statement of Assets and Liabilities
| | | July 31, 2020 |
| Assets | | |
Investment in securities, at value (including securities loaned of $22,192,021) — See accompanying schedule:
Unaffiliated issuers (cost $2,373,865,071) | $2,273,664,448 | |
| Fidelity Central Funds (cost $31,029,535) | 31,029,702 | |
| Total Investment in Securities (cost $2,404,894,606) | | $2,304,694,150 |
| Segregated cash with brokers for derivative instruments | | 421,236 |
| Receivable for fund shares sold | | 1,449,146 |
| Dividends receivable | | 5,675,665 |
| Distributions receivable from Fidelity Central Funds | | 4,140 |
| Receivable for daily variation margin on futures contracts | | 33,188 |
| Prepaid expenses | | 472 |
| Total assets | | 2,312,277,997 |
| Liabilities | | |
| Payable for investments purchased | $5,901,636 | |
| Payable for fund shares redeemed | 1,146,600 | |
| Accrued management fee | 190,460 | |
| Other payables and accrued expenses | 55,624 | |
| Collateral on securities loaned | 22,682,758 | |
| Total liabilities | | 29,977,078 |
| Net Assets | | $2,282,300,919 |
| Net Assets consist of: | | |
| Paid in capital | | $2,492,885,455 |
| Total accumulated earnings (loss) | | (210,584,536) |
| Net Assets | | $2,282,300,919 |
| Net Asset Value, offering price and redemption price per share ($2,282,300,919 ÷ 258,877,939 shares) | | $8.82 |
See accompanying notes which are an integral part of the financial statements.
Statement of Operations
| | | Year ended July 31, 2020 |
| Investment Income | | |
| Dividends | | $63,558,839 |
| Interest | | 3,519 |
| Income from Fidelity Central Funds (including $118,558 from security lending) | | 191,251 |
| Total income | | 63,753,609 |
| Expenses | | |
| Management fee | $1,977,060 | |
| Custodian fees and expenses | 36,986 | |
| Independent trustees' fees and expenses | 6,734 | |
| Registration fees | 38,106 | |
| Audit | 53,430 | |
| Legal | 3,076 | |
| Interest | 4,601 | |
| Miscellaneous | 11,240 | |
| Total expenses | | 2,131,233 |
| Net investment income (loss) | | 61,622,376 |
| Realized and Unrealized Gain (Loss) | | |
| Net realized gain (loss) on: | | |
| Investment securities: | | |
| Unaffiliated issuers | (88,530,938) | |
| Fidelity Central Funds | 1,201 | |
| Futures contracts | (595,121) | |
| Total net realized gain (loss) | | (89,124,858) |
| Change in net unrealized appreciation (depreciation) on: | | |
| Investment securities: | | |
| Unaffiliated issuers | (108,478,746) | |
| Fidelity Central Funds | 167 | |
| Futures contracts | 398,493 | |
| Total change in net unrealized appreciation (depreciation) | | (108,080,086) |
| Net gain (loss) | | (197,204,944) |
| Net increase (decrease) in net assets resulting from operations | | $(135,582,568) |
See accompanying notes which are an integral part of the financial statements.
Statement of Changes in Net Assets
| | Year ended July 31, 2020 | Year ended July 31, 2019 |
| Increase (Decrease) in Net Assets | | |
| Operations | | |
| Net investment income (loss) | $61,622,376 | $50,403,392 |
| Net realized gain (loss) | (89,124,858) | (17,902,029) |
| Change in net unrealized appreciation (depreciation) | (108,080,086) | (294,908) |
| Net increase (decrease) in net assets resulting from operations | (135,582,568) | 32,206,455 |
| Distributions to shareholders | (47,902,133) | (66,034,772) |
| Share transactions | | |
| Proceeds from sales of shares | 1,249,352,947 | 812,292,938 |
| Reinvestment of distributions | 31,571,367 | 26,777,127 |
| Cost of shares redeemed | (603,278,266) | (975,258,724) |
| Net increase (decrease) in net assets resulting from share transactions | 677,646,048 | (136,188,659) |
| Total increase (decrease) in net assets | 494,161,347 | (170,016,976) |
| Net Assets | | |
| Beginning of period | 1,788,139,572 | 1,958,156,548 |
| End of period | $2,282,300,919 | $1,788,139,572 |
| Other Information | | |
| Shares | | |
| Sold | 144,603,376 | 86,804,375 |
| Issued in reinvestment of distributions | 3,017,446 | 2,944,380 |
| Redeemed | (66,443,904) | (100,973,131) |
| Net increase (decrease) | 81,176,918 | (11,224,376) |
See accompanying notes which are an integral part of the financial statements.
Financial Highlights
Fidelity SAI U.S. Value Index Fund
| | | | |
| Years ended July 31, | 2020 | 2019 | 2018 A |
| Selected Per–Share Data | | | |
| Net asset value, beginning of period | $10.06 | $10.36 | $10.00 |
| Income from Investment Operations | | | |
| Net investment income (loss)B | .29 | .25 | .14 |
| Net realized and unrealized gain (loss) | (1.27) | (.22) | .23 |
| Total from investment operations | (.98) | .03 | .37 |
| Distributions from net investment income | (.26) | (.19) | (.01) |
| Distributions from net realized gain | – | (.14) | – |
| Total distributions | (.26) | (.33) | (.01) |
| Net asset value, end of period | $8.82 | $10.06 | $10.36 |
| Total ReturnC,D | (10.13)% | .62% | 3.67% |
| Ratios to Average Net AssetsE,F | | | |
| Expenses before reductions | .11% | .21% | .28%G |
| Expenses net of fee waivers, if any | .11% | .15% | .15%G |
| Expenses net of all reductions | .11% | .15% | .15%G |
| Net investment income (loss) | 3.12% | 2.61% | 2.20%G |
| Supplemental Data | | | |
| Net assets, end of period (000 omitted) | $2,282,301 | $1,788,140 | $1,958,157 |
| Portfolio turnover rateH | 82% | 99% | 113%G |
A For the period December 19, 2017 (commencement of operations) to July 31, 2018.
B Calculated based on average shares outstanding during the period.
C Total returns for periods of less than one year are not annualized.
D Total returns would have been lower if certain expenses had not been reduced during the applicable periods shown.
E Fees and expenses of any underlying mutual funds or exchange-traded funds (ETFs) are not included in the Fund's expense ratio. The Fund indirectly bears its proportionate share of these expenses. For additional expense information related to investments in Fidelity Central Funds, please refer to the "Investments in Fidelity Central Funds" note found in the Notes to Financial Statements section of the most recent Annual or Semi-Annual report.
F Expense ratios reflect operating expenses of the Fund. Expenses before reductions do not reflect amounts reimbursed by the investment adviser or reductions from expense offset arrangements and do not represent the amount paid by the Fund during periods when reimbursements or reductions occur. Expense ratios before reductions for start-up periods may not be representative of longer term operating periods. Expenses net of fee waivers reflect expenses after reimbursement by the investment adviser but prior to reductions from expense offset arrangements. Expenses net of all reductions represent the net expenses paid by the Fund.
G Annualized
H Amount does not include the portfolio activity of any underlying Fidelity Central Funds.
See accompanying notes which are an integral part of the financial statements.
Notes to Financial Statements
For the period ended July 31, 2020
1. Organization.
Fidelity SAI U.S. Value Index Fund (the Fund) is a fund of Fidelity Salem Street Trust (the Trust) and is authorized to issue an unlimited number of shares. Shares are offered exclusively to certain clients of Fidelity Management & Research Company LLC (FMR) or its affiliates. The Trust is registered under the Investment Company Act of 1940, as amended (the 1940 Act), as an open-end management investment company organized as a Massachusetts business trust.
Effective January 1, 2020:
Investment advisers Fidelity Investments Money Management, Inc., FMR Co., Inc., and Fidelity SelectCo, LLC, merged with and into Fidelity Management & Research Company. In connection with the merger transactions, the resulting, merged investment adviser was then redomiciled from Massachusetts to Delaware, changed its corporate structure from a corporation to a limited liability company, and changed its name to "Fidelity Management & Research Company LLC".
2. Investments in Fidelity Central Funds.
The Fund invests in Fidelity Central Funds, which are open-end investment companies generally available only to other investment companies and accounts managed by the investment adviser and its affiliates. The Fund's Schedule of Investments lists each of the Fidelity Central Funds held as of period end, if any, as an investment of the Fund, but does not include the underlying holdings of each Fidelity Central Fund. As an Investing Fund, the Fund indirectly bears its proportionate share of the expenses of the underlying Fidelity Central Funds.
The Money Market Central Funds seek preservation of capital and current income and are managed by the investment adviser. Annualized expenses of the Money Market Central Funds as of their most recent shareholder report date ranged from less than .005% to .01%.
A complete unaudited list of holdings for each Fidelity Central Fund is available upon request or at the Securities and Exchange Commission (the SEC) website at www.sec.gov. In addition, the financial statements of the Fidelity Central Funds, which are not covered by the Fund's Report of Independent Registered Public Accounting Firm, are available on the SEC website or upon request.
3. Significant Accounting Policies.
The Fund is an investment company and applies the accounting and reporting guidance of the Financial Accounting Standards Board (FASB) Accounting Standards Codification Topic 946 Financial Services – Investment Companies. The financial statements have been prepared in conformity with accounting principles generally accepted in the United States of America (GAAP), which require management to make certain estimates and assumptions at the date of the financial statements. Actual results could differ from those estimates. Subsequent events, if any, through the date that the financial statements were issued have been evaluated in the preparation of the financial statements. The following summarizes the significant accounting policies of the Fund:
Investment Valuation. Investments are valued as of 4:00 p.m. Eastern time on the last calendar day of the period. The Board of Trustees (the Board) has delegated the day to day responsibility for the valuation of the Fund's investments to the Fair Value Committee (the Committee) established by the Fund's investment adviser. In accordance with valuation policies and procedures approved by the Board, the Fund attempts to obtain prices from one or more third party pricing vendors or brokers to value its investments. When current market prices, quotations or currency exchange rates are not readily available or reliable, investments will be fair valued in good faith by the Committee, in accordance with procedures adopted by the Board. Factors used in determining fair value vary by investment type and may include market or investment specific events, changes in interest rates and credit quality. The frequency with which these procedures are used cannot be predicted and they may be utilized to a significant extent. The Committee oversees the Fund's valuation policies and procedures and reports to the Board on the Committee's activities and fair value determinations. The Board monitors the appropriateness of the procedures used in valuing the Fund's investments and ratifies the fair value determinations of the Committee.
The Fund categorizes the inputs to valuation techniques used to value its investments into a disclosure hierarchy consisting of three levels as shown below:
- Level 1 – quoted prices in active markets for identical investments
- Level 2 – other significant observable inputs (including quoted prices for similar investments, interest rates, prepayment speeds, etc.)
- Level 3 – unobservable inputs (including the Fund's own assumptions based on the best information available)
Valuation techniques used to value the Fund's investments by major category are as follows:
Equity securities, including restricted securities, for which market quotations are readily available, are valued at the last reported sale price or official closing price as reported by a third party pricing vendor on the primary market or exchange on which they are traded and are categorized as Level 1 in the hierarchy. In the event there were no sales during the day or closing prices are not available, securities are valued at the last quoted bid price or may be valued using the last available price and are generally categorized as Level 2 in the hierarchy. For foreign equity securities, when market or security specific events arise, comparisons to the valuation of American Depositary Receipts (ADRs), futures contracts, Exchange-Traded Funds (ETFs) and certain indexes as well as quoted prices for similar securities may be used and would be categorized as Level 2 in the hierarchy. For equity securities, including restricted securities, where observable inputs are limited, assumptions about market activity and risk are used and these securities may be categorized as Level 3 in the hierarchy.
Debt securities, including restricted securities, are valued based on evaluated prices received from third party pricing vendors or from brokers who make markets in such securities. U.S. government and government agency obligations are valued by pricing vendors who utilize matrix pricing which considers yield or price of bonds of comparable quality, coupon, maturity and type or by broker-supplied prices. When independent prices are unavailable or unreliable, debt securities may be valued utilizing pricing methodologies which consider similar factors that would be used by third party pricing vendors. Debt securities are generally categorized as Level 2 in the hierarchy but may be Level 3 depending on the circumstances.
Futures contracts are valued at the settlement price established each day by the board of trade or exchange on which they are traded and are categorized as Level 1 in the hierarchy. Investments in open-end mutual funds, including the Fidelity Central Funds, are valued at their closing net asset value (NAV) each business day and are categorized as Level 1 in the hierarchy.
Changes in valuation techniques may result in transfers in or out of an assigned level within the disclosure hierarchy. The aggregate value of investments by input level as of July 31, 2020 is included at the end of the Fund's Schedule of Investments.
Investment Transactions and Income. For financial reporting purposes, the Fund's investment holdings and NAV include trades executed through the end of the last business day of the period. The NAV per share for processing shareholder transactions is calculated as of the close of business of the New York Stock Exchange (NYSE), normally 4:00 p.m. Eastern time and includes trades executed through the end of the prior business day. Gains and losses on securities sold are determined on the basis of identified cost. Dividend income is recorded on the ex-dividend date, except for certain dividends from foreign securities where the ex-dividend date may have passed, which are recorded as soon as the Fund is informed of the ex-dividend date. Non-cash dividends included in dividend income, if any, are recorded at the fair market value of the securities received. Income and capital gain distributions from Fidelity Central Funds, if any, are recorded on the ex-dividend date. Certain distributions received by the Fund represent a return of capital or capital gain. The Fund determines the components of these distributions subsequent to the ex-dividend date, based upon receipt of tax filings or other correspondence relating to the underlying investment. These distributions are recorded as a reduction of cost of investments and/or as a realized gain. Interest income is accrued as earned and includes coupon interest and amortization of premium and accretion of discount on debt securities as applicable.
Expenses. Expenses directly attributable to a fund are charged to that fund. Expenses attributable to more than one fund are allocated among the respective funds on the basis of relative net assets or other appropriate methods. Expense estimates are accrued in the period to which they relate and adjustments are made when actual amounts are known.
Income Tax Information and Distributions to Shareholders. Each year, the Fund intends to qualify as a regulated investment company under Subchapter M of the Internal Revenue Code, including distributing substantially all of its taxable income and realized gains. As a result, no provision for U.S. Federal income taxes is required. As of July 31, 2020, the Fund did not have any unrecognized tax benefits in the financial statements; nor is the Fund aware of any tax positions for which it is reasonably possible that the total amounts of unrecognized tax benefits will significantly change in the next twelve months. The Fund files a U.S. federal tax return, in addition to state and local tax returns as required. The Fund's federal income tax returns are subject to examination by the Internal Revenue Service (IRS) for a period of three fiscal years after they are filed. State and local tax returns may be subject to examination for an additional fiscal year depending on the jurisdiction.
Distributions are declared and recorded on the ex-dividend date. Income and capital gain distributions are determined in accordance with income tax regulations, which may differ from GAAP. In addition, the Fund claimed a portion of the payment made to redeeming shareholders as a distribution for income tax purposes.
Capital accounts within the financial statements are adjusted for permanent book-tax differences. These adjustments have no impact on net assets or the results of operations. Capital accounts are not adjusted for temporary book-tax differences which will reverse in a subsequent period.
Book-tax differences are primarily due to futures contracts, capital loss carryforwards and losses deferred due to wash sales and excise tax regulations.
As of period end, the cost and unrealized appreciation (depreciation) in securities, and derivatives if applicable, for federal income tax purposes were as follows:
| Gross unrealized appreciation | $168,258,920 |
| Gross unrealized depreciation | (388,035,660) |
| Net unrealized appreciation (depreciation) | $(219,776,740) |
| Tax Cost | $2,524,470,890 |
The tax-based components of distributable earnings as of period end were as follows:
| Undistributed ordinary income | $33,648,741 |
| Capital loss carryforward | $(24,456,537) |
| Net unrealized appreciation (depreciation) on securities and other investments | $(219,776,740) |
Capital loss carryforwards are only available to offset future capital gains of the Fund to the extent provided by regulations and may be limited. The capital loss carryforward information presented below, including any applicable limitation, is estimated as of fiscal period end and is subject to adjustment.
| No expiration | |
| Long-term | $(24,456,537) |
The tax character of distributions paid was as follows:
| | July 31, 2020 | July 31, 2019 |
| Ordinary Income | $47,902,133 | $ 66,034,772 |
4. Derivative Instruments.
Risk Exposures and the Use of Derivative Instruments. The Fund's investment objective allows the Fund to enter into various types of derivative contracts, including futures contracts. Derivatives are investments whose value is primarily derived from underlying assets, indices or reference rates and may be transacted on an exchange or over-the-counter (OTC). Derivatives may involve a future commitment to buy or sell a specified asset based on specified terms, to exchange future cash flows at periodic intervals based on a notional principal amount, or for one party to make one or more payments upon the occurrence of specified events in exchange for periodic payments from the other party.
The Fund used derivatives to increase returns and to manage exposure to certain risks as defined below. The success of any strategy involving derivatives depends on analysis of numerous economic factors, and if the strategies for investment do not work as intended, the Fund may not achieve its objectives.
The Fund's use of derivatives increased or decreased its exposure to the following risk:
| Equity Risk | Equity risk relates to the fluctuations in the value of financial instruments as a result of changes in market prices (other than those arising from interest rate risk or foreign exchange risk), whether caused by factors specific to an individual investment, its issuer, or all factors affecting all instruments traded in a market or market segment.
|
The Fund is also exposed to additional risks from investing in derivatives, such as liquidity risk and counterparty credit risk. Liquidity risk is the risk that the Fund will be unable to close out the derivative in the open market in a timely manner. Counterparty credit risk is the risk that the counterparty will not be able to fulfill its obligation to the Fund. Counterparty credit risk related to exchange-traded futures contracts may be mitigated by the protection provided by the exchange on which they trade.
Investing in derivatives may involve greater risks than investing in the underlying assets directly and, to varying degrees, may involve risk of loss in excess of any initial investment and collateral received and amounts recognized in the Statement of Assets and Liabilities. In addition, there may be the risk that the change in value of the derivative contract does not correspond to the change in value of the underlying instrument.
Futures Contracts. A futures contract is an agreement between two parties to buy or sell a specified underlying instrument for a fixed price at a specified future date. The Fund used futures contracts to manage its exposure to the stock market.
Upon entering into a futures contract, a fund is required to deposit either cash or securities (initial margin) with a clearing broker in an amount equal to a certain percentage of the face value of the contract. Futures contracts are marked-to-market daily and subsequent daily payments (variation margin) are made or received by a fund depending on the daily fluctuations in the value of the futures contracts and are recorded as unrealized appreciation or (depreciation). This receivable and/or payable, if any, is included in daily variation margin on futures contracts in the Statement of Assets and Liabilities. Realized gain or (loss) is recorded upon the expiration or closing of a futures contract. The net realized gain (loss) and change in net unrealized appreciation (depreciation) on futures contracts during the period is presented in the Statement of Operations.
Any open futures contracts at period end are presented in the Schedule of Investments under the caption "Futures Contracts". The notional amount at value reflects each contract's exposure to the underlying instrument or index at period end and is representative of volume of activity during the period. Securities deposited to meet initial margin requirements are identified in the Schedule of Investments. Cash deposited to meet initial margin requirements is presented as segregated cash with brokers for derivative instruments in the Statement of Assets and Liabilities.
5. Purchases and Sales of Investments.
Purchases and sales of securities, other than short-term securities are noted in the table below.
| | Purchases ($) | Sales ($) |
| Fidelity SAI U.S. Value Index Fund | 2,318,168,526 | 1,625,717,652 |
6. Fees and Other Transactions with Affiliates.
Management Fee. Fidelity Management & Research Company LLC (the investment adviser) and its affiliates provide the Fund with investment management related services for which the Fund pays a monthly management fee that is based on an annual rate of .10% of the Fund's average net assets.
Sub-Adviser. Geode Capital Management, LLC (Geode), serves as sub-adviser for the Fund. Geode provides discretionary investment advisory services to the Fund and is paid by the investment adviser for providing these services.
Interfund Lending Program. Pursuant to an Exemptive Order issued by the SEC, the fund, along with other registered investment companies having management contracts with Fidelity Management & Research Company LLC (FMR), or other affiliated entities of FMR, may participate in an interfund lending program. This program provides an alternative credit facility allowing the fund to borrow from, or lend money to, other participating affiliated funds. At period end, there were no interfund loans outstanding. Activity in this program during the period for which loans were outstanding was as follows:
| | Borrower or Lender | Average Loan Balance | Weighted Average Interest Rate | Interest Expense |
| Fidelity SAI U.S. Value Index Fund | Borrower | $45,205,143 | .52% | $4,601 |
Interfund Trades. Funds may purchase from or sell securities to other Fidelity Funds under procedures adopted by the Board. The procedures have been designed to ensure these interfund trades are executed in accordance with Rule 17a-7 of the 1940 Act. Interfund trades are included within the respective purchases and sales amounts shown in the Purchases and Sales of Investments note.
7. Committed Line of Credit.
Certain Funds participate with other funds managed by the investment adviser or an affiliate in a $4.25 billion credit facility (the "line of credit") to be utilized for temporary or emergency purposes to fund shareholder redemptions or for other short-term liquidity purposes. The participating funds have agreed to pay commitment fees on their pro-rata portion of the line of credit, which are reflected in Miscellaneous expenses on the Statement of Operations, and are as follows:
| | Amount |
| Fidelity SAI U.S. Value Index Fund | $4,717 |
During the period, there were no borrowings on this line of credit.
8. Security Lending.
The Fund lends portfolio securities from time to time in order to earn additional income. Lending agents are used, including National Financial Services (NFS), an affiliate of the Fund. Pursuant to a securities lending agreement, NFS will receive a fee, which is capped at 9.9% of daily lending revenue, for its services as lending agent. The Fund may lend securities to certain qualified borrowers, including NFS. On the settlement date of the loan, the Fund receives collateral (in the form of U.S. Treasury obligations, letters of credit and/or cash) against the loaned securities and maintains collateral in an amount not less than 100% of the market value of the loaned securities during the period of the loan. The market value of the loaned securities is determined at the close of business of the Fund and any additional required collateral is delivered to the Fund on the next business day. The Fund or borrower may terminate the loan at any time, and if the borrower defaults on its obligation to return the securities loaned because of insolvency or other reasons, the Fund may apply collateral received from the borrower against the obligation. The Fund may experience delays and costs in recovering the securities loaned. Any cash collateral received is invested in the Fidelity Securities Lending Cash Central Fund. The value of loaned securities and cash collateral at period end are disclosed on the Fund's Statement of Assets and Liabilities. At period end, there were no security loans outstanding with NFS, as affiliated borrower. Total fees paid by the Fund to NFS, as lending agent, amounted to $9,350. Security lending income represents the income earned on investing cash collateral, less rebates paid to borrowers and any lending agent fees associated with the loan, plus any premium payments received for lending certain types of securities. Net income from the Fidelity Securities Lending Cash Central Fund during the period is presented in the Statement of Operations as a component of income from Fidelity Central Funds (and includes $24 from securities loaned to NFS, as affiliated borrower).
9. Other.
The Fund's organizational documents provide former and current trustees and officers with a limited indemnification against liabilities arising in connection with the performance of their duties to the Fund. In the normal course of business, the Fund may also enter into contracts that provide general indemnifications. The Fund's maximum exposure under these arrangements is unknown as this would be dependent on future claims that may be made against the Fund. The risk of material loss from such claims is considered remote.
At the end of the period, Strategic Advisers Fidelity U.S. Total Stock Fund was the owner of record of approximately 54% of the total outstanding shares of the Fund.
10. Coronavirus (COVID-19) Pandemic.
An outbreak of COVID-19 first detected in China during December 2019 has since spread globally and was declared a pandemic by the World Health Organization during March 2020. Developments that disrupt global economies and financial markets, such as the COVID-19 pandemic, may magnify factors that affect the Fund's performance.
Report of Independent Registered Public Accounting Firm
To the Board of Trustees of Fidelity Salem Street Trust and Shareholders of Fidelity SAI U.S. Value Index Fund
Opinion on the Financial Statements
We have audited the accompanying statement of assets and liabilities, including the schedule of investments, of Fidelity SAI U.S. Value Index Fund (one of the funds constituting Fidelity Salem Street Trust, referred to hereafter as the “Fund”) as of July 31, 2020, the related statement of operations for the year ended July 31, 2020, the statement of changes in net assets for each of the two years in the period ended July 31, 2020, including the related notes, and the financial highlights for each of the two years in the period ended July 31, 2020 and for the period December 19, 2017 (commencement of operations) through July 31, 2018 (collectively referred to as the “financial statements”). In our opinion, the financial statements present fairly, in all material respects, the financial position of the Fund as of July 31, 2020, the results of its operations for the year then ended, the changes in its net assets for each of the two years in the period ended July 31, 2020 and the financial highlights for each of the two years in the period ended July 31, 2020 and for the period December 19, 2017 (commencement of operations) through July 31, 2018 in conformity with accounting principles generally accepted in the United States of America.
Basis for Opinion
These financial statements are the responsibility of the Fund’s management. Our responsibility is to express an opinion on the Fund’s financial statements based on our audits. We are a public accounting firm registered with the Public Company Accounting Oversight Board (United States) (PCAOB) and are required to be independent with respect to the Fund in accordance with the U.S. federal securities laws and the applicable rules and regulations of the Securities and Exchange Commission and the PCAOB.
We conducted our audits of these financial statements in accordance with the standards of the PCAOB. Those standards require that we plan and perform the audit to obtain reasonable assurance about whether the financial statements are free of material misstatement, whether due to error or fraud.
Our audits included performing procedures to assess the risks of material misstatement of the financial statements, whether due to error or fraud, and performing procedures that respond to those risks. Such procedures included examining, on a test basis, evidence regarding the amounts and disclosures in the financial statements. Our audits also included evaluating the accounting principles used and significant estimates made by management, as well as evaluating the overall presentation of the financial statements. Our procedures included confirmation of securities owned as of July 31, 2020 by correspondence with the custodian and brokers; when replies were not received from brokers, we performed other auditing procedures. We believe that our audits provide a reasonable basis for our opinion.
/s/ PricewaterhouseCoopers LLP
Boston, Massachusetts
September 14, 2020
We have served as the auditor of one or more investment companies in the Fidelity group of funds since 1932.
Trustees and Officers
The Trustees, Members of the Advisory Board (if any), and officers of the trust and fund, as applicable, are listed below. The Board of Trustees governs the fund and is responsible for protecting the interests of shareholders. The Trustees are experienced executives who meet periodically throughout the year to oversee the fund's activities, review contractual arrangements with companies that provide services to the fund, oversee management of the risks associated with such activities and contractual arrangements, and review the fund's performance. Except for Jonathan Chiel, each of the Trustees oversees 280 funds. Mr. Chiel oversees 174 funds.
The Trustees hold office without limit in time except that (a) any Trustee may resign; (b) any Trustee may be removed by written instrument, signed by at least two-thirds of the number of Trustees prior to such removal; (c) any Trustee who requests to be retired or who has become incapacitated by illness or injury may be retired by written instrument signed by a majority of the other Trustees; and (d) any Trustee may be removed at any special meeting of shareholders by a two-thirds vote of the outstanding voting securities of the trust. Each Trustee who is not an interested person (as defined in the 1940 Act) of the trust and the fund is referred to herein as an Independent Trustee. Each Independent Trustee shall retire not later than the last day of the calendar year in which his or her 75th birthday occurs. The Independent Trustees may waive this mandatory retirement age policy with respect to individual Trustees. Officers and Advisory Board Members hold office without limit in time, except that any officer or Advisory Board Member may resign or may be removed by a vote of a majority of the Trustees at any regular meeting or any special meeting of the Trustees. Except as indicated, each individual has held the office shown or other offices in the same company for the past five years.
The fund’s Statement of Additional Information (SAI) includes more information about the Trustees. To request a free copy, call Fidelity at 1-800-544-3455.
Experience, Skills, Attributes, and Qualifications of the Trustees. The Governance and Nominating Committee has adopted a statement of policy that describes the experience, qualifications, attributes, and skills that are necessary and desirable for potential Independent Trustee candidates (Statement of Policy). The Board believes that each Trustee satisfied at the time he or she was initially elected or appointed a Trustee, and continues to satisfy, the standards contemplated by the Statement of Policy. The Governance and Nominating Committee also engages professional search firms to help identify potential Independent Trustee candidates who have the experience, qualifications, attributes, and skills consistent with the Statement of Policy. From time to time, additional criteria based on the composition and skills of the current Independent Trustees, as well as experience or skills that may be appropriate in light of future changes to board composition, business conditions, and regulatory or other developments, have also been considered by the professional search firms and the Governance and Nominating Committee. In addition, the Board takes into account the Trustees' commitment and participation in Board and committee meetings, as well as their leadership of standing and ad hoc committees throughout their tenure.
In determining that a particular Trustee was and continues to be qualified to serve as a Trustee, the Board has considered a variety of criteria, none of which, in isolation, was controlling. The Board believes that, collectively, the Trustees have balanced and diverse experience, qualifications, attributes, and skills, which allow the Board to operate effectively in governing the fund and protecting the interests of shareholders. Information about the specific experience, skills, attributes, and qualifications of each Trustee, which in each case led to the Board's conclusion that the Trustee should serve (or continue to serve) as a trustee of the fund, is provided below.
Board Structure and Oversight Function. Abigail P. Johnson is an interested person and currently serves as Chairman. The Trustees have determined that an interested Chairman is appropriate and benefits shareholders because an interested Chairman has a personal and professional stake in the quality and continuity of services provided to the fund. Independent Trustees exercise their informed business judgment to appoint an individual of their choosing to serve as Chairman, regardless of whether the Trustee happens to be independent or a member of management. The Independent Trustees have determined that they can act independently and effectively without having an Independent Trustee serve as Chairman and that a key structural component for assuring that they are in a position to do so is for the Independent Trustees to constitute a substantial majority for the Board. The Independent Trustees also regularly meet in executive session. Arthur E. Johnson serves as Chairman of the Independent Trustees and as such (i) acts as a liaison between the Independent Trustees and management with respect to matters important to the Independent Trustees and (ii) with management prepares agendas for Board meetings.
Fidelity® funds are overseen by different Boards of Trustees. The fund's Board oversees Fidelity's investment-grade bond, money market, asset allocation and certain equity funds, and other Boards oversee Fidelity's high income and other equity funds. The asset allocation funds may invest in Fidelity® funds that are overseen by such other Boards. The use of separate Boards, each with its own committee structure, allows the Trustees of each group of Fidelity® funds to focus on the unique issues of the funds they oversee, including common research, investment, and operational issues. On occasion, the separate Boards establish joint committees to address issues of overlapping consequences for the Fidelity® funds overseen by each Board.
The Trustees operate using a system of committees to facilitate the timely and efficient consideration of all matters of importance to the Trustees, the fund, and fund shareholders and to facilitate compliance with legal and regulatory requirements and oversight of the fund's activities and associated risks. The Board, acting through its committees, has charged FMR and its affiliates with (i) identifying events or circumstances the occurrence of which could have demonstrably adverse effects on the fund's business and/or reputation; (ii) implementing processes and controls to lessen the possibility that such events or circumstances occur or to mitigate the effects of such events or circumstances if they do occur; and (iii) creating and maintaining a system designed to evaluate continuously business and market conditions in order to facilitate the identification and implementation processes described in (i) and (ii) above. Because the day-to-day operations and activities of the fund are carried out by or through FMR, its affiliates, and other service providers, the fund's exposure to risks is mitigated but not eliminated by the processes overseen by the Trustees. While each of the Board's committees has responsibility for overseeing different aspects of the fund's activities, oversight is exercised primarily through the Operations and Audit Committees. In addition, an ad hoc Board committee of Independent Trustees has worked with FMR to enhance the Board's oversight of investment and financial risks, legal and regulatory risks, technology risks, and operational risks, including the development of additional risk reporting to the Board. Appropriate personnel, including but not limited to the fund's Chief Compliance Officer (CCO), FMR's internal auditor, the independent accountants, the fund's Treasurer and portfolio management personnel, make periodic reports to the Board's committees, as appropriate, including an annual review of Fidelity's risk management program for the Fidelity® funds. The responsibilities of each standing committee, including their oversight responsibilities, are described further under "Standing Committees of the Trustees."
Interested Trustees*:
Correspondence intended for a Trustee who is an interested person may be sent to Fidelity Investments, 245 Summer Street, Boston, Massachusetts 02210.
Name, Year of Birth; Principal Occupations and Other Relevant Experience+
Jonathan Chiel (1957)
Year of Election or Appointment: 2016
Trustee
Mr. Chiel also serves as Trustee of other Fidelity® funds. Mr. Chiel is Executive Vice President and General Counsel for FMR LLC (diversified financial services company, 2012-present). Previously, Mr. Chiel served as general counsel (2004-2012) and senior vice president and deputy general counsel (2000-2004) for John Hancock Financial Services; a partner with Choate, Hall & Stewart (1996-2000) (law firm); and an Assistant United States Attorney for the United States Attorney’s Office of the District of Massachusetts (1986-95), including Chief of the Criminal Division (1993-1995). Mr. Chiel is a director on the boards of the Boston Bar Foundation and the Maimonides School.
Abigail P. Johnson (1961)
Year of Election or Appointment: 2009
Trustee
Chairman of the Board of Trustees
Ms. Johnson also serves as Trustee of other Fidelity® funds. Ms. Johnson serves as Chairman (2016-present), Chief Executive Officer (2014-present), and Director (2007-present) of FMR LLC (diversified financial services company), President of Fidelity Financial Services (2012-present) and President of Personal, Workplace and Institutional Services (2005-present). Ms. Johnson is Chairman and Director of Fidelity Management & Research Company LLC (investment adviser firm, 2011-present). Previously, Ms. Johnson served as Chairman and Director of FMR Co., Inc. (investment adviser firm, 2011-2019), Vice Chairman (2007-2016) and President (2013-2016) of FMR LLC, President and a Director of Fidelity Management & Research Company (2001-2005), a Trustee of other investment companies advised by Fidelity Management & Research Company, Fidelity Investments Money Management, Inc. (investment adviser firm), and FMR Co., Inc. (2001-2005), Senior Vice President of the Fidelity® funds (2001-2005), and managed a number of Fidelity® funds. Ms. Abigail P. Johnson and Mr. Arthur E. Johnson are not related.
Jennifer Toolin McAuliffe (1959)
Year of Election or Appointment: 2016
Trustee
Ms. McAuliffe also serves as Trustee of other Fidelity® funds. Previously, Ms. McAuliffe served as Co-Head of Fixed Income of Fidelity Investments Limited (now known as FIL Limited (FIL)) (diversified financial services company), Director of Research for FIL’s credit and quantitative teams in London, Hong Kong and Tokyo and Director of Research for taxable and municipal bonds at Fidelity Investments Money Management, Inc. Ms. McAuliffe previously served as a member of the Advisory Board of certain Fidelity® funds (2016). Ms. McAuliffe was previously a lawyer at Ropes & Gray LLP and currently serves as director or trustee of several not-for-profit entities.
* Determined to be an “Interested Trustee” by virtue of, among other things, his or her affiliation with the trust or various entities under common control with FMR.
+ The information includes the Trustee's principal occupation during the last five years and other information relating to the experience, attributes, and skills relevant to the Trustee's qualifications to serve as a Trustee, which led to the conclusion that the Trustee should serve as a Trustee for the fund.
Independent Trustees:
Correspondence intended for an Independent Trustee may be sent to Fidelity Investments, P.O. Box 55235, Boston, Massachusetts 02205-5235.
Name, Year of Birth; Principal Occupations and Other Relevant Experience+
Elizabeth S. Acton (1951)
Year of Election or Appointment: 2013
Trustee
Ms. Acton also serves as Trustee of other Fidelity® funds. Prior to her retirement, Ms. Acton served as Executive Vice President, Finance (2011-2012), Executive Vice President, Chief Financial Officer (2002-2011) and Treasurer (2004-2005) of Comerica Incorporated (financial services). Prior to joining Comerica, Ms. Acton held a variety of positions at Ford Motor Company (1983-2002), including Vice President and Treasurer (2000-2002) and Executive Vice President and Chief Financial Officer of Ford Motor Credit Company (1998-2000). Ms. Acton currently serves as a member of the Board and Audit and Finance Committees of Beazer Homes USA, Inc. (homebuilding, 2012-present). Ms. Acton previously served as a member of the Advisory Board of certain Fidelity® funds (2013-2016).
Ann E. Dunwoody (1953)
Year of Election or Appointment: 2018
Trustee
General Dunwoody also serves as Trustee of other Fidelity® funds. General Dunwoody (United States Army, Retired) was the first woman in U.S. military history to achieve the rank of four-star general and prior to her retirement in 2012 held a variety of positions within the U.S. Army, including Commanding General, U.S. Army Material Command (2008-2012). General Dunwoody currently serves as President of First to Four LLC (leadership and mentoring services, 2012-present), a member of the Board and Nomination and Corporate Governance Committees of Kforce Inc. (professional staffing services, 2016-present) and a member of the Board of Automattic Inc. (software engineering, 2018-present). Previously, General Dunwoody served as a member of the Advisory Board and Nominating and Corporate Governance Committee of L3 Technologies, Inc. (communication, electronic, sensor and aerospace systems, 2013-2019) and a member of the Board and Audit and Sustainability and Corporate Responsibility Committees of Republic Services, Inc. (waste collection, disposal and recycling, 2013-2016). Ms. Dunwoody also serves on several boards for non-profit organizations, including as a member of the Board, Chair of the Nomination and Governance Committee and a member of the Audit Committee of Logistics Management Institute (consulting non-profit, 2012-present), a member of the Council of Trustees for the Association of the United States Army (advocacy non-profit, 2013-present), a member of the Board of Florida Institute of Technology (2015-present) and a member of the Board of ThanksUSA (military family education non-profit, 2014-present). General Dunwoody previously served as a member of the Advisory Board of certain Fidelity® funds (2018).
John Engler (1948)
Year of Election or Appointment: 2014
Trustee
Mr. Engler also serves as Trustee of other Fidelity® funds. Previously, Mr. Engler served as Governor of Michigan (1991-2003), President of the Business Roundtable (2011-2017) and interim President of Michigan State University (2018-2019). Mr. Engler currently serves as a member of the Board of K12 Inc. (technology-based education company, 2012-present). Previously, Mr. Engler served as a member of the Board of Universal Forest Products (manufacturer and distributor of wood and wood-alternative products, 2003-2019) and Trustee of The Munder Funds (2003-2014). Mr. Engler previously served as a member of the Advisory Board of certain Fidelity® funds (2014-2016).
Robert F. Gartland (1951)
Year of Election or Appointment: 2010
Trustee
Mr. Gartland also serves as Trustee of other Fidelity® funds. Prior to his retirement, Mr. Gartland held a variety of positions at Morgan Stanley (financial services, 1979-2007), including Managing Director (1987-2007) and Chase Manhattan Bank (1975-1978). Mr. Gartland previously served as Chairman and an investor in Gartland & Mellina Group Corp. (consulting, 2009-2019), as a member of the Board of National Securities Clearing Corporation (1993-1996) and as Chairman of TradeWeb (2003-2004).
Arthur E. Johnson (1947)
Year of Election or Appointment: 2008
Trustee
Chairman of the Independent Trustees
Mr. Johnson also serves as Trustee of other Fidelity® funds. Prior to his retirement, Mr. Johnson served as Senior Vice President of Corporate Strategic Development of Lockheed Martin Corporation (defense contractor, 1999-2009). Mr. Johnson currently serves as a member of the Board of Booz Allen Hamilton (management consulting, 2011-present). Mr. Johnson previously served as a member of the Board of Eaton Corporation plc (diversified power management, 2009-2019) and a member of the Board of AGL Resources, Inc. (holding company, 2002-2016). Mr. Johnson previously served as Vice Chairman (2015-2018) of the Independent Trustees of certain Fidelity® funds. Mr. Arthur E. Johnson is not related to Ms. Abigail P. Johnson.
Michael E. Kenneally (1954)
Year of Election or Appointment: 2009
Trustee
Vice Chairman of the Independent Trustees
Mr. Kenneally also serves as Trustee of other Fidelity® funds. Prior to his retirement, Mr. Kenneally served as Chairman and Global Chief Executive Officer of Credit Suisse Asset Management and Executive Vice President and Chief Investment Officer of Bank of America Corporation. Earlier roles at Bank of America included Director of Research, Senior Portfolio Manager for various institutional equity accounts and mutual funds and Portfolio Manager for a number of institutional fixed-income clients. Mr. Kenneally began his career as a Research Analyst in 1983 and was awarded the Chartered Financial Analyst (CFA) designation in 1991.
Marie L. Knowles (1946)
Year of Election or Appointment: 2001
Trustee
Ms. Knowles also serves as Trustee of other Fidelity® funds. Prior to her retirement, Ms. Knowles held several positions at Atlantic Richfield Company (diversified energy), including Executive Vice President and Chief Financial Officer (1996-2000), Senior Vice President (1993-1996) and President of ARCO Transportation Company (pipeline and tanker operations, 1993-1996). Ms. Knowles currently serves as a member of the Board of McKesson Corporation (healthcare service, since 2002), a member of the Board of the Santa Catalina Island Company (real estate, 2009-present), a member of the Investment Company Institute Board of Governors and a member of the Governing Council of the Independent Directors Council (2014-present). Ms. Knowles also serves as a member of the Advisory Board for the School of Engineering of the University of Southern California. Ms. Knowles previously served as Chairman (2015-2018) and Vice Chairman (2012-2015) of the Independent Trustees of certain Fidelity® funds.
Mark A. Murray (1954)
Year of Election or Appointment: 2016
Trustee
Mr. Murray also serves as Trustee of other Fidelity® funds. Previously, Mr. Murray served as Co-Chief Executive Officer (2013-2016), President (2006-2013) and Vice Chairman (2013-2020) of Meijer, Inc. Mr. Murray serves as a member of the Board and Nuclear Review and Public Policy and Responsibility Committees of DTE Energy Company (diversified energy company, 2009-present) and a member of the Board and Audit Committee and Chairman of the Nominating and Corporate Governance Committee of Universal Forest Products, Inc. (manufacturer and distributor of wood and wood-alternative products, 2004-2016). Mr. Murray previously served as a member of the Board of Spectrum Health (not-for-profit health system, 2015-2019). Mr. Murray also serves as a member of the Board of many community and professional organizations. Mr. Murray previously served as a member of the Advisory Board of certain Fidelity® funds (2016).
+ The information includes the Trustee's principal occupation during the last five years and other information relating to the experience, attributes, and skills relevant to the Trustee's qualifications to serve as a Trustee, which led to the conclusion that the Trustee should serve as a Trustee for the fund.
Advisory Board Members and Officers:
Correspondence intended for an officer may be sent to Fidelity Investments, 245 Summer Street, Boston, Massachusetts 02210. Officers appear below in alphabetical order.
Name, Year of Birth; Principal Occupation
Elizabeth Paige Baumann (1968)
Year of Election or Appointment: 2017
Anti-Money Laundering (AML) Officer
Ms. Baumann also serves as AML Officer of other funds. She is Chief AML Officer (2012-present) and Senior Vice President (2014-present) of FMR LLC (diversified financial services company) and is an employee of Fidelity Investments. Previously, Ms. Baumann served as AML Officer of certain funds (2017-2019), as AML Officer of the funds (2012-2016), and Vice President (2007-2014) and Deputy Anti-Money Laundering Officer (2007-2012) of FMR LLC.
Craig S. Brown (1977)
Year of Election or Appointment: 2019
Assistant Treasurer
Mr. Brown also serves as Assistant Treasurer of other funds. Mr. Brown is an employee of Fidelity Investments (2013-present).
John J. Burke III (1964)
Year of Election or Appointment: 2018
Chief Financial Officer
Mr. Burke also serves as Chief Financial Officer of other funds. Mr. Burke serves as Head of Investment Operations for Fidelity Fund and Investment Operations (2018-present) and is an employee of Fidelity Investments (1998-present). Previously Mr. Burke served as head of Asset Management Investment Operations (2012-2018).
David J. Carter (1973)
Year of Election or Appointment: 2020
Assistant Secretary
Mr. Carter also serves as Assistant Secretary of other funds. Mr. Carter serves as Vice President, Associate General Counsel (2010-present) and is an employee of Fidelity Investments (2005-present).
Jonathan Davis (1968)
Year of Election or Appointment: 2010
Assistant Treasurer
Mr. Davis also serves as Assistant Treasurer of other funds. Mr. Davis serves as Assistant Treasurer of FMR Capital, Inc. (2017-present) and is an employee of Fidelity Investments. Previously, Mr. Davis served as Vice President and Associate General Counsel of FMR LLC (diversified financial services company, 2003-2010).
Laura M. Del Prato (1964)
Year of Election or Appointment: 2018
President and Treasurer
Ms. Del Prato also serves as an officer of other funds. Ms. Del Prato is an employee of Fidelity Investments (2017-present). Previously, Ms. Del Prato served as President and Treasurer of The North Carolina Capital Management Trust: Cash Portfolio and Term Portfolio (2018-2020). Prior to joining Fidelity Investments, Ms. Del Prato served as a Managing Director and Treasurer of the JPMorgan Mutual Funds (2014-2017). Prior to JPMorgan, Ms. Del Prato served as a partner at Cohen Fund Audit Services (accounting firm, 2012-2013) and KPMG LLP (accounting firm, 2004-2012).
Colm A. Hogan (1973)
Year of Election or Appointment: 2016
Assistant Treasurer
Mr. Hogan also serves as an officer of other funds. Mr. Hogan serves as Assistant Treasurer of FMR Capital, Inc. (2017-present) and is an employee of Fidelity Investments (2005-present). Previously, Mr. Hogan served as Deputy Treasurer of certain Fidelity® funds (2016-2020) and Assistant Treasurer of certain Fidelity® funds (2016-2018).
Cynthia Lo Bessette (1969)
Year of Election or Appointment: 2019
Secretary and Chief Legal Officer (CLO)
Ms. Lo Bessette also serves as an officer of other funds. Ms. Lo Bessette serves as CLO, Secretary, and Senior Vice President of Fidelity Management & Research Company LLC (investment adviser firm, 2019-present); and CLO of Fidelity Management & Research (Hong Kong) Limited, FMR Investment Management (UK) Limited, and Fidelity Management & Research (Japan) Limited (investment adviser firms, 2019-present). She is a Senior Vice President and Deputy General Counsel of FMR LLC (diversified financial services company, 2019-present), and is an employee of Fidelity Investments. Previously, Ms. Lo Bessette served as CLO, Secretary, and Senior Vice President of FMR Co., Inc. (investment adviser firm, 2019); Secretary of Fidelity SelectCo, LLC and Fidelity Investments Money Management, Inc. (investment adviser firms, 2019). Prior to joining Fidelity Investments, Ms. Lo Bessette was Executive Vice President, General Counsel (2016-2019) and Senior Vice President, Deputy General Counsel (2015-2016) of OppenheimerFunds (investment management company) and Deputy Chief Legal Officer (2013-2015) of Jennison Associates LLC (investment adviser firm).
Chris Maher (1972)
Year of Election or Appointment: 2013
Assistant Treasurer
Mr. Maher also serves as an officer of other funds. Mr. Maher serves as Assistant Treasurer of FMR Capital, Inc. (2017-present), and is an employee of Fidelity Investments (2008-present). Previously, Mr. Maher served as Assistant Treasurer of certain funds (2013-2020); Vice President of Asset Management Compliance (2013), Vice President of the Program Management Group of FMR (investment adviser firm, 2010-2013), and Vice President of Valuation Oversight (2008-2010).
Jamie Pagliocco (1964)
Year of Election or Appointment: 2020
Vice President
Mr. Pagliocco also serves as Vice President of other funds. Mr. Pagliocco serves as President of Fixed Income (2020-present), and is an employee of Fidelity Investments (2001-present). Previously, Mr. Pagliocco served as Co-Chief Investment Officer – Bond (2017-2020), Global Head of Bond Trading (2016-2019), and as a portfolio manager.
Kenneth B. Robins (1969)
Year of Election or Appointment: 2020
Chief Compliance Officer
Mr. Robins also serves as an officer of other funds. Mr. Robins serves as Compliance Officer of Fidelity Management & Research Company LLC (investment adviser firm, 2016-present) and is an employee of Fidelity Investments (2004-present). Previously, Mr. Robins served as Compliance Officer of FMR Co., Inc. (investment adviser firm, 2016-2019), as Executive Vice President of Fidelity Investments Money Management, Inc. (investment adviser firm, 2013-2016) and served in other fund officer roles.
Stacie M. Smith (1974)
Year of Election or Appointment: 2013
Assistant Treasurer
Ms. Smith also serves as an officer of other funds. Ms. Smith serves as Assistant Treasurer of FMR Capital, Inc. (2017-present), is an employee of Fidelity Investments (2009-present), and has served in other fund officer roles. Prior to joining Fidelity Investments, Ms. Smith served as Senior Audit Manager of Ernst & Young LLP (accounting firm, 1996-2009). Previously, Ms. Smith served as Assistant Treasurer (2013-2019) and Deputy Treasurer (2013-2016) of certain Fidelity® funds.
Marc L. Spector (1972)
Year of Election or Appointment: 2016
Deputy Treasurer
Mr. Spector also serves as an officer of other funds. Mr. Spector serves as Assistant Treasurer of FMR Capital, Inc. (2017-present) and is an employee of Fidelity Investments (2016-present). Prior to joining Fidelity Investments, Mr. Spector served as Director at the Siegfried Group (accounting firm, 2013-2016), and prior to Siegfried Group as audit senior manager at Deloitte & Touche LLP (accounting firm, 2005-2013).
Jim Wegmann (1979)
Year of Election or Appointment: 2019
Assistant Treasurer
Mr. Wegmann also serves as Assistant Treasurer of other funds. Mr. Wegmann is an employee of Fidelity Investments (2011-present).
Shareholder Expense Example
As a shareholder, you incur two types of costs: (1) transaction costs, which may include sales charges (loads) on purchase payments or redemption proceeds, as applicable and (2) ongoing costs, which generally include management fees, distribution and/or service (12b-1) fees and other Fund expenses. This Example is intended to help you understand your ongoing costs (in dollars) of investing in a fund and to compare these costs with the ongoing costs of investing in other mutual funds.
The Example is based on an investment of $1,000 invested at the beginning of the period and held for the entire period (February 1, 2020 to July 31, 2020).
Actual Expenses
The first line of the accompanying table provides information about actual account values and actual expenses. You may use the information in this line, together with the amount you invested, to estimate the expenses that you paid over the period. Simply divide your account value by $1,000.00 (for example, an $8,600 account value divided by $1,000.00 = 8.6), then multiply the result by the number in the first line for a class/Fund under the heading entitled "Expenses Paid During Period" to estimate the expenses you paid on your account during this period. If any fund is a shareholder of any underlying mutual funds or exchange-traded funds (ETFs) (the Underlying Funds), such fund indirectly bears its proportional share of the expenses of the Underlying Funds in addition to the direct expenses incurred presented in the table. These fees and expenses are not included in the annualized expense ratio used to calculate the expense estimate in the table below.
Hypothetical Example for Comparison Purposes
The second line of the accompanying table provides information about hypothetical account values and hypothetical expenses based on the actual expense ratio and an assumed rate of return of 5% per year before expenses, which is not the actual return. The hypothetical account values and expenses may not be used to estimate the actual ending account balance or expenses you paid for the period. You may use this information to compare the ongoing costs of investing in the Fund and other funds. To do so, compare this 5% hypothetical example with the 5% hypothetical examples that appear in the shareholder reports of the other funds. If any fund is a shareholder of any Underlying Funds, such fund indirectly bears its proportional share of the expenses of the Underlying Funds in addition to the direct expenses as presented in the table. These fees and expenses are not included in the annualized expense ratio used to calculate the expense estimate in the table below.
Please note that the expenses shown in the table are meant to highlight your ongoing costs only and do not reflect any transaction costs. Therefore, the second line of the table is useful in comparing ongoing costs only, and will not help you determine the relative total costs of owning different funds.
| | Annualized Expense Ratio-A | Beginning
Account Value
February 1, 2020 | Ending
Account Value
July 31, 2020 | Expenses Paid
During Period-B
February 1, 2020
to July 31, 2020 |
| Fidelity SAI U.S. Value Index Fund | .11% | | | |
| Actual | | $1,000.00 | $858.80 | $.51 |
| Hypothetical-C | | $1,000.00 | $1,024.32 | $.55 |
A Annualized expense ratio reflects expenses net of applicable fee waivers.
B Expenses are equal to the annualized expense ratio, multiplied by the average account value over the period, multiplied by 182/ 366 (to reflect the one-half year period). The fees and expenses of any Underlying Funds are not included in each annualized expense ratio.
C 5% return per year before expenses
Distributions (Unaudited)
The fund designates 100% and 92% of the dividends distributed in September and December, respectively, during the fiscal year as qualifying for the dividends–received deduction for corporate shareholders.
The fund designates 100% and 96% of the dividends distributed in September and December, respectively, during the fiscal year as amounts which may be taken into account as a dividend for the purposes of the maximum rate under section 1(h)(11) of the Internal Revenue Code.
The fund designates 1% and 2% of the dividends distributed in September and December, respectively, during the fiscal year as a section 199A dividend.
The fund will notify shareholders in January 2021 of amounts for use in preparing 2020 income tax returns.
Liquidity Risk Management Program
The Securities and Exchange Commission adopted Rule 22e-4 under the Investment Company Act of 1940 (the Liquidity Rule) to promote effective liquidity risk management throughout the open-end investment company industry, thereby reducing the risk that funds will be unable to meet their redemption obligations and mitigating dilution of the interests of fund shareholders.
The Fund has adopted and implemented a liquidity risk management program pursuant to the Liquidity Rule (the Program) effective December 1, 2018. The Program is reasonably designed to assess and manage the Fund’s liquidity risk and to comply with the requirements of the Liquidity Rule. The Fund’s Board of Trustees (the Board) has designated the Fund’s investment adviser as administrator of the Program. The Fidelity advisers have established a Liquidity Risk Management Committee (the LRM Committee) to manage the Program for each of the Fidelity Funds. The LRM Committee monitors the adequacy and effectiveness of implementation of the Program and on a periodic basis assesses each Fund’s liquidity risk based on a variety of factors including (1) the Fund’s investment strategy, (2) portfolio liquidity and cash flow projections during normal and reasonably foreseeable stressed conditions, (3) shareholder redemptions, (4) borrowings and other funding sources and (5) in the case of exchange-traded funds, certain additional factors including the effect of the Fund’s prices and spreads, market participants, and basket compositions on the overall liquidity of the Fund’s portfolio, as applicable.
In accordance with the Program, each of the Fund’s portfolio investments is classified into one of four liquidity categories described below based on a determination of a reasonable expectation for how long it would take to convert the investment to cash (or sell or dispose of the investment) without significantly changing its market value.
- Highly liquid investments – cash or convertible to cash within three business days or less
- Moderately liquid investments – convertible to cash in three to seven calendar days
- Less liquid investments – can be sold or disposed of, but not settled, within seven calendar days
- Illiquid investments – cannot be sold or disposed of within seven calendar days
Liquidity classification determinations take into account a variety of factors including various market, trading and investment-specific considerations, as well as market depth, and generally utilize analysis from a third-party liquidity metrics service.
The Liquidity Rule places a 15% limit on a fund’s illiquid investments and requires funds that do not primarily hold assets that are highly liquid investments to determine and maintain a minimum percentage of the fund’s net assets to be invested in highly liquid investments (highly liquid investment minimum or HLIM). The Program includes provisions reasonably designed to comply with the 15% limit on illiquid investments and for determining, periodically reviewing and complying with the HLIM requirement as applicable.
At a recent meeting of the Fund’s Board of Trustees, the LRM Committee provided a written report to the Board pertaining to the operation, adequacy, and effectiveness of implementation of the Program for the annual period from December 1, 2018 through November 30, 2019. The report concluded that the Program has been implemented and is operating effectively and is reasonably designed to assess and manage the Fund’s liquidity risk.
USV-ANN-0920
1.9885515.102
Item 2.
Code of Ethics
As of the end of the period, July 31, 2020, Fidelity Salem Street Trust (the trust) has adopted a code of ethics, as defined in Item 2 of Form N-CSR, that applies to its President and Treasurer and its Chief Financial Officer. A copy of the code of ethics is filed as an exhibit to this Form N-CSR.
Item 3.
Audit Committee Financial Expert
The Board of Trustees of the trust has determined that Elizabeth S. Acton is an audit committee financial expert, as defined in Item 3 of Form N-CSR. Ms. Acton is independent for purposes of Item 3 of Form N-CSR.
Item 4.
Principal Accountant Fees and Services
Fees and Services
The following table presents fees billed by Deloitte & Touche LLP, the member firms of Deloitte Touche Tohmatsu, and their respective affiliates (collectively, “Deloitte Entities”) in each of the last two fiscal years for services rendered to Fidelity Real Estate Index Fund, Fidelity SAI Real Estate Index Fund, Fidelity SAI Small-Mid Cap 500 Index Fund, Fidelity SAI U.S. Large Cap Index Fund, Fidelity SAI U.S. Momentum Index Fund and Fidelity SAI U.S. Quality Index Fund (the “Funds”):
Services Billed by Deloitte Entities
July 31, 2020 FeesA
| | | | |
| Audit Fees | Audit-Related Fees | Tax Fees | All Other Fees |
Fidelity Real Estate Index Fund | $35,500 | $- | $8,600 | $800 |
Fidelity SAI Real Estate Index Fund | $37,400 | $- | $8,100 | $800 |
Fidelity SAI Small-Mid Cap 500 Index Fund | $40,700 | $- | $7,400 | $900 |
Fidelity SAI U.S. Large Cap Index Fund | $38,600 | $- | $9,100 | $900 |
Fidelity SAI U.S. Momentum Index Fund | $40,200 | $- | $7,200 | $900 |
Fidelity SAI U.S. Quality Index Fund | $40,200 | $- | $7,400 | $900 |
| | | | |
| Audit Fees | Audit-Related Fees | Tax Fees | All Other Fees |
Fidelity Real Estate Index Fund | $38,000 | $100 | $6,000 | $1,200 |
Fidelity SAI Real Estate Index Fund | $40,000 | $100 | $5,700 | $1,200 |
Fidelity SAI Small-Mid Cap 500 Index Fund | $43,000 | $100 | $5,100 | $1,300 |
Fidelity SAI U.S. Large Cap Index Fund | $42,000 | $100 | $6,300 | $1,200 |
Fidelity SAI U.S. Momentum Index Fund | $43,000 | $100 | $4,800 | $1,200 |
Fidelity SAI U.S. Quality Index Fund | $43,000 | $100 | $5,100 | $1,200 |
A Amounts may reflect rounding.
The following table presents fees billed by PricewaterhouseCoopers LLP (“PwC”) in each of the last two fiscal years for services rendered to Fidelity SAI U.S. Value Index Fund (the “Fund(s)”):
Services Billed by PwC
July 31, 2020 FeesA
| | | | |
| Audit Fees | Audit-Related Fees | Tax Fees | All Other Fees |
Fidelity SAI U.S. Value Index Fund | $38,000 | $3,500 | $9,000 | $1,900 |
| | | | |
| Audit Fees | Audit-Related Fees | Tax Fees | All Other Fees |
Fidelity SAI U.S. Value Index Fund | $46,000 | $3,500 | $3,500 | $2,000 |
A Amounts may reflect rounding.
The following table(s) present(s) fees billed by Deloitte Entities and PwC that were required to be approved by the Audit Committee for services that relate directly to the operations and financial reporting of the Fund(s) and that are rendered on behalf of Fidelity Management & Research Company LLC ("FMR") and entities controlling, controlled by, or under common control with FMR (not including any sub-adviser whose role is primarily portfolio management and is subcontracted with or overseen by another
investment adviser) that provide ongoing services to the Fund(s) (“Fund Service Providers”):
Services Billed by Deloitte Entities
| | |
| July 31, 2020A | July 31, 2019A |
Audit-Related Fees | $- | $290,000 |
Tax Fees | $3,000 | $- |
All Other Fees | $- | $- |
A Amounts may reflect rounding.
Services Billed by PwC
| | |
| July 31, 2020A | July 31, 2019 A |
Audit-Related Fees | $9,030,200 | $7,890,000 |
Tax Fees | $20,800 | $10,000 |
All Other Fees | $- | $- |
A Amounts may reflect rounding.
“Audit-Related Fees” represent fees billed for assurance and related services that are reasonably related to the performance of the fund audit or the review of the fund's financial statements and that are not reported under Audit Fees.
“Tax Fees” represent fees billed for tax compliance, tax advice or tax planning that relate directly to the operations and financial reporting of the fund.
“All Other Fees” represent fees billed for services provided to the fund or Fund Service Provider, a significant portion of which are assurance related, that relate directly to the operations and financial reporting of the fund, excluding those services that are reported under Audit Fees, Audit-Related Fees or Tax Fees.
Assurance services must be performed by an independent public accountant.
* * *
The aggregate non-audit fees billed by Deloitte Entities and PwC for services rendered to the Fund(s), FMR (not including any sub-adviser whose role is primarily portfolio management and is subcontracted with or overseen by another investment adviser), and any Fund Service Provider for each of the last two fiscal years of the Fund(s) are as follows:
| | |
Billed By | July 31, 2020A | July 31, 2019A |
Deloitte Entities | $557,600 | $740,000 |
PwC | $14,313,000 | $12,380,000 |
A Amounts may reflect rounding.
The trust's Audit Committee has considered non-audit services that were not pre-approved that were provided by Deloitte Entities and PwC to Fund Service Providers to be compatible with maintaining the independence of Deloitte Entities and PwC in its(their) audit of the Fund(s), taking into account representations from Deloitte Entities and PwC, in accordance with Public Company Accounting Oversight Board rules, regarding its independence from the Fund(s) and its(their) related entities and FMR’s review of the appropriateness and permissibility under applicable law of such non-audit services prior to their provision to the Fund(s) Service Providers.
Audit Committee Pre-Approval Policies and Procedures
The trust’s Audit Committee must pre-approve all audit and non-audit services provided by a fund’s independent registered public accounting firm relating to the operations or financial reporting of the fund. Prior to the commencement of any audit or non-audit services to a fund, the Audit Committee reviews the services to determine whether they are appropriate and permissible under applicable law.
The Audit Committee has adopted policies and procedures to, among other purposes, provide a framework for the Committee’s consideration of non-audit services by the audit firms that audit the Fidelity funds. The policies and procedures require that any non-audit service provided by a fund audit firm to a Fidelity fund and any non-audit service provided by a fund auditor to a Fund Service Provider that relates directly to the operations and financial reporting of a Fidelity fund (“Covered Service”) are subject to approval by the Audit Committee before such service is provided.
All Covered Services must be approved in advance of provision of the service either: (i) by formal resolution of the Audit Committee, or (ii) by oral or written approval of the service by the Chair of the Audit Committee (or if the Chair is unavailable, such other member of the Audit Committee as may be designated by the Chair to act in the Chair’s absence). The approval contemplated by (ii) above is permitted where the Treasurer determines that action on such an engagement is necessary before the next meeting of the Audit Committee.
Non-audit services provided by a fund audit firm to a Fund Service Provider that do not relate directly to the operations and financial reporting of a Fidelity fund are reported to the Audit Committee periodically.
Non-Audit Services Approved Pursuant to Rule 2-01(c)(7)(i)(C) and (ii) of Regulation S-X (“De Minimis Exception”)
There were no non-audit services approved or required to be approved by the Audit Committee pursuant to the De Minimis Exception during the Fund’s(s’) last two fiscal years relating to services provided to (i) the Fund(s) or (ii) any Fund Service Provider that relate directly to the operations and financial reporting of the Fund(s).
Item 5.
Audit Committee of Listed Registrants
Not applicable.
Item 6.
Investments
(a)
Not applicable.
(b)
Not applicable.
Item 7.
Disclosure of Proxy Voting Policies and Procedures for Closed-End Management Investment Companies
Not applicable.
Item 8.
Portfolio Managers of Closed-End Management Investment Companies
Not applicable.
Item 9.
Purchase of Equity Securities by Closed-End Management Investment Company and Affiliated Purchasers
Not applicable.
Item 10.
Submission of Matters to a Vote of Security Holders
There were no material changes to the procedures by which shareholders may recommend nominees to the trust’s Board of Trustees.
Item 11.
Controls and Procedures
(a)(i) The President and Treasurer and the Chief Financial Officer have concluded that the trust’s disclosure controls and procedures (as defined in Rule 30a-3(c) under the Investment Company Act) provide reasonable assurances that material information relating to the trust is made known to them by the appropriate persons, based on their evaluation of these controls and procedures as of a date within 90 days of the filing date of this report.
(a)(ii) There was no change in the trust’s internal control over financial reporting (as defined in Rule 30a-3(d) under the Investment Company Act) that occurred during the
period covered by this report that has materially affected, or is reasonably likely to materially affect, the trust’s internal control over financial reporting.
Item 12.
Disclosure of Securities Lending Activities for Closed-End Management
Investment Companies
Not applicable.
Item 13.
Exhibits
SIGNATURES
Pursuant to the requirements of the Securities Exchange Act of 1934 and the Investment Company Act of 1940, the registrant has duly caused this report to be signed on its behalf by the undersigned, thereunto duly authorized.
Fidelity Salem Street Trust
| |
By: | /s/Laura M. Del Prato |
| Laura M. Del Prato |
| President and Treasurer |
|
|
Date: | September 21, 2020 |
Pursuant to the requirements of the Securities Exchange Act of 1934 and the Investment Company Act of 1940, this report has been signed below by the following persons on behalf of the registrant and in the capacities and on the dates indicated.
| |
By: | /s/Laura M. Del Prato |
| Laura M. Del Prato |
| President and Treasurer |
|
|
Date: | September 21, 2020 |
| |
By: | /s/John J. Burke III |
| John J. Burke III |
| Chief Financial Officer |
|
|
Date: | September 21, 2020 |