
33rd Annual J.P. Morgan Healthcare Conference January 2015
Forward-Looking Statements Certain of the statements made today and listed within the following presentation slides are forward-looking statements within the meaning of the Private Securities Litigation Reform Act of 1995. These forward-looking statements include, but are not limited to, all statements regarding the intent, belief or current expectations regarding the matters discussed in this presentation. Such forward-looking statements are based on management’s current expectations and involve known and unknown risks, uncertainties, contingencies and other factors that could cause results, performance or achievements to differ materially from those stated. The most significant of these risks and uncertainties are described in the Company’s Form 10-K, Form 10-Q and Form 8-K reports filed with the Securities and Exchange Commission. Investors are cautioned that such statements are only predictions and that actual events or results may differ materially. These forward-looking statements speak only as of the date this presentation was originally given. We undertake no obligation to update such forward-looking statements to reflect events or circumstances after today or to reflect the occurrence of unanticipated events. To facilitate comparisons and enhance understanding of core operating performance, certain financial measures have been adjusted from the comparable amount under Generally Accepted Accounting Principles (GAAP). A detailed reconciliation of adjusted numbers to the most comparable GAAP numbers is posted under “Supplemental Financial Data” in the Investors section of our website at http://ir.omnicare.com. Additionally, all amounts are presented on a continuing operations basis, unless otherwise stated. 2

Agenda Omnicare Background Long-Term Care Group Specialty Care Group 1 2 3 3 Financial Overview 5 Multi-Layered Growth Strategy 4
Omnicare Background
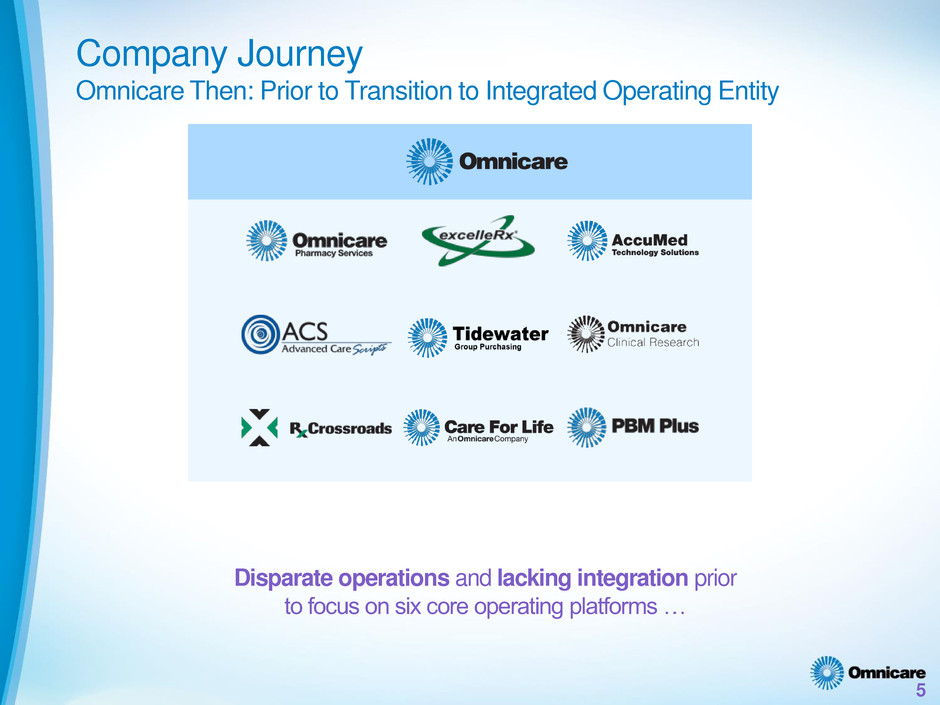
Company Journey Omnicare Then: Prior to Transition to Integrated Operating Entity 5 Disparate operations and lacking integration prior to focus on six core operating platforms …
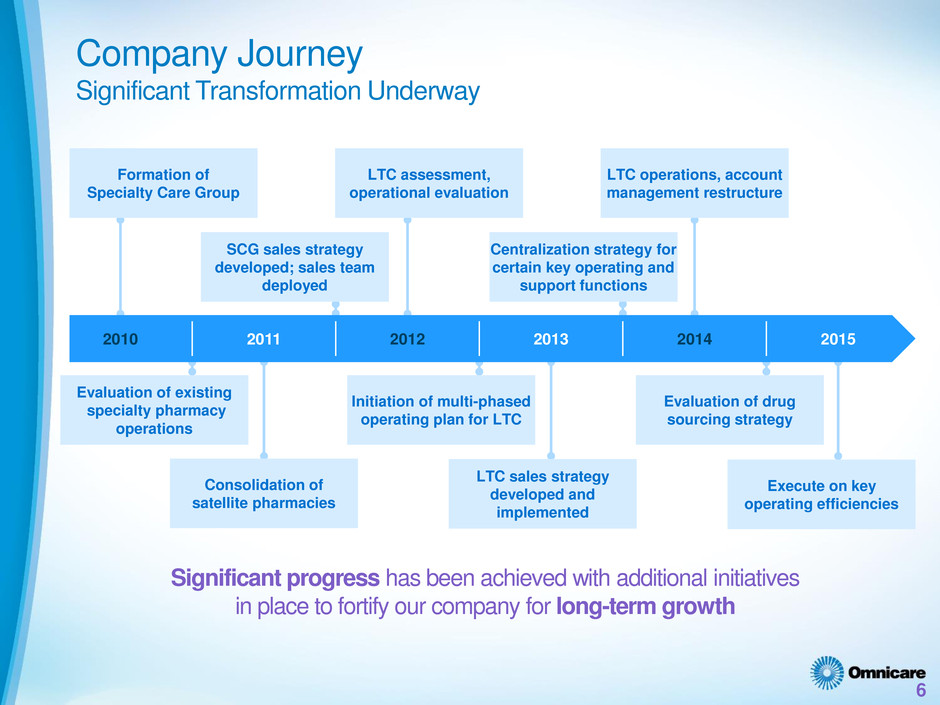
Company Journey Significant Transformation Underway 6 Significant progress has been achieved with additional initiatives in place to fortify our company for long-term growth 2010 2013 2014 2015 Formation of Specialty Care Group LTC assessment, operational evaluation Execute on key operating efficiencies LTC operations, account management restructure 2012 2011 Consolidation of satellite pharmacies LTC sales strategy developed and implemented Evaluation of existing specialty pharmacy operations Initiation of multi-phased operating plan for LTC Evaluation of drug sourcing strategy SCG sales strategy developed; sales team deployed Centralization strategy for certain key operating and support functions
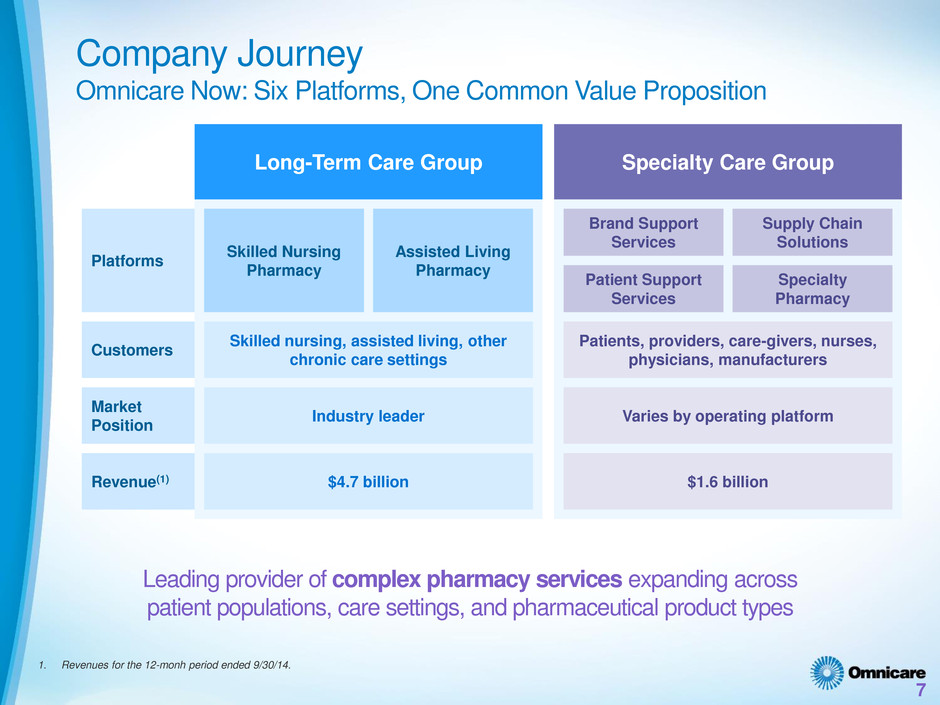
Platforms Customers Market Position Revenue(1) Company Journey Omnicare Now: Six Platforms, One Common Value Proposition Leading provider of complex pharmacy services expanding across patient populations, care settings, and pharmaceutical product types 1. Revenues for the 12-monh period ended 9/30/14. Skilled Nursing Pharmacy Assisted Living Pharmacy 7 Long-Term Care Group Specialty Care Group Brand Support Services Supply Chain Solutions Patient Support Services Specialty Pharmacy Skilled nursing, assisted living, other chronic care settings Industry leader $4.7 billion Patients, providers, care-givers, nurses, physicians, manufacturers Varies by operating platform $1.6 billion
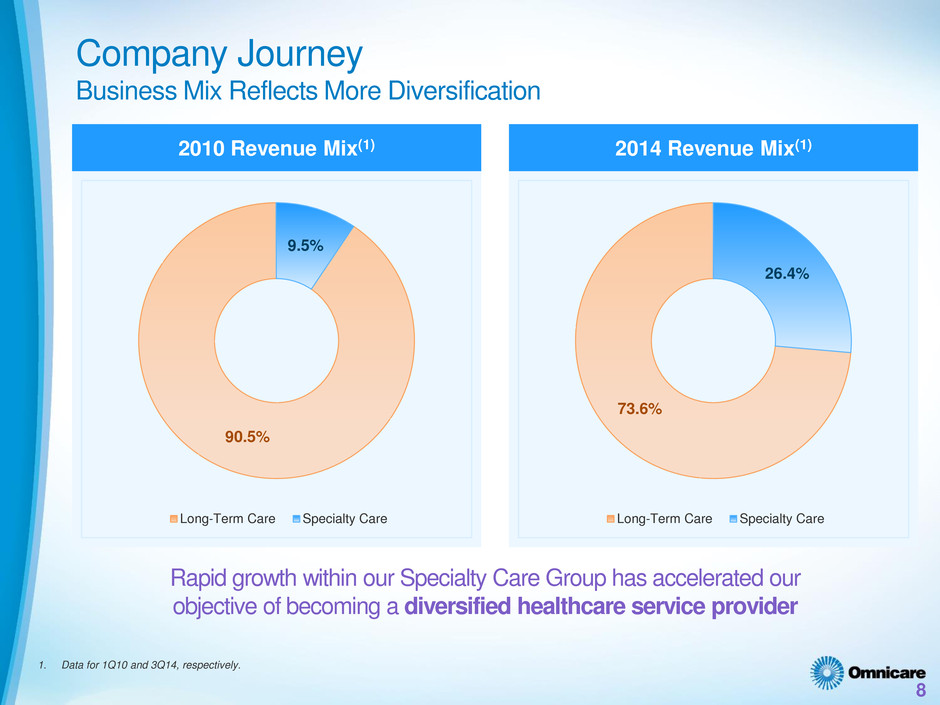
Company Journey Business Mix Reflects More Diversification 8 2010 Revenue Mix(1) 2014 Revenue Mix(1) Rapid growth within our Specialty Care Group has accelerated our objective of becoming a diversified healthcare service provider 90.5% 9.5% Long-Term Care Specialty Care 73.6% 26.4% Long-Term Care Specialty Care 1. Data for 1Q10 and 3Q14, respectively.
Long-Term Care Group
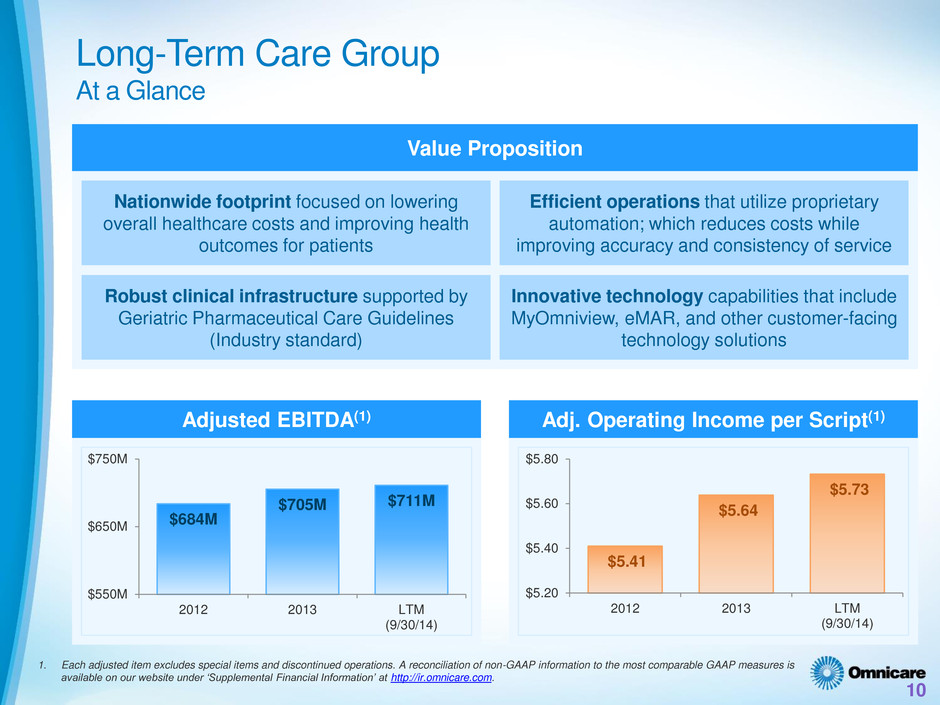
Long-Term Care Group At a Glance 10 $684M $705M $711M $550M $650M $750M 2012 2013 LTM (9/30/14) Adjusted EBITDA(1) Adj. Operating Income per Script(1) $5.41 $5.64 $5.73 $5.20 $5.40 $5.60 $5.80 2012 2013 LTM (9/30/14) Value Proposition Nationwide footprint focused on lowering overall healthcare costs and improving health outcomes for patients Efficient operations that utilize proprietary automation; which reduces costs while improving accuracy and consistency of service Robust clinical infrastructure supported by Geriatric Pharmaceutical Care Guidelines (Industry standard) Innovative technology capabilities that include MyOmniview, eMAR, and other customer-facing technology solutions 1. Each adjusted item excludes special items and discontinued operations. A reconciliation of non-GAAP information to the most comparable GAAP measures is available on our website under ‘Supplemental Financial Information’ at http://ir.omnicare.com.
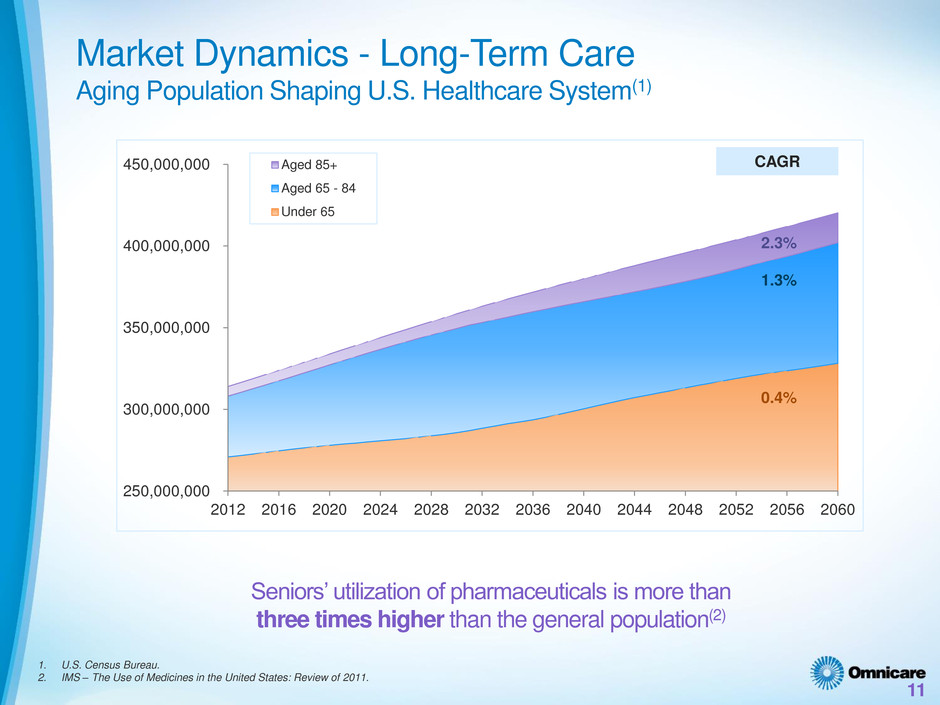
Seniors’ utilization of pharmaceuticals is more than three times higher than the general population(2) 11 250,000,000 300,000,000 350,000,000 400,000,000 450,000,000 2012 2016 2020 2024 2028 2032 2036 2040 2044 2048 2052 2056 2060 Aged 85+ Aged 65 - 84 Under 65 1. U.S. Census Bureau. 2. IMS – The Use of Medicines in the United States: Review of 2011. 2.3% CAGR 1.3% 0.4% Market Dynamics - Long-Term Care Aging Population Shaping U.S. Healthcare System(1)
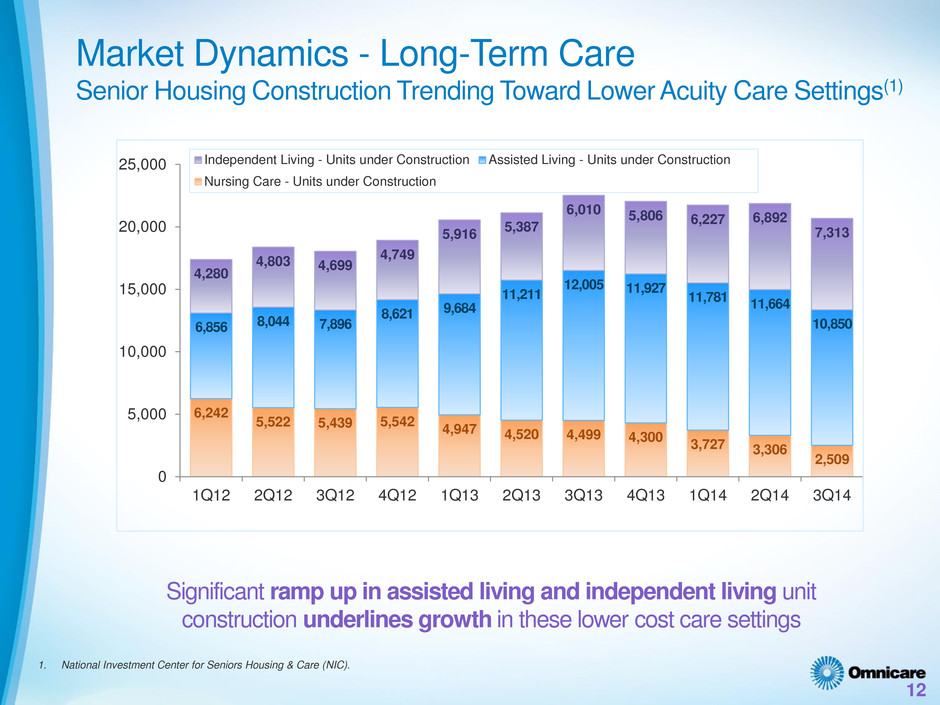
Significant ramp up in assisted living and independent living unit construction underlines growth in these lower cost care settings 12 6,242 5,522 5,439 5,542 4,947 4,520 4,499 4,300 3,727 3,306 2,509 6,856 8,044 7,896 8,621 9,684 11,211 12,005 11,927 11,781 11,664 10,850 4,280 4,803 4,699 4,749 5,916 5,387 6,010 5,806 6,227 6,892 7,313 0 5,000 10,000 15,000 20,000 25,000 1Q12 2Q12 3Q12 4Q12 1Q13 2Q13 3Q13 4Q13 1Q14 2Q14 3Q14 Independent Living - Units under Construction Assisted Living - Units under Construction Nursing Care - Units under Construction 1. National Investment Center for Seniors Housing & Care (NIC). Market Dynamics - Long-Term Care Senior Housing Construction Trending Toward Lower Acuity Care Settings(1)
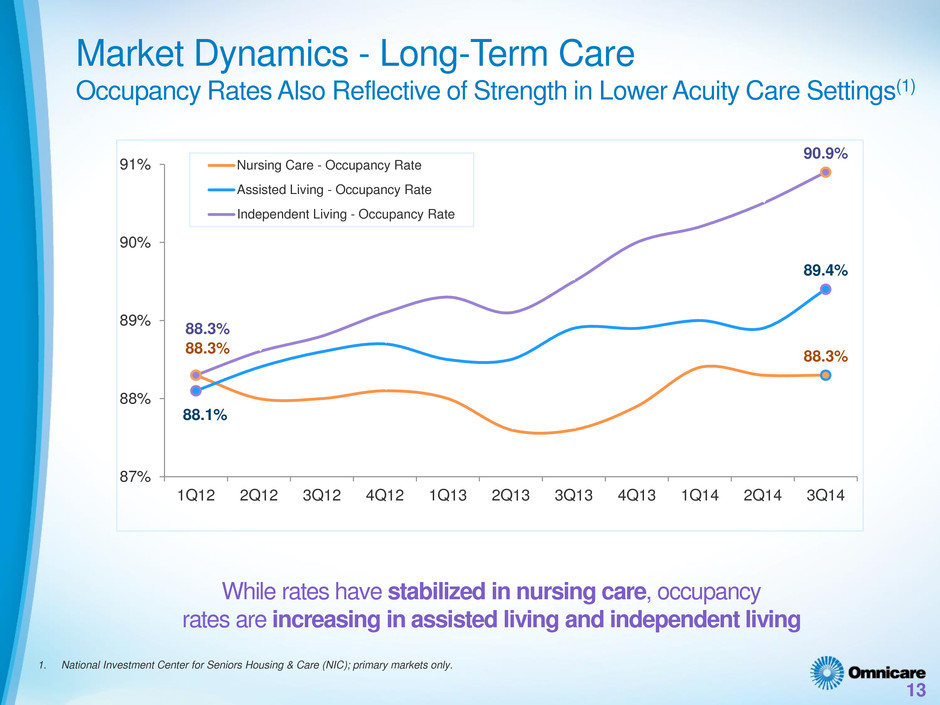
While rates have stabilized in nursing care, occupancy rates are increasing in assisted living and independent living 13 88.3% 88.3% 88.1% 89.4% 88.3% 90.9% 87% 88% 89% 90% 91% 1Q12 2Q12 3Q12 4Q12 1Q13 2Q13 3Q13 4Q13 1Q14 2Q14 3Q14 Nursing Care - Occupancy Rate Assisted Living - Occupancy Rate Independent Living - Occupancy Rate 1. National Investment Center for Seniors Housing & Care (NIC); primary markets only. Market Dynamics - Long-Term Care Occupancy Rates Also Reflective of Strength in Lower Acuity Care Settings(1)
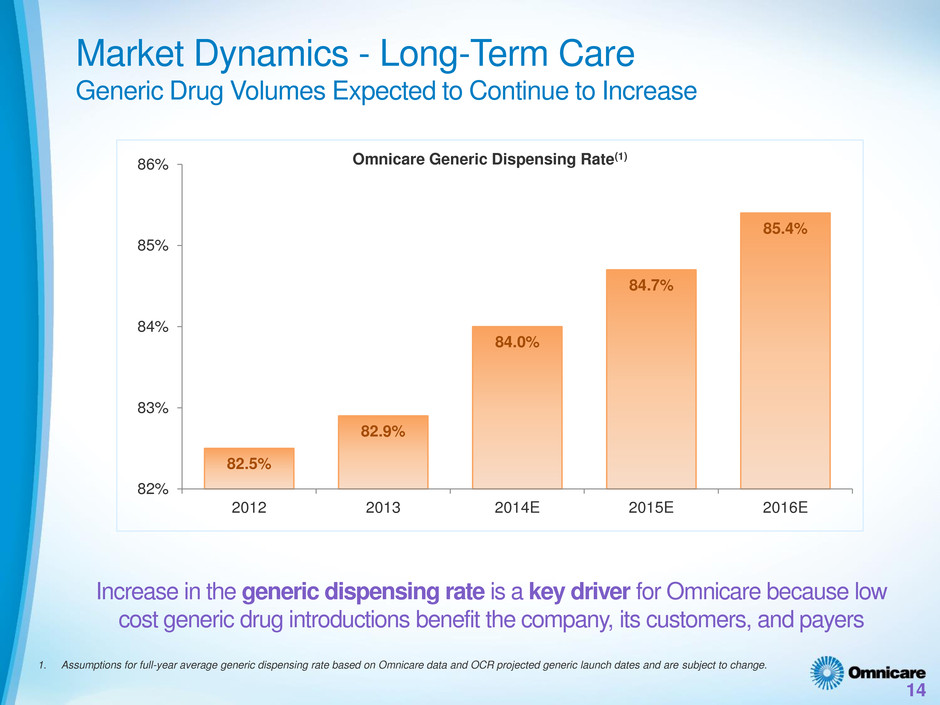
14 Market Dynamics - Long-Term Care Generic Drug Volumes Expected to Continue to Increase 82.5% 82.9% 84.0% 84.7% 85.4% 82% 83% 84% 85% 86% 2012 2013 2014E 2015E 2016E Omnicare Generic Dispensing Rate(1) 1. Assumptions for full-year average generic dispensing rate based on Omnicare data and OCR projected generic launch dates and are subject to change. Increase in the generic dispensing rate is a key driver for Omnicare because low cost generic drug introductions benefit the company, its customers, and payers
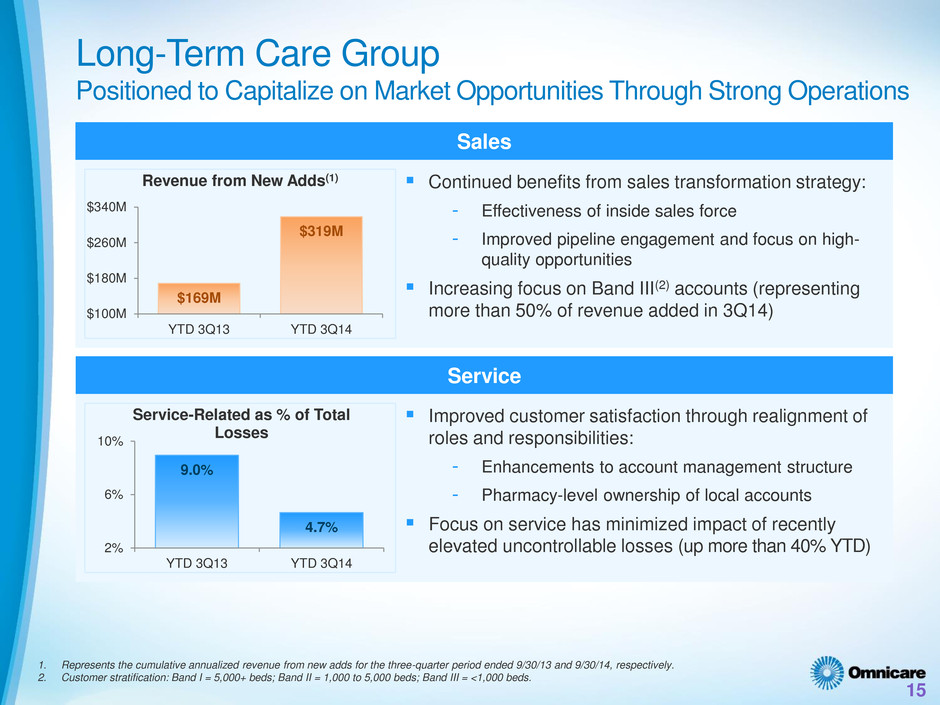
9.0% 4.7% 2% 6% 10% YTD 3Q13 YTD 3Q14 Service-Related as % of Total Losses 15 Long-Term Care Group Positioned to Capitalize on Market Opportunities Through Strong Operations Service Sales 1. Represents the cumulative annualized revenue from new adds for the three-quarter period ended 9/30/13 and 9/30/14, respectively. 2. Customer stratification: Band I = 5,000+ beds; Band II = 1,000 to 5,000 beds; Band III = <1,000 beds. $169M $319M $100M $180M $260M $340M YTD 3Q13 YTD 3Q14 Revenue from New Adds(1) Continued benefits from sales transformation strategy: - Effectiveness of inside sales force - Improved pipeline engagement and focus on high- quality opportunities Increasing focus on Band III(2) accounts (representing more than 50% of revenue added in 3Q14) Improved customer satisfaction through realignment of roles and responsibilities: - Enhancements to account management structure - Pharmacy-level ownership of local accounts Focus on service has minimized impact of recently elevated uncontrollable losses (up more than 40% YTD)
Specialty Care Group
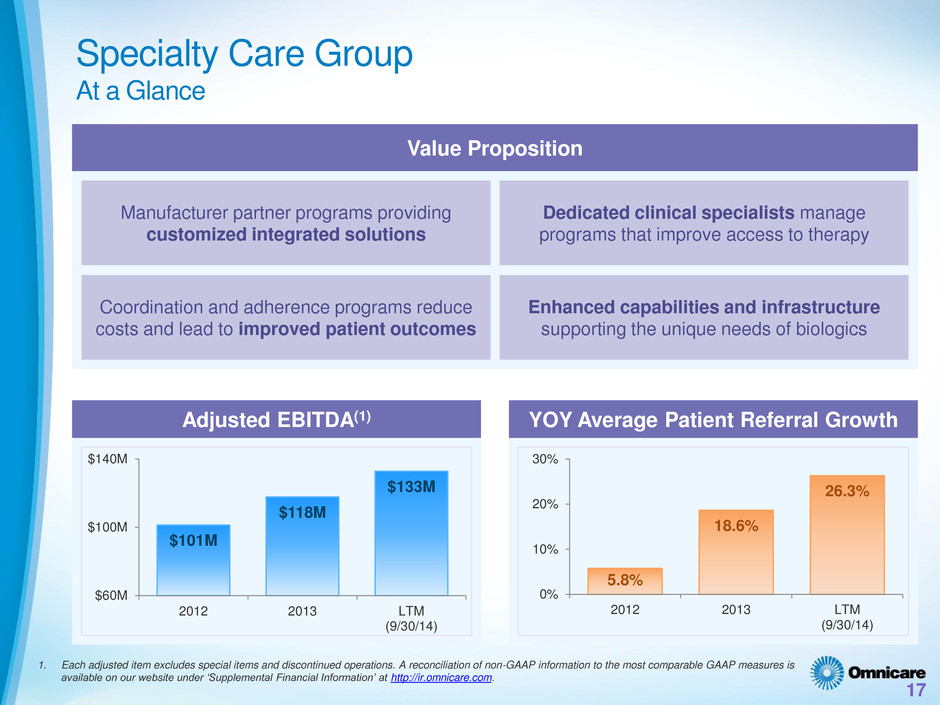
Specialty Care Group At a Glance 17 $101M $118M $133M $60M $100M $140M 2012 2013 LTM (9/30/14) Adjusted EBITDA(1) YOY Average Patient Referral Growth 5.8% 18.6% 26.3% 0% 10% 20% 30% 2012 2013 LTM (9/30/14) Value Proposition Manufacturer partner programs providing customized integrated solutions Dedicated clinical specialists manage programs that improve access to therapy Coordination and adherence programs reduce costs and lead to improved patient outcomes Enhanced capabilities and infrastructure supporting the unique needs of biologics 1. Each adjusted item excludes special items and discontinued operations. A reconciliation of non-GAAP information to the most comparable GAAP measures is available on our website under ‘Supplemental Financial Information’ at http://ir.omnicare.com.
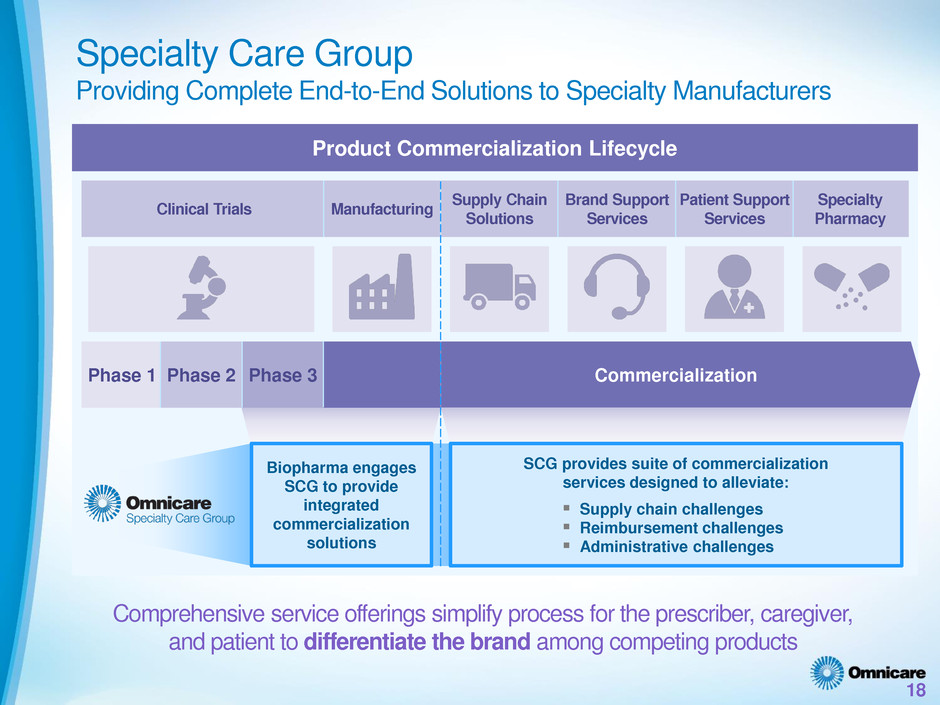
Specialty Care Group Providing Complete End-to-End Solutions to Specialty Manufacturers 18 Product Commercialization Lifecycle Clinical Trials Manufacturing Supply Chain Solutions Brand Support Services Patient Support Services Specialty Pharmacy Phase 1 Commercialization Phase 2 Phase 3 Comprehensive service offerings simplify process for the prescriber, caregiver, and patient to differentiate the brand among competing products SCG provides suite of commercialization services designed to alleviate: Supply chain challenges Reimbursement challenges Administrative challenges Biopharma engages SCG to provide integrated commercialization solutions
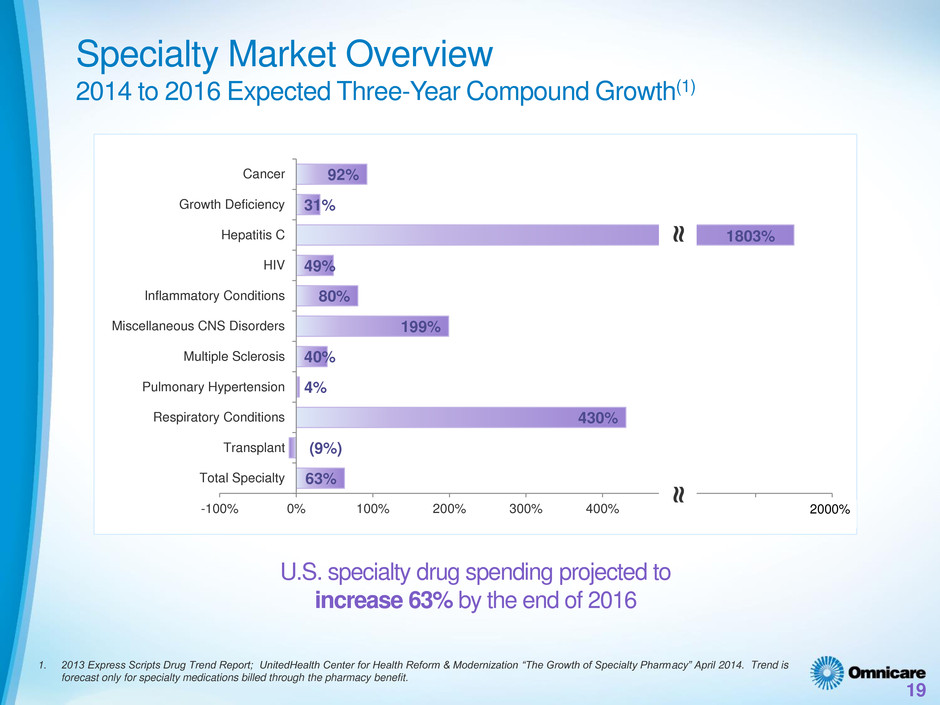
U.S. specialty drug spending projected to increase 63% by the end of 2016 19 1. 2013 Express Scripts Drug Trend Report; UnitedHealth Center for Health Reform & Modernization “The Growth of Specialty Pharmacy” April 2014. Trend is forecast only for specialty medications billed through the pharmacy benefit. Specialty Market Overview 2014 to 2016 Expected Three-Year Compound Growth(1) 63% (9%) 430% 4% 40% 199% 80% 49% 31% 92% -100% 0% 100% 200% 300% 400% 500% 600% 700% Total Specialty Transplant Respiratory Conditions Pulmonary Hypertension Multiple Sclerosis Miscellaneous CNS Disorders Inflammatory Conditions HIV Hepatitis C Growth Deficiency Cancer 20 ≈ ≈ 1803%
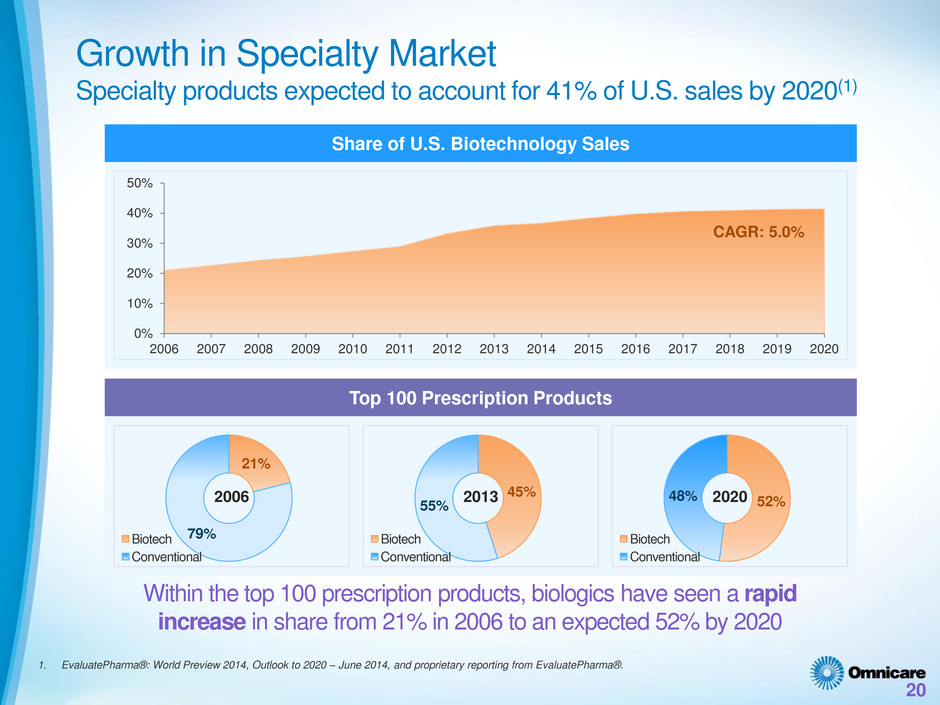
20 0% 10% 20% 30% 40% 50% 2006 2007 2008 2009 2010 2011 2012 2013 2014 2015 2016 2017 2018 2019 2020 Within the top 100 prescription products, biologics have seen a rapid increase in share from 21% in 2006 to an expected 52% by 2020 1. EvaluatePharma®: World Preview 2014, Outlook to 2020 – June 2014, and proprietary reporting from EvaluatePharma®. Top 100 Prescription Products 21% 79% Biotech Conventional Share of U.S. Biotechnology Sales CAGR: 5.0% 45% 55% Biotech Conventional 52% 48% Biotech Conventional 2006 2013 2020 Growth in Specialty Market Specialty products expected to account for 41% of U.S. sales by 2020(1)
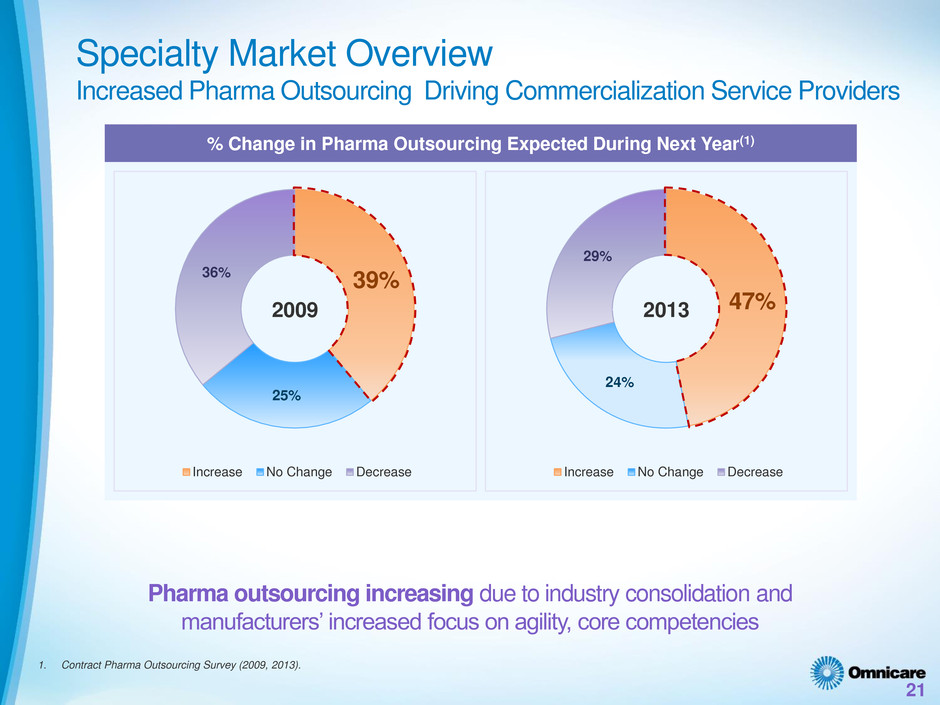
21 Pharma outsourcing increasing due to industry consolidation and manufacturers’ increased focus on agility, core competencies % Change in Pharma Outsourcing Expected During Next Year(1) Specialty Market Overview Increased Pharma Outsourcing Driving Commercialization Service Providers 39% 25% 36% Increase No Change Decrease 1. Contract Pharma Outsourcing Survey (2009, 2013). 2009 47% 24% 29% Increase No Change Decrease 2013
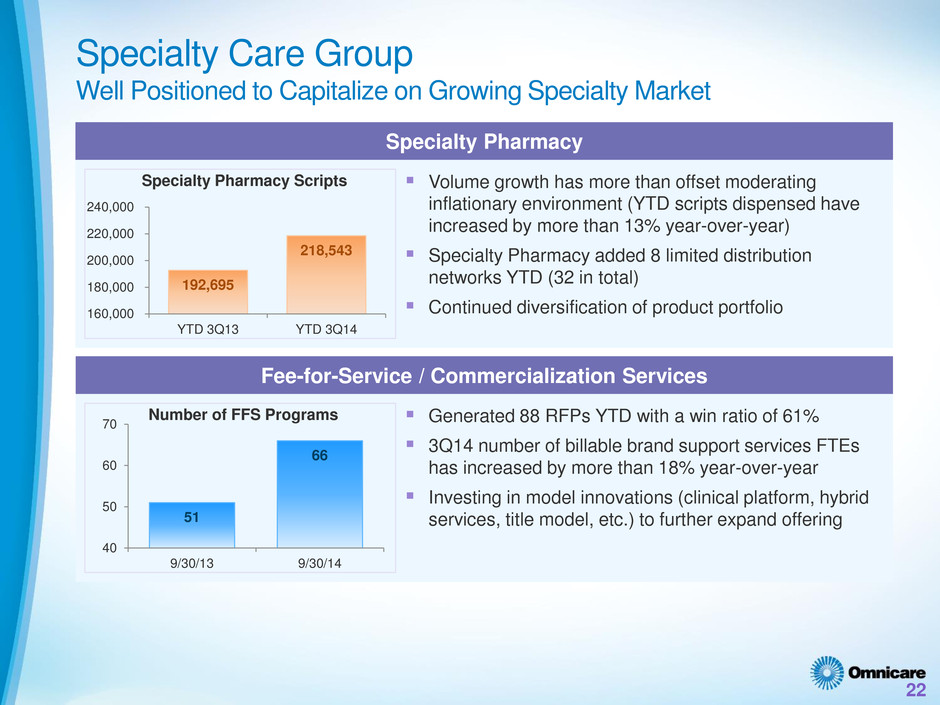
51 66 40 50 60 70 9/30/13 9/30/14 Number of FFS Programs 22 Specialty Care Group Well Positioned to Capitalize on Growing Specialty Market Fee-for-Service / Commercialization Services Specialty Pharmacy 192,695 218,543 160,000 180,000 200,000 220,000 240,000 YTD 3Q13 YTD 3Q14 Specialty Pharmacy Scripts Volume growth has more than offset moderating inflationary environment (YTD scripts dispensed have increased by more than 13% year-over-year) Specialty Pharmacy added 8 limited distribution networks YTD (32 in total) Continued diversification of product portfolio Generated 88 RFPs YTD with a win ratio of 61% 3Q14 number of billable brand support services FTEs has increased by more than 18% year-over-year Investing in model innovations (clinical platform, hybrid services, title model, etc.) to further expand offering

Multi-Layered Growth Strategy
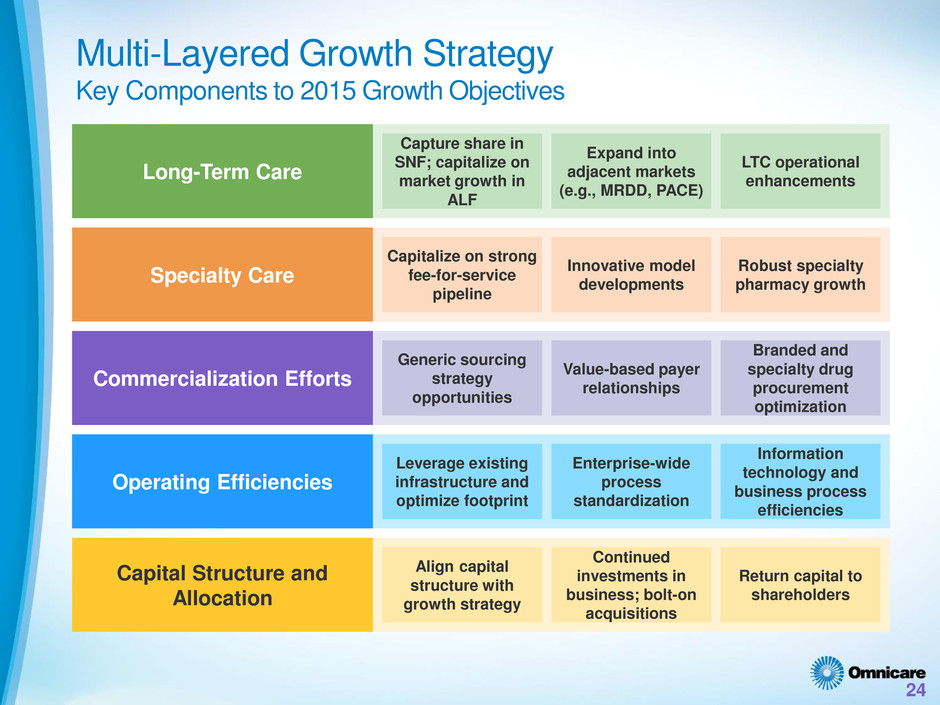
Multi-Layered Growth Strategy Key Components to 2015 Growth Objectives Long-Term Care Specialty Care Commercialization Efforts Capture share in SNF; capitalize on market growth in ALF Generic sourcing strategy opportunities Expand into adjacent markets (e.g., MRDD, PACE) Value-based payer relationships LTC operational enhancements Capitalize on strong fee-for-service pipeline Robust specialty pharmacy growth Innovative model developments Operating Efficiencies Branded and specialty drug procurement optimization Capital Structure and Allocation 24 Leverage existing infrastructure and optimize footprint Enterprise-wide process standardization Information technology and business process efficiencies Align capital structure with growth strategy Continued investments in business; bolt-on acquisitions Return capital to shareholders
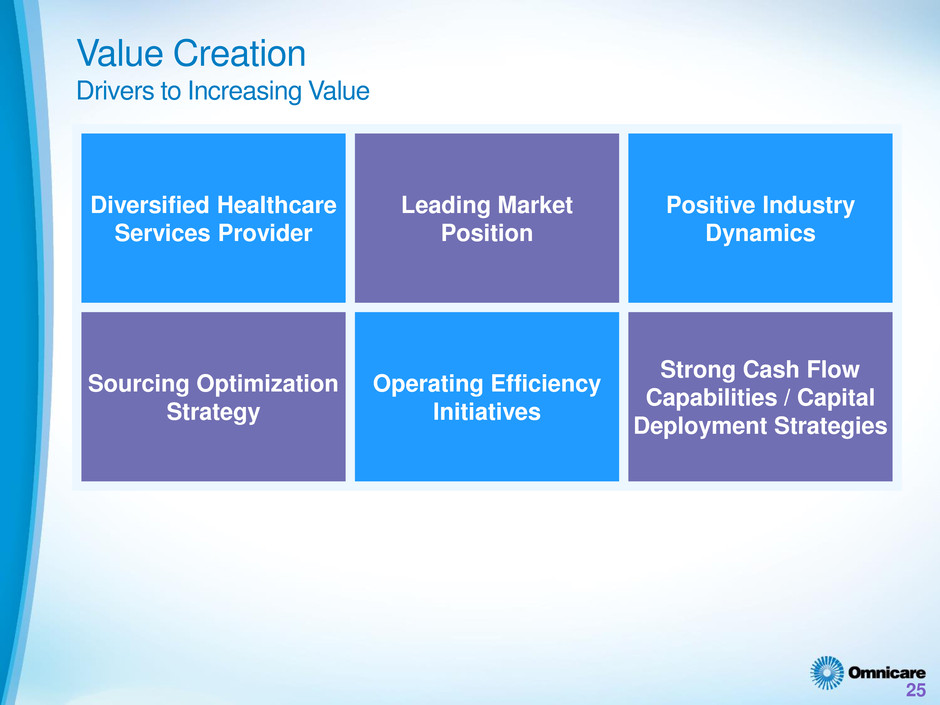
Value Creation Drivers to Increasing Value Diversified Healthcare Services Provider Leading Market Position Positive Industry Dynamics Sourcing Optimization Strategy 25 Operating Efficiency Initiatives Strong Cash Flow Capabilities / Capital Deployment Strategies

Financial Overview
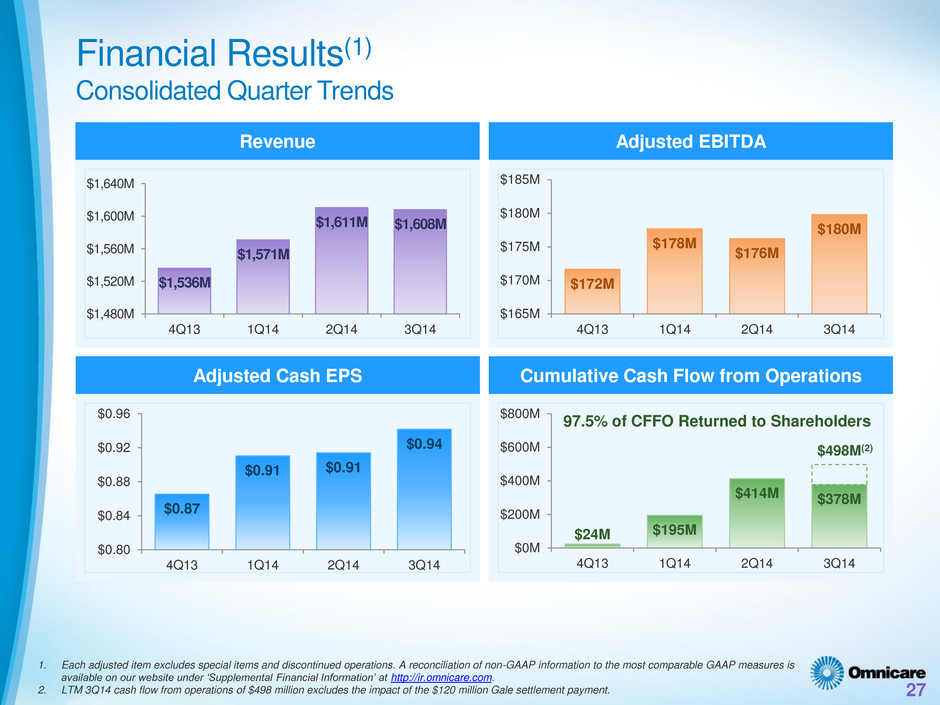
$1,536M $1,571M $1,611M $1,608M $1,480M $1,520M $1,560M $1,600M $1,640M 4Q13 1Q14 2Q14 3Q14 $172M $178M $176M $180M $165M $170M $175M $180M $185M 4Q13 1Q14 2Q14 3Q14 27 Financial Results(1) Consolidated Quarter Trends 1. Each adjusted item excludes special items and discontinued operations. A reconciliation of non-GAAP information to the most comparable GAAP measures is available on our website under ‘Supplemental Financial Information’ at http://ir.omnicare.com. 2. LTM 3Q14 cash flow from operations of $498 million excludes the impact of the $120 million Gale settlement payment. $0.87 $0.91 $0.91 $0.94 $0.80 $0.84 $0.88 $0.92 $0.96 4Q13 1Q14 2Q14 3Q14 $24M $195M $414M $378M $0M $200M $400M $600M $800M 4Q13 1Q14 2Q14 3Q14 Adjusted Cash EPS Cumulative Cash Flow from Operations Adjusted EBITDA Revenue 97.5% of CFFO Returned to Shareholders $498M(2)
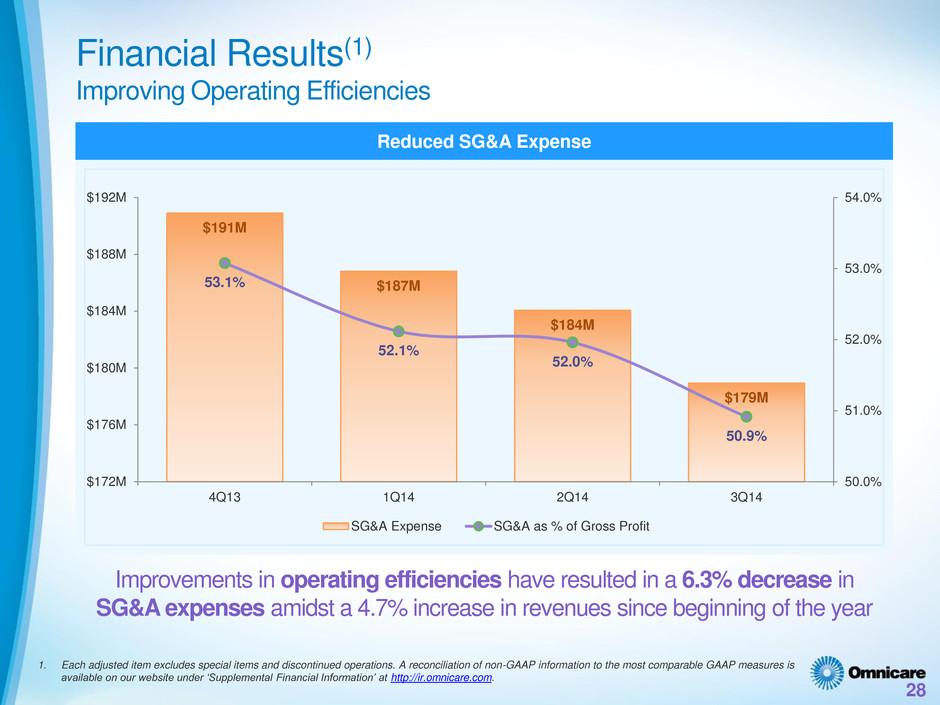
28 Financial Results(1) Improving Operating Efficiencies 1. Each adjusted item excludes special items and discontinued operations. A reconciliation of non-GAAP information to the most comparable GAAP measures is available on our website under ‘Supplemental Financial Information’ at http://ir.omnicare.com. $191M $187M $184M $179M 53.1% 52.1% 52.0% 50.9% 50.0% 51.0% 52.0% 53.0% 54.0% $172M $176M $180M $184M $188M $192M 4Q13 1Q14 2Q14 3Q14 SG&A Expense SG&A as % of Gross Profit Reduced SG&A Expense Improvements in operating efficiencies have resulted in a 6.3% decrease in SG&A expenses amidst a 4.7% increase in revenues since beginning of the year
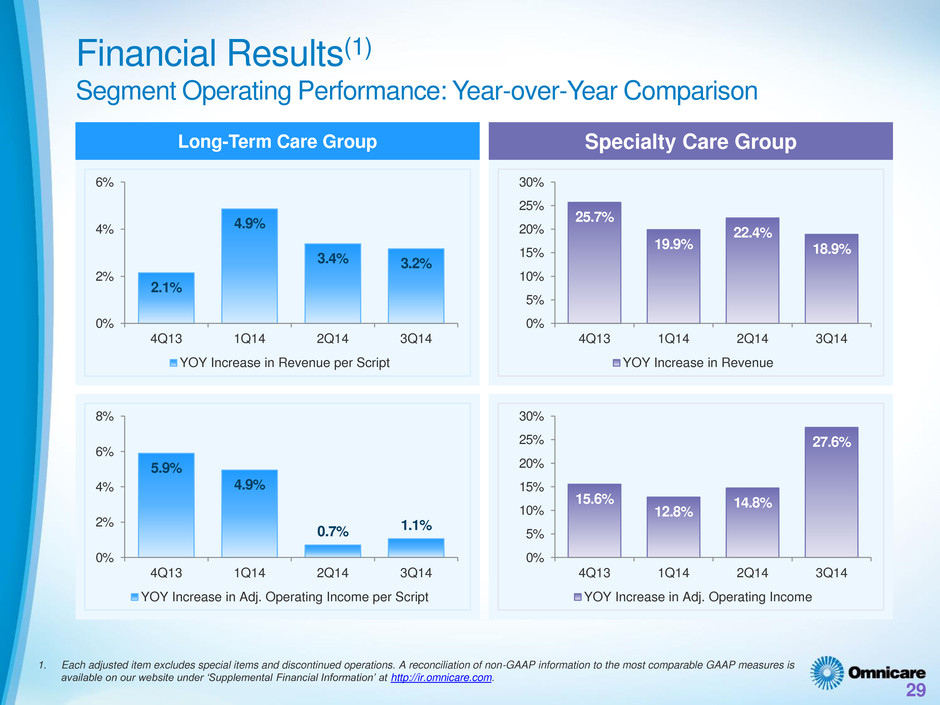
2.1% 4.9% 3.4% 3.2% 0% 2% 4% 6% 4Q13 1Q14 2Q14 3Q14 YOY Increase in Revenue per Script 29 Financial Results(1) Segment Operating Performance: Year-over-Year Comparison 1. Each adjusted item excludes special items and discontinued operations. A reconciliation of non-GAAP information to the most comparable GAAP measures is available on our website under ‘Supplemental Financial Information’ at http://ir.omnicare.com. Specialty Care Group Long-Term Care Group 5.9% 4.9% 0.7% 1.1% 0% 2% 4% 6% 8% 4Q13 1Q14 2Q14 3Q14 YOY Increase in Adj. Operating Income per Script 25.7% 19.9% 22.4% 18.9% 0% 5% 10% 15% 20% 25% 30% 4Q13 1Q14 2Q14 3Q14 YOY Increase in Revenue 15.6% 12.8% 14.8% 27.6% 0% 5% 10% 15% 20% 25% 30% 4Q13 1Q14 2Q14 3Q14 YOY Increase in Adj. Operating Income
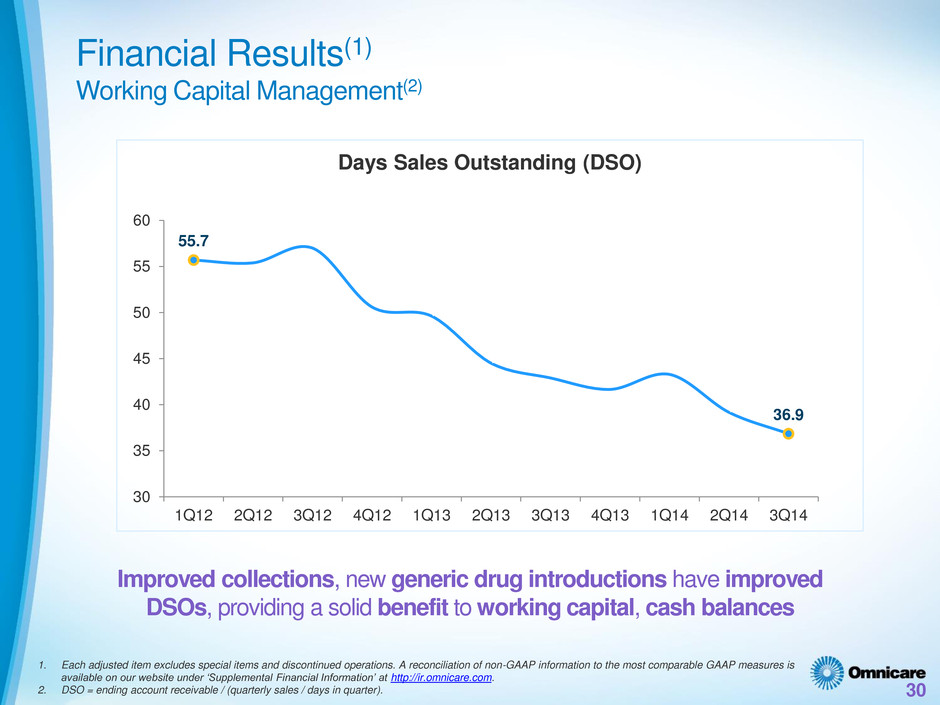
30 Financial Results(1) Working Capital Management(2) 1. Each adjusted item excludes special items and discontinued operations. A reconciliation of non-GAAP information to the most comparable GAAP measures is available on our website under ‘Supplemental Financial Information’ at http://ir.omnicare.com. 2. DSO = ending account receivable / (quarterly sales / days in quarter). 55.7 36.9 30 35 40 45 50 55 60 1Q12 2Q12 3Q12 4Q12 1Q13 2Q13 3Q13 4Q13 1Q14 2Q14 3Q14 Days Sales Outstanding (DSO) Improved collections, new generic drug introductions have improved DSOs, providing a solid benefit to working capital, cash balances
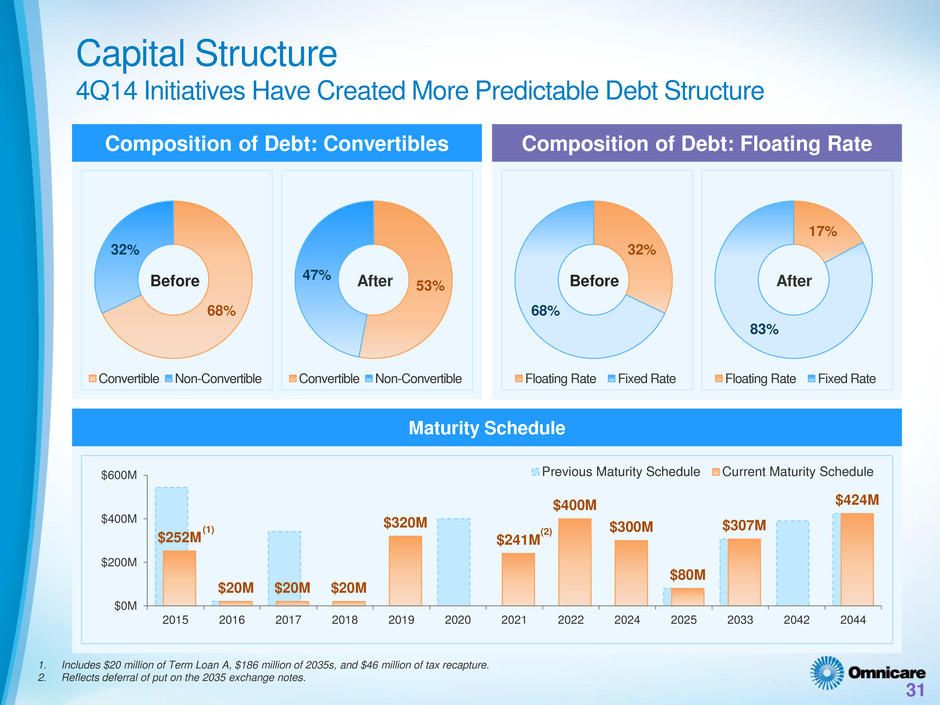
Capital Structure 4Q14 Initiatives Have Created More Predictable Debt Structure $252M $20M $20M $20M $320M $241M $400M $300M $80M $307M $424M $0M $200M $400M $600M 2015 2016 2017 2018 2019 2020 2021 2022 2024 2025 2033 2042 2044 Previous Maturity Schedule Current Maturity Schedule Composition of Debt: Convertibles (1) (2) Maturity Schedule 1. Includes $20 million of Term Loan A, $186 million of 2035s, and $46 million of tax recapture. 2. Reflects deferral of put on the 2035 exchange notes. Composition of Debt: Floating Rate 68% 32% Convertible Non-Convertible 53% 47% Convertible Non-Convertible 31 Before After 32% 68% Floating Rate Fixed Rate 17% 83% Floating Rate Fixed Rate Before After
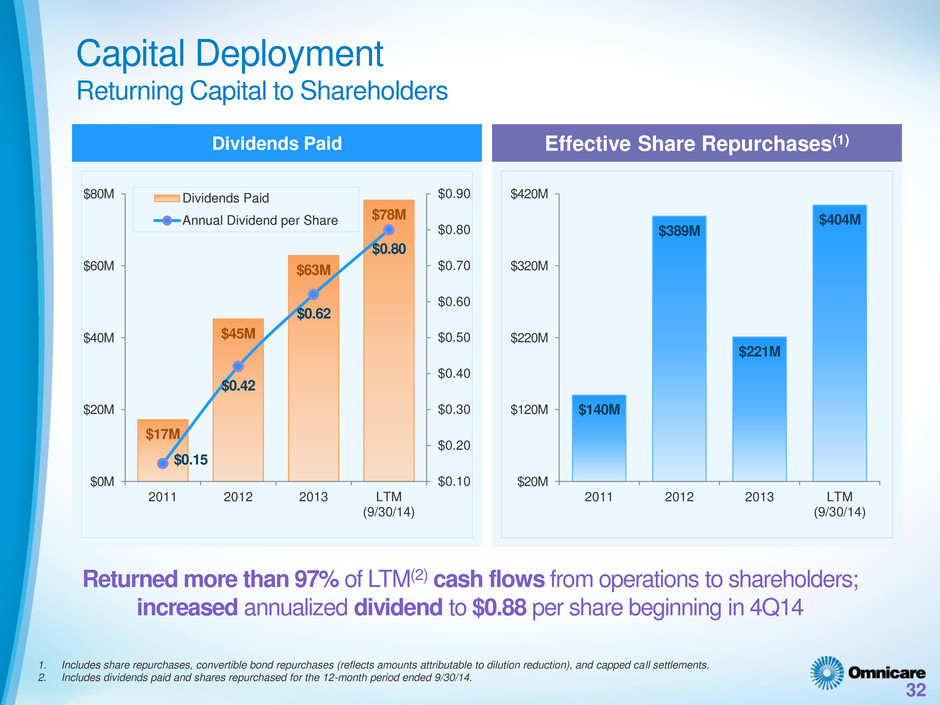
Capital Deployment Returning Capital to Shareholders 32 $17M $45M $63M $78M $0.15 $0.42 $0.62 $0.80 $0.10 $0.20 $0.30 $0.40 $0.50 $0.60 $0.70 $0.80 $0.90 $0M $20M $40M $60M $80M 2011 2012 2013 LTM (9/30/14) Dividends Paid Annual Dividend per Share Effective Share Repurchases(1) Dividends Paid $140M $389M $221M $404M $20M $120M $220M $320M $420M 2011 2012 2013 LTM (9/30/14) Returned more than 97% of LTM(2) cash flows from operations to shareholders; increased annualized dividend to $0.88 per share beginning in 4Q14 1. Includes share repurchases, convertible bond repurchases (reflects amounts attributable to dilution reduction), and capped call settlements. 2. Includes dividends paid and shares repurchased for the 12-month period ended 9/30/14.
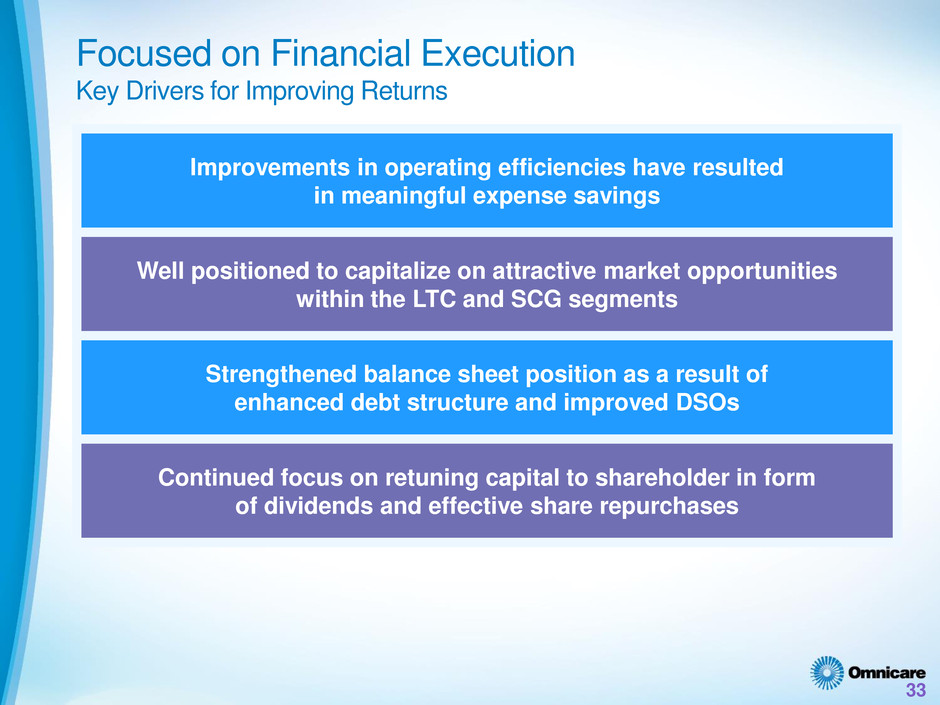
Focused on Financial Execution Key Drivers for Improving Returns Improvements in operating efficiencies have resulted in meaningful expense savings Well positioned to capitalize on attractive market opportunities within the LTC and SCG segments 33 Strengthened balance sheet position as a result of enhanced debt structure and improved DSOs Continued focus on retuning capital to shareholder in form of dividends and effective share repurchases

33rd Annual J.P. Morgan Healthcare Conference January 2015


