UNITED STATES
SECURITIES AND EXCHANGE COMMISSION
Washington, D.C. 20549
FORM N-CSR
CERTIFIED SHAREHOLDER REPORT OF REGISTERED
MANAGEMENT INVESTMENT COMPANIES
Investment Company Act file number 811-02460
Fidelity Union Street Trust
(Exact name of registrant as specified in charter)
245 Summer St., Boston, Massachusetts 02210
(Address of principal executive offices) (Zip code)
Nicole Macarchuk, Secretary
245 Summer St.
Boston, Massachusetts 02210
(Name and address of agent for service)
Registrant's telephone number, including area code:
617-563-7000
| |
Date of fiscal year end: | August 31 |
|
|
Date of reporting period: | August 31, 2024 |
Item 1.
Reports to Stockholders
| |
| | ANNUAL SHAREHOLDER REPORT | AS OF AUGUST 31, 2024 | |
| | Fidelity® Arizona Municipal Income Fund Fidelity® Arizona Municipal Income Fund : FSAZX |
| | | |
This annual shareholder report contains information about Fidelity® Arizona Municipal Income Fund for the period September 1, 2023 to August 31, 2024. You can find additional information about the Fund at fundresearch.fidelity.com/prospectus/sec. You can also request this information by contacting us at 1-800-544-8544 or by sending an e-mail to fidfunddocuments@fidelity.com.
What were your Fund costs for the last year?(based on hypothetical $10,000 investment)
FUND COST (PREVIOUS YEAR)
| | Costs of a $10,000 investment | Costs paid as a percentage of a $10,000 investment | |
| Fidelity® Arizona Municipal Income Fund | $ 57 | 0.55% | |
What affected the Fund's performance this period?
•Tax-exempt municipal bonds notched a strong gain for the 12 months ending August 31, 2024, thanks to rallies in late 2023 and summer 2024, when cooling inflation data and comments from the U.S. Federal Reserve bolstered investors' expectation for interest-rate cuts.
•Against this backdrop, credit-quality positioning was a key contributor to the fund's performance versus the state-specific index, the Bloomberg Arizona 2+ Year Enhanced Municipal Linked 08/01/2018 Index, for the fiscal year. This included an overweight in lower-quality investment-grade securities, which outperformed as credit spreads narrowed.
•Overweight exposure to certain lower-rated hospital bonds also helped relative performance this period.
•Periodic adjustments to the fund's yield-curve positioning, made based on expected re-shaping of the curve, contributed for the 12 months.
•To a lesser extent, the fund's "carry" advantage, meaning its proportionately larger stake in higher-yielding bonds than the state-specific index, was beneficial.
•Pricing factors modestly boosted relative performance. Fund holdings are priced by a third-party pricing service and validated daily by Fidelity Management & Research's fair-value processes. Securities within the index, however, are priced by the index provider. These two approaches employ somewhat different methodologies in setting the prices of municipal securities, most of which trade infrequently.
•In contrast, fund holdings in certain industrial development revenue bonds detracted versus the state index the past 12 months.
How did the Fund perform over the past 10 years?
CUMULATIVE PERFORMANCE
August 31, 2014 through August 31, 2024.
Initial investment of $10,000.
Fidelity® Arizona Municipal Income Fund | $10,000 | $10,328 | $11,052 | $11,099 | $11,094 | $12,044 | $12,324 | $12,727 | $11,573 | $11,749 | $12,546 |
Bloomberg Arizona 2+ Year Enhanced Municipal Linked Index | $10,000 | $10,319 | $11,078 | $11,215 | $11,228 | $12,206 | $12,602 | $12,985 | $11,885 | $12,017 | $12,736 |
Bloomberg Municipal Bond Index | $10,000 | $10,252 | $10,958 | $11,054 | $11,108 | $12,077 | $12,468 | $12,891 | $11,778 | $11,979 | $12,708 |
| | 2014 | 2015 | 2016 | 2017 | 2018 | 2019 | 2020 | 2021 | 2022 | 2023 | 2024 |
AVERAGE ANNUAL TOTAL RETURNS: | | 1 Year | 5 Year | 10 Year |
| Fidelity® Arizona Municipal Income Fund | 6.78% | 0.82% | 2.29% |
| Bloomberg Arizona 2+ Year Enhanced Municipal Linked Index | 5.99% | 0.85% | 2.45% |
| Bloomberg Municipal Bond Index | 6.09% | 1.02% | 2.43% |
Visit www.fidelity.com for more recent performance information. |
The Fund's past performance is not a good predictor of the Fund's future performance. The graph and table do not reflect the deduction of taxes that a shareholder would pay on fund distributions or redemption of fund shares. |
Key Fund Statistics (as of August 31, 2024)
KEY FACTS | | |
| Fund Size | $122,357,798 | |
| Number of Holdings | 113 | |
| Total Advisory Fee | $666,316 | |
| Portfolio Turnover | 7% | |
What did the Fund invest in?
(as of August 31, 2024)
REVENUE SOURCES (% of Fund's net assets) |
| Health Care | 28.5 | |
| Education | 18.4 | |
| General Obligations | 13.9 | |
| Transportation | 10.0 | |
| Special Tax | 9.0 | |
| Water & Sewer | 5.8 | |
| State G.O. | 5.3 | |
| Others(Individually Less Than 5%) | 9.1 | |
| 100.0 | |
| |
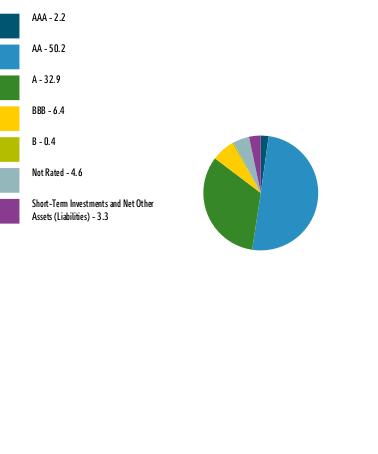
| AAA | 2.2 |
| AA | 50.2 |
| A | 32.9 |
| BBB | 6.4 |
| B | 0.4 |
| Not Rated | 4.6 |
| Short-Term Investments and Net Other Assets (Liabilities) | 3.3 |
QUALITY DIVERSIFICATION (% of Fund's net assets) |
|
| |
| We have used ratings from Moody's Investors Service, Inc. Where Moody's® ratings are not available, we have used S&P® ratings. All ratings are as of the date indicated and do not reflect subsequent changes. |
| Fidelity, the Fidelity Investments Logo and all other Fidelity trademarks or service marks used herein are trademarks or service marks of FMR LLC. Any third-party marks that are used herein are trademarks or service marks of their respective owners. © 2024 FMR LLC. All rights reserved. |
| | For additional information about the Fund; including its prospectus, financial information, holdings and proxy information, scan the QR code or visit fundresearch.fidelity.com/prospectus/sec 1.9913618.100 434-TSRA-1024 |
| |
| | ANNUAL SHAREHOLDER REPORT | AS OF AUGUST 31, 2024 | |
| | Fidelity® Maryland Municipal Income Fund Fidelity® Maryland Municipal Income Fund : SMDMX |
| | | |
This annual shareholder report contains information about Fidelity® Maryland Municipal Income Fund for the period September 1, 2023 to August 31, 2024. You can find additional information about the Fund at fundresearch.fidelity.com/prospectus/sec. You can also request this information by contacting us at 1-800-544-8544 or by sending an e-mail to fidfunddocuments@fidelity.com.
What were your Fund costs for the last year?(based on hypothetical $10,000 investment)
FUND COST (PREVIOUS YEAR)
| | Costs of a $10,000 investment | Costs paid as a percentage of a $10,000 investment | |
| Fidelity® Maryland Municipal Income Fund | $ 57 | 0.55% | |
What affected the Fund's performance this period?
•Tax-exempt municipal bonds notched a strong gain for the 12 months ending August 31, 2024, thanks to rallies in late 2023 and summer 2024, when cooling inflation data and comments from the U.S. Federal Reserve bolstered investors' expectation for interest-rate cuts.
•Against this backdrop, credit-quality positioning was a key contributor to the fund's performance versus the state-specific index, the Bloomberg Maryland 2+ Year Enhanced Municipal Linked 08/01/2018 Index, for the fiscal year. This included an overweight in lower-quality investment-grade securities, which outperformed as credit spreads narrowed.
•Overweight exposure to certain senior living municipal bonds also helped relative performance this period.
•To a lesser extent, the fund's "carry" advantage, meaning its proportionately larger stake in higher-yielding bonds than the state-specific index, was beneficial.
•Periodic adjustments to the fund's yield-curve positioning, made based on expected re-shaping of the curve, contributed for the 12 months.
•In contrast, pricing factors modestly detracted from relative performance. Fund holdings are priced by a third-party pricing service and validated daily by Fidelity Management & Research's fair-value processes. Securities within the index, however, are priced by the index provider. These two approaches employ somewhat different methodologies in setting the prices of municipal securities, most of which trade infrequently.
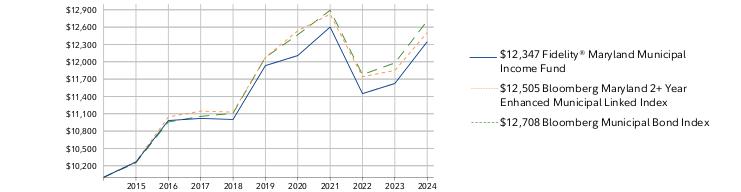
How did the Fund perform over the past 10 years?
CUMULATIVE PERFORMANCE
August 31, 2014 through August 31, 2024.
Initial investment of $10,000.
Fidelity® Maryland Municipal Income Fund | $10,000 | $10,266 | $10,983 | $11,019 | $11,001 | $11,934 | $12,107 | $12,601 | $11,448 | $11,624 | $12,347 |
Bloomberg Maryland 2+ Year Enhanced Municipal Linked Index | $10,000 | $10,271 | $11,044 | $11,147 | $11,128 | $12,076 | $12,536 | $12,824 | $11,742 | $11,850 | $12,505 |
Bloomberg Municipal Bond Index | $10,000 | $10,252 | $10,958 | $11,054 | $11,108 | $12,077 | $12,468 | $12,891 | $11,778 | $11,979 | $12,708 |
| | 2014 | 2015 | 2016 | 2017 | 2018 | 2019 | 2020 | 2021 | 2022 | 2023 | 2024 |
AVERAGE ANNUAL TOTAL RETURNS: | | 1 Year | 5 Year | 10 Year |
| Fidelity® Maryland Municipal Income Fund | 6.22% | 0.68% | 2.13% |
| Bloomberg Maryland 2+ Year Enhanced Municipal Linked Index | 5.53% | 0.70% | 2.26% |
| Bloomberg Municipal Bond Index | 6.09% | 1.02% | 2.43% |
Visit www.fidelity.com for more recent performance information. |
The Fund's past performance is not a good predictor of the Fund's future performance. The graph and table do not reflect the deduction of taxes that a shareholder would pay on fund distributions or redemption of fund shares. |
Key Fund Statistics (as of August 31, 2024)
KEY FACTS | | |
| Fund Size | $164,184,901 | |
| Number of Holdings | 131 | |
| Total Advisory Fee | $936,180 | |
| Portfolio Turnover | 15% | |
What did the Fund invest in?
(as of August 31, 2024)
REVENUE SOURCES (% of Fund's net assets) |
| Health Care | 25.4 | |
| General Obligations | 23.2 | |
| Special Tax | 12.4 | |
| Transportation | 9.7 | |
| Water & Sewer | 7.8 | |
| Education | 7.7 | |
| Housing | 6.7 | |
| Others(Individually Less Than 5%) | 7.1 | |
| 100.0 | |
| |
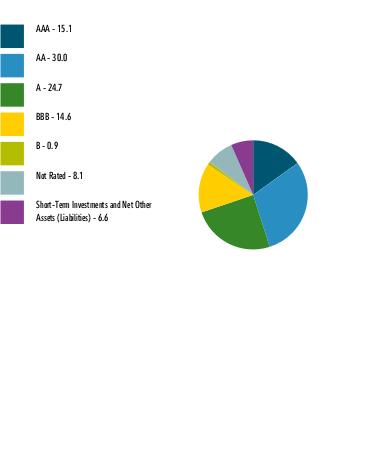
| AAA | 15.1 |
| AA | 30.0 |
| A | 24.7 |
| BBB | 14.6 |
| B | 0.9 |
| Not Rated | 8.1 |
| Short-Term Investments and Net Other Assets (Liabilities) | 6.6 |
QUALITY DIVERSIFICATION (% of Fund's net assets) |
|
| |
| We have used ratings from Moody's Investors Service, Inc. Where Moody's® ratings are not available, we have used S&P® ratings. All ratings are as of the date indicated and do not reflect subsequent changes. |
| Fidelity, the Fidelity Investments Logo and all other Fidelity trademarks or service marks used herein are trademarks or service marks of FMR LLC. Any third-party marks that are used herein are trademarks or service marks of their respective owners. © 2024 FMR LLC. All rights reserved. |
| | For additional information about the Fund; including its prospectus, financial information, holdings and proxy information, scan the QR code or visit fundresearch.fidelity.com/prospectus/sec 1.9913617.100 429-TSRA-1024 |
Item 2.
Code of Ethics
As of the end of the period, August 31, 2024, Fidelity Union Street Trust (the trust) has adopted a code of ethics, as defined in Item 2 of Form N-CSR, that applies to its President and Treasurer and its Chief Financial Officer. A copy of the code of ethics is filed as an exhibit to this Form N-CSR.
Item 3.
Audit Committee Financial Expert
The Board of Trustees of the trust has determined that Elizabeth S. Acton is an audit committee financial expert, as defined in Item 3 of Form N-CSR. Ms. Acton is independent for purposes of Item 3 of Form N-CSR.
Item 4.
Principal Accountant Fees and Services
Fees and Services
The following table presents fees billed by PricewaterhouseCoopers LLP (“PwC”) in each of the last two fiscal years for services rendered to Fidelity Arizona Municipal Income Fund and Fidelity Maryland Municipal Income Fund (the “Funds”):
Services Billed by PwC
August 31, 2024 FeesA
|
| Audit Fees | Audit-Related Fees | Tax Fees | All Other Fees |
Fidelity Arizona Municipal Income Fund | $45,100 | $3,700 | $5,500 | $1,600 |
Fidelity Maryland Municipal Income Fund | $45,100 | $3,700 | $5,500 | $1,600 |
|
| Audit Fees | Audit-Related Fees | Tax Fees | All Other Fees |
Fidelity Arizona Municipal Income Fund | $45,200 | $3,700 | $5,500 | $1,600 |
Fidelity Maryland Municipal Income Fund | $45,200 | $3,700 | $5,500 | $1,600 |
A Amounts may reflect rounding.
The following table(s) present(s) fees billed by PwC that were required to be approved by the Audit Committee for services that relate directly to the operations and financial reporting of the Fund(s) and that are rendered on behalf of Fidelity Management & Research Company LLC ("FMR") and entities controlling, controlled by, or under common control with FMR (not including any sub-adviser whose role is primarily portfolio management and is subcontracted with or overseen by another investment adviser) that provide ongoing services to the Fund(s) (“Fund Service Providers”):
Services Billed by PwC
|
| August 31, 2024A | August 31, 2023A |
Audit-Related Fees | $9,437,800 | $8,379,200 |
Tax Fees | $61,000 | $1,000 |
All Other Fees | $35,000 | $- |
A Amounts may reflect rounding.
“Audit-Related Fees” represent fees billed for assurance and related services that are reasonably related to the performance of the fund audit or the review of the fund's financial statements and that are not reported under Audit Fees.
“Tax Fees” represent fees billed for tax compliance, tax advice or tax planning that relate directly to the operations and financial reporting of the fund.
“All Other Fees” represent fees billed for services provided to the fund or Fund Service Provider, a significant portion of which are assurance related, that relate directly to the operations and financial reporting of the fund, excluding those services that are reported under Audit Fees, Audit-Related Fees or Tax Fees.
Assurance services must be performed by an independent public accountant.
* * *
The aggregate non-audit fees billed by PwC for services rendered to the Fund(s), FMR (not including any sub-adviser whose role is primarily portfolio management and is subcontracted with or overseen by another investment adviser), and any Fund Service Provider for each of the last two fiscal years of the Fund(s) are as follows:
|
Billed By | August 31, 2024A | August 31, 2023A |
PwC | $15,030,000 | $13,854,600 |
|
|
|
A Amounts may reflect rounding.
The trust's Audit Committee has considered non-audit services that were not pre-approved that were provided by PwC to Fund Service Providers to be compatible with
maintaining the independence of PwC in its(their) audit of the Fund(s), taking into account representations from PwC, in accordance with Public Company Accounting Oversight Board rules, regarding its independence from the Fund(s) and its(their) related entities and FMR’s review of the appropriateness and permissibility under applicable law of such non-audit services prior to their provision to the Fund(s) Service Providers.
Audit Committee Pre-Approval Policies and Procedures
The trust’s Audit Committee must pre-approve all audit and non-audit services provided by a fund’s independent registered public accounting firm relating to the operations or financial reporting of the fund. Prior to the commencement of any audit or non-audit services to a fund, the Audit Committee reviews the services to determine whether they are appropriate and permissible under applicable law.
The Audit Committee has adopted policies and procedures to, among other purposes, provide a framework for the Committee’s consideration of non-audit services by the audit firms that audit the Fidelity funds. The policies and procedures require that any non-audit service provided by a fund audit firm to a Fidelity fund and any non-audit service provided by a fund auditor to a Fund Service Provider that relates directly to the operations and financial reporting of a Fidelity fund (“Covered Service”) are subject to approval by the Audit Committee before such service is provided.
All Covered Services must be approved in advance of provision of the service either: (i) by formal resolution of the Audit Committee, or (ii) by oral or written approval of the service by the Chair of the Audit Committee (or if the Chair is unavailable, such other member of the Audit Committee as may be designated by the Chair to act in the Chair’s absence). The approval contemplated by (ii) above is permitted where the Treasurer determines that action on such an engagement is necessary before the next meeting of the Audit Committee.
Non-audit services provided by a fund audit firm to a Fund Service Provider that do not relate directly to the operations and financial reporting of a Fidelity fund are reported to the Audit Committee periodically.
Non-Audit Services Approved Pursuant to Rule 2-01(c)(7)(i)(C) and (ii) of Regulation S-X (“De Minimis Exception”)
There were no non-audit services approved or required to be approved by the Audit Committee pursuant to the De Minimis Exception during the Fund’s(s’) last two fiscal years relating to services provided to (i) the Fund(s) or (ii) any Fund Service Provider that relate directly to the operations and financial reporting of the Fund(s).
The Registrant has not retained, for the preparation of the audit report on the financial statements included in the Form N-CSR, a registered public accounting firm that has a branch or office that is located in a foreign jurisdiction and that the Public Company Accounting Oversight Board (the “PCAOB”) has determined that the PCAOB is unable
to inspect or investigate completely because of a position taken by an authority in the foreign jurisdiction.
The Registrant is not a “foreign issuer,” as defined in 17 CFR 240.3b-4.
Item 5.
Audit Committee of Listed Registrants
Not applicable.
Item 6.
Investments
(a)
Not applicable.
(b)
Not applicable.
Item 7.
Financial Statements and Financial Highlights for Open-End Management Investment Companies
Fidelity® Arizona Municipal Income Fund
Annual Report
August 31, 2024
Contents
To view a fund's proxy voting guidelines and proxy voting record for the 12-month period ended June 30, visit http://www.fidelity.com/proxyvotingresults or visit the Securities and Exchange Commission's (SEC) web site at http://www.sec.gov.
You may also call 1-800-544-8544 to request a free copy of the proxy voting guidelines.
Standard & Poor's, S&P and S&P 500 are registered service marks of The McGraw-Hill Companies, Inc. and have been licensed for use by Fidelity Distributors Corporation.
Other third-party marks appearing herein are the property of their respective owners.
All other marks appearing herein are registered or unregistered trademarks or service marks of FMR LLC or an affiliated company. © 2024 FMR LLC. All rights reserved.
This report and the financial statements contained herein are submitted for the general information of the shareholders of the Fund. This report is not authorized for distribution to prospective investors in the Fund unless preceded or accompanied by an effective prospectus.
A fund files its complete schedule of portfolio holdings with the SEC for the first and third quarters of each fiscal year on Form N-PORT. Forms N-PORT are available on the SEC's web site at http://www.sec.gov. A fund's Forms N-PORT may be reviewed and copied at the SEC's Public Reference Room in Washington, DC. Information regarding the operation of the SEC's Public Reference Room may be obtained by calling 1-800-SEC-0330.
For a complete list of a fund's portfolio holdings, view the most recent holdings listing, semiannual report, or annual report on Fidelity's web site at http://www.fidelity.com, http://www.institutional.fidelity.com, or http://www.401k.com, as applicable.
NOT FDIC INSURED •MAY LOSE VALUE •NO BANK GUARANTEE
Neither the Fund nor Fidelity Distributors Corporation is a bank.
Item 7: Financial Statements and Financial Highlights for Open-End Management Investment Companies (Annual Report)
Fidelity® Arizona Municipal Income Fund
Schedule of Investments August 31, 2024
Showing Percentage of Net Assets
| Municipal Bonds - 96.7% |
| | | Principal Amount (a) | Value ($) |
| Arizona - 94.8% | | | |
| Arizona Board of Regents Arizona State Univ. Rev.: | | | |
| Series 2015 B, 5% 7/1/31 | | 1,525,000 | 1,551,228 |
| Series 2015 D: | | | |
5% 7/1/34 | | 500,000 | 508,311 |
5% 7/1/35 | | 900,000 | 914,514 |
| Arizona Game and Fish Dept. and Commission (AGF Administration Bldg. Proj.) Series 2006, 5% 7/1/32 | | 470,000 | 470,600 |
| Arizona Health Facilities Auth. Rev. (Banner Health Sys. Proj.) Series 2007 B, S&P Municipal Bond 7 Day High Grade Rate Index + 0.810% 4.9%, tender 1/1/37 (b)(c) | | 1,000,000 | 973,195 |
| Arizona Indl. Dev. Auth. Hosp. Rev.: | | | |
| Series 2020 A: | | | |
3% 2/1/45 | | 1,000,000 | 823,246 |
4% 2/1/50 | | 2,005,000 | 1,917,592 |
5% 2/1/40 | | 700,000 | 749,231 |
| Series 2021 A: | | | |
4% 2/1/39 | | 500,000 | 502,806 |
4% 2/1/40 | | 1,000,000 | 1,000,037 |
| Arizona Indl. Dev. Auth. Lease Rev. Series 2020 A: | | | |
| 4% 9/1/35 | | 200,000 | 202,472 |
| 4% 9/1/36 | | 355,000 | 358,610 |
| 4% 9/1/46 | | 1,000,000 | 931,916 |
| Arizona Indl. Dev. Auth. Rev. Series 2019 2, 3.625% 5/20/33 | | 1,822,852 | 1,761,133 |
| Arizona State Trans. Board: | | | |
| Series 2017 A, 5% 7/1/32 | | 1,500,000 | 1,595,484 |
| Series 2017A, 5% 7/1/31 | | 385,000 | 409,616 |
| Arizona State Univ. Revs.: | | | |
| Series 2019 A, 5% 7/1/40 | | 510,000 | 545,327 |
| Series 2020 A: | | | |
5% 7/1/39 | | 390,000 | 425,306 |
5% 7/1/43 | | 2,925,000 | 3,143,518 |
| Bullhead City Excise Taxes Series 2021, 2.55% 7/1/46 | | 3,000,000 | 2,157,367 |
| Central Wtr. Conservation District (Central Arizona Proj.) Series 2016 A, 5% 1/1/36 | | 500,000 | 512,084 |
| Chandler Excise Tax Rev. Series 2015, 3% 7/1/34 | | 300,000 | 290,095 |
| Chandler Indl. Dev. Auth. Indl. Dev. Rev. Bonds (Intel Corp. Proj.) Series 2022 2, 5%, tender 9/1/27 (b)(d) | | 3,000,000 | 3,087,755 |
| Coconino County Poll. Cont. Corp. Rev. Bonds (Navada Pwr. Co. Projs.) Series 2017 A, 4.125%, tender 3/31/26 (b)(d) | | 1,000,000 | 1,003,599 |
| Glendale Union School District 205 Series A: | | | |
| 4% 7/1/38 (Assured Guaranty Muni. Corp. Insured) | | 1,000,000 | 1,024,024 |
| 4% 7/1/39 (Assured Guaranty Muni. Corp. Insured) | | 1,000,000 | 1,019,611 |
| Glendale Gen. Oblig. Series 2017: | | | |
| 5% 7/1/30 | | 2,310,000 | 2,455,098 |
| 5% 7/1/32 | | 1,000,000 | 1,059,728 |
| Glendale Indl. Dev. Auth. (Terraces of Phoenix Proj.) Series 2018 A: | | | |
| 4% 7/1/28 | | 215,000 | 209,307 |
| 5% 7/1/33 | | 435,000 | 438,028 |
| Indl. Dev. Auth. of The City of Glendale Sr. Living Rev. (Royal Oaks Inspirata Pointe Proj.) Series 2020 A, 5% 5/15/56 | | 1,000,000 | 954,394 |
| Maricopa County Indl. Dev. Auth.: | | | |
| (Creighton Univ. Proj.) Series 2020, 5% 7/1/47 | | 2,000,000 | 2,088,971 |
| Series 2019 A: | | | |
5% 9/1/29 | | 310,000 | 332,058 |
5% 9/1/33 | | 275,000 | 292,368 |
5% 9/1/34 | | 680,000 | 721,454 |
| Series 2021 A: | | | |
3% 9/1/51 | | 3,000,000 | 2,334,998 |
4% 9/1/51 | | 1,500,000 | 1,405,025 |
| Maricopa County Indl. Dev. Auth. Sr. Living Facilities Series 2016: | | | |
| 5.75% 1/1/36 (e) | | 500,000 | 432,542 |
| 6% 1/1/48 (e) | | 500,000 | 386,873 |
| Maricopa County Phoenix Union High School District #210 Series 2017 B: | | | |
| 5% 7/1/32 | | 1,180,000 | 1,273,426 |
| 5% 7/1/34 | | 585,000 | 629,126 |
| Maricopa County Rev.: | | | |
| Bonds Series C, 5%, tender 10/18/24 (b) | | 125,000 | 125,242 |
| Series 2016 A: | | | |
5% 1/1/34 | | 2,935,000 | 3,049,166 |
5% 1/1/38 | | 2,320,000 | 2,398,448 |
| Series 2019 E, 3% 1/1/49 | | 3,000,000 | 2,387,276 |
| Series 2019 F, 4% 1/1/45 | | 1,000,000 | 978,789 |
| Maricopa County School District #214 Tolleson Series 2018 A, 5% 7/1/31 | | 350,000 | 372,674 |
| Maricopa County School District #28 Kyrene Elementary: | | | |
| Series 2015 C, 4% 7/1/29 | | 650,000 | 653,691 |
| Series 2019 A, 5% 7/1/37 | | 1,000,000 | 1,066,067 |
| Maricopa County School District No. 40 Series 2021 B, 2% 7/1/35 (Assured Guaranty Muni. Corp. Insured) | | 2,050,000 | 1,654,382 |
| Maricopa County Spl. Health Care District Gen. Oblig. Series 2018 C, 5% 7/1/36 | | 1,000,000 | 1,060,708 |
| Maricopa County Unified School District #48 Scottsdale: | | | |
| Series 2017 B, 5% 7/1/33 | | 3,015,000 | 3,202,687 |
| Series D, 4% 7/1/34 | | 350,000 | 365,569 |
| Maricopa County Unified School District #69 Paradise Valley Series 2022, 5% 7/1/31 | | 105,000 | 119,840 |
| McAllister Academic Village LLC Rev. (Arizona State Univ. Hassayampa Academic Village Proj.) Series 2016: | | | |
| 5% 7/1/37 | | 2,000,000 | 2,050,333 |
| 5% 7/1/38 | | 3,850,000 | 3,938,715 |
| Mesa Util. Sys. Rev.: | | | |
| Series 2016, 3% 7/1/40 | | 100,000 | 87,775 |
| Series 2017: | | | |
3.25% 7/1/40 | | 250,000 | 230,774 |
3.25% 7/1/41 | | 680,000 | 620,046 |
| Series 2019 A, 5% 7/1/43 | | 2,015,000 | 2,138,697 |
| Series 2021, 4% 7/1/35 | | 1,000,000 | 1,048,698 |
| Northern Arizona Univ. Revs.: | | | |
| Series 2015, 5% 6/1/30 | | 1,000,000 | 1,014,291 |
| Series 2020 B, 5% 6/1/37 (Build America Mutual Assurance Insured) | | 1,000,000 | 1,089,814 |
| Phoenix Ariz Indl. Dev. Auth. Rev. (Guam Facilities Foundation, Inc. Proj.) Series 2014, 5.125% 2/1/34 | | 500,000 | 483,963 |
| Phoenix Civic Impt. Board Arpt. Rev.: | | | |
| Series 2017 A: | | | |
5% 7/1/33 (d) | | 25,000 | 25,962 |
5% 7/1/35 (d) | | 2,425,000 | 2,512,673 |
| Series 2017 D, 5% 7/1/31 | | 2,000,000 | 2,106,502 |
| Series 2019 B: | | | |
4% 7/1/37 (d) | | 1,750,000 | 1,747,730 |
5% 7/1/33 (d) | | 280,000 | 297,907 |
| Series 2023, 5% 7/1/30 (d) | | 2,000,000 | 2,190,477 |
| Phoenix Civic Impt. Corp. Series 2019 A: | | | |
| 5% 7/1/29 | | 185,000 | 201,524 |
| 5% 7/1/35 | | 1,000,000 | 1,069,178 |
| Phoenix Civic Impt. Corp. District Rev. (Plaza Expansion Proj.) Series 2005 B, 5.5% 7/1/38 (Nat'l. Pub. Fin. Guarantee Corp. Insured) | | 2,000,000 | 2,502,024 |
| Phoenix Civic Impt. Corp. Wastewtr. Sys. Rev. Series 2016, 5% 7/1/33 | | 1,000,000 | 1,035,316 |
| Phoenix IDA Student Hsg. Rev.: | | | |
| (Downtown Phoenix Student Hsg. II LLC Arizona State Univ. Proj.) Series 2019 A, 5% 7/1/36 | | 1,175,000 | 1,221,011 |
| Series 2018 A, (Downtown Phoenix Student Hsg., LLC AZ State Univ. Proj.) 5% 7/1/42 | | 1,500,000 | 1,531,717 |
| Phoenix-Mesa Gateway Arpt. Auth. (Mesa Proj.) Series 2012, 5% 7/1/27 (d) | | 400,000 | 400,320 |
| Pima County Indl. Dev. Auth. Rev. Series 2021 A: | | | |
| 4% 4/1/37 | | 415,000 | 414,642 |
| 4% 4/1/46 | | 3,000,000 | 2,799,580 |
| Pima County Unified School District #1 Tucson Series 2024 A, 5% 7/1/42 (Assured Guaranty Muni. Corp. Insured) | | 875,000 | 972,061 |
| Salt River Proj. Agricultural Impt. & Pwr. District Elec. Sys. Rev.: | | | |
| Series 2019 A, 5% 1/1/35 | | 395,000 | 436,329 |
| Series A, 5% 1/1/37 | | 880,000 | 961,401 |
| Salt Verde Finl. Corp. Sr. Gas Rev. Series 2007: | | | |
| 5% 12/1/37 | | 2,910,000 | 3,223,242 |
| 5.5% 12/1/29 | | 3,000,000 | 3,277,103 |
| Scottsdale Gen. Oblig. Series 2017, 4% 7/1/32 | | 400,000 | 411,761 |
| Student &Academic Svcs. Llc (Northern Arizona Univ. Proj.) Series 2024, 5% 6/1/39 (Build America Mutual Assurance Insured) | | 1,385,000 | 1,554,726 |
| Tempe Excise Tax Rev. Series 2016: | | | |
| 5% 7/1/28 | | 315,000 | 328,125 |
| 5% 7/1/29 | | 500,000 | 520,833 |
| 5% 7/1/30 | | 325,000 | 338,305 |
| 5% 7/1/31 | | 375,000 | 390,011 |
| Tempe Indl. Dev. Auth. Rev. (Friendship Village of Tempe Proj.) Series 2021 A, 4% 12/1/46 | | 1,000,000 | 882,800 |
| Tucson Wtr. Rev. Series 2017, 5% 7/1/34 | | 1,000,000 | 1,057,212 |
| Univ. of Arizona Univ. Revs. Series 2020 C, 5% 8/1/28 | | 900,000 | 980,593 |
| Window Rock Unified School District No. 8 of Apache County Impact Aid Rev. Series 2022: | | | |
| 5% 7/1/35 | | 500,000 | 552,923 |
| 5% 7/1/36 | | 500,000 | 550,181 |
| Yavapai County Indl. Dev. Auth.: | | | |
| Series 2016, 5% 8/1/36 | | 1,305,000 | 1,336,219 |
| Series 2019: | | | |
4% 8/1/43 | | 350,000 | 335,052 |
5% 8/1/25 | | 400,000 | 406,301 |
5% 8/1/26 | | 600,000 | 619,510 |
5% 8/1/27 | | 625,000 | 654,358 |
5% 8/1/39 | | 1,060,000 | 1,101,954 |
| Yuma Indl. Dev. Auth. Hosp. Rev. Series 2014 A, 5% 8/1/27 | | 2,000,000 | 2,001,776 |
TOTAL ARIZONA | | | 115,979,057 |
| Puerto Rico - 1.9% | | | |
| Puerto Rico Commonwealth Aqueduct & Swr. Auth. Series 2021 B, 5% 7/1/37 (e) | | 395,000 | 414,959 |
| Puerto Rico Commonwealth Pub. Impt. Gen. Oblig. Series 2021 A1: | | | |
| 0% 7/1/33 | | 435,874 | 293,181 |
| 5.625% 7/1/27 | | 50,000 | 52,061 |
| 5.625% 7/1/29 | | 150,000 | 161,272 |
| 5.75% 7/1/31 | | 365,000 | 404,117 |
| Puerto Rico Indl., Tourist, Edl., Med. And Envir. Cont. Facilities Fing. Auth. Series 2021: | | | |
| 4% 7/1/41 | | 50,000 | 46,699 |
| 5% 7/1/27 | | 260,000 | 272,590 |
| 5% 7/1/32 | | 95,000 | 102,829 |
| Puerto Rico Sales Tax Fing. Corp. Sales Tax Rev.: | | | |
| Series 2018 A1, 4.55% 7/1/40 | | 310,000 | 310,597 |
| Series 2019 A2, 4.329% 7/1/40 | | 260,000 | 256,759 |
TOTAL PUERTO RICO | | | 2,315,064 |
| TOTAL MUNICIPAL BONDS (Cost $119,633,116) | | | 118,294,121 |
| | | | |
| Money Market Funds - 2.4% |
| | | Shares | Value ($) |
Fidelity Municipal Cash Central Fund 3.22% (f)(g) (Cost $2,987,772) | | 2,987,174 | 2,987,772 |
| | | | |
| TOTAL INVESTMENT IN SECURITIES - 99.1% (Cost $122,620,888) | 121,281,893 |
NET OTHER ASSETS (LIABILITIES) - 0.9% | 1,075,905 |
| NET ASSETS - 100.0% | 122,357,798 |
| | |
Legend
| (a) | Amount is stated in United States dollars unless otherwise noted. |
| (b) | Coupon rates for floating and adjustable rate securities reflect the rates in effect at period end. |
| (c) | Coupon is indexed to a floating interest rate which may be multiplied by a specified factor and/or subject to caps or floors. |
| (d) | Private activity obligations whose interest is subject to the federal alternative minimum tax for individuals. |
| (e) | Security exempt from registration under Rule 144A of the Securities Act of 1933. These securities may be resold in transactions exempt from registration, normally to qualified institutional buyers. At the end of the period, the value of these securities amounted to $1,234,374 or 1.0% of net assets. |
| (f) | Information in this report regarding holdings by state and security types does not reflect the holdings of the Fidelity Municipal Cash Central Fund. |
| (g) | Affiliated fund that is generally available only to investment companies and other accounts managed by Fidelity Investments. The rate quoted is the annualized seven-day yield of the fund at period end. A complete unaudited listing of the fund's holdings as of its most recent quarter end is available upon request. In addition, each Fidelity Central Fund's financial statements, which are not covered by the Fund's Report of Independent Registered Public Accounting Firm, are available on the SEC's website or upon request. |
Affiliated Central Funds
Fiscal year to date information regarding the Fund's investments in Fidelity Central Funds, including the ownership percentage, is presented below.
| Affiliate | Value, beginning of period ($) | Purchases ($) | Sales Proceeds ($) | Dividend Income ($) | Realized Gain (loss) ($) | Change in Unrealized appreciation (depreciation) ($) | Value, end of period ($) | % ownership, end of period |
| Fidelity Municipal Cash Central Fund 3.22% | 4,134,997 | 20,149,639 | 21,296,816 | 67,559 | (53) | 5 | 2,987,772 | 0.1% |
| Total | 4,134,997 | 20,149,639 | 21,296,816 | 67,559 | (53) | 5 | 2,987,772 | |
| | | | | | | | | |
Amounts in the dividend income column in the above table include any capital gain distributions from underlying funds, which are presented in the corresponding line item in the Statement of Operations, if applicable.
Amounts included in the purchases and sales proceeds columns may include in-kind transactions, if applicable.
Investment Valuation
The following is a summary of the inputs used, as of August 31, 2024, involving the Fund's assets and liabilities carried at fair value. The inputs or methodology used for valuing securities may not be an indication of the risk associated with investing in those securities. For more information on valuation inputs, and their aggregation into the levels used below, please refer to the Investment Valuation section in the accompanying Notes to Financial Statements.
| Valuation Inputs at Reporting Date: |
| Description | Total ($) | Level 1 ($) | Level 2 ($) | Level 3 ($) |
Investments in Securities: | | | | |
|
| Municipal Securities | 118,294,121 | - | 118,294,121 | - |
|
| Money Market Funds | 2,987,772 | 2,987,772 | - | - |
| Total Investments in Securities: | 121,281,893 | 2,987,772 | 118,294,121 | - |
Financial Statements
| Statement of Assets and Liabilities |
As of August 31, 2024 |
| Assets | | | | |
| Investment in securities, at value - See accompanying schedule: | | | | |
Unaffiliated issuers (cost $119,633,116) | $ | 118,294,121 | | |
Fidelity Central Funds (cost $2,987,772) | | 2,987,772 | | |
| | | | | |
| | | | | |
| Total Investment in Securities (cost $122,620,888) | | | $ | 121,281,893 |
| Receivable for fund shares sold | | | | 304,257 |
| Interest receivable | | | | 1,071,552 |
| Distributions receivable from Fidelity Central Funds | | | | 6,587 |
| Other receivables | | | | 16 |
Total assets | | | | 122,664,305 |
| Liabilities | | | | |
| Payable to custodian bank | $ | 27,965 | | |
| Payable for fund shares redeemed | | 144,886 | | |
| Distributions payable | | 78,122 | | |
| Accrued management fee | | 55,534 | | |
| Total liabilities | | | | 306,507 |
| Net Assets | | | $ | 122,357,798 |
| Net Assets consist of: | | | | |
| Paid in capital | | | $ | 125,818,977 |
| Total accumulated earnings (loss) | | | | (3,461,179) |
| Net Assets | | | $ | 122,357,798 |
Net Asset Value, offering price and redemption price per share ($122,357,798 ÷ 10,583,546 shares) | | | $ | 11.56 |
| Statement of Operations |
| Year ended August 31, 2024 |
| Investment Income | | | | |
| Interest | | | $ | 3,862,474 |
| Income from Fidelity Central Funds | | | | 67,559 |
| Total income | | | | 3,930,033 |
| Expenses | | | | |
| Management fee | $ | 666,316 | | |
| Independent trustees' fees and expenses | | 374 | | |
| Total expenses before reductions | | 666,690 | | |
| Expense reductions | | (84) | | |
| Total expenses after reductions | | | | 666,606 |
| Net Investment income (loss) | | | | 3,263,427 |
| Realized and Unrealized Gain (Loss) | | | | |
| Net realized gain (loss) on: | | | | |
| Investment Securities: | | | | |
| Unaffiliated issuers | | (586,262) | | |
| Fidelity Central Funds | | (53) | | |
| Total net realized gain (loss) | | | | (586,315) |
| Change in net unrealized appreciation (depreciation) on: | | | | |
| Investment Securities: | | | | |
| Unaffiliated issuers | | 5,184,308 | | |
| Fidelity Central Funds | | 5 | | |
| Total change in net unrealized appreciation (depreciation) | | | | 5,184,313 |
| Net gain (loss) | | | | 4,597,998 |
| Net increase (decrease) in net assets resulting from operations | | | $ | 7,861,425 |
| Statement of Changes in Net Assets |
| |
| | Year ended August 31, 2024 | | Year ended August 31, 2023 |
| Increase (Decrease) in Net Assets | | | | |
| Operations | | | | |
| Net investment income (loss) | $ | 3,263,427 | $ | 3,393,740 |
| Net realized gain (loss) | | (586,315) | | (1,548,566) |
| Change in net unrealized appreciation (depreciation) | | 5,184,313 | | 218,535 |
| Net increase (decrease) in net assets resulting from operations | | 7,861,425 | | 2,063,709 |
| Distributions to shareholders | | (3,142,432) | | (3,325,651) |
| | | | | |
| Share transactions | | | | |
| Proceeds from sales of shares | | 18,367,617 | | 15,773,231 |
| Reinvestment of distributions | | 2,153,759 | | 2,058,068 |
| Cost of shares redeemed | | (32,241,531) | | (37,072,350) |
| | | | | |
Net increase (decrease) in net assets resulting from share transactions | | (11,720,155) | | (19,241,051) |
| Total increase (decrease) in net assets | | (7,001,162) | | (20,502,993) |
| | | | | |
| Net Assets | | | | |
| Beginning of period | | 129,358,960 | | 149,861,953 |
| End of period | $ | 122,357,798 | $ | 129,358,960 |
| | | | | |
| Other Information | | | | |
| Shares | | | | |
| Sold | | 1,624,996 | | 1,418,888 |
| Issued in reinvestment of distributions | | 190,444 | | 184,558 |
| Redeemed | | (2,876,523) | | (3,332,944) |
| Net increase (decrease) | | (1,061,083) | | (1,729,498) |
| | | | | |
Financial Highlights
Fidelity® Arizona Municipal Income Fund |
| |
| Years ended August 31, | | 2024 | | 2023 | | 2022 | | 2021 | | 2020 |
Selected Per-Share Data | | | | | | | | | | |
| Net asset value, beginning of period | $ | 11.11 | $ | 11.21 | $ | 12.63 | $ | 12.53 | $ | 12.52 |
| Income from Investment Operations | | | | | | | | | | |
Net investment income (loss) A,B | | .304 | | .273 | | .248 | | .257 | | .277 |
| Net realized and unrealized gain (loss) | | .439 | | (.105) | | (1.379) | | .148 | | .009 |
| Total from investment operations | | .743 | | .168 | | (1.131) | | .405 | | .286 |
| Distributions from net investment income | | (.293) | | (.268) | | (.247) | | (.257) | | (.276) |
| Distributions from net realized gain | | - | | - | | (.042) | | (.048) | | - |
| Total distributions | | (.293) | | (.268) | | (.289) | | (.305) | | (.276) |
| Net asset value, end of period | $ | 11.56 | $ | 11.11 | $ | 11.21 | $ | 12.63 | $ | 12.53 |
Total Return C | | | | 1.52% | | (9.07)% | | 3.27% | | 2.33% |
Ratios to Average Net Assets B,D,E | | | | | | | | | | |
| Expenses before reductions | | .55% | | .55% | | .55% | | .55% | | .55% |
| Expenses net of fee waivers, if any | | | | .55% | | .55% | | .55% | | .55% |
| Expenses net of all reductions | | .55% | | .55% | | .55% | | .55% | | .55% |
| Net investment income (loss) | | 2.69% | | 2.45% | | 2.07% | | 2.04% | | 2.23% |
| Supplemental Data | | | | | | | | | | |
| Net assets, end of period (000 omitted) | $ | 122,358 | $ | 129,359 | $ | 149,862 | $ | 190,014 | $ | 178,875 |
Portfolio turnover rate F | | | | 15% | | 10% | | 8% | | 17% |
ACalculated based on average shares outstanding during the period.
BNet investment income (loss) is affected by the timing of the declaration of dividends by any underlying mutual funds or exchange-traded funds (ETFs). Net investment income (loss) of any mutual funds or ETFs is not included in the Fund's net investment income (loss) ratio.
CTotal returns would have been lower if certain expenses had not been reduced during the applicable periods shown.
DFees and expenses of any underlying mutual funds or exchange-traded funds (ETFs) are not included in the Fund's expense ratio. The Fund indirectly bears its proportionate share of these expenses. For additional expense information related to investments in Fidelity Central Funds, please refer to the "Investments in Fidelity Central Funds" note found in the Notes to Financial Statements section of the most recent Annual or Semi-Annual report.
EExpense ratios reflect operating expenses of the class. Expenses before reductions do not reflect amounts reimbursed, waived, or reduced through arrangements with the investment adviser, brokerage services, or other offset arrangements, if applicable, and do not represent the amount paid by the class during periods when reimbursements, waivers or reductions occur.
FAmount does not include the portfolio activity of any underlying mutual funds or exchange-traded funds (ETFs).
Notes to Financial Statements
For the period ended August 31, 2024
1. Organization.
Fidelity Arizona Municipal Income Fund (the Fund) is a non-diversified fund of Fidelity Union Street Trust (the Trust) and is authorized to issue an unlimited number of shares. Share transactions on the Statement of Changes in Net Assets may contain exchanges between affiliated funds. The Trust is registered under the Investment Company Act of 1940, as amended (the 1940 Act), as an open-end management investment company organized as a Massachusetts business trust. The Fund may be affected by economic and political developments in the state of Arizona.
2. Investments in Fidelity Central Funds.
Funds may invest in Fidelity Central Funds, which are open-end investment companies generally available only to other investment companies and accounts managed by the investment adviser and its affiliates. The Schedule of Investments lists any Fidelity Central Funds held as an investment as of period end, but does not include the underlying holdings of each Fidelity Central Fund. An investing fund indirectly bears its proportionate share of the expenses of the underlying Fidelity Central Funds.
Based on its investment objective, each Fidelity Central Fund may invest or participate in various investment vehicles or strategies that are similar to those of the investing fund. These strategies are consistent with the investment objectives of the investing fund and may involve certain economic risks which may cause a decline in value of each of the Fidelity Central Funds and thus a decline in the value of the investing fund.
| Fidelity Central Fund | Investment Manager | Investment Objective | Investment Practices | Expense RatioA |
| Fidelity Money Market Central Funds | Fidelity Management & Research Company LLC (FMR) | Each fund seeks to obtain a high level of current income consistent with the preservation of capital and liquidity. | Short-term Investments | Less than .005% |
A Expenses expressed as a percentage of average net assets and are as of each underlying Central Fund's most recent annual or semi-annual shareholder report.
A complete unaudited list of holdings for each Fidelity Central Fund is available upon request or at the Securities and Exchange Commission website at www.sec.gov. In addition, the financial statements of the Fidelity Central Funds which contain the significant accounting policies (including investment valuation policies) of those funds, and are not covered by the Report of Independent Registered Public Accounting Firm, are available on the Securities and Exchange Commission website or upon request.
3. Significant Accounting Policies.
The Fund is an investment company and applies the accounting and reporting guidance of the Financial Accounting Standards Board (FASB) Accounting Standards Codification Topic 946 Financial Services - Investment Companies. The financial statements have been prepared in conformity with accounting principles generally accepted in the United States of America (GAAP), which require management to make certain estimates and assumptions at the date of the financial statements. Actual results could differ from those estimates. Subsequent events, if any, through the date that the financial statements were issued have been evaluated in the preparation of the financial statements. The Fund's Schedule of Investments lists any underlying mutual funds or exchange-traded funds (ETFs) but does not include the underlying holdings of these funds. The following summarizes the significant accounting policies of the Fund:
Investment Valuation. Investments are valued as of 4:00 p.m. Eastern time on the last calendar day of the period. The Board of Trustees (the Board) has designated the Fund's investment adviser as the valuation designee responsible for the fair valuation function and performing fair value determinations as needed. The investment adviser has established a Fair Value Committee (the Committee) to carry out the day-to-day fair valuation responsibilities and has adopted policies and procedures to govern the fair valuation process and the activities of the Committee. In accordance with these fair valuation policies and procedures, which have been approved by the Board, the Fund attempts to obtain prices from one or more third party pricing services or brokers to value its investments. When current market prices, quotations or currency exchange rates are not readily available or reliable, investments will be fair valued in good faith by the Committee, in accordance with the policies and procedures. Factors used in determining fair value vary by investment type and may include market or investment specific events, transaction data, estimated cash flows, and market observations of comparable investments. The frequency that the fair valuation procedures are used cannot be predicted and they may be utilized to a significant extent. The Committee manages the Fund's fair valuation practices and maintains the fair valuation policies and procedures. The Fund's investment adviser reports to the Board information regarding the fair valuation process and related material matters.
The Fund categorizes the inputs to valuation techniques used to value its investments into a disclosure hierarchy consisting of three levels as shown below:
Level 1 - unadjusted quoted prices in active markets for identical investments
Level 2 - other significant observable inputs (including quoted prices for similar investments, interest rates, prepayment speeds, etc.)
Level 3 - unobservable inputs (including the Fund's own assumptions based on the best information available)
Valuation techniques used to value the Fund's investments by major category are as follows:
Debt securities, including restricted securities, are valued based on evaluated prices received from third party pricing services or from brokers who make markets in such securities. Municipal securities are valued by pricing services who utilize matrix pricing which considers yield or price of bonds of comparable quality, coupon, maturity and type or by broker-supplied prices. When independent prices are unavailable or unreliable, debt securities may be valued utilizing pricing methodologies which consider similar factors that would be used by third party pricing services. Debt securities are generally categorized as Level 2 in the hierarchy but may be Level 3 depending on the circumstances.
Investments in underlying funds, including the Fidelity Central Funds, are valued at their closing net asset value (NAV) each business day and are categorized as Level 1 in the hierarchy.
Changes in valuation techniques may result in transfers in or out of an assigned level within the disclosure hierarchy. The aggregate value of investments by input level as of August 31, 2024 is included at the end of the Fund's Schedule of Investments.
Investment Transactions and Income. For financial reporting purposes, the Fund's investment holdings and NAV include trades executed through the end of the last business day of the period. The NAV per share for processing shareholder transactions is calculated as of the close of business of the New York Stock Exchange (NYSE), normally 4:00 p.m. Eastern time and includes trades executed through the end of the prior business day. Gains and losses on securities sold are determined on the basis of identified cost. Income and capital gain distributions from Fidelity Central Funds, if any, are recorded on the ex-dividend date. Interest income is accrued as earned and includes coupon interest and amortization of premium and accretion of discount on debt securities as applicable. Debt obligations may be placed on non-accrual status and related interest income may be reduced by ceasing current accruals and writing off interest receivables when the collection of all or a portion of interest has become doubtful based on consistently applied procedures. A debt obligation is removed from non-accrual status when the issuer resumes interest payments or when collectability of interest is reasonably assured.
Expenses. Expenses directly attributable to a fund are charged to that fund. Expenses attributable to more than one fund are allocated among the respective funds on the basis of relative net assets or other appropriate methods. Expenses included in the accompanying financial statements reflect the expenses of that fund and do not include any expenses associated with any underlying mutual funds or exchange-traded funds. Although not included in a fund's expenses, a fund indirectly bears its proportionate share of these expenses through the net asset value of each underlying mutual fund or exchange-traded fund. Expense estimates are accrued in the period to which they relate and adjustments are made when actual amounts are known.
Income Tax Information and Distributions to Shareholders. Each year, the Fund intends to qualify as a regulated investment company under Subchapter M of the Internal Revenue Code, including distributing substantially all of its taxable income and realized gains. As a result, no provision for U.S. Federal income taxes is required. As of August 31, 2024, the Fund did not have any unrecognized tax benefits in the financial statements; nor is the Fund aware of any tax positions for which it is reasonably possible that the total amounts of unrecognized tax benefits will significantly change in the next twelve months. The Fund files a U.S. federal tax return, in addition to state and local tax returns as required. The Fund's federal income tax returns are subject to examination by the Internal Revenue Service (IRS) for a period of three fiscal years after they are filed. State and local tax returns may be subject to examination for an additional fiscal year depending on the jurisdiction.
Distributions are declared and recorded daily and paid monthly from net investment income. Distributions from realized gains, if any, are declared and recorded on the ex-dividend date. Income and capital gain distributions are determined in accordance with income tax regulations, which may differ from GAAP.
Capital accounts within the financial statements are adjusted for permanent book-tax differences. These adjustments have no impact on net assets or the results of operations. Capital accounts are not adjusted for temporary book-tax differences which will reverse in a subsequent period.
Book-tax differences are primarily due to market discount and capital loss carryforwards.
The Fund purchases municipal securities whose interest, in the opinion of the issuer, is free from federal income tax. There is no assurance that the IRS will agree with this opinion. In the event the IRS determines that the issuer does not comply with relevant tax requirements, interest payments from a security could become federally taxable, possibly retroactively to the date the security was issued.
As of period end, the cost and unrealized appreciation (depreciation) in securities, and derivatives if applicable, for federal income tax purposes were as follows:
| Gross unrealized appreciation | $2,908,236 |
| Gross unrealized depreciation | (4,003,745) |
| Net unrealized appreciation (depreciation) | $(1,095,509) |
| Tax Cost | $122,377,402 |
The tax-based components of distributable earnings as of period end were as follows:
| Undistributed tax-exempt income | $12,577 |
| Undistributed ordinary income | $519 |
| Capital loss carryforward | $(2,378,766) |
| Net unrealized appreciation (depreciation) on securities and other investments | $(1,095,509) |
Capital loss carryforwards are only available to offset future capital gains of the Fund to the extent provided by regulations and may be limited. The capital loss carryforward information presented below, including any applicable limitation, is estimated as of fiscal period end and is subject to adjustment.
Short-term | $(657,104) |
Long-term | (1,721,662) |
| Total capital loss carryforward | $(2,378,766) |
The tax character of distributions paid was as follows:
| | August 31, 2024 | August 31, 2023 |
| Tax-exempt Income | $3,142,432 | $3,325,651 |
Restricted Securities (including Private Placements). Funds may invest in securities that are subject to legal or contractual restrictions on resale. These securities generally may be resold in transactions exempt from registration or to the public if the securities are registered. Disposal of these securities may involve time-consuming negotiations and expense, and prompt sale at an acceptable price may be difficult. Information regarding restricted securities held at period end is included at the end of the Schedule of Investments, if applicable.
4. Purchases and Sales of Investments.
Purchases and sales of securities, other than short-term securities and in-kind transactions, as applicable, are noted in the table below.
| | Purchases ($) | Sales ($) |
| Fidelity Arizona Municipal Income Fund | 8,341,577 | 17,450,165 |
5. Fees and Other Transactions with Affiliates.
Management Fee. Fidelity Management & Research Company LLC (the investment adviser) and its affiliates provide the Fund with investment management related services for which the Fund pays a monthly management fee that is based on an annual rate of .55% of the Fund's average net assets. Under the management contract, the investment adviser pays all other expenses, except the compensation of the independent Trustees and certain other expenses such as interest expense. The management fee is reduced by an amount equal to the fees and expenses paid by the Fund to the independent Trustees.
Interfund Trades. Funds may purchase from or sell securities to other Fidelity Funds under procedures adopted by the Board. The procedures have been designed to ensure these interfund trades are executed in accordance with Rule 17a-7 of the 1940 Act. Any interfund trades are included within the respective purchases and sales amounts shown in the Purchases and Sales of Investments note. During the period, there were no interfund trades.
Sub-Advisory Arrangements. Effective March 1, 2024, the Fund's sub-advisory agreements with FMR Investment Management (UK) Limited, Fidelity Management & Research (Hong Kong) Limited, and Fidelity Management & Research (Japan) Limited were amended to provide that the investment adviser pays each sub-adviser monthly fees equal to 110% of the sub-adviser's costs for providing sub-advisory services.
6. Committed Line of Credit.
Certain Funds participate with other funds managed by the investment adviser or an affiliate in a $4.25 billion credit facility (the "line of credit") to be utilized for temporary or emergency purposes to fund shareholder redemptions or for other short-term liquidity purposes. The commitment fees on the pro-rata portion of the line of credit are borne by the investment adviser. During the period, there were no borrowings on this line of credit.
7. Expense Reductions.
Through arrangements with the Fund's custodian, credits realized as a result of certain uninvested cash balances were used to reduce the Fund's expenses by $84.
8. Other.
A fund's organizational documents provide former and current trustees and officers with a limited indemnification against liabilities arising in connection with the performance of their duties to the fund. In the normal course of business, a fund may also enter into contracts that provide general indemnifications. A fund's maximum exposure under these arrangements is unknown as this would be dependent on future claims that may be made against a fund. The risk of material loss from such claims is considered remote.
9. Risk and Uncertainties.
Many factors affect a fund's performance. Developments that disrupt global economies and financial markets, such as pandemics, epidemics, outbreaks of infectious diseases, war, terrorism, and environmental disasters, may significantly affect a fund's investment performance. The effects of these developments to a fund will be impacted by the types of securities in which a fund invests, the financial condition, industry, economic sector, and geographic location of an issuer, and a fund's level of investment in the securities of that issuer. Significant concentrations in security types, issuers, industries, sectors, and geographic locations may magnify the factors that affect a fund's performance.
Report of Independent Registered Public Accounting Firm
To the Board of Trustees of Fidelity Union Street Trust and Shareholders of Fidelity Arizona Municipal Income Fund
Opinion on the Financial Statements
We have audited the accompanying statement of assets and liabilities, including the schedule of investments, of Fidelity Arizona Municipal Income Fund (one of the funds constituting Fidelity Union Street Trust, referred to hereafter as the "Fund") as of August 31, 2024, the related statement of operations for the year ended August 31, 2024, the statement of changes in net assets for each of the two years in the period ended August 31, 2024, including the related notes, and the financial highlights for each of the five years in the period ended August 31, 2024 (collectively referred to as the "financial statements"). In our opinion, the financial statements present fairly, in all material respects, the financial position of the Fund as of August 31, 2024, the results of its operations for the year then ended, the changes in its net assets for each of the two years in the period ended August 31, 2024 and the financial highlights for each of the five years in the period ended August 31, 2024 in conformity with accounting principles generally accepted in the United States of America.
Basis for Opinion
These financial statements are the responsibility of the Fund's management. Our responsibility is to express an opinion on the Fund's financial statements based on our audits. We are a public accounting firm registered with the Public Company Accounting Oversight Board (United States) (PCAOB) and are required to be independent with respect to the Fund in accordance with the U.S. federal securities laws and the applicable rules and regulations of the Securities and Exchange Commission and the PCAOB.
We conducted our audits of these financial statements in accordance with the standards of the PCAOB. Those standards require that we plan and perform the audit to obtain reasonable assurance about whether the financial statements are free of material misstatement, whether due to error or fraud.
Our audits included performing procedures to assess the risks of material misstatement of the financial statements, whether due to error or fraud, and performing procedures that respond to those risks. Such procedures included examining, on a test basis, evidence regarding the amounts and disclosures in the financial statements. Our audits also included evaluating the accounting principles used and significant estimates made by management, as well as evaluating the overall presentation of the financial statements. Our procedures included confirmation of securities owned as of August 31, 2024 by correspondence with the custodian. We believe that our audits provide a reasonable basis for our opinion.
/s/ PricewaterhouseCoopers LLP
Boston, Massachusetts
October 14, 2024
We have served as the auditor of one or more investment companies in the Fidelity group of funds since 1932.
Distributions
(Unaudited)
The dividend and capital gains distributions for the fund(s) are available on Fidelity.com or Institutional.Fidelity.com.
During fiscal year ended 2024, 100% of the fund's income dividends was free from federal income tax, and 12.55% of the fund's income dividends was subject to the federal alternative minimum tax.
The fund will notify shareholders in January 2025 of amounts for use in preparing 2024 income tax returns.
Item 8: Changes in and Disagreements with Accountants for Open-End Management Investment Companies
(Unaudited)
Note: This is not applicable for any fund included in this document.
Item 9: Proxy Disclosures for Open-End Management Investment Companies
(Unaudited)
| A special meeting of shareholders was held on October 18, 2023. The results of votes taken among shareholders on the proposal before them are reported below. Each vote reported represents one dollar of net asset value held on the record date for the meeting. |
| Proposal 1 |
| To elect a Board of Trustees. |
| | # of Votes | % of Votes |
| Abigail P. Johnson |
| Affirmative | 242,066,552.08 | 91.65 |
| Withheld | 22,039,917.22 | 8.35 |
| TOTAL | 264,106,469.30 | 100.00 |
| Jennifer Toolin McAuliffe |
| Affirmative | 242,066,552.08 | 91.65 |
| Withheld | 22,039,917.22 | 8.35 |
| TOTAL | 264,106,469.30 | 100.00 |
| Christine J. Thompson |
| Affirmative | 242,066,017.16 | 91.65 |
| Withheld | 22,040,452.14 | 8.35 |
| TOTAL | 264,106,469.30 | 100.00 |
| Elizabeth S. Acton |
| Affirmative | 244,676,369.77 | 92.64 |
| Withheld | 19,430,099.53 | 7.36 |
| TOTAL | 264,106,469.30 | 100.00 |
| Laura M. Bishop |
| Affirmative | 241,054,335.83 | 91.27 |
| Withheld | 23,052,133.47 | 8.73 |
| TOTAL | 264,106,469.30 | 100.00 |
| Ann E. Dunwoody |
| Affirmative | 244,728,263.98 | 92.66 |
| Withheld | 19,378,205.32 | 7.34 |
| TOTAL | 264,106,469.30 | 100.00 |
| John Engler |
| Affirmative | 237,382,398.28 | 89.88 |
| Withheld | 26,724,071.02 | 10.12 |
| TOTAL | 264,106,469.30 | 100.00 |
| Robert F. Gartland |
| Affirmative | 245,243,912.81 | 92.86 |
| Withheld | 18,862,556.49 | 7.14 |
| TOTAL | 264,106,469.30 | 100.00 |
| Robert W. Helm |
| Affirmative | 245,243,377.92 | 92.86 |
| Withheld | 18,863,091.38 | 7.14 |
| TOTAL | 264,106,469.30 | 100.00 |
| Arthur E. Johnson |
| Affirmative | 241,003,897.25 | 91.25 |
| Withheld | 23,102,572.05 | 8.75 |
| TOTAL | 264,106,469.30 | 100.00 |
| Michael E. Kenneally |
| Affirmative | 241,518,090.53 | 91.45 |
| Withheld | 22,588,378.77 | 8.55 |
| TOTAL | 264,106,469.30 | 100.00 |
| Mark A. Murray |
| Affirmative | 245,191,483.71 | 92.84 |
| Withheld | 18,914,985.59 | 7.16 |
| TOTAL | 264,106,469.30 | 100.00 |
| Carol J. Zierhoffer |
| Affirmative | 241,002,441.62 | 91.25 |
| Withheld | 23,104,027.68 | 8.75 |
| TOTAL | 264,106,469.30 | 100.00 |
| | | |
| Proposal 1 reflects trust-wide proposal and voting results. |
Item 10: Remuneration Paid to Directors, Officers, and others of Open-End Management Investment Companies
(Unaudited)
Note: This information is disclosed as part of the financial statements for each Fund as part of Item 7: Financial Statements and Financial Highlights for Open-End Management Investment companies.
Item 11: Statement Regarding Basis for Approval of Investment Advisory Contract
(Unaudited)
Note: This is not applicable for any fund included in this document.
1.536826.127
AZI-SPZ-ANN-1024
Fidelity® Maryland Municipal Income Fund
Annual Report
August 31, 2024
Contents
To view a fund's proxy voting guidelines and proxy voting record for the 12-month period ended June 30, visit http://www.fidelity.com/proxyvotingresults or visit the Securities and Exchange Commission's (SEC) web site at http://www.sec.gov.
You may also call 1-800-544-8544 to request a free copy of the proxy voting guidelines.
Standard & Poor's, S&P and S&P 500 are registered service marks of The McGraw-Hill Companies, Inc. and have been licensed for use by Fidelity Distributors Corporation.
Other third-party marks appearing herein are the property of their respective owners.
All other marks appearing herein are registered or unregistered trademarks or service marks of FMR LLC or an affiliated company. © 2024 FMR LLC. All rights reserved.
This report and the financial statements contained herein are submitted for the general information of the shareholders of the Fund. This report is not authorized for distribution to prospective investors in the Fund unless preceded or accompanied by an effective prospectus.
A fund files its complete schedule of portfolio holdings with the SEC for the first and third quarters of each fiscal year on Form N-PORT. Forms N-PORT are available on the SEC's web site at http://www.sec.gov. A fund's Forms N-PORT may be reviewed and copied at the SEC's Public Reference Room in Washington, DC. Information regarding the operation of the SEC's Public Reference Room may be obtained by calling 1-800-SEC-0330.
For a complete list of a fund's portfolio holdings, view the most recent holdings listing, semiannual report, or annual report on Fidelity's web site at http://www.fidelity.com, http://www.institutional.fidelity.com, or http://www.401k.com, as applicable.
NOT FDIC INSURED •MAY LOSE VALUE •NO BANK GUARANTEE
Neither the Fund nor Fidelity Distributors Corporation is a bank.
Item 7: Financial Statements and Financial Highlights for Open-End Management Investment Companies (Annual Report)
Fidelity® Maryland Municipal Income Fund
Schedule of Investments August 31, 2024
Showing Percentage of Net Assets
| Municipal Bonds - 93.4% |
| | | Principal Amount (a) | Value ($) |
| District Of Columbia - 1.3% | | | |
| Washington D.C. Metropolitan Transit Auth. Rev. Series 2017 B, 5% 7/1/33 | | 2,000,000 | 2,095,663 |
| Maryland - 90.7% | | | |
| Anne Arundel County Gen. Oblig. Series 2021, 3% 10/1/37 | | 1,300,000 | 1,205,979 |
| Baltimore Convention Ctr. Hotel Rev. Series 2017, 5% 9/1/32 | | 1,500,000 | 1,511,868 |
| Baltimore County Gen. Oblig.: | | | |
| Series 2019, 4% 11/1/33 | | 1,805,000 | 1,886,563 |
| Series 2020: | | | |
4% 1/1/32 | | 700,000 | 716,140 |
4% 1/1/33 | | 1,200,000 | 1,224,530 |
4% 1/1/35 | | 1,230,000 | 1,247,671 |
4% 1/1/37 | | 1,500,000 | 1,508,042 |
4% 1/1/45 | | 1,750,000 | 1,630,721 |
4% 1/1/50 | | 2,400,000 | 2,156,450 |
| Series 2021: | | | |
3% 3/1/37 | | 1,000,000 | 933,018 |
3% 3/1/39 | | 3,220,000 | 2,910,206 |
| Baltimore Gen. Oblig.: | | | |
| (East Baltimore Research Park Proj.) Series 2017 A, 5% 9/1/38 | | 1,650,000 | 1,667,743 |
| Series 2017 A: | | | |
5% 10/15/34 | | 2,000,000 | 2,105,686 |
5% 10/15/36 | | 1,000,000 | 1,047,677 |
5% 10/15/37 | | 1,005,000 | 1,051,607 |
| Series 2022 A, 5% 10/15/36 | | 1,565,000 | 1,788,437 |
| Baltimore Proj. Rev.: | | | |
| (Wastewtr. Projs.) Series 2014 C, 5% 7/1/34 | | 1,285,000 | 1,290,049 |
| (Wtr. Projs.): | | | |
Series 2014 A, 5% 7/1/33 | | 3,000,000 | 3,012,145 |
Series 2020 A, 5% 7/1/50 | | 2,490,000 | 2,634,499 |
| Series 2017 D, 5% 7/1/31 | | 5,260,000 | 5,494,407 |
| Charles County Gen. Oblig.: | | | |
| Series 2017: | | | |
2.8% 10/1/31 | | 1,105,000 | 1,058,970 |
2.9% 10/1/32 | | 1,960,000 | 1,879,490 |
| Series 2020, 1.625% 10/1/33 | | 2,505,000 | 2,019,071 |
| City of Westminster Series 2016, 5% 11/1/31 | | 1,000,000 | 1,027,567 |
| Frederick County Gen. Oblig. Series 2021 A: | | | |
| 1.5% 10/1/33 | | 2,000,000 | 1,589,329 |
| 1.75% 10/1/37 | | 2,000,000 | 1,489,915 |
| Harford County Gen. Oblig. Series 2018: | | | |
| 2.85% 9/15/31 | | 1,820,000 | 1,752,763 |
| 2.95% 9/15/32 | | 1,045,000 | 1,007,400 |
| 3.05% 9/15/34 | | 260,000 | 254,060 |
| 3.15% 9/15/36 | | 670,000 | 642,887 |
| Howard County Hsg. Commn Lease (Roger Carter Recreation Ctr. Proj.) Series 2021, 2% 6/1/39 | | 755,000 | 567,153 |
| Maryland Cmnty. Dev. Admin Dept. Hsg. & Cmnty. Dev.: | | | |
| Series 2019 B, 4% 9/1/49 | | 440,000 | 441,935 |
| Series 2019 C: | | | |
3.5% 3/1/50 | | 760,000 | 757,458 |
5% 9/1/29 | | 550,000 | 595,982 |
5% 3/1/30 | | 700,000 | 749,672 |
5% 3/1/31 | | 1,150,000 | 1,230,483 |
| Series 2020 A: | | | |
2.5% 9/1/40 | | 1,000,000 | 796,725 |
2.6% 3/1/42 | | 3,490,000 | 2,717,988 |
| Series 2021 B, 3% 9/1/51 | | 1,135,000 | 1,114,899 |
| Series 2023 E, 6.25% 3/1/54 | | 1,950,000 | 2,148,452 |
| Maryland Dept. of Trans.: | | | |
| Series 2021 A: | | | |
2% 10/1/34 | | 2,225,000 | 1,851,305 |
3% 10/1/32 | | 570,000 | 551,938 |
| Series 2021 B: | | | |
4% 8/1/51 (b) | | 2,005,000 | 1,865,731 |
5% 8/1/46 (b) | | 2,000,000 | 2,076,562 |
| Maryland Econ. Dev. Auth. Rev.: | | | |
| (Ports America Chesapeake LLC. Proj.) Series 2017 A, 5% 6/1/29 | | 1,850,000 | 1,958,120 |
| (Term. Proj.) Series 2019 A: | | | |
5% 6/1/44 (b) | | 500,000 | 516,199 |
5% 6/1/49 (b) | | 1,000,000 | 1,024,344 |
| Maryland Econ. Dev. Corp. (Purple Line Lt. Rail Proj.) Series 2022 B: | | | |
| 5% 6/30/37 (b) | | 2,465,000 | 2,634,094 |
| 5.25% 6/30/55 (b) | | 1,000,000 | 1,040,707 |
| Maryland Econ. Dev. Corp. Air Cargo Series 2019: | | | |
| 5% 7/1/27 (b) | | 200,000 | 208,412 |
| 5% 7/1/28 (b) | | 630,000 | 664,749 |
| 5% 7/1/29 (b) | | 585,000 | 624,970 |
| Maryland Econ. Dev. Corp. Student Hsg. Rev.: | | | |
| (Morgan State Univ. Proj.) Series 2022 A, 5.75% 7/1/53 | | 1,000,000 | 1,094,498 |
| (Towson Univ. Proj.) Series 2017: | | | |
5% 7/1/26 | | 350,000 | 358,606 |
5% 7/1/28 | | 305,000 | 316,191 |
5% 7/1/29 | | 185,000 | 191,625 |
5% 7/1/30 | | 250,000 | 258,335 |
5% 7/1/31 | | 300,000 | 309,234 |
5% 7/1/32 | | 325,000 | 334,290 |
5% 7/1/36 | | 500,000 | 510,713 |
| (Univ. of Maryland, Baltimore County Proj.) Series 2016: | | | |
5% 7/1/28 (Assured Guaranty Muni. Corp. Insured) | | 350,000 | 361,761 |
5% 7/1/29 (Assured Guaranty Muni. Corp. Insured) | | 700,000 | 722,232 |
| (Univ. of Maryland, College Park Projs.) Series 2016, 5% 6/1/43 (Assured Guaranty Muni. Corp. Insured) | | 575,000 | 583,804 |
| Maryland Gen. Oblig. Series 2016 1, 3% 6/1/31 | | 1,085,000 | 1,074,283 |
| Maryland Health & Higher Edl.: | | | |
| Series 2020: | | | |
4% 7/1/40 | | 300,000 | 294,841 |
4% 7/1/45 | | 750,000 | 723,804 |
4% 7/1/50 | | 1,000,000 | 949,398 |
| Series 2021 A: | | | |
2.5% 7/1/51 | | 5,000,000 | 3,228,456 |
3% 7/1/51 | | 1,000,000 | 772,437 |
4% 6/1/39 | | 475,000 | 453,066 |
4% 6/1/40 | | 500,000 | 471,569 |
4% 6/1/55 | | 500,000 | 441,457 |
| Series 2023, 5% 7/1/39 | | 1,000,000 | 1,075,760 |
| Series 2024, 5.25% 6/1/44 | | 1,000,000 | 1,061,849 |
| Maryland Health & Higher Edl. Facilities Auth. Rev.: | | | |
| (Anne Arundel Med. Ctr., MD Proj.) Series 2017 A: | | | |
5% 7/1/28 | | 520,000 | 541,500 |
5% 7/1/30 | | 850,000 | 881,532 |
5% 7/1/31 | | 1,400,000 | 1,448,714 |
5% 7/1/32 | | 290,000 | 299,437 |
| Series 2013 B, 5% 8/15/38 | | 2,000,000 | 2,001,993 |
| Series 2015: | | | |
4% 8/15/45 | | 250,000 | 245,125 |
5% 7/1/31 | | 2,200,000 | 2,236,899 |
5% 7/1/33 | | 1,325,000 | 1,340,682 |
5% 7/1/34 | | 1,200,000 | 1,213,552 |
| Series 2016 A: | | | |
4% 7/1/42 | | 2,175,000 | 2,036,866 |
5% 7/1/35 | | 1,500,000 | 1,530,112 |
5% 7/1/38 | | 3,215,000 | 3,263,017 |
5.5% 1/1/31 | | 1,500,000 | 1,557,766 |
| Series 2016: | | | |
5% 6/1/26 | | 300,000 | 307,648 |
5% 6/1/27 | | 255,000 | 261,221 |
5% 6/1/28 | | 310,000 | 317,403 |
5% 6/1/29 | | 350,000 | 358,047 |
5% 7/1/31 | | 500,000 | 517,281 |
5% 6/1/33 | | 305,000 | 310,514 |
5% 6/1/36 | | 250,000 | 253,982 |
| Series 2017: | | | |
4% 7/1/42 | | 2,845,000 | 2,744,818 |
5% 6/1/27 (Pre-Refunded to 6/1/26 @ 100) | | 290,000 | 301,558 |
5% 6/1/31 (Pre-Refunded to 6/1/26 @ 100) | | 425,000 | 441,939 |
| Series 2019 A, 5% 10/1/49 | | 2,000,000 | 2,092,554 |
| Series 2020 A: | | | |
5% 7/1/34 | | 1,000,000 | 1,070,957 |
5% 7/1/35 | | 1,000,000 | 1,069,935 |
| Series 2020 B: | | | |
5% 4/15/34 | | 1,010,000 | 1,104,650 |
5% 4/15/35 | | 1,000,000 | 1,090,708 |
| Maryland St Stad Auth. Lease Rev. Series 2019 C, 3% 12/15/34 | | 545,000 | 522,350 |
| Maryland Stadium Auth. Built to Learn Rev.: | | | |
| Series 2021: | | | |
2.75% 6/1/51 | | 1,000,000 | 710,177 |
4% 6/1/46 | | 1,000,000 | 990,796 |
4% 6/1/51 | | 1,000,000 | 966,952 |
| Series 2022 A, 4% 6/1/36 | | 1,875,000 | 1,955,840 |
| Maryland Stadium Auth. Rev. (Pub. Schools Construction and Revitalization Prog.): | | | |
| Series 2016, 5% 5/1/30 | | 1,715,000 | 1,767,429 |
| Series 2018 A, 5% 5/1/36 | | 1,580,000 | 1,664,279 |
| Maryland Trans. Auth. Trans. Facility Projs. Rev.: | | | |
| Series 2020, 5% 7/1/36 | | 490,000 | 540,942 |
| Series 2021 A: | | | |
2.5% 7/1/47 | | 2,000,000 | 1,394,355 |
3% 7/1/37 | | 1,620,000 | 1,510,480 |
| Montgomery County Gen. Oblig. Series A, 4% 11/1/33 | | 3,000,000 | 3,135,561 |
| Montgomery County Hsg. Opportunities Commission Series 2023 C, 5.75% 1/1/58 | | 500,000 | 572,707 |
| Prince Georges County Ctfs. of Prtn.: | | | |
| Series 2018, 5% 10/1/48 | | 2,100,000 | 2,187,266 |
| Series 2021: | | | |
4% 10/1/39 | | 1,205,000 | 1,236,617 |
4% 10/1/40 | | 1,255,000 | 1,277,897 |
| Prince Georges County Gen. Oblig.: | | | |
| Series 2020 A, 5% 7/15/34 | | 1,010,000 | 1,085,385 |
| Series 2021 A, 2% 7/1/35 | | 1,000,000 | 829,800 |
| Salisbury Gen. Oblig. Series 2021, 3% 9/1/30 | | 305,000 | 302,150 |
| Washington Metropolitan Area Transit Auth. Series 2021 A: | | | |
| 3% 7/15/36 | | 400,000 | 379,503 |
| 5% 7/15/46 | | 3,350,000 | 3,587,052 |
TOTAL MARYLAND | | | 148,928,925 |
| Puerto Rico - 1.4% | | | |
| Puerto Rico Commonwealth Aqueduct & Swr. Auth. Series 2021 B, 5% 7/1/37 (c) | | 445,000 | 467,486 |
| Puerto Rico Commonwealth Pub. Impt. Gen. Oblig. Series 2021 A1: | | | |
| 0% 7/1/33 | | 505,310 | 339,885 |
| 5.625% 7/1/27 | | 55,000 | 57,267 |
| 5.625% 7/1/29 | | 185,000 | 198,903 |
| 5.75% 7/1/31 | | 445,000 | 492,691 |
| Puerto Rico Sales Tax Fing. Corp. Sales Tax Rev.: | | | |
| Series 2018 A1, 4.55% 7/1/40 | | 335,000 | 335,646 |
| Series 2019 A2, 4.329% 7/1/40 | | 320,000 | 316,011 |
TOTAL PUERTO RICO | | | 2,207,889 |
| TOTAL MUNICIPAL BONDS (Cost $155,644,292) | | | 153,232,477 |
| | | | |
| Money Market Funds - 5.7% |
| | | Shares | Value ($) |
Fidelity Municipal Cash Central Fund 3.22% (d)(e) (Cost $9,404,253) | | 9,402,373 | 9,404,253 |
| | | | |
| TOTAL INVESTMENT IN SECURITIES - 99.1% (Cost $165,048,545) | 162,636,730 |
NET OTHER ASSETS (LIABILITIES) - 0.9% | 1,548,171 |
| NET ASSETS - 100.0% | 164,184,901 |
| | |
Legend
| (a) | Amount is stated in United States dollars unless otherwise noted. |
| (b) | Private activity obligations whose interest is subject to the federal alternative minimum tax for individuals. |
| (c) | Security exempt from registration under Rule 144A of the Securities Act of 1933. These securities may be resold in transactions exempt from registration, normally to qualified institutional buyers. At the end of the period, the value of these securities amounted to $467,486 or 0.3% of net assets. |
| (d) | Information in this report regarding holdings by state and security types does not reflect the holdings of the Fidelity Municipal Cash Central Fund. |
| (e) | Affiliated fund that is generally available only to investment companies and other accounts managed by Fidelity Investments. The rate quoted is the annualized seven-day yield of the fund at period end. A complete unaudited listing of the fund's holdings as of its most recent quarter end is available upon request. In addition, each Fidelity Central Fund's financial statements, which are not covered by the Fund's Report of Independent Registered Public Accounting Firm, are available on the SEC's website or upon request. |
Affiliated Central Funds
Fiscal year to date information regarding the Fund's investments in Fidelity Central Funds, including the ownership percentage, is presented below.
| Affiliate | Value, beginning of period ($) | Purchases ($) | Sales Proceeds ($) | Dividend Income ($) | Realized Gain (loss) ($) | Change in Unrealized appreciation (depreciation) ($) | Value, end of period ($) | % ownership, end of period |
| Fidelity Municipal Cash Central Fund 3.22% | 1,088,000 | 48,742,743 | 40,426,680 | 108,335 | 190 | - | 9,404,253 | 0.4% |
| Total | 1,088,000 | 48,742,743 | 40,426,680 | 108,335 | 190 | - | 9,404,253 | |
| | | | | | | | | |
Amounts in the dividend income column in the above table include any capital gain distributions from underlying funds, which are presented in the corresponding line item in the Statement of Operations, if applicable.
Amounts included in the purchases and sales proceeds columns may include in-kind transactions, if applicable.
Investment Valuation
The following is a summary of the inputs used, as of August 31, 2024, involving the Fund's assets and liabilities carried at fair value. The inputs or methodology used for valuing securities may not be an indication of the risk associated with investing in those securities. For more information on valuation inputs, and their aggregation into the levels used below, please refer to the Investment Valuation section in the accompanying Notes to Financial Statements.
| Valuation Inputs at Reporting Date: |
| Description | Total ($) | Level 1 ($) | Level 2 ($) | Level 3 ($) |
Investments in Securities: | | | | |
|
| Municipal Securities | 153,232,477 | - | 153,232,477 | - |
|
| Money Market Funds | 9,404,253 | 9,404,253 | - | - |
| Total Investments in Securities: | 162,636,730 | 9,404,253 | 153,232,477 | - |
Financial Statements
| Statement of Assets and Liabilities |
As of August 31, 2024 |
| Assets | | | | |
| Investment in securities, at value - See accompanying schedule: | | | | |
Unaffiliated issuers (cost $155,644,292) | $ | 153,232,477 | | |
Fidelity Central Funds (cost $9,404,253) | | 9,404,253 | | |
| | | | | |
| | | | | |
| Total Investment in Securities (cost $165,048,545) | | | $ | 162,636,730 |
| Cash | | | | 97,604 |
| Receivable for fund shares sold | | | | 104,613 |
| Interest receivable | | | | 1,680,883 |
| Distributions receivable from Fidelity Central Funds | | | | 7,259 |
| Other receivables | | | | 2 |
Total assets | | | | 164,527,091 |
| Liabilities | | | | |
| Payable for fund shares redeemed | $ | 134,469 | | |
| Distributions payable | | 131,567 | | |
| Accrued management fee | | 76,154 | | |
| Total liabilities | | | | 342,190 |
| Net Assets | | | $ | 164,184,901 |
| Net Assets consist of: | | | | |
| Paid in capital | | | $ | 170,224,856 |
| Total accumulated earnings (loss) | | | | (6,039,955) |
| Net Assets | | | $ | 164,184,901 |
Net Asset Value, offering price and redemption price per share ($164,184,901 ÷ 15,183,973 shares) | | | $ | 10.81 |
| Statement of Operations |
| Year ended August 31, 2024 |
| Investment Income | | | | |
| Interest | | | $ | 5,538,500 |
| Income from Fidelity Central Funds | | | | 108,335 |
| Total income | | | | 5,646,835 |
| Expenses | | | | |
| Management fee | $ | 936,180 | | |
| Independent trustees' fees and expenses | | 517 | | |
| Total expenses before reductions | | 936,697 | | |
| Expense reductions | | (190) | | |
| Total expenses after reductions | | | | 936,507 |
| Net Investment income (loss) | | | | 4,710,328 |
| Realized and Unrealized Gain (Loss) | | | | |
| Net realized gain (loss) on: | | | | |
| Investment Securities: | | | | |
| Unaffiliated issuers | | (1,251,111) | | |
| Fidelity Central Funds | | 190 | | |
| Total net realized gain (loss) | | | | (1,250,921) |
| Change in net unrealized appreciation (depreciation) on investment securities | | | | 7,026,903 |
| Net gain (loss) | | | | 5,775,982 |
| Net increase (decrease) in net assets resulting from operations | | | $ | 10,486,310 |
| Statement of Changes in Net Assets |
| |
| | Year ended August 31, 2024 | | Year ended August 31, 2023 |
| Increase (Decrease) in Net Assets | | | | |
| Operations | | | | |
| Net investment income (loss) | $ | 4,710,328 | $ | 3,998,995 |
| Net realized gain (loss) | | (1,250,921) | | (1,136,083) |
| Change in net unrealized appreciation (depreciation) | | 7,026,903 | | (752,347) |
| Net increase (decrease) in net assets resulting from operations | | 10,486,310 | | 2,110,565 |
| Distributions to shareholders | | (4,349,735) | | (3,932,743) |
| | | | | |
| Share transactions | | | | |
| Proceeds from sales of shares | | 47,273,341 | | 65,338,292 |
| Reinvestment of distributions | | 2,710,305 | | 2,711,242 |
| Cost of shares redeemed | | (58,143,227) | | (76,367,564) |
| | | | | |
Net increase (decrease) in net assets resulting from share transactions | | (8,159,581) | | (8,318,030) |
| Total increase (decrease) in net assets | | (2,023,006) | | (10,140,208) |
| | | | | |
| Net Assets | | | | |
| Beginning of period | | 166,207,907 | | 176,348,115 |
| End of period | $ | 164,184,901 | $ | 166,207,907 |
| | | | | |
| Other Information | | | | |
| Shares | | | | |
| Sold | | 4,576,210 | | 6,296,010 |
| Issued in reinvestment of distributions | | 255,950 | | 258,715 |
| Redeemed | | (5,568,142) | | (7,383,091) |
| Net increase (decrease) | | (735,982) | | (828,366) |
| | | | | |
Financial Highlights
Fidelity® Maryland Municipal Income Fund |
| |
| Years ended August 31, | | 2024 | | 2023 | | 2022 | | 2021 | | 2020 |
Selected Per-Share Data | | | | | | | | | | |
| Net asset value, beginning of period | $ | 10.44 | $ | 10.53 | $ | 11.88 | $ | 11.69 | $ | 11.78 |
| Income from Investment Operations | | | | | | | | | | |
Net investment income (loss) A,B | | .293 | | .254 | | .233 | | .239 | | .257 |
| Net realized and unrealized gain (loss) | | .348 | | (.094) | | (1.305) | | .232 | | (.090) |
| Total from investment operations | | .641 | | .160 | | (1.072) | | .471 | | .167 |
| Distributions from net investment income | | (.271) | | (.250) | | (.234) | | (.239) | | (.257) |
| Distributions from net realized gain | | - | | - | | (.044) | | (.042) | | - |
| Total distributions | | (.271) | | (.250) | | (.278) | | (.281) | | (.257) |
| Net asset value, end of period | $ | 10.81 | $ | 10.44 | $ | 10.53 | $ | 11.88 | $ | 11.69 |
Total Return C | | | | 1.54% | | (9.15)% | | 4.08% | | 1.45% |
Ratios to Average Net Assets B,D,E | | | | | | | | | | |
| Expenses before reductions | | .55% | | .55% | | .55% | | .55% | | .55% |
| Expenses net of fee waivers, if any | | | | .55% | | .55% | | .55% | | .55% |
| Expenses net of all reductions | | .55% | | .55% | | .55% | | .55% | | .55% |
| Net investment income (loss) | | 2.77% | | 2.42% | | 2.08% | | 2.03% | | 2.21% |
| Supplemental Data | | | | | | | | | | |
| Net assets, end of period (000 omitted) | $ | 164,185 | $ | 166,208 | $ | 176,348 | $ | 232,515 | $ | 222,833 |
Portfolio turnover rate F | | | | 12% | | 10% | | 10% | | 19% |
ACalculated based on average shares outstanding during the period.
BNet investment income (loss) is affected by the timing of the declaration of dividends by any underlying mutual funds or exchange-traded funds (ETFs). Net investment income (loss) of any mutual funds or ETFs is not included in the Fund's net investment income (loss) ratio.
CTotal returns would have been lower if certain expenses had not been reduced during the applicable periods shown.
DFees and expenses of any underlying mutual funds or exchange-traded funds (ETFs) are not included in the Fund's expense ratio. The Fund indirectly bears its proportionate share of these expenses. For additional expense information related to investments in Fidelity Central Funds, please refer to the "Investments in Fidelity Central Funds" note found in the Notes to Financial Statements section of the most recent Annual or Semi-Annual report.
EExpense ratios reflect operating expenses of the class. Expenses before reductions do not reflect amounts reimbursed, waived, or reduced through arrangements with the investment adviser, brokerage services, or other offset arrangements, if applicable, and do not represent the amount paid by the class during periods when reimbursements, waivers or reductions occur.
FAmount does not include the portfolio activity of any underlying mutual funds or exchange-traded funds (ETFs).
Notes to Financial Statements
For the period ended August 31, 2024
1. Organization.
Fidelity Maryland Municipal Income Fund (the Fund) is a non-diversified fund of Fidelity Union Street Trust (the Trust) and is authorized to issue an unlimited number of shares. Share transactions on the Statement of Changes in Net Assets may contain exchanges between affiliated funds. The Trust is registered under the Investment Company Act of 1940, as amended (the 1940 Act), as an open-end management investment company organized as a Massachusetts business trust. The Fund may be affected by economic and political developments in the state of Maryland.
2. Investments in Fidelity Central Funds.
Funds may invest in Fidelity Central Funds, which are open-end investment companies generally available only to other investment companies and accounts managed by the investment adviser and its affiliates. The Schedule of Investments lists any Fidelity Central Funds held as an investment as of period end, but does not include the underlying holdings of each Fidelity Central Fund. An investing fund indirectly bears its proportionate share of the expenses of the underlying Fidelity Central Funds.
Based on its investment objective, each Fidelity Central Fund may invest or participate in various investment vehicles or strategies that are similar to those of the investing fund. These strategies are consistent with the investment objectives of the investing fund and may involve certain economic risks which may cause a decline in value of each of the Fidelity Central Funds and thus a decline in the value of the investing fund.
| Fidelity Central Fund | Investment Manager | Investment Objective | Investment Practices | Expense RatioA |
| Fidelity Money Market Central Funds | Fidelity Management & Research Company LLC (FMR) | Each fund seeks to obtain a high level of current income consistent with the preservation of capital and liquidity. | Short-term Investments | Less than .005% |
A Expenses expressed as a percentage of average net assets and are as of each underlying Central Fund's most recent annual or semi-annual shareholder report.
A complete unaudited list of holdings for each Fidelity Central Fund is available upon request or at the Securities and Exchange Commission website at www.sec.gov. In addition, the financial statements of the Fidelity Central Funds which contain the significant accounting policies (including investment valuation policies) of those funds, and are not covered by the Report of Independent Registered Public Accounting Firm, are available on the Securities and Exchange Commission website or upon request.
3. Significant Accounting Policies.
The Fund is an investment company and applies the accounting and reporting guidance of the Financial Accounting Standards Board (FASB) Accounting Standards Codification Topic 946 Financial Services - Investment Companies. The financial statements have been prepared in conformity with accounting principles generally accepted in the United States of America (GAAP), which require management to make certain estimates and assumptions at the date of the financial statements. Actual results could differ from those estimates. Subsequent events, if any, through the date that the financial statements were issued have been evaluated in the preparation of the financial statements. The Fund's Schedule of Investments lists any underlying mutual funds or exchange-traded funds (ETFs) but does not include the underlying holdings of these funds. The following summarizes the significant accounting policies of the Fund:
Investment Valuation. Investments are valued as of 4:00 p.m. Eastern time on the last calendar day of the period. The Board of Trustees (the Board) has designated the Fund's investment adviser as the valuation designee responsible for the fair valuation function and performing fair value determinations as needed. The investment adviser has established a Fair Value Committee (the Committee) to carry out the day-to-day fair valuation responsibilities and has adopted policies and procedures to govern the fair valuation process and the activities of the Committee. In accordance with these fair valuation policies and procedures, which have been approved by the Board, the Fund attempts to obtain prices from one or more third party pricing services or brokers to value its investments. When current market prices, quotations or currency exchange rates are not readily available or reliable, investments will be fair valued in good faith by the Committee, in accordance with the policies and procedures. Factors used in determining fair value vary by investment type and may include market or investment specific events, transaction data, estimated cash flows, and market observations of comparable investments. The frequency that the fair valuation procedures are used cannot be predicted and they may be utilized to a significant extent. The Committee manages the Fund's fair valuation practices and maintains the fair valuation policies and procedures. The Fund's investment adviser reports to the Board information regarding the fair valuation process and related material matters.
The Fund categorizes the inputs to valuation techniques used to value its investments into a disclosure hierarchy consisting of three levels as shown below:
Level 1 - unadjusted quoted prices in active markets for identical investments
Level 2 - other significant observable inputs (including quoted prices for similar investments, interest rates, prepayment speeds, etc.)
Level 3 - unobservable inputs (including the Fund's own assumptions based on the best information available)
Valuation techniques used to value the Fund's investments by major category are as follows:
Debt securities, including restricted securities, are valued based on evaluated prices received from third party pricing services or from brokers who make markets in such securities. Municipal securities are valued by pricing services who utilize matrix pricing which considers yield or price of bonds of comparable quality, coupon, maturity and type or by broker-supplied prices. When independent prices are unavailable or unreliable, debt securities may be valued utilizing pricing methodologies which consider similar factors that would be used by third party pricing services. Debt securities are generally categorized as Level 2 in the hierarchy but may be Level 3 depending on the circumstances.
Investments in underlying funds, including the Fidelity Central Funds, are valued at their closing net asset value (NAV) each business day and are categorized as Level 1 in the hierarchy.
Changes in valuation techniques may result in transfers in or out of an assigned level within the disclosure hierarchy. The aggregate value of investments by input level as of August 31, 2024 is included at the end of the Fund's Schedule of Investments.
Investment Transactions and Income. For financial reporting purposes, the Fund's investment holdings and NAV include trades executed through the end of the last business day of the period. The NAV per share for processing shareholder transactions is calculated as of the close of business of the New York Stock Exchange (NYSE), normally 4:00 p.m. Eastern time and includes trades executed through the end of the prior business day. Gains and losses on securities sold are determined on the basis of identified cost. Income and capital gain distributions from Fidelity Central Funds, if any, are recorded on the ex-dividend date. Interest income is accrued as earned and includes coupon interest and amortization of premium and accretion of discount on debt securities as applicable. Debt obligations may be placed on non-accrual status and related interest income may be reduced by ceasing current accruals and writing off interest receivables when the collection of all or a portion of interest has become doubtful based on consistently applied procedures. A debt obligation is removed from non-accrual status when the issuer resumes interest payments or when collectability of interest is reasonably assured.
Expenses. Expenses directly attributable to a fund are charged to that fund. Expenses attributable to more than one fund are allocated among the respective funds on the basis of relative net assets or other appropriate methods. Expenses included in the accompanying financial statements reflect the expenses of that fund and do not include any expenses associated with any underlying mutual funds or exchange-traded funds. Although not included in a fund's expenses, a fund indirectly bears its proportionate share of these expenses through the net asset value of each underlying mutual fund or exchange-traded fund. Expense estimates are accrued in the period to which they relate and adjustments are made when actual amounts are known.
Income Tax Information and Distributions to Shareholders. Each year, the Fund intends to qualify as a regulated investment company under Subchapter M of the Internal Revenue Code, including distributing substantially all of its taxable income and realized gains. As a result, no provision for U.S. Federal income taxes is required. As of August 31, 2024, the Fund did not have any unrecognized tax benefits in the financial statements; nor is the Fund aware of any tax positions for which it is reasonably possible that the total amounts of unrecognized tax benefits will significantly change in the next twelve months. The Fund files a U.S. federal tax return, in addition to state and local tax returns as required. The Fund's federal income tax returns are subject to examination by the Internal Revenue Service (IRS) for a period of three fiscal years after they are filed. State and local tax returns may be subject to examination for an additional fiscal year depending on the jurisdiction.
Distributions are declared and recorded daily and paid monthly from net investment income. Distributions from realized gains, if any, are declared and recorded on the ex-dividend date. Income and capital gain distributions are determined in accordance with income tax regulations, which may differ from GAAP.
Capital accounts within the financial statements are adjusted for permanent book-tax differences. These adjustments have no impact on net assets or the results of operations. Capital accounts are not adjusted for temporary book-tax differences which will reverse in a subsequent period.
Book-tax differences are primarily due to market discount and capital loss carryforwards.
The Fund purchases municipal securities whose interest, in the opinion of the issuer, is free from federal income tax. There is no assurance that the IRS will agree with this opinion. In the event the IRS determines that the issuer does not comply with relevant tax requirements, interest payments from a security could become federally taxable, possibly retroactively to the date the security was issued.
As of period end, the cost and unrealized appreciation (depreciation) in securities, and derivatives if applicable, for federal income tax purposes were as follows:
| Gross unrealized appreciation | $2,978,923 |
| Gross unrealized depreciation | (4,965,710) |
| Net unrealized appreciation (depreciation) | $(1,986,787) |
| Tax Cost | $164,623,517 |
The tax-based components of distributable earnings as of period end were as follows:
| Capital loss carryforward | $(4,041,881) |
| Net unrealized appreciation (depreciation) on securities and other investments | $(1,986,787) |
Capital loss carryforwards are only available to offset future capital gains of the Fund to the extent provided by regulations and may be limited. The capital loss carryforward information presented below, including any applicable limitation, is estimated as of fiscal period end and is subject to adjustment.
Short-term | $(210,619) |
Long-term | (3,831,262) |
| Total capital loss carryforward | $(4,041,881) |
The tax character of distributions paid was as follows:
| | August 31, 2024 | August 31, 2023 |
| Tax-exempt Income | $4,349,735 | $3,932,743 |
Restricted Securities (including Private Placements). Funds may invest in securities that are subject to legal or contractual restrictions on resale. These securities generally may be resold in transactions exempt from registration or to the public if the securities are registered. Disposal of these securities may involve time-consuming negotiations and expense, and prompt sale at an acceptable price may be difficult. Information regarding restricted securities held at period end is included at the end of the Schedule of Investments, if applicable.
4. Purchases and Sales of Investments.
Purchases and sales of securities, other than short-term securities and in-kind transactions, as applicable, are noted in the table below.
| | Purchases ($) | Sales ($) |
| Fidelity Maryland Municipal Income Fund | 24,381,029 | 38,598,642 |
5. Fees and Other Transactions with Affiliates.
Management Fee. Fidelity Management & Research Company LLC (the investment adviser) and its affiliates provide the Fund with investment management related services for which the Fund pays a monthly management fee that is based on an annual rate of .55% of the Fund's average net assets. Under the management contract, the investment adviser pays all other expenses, except the compensation of the independent Trustees and certain other expenses such as interest expense. The management fee is reduced by an amount equal to the fees and expenses paid by the Fund to the independent Trustees.
Interfund Trades. Funds may purchase from or sell securities to other Fidelity Funds under procedures adopted by the Board. The procedures have been designed to ensure these interfund trades are executed in accordance with Rule 17a-7 of the 1940 Act. Any interfund trades are included within the respective purchases and sales amounts shown in the Purchases and Sales of Investments note. During the period, there were no interfund trades.
Sub-Advisory Arrangements. Effective March 1, 2024, the Fund's sub-advisory agreements with FMR Investment Management (UK) Limited, Fidelity Management & Research (Hong Kong) Limited, and Fidelity Management & Research (Japan) Limited were amended to provide that the investment adviser pays each sub-adviser monthly fees equal to 110% of the sub-adviser's costs for providing sub-advisory services.
6. Committed Line of Credit.
Certain Funds participate with other funds managed by the investment adviser or an affiliate in a $4.25 billion credit facility (the "line of credit") to be utilized for temporary or emergency purposes to fund shareholder redemptions or for other short-term liquidity purposes. The commitment fees on the pro-rata portion of the line of credit are borne by the investment adviser. During the period, there were no borrowings on this line of credit.
7. Expense Reductions.
Through arrangements with the Fund's custodian, credits realized as a result of certain uninvested cash balances were used to reduce the Fund's expenses by $190.
8. Other.
A fund's organizational documents provide former and current trustees and officers with a limited indemnification against liabilities arising in connection with the performance of their duties to the fund. In the normal course of business, a fund may also enter into contracts that provide general indemnifications. A fund's maximum exposure under these arrangements is unknown as this would be dependent on future claims that may be made against a fund. The risk of material loss from such claims is considered remote.
9. Risk and Uncertainties.
Many factors affect a fund's performance. Developments that disrupt global economies and financial markets, such as pandemics, epidemics, outbreaks of infectious diseases, war, terrorism, and environmental disasters, may significantly affect a fund's investment performance. The effects of these developments to a fund will be impacted by the types of securities in which a fund invests, the financial condition, industry, economic sector, and geographic location of an issuer, and a fund's level of investment in the securities of that issuer. Significant concentrations in security types, issuers, industries, sectors, and geographic locations may magnify the factors that affect a fund's performance.
Report of Independent Registered Public Accounting Firm
To the Board of Trustees of Fidelity Union Street Trust and Shareholders of Fidelity Maryland Municipal Income Fund
Opinion on the Financial Statements
We have audited the accompanying statement of assets and liabilities, including the schedule of investments, of Fidelity Maryland Municipal Income Fund (one of the funds constituting Fidelity Union Street Trust, referred to hereafter as the "Fund") as of August 31, 2024, the related statement of operations for the year ended August 31, 2024, the statement of changes in net assets for each of the two years in the period ended August 31, 2024, including the related notes, and the financial highlights for each of the five years in the period ended August 31, 2024 (collectively referred to as the "financial statements"). In our opinion, the financial statements present fairly, in all material respects, the financial position of the Fund as of August 31, 2024, the results of its operations for the year then ended, the changes in its net assets for each of the two years in the period ended August 31, 2024 and the financial highlights for each of the five years in the period ended August 31, 2024 in conformity with accounting principles generally accepted in the United States of America.
Basis for Opinion
These financial statements are the responsibility of the Fund's management. Our responsibility is to express an opinion on the Fund's financial statements based on our audits. We are a public accounting firm registered with the Public Company Accounting Oversight Board (United States) (PCAOB) and are required to be independent with respect to the Fund in accordance with the U.S. federal securities laws and the applicable rules and regulations of the Securities and Exchange Commission and the PCAOB.
We conducted our audits of these financial statements in accordance with the standards of the PCAOB. Those standards require that we plan and perform the audit to obtain reasonable assurance about whether the financial statements are free of material misstatement, whether due to error or fraud.
Our audits included performing procedures to assess the risks of material misstatement of the financial statements, whether due to error or fraud, and performing procedures that respond to those risks. Such procedures included examining, on a test basis, evidence regarding the amounts and disclosures in the financial statements. Our audits also included evaluating the accounting principles used and significant estimates made by management, as well as evaluating the overall presentation of the financial statements. Our procedures included confirmation of securities owned as of August 31, 2024 by correspondence with the custodian. We believe that our audits provide a reasonable basis for our opinion.
/s/ PricewaterhouseCoopers LLP
Boston, Massachusetts
October 14, 2024
We have served as the auditor of one or more investment companies in the Fidelity group of funds since 1932.
Distributions
(Unaudited)
The dividend and capital gains distributions for the fund(s) are available on Fidelity.com or Institutional.Fidelity.com.
During fiscal year ended 2024, 100% of the fund's income dividends was free from federal income tax, and 6.65% of the fund's income dividends was subject to the federal alternative minimum tax.
The fund will notify shareholders in January 2025 of amounts for use in preparing 2024 income tax returns.
Item 8: Changes in and Disagreements with Accountants for Open-End Management Investment Companies
(Unaudited)
Note: This is not applicable for any fund included in this document.
Item 9: Proxy Disclosures for Open-End Management Investment Companies
(Unaudited)
| A special meeting of shareholders was held on October 18, 2023. The results of votes taken among shareholders on the proposal before them are reported below. Each vote reported represents one dollar of net asset value held on the record date for the meeting. |
| Proposal 1 |
| To elect a Board of Trustees. |
| | # of Votes | % of Votes |
| Abigail P. Johnson |
| Affirmative | 242,066,552.08 | 91.65 |
| Withheld | 22,039,917.22 | 8.35 |
| TOTAL | 264,106,469.30 | 100.00 |
| Jennifer Toolin McAuliffe |
| Affirmative | 242,066,552.08 | 91.65 |
| Withheld | 22,039,917.22 | 8.35 |
| TOTAL | 264,106,469.30 | 100.00 |
| Christine J. Thompson |
| Affirmative | 242,066,017.16 | 91.65 |
| Withheld | 22,040,452.14 | 8.35 |
| TOTAL | 264,106,469.30 | 100.00 |
| Elizabeth S. Acton |
| Affirmative | 244,676,369.77 | 92.64 |
| Withheld | 19,430,099.53 | 7.36 |
| TOTAL | 264,106,469.30 | 100.00 |
| Laura M. Bishop |
| Affirmative | 241,054,335.83 | 91.27 |
| Withheld | 23,052,133.47 | 8.73 |
| TOTAL | 264,106,469.30 | 100.00 |
| Ann E. Dunwoody |
| Affirmative | 244,728,263.98 | 92.66 |
| Withheld | 19,378,205.32 | 7.34 |
| TOTAL | 264,106,469.30 | 100.00 |
| John Engler |
| Affirmative | 237,382,398.28 | 89.88 |
| Withheld | 26,724,071.02 | 10.12 |
| TOTAL | 264,106,469.30 | 100.00 |
| Robert F. Gartland |
| Affirmative | 245,243,912.81 | 92.86 |
| Withheld | 18,862,556.49 | 7.14 |
| TOTAL | 264,106,469.30 | 100.00 |
| Robert W. Helm |
| Affirmative | 245,243,377.92 | 92.86 |
| Withheld | 18,863,091.38 | 7.14 |
| TOTAL | 264,106,469.30 | 100.00 |
| Arthur E. Johnson |
| Affirmative | 241,003,897.25 | 91.25 |
| Withheld | 23,102,572.05 | 8.75 |
| TOTAL | 264,106,469.30 | 100.00 |
| Michael E. Kenneally |
| Affirmative | 241,518,090.53 | 91.45 |
| Withheld | 22,588,378.77 | 8.55 |
| TOTAL | 264,106,469.30 | 100.00 |
| Mark A. Murray |
| Affirmative | 245,191,483.71 | 92.84 |
| Withheld | 18,914,985.59 | 7.16 |
| TOTAL | 264,106,469.30 | 100.00 |
| Carol J. Zierhoffer |
| Affirmative | 241,002,441.62 | 91.25 |
| Withheld | 23,104,027.68 | 8.75 |
| TOTAL | 264,106,469.30 | 100.00 |
| | | |
| Proposal 1 reflects trust-wide proposal and voting results. |
Item 10: Remuneration Paid to Directors, Officers, and others of Open-End Management Investment Companies
(Unaudited)
Note: This information is disclosed as part of the financial statements for each Fund as part of Item 7: Financial Statements and Financial Highlights for Open-End Management Investment companies.
Item 11: Statement Regarding Basis for Approval of Investment Advisory Contract
(Unaudited)
Note: This is not applicable for any fund included in this document.
1.536791.127
SMD-ANN-1024
Item 8.
Changes in and Disagreements with Accountants for Open-End Management Investment Companies
See Item 7.
Item 9.
Proxy Disclosures for Open-End Management Investment Companies
See Item 7.
Item 10.
Remuneration Paid to Directors, Officers, and Others of Open-End Management Investment Companies
See Item 7.
Item 11.
Statement Regarding Basis for Approval of Investment Advisory Contract
See Item 7.
Item 12.
Disclosure of Proxy Voting Policies and Procedures for Closed-End Management Investment Companies
Not applicable.
Item 13.
Portfolio Managers of Closed-End Management Investment Companies
Not applicable.
Item 14.
Purchase of Equity Securities by Closed-End Management Investment Company and Affiliated Purchasers
Not applicable.
Item 15.
Submission of Matters to a Vote of Security Holders
There were no material changes to the procedures by which shareholders may recommend nominees to the trust’s Board of Trustees.
Item 16.
Controls and Procedures
(a)(i) The President and Treasurer and the Chief Financial Officer have concluded that the trust’s disclosure controls and procedures (as defined in Rule 30a-3(c) under the Investment Company Act) provide reasonable assurances that material information relating to the trust is made known to them by the appropriate persons, based on their evaluation of these controls and procedures as of a date within 90 days of the filing date of this report.
(a)(ii) There was no change in the trust’s internal control over financial reporting (as defined in Rule 30a-3(d) under the Investment Company Act) that occurred during the period covered by this report that has materially affected, or is reasonably likely to materially affect, the trust’s internal control over financial reporting.
Item 17.
Disclosure of Securities Lending Activities for Closed-End Management Investment Companies
Not applicable.
Item 18.
Recovery of Erroneously Awarded Compensation
(a)
Not applicable.
(b)
Not applicable.
Item 19.
Exhibits
SIGNATURES
Pursuant to the requirements of the Securities Exchange Act of 1934 and the Investment Company Act of 1940, the registrant has duly caused this report to be signed on its behalf by the undersigned, thereunto duly authorized.
Fidelity Union Street Trust
|
By: | /s/Laura M. Del Prato |
| Laura M. Del Prato |
| President and Treasurer (Principal Executive Officer) |
|
|
Date: | October 23, 2024 |
Pursuant to the requirements of the Securities Exchange Act of 1934 and the Investment Company Act of 1940, this report has been signed below by the following persons on behalf of the registrant and in the capacities and on the dates indicated.
|
By: | /s/Laura M. Del Prato |
| Laura M. Del Prato |
| President and Treasurer (Principal Executive Officer) |
|
|
Date: | October 23, 2024 |
|
By: | /s/John J. Burke III |
| John J. Burke III |
| Chief Financial Officer (Principal Financial Officer) |
|
|
Date: | October 23, 2024 |