Fidelity® Arizona Municipal Income Fund
Fidelity® Arizona Municipal Money Market Fund
Annual Report
August 31, 2020

See the inside front cover for important information about access to your fund’s shareholder reports.

Beginning on January 1, 2021, as permitted by regulations adopted by the Securities and Exchange Commission, paper copies of a fund’s shareholder reports will no longer be sent by mail, unless you specifically request paper copies of the reports from the fund or from your financial intermediary, such as a financial advisor, broker-dealer or bank. Instead, the reports will be made available on a website, and you will be notified by mail each time a report is posted and provided with a website link to access the report.
If you already elected to receive shareholder reports electronically, you will not be affected by this change and you need not take any action. You may elect to receive shareholder reports and other communications from a fund electronically, by contacting your financial intermediary. For Fidelity customers, visit Fidelity's web site or call Fidelity using the contact information listed below.
You may elect to receive all future reports in paper free of charge. If you wish to continue receiving paper copies of your shareholder reports, you may contact your financial intermediary or, if you are a Fidelity customer, visit Fidelity’s website, or call Fidelity at the applicable toll-free number listed below. Your election to receive reports in paper will apply to all funds held with the fund complex/your financial intermediary.
| Account Type | Website | Phone Number |
| Brokerage, Mutual Fund, or Annuity Contracts: | fidelity.com/mailpreferences | 1-800-343-3548 |
| Employer Provided Retirement Accounts: | netbenefits.fidelity.com/preferences (choose 'no' under Required Disclosures to continue to print) | 1-800-343-0860 |
| Advisor Sold Accounts Serviced Through Your Financial Intermediary: | Contact Your Financial Intermediary | Your Financial Intermediary's phone number |
| Advisor Sold Accounts Serviced by Fidelity: | institutional.fidelity.com | 1-877-208-0098 |
Contents
To view a fund's proxy voting guidelines and proxy voting record for the 12-month period ended June 30, visit http://www.fidelity.com/proxyvotingresults or visit the Securities and Exchange Commission's (SEC) web site at http://www.sec.gov.
You may also call 1-800-544-8544 to request a free copy of the proxy voting guidelines.
Standard & Poor's, S&P and S&P 500 are registered service marks of The McGraw-Hill Companies, Inc. and have been licensed for use by Fidelity Distributors Corporation.
Other third-party marks appearing herein are the property of their respective owners.
All other marks appearing herein are registered or unregistered trademarks or service marks of FMR LLC or an affiliated company. © 2020 FMR LLC. All rights reserved.
This report and the financial statements contained herein are submitted for the general information of the shareholders of the Funds. This report is not authorized for distribution to prospective investors in the Funds unless preceded or accompanied by an effective prospectus.
A fund files its complete schedule of portfolio holdings with the SEC for the first and third quarters of each fiscal year on Form N-PORT. Forms N-PORT are available on the SEC’s web site at http://www.sec.gov. A fund's Forms N-PORT may be reviewed and copied at the SEC’s Public Reference Room in Washington, DC. Information regarding the operation of the SEC's Public Reference Room may be obtained by calling 1-800-SEC-0330.
For a complete list of a fund's portfolio holdings, view the most recent holdings listing, semiannual report, or annual report on Fidelity's web site at http://www.fidelity.com, http://www.institutional.fidelity.com, or http://www.401k.com, as applicable.
NOT FDIC INSURED •MAY LOSE VALUE •NO BANK GUARANTEE
Neither the Funds nor Fidelity Distributors Corporation is a bank.
Note to Shareholders:
Early in 2020, the outbreak and spread of a new coronavirus emerged as a public health emergency that had a major influence on financial markets, primarily based on its impact on the global economy and the outlook for corporate earnings. The virus causes a respiratory disease known as COVID-19. On March 11, the World Health Organization declared the COVID-19 outbreak a pandemic, citing sustained risk of further global spread.
In the weeks following, as the crisis worsened, we witnessed an escalating human tragedy with wide-scale social and economic consequences from coronavirus-containment measures. The outbreak of COVID-19 prompted a number of measures to limit the spread, including travel and border restrictions, quarantines, and restrictions on large gatherings. In turn, these resulted in lower consumer activity, diminished demand for a wide range of products and services, disruption in manufacturing and supply chains, and – given the wide variability in outcomes regarding the outbreak – significant market uncertainty and volatility. Amid the turmoil, the U.S. government took unprecedented action – in concert with the U.S. Federal Reserve and central banks around the world – to help support consumers, businesses, and the broader economy, and to limit disruption to the financial system.
The situation continues to unfold, and the extent and duration of its impact on financial markets and the economy remain highly uncertain. Extreme events such as the coronavirus crisis are “exogenous shocks” that can have significant adverse effects on mutual funds and their investments. Although multiple asset classes may be affected by market disruption, the duration and impact may not be the same for all types of assets.
Fidelity is committed to helping you stay informed amid news about COVID-19 and during increased market volatility, and we’re taking extra steps to be responsive to customer needs. We encourage you to visit our websites, where we offer ongoing updates, commentary, and analysis on the markets and our funds.
Fidelity® Arizona Municipal Income Fund
Performance: The Bottom Line
Average annual total return reflects the change in the value of an investment, assuming reinvestment of distributions from dividend income and capital gains (the profits earned upon the sale of securities that have grown in value, if any) and assuming a constant rate of performance each year. The hypothetical investment and the average annual total returns do not reflect the deduction of taxes that a shareholder would pay on fund distributions or the redemption of fund shares. During periods of reimbursement by Fidelity, a fund’s total return will be greater than it would be had the reimbursement not occurred. How a fund did yesterday is no guarantee of how it will do tomorrow.
Average Annual Total Returns
| For the periods ended August 31, 2020 | Past 1 year | Past 5 years | Past 10 years |
| Fidelity® Arizona Municipal Income Fund | 2.33% | 3.60% | 3.88% |
$10,000 Over 10 Years
Let's say hypothetically that $10,000 was invested in Fidelity® Arizona Municipal Income Fund on August 31, 2010.
The chart shows how the value of your investment would have changed, and also shows how the Bloomberg Barclays Municipal Bond Index performed over the same period.
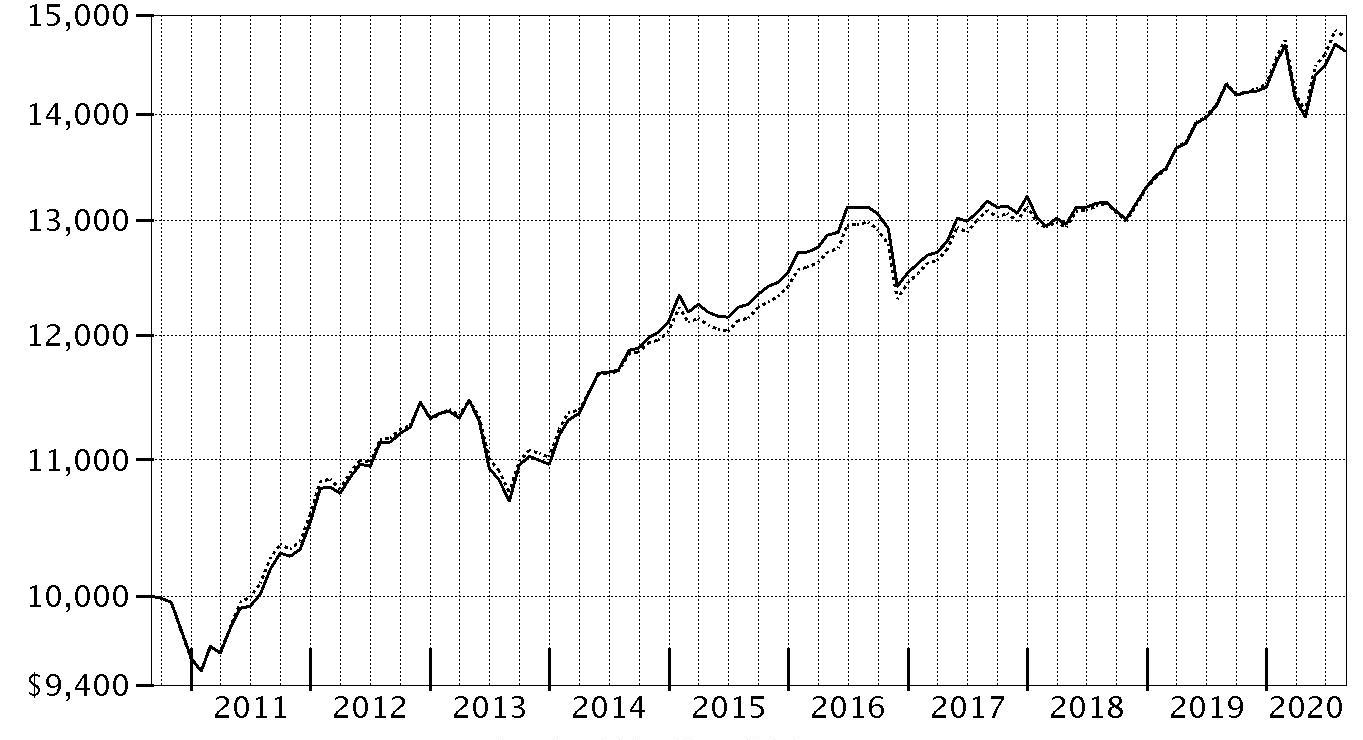
| Period Ending Values |
| $14,627 | Fidelity® Arizona Municipal Income Fund |
| $14,768 | Bloomberg Barclays Municipal Bond Index |
Fidelity® Arizona Municipal Income Fund
Management's Discussion of Fund Performance
Market Recap: Tax-exempt municipal bonds posted a gain for the 12 months ending August 31, 2020, overcoming market volatility related to economic and credit fears caused by the coronavirus. The Bloomberg Barclays Municipal Bond Index rose 3.24% for the period. Munis gained 7.54% in 2019 and began 2020 on an upswing, driven by extremely robust investor demand. By the second week of March, however, the emerging coronavirus pandemic began to raise the prospect of a broad economic slowdown that would present financial challenges for muni issuers across sectors. For example, revenue bonds used to finance airport projects were hampered by a sharp reduction in air travel. Also, bonds issued by hospitals received scrutiny due to uncertain reimbursement for coronavirus-related treatment and the halt of elective medical procedures. State and local government tax revenue was impacted by the delay in the income-tax filing date to July 15 and the collapse in revenue from sales taxes, activity taxes and fees. Muni yields rose substantially as a result of this heightened credit uncertainty. The U.S. Federal Reserve responded to the risk of rapid economic contraction and dysfunction in the credit markets with substantial stimulus. This led to increased market liquidity and a return of new issuance in the primary market, which continued through August 31.
Comments from Co-Portfolio Managers Cormac Cullen, Michael Maka and Elizah McLaughlin: For the fiscal year, the fund gained 2.33%, lagging, net of fees, the 3.24% advance of the state benchmark, the Bloomberg Barclays Arizona 2+ Year Enhanced Municipal Bond Index Linked. We focused on longer-term objectives and sought to generate attractive tax-exempt income and competitive risk-adjusted returns over time. Versus the state benchmark, the fund's overweighting in the lower credit quality tiers detracted from performance, especially securities in the senior living and student housing segments. Underweighting higher-quality securities, particularly electric utility Salt River Project Agricultural Improvement and Power District, also held back the fund's relative return. Differences in the way fund holdings and index components were priced further hampered the relative result. In contrast, the fund's holdings cumulatively produced more income than index, which helped on relative basis.
The views expressed above reflect those of the portfolio manager(s) only through the end of the period as stated on the cover of this report and do not necessarily represent the views of Fidelity or any other person in the Fidelity organization. Any such views are subject to change at any time based upon market or other conditions and Fidelity disclaims any responsibility to update such views. These views may not be relied on as investment advice and, because investment decisions for a Fidelity fund are based on numerous factors, may not be relied on as an indication of trading intent on behalf of any Fidelity fund.
Note to shareholders: On March 1, 2020, Michael Maka assumed co-management responsibilities for the fund. He succeeded Kevin Ramundo, who retired from Fidelity on June 30, 2020, after more than 20 years with the firm.
Fidelity® Arizona Municipal Income Fund
Investment Summary (Unaudited)
Top Five Sectors as of August 31, 2020
| | % of fund's net assets |
| Education | 26.7 |
| Health Care | 18.9 |
| General Obligations | 18.3 |
| Transportation | 11.3 |
| Special Tax | 9.1 |
Quality Diversification (% of fund's net assets)
| As of August 31, 2020 |
| | AAA | 0.3% |
| | AA,A | 94.8% |
| | BBB | 2.3% |
| | Not Rated | 2.0% |
| | Short-Term Investments and Net Other Assets | 0.6% |

We have used ratings from Moody's Investors Service, Inc. Where Moody's® ratings are not available, we have used S&P® ratings. All ratings are as of the date indicated and do not reflect subsequent changes.
Fidelity® Arizona Municipal Income Fund
Schedule of Investments August 31, 2020
Showing Percentage of Net Assets
| Municipal Bonds - 99.4% | | | |
| | | Principal Amount | Value |
| Arizona - 99.1% | | | |
| Arizona Board of Regents Arizona State Univ. Rev.: | | | |
| Series 2012 A: | | $ | $ |
| 5% 7/1/26 | | 550,000 | 594,303 |
| 5% 7/1/26 (Pre-Refunded to 7/1/22 @ 100) | | 450,000 | 488,579 |
| Series 2015 A, 5% 7/1/35 | | 2,215,000 | 2,610,289 |
| Series 2015 B, 5% 7/1/31 | | 1,525,000 | 1,818,166 |
| Series 2015 D: | | | |
| 5% 7/1/34 | | 500,000 | 590,645 |
| 5% 7/1/35 | | 900,000 | 1,060,614 |
| 5% 7/1/41 | | 485,000 | 565,044 |
| Arizona Board of Regents Ctfs. of Prtn. (Univ. of Arizona Projs.) Series 2012 C, 5% 6/1/26 | | 3,035,000 | 3,257,405 |
| Arizona Ctfs. of Prtn.: | | | |
| Series 2013 A, 5% 10/1/25 | | 1,870,000 | 2,047,033 |
| Series 2015, 5% 9/1/27 | | 1,500,000 | 1,820,070 |
| Arizona Game and Fish Dept. and Commission (AGF Administration Bldg. Proj.) Series 2006: | | | |
| 5% 7/1/21 | | 345,000 | 346,344 |
| 5% 7/1/32 | | 470,000 | 471,739 |
| Arizona Health Facilities Auth. Hosp. Sys. Rev. Series 2012 A, 5% 2/1/23 | | 1,285,000 | 1,367,394 |
| Arizona Health Facilities Auth. Rev.: | | | |
| (Banner Health Sys. Proj.) Series 2007 B, 3 month U.S. LIBOR + 0.810% 1.008%, tender 1/1/37 (a)(b) | | 1,000,000 | 929,700 |
| (Scottsdale Lincoln Hospitals Proj.) Series 2014 A: | | | |
| 5% 12/1/26 | | 2,000,000 | 2,321,320 |
| 5% 12/1/42 | | 2,020,000 | 2,268,420 |
| Series 2011 B1, 5.25% 3/1/39 | | 1,000,000 | 1,020,780 |
| Series 2012 A, 5% 1/1/43 | | 2,000,000 | 2,086,440 |
| Arizona Indl. Dev. Auth. Hosp. Rev. Series 2020 A: | | | |
| 4% 2/1/50 | | 2,000,000 | 2,274,540 |
| 5% 2/1/40 | | 700,000 | 880,593 |
| Arizona State Lottery Rev. Series 2019, 5% 7/1/29 | | 2,000,000 | 2,693,840 |
| Arizona State Trans. Board: | | | |
| Series 2017 A, 5% 7/1/32 | | 1,500,000 | 1,870,995 |
| Series 2017A, 5% 7/1/31 | | 385,000 | 484,353 |
| Arizona State Univ. Rev. Series 2020 A: | | | |
| 4% 7/1/40 | | 1,300,000 | 1,559,584 |
| 5% 7/1/43 | | 2,925,000 | 3,781,586 |
| Buckeye Excise Tax Rev. Series 2015: | | | |
| 5% 7/1/27 | | 350,000 | 425,828 |
| 5% 7/1/28 | | 500,000 | 608,325 |
| 5% 7/1/29 | | 455,000 | 552,115 |
| Central Wtr. Conservation District (Central Arizona Proj.) Series 2016 A, 5% 1/1/36 | | 500,000 | 603,655 |
| Chandler Indl. Dev. Auth. Indl. Dev. Rev. Bonds (Intel Corp. Proj.): | | | |
| Series 2007, 2.7%, tender 8/14/23 (a)(c) | | 2,000,000 | 2,106,220 |
| Series 2019, 5%, tender 6/3/24 (a)(c) | | 3,700,000 | 4,273,796 |
| Dysart Unified School District #89 Gen. Oblig. Series 2014: | | | |
| 5% 7/1/23 | | 700,000 | 788,452 |
| 5% 7/1/27 | | 1,300,000 | 1,517,932 |
| Glendale Gen. Oblig.: | | | |
| Series 2015, 5% 7/1/22 (FSA Insured) | | 1,000,000 | 1,088,240 |
| Series 2017: | | | |
| 5% 7/1/30 | | 2,310,000 | 2,784,566 |
| 5% 7/1/32 | | 1,000,000 | 1,193,050 |
| Glendale Indl. Dev. Auth. (Terraces of Phoenix Proj.) Series 2018 A: | | | |
| 4% 7/1/28 | | 265,000 | 262,877 |
| 5% 7/1/33 | | 435,000 | 447,898 |
| Glendale Sr. Excise Tax Rev. Series 2015 A, 5% 7/1/28 | | 1,000,000 | 1,179,360 |
| Goodyear Pub. Impt. Corp. Facilities Rev. Series 2016 A, 5% 7/1/29 | | 1,000,000 | 1,241,850 |
| Maricopa County Indl. Dev. Auth.: | | | |
| (Creighton Univ. Proj.) Series 2020, 5% 7/1/47 | | 2,000,000 | 2,377,500 |
| Series 2019 A: | | | |
| 5% 9/1/29 | | 310,000 | 392,355 |
| 5% 9/1/33 | | 250,000 | 308,245 |
| 5% 9/1/34 | | 680,000 | 836,359 |
| 5% 9/1/35 | | 395,000 | 483,911 |
| Maricopa County Indl. Dev. Auth. Sr. Living Facilities Series 2016: | | | |
| 5.75% 1/1/36 (d) | | 350,000 | 353,105 |
| 6% 1/1/48 (d) | | 500,000 | 481,140 |
| Maricopa County Phoenix Union High School District #210 Series 2017 B: | | | |
| 5% 7/1/32 | | 1,180,000 | 1,512,583 |
| 5% 7/1/34 | | 585,000 | 744,026 |
| Maricopa County Rev.: | | | |
| Bonds Series 2019 D, 5%, tender 5/15/26 (a) | | 200,000 | 245,532 |
| Series 2016 A: | | | |
| 4% 1/1/24 | | 255,000 | 282,884 |
| 5% 1/1/34 | | 2,935,000 | 3,532,595 |
| 5% 1/1/38 | | 1,840,000 | 2,190,575 |
| Maricopa County School District #214 Tolleson Series 2018 A, 5% 7/1/31 | | 350,000 | 441,637 |
| Maricopa County School District #28 Kyrene Elementary: | | | |
| Series 2015 C, 4% 7/1/29 | | 650,000 | 741,611 |
| Series 2019 A, 5% 7/1/37 | | 1,000,000 | 1,262,670 |
| Maricopa County Spl. Health Care District Gen. Oblig. Series 2018 C, 5% 7/1/36 | | 1,000,000 | 1,224,180 |
| Maricopa County Unified School District #48 Scottsdale Series 2017 B, 5% 7/1/33 | | 3,000,000 | 3,769,950 |
| McAllister Academic Village LLC Rev.: | | | |
| (Arizona State Univ. Hassayampa Academic Village Proj.) Series 2016: | | | |
| 5% 7/1/37 | | 2,000,000 | 2,380,680 |
| 5% 7/1/38 | | 3,850,000 | 4,572,992 |
| Series 2016, 5% 7/1/39 | | 2,270,000 | 2,690,903 |
| Mesa Util. Sys. Rev. Series 2019 A, 5% 7/1/43 | | 2,000,000 | 2,526,840 |
| Northern Arizona Univ. Ctfs. of Prtn.: | | | |
| (Univ. Proj.) Series 2013, 5% 9/1/24 | | 1,000,000 | 1,069,130 |
| Series 2015, 5% 9/1/20 (FSA Insured) | | 440,000 | 440,000 |
| Northern Arizona Univ. Revs.: | | | |
| Series 2012, 5% 6/1/36 (Pre-Refunded to 6/1/21 @ 100) | | 860,000 | 890,341 |
| Series 2013, 5% 8/1/27 | | 1,000,000 | 1,092,400 |
| Series 2014, 5% 6/1/29 | | 500,000 | 570,460 |
| Series 2015, 5% 6/1/30 | | 1,000,000 | 1,171,120 |
| Series 2020 B, 5% 6/1/37 (Build America Mutual Assurance Insured) | | 1,000,000 | 1,275,960 |
| Phoenix Civic Impt. Board Arpt. Rev.: | | | |
| Series 2013: | | | |
| 5% 7/1/26 (c) | | 1,100,000 | 1,221,550 |
| 5% 7/1/29 (c) | | 500,000 | 552,585 |
| Series 2015 A, 5% 7/1/45 | | 4,100,000 | 4,655,508 |
| Series 2017 A: | | | |
| 5% 7/1/35 (c) | | 2,425,000 | 2,897,972 |
| 5% 7/1/42 (c) | | 2,000,000 | 2,348,620 |
| Series 2017 D, 5% 7/1/31 | | 2,000,000 | 2,423,640 |
| Series 2019 A, 5% 7/1/49 | | 2,000,000 | 2,392,640 |
| Phoenix Civic Impt. Corp. Series 2019 A, 5% 7/1/35 | | 1,000,000 | 1,172,110 |
| Phoenix Civic Impt. Corp. District Rev. (Plaza Expansion Proj.) Series 2005 B, 5.5% 7/1/38 (Nat'l. Pub. Fin. Guarantee Corp. Insured) | | 2,000,000 | 3,052,400 |
| Phoenix Civic Impt. Corp. Wastewtr. Sys. Rev. Series 2016, 5% 7/1/33 | | 1,000,000 | 1,234,130 |
| Phoenix Gen. Oblig. Series 2014, 4% 7/1/26 | | 2,000,000 | 2,263,420 |
| Phoenix IDA Student Hsg. Rev.: | | | |
| (Downtown Phoenix Student Hsg. II LLC Arizona State Univ. Proj.) Series 2019 A, 5% 7/1/36 | | 1,175,000 | 1,260,728 |
| Series 2018 A, (Downtown Phoenix Student Hsg., LLC AZ State Univ. Proj.) 5% 7/1/42 | | 1,500,000 | 1,585,410 |
| Phoenix-Mesa Gateway Arpt. Auth. (Mesa Proj.) Series 2012: | | | |
| 5% 7/1/24 (c) | | 380,000 | 407,352 |
| 5% 7/1/27 (c) | | 400,000 | 428,112 |
| Pima County Ctfs. of Prtn.: | | | |
| Series 2013 A, 5% 12/1/22 | | 1,000,000 | 1,104,470 |
| Series 2014, 5% 12/1/27 | | 1,745,000 | 1,996,908 |
| Pima County Swr. Sys. Rev. Series 2012 A: | | | |
| 5% 7/1/23 | | 30,000 | 32,601 |
| 5% 7/1/25 | | 1,600,000 | 1,735,936 |
| Salt River Proj. Agricultural Impt. & Pwr. District Elec. Sys. Rev. Series 2015 A, 5% 12/1/34 | | 1,500,000 | 1,792,620 |
| Salt Verde Finl. Corp. Sr. Gas Rev. Series 2007: | | | |
| 5% 12/1/37 | | 2,485,000 | 3,393,789 |
| 5.5% 12/1/29 | | 3,000,000 | 3,980,880 |
| Scottsdale Gen. Oblig. Series 2017, 4% 7/1/32 | | 400,000 | 469,924 |
| Scottsdale Indl. Dev. Auth. Hosp. Rev. (Scottsdale Healthcare Proj.) Series 2006 C, 5% 9/1/35 (FSA Insured) | | 420,000 | 421,499 |
| Scottsdale Muni. Property Corp. Excise Tax Rev. Series 2015, 5% 7/1/34 | | 1,355,000 | 1,624,130 |
| Tempe Excise Tax Rev.: | | | |
| Series 2012, 5% 7/1/25 | | 1,090,000 | 1,183,446 |
| Series 2016: | | | |
| 5% 7/1/28 | | 315,000 | 393,221 |
| 5% 7/1/29 | | 500,000 | 622,865 |
| 5% 7/1/30 | | 325,000 | 404,021 |
| 5% 7/1/31 | | 375,000 | 464,966 |
| Tucson Ctfs. of Prtn.: | | | |
| Series 2014, 5% 7/1/28 (FSA Insured) | | 1,000,000 | 1,157,740 |
| Series 2015, 5% 7/1/23 (FSA Insured) | | 555,000 | 625,130 |
| Series 2016, 5% 7/1/27 (FSA Insured) | | 1,245,000 | 1,530,130 |
| Tucson Wtr. Rev.: | | | |
| Series 2015, 5% 7/1/31 | | 1,000,000 | 1,204,420 |
| Series 2017, 5% 7/1/34 | | 1,000,000 | 1,249,780 |
| Univ. Med. Ctr. Corp. Hosp. Rev. 5.625% 7/1/36 (Pre-Refunded to 7/1/23 @ 100) | | 1,000,000 | 1,150,590 |
| Univ. of Arizona Univ. Revs.: | | | |
| Series 2014, 5% 8/1/28 | | 1,000,000 | 1,157,480 |
| Series 2015 A 5% 6/1/30 | | 2,500,000 | 2,983,825 |
| Series 2019 A, 5% 6/1/41 | | 1,965,000 | 2,499,834 |
| Series 2020 C: | | | |
| 5% 8/1/22 (e) | | 920,000 | 970,379 |
| 5% 8/1/24 (e) | | 800,000 | 912,016 |
| 5% 8/1/26 (e) | | 800,000 | 968,072 |
| 5% 8/1/28 (e) | | 900,000 | 1,139,643 |
| 5% 6/1/38 | | 1,000,000 | 1,195,140 |
| Western Maricopa Ed. Ctr. District Series 2019 B: | | | |
| 5% 7/1/27 | | 1,000,000 | 1,287,340 |
| 5% 7/1/28 | | 1,115,000 | 1,468,020 |
| Yavapai County Indl. Dev. Auth.: | | | |
| Series 2012 A, 5.25% 8/1/33 | | 2,000,000 | 2,200,000 |
| Series 2016, 5% 8/1/36 | | 1,305,000 | 1,522,387 |
| Series 2019: | | | |
| 4% 8/1/43 | | 350,000 | 394,167 |
| 5% 8/1/24 | | 325,000 | 377,059 |
| 5% 8/1/25 | | 400,000 | 477,460 |
| 5% 8/1/26 | | 600,000 | 734,256 |
| 5% 8/1/27 | | 625,000 | 781,000 |
| 5% 8/1/39 | | 1,060,000 | 1,306,365 |
| Yuma Indl. Dev. Auth. Hosp. Rev. Series 2014 A, 5% 8/1/27 | | 2,000,000 | 2,289,400 |
|
| TOTAL ARIZONA | | | 177,244,710 |
|
| Guam - 0.3% | | | |
| Guam Int'l. Arpt. Auth. Rev. Series 2013 C, 6.375% 10/1/43 (c) | | 200,000 | 206,126 |
| Guam Pwr. Auth. Rev. Series 2012 A, 5% 10/1/21 (FSA Insured) | | 400,000 | 417,188 |
|
| TOTAL GUAM | | | 623,314 |
|
| TOTAL MUNICIPAL BONDS | | | |
| (Cost $166,363,806) | | | 177,868,024 |
| TOTAL INVESTMENT IN SECURITIES - 99.4% | | | |
| (Cost $166,363,806) | | | 177,868,024 |
| NET OTHER ASSETS (LIABILITIES) - 0.6% | | | 1,007,340 |
| NET ASSETS - 100% | | | $178,875,364 |
Legend
(a) Coupon rates for floating and adjustable rate securities reflect the rates in effect at period end.
(b) Coupon is indexed to a floating interest rate which may be multiplied by a specified factor and/or subject to caps or floors.
(c) Private activity obligations whose interest is subject to the federal alternative minimum tax for individuals.
(d) Security exempt from registration under Rule 144A of the Securities Act of 1933. These securities may be resold in transactions exempt from registration, normally to qualified institutional buyers. At the end of the period, the value of these securities amounted to $834,245 or 0.5% of net assets.
(e) Security or a portion of the security purchased on a delayed delivery or when-issued basis.
Investment Valuation
The following is a summary of the inputs used, as of August 31, 2020, involving the Fund's assets and liabilities carried at fair value. The inputs or methodology used for valuing securities may not be an indication of the risk associated with investing in those securities. For more information on valuation inputs, and their aggregation into the levels used below, please refer to the Investment Valuation section in the accompanying Notes to Financial Statements.
| | Valuation Inputs at Reporting Date: |
| Description | Total | Level 1 | Level 2 | Level 3 |
| Investments in Securities: | | | | |
| Municipal Securities | $177,868,024 | $-- | $177,868,024 | $-- |
| Total Investments in Securities: | $177,868,024 | $-- | $177,868,024 | $-- |
Other Information
The distribution of municipal securities by revenue source, as a percentage of total Net Assets, is as follows (Unaudited):
| Education | 26.7% |
| Health Care | 18.9% |
| General Obligations | 18.3% |
| Transportation | 11.3% |
| Special Tax | 9.1% |
| Others* (Individually Less Than 5%) | 15.7% |
| | 100.0% |
* Includes net other assets
See accompanying notes which are an integral part of the financial statements.
Fidelity® Arizona Municipal Income Fund
Financial Statements
Statement of Assets and Liabilities
| | | August 31, 2020 |
| Assets | | |
Investment in securities, at value — See accompanying schedule:
Unaffiliated issuers (cost $166,363,806) | | $177,868,024 |
| Cash | | 3,748,342 |
| Receivable for fund shares sold | | 58,089 |
| Interest receivable | | 1,443,545 |
| Other receivables | | 454 |
| Total assets | | 183,118,454 |
| Liabilities | | |
| Payable for investments purchased on a delayed delivery basis | $3,869,513 | |
| Payable for fund shares redeemed | 164,689 | |
| Distributions payable | 126,478 | |
| Accrued management fee | 82,410 | |
| Total liabilities | | 4,243,090 |
| Net Assets | | $178,875,364 |
| Net Assets consist of: | | |
| Paid in capital | | $166,604,696 |
| Total accumulated earnings (loss) | | 12,270,668 |
| Net Assets | | $178,875,364 |
| Net Asset Value, offering price and redemption price per share ($178,875,364 ÷ 14,272,396 shares) | | $12.53 |
See accompanying notes which are an integral part of the financial statements.
Statement of Operations
| | | Year ended August 31, 2020 |
| Investment Income | | |
| Interest | | $4,958,332 |
| Expenses | | |
| Management fee | $980,448 | |
| Independent trustees' fees and expenses | 586 | |
| Commitment fees | 433 | |
| Total expenses before reductions | 981,467 | |
| Expense reductions | (1,207) | |
| Total expenses after reductions | | 980,260 |
| Net investment income (loss) | | 3,978,072 |
| Realized and Unrealized Gain (Loss) | | |
| Net realized gain (loss) on: | | |
| Investment securities: | | |
| Unaffiliated issuers | | 865,697 |
| Total net realized gain (loss) | | 865,697 |
| Change in net unrealized appreciation (depreciation) on investment securities | | (1,370,848) |
| Net gain (loss) | | (505,151) |
| Net increase (decrease) in net assets resulting from operations | | $3,472,921 |
See accompanying notes which are an integral part of the financial statements.
Statement of Changes in Net Assets
| | Year ended August 31, 2020 | Year ended August 31, 2019 |
| Increase (Decrease) in Net Assets | | |
| Operations | | |
| Net investment income (loss) | $3,978,072 | $4,174,882 |
| Net realized gain (loss) | 865,697 | (142,077) |
| Change in net unrealized appreciation (depreciation) | (1,370,848) | 9,902,624 |
| Net increase (decrease) in net assets resulting from operations | 3,472,921 | 13,935,429 |
| Distributions to shareholders | (3,970,388) | (4,145,505) |
| Share transactions | | |
| Proceeds from sales of shares | 23,262,594 | 24,527,413 |
| Reinvestment of distributions | 2,396,135 | 2,563,458 |
| Cost of shares redeemed | (27,145,465) | (26,578,108) |
| Net increase (decrease) in net assets resulting from share transactions | (1,486,736) | 512,763 |
| Total increase (decrease) in net assets | (1,984,203) | 10,302,687 |
| Net Assets | | |
| Beginning of period | 180,859,567 | 170,556,880 |
| End of period | $178,875,364 | $180,859,567 |
| Other Information | | |
| Shares | | |
| Sold | 1,872,570 | 2,029,870 |
| Issued in reinvestment of distributions | 192,807 | 213,227 |
| Redeemed | (2,234,129) | (2,235,331) |
| Net increase (decrease) | (168,752) | 7,766 |
See accompanying notes which are an integral part of the financial statements.
Financial Highlights
Fidelity Arizona Municipal Income Fund
| | | | | | |
| Years ended August 31, | 2020 | 2019 | 2018 | 2017 | 2016 |
| Selected Per–Share Data | | | | | |
| Net asset value, beginning of period | $12.52 | $11.82 | $12.21 | $12.50 | $12.12 |
| Income from Investment Operations | | | | | |
| Net investment income (loss)A | .277 | .298 | .300 | .311 | .335 |
| Net realized and unrealized gain (loss) | .009 | .698 | (.309) | (.267) | .498 |
| Total from investment operations | .286 | .996 | (.009) | .044 | .833 |
| Distributions from net investment income | (.276) | (.296) | (.300) | (.310) | (.335) |
| Distributions from net realized gain | – | – | (.081) | (.024) | (.118) |
| Total distributions | (.276) | (.296) | (.381) | (.334) | (.453) |
| Redemption fees added to paid in capitalA | – | – | – | –B | –B |
| Net asset value, end of period | $12.53 | $12.52 | $11.82 | $12.21 | $12.50 |
| Total ReturnC | 2.33% | 8.56% | (.05)% | .43% | 7.01% |
| Ratios to Average Net AssetsD | | | | | |
| Expenses before reductions | .55% | .55% | .55% | .55% | .55% |
| Expenses net of fee waivers, if any | .55% | .55% | .55% | .55% | .55% |
| Expenses net of all reductions | .55% | .55% | .55% | .55% | .55% |
| Net investment income (loss) | 2.23% | 2.49% | 2.52% | 2.58% | 2.73% |
| Supplemental Data | | | | | |
| Net assets, end of period (000 omitted) | $178,875 | $180,860 | $170,557 | $181,740 | $192,725 |
| Portfolio turnover rate | 17% | 13% | 12% | 18% | 7% |
A Calculated based on average shares outstanding during the period.
B Amount represents less than $.0005 per share.
C Total returns would have been lower if certain expenses had not been reduced during the applicable periods shown.
D Expense ratios reflect operating expenses of the class. Expenses before reductions do not reflect amounts reimbursed, waived, or reduced through arrangements with the investment advisor, brokerage services, or other offset arrangements, if applicable, and do not represent the amount paid by the class during periods when reimbursements, waivers or reductions occur.
See accompanying notes which are an integral part of the financial statements.
Fidelity® Arizona Municipal Money Market Fund
Investment Summary/Performance (Unaudited)
Effective Maturity Diversification as of August 31, 2020
| Days | % of fund's investments 8/31/20 |
| 1 - 7 | 9.3 |
| 8 - 30 | 79.8 |
| 31 - 60 | 10.0 |
| 91 - 180 | 0.9 |
Effective maturity is determined in accordance with the requirements of Rule 2a-7 under the Investment Company Act of 1940.
Asset Allocation (% of fund's net assets)
| As of August 31, 2020 |
| | Variable Rate Demand Notes (VRDNs) | 66.6% |
| | Tender Option Bond | 18.8% |
| | Other Municipal Security | 9.8% |
| | Investment Companies | 4.8% |

Current 7-Day Yields
| | 8/31/20 |
| Fidelity® Arizona Municipal Money Market Fund | 0.01% |
Yield refers to the income paid by the Fund over a given period. Yield for money market funds is usually for seven-day periods, as it is here, though it is expressed as an annual percentage rate. Past performance is no guarantee of future results. Yield will vary and it's possible to lose money investing in the Fund. A portion of the Fund's expenses was reimbursed and/or waived. Absent such reimbursements and/or waivers the yield for the period ending August 31, 2020, the most recent period shown in the table, would have been -0.33%.
Fidelity® Arizona Municipal Money Market Fund
Schedule of Investments August 31, 2020
Showing Percentage of Net Assets
| Variable Rate Demand Note - 66.6% | | | |
| | | Principal Amount | Value |
| Alabama - 0.4% | | | |
| Decatur Indl. Dev. Board Exempt Facilities Rev. (Nucor Steel Decatur LLC Proj.) Series 2003 A, 0.22% 9/8/20, VRDN (a)(b) | | $300,000 | $300,000 |
| Arizona - 65.0% | | | |
| Arizona Health Facilities Auth. Rev.: | | | |
| (Catholic Healthcare West Proj.): | | | |
| Series 2008 A, 0.1% 9/8/20, LOC JPMorgan Chase Bank, VRDN (a) | | 1,930,000 | 1,930,000 |
| Series 2009 F, 0.11% 9/8/20, LOC Mizuho Corporate Bank Ltd., VRDN (a) | | 10,600,000 | 10,600,000 |
| Series 2015 B, 0.02% 9/1/20, LOC Bank of Tokyo-Mitsubishi UFJ Ltd., VRDN (a) | | 1,530,000 | 1,530,000 |
| Arizona Indl. Dev. Auth. Hosp. Rev. Series 2019 A, 0.02% 9/1/20, LOC JPMorgan Chase Bank, VRDN (a) | | 1,400,000 | 1,400,000 |
| Maricopa County Indl. Dev. Auth. Rev. (Clayton Homes, Inc. Proj.) Series 1998, 0.15% 9/8/20, LOC U.S. Bank NA, Cincinnati, VRDN (a)(b) | | 2,600,000 | 2,600,000 |
| Maricopa County Poll. Cont. Rev. (Arizona Pub. Svc. Co. Palo Verde Proj.) Series 2009 A, 0.16% 9/8/20, VRDN (a) | | 8,400,000 | 8,400,000 |
| FNMA: | | | |
| Arizona Hsg. Fin. Auth. Multi-family Hsg. Rev. (Santa Carolina Apts. Proj.) Series 2005, 0.12% 9/8/20, LOC Fannie Mae, VRDN (a)(b) | | 3,645,000 | 3,645,000 |
| Maricopa County Indl. Dev. Auth. Multi-family Hsg. Rev.: | | | |
| (San Angelin Apts. Proj.) Series 2004, 0.11% 9/8/20, LOC Fannie Mae, VRDN (a)(b) | | 3,840,000 | 3,840,000 |
| (San Fernando Apts. Proj.) Series 2004, 0.11% 9/8/20, LOC Fannie Mae, VRDN (a)(b) | | 4,185,000 | 4,185,000 |
| (San Martin Apts. Proj.) Series A2, 0.11% 9/8/20, LOC Fannie Mae, VRDN (a)(b) | | 3,300,000 | 3,300,000 |
| (San Miguel Apts. Proj.) Series 2003, 0.1% 9/8/20, LOC Fannie Mae, VRDN (a)(b) | | 1,580,000 | 1,580,000 |
| (San Remo Apts. Proj.) Series 2002, 0.11% 9/8/20, LOC Fannie Mae, VRDN (a)(b) | | 6,400,000 | 6,400,000 |
| (Village Square Apts. Proj.) Series 2004, 0.11% 9/8/20, LOC Fannie Mae, VRDN (a)(b) | | 3,500,000 | 3,500,000 |
| Pima County Indl. Dev. Auth. Multi-family Hsg. Rev. Series A, 0.14% 9/8/20, LOC Fannie Mae, VRDN (a)(b) | | 2,865,000 | 2,865,000 |
| | | | 55,775,000 |
| Arkansas - 0.1% | | | |
| Blytheville Indl. Dev. Rev. (Nucor Corp. Proj.) Series 1998, 0.22% 9/8/20, VRDN (a)(b) | | 100,000 | 100,000 |
| Kansas - 0.5% | | | |
| Burlington Envir. Impt. Rev. (Kansas City Pwr. and Lt. Co. Proj.) Series 2007 B, 0.27% 9/8/20, VRDN (a) | | 100,000 | 100,000 |
| St. Mary's Kansas Poll. Cont. Rev. (Kansas Gas and Elec. Co. Proj.) Series 1994, 0.26% 9/8/20, VRDN (a) | | 200,000 | 200,000 |
| Wamego Kansas Poll. Cont. Rfdg. Rev. (Western Resources, Inc. Proj.) Series 1994, 0.26% 9/8/20, VRDN (a) | | 100,000 | 100,000 |
| | | | 400,000 |
| Louisiana - 0.1% | | | |
| Saint James Parish Gen. Oblig. (Nucor Steel Louisiana LLC Proj.) Series 2010 B1, 0.24% 9/8/20, VRDN (a) | | 100,000 | 100,000 |
| Nebraska - 0.1% | | | |
| Stanton County Indl. Dev. Rev. (Nucor Corp. Proj.) Series 1996, 0.22% 9/8/20, VRDN (a)(b) | | 100,000 | 100,000 |
| Pennsylvania - 0.2% | | | |
| Delaware County Indl. Dev. Auth. Arpt. Facilities Rev. (United Parcel Svc. Proj.) Series 2015, 0.22% 9/1/20, VRDN (a) | | 200,000 | 200,000 |
| West Virginia - 0.2% | | | |
| West Virginia Econ. Dev. Auth. Solid Waste Disp. Facilities Rev.: | | | |
| (Appalachian Pwr. Co. - Amos Proj.) Series 2008 B, 0.21% 9/8/20, VRDN (a)(b) | | 100,000 | 100,000 |
| (Appalachian Pwr. Co.- Mountaineer Proj.) Series 2008 A, 0.2% 9/8/20, VRDN (a)(b) | | 100,000 | 100,000 |
| | | | 200,000 |
| TOTAL VARIABLE RATE DEMAND NOTE | | | |
| (Cost $57,175,000) | | | 57,175,000 |
|
| Tender Option Bond - 18.8% | | | |
| Arizona - 15.5% | | | |
| Arizona Indl. Dev. Auth. Hosp. Rev. Participating VRDN Series 20 XF 09 90, 0.14% 9/8/20 (Liquidity Facility Toronto-Dominion Bank) (a)(c)(d) | | 900,000 | 900,000 |
| Arizona Tourism & Sports Auth. Tax Rev. Participating VRDN Series Floaters E85, 0.12% 9/8/20 (Liquidity Facility Royal Bank of Canada) (a)(c)(d) | | 1,460,000 | 1,460,000 |
| Arizona Trans. Board Hwy. Rev. Participating VRDN Series Floaters XX 10 05, 0.12% 9/8/20 (Liquidity Facility Barclays Bank PLC) (a)(c)(d) | | 1,160,000 | 1,160,000 |
| Maricopa County Rev. Participating VRDN Series Putter 50 36, 0.04% 9/1/20 (Liquidity Facility JPMorgan Chase Bank) (a)(c)(d) | | 700,000 | 700,000 |
| Mesa Util. Sys. Rev. Participating VRDN Series ROC II R 11959X, 0.12% 9/8/20 (Liquidity Facility Citibank NA) (a)(c)(d) | | 1,500,000 | 1,500,000 |
| Phoenix Civic Impt. Board Arpt. Rev. Participating VRDN: | | | |
| Series Floaters ZF 27 58, 0.15% 9/8/20 (Liquidity Facility Barclays Bank PLC) (a)(b)(c)(d) | | 2,600,000 | 2,600,000 |
| Series XF 08 46, 0.19% 9/8/20 (Liquidity Facility Toronto-Dominion Bank) (a)(b)(c)(d) | | 800,000 | 800,000 |
| Rowan Univ. Participating VRDN Series 2016 XF 2337, 0.13% 9/8/20 (Liquidity Facility Barclays Bank PLC) (a)(c)(d) | | 4,200,000 | 4,200,000 |
| | | | 13,320,000 |
| California - 0.4% | | | |
| Dignity Health Participating VRDN Series DBE 80 11, 0.31% 9/8/20 (Liquidity Facility Deutsche Bank AG New York Branch) (a)(c)(d) | | 300,000 | 300,000 |
| Florida - 0.3% | | | |
| Jacksonville Elec. Auth. Elec. Sys. Rev. Participating VRDN Series 2019, 0.39% 10/13/20 (Liquidity Facility Wells Fargo Bank NA) (a)(c)(d) | | 200,000 | 200,000 |
| Illinois - 0.2% | | | |
| Illinois Fin. Auth. Rev. Participating VRDN Series Floaters 017, 0.24% 10/13/20 (Liquidity Facility Barclays Bank PLC) (a)(c)(d) | | 190,000 | 190,000 |
| Massachusetts - 0.1% | | | |
| Massachusetts Gen. Oblig. Bonds Series Clipper 09 67, 0.27%, tender 1/14/21 (Liquidity Facility State Street Bank & Trust Co., Boston) (a)(c)(d)(e) | | 100,000 | 100,000 |
| New Jersey - 0.1% | | | |
| Clipper Tax-Exempt Trust Bonds Series Clipper 06 12, 0.26%, tender 9/24/20 (Liquidity Facility State Street Bank & Trust Co., Boston) (a)(c)(d)(e) | | 100,000 | 100,000 |
| Ohio - 0.2% | | | |
| Middletown Hosp. Facilities Rev. Participating VRDN Series Floaters 003, 0.24% 10/13/20 (Liquidity Facility Barclays Bank PLC) (a)(c)(d) | | 95,000 | 95,000 |
| Ohio Hosp. Rev. Participating VRDN Series 002, 0.24% 10/13/20 (Liquidity Facility Barclays Bank PLC) (a)(c)(d) | | 100,000 | 100,000 |
| | | | 195,000 |
| Utah - 1.6% | | | |
| Salt Lake City Arpt. Rev. Participating VRDN Series DBE 8034, 0.34% 9/8/20 (Liquidity Facility Deutsche Bank AG New York Branch) (a)(b)(c)(d) | | 1,400,000 | 1,400,000 |
| Virginia - 0.4% | | | |
| Lynchburg Econ. Dev. Participating VRDN Series 2020 10, 0.24% 10/13/20 (Liquidity Facility Barclays Bank PLC) (a)(c)(d) | | 200,000 | 200,000 |
| Suffolk Econ. Dev. Auth. Hosp. Facilities Rev. Participating VRDN Series MIZ 90 25, 0.22% 9/8/20 (Liquidity Facility Mizuho Cap. Markets Llc) (a)(c)(d) | | 100,000 | 100,000 |
| | | | 300,000 |
| TOTAL TENDER OPTION BOND | | | |
| (Cost $16,105,000) | | | 16,105,000 |
|
| Other Municipal Security - 9.8% | | | |
| Arizona - 9.8% | | | |
| Arizona Health Facilities Auth. Rev. Bonds (Banner Health Sys. Proj.) Series 2015 A, 5% 1/1/21 | | 100,000 | 101,561 |
| Arizona Wtr. Infrastructure Fin. Auth. Rev. Bonds Series 2010 A, 5% 10/1/20 (Pre-Refunded to 10/1/20 @ 100) | | 5,925,000 | 5,946,679 |
| Salt River Proj. Agricultural Impt. & Pwr. District Elec. Sys. Rev.: | | | |
| Bonds: | | | |
| Series 2016 A, 5% 1/1/21 | | 275,000 | 279,415 |
| Series A, 5% 12/1/20 | | 300,000 | 303,462 |
| Series C: | | | |
| 0.16% 10/6/20, CP | | 900,000 | 900,000 |
| 0.17% 10/5/20, CP | | 900,000 | 900,000 |
| TOTAL OTHER MUNICIPAL SECURITY | | | |
| (Cost $8,431,117) | | | 8,431,117 |
| | | Shares | Value |
|
| Investment Company - 4.8% | | | |
| Fidelity Municipal Cash Central Fund .09% (f)(g) | | | |
| (Cost $4,082,000) | | 4,081,592 | 4,082,000 |
| TOTAL INVESTMENT IN SECURITIES - 100.0% | | | |
| (Cost $85,793,117) | | | 85,793,117 |
| NET OTHER ASSETS (LIABILITIES) - 0.0% | | | 28,882 |
| NET ASSETS - 100% | | | $85,821,999 |
Security Type Abbreviations
CP – COMMERCIAL PAPER
VRDN – VARIABLE RATE DEMAND NOTE (A debt instrument that is payable upon demand, either daily, weekly or monthly)
Legend
(a) Coupon rates for floating and adjustable rate securities reflect the rates in effect at period end.
(b) Private activity obligations whose interest is subject to the federal alternative minimum tax for individuals.
(c) Provides evidence of ownership in one or more underlying municipal bonds.
(d) Coupon rates are determined by re-marketing agents based on current market conditions.
(e) Restricted securities (including private placements) - Investment in securities not registered under the Securities Act of 1933 (excluding 144A issues). At the end of the period, the value of restricted securities (excluding 144A issues) amounted to $200,000 or 0.2% of net assets.
(f) Information in this report regarding holdings by state and security types does not reflect the holdings of the Fidelity Municipal Cash Central Fund.
(g) Affiliated fund that is available only to investment companies and other accounts managed by Fidelity Investments. The rate quoted is the annualized seven-day yield of the fund at period end. A complete unaudited listing of the fund's holdings as of its most recent quarter end is available upon request. In addition, each Fidelity Central Fund's financial statements, which are not covered by the Fund's Report of Independent Registered Public Accounting Firm, are available on the SEC's website or upon request.
Additional information on each restricted holding is as follows:
| Security | Acquisition Date | Cost |
| Clipper Tax-Exempt Trust Bonds Series Clipper 06 12, 0.26%, tender 9/24/20 (Liquidity Facility State Street Bank & Trust Co., Boston) | 5/20/20 | $100,000 |
| Massachusetts Gen. Oblig. Bonds Series Clipper 09 67, 0.27%, tender 1/14/21 (Liquidity Facility State Street Bank & Trust Co., Boston) | 8/12/20 | $100,000 |
Affiliated Central Funds
Information regarding fiscal year to date income earned by the Fund from investments in Fidelity Central Funds is as follows:
| Fund | Income earned |
| Fidelity Municipal Cash Central Fund | $45,634 |
| Total | $45,634 |
Amounts in the income column in the above table exclude any capital gain distributions from underlying funds, which are presented in the corresponding line-item in the Statement of Operations, if applicable.
Investment Valuation
All investments are categorized as Level 2 under the Fair Value Hierarchy. The inputs or methodology used for valuing securities may not be an indication of the risk associated with investing in those securities. For more information on valuation inputs please refer to the Investment Valuation section in the accompanying Notes to Financial Statements.
See accompanying notes which are an integral part of the financial statements.
Fidelity® Arizona Municipal Money Market Fund
Financial Statements
Statement of Assets and Liabilities
| | | August 31, 2020 |
| Assets | | |
Investment in securities, at value — See accompanying schedule:
Unaffiliated issuers (cost $81,711,117) | $81,711,117 | |
| Fidelity Central Funds (cost $4,082,000) | 4,082,000 | |
| Total Investment in Securities (cost $85,793,117) | | $85,793,117 |
| Receivable for fund shares sold | | 1,003 |
| Interest receivable | | 142,325 |
| Distributions receivable from Fidelity Central Funds | | 554 |
| Total assets | | 85,936,999 |
| Liabilities | | |
| Payable to custodian bank | $53,230 | |
| Payable for fund shares redeemed | 49,866 | |
| Distributions payable | 129 | |
| Accrued management fee | 11,775 | |
| Total liabilities | | 115,000 |
| Net Assets | | $85,821,999 |
| Net Assets consist of: | | |
| Paid in capital | | $85,805,488 |
| Total accumulated earnings (loss) | | 16,511 |
| Net Assets | | $85,821,999 |
| Net Asset Value, offering price and redemption price per share ($85,821,999 ÷ 85,670,026 shares) | | $1.00 |
See accompanying notes which are an integral part of the financial statements.
Statement of Operations
| | | Year ended August 31, 2020 |
| Investment Income | | |
| Interest | | $850,250 |
| Income from Fidelity Central Funds | | 45,634 |
| Total income | | 895,884 |
| Expenses | | |
| Management fee | $445,066 | |
| Independent trustees' fees and expenses | 295 | |
| Total expenses before reductions | 445,361 | |
| Expense reductions | (95,823) | |
| Total expenses after reductions | | 349,538 |
| Net investment income (loss) | | 546,346 |
| Realized and Unrealized Gain (Loss) | | |
| Net realized gain (loss) on: | | |
| Investment securities: | | |
| Unaffiliated issuers | 17,714 | |
| Fidelity Central Funds | 29 | |
| Capital gain distributions from Fidelity Central Funds | 26 | |
| Total net realized gain (loss) | | 17,769 |
| Net increase in net assets resulting from operations | | $564,115 |
See accompanying notes which are an integral part of the financial statements.
Statement of Changes in Net Assets
| | Year ended August 31, 2020 | Year ended August 31, 2019 |
| Increase (Decrease) in Net Assets | | |
| Operations | | |
| Net investment income (loss) | $546,346 | $1,163,939 |
| Net realized gain (loss) | 17,769 | 7,783 |
| Net increase in net assets resulting from operations | 564,115 | 1,171,722 |
| Distributions to shareholders | (551,704) | (1,164,874) |
| Share transactions | | |
| Proceeds from sales of shares | 27,678,250 | 23,231,595 |
| Reinvestment of distributions | 475,957 | 1,064,277 |
| Cost of shares redeemed | (35,079,577) | (38,805,699) |
| Net increase (decrease) in net assets and shares resulting from share transactions | (6,925,370) | (14,509,827) |
| Total increase (decrease) in net assets | (6,912,959) | (14,502,979) |
| Net Assets | | |
| Beginning of period | 92,734,958 | 107,237,937 |
| End of period | $85,821,999 | $92,734,958 |
| Other Information | | |
| Shares | | |
| Sold | 27,678,250 | 23,231,595 |
| Issued in reinvestment of distributions | 475,957 | 1,064,277 |
| Redeemed | (35,079,577) | (38,805,699) |
| Net increase (decrease) | (6,925,370) | (14,509,827) |
See accompanying notes which are an integral part of the financial statements.
Financial Highlights
Fidelity Arizona Municipal Money Market Fund
| | | | | | |
| Years ended August 31, | 2020 | 2019 | 2018 | 2017 | 2016 |
| Selected Per–Share Data | | | | | |
| Net asset value, beginning of period | $1.00 | $1.00 | $1.00 | $1.00 | $1.00 |
| Income from Investment Operations | | | | | |
| Net investment income (loss) | .006 | .012 | .008 | .003 | –A |
| Net realized and unrealized gain (loss) | –A | –A | –A | .002 | –A |
| Total from investment operations | .006 | .012 | .008 | .005 | –A |
| Distributions from net investment income | (.006) | (.012) | (.008) | (.003) | –A |
| Distributions from net realized gain | –A | –A | – | (.002) | –A |
| Total distributions | (.006) | (.012) | (.008) | (.005) | –A |
| Net asset value, end of period | $1.00 | $1.00 | $1.00 | $1.00 | $1.00 |
| Total ReturnB | .61% | 1.16% | .78% | .48% | .02% |
| Ratios to Average Net AssetsC,D | | | | | |
| Expenses before reductions | .50% | .50% | .50% | .50% | .50% |
| Expenses net of fee waivers, if any | .39% | .50% | .50% | .50% | .20% |
| Expenses net of all reductions | .39% | .50% | .50% | .50% | .20% |
| Net investment income (loss) | .61% | 1.16% | .76% | .29% | .01% |
| Supplemental Data | | | | | |
| Net assets, end of period (000 omitted) | $85,822 | $92,735 | $107,238 | $143,253 | $242,046 |
A Amount represents less than $.0005 per share.
B Total returns would have been lower if certain expenses had not been reduced during the applicable periods shown.
C Fees and expenses of any underlying mutual funds or exchange-traded funds (ETFs) are not included in the Fund's expense ratio. The Fund indirectly bears its proportionate share of these expenses. For additional expense information related to investments in Fidelity Central Funds, please refer to the "Investments in Fidelity Central Funds" note found in the Notes to Financial Statements section of the most recent Annual or Semi-Annual report.
D Expense ratios reflect operating expenses of the class. Expenses before reductions do not reflect amounts reimbursed, waived, or reduced through arrangements with the investment advisor, brokerage services, or other offset arrangements, if applicable, and do not represent the amount paid by the class during periods when reimbursements, waivers or reductions occur.
See accompanying notes which are an integral part of the financial statements.
Notes to Financial Statements
For the period ended August 31, 2020
1. Organization.
Fidelity Arizona Municipal Income Fund (the Income Fund) is a fund of Fidelity Union Street Trust. Fidelity Arizona Municipal Money Market Fund (the Money Market Fund) is a fund of Fidelity Union Street Trust II. Each Trust is registered under the Investment Company Act of 1940, as amended (the 1940 Act), as an open-end management investment company. Fidelity Union Street Trust and Fidelity Union Street Trust II (the Trusts) are organized as a Massachusetts business trust and a Delaware statutory trust, respectively. The Income Fund is a non-diversified fund. Each Fund is authorized to issue an unlimited number of shares. Shares of the Money Market Fund are only available for purchase by retail shareholders. Share transactions on the Statement of Changes in Net Assets may contain exchanges between affiliated funds. Each Fund may be affected by economic and political developments in the state of Arizona.
Effective January 1, 2020:
Investment advisers Fidelity Investments Money Management, Inc., FMR Co., Inc., and Fidelity SelectCo, LLC, merged with and into Fidelity Management & Research Company. In connection with the merger transactions, the resulting, merged investment adviser was then redomiciled from Massachusetts to Delaware, changed its corporate structure from a corporation to a limited liability company, and changed its name to "Fidelity Management & Research Company LLC".
2. Investments in Fidelity Central Funds.
The Funds may invest in Fidelity Central Funds, which are open-end investment companies generally available only to other investment companies and accounts managed by the investment adviser and its affiliates. The Funds' Schedules of Investments list each of the Fidelity Central Funds held as of period end, if any, as an investment of each Fund, but do not include the underlying holdings of each Fidelity Central Fund. As an Investing Fund, each Fund indirectly bears its proportionate share of the expenses of the underlying Fidelity Central Funds.
The Money Market Central Funds seek preservation of capital and current income and are managed by the investment adviser. Annualized expenses of the Money Market Central Funds as of their most recent shareholder report date ranged from less than .005% to .01%.
A complete unaudited list of holdings for each Fidelity Central Fund is available upon request or at the Securities and Exchange Commission (the SEC) website at www.sec.gov. In addition, the financial statements of the Fidelity Central Funds, which are not covered by the Funds' Report of Independent Registered Public Accounting Firm, are available on the SEC website or upon request.
3. Significant Accounting Policies.
Each Fund is an investment company and applies the accounting and reporting guidance of the Financial Accounting Standards Board (FASB) Accounting Standards Codification Topic 946 Financial Services – Investment Companies. The financial statements have been prepared in conformity with accounting principles generally accepted in the United States of America (GAAP), which require management to make certain estimates and assumptions at the date of the financial statements. Actual results could differ from those estimates. Subsequent events, if any, through the date that the financial statements were issued have been evaluated in the preparation of the financial statements. The following summarizes the significant accounting policies of the Funds:
Investment Valuation. Investments are valued as of 4:00 p.m. Eastern time on the last calendar day of the period. The Board of Trustees (the Board) has delegated the day to day responsibility for the valuation of the Income Fund's investments to the Fair Value Committee (the Committee) established by the Income Fund's investment adviser. In accordance with valuation policies and procedures approved by the Board, the Income Fund attempts to obtain prices from one or more third party pricing vendors or brokers to value its investments. When current market prices, quotations or currency exchange rates are not readily available or reliable, investments will be fair valued in good faith by the Committee, in accordance with procedures adopted by the Board. Factors used in determining fair value vary by investment type and may include market or investment specific events, changes in interest rates and credit quality. The frequency with which these procedures are used cannot be predicted and they may be utilized to a significant extent. The Committee oversees the Income Fund's valuation policies and procedures and reports to the Board on the Committee's activities and fair value determinations. The Board monitors the appropriateness of the procedures used in valuing the Income Fund's investments and ratifies the fair value determinations of the Committee.
Each Fund categorizes the inputs to valuation techniques used to value its investments into a disclosure hierarchy consisting of three levels as shown below:
- Level 1 – quoted prices in active markets for identical investments
- Level 2 – other significant observable inputs (including quoted prices for similar investments, interest rates, prepayment speeds, etc.)
- Level 3 – unobservable inputs (including the Fund's own assumptions based on the best information available)
Valuation techniques used to value each Fund's investments by major category are as follows:
For the Income Fund, debt securities, including restricted securities, are valued based on evaluated prices received from third party pricing vendors or from brokers who make markets in such securities. Municipal securities are valued by pricing vendors who utilize matrix pricing which considers yield or price of bonds of comparable quality, coupon, maturity and type or by broker-supplied prices. When independent prices are unavailable or unreliable, debt securities may be valued utilizing pricing methodologies which consider similar factors that would be used by third party pricing vendors. Debt securities are generally categorized as Level 2 in the hierarchy but may be Level 3 depending on the circumstances.
For the Money Market Fund, as permitted by compliance with certain conditions under Rule 2a-7 of the 1940 Act, securities are valued at amortized cost, which approximates fair value. The amortized cost of an instrument is determined by valuing it at its original cost and thereafter amortizing any discount or premium from its face value at a constant rate until maturity. Securities held by a money market fund are generally high quality and liquid; however, they are reflected as Level 2 because the inputs used to determine fair value are not quoted prices in an active market.
For the Income Fund, changes in valuation techniques may result in transfers in or out of an assigned level within the disclosure hierarchy. The aggregate value of investments by input level as of August 31, 2020 is included at the end of the Fund's Schedule of Investments.
Investment Transactions and Income. For financial reporting purposes, the Funds' investment holdings and NAV include trades executed through the end of the last business day of the period. The NAV per share for processing shareholder transactions is calculated as of the close of business of the New York Stock Exchange (NYSE), normally 4:00 p.m. Eastern time and includes trades executed through the end of the prior business day for the Income Fund and trades executed through the end of the current business day for the Money Market Fund. Gains and losses on securities sold are determined on the basis of identified cost and for certain Funds include proceeds received from litigation. Income and capital gain distributions from Fidelity Central Funds, if any, are recorded on the ex-dividend date. Interest income is accrued as earned and includes coupon interest and amortization of premium and accretion of discount on debt securities as applicable.
Expenses. Expenses directly attributable to a fund are charged to that fund. Expenses attributable to more than one fund are allocated among the respective funds on the basis of relative net assets or other appropriate methods. Expense estimates are accrued in the period to which they relate and adjustments are made when actual amounts are known.
Income Tax Information and Distributions to Shareholders. Each year, each Fund intends to qualify as a regulated investment company under Subchapter M of the Internal Revenue Code, including distributing substantially all of its taxable income and realized gains. As a result, no provision for U.S. Federal income taxes is required. As of August 31, 2020, each Fund did not have any unrecognized tax benefits in the financial statements; nor is each Fund aware of any tax positions for which it is reasonably possible that the total amounts of unrecognized tax benefits will significantly change in the next twelve months. Each Fund files a U.S. federal tax return, in addition to state and local tax returns as required. Each Fund's federal income tax returns are subject to examination by the Internal Revenue Service (IRS) for a period of three fiscal years after they are filed. State and local tax returns may be subject to examination for an additional fiscal year depending on the jurisdiction.
Distributions are declared and recorded daily and paid monthly from net investment income. Distributions from realized gains, if any, are declared and recorded on the ex-dividend date. Income and capital gain distributions are determined in accordance with income tax regulations, which may differ from GAAP. In addition, the Income Fund claimed a portion of the payment made to redeeming shareholders as a distribution for income tax purposes.
Capital accounts within the financial statements are adjusted for permanent book-tax differences. These adjustments have no impact on net assets or the results of operations. Capital accounts are not adjusted for temporary book-tax differences which will reverse in a subsequent period.
Book-tax differences are primarily due to the short-term gain distributions from the Fidelity Central Funds, market discount and capital loss carryforwards.
The Funds purchase municipal securities whose interest, in the opinion of the issuer, is free from federal income tax. There is no assurance that the IRS will agree with this opinion. In the event the IRS determines that the issuer does not comply with relevant tax requirements, interest payments from a security could become federally taxable, possibly retroactively to the date the security was issued.
As of period end, the cost and unrealized appreciation (depreciation) in securities, and derivatives if applicable, for federal income tax purposes were as follows for each Fund:
| | Tax cost | Gross unrealized appreciation | Gross unrealized depreciation | Net unrealized appreciation (depreciation) |
| Fidelity Arizona Municipal Income Fund | $166,318,248 | $11,979,788 | $(430,012) | $11,549,776 |
| Fidelity Arizona Municipal Money Market Fund | 85,793,117 | – | – | – |
The tax-based components of distributable earnings as of period end were as follows for each Fund:
| | Undistributed tax-exempt income | Undistributed ordinary income | Undistributed long-term capital gain | Net unrealized appreciation (depreciation) on securities and other investments |
| Fidelity Arizona Municipal Income Fund | $37,543 | $– | $683,350 | $11,549,776 |
| Fidelity Arizona Municipal Money Market Fund | 139 | 11,041 | 5,330 | – |
The tax character of distributions paid was as follows:
| August 31, 2020 | | | |
| | Tax-Exempt Income | Long-term Capital Gains | Total |
| Fidelity Arizona Municipal Income Fund | $3,970,388 | $– | $3,970,388 |
| Fidelity Arizona Municipal Money Market Fund | 546,433 | 5,271 | 551,704 |
| August 31, 2019 | | | |
| | Tax-Exempt Income | Ordinary Income | Total |
| Fidelity Arizona Municipal Income Fund | $4,145,505 | $– | $4,145,505 |
| Fidelity Arizona Municipal Money Market Fund | 1,163,825 | 1,049 | 1,164,874 |
Delayed Delivery Transactions and When-Issued Securities. During the period, certain Funds transacted in securities on a delayed delivery or when-issued basis. Payment and delivery may take place after the customary settlement period for that security. The price of the underlying securities and the date when the securities will be delivered and paid for are fixed at the time the transaction is negotiated. Securities purchased on a delayed delivery or when-issued basis are identified as such in the Schedule of Investments. Compensation for interest forgone in the purchase of a delayed delivery or when-issued debt security may be received. With respect to purchase commitments, each applicable Fund identifies securities as segregated in its records with a value at least equal to the amount of the commitment. Payables and receivables associated with the purchases and sales of delayed delivery securities having the same coupon, settlement date and broker are offset. Delayed delivery or when-issued securities that have been purchased from and sold to different brokers are reflected as both payables and receivables in the Statement of Assets and Liabilities under the caption "Delayed delivery", as applicable. Losses may arise due to changes in the value of the underlying securities or if the counterparty does not perform under the contract's terms, or if the issuer does not issue the securities due to political, economic, or other factors.
Restricted Securities (including Private Placements). The Funds may invest in securities that are subject to legal or contractual restrictions on resale. These securities generally may be resold in transactions exempt from registration or to the public if the securities are registered. Disposal of these securities may involve time-consuming negotiations and expense, and prompt sale at an acceptable price may be difficult. Information regarding restricted securities is included at the end of each applicable Fund's Schedule of Investments.
4. Purchases and Sales of Investments.
Purchases and sales of securities, other than short-term securities, are noted in the table below.
| | Purchases ($) | Sales ($) |
| Fidelity Arizona Municipal Income Fund | 35,759,969 | 30,059,775 |
5. Fees and Other Transactions with Affiliates.
Management Fee. Fidelity Management & Research Company LLC (the investment adviser) and its affiliates provides the Funds with investment management related services for which the Funds pay a monthly management fee. Under the management contract, the investment adviser pays all other expenses, except the compensation of the independent Trustees and certain other expenses such as interest expense, including commitment fees. The management fee is reduced by an amount equal to the fees and expenses paid by the Fund to the independent Trustees. Each Fund's management fee is equal to the following annual rate of average net assets:
| Fidelity Arizona Municipal Income Fund | .55% |
| Fidelity Arizona Municipal Money Market Fund | .50% |
Interfund Trades. Funds may purchase from or sell securities to other Fidelity Funds under procedures adopted by the Board. The procedures have been designed to ensure these interfund trades are executed in accordance with Rule 17a-7 of the 1940 Act. For the Income Fund, interfund trades are included within the respective purchases and sales amounts shown in the Purchases and Sales of Investments note.
6. Committed Line of Credit.
Certain Funds participate with other funds managed by the investment adviser or an affiliate in a $4.25 billion credit facility (the "line of credit") to be utilized for temporary or emergency purposes to fund shareholder redemptions or for other short-term liquidity purposes. The participating funds have agreed to pay commitment fees on their pro-rata portion of the line of credit, which are reflected in Commitment fees on the Statement of Operations, and are as follows:
| | Amount |
| Fidelity Arizona Municipal Income Fund | $433 |
During the period, there were no borrowings on this line of credit.
7. Expense Reductions.
The investment adviser or its affiliates voluntarily agreed to waive certain fees for the Money Market Fund in order to avoid a negative yield. Such arrangements may be discontinued by the investment adviser at any time. For the period, the amount of the waiver was $95,775.
In addition, through arrangements with each applicable Fund's custodian, credits realized as a result of certain uninvested cash balances were used to reduce each applicable Fund's expenses. All of the applicable expense reductions are noted in the table below.
| | Custodian credits |
| Fidelity Arizona Municipal Income Fund | $1,207 |
| Fidelity Arizona Municipal Money Market Fund | 48 |
8. Other.
The Funds' organizational documents provide former and current trustees and officers with a limited indemnification against liabilities arising in connection with the performance of their duties to the Funds. In the normal course of business, the Funds may also enter into contracts that provide general indemnifications. The Funds' maximum exposure under these arrangements is unknown as this would be dependent on future claims that may be made against the Funds. The risk of material loss from such claims is considered remote.
9. Coronavirus (COVID-19) Pandemic.
An outbreak of COVID-19 first detected in China during December 2019 has since spread globally and was declared a pandemic by the World Health Organization during March 2020. Developments that disrupt global economies and financial markets, such as the COVID-19 pandemic, may magnify factors that affect the Funds' performance.
Report of Independent Registered Public Accounting Firm
To the Board of Trustees of Fidelity Union Street Trust and Fidelity Union Street Trust II and Shareholders of Fidelity Arizona Municipal Income Fund and Fidelity Arizona Municipal Money Market Fund
Opinions on the Financial Statements
We have audited the accompanying statements of assets and liabilities, including the schedules of investments, of Fidelity Arizona Municipal Income Fund (one of the funds constituting Fidelity Union Street Trust) and Fidelity Arizona Municipal Money Market Fund (one of the funds constituting Fidelity Union Street Trust II) (hereafter collectively referred to as the “Funds”) as of August 31, 2020, the related statements of operations for the year ended August 31, 2020, the statements of changes in net assets for each of the two years in the period ended August 31, 2020, including the related notes, and the financial highlights for each of the five years in the period ended August 31, 2020 (collectively referred to as the “financial statements”). In our opinion, the financial statements present fairly, in all material respects, the financial position of each of the Funds as of August 31, 2020, the results of each of their operations for the year then ended, the changes in each of their net assets for each of the two years in the period ended August 31, 2020 and each of the financial highlights for each of the five years in the period ended August 31, 2020 in conformity with accounting principles generally accepted in the United States of America.
Basis for Opinions
These financial statements are the responsibility of the Funds' management. Our responsibility is to express an opinion on the Funds' financial statements based on our audits. We are a public accounting firm registered with the Public Company Accounting Oversight Board (United States) (PCAOB) and are required to be independent with respect to the Funds in accordance with the U.S. federal securities laws and the applicable rules and regulations of the Securities and Exchange Commission and the PCAOB.
We conducted our audits of these financial statements in accordance with the standards of the PCAOB. Those standards require that we plan and perform the audit to obtain reasonable assurance about whether the financial statements are free of material misstatement, whether due to error or fraud.
Our audits included performing procedures to assess the risks of material misstatement of the financial statements, whether due to error or fraud, and performing procedures that respond to those risks. Such procedures included examining, on a test basis, evidence regarding the amounts and disclosures in the financial statements. Our audits also included evaluating the accounting principles used and significant estimates made by management, as well as evaluating the overall presentation of the financial statements. Our procedures included confirmation of securities owned as of August 31, 2020 by correspondence with the custodian and brokers; when replies were not received from brokers, we performed other auditing procedures. We believe that our audits provide a reasonable basis for our opinions.
/s/ PricewaterhouseCoopers LLP
Boston, Massachusetts
October 8, 2020
We have served as the auditor of one or more investment companies in the Fidelity group of funds since 1932.
Trustees and Officers
The Trustees, Members of the Advisory Board (if any), and officers of the trusts and funds, as applicable, are listed below. The Board of Trustees governs each fund and is responsible for protecting the interests of shareholders. The Trustees are experienced executives who meet periodically throughout the year to oversee each fund's activities, review contractual arrangements with companies that provide services to each fund, oversee management of the risks associated with such activities and contractual arrangements, and review each fund's performance. Each of the Trustees oversees 278 funds.
The Trustees hold office without limit in time except that (a) any Trustee may resign; (b) any Trustee may be removed by written instrument, signed by at least two-thirds of the number of Trustees prior to such removal; (c) any Trustee who requests to be retired or who has become incapacitated by illness or injury may be retired by written instrument signed by a majority of the other Trustees; and (d) any Trustee may be removed at any special meeting of shareholders by a two-thirds vote of the outstanding voting securities of the trust. Each Trustee who is not an interested person (as defined in the 1940 Act) of the trust and the funds is referred to herein as an Independent Trustee. Each Independent Trustee shall retire not later than the last day of the calendar year in which his or her 75th birthday occurs. The Independent Trustees may waive this mandatory retirement age policy with respect to individual Trustees. Officers and Advisory Board Members hold office without limit in time, except that any officer or Advisory Board Member may resign or may be removed by a vote of a majority of the Trustees at any regular meeting or any special meeting of the Trustees. Except as indicated, each individual has held the office shown or other offices in the same company for the past five years.
Each fund’s Statement of Additional Information (SAI) includes more information about the Trustees. To request a free copy, call Fidelity at 1-800-544-8544
Experience, Skills, Attributes, and Qualifications of the Trustees. The Governance and Nominating Committee has adopted a statement of policy that describes the experience, qualifications, attributes, and skills that are necessary and desirable for potential Independent Trustee candidates (Statement of Policy). The Board believes that each Trustee satisfied at the time he or she was initially elected or appointed a Trustee, and continues to satisfy, the standards contemplated by the Statement of Policy. The Governance and Nominating Committee also engages professional search firms to help identify potential Independent Trustee candidates who have the experience, qualifications, attributes, and skills consistent with the Statement of Policy. From time to time, additional criteria based on the composition and skills of the current Independent Trustees, as well as experience or skills that may be appropriate in light of future changes to board composition, business conditions, and regulatory or other developments, have also been considered by the professional search firms and the Governance and Nominating Committee. In addition, the Board takes into account the Trustees' commitment and participation in Board and committee meetings, as well as their leadership of standing and ad hoc committees throughout their tenure.
In determining that a particular Trustee was and continues to be qualified to serve as a Trustee, the Board has considered a variety of criteria, none of which, in isolation, was controlling. The Board believes that, collectively, the Trustees have balanced and diverse experience, qualifications, attributes, and skills, which allow the Board to operate effectively in governing each fund and protecting the interests of shareholders. Information about the specific experience, skills, attributes, and qualifications of each Trustee, which in each case led to the Board's conclusion that the Trustee should serve (or continue to serve) as a trustee of the funds, is provided below.
Board Structure and Oversight Function. Abigail P. Johnson is an interested person and currently serves as Chairman. The Trustees have determined that an interested Chairman is appropriate and benefits shareholders because an interested Chairman has a personal and professional stake in the quality and continuity of services provided to the funds. Independent Trustees exercise their informed business judgment to appoint an individual of their choosing to serve as Chairman, regardless of whether the Trustee happens to be independent or a member of management. The Independent Trustees have determined that they can act independently and effectively without having an Independent Trustee serve as Chairman and that a key structural component for assuring that they are in a position to do so is for the Independent Trustees to constitute a substantial majority for the Board. The Independent Trustees also regularly meet in executive session. Arthur E. Johnson serves as Chairman of the Independent Trustees and as such (i) acts as a liaison between the Independent Trustees and management with respect to matters important to the Independent Trustees and (ii) with management prepares agendas for Board meetings.
Fidelity® funds are overseen by different Boards of Trustees. The funds' Board oversees Fidelity's investment-grade bond, money market, asset allocation and certain equity funds, and other Boards oversee Fidelity's high income and other equity funds. The asset allocation funds may invest in Fidelity® funds that are overseen by such other Boards. The use of separate Boards, each with its own committee structure, allows the Trustees of each group of Fidelity® funds to focus on the unique issues of the funds they oversee, including common research, investment, and operational issues. On occasion, the separate Boards establish joint committees to address issues of overlapping consequences for the Fidelity® funds overseen by each Board.
The Trustees operate using a system of committees to facilitate the timely and efficient consideration of all matters of importance to the Trustees, each fund, and fund shareholders and to facilitate compliance with legal and regulatory requirements and oversight of the funds' activities and associated risks. The Board, acting through its committees, has charged FMR and its affiliates with (i) identifying events or circumstances the occurrence of which could have demonstrably adverse effects on the funds' business and/or reputation; (ii) implementing processes and controls to lessen the possibility that such events or circumstances occur or to mitigate the effects of such events or circumstances if they do occur; and (iii) creating and maintaining a system designed to evaluate continuously business and market conditions in order to facilitate the identification and implementation processes described in (i) and (ii) above. Because the day-to-day operations and activities of the funds are carried out by or through FMR, its affiliates, and other service providers, the funds' exposure to risks is mitigated but not eliminated by the processes overseen by the Trustees. While each of the Board's committees has responsibility for overseeing different aspects of the funds' activities, oversight is exercised primarily through the Operations and Audit Committees. In addition, an ad hoc Board committee of Independent Trustees has worked with FMR to enhance the Board's oversight of investment and financial risks, legal and regulatory risks, technology risks, and operational risks, including the development of additional risk reporting to the Board. The Operations Committee also worked and continues to work with FMR to enhance the stress tests required under SEC regulations for money market funds. Appropriate personnel, including but not limited to the funds' Chief Compliance Officer (CCO), FMR's internal auditor, the independent accountants, the funds' Treasurer and portfolio management personnel, make periodic reports to the Board's committees, as appropriate, including an annual review of Fidelity's risk management program for the Fidelity® funds. The responsibilities of each standing committee, including their oversight responsibilities, are described further under "Standing Committees of the Trustees."
Interested Trustees*:
Correspondence intended for a Trustee who is an interested person may be sent to Fidelity Investments, 245 Summer Street, Boston, Massachusetts 02210.
Name, Year of Birth; Principal Occupations and Other Relevant Experience+
Abigail P. Johnson (1961)
Year of Election or Appointment: 2009
Trustee
Chairman of the Board of Trustees
Ms. Johnson also serves as Trustee of other Fidelity® funds. Ms. Johnson serves as Chairman (2016-present), Chief Executive Officer (2014-present), and Director (2007-present) of FMR LLC (diversified financial services company), President of Fidelity Financial Services (2012-present) and President of Personal, Workplace and Institutional Services (2005-present). Ms. Johnson is Chairman and Director of Fidelity Management & Research Company LLC (investment adviser firm, 2011-present). Previously, Ms. Johnson served as Chairman and Director of FMR Co., Inc. (investment adviser firm, 2011-2019), Vice Chairman (2007-2016) and President (2013-2016) of FMR LLC, President and a Director of Fidelity Management & Research Company (2001-2005), a Trustee of other investment companies advised by Fidelity Management & Research Company, Fidelity Investments Money Management, Inc. (investment adviser firm), and FMR Co., Inc. (2001-2005), Senior Vice President of the Fidelity® funds (2001-2005), and managed a number of Fidelity® funds. Ms. Abigail P. Johnson and Mr. Arthur E. Johnson are not related.
Jennifer Toolin McAuliffe (1959)
Year of Election or Appointment: 2016
Trustee
Ms. McAuliffe also serves as Trustee of other Fidelity® funds. Previously, Ms. McAuliffe served as Co-Head of Fixed Income of Fidelity Investments Limited (now known as FIL Limited (FIL)) (diversified financial services company), Director of Research for FIL’s credit and quantitative teams in London, Hong Kong and Tokyo and Director of Research for taxable and municipal bonds at Fidelity Investments Money Management, Inc. Ms. McAuliffe previously served as a member of the Advisory Board of certain Fidelity® funds (2016). Ms. McAuliffe was previously a lawyer at Ropes & Gray LLP and currently serves as director or trustee of several not-for-profit entities.
* Determined to be an “Interested Trustee” by virtue of, among other things, his or her affiliation with the trust[s] or various entities under common control with FMR.
+ The information includes the Trustee's principal occupation during the last five years and other information relating to the experience, attributes, and skills relevant to the Trustee's qualifications to serve as a Trustee, which led to the conclusion that the Trustee should serve as a Trustee for each fund.
Independent Trustees:
Correspondence intended for an Independent Trustee may be sent to Fidelity Investments, P.O. Box 55235, Boston, Massachusetts 02205-5235.
Name, Year of Birth; Principal Occupations and Other Relevant Experience+
Elizabeth S. Acton (1951)
Year of Election or Appointment: 2013
Trustee
Ms. Acton also serves as Trustee of other Fidelity® funds. Prior to her retirement, Ms. Acton served as Executive Vice President, Finance (2011-2012), Executive Vice President, Chief Financial Officer (2002-2011) and Treasurer (2004-2005) of Comerica Incorporated (financial services). Prior to joining Comerica, Ms. Acton held a variety of positions at Ford Motor Company (1983-2002), including Vice President and Treasurer (2000-2002) and Executive Vice President and Chief Financial Officer of Ford Motor Credit Company (1998-2000). Ms. Acton currently serves as a member of the Board and Audit and Finance Committees of Beazer Homes USA, Inc. (homebuilding, 2012-present). Ms. Acton previously served as a member of the Advisory Board of certain Fidelity® funds (2013-2016).
Ann E. Dunwoody (1953)
Year of Election or Appointment: 2018
Trustee
General Dunwoody also serves as Trustee of other Fidelity® funds. General Dunwoody (United States Army, Retired) was the first woman in U.S. military history to achieve the rank of four-star general and prior to her retirement in 2012 held a variety of positions within the U.S. Army, including Commanding General, U.S. Army Material Command (2008-2012). General Dunwoody currently serves as President of First to Four LLC (leadership and mentoring services, 2012-present), a member of the Board and Nomination and Corporate Governance Committees of Kforce Inc. (professional staffing services, 2016-present) and a member of the Board of Automattic Inc. (software engineering, 2018-present). Previously, General Dunwoody served as a member of the Advisory Board and Nominating and Corporate Governance Committee of L3 Technologies, Inc. (communication, electronic, sensor and aerospace systems, 2013-2019) and a member of the Board and Audit and Sustainability and Corporate Responsibility Committees of Republic Services, Inc. (waste collection, disposal and recycling, 2013-2016). Ms. Dunwoody also serves on several boards for non-profit organizations, including as a member of the Board, Chair of the Nomination and Governance Committee and a member of the Audit Committee of Logistics Management Institute (consulting non-profit, 2012-present), a member of the Council of Trustees for the Association of the United States Army (advocacy non-profit, 2013-present), a member of the Board of Florida Institute of Technology (2015-present) and a member of the Board of ThanksUSA (military family education non-profit, 2014-present). General Dunwoody previously served as a member of the Advisory Board of certain Fidelity® funds (2018).
John Engler (1948)
Year of Election or Appointment: 2014
Trustee
Mr. Engler also serves as Trustee of other Fidelity® funds. Previously, Mr. Engler served as Governor of Michigan (1991-2003), President of the Business Roundtable (2011-2017) and interim President of Michigan State University (2018-2019). Mr. Engler currently serves as a member of the Board of K12 Inc. (technology-based education company, 2012-present). Previously, Mr. Engler served as a member of the Board of Universal Forest Products (manufacturer and distributor of wood and wood-alternative products, 2003-2019) and Trustee of The Munder Funds (2003-2014). Mr. Engler previously served as a member of the Advisory Board of certain Fidelity® funds (2014-2016).
Robert F. Gartland (1951)
Year of Election or Appointment: 2010
Trustee
Mr. Gartland also serves as Trustee of other Fidelity® funds. Prior to his retirement, Mr. Gartland held a variety of positions at Morgan Stanley (financial services, 1979-2007), including Managing Director (1987-2007) and Chase Manhattan Bank (1975-1978). Mr. Gartland previously served as Chairman and an investor in Gartland & Mellina Group Corp. (consulting, 2009-2019), as a member of the Board of National Securities Clearing Corporation (1993-1996) and as Chairman of TradeWeb (2003-2004).
Arthur E. Johnson (1947)
Year of Election or Appointment: 2008
Trustee
Chairman of the Independent Trustees
Mr. Johnson also serves as Trustee of other Fidelity® funds. Prior to his retirement, Mr. Johnson served as Senior Vice President of Corporate Strategic Development of Lockheed Martin Corporation (defense contractor, 1999-2009). Mr. Johnson currently serves as a member of the Board of Booz Allen Hamilton (management consulting, 2011-present). Mr. Johnson previously served as a member of the Board of Eaton Corporation plc (diversified power management, 2009-2019) and a member of the Board of AGL Resources, Inc. (holding company, 2002-2016). Mr. Johnson previously served as Vice Chairman (2015-2018) of the Independent Trustees of certain Fidelity® funds. Mr. Arthur E. Johnson is not related to Ms. Abigail P. Johnson.
Michael E. Kenneally (1954)
Year of Election or Appointment: 2009
Trustee
Vice Chairman of the Independent Trustees
Mr. Kenneally also serves as Trustee of other Fidelity® funds. Prior to his retirement, Mr. Kenneally served as Chairman and Global Chief Executive Officer of Credit Suisse Asset Management and Executive Vice President and Chief Investment Officer of Bank of America Corporation. Earlier roles at Bank of America included Director of Research, Senior Portfolio Manager for various institutional equity accounts and mutual funds and Portfolio Manager for a number of institutional fixed-income clients. Mr. Kenneally began his career as a Research Analyst in 1983 and was awarded the Chartered Financial Analyst (CFA) designation in 1991.
Marie L. Knowles (1946)
Year of Election or Appointment: 2001
Trustee
Ms. Knowles also serves as Trustee of other Fidelity® funds. Prior to her retirement, Ms. Knowles held several positions at Atlantic Richfield Company (diversified energy), including Executive Vice President and Chief Financial Officer (1996-2000), Senior Vice President (1993-1996) and President of ARCO Transportation Company (pipeline and tanker operations, 1993-1996). Ms. Knowles currently serves as a member of the Board of McKesson Corporation (healthcare service, since 2002), a member of the Board of the Santa Catalina Island Company (real estate, 2009-present), a member of the Investment Company Institute Board of Governors and a member of the Governing Council of the Independent Directors Council (2014-present). Ms. Knowles also serves as a member of the Advisory Board for the School of Engineering of the University of Southern California. Ms. Knowles previously served as Chairman (2015-2018) and Vice Chairman (2012-2015) of the Independent Trustees of certain Fidelity® funds.
Mark A. Murray (1954)
Year of Election or Appointment: 2016
Trustee
Mr. Murray also serves as Trustee of other Fidelity® funds. Previously, Mr. Murray served as Co-Chief Executive Officer (2013-2016), President (2006-2013) and Vice Chairman (2013-2020) of Meijer, Inc. Mr. Murray serves as a member of the Board and Nuclear Review and Public Policy and Responsibility Committees of DTE Energy Company (diversified energy company, 2009-present) and a member of the Board and Audit Committee and Chairman of the Nominating and Corporate Governance Committee of Universal Forest Products, Inc. (manufacturer and distributor of wood and wood-alternative products, 2004-2016). Mr. Murray previously served as a member of the Board of Spectrum Health (not-for-profit health system, 2015-2019). Mr. Murray also serves as a member of the Board of many community and professional organizations. Mr. Murray previously served as a member of the Advisory Board of certain Fidelity® funds (2016).
+ The information includes the Trustee's principal occupation during the last five years and other information relating to the experience, attributes, and skills relevant to the Trustee's qualifications to serve as a Trustee, which led to the conclusion that the Trustee should serve as a Trustee for each fund.
Advisory Board Members and Officers:
Correspondence intended for an officer may be sent to Fidelity Investments, 245 Summer Street, Boston, Massachusetts 02210. Officers appear below in alphabetical order.
Name, Year of Birth; Principal Occupation
Elizabeth Paige Baumann (1968)
Year of Election or Appointment: 2017
Anti-Money Laundering (AML) Officer
Ms. Baumann also serves as AML Officer of other funds. She is Chief AML Officer (2012-present) and Senior Vice President (2014-present) of FMR LLC (diversified financial services company) and is an employee of Fidelity Investments. Previously, Ms. Baumann served as AML Officer of certain funds (2017-2019), as AML Officer of the funds (2012-2016), and Vice President (2007-2014) and Deputy Anti-Money Laundering Officer (2007-2012) of FMR LLC.
Craig S. Brown (1977)
Year of Election or Appointment: 2019
Assistant Treasurer
Mr. Brown also serves as Assistant Treasurer of other funds. Mr. Brown is an employee of Fidelity Investments (2013-present).
John J. Burke III (1964)
Year of Election or Appointment: 2018
Chief Financial Officer
Mr. Burke also serves as Chief Financial Officer of other funds. Mr. Burke serves as Head of Investment Operations for Fidelity Fund and Investment Operations (2018-present) and is an employee of Fidelity Investments (1998-present). Previously Mr. Burke served as head of Asset Management Investment Operations (2012-2018).
David J. Carter (1973)
Year of Election or Appointment: 2020
Assistant Secretary
Mr. Carter also serves as Assistant Secretary of other funds. Mr. Carter serves as Vice President, Associate General Counsel (2010-present) and is an employee of Fidelity Investments (2005-present).
Jonathan Davis (1968)
Year of Election or Appointment: 2010
Assistant Treasurer
Mr. Davis also serves as Assistant Treasurer of other funds. Mr. Davis serves as Assistant Treasurer of FMR Capital, Inc. (2017-present) and is an employee of Fidelity Investments. Previously, Mr. Davis served as Vice President and Associate General Counsel of FMR LLC (diversified financial services company, 2003-2010).
Laura M. Del Prato (1964)
Year of Election or Appointment: 2018
President and Treasurer
Ms. Del Prato also serves as an officer of other funds. Ms. Del Prato is an employee of Fidelity Investments (2017-present). Previously, Ms. Del Prato served as President and Treasurer of The North Carolina Capital Management Trust: Cash Portfolio and Term Portfolio (2018-2020). Prior to joining Fidelity Investments, Ms. Del Prato served as a Managing Director and Treasurer of the JPMorgan Mutual Funds (2014-2017). Prior to JPMorgan, Ms. Del Prato served as a partner at Cohen Fund Audit Services (accounting firm, 2012-2013) and KPMG LLP (accounting firm, 2004-2012).
Colm A. Hogan (1973)
Year of Election or Appointment: 2016
Assistant Treasurer
Mr. Hogan also serves as an officer of other funds. Mr. Hogan serves as Assistant Treasurer of FMR Capital, Inc. (2017-present) and is an employee of Fidelity Investments (2005-present). Previously, Mr. Hogan served as Deputy Treasurer of certain Fidelity® funds (2016-2020) and Assistant Treasurer of certain Fidelity® funds (2016-2018).
Cynthia Lo Bessette (1969)
Year of Election or Appointment: 2019
Secretary and Chief Legal Officer (CLO)
Ms. Lo Bessette also serves as an officer of other funds. Ms. Lo Bessette serves as CLO, Secretary, and Senior Vice President of Fidelity Management & Research Company LLC (investment adviser firm, 2019-present); and CLO of Fidelity Management & Research (Hong Kong) Limited, FMR Investment Management (UK) Limited, and Fidelity Management & Research (Japan) Limited (investment adviser firms, 2019-present). She is a Senior Vice President and Deputy General Counsel of FMR LLC (diversified financial services company, 2019-present), and is an employee of Fidelity Investments. Previously, Ms. Lo Bessette served as CLO, Secretary, and Senior Vice President of FMR Co., Inc. (investment adviser firm, 2019); Secretary of Fidelity SelectCo, LLC and Fidelity Investments Money Management, Inc. (investment adviser firms, 2019). Prior to joining Fidelity Investments, Ms. Lo Bessette was Executive Vice President, General Counsel (2016-2019) and Senior Vice President, Deputy General Counsel (2015-2016) of OppenheimerFunds (investment management company) and Deputy Chief Legal Officer (2013-2015) of Jennison Associates LLC (investment adviser firm).
Chris Maher (1972)
Year of Election or Appointment: 2013
Assistant Treasurer
Mr. Maher also serves as an officer of other funds. Mr. Maher serves as Assistant Treasurer of FMR Capital, Inc. (2017-present), and is an employee of Fidelity Investments (2008-present). Previously, Mr. Maher served as Assistant Treasurer of certain funds (2013-2020); Vice President of Asset Management Compliance (2013), Vice President of the Program Management Group of FMR (investment adviser firm, 2010-2013), and Vice President of Valuation Oversight (2008-2010).
Jamie Pagliocco (1964)
Year of Election or Appointment: 2020
Vice President
Mr. Pagliocco also serves as Vice President of other funds. Mr. Pagliocco serves as President of Fixed Income (2020-present), and is an employee of Fidelity Investments (2001-present). Previously, Mr. Pagliocco served as Co-Chief Investment Officer – Bond (2017-2020), Global Head of Bond Trading (2016-2019), and as a portfolio manager.
Kenneth B. Robins (1969)
Year of Election or Appointment: 2020
Chief Compliance Officer
Mr. Robins also serves as an officer of other funds. Mr. Robins serves as Compliance Officer of Fidelity Management & Research Company LLC (investment adviser firm, 2016-present) and is an employee of Fidelity Investments (2004-present). Previously, Mr. Robins served as Compliance Officer of FMR Co., Inc. (investment adviser firm, 2016-2019), as Executive Vice President of Fidelity Investments Money Management, Inc. (investment adviser firm, 2013-2016) and served in other fund officer roles.
Stacie M. Smith (1974)
Year of Election or Appointment: 2013
Assistant Treasurer
Ms. Smith also serves as an officer of other funds. Ms. Smith serves as Assistant Treasurer of FMR Capital, Inc. (2017-present), is an employee of Fidelity Investments (2009-present), and has served in other fund officer roles. Prior to joining Fidelity Investments, Ms. Smith served as Senior Audit Manager of Ernst & Young LLP (accounting firm, 1996-2009). Previously, Ms. Smith served as Assistant Treasurer (2013-2019) and Deputy Treasurer (2013-2016) of certain Fidelity® funds.
Marc L. Spector (1972)
Year of Election or Appointment: 2016
Deputy Treasurer
Mr. Spector also serves as an officer of other funds. Mr. Spector serves as Assistant Treasurer of FMR Capital, Inc. (2017-present) and is an employee of Fidelity Investments (2016-present). Prior to joining Fidelity Investments, Mr. Spector served as Director at the Siegfried Group (accounting firm, 2013-2016), and prior to Siegfried Group as audit senior manager at Deloitte & Touche LLP (accounting firm, 2005-2013).
Jim Wegmann (1979)
Year of Election or Appointment: 2019
Assistant Treasurer
Mr. Wegmann also serves as Assistant Treasurer of other funds. Mr. Wegmann is an employee of Fidelity Investments (2011-present).
Shareholder Expense Example
As a shareholder, you incur two types of costs: (1) transaction costs, which may include sales charges (loads) on purchase payments or redemption proceeds, as applicable and (2) ongoing costs, which generally include management fees, distribution and/or service (12b-1) fees and other Fund expenses. This Example is intended to help you understand your ongoing costs (in dollars) of investing in a fund and to compare these costs with the ongoing costs of investing in other mutual funds.
The Example is based on an investment of $1,000 invested at the beginning of the period and held for the entire period (March 1, 2020 to August 31, 2020).
Actual Expenses
The first line of the accompanying table provides information about actual account values and actual expenses. You may use the information in this line, together with the amount you invested, to estimate the expenses that you paid over the period. Simply divide your account value by $1,000.00 (for example, an $8,600 account value divided by $1,000.00 = 8.6), then multiply the result by the number in the first line for a class/Fund under the heading entitled "Expenses Paid During Period" to estimate the expenses you paid on your account during this period. If any fund is a shareholder of any underlying mutual funds or exchange-traded funds (ETFs) (the Underlying Funds), such fund indirectly bears its proportional share of the expenses of the Underlying Funds in addition to the direct expenses incurred presented in the table. These fees and expenses are not included in the annualized expense ratio used to calculate the expense estimate in the table below.
Hypothetical Example for Comparison Purposes
The second line of the accompanying table provides information about hypothetical account values and hypothetical expenses based on the actual expense ratio and an assumed rate of return of 5% per year before expenses, which is not the actual return. The hypothetical account values and expenses may not be used to estimate the actual ending account balance or expenses you paid for the period. You may use this information to compare the ongoing costs of investing in the Fund and other funds. To do so, compare this 5% hypothetical example with the 5% hypothetical examples that appear in the shareholder reports of the other funds. If any fund is a shareholder of any Underlying Funds, such fund indirectly bears its proportional share of the expenses of the Underlying Funds in addition to the direct expenses as presented in the table. These fees and expenses are not included in the annualized expense ratio used to calculate the expense estimate in the table below.
Please note that the expenses shown in the table are meant to highlight your ongoing costs only and do not reflect any transaction costs. Therefore, the second line of the table is useful in comparing ongoing costs only, and will not help you determine the relative total costs of owning different funds.
| | Annualized Expense Ratio-A | Beginning
Account Value
March 1, 2020 | Ending
Account Value
August 31, 2020 | Expenses Paid
During Period-B
March 1, 2020
to August 31, 2020 |
| Fidelity Arizona Municipal Income Fund | .55% | | | |
| Actual | | $1,000.00 | $996.10 | $2.76 |
| Hypothetical-C | | $1,000.00 | $1,022.37 | $2.80 |
| Fidelity Arizona Municipal Money Market Fund | .28% | | | |
| Actual | | $1,000.00 | $1,002.30 | $1.41** |
| Hypothetical-C | | $1,000.00 | $1,023.73 | $1.42** |
A Annualized expense ratio reflects expenses net of applicable fee waivers.
B Expenses are equal to the annualized expense ratio, multiplied by the average account value over the period, multiplied by 184/ 366 (to reflect the one-half year period). The fees and expenses of any Underlying Funds are not included in each annualized expense ratio.
C 5% return per year before expenses
** If certain fees were not voluntarily waived by the investment advisor or its affiliates during the period, the annualized expense ratio would have been .50% and the expenses paid in the actual and hypothetical examples above would have been $2.52 and $2.54, respectively.
Distributions (Unaudited)
The Board of Trustees of each fund voted to pay to shareholders of record at the opening of business on record date, the following distributions per share derived from capital gains realized from sales of portfolio securities:
| | Pay Date | Record Date | Capital Gains |
| Fidelity Arizona Municipal Income Fund | 10/05/2020 | 10/02/2020 | $0.04800 |
| Fidelity Arizona Municipal Money Market Fund | 10/05/2020 | 10/02/2020 | $0.00066 |
The funds hereby designate as capital gain dividend the amounts noted below for the taxable year ended August 31, 2020, or, if subsequently determined to be different, the net capital gain of such year.
| Fidelity Arizona Municipal Income Fund | $734,864 |
| Fidelity Arizona Municipal Money Market Fund | $6,092 |
|
During fiscal year ended 2020, 100% of each fund's income dividends were free from federal income tax, and 7.13% and 56.47% of Fidelity Arizona Municipal Income Fund and Fidelity Arizona Municipal Money Market Fund's income dividends were subject to the federal alternative minimum tax.
The funds will notify shareholders in January 2021 of amounts for use in preparing 2020 income tax returns.

AZI-SPZ-ANN-1020
1.536826.123
Fidelity® Maryland Municipal Income Fund
Annual Report
August 31, 2020
See the inside front cover for important information about access to your fund’s shareholder reports.
Beginning on January 1, 2021, as permitted by regulations adopted by the Securities and Exchange Commission, paper copies of a fund’s shareholder reports will no longer be sent by mail, unless you specifically request paper copies of the reports from the fund or from your financial intermediary, such as a financial advisor, broker-dealer or bank. Instead, the reports will be made available on a website, and you will be notified by mail each time a report is posted and provided with a website link to access the report.
If you already elected to receive shareholder reports electronically, you will not be affected by this change and you need not take any action. You may elect to receive shareholder reports and other communications from a fund electronically, by contacting your financial intermediary. For Fidelity customers, visit Fidelity's web site or call Fidelity using the contact information listed below.
You may elect to receive all future reports in paper free of charge. If you wish to continue receiving paper copies of your shareholder reports, you may contact your financial intermediary or, if you are a Fidelity customer, visit Fidelity’s website, or call Fidelity at the applicable toll-free number listed below. Your election to receive reports in paper will apply to all funds held with the fund complex/your financial intermediary.
| Account Type | Website | Phone Number |
| Brokerage, Mutual Fund, or Annuity Contracts: | fidelity.com/mailpreferences | 1-800-343-3548 |
| Employer Provided Retirement Accounts: | netbenefits.fidelity.com/preferences (choose 'no' under Required Disclosures to continue to print) | 1-800-343-0860 |
| Advisor Sold Accounts Serviced Through Your Financial Intermediary: | Contact Your Financial Intermediary | Your Financial Intermediary's phone number |
| Advisor Sold Accounts Serviced by Fidelity: | institutional.fidelity.com | 1-877-208-0098 |
Contents
To view a fund's proxy voting guidelines and proxy voting record for the 12-month period ended June 30, visit http://www.fidelity.com/proxyvotingresults or visit the Securities and Exchange Commission's (SEC) web site at http://www.sec.gov.
You may also call 1-800-544-8544 to request a free copy of the proxy voting guidelines.
Standard & Poor's, S&P and S&P 500 are registered service marks of The McGraw-Hill Companies, Inc. and have been licensed for use by Fidelity Distributors Corporation.
Other third-party marks appearing herein are the property of their respective owners.
All other marks appearing herein are registered or unregistered trademarks or service marks of FMR LLC or an affiliated company. © 2020 FMR LLC. All rights reserved.
This report and the financial statements contained herein are submitted for the general information of the shareholders of the Fund. This report is not authorized for distribution to prospective investors in the Fund unless preceded or accompanied by an effective prospectus.
A fund files its complete schedule of portfolio holdings with the SEC for the first and third quarters of each fiscal year on Form N-PORT. Forms N-PORT are available on the SEC’s web site at http://www.sec.gov. A fund's Forms N-PORT may be reviewed and copied at the SEC’s Public Reference Room in Washington, DC. Information regarding the operation of the SEC's Public Reference Room may be obtained by calling 1-800-SEC-0330.
For a complete list of a fund's portfolio holdings, view the most recent holdings listing, semiannual report, or annual report on Fidelity's web site at http://www.fidelity.com, http://www.institutional.fidelity.com, or http://www.401k.com, as applicable.
NOT FDIC INSURED •MAY LOSE VALUE •NO BANK GUARANTEE
Neither the Fund nor Fidelity Distributors Corporation is a bank.
Note to Shareholders:
Early in 2020, the outbreak and spread of a new coronavirus emerged as a public health emergency that had a major influence on financial markets, primarily based on its impact on the global economy and the outlook for corporate earnings. The virus causes a respiratory disease known as COVID-19. On March 11, the World Health Organization declared the COVID-19 outbreak a pandemic, citing sustained risk of further global spread.
In the weeks following, as the crisis worsened, we witnessed an escalating human tragedy with wide-scale social and economic consequences from coronavirus-containment measures. The outbreak of COVID-19 prompted a number of measures to limit the spread, including travel and border restrictions, quarantines, and restrictions on large gatherings. In turn, these resulted in lower consumer activity, diminished demand for a wide range of products and services, disruption in manufacturing and supply chains, and – given the wide variability in outcomes regarding the outbreak – significant market uncertainty and volatility. Amid the turmoil, the U.S. government took unprecedented action – in concert with the U.S. Federal Reserve and central banks around the world – to help support consumers, businesses, and the broader economy, and to limit disruption to the financial system.
The situation continues to unfold, and the extent and duration of its impact on financial markets and the economy remain highly uncertain. Extreme events such as the coronavirus crisis are “exogenous shocks” that can have significant adverse effects on mutual funds and their investments. Although multiple asset classes may be affected by market disruption, the duration and impact may not be the same for all types of assets.
Fidelity is committed to helping you stay informed amid news about COVID-19 and during increased market volatility, and we’re taking extra steps to be responsive to customer needs. We encourage you to visit our websites, where we offer ongoing updates, commentary, and analysis on the markets and our funds.
Performance: The Bottom Line
Average annual total return reflects the change in the value of an investment, assuming reinvestment of distributions from dividend income and capital gains (the profits earned upon the sale of securities that have grown in value, if any) and assuming a constant rate of performance each year. The hypothetical investment and the average annual total returns do not reflect the deduction of taxes that a shareholder would pay on fund distributions or the redemption of fund shares. During periods of reimbursement by Fidelity, a fund’s total return will be greater than it would be had the reimbursement not occurred. How a fund did yesterday is no guarantee of how it will do tomorrow.
Average Annual Total Returns
| For the periods ended August 31, 2020 | Past 1 year | Past 5 years | Past 10 years |
| Fidelity® Maryland Municipal Income Fund | 1.45% | 3.35% | 3.34% |
$10,000 Over 10 Years
Let's say hypothetically that $10,000 was invested in Fidelity® Maryland Municipal Income Fund on August 31, 2010.
The chart shows how the value of your investment would have changed, and also shows how the Bloomberg Barclays Municipal Bond Index performed over the same period.
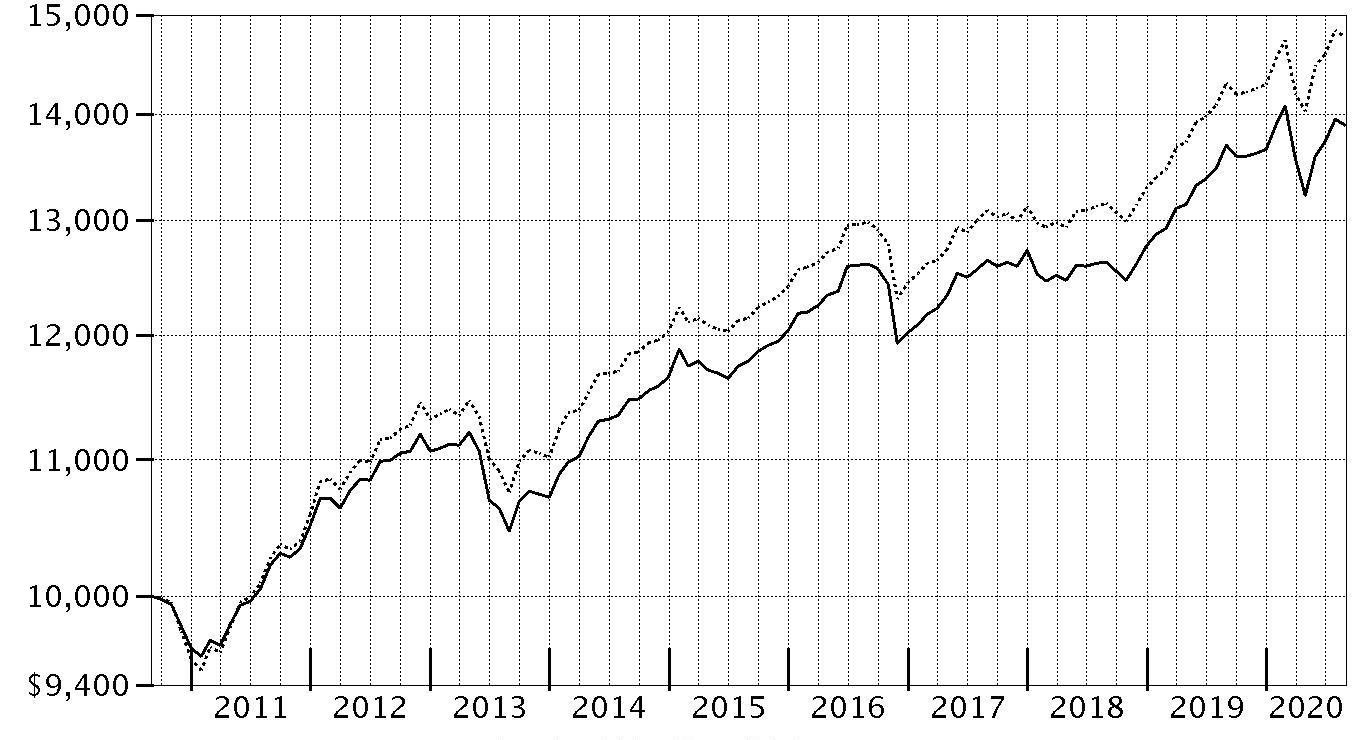
| Period Ending Values |
| $13,893 | Fidelity® Maryland Municipal Income Fund |
| $14,768 | Bloomberg Barclays Municipal Bond Index |
Management's Discussion of Fund Performance
Market Recap: Tax-exempt municipal bonds posted a gain for the 12 months ending August 31, 2020, overcoming market volatility related to economic and credit fears caused by the coronavirus. The Bloomberg Barclays Municipal Bond Index rose 3.24% for the period. Munis gained 7.54% in 2019 and began 2020 on an upswing, driven by extremely robust investor demand. By the second week of March, however, the emerging coronavirus pandemic began to raise the prospect of a broad economic slowdown that would present financial challenges for muni issuers across sectors. For example, revenue bonds used to finance airport projects were hampered by a sharp reduction in air travel. Also, bonds issued by hospitals received scrutiny due to uncertain reimbursement for coronavirus-related treatment and the halt of elective medical procedures. State and local government tax revenue was impacted by the delay in the income-tax filing date to July 15 and the collapse in revenue from sales taxes, activity taxes and fees. Muni yields rose substantially as a result of this heightened credit uncertainty. The U.S. Federal Reserve responded to the risk of rapid economic contraction and dysfunction in the credit markets with substantial stimulus. This led to increased market liquidity and a return of new issuance in the primary market, which continued through August 31.
Comments from Co-Portfolio Managers Cormac Cullen, Michael Maka and Elizah McLaughlin: For the fiscal year, the fund gained 1.45%, lagging, net of fees, the 3.81% advance of the state benchmark, the Bloomberg Barclays Maryland 2+ Year Enhanced Municipal Bond Index Linked. We focused on longer-term objectives and sought to generate attractive tax-exempt income and competitive risk-adjusted returns over time. Versus the state benchmark, the fund's overweighting in lower-rated securities detracted from performance, as these bonds fared poorly in March, April and May. l. Overweightings in bonds issued by the Baltimore Convention Center for Baltimore Convention Center Hotel Revenue bonds and the debt of the Maryland Economic Development Corporation issued for the Purple Line particularly hurt, because the credit ratings of these entities were downgraded. Underweighting higher-quality securities that fared comparatively well held back relative performance as well. Differences in the way fund holdings and index components were priced further hampered the fund's relative result. In contrast, the fund's holdings cumulatively produced more income than index, which helped on relative basis.
The views expressed above reflect those of the portfolio manager(s) only through the end of the period as stated on the cover of this report and do not necessarily represent the views of Fidelity or any other person in the Fidelity organization. Any such views are subject to change at any time based upon market or other conditions and Fidelity disclaims any responsibility to update such views. These views may not be relied on as investment advice and, because investment decisions for a Fidelity fund are based on numerous factors, may not be relied on as an indication of trading intent on behalf of any Fidelity fund.
Note to shareholders: On March 1, 2020, Michael Maka assumed co-management responsibilities for the fund. He succeeded Kevin Ramundo, who retired from Fidelity on June 30, 2020, after more than 20 years with the firm.
Investment Summary (Unaudited)
Top Five Sectors as of August 31, 2020
| | % of fund's net assets |
| Health Care | 34.3 |
| General Obligations | 21.7 |
| Water & Sewer | 10.2 |
| Escrowed/Pre-Refunded | 9.7 |
| Education | 7.3 |
Quality Diversification (% of fund's net assets)
| As of August 31, 2020 |
| | AAA | 8.2% |
| | AA,A | 62.7% |
| | BBB | 16.1% |
| | BB and Below | 1.5% |
| | Not Rated | 9.0% |
| | Short-Term Investments and Net Other Assets | 2.5% |

We have used ratings from Moody's Investors Service, Inc. Where Moody's® ratings are not available, we have used S&P® ratings. All ratings are as of the date indicated and do not reflect subsequent changes.
Schedule of Investments August 31, 2020
Showing Percentage of Net Assets
| Municipal Bonds - 97.5% | | | |
| | | Principal Amount | Value |
| District Of Columbia - 1.1% | | | |
| Washington D.C. Metropolitan Transit Auth. Rev. Series 2017 B, 5% 7/1/33 | | 2,000,000 | 2,483,540 |
| Guam - 0.2% | | | |
| Guam Int'l. Arpt. Auth. Rev. Series 2013 C, 6.25% 10/1/34 (a) | | 300,000 | 310,194 |
| Maryland - 96.2% | | | |
| Anne Arundel County Gen. Oblig.: | | | |
| Series 2014, 5% 4/1/25 | | $2,140,000 | $2,501,253 |
| Series 2015: | | | |
| 5% 4/1/33 | | 5,895,000 | 6,993,828 |
| 5% 4/1/33 | | 2,585,000 | 3,066,844 |
| Series 2018, 5% 10/1/35 | | 6,400,000 | 8,069,942 |
| Baltimore Convention Ctr. Hotel Rev. Series 2017, 5% 9/1/32 | | 1,500,000 | 1,339,695 |
| Baltimore County Gen. Oblig.: | | | |
| Series 2016, 5% 2/1/29 | | 1,310,000 | 1,611,156 |
| Series 2019, 4% 11/1/33 | | 1,805,000 | 2,232,045 |
| Series 2020: | | | |
| 4% 1/1/32 | | 700,000 | 791,903 |
| 4% 1/1/33 | | 1,200,000 | 1,349,904 |
| 4% 1/1/35 | | 1,230,000 | 1,373,541 |
| 4% 1/1/37 | | 1,500,000 | 1,663,755 |
| 4% 1/1/45 | | 1,750,000 | 1,875,248 |
| 4% 3/1/48 | | 2,060,000 | 2,445,138 |
| 4% 1/1/50 | | 2,400,000 | 2,561,736 |
| Baltimore Gen. Oblig.: | | | |
| (East Baltimore Research Park Proj.) Series 2017 A, 5% 9/1/38 | | 1,650,000 | 1,727,270 |
| Series 2013 B, 5% 10/15/24 | | 1,875,000 | 2,063,738 |
| Series 2015: | | | |
| 5% 6/15/23 | | 350,000 | 391,066 |
| 5% 6/15/24 | | 500,000 | 577,185 |
| Series 2017 A: | | | |
| 5% 10/15/34 | | 2,000,000 | 2,516,200 |
| 5% 10/15/36 | | 1,000,000 | 1,249,320 |
| 5% 10/15/37 | | 1,000,000 | 1,245,960 |
| Baltimore Proj. Rev.: | | | |
| (Wastewtr. Projs.): | | | |
| Series 2014 C: | | | |
| 5% 7/1/27 | | 2,325,000 | 2,748,894 |
| 5% 7/1/34 | | 1,285,000 | 1,485,589 |
| Series 2014 D, 5% 7/1/28 | | 2,750,000 | 3,257,705 |
| (Wtr. Projs.): | | | |
| Series 1994 A, 5% 7/1/24 (Nat'l. Pub. Fin. Guarantee Corp. Insured) | | 120,000 | 127,344 |
| Series 2014 A: | | | |
| 5% 7/1/28 | | 2,825,000 | 3,306,945 |
| 5% 7/1/33 | | 3,000,000 | 3,453,510 |
| Series 2014 B, 5% 7/1/28 | | 1,580,000 | 1,864,289 |
| Series 2017 D, 5% 7/1/31 | | 5,260,000 | 6,485,107 |
| City of Westminster Series 2016, 5% 11/1/31 | | 1,000,000 | 1,109,900 |
| Maryland Cmnty. Dev. Admin Dept. Hsg. & Cmnty. Dev.: | | | |
| Series 2019 B, 4% 9/1/49 | | 955,000 | 1,065,150 |
| Series 2019 C: | | | |
| 5% 9/1/29 | | 550,000 | 712,327 |
| 5% 3/1/30 | | 700,000 | 903,728 |
| 5% 3/1/31 | | 1,150,000 | 1,470,494 |
| Maryland Dept. of Trans. Consolidated Trans. Rev. Series 2018, 5% 10/1/21 | | 2,000,000 | 2,104,240 |
| Maryland Econ. Dev. Auth. Rev.: | | | |
| (Ports America Chesapeake LLC. Proj.) Series 2017 A, 5% 6/1/29 | | 1,850,000 | 2,161,559 |
| (Term. Proj.) Series 2019 A: | | | |
| 5% 6/1/44 (a) | | 500,000 | 543,385 |
| 5% 6/1/49 (a) | | 1,000,000 | 1,080,370 |
| Maryland Econ. Dev. Corp. (Purple Line Lt. Rail Proj.) Series 2016 D, 5% 3/31/31 (a) | | 1,950,000 | 1,879,430 |
| Maryland Econ. Dev. Corp. Air Cargo Series 2019: | | | |
| 5% 7/1/27 (a) | | 200,000 | 239,584 |
| 5% 7/1/28 (a) | | 630,000 | 766,471 |
| 5% 7/1/29 (a) | | 585,000 | 721,949 |
| Maryland Econ. Dev. Corp. Student Hsg. Rev.: | | | |
| (Towson Univ. Proj.) Series 2017: | | | |
| 5% 7/1/26 | | 350,000 | 375,739 |
| 5% 7/1/28 | | 305,000 | 327,390 |
| 5% 7/1/29 | | 185,000 | 197,776 |
| 5% 7/1/30 | | 250,000 | 266,030 |
| 5% 7/1/31 | | 300,000 | 317,760 |
| 5% 7/1/32 | | 325,000 | 342,453 |
| 5% 7/1/36 | | 500,000 | 520,260 |
| (Univ. of Maryland, Baltimore County Proj.) Series 2016: | | | |
| 5% 7/1/28 (FSA Insured) | | 350,000 | 419,272 |
| 5% 7/1/29 (FSA Insured) | | 700,000 | 836,129 |
| (Univ. of Maryland, College Park Projs.) Series 2016, 5% 6/1/43 (FSA Insured) | | 575,000 | 659,364 |
| Maryland Gen. Oblig. Series A: | | | |
| 5% 8/1/31 | | 1,060,000 | 1,464,252 |
| 5% 8/1/32 | | 1,000,000 | 1,370,580 |
| 5% 3/15/33 | | 2,000,000 | 2,704,340 |
| 5% 8/1/34 | | 2,000,000 | 2,716,020 |
| Maryland Health & Higher Edl. Series 2020: | | | |
| 4% 7/1/40 | | 300,000 | 336,024 |
| 4% 7/1/45 | | 750,000 | 828,443 |
| 4% 7/1/50 | | 1,000,000 | 1,099,880 |
| Maryland Health & Higher Edl. Facilities Auth. Rev.: | | | |
| (Anne Arundel Med. Ctr., MD Proj.) Series 2017 A: | | | |
| 5% 7/1/28 | | 500,000 | 613,655 |
| 5% 7/1/30 | | 850,000 | 1,032,546 |
| 5% 7/1/31 | | 1,400,000 | 1,692,530 |
| 5% 7/1/32 | | 290,000 | 348,655 |
| Series 2012 A: | | | |
| 5% 7/1/23 | | 400,000 | 431,236 |
| 5% 7/1/25 (Pre-Refunded to 7/1/22 @ 100) | | 1,000,000 | 1,083,810 |
| 5% 7/1/25 (Pre-Refunded to 7/1/22 @ 100) | | 1,120,000 | 1,213,867 |
| 5% 7/1/26 (Pre-Refunded to 7/1/22 @ 100) | | 300,000 | 325,143 |
| 5% 10/1/30 (Pre-Refunded to 10/1/22 @ 100) | | 750,000 | 822,728 |
| Series 2012: | | | |
| 5% 7/1/23 | | 850,000 | 915,892 |
| 5% 7/1/24 | | 1,100,000 | 1,184,634 |
| 5% 7/1/26 | | 1,080,000 | 1,152,598 |
| 5% 7/1/26 | | 1,400,000 | 1,502,564 |
| 5% 7/1/27 | | 300,000 | 321,444 |
| 5% 7/1/31 | | 2,500,000 | 2,634,475 |
| Series 2013 A: | | | |
| 5% 7/1/26 (Pre-Refunded to 7/1/22 @ 100) | | 1,045,000 | 1,135,602 |
| 5% 7/1/27 (Pre-Refunded to 7/1/22 @ 100) | | 1,185,000 | 1,287,740 |
| 5% 8/15/41 | | 3,000,000 | 3,316,380 |
| 5% 7/1/43 (Pre-Refunded to 7/1/22 @ 100) | | 3,495,000 | 3,798,017 |
| Series 2013 B, 5% 8/15/38 | | 2,000,000 | 2,202,220 |
| Series 2014: | | | |
| 5% 7/1/22 (Escrowed to Maturity) | | 870,000 | 943,750 |
| 5% 7/1/27 | | 3,495,000 | 3,998,245 |
| 5% 10/1/45 | | 2,500,000 | 2,725,600 |
| 5.25% 7/1/25 (Pre-Refunded to 7/1/24 @ 100) | | 5,000,000 | 5,918,800 |
| Series 2015 A: | | | |
| 5% 5/15/29 | | 2,000,000 | 2,354,180 |
| 5% 5/15/30 | | 1,000,000 | 1,170,250 |
| Series 2015: | | | |
| 5% 7/1/24 | | 100,000 | 115,079 |
| 5% 7/1/26 | | 1,000,000 | 1,136,900 |
| 5% 7/1/27 | | 1,000,000 | 1,135,130 |
| 5% 7/1/29 | | 600,000 | 702,882 |
| 5% 8/15/29 | | 2,000,000 | 2,329,160 |
| 5% 7/1/30 | | 1,075,000 | 1,254,536 |
| 5% 7/1/31 | | 2,200,000 | 2,560,624 |
| 5% 7/1/33 | | 1,325,000 | 1,511,030 |
| 5% 7/1/34 | | 1,200,000 | 1,365,984 |
| 5% 7/1/40 | | 3,350,000 | 3,822,585 |
| Series 2016 A: | | | |
| 4% 7/1/42 | | 2,175,000 | 2,304,369 |
| 5% 7/1/35 | | 1,500,000 | 1,706,835 |
| 5% 7/1/38 | | 3,215,000 | 3,631,310 |
| 5.5% 1/1/31 | | 1,500,000 | 1,742,655 |
| Series 2016: | | | |
| 5% 6/1/26 | | 300,000 | 350,730 |
| 5% 6/1/27 | | 255,000 | 296,491 |
| 5% 6/1/28 | | 310,000 | 357,715 |
| 5% 6/1/29 | | 350,000 | 401,877 |
| 5% 7/1/31 | | 500,000 | 596,055 |
| 5% 6/1/33 | | 305,000 | 343,232 |
| 5% 6/1/36 | | 250,000 | 279,288 |
| Series 2017: | | | |
| 4% 7/1/42 | | 2,845,000 | 3,152,118 |
| 5% 6/1/27 | | 290,000 | 337,186 |
| 5% 6/1/31 | | 425,000 | 483,119 |
| 5% 6/1/33 | | 970,000 | 1,091,590 |
| 5% 6/1/35 | | 600,000 | 672,564 |
| 5% 6/1/42 | | 1,000,000 | 1,103,090 |
| Series 2019 A, 5% 10/1/49 | | 2,000,000 | 2,364,400 |
| Series 2020 A: | | | |
| 4% 7/1/22 | | 100,000 | 105,878 |
| 5% 7/1/23 | | 310,000 | 344,069 |
| 5% 7/1/24 | | 355,000 | 407,086 |
| 5% 7/1/34 | | 1,000,000 | 1,258,120 |
| 5% 7/1/35 | | 1,000,000 | 1,252,580 |
| Series 2020 B: | | | |
| 5% 4/15/34 | | 1,000,000 | 1,273,870 |
| 5% 4/15/35 | | 1,000,000 | 1,268,820 |
| Maryland Stadium Auth. Rev.: | | | |
| (Pub. Schools Construction and Revitalization Prog.): | | | |
| Series 2016: | | | |
| 5% 5/1/30 | | 1,715,000 | 2,068,067 |
| 5% 5/1/36 | | 2,000,000 | 2,368,560 |
| 5% 5/1/41 (Pre-Refunded to 5/1/26 @ 100) | | 1,000,000 | 1,260,550 |
| Series 2018 A, 5% 5/1/36 | | 1,580,000 | 1,935,974 |
| Series 2016, 5% 5/1/46 (Pre-Refunded to 5/1/26 @ 100) | | 1,000,000 | 1,260,550 |
| Maryland Trans. Auth. Passenger Facility Charge Rev. Series 2012 A, 5% 6/1/21 (a) | | 2,255,000 | 2,322,290 |
| Maryland Trans. Auth. Trans. Facility Projs. Rev.: | | | |
| Series 2017, 5% 7/1/30 | | 3,000,000 | 3,803,760 |
| Series 2020, 5% 7/1/33 | | 1,000,000 | 1,349,100 |
| Montgomery County Gen. Oblig.: | | | |
| (Trinity Health Cr. Group Proj.) Series 2016, 5% 12/1/45 | | 2,500,000 | 2,931,200 |
| Series A, 4% 11/1/33 | | 3,000,000 | 3,709,770 |
| Prince Georges County Ctfs. of Prtn. Series 2018, 5% 10/1/48 | | 2,000,000 | 2,487,460 |
| Rockville Mayor & Council Econ. Dev. (Rfdg.-Ingleside King Farm Proj.) Series 2017, 3.5% 11/1/26 | | 1,825,000 | 1,786,255 |
|
| TOTAL MARYLAND | | | 214,385,463 |
|
| TOTAL MUNICIPAL BONDS | | | |
| (Cost $206,611,457) | | | 217,179,197 |
| TOTAL INVESTMENT IN SECURITIES - 97.5% | | | |
| (Cost $206,611,457) | | | 217,179,197 |
| NET OTHER ASSETS (LIABILITIES) - 2.5% | | | 5,653,806 |
| NET ASSETS - 100% | | | $222,833,003 |
Legend
(a) Private activity obligations whose interest is subject to the federal alternative minimum tax for individuals.
Investment Valuation
The following is a summary of the inputs used, as of August 31, 2020, involving the Fund's assets and liabilities carried at fair value. The inputs or methodology used for valuing securities may not be an indication of the risk associated with investing in those securities. For more information on valuation inputs, and their aggregation into the levels used below, please refer to the Investment Valuation section in the accompanying Notes to Financial Statements.
| | Valuation Inputs at Reporting Date: |
| Description | Total | Level 1 | Level 2 | Level 3 |
| Investments in Securities: | | | | |
| Municipal Securities | $217,179,197 | $-- | $217,179,197 | $-- |
| Total Investments in Securities: | $217,179,197 | $-- | $217,179,197 | $-- |
Other Information
The distribution of municipal securities by revenue source, as a percentage of total Net Assets, is as follows (Unaudited):
| Health Care | 34.3% |
| General Obligations | 21.7% |
| Water & Sewer | 10.2% |
| Escrowed/Pre-Refunded | 9.7% |
| Education | 7.3% |
| Transportation | 6.7% |
| Special Tax | 5.7% |
| Others* (Individually Less Than 5%) | 4.4% |
| | 100.0% |
* Includes net other assets
See accompanying notes which are an integral part of the financial statements.
Financial Statements
Statement of Assets and Liabilities
| | | August 31, 2020 |
| Assets | | |
Investment in securities, at value — See accompanying schedule:
Unaffiliated issuers (cost $206,611,457) | | $217,179,197 |
| Cash | | 4,345,076 |
| Receivable for fund shares sold | | 45,118 |
| Interest receivable | | 2,251,489 |
| Other receivables | | 545 |
| Total assets | | 223,821,425 |
| Liabilities | | |
| Payable for fund shares redeemed | $757,067 | |
| Distributions payable | 128,528 | |
| Accrued management fee | 102,827 | |
| Total liabilities | | 988,422 |
| Net Assets | | $222,833,003 |
| Net Assets consist of: | | |
| Paid in capital | | $211,595,748 |
| Total accumulated earnings (loss) | | 11,237,255 |
| Net Assets | | $222,833,003 |
| Net Asset Value, offering price and redemption price per share ($222,833,003 ÷ 19,054,963 shares) | | $11.69 |
See accompanying notes which are an integral part of the financial statements.
Statement of Operations
| | | Year ended August 31, 2020 |
| Investment Income | | |
| Interest | | $6,159,957 |
| Expenses | | |
| Management fee | $1,226,536 | |
| Independent trustees' fees and expenses | 733 | |
| Commitment fees | 542 | |
| Total expenses before reductions | 1,227,811 | |
| Expense reductions | (1,375) | |
| Total expenses after reductions | | 1,226,436 |
| Net investment income (loss) | | 4,933,521 |
| Realized and Unrealized Gain (Loss) | | |
| Net realized gain (loss) on: | | |
| Investment securities: | | |
| Unaffiliated issuers | | 871,115 |
| Total net realized gain (loss) | | 871,115 |
| Change in net unrealized appreciation (depreciation) on investment securities | | (2,932,954) |
| Net gain (loss) | | (2,061,839) |
| Net increase (decrease) in net assets resulting from operations | | $2,871,682 |
See accompanying notes which are an integral part of the financial statements.
Statement of Changes in Net Assets
| | Year ended August 31, 2020 | Year ended August 31, 2019 |
| Increase (Decrease) in Net Assets | | |
| Operations | | |
| Net investment income (loss) | $4,933,521 | $4,873,884 |
| Net realized gain (loss) | 871,115 | (6,299) |
| Change in net unrealized appreciation (depreciation) | (2,932,954) | 12,459,657 |
| Net increase (decrease) in net assets resulting from operations | 2,871,682 | 17,327,242 |
| Distributions to shareholders | (4,933,521) | (4,873,866) |
| Share transactions | | |
| Proceeds from sales of shares | 35,185,192 | 38,198,077 |
| Reinvestment of distributions | 3,386,027 | 3,373,951 |
| Cost of shares redeemed | (37,952,115) | (46,671,780) |
| Net increase (decrease) in net assets resulting from share transactions | 619,104 | (5,099,752) |
| Total increase (decrease) in net assets | (1,442,735) | 7,353,624 |
| Net Assets | | |
| Beginning of period | 224,275,738 | 216,922,114 |
| End of period | $222,833,003 | $224,275,738 |
| Other Information | | |
| Shares | | |
| Sold | 3,029,647 | 3,399,672 |
| Issued in reinvestment of distributions | 290,820 | 298,228 |
| Redeemed | (3,298,863) | (4,184,986) |
| Net increase (decrease) | 21,604 | (487,086) |
See accompanying notes which are an integral part of the financial statements.
Financial Highlights
Fidelity Maryland Municipal Income Fund
| | | | | | |
| Years ended August 31, | 2020 | 2019 | 2018 | 2017 | 2016 |
| Selected Per–Share Data | | | | | |
| Net asset value, beginning of period | $11.78 | $11.11 | $11.47 | $11.73 | $11.40 |
| Income from Investment Operations | | | | | |
| Net investment income (loss)A | .257 | .259 | .258 | .271 | .288 |
| Net realized and unrealized gain (loss) | (.090) | .670 | (.278) | (.239) | .490 |
| Total from investment operations | .167 | .929 | (.020) | .032 | .778 |
| Distributions from net investment income | (.257) | (.259) | (.258) | (.272) | (.289) |
| Distributions from net realized gain | – | – | (.082) | (.020) | (.159) |
| Total distributions | (.257) | (.259) | (.340) | (.292) | (.448) |
| Redemption fees added to paid in capitalA | – | – | – | –B | –B |
| Net asset value, end of period | $11.69 | $11.78 | $11.11 | $11.47 | $11.73 |
| Total ReturnC | 1.45% | 8.48% | (.16)% | .33% | 6.98% |
| Ratios to Average Net AssetsD | | | | | |
| Expenses before reductions | .55% | .55% | .55% | .55% | .55% |
| Expenses net of fee waivers, if any | .55% | .55% | .55% | .55% | .55% |
| Expenses net of all reductions | .55% | .55% | .55% | .55% | .55% |
| Net investment income (loss) | 2.21% | 2.29% | 2.30% | 2.40% | 2.50% |
| Supplemental Data | | | | | |
| Net assets, end of period (000 omitted) | $222,833 | $224,276 | $216,922 | $235,012 | $245,929 |
| Portfolio turnover rate | 19% | 10% | 25% | 24% | 9% |
A Calculated based on average shares outstanding during the period.
B Amount represents less than $.0005 per share.
C Total returns would have been lower if certain expenses had not been reduced during the applicable periods shown.
D Expense ratios reflect operating expenses of the class. Expenses before reductions do not reflect amounts reimbursed, waived, or reduced through arrangements with the investment advisor, brokerage services, or other offset arrangements, if applicable, and do not represent the amount paid by the class during periods when reimbursements, waivers or reductions occur.
See accompanying notes which are an integral part of the financial statements.
Notes to Financial Statements
For the period ended August 31, 2020
1. Organization.
Fidelity Maryland Municipal Income Fund (the Fund) is a non-diversified fund of Fidelity Union Street Trust (the Trust) and is authorized to issue an unlimited number of shares. Share transactions on the Statement of Changes in Net Assets may contain exchanges between affiliated funds. The Trust is registered under the Investment Company Act of 1940, as amended (the 1940 Act), as an open-end management investment company organized as a Massachusetts business trust. The Fund may be affected by economic and political developments in the state of Maryland.
Effective January 1, 2020:
Investment advisers Fidelity Investments Money Management, Inc., FMR Co., Inc., and Fidelity SelectCo, LLC, merged with and into Fidelity Management & Research Company. In connection with the merger transactions, the resulting, merged investment adviser was then redomiciled from Massachusetts to Delaware, changed its corporate structure from a corporation to a limited liability company, and changed its name to "Fidelity Management & Research Company LLC".
2. Significant Accounting Policies.
The Fund is an investment company and applies the accounting and reporting guidance of the Financial Accounting Standards Board (FASB) Accounting Standards Codification Topic 946 Financial Services – Investment Companies. The financial statements have been prepared in conformity with accounting principles generally accepted in the United States of America (GAAP), which require management to make certain estimates and assumptions at the date of the financial statements. Actual results could differ from those estimates. Subsequent events, if any, through the date that the financial statements were issued have been evaluated in the preparation of the financial statements. The following summarizes the significant accounting policies of the Fund:
Investment Valuation. Investments are valued as of 4:00 p.m. Eastern time on the last calendar day of the period. The Board of Trustees (the Board) has delegated the day to day responsibility for the valuation of the Fund's investments to the Fair Value Committee (the Committee) established by the Fund's investment adviser. In accordance with valuation policies and procedures approved by the Board, the Fund attempts to obtain prices from one or more third party pricing vendors or brokers to value its investments. When current market prices, quotations or currency exchange rates are not readily available or reliable, investments will be fair valued in good faith by the Committee, in accordance with procedures adopted by the Board. Factors used in determining fair value vary by investment type and may include market or investment specific events, changes in interest rates and credit quality. The frequency with which these procedures are used cannot be predicted and they may be utilized to a significant extent. The Committee oversees the Fund's valuation policies and procedures and reports to the Board on the Committee's activities and fair value determinations. The Board monitors the appropriateness of the procedures used in valuing the Fund's investments and ratifies the fair value determinations of the Committee.
The Fund categorizes the inputs to valuation techniques used to value its investments into a disclosure hierarchy consisting of three levels as shown below:
- Level 1 – quoted prices in active markets for identical investments
- Level 2 – other significant observable inputs (including quoted prices for similar investments, interest rates, prepayment speeds, etc.)
- Level 3 – unobservable inputs (including the Fund's own assumptions based on the best information available)
Valuation techniques used to value the Fund's investments by major category are as follows:
Debt securities, including restricted securities, are valued based on evaluated prices received from third party pricing vendors or from brokers who make markets in such securities. Municipal securities are valued by pricing vendors who utilize matrix pricing which considers yield or price of bonds of comparable quality, coupon, maturity and type or by broker-supplied prices. When independent prices are unavailable or unreliable, debt securities may be valued utilizing pricing methodologies which consider similar factors that would be used by third party pricing vendors. Debt securities are generally categorized as Level 2 in the hierarchy but may be Level 3 depending on the circumstances.
Changes in valuation techniques may result in transfers in or out of an assigned level within the disclosure hierarchy. The aggregate value of investments by input level as of August 31, 2020 is included at the end of the Fund's Schedule of Investments.
Investment Transactions and Income. For financial reporting purposes, the Fund's investment holdings and NAV include trades executed through the end of the last business day of the period. The NAV per share for processing shareholder transactions is calculated as of the close of business of the New York Stock Exchange (NYSE), normally 4:00 p.m. Eastern time and includes trades executed through the end of the prior business day. Gains and losses on securities sold are determined on the basis of identified cost and include proceeds received from litigation. Interest income is accrued as earned and includes coupon interest and amortization of premium and accretion of discount on debt securities as applicable. Debt obligations may be placed on non-accrual status and related interest income may be reduced by ceasing current accruals and writing off interest receivables when the collection of all or a portion of interest has become doubtful based on consistently applied procedures. A debt obligation is removed from non-accrual status when the issuer resumes interest payments or when collectability of interest is reasonably assured.
Expenses. Expenses directly attributable to a fund are charged to that fund. Expenses attributable to more than one fund are allocated among the respective funds on the basis of relative net assets or other appropriate methods. Expense estimates are accrued in the period to which they relate and adjustments are made when actual amounts are known.
Income Tax Information and Distributions to Shareholders. Each year, the Fund intends to qualify as a regulated investment company under Subchapter M of the Internal Revenue Code, including distributing substantially all of its taxable income and realized gains. As a result, no provision for U.S. Federal income taxes is required. As of August 31, 2020, the Fund did not have any unrecognized tax benefits in the financial statements; nor is the Fund aware of any tax positions for which it is reasonably possible that the total amounts of unrecognized tax benefits will significantly change in the next twelve months. The Fund files a U.S. federal tax return, in addition to state and local tax returns as required. The Fund's federal income tax returns are subject to examination by the Internal Revenue Service (IRS) for a period of three fiscal years after they are filed. State and local tax returns may be subject to examination for an additional fiscal year depending on the jurisdiction.
Distributions are declared and recorded daily and paid monthly from net investment income. Distributions from realized gains, if any, are declared and recorded on the ex-dividend date. Income and capital gain distributions are determined in accordance with income tax regulations, which may differ from GAAP. In addition, the Fund claimed a portion of the payment made to redeeming shareholders as a distribution for income tax purposes.
Capital accounts within the financial statements are adjusted for permanent book-tax differences. These adjustments have no impact on net assets or the results of operations. Capital accounts are not adjusted for temporary book-tax differences which will reverse in a subsequent period.
Book-tax differences are primarily due to capital loss carryforwards.
The Fund purchases municipal securities whose interest, in the opinion of the issuer, is free from federal income tax. There is no assurance that the IRS will agree with this opinion. In the event the IRS determines that the issuer does not comply with relevant tax requirements, interest payments from a security could become federally taxable, possibly retroactively to the date the security was issued.
As of period end, the cost and unrealized appreciation (depreciation) in securities, and derivatives if applicable, for federal income tax purposes were as follows:
| Gross unrealized appreciation | $11,756,659 |
| Gross unrealized depreciation | (1,188,919) |
| Net unrealized appreciation (depreciation) | $10,567,740 |
| Tax Cost | $206,611,457 |
The tax-based components of distributable earnings as of period end were as follows:
| Undistributed tax-exempt income | $18,151 |
| Undistributed long-term capital gain | $651,363 |
| Net unrealized appreciation (depreciation) on securities and other investments | $10,567,740 |
The tax character of distributions paid was as follows:
| | August 31, 2020 | August 31, 2019 |
| Tax-exempt Income | $4,933,521 | $4,873,866 |
3. Purchases and Sales of Investments.
Purchases and sales of securities, other than short-term securities are noted in the table below.
| | Purchases ($) | Sales ($) |
| Fidelity Maryland Municipal Income Fund | 43,034,270 | 40,572,606 |
4. Fees and Other Transactions with Affiliates.
Management Fee. Fidelity Management & Research Company LLC (the investment adviser) and its affiliates provide the Fund with investment management related services for which the Fund pays a monthly management fee that is based on an annual rate of .55% of the Fund's average net assets. Under the management contract, the investment adviser pays all other expenses, except the compensation of the independent Trustees and certain other expenses such as interest expense, including commitment fees. The management fee is reduced by an amount equal to the fees and expenses paid by the Fund to the independent Trustees.
Interfund Trades. Funds may purchase from or sell securities to other Fidelity Funds under procedures adopted by the Board. The procedures have been designed to ensure these interfund trades are executed in accordance with Rule 17a-7 of the 1940 Act. Interfund trades are included within the respective purchases and sales amounts shown in the Purchases and Sales of Investments note.
5. Committed Line of Credit.
Certain Funds participate with other funds managed by the investment adviser or an affiliate in a $4.25 billion credit facility (the "line of credit") to be utilized for temporary or emergency purposes to fund shareholder redemptions or for other short-term liquidity purposes. The participating funds have agreed to pay commitment fees on their pro-rata portion of the line of credit, which are reflected in Commitment fees on the Statement of Operations, and are as follows:
| | Amount |
| Fidelity Maryland Municipal Income Fund | $542 |
During the period, there were no borrowings on this line of credit.
6. Expense Reductions.
Through arrangements with the Fund's custodian, credits realized as a result of certain uninvested cash balances were used to reduce the Fund's expenses by $1,375.
7. Other.
The Fund's organizational documents provide former and current trustees and officers with a limited indemnification against liabilities arising in connection with the performance of their duties to the Fund. In the normal course of business, the Fund may also enter into contracts that provide general indemnifications. The Fund's maximum exposure under these arrangements is unknown as this would be dependent on future claims that may be made against the Fund. The risk of material loss from such claims is considered remote.
8. Coronavirus (COVID-19) Pandemic.
An outbreak of COVID-19 first detected in China during December 2019 has since spread globally and was declared a pandemic by the World Health Organization during March 2020. Developments that disrupt global economies and financial markets, such as the COVID-19 pandemic, may magnify factors that affect the Fund's performance.
Report of Independent Registered Public Accounting Firm
To the Board of Trustees of Fidelity Union Street Trust and Shareholders of Fidelity Maryland Municipal Income Fund
Opinion on the Financial Statements
We have audited the accompanying statement of assets and liabilities, including the schedule of investments, of Fidelity Maryland Municipal Income Fund (one of the funds constituting Fidelity Union Street Trust, referred to hereafter as the “Fund”) as of August 31, 2020, the related statement of operations for the year ended August 31, 2020, the statement of changes in net assets for each of the two years in the period ended August 31, 2020, including the related notes, and the financial highlights for each of the five years in the period ended August 31, 2020 (collectively referred to as the “financial statements”). In our opinion, the financial statements present fairly, in all material respects, the financial position of the Fund as of August 31, 2020, the results of its operations for the year then ended, the changes in its net assets for each of the two years in the period ended August 31, 2020 and the financial highlights for each of the five years in the period ended August 31, 2020 in conformity with accounting principles generally accepted in the United States of America.
Basis for Opinion
These financial statements are the responsibility of the Fund’s management. Our responsibility is to express an opinion on the Fund’s financial statements based on our audits. We are a public accounting firm registered with the Public Company Accounting Oversight Board (United States) (PCAOB) and are required to be independent with respect to the Fund in accordance with the U.S. federal securities laws and the applicable rules and regulations of the Securities and Exchange Commission and the PCAOB.
We conducted our audits of these financial statements in accordance with the standards of the PCAOB. Those standards require that we plan and perform the audit to obtain reasonable assurance about whether the financial statements are free of material misstatement, whether due to error or fraud.
Our audits included performing procedures to assess the risks of material misstatement of the financial statements, whether due to error or fraud, and performing procedures that respond to those risks. Such procedures included examining, on a test basis, evidence regarding the amounts and disclosures in the financial statements. Our audits also included evaluating the accounting principles used and significant estimates made by management, as well as evaluating the overall presentation of the financial statements. Our procedures included confirmation of securities owned as of August 31, 2020 by correspondence with the custodian. We believe that our audits provide a reasonable basis for our opinion.
/s/ PricewaterhouseCoopers LLP
Boston, Massachusetts
October 9, 2020
We have served as the auditor of one or more investment companies in the Fidelity group of funds since 1932.
Trustees and Officers
The Trustees, Members of the Advisory Board (if any), and officers of the trust, as applicable, are listed below. The Board of Trustees governs the fund and is responsible for protecting the interests of shareholders. The Trustees are experienced executives who meet periodically throughout the year to oversee the fund's activities, review contractual arrangements with companies that provide services to the fund, oversee management of the risks associated with such activities and contractual arrangements, and review the fund's performance. Each of the Trustees oversees 278 funds.
The Trustees hold office without limit in time except that (a) any Trustee may resign; (b) any Trustee may be removed by written instrument, signed by at least two-thirds of the number of Trustees prior to such removal; (c) any Trustee who requests to be retired or who has become incapacitated by illness or injury may be retired by written instrument signed by a majority of the other Trustees; and (d) any Trustee may be removed at any special meeting of shareholders by a two-thirds vote of the outstanding voting securities of the trust. Each Trustee who is not an interested person (as defined in the 1940 Act) of the trust and the fund is referred to herein as an Independent Trustee. Each Independent Trustee shall retire not later than the last day of the calendar year in which his or her 75th birthday occurs. The Independent Trustees may waive this mandatory retirement age policy with respect to individual Trustees. Officers and Advisory Board Members hold office without limit in time, except that any officer or Advisory Board Member may resign or may be removed by a vote of a majority of the Trustees at any regular meeting or any special meeting of the Trustees. Except as indicated, each individual has held the office shown or other offices in the same company for the past five years.
The fund’s Statement of Additional Information (SAI) includes more information about the Trustees. To request a free copy, call Fidelity at 1-800-544-8544.
Experience, Skills, Attributes, and Qualifications of the Trustees. The Governance and Nominating Committee has adopted a statement of policy that describes the experience, qualifications, attributes, and skills that are necessary and desirable for potential Independent Trustee candidates (Statement of Policy). The Board believes that each Trustee satisfied at the time he or she was initially elected or appointed a Trustee, and continues to satisfy, the standards contemplated by the Statement of Policy. The Governance and Nominating Committee also engages professional search firms to help identify potential Independent Trustee candidates who have the experience, qualifications, attributes, and skills consistent with the Statement of Policy. From time to time, additional criteria based on the composition and skills of the current Independent Trustees, as well as experience or skills that may be appropriate in light of future changes to board composition, business conditions, and regulatory or other developments, have also been considered by the professional search firms and the Governance and Nominating Committee. In addition, the Board takes into account the Trustees' commitment and participation in Board and committee meetings, as well as their leadership of standing and ad hoc committees throughout their tenure.
In determining that a particular Trustee was and continues to be qualified to serve as a Trustee, the Board has considered a variety of criteria, none of which, in isolation, was controlling. The Board believes that, collectively, the Trustees have balanced and diverse experience, qualifications, attributes, and skills, which allow the Board to operate effectively in governing the fund and protecting the interests of shareholders. Information about the specific experience, skills, attributes, and qualifications of each Trustee, which in each case led to the Board's conclusion that the Trustee should serve (or continue to serve) as a trustee of the fund, is provided below.
Board Structure and Oversight Function. Abigail P. Johnson is an interested person and currently serves as Chairman. The Trustees have determined that an interested Chairman is appropriate and benefits shareholders because an interested Chairman has a personal and professional stake in the quality and continuity of services provided to the fund. Independent Trustees exercise their informed business judgment to appoint an individual of their choosing to serve as Chairman, regardless of whether the Trustee happens to be independent or a member of management. The Independent Trustees have determined that they can act independently and effectively without having an Independent Trustee serve as Chairman and that a key structural component for assuring that they are in a position to do so is for the Independent Trustees to constitute a substantial majority for the Board. The Independent Trustees also regularly meet in executive session. Arthur E. Johnson serves as Chairman of the Independent Trustees and as such (i) acts as a liaison between the Independent Trustees and management with respect to matters important to the Independent Trustees and (ii) with management prepares agendas for Board meetings.
Fidelity® funds are overseen by different Boards of Trustees. The fund's Board oversees Fidelity's investment-grade bond, money market, asset allocation and certain equity funds, and other Boards oversee Fidelity's high income and other equity funds. The asset allocation funds may invest in Fidelity® funds that are overseen by such other Boards. The use of separate Boards, each with its own committee structure, allows the Trustees of each group of Fidelity® funds to focus on the unique issues of the funds they oversee, including common research, investment, and operational issues. On occasion, the separate Boards establish joint committees to address issues of overlapping consequences for the Fidelity® funds overseen by each Board.
The Trustees operate using a system of committees to facilitate the timely and efficient consideration of all matters of importance to the Trustees, the fund, and fund shareholders and to facilitate compliance with legal and regulatory requirements and oversight of the fund's activities and associated risks. The Board, acting through its committees, has charged FMR and its affiliates with (i) identifying events or circumstances the occurrence of which could have demonstrably adverse effects on the fund's business and/or reputation; (ii) implementing processes and controls to lessen the possibility that such events or circumstances occur or to mitigate the effects of such events or circumstances if they do occur; and (iii) creating and maintaining a system designed to evaluate continuously business and market conditions in order to facilitate the identification and implementation processes described in (i) and (ii) above. Because the day-to-day operations and activities of the fund are carried out by or through FMR, its affiliates, and other service providers, the fund's exposure to risks is mitigated but not eliminated by the processes overseen by the Trustees. While each of the Board's committees has responsibility for overseeing different aspects of the fund's activities, oversight is exercised primarily through the Operations and Audit Committees. In addition, an ad hoc Board committee of Independent Trustees has worked with FMR to enhance the Board's oversight of investment and financial risks, legal and regulatory risks, technology risks, and operational risks, including the development of additional risk reporting to the Board. Appropriate personnel, including but not limited to the fund's Chief Compliance Officer (CCO), FMR's internal auditor, the independent accountants, the fund's Treasurer and portfolio management personnel, make periodic reports to the Board's committees, as appropriate, including an annual review of Fidelity's risk management program for the Fidelity® funds. The responsibilities of each standing committee, including their oversight responsibilities, are described further under "Standing Committees of the Trustees."
Interested Trustees*:
Correspondence intended for a Trustee who is an interested person may be sent to Fidelity Investments, 245 Summer Street, Boston, Massachusetts 02210.
Name, Year of Birth; Principal Occupations and Other Relevant Experience+
Abigail P. Johnson (1961)
Year of Election or Appointment: 2009
Trustee
Chairman of the Board of Trustees
Ms. Johnson also serves as Trustee of other Fidelity® funds. Ms. Johnson serves as Chairman (2016-present), Chief Executive Officer (2014-present), and Director (2007-present) of FMR LLC (diversified financial services company), President of Fidelity Financial Services (2012-present) and President of Personal, Workplace and Institutional Services (2005-present). Ms. Johnson is Chairman and Director of Fidelity Management & Research Company LLC (investment adviser firm, 2011-present). Previously, Ms. Johnson served as Chairman and Director of FMR Co., Inc. (investment adviser firm, 2011-2019), Vice Chairman (2007-2016) and President (2013-2016) of FMR LLC, President and a Director of Fidelity Management & Research Company (2001-2005), a Trustee of other investment companies advised by Fidelity Management & Research Company, Fidelity Investments Money Management, Inc. (investment adviser firm), and FMR Co., Inc. (2001-2005), Senior Vice President of the Fidelity® funds (2001-2005), and managed a number of Fidelity® funds. Ms. Abigail P. Johnson and Mr. Arthur E. Johnson are not related.
Jennifer Toolin McAuliffe (1959)
Year of Election or Appointment: 2016
Trustee
Ms. McAuliffe also serves as Trustee of other Fidelity® funds. Previously, Ms. McAuliffe served as Co-Head of Fixed Income of Fidelity Investments Limited (now known as FIL Limited (FIL)) (diversified financial services company), Director of Research for FIL’s credit and quantitative teams in London, Hong Kong and Tokyo and Director of Research for taxable and municipal bonds at Fidelity Investments Money Management, Inc. Ms. McAuliffe previously served as a member of the Advisory Board of certain Fidelity® funds (2016). Ms. McAuliffe was previously a lawyer at Ropes & Gray LLP and currently serves as director or trustee of several not-for-profit entities.
* Determined to be an “Interested Trustee” by virtue of, among other things, his or her affiliation with the trust or various entities under common control with FMR.
+ The information includes the Trustee's principal occupation during the last five years and other information relating to the experience, attributes, and skills relevant to the Trustee's qualifications to serve as a Trustee, which led to the conclusion that the Trustee should serve as a Trustee for the fund.
Independent Trustees:
Correspondence intended for an Independent Trustee may be sent to Fidelity Investments, P.O. Box 55235, Boston, Massachusetts 02205-5235.
Name, Year of Birth; Principal Occupations and Other Relevant Experience+
Elizabeth S. Acton (1951)
Year of Election or Appointment: 2013
Trustee
Ms. Acton also serves as Trustee of other Fidelity® funds. Prior to her retirement, Ms. Acton served as Executive Vice President, Finance (2011-2012), Executive Vice President, Chief Financial Officer (2002-2011) and Treasurer (2004-2005) of Comerica Incorporated (financial services). Prior to joining Comerica, Ms. Acton held a variety of positions at Ford Motor Company (1983-2002), including Vice President and Treasurer (2000-2002) and Executive Vice President and Chief Financial Officer of Ford Motor Credit Company (1998-2000). Ms. Acton currently serves as a member of the Board and Audit and Finance Committees of Beazer Homes USA, Inc. (homebuilding, 2012-present). Ms. Acton previously served as a member of the Advisory Board of certain Fidelity® funds (2013-2016).
Ann E. Dunwoody (1953)
Year of Election or Appointment: 2018
Trustee
General Dunwoody also serves as Trustee of other Fidelity® funds. General Dunwoody (United States Army, Retired) was the first woman in U.S. military history to achieve the rank of four-star general and prior to her retirement in 2012 held a variety of positions within the U.S. Army, including Commanding General, U.S. Army Material Command (2008-2012). General Dunwoody currently serves as President of First to Four LLC (leadership and mentoring services, 2012-present), a member of the Board and Nomination and Corporate Governance Committees of Kforce Inc. (professional staffing services, 2016-present) and a member of the Board of Automattic Inc. (software engineering, 2018-present). Previously, General Dunwoody served as a member of the Advisory Board and Nominating and Corporate Governance Committee of L3 Technologies, Inc. (communication, electronic, sensor and aerospace systems, 2013-2019) and a member of the Board and Audit and Sustainability and Corporate Responsibility Committees of Republic Services, Inc. (waste collection, disposal and recycling, 2013-2016). Ms. Dunwoody also serves on several boards for non-profit organizations, including as a member of the Board, Chair of the Nomination and Governance Committee and a member of the Audit Committee of Logistics Management Institute (consulting non-profit, 2012-present), a member of the Council of Trustees for the Association of the United States Army (advocacy non-profit, 2013-present), a member of the Board of Florida Institute of Technology (2015-present) and a member of the Board of ThanksUSA (military family education non-profit, 2014-present). General Dunwoody previously served as a member of the Advisory Board of certain Fidelity® funds (2018).
John Engler (1948)
Year of Election or Appointment: 2014
Trustee
Mr. Engler also serves as Trustee of other Fidelity® funds. Previously, Mr. Engler served as Governor of Michigan (1991-2003), President of the Business Roundtable (2011-2017) and interim President of Michigan State University (2018-2019). Mr. Engler currently serves as a member of the Board of K12 Inc. (technology-based education company, 2012-present). Previously, Mr. Engler served as a member of the Board of Universal Forest Products (manufacturer and distributor of wood and wood-alternative products, 2003-2019) and Trustee of The Munder Funds (2003-2014). Mr. Engler previously served as a member of the Advisory Board of certain Fidelity® funds (2014-2016).
Robert F. Gartland (1951)
Year of Election or Appointment: 2010
Trustee
Mr. Gartland also serves as Trustee of other Fidelity® funds. Prior to his retirement, Mr. Gartland held a variety of positions at Morgan Stanley (financial services, 1979-2007), including Managing Director (1987-2007) and Chase Manhattan Bank (1975-1978). Mr. Gartland previously served as Chairman and an investor in Gartland & Mellina Group Corp. (consulting, 2009-2019), as a member of the Board of National Securities Clearing Corporation (1993-1996) and as Chairman of TradeWeb (2003-2004).
Arthur E. Johnson (1947)
Year of Election or Appointment: 2008
Trustee
Chairman of the Independent Trustees
Mr. Johnson also serves as Trustee of other Fidelity® funds. Prior to his retirement, Mr. Johnson served as Senior Vice President of Corporate Strategic Development of Lockheed Martin Corporation (defense contractor, 1999-2009). Mr. Johnson currently serves as a member of the Board of Booz Allen Hamilton (management consulting, 2011-present). Mr. Johnson previously served as a member of the Board of Eaton Corporation plc (diversified power management, 2009-2019) and a member of the Board of AGL Resources, Inc. (holding company, 2002-2016). Mr. Johnson previously served as Vice Chairman (2015-2018) of the Independent Trustees of certain Fidelity® funds. Mr. Arthur E. Johnson is not related to Ms. Abigail P. Johnson.
Michael E. Kenneally (1954)
Year of Election or Appointment: 2009
Trustee
Vice Chairman of the Independent Trustees
Mr. Kenneally also serves as Trustee of other Fidelity® funds. Prior to his retirement, Mr. Kenneally served as Chairman and Global Chief Executive Officer of Credit Suisse Asset Management and Executive Vice President and Chief Investment Officer of Bank of America Corporation. Earlier roles at Bank of America included Director of Research, Senior Portfolio Manager for various institutional equity accounts and mutual funds and Portfolio Manager for a number of institutional fixed-income clients. Mr. Kenneally began his career as a Research Analyst in 1983 and was awarded the Chartered Financial Analyst (CFA) designation in 1991.
Marie L. Knowles (1946)
Year of Election or Appointment: 2001
Trustee
Ms. Knowles also serves as Trustee of other Fidelity® funds. Prior to her retirement, Ms. Knowles held several positions at Atlantic Richfield Company (diversified energy), including Executive Vice President and Chief Financial Officer (1996-2000), Senior Vice President (1993-1996) and President of ARCO Transportation Company (pipeline and tanker operations, 1993-1996). Ms. Knowles currently serves as a member of the Board of McKesson Corporation (healthcare service, since 2002), a member of the Board of the Santa Catalina Island Company (real estate, 2009-present), a member of the Investment Company Institute Board of Governors and a member of the Governing Council of the Independent Directors Council (2014-present). Ms. Knowles also serves as a member of the Advisory Board for the School of Engineering of the University of Southern California. Ms. Knowles previously served as Chairman (2015-2018) and Vice Chairman (2012-2015) of the Independent Trustees of certain Fidelity® funds.
Mark A. Murray (1954)
Year of Election or Appointment: 2016
Trustee
Mr. Murray also serves as Trustee of other Fidelity® funds. Previously, Mr. Murray served as Co-Chief Executive Officer (2013-2016), President (2006-2013) and Vice Chairman (2013-2020) of Meijer, Inc. Mr. Murray serves as a member of the Board and Nuclear Review and Public Policy and Responsibility Committees of DTE Energy Company (diversified energy company, 2009-present) and a member of the Board and Audit Committee and Chairman of the Nominating and Corporate Governance Committee of Universal Forest Products, Inc. (manufacturer and distributor of wood and wood-alternative products, 2004-2016). Mr. Murray previously served as a member of the Board of Spectrum Health (not-for-profit health system, 2015-2019). Mr. Murray also serves as a member of the Board of many community and professional organizations. Mr. Murray previously served as a member of the Advisory Board of certain Fidelity® funds (2016).
+ The information includes the Trustee's principal occupation during the last five years and other information relating to the experience, attributes, and skills relevant to the Trustee's qualifications to serve as a Trustee, which led to the conclusion that the Trustee should serve as a Trustee for the fund.
Advisory Board Members and Officers:
Correspondence intended for an officer may be sent to Fidelity Investments, 245 Summer Street, Boston, Massachusetts 02210. Officers appear below in alphabetical order.
Name, Year of Birth; Principal Occupation
Elizabeth Paige Baumann (1968)
Year of Election or Appointment: 2017
Anti-Money Laundering (AML) Officer
Ms. Baumann also serves as AML Officer of other funds. She is Chief AML Officer (2012-present) and Senior Vice President (2014-present) of FMR LLC (diversified financial services company) and is an employee of Fidelity Investments. Previously, Ms. Baumann served as AML Officer of certain funds (2017-2019), as AML Officer of the funds (2012-2016), and Vice President (2007-2014) and Deputy Anti-Money Laundering Officer (2007-2012) of FMR LLC.
Craig S. Brown (1977)
Year of Election or Appointment: 2019
Assistant Treasurer
Mr. Brown also serves as Assistant Treasurer of other funds. Mr. Brown is an employee of Fidelity Investments (2013-present).
John J. Burke III (1964)
Year of Election or Appointment: 2018
Chief Financial Officer
Mr. Burke also serves as Chief Financial Officer of other funds. Mr. Burke serves as Head of Investment Operations for Fidelity Fund and Investment Operations (2018-present) and is an employee of Fidelity Investments (1998-present). Previously Mr. Burke served as head of Asset Management Investment Operations (2012-2018).
David J. Carter (1973)
Year of Election or Appointment: 2020
Assistant Secretary
Mr. Carter also serves as Assistant Secretary of other funds. Mr. Carter serves as Vice President, Associate General Counsel (2010-present) and is an employee of Fidelity Investments (2005-present).
Jonathan Davis (1968)
Year of Election or Appointment: 2010
Assistant Treasurer
Mr. Davis also serves as Assistant Treasurer of other funds. Mr. Davis serves as Assistant Treasurer of FMR Capital, Inc. (2017-present) and is an employee of Fidelity Investments. Previously, Mr. Davis served as Vice President and Associate General Counsel of FMR LLC (diversified financial services company, 2003-2010).
Laura M. Del Prato (1964)
Year of Election or Appointment: 2018
President and Treasurer
Ms. Del Prato also serves as an officer of other funds. Ms. Del Prato is an employee of Fidelity Investments (2017-present). Previously, Ms. Del Prato served as President and Treasurer of The North Carolina Capital Management Trust: Cash Portfolio and Term Portfolio (2018-2020). Prior to joining Fidelity Investments, Ms. Del Prato served as a Managing Director and Treasurer of the JPMorgan Mutual Funds (2014-2017). Prior to JPMorgan, Ms. Del Prato served as a partner at Cohen Fund Audit Services (accounting firm, 2012-2013) and KPMG LLP (accounting firm, 2004-2012).
Colm A. Hogan (1973)
Year of Election or Appointment: 2016
Assistant Treasurer
Mr. Hogan also serves as an officer of other funds. Mr. Hogan serves as Assistant Treasurer of FMR Capital, Inc. (2017-present) and is an employee of Fidelity Investments (2005-present). Previously, Mr. Hogan served as Deputy Treasurer of certain Fidelity® funds (2016-2020) and Assistant Treasurer of certain Fidelity® funds (2016-2018).
Cynthia Lo Bessette (1969)
Year of Election or Appointment: 2019
Secretary and Chief Legal Officer (CLO)
Ms. Lo Bessette also serves as an officer of other funds. Ms. Lo Bessette serves as CLO, Secretary, and Senior Vice President of Fidelity Management & Research Company LLC (investment adviser firm, 2019-present); and CLO of Fidelity Management & Research (Hong Kong) Limited, FMR Investment Management (UK) Limited, and Fidelity Management & Research (Japan) Limited (investment adviser firms, 2019-present). She is a Senior Vice President and Deputy General Counsel of FMR LLC (diversified financial services company, 2019-present), and is an employee of Fidelity Investments. Previously, Ms. Lo Bessette served as CLO, Secretary, and Senior Vice President of FMR Co., Inc. (investment adviser firm, 2019); Secretary of Fidelity SelectCo, LLC and Fidelity Investments Money Management, Inc. (investment adviser firms, 2019). Prior to joining Fidelity Investments, Ms. Lo Bessette was Executive Vice President, General Counsel (2016-2019) and Senior Vice President, Deputy General Counsel (2015-2016) of OppenheimerFunds (investment management company) and Deputy Chief Legal Officer (2013-2015) of Jennison Associates LLC (investment adviser firm).
Chris Maher (1972)
Year of Election or Appointment: 2013
Assistant Treasurer
Mr. Maher also serves as an officer of other funds. Mr. Maher serves as Assistant Treasurer of FMR Capital, Inc. (2017-present), and is an employee of Fidelity Investments (2008-present). Previously, Mr. Maher served as Assistant Treasurer of certain funds (2013-2020); Vice President of Asset Management Compliance (2013), Vice President of the Program Management Group of FMR (investment adviser firm, 2010-2013), and Vice President of Valuation Oversight (2008-2010).
Jamie Pagliocco (1964)
Year of Election or Appointment: 2020
Vice President
Mr. Pagliocco also serves as Vice President of other funds. Mr. Pagliocco serves as President of Fixed Income (2020-present), and is an employee of Fidelity Investments (2001-present). Previously, Mr. Pagliocco served as Co-Chief Investment Officer – Bond (2017-2020), Global Head of Bond Trading (2016-2019), and as a portfolio manager.
Kenneth B. Robins (1969)
Year of Election or Appointment: 2020
Chief Compliance Officer
Mr. Robins also serves as an officer of other funds. Mr. Robins serves as Compliance Officer of Fidelity Management & Research Company LLC (investment adviser firm, 2016-present) and is an employee of Fidelity Investments (2004-present). Previously, Mr. Robins served as Compliance Officer of FMR Co., Inc. (investment adviser firm, 2016-2019), as Executive Vice President of Fidelity Investments Money Management, Inc. (investment adviser firm, 2013-2016) and served in other fund officer roles.
Stacie M. Smith (1974)
Year of Election or Appointment: 2013
Assistant Treasurer
Ms. Smith also serves as an officer of other funds. Ms. Smith serves as Assistant Treasurer of FMR Capital, Inc. (2017-present), is an employee of Fidelity Investments (2009-present), and has served in other fund officer roles. Prior to joining Fidelity Investments, Ms. Smith served as Senior Audit Manager of Ernst & Young LLP (accounting firm, 1996-2009). Previously, Ms. Smith served as Assistant Treasurer (2013-2019) and Deputy Treasurer (2013-2016) of certain Fidelity® funds.
Marc L. Spector (1972)
Year of Election or Appointment: 2016
Deputy Treasurer
Mr. Spector also serves as an officer of other funds. Mr. Spector serves as Assistant Treasurer of FMR Capital, Inc. (2017-present) and is an employee of Fidelity Investments (2016-present). Prior to joining Fidelity Investments, Mr. Spector served as Director at the Siegfried Group (accounting firm, 2013-2016), and prior to Siegfried Group as audit senior manager at Deloitte & Touche LLP (accounting firm, 2005-2013).
Jim Wegmann (1979)
Year of Election or Appointment: 2019
Assistant Treasurer
Mr. Wegmann also serves as Assistant Treasurer of other funds. Mr. Wegmann is an employee of Fidelity Investments (2011-present).
Shareholder Expense Example
As a shareholder, you incur two types of costs: (1) transaction costs, which may include sales charges (loads) on purchase payments or redemption proceeds, as applicable and (2) ongoing costs, which generally include management fees, distribution and/or service (12b-1) fees and other Fund expenses. This Example is intended to help you understand your ongoing costs (in dollars) of investing in a fund and to compare these costs with the ongoing costs of investing in other mutual funds.
The Example is based on an investment of $1,000 invested at the beginning of the period and held for the entire period (March 1, 2020 to August 31, 2020).
Actual Expenses
The first line of the accompanying table provides information about actual account values and actual expenses. You may use the information in this line, together with the amount you invested, to estimate the expenses that you paid over the period. Simply divide your account value by $1,000.00 (for example, an $8,600 account value divided by $1,000.00 = 8.6), then multiply the result by the number in the first line for a class/Fund under the heading entitled "Expenses Paid During Period" to estimate the expenses you paid on your account during this period. If any fund is a shareholder of any underlying mutual funds or exchange-traded funds (ETFs) (the Underlying Funds), such fund indirectly bears its proportional share of the expenses of the Underlying Funds in addition to the direct expenses incurred presented in the table. These fees and expenses are not included in the annualized expense ratio used to calculate the expense estimate in the table below.
Hypothetical Example for Comparison Purposes
The second line of the accompanying table provides information about hypothetical account values and hypothetical expenses based on the actual expense ratio and an assumed rate of return of 5% per year before expenses, which is not the actual return. The hypothetical account values and expenses may not be used to estimate the actual ending account balance or expenses you paid for the period. You may use this information to compare the ongoing costs of investing in the Fund and other funds. To do so, compare this 5% hypothetical example with the 5% hypothetical examples that appear in the shareholder reports of the other funds. If any fund is a shareholder of any Underlying Funds, such fund indirectly bears its proportional share of the expenses of the Underlying Funds in addition to the direct expenses as presented in the table. These fees and expenses are not included in the annualized expense ratio used to calculate the expense estimate in the table below.
Please note that the expenses shown in the table are meant to highlight your ongoing costs only and do not reflect any transaction costs. Therefore, the second line of the table is useful in comparing ongoing costs only, and will not help you determine the relative total costs of owning different funds.
| | Annualized Expense Ratio-A | Beginning
Account Value
March 1, 2020 | Ending
Account Value
August 31, 2020 | Expenses Paid
During Period-B
March 1, 2020
to August 31, 2020 |
| Fidelity Maryland Municipal Income Fund | .55% | | | |
| Actual | | $1,000.00 | $986.70 | $2.75 |
| Hypothetical-C | | $1,000.00 | $1,022.37 | $2.80 |
A Annualized expense ratio reflects expenses net of applicable fee waivers.
B Expenses are equal to the annualized expense ratio, multiplied by the average account value over the period, multiplied by 184/ 366 (to reflect the one-half year period). The fees and expenses of any Underlying Funds are not included in each annualized expense ratio.
C 5% return per year before expenses
Distributions (Unaudited)
The Board of Trustees of Fidelity Maryland Municipal Income Fund voted to pay on October 5, 2020, to shareholders of record at the opening of business on October 2, 2020, a distribution of $.035 per share derived from capital gains realized from sales of portfolio securities.
The fund hereby designates as a capital gain dividend with respect to the taxable year ended August 31, 2020, $724,258, or, if subsequently determined to be different, the net capital gain of such year.
During fiscal year ended 2020, 100% of the fund's income dividends was free from federal income tax, and 5.01% of the fund's income dividends was subject to the federal alternative minimum tax.
The fund will notify shareholders in January 2021 of amounts for use in preparing 2020 income tax returns.
SMD-ANN-1020
1.536791.123