Fidelity® Maryland Municipal Income Fund
Semi-Annual Report
February 28, 2022


Contents
To view a fund's proxy voting guidelines and proxy voting record for the 12-month period ended June 30, visit http://www.fidelity.com/proxyvotingresults or visit the Securities and Exchange Commission's (SEC) web site at http://www.sec.gov.
You may also call 1-800-544-8544 to request a free copy of the proxy voting guidelines.
Standard & Poor's, S&P and S&P 500 are registered service marks of The McGraw-Hill Companies, Inc. and have been licensed for use by Fidelity Distributors Corporation.
Other third-party marks appearing herein are the property of their respective owners.
All other marks appearing herein are registered or unregistered trademarks or service marks of FMR LLC or an affiliated company. © 2022 FMR LLC. All rights reserved.
This report and the financial statements contained herein are submitted for the general information of the shareholders of the Fund. This report is not authorized for distribution to prospective investors in the Fund unless preceded or accompanied by an effective prospectus.
A fund files its complete schedule of portfolio holdings with the SEC for the first and third quarters of each fiscal year on Form N-PORT. Forms N-PORT are available on the SEC’s web site at http://www.sec.gov. A fund's Forms N-PORT may be reviewed and copied at the SEC’s Public Reference Room in Washington, DC. Information regarding the operation of the SEC's Public Reference Room may be obtained by calling 1-800-SEC-0330.
For a complete list of a fund's portfolio holdings, view the most recent holdings listing, semiannual report, or annual report on Fidelity's web site at http://www.fidelity.com, http://www.institutional.fidelity.com, or http://www.401k.com, as applicable.
NOT FDIC INSURED •MAY LOSE VALUE •NO BANK GUARANTEE
Neither the Fund nor Fidelity Distributors Corporation is a bank.
Note to Shareholders:
Early in 2020, the outbreak and spread of COVID-19 emerged as a public health emergency that had a major influence on financial markets, primarily based on its impact on the global economy and corporate earnings. On March 11, 2020, the World Health Organization declared the COVID-19 outbreak a pandemic, citing sustained risk of further global spread. The pandemic prompted a number of measures to limit the spread of COVID-19, including travel and border restrictions, quarantines, and restrictions on large gatherings. In turn, these resulted in lower consumer activity, diminished demand for a wide range of products and services, disruption in manufacturing and supply chains, and – given the wide variability in outcomes regarding the outbreak – significant market uncertainty and volatility. To help stem the turmoil, the U.S. government took unprecedented action – in concert with the U.S. Federal Reserve and central banks around the world – to help support consumers, businesses, and the broader economy, and to limit disruption to the financial system.
In general, the overall impact of the pandemic lessened in 2021, amid a resilient economy and widespread distribution of three COVID-19 vaccines granted emergency use authorization from the U.S. Food and Drug Administration (FDA) early in the year. Still, the situation remains dynamic, and the extent and duration of its influence on financial markets and the economy is highly uncertain, due in part to a recent spike in cases based on highly contagious variants of the coronavirus.
Extreme events such as the COVID-19 crisis are exogenous shocks that can have significant adverse effects on mutual funds and their investments. Although multiple asset classes may be affected by market disruption, the duration and impact may not be the same for all types of assets. Fidelity is committed to helping you stay informed amid news about COVID-19 and during increased market volatility, and we continue to take extra steps to be responsive to customer needs. We encourage you to visit us online, where we offer ongoing updates, commentary, and analysis on the markets and our funds.
Investment Summary (Unaudited)
Top Five Sectors as of February 28, 2022
| | % of fund's net assets |
| Health Care | 29.1 |
| General Obligations | 25.4 |
| Special Tax | 11.5 |
| Transportation | 10.0 |
| Water & Sewer | 10.0 |
Quality Diversification (% of fund's net assets)
| As of February 28, 2022 |
| | AAA | 11.0% |
| | AA,A | 68.7% |
| | BBB | 15.6% |
| | BB and Below | 2.1% |
| | Not Rated | 5.9% |
| | Short-Term Investments and Net Other Assets* | (3.3)% |

* Not included in the pie chart
We have used ratings from Moody's Investors Service, Inc. Where Moody's® ratings are not available, we have used S&P® ratings. All ratings are as of the date indicated and do not reflect subsequent changes.
Schedule of Investments February 28, 2022 (Unaudited)
Showing Percentage of Net Assets
| Municipal Bonds - 103.3% | | | |
| | | Principal Amount | Value |
| District Of Columbia - 1.1% | | | |
| Washington D.C. Metropolitan Transit Auth. Rev. Series 2017 B, 5% 7/1/33 | | 2,000,000 | 2,327,899 |
| Guam - 0.2% | | | |
| Guam Int'l. Arpt. Auth. Rev. Series 2013 C: | | | |
| 6.25% 10/1/34 (a) | | $180,000 | $191,311 |
| 6.25% 10/1/34 (Pre-Refunded to 10/1/23 @ 100) (a) | | 120,000 | 129,432 |
|
| TOTAL GUAM | | | 320,743 |
|
| Maryland - 102.0% | | | |
| Anne Arundel County Gen. Oblig.: | | | |
| Series 2015: | | | |
| 5% 4/1/33 | | 5,895,000 | 6,538,083 |
| 5% 4/1/33 | | 2,585,000 | 2,866,997 |
| Series 2018, 5% 10/1/35 | | 6,400,000 | 7,551,212 |
| Series 2019, 5% 10/1/48 | | 550,000 | 671,055 |
| Baltimore Convention Ctr. Hotel Rev. Series 2017, 5% 9/1/32 | | 1,500,000 | 1,567,894 |
| Baltimore County Gen. Oblig.: | | | |
| Series 2016, 5% 2/1/29 | | 1,310,000 | 1,487,734 |
| Series 2019, 4% 11/1/33 | | 1,805,000 | 2,088,267 |
| Series 2020: | | | |
| 4% 1/1/32 | | 700,000 | 789,476 |
| 4% 1/1/33 | | 1,200,000 | 1,352,958 |
| 4% 1/1/35 | | 1,230,000 | 1,383,804 |
| 4% 1/1/37 | | 1,500,000 | 1,685,217 |
| 4% 1/1/45 | | 1,750,000 | 1,937,057 |
| 4% 3/1/48 | | 2,060,000 | 2,315,784 |
| 4% 1/1/50 | | 2,400,000 | 2,654,414 |
| Baltimore Gen. Oblig.: | | | |
| (East Baltimore Research Park Proj.) Series 2017 A, 5% 9/1/38 | | 1,650,000 | 1,796,891 |
| Series 2013 B, 5% 10/15/24 | | 1,875,000 | 1,924,135 |
| Series 2015: | | | |
| 5% 6/15/23 | | 350,000 | 367,106 |
| 5% 6/15/24 | | 500,000 | 539,747 |
| Series 2017 A: | | | |
| 5% 10/15/34 | | 2,000,000 | 2,361,347 |
| 5% 10/15/36 | | 1,000,000 | 1,180,748 |
| 5% 10/15/37 | | 1,005,000 | 1,188,665 |
| Baltimore Proj. Rev.: | | | |
| (Wastewtr. Projs.) Series 2014 C: | | | |
| 5% 7/1/27 | | 2,325,000 | 2,558,252 |
| 5% 7/1/34 | | 1,285,000 | 1,410,357 |
| (Wtr. Projs.): | | | |
| Series 1994 A, 5% 7/1/24 (Nat'l. Pub. Fin. Guarantee Corp. Insured) | | 60,000 | 60,748 |
| Series 2014 A: | | | |
| 5% 7/1/28 | | 2,825,000 | 3,111,898 |
| 5% 7/1/33 | | 3,000,000 | 3,293,881 |
| Series 2014 B, 5% 7/1/28 | | 1,580,000 | 1,738,605 |
| Series 2020 A, 5% 7/1/50 | | 2,490,000 | 3,021,825 |
| Series 2017 D, 5% 7/1/31 | | 5,260,000 | 6,116,099 |
| City of Westminster Series 2016, 5% 11/1/31 | | 1,000,000 | 1,127,457 |
| Maryland Cmnty. Dev. Admin Dept. Hsg. & Cmnty. Dev.: | | | |
| Series 2019 B, 4% 9/1/49 | | 645,000 | 684,795 |
| Series 2019 C: | | | |
| 5% 9/1/29 | | 550,000 | 659,631 |
| 5% 3/1/30 | | 700,000 | 837,988 |
| 5% 3/1/31 | | 1,150,000 | 1,367,282 |
| Series 2021 B, 3% 9/1/51 | | 1,000,000 | 1,038,169 |
| Maryland Dept. of Trans. Series 2021 B: | | | |
| 4% 8/1/51 (a) | | 2,005,000 | 2,173,197 |
| 5% 8/1/46 (a) | | 2,000,000 | 2,378,062 |
| Maryland Dept. of Trans. Consolidated Trans. Rev.: | | | |
| Series 2020, 5% 10/1/33 | | 1,520,000 | 1,908,208 |
| Series 2022 B: | | | |
| 5% 12/1/28 (b) | | 2,500,000 | 2,911,391 |
| 5% 12/1/29 (b) | | 2,375,000 | 2,811,161 |
| Maryland Econ. Dev. Auth. Rev.: | | | |
| (Ports America Chesapeake LLC. Proj.) Series 2017 A, 5% 6/1/29 | | 1,850,000 | 2,167,886 |
| (Term. Proj.) Series 2019 A: | | | |
| 5% 6/1/44 (a) | | 500,000 | 573,245 |
| 5% 6/1/49 (a) | | 1,000,000 | 1,138,984 |
| Maryland Econ. Dev. Corp. Air Cargo Series 2019: | | | |
| 5% 7/1/27 (a) | | 200,000 | 229,388 |
| 5% 7/1/28 (a) | | 630,000 | 736,473 |
| 5% 7/1/29 (a) | | 585,000 | 694,896 |
| Maryland Econ. Dev. Corp. Student Hsg. Rev.: | | | |
| (Towson Univ. Proj.) Series 2017: | | | |
| 5% 7/1/26 | | 350,000 | 384,483 |
| 5% 7/1/28 | | 305,000 | 338,001 |
| 5% 7/1/29 | | 185,000 | 203,957 |
| 5% 7/1/30 | | 250,000 | 274,323 |
| 5% 7/1/31 | | 300,000 | 328,104 |
| 5% 7/1/32 | | 325,000 | 354,112 |
| 5% 7/1/36 | | 500,000 | 540,707 |
| (Univ. of Maryland, Baltimore County Proj.) Series 2016: | | | |
| 5% 7/1/28 (Assured Guaranty Muni. Corp. Insured) | | 350,000 | 397,836 |
| 5% 7/1/29 (Assured Guaranty Muni. Corp. Insured) | | 700,000 | 793,537 |
| (Univ. of Maryland, College Park Projs.) Series 2016, 5% 6/1/43 (Assured Guaranty Muni. Corp. Insured) | | 575,000 | 651,620 |
| Maryland Gen. Oblig.: | | | |
| Series 2021 2A, 4% 8/1/36 | | 1,000,000 | 1,179,470 |
| Series 2022 2D, 4% 8/1/29 (b) | | 2,500,000 | 2,898,679 |
| Series A: | | | |
| 5% 8/1/31 | | 1,060,000 | 1,335,301 |
| 5% 8/1/32 | | 1,000,000 | 1,258,444 |
| 5% 3/15/33 | | 2,925,000 | 3,644,566 |
| 5% 8/1/34 | | 2,000,000 | 2,510,125 |
| Maryland Health & Higher Edl.: | | | |
| Series 2020: | | | |
| 4% 7/1/40 | | 300,000 | 334,315 |
| 4% 7/1/45 | | 750,000 | 827,952 |
| 4% 7/1/50 | | 1,000,000 | 1,097,801 |
| Series 2021 A: | | | |
| 4% 6/1/39 | | 475,000 | 525,663 |
| 4% 6/1/40 | | 500,000 | 552,778 |
| Maryland Health & Higher Edl. Facilities Auth. Rev.: | | | |
| (Anne Arundel Med. Ctr., MD Proj.) Series 2017 A: | | | |
| 5% 7/1/28 | | 520,000 | 608,719 |
| 5% 7/1/30 | | 850,000 | 985,602 |
| 5% 7/1/31 | | 1,400,000 | 1,618,723 |
| 5% 7/1/32 | | 290,000 | 334,671 |
| (Medstar Health, Inc. Proj.) Series 2017 A, 5% 5/15/45 | | 65,000 | 75,449 |
| Series 2012 A: | | | |
| 5% 7/1/23 (Pre-Refunded to 7/1/22 @ 100) | | 400,000 | 405,757 |
| 5% 7/1/26 (Pre-Refunded to 7/1/22 @ 100) | | 300,000 | 304,166 |
| Series 2012: | | | |
| 5% 7/1/23 (Pre-Refunded to 7/1/22 @ 100) | | 850,000 | 862,089 |
| 5% 7/1/26 | | 1,080,000 | 1,093,191 |
| 5% 7/1/27 (Pre-Refunded to 7/1/22 @ 100) | | 300,000 | 304,267 |
| 5% 7/1/31 | | 2,500,000 | 2,531,241 |
| Series 2013 A, 5% 8/15/41 | | 3,015,000 | 3,174,254 |
| Series 2013 B, 5% 8/15/38 | | 2,000,000 | 2,109,807 |
| Series 2014: | | | |
| 5% 7/1/22 (Escrowed to Maturity) | | 870,000 | 882,521 |
| 5% 7/1/27 (Pre-Refunded to 7/1/24 @ 100) | | 3,495,000 | 3,791,243 |
| 5% 10/1/45 | | 2,500,000 | 2,718,406 |
| Series 2015 A: | | | |
| 5% 5/15/29 | | 2,000,000 | 2,216,348 |
| 5% 5/15/30 | | 1,000,000 | 1,107,180 |
| Series 2015: | | | |
| 5% 7/1/24 | | 100,000 | 108,476 |
| 5% 7/1/26 (Pre-Refunded to 7/1/24 @ 100) | | 1,000,000 | 1,085,967 |
| 5% 7/1/27 (Pre-Refunded to 7/1/24 @ 100) | | 1,000,000 | 1,085,967 |
| 5% 7/1/29 (Pre-Refunded to 7/1/25 @ 100) | | 600,000 | 670,156 |
| 5% 8/15/29 | | 2,000,000 | 2,201,559 |
| 5% 7/1/30 (Pre-Refunded to 7/1/25 @ 100) | | 1,075,000 | 1,200,696 |
| 5% 7/1/31 | | 2,200,000 | 2,431,478 |
| 5% 7/1/33 | | 1,325,000 | 1,461,249 |
| 5% 7/1/34 | | 1,200,000 | 1,322,826 |
| 5% 7/1/40 (Pre-Refunded to 7/1/25 @ 100) | | 3,350,000 | 3,741,704 |
| Series 2016 A: | | | |
| 4% 7/1/42 | | 2,175,000 | 2,318,217 |
| 5% 7/1/35 | | 1,500,000 | 1,694,208 |
| 5% 7/1/38 | | 3,215,000 | 3,616,872 |
| 5.5% 1/1/31 | | 1,500,000 | 1,766,640 |
| Series 2016: | | | |
| 5% 6/1/26 | | 300,000 | 339,158 |
| 5% 6/1/27 | | 255,000 | 287,471 |
| 5% 6/1/28 | | 310,000 | 348,142 |
| 5% 6/1/29 | | 350,000 | 392,016 |
| 5% 7/1/31 | | 500,000 | 564,165 |
| 5% 6/1/33 | | 305,000 | 339,397 |
| 5% 6/1/36 | | 250,000 | 277,420 |
| Series 2017: | | | |
| 4% 7/1/42 | | 2,845,000 | 3,072,381 |
| 5% 6/1/27 | | 290,000 | 326,928 |
| 5% 6/1/31 | | 425,000 | 473,865 |
| 5% 6/1/33 | | 970,000 | 1,079,393 |
| 5% 6/1/35 | | 600,000 | 666,413 |
| 5% 6/1/42 | | 1,000,000 | 1,101,815 |
| Series 2019 A, 5% 10/1/49 | | 2,000,000 | 2,370,263 |
| Series 2020 A: | | | |
| 4% 7/1/22 | | 100,000 | 101,069 |
| 5% 7/1/23 | | 310,000 | 325,747 |
| 5% 7/1/24 | | 355,000 | 384,066 |
| 5% 7/1/34 | | 1,000,000 | 1,218,151 |
| 5% 7/1/35 | | 1,000,000 | 1,216,897 |
| Series 2020 B: | | | |
| 5% 4/15/34 | | 1,010,000 | 1,222,147 |
| 5% 4/15/35 | | 1,000,000 | 1,208,771 |
| Maryland Stadium Auth. Built to Learn Rev. Series 2022 A, 4% 6/1/36 (b) | | 1,875,000 | 2,115,541 |
| Maryland Stadium Auth. Rev. (Pub. Schools Construction and Revitalization Prog.): | | | |
| Series 2016: | | | |
| 5% 5/1/30 | | 1,715,000 | 1,950,480 |
| 5% 5/1/36 | | 2,000,000 | 2,262,989 |
| Series 2018 A, 5% 5/1/36 | | 1,580,000 | 1,862,190 |
| Maryland Trans. Auth. Trans. Facility Projs. Rev.: | | | |
| Series 2017, 5% 7/1/30 | | 3,000,000 | 3,516,058 |
| Series 2020: | | | |
| 4% 7/1/50 | | 2,500,000 | 2,795,974 |
| 5% 7/1/33 | | 1,000,000 | 1,244,386 |
| 5% 7/1/36 | | 490,000 | 606,655 |
| Series 2021 A, 5% 7/1/51 | | 2,500,000 | 3,079,982 |
| Montgomery County Gen. Oblig.: | | | |
| (Trinity Health Cr. Group Proj.) Series 2016, 5% 12/1/45 | | 2,545,000 | 2,891,719 |
| Series A, 4% 11/1/33 | | 3,000,000 | 3,498,840 |
| Prince Georges County Ctfs. of Prtn.: | | | |
| Series 2018, 5% 10/1/48 | | 2,100,000 | 2,492,038 |
| Series 2021: | | | |
| 4% 10/1/39 | | 1,205,000 | 1,398,298 |
| 4% 10/1/40 | | 1,255,000 | 1,451,284 |
| 4% 10/1/41 | | 400,000 | 462,178 |
| Prince Georges County Gen. Oblig. Series 2020 A, 5% 7/15/34 | | 1,010,000 | 1,216,554 |
| Univ. of Maryland Sys. Auxiliary Facility & Tuition Rev. Series 2021 A, 4% 4/1/47 | | 2,520,000 | 2,863,025 |
| Washington Metropolitan Area Transit Auth. Series 2021 A, 5% 7/15/46 | | 3,350,000 | 4,143,049 |
|
| TOTAL MARYLAND | | | 216,426,807 |
|
| TOTAL MUNICIPAL BONDS | | | |
| (Cost $214,748,746) | | | 219,075,449 |
| TOTAL INVESTMENT IN SECURITIES - 103.3% | | | |
| (Cost $214,748,746) | | | 219,075,449 |
| NET OTHER ASSETS (LIABILITIES) - (3.3)% | | | (6,980,648) |
| NET ASSETS - 100% | | | $212,094,801 |
Legend
(a) Private activity obligations whose interest is subject to the federal alternative minimum tax for individuals.
(b) Security or a portion of the security purchased on a delayed delivery or when-issued basis.
Investment Valuation
The following is a summary of the inputs used, as of February 28, 2022, involving the Fund's assets and liabilities carried at fair value. The inputs or methodology used for valuing securities may not be an indication of the risk associated with investing in those securities. For more information on valuation inputs, and their aggregation into the levels used below, please refer to the Investment Valuation section in the accompanying Notes to Financial Statements.
| | Valuation Inputs at Reporting Date: |
| Description | Total | Level 1 | Level 2 | Level 3 |
| Investments in Securities: | | | | |
| Municipal Securities | $219,075,449 | $-- | $219,075,449 | $-- |
| Total Investments in Securities: | $219,075,449 | $-- | $219,075,449 | $-- |
Other Information
The distribution of municipal securities by revenue source, as a percentage of total Net Assets, is as follows (Unaudited):
| Health Care | 29.1% |
| General Obligations | 25.4% |
| Special Tax | 11.5% |
| Transportation | 10.0% |
| Water & Sewer | 10.0% |
| Education | 9.6% |
| Escrowed/Pre-Refunded | 5.6% |
| Others* (Individually Less Than 5%) | (1.2)% |
| | 100.0% |
* Includes net other assets
See accompanying notes which are an integral part of the financial statements.
Financial Statements
Statement of Assets and Liabilities
| | | February 28, 2022 (Unaudited) |
| Assets | | |
Investment in securities, at value — See accompanying schedule:
Unaffiliated issuers (cost $214,748,746) | | $219,075,449 |
| Cash | | 298,048 |
| Receivable for investments sold | | 3,670,498 |
| Receivable for fund shares sold | | 191,503 |
| Interest receivable | | 2,187,832 |
| Other receivables | | 1,453 |
| Total assets | | 225,424,783 |
| Liabilities | | |
| Payable for investments purchased | | |
| Regular delivery | $99,180 | |
| Delayed delivery | 11,048,500 | |
| Payable for fund shares redeemed | 1,966,530 | |
| Distributions payable | 115,001 | |
| Accrued management fee | 100,771 | |
| Total liabilities | | 13,329,982 |
| Net Assets | | $212,094,801 |
| Net Assets consist of: | | |
| Paid in capital | | $207,434,997 |
| Total accumulated earnings (loss) | | 4,659,804 |
| Net Assets | | $212,094,801 |
| Net Asset Value, offering price and redemption price per share ($212,094,801 ÷ 18,671,122 shares) | | $11.36 |
See accompanying notes which are an integral part of the financial statements.
Statement of Operations
| | | Six months ended February 28, 2022 (Unaudited) |
| Investment Income | | |
| Interest | | $2,834,795 |
| Expenses | | |
| Management fee | $623,237 | |
| Independent trustees' fees and expenses | 387 | |
| Total expenses before reductions | 623,624 | |
| Expense reductions | (1,935) | |
| Total expenses after reductions | | 621,689 |
| Net investment income (loss) | | 2,213,106 |
| Realized and Unrealized Gain (Loss) | | |
| Net realized gain (loss) on: | | |
| Investment securities: | | |
| Unaffiliated issuers | | 525,523 |
| Total net realized gain (loss) | | 525,523 |
| Change in net unrealized appreciation (depreciation) on investment securities | | (9,674,641) |
| Net gain (loss) | | (9,149,118) |
| Net increase (decrease) in net assets resulting from operations | | $(6,936,012) |
See accompanying notes which are an integral part of the financial statements.
Statement of Changes in Net Assets
| | Six months ended February 28, 2022 (Unaudited) | Year ended August 31, 2021 |
| Increase (Decrease) in Net Assets | | |
| Operations | | |
| Net investment income (loss) | $2,213,106 | $4,563,266 |
| Net realized gain (loss) | 525,523 | 822,523 |
| Change in net unrealized appreciation (depreciation) | (9,674,641) | 3,433,604 |
| Net increase (decrease) in net assets resulting from operations | (6,936,012) | 8,819,393 |
| Distributions to shareholders | (3,071,848) | (5,367,129) |
| Share transactions | | |
| Proceeds from sales of shares | 16,715,629 | 37,325,056 |
| Reinvestment of distributions | 1,981,096 | 3,606,916 |
| Cost of shares redeemed | (29,108,822) | (34,702,481) |
| Net increase (decrease) in net assets resulting from share transactions | (10,412,097) | 6,229,491 |
| Total increase (decrease) in net assets | (20,419,957) | 9,681,755 |
| Net Assets | | |
| Beginning of period | 232,514,758 | 222,833,003 |
| End of period | $212,094,801 | $232,514,758 |
| Other Information | | |
| Shares | | |
| Sold | 1,440,565 | 3,166,706 |
| Issued in reinvestment of distributions | 169,953 | 306,747 |
| Redeemed | (2,518,101) | (2,949,711) |
| Net increase (decrease) | (907,583) | 523,742 |
See accompanying notes which are an integral part of the financial statements.
Financial Highlights
Fidelity Maryland Municipal Income Fund
| | Six months ended (Unaudited) February 28, | Years endedAugust 31, | | | | |
| | 2022 | 2021 | 2020 | 2019 | 2018 | 2017 |
| Selected Per–Share Data | | | | | | |
| Net asset value, beginning of period | $11.88 | $11.69 | $11.78 | $11.11 | $11.47 | $11.73 |
| Income from Investment Operations | | | | | | |
| Net investment income (loss)A,B | .114 | .239 | .257 | .259 | .258 | .271 |
| Net realized and unrealized gain (loss) | (.476) | .232 | (.090) | .670 | (.278) | (.239) |
| Total from investment operations | (.362) | .471 | .167 | .929 | (.020) | .032 |
| Distributions from net investment income | (.114) | (.239) | (.257) | (.259) | (.258) | (.272) |
| Distributions from net realized gain | (.044) | (.042) | – | – | (.082) | (.020) |
| Total distributions | (.158) | (.281) | (.257) | (.259) | (.340) | (.292) |
| Redemption fees added to paid in capitalA | – | – | – | – | – | –C |
| Net asset value, end of period | $11.36 | $11.88 | $11.69 | $11.78 | $11.11 | $11.47 |
| Total ReturnD,E | (3.07)% | 4.08% | 1.45% | 8.48% | (.16)% | .33% |
| Ratios to Average Net AssetsB,F,G | | | | | | |
| Expenses before reductions | .55%H | .55% | .55% | .55% | .55% | .55% |
| Expenses net of fee waivers, if any | .55%H | .55% | .55% | .55% | .55% | .55% |
| Expenses net of all reductions | .55%H | .55% | .55% | .55% | .55% | .55% |
| Net investment income (loss) | 1.97%H | 2.03% | 2.21% | 2.29% | 2.30% | 2.40% |
| Supplemental Data | | | | | | |
| Net assets, end of period (000 omitted) | $212,095 | $232,515 | $222,833 | $224,276 | $216,922 | $235,012 |
| Portfolio turnover rateI | 10%H | 10% | 19% | 10% | 25% | 24% |
A Calculated based on average shares outstanding during the period.
B Net investment income (loss) is affected by the timing of the declaration of dividends by any underlying mutual funds or exchange-traded funds (ETFs). Net investment income (loss) of any such underlying funds is not included in the Fund's net investment income (loss) ratio.
C Amount represents less than $.0005 per share.
D Total returns for periods of less than one year are not annualized.
E Total returns would have been lower if certain expenses had not been reduced during the applicable periods shown.
F Fees and expenses of any underlying mutual funds or exchange-traded funds (ETFs) are not included in the Fund's expense ratio. The Fund indirectly bears its proportionate share of these expenses.
G Expense ratios reflect operating expenses of the class. Expenses before reductions do not reflect amounts reimbursed, waived, or reduced through arrangements with the investment adviser, brokerage services, or other offset arrangements, if applicable, and do not represent the amount paid by the class during periods when reimbursements, waivers or reductions occur.
H Annualized
I Amount does not include the portfolio activity of any underlying mutual funds or exchange-traded funds (ETFs).
See accompanying notes which are an integral part of the financial statements.
Notes to Financial Statements (Unaudited)
For the period ended February 28, 2022
1. Organization.
Fidelity Maryland Municipal Income Fund (the Fund) is a non-diversified fund of Fidelity Union Street Trust (the Trust) and is authorized to issue an unlimited number of shares. Share transactions on the Statement of Changes in Net Assets may contain exchanges between affiliated funds. The Trust is registered under the Investment Company Act of 1940, as amended (the 1940 Act), as an open-end management investment company organized as a Massachusetts business trust. The Fund may be affected by economic and political developments in the state of Maryland.
2. Significant Accounting Policies.
The Fund is an investment company and applies the accounting and reporting guidance of the Financial Accounting Standards Board (FASB) Accounting Standards Codification Topic 946 Financial Services - Investment Companies. The financial statements have been prepared in conformity with accounting principles generally accepted in the United States of America (GAAP), which require management to make certain estimates and assumptions at the date of the financial statements. Actual results could differ from those estimates. Subsequent events, if any, through the date that the financial statements were issued have been evaluated in the preparation of the financial statements. The Fund's Schedule of Investments lists any underlying mutual funds or exchange-traded funds (ETFs) but does not include the underlying holdings of these funds. The following summarizes the significant accounting policies of the Fund:
Investment Valuation. Investments are valued as of 4:00 p.m. Eastern time on the last calendar day of the period. The Board of Trustees (the Board) has delegated the day to day responsibility for the valuation of the Fund's investments to the Fair Value Committee (the Committee) established by the Fund's investment adviser. In accordance with valuation policies and procedures approved by the Board, the Fund attempts to obtain prices from one or more third party pricing vendors or brokers to value its investments. When current market prices, quotations or currency exchange rates are not readily available or reliable, investments will be fair valued in good faith by the Committee, in accordance with procedures adopted by the Board. Factors used in determining fair value vary by investment type and may include market or investment specific events, changes in interest rates and credit quality. The frequency with which these procedures are used cannot be predicted and they may be utilized to a significant extent. The Committee oversees the Fund's valuation policies and procedures and reports to the Board on the Committee's activities and fair value determinations. The Board monitors the appropriateness of the procedures used in valuing the Fund's investments and ratifies the fair value determinations of the Committee.
The Fund categorizes the inputs to valuation techniques used to value its investments into a disclosure hierarchy consisting of three levels as shown below:
- Level 1 – Unadjusted quoted prices in active markets for identical investments
- Level 2 – other significant observable inputs (including quoted prices for similar investments, interest rates, prepayment speeds, etc.)
- Level 3 – unobservable inputs (including the Fund's own assumptions based on the best information available)
Valuation techniques used to value the Fund's investments by major category are as follows:
Debt securities, including restricted securities, are valued based on evaluated prices received from third party pricing vendors or from brokers who make markets in such securities. Municipal securities are valued by pricing vendors who utilize matrix pricing which considers yield or price of bonds of comparable quality, coupon, maturity and type or by broker-supplied prices. When independent prices are unavailable or unreliable, debt securities may be valued utilizing pricing methodologies which consider similar factors that would be used by third party pricing vendors. Debt securities are generally categorized as Level 2 in the hierarchy but may be Level 3 depending on the circumstances.
Changes in valuation techniques may result in transfers in or out of an assigned level within the disclosure hierarchy. The aggregate value of investments by input level as of February 28, 2022 is included at the end of the Fund's Schedule of Investments.
Investment Transactions and Income. For financial reporting purposes, the Fund's investment holdings and NAV include trades executed through the end of the last business day of the period. The NAV per share for processing shareholder transactions is calculated as of the close of business of the New York Stock Exchange (NYSE), normally 4:00 p.m. Eastern time and includes trades executed through the end of the prior business day. Gains and losses on securities sold are determined on the basis of identified cost. Interest income is accrued as earned and includes coupon interest and amortization of premium and accretion of discount on debt securities as applicable. Debt obligations may be placed on non-accrual status and related interest income may be reduced by ceasing current accruals and writing off interest receivables when the collection of all or a portion of interest has become doubtful based on consistently applied procedures. A debt obligation is removed from non-accrual status when the issuer resumes interest payments or when collectability of interest is reasonably assured.
Expenses. Expenses directly attributable to a fund are charged to that fund. Expenses attributable to more than one fund are allocated among the respective funds on the basis of relative net assets or other appropriate methods. Expenses included in the accompanying financial statements reflect the expenses of that fund and do not include any expenses associated with any underlying mutual funds or exchange-traded funds. Although not included in a fund's expenses, a fund indirectly bears its proportionate share of these expenses through the net asset value of each underlying mutual fund or exchange-traded fund. Expense estimates are accrued in the period to which they relate and adjustments are made when actual amounts are known.
Income Tax Information and Distributions to Shareholders. Each year, the Fund intends to qualify as a regulated investment company under Subchapter M of the Internal Revenue Code, including distributing substantially all of its taxable income and realized gains. As a result, no provision for U.S. Federal income taxes is required. The Fund files a U.S. federal tax return, in addition to state and local tax returns as required. The Fund's federal income tax returns are subject to examination by the Internal Revenue Service (IRS) for a period of three fiscal years after they are filed. State and local tax returns may be subject to examination for an additional fiscal year depending on the jurisdiction.
Distributions are declared and recorded daily and paid monthly from net investment income. Distributions from realized gains, if any, are declared and recorded on the ex-dividend date. Income and capital gain distributions are determined in accordance with income tax regulations, which may differ from GAAP.
Capital accounts within the financial statements are adjusted for permanent book-tax differences. These adjustments have no impact on net assets or the results of operations. Capital accounts are not adjusted for temporary book-tax differences which will reverse in a subsequent period.
The Fund purchases municipal securities whose interest, in the opinion of the issuer, is free from federal income tax. There is no assurance that the IRS will agree with this opinion. In the event the IRS determines that the issuer does not comply with relevant tax requirements, interest payments from a security could become federally taxable, possibly retroactively to the date the security was issued.
As of period end, the cost and unrealized appreciation (depreciation) in securities, and derivatives if applicable, for federal income tax purposes were as follows:
| Gross unrealized appreciation | $6,664,916 |
| Gross unrealized depreciation | (2,338,213) |
| Net unrealized appreciation (depreciation) | $4,326,703 |
| Tax cost | $214,748,746 |
Delayed Delivery Transactions and When-Issued Securities. During the period, certain Funds transacted in securities on a delayed delivery or when-issued basis. Payment and delivery may take place after the customary settlement period for that security. The price of the underlying securities and the date when the securities will be delivered and paid for are fixed at the time the transaction is negotiated. Securities purchased on a delayed delivery or when-issued basis are identified as such in the Schedule of Investments. Compensation for interest forgone in the purchase of a delayed delivery or when-issued debt security may be received. With respect to purchase commitments, each applicable Fund identifies securities as segregated in its records with a value at least equal to the amount of the commitment. Payables and receivables associated with the purchases and sales of delayed delivery securities having the same coupon, settlement date and broker are offset. Delayed delivery or when-issued securities that have been purchased from and sold to different brokers are reflected as both payables and receivables in the Statement of Assets and Liabilities under the caption "Delayed delivery", as applicable. Losses may arise due to changes in the value of the underlying securities or if the counterparty does not perform under the contract's terms, or if the issuer does not issue the securities due to political, economic, or other factors.
3. Purchases and Sales of Investments.
Purchases and sales of securities, other than short-term securities and in-kind transactions, as applicable, are noted in the table below.
| | Purchases ($) | Sales ($) |
| Fidelity Maryland Municipal Income Fund | 10,796,500 | 12,110,254 |
4. Fees and Other Transactions with Affiliates.
Management Fee. Fidelity Management & Research Company LLC (the investment adviser) and its affiliates provide the Fund with investment management related services for which the Fund pays a monthly management fee that is based on an annual rate of .55% of the Fund's average net assets. Under the management contract, the investment adviser pays all other expenses, except the compensation of the independent Trustees and certain other expenses such as interest expense. The management fee is reduced by an amount equal to the fees and expenses paid by the Fund to the independent Trustees.
Interfund Trades. Funds may purchase from or sell securities to other Fidelity Funds under procedures adopted by the Board. The procedures have been designed to ensure these interfund trades are executed in accordance with Rule 17a-7 of the 1940 Act. Any interfund trades are included within the respective purchases and sales amounts shown in the Purchases and Sales of Investments note. During the period there were no interfund trades.
5. Committed Line of Credit.
Certain Funds participate with other funds managed by the investment adviser or an affiliate in a $4.25 billion credit facility (the "line of credit") to be utilized for temporary or emergency purposes to fund shareholder redemptions or for other short-term liquidity purposes. The commitment fees on the pro-rata portion of the line of credit are borne by the investment adviser. During the period, there were no borrowings on this line of credit.
6. Expense Reductions.
Through arrangements with the Fund's custodian, credits realized as a result of certain uninvested cash balances were used to reduce the Fund's expenses by $1,935.
7. Other.
A fund's organizational documents provide former and current trustees and officers with a limited indemnification against liabilities arising in connection with the performance of their duties to the fund. In the normal course of business, a fund may also enter into contracts that provide general indemnifications. A fund's maximum exposure under these arrangements is unknown as this would be dependent on future claims that may be made against a fund. The risk of material loss from such claims is considered remote.
8. Coronavirus (COVID-19) Pandemic.
An outbreak of COVID-19 first detected in China during December 2019 has since spread globally and was declared a pandemic by the World Health Organization during March 2020. Developments that disrupt global economies and financial markets, such as the COVID-19 pandemic, may magnify factors that affect the Fund's performance.
Shareholder Expense Example
As a shareholder, you incur two types of costs: (1) transaction costs, which may include sales charges (loads) on purchase payments or redemption proceeds, as applicable and (2) ongoing costs, which generally include management fees, distribution and/or service (12b-1) fees and other Fund expenses. This Example is intended to help you understand your ongoing costs (in dollars) of investing in a fund and to compare these costs with the ongoing costs of investing in other mutual funds.
The Example is based on an investment of $1,000 invested at the beginning of the period and held for the entire period (September 1, 2021 to February 28, 2022).
Actual Expenses
The first line of the accompanying table provides information about actual account values and actual expenses. You may use the information in this line, together with the amount you invested, to estimate the expenses that you paid over the period. Simply divide your account value by $1,000.00 (for example, an $8,600 account value divided by $1,000.00 = 8.6), then multiply the result by the number in the first line for a class/Fund under the heading entitled "Expenses Paid During Period" to estimate the expenses you paid on your account during this period. If any fund is a shareholder of any underlying mutual funds or exchange-traded funds (ETFs) (the Underlying Funds), such fund indirectly bears its proportional share of the expenses of the Underlying Funds in addition to the direct expenses incurred presented in the table. These fees and expenses are not included in the annualized expense ratio used to calculate the expense estimate in the table below.
Hypothetical Example for Comparison Purposes
The second line of the accompanying table provides information about hypothetical account values and hypothetical expenses based on the actual expense ratio and an assumed rate of return of 5% per year before expenses, which is not the actual return. The hypothetical account values and expenses may not be used to estimate the actual ending account balance or expenses you paid for the period. You may use this information to compare the ongoing costs of investing in the Fund and other funds. To do so, compare this 5% hypothetical example with the 5% hypothetical examples that appear in the shareholder reports of the other funds. If any fund is a shareholder of any Underlying Funds, such fund indirectly bears its proportional share of the expenses of the Underlying Funds in addition to the direct expenses as presented in the table. These fees and expenses are not included in the annualized expense ratio used to calculate the expense estimate in the table below.
Please note that the expenses shown in the table are meant to highlight your ongoing costs only and do not reflect any transaction costs. Therefore, the second line of the table is useful in comparing ongoing costs only, and will not help you determine the relative total costs of owning different funds. In addition, if these transactional costs were included, your costs would have been higher.
| | Annualized Expense Ratio-A | Beginning
Account Value
September 1, 2021 | Ending
Account Value
February 28, 2022 | Expenses Paid
During Period-B
September 1, 2021
to February 28, 2022 |
| Fidelity Maryland Municipal Income Fund | .55% | | | |
| Actual | | $1,000.00 | $969.30 | $2.69 |
| Hypothetical-C | | $1,000.00 | $1,022.07 | $2.76 |
A Annualized expense ratio reflects expenses net of applicable fee waivers.
B Expenses are equal to the annualized expense ratio, multiplied by the average account value over the period, multiplied by 181/ 365 (to reflect the one-half year period). The fees and expenses of any Underlying Funds are not included in each annualized expense ratio.
C 5% return per year before expenses
Board Approval of Investment Advisory Contracts and Management Fees
Fidelity Maryland Municipal Income Fund
Each year, the Board of Trustees, including the Independent Trustees (together, the Board), votes on the renewal of the management contract with Fidelity Management & Research Company LLC (FMR) and the sub-advisory agreements (together, the Advisory Contracts) for the fund. FMR and the sub-advisers are referred to herein as the Investment Advisers. The Board, assisted by the advice of fund counsel and Independent Trustees' counsel, requests and considers a broad range of information relevant to the renewal of the Advisory Contracts throughout the year.
The Board meets regularly and, at each of its meetings, covers an extensive agenda of topics and materials and considers factors that are relevant to its annual consideration of the renewal of the fund's Advisory Contracts, including the services and support provided to the fund and its shareholders. The Board has established four standing committees (Committees) — Operations, Audit, Fair Valuation, and Governance and Nominating — each composed of and chaired by Independent Trustees with varying backgrounds, to which the Board has assigned specific subject matter responsibilities in order to enhance effective decision-making by the Board. The Operations Committee, of which all of the Independent Trustees are members, meets regularly throughout the year and considers, among other matters, information specifically related to the annual consideration of the renewal of the fund's Advisory Contracts. The Board, acting directly and through its Committees, requests and receives information concerning the annual consideration of the renewal of the fund's Advisory Contracts. The Board also meets as needed to review matters specifically related to the Board's annual consideration of the renewal of the Advisory Contracts. Members of the Board may also meet with trustees of other Fidelity funds through joint ad hoc committees to discuss certain matters relevant to all of the Fidelity funds.
At its September 2021 meeting, the Board unanimously determined to renew the fund's Advisory Contracts. In reaching its determination, the Board considered all factors it believed relevant, including (i) the nature, extent, and quality of the services provided to the fund and its shareholders (including the investment performance of the fund); (ii) the competitiveness relative to peer funds of the fund's management fee and total expense ratio; (iii) the total costs of the services provided by and the profits realized by Fidelity from its relationships with the fund; and (iv) the extent to which, if any, economies of scale exist and are realized as the fund grows, and whether any economies of scale are appropriately shared with fund shareholders.
In considering whether to renew the Advisory Contracts for the fund, the Board reached a determination, with the assistance of fund counsel and Independent Trustees' counsel and through the exercise of its business judgment, that the renewal of the Advisory Contracts was in the best interests of the fund and its shareholders and that the compensation payable under the Advisory Contracts was fair and reasonable. The Board's decision to renew the Advisory Contracts was not based on any single factor, but rather was based on a comprehensive consideration of all the information provided to the Board at its meetings throughout the year. The Board, in reaching its determination to renew the Advisory Contracts, was aware that shareholders of the fund have a broad range of investment choices available to them, including a wide choice among funds offered by Fidelity's competitors, and that the fund's shareholders, who have the opportunity to review and weigh the disclosure provided by the fund in its prospectus and other public disclosures, have chosen to invest in this fund, which is part of the Fidelity family of funds.
Nature, Extent, and Quality of Services Provided. The Board considered Fidelity's staffing as it relates to the fund, including the backgrounds of investment personnel of Fidelity, and also considered the fund's investment objective, strategies, and related investment philosophy. The Independent Trustees also had discussions with senior management of Fidelity's investment operations and investment groups. The Board considered the structure of the investment personnel compensation program and whether this structure provides appropriate incentives to act in the best interests of the fund. Additionally, the Board considered the portfolio managers' investments, if any, in the funds that they manage. The Board also considered the steps Fidelity had taken to ensure the continued provision of high quality services to the Fidelity funds during the COVID-19 pandemic, including the expansion of staff in client facing positions to maintain service levels in periods of high volumes and volatility.
Resources Dedicated to Investment Management and Support Services. The Board reviewed the general qualifications and capabilities of Fidelity's investment staff, including its size, education, experience, and resources, as well as Fidelity's approach to recruiting, training, managing, and compensating investment personnel. The Board noted the resources devoted to Fidelity's global investment organization, and that Fidelity's analysts have extensive resources, tools and capabilities that allow them to conduct sophisticated quantitative and fundamental analysis, as well as credit analysis of issuers, counterparties and guarantors. Further, the Board considered that Fidelity's investment professionals have sufficient access to global information and data so as to provide competitive investment results over time, and that those professionals also have access to sophisticated tools that permit them to assess portfolio construction and risk and performance attribution characteristics continuously, as well as to transmit new information and research conclusions rapidly around the world. Additionally, in its deliberations, the Board considered Fidelity's trading, risk management, compliance, cybersecurity, and technology and operations capabilities and resources, which are integral parts of the investment management process.
Shareholder and Administrative Services. The Board considered (i) the nature, extent, quality, and cost of advisory, administrative, and shareholder services performed by the Investment Advisers and their affiliates under the Advisory Contracts and under separate agreements covering transfer agency and pricing and bookkeeping services for the fund; (ii) the nature and extent of the supervision of third party service providers, principally custodians, subcustodians, and pricing vendors; and (iii) the resources devoted to, and the record of compliance with, the fund's compliance policies and procedures.
The Board noted that the growth of fund assets over time across the complex allows Fidelity to reinvest in the development of services designed to enhance the value and convenience of the Fidelity funds as investment vehicles. These services include 24-hour access to account information and market information over the Internet and through telephone representatives, investor education materials and asset allocation tools. The Board also considered that it reviews customer service metrics such as telephone response times, continuity of services on the website and metrics addressing services at Fidelity Investor Centers.
Investment in a Large Fund Family. The Board considered the benefits to shareholders of investing in a Fidelity fund, including the benefits of investing in a fund that is part of a large family of funds offering a variety of investment disciplines and providing a large variety of mutual fund investor services. The Board noted that Fidelity had taken, or had made recommendations to the Board that resulted in the Fidelity funds taking, a number of actions over the previous year that benefited particular funds, including: (i) continuing to dedicate additional resources to Fidelity's investment research process, which includes meetings with management of issuers of securities in which the funds invest; (ii) continuing efforts to enhance Fidelity's global research capabilities; (iii) launching new funds and ETFs with innovative structures, strategies and pricing and making other enhancements to meet client needs; (iv) launching new share classes of existing funds; (v) eliminating purchase minimums and broadening eligibility requirements for certain funds and share classes; (vi) reducing the holding period for the conversion of Class C shares to Class A shares; (vii) reducing management fees and total expenses for certain target date funds and classes and index funds; (viii) lowering expenses for certain existing funds and classes by implementing or lowering expense caps; (ix) rationalizing product lines and gaining increased efficiencies from fund mergers, liquidations, and share class consolidations; (x) continuing to develop, acquire and implement systems and technology to improve services to the funds and shareholders, strengthen information security, and increase efficiency; and (xi) continuing to implement enhancements to further strengthen Fidelity's product line to increase investors' probability of success in achieving their investment goals, including their retirement income goals.
Investment Performance. The Board considered whether the fund has operated in accordance with its investment objective, as well as its record of compliance with its investment restrictions and its performance history.
The Board took into account discussions that occur at Board meetings throughout the year with representatives of the Investment Advisers about fund investment performance. In this regard the Board noted that as part of regularly scheduled fund reviews and other reports to the Board on fund performance, the Board considers annualized return information for the fund for different time periods, measured against an appropriate securities market index (benchmark index) and an appropriate peer group of funds with similar objectives (peer group). The Board also reviews and considers information about performance attribution. In its evaluation of fund investment performance at meetings throughout the year, the Board gave particular attention to information indicating underperformance of certain Fidelity funds for specific time periods and discussed with the Investment Advisers the reasons for such underperformance.
In addition to reviewing absolute and relative fund performance, the Independent Trustees periodically consider the appropriateness of fund performance metrics in evaluating the results achieved. In general, the Independent Trustees believe that fund performance should be evaluated based on gross performance (before fees and expenses but after transaction costs) compared to appropriate benchmark indices, over appropriate time periods that may include full market cycles, and on net performance (after fees and expenses) compared to appropriate peer groups, as applicable, over the same periods, taking into account relevant factors including the following: general market conditions; expectations for interest rate levels and credit conditions; issuer-specific information including credit quality; the potential for incremental return versus the fund's benchmark index weighed against the risks involved in obtaining that incremental return, including the risk of diminished or negative total returns; and fund cash flows and other factors. The Independent Trustees generally give greater weight to fund performance over longer time periods than over shorter time periods. Depending on the circumstances, the Independent Trustees may be satisfied with a fund's performance notwithstanding that it lags its benchmark index or peer group for certain periods.
The Independent Trustees recognize that shareholders evaluate performance on a net basis over their own holding periods, for which one-, three-, and five-year periods are often used as a proxy. For this reason, the performance information reviewed by the Board also included net cumulative calendar year total return information for the fund and an appropriate benchmark index and peer group for the most recent one-, three-, and five-year periods. The Independent Trustees recognize that shareholders who are not investing through a tax-advantaged retirement account also consider tax consequences in evaluating performance.
Based on its review, the Board concluded that the nature, extent, and quality of services provided to the fund under the Advisory Contracts should continue to benefit the shareholders of the fund.
Competitiveness of Management Fee and Total Expense Ratio. The Board considered the fund's management fee and total expense ratio compared to "mapped groups" of competitive funds and classes created for the purpose of facilitating the Trustees' competitive analysis of management fees and total expenses. Fidelity creates "mapped groups" by combining similar Lipper investment objective categories that have comparable investment mandates. Combining Lipper investment objective categories aids the Board's management fee and total expense ratio comparisons by broadening the competitive group used for comparison.
Management Fee. The Board considered two proprietary management fee comparisons for the 12-month periods shown in basis points (BP) in the chart below. The group of Lipper funds used by the Board for management fee comparisons is referred to below as the "Total Mapped Group" and is broader than the Lipper peer group used by the Board for performance comparisons. The Total Mapped Group comparison focuses on a fund's standing in terms of gross management fees before expense reimbursements or caps relative to the total universe of funds with comparable investment mandates, regardless of whether their management fee structures also are comparable. Funds with comparable investment mandates offer exposure to similar types of securities. Funds with comparable management fee structures have similar management fee contractual arrangements (
e.g., flat rate charged for advisory services, all-inclusive fee rate,
etc.). "TMG %" represents the percentage of funds in the Total Mapped Group that had management fees that were lower than the fund's. For example, a hypothetical TMG % of 20% would mean that 80% of the funds in the Total Mapped Group had higher, and 20% had lower, management fees than the fund. The fund's actual TMG %s and the number of funds in the Total Mapped Group are in the chart below. The "Asset-Sized Peer Group" (ASPG) comparison focuses on a fund's standing relative to a subset of non-Fidelity funds within the Total Mapped Group that are similar in size and management fee structure. For example, if a fund is in the first quartile of the ASPG, the fund's management fee ranks in the least expensive or lowest 25% of funds in the ASPG. The ASPG represents at least 15% of the funds in the Total Mapped Group with comparable asset size and management fee structures, subject to a minimum of 50 funds (or all funds in the Total Mapped Group if fewer than 50). Additional information, such as the ASPG quartile in which the fund's management fee rate ranked, is also included in the chart and was considered by the Board. Because the vast majority of competitor funds' management fees do not cover expenses beyond portfolio management, in prior years, the fund was compared on the basis of a hypothetical "net management fee," which was derived by subtracting payments made by Fidelity for expenses beyond portfolio management (including transfer agent fees, pricing and bookkeeping fees, and fees paid to non-affiliated custodians) from the fund's all-inclusive fee. Given the fund's competitive management fee rate, Fidelity no longer calculates a hypothetical net management fee for the fund and, as a result, the chart does not include hypothetical net management fees for periods after 2016.
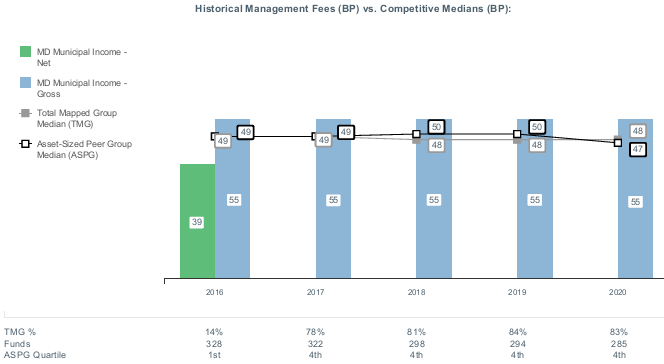
The Board noted that the fund's management fee rate ranked above the median of its Total Mapped Group and above the median of its ASPG for 2020. The Board considered that the fund has an all-inclusive fee that covers expenses beyond portfolio management, unlike the majority of funds within this group. The Board further considered that when compared to the total expenses of its competitors, the fund ranked below its load-type group median.
Based on its review, the Board concluded that the fund's management fee is fair and reasonable in light of the services that the fund receives and the other factors considered.
Total Expense Ratio. In its review of the fund's total expense ratio, the Board considered the fund's all-inclusive fee rate. The Board also considered other expenses, such as transfer agent fees, pricing and bookkeeping fees, and custodial, legal, and audit fees, paid by FMR under the all-inclusive arrangement. The Board also noted that Fidelity may agree to waive fees or reimburse expenses from time to time, and the extent to which, if any, it has done so for the fund. The fund is compared to those funds and classes in the Total Mapped Group (used by the Board for management fee comparisons) that have a similar sales load structure. The Board also considered a total expense ASPG comparison, which focuses on the total expenses of the fund relative to a subset of non-Fidelity funds within the similar sales load structure group. The total expense ASPG is limited to 15 larger and 15 smaller classes of different funds, where possible. The total expense ASPG comparison excludes performance adjustments and fund-paid 12b-1 fees to eliminate variability in expenses relating to these items.
The Board noted that the fund's total expense ratio ranked below the similar sales load structure group competitive median for 2020 and below the ASPG competitive median for 2020.
Fees Charged to Other Fidelity Clients. The Board also considered Fidelity fee structures and other information with respect to clients of Fidelity, such as other funds advised or subadvised by Fidelity, pension plan clients, and other institutional clients with similar mandates. The Board noted that a joint ad hoc committee created by it and the boards of other Fidelity funds periodically reviews and compares Fidelity's institutional investment advisory business with its business of providing services to the Fidelity funds and also noted the most recent findings of the committee. The Board noted that the committee's review included a consideration of the differences in services provided, fees charged, and costs incurred, as well as competition in the markets serving the different categories of clients.
Based on its review of total expense ratios and fees charged to other Fidelity clients, the Board concluded that the fund's total expense ratio was reasonable in light of the services that the fund and its shareholders receive and the other factors considered.
Costs of the Services and Profitability. The Board considered the revenues earned and the expenses incurred by Fidelity in conducting the business of developing, marketing, distributing, managing, administering and servicing the fund and servicing the fund's shareholders. The Board also considered the level of Fidelity's profits in respect of all the Fidelity funds.
On an annual basis, Fidelity presents to the Board information about the profitability of its relationships with the fund. Fidelity calculates profitability information for each fund, as well as aggregate profitability information for groups of Fidelity funds and all Fidelity funds, using a series of detailed revenue and cost allocation methodologies which originate with the books and records of Fidelity on which Fidelity's audited financial statements are based. The Audit Committee of the Board reviews any significant changes from the prior year's methodologies and the full Board approves such changes.
A public accounting firm has been engaged annually by the Board as part of the Board's assessment of Fidelity's profitability analysis. The engagement includes the review and assessment of the methodologies used by Fidelity in determining the revenues and expenses attributable to Fidelity's mutual fund business, and completion of agreed-upon procedures in respect of the mathematical accuracy of certain fund profitability information and its conformity to established allocation methodologies. After considering the reports issued under the engagement and information provided by Fidelity, the Board concluded that while other allocation methods may also be reasonable, Fidelity's profitability methodologies are reasonable in all material respects.
The Board also reviewed Fidelity's non-fund businesses and potential indirect benefits such businesses may have received as a result of their association with Fidelity's mutual fund business (i.e., fall-out benefits) as well as cases where Fidelity's affiliates may benefit from the funds' business. The Board considered areas where potential indirect benefits to the Fidelity funds from their relationships with Fidelity may exist. The Board's consideration of these matters was informed by the findings of a joint ad hoc committee created by it and the boards of other Fidelity funds to evaluate potential fall-out benefits.
The Board considered the costs of the services provided by and the profits realized by Fidelity in connection with the operation of the fund and was satisfied that the profitability was not excessive.
Economies of Scale. The Board considered whether there have been economies of scale in respect of the management of the Fidelity funds, whether the Fidelity funds (including the fund) have appropriately benefited from any such economies of scale, and whether there is potential for realization of any further economies of scale. The Board considered the extent to which the fund will benefit from economies of scale as assets grow through increased services to the fund, through waivers or reimbursements, or through fee or expense ratio reductions. The Board recognized that, due to the fund's current contractual arrangements, its expense ratio will not decline if the fund's operating costs decrease as assets grow, or rise as assets decrease. The Board also noted that a committee (the Economies of Scale Committee) created by it and the boards of other Fidelity funds periodically analyzes whether Fidelity attains economies of scale in respect of the management and servicing of the Fidelity funds, whether the Fidelity funds have appropriately benefited from such economies of scale, and whether there is potential for realization of any further economies of scale.
The Board concluded, taking into account the analysis of the Economies of Scale Committee, that economies of scale, if any, are being appropriately shared between fund shareholders and Fidelity.
Additional Information Requested by the Board. In order to develop fully the factual basis for consideration of the Fidelity funds' advisory contracts, the Board requested and received additional information on certain topics, including: (i) Fidelity's fund profitability methodology, profitability trends for certain funds, the allocation of various costs to different funds, and the impact of certain factors on fund profitability results; (ii) portfolio manager changes that have occurred during the past year and the amount of the investment that each portfolio manager has made in the Fidelity fund(s) that he or she manages; (iii) the extent to which current market conditions have affected retention and recruitment of personnel; (iv) the arrangements with and compensation paid to certain fund sub-advisers on behalf of the Fidelity funds and the treatment of such compensation within Fidelity's fund profitability methodology; (v) the terms of the funds' various management fee structures, including the basic group fee and the terms of Fidelity's voluntary expense limitation arrangements; (vi) Fidelity's transfer agent fee, expense, and service structures for different funds and classes relative to competitive trends; (vii) the impact on fund profitability of recent industry trends, such as the growth in passively managed funds and the continued waiver of money market fund fees; (viii) the types of management fee and total expense comparisons provided, and the challenges and limitations associated with such information; and (ix) explanations regarding the relative total expense ratios of certain funds and classes, total expense competitive trends and methodologies for total expense competitive comparisons. In addition, the Board considered its discussions with Fidelity regarding Fidelity's efforts to maintain the continuous investment and shareholder services necessary for the funds during the current pandemic and economic circumstances.
Based on its evaluation of all of the conclusions noted above, and after considering all factors it believed relevant, the Board concluded that the advisory fee arrangements are fair and reasonable, and that the fund's Advisory Contracts should be renewed.
Liquidity Risk Management Program
The Securities and Exchange Commission adopted Rule 22e-4 under the Investment Company Act of 1940 (the Liquidity Rule) to promote effective liquidity risk management throughout the open-end investment company industry, thereby reducing the risk that funds will be unable to meet their redemption obligations and mitigating dilution of the interests of fund shareholders.
The Fund has adopted and implemented a liquidity risk management program pursuant to the Liquidity Rule (the Program) effective December 1, 2018. The Program is reasonably designed to assess and manage the Fund’s liquidity risk and to comply with the requirements of the Liquidity Rule. The Fund’s Board of Trustees (the Board) has designated the Fund’s investment adviser as administrator of the Program. The Fidelity advisers have established a Liquidity Risk Management Committee (the LRM Committee) to manage the Program for each of the Fidelity Funds. The LRM Committee monitors the adequacy and effectiveness of implementation of the Program and on a periodic basis assesses each Fund’s liquidity risk based on a variety of factors including (1) the Fund’s investment strategy, (2) portfolio liquidity and cash flow projections during normal and reasonably foreseeable stressed conditions, (3) shareholder redemptions, (4) borrowings and other funding sources and (5) in the case of exchange-traded funds, certain additional factors including the effect of the Fund’s prices and spreads, market participants, and basket compositions on the overall liquidity of the Fund’s portfolio, as applicable.
In accordance with the Program, each of the Fund’s portfolio investments is classified into one of four liquidity categories described below based on a determination of a reasonable expectation for how long it would take to convert the investment to cash (or sell or dispose of the investment) without significantly changing its market value.
- Highly liquid investments – cash or convertible to cash within three business days or less
- Moderately liquid investments – convertible to cash in three to seven calendar days
- Less liquid investments – can be sold or disposed of, but not settled, within seven calendar days
- Illiquid investments – cannot be sold or disposed of within seven calendar days
Liquidity classification determinations take into account a variety of factors including various market, trading and investment-specific considerations, as well as market depth, and generally utilize analysis from a third-party liquidity metrics service.
The Liquidity Rule places a 15% limit on a fund’s illiquid investments and requires funds that do not primarily hold assets that are highly liquid investments to determine and maintain a minimum percentage of the fund’s net assets to be invested in highly liquid investments (highly liquid investment minimum or HLIM). The Program includes provisions reasonably designed to comply with the 15% limit on illiquid investments and for determining, periodically reviewing and complying with the HLIM requirement as applicable.
At a recent meeting of the Fund’s Board of Trustees, the LRM Committee provided a written report to the Board pertaining to the operation, adequacy, and effectiveness of implementation of the Program for the annual period from December 1, 2020 through November 30, 2021. The report concluded that the Program has been implemented and is operating effectively and is reasonably designed to assess and manage the Fund’s liquidity risk.

SMD-SANN-0422
1.701070.124
Fidelity® Arizona Municipal Income Fund
Fidelity® Arizona Municipal Money Market Fund
Semi-Annual Report
February 28, 2022
Contents
To view a fund's proxy voting guidelines and proxy voting record for the 12-month period ended June 30, visit http://www.fidelity.com/proxyvotingresults or visit the Securities and Exchange Commission's (SEC) web site at http://www.sec.gov.
You may also call 1-800-544-8544 to request a free copy of the proxy voting guidelines.
Standard & Poor's, S&P and S&P 500 are registered service marks of The McGraw-Hill Companies, Inc. and have been licensed for use by Fidelity Distributors Corporation.
Other third-party marks appearing herein are the property of their respective owners.
All other marks appearing herein are registered or unregistered trademarks or service marks of FMR LLC or an affiliated company. © 2022 FMR LLC. All rights reserved.
This report and the financial statements contained herein are submitted for the general information of the shareholders of the Funds. This report is not authorized for distribution to prospective investors in the Funds unless preceded or accompanied by an effective prospectus.
A fund files its complete schedule of portfolio holdings with the SEC for the first and third quarters of each fiscal year on Form N-PORT. Forms N-PORT are available on the SEC’s web site at http://www.sec.gov. A fund's Forms N-PORT may be reviewed and copied at the SEC’s Public Reference Room in Washington, DC. Information regarding the operation of the SEC's Public Reference Room may be obtained by calling 1-800-SEC-0330.
For a complete list of a fund's portfolio holdings, view the most recent holdings listing, semiannual report, or annual report on Fidelity's web site at http://www.fidelity.com, http://www.institutional.fidelity.com, or http://www.401k.com, as applicable.
NOT FDIC INSURED •MAY LOSE VALUE •NO BANK GUARANTEE
Neither the Funds nor Fidelity Distributors Corporation is a bank.
Note to Shareholders:
Early in 2020, the outbreak and spread of COVID-19 emerged as a public health emergency that had a major influence on financial markets, primarily based on its impact on the global economy and corporate earnings. On March 11, 2020, the World Health Organization declared the COVID-19 outbreak a pandemic, citing sustained risk of further global spread. The pandemic prompted a number of measures to limit the spread of COVID-19, including travel and border restrictions, quarantines, and restrictions on large gatherings. In turn, these resulted in lower consumer activity, diminished demand for a wide range of products and services, disruption in manufacturing and supply chains, and – given the wide variability in outcomes regarding the outbreak – significant market uncertainty and volatility. To help stem the turmoil, the U.S. government took unprecedented action – in concert with the U.S. Federal Reserve and central banks around the world – to help support consumers, businesses, and the broader economy, and to limit disruption to the financial system.
In general, the overall impact of the pandemic lessened in 2021, amid a resilient economy and widespread distribution of three COVID-19 vaccines granted emergency use authorization from the U.S. Food and Drug Administration (FDA) early in the year. Still, the situation remains dynamic, and the extent and duration of its influence on financial markets and the economy is highly uncertain, due in part to a recent spike in cases based on highly contagious variants of the coronavirus.
Extreme events such as the COVID-19 crisis are exogenous shocks that can have significant adverse effects on mutual funds and their investments. Although multiple asset classes may be affected by market disruption, the duration and impact may not be the same for all types of assets. Fidelity is committed to helping you stay informed amid news about COVID-19 and during increased market volatility, and we continue to take extra steps to be responsive to customer needs. We encourage you to visit us online, where we offer ongoing updates, commentary, and analysis on the markets and our funds.
Fidelity® Arizona Municipal Income Fund
Investment Summary (Unaudited)
Top Five Sectors as of February 28, 2022
| | % of fund's net assets |
| Education | 25.2 |
| Health Care | 22.6 |
| General Obligations | 15.0 |
| Transportation | 11.4 |
| Water & Sewer | 8.0 |
Quality Diversification (% of fund's net assets)
| As of February 28, 2022 |
| | AAA | 1.3% |
| | AA,A | 93.1% |
| | BBB | 2.0% |
| | Not Rated | 2.1% |
| | Short-Term Investments and Net Other Assets | 1.5% |

We have used ratings from Moody's Investors Service, Inc. Where Moody's® ratings are not available, we have used S&P® ratings. All ratings are as of the date indicated and do not reflect subsequent changes.
Fidelity® Arizona Municipal Income Fund
Schedule of Investments February 28, 2022 (Unaudited)
Showing Percentage of Net Assets
| Municipal Bonds - 98.5% | | | |
| | | Principal Amount | Value |
| Arizona - 98.3% | | | |
| Arizona Board of Regents Arizona State Univ. Rev.: | | | |
| Series 2015 A, 5% 7/1/35 | | $2,215,000 | $2,469,392 |
| Series 2015 B, 5% 7/1/31 | | 1,525,000 | 1,703,842 |
| Series 2015 D: | | | |
| 5% 7/1/34 | | 500,000 | 557,425 |
| 5% 7/1/35 | | 900,000 | 1,003,365 |
| 5% 7/1/41 | | 525,000 | 584,389 |
| Arizona Ctfs. of Prtn.: | | | |
| Series 2013 A, 5% 10/1/25 | | 1,870,000 | 1,914,921 |
| Series 2015, 5% 9/1/27 | | 1,500,000 | 1,675,738 |
| Arizona Game and Fish Dept. and Commission (AGF Administration Bldg. Proj.) Series 2006, 5% 7/1/32 | | 470,000 | 471,688 |
| Arizona Health Facilities Auth. Rev.: | | | |
| (Banner Health Sys. Proj.) Series 2007 B, 3 month U.S. LIBOR + 0.810% 0.954%, tender 1/1/37 (a)(b) | | 1,000,000 | 970,629 |
| (Scottsdale Lincoln Hospitals Proj.) Series 2014 A: | | | |
| 5% 12/1/26 | | 2,000,000 | 2,195,789 |
| 5% 12/1/42 | | 2,325,000 | 2,530,880 |
| Arizona Indl. Dev. Auth. Hosp. Rev.: | | | |
| Series 2020 A: | | | |
| 4% 2/1/50 | | 2,005,000 | 2,189,310 |
| 5% 2/1/40 | | 700,000 | 841,526 |
| Series 2021 A: | | | |
| 4% 2/1/39 | | 500,000 | 568,351 |
| 4% 2/1/40 | | 1,000,000 | 1,132,673 |
| Arizona Indl. Dev. Auth. Lease Rev. Series 2020 A: | | | |
| 4% 9/1/35 | | 200,000 | 228,014 |
| 4% 9/1/36 | | 355,000 | 404,591 |
| 4% 9/1/46 | | 1,000,000 | 1,110,867 |
| Arizona State Trans. Board: | | | |
| Series 2017 A, 5% 7/1/32 | | 1,500,000 | 1,751,747 |
| Series 2017A, 5% 7/1/31 | | 385,000 | 450,472 |
| Arizona State Univ. Revs.: | | | |
| Series 2019 A, 5% 7/1/43 | | 1,000,000 | 1,210,288 |
| Series 2020 A: | | | |
| 4% 7/1/40 | | 1,300,000 | 1,479,115 |
| 5% 7/1/39 | | 390,000 | 480,061 |
| 5% 7/1/43 | | 2,925,000 | 3,574,703 |
| Series 2021 C, 5% 7/1/41 | | 1,000,000 | 1,251,062 |
| Buckeye Excise Tax Rev. Series 2015: | | | |
| 5% 7/1/27 | | 350,000 | 390,924 |
| 5% 7/1/28 | | 500,000 | 557,425 |
| 5% 7/1/29 | | 455,000 | 507,257 |
| Central Wtr. Conservation District (Central Arizona Proj.) Series 2016 A, 5% 1/1/36 | | 500,000 | 558,594 |
| Chandler Indl. Dev. Auth. Indl. Dev. Rev. Bonds (Intel Corp. Proj.): | | | |
| Series 2007, 2.7%, tender 8/14/23 (a)(c) | | 2,000,000 | 2,043,103 |
| Series 2019, 5%, tender 6/3/24 (a)(c) | | 3,700,000 | 3,979,923 |
| Dysart Unified School District #89 Gen. Oblig. Series 2014, 5% 7/1/27 | | 1,300,000 | 1,403,946 |
| Glendale Union School District 205 Series A: | | | |
| 4% 7/1/38 (Assured Guaranty Muni. Corp. Insured) | | 1,000,000 | 1,164,485 |
| 4% 7/1/39 (Assured Guaranty Muni. Corp. Insured) | | 1,000,000 | 1,162,129 |
| Glendale Gen. Oblig. Series 2017: | | | |
| 5% 7/1/30 | | 2,310,000 | 2,702,831 |
| 5% 7/1/32 | | 1,000,000 | 1,163,950 |
| Glendale Indl. dev auth Sr Living Facilities Rev. (Royal Oaks Inspirata Pointe Proj.) Series 2020 A, 5% 5/15/56 | | 1,000,000 | 1,088,984 |
| Glendale Indl. Dev. Auth. (Terraces of Phoenix Proj.) Series 2018 A: | | | |
| 4% 7/1/28 | | 265,000 | 269,389 |
| 5% 7/1/33 | | 435,000 | 455,461 |
| Glendale Sr. Excise Tax Rev. Series 2015 A, 5% 7/1/28 | | 1,000,000 | 1,111,398 |
| Goodyear Pub. Impt. Corp. Facilities Rev. Series 2016 A, 5% 7/1/29 | | 1,000,000 | 1,144,913 |
| Maricopa County Indl. Dev. Auth.: | | | |
| (Creighton Univ. Proj.) Series 2020, 5% 7/1/47 | | 2,000,000 | 2,356,937 |
| Series 2019 A: | | | |
| 5% 9/1/29 | | 310,000 | 373,737 |
| 5% 9/1/33 | | 275,000 | 328,986 |
| 5% 9/1/34 | | 680,000 | 812,829 |
| 5% 9/1/35 | | 395,000 | 471,780 |
| Series 2021 A, 4% 9/1/51 | | 1,500,000 | 1,666,027 |
| Maricopa County Indl. Dev. Auth. Sr. Living Facilities Series 2016: | | | |
| 5.75% 1/1/36 (d) | | 500,000 | 453,776 |
| 6% 1/1/48 (d) | | 500,000 | 440,054 |
| Maricopa County Phoenix Union High School District #210 Series 2017 B: | | | |
| 5% 7/1/32 | | 1,180,000 | 1,411,943 |
| 5% 7/1/34 | | 585,000 | 698,911 |
| Maricopa County Rev.: | | | |
| Bonds: | | | |
| Series 2019 D, 5%, tender 5/15/26 (a) | | 200,000 | 226,732 |
| Series C, 5%, tender 10/18/24 (a) | | 125,000 | 136,314 |
| Series 2016 A: | | | |
| 4% 1/1/24 | | 255,000 | 267,717 |
| 5% 1/1/23 | | 40,000 | 41,360 |
| 5% 1/1/24 | | 275,000 | 293,676 |
| 5% 1/1/25 | | 105,000 | 115,221 |
| 5% 1/1/34 | | 2,935,000 | 3,373,924 |
| 5% 1/1/38 | | 2,205,000 | 2,525,946 |
| Series 2019 F, 4% 1/1/45 | | 1,000,000 | 1,109,472 |
| Maricopa County School District #214 Tolleson Series 2018 A, 5% 7/1/31 | | 350,000 | 409,520 |
| Maricopa County School District #28 Kyrene Elementary: | | | |
| Series 2015 C, 4% 7/1/29 | | 650,000 | 701,173 |
| Series 2019 A, 5% 7/1/37 | | 1,000,000 | 1,195,423 |
| Maricopa County Spl. Health Care District Gen. Oblig. Series 2018 C, 5% 7/1/36 | | 1,000,000 | 1,189,531 |
| Maricopa County Unified School District #48 Scottsdale: | | | |
| Series 2017 B, 5% 7/1/33 | | 3,015,000 | 3,526,042 |
| Series D, 4% 7/1/34 | | 350,000 | 405,555 |
| McAllister Academic Village LLC Rev.: | | | |
| (Arizona State Univ. Hassayampa Academic Village Proj.) Series 2016: | | | |
| 5% 7/1/37 | | 2,000,000 | 2,279,006 |
| 5% 7/1/38 | | 3,850,000 | 4,381,899 |
| Series 2016, 5% 7/1/39 | | 2,270,000 | 2,581,576 |
| Mesa Util. Sys. Rev.: | | | |
| Series 2019 A, 5% 7/1/43 | | 2,015,000 | 2,420,413 |
| Series 2021, 5% 7/1/45 | | 1,000,000 | 1,241,312 |
| Northern Arizona Univ. Ctfs. of Prtn. (Univ. Proj.) Series 2013, 5% 9/1/24 | | 1,000,000 | 1,016,812 |
| Northern Arizona Univ. Revs.: | | | |
| Series 2013, 5% 8/1/27 | | 1,000,000 | 1,044,027 |
| Series 2014, 5% 6/1/29 | | 500,000 | 535,906 |
| Series 2015, 5% 6/1/30 | | 1,000,000 | 1,102,177 |
| Series 2020 B, 5% 6/1/37 (Build America Mutual Assurance Insured) | | 1,000,000 | 1,223,826 |
| Phoenix Civic Impt. Board Arpt. Rev.: | | | |
| Series 2013: | | | |
| 5% 7/1/26 (c) | | 1,100,000 | 1,153,628 |
| 5% 7/1/29 (c) | | 500,000 | 522,679 |
| Series 2015 A, 5% 7/1/45 | | 4,100,000 | 4,531,391 |
| Series 2017 A: | | | |
| 5% 7/1/33 (c) | | 25,000 | 28,700 |
| 5% 7/1/35 (c) | | 2,425,000 | 2,784,059 |
| 5% 7/1/42 (c) | | 2,000,000 | 2,297,553 |
| Series 2017 D, 5% 7/1/31 | | 2,000,000 | 2,334,432 |
| Series 2019 A, 5% 7/1/49 | | 2,220,000 | 2,613,612 |
| Phoenix Civic Impt. Corp. Series 2019 A: | | | |
| 5% 7/1/29 | | 185,000 | 221,552 |
| 5% 7/1/35 | | 1,000,000 | 1,188,367 |
| Phoenix Civic Impt. Corp. District Rev. (Plaza Expansion Proj.) Series 2005 B, 5.5% 7/1/38 (Nat'l. Pub. Fin. Guarantee Corp. Insured) | | 2,000,000 | 2,799,175 |
| Phoenix Civic Impt. Corp. Wastewtr. Sys. Rev. Series 2016, 5% 7/1/33 | | 1,000,000 | 1,138,156 |
| Phoenix Civic Impt. Corp. Wtr. Sys. Rev.: | | | |
| Series 2020 A, 5% 7/1/44 | | 1,000,000 | 1,218,359 |
| Series 2021 A, 5% 7/1/45 | | 3,730,000 | 4,622,968 |
| Phoenix Gen. Oblig. Series 2014, 4% 7/1/26 | | 2,000,000 | 2,120,439 |
| Phoenix IDA Student Hsg. Rev.: | | | |
| (Downtown Phoenix Student Hsg. II LLC Arizona State Univ. Proj.) Series 2019 A, 5% 7/1/36 | | 1,175,000 | 1,355,292 |
| Series 2018 A, (Downtown Phoenix Student Hsg., LLC AZ State Univ. Proj.) 5% 7/1/42 | | 1,500,000 | 1,694,811 |
| Phoenix-Mesa Gateway Arpt. Auth. (Mesa Proj.) Series 2012: | | | |
| 5% 7/1/24 (c) | | 380,000 | 385,251 |
| 5% 7/1/27 (c) | | 400,000 | 405,258 |
| Pima County Ctfs. of Prtn. Series 2014, 5% 12/1/27 | | 1,745,000 | 1,858,923 |
| Pima County Indl. Dev. Auth. Rev. Series 2021 A, 4% 4/1/46 | | 2,000,000 | 2,231,812 |
| Pima County Swr. Sys. Rev. Series 2012 A: | | | |
| 5% 7/1/23 (Pre-Refunded to 7/1/22 @ 100) | | 30,000 | 30,432 |
| 5% 7/1/25 | | 1,600,000 | 1,624,593 |
| Salt River Proj. Agricultural Impt. & Pwr. District Elec. Sys. Rev.: | | | |
| Series 2015 A, 5% 12/1/34 | | 1,600,000 | 1,777,415 |
| Series A, 5% 1/1/37 | | 520,000 | 637,716 |
| Salt Verde Finl. Corp. Sr. Gas Rev. Series 2007: | | | |
| 5% 12/1/37 | | 2,910,000 | 3,704,589 |
| 5.5% 12/1/29 | | 3,000,000 | 3,650,215 |
| Scottsdale Gen. Oblig. Series 2017, 4% 7/1/32 | | 400,000 | 445,748 |
| Tempe Excise Tax Rev. Series 2016: | | | |
| 5% 7/1/28 | | 315,000 | 361,218 |
| 5% 7/1/29 | | 500,000 | 571,779 |
| 5% 7/1/30 | | 325,000 | 370,923 |
| 5% 7/1/31 | | 375,000 | 427,820 |
| Tempe Indl. Dev. Auth. Rev. (Friendship Village of Tempe Proj.) Series 2021 A, 4% 12/1/46 | | 500,000 | 515,881 |
| Tucson Ctfs. of Prtn. Series 2016, 5% 7/1/27 (Assured Guaranty Muni. Corp. Insured) | | 1,245,000 | 1,416,445 |
| Tucson Wtr. Rev. Series 2017, 5% 7/1/34 | | 1,000,000 | 1,162,290 |
| Univ. of Arizona Univ. Revs.: | | | |
| Series 2014, 5% 8/1/28 | | 1,000,000 | 1,085,551 |
| Series 2015 A 5% 6/1/30 | | 2,500,000 | 2,786,483 |
| Series 2016, 5% 6/1/38 | | 1,000,000 | 1,137,557 |
| Series 2019 A, 5% 6/1/41 | | 1,965,000 | 2,370,794 |
| Series 2020 C: | | | |
| 5% 8/1/24 | | 800,000 | 872,236 |
| 5% 8/1/26 | | 800,000 | 922,356 |
| 5% 8/1/28 | | 900,000 | 1,084,140 |
| Western Maricopa Ed. Ctr. District Series 2019 B: | | | |
| 5% 7/1/27 | | 1,000,000 | 1,176,762 |
| 5% 7/1/28 | | 1,315,000 | 1,582,121 |
| Yavapai County Indl. Dev. Auth.: | | | |
| Series 2012 A, 5.25% 8/1/33 | | 2,000,000 | 2,109,857 |
| Series 2016, 5% 8/1/36 | | 1,305,000 | 1,478,846 |
| Series 2019: | | | |
| 4% 8/1/43 | | 350,000 | 384,536 |
| 5% 8/1/24 | | 325,000 | 352,723 |
| 5% 8/1/25 | | 400,000 | 446,558 |
| 5% 8/1/26 | | 600,000 | 687,610 |
| 5% 8/1/27 | | 625,000 | 732,640 |
| 5% 8/1/39 | | 1,060,000 | 1,270,885 |
| Yuma Indl. Dev. Auth. Hosp. Rev. Series 2014 A, 5% 8/1/27 | | 2,000,000 | 2,165,632 |
|
| TOTAL ARIZONA | | | 171,665,858 |
|
| Guam - 0.0% | | | |
| Guam Int'l. Arpt. Auth. Rev. Series 2013 C, 6.375% 10/1/43 (c) | | 95,000 | 101,047 |
| Puerto Rico - 0.2% | | | |
| Puerto Rico Indl., Tourist, Edl., Med. And Envir. Cont. Facilities Fing. Auth. Series 2021: | | | |
| 4% 7/1/41 | | 50,000 | 54,714 |
| 5% 7/1/27 | | 125,000 | 143,913 |
| 5% 7/1/32 | | 95,000 | 115,533 |
|
| TOTAL PUERTO RICO | | | 314,160 |
|
| TOTAL MUNICIPAL BONDS | | | |
| (Cost $167,417,725) | | | 172,081,065 |
| TOTAL INVESTMENT IN SECURITIES - 98.5% | | | |
| (Cost $167,417,725) | | | 172,081,065 |
| NET OTHER ASSETS (LIABILITIES) - 1.5% | | | 2,589,476 |
| NET ASSETS - 100% | | | $174,670,541 |
Legend
(a) Coupon rates for floating and adjustable rate securities reflect the rates in effect at period end.
(b) Coupon is indexed to a floating interest rate which may be multiplied by a specified factor and/or subject to caps or floors.
(c) Private activity obligations whose interest is subject to the federal alternative minimum tax for individuals.
(d) Security exempt from registration under Rule 144A of the Securities Act of 1933. These securities may be resold in transactions exempt from registration, normally to qualified institutional buyers. At the end of the period, the value of these securities amounted to $893,830 or 0.5% of net assets.
Investment Valuation
The following is a summary of the inputs used, as of February 28, 2022, involving the Fund's assets and liabilities carried at fair value. The inputs or methodology used for valuing securities may not be an indication of the risk associated with investing in those securities. For more information on valuation inputs, and their aggregation into the levels used below, please refer to the Investment Valuation section in the accompanying Notes to Financial Statements.
| | Valuation Inputs at Reporting Date: |
| Description | Total | Level 1 | Level 2 | Level 3 |
| Investments in Securities: | | | | |
| Municipal Securities | $172,081,065 | $-- | $172,081,065 | $-- |
| Total Investments in Securities: | $172,081,065 | $-- | $172,081,065 | $-- |
Other Information
The distribution of municipal securities by revenue source, as a percentage of total Net Assets, is as follows (Unaudited):
| Education | 25.2% |
| Health Care | 22.6% |
| General Obligations | 15.0% |
| Transportation | 11.4% |
| Water & Sewer | 8.0% |
| Special Tax | 7.2% |
| Others* (Individually Less Than 5%) | 10.6% |
| | 100.0% |
* Includes net other assets
See accompanying notes which are an integral part of the financial statements.
Fidelity® Arizona Municipal Income Fund
Financial Statements
Statement of Assets and Liabilities
| | | February 28, 2022 (Unaudited) |
| Assets | | |
Investment in securities, at value — See accompanying schedule:
Unaffiliated issuers (cost $167,417,725) | | $172,081,065 |
| Cash | | 2,018,692 |
| Receivable for fund shares sold | | 21,586 |
| Interest receivable | | 1,390,873 |
| Other receivables | | 2,080 |
| Total assets | | 175,514,296 |
| Liabilities | | |
| Payable for fund shares redeemed | $661,459 | |
| Distributions payable | 99,899 | |
| Accrued management fee | 82,397 | |
| Total liabilities | | 843,755 |
| Net Assets | | $174,670,541 |
| Net Assets consist of: | | |
| Paid in capital | | $169,717,419 |
| Total accumulated earnings (loss) | | 4,953,122 |
| Net Assets | | $174,670,541 |
| Net Asset Value, offering price and redemption price per share ($174,670,541 ÷ 14,486,058 shares) | | $12.06 |
See accompanying notes which are an integral part of the financial statements.
Statement of Operations
| | | Six months ended February 28, 2022 (Unaudited) |
| Investment Income | | |
| Interest | | $2,331,592 |
| Expenses | | |
| Management fee | $518,335 | |
| Independent trustees' fees and expenses | 323 | |
| Total expenses before reductions | 518,658 | |
| Expense reductions | (2,519) | |
| Total expenses after reductions | | 516,139 |
| Net investment income (loss) | | 1,815,453 |
| Realized and Unrealized Gain (Loss) | | |
| Net realized gain (loss) on: | | |
| Investment securities: | | |
| Unaffiliated issuers | | 270,365 |
| Total net realized gain (loss) | | 270,365 |
| Change in net unrealized appreciation (depreciation) on investment securities | | (8,350,461) |
| Net gain (loss) | | (8,080,096) |
| Net increase (decrease) in net assets resulting from operations | | $(6,264,643) |
See accompanying notes which are an integral part of the financial statements.
Statement of Changes in Net Assets
| | Six months ended February 28, 2022 (Unaudited) | Year ended August 31, 2021 |
| Increase (Decrease) in Net Assets | | |
| Operations | | |
| Net investment income (loss) | $1,815,453 | $3,813,140 |
| Net realized gain (loss) | 270,365 | 603,142 |
| Change in net unrealized appreciation (depreciation) | (8,350,461) | 1,509,583 |
| Net increase (decrease) in net assets resulting from operations | (6,264,643) | 5,925,865 |
| Distributions to shareholders | (2,459,818) | (4,496,086) |
| Share transactions | | |
| Proceeds from sales of shares | 16,997,352 | 35,061,844 |
| Reinvestment of distributions | 1,566,547 | 2,813,122 |
| Cost of shares redeemed | (25,182,875) | (28,166,131) |
| Net increase (decrease) in net assets resulting from share transactions | (6,618,976) | 9,708,835 |
| Total increase (decrease) in net assets | (15,343,437) | 11,138,614 |
| Net Assets | | |
| Beginning of period | 190,013,978 | 178,875,364 |
| End of period | $174,670,541 | $190,013,978 |
| Other Information | | |
| Shares | | |
| Sold | 1,361,936 | 2,787,014 |
| Issued in reinvestment of distributions | 126,445 | 224,116 |
| Redeemed | (2,046,221) | (2,239,628) |
| Net increase (decrease) | (557,840) | 771,502 |
See accompanying notes which are an integral part of the financial statements.
Financial Highlights
Fidelity Arizona Municipal Income Fund
| | Six months ended (Unaudited) February 28, | Years endedAugust 31, | | | | |
| | 2022 | 2021 | 2020 | 2019 | 2018 | 2017 |
| Selected Per–Share Data | | | | | | |
| Net asset value, beginning of period | $12.63 | $12.53 | $12.52 | $11.82 | $12.21 | $12.50 |
| Income from Investment Operations | | | | | | |
| Net investment income (loss)A,B | .119 | .257 | .277 | .298 | .300 | .311 |
| Net realized and unrealized gain (loss) | (.528) | .148 | .009 | .698 | (.309) | (.267) |
| Total from investment operations | (.409) | .405 | .286 | .996 | (.009) | .044 |
| Distributions from net investment income | (.119) | (.257) | (.276) | (.296) | (.300) | (.310) |
| Distributions from net realized gain | (.042) | (.048) | – | – | (.081) | (.024) |
| Total distributions | (.161) | (.305) | (.276) | (.296) | (.381) | (.334) |
| Redemption fees added to paid in capitalA | – | – | – | – | – | –C |
| Net asset value, end of period | $12.06 | $12.63 | $12.53 | $12.52 | $11.82 | $12.21 |
| Total ReturnD,E | (3.26)% | 3.27% | 2.33% | 8.56% | (.05)% | .43% |
| Ratios to Average Net AssetsB,F,G | | | | | | |
| Expenses before reductions | .55%H | .55% | .55% | .55% | .55% | .55% |
| Expenses net of fee waivers, if any | .55%H | .55% | .55% | .55% | .55% | .55% |
| Expenses net of all reductions | .55%H | .55% | .55% | .55% | .55% | .55% |
| Net investment income (loss) | 1.94%H | 2.04% | 2.23% | 2.49% | 2.52% | 2.58% |
| Supplemental Data | | | | | | |
| Net assets, end of period (000 omitted) | $174,671 | $190,014 | $178,875 | $180,860 | $170,557 | $181,740 |
| Portfolio turnover rateI | 7%H | 8% | 17% | 13% | 12% | 18% |
A Calculated based on average shares outstanding during the period.
B Net investment income (loss) is affected by the timing of the declaration of dividends by any underlying mutual funds or exchange-traded funds (ETFs). Net investment income (loss) of any such underlying funds is not included in the Fund's net investment income (loss) ratio.
C Amount represents less than $.0005 per share.
D Total returns for periods of less than one year are not annualized.
E Total returns would have been lower if certain expenses had not been reduced during the applicable periods shown.
F Fees and expenses of any underlying mutual funds or exchange-traded funds (ETFs) are not included in the Fund's expense ratio. The Fund indirectly bears its proportionate share of these expenses.
G Expense ratios reflect operating expenses of the class. Expenses before reductions do not reflect amounts reimbursed, waived, or reduced through arrangements with the investment adviser, brokerage services, or other offset arrangements, if applicable, and do not represent the amount paid by the class during periods when reimbursements, waivers or reductions occur.
H Annualized
I Amount does not include the portfolio activity of any underlying mutual funds or exchange-traded funds (ETFs).
See accompanying notes which are an integral part of the financial statements.
Fidelity® Arizona Municipal Money Market Fund
Investment Summary/Performance (Unaudited)
Effective Maturity Diversification as of February 28, 2022
| Days | % of fund's investments 2/28/22 |
| 1 - 7 | 79.3 |
| 31 - 60 | 0.6 |
| 91 - 180 | 19.7 |
| > 180 | 0.4 |
Effective maturity is determined in accordance with the requirements of Rule 2a-7 under the Investment Company Act of 1940.
Asset Allocation (% of fund's net assets)
| As of February 28, 2022 |
| | Variable Rate Demand Notes (VRDNs) | 22.0% |
| | Tender Option Bond | 42.5% |
| | Other Municipal Security | 24.6% |
| | Investment Companies | 9.8% |
| | Net Other Assets (Liabilities) | 1.1% |

Current 7-Day Yields
| | 2/28/22 |
| Fidelity® Arizona Municipal Money Market Fund | 0.01% |
Yield refers to the income paid by the Fund over a given period. Yield for money market funds is usually for seven-day periods, as it is here, though it is expressed as an annual percentage rate. Past performance is no guarantee of future results. Yield will vary and it's possible to lose money investing in the Fund. A portion of the Fund's expenses was reimbursed and/or waived. Absent such reimbursements and/or waivers the yield for the period ending February 28, 2022, the most recent period shown in the table, would have been -.34%.
Fidelity® Arizona Municipal Money Market Fund
Schedule of Investments February 28, 2022 (Unaudited)
Showing Percentage of Net Assets
| Variable Rate Demand Note - 22.0% | | | |
| | | Principal Amount | Value |
| Alabama - 0.4% | | | |
| Decatur Indl. Dev. Board Exempt Facilities Rev. (Nucor Steel Decatur LLC Proj.) Series 2003 A, 0.31% 3/7/22, VRDN (a)(b) | | $300,000 | $300,000 |
| Arizona - 20.5% | | | |
| Arizona Board of Regents Arizona State Univ. Rev.: | | | |
| Series 2008 A, 0.19% 3/7/22, VRDN (a) | | 1,400,000 | 1,400,000 |
| Series 2008 B, 0.18% 3/7/22, VRDN (a) | | 1,600,000 | 1,600,000 |
| Arizona Health Facilities Auth. Rev. Series 2015 C, 0.06% 3/1/22, LOC Bank of America NA, VRDN (a) | | 320,000 | 320,000 |
| Arizona Indl. Dev. Auth. Hosp. Rev. Series 2019 A, 0.06% 3/1/22, LOC JPMorgan Chase Bank, VRDN (a) | | 225,000 | 225,000 |
| Maricopa County Indl. Dev. Auth. Rev. (Clayton Homes, Inc. Proj.) Series 1998, 0.21% 3/7/22, LOC U.S. Bank NA, Cincinnati, VRDN (a)(b) | | 2,600,000 | 2,600,000 |
| Maricopa County Poll. Cont. Rev. (Arizona Pub. Svc. Co. Palo Verde Proj.) Series 2009 A, 0.3% 3/7/22, VRDN (a) | | 1,300,000 | 1,300,000 |
| Tempe Indl. Dev. Auth. Rev. (ASUF Brickyard Proj.) Series 2004 A, 0.23% 3/7/22, LOC Bank of America NA, VRDN (a) | | 200,000 | 200,000 |
| FNMA: | | | |
| Maricopa County Indl. Dev. Auth. Multi-family Hsg. Rev. (Village Square Apts. Proj.) Series 2004, 0.1% 3/7/22, LOC Fannie Mae, VRDN (a)(b) | | 3,400,000 | 3,400,000 |
| Pima County Indl. Dev. Auth. Multi-family Hsg. Rev. Series A, 0.26% 3/7/22, LOC Fannie Mae, VRDN (a)(b) | | 2,765,000 | 2,765,000 |
| | | | 13,810,000 |
| Arkansas - 0.2% | | | |
| Blytheville Indl. Dev. Rev. (Nucor Corp. Proj.) Series 1998, 0.31% 3/7/22, VRDN (a)(b) | | 100,000 | 100,000 |
| Kansas - 0.4% | | | |
| Burlington Envir. Impt. Rev. (Kansas City Pwr. and Lt. Co. Proj.) Series 2007 B, 0.3% 3/7/22, VRDN (a) | | 100,000 | 100,000 |
| St. Mary's Kansas Poll. Cont. Rev. (Kansas Gas and Elec. Co. Proj.) Series 1994, 0.27% 3/7/22, VRDN (a) | | 200,000 | 200,000 |
| | | | 300,000 |
| Louisiana - 0.2% | | | |
| Saint James Parish Gen. Oblig. (Nucor Steel Louisiana LLC Proj.) Series 2010 B1, 0.26% 3/7/22, VRDN (a) | | 100,000 | 100,000 |
| Nebraska - 0.2% | | | |
| Stanton County Indl. Dev. Rev. (Nucor Corp. Proj.) Series 1996, 0.31% 3/7/22, VRDN (a)(b) | | 100,000 | 100,000 |
| West Virginia - 0.1% | | | |
| West Virginia Econ. Dev. Auth. Solid Waste Disp. Facilities Rev. (Appalachian Pwr. Co.- Mountaineer Proj.) Series 2008 A, 0.27% 3/7/22, VRDN (a)(b) | | 100,000 | 100,000 |
| TOTAL VARIABLE RATE DEMAND NOTE | | | |
| (Cost $14,810,000) | | | 14,810,000 |
|
| Tender Option Bond - 42.5% | | | |
| Arizona - 41.2% | | | |
| Arizona Indl. Dev. Auth. Hosp. Rev. Participating VRDN Series 20 XF 09 90, 0.25% 3/7/22 (Liquidity Facility Toronto-Dominion Bank) (a)(c)(d) | | 3,300,000 | 3,300,000 |
| Arizona Tourism & Sports Auth. Tax Rev. Participating VRDN Series Floaters E85, 0.23% 3/7/22 (Liquidity Facility Royal Bank of Canada) (a)(c)(d) | | 2,920,000 | 2,920,000 |
| Maricopa County Indl. Dev. Auth. Participating VRDN Series E 147, 0.23% 3/7/22 (Liquidity Facility Royal Bank of Canada) (a)(c)(d) | | 7,500,000 | 7,500,003 |
| Maricopa County Rev. Participating VRDN: | | | |
| Series XL 01 52, 0.23% 3/7/22 (Liquidity Facility JPMorgan Chase Bank) (a)(c)(d) | | 1,000,000 | 1,000,000 |
| Series ZF 12 05, 0.23% 3/7/22 (Liquidity Facility JPMorgan Chase Bank) (a)(c)(d) | | 1,665,000 | 1,665,000 |
| Mesa Util. Sys. Rev. Participating VRDN Series Solar 17 0026, 0.25% 3/7/22 (Liquidity Facility U.S. Bank NA, Cincinnati) (a)(c)(d) | | 4,400,000 | 4,400,000 |
| Phoenix Civic Impt. Board Arpt. Rev. Participating VRDN: | | | |
| Series Floaters ZF 27 58, 0.26% 3/7/22 (Liquidity Facility Barclays Bank PLC) (a)(b)(c)(d) | | 2,100,000 | 2,100,000 |
| Series XF 08 46, 0.23% 3/7/22 (Liquidity Facility Toronto-Dominion Bank) (a)(b)(c)(d) | | 800,000 | 800,000 |
| Series YX 11 54, 0.25% 3/7/22 (Liquidity Facility Barclays Bank PLC) (a)(b)(c)(d) | | 935,000 | 935,000 |
| Rowan Univ. Participating VRDN Series 2016 XF 2337, 0.24% 3/7/22 (Liquidity Facility Barclays Bank PLC) (a)(c)(d) | | 3,100,000 | 3,100,000 |
| | | | 27,720,003 |
| California - 0.3% | | | |
| California Health Facilities Fing. Auth. Rev. Participating VRDN Series DBE 80 11, 0.34% 3/7/22 (Liquidity Facility Deutsche Bank AG New York Branch) (a)(c)(d) | | 200,000 | 200,000 |
| Florida - 0.2% | | | |
| Lee County Arpt. Rev. Participating VRDN Series XF 11 26, 0.27% 3/7/22 (Liquidity Facility Deutsche Bank AG New York Branch) (a)(b)(c)(d) | | 100,000 | 100,000 |
| Illinois - 0.3% | | | |
| Illinois Fin. Auth. Rev. Participating VRDN Series Floaters 017, 0.32% 4/11/22 (Liquidity Facility Barclays Bank PLC) (a)(c)(d) | | 190,000 | 190,000 |
| Ohio - 0.4% | | | |
| Columbus Gen. Oblig. Participating VRDN Series DB 80 75, 0.26% 3/7/22 (Liquidity Facility Deutsche Bank AG New York Branch) (a)(c)(d) | | 100,000 | 100,000 |
| Middletown Hosp. Facilities Rev. Participating VRDN Series Floaters 003, 0.32% 4/11/22 (Liquidity Facility Barclays Bank PLC) (a)(c)(d) | | 95,000 | 95,000 |
| Ohio Hosp. Rev. Participating VRDN Series 002, 0.32% 4/11/22 (Liquidity Facility Barclays Bank PLC) (a)(c)(d) | | 100,000 | 100,000 |
| | | | 295,000 |
| Virginia - 0.1% | | | |
| Suffolk Econ. Dev. Auth. Hosp. Facilities Rev. Participating VRDN Series MIZ 90 25, 0.29% 3/7/22 (Liquidity Facility Mizuho Cap. Markets LLC) (a)(c)(d) | | 100,000 | 100,000 |
| TOTAL TENDER OPTION BOND | | | |
| (Cost $28,605,003) | | | 28,605,003 |
|
| Other Municipal Security - 24.6% | | | |
| Arizona - 24.6% | | | |
| Arizona Board of Regents Arizona State Univ. Rev. Bonds: | | | |
| Series 2012 A: | | | |
| 5% 7/1/22 (Pre-Refunded to 7/1/22 @ 100) | | 100,000 | 101,637 |
| 5% 7/1/22 (Pre-Refunded to 7/1/22 @ 100) | | 550,000 | 558,817 |
| 5% 7/1/22 (Pre-Refunded to 7/1/22 @ 100) | | 110,000 | 111,743 |
| Series 2012 A. 5% 7/1/22 (Pre-Refunded to 7/1/22 @ 100) | | 125,000 | 126,998 |
| Series 2013 A, 5% 7/1/22 (Pre-Refunded to 7/1/22 @ 100) | | 160,000 | 162,451 |
| Arizona Board of Regents Ctfs. of Prtn. Bonds: | | | |
| (Univ. of Arizona Projs.) Series 2012 C: | | | |
| 5% 6/1/22 (Pre-Refunded to 6/1/22 @ 100) | | 130,000 | 131,537 |
| 5% 6/1/22 (Pre-Refunded to 6/1/22 @ 100) | | 120,000 | 121,402 |
| Series 2015 A, 5% 6/1/22 | | 645,000 | 652,589 |
| Arizona Trans. Board Excise Tax Rev. Bonds Series 2014, 5% 7/1/22 | | 3,450,000 | 3,506,774 |
| Arizona Trans. Board Hwy. Rev. Bonds Series 2013 A: | | | |
| 5% 7/1/22 (Pre-Refunded to 7/1/22 @ 100) | | 200,000 | 203,261 |
| 5% 7/1/22 (Pre-Refunded to 7/1/22 @ 100) | | 105,000 | 106,656 |
| 5% 7/1/22 (Pre-Refunded to 7/1/22 @ 100) | | 200,000 | 203,258 |
| 5% 7/1/22 (Pre-Refunded to 7/1/22 @ 100) | | 230,000 | 233,481 |
| 5% 7/1/22 (Pre-Refunded to 7/1/22 @ 100) | | 150,000 | 152,297 |
| 5% 7/1/22 (Pre-Refunded to 7/1/22 @ 100) | | 375,000 | 380,968 |
| Bullhead City Excise Taxes Bonds Series 2021 2, 4% 7/1/22 | | 1,000,000 | 1,013,104 |
| Goodyear Pub. Impt. Corp. Facilities Rev. Bonds Series 2011 A: | | | |
| 5% 7/1/22 (Pre-Refunded to 7/1/22 @ 100) | | 100,000 | 101,617 |
| 5% 7/1/22 (Pre-Refunded to 7/1/22 @ 100) | | 320,000 | 325,299 |
| Maricopa County Rev. Bonds Series B, 5%, tender 10/18/22 (a) | | 235,000 | 241,901 |
| Mesa Util. Sys. Rev. Bonds Series 2015, 5% 7/1/22 | | 125,000 | 127,019 |
| Phoenix Civic Impt. Board Arpt. Rev. Bonds Series 2017 D, 5% 7/1/22 | | 700,000 | 711,174 |
| Salt River Proj. Agricultural Impt. & Pwr. District Elec. Sys. Rev. Series 2022 C, 0.09% 3/3/22, CP | | 3,200,000 | 3,200,000 |
| Scottsdale Gen. Oblig. Bonds Series 2021, 4% 7/1/22 | | 1,125,000 | 1,139,984 |
| Tempe Excise Tax Rev. Bonds Series 2012, 5% 7/1/22 (Pre-Refunded to 7/1/22 @ 100) | | 1,090,000 | 1,107,664 |
| Tucson Wtr. Rev. Bonds Series 2016 A, 5% 7/1/22 | | 995,000 | 1,011,446 |
| Univ. of Arizona Univ. Revs. Bonds: | | | |
| Series 2012 A, 5% 6/1/22 (Pre-Refunded to 6/1/22 @ 100) | | 300,000 | 303,701 |
| Series 2012, 5% 6/1/22 (Pre-Refunded to 6/1/22 @ 100) | | 135,000 | 136,598 |
| Series 2015 A, 5% 6/1/22 | | 400,000 | 404,913 |
| TOTAL OTHER MUNICIPAL SECURITY | | | |
| (Cost $16,578,289) | | | 16,578,289 |
| | | Shares | Value |
| | | | |
|
| Investment Company - 9.8% | | | |
| Fidelity Municipal Cash Central Fund 0.15% (e)(f) | | | |
| (Cost $6,549,929) | | 6,548,752 | 6,549,929 |
| TOTAL INVESTMENT IN SECURITIES - 98.9% | | | |
| (Cost $66,543,221) | | | 66,543,221 |
| NET OTHER ASSETS (LIABILITIES) - 1.1% | | | 767,435 |
| NET ASSETS - 100% | | | $67,310,656 |
Security Type Abbreviations
CP – COMMERCIAL PAPER
VRDN – VARIABLE RATE DEMAND NOTE (A debt instrument that is payable upon demand, either daily, weekly or monthly)
Legend
(a) Coupon rates for floating and adjustable rate securities reflect the rates in effect at period end.
(b) Private activity obligations whose interest is subject to the federal alternative minimum tax for individuals.
(c) Provides evidence of ownership in one or more underlying municipal bonds.
(d) Coupon rates are determined by re-marketing agents based on current market conditions.
(e) Information in this report regarding holdings by state and security types does not reflect the holdings of the Fidelity Municipal Cash Central Fund.
(f) Affiliated fund that is generally available only to investment companies and other accounts managed by Fidelity Investments. The rate quoted is the annualized seven-day yield of the fund at period end. A complete unaudited listing of the fund's holdings as of its most recent quarter end is available upon request. In addition, each Fidelity Central Fund's financial statements are available on the SEC's website or upon request.
Affiliated Central Funds
Fiscal year to date information regarding the Fund's investments in Fidelity Central Funds, including the ownership percentage, is presented below.
| Fund | Value, beginning of period | Purchases | Sales Proceeds | Dividend Income | Realized Gain/Loss | Change in Unrealized appreciation (depreciation) | Value, end of period | % ownership, end of period |
| Fidelity Municipal Cash Central Fund 0.15% | $9,008,929 | $5,510,000 | $7,969,000 | $2,831 | $-- | $-- | $6,549,929 | 0.4% |
| Total | $9,008,929 | $5,510,000 | $7,969,000 | $2,831 | $-- | $-- | $6,549,929 | |
Amounts in the income column in the above table include any capital gain distributions from underlying funds, which are presented in the corresponding line-item in the Statement of Operations, if applicable.
Investment Valuation
All investments are categorized as Level 2 under the Fair Value Hierarchy. The inputs or methodology used for valuing securities may not be an indication of the risk associated with investing in those securities. For more information on valuation inputs please refer to the Investment Valuation section in the accompanying Notes to Financial Statements.
See accompanying notes which are an integral part of the financial statements.
Fidelity® Arizona Municipal Money Market Fund
Financial Statements
Statement of Assets and Liabilities
| | | February 28, 2022 (Unaudited) |
| Assets | | |
Investment in securities, at value — See accompanying schedule:
Unaffiliated issuers (cost $59,993,292) | $59,993,292 | |
| Fidelity Central Funds (cost $6,549,929) | 6,549,929 | |
| Total Investment in Securities (cost $66,543,221) | | $66,543,221 |
| Receivable for investments sold | | 800,000 |
| Receivable for fund shares sold | | 8,584 |
| Interest receivable | | 119,536 |
| Distributions receivable from Fidelity Central Funds | | 592 |
| Other receivables | | 260 |
| Total assets | | 67,472,193 |
| Liabilities | | |
| Payable to custodian bank | $59,739 | |
| Payable for fund shares redeemed | 93,091 | |
| Distributions payable | 51 | |
| Accrued management fee | 8,656 | |
| Total liabilities | | 161,537 |
| Net Assets | | $67,310,656 |
| Net Assets consist of: | | |
| Paid in capital | | $67,306,799 |
| Total accumulated earnings (loss) | | 3,857 |
| Net Assets | | $67,310,656 |
| Net Asset Value, offering price and redemption price per share ($67,310,656 ÷ 67,191,755 shares) | | $1.00 |
See accompanying notes which are an integral part of the financial statements.
Statement of Operations
| | | Six months ended February 28, 2022 (Unaudited) |
| Investment Income | | |
| Interest | | $32,480 |
| Income from Fidelity Central Funds | | 2,704 |
| Total income | | 35,184 |
| Expenses | | |
| Management fee | $176,360 | |
| Independent trustees' fees and expenses | 124 | |
| Total expenses before reductions | 176,484 | |
| Expense reductions | (144,799) | |
| Total expenses after reductions | | 31,685 |
| Net investment income (loss) | | 3,499 |
| Realized and Unrealized Gain (Loss) | | |
| Net realized gain (loss) on: | | |
| Investment securities: | | |
| Unaffiliated issuers | 4,333 | |
| Capital gain distributions from Fidelity Central Funds | 127 | |
| Total net realized gain (loss) | | 4,460 |
| Net increase in net assets resulting from operations | | $7,959 |
See accompanying notes which are an integral part of the financial statements.
Statement of Changes in Net Assets
| | Six months ended February 28, 2022 (Unaudited) | Year ended August 31, 2021 |
| Increase (Decrease) in Net Assets | | |
| Operations | | |
| Net investment income (loss) | $3,499 | $7,857 |
| Net realized gain (loss) | 4,460 | 16,477 |
| Net increase in net assets resulting from operations | 7,959 | 24,334 |
| Distributions to shareholders | (3,491) | (61,874) |
| Share transactions | | |
| Proceeds from sales of shares | 2,216,498 | 8,024,955 |
| Reinvestment of distributions | 3,079 | 52,025 |
| Cost of shares redeemed | (8,145,548) | (20,629,280) |
| Net increase (decrease) in net assets and shares resulting from share transactions | (5,925,971) | (12,552,300) |
| Total increase (decrease) in net assets | (5,921,503) | (12,589,840) |
| Net Assets | | |
| Beginning of period | 73,232,159 | 85,821,999 |
| End of period | $67,310,656 | $73,232,159 |
| Other Information | | |
| Shares | | |
| Sold | 2,216,498 | 8,024,955 |
| Issued in reinvestment of distributions | 3,079 | 52,025 |
| Redeemed | (8,145,548) | (20,629,280) |
| Net increase (decrease) | (5,925,971) | (12,552,300) |
See accompanying notes which are an integral part of the financial statements.
Financial Highlights
Fidelity Arizona Municipal Money Market Fund
| | Six months ended (Unaudited) February 28, | Years endedAugust 31, | | | | |
| | 2022 | 2021 | 2020 | 2019 | 2018 | 2017 |
| Selected Per–Share Data | | | | | | |
| Net asset value, beginning of period | $1.00 | $1.00 | $1.00 | $1.00 | $1.00 | $1.00 |
| Income from Investment Operations | | | | | | |
| Net investment income (loss)A | –B | –B | .006 | .012 | .008 | .003 |
| Net realized and unrealized gain (loss) | –B | .001 | –B | –B | –B | .002 |
| Total from investment operations | –B | .001 | .006 | .012 | .008 | .005 |
| Distributions from net investment income | –B | –B | (.006) | (.012) | (.008) | (.003) |
| Distributions from net realized gain | – | (.001) | –B | –B | – | (.002) |
| Total distributions | –B | (.001) | (.006) | (.012) | (.008) | (.005) |
| Net asset value, end of period | $1.00 | $1.00 | $1.00 | $1.00 | $1.00 | $1.00 |
| Total ReturnC,D | - %E | .08% | .61% | 1.16% | .78% | .48% |
| Ratios to Average Net AssetsA,F,G | | | | | | |
| Expenses before reductions | .50%H | .50% | .50% | .50% | .50% | .50% |
| Expenses net of fee waivers, if any | .09%H | .10% | .39% | .50% | .50% | .50% |
| Expenses net of all reductions | .09%H | .10% | .39% | .50% | .50% | .50% |
| Net investment income (loss) | .01%H | .01% | .61% | 1.16% | .76% | .29% |
| Supplemental Data | | | | | | |
| Net assets, end of period (000 omitted) | $67,311 | $73,232 | $85,822 | $92,735 | $107,238 | $143,253 |
A Net investment income (loss) is affected by the timing of the declaration of dividends by any underlying mutual funds or exchange-traded funds (ETFs). Net investment income (loss) of any such underlying funds is not included in the Fund's net investment income (loss) ratio.
B Amount represents less than $.0005 per share.
C Total returns for periods of less than one year are not annualized.
D Total returns would have been lower if certain expenses had not been reduced during the applicable periods shown.
E Amount represents less than .005%.
F Fees and expenses of any underlying mutual funds or exchange-traded funds (ETFs) are not included in the Fund's expense ratio. The Fund indirectly bears its proportionate share of these expenses. For additional expense information related to investments in Fidelity Central Funds, please refer to the "Investments in Fidelity Central Funds" note found in the Notes to Financial Statements section of the most recent Annual or Semi-Annual report.
G Expense ratios reflect operating expenses of the class. Expenses before reductions do not reflect amounts reimbursed, waived, or reduced through arrangements with the investment adviser, brokerage services, or other offset arrangements, if applicable, and do not represent the amount paid by the class during periods when reimbursements, waivers or reductions occur.
H Annualized
See accompanying notes which are an integral part of the financial statements.
Notes to Financial Statements (Unaudited)
For the period ended February 28, 2022
1. Organization.
Fidelity Arizona Municipal Income Fund (the Income Fund) is a fund of Fidelity Union Street Trust. Fidelity Arizona Municipal Money Market Fund (the Money Market Fund) is a fund of Fidelity Union Street Trust II. Each Trust is registered under the Investment Company Act of 1940, as amended (the 1940 Act), as an open-end management investment company. Fidelity Union Street Trust and Fidelity Union Street Trust II (the Trusts) are organized as a Massachusetts business trust and a Delaware statutory trust, respectively. The Income Fund is a non-diversified fund. Each Fund is authorized to issue an unlimited number of shares. Shares of the Money Market Fund are only available for purchase by retail shareholders. Share transactions on the Statement of Changes in Net Assets may contain exchanges between affiliated funds. Each Fund may be affected by economic and political developments in the state of Arizona.
2. Investments in Fidelity Central Funds.
Funds may invest in Fidelity Central Funds, which are open-end investment companies generally available only to other investment companies and accounts managed by the investment adviser and its affiliates. The Schedule of Investments lists any Fidelity Central Funds held as an investment as of period end, but does not include the underlying holdings of each Fidelity Central Fund. An investing fund indirectly bears its proportionate share of the expenses of the underlying Fidelity Central Funds.
Based on its investment objective, each Fidelity Central Fund may invest or participate in various investment vehicles or strategies that are similar to those of the investing fund. These strategies are consistent with the investment objectives of the investing fund and may involve certain economic risks which may cause a decline in value of each of the Fidelity Central Funds and thus a decline in the value of the investing fund.
| Fidelity Central Fund | Investment Manager | Investment Objective | Investment Practices | Expense Ratio(a) |
| Fidelity Money Market Central Funds | Fidelity Management & Research Company LLC (FMR) | Each fund seeks to obtain a high level of current income consistent with the preservation of capital and liquidity. | Short-term Investments | Less than .005% |
(a) Expenses expressed as a percentage of average net assets and are as of each underlying Central Fund's most recent annual or semi-annual shareholder report.
A complete unaudited list of holdings for each Fidelity Central Fund is available upon request or at the Securities and Exchange Commission website at www.sec.gov. In addition, the financial statements of the Fidelity Central Funds which contain the significant accounting policies (including investment valuation policies) of those funds, and are not covered by the Report of Independent Registered Public Accounting Firm, are available on the Securities and Exchange Commission website or upon request.
3. Significant Accounting Policies.
Each Fund is an investment company and applies the accounting and reporting guidance of the Financial Accounting Standards Board (FASB) Accounting Standards Codification Topic 946 Financial Services - Investment Companies. The financial statements have been prepared in conformity with accounting principles generally accepted in the United States of America (GAAP), which require management to make certain estimates and assumptions at the date of the financial statements. Actual results could differ from those estimates. Subsequent events, if any, through the date that the financial statements were issued have been evaluated in the preparation of the financial statements. Each Fund's Schedule of Investments lists any underlying mutual funds or exchange-traded funds (ETFs) but does not include the underlying holdings of these funds. The following summarizes the significant accounting policies of each Fund:
Investment Valuation. Investments are valued as of 4:00 p.m. Eastern time on the last calendar day of the period. The Board of Trustees (the Board) has delegated the day to day responsibility for the valuation of the Income Fund's investments to the Fair Value Committee (the Committee) established by the Income Fund's investment adviser. In accordance with valuation policies and procedures approved by the Board, the Income Fund attempts to obtain prices from one or more third party pricing vendors or brokers to value its investments. When current market prices, quotations or currency exchange rates are not readily available or reliable, investments will be fair valued in good faith by the Committee, in accordance with procedures adopted by the Board. Factors used in determining fair value vary by investment type and may include market or investment specific events, changes in interest rates and credit quality. The frequency with which these procedures are used cannot be predicted and they may be utilized to a significant extent. The Committee oversees the Income Fund's valuation policies and procedures and reports to the Board on the Committee's activities and fair value determinations. The Board monitors the appropriateness of the procedures used in valuing the Income Fund's investments and ratifies the fair value determinations of the Committee.
Each Fund categorizes the inputs to valuation techniques used to value its investments into a disclosure hierarchy consisting of three levels as shown below:
- Level 1 – Unadjusted quoted prices in active markets for identical investments
- Level 2 – other significant observable inputs (including quoted prices for similar investments, interest rates, prepayment speeds, etc.)
- Level 3 – unobservable inputs (including the Fund's own assumptions based on the best information available)
Valuation techniques used to value each Fund's investments by major category are as follows:
For the Income Fund, debt securities, including restricted securities, are valued based on evaluated prices received from third party pricing vendors or from brokers who make markets in such securities. Municipal securities are valued by pricing vendors who utilize matrix pricing which considers yield or price of bonds of comparable quality, coupon, maturity and type or by broker-supplied prices. When independent prices are unavailable or unreliable, debt securities may be valued utilizing pricing methodologies which consider similar factors that would be used by third party pricing vendors. Debt securities are generally categorized as Level 2 in the hierarchy but may be Level 3 depending on the circumstances.
For the Money Market Fund, as permitted by compliance with certain conditions under Rule 2a-7 of the 1940 Act, securities are valued at amortized cost, which approximates fair value. The amortized cost of an instrument is determined by valuing it at its original cost and thereafter amortizing any discount or premium from its face value at a constant rate until maturity. Securities held by a money market fund are generally high quality and liquid; however, they are reflected as Level 2 because the inputs used to determine fair value are not quoted prices in an active market.
For the Income Fund, changes in valuation techniques may result in transfers in or out of an assigned level within the disclosure hierarchy. The aggregate value of investments by input level as of February 28, 2022 is included at the end of the Fund's Schedule of Investments.
Investment Transactions and Income. For financial reporting purposes, the Funds' investment holdings and NAV include trades executed through the end of the last business day of the period. The NAV per share for processing shareholder transactions is calculated as of the close of business of the New York Stock Exchange (NYSE), normally 4:00 p.m. Eastern time and includes trades executed through the end of the prior business day for the Income Fund and trades executed through the end of the current business day for the Money Market Fund. Gains and losses on securities sold are determined on the basis of identified cost. Income and capital gain distributions from Fidelity Central Funds, if any, are recorded on the ex-dividend date. Interest income is accrued as earned and includes coupon interest and amortization of premium and accretion of discount on debt securities as applicable.
Expenses. Expenses directly attributable to a fund are charged to that fund. Expenses attributable to more than one fund are allocated among the respective funds on the basis of relative net assets or other appropriate methods. Expenses included in the accompanying financial statements reflect the expenses of that fund and do not include any expenses associated with any underlying mutual funds or exchange-traded funds. Although not included in a fund's expenses, a fund indirectly bears its proportionate share of these expenses through the net asset value of each underlying mutual fund or exchange-traded fund. Expense estimates are accrued in the period to which they relate and adjustments are made when actual amounts are known.
Income Tax Information and Distributions to Shareholders. Each year, each Fund intends to qualify as a regulated investment company under Subchapter M of the Internal Revenue Code, including distributing substantially all of its taxable income and realized gains. As a result, no provision for U.S. Federal income taxes is required. Each Fund files a U.S. federal tax return, in addition to state and local tax returns as required. Each Fund's federal income tax returns are subject to examination by the Internal Revenue Service (IRS) for a period of three fiscal years after they are filed. State and local tax returns may be subject to examination for an additional fiscal year depending on the jurisdiction.
Distributions are declared and recorded daily and paid monthly from net investment income. Distributions from realized gains, if any, are declared and recorded on the ex-dividend date. Income and capital gain distributions are determined in accordance with income tax regulations, which may differ from GAAP.
Capital accounts within the financial statements are adjusted for permanent book-tax differences. These adjustments have no impact on net assets or the results of operations. Capital accounts are not adjusted for temporary book-tax differences which will reverse in a subsequent period.
Book-tax differences are primarily due to market discount and losses deferred due to excise tax regulations.
The Funds purchase municipal securities whose interest, in the opinion of the issuer, is free from federal income tax. There is no assurance that the IRS will agree with this opinion. In the event the IRS determines that the issuer does not comply with relevant tax requirements, interest payments from a security could become federally taxable, possibly retroactively to the date the security was issued.
As of period end, the cost and unrealized appreciation (depreciation) in securities, and derivatives if applicable, for federal income tax purposes were as follows for each Fund:
| | Tax cost | Gross unrealized appreciation | Gross unrealized depreciation | Net unrealized appreciation (depreciation) |
| Fidelity Arizona Municipal Income Fund | $167,363,101 | $6,303,443 | $(1,585,479) | $4,717,964 |
| Fidelity Arizona Municipal Money Market Fund | 66,543,221 | – | – | – |
Certain of the Funds elected to defer to the next fiscal year capital losses recognized during the period November 1, 2020 to August 31, 2021. Loss deferrals were as follows:
| | Capital losses |
| Fidelity Arizona Municipal Money Market Fund | (612) |
Restricted Securities (including Private Placements). Funds may invest in securities that are subject to legal or contractual restrictions on resale. These securities generally may be resold in transactions exempt from registration or to the public if the securities are registered. Disposal of these securities may involve time-consuming negotiations and expense, and prompt sale at an acceptable price may be difficult. Information regarding restricted securities held at period end is included at the end of the Schedule of Investments, if applicable.
4. Purchases and Sales of Investments.
Purchases and sales of securities, other than short-term securities and in-kind transactions, as applicable, are noted in the table below.
| | Purchases ($) | Sales ($) |
| Fidelity Arizona Municipal Income Fund | 6,588,290 | 11,593,498 |
5. Fees and Other Transactions with Affiliates.
Management Fee. Fidelity Management & Research Company LLC (the investment adviser) and its affiliates provides the Funds with investment management related services for which the Funds pay a monthly management fee. Under the management contract, the investment adviser pays all other expenses, except the compensation of the independent Trustees and certain other expenses such as interest expense. The management fee is reduced by an amount equal to the fees and expenses paid by the Fund to the independent Trustees. Each Fund's management fee is equal to the following annual rate of average net assets:
| Fidelity Arizona Municipal Income Fund | .55% |
| Fidelity Arizona Municipal Money Market Fund | .50% |
Interfund Trades. Funds may purchase from or sell securities to other Fidelity Funds under procedures adopted by the Board. The procedures have been designed to ensure these interfund trades are executed in accordance with Rule 17a-7 of the 1940 Act. For the Income Fund, any interfund trades are included within the respective purchases and sales amounts shown in the Purchases and Sales of Investments note. Interfund trades during the period are noted in the table below.
| | Purchases ($) | Sales ($) | Realized Gain (Loss) ($) |
| Fidelity Arizona Municipal Income Fund | – | 1,692,528 | 30,751 |
| Fidelity Arizona Municipal Money Market Fund | 6,092,528 | 3,600,000 | – |
6. Committed Line of Credit.
Certain Funds participate with other funds managed by the investment adviser or an affiliate in a $4.25 billion credit facility (the "line of credit") to be utilized for temporary or emergency purposes to fund shareholder redemptions or for other short-term liquidity purposes. The commitment fees on the pro-rata portion of the line of credit are borne by the investment adviser. During the period, there were no borrowings on this line of credit.
7. Expense Reductions.
The investment adviser or its affiliates voluntarily agreed to waive certain fees for the Money Market Fund in order to avoid a negative yield. Such arrangements may be discontinued by the investment adviser at any time. For the period, the amount of the waiver was $144,341.
Through arrangements with each applicable Fund's custodian, credits realized as a result of certain uninvested cash balances were used to reduce each applicable Fund's expenses. All of the applicable expense reductions are noted in the table below.
| | Custodian credits |
| Fidelity Arizona Municipal Income Fund | $2,519 |
| Fidelity Arizona Municipal Money Market Fund | 458 |
8. Other.
A fund's organizational documents provide former and current trustees and officers with a limited indemnification against liabilities arising in connection with the performance of their duties to the fund. In the normal course of business, a fund may also enter into contracts that provide general indemnifications. A fund's maximum exposure under these arrangements is unknown as this would be dependent on future claims that may be made against a fund. The risk of material loss from such claims is considered remote.
9. Coronavirus (COVID-19) Pandemic.
An outbreak of COVID-19 first detected in China during December 2019 has since spread globally and was declared a pandemic by the World Health Organization during March 2020. Developments that disrupt global economies and financial markets, such as the COVID-19 pandemic, may magnify factors that affect the Funds' performance.
Shareholder Expense Example
As a shareholder, you incur two types of costs: (1) transaction costs, which may include sales charges (loads) on purchase payments or redemption proceeds, as applicable and (2) ongoing costs, which generally include management fees, distribution and/or service (12b-1) fees and other Fund expenses. This Example is intended to help you understand your ongoing costs (in dollars) of investing in a fund and to compare these costs with the ongoing costs of investing in other mutual funds.
The Example is based on an investment of $1,000 invested at the beginning of the period and held for the entire period (September 1, 2021 to February 28, 2022).
Actual Expenses
The first line of the accompanying table provides information about actual account values and actual expenses. You may use the information in this line, together with the amount you invested, to estimate the expenses that you paid over the period. Simply divide your account value by $1,000.00 (for example, an $8,600 account value divided by $1,000.00 = 8.6), then multiply the result by the number in the first line for a class/Fund under the heading entitled "Expenses Paid During Period" to estimate the expenses you paid on your account during this period. If any fund is a shareholder of any underlying mutual funds or exchange-traded funds (ETFs) (the Underlying Funds), such fund indirectly bears its proportional share of the expenses of the Underlying Funds in addition to the direct expenses incurred presented in the table. These fees and expenses are not included in the annualized expense ratio used to calculate the expense estimate in the table below.
Hypothetical Example for Comparison Purposes
The second line of the accompanying table provides information about hypothetical account values and hypothetical expenses based on the actual expense ratio and an assumed rate of return of 5% per year before expenses, which is not the actual return. The hypothetical account values and expenses may not be used to estimate the actual ending account balance or expenses you paid for the period. You may use this information to compare the ongoing costs of investing in the Fund and other funds. To do so, compare this 5% hypothetical example with the 5% hypothetical examples that appear in the shareholder reports of the other funds. If any fund is a shareholder of any Underlying Funds, such fund indirectly bears its proportional share of the expenses of the Underlying Funds in addition to the direct expenses as presented in the table. These fees and expenses are not included in the annualized expense ratio used to calculate the expense estimate in the table below.
Please note that the expenses shown in the table are meant to highlight your ongoing costs only and do not reflect any transaction costs. Therefore, the second line of the table is useful in comparing ongoing costs only, and will not help you determine the relative total costs of owning different funds. In addition, if these transactional costs were included, your costs would have been higher.
| | Annualized Expense Ratio-A | Beginning
Account Value
September 1, 2021 | Ending
Account Value
February 28, 2022 | Expenses Paid
During Period-B
September 1, 2021
to February 28, 2022 |
| Fidelity Arizona Municipal Income Fund | .55% | | | |
| Actual | | $1,000.00 | $967.40 | $2.68 |
| Hypothetical-C | | $1,000.00 | $1,022.07 | $2.76 |
| Fidelity Arizona Municipal Money Market Fund | .09% | | | |
| Actual | | $1,000.00 | $1,000.00 | $.45** |
| Hypothetical-C | | $1,000.00 | $1,024.35 | $.45** |
A Annualized expense ratio reflects expenses net of applicable fee waivers.
B Expenses are equal to the annualized expense ratio, multiplied by the average account value over the period, multiplied by 181/ 365 (to reflect the one-half year period). The fees and expenses of any Underlying Funds are not included in each annualized expense ratio.
C 5% return per year before expenses
**If certain fees were not voluntarily waived by the investment adviser or its affiliates during the period, the annualized expense ratio and the expenses paid in the actual and hypothetical examples above would have been as shown in table below:
| | Annualized Expense Ratio-(a)
| Expenses Paid
|
| Fidelity Arizona Municipal Money Market Fund | .50% | |
| Actual | | $2.48 |
| Hypothetical-(b) | | $2.51 |
(a) Annualized expense ratio reflects expenses net of applicable fee waivers.
(b) 5% return per year before expenses
Board Approval of Investment Advisory Contracts and Management Fees
Fidelity Arizona Municipal Income Fund / Fidelity Arizona Municipal Money Market Fund
Each year, the Board of Trustees, including the Independent Trustees (together, the Board), votes on the renewal of the management contract with Fidelity Management & Research Company LLC (FMR) and the sub-advisory agreements (together, the Advisory Contracts) for each fund. FMR and the sub-advisers are referred to herein as the Investment Advisers. The Board, assisted by the advice of fund counsel and Independent Trustees' counsel, requests and considers a broad range of information relevant to the renewal of the Advisory Contracts throughout the year.
The Board meets regularly and, at each of its meetings, covers an extensive agenda of topics and materials and considers factors that are relevant to its annual consideration of the renewal of each fund's Advisory Contracts, including the services and support provided to each fund and its shareholders. The Board has established four standing committees (Committees) — Operations, Audit, Fair Valuation, and Governance and Nominating — each composed of and chaired by Independent Trustees with varying backgrounds, to which the Board has assigned specific subject matter responsibilities in order to enhance effective decision-making by the Board. The Operations Committee, of which all of the Independent Trustees are members, meets regularly throughout the year and considers, among other matters, information specifically related to the annual consideration of the renewal of each fund's Advisory Contracts. The Board, acting directly and through its Committees, requests and receives information concerning the annual consideration of the renewal of each fund's Advisory Contracts. The Board also meets as needed to review matters specifically related to the Board's annual consideration of the renewal of the Advisory Contracts. Members of the Board may also meet with trustees of other Fidelity funds through joint ad hoc committees to discuss certain matters relevant to all of the Fidelity funds.
At its September 2021 meeting, the Board unanimously determined to renew each fund's Advisory Contracts. In reaching its determination, the Board considered all factors it believed relevant, including (i) the nature, extent, and quality of the services provided to each fund and its shareholders (including the investment performance of each fund); (ii) the competitiveness relative to peer funds of each fund's management fee and total expense ratio; (iii) the total costs of the services provided by and the profits realized by Fidelity from its relationships with each fund; and (iv) the extent to which, if any, economies of scale exist and are realized as each fund grows, and whether any economies of scale are appropriately shared with fund shareholders.
In considering whether to renew the Advisory Contracts for each fund, the Board reached a determination, with the assistance of fund counsel and Independent Trustees' counsel and through the exercise of its business judgment, that the renewal of the Advisory Contracts was in the best interests of each fund and its shareholders and that the compensation payable under the Advisory Contracts was fair and reasonable. The Board's decision to renew the Advisory Contracts was not based on any single factor, but rather was based on a comprehensive consideration of all the information provided to the Board at its meetings throughout the year. The Board, in reaching its determination to renew the Advisory Contracts, was aware that shareholders of each fund have a broad range of investment choices available to them, including a wide choice among funds offered by Fidelity's competitors, and that each fund's shareholders, who have the opportunity to review and weigh the disclosure provided by the fund in its prospectus and other public disclosures, have chosen to invest in that fund, which is part of the Fidelity family of funds.
Nature, Extent, and Quality of Services Provided. The Board considered Fidelity's staffing as it relates to the funds, including the backgrounds of investment personnel of Fidelity, and also considered the funds' investment objectives, strategies, and related investment philosophies. The Independent Trustees also had discussions with senior management of Fidelity's investment operations and investment groups. The Board considered the structure of the investment personnel compensation program and whether this structure provides appropriate incentives to act in the best interests of each fund. Additionally, the Board considered the portfolio managers' investments, if any, in the funds that they manage. The Board also considered the steps Fidelity had taken to ensure the continued provision of high quality services to the Fidelity funds during the COVID-19 pandemic, including the expansion of staff in client facing positions to maintain service levels in periods of high volumes and volatility.
Resources Dedicated to Investment Management and Support Services. The Board reviewed the general qualifications and capabilities of Fidelity’s investment staff, including its size, education, experience, and resources, as well as Fidelity’s approach to recruiting, training, managing, and compensating investment personnel. The Board noted the resources devoted to Fidelity’s global investment organization, and that Fidelity’s analysts have extensive resources, tools and capabilities that allow them to conduct
sophisticated quantitative and fundamental analysis, as well
as credit analysis of issuers, counterparties and guarantors. Further, the Board considered that Fidelity’s investment professionals have sufficient access to global information and data so as to provide competitive investment results over time, and that those professionals also have access to sophisticated tools that permit them to assess portfolio construction and risk and performance attribution characteristics continuously, as well as to transmit new information and research conclusions rapidly around the world. Additionally, in its deliberations, the Board considered Fidelity’s trading, risk management, compliance, cybersecurity, and technology and operations capabilities and resources, which are integral parts of the investment management process.
Shareholder and Administrative Services. The Board considered (i) the nature, extent, quality, and cost of advisory, administrative, and shareholder services performed by the Investment Advisers and their affiliates under the Advisory Contracts and under separate agreements covering transfer agency and pricing and bookkeeping services for each fund; (ii) the nature and extent of the supervision of third party service providers, principally custodians, subcustodians, and pricing vendors; and (iii) the resources devoted to, and the record of compliance with, each fund's compliance policies and procedures.
The Board noted that the growth of fund assets over time across the complex allows Fidelity to reinvest in the development of services designed to enhance the value and convenience of the Fidelity funds as investment vehicles. These services include 24-hour access to account information and market information over the Internet and through telephone representatives, investor education materials and asset allocation tools. The Board also considered that it reviews customer service metrics such as telephone response times, continuity of services on the website and metrics addressing services at Fidelity Investor Centers.
Investment in a Large Fund Family. The Board considered the benefits to shareholders of investing in a Fidelity fund, including the benefits of investing in a fund that is part of a large family of funds offering a variety of investment disciplines and providing a large variety of mutual fund investor services. The Board noted that Fidelity had taken, or had made recommendations to the Board that resulted in the Fidelity funds taking, a number of actions over the previous year that benefited particular funds, including: (i) continuing to dedicate additional resources to Fidelity's investment research process, which includes meetings with management of issuers of securities in which the funds invest; (ii) continuing efforts to enhance Fidelity's global research capabilities; (iii) launching new funds and ETFs with innovative structures, strategies and pricing and making other enhancements to meet client needs; (iv) launching new share classes of existing funds; (v) eliminating purchase minimums and broadening eligibility requirements for certain funds and share classes; (vi) reducing the holding period for the conversion of Class C shares to Class A shares; (vii) reducing management fees and total expenses for certain target date funds and classes and index funds; (viii) lowering expenses for certain existing funds and classes by implementing or lowering expense caps; (ix) rationalizing product lines and gaining increased efficiencies from fund mergers, liquidations, and share class consolidations; (x) continuing to develop, acquire and implement systems and technology to improve services to the funds and shareholders, strengthen information security, and increase efficiency; and (xi) continuing to implement enhancements to further strengthen Fidelity's product line to increase investors' probability of success in achieving their investment goals, including their retirement income goals.
Investment Performance (for Fidelity Arizona Municipal Income Fund). The Board considered whether the fund has operated in accordance with its investment objective, as well as its record of compliance with its investment restrictions and its performance history.
The Board took into account discussions that occur at Board meetings throughout the year with representatives of the Investment Advisers about fund investment performance. In this regard the Board noted that as part of regularly scheduled fund reviews and other reports to the Board on fund performance, the Board considers annualized return information for the fund for different time periods, measured against an appropriate securities market index (benchmark index) and an appropriate peer group of funds with similar objectives (peer group). The Board also reviews and considers information about performance attribution. In its evaluation of fund investment performance at meetings throughout the year, the Board gave particular attention to information indicating underperformance of certain Fidelity funds for specific time periods and discussed with the Investment Advisers the reasons for such underperformance.
In addition to reviewing absolute and relative fund performance, the Independent Trustees periodically consider the appropriateness of fund performance metrics in evaluating the results achieved. In general, the Independent Trustees believe that fund performance should be evaluated based on gross performance (before fees and expenses but after transaction costs) compared to appropriate benchmark indices, over appropriate time periods that may include full market cycles, and on net performance (after fees and expenses) compared to appropriate peer groups, as applicable, over the same periods, taking into account relevant factors including the following: general market conditions; expectations for interest rate levels and credit conditions; issuer-specific information including credit quality; the potential for incremental return versus the fund's benchmark index weighed against the risks involved in obtaining that incremental return, including the risk of diminished or negative total returns; and fund cash flows and other factors. The Independent Trustees generally give greater weight to fund performance over longer time periods than over shorter time periods. Depending on the circumstances, the Independent Trustees may be satisfied with a fund's performance notwithstanding that it lags its benchmark index or peer group for certain periods.
The Independent Trustees recognize that shareholders evaluate performance on a net basis over their own holding periods, for which one-, three-, and five-year periods are often used as a proxy. For this reason, the performance information reviewed by the Board also included net cumulative calendar year total return information for the fund and an appropriate benchmark index and peer group for the most recent one-, three-, and five-year periods. The Independent Trustees recognize that shareholders who are not investing through a tax-advantaged retirement account also consider tax consequences in evaluating performance.
Investment Performance (for Fidelity Arizona Municipal Money Market Fund). The Board took into account discussions that occur at Board meetings throughout the year with representatives of the Investment Advisers about fund investment performance. In this regard the Board noted that as part of regularly scheduled fund reviews and other reports to the Board on fund performance, the Board considers annualized return information for the fund for different time periods, measured against an appropriate peer group.
In addition to reviewing absolute and relative fund performance, the Independent Trustees periodically consider the appropriateness of fund performance metrics in evaluating the results achieved. In general, the Independent Trustees believe that fund performance should be evaluated based on gross performance (before fees and expenses but after transaction costs) compared to the gross performance of appropriate peer groups, over appropriate time periods that may include full market cycles, taking into account relevant factors including the following: general market conditions; expectations for interest rate levels and credit conditions; issuer-specific information including credit quality; the fund's market value NAV over time and its resilience under various stressed conditions; and fund cash flows and other factors. The Independent Trustees generally give greater weight to fund performance over longer time periods than over shorter time periods.
The Board recognizes that in interest rate environments where many competitors waive fees to maintain a minimum yield, relative money market fund performance on a net basis (after fees and expenses) may not be particularly meaningful due to miniscule performance differences among competitor funds. Depending on the circumstances, the Independent Trustees may be satisfied with a fund's performance notwithstanding that it lags its peer group for certain periods.
The Independent Trustees recognize that shareholders evaluate performance on a net basis over their own holding periods, for which one-, three-, and five-year periods are often used as a proxy. For this reason, the performance information reviewed by the Board also included net cumulative calendar year total return information for the fund and an appropriate peer group for the most recent one-, three-, and five-year periods. The Independent Trustees recognize that shareholders who are not investing through a tax-advantaged retirement account also consider tax consequences in evaluating performance.
Based on its review, the Board concluded that the nature, extent, and quality of services provided to each fund under the Advisory Contracts should continue to benefit the shareholders of each fund.
Competitiveness of Management Fee and Total Expense Ratio. The Board considered each fund's management fee and total expense ratio compared to "mapped groups" of competitive funds and classes created for the purpose of facilitating the Trustees' competitive analysis of management fees and total expenses. Fidelity creates "mapped groups" by combining similar Lipper investment objective categories that have comparable investment mandates. Combining Lipper investment objective categories aids the Board's management fee and total expense ratio comparisons by broadening the competitive group used for comparison.
Management Fee. The Board considered two proprietary management fee comparisons for the 12-month periods shown in basis points (BP) in the charts below. The group of Lipper funds used by the Board for management fee comparisons is referred to below as the "Total Mapped Group" and is broader than the Lipper peer group used by the Board for performance comparisons. The Total Mapped Group comparison focuses on a fund's standing in terms of gross management fees before expense reimbursements or caps relative to the total universe of funds with comparable investment mandates, regardless of whether their management fee structures also are comparable. Funds with comparable investment mandates offer exposure to similar types of securities. Funds with comparable management fee structures have similar management fee contractual arrangements (
e.g., flat rate charged for advisory services, all-inclusive fee rate,
etc.). "TMG %" represents the percentage of funds in the Total Mapped Group that had management fees that were lower than a fund's. For example, a hypothetical TMG % of 20% would mean that 80% of the funds in the Total Mapped Group had higher, and 20% had lower, management fees than a fund. The funds' actual TMG %s and the number of funds in the Total Mapped Group are in the charts below. The "Asset-Sized Peer Group" (ASPG) comparison focuses on a fund's standing relative to a subset of non-Fidelity funds within the Total Mapped Group that are similar in size and management fee structure. For example, if a fund is in the first quartile of the ASPG, the fund's management fee ranks in the least expensive or lowest 25% of funds in the ASPG. The ASPG represents at least 15% of the funds in the Total Mapped Group with comparable asset size and management fee structures, subject to a minimum of 50 funds (or all funds in the Total Mapped Group if fewer than 50). Additional information, such as the ASPG quartile in which a fund's management fee rate ranked, is also included in the charts and was considered by the Board. Because the vast majority of competitor funds' management fees do not cover expenses beyond portfolio management, in prior years, each fund was compared on the basis of a hypothetical "net management fee," which was derived by subtracting payments made by Fidelity for expenses beyond portfolio management (including transfer agent fees, pricing and bookkeeping fees, and fees paid to non-affiliated custodians) from the fund's all-inclusive fee. Given the funds' competitive management fee rates, Fidelity no longer calculates hypothetical net management fees for the fund and, as a result, the charts do not include hypothetical net management fees for periods after 2016.
Fidelity Arizona Municipal Income Fund

The Board noted that the fund's management fee rate ranked above the median of its Total Mapped Group and above the median of its ASPG for 2020. The Board noted that the management fee rate was 7 BP above the Total Mapped Group and 7 BP above the ASPG median. Arizona Municipal Income Fund has an all-inclusive management fee that covers expenses beyond portfolio management, whereas the majority of its competitors do not have all-inclusive fees. When compared to the total expenses of its load-type competitors, the fund ranks below its load-type group median.
Fidelity Arizona Municipal Money Market Fund
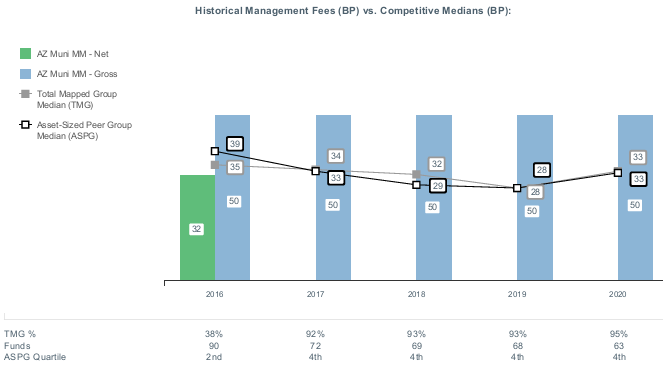
The Board noted that the fund's management fee rate ranked above the median of its Total Mapped Group and above the median of its ASPG for 2020. The Board noted that the management fee rate was 17 BP above the Total Mapped Group and 17 BP above the ASPG median. The Board noted that because there is a relatively small number of state-specific funds in the Lipper objective, Fidelity combines Lipper's separate categories for state-specific funds with all state and national municipal money market funds to create a single mapped group. The Board considered that Fidelity is the only firm that offers an Arizona money market fund.
Based on its review, the Board concluded that each fund's management fee is fair and reasonable in light of the services that the fund receives and the other factors considered.
Total Expense Ratio. In its review of each fund's total expense ratio, the Board considered the fund's all-inclusive fee rate. The Board also considered other expenses, such as transfer agent fees, pricing and bookkeeping fees, and custodial, legal, and audit fees, paid by FMR under the all-inclusive arrangement. The Board also noted that Fidelity may agree to waive fees or reimburse expenses from time to time, and the extent to which, if any, it has done so for each fund. Each fund is compared to those funds and classes in the Total Mapped Group (used by the Board for management fee comparisons) that have a similar sales load structure. The Board also considered a total expense ASPG comparison for each fund, which focuses on the total expenses of the fund relative to a subset of non-Fidelity funds within the similar sales load structure group. The total expense ASPG is limited to 15 larger and 15 smaller classes in fund average assets for a total of 30 classes, where possible. The total expense ASPG comparison excludes performance adjustments and fund-paid 12b-1 fees to eliminate variability in expenses relating to these items.
The Board noted that each fund's total expense ratio ranked below the similar sales load structure group competitive median for 2020 and below the ASPG competitive median for 2020.
Fees Charged to Other Fidelity Clients. The Board also considered Fidelity fee structures and other information with respect to clients of Fidelity, such as other funds advised or subadvised by Fidelity, pension plan clients, and other institutional clients with similar mandates. The Board noted that a joint ad hoc committee created by it and the boards of other Fidelity funds periodically reviews and compares Fidelity's institutional investment advisory business with its business of providing services to the Fidelity funds and also noted the most recent findings of the committee. The Board noted that the committee's review included a consideration of the differences in services provided, fees charged, and costs incurred, as well as competition in the markets serving the different categories of clients.
Based on its review of total expense ratios and fees charged to other Fidelity clients, the Board concluded that each fund's total expense ratio was reasonable in light of the services that the fund and its shareholders receive and the other factors considered.
Costs of the Services and Profitability. The Board considered the revenues earned and the expenses incurred by Fidelity in conducting the business of developing, marketing, distributing, managing, administering and servicing each fund and servicing each fund's shareholders. The Board also considered the level of Fidelity's profits in respect of all the Fidelity funds.
On an annual basis, Fidelity presents to the Board information about the profitability of its relationships with each fund. Fidelity calculates profitability information for each fund, as well as aggregate profitability information for groups of Fidelity funds and all Fidelity funds, using a series of detailed revenue and cost allocation methodologies which originate with the books and records of Fidelity on which Fidelity's audited financial statements are based. The Audit Committee of the Board reviews any significant changes from the prior year's methodologies and the full Board approves such changes.
A public accounting firm has been engaged annually by the Board as part of the Board's assessment of Fidelity's profitability analysis. The engagement includes the review and assessment of the methodologies used by Fidelity in determining the revenues and expenses attributable to Fidelity's mutual fund business, and completion of agreed-upon procedures in respect of the mathematical accuracy of certain fund profitability information and its conformity to established allocation methodologies. After considering the reports issued under the engagement and information provided by Fidelity, the Board concluded that while other allocation methods may also be reasonable, Fidelity's profitability methodologies are reasonable in all material respects.
The Board also reviewed Fidelity's non-fund businesses and potential indirect benefits such businesses may have received as a result of their association with Fidelity's mutual fund business (i.e., fall-out benefits) as well as cases where Fidelity's affiliates may benefit from the funds' business. The Board considered areas where potential indirect benefits to the Fidelity funds from their relationships with Fidelity may exist. The Board's consideration of these matters was informed by the findings of a joint ad hoc committee created by it and the boards of other Fidelity funds to evaluate potential fall-out benefits.
The Board considered the costs of the services provided by and the profits realized by Fidelity in connection with the operation of each fund and was satisfied that the profitability was not excessive.
Economies of Scale. The Board considered whether there have been economies of scale in respect of the management of the Fidelity funds, whether the Fidelity funds (including each fund) have appropriately benefited from any such economies of scale, and whether there is potential for realization of any further economies of scale. The Board considered the extent to which each fund will benefit from economies of scale as assets grow through increased services to the fund, through waivers or reimbursements, or through fee or expense ratio reductions. The Board recognized that, due to each fund's current contractual arrangements, its expense ratio will not decline if the fund's operating costs decrease as assets grow, or rise as assets decrease. The Board also noted that a committee (the Economies of Scale Committee) created by it and the boards of other Fidelity funds periodically analyzes whether Fidelity attains economies of scale in respect of the management and servicing of the Fidelity funds, whether the Fidelity funds have appropriately benefited from such economies of scale, and whether there is potential for realization of any further economies of scale.
The Board concluded, taking into account the analysis of the Economies of Scale Committee, that economies of scale, if any, are being appropriately shared between fund shareholders and Fidelity.
Additional Information Requested by the Board. In order to develop fully the factual basis for consideration of the Fidelity funds' advisory contracts, the Board requested and received additional information on certain topics, including: (i) Fidelity's fund profitability methodology, profitability trends for certain funds, the allocation of various costs to different funds, and the impact of certain factors on fund profitability results; (ii) portfolio manager changes that have occurred during the past year and the amount of the investment that each portfolio manager has made in the Fidelity fund(s) that he or she manages; (iii) the extent to which current market conditions have affected retention and recruitment of personnel; (iv) the arrangements with and compensation paid to certain fund sub-advisers on behalf of the Fidelity funds and the treatment of such compensation within Fidelity's fund profitability methodology; (v) the terms of the funds' various management fee structures, including the basic group fee and the terms of Fidelity's voluntary expense limitation arrangements; (vi) Fidelity's transfer agent fee, expense, and service structures for different funds and classes relative to competitive trends; (vii) the impact on fund profitability of recent industry trends, such as the growth in passively managed funds and the continued waiver of money market fund fees; (viii) the types of management fee and total expense comparisons provided, and the challenges and limitations associated with such information; and (ix) explanations regarding the relative total expense ratios of certain funds and classes, total expense competitive trends and methodologies for total expense competitive comparisons. In addition, the Board considered its discussions with Fidelity regarding Fidelity's efforts to maintain the continuous investment and shareholder services necessary for the funds during the current pandemic and economic circumstances.
Based on its evaluation of all of the conclusions noted above, and after considering all factors it believed relevant, the Board concluded that the advisory fee arrangements are fair and reasonable, and that each fund's Advisory Contracts should be renewed.
Liquidity Risk Management Program
The Securities and Exchange Commission adopted Rule 22e-4 under the Investment Company Act of 1940 (the Liquidity Rule) to promote effective liquidity risk management throughout the open-end investment company industry, thereby reducing the risk that funds will be unable to meet their redemption obligations and mitigating dilution of the interests of fund shareholders.
The Arizona Municipal Income Fund (the Income Fund) has adopted and implemented a liquidity risk management program pursuant to the Liquidity Rule (the Program) effective December 1, 2018. The Program is reasonably designed to assess and manage the Income Fund’s liquidity risk and to comply with the requirements of the Liquidity Rule. The Income Fund’s Board of Trustees (the Board) has designated the Income Fund’s investment adviser as administrator of the Program. The Fidelity advisers have established a Liquidity Risk Management Committee (the LRM Committee) to manage the Program for each of the Fidelity Funds. The LRM Committee monitors the adequacy and effectiveness of implementation of the Program and on a periodic basis assesses each Fund’s liquidity risk based on a variety of factors including (1) the Fund’s investment strategy, (2) portfolio liquidity and cash flow projections during normal and reasonably foreseeable stressed conditions, (3) shareholder redemptions, (4) borrowings and other funding sources and (5) in the case of exchange-traded funds, certain additional factors including the effect of the Fund’s prices and spreads, market participants, and basket compositions on the overall liquidity of the Fund’s portfolio, as applicable.
In accordance with the Program, each of the Fund’s portfolio investments is classified into one of four liquidity categories described below based on a determination of a reasonable expectation for how long it would take to convert the investment to cash (or sell or dispose of the investment) without significantly changing its market value.
- Highly liquid investments – cash or convertible to cash within three business days or less
- Moderately liquid investments – convertible to cash in three to seven calendar days
- Less liquid investments – can be sold or disposed of, but not settled, within seven calendar days
- Illiquid investments – cannot be sold or disposed of within seven calendar days
Liquidity classification determinations take into account a variety of factors including various market, trading and investment-specific considerations, as well as market depth, and generally utilize analysis from a third-party liquidity metrics service.
The Liquidity Rule places a 15% limit on a fund’s illiquid investments and requires funds that do not primarily hold assets that are highly liquid investments to determine and maintain a minimum percentage of the fund’s net assets to be invested in highly liquid investments (highly liquid investment minimum or HLIM). The Program includes provisions reasonably designed to comply with the 15% limit on illiquid investments and for determining, periodically reviewing and complying with the HLIM requirement as applicable.
At a recent meeting of the Fund’s Board of Trustees, the LRM Committee provided a written report to the Board pertaining to the operation, adequacy, and effectiveness of implementation of the Program for the annual period from December 1, 2020 through November 30, 2021. The report concluded that the Program has been implemented and is operating effectively and is reasonably designed to assess and manage the Fund’s liquidity risk.
AZI-SPZ-SANN-0422
1.700927.124