UNITED STATES
SECURITIES AND EXCHANGE COMMISSION
Washington, D.C. 20549
FORM N-CSR
CERTIFIED SHAREHOLDER REPORT OF REGISTERED
MANAGEMENT INVESTMENT COMPANIES
Investment Company Act file number 811-01796
Fidelity Destiny Portfolios
(Exact name of registrant as specified in charter)
245 Summer St., Boston, Massachusetts 02210
(Address of principal executive offices) (Zip code)
Margaret Carey, Secretary
245 Summer St.
Boston, Massachusetts 02210
(Name and address of agent for service)
Registrant's telephone number, including area code:
617-563-7000
Date of fiscal year end: | September 30 |
Date of reporting period: | September 30, 2023 |
Item 1.
Reports to Stockholders


Contents
| Average Annual Total Returns | |||
Periods ended September 30, 2023 | Past 1 year | Past 5 years | Past 10 years |
| Class O | 22.87% | 9.94% | 11.45% |
Class A (incl. 5.75% sales charge) | 15.41% | 8.26% | 10.41% |
Class M (incl. 3.50% sales charge) | 17.76% | 8.40% | 10.26% |
Class C (incl. contingent deferred sales charge) | 20.38% | 8.56% | 10.25% |
| Class I | 22.70% | 9.77% | 11.29% |
| Class Z | 22.85% | 9.90% | 11.42% |
| $10,000 Over 10 Years |
Let's say hypothetically that $10,000 was invested in Fidelity Advisor® Diversified Stock Fund - Class A, a class of the fund, on September 30, 2013, and the current 5.75% sales charge was paid. The chart shows how the value of your investment would have changed, and also shows how the S&P 500® Index performed over the same period. |
 |
Top Holdings (% of Fund's net assets) | ||
| Microsoft Corp. | 9.4 | |
| NVIDIA Corp. | 5.6 | |
| Alphabet, Inc. Class C | 5.4 | |
| Meta Platforms, Inc. Class A | 3.6 | |
| Amazon.com, Inc. | 3.4 | |
| Eaton Corp. PLC | 3.1 | |
| MasterCard, Inc. Class A | 2.7 | |
| Apple, Inc. | 2.4 | |
| Eli Lilly & Co. | 2.1 | |
| Marvell Technology, Inc. | 1.8 | |
| 39.5 | ||
| Market Sectors (% of Fund's net assets) | ||
| Information Technology | 30.3 | |
| Industrials | 13.7 | |
| Health Care | 12.1 | |
| Financials | 11.3 | |
| Communication Services | 11.0 | |
| Consumer Discretionary | 9.4 | |
| Energy | 5.7 | |
| Materials | 3.7 | |
| Consumer Staples | 1.9 | |
Asset Allocation (% of Fund's net assets) |
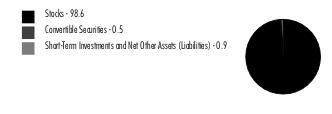 |
| Common Stocks - 98.6% | |||
| Shares | Value ($) | ||
| COMMUNICATION SERVICES - 10.8% | |||
| Entertainment - 0.9% | |||
| Electronic Arts, Inc. | 10,367 | 1,248,187 | |
| Netflix, Inc. (a) | 51,800 | 19,559,680 | |
| Spotify Technology SA (a) | 7,900 | 1,221,656 | |
| Universal Music Group NV | 108,700 | 2,836,655 | |
| 24,866,178 | |||
| Interactive Media & Services - 9.0% | |||
| Alphabet, Inc. Class C (a) | 1,082,360 | 142,709,166 | |
| Meta Platforms, Inc. Class A (a) | 319,031 | 95,776,297 | |
| 238,485,463 | |||
| Media - 0.9% | |||
| Comcast Corp. Class A | 528,700 | 23,442,558 | |
TOTAL COMMUNICATION SERVICES | 286,794,199 | ||
| CONSUMER DISCRETIONARY - 9.4% | |||
| Automobile Components - 0.1% | |||
| Aptiv PLC (a) | 25,700 | 2,533,763 | |
| Automobiles - 0.0% | |||
| Li Auto, Inc. ADR (a) | 13,800 | 491,970 | |
| Broadline Retail - 3.4% | |||
| Amazon.com, Inc. (a) | 697,600 | 88,678,912 | |
| Global-e Online Ltd. (a)(b) | 28,500 | 1,132,590 | |
| 89,811,502 | |||
| Hotels, Restaurants & Leisure - 2.3% | |||
| Airbnb, Inc. Class A (a) | 86,200 | 11,827,502 | |
| Caesars Entertainment, Inc. (a) | 69,700 | 3,230,595 | |
| Compass Group PLC | 73,105 | 1,779,492 | |
| Domino's Pizza, Inc. | 21,300 | 8,068,227 | |
| Flutter Entertainment PLC (a) | 35,100 | 5,734,336 | |
| Hilton Worldwide Holdings, Inc. | 118,584 | 17,808,945 | |
| Marriott International, Inc. Class A | 38,021 | 7,473,408 | |
| McDonald's Corp. | 21,400 | 5,637,616 | |
| 61,560,121 | |||
| Household Durables - 0.2% | |||
| Chervon Holdings Ltd. | 216,700 | 648,914 | |
| D.R. Horton, Inc. | 38,200 | 4,105,354 | |
| 4,754,268 | |||
| Specialty Retail - 2.5% | |||
| Abercrombie & Fitch Co. Class A (a) | 20,000 | 1,127,400 | |
| Lowe's Companies, Inc. | 105,800 | 21,989,472 | |
| Revolve Group, Inc. (a) | 25,900 | 352,499 | |
| RH (a) | 12,200 | 3,225,192 | |
| TJX Companies, Inc. | 431,440 | 38,346,387 | |
| 65,040,950 | |||
| Textiles, Apparel & Luxury Goods - 0.9% | |||
| Brunello Cucinelli SpA | 205,300 | 15,638,699 | |
| Moncler SpA | 13,867 | 807,522 | |
| NIKE, Inc. Class B | 23,000 | 2,199,260 | |
| On Holding AG (a) | 6,700 | 186,394 | |
| Ralph Lauren Corp. | 41,400 | 4,806,126 | |
| Tapestry, Inc. | 26,100 | 750,375 | |
| Tory Burch LLC (a)(c)(d)(e) | 28,846 | 893,929 | |
| 25,282,305 | |||
TOTAL CONSUMER DISCRETIONARY | 249,474,879 | ||
| CONSUMER STAPLES - 1.9% | |||
| Beverages - 1.0% | |||
| Boston Beer Co., Inc. Class A (a) | 10,703 | 4,169,140 | |
| Monster Beverage Corp. | 438,780 | 23,233,401 | |
| 27,402,541 | |||
| Consumer Staples Distribution & Retail - 0.1% | |||
| Dollar Tree, Inc. (a) | 12,600 | 1,341,270 | |
| Performance Food Group Co. (a) | 22,200 | 1,306,692 | |
| 2,647,962 | |||
| Household Products - 0.4% | |||
| The Clorox Co. | 91,400 | 11,978,884 | |
| Personal Care Products - 0.4% | |||
| Estee Lauder Companies, Inc. Class A | 29,500 | 4,264,225 | |
| Kenvue, Inc. | 260,400 | 5,228,832 | |
| 9,493,057 | |||
TOTAL CONSUMER STAPLES | 51,522,444 | ||
| ENERGY - 5.7% | |||
| Energy Equipment & Services - 3.2% | |||
| Baker Hughes Co. Class A | 711,200 | 25,119,584 | |
| Expro Group Holdings NV (a) | 45,000 | 1,045,350 | |
| NOV, Inc. | 666,700 | 13,934,030 | |
| Schlumberger Ltd. | 552,800 | 32,228,240 | |
| Seadrill Ltd. (a) | 8,000 | 358,320 | |
| TechnipFMC PLC | 607,200 | 12,350,448 | |
| Weatherford International PLC (a) | 7,500 | 677,475 | |
| 85,713,447 | |||
| Oil, Gas & Consumable Fuels - 2.5% | |||
| Antero Resources Corp. (a) | 93,879 | 2,382,649 | |
| Exxon Mobil Corp. | 207,634 | 24,413,606 | |
| Hess Corp. | 186,495 | 28,533,735 | |
| Range Resources Corp. | 286,465 | 9,284,331 | |
| 64,614,321 | |||
TOTAL ENERGY | 150,327,768 | ||
| FINANCIALS - 11.3% | |||
| Banks - 0.7% | |||
| JPMorgan Chase & Co. | 97,400 | 14,124,948 | |
| Starling Bank Ltd. Series D (a)(d)(e) | 879,300 | 3,572,537 | |
| 17,697,485 | |||
| Capital Markets - 4.0% | |||
| Ares Management Corp. | 211,600 | 21,767,292 | |
| BlackRock, Inc. Class A | 21,400 | 13,834,886 | |
| Cboe Global Markets, Inc. | 57,600 | 8,997,696 | |
| CME Group, Inc. | 41,100 | 8,229,042 | |
| Deutsche Borse AG | 23,700 | 4,092,914 | |
| Goldman Sachs Group, Inc. | 21,400 | 6,924,398 | |
| Intercontinental Exchange, Inc. | 114,100 | 12,553,282 | |
| KKR & Co. LP | 83,700 | 5,155,920 | |
| London Stock Exchange Group PLC | 17,900 | 1,794,044 | |
| Moody's Corp. | 11,000 | 3,477,870 | |
| Morgan Stanley | 202,700 | 16,554,509 | |
| Raymond James Financial, Inc. | 19,400 | 1,948,342 | |
| 105,330,195 | |||
| Consumer Finance - 0.2% | |||
| American Express Co. | 29,600 | 4,416,024 | |
| Capital One Financial Corp. | 22,700 | 2,203,035 | |
| 6,619,059 | |||
| Financial Services - 4.2% | |||
| Berkshire Hathaway, Inc. Class B (a) | 36,345 | 12,731,654 | |
| Block, Inc. Class A (a) | 33,500 | 1,482,710 | |
| MasterCard, Inc. Class A | 180,259 | 71,366,341 | |
| Toast, Inc. (a) | 69,600 | 1,303,608 | |
| Visa, Inc. Class A | 100,300 | 23,070,003 | |
| 109,954,316 | |||
| Insurance - 2.2% | |||
| Arthur J. Gallagher & Co. | 74,754 | 17,038,679 | |
| Chubb Ltd. | 56,000 | 11,658,080 | |
| Globe Life, Inc. | 33,100 | 3,598,963 | |
| Hartford Financial Services Group, Inc. | 33,300 | 2,361,303 | |
| Marsh & McLennan Companies, Inc. | 70,400 | 13,397,120 | |
| The Travelers Companies, Inc. | 61,442 | 10,034,093 | |
| 58,088,238 | |||
TOTAL FINANCIALS | 297,689,293 | ||
| HEALTH CARE - 12.1% | |||
| Biotechnology - 2.3% | |||
| Argenx SE ADR (a) | 15,433 | 7,587,326 | |
| Exact Sciences Corp. (a) | 142,500 | 9,721,350 | |
| Karuna Therapeutics, Inc. (a) | 9,300 | 1,572,537 | |
| Legend Biotech Corp. ADR (a) | 134,800 | 9,054,516 | |
| Moderna, Inc. (a) | 40,000 | 4,131,600 | |
| Nuvalent, Inc. Class A (a) | 17,800 | 818,266 | |
| Prothena Corp. PLC (a) | 22,200 | 1,071,150 | |
| Regeneron Pharmaceuticals, Inc. (a) | 17,355 | 14,282,471 | |
| Vertex Pharmaceuticals, Inc. (a) | 33,900 | 11,788,386 | |
| 60,027,602 | |||
| Health Care Equipment & Supplies - 3.3% | |||
| Baxter International, Inc. | 27,100 | 1,022,754 | |
| Boston Scientific Corp. (a) | 906,437 | 47,859,874 | |
| Glaukos Corp. (a) | 24,700 | 1,858,675 | |
| Intuitive Surgical, Inc. (a) | 28,300 | 8,271,807 | |
| Stryker Corp. | 100,949 | 27,586,333 | |
| 86,599,443 | |||
| Health Care Providers & Services - 2.8% | |||
| agilon health, Inc. (a) | 571,347 | 10,147,123 | |
| Cardinal Health, Inc. | 20,900 | 1,814,538 | |
| Cigna Group | 16,300 | 4,662,941 | |
| CVS Health Corp. | 138,700 | 9,684,034 | |
| UnitedHealth Group, Inc. | 96,208 | 48,507,112 | |
| 74,815,748 | |||
| Health Care Technology - 0.2% | |||
| Evolent Health, Inc. (d) | 145,500 | 3,763,867 | |
| Life Sciences Tools & Services - 0.2% | |||
| Agilent Technologies, Inc. | 28,700 | 3,209,234 | |
| Thermo Fisher Scientific, Inc. | 5,933 | 3,003,107 | |
| 6,212,341 | |||
| Pharmaceuticals - 3.3% | |||
| AstraZeneca PLC sponsored ADR | 15,400 | 1,042,888 | |
| Eli Lilly & Co. | 104,738 | 56,257,922 | |
| Merck & Co., Inc. | 235,000 | 24,193,250 | |
| Novo Nordisk A/S Series B | 62,600 | 5,699,809 | |
| 87,193,869 | |||
TOTAL HEALTH CARE | 318,612,870 | ||
| INDUSTRIALS - 13.7% | |||
| Aerospace & Defense - 3.0% | |||
| BWX Technologies, Inc. | 4,000 | 299,920 | |
| Howmet Aerospace, Inc. | 204,400 | 9,453,500 | |
| Lockheed Martin Corp. | 45,000 | 18,403,200 | |
| The Boeing Co. (a) | 244,303 | 46,827,999 | |
| TransDigm Group, Inc. (a) | 6,100 | 5,143,093 | |
| 80,127,712 | |||
| Air Freight & Logistics - 0.2% | |||
| FedEx Corp. | 19,000 | 5,033,480 | |
| Building Products - 1.3% | |||
| Fortune Brands Home & Security, Inc. | 61,400 | 3,816,624 | |
| Johnson Controls International PLC | 82,000 | 4,363,220 | |
| Trane Technologies PLC | 122,249 | 24,805,545 | |
| 32,985,389 | |||
| Commercial Services & Supplies - 0.4% | |||
| Cintas Corp. | 17,610 | 8,470,586 | |
| Copart, Inc. | 10,400 | 448,136 | |
| Republic Services, Inc. | 5,600 | 798,056 | |
| 9,716,778 | |||
| Construction & Engineering - 0.3% | |||
| Fluor Corp. (a) | 192,900 | 7,079,430 | |
| Electrical Equipment - 3.9% | |||
| Eaton Corp. PLC | 379,300 | 80,897,104 | |
| Hubbell, Inc. Class B | 25,100 | 7,866,591 | |
| Prysmian SpA | 89,400 | 3,605,867 | |
| Regal Rexnord Corp. | 7,700 | 1,100,176 | |
| Vertiv Holdings Co. | 251,800 | 9,366,960 | |
| 102,836,698 | |||
| Ground Transportation - 1.5% | |||
| Lyft, Inc. (a) | 238,300 | 2,511,682 | |
| Uber Technologies, Inc. (a) | 807,472 | 37,135,637 | |
| 39,647,319 | |||
| Industrial Conglomerates - 1.3% | |||
| General Electric Co. | 309,000 | 34,159,950 | |
| Machinery - 1.3% | |||
| Caterpillar, Inc. | 106,200 | 28,992,600 | |
| PACCAR, Inc. | 13,800 | 1,173,276 | |
| Parker Hannifin Corp. | 5,200 | 2,025,504 | |
| Pentair PLC | 42,600 | 2,758,350 | |
| 34,949,730 | |||
| Passenger Airlines - 0.2% | |||
| Copa Holdings SA Class A | 49,100 | 4,375,792 | |
| Delta Air Lines, Inc. | 48,700 | 1,801,900 | |
| 6,177,692 | |||
| Professional Services - 0.1% | |||
| Equifax, Inc. | 20,900 | 3,828,462 | |
| Trading Companies & Distributors - 0.2% | |||
| Applied Industrial Technologies, Inc. | 5,100 | 788,511 | |
| W.W. Grainger, Inc. | 5,800 | 4,012,672 | |
| 4,801,183 | |||
TOTAL INDUSTRIALS | 361,343,823 | ||
| INFORMATION TECHNOLOGY - 30.0% | |||
| Electronic Equipment, Instruments & Components - 1.1% | |||
| Amphenol Corp. Class A | 147,300 | 12,371,727 | |
| Flex Ltd. (a) | 199,300 | 5,377,114 | |
| Jabil, Inc. | 83,300 | 10,569,937 | |
| 28,318,778 | |||
| IT Services - 2.2% | |||
| Accenture PLC Class A | 62,223 | 19,109,306 | |
| Shopify, Inc. Class A (a) | 616,100 | 33,620,577 | |
| Snowflake, Inc. (a) | 35,000 | 5,346,950 | |
| X Holdings Corp. Class A (d)(e) | 22,870 | 807,768 | |
| 58,884,601 | |||
| Semiconductors & Semiconductor Equipment - 11.2% | |||
| Advanced Micro Devices, Inc. (a) | 17,200 | 1,768,504 | |
| Analog Devices, Inc. | 130,800 | 22,901,772 | |
| Applied Materials, Inc. | 35,800 | 4,956,510 | |
| ASML Holding NV (depository receipt) | 14,800 | 8,712,168 | |
| GlobalFoundries, Inc. (a) | 156,400 | 9,100,916 | |
| Lam Research Corp. | 8,601 | 5,390,849 | |
| Lattice Semiconductor Corp. (a) | 34,500 | 2,964,585 | |
| Marvell Technology, Inc. | 899,948 | 48,714,185 | |
| Monolithic Power Systems, Inc. | 9,300 | 4,296,600 | |
| NVIDIA Corp. | 341,800 | 148,679,582 | |
| NXP Semiconductors NV | 54,200 | 10,835,664 | |
| ON Semiconductor Corp. (a) | 100,800 | 9,369,360 | |
| Taiwan Semiconductor Manufacturing Co. Ltd. sponsored ADR | 154,400 | 13,417,360 | |
| Universal Display Corp. | 40,834 | 6,410,530 | |
| 297,518,585 | |||
| Software - 13.1% | |||
| Adobe, Inc. (a) | 31,219 | 15,918,568 | |
| Autodesk, Inc. (a) | 12,300 | 2,544,993 | |
| Confluent, Inc. (a) | 38,100 | 1,128,141 | |
| Dynatrace, Inc. (a) | 318,036 | 14,861,822 | |
| Fair Isaac Corp. (a) | 3,700 | 3,213,561 | |
| HubSpot, Inc. (a) | 8,200 | 4,038,500 | |
| Intuit, Inc. | 2,500 | 1,277,350 | |
| Microsoft Corp. | 788,113 | 248,846,675 | |
| Oracle Corp. | 180,300 | 19,097,376 | |
| Salesforce, Inc. (a) | 68,895 | 13,970,528 | |
| Synopsys, Inc. (a) | 22,800 | 10,464,516 | |
| Tenable Holdings, Inc. (a) | 14,709 | 658,963 | |
| UiPath, Inc. Class A (a) | 48,400 | 828,124 | |
| Workday, Inc. Class A (a) | 38,600 | 8,293,210 | |
| 345,142,327 | |||
| Technology Hardware, Storage & Peripherals - 2.4% | |||
| Apple, Inc. | 364,655 | 62,432,583 | |
| Samsung Electronics Co. Ltd. | 15,000 | 756,566 | |
| 63,189,149 | |||
TOTAL INFORMATION TECHNOLOGY | 793,053,440 | ||
| MATERIALS - 3.7% | |||
| Chemicals - 2.8% | |||
| Linde PLC | 108,600 | 40,437,210 | |
| Sherwin-Williams Co. | 127,666 | 32,561,213 | |
| 72,998,423 | |||
| Construction Materials - 0.2% | |||
| Martin Marietta Materials, Inc. | 9,200 | 3,776,416 | |
| Containers & Packaging - 0.1% | |||
| Aptargroup, Inc. | 2,100 | 262,584 | |
| Ball Corp. | 60,900 | 3,031,602 | |
| 3,294,186 | |||
| Metals & Mining - 0.6% | |||
| First Quantum Minerals Ltd. | 185,100 | 4,373,171 | |
| Franco-Nevada Corp. | 4,111 | 548,829 | |
| Freeport-McMoRan, Inc. | 11,900 | 443,751 | |
| Newcrest Mining Ltd. | 179,500 | 2,829,842 | |
| Newmont Corp. | 191,000 | 7,057,450 | |
| Wheaton Precious Metals Corp. | 34,900 | 1,416,299 | |
| 16,669,342 | |||
TOTAL MATERIALS | 96,738,367 | ||
| TOTAL COMMON STOCKS (Cost $1,879,176,453) | 2,605,557,083 | ||
| Convertible Preferred Stocks - 0.5% | |||
| Shares | Value ($) | ||
| COMMUNICATION SERVICES - 0.2% | |||
| Interactive Media & Services - 0.2% | |||
| ByteDance Ltd. Series E1 (a)(d)(e) | 17,226 | 4,024,855 | |
| Reddit, Inc. Series E (a)(d)(e) | 3,500 | 115,465 | |
| 4,140,320 | |||
| INFORMATION TECHNOLOGY - 0.3% | |||
| IT Services - 0.1% | |||
| Yanka Industries, Inc.: | |||
| Series E (a)(d)(e) | 165,574 | 1,129,215 | |
| Series F (a)(d)(e) | 265,105 | 1,808,016 | |
| 2,937,231 | |||
| Software - 0.2% | |||
| Evozyne, Inc. Series A (a)(d)(e) | 20,000 | 294,600 | |
| Moloco, Inc. Series A (d)(e) | 100,208 | 6,012,480 | |
| 6,307,080 | |||
TOTAL INFORMATION TECHNOLOGY | 9,244,311 | ||
| TOTAL CONVERTIBLE PREFERRED STOCKS (Cost $18,948,765) | 13,384,631 | ||
| Money Market Funds - 1.8% | |||
| Shares | Value ($) | ||
| Fidelity Cash Central Fund 5.39% (f) | 46,923,087 | 46,932,472 | |
| Fidelity Securities Lending Cash Central Fund 5.39% (f)(g) | 1,132,276 | 1,132,389 | |
| TOTAL MONEY MARKET FUNDS (Cost $48,064,861) | 48,064,861 | ||
| TOTAL INVESTMENT IN SECURITIES - 100.9% (Cost $1,946,190,079) | 2,667,006,575 |
NET OTHER ASSETS (LIABILITIES) - (0.9)% | (23,535,146) |
| NET ASSETS - 100.0% | 2,643,471,429 |
| (a) | Non-income producing |
| (b) | Security or a portion of the security is on loan at period end. |
| (c) | Investment is owned by a wholly-owned subsidiary (Subsidiary) that is treated as a corporation for U.S. tax purposes. |
| (d) | Restricted securities (including private placements) - Investment in securities not registered under the Securities Act of 1933 (excluding 144A issues). At the end of the period, the value of restricted securities (excluding 144A issues) amounted to $22,422,732 or 0.8% of net assets. |
| (e) | Level 3 security |
| (f) | Affiliated fund that is generally available only to investment companies and other accounts managed by Fidelity Investments. The rate quoted is the annualized seven-day yield of the fund at period end. A complete unaudited listing of the fund's holdings as of its most recent quarter end is available upon request. In addition, each Fidelity Central Fund's financial statements, which are not covered by the Fund's Report of Independent Registered Public Accounting Firm, are available on the SEC's website or upon request. |
| (g) | Investment made with cash collateral received from securities on loan. |
| Additional information on each restricted holding is as follows: | ||
| Security | Acquisition Date | Acquisition Cost ($) |
| ByteDance Ltd. Series E1 | 11/18/20 | 1,887,525 |
| Evolent Health, Inc. | 3/28/23 | 4,219,500 |
| Evozyne, Inc. Series A | 4/09/21 | 449,400 |
| Moloco, Inc. Series A | 6/26/23 | 6,012,480 |
| Reddit, Inc. Series E | 5/18/21 | 148,660 |
| Starling Bank Ltd. Series D | 6/18/21 - 4/05/22 | 1,694,172 |
| Tory Burch LLC | 5/14/15 | 2,039,212 |
| X Holdings Corp. Class A | 10/25/22 | 2,287,000 |
| Yanka Industries, Inc. Series E | 5/15/20 | 2,000,001 |
| Yanka Industries, Inc. Series F | 4/08/21 | 8,450,699 |
| Affiliate | Value, beginning of period ($) | Purchases ($) | Sales Proceeds ($) | Dividend Income ($) | Realized Gain (loss) ($) | Change in Unrealized appreciation (depreciation) ($) | Value, end of period ($) | % ownership, end of period |
| Fidelity Cash Central Fund 5.39% | 73,108,960 | 465,224,278 | 491,400,766 | 2,439,097 | - | - | 46,932,472 | 0.1% |
| Fidelity Securities Lending Cash Central Fund 5.39% | 2,193,014 | 111,476,464 | 112,537,089 | 39,860 | - | - | 1,132,389 | 0.0% |
| Total | 75,301,974 | 576,700,742 | 603,937,855 | 2,478,957 | - | - | 48,064,861 | |
| Valuation Inputs at Reporting Date: | ||||
| Description | Total ($) | Level 1 ($) | Level 2 ($) | Level 3 ($) |
Investments in Securities: | ||||
| Equities: | ||||
Communication Services | 290,934,519 | 283,957,544 | 2,836,655 | 4,140,320 |
Consumer Discretionary | 249,474,879 | 246,801,458 | 1,779,492 | 893,929 |
Consumer Staples | 51,522,444 | 51,522,444 | - | - |
Energy | 150,327,768 | 150,327,768 | - | - |
Financials | 297,689,293 | 288,229,798 | 5,886,958 | 3,572,537 |
Health Care | 318,612,870 | 309,149,194 | 9,463,676 | - |
Industrials | 361,343,823 | 361,343,823 | - | - |
Information Technology | 802,297,751 | 791,489,106 | 756,566 | 10,052,079 |
Materials | 96,738,367 | 96,738,367 | - | - |
| Money Market Funds | 48,064,861 | 48,064,861 | - | - |
| Total Investments in Securities: | 2,667,006,575 | 2,627,624,363 | 20,723,347 | 18,658,865 |
| Consolidated Statement of Assets and Liabilities | ||||
| September 30, 2023 | ||||
| Assets | ||||
| Investment in securities, at value (including securities loaned of $1,128,616) - See accompanying schedule: | ||||
Unaffiliated issuers (cost $1,898,125,218) | $ | 2,618,941,714 | ||
Fidelity Central Funds (cost $48,064,861) | 48,064,861 | |||
| Total Investment in Securities (cost $1,946,190,079) | $ | 2,667,006,575 | ||
| Cash | 259,443 | |||
| Restricted cash | 20,101 | |||
| Foreign currency held at value (cost $191) | 192 | |||
| Receivable for investments sold | 23,451,509 | |||
| Receivable for fund shares sold | 315,636 | |||
| Dividends receivable | 912,599 | |||
| Distributions receivable from Fidelity Central Funds | 139,466 | |||
| Prepaid expenses | 4,138 | |||
| Other receivables | 67,022 | |||
Total assets | 2,692,176,681 | |||
| Liabilities | ||||
| Payable for investments purchased | $ | 45,704,351 | ||
| Payable for fund shares redeemed | 556,678 | |||
| Accrued management fee | 893,265 | |||
| Distribution and service plan fees payable | 128,410 | |||
| Other affiliated payables | 143,830 | |||
| Other payables and accrued expenses | 149,818 | |||
| Collateral on securities loaned | 1,128,900 | |||
| Total Liabilities | 48,705,252 | |||
| Net Assets | $ | 2,643,471,429 | ||
| Net Assets consist of: | ||||
| Paid in capital | $ | 1,833,198,253 | ||
| Total accumulated earnings (loss) | 810,273,176 | |||
| Net Assets | $ | 2,643,471,429 | ||
| Net Asset Value and Maximum Offering Price | ||||
| Class O : | ||||
Net Asset Value, offering price and redemption price per share ($2,028,689,536 ÷ 68,625,628 shares) | $ | 29.56 | ||
| Class A : | ||||
Net Asset Value and redemption price per share ($389,470,071 ÷ 13,769,838 shares)(a) | $ | 28.28 | ||
| Maximum offering price per share (100/94.25 of $28.28) | $ | 30.01 | ||
| Class M : | ||||
Net Asset Value and redemption price per share ($49,711,460 ÷ 1,784,758 shares)(a) | $ | 27.85 | ||
| Maximum offering price per share (100/96.50 of $27.85) | $ | 28.86 | ||
| Class C : | ||||
Net Asset Value and offering price per share ($27,192,234 ÷ 1,032,808 shares)(a) | $ | 26.33 | ||
| Class I : | ||||
Net Asset Value, offering price and redemption price per share ($111,078,757 ÷ 3,571,772 shares) | $ | 31.10 | ||
| Class Z : | ||||
Net Asset Value, offering price and redemption price per share ($37,329,371 ÷ 1,217,158 shares) | $ | 30.67 | ||
(a)Redemption price per share is equal to net asset value less any applicable contingent deferred sales charge. | ||||
| Consolidated Statement of Operations | ||||
Year ended September 30, 2023 | ||||
| Investment Income | ||||
| Dividends | $ | 25,265,120 | ||
| Income from Fidelity Central Funds (including $39,860 from security lending) | 2,478,957 | |||
| Total Income | 27,744,077 | |||
| Expenses | ||||
| Management fee | $ | 10,021,964 | ||
| Transfer agent fees | 3,236,052 | |||
| Distribution and service plan fees | 1,408,662 | |||
| Accounting fees | 665,567 | |||
| Custodian fees and expenses | 79,730 | |||
| Independent trustees' fees and expenses | 13,955 | |||
| Registration fees | 113,536 | |||
| Audit | 94,772 | |||
| Legal | 9,273 | |||
| Miscellaneous | 12,065 | |||
| Total expenses before reductions | 15,655,576 | |||
| Expense reductions | (2,437,045) | |||
| Total expenses after reductions | 13,218,531 | |||
| Net Investment income (loss) | 14,525,546 | |||
| Realized and Unrealized Gain (Loss) | ||||
| Net realized gain (loss) on: | ||||
| Investment Securities: | ||||
| Unaffiliated issuers | 91,099,067 | |||
| Foreign currency transactions | (5,739) | |||
| Written options | 3,312,203 | |||
| Total net realized gain (loss) | 94,405,531 | |||
| Change in net unrealized appreciation (depreciation) on: | ||||
| Investment Securities: | ||||
| Investments | 391,983,350 | |||
| Assets and liabilities in foreign currencies | 23,965 | |||
| Total change in net unrealized appreciation (depreciation) | 392,007,315 | |||
| Net gain (loss) | 486,412,846 | |||
| Net increase (decrease) in net assets resulting from operations | $ | 500,938,392 | ||
| Consolidated Statement of Changes in Net Assets | ||||
Year ended September 30, 2023 | Year ended September 30, 2022 | |||
| Increase (Decrease) in Net Assets | ||||
| Operations | ||||
| Net investment income (loss) | $ | 14,525,546 | $ | 20,063,935 |
| Net realized gain (loss) | 94,405,531 | 213,809,147 | ||
| Change in net unrealized appreciation (depreciation) | 392,007,315 | (715,326,018) | ||
| Net increase (decrease) in net assets resulting from operations | 500,938,392 | (481,452,936) | ||
| Distributions to shareholders | (196,467,573) | (458,516,913) | ||
| Share transactions - net increase (decrease) | 71,602,216 | 297,349,064 | ||
| Total increase (decrease) in net assets | 376,073,035 | (642,620,785) | ||
| Net Assets | ||||
| Beginning of period | 2,267,398,394 | 2,910,019,179 | ||
| End of period | $ | 2,643,471,429 | $ | 2,267,398,394 |
| Fidelity Advisor® Diversified Stock Fund Class O |
| Years ended September 30, | 2023 | 2022 | 2021 | 2020 | 2019 | |||||
Selected Per-Share Data | ||||||||||
| Net asset value, beginning of period | $ | 26.24 | $ | 37.32 | $ | 30.57 | $ | 24.95 | $ | 28.95 |
| Income from Investment Operations | ||||||||||
Net investment income (loss) A,B | .19 | .26 | .16 | .20 | .22 | |||||
| Net realized and unrealized gain (loss) | 5.47 | (5.43) | 8.28 | 6.28 | (1.33) | |||||
| Total from investment operations | 5.66 | (5.17) | 8.44 | 6.48 | (1.11) | |||||
| Distributions from net investment income | (.22) | (.25) C | (.17) | (.22) | (.17) | |||||
| Distributions from net realized gain | (2.11) | (5.66) C | (1.53) | (.64) | (2.71) | |||||
| Total distributions | (2.34) D | (5.91) | (1.69) D | (.86) | (2.89) D | |||||
| Net asset value, end of period | $ | 29.56 | $ | 26.24 | $ | 37.32 | $ | 30.57 | $ | 24.95 |
Total Return E | 22.87% | (17.44)% | 28.60% | 26.50% | (2.68)% F | |||||
Ratios to Average Net Assets B,G,H | ||||||||||
| Expenses before reductions | .55% | .55% | .55% | .57% | .57% | |||||
| Expenses net of fee waivers, if any | .44% | .45% | .45% | .46% | .46% | |||||
| Expenses net of all reductions | .44% | .45% | .44% | .45% | .46% | |||||
| Net investment income (loss) | .65% | .80% | .47% | .74% | .88% | |||||
| Supplemental Data | ||||||||||
| Net assets, end of period (000 omitted) | $ | 2,028,690 | $ | 1,791,079 | $ | 2,335,000 | $ | 1,935,829 | $ | 1,640,484 |
Portfolio turnover rate I | 85% | 90% | 75% | 78% | 95% |
| Fidelity Advisor® Diversified Stock Fund Class A |
| Years ended September 30, | 2023 | 2022 | 2021 | 2020 | 2019 | |||||
Selected Per-Share Data | ||||||||||
| Net asset value, beginning of period | $ | 25.18 | $ | 36.04 | $ | 29.58 | $ | 24.17 | $ | 28.14 |
| Income from Investment Operations | ||||||||||
Net investment income (loss) A,B | .08 | .14 | .04 | .10 | .12 | |||||
| Net realized and unrealized gain (loss) | 5.25 | (5.22) | 8.01 | 6.08 | (1.30) | |||||
| Total from investment operations | 5.33 | (5.08) | 8.05 | 6.18 | (1.18) | |||||
| Distributions from net investment income | (.12) | (.12) C | (.07) | (.13) | (.08) | |||||
| Distributions from net realized gain | (2.11) | (5.66) C | (1.53) | (.64) | (2.71) | |||||
| Total distributions | (2.23) | (5.78) | (1.59) D | (.77) | (2.79) | |||||
| Net asset value, end of period | $ | 28.28 | $ | 25.18 | $ | 36.04 | $ | 29.58 | $ | 24.17 |
Total Return E,F | 22.46% | (17.76)% | 28.17% | 26.05% | (3.05)% G | |||||
Ratios to Average Net Assets B,H,I | ||||||||||
| Expenses before reductions | .85% | .85% | .85% | .87% | .88% | |||||
| Expenses net of fee waivers, if any | .79% | .80% | .80% | .81% | .82% | |||||
| Expenses net of all reductions | .79% | .80% | .79% | .80% | .81% | |||||
| Net investment income (loss) | .30% | .45% | .12% | .38% | .52% | |||||
| Supplemental Data | ||||||||||
| Net assets, end of period (000 omitted) | $ | 389,470 | $ | 318,997 | $ | 399,876 | $ | 314,622 | $ | 270,441 |
Portfolio turnover rate J | 85% | 90% | 75% | 78% | 95% |
| Fidelity Advisor® Diversified Stock Fund Class M |
| Years ended September 30, | 2023 | 2022 | 2021 | 2020 | 2019 | |||||
Selected Per-Share Data | ||||||||||
| Net asset value, beginning of period | $ | 24.82 | $ | 35.60 | $ | 29.27 | $ | 23.91 | $ | 27.86 |
| Income from Investment Operations | ||||||||||
Net investment income (loss) A,B | (.01) | .04 | (.07) | .01 | .04 | |||||
| Net realized and unrealized gain (loss) | 5.18 | (5.14) | 7.93 | 6.02 | (1.29) | |||||
| Total from investment operations | 5.17 | (5.10) | 7.86 | 6.03 | (1.25) | |||||
| Distributions from net investment income | (.02) | (.04) C | - | (.03) | - | |||||
| Distributions from net realized gain | (2.11) | (5.64) C | (1.53) | (.64) | (2.70) | |||||
| Total distributions | (2.14) D | (5.68) | (1.53) | (.67) | (2.70) | |||||
| Net asset value, end of period | $ | 27.85 | $ | 24.82 | $ | 35.60 | $ | 29.27 | $ | 23.91 |
Total Return E,F | 22.03% | (18.02)% | 27.74% | 25.64% | (3.42)% | |||||
Ratios to Average Net Assets B,G,H | ||||||||||
| Expenses before reductions | 1.12% | 1.12% | 1.13% | 1.17% | 1.18% | |||||
| Expenses net of fee waivers, if any | 1.12% | 1.12% | 1.13% | 1.16% | 1.18% | |||||
| Expenses net of all reductions | 1.12% | 1.12% | 1.12% | 1.16% | 1.18% | |||||
| Net investment income (loss) | (.02)% | .12% | (.21)% | .03% | .16% | |||||
| Supplemental Data | ||||||||||
| Net assets, end of period (000 omitted) | $ | 49,711 | $ | 41,957 | $ | 53,062 | $ | 42,562 | $ | 38,382 |
Portfolio turnover rate I | 85% | 90% | 75% | 78% | 95% |
| Fidelity Advisor® Diversified Stock Fund Class C |
| Years ended September 30, | 2023 | 2022 | 2021 | 2020 | 2019 | |||||
Selected Per-Share Data | ||||||||||
| Net asset value, beginning of period | $ | 23.67 | $ | 34.17 | $ | 28.30 | $ | 23.21 | $ | 27.13 |
| Income from Investment Operations | ||||||||||
Net investment income (loss) A,B | (.15) | (.13) | (.25) | (.13) | (.09) | |||||
| Net realized and unrealized gain (loss) | 4.92 | (4.91) | 7.65 | 5.82 | (1.25) | |||||
| Total from investment operations | 4.77 | (5.04) | 7.40 | 5.69 | (1.34) | |||||
| Distributions from net investment income | - | (.04) C | - | - D | - | |||||
| Distributions from net realized gain | (2.11) | (5.42) C | (1.53) | (.60) | (2.58) | |||||
| Total distributions | (2.11) | (5.46) | (1.53) | (.60) | (2.58) | |||||
| Net asset value, end of period | $ | 26.33 | $ | 23.67 | $ | 34.17 | $ | 28.30 | $ | 23.21 |
Total Return E,F | 21.38% | (18.49)% | 27.03% | 24.87% | (3.92)% | |||||
Ratios to Average Net Assets B,G,H | ||||||||||
| Expenses before reductions | 1.69% | 1.69% | 1.70% | 1.73% | 1.74% | |||||
| Expenses net of fee waivers, if any | 1.68% | 1.69% | 1.70% | 1.73% | 1.74% | |||||
| Expenses net of all reductions | 1.68% | 1.69% | 1.69% | 1.72% | 1.74% | |||||
| Net investment income (loss) | (.59)% | (.45)% | (.78)% | (.54)% | (.40)% | |||||
| Supplemental Data | ||||||||||
| Net assets, end of period (000 omitted) | $ | 27,192 | $ | 22,437 | $ | 32,096 | $ | 30,556 | $ | 29,785 |
Portfolio turnover rate I | 85% | 90% | 75% | 78% | 95% |
| Fidelity Advisor® Diversified Stock Fund Class I |
| Years ended September 30, | 2023 | 2022 | 2021 | 2020 | 2019 | |||||
Selected Per-Share Data | ||||||||||
| Net asset value, beginning of period | $ | 27.49 | $ | 38.84 | $ | 31.75 | $ | 25.88 | $ | 29.91 |
| Income from Investment Operations | ||||||||||
Net investment income (loss) A,B | .15 | .22 | .12 | .16 | .18 | |||||
| Net realized and unrealized gain (loss) | 5.75 | (5.71) | 8.62 | 6.52 | (1.36) | |||||
| Total from investment operations | 5.90 | (5.49) | 8.74 | 6.68 | (1.18) | |||||
| Distributions from net investment income | (.18) | (.20) C | (.12) | (.18) | (.13) | |||||
| Distributions from net realized gain | (2.11) | (5.66) C | (1.53) | (.64) | (2.71) | |||||
| Total distributions | (2.29) | (5.86) | (1.65) | (.81) D | (2.85) D | |||||
| Net asset value, end of period | $ | 31.10 | $ | 27.49 | $ | 38.84 | $ | 31.75 | $ | 25.88 |
Total Return E | 22.70% | (17.57)% | 28.43% | 26.32% | (2.85)% | |||||
Ratios to Average Net Assets B,F,G | ||||||||||
| Expenses before reductions | .59% | .59% | .59% | .61% | .62% | |||||
| Expenses net of fee waivers, if any | .59% | .59% | .59% | .61% | .62% | |||||
| Expenses net of all reductions | .59% | .59% | .58% | .60% | .62% | |||||
| Net investment income (loss) | .51% | .65% | .33% | .59% | .72% | |||||
| Supplemental Data | ||||||||||
| Net assets, end of period (000 omitted) | $ | 111,079 | $ | 75,626 | $ | 73,345 | $ | 58,886 | $ | 56,150 |
Portfolio turnover rate H | 85% | 90% | 75% | 78% | 95% |
| Fidelity Advisor® Diversified Stock Fund Class Z |
| Years ended September 30, | 2023 | 2022 | 2021 | 2020 | 2019 | |||||
Selected Per-Share Data | ||||||||||
| Net asset value, beginning of period | $ | 27.14 | $ | 38.41 | $ | 31.42 | $ | 25.62 | $ | 29.65 |
| Income from Investment Operations | ||||||||||
Net investment income (loss) A,B | .18 | .25 | .16 | .19 | .21 | |||||
| Net realized and unrealized gain (loss) | 5.68 | (5.63) | 8.51 | 6.46 | (1.36) | |||||
| Total from investment operations | 5.86 | (5.38) | 8.67 | 6.65 | (1.15) | |||||
| Distributions from net investment income | (.22) | (.23) C | (.16) | (.21) | (.17) | |||||
| Distributions from net realized gain | (2.11) | (5.66) C | (1.53) | (.64) | (2.71) | |||||
| Total distributions | (2.33) | (5.89) | (1.68) D | (.85) | (2.88) | |||||
| Net asset value, end of period | $ | 30.67 | $ | 27.14 | $ | 38.41 | $ | 31.42 | $ | 25.62 |
Total Return E | 22.85% | (17.47)% | 28.55% | 26.47% | (2.74)% | |||||
Ratios to Average Net Assets B,F,G | ||||||||||
| Expenses before reductions | .48% | .48% | .48% | .49% | .50% | |||||
| Expenses net of fee waivers, if any | .47% | .48% | .48% | .49% | .50% | |||||
| Expenses net of all reductions | .47% | .48% | .47% | .49% | .49% | |||||
| Net investment income (loss) | .62% | .77% | .44% | .70% | .84% | |||||
| Supplemental Data | ||||||||||
| Net assets, end of period (000 omitted) | $ | 37,329 | $ | 17,302 | $ | 16,639 | $ | 12,284 | $ | 10,010 |
Portfolio turnover rate H | 85% | 90% | 75% | 78% | 95% |
| Fidelity Central Fund | Investment Manager | Investment Objective | Investment Practices | Expense RatioA |
| Fidelity Money Market Central Funds | Fidelity Management & Research Company LLC (FMR) | Each fund seeks to obtain a high level of current income consistent with the preservation of capital and liquidity. | Short-term Investments | Less than .005% |
| Fidelity Advisor Diversified Stock Fund | $10,426 |
| Gross unrealized appreciation | $773,599,675 |
| Gross unrealized depreciation | (58,458,009) |
| Net unrealized appreciation (depreciation) | $715,141,666 |
| Tax Cost | $1,951,864,909 |
| Undistributed ordinary income | $10,143,956 |
| Undistributed long-term capital gain | $84,991,451 |
| Net unrealized appreciation (depreciation) on securities and other investments | $715,137,771 |
| September 30, 2023 | September 30, 2022 | |
| Ordinary Income | $16,985,144 | $ 91,306,614 |
| Long-term Capital Gains | 179,482,429 | 367,210,299 |
| Total | $196,467,573 | $ 458,516,913 |
| $ Amount | % of Net Assets | |
| Fidelity Advisor Diversified Stock Fund | 914,030 | .03 |
| Equity Risk | Equity risk relates to the fluctuations in the value of financial instruments as a result of changes in market prices (other than those arising from interest rate risk or foreign exchange risk), whether caused by factors specific to an individual investment, its issuer, or all factors affecting all instruments traded in a market or market segment. |
| Purchases ($) | Sales ($) | |
| Fidelity Advisor Diversified Stock Fund | 2,109,093,832 | 2,187,596,897 |
| Distribution Fee | Service Fee | Total Fees | Retained by FDC | |
| Class A | - % | .25% | $921,485 | 9,199 |
| Class M | .25% | .25% | 238,342 | 753 |
| Class C | .75% | .25% | 248,835 | 43,748 |
| $1,408,662 | $53,700 |
| Retained by FDC | |
| Class A | $63,356 |
| Class M | 3,618 |
Class C A | 1,723 |
| $68,697 |
| Amount | % of Class-Level Average Net Assets | |
| Class O | $2,310,580 | .12 |
| Class A | 602,822 | .16 |
| Class M | 90,842 | .19 |
| Class C | 63,510 | .26 |
| Class I | 155,735 | .16 |
| Class Z | 12,563 | .04 |
| $3,236,052 |
| % of Average Net Assets | |
| Fidelity Advisor Diversified Stock Fund | .03 |
| Amount | |
| Fidelity Advisor Diversified Stock Fund | $45,258 |
| Purchases ($) | Sales ($) | Realized Gain (Loss) ($) | |
| Fidelity Advisor Diversified Stock Fund | 102,462,639 | 128,892,106 | 5,076,497 |
| Amount | |
| Fidelity Advisor Diversified Stock Fund | $4,602 |
| Total Security Lending Fees Paid to NFS | Security Lending Income From Securities Loaned to NFS | Value of Securities Loaned to NFS at Period End | |
| Fidelity Advisor Diversified Stock Fund | $4,023 | $- | $- |
| Transfer Agent Fees Limitation | Waiver | |
| Class O | .01% | $2,111,081 |
| Class A | .11% | 196,535 |
| Expense reduction | |
| Class M | $1,598 |
Year ended September 30, 2023 | Year ended September 30, 2022 | |
| Fidelity Advisor Diversified Stock Fund | ||
| Distributions to shareholders | ||
| Class O | $ 154,281,370 | $365,744,514 |
| Class A | 28,221,117 | 64,804,937 |
| Class M | 3,593,245 | 8,769,739 |
| Class C | 1,915,199 | 5,288,572 |
| Class I | 6,755,305 | 11,364,980 |
| Class Z | 1,701,337 | 2,544,171 |
Total | $196,467,573 | $458,516,913 |
| Shares | Shares | Dollars | Dollars | |
Year ended September 30, 2023 | Year ended September 30, 2022 | Year ended September 30, 2023 | Year ended September 30, 2022 | |
| Fidelity Advisor Diversified Stock Fund | ||||
| Class O | ||||
| Shares sold | 325,309 | 551,781 | $9,339,172 | $17,867,516 |
| Reinvestment of distributions | 5,205,884 | 9,414,946 | 134,051,504 | 319,354,977 |
| Shares redeemed | (5,174,055) | (4,261,527) | (143,633,754) | (138,547,377) |
| Net increase (decrease) | 357,138 | 5,705,200 | $(243,078) | $198,675,116 |
| Class A | ||||
| Shares sold | 1,625,740 | 1,399,424 | $44,177,246 | $44,810,563 |
| Reinvestment of distributions | 1,127,278 | 1,959,102 | 27,855,059 | 63,964,694 |
| Shares redeemed | (1,650,632) | (1,786,105) | (44,684,185) | (54,737,292) |
| Net increase (decrease) | 1,102,386 | 1,572,421 | $27,348,120 | $54,037,965 |
| Class M | ||||
| Shares sold | 250,524 | 297,075 | $6,770,032 | $9,639,615 |
| Reinvestment of distributions | 146,709 | 270,089 | 3,578,243 | 8,713,064 |
| Shares redeemed | (303,136) | (367,174) | (8,135,215) | (11,150,374) |
| Net increase (decrease) | 94,097 | 199,990 | $2,213,060 | $7,202,305 |
| Class C | ||||
| Shares sold | 318,929 | 209,837 | $8,182,208 | $6,571,126 |
| Reinvestment of distributions | 81,037 | 167,701 | 1,876,816 | 5,183,644 |
| Shares redeemed | (315,056) | (369,072) | (7,967,842) | (10,825,059) |
| Net increase (decrease) | 84,910 | 8,466 | $2,091,182 | $929,711 |
| Class I | ||||
| Shares sold | 1,360,395 | 1,292,193 | $40,572,809 | $42,965,177 |
| Reinvestment of distributions | 210,392 | 252,131 | 5,705,837 | 8,970,834 |
| Shares redeemed | (750,379) | (681,409) | (22,428,071) | (22,296,490) |
| Net increase (decrease) | 820,408 | 862,915 | $23,850,575 | $29,639,521 |
| Class Z | ||||
| Shares sold | 816,559 | 268,029 | $23,688,094 | $8,751,413 |
| Reinvestment of distributions | 58,613 | 66,191 | 1,566,132 | 2,323,303 |
| Shares redeemed | (295,597) | (129,807) | (8,911,869) | (4,210,270) |
| Net increase (decrease) | 579,575 | 204,413 | $16,342,357 | $6,864,446 |
| The Example is based on an investment of $1,000 invested at the beginning of the period and held for the entire period (April 1, 2023 to September 30, 2023). |
Annualized Expense Ratio- A | Beginning Account Value April 1, 2023 | Ending Account Value September 30, 2023 | Expenses Paid During Period- C April 1, 2023 to September 30, 2023 | |||||||
| Fidelity Advisor® Diversified Stock Fund | ||||||||||
| Class O | .44% | |||||||||
| Actual | $ 1,000 | $ 1,074.50 | $ 2.29 | |||||||
Hypothetical-B | $ 1,000 | $ 1,022.86 | $ 2.23 | |||||||
| Class A | .79% | |||||||||
| Actual | $ 1,000 | $ 1,072.80 | $ 4.10 | |||||||
Hypothetical-B | $ 1,000 | $ 1,021.11 | $ 4.00 | |||||||
| Class M | 1.11% | |||||||||
| Actual | $ 1,000 | $ 1,070.70 | $ 5.76 | |||||||
Hypothetical-B | $ 1,000 | $ 1,019.50 | $ 5.62 | |||||||
| Class C | 1.68% | |||||||||
| Actual | $ 1,000 | $ 1,068.20 | $ 8.71 | |||||||
Hypothetical-B | $ 1,000 | $ 1,016.65 | $ 8.49 | |||||||
| Class I | .59% | |||||||||
| Actual | $ 1,000 | $ 1,073.90 | $ 3.07 | |||||||
Hypothetical-B | $ 1,000 | $ 1,022.11 | $ 2.99 | |||||||
| Class Z | .47% | |||||||||
| Actual | $ 1,000 | $ 1,074.60 | $ 2.44 | |||||||
Hypothetical-B | $ 1,000 | $ 1,022.71 | $ 2.38 | |||||||
 |


Contents
| Average Annual Total Returns | |||
Periods ended September 30, 2023 | Past 1 year | Past 5 years | Past 10 years |
| Class O | 27.44% | 9.41% | 10.59% |
Class A (incl. 5.75% sales charge) | 19.79% | 7.81% | 9.63% |
Class M (incl. 3.50% sales charge) | 22.08% | 7.78% | 9.32% |
Class C (incl. contingent deferred sales charge) | 24.89% | 8.06% | 9.41% |
| Class I | 27.23% | 9.23% | 10.43% |
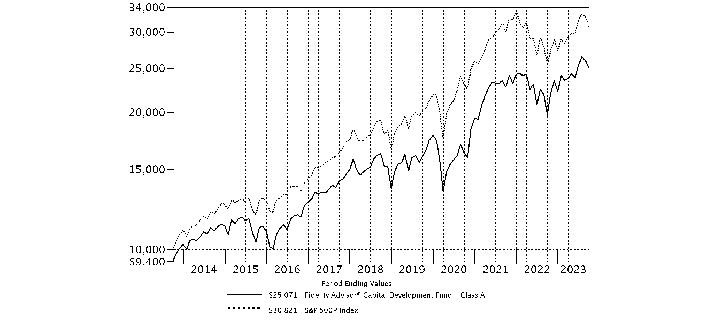
| $10,000 Over 10 Years |
Let's say hypothetically that $10,000 was invested in Fidelity Advisor® Capital Development Fund - Class A, a class of the fund, on September 30, 2013, and the current 5.75% sales charge was paid. The chart shows how the value of your investment would have changed, and also shows how the S&P 500® Index performed over the same period. |
 |
Top Holdings (% of Fund's net assets) | ||
| Exxon Mobil Corp. | 7.8 | |
| Microsoft Corp. | 7.1 | |
| General Electric Co. | 6.5 | |
| Wells Fargo & Co. | 5.3 | |
| Apple, Inc. | 3.1 | |
| Bank of America Corp. | 2.4 | |
| Hess Corp. | 2.2 | |
| Comcast Corp. Class A | 2.1 | |
| The Boeing Co. | 2.0 | |
| UnitedHealth Group, Inc. | 2.0 | |
| 40.5 | ||
| Market Sectors (% of Fund's net assets) | ||
| Information Technology | 17.0 | |
| Financials | 16.3 | |
| Industrials | 15.4 | |
| Health Care | 13.4 | |
| Energy | 12.3 | |
| Communication Services | 9.9 | |
| Consumer Staples | 5.4 | |
| Consumer Discretionary | 3.8 | |
| Materials | 2.8 | |
| Real Estate | 0.9 | |
| Utilities | 0.9 | |
Asset Allocation (% of Fund's net assets) |
 |
| Common Stocks - 97.9% | |||
| Shares | Value ($) | ||
| COMMUNICATION SERVICES - 9.9% | |||
| Diversified Telecommunication Services - 0.3% | |||
| Cellnex Telecom SA (a) | 160,500 | 5,594,634 | |
| Verizon Communications, Inc. | 197,006 | 6,384,964 | |
| 11,979,598 | |||
| Entertainment - 1.1% | |||
| Activision Blizzard, Inc. | 61,300 | 5,739,519 | |
| The Walt Disney Co. (b) | 198,100 | 16,056,005 | |
| Universal Music Group NV | 774,200 | 20,203,665 | |
| 41,999,189 | |||
| Interactive Media & Services - 5.9% | |||
| Alphabet, Inc.: | |||
| Class A (b) | 541,100 | 70,808,346 | |
| Class C (b) | 499,460 | 65,853,801 | |
| Match Group, Inc. (b) | 254,600 | 9,973,955 | |
| Meta Platforms, Inc. Class A (b) | 228,039 | 68,459,588 | |
| Snap, Inc. Class A (b) | 862,400 | 7,683,984 | |
| 222,779,674 | |||
| Media - 2.6% | |||
| Charter Communications, Inc. Class A (b) | 8,200 | 3,606,524 | |
| Comcast Corp. Class A | 1,846,200 | 81,860,508 | |
| Interpublic Group of Companies, Inc. | 476,600 | 13,659,356 | |
| 99,126,388 | |||
TOTAL COMMUNICATION SERVICES | 375,884,849 | ||
| CONSUMER DISCRETIONARY - 3.8% | |||
| Automobile Components - 0.2% | |||
| BorgWarner, Inc. | 177,460 | 7,164,060 | |
| Automobiles - 0.1% | |||
| General Motors Co. | 82,600 | 2,723,322 | |
| Broadline Retail - 0.1% | |||
| Amazon.com, Inc. (b) | 41,700 | 5,300,904 | |
| Hotels, Restaurants & Leisure - 2.0% | |||
| Amadeus IT Holding SA Class A | 113,600 | 6,879,534 | |
| Booking Holdings, Inc. (b) | 14,200 | 43,792,090 | |
| Expedia, Inc. (b) | 68,200 | 7,029,374 | |
| Marriott International, Inc. Class A | 65,900 | 12,953,304 | |
| Starbucks Corp. | 51,000 | 4,654,770 | |
| 75,309,072 | |||
| Household Durables - 0.4% | |||
| Mohawk Industries, Inc. (b) | 85,100 | 7,302,431 | |
| Sony Group Corp. sponsored ADR (c) | 55,100 | 4,540,791 | |
| Whirlpool Corp. | 17,600 | 2,353,120 | |
| 14,196,342 | |||
| Specialty Retail - 0.9% | |||
| Lowe's Companies, Inc. | 161,800 | 33,628,512 | |
| RH (b) | 9,900 | 2,617,164 | |
| 36,245,676 | |||
| Textiles, Apparel & Luxury Goods - 0.1% | |||
| NIKE, Inc. Class B | 31,300 | 2,992,906 | |
TOTAL CONSUMER DISCRETIONARY | 143,932,282 | ||
| CONSUMER STAPLES - 5.4% | |||
| Beverages - 1.7% | |||
| Diageo PLC sponsored ADR (c) | 96,500 | 14,395,870 | |
| Keurig Dr. Pepper, Inc. | 517,800 | 16,346,946 | |
| The Coca-Cola Co. | 561,700 | 31,443,966 | |
| 62,186,782 | |||
| Consumer Staples Distribution & Retail - 1.5% | |||
| Costco Wholesale Corp. | 4,400 | 2,485,824 | |
| Performance Food Group Co. (b) | 138,200 | 8,134,452 | |
| Sysco Corp. | 305,700 | 20,191,485 | |
| Target Corp. | 81,500 | 9,011,455 | |
| U.S. Foods Holding Corp. (b) | 174,700 | 6,935,590 | |
| Walmart, Inc. | 71,700 | 11,466,981 | |
| 58,225,787 | |||
| Household Products - 0.0% | |||
| Colgate-Palmolive Co. | 4,500 | 319,995 | |
| Procter & Gamble Co. | 5,100 | 743,886 | |
| 1,063,881 | |||
| Personal Care Products - 1.4% | |||
| Estee Lauder Companies, Inc. Class A | 54,000 | 7,805,700 | |
| Haleon PLC ADR (c) | 2,592,500 | 21,595,525 | |
| Kenvue, Inc. | 1,245,113 | 25,001,869 | |
| 54,403,094 | |||
| Tobacco - 0.8% | |||
| Altria Group, Inc. | 640,200 | 26,920,410 | |
| Philip Morris International, Inc. | 32,900 | 3,045,882 | |
| 29,966,292 | |||
TOTAL CONSUMER STAPLES | 205,845,836 | ||
| ENERGY - 12.3% | |||
| Energy Equipment & Services - 0.0% | |||
| Baker Hughes Co. Class A | 28,200 | 996,024 | |
| Oil, Gas & Consumable Fuels - 12.3% | |||
| Exxon Mobil Corp. | 2,521,300 | 296,454,453 | |
| Hess Corp. | 546,720 | 83,648,160 | |
| Imperial Oil Ltd. | 495,900 | 30,544,446 | |
| Kosmos Energy Ltd. (b) | 3,119,901 | 25,520,790 | |
| MEG Energy Corp. (b) | 933,100 | 18,157,065 | |
| Shell PLC ADR | 191,700 | 12,341,646 | |
| 466,666,560 | |||
TOTAL ENERGY | 467,662,584 | ||
| FINANCIALS - 16.3% | |||
| Banks - 10.9% | |||
| Bank of America Corp. | 3,308,315 | 90,581,665 | |
| JPMorgan Chase & Co. | 288,700 | 41,867,274 | |
| M&T Bank Corp. | 68,600 | 8,674,470 | |
| PNC Financial Services Group, Inc. | 261,716 | 32,130,873 | |
| Truist Financial Corp. | 466,226 | 13,338,726 | |
| U.S. Bancorp | 751,142 | 24,832,755 | |
| Wells Fargo & Co. | 4,967,250 | 202,961,835 | |
| 414,387,598 | |||
| Capital Markets - 1.9% | |||
| Charles Schwab Corp. | 7,500 | 411,750 | |
| CME Group, Inc. | 5,100 | 1,021,122 | |
| KKR & Co. LP | 374,685 | 23,080,596 | |
| Morgan Stanley | 160,800 | 13,132,536 | |
| Northern Trust Corp. | 381,195 | 26,485,429 | |
| Raymond James Financial, Inc. | 54,850 | 5,508,586 | |
| State Street Corp. | 40,890 | 2,737,994 | |
| 72,378,013 | |||
| Financial Services - 3.3% | |||
| Edenred SA | 234,900 | 14,722,071 | |
| Fidelity National Information Services, Inc. | 158,400 | 8,754,768 | |
| Global Payments, Inc. | 30,700 | 3,542,473 | |
| MasterCard, Inc. Class A | 38,600 | 15,282,126 | |
| PayPal Holdings, Inc. (b) | 102,100 | 5,968,766 | |
| Radian Group, Inc. | 357,952 | 8,988,175 | |
| Visa, Inc. Class A | 306,800 | 70,567,068 | |
| 127,825,447 | |||
| Insurance - 0.2% | |||
| Chubb Ltd. | 40,200 | 8,368,836 | |
TOTAL FINANCIALS | 622,959,894 | ||
| HEALTH CARE - 13.4% | |||
| Biotechnology - 0.5% | |||
| Alnylam Pharmaceuticals, Inc. (b) | 43,000 | 7,615,300 | |
| Argenx SE ADR (b) | 6,600 | 3,244,758 | |
| Insmed, Inc. (b) | 157,479 | 3,976,345 | |
| Vaxcyte, Inc. (b) | 104,600 | 5,332,508 | |
| Verve Therapeutics, Inc. (b)(c) | 66,900 | 887,094 | |
| 21,056,005 | |||
| Health Care Equipment & Supplies - 2.9% | |||
| Abbott Laboratories | 21,800 | 2,111,330 | |
| Becton, Dickinson & Co. | 40,600 | 10,496,318 | |
| Boston Scientific Corp. (b) | 1,035,451 | 54,671,813 | |
| GE Healthcare Holding LLC | 564,262 | 38,392,386 | |
| Koninklijke Philips Electronics NV (depository receipt) (NY Reg.) (c) | 183,551 | 3,660,007 | |
| 109,331,854 | |||
| Health Care Providers & Services - 5.8% | |||
| Cardinal Health, Inc. | 259,500 | 22,529,790 | |
| Centene Corp. (b) | 34,000 | 2,341,920 | |
| Cigna Group | 168,800 | 48,288,616 | |
| CVS Health Corp. | 329,900 | 23,033,618 | |
| Guardant Health, Inc. (b) | 80,400 | 2,383,056 | |
| Humana, Inc. | 13,200 | 6,422,064 | |
| McKesson Corp. | 91,080 | 39,606,138 | |
| UnitedHealth Group, Inc. | 149,200 | 75,225,148 | |
| 219,830,350 | |||
| Life Sciences Tools & Services - 0.3% | |||
| Danaher Corp. | 45,700 | 11,338,170 | |
| Pharmaceuticals - 3.9% | |||
| Bristol-Myers Squibb Co. | 993,200 | 57,645,328 | |
| Eli Lilly & Co. | 56,520 | 30,358,588 | |
| GSK PLC sponsored ADR | 753,100 | 27,299,875 | |
| Johnson & Johnson | 192,657 | 30,006,328 | |
| Sanofi SA sponsored ADR | 63,000 | 3,379,320 | |
| 148,689,439 | |||
TOTAL HEALTH CARE | 510,245,818 | ||
| INDUSTRIALS - 15.2% | |||
| Aerospace & Defense - 3.4% | |||
| Airbus Group NV | 170,600 | 22,834,551 | |
| General Dynamics Corp. | 49,300 | 10,893,821 | |
| Howmet Aerospace, Inc. | 8,000 | 370,000 | |
| Huntington Ingalls Industries, Inc. | 33,400 | 6,832,972 | |
| RTX Corp. | 62,000 | 4,462,140 | |
| Safran SA | 29,100 | 4,560,239 | |
| Textron, Inc. | 36,800 | 2,875,552 | |
| The Boeing Co. (b) | 410,700 | 78,722,976 | |
| 131,552,251 | |||
| Air Freight & Logistics - 1.7% | |||
| FedEx Corp. | 83,300 | 22,067,836 | |
| United Parcel Service, Inc. Class B | 277,100 | 43,191,577 | |
| 65,259,413 | |||
| Building Products - 0.1% | |||
| Johnson Controls International PLC | 52,400 | 2,788,204 | |
| Commercial Services & Supplies - 0.1% | |||
| ACV Auctions, Inc. Class A (b) | 307,100 | 4,661,778 | |
| Electrical Equipment - 1.5% | |||
| Acuity Brands, Inc. | 62,900 | 10,712,499 | |
| Hubbell, Inc. Class B | 43,218 | 13,544,953 | |
| Regal Rexnord Corp. | 64,700 | 9,244,336 | |
| Vertiv Holdings Co. | 611,000 | 22,729,200 | |
| 56,230,988 | |||
| Ground Transportation - 0.4% | |||
| Knight-Swift Transportation Holdings, Inc. Class A | 290,200 | 14,553,530 | |
| Industrial Conglomerates - 6.6% | |||
| 3M Co. | 33,900 | 3,173,718 | |
| General Electric Co. | 2,250,659 | 248,810,352 | |
| 251,984,070 | |||
| Machinery - 1.0% | |||
| Chart Industries, Inc. (b) | 42,600 | 7,204,512 | |
| Cummins, Inc. | 24,400 | 5,574,424 | |
| Fortive Corp. | 112,100 | 8,313,336 | |
| Nordson Corp. | 3,400 | 758,778 | |
| Otis Worldwide Corp. | 71,750 | 5,762,243 | |
| Stanley Black & Decker, Inc. | 43,700 | 3,652,446 | |
| Westinghouse Air Brake Tech Co. | 48,502 | 5,154,308 | |
| 36,420,047 | |||
| Passenger Airlines - 0.1% | |||
| Copa Holdings SA Class A | 13,500 | 1,203,120 | |
| Ryanair Holdings PLC sponsored ADR (b) | 34,400 | 3,344,024 | |
| 4,547,144 | |||
| Professional Services - 0.3% | |||
| Equifax, Inc. | 15,900 | 2,912,562 | |
| Genpact Ltd. | 145,400 | 5,263,480 | |
| Paycom Software, Inc. | 9,400 | 2,437,138 | |
| 10,613,180 | |||
| Trading Companies & Distributors - 0.0% | |||
| Beijer Ref AB (B Shares) | 112,399 | 1,188,232 | |
TOTAL INDUSTRIALS | 579,798,837 | ||
| INFORMATION TECHNOLOGY - 17.0% | |||
| IT Services - 0.3% | |||
| EPAM Systems, Inc. (b) | 9,300 | 2,377,917 | |
| IBM Corp. | 40,500 | 5,682,150 | |
| Snowflake, Inc. (b) | 3,300 | 504,141 | |
| Twilio, Inc. Class A (b) | 85,300 | 4,992,609 | |
| 13,556,817 | |||
| Semiconductors & Semiconductor Equipment - 3.5% | |||
| Analog Devices, Inc. | 46,200 | 8,089,158 | |
| Applied Materials, Inc. | 88,000 | 12,183,600 | |
| Broadcom, Inc. | 14,000 | 11,628,120 | |
| Lam Research Corp. | 15,700 | 9,840,289 | |
| Marvell Technology, Inc. | 468,767 | 25,374,358 | |
| NVIDIA Corp. | 72,600 | 31,580,274 | |
| Qualcomm, Inc. | 205,690 | 22,843,931 | |
| Taiwan Semiconductor Manufacturing Co. Ltd. sponsored ADR | 129,900 | 11,288,310 | |
| 132,828,040 | |||
| Software - 10.0% | |||
| Adobe, Inc. (b) | 67,900 | 34,622,210 | |
| Autodesk, Inc. (b) | 42,200 | 8,731,602 | |
| DoubleVerify Holdings, Inc. (b) | 64,200 | 1,794,390 | |
| Elastic NV (b) | 121,700 | 9,886,908 | |
| Intuit, Inc. | 23,100 | 11,802,714 | |
| Microsoft Corp. | 853,800 | 269,587,350 | |
| PTC, Inc. (b) | 37,900 | 5,369,672 | |
| Sage Group PLC | 61,900 | 746,934 | |
| Salesforce, Inc. (b) | 17,700 | 3,589,206 | |
| SAP SE sponsored ADR (c) | 253,300 | 32,756,756 | |
| Workday, Inc. Class A (b) | 12,900 | 2,771,565 | |
| 381,659,307 | |||
| Technology Hardware, Storage & Peripherals - 3.2% | |||
| Apple, Inc. | 686,700 | 117,569,907 | |
| Samsung Electronics Co. Ltd. | 84,220 | 4,247,863 | |
| 121,817,770 | |||
TOTAL INFORMATION TECHNOLOGY | 649,861,934 | ||
| MATERIALS - 2.8% | |||
| Chemicals - 0.7% | |||
| DuPont de Nemours, Inc. | 261,500 | 19,505,285 | |
| LyondellBasell Industries NV Class A | 63,400 | 6,003,980 | |
| Sherwin-Williams Co. | 7,400 | 1,887,370 | |
| 27,396,635 | |||
| Metals & Mining - 2.1% | |||
| First Quantum Minerals Ltd. | 1,563,500 | 36,939,234 | |
| Freeport-McMoRan, Inc. | 1,085,479 | 40,477,512 | |
| Ivanhoe Mines Ltd. (b) | 354,700 | 3,039,726 | |
| 80,456,472 | |||
TOTAL MATERIALS | 107,853,107 | ||
| REAL ESTATE - 0.9% | |||
| Equity Real Estate Investment Trusts (REITs) - 0.9% | |||
| American Tower Corp. | 49,900 | 8,206,055 | |
| Crown Castle International Corp. | 135,400 | 12,460,862 | |
| Equinix, Inc. | 1,400 | 1,016,764 | |
| Simon Property Group, Inc. | 134,200 | 14,497,626 | |
| 36,181,307 | |||
| UTILITIES - 0.9% | |||
| Electric Utilities - 0.9% | |||
| Entergy Corp. | 32,200 | 2,978,500 | |
| PG&E Corp. (b) | 227,300 | 3,666,349 | |
| Southern Co. | 435,600 | 28,192,032 | |
| 34,836,881 | |||
| Multi-Utilities - 0.0% | |||
| Sempra | 18,600 | 1,265,358 | |
TOTAL UTILITIES | 36,102,239 | ||
| TOTAL COMMON STOCKS (Cost $2,337,475,109) | 3,736,328,687 | ||
| Preferred Stocks - 0.2% | |||
| Shares | Value ($) | ||
| Convertible Preferred Stocks - 0.0% | |||
| COMMUNICATION SERVICES - 0.0% | |||
| Interactive Media & Services - 0.0% | |||
| Reddit, Inc. Series E (b)(d)(e) | 5,200 | 171,548 | |
| Nonconvertible Preferred Stocks - 0.2% | |||
| INDUSTRIALS - 0.2% | |||
| Aerospace & Defense - 0.2% | |||
| Embraer SA sponsored ADR (b) | 451,800 | 6,198,696 | |
| TOTAL PREFERRED STOCKS (Cost $5,449,043) | 6,370,244 | ||
| Money Market Funds - 2.8% | |||
| Shares | Value ($) | ||
| Fidelity Cash Central Fund 5.39% (f) | 69,608,062 | 69,621,984 | |
| Fidelity Securities Lending Cash Central Fund 5.39% (f)(g) | 38,408,115 | 38,411,956 | |
| TOTAL MONEY MARKET FUNDS (Cost $108,033,939) | 108,033,940 | ||
| TOTAL INVESTMENT IN SECURITIES - 100.9% (Cost $2,450,958,091) | 3,850,732,871 |
NET OTHER ASSETS (LIABILITIES) - (0.9)% | (36,024,087) |
| NET ASSETS - 100.0% | 3,814,708,784 |
| (a) | Security exempt from registration under Rule 144A of the Securities Act of 1933. These securities may be resold in transactions exempt from registration, normally to qualified institutional buyers. At the end of the period, the value of these securities amounted to $5,594,634 or 0.1% of net assets. |
| (b) | Non-income producing |
| (c) | Security or a portion of the security is on loan at period end. |
| (d) | Restricted securities (including private placements) - Investment in securities not registered under the Securities Act of 1933 (excluding 144A issues). At the end of the period, the value of restricted securities (excluding 144A issues) amounted to $171,548 or 0.0% of net assets. |
| (e) | Level 3 security |
| (f) | Affiliated fund that is generally available only to investment companies and other accounts managed by Fidelity Investments. The rate quoted is the annualized seven-day yield of the fund at period end. A complete unaudited listing of the fund's holdings as of its most recent quarter end is available upon request. In addition, each Fidelity Central Fund's financial statements, which are not covered by the Fund's Report of Independent Registered Public Accounting Firm, are available on the SEC's website or upon request. |
| (g) | Investment made with cash collateral received from securities on loan. |
| Additional information on each restricted holding is as follows: | ||
| Security | Acquisition Date | Acquisition Cost ($) |
| Reddit, Inc. Series E | 5/18/21 | 220,866 |
| Affiliate | Value, beginning of period ($) | Purchases ($) | Sales Proceeds ($) | Dividend Income ($) | Realized Gain (loss) ($) | Change in Unrealized appreciation (depreciation) ($) | Value, end of period ($) | % ownership, end of period |
| Fidelity Cash Central Fund 5.39% | 72,038,809 | 238,436,585 | 240,853,411 | 4,229,274 | - | 1 | 69,621,984 | 0.2% |
| Fidelity Securities Lending Cash Central Fund 5.39% | 22,860,131 | 337,602,094 | 322,050,269 | 348,620 | - | - | 38,411,956 | 0.1% |
| Total | 94,898,940 | 576,038,679 | 562,903,680 | 4,577,894 | - | 1 | 108,033,940 | |
| Valuation Inputs at Reporting Date: | ||||
| Description | Total ($) | Level 1 ($) | Level 2 ($) | Level 3 ($) |
Investments in Securities: | ||||
| Equities: | ||||
Communication Services | 376,056,397 | 355,681,184 | 20,203,665 | 171,548 |
Consumer Discretionary | 143,932,282 | 143,932,282 | - | - |
Consumer Staples | 205,845,836 | 205,845,836 | - | - |
Energy | 467,662,584 | 467,662,584 | - | - |
Financials | 622,959,894 | 622,959,894 | - | - |
Health Care | 510,245,818 | 510,245,818 | - | - |
Industrials | 585,997,533 | 558,602,743 | 27,394,790 | - |
Information Technology | 649,861,934 | 645,614,071 | 4,247,863 | - |
Materials | 107,853,107 | 107,853,107 | - | - |
Real Estate | 36,181,307 | 36,181,307 | - | - |
Utilities | 36,102,239 | 36,102,239 | - | - |
| Money Market Funds | 108,033,940 | 108,033,940 | - | - |
| Total Investments in Securities: | 3,850,732,871 | 3,798,715,005 | 51,846,318 | 171,548 |
| Statement of Assets and Liabilities | ||||
| September 30, 2023 | ||||
| Assets | ||||
| Investment in securities, at value (including securities loaned of $37,813,455) - See accompanying schedule: | ||||
Unaffiliated issuers (cost $2,342,924,152) | $ | 3,742,698,931 | ||
Fidelity Central Funds (cost $108,033,939) | 108,033,940 | |||
| Total Investment in Securities (cost $2,450,958,091) | $ | 3,850,732,871 | ||
| Foreign currency held at value (cost $43,742) | 43,739 | |||
| Receivable for investments sold | 762,005 | |||
| Receivable for fund shares sold | 295,929 | |||
| Dividends receivable | 3,789,840 | |||
| Distributions receivable from Fidelity Central Funds | 395,300 | |||
| Prepaid expenses | 5,908 | |||
| Other receivables | 324,293 | |||
Total assets | 3,856,349,885 | |||
| Liabilities | ||||
| Payable for investments purchased | $ | 392,314 | ||
| Payable for fund shares redeemed | 806,910 | |||
| Accrued management fee | 1,700,759 | |||
| Distribution and service plan fees payable | 129,143 | |||
| Other affiliated payables | 102,855 | |||
| Other payables and accrued expenses | 88,295 | |||
| Collateral on securities loaned | 38,420,825 | |||
| Total Liabilities | 41,641,101 | |||
| Net Assets | $ | 3,814,708,784 | ||
| Net Assets consist of: | ||||
| Paid in capital | $ | 2,281,562,788 | ||
| Total accumulated earnings (loss) | 1,533,145,996 | |||
| Net Assets | $ | 3,814,708,784 | ||
| Net Asset Value and Maximum Offering Price | ||||
| Class O : | ||||
Net Asset Value, offering price and redemption price per share ($3,183,537,823 ÷ 163,251,312 shares) | $ | 19.50 | ||
| Class A : | ||||
Net Asset Value and redemption price per share ($584,349,433 ÷ 31,523,623 shares)(a) | $ | 18.54 | ||
| Maximum offering price per share (100/94.25 of $18.54) | $ | 19.67 | ||
| Class M : | ||||
Net Asset Value and redemption price per share ($3,965,165 ÷ 222,533 shares)(a) | $ | 17.82 | ||
| Maximum offering price per share (100/96.50 of $17.82) | $ | 18.47 | ||
| Class C : | ||||
Net Asset Value and offering price per share ($3,662,358 ÷ 217,039 shares)(a) | $ | 16.87 | ||
| Class I : | ||||
Net Asset Value, offering price and redemption price per share ($39,194,005 ÷ 2,001,885 shares) | $ | 19.58 | ||
(a)Redemption price per share is equal to net asset value less any applicable contingent deferred sales charge. | ||||
| Statement of Operations | ||||
Year ended September 30, 2023 | ||||
| Investment Income | ||||
| Dividends | $ | 66,793,359 | ||
| Income from Fidelity Central Funds (including $348,620 from security lending) | 4,577,894 | |||
| Total Income | 71,371,253 | |||
| Expenses | ||||
| Management fee | $ | 19,472,043 | ||
| Transfer agent fees | 4,738,332 | |||
| Distribution and service plan fees | 1,456,102 | |||
| Accounting fees | 902,891 | |||
| Custodian fees and expenses | 95,970 | |||
| Independent trustees' fees and expenses | 20,221 | |||
| Registration fees | 93,937 | |||
| Audit | 74,899 | |||
| Legal | 11,093 | |||
| Miscellaneous | 17,158 | |||
| Total expenses before reductions | 26,882,646 | |||
| Expense reductions | (4,600,209) | |||
| Total expenses after reductions | 22,282,437 | |||
| Net Investment income (loss) | 49,088,816 | |||
| Realized and Unrealized Gain (Loss) | ||||
| Net realized gain (loss) on: | ||||
| Investment Securities: | ||||
| Unaffiliated issuers | 118,575,708 | |||
| Foreign currency transactions | 367,644 | |||
| Total net realized gain (loss) | 118,943,352 | |||
| Change in net unrealized appreciation (depreciation) on: | ||||
| Investment Securities: | ||||
| Unaffiliated issuers | 681,643,088 | |||
| Fidelity Central Funds | 1 | |||
| Assets and liabilities in foreign currencies | 49,097 | |||
| Total change in net unrealized appreciation (depreciation) | 681,692,186 | |||
| Net gain (loss) | 800,635,538 | |||
| Net increase (decrease) in net assets resulting from operations | $ | 849,724,354 | ||
| Statement of Changes in Net Assets | ||||
Year ended September 30, 2023 | Year ended September 30, 2022 | |||
| Increase (Decrease) in Net Assets | ||||
| Operations | ||||
| Net investment income (loss) | $ | 49,088,816 | $ | 48,567,478 |
| Net realized gain (loss) | 118,943,352 | 177,401,543 | ||
| Change in net unrealized appreciation (depreciation) | 681,692,186 | (681,782,978) | ||
| Net increase (decrease) in net assets resulting from operations | 849,724,354 | (455,813,957) | ||
| Distributions to shareholders | (187,739,920) | (224,714,403) | ||
| Share transactions - net increase (decrease) | (10,409,694) | (322,026,152) | ||
| Total increase (decrease) in net assets | 651,574,740 | (1,002,554,512) | ||
| Net Assets | ||||
| Beginning of period | 3,163,134,044 | 4,165,688,556 | ||
| End of period | $ | 3,814,708,784 | $ | 3,163,134,044 |
| Fidelity Advisor® Capital Development Fund Class O |
| Years ended September 30, | 2023 | 2022 | 2021 | 2020 | 2019 | |||||
Selected Per-Share Data | ||||||||||
| Net asset value, beginning of period | $ | 16.18 | $ | 19.65 | $ | 14.71 | $ | 15.41 | $ | 17.96 |
| Income from Investment Operations | ||||||||||
Net investment income (loss) A,B | .26 | .25 | .37 C | .29 | .31 | |||||
| Net realized and unrealized gain (loss) | 4.04 | (2.60) | 5.32 | .21 | (.79) D | |||||
| Total from investment operations | 4.30 | (2.35) | 5.69 | .50 | (.48) | |||||
| Distributions from net investment income | (.26) | (.38) | (.28) | (.31) | (.28) | |||||
| Distributions from net realized gain | (.71) | (.73) | (.47) | (.88) | (1.80) | |||||
| Total distributions | (.98) E | (1.12) E | (.75) | (1.20) E | (2.07) E | |||||
| Net asset value, end of period | $ | 19.50 | $ | 16.18 | $ | 19.65 | $ | 14.71 | $ | 15.41 |
Total Return F | 27.44% | (12.87)% | 39.61% | 2.62% | (1.43)% D,G | |||||
Ratios to Average Net Assets B,H,I | ||||||||||
| Expenses before reductions | .68% | .68% | .70% | .72% | .70% | |||||
| Expenses net of fee waivers, if any | .55% | .56% | .56% | .57% | .58% | |||||
| Expenses net of all reductions | .55% | .56% | .56% | .57% | .57% | |||||
| Net investment income (loss) | 1.37% | 1.31% | 2.03% C | 1.95% | 2.07% | |||||
| Supplemental Data | ||||||||||
| Net assets, end of period (000 omitted) | $ | 3,183,538 | $ | 2,660,011 | $ | 3,567,329 | $ | 2,663,852 | $ | 2,611,342 |
Portfolio turnover rate J | 12% | 11% | 16% | 26% | 38% |
| Fidelity Advisor® Capital Development Fund Class A |
| Years ended September 30, | 2023 | 2022 | 2021 | 2020 | 2019 | |||||
Selected Per-Share Data | ||||||||||
| Net asset value, beginning of period | $ | 15.42 | $ | 18.78 | $ | 14.09 | $ | 14.80 | $ | 17.34 |
| Income from Investment Operations | ||||||||||
Net investment income (loss) A,B | .19 | .19 | .31 C | .24 | .26 | |||||
| Net realized and unrealized gain (loss) | 3.86 | (2.49) | 5.09 | .20 | (.77) D | |||||
| Total from investment operations | 4.05 | (2.30) | 5.40 | .44 | (.51) | |||||
| Distributions from net investment income | (.21) | (.33) | (.24) | (.27) | (.23) | |||||
| Distributions from net realized gain | (.71) | (.73) | (.47) | (.88) | (1.80) | |||||
| Total distributions | (.93) E | (1.06) | (.71) | (1.15) | (2.03) | |||||
| Net asset value, end of period | $ | 18.54 | $ | 15.42 | $ | 18.78 | $ | 14.09 | $ | 14.80 |
Total Return F,G | 27.10% | (13.15)% | 39.21% | 2.37% | (1.76)% D,H | |||||
Ratios to Average Net Assets B,I,J | ||||||||||
| Expenses before reductions | .96% | .96% | .97% | 1.00% | 1.00% | |||||
| Expenses net of fee waivers, if any | .84% | .85% | .85% | .86% | .87% | |||||
| Expenses net of all reductions | .84% | .85% | .85% | .86% | .86% | |||||
| Net investment income (loss) | 1.08% | 1.01% | 1.74% C | 1.66% | 1.78% | |||||
| Supplemental Data | ||||||||||
| Net assets, end of period (000 omitted) | $ | 584,349 | $ | 467,810 | $ | 552,638 | $ | 425,890 | $ | 433,610 |
Portfolio turnover rate K | 12% | 11% | 16% | 26% | 38% |
| Fidelity Advisor® Capital Development Fund Class M |
| Years ended September 30, | 2023 | 2022 | 2021 | 2020 | 2019 | |||||
Selected Per-Share Data | ||||||||||
| Net asset value, beginning of period | $ | 14.85 | $ | 18.12 | $ | 13.61 | $ | 14.34 | $ | 16.85 |
| Income from Investment Operations | ||||||||||
Net investment income (loss) A,B | .11 | .10 | .21 C | .16 | .18 | |||||
| Net realized and unrealized gain (loss) | 3.71 | (2.39) | 4.93 | .18 | (.75) D | |||||
| Total from investment operations | 3.82 | (2.29) | 5.14 | .34 | (.57) | |||||
| Distributions from net investment income | (.14) | (.24) | (.17) | (.19) | (.14) | |||||
| Distributions from net realized gain | (.71) | (.73) | (.47) | (.88) | (1.80) | |||||
| Total distributions | (.85) | (.98) E | (.63) E | (1.07) | (1.94) | |||||
| Net asset value, end of period | $ | 17.82 | $ | 14.85 | $ | 18.12 | $ | 13.61 | $ | 14.34 |
Total Return F,G | 26.51% | (13.54)% | 38.61% | 1.76% | (2.27)% D | |||||
Ratios to Average Net Assets B,H,I | ||||||||||
| Expenses before reductions | 1.31% | 1.32% | 1.33% | 1.37% | 1.40% | |||||
| Expenses net of fee waivers, if any | 1.30% | 1.32% | 1.33% | 1.37% | 1.40% | |||||
| Expenses net of all reductions | 1.29% | 1.32% | 1.33% | 1.36% | 1.40% | |||||
| Net investment income (loss) | .64% | .54% | 1.25% C | 1.16% | 1.24% | |||||
| Supplemental Data | ||||||||||
| Net assets, end of period (000 omitted) | $ | 3,965 | $ | 3,152 | $ | 3,476 | $ | 2,468 | $ | 3,294 |
Portfolio turnover rate J | 12% | 11% | 16% | 26% | 38% |
| Fidelity Advisor® Capital Development Fund Class C |
| Years ended September 30, | 2023 | 2022 | 2021 | 2020 | 2019 | |||||
Selected Per-Share Data | ||||||||||
| Net asset value, beginning of period | $ | 14.10 | $ | 17.28 | $ | 12.99 | $ | 13.73 | $ | 16.23 |
| Income from Investment Operations | ||||||||||
Net investment income (loss) A,B | .02 | .01 | .13 C | .09 | .11 | |||||
| Net realized and unrealized gain (loss) | 3.53 | (2.27) | 4.70 | .19 | (.73) D | |||||
| Total from investment operations | 3.55 | (2.26) | 4.83 | .28 | (.62) | |||||
| Distributions from net investment income | (.06) | (.19) | (.07) | (.14) | (.09) | |||||
| Distributions from net realized gain | (.71) | (.73) | (.47) | (.88) | (1.80) | |||||
| Total distributions | (.78) E | (.92) | (.54) | (1.02) | (1.88) E | |||||
| Net asset value, end of period | $ | 16.87 | $ | 14.10 | $ | 17.28 | $ | 12.99 | $ | 13.73 |
Total Return F,G | 25.89% | (13.95)% | 37.89% | 1.39% | (2.72)% D | |||||
Ratios to Average Net Assets B,H,I | ||||||||||
| Expenses before reductions | 1.78% | 1.78% | 1.80% | 1.83% | 1.83% | |||||
| Expenses net of fee waivers, if any | 1.77% | 1.78% | 1.80% | 1.83% | 1.83% | |||||
| Expenses net of all reductions | 1.77% | 1.78% | 1.80% | 1.82% | 1.82% | |||||
| Net investment income (loss) | .15% | .08% | .79% C | .70% | .82% | |||||
| Supplemental Data | ||||||||||
| Net assets, end of period (000 omitted) | $ | 3,662 | $ | 2,807 | $ | 2,607 | $ | 1,956 | $ | 3,247 |
Portfolio turnover rate J | 12% | 11% | 16% | 26% | 38% |
| Fidelity Advisor® Capital Development Fund Class I |
| Years ended September 30, | 2023 | 2022 | 2021 | 2020 | 2019 | |||||
Selected Per-Share Data | ||||||||||
| Net asset value, beginning of period | $ | 16.24 | $ | 19.73 | $ | 14.77 | $ | 15.46 | $ | 18.03 |
| Income from Investment Operations | ||||||||||
Net investment income (loss) A,B | .23 | .22 | .35 C | .27 | .29 | |||||
| Net realized and unrealized gain (loss) | 4.06 | (2.62) | 5.34 | .22 | (.81) D | |||||
| Total from investment operations | 4.29 | (2.40) | 5.69 | .49 | (.52) | |||||
| Distributions from net investment income | (.23) | (.36) | (.26) | (.29) | (.26) | |||||
| Distributions from net realized gain | (.71) | (.73) | (.47) | (.88) | (1.80) | |||||
| Total distributions | (.95) E | (1.09) | (.73) | (1.18) E | (2.05) E | |||||
| Net asset value, end of period | $ | 19.58 | $ | 16.24 | $ | 19.73 | $ | 14.77 | $ | 15.46 |
Total Return F | 27.23% | (13.03)% | 39.40% | 2.54% | (1.68)% D | |||||
Ratios to Average Net Assets B,G,H | ||||||||||
| Expenses before reductions | .72% | .72% | .71% | .72% | .73% | |||||
| Expenses net of fee waivers, if any | .72% | .72% | .71% | .72% | .73% | |||||
| Expenses net of all reductions | .72% | .72% | .71% | .71% | .73% | |||||
| Net investment income (loss) | 1.21% | 1.15% | 1.87% C | 1.81% | 1.91% | |||||
| Supplemental Data | ||||||||||
| Net assets, end of period (000 omitted) | $ | 39,194 | $ | 29,353 | $ | 39,639 | $ | 11,438 | $ | 12,138 |
Portfolio turnover rate I | 12% | 11% | 16% | 26% | 38% |
| Fidelity Central Fund | Investment Manager | Investment Objective | Investment Practices | Expense RatioA |
| Fidelity Money Market Central Funds | Fidelity Management & Research Company LLC (FMR) | Each fund seeks to obtain a high level of current income consistent with the preservation of capital and liquidity. | Short-term Investments | Less than .005% |
| Fidelity Advisor Capital Development Fund | $17,608 |
| Gross unrealized appreciation | $1,515,769,418 |
| Gross unrealized depreciation | (120,623,207) |
| Net unrealized appreciation (depreciation) | $1,395,146,211 |
| Tax Cost | $2,455,586,660 |
| Undistributed ordinary income | $37,274,119 |
| Undistributed long-term capital gain | $101,037,620 |
| Net unrealized appreciation (depreciation) on securities and other investments | $1,394,834,255 |
| September 30, 2023 | September 30, 2022 | |
| Ordinary Income | $49,458,020 | $98,611,674 |
| Long-term Capital Gains | 138,281,900 | 126,102,729 |
| Total | $187,739,920 | $224,714,403 |
| Purchases ($) | Sales ($) | |
| Fidelity Advisor Capital Development Fund | 430,273,772 | 574,150,340 |
| Distribution Fee | Service Fee | Total Fees | Retained by FDC | |
| Class A | - % | .25% | $1,402,219 | $14,800 |
| Class M | .25% | .25% | 18,836 | 44 |
| Class C | .75% | .25% | 35,047 | 4,219 |
| $1,456,102 | $19,063 |
| Retained by FDC | |
| Class A | $37,258 |
| Class M | 688 |
Class C A | 311 |
| $38,257 |
| Amount | % of Class-Level Average Net Assets | |
| Class O | $ 3,806,461 | .12 |
| Class A | 855,393 | .15 |
| Class M | 9,378 | .25 |
| Class C | 7,766 | .22 |
| Class I | 59,334 | .16 |
| $4,738,332 |
| % of Average Net Assets | |
| Fidelity Advisor Capital Development Fund | .02 |
| Amount | |
| Fidelity Advisor Capital Development Fund | $8,729 |
| Purchases ($) | Sales ($) | Realized Gain (Loss) ($) | |
| Fidelity Advisor Capital Development Fund | 35,599,220 | 21,586,369 | 7,278,511 |
| Amount | |
| Fidelity Advisor Capital Development Fund | $6,700 |
| Total Security Lending Fees Paid to NFS | Security Lending Income From Securities Loaned to NFS | Value of Securities Loaned to NFS at Period End | |
| Fidelity Advisor Capital Development Fund | $36,525 | $- | $- |
| Transfer Agent Fees Limitation | Waiver | |
| Class O | .00% | $3,792,368 |
| Class A | .04% | 625,122 |
| Expense reduction | |
| Class M | $485 |
Year ended September 30, 2023 | Year ended September 30, 2022 | |
| Fidelity Advisor Capital Development Fund | ||
| Distributions to shareholders | ||
| Class O | $ 157,550,598 | $191,175,178 |
| Class A | 28,132,043 | 31,061,621 |
| Class M | 178,543 | 181,972 |
| Class C | 155,227 | 154,286 |
| Class I | 1,723,509 | 2,141,346 |
Total | $187,739,920 | $224,714,403 |
| Shares | Shares | Dollars | Dollars | |
Year ended September 30, 2023 | Year ended September 30, 2022 | Year ended September 30, 2023 | Year ended September 30, 2022 | |
| Fidelity Advisor Capital Development Fund | ||||
| Class O | ||||
| Shares sold | 1,394,169 | 2,274,309 | $26,041,932 | $44,524,973 |
| Reinvestment of distributions | 8,928,558 | 9,628,440 | 152,142,622 | 185,058,616 |
| Shares redeemed | (11,499,950) | (29,010,632) | (211,065,655) | (566,420,710) |
| Net increase (decrease) | (1,177,223) | (17,107,883) | $(32,881,101) | $(336,837,121) |
| Class A | ||||
| Shares sold | 1,510,371 | 1,347,054 | $26,993,379 | $24,709,340 |
| Reinvestment of distributions | 1,722,233 | 1,681,559 | 27,951,846 | 30,873,426 |
| Shares redeemed | (2,050,894) | (2,117,176) | (36,458,279) | (38,725,031) |
| Net increase (decrease) | 1,181,710 | 911,437 | $18,486,946 | $16,857,735 |
| Class M | ||||
| Shares sold | 18,498 | 36,811 | $324,912 | $658,898 |
| Reinvestment of distributions | 11,401 | 10,252 | 178,543 | 181,972 |
| Shares redeemed | (19,700) | (26,601) | (341,738) | (468,862) |
| Net increase (decrease) | 10,199 | 20,462 | $161,717 | $372,008 |
| Class C | ||||
| Shares sold | 78,989 | 158,585 | $1,294,892 | $2,739,763 |
| Reinvestment of distributions | 10,125 | 8,891 | 150,667 | 150,435 |
| Shares redeemed | (71,176) | (119,205) | (1,166,413) | (1,940,174) |
| Net increase (decrease) | 17,938 | 48,271 | $279,146 | $950,024 |
| Class I | ||||
| Shares sold | 508,367 | 649,695 | $9,591,290 | $13,036,781 |
| Reinvestment of distributions | 89,390 | 96,947 | 1,531,242 | 1,873,010 |
| Shares redeemed | (403,840) | (948,147) | (7,578,934) | (18,278,589) |
| Net increase (decrease) | 193,917 | (201,505) | $3,543,598 | $(3,368,798) |
| The Example is based on an investment of $1,000 invested at the beginning of the period and held for the entire period (April 1, 2023 to September 30, 2023). |
Annualized Expense Ratio- A | Beginning Account Value April 1, 2023 | Ending Account Value September 30, 2023 | Expenses Paid During Period- C April 1, 2023 to September 30, 2023 | |||||||
| Fidelity Advisor® Capital Development Fund | ||||||||||
| Class O | .55% | |||||||||
| Actual | $ 1,000 | $ 1,058.60 | $ 2.84 | |||||||
Hypothetical-B | $ 1,000 | $ 1,022.31 | $ 2.79 | |||||||
| Class A | .84% | |||||||||
| Actual | $ 1,000 | $ 1,057.60 | $ 4.33 | |||||||
Hypothetical-B | $ 1,000 | $ 1,020.86 | $ 4.26 | |||||||
| Class M | 1.29% | |||||||||
| Actual | $ 1,000 | $ 1,055.10 | $ 6.65 | |||||||
Hypothetical-B | $ 1,000 | $ 1,018.60 | $ 6.53 | |||||||
| Class C | 1.76% | |||||||||
| Actual | $ 1,000 | $ 1,052.40 | $ 9.06 | |||||||
Hypothetical-B | $ 1,000 | $ 1,016.24 | $ 8.90 | |||||||
| Class I | .71% | |||||||||
| Actual | $ 1,000 | $ 1,057.80 | $ 3.66 | |||||||
Hypothetical-B | $ 1,000 | $ 1,021.51 | $ 3.60 | |||||||
 |
Item 2.
Code of Ethics
As of the end of the period, September 30, 2023, Fidelity Destiny Portfolios (the trust) has adopted a code of ethics, as defined in Item 2 of Form N-CSR, that applies to its President and Treasurer and its Chief Financial Officer. A copy of the code of ethics is filed as an exhibit to this Form N-CSR.
Item 3.
Audit Committee Financial Expert
The Board of Trustees of the trust has determined that Donald F. Donahue is an audit committee financial expert, as defined in Item 3 of Form N-CSR. Mr. Donahue is independent for purposes of Item 3 of Form N-CSR.
Item 4.
Principal Accountant Fees and Services
Fees and Services
The following table presents fees billed by Deloitte & Touche LLP, the member firms of Deloitte Touche Tohmatsu, and their respective affiliates (collectively, “Deloitte Entities”) in each of the last two fiscal years for services rendered to Fidelity Advisor Capital Development Fund and Fidelity Advisor Diversified Stock Fund (the “Fund(s)”):
Services Billed by Deloitte Entities
September 30, 2023 FeesA
Audit Fees | Audit-Related Fees | Tax Fees | All Other Fees | |
Fidelity Advisor Capital Development Fund | $53,200 | $- | $10,500 | $1,400 |
Fidelity Advisor Diversified Stock Fund | $62,700 | $- | $10,800 | $1,600 |
September 30, 2022 FeesA
Audit Fees | Audit-Related Fees | Tax Fees | All Other Fees | |
Fidelity Advisor Capital Development Fund | $52,500 | $- | $10,000 | $1,300 |
Fidelity Advisor Diversified Stock Fund | $62,000 | $- | $10,300 | $1,400 |
A Amounts may reflect rounding.
The following table(s) present(s) fees billed by Deloitte Entities that were required to be approved by the Audit Committee for services that relate directly to the operations and financial reporting of the Fund(s) and that are rendered on behalf of Fidelity Management & Research Company LLC ("FMR") and entities controlling, controlled by, or under common control with FMR (not including any sub-adviser whose role is primarily portfolio management and is subcontracted with or overseen by another investment adviser) that provide ongoing services to the Fund(s) (“Fund Service Providers”):
Services Billed by Deloitte Entities
September 30, 2023A | September 30, 2022A | |
Audit-Related Fees | $- | $- |
Tax Fees | $- | $- |
All Other Fees | $- | $- |
A Amounts may reflect rounding.
“Audit-Related Fees” represent fees billed for assurance and related services that are reasonably related to the performance of the fund audit or the review of the fund's financial statements and that are not reported under Audit Fees.
“Tax Fees” represent fees billed for tax compliance, tax advice or tax planning that relate directly to the operations and financial reporting of the fund.
“All Other Fees” represent fees billed for services provided to the fund or Fund Service Provider, a significant portion of which are assurance related, that relate directly to the operations and financial reporting of the fund, excluding those services that are reported under Audit Fees, Audit-Related Fees or Tax Fees.
Assurance services must be performed by an independent public accountant.
* * *
The aggregate non-audit fees billed by Deloitte Entities for services rendered to the Fund(s), FMR (not including any sub-adviser whose role is primarily portfolio management and is subcontracted with or overseen by another investment adviser), and any Fund Service Provider for each of the last two fiscal years of the Fund(s) are as follows:
Billed By | September 30, 2023A | September 30, 2022A |
Deloitte Entities | $266,900 | $480,600 |
A Amounts may reflect rounding.
The trust's Audit Committee has considered non-audit services that were not pre-approved that were provided by Deloitte Entities to Fund Service Providers to be compatible with maintaining the independence of Deloitte Entities in its(their) audit of the Fund(s), taking into account representations from Deloitte Entities, in accordance with Public Company Accounting Oversight Board rules, regarding its independence from the Fund(s) and its(their) related entities and FMR’s review of the appropriateness and permissibility under applicable law of such non-audit services prior to their provision to the Fund(s) Service Providers.
Audit Committee Pre-Approval Policies and Procedures
The trust’s Audit Committee must pre-approve all audit and non-audit services provided by a fund’s independent registered public accounting firm relating to the operations or financial reporting of the fund. Prior to the commencement of any audit or non-audit services to a fund, the Audit Committee reviews the services to determine whether they are appropriate and permissible under applicable law.
The Audit Committee has adopted policies and procedures to, among other purposes, provide a framework for the Committee’s consideration of non-audit services by the audit firms that audit the Fidelity funds. The policies and procedures require that any non-audit service provided by a fund audit firm to a Fidelity fund and any non-audit service provided by a fund auditor to a Fund Service Provider that relates directly to the operations and financial reporting of a Fidelity fund (“Covered Service”) are subject to approval by the Audit Committee before such service is provided.
All Covered Services must be approved in advance of provision of the service either: (i) by formal resolution of the Audit Committee, or (ii) by oral or written approval of the service by the Chair of the Audit Committee (or if the Chair is unavailable, such other member of the Audit Committee as may be designated by the Chair to act in the Chair’s absence). The approval contemplated by (ii) above is permitted where the Treasurer determines that action on such an engagement is necessary before the next meeting of the Audit Committee.
Non-audit services provided by a fund audit firm to a Fund Service Provider that do not relate directly to the operations and financial reporting of a Fidelity fund are reported to the Audit Committee periodically.
Non-Audit Services Approved Pursuant to Rule 2-01(c)(7)(i)(C) and (ii) of Regulation S-X (“De Minimis Exception”)
There were no non-audit services approved or required to be approved by the Audit Committee pursuant to the De Minimis Exception during the Fund’s(s’) last two fiscal years relating to services provided to (i) the Fund(s) or (ii) any Fund Service Provider that relate directly to the operations and financial reporting of the Fund(s).
The Registrant has not retained, for the preparation of the audit report on the financial statements included in the Form N-CSR, a registered public accounting firm that has a branch or office that is located in a foreign jurisdiction and that the Public Company Accounting Oversight Board (the “PCAOB”) has determined that the PCAOB is unable to inspect or investigate completely because of a position taken by an authority in the foreign jurisdiction.
The Registrant is not a “foreign issuer,” as defined in 17 CFR 240.3b-4.
Item 5.
Audit Committee of Listed Registrants
Not applicable.
Item 6.
Investments
(a)
Not applicable.
(b)
Not applicable.
Item 7.
Disclosure of Proxy Voting Policies and Procedures for Closed-End Management Investment Companies
Not applicable.
Item 8.
Portfolio Managers of Closed-End Management Investment Companies
Not applicable.
Item 9.
Purchase of Equity Securities by Closed-End Management Investment Company and Affiliated Purchasers
Not applicable.
Item 10.
Submission of Matters to a Vote of Security Holders
There were no material changes to the procedures by which shareholders may recommend nominees to the trust’s Board of Trustees.
Item 11.
Controls and Procedures
(a)(i) The President and Treasurer and the Chief Financial Officer have concluded that the trust’s disclosure controls and procedures (as defined in Rule 30a-3(c) under the Investment Company Act) provide reasonable assurances that material information relating to the trust is made known to them by the appropriate persons, based on their evaluation of these controls and procedures as of a date within 90 days of the filing date of this report.
(a)(ii) There was no change in the trust’s internal control over financial reporting (as defined in Rule 30a-3(d) under the Investment Company Act) that occurred during the period covered by this report that has materially affected, or is reasonably likely to materially affect, the trust’s internal control over financial reporting.
Item 12.
Disclosure of Securities Lending Activities for Closed-End Management
Investment Companies
Not applicable.
Item 13.
Exhibits
(a) | (1) | Code of Ethics pursuant to Item 2 of Form N-CSR is filed and attached hereto as EX-99.CODE ETH. |
(a) | (2) | |
(a) | (3) | Not applicable. |
(b) |
SIGNATURES
Pursuant to the requirements of the Securities Exchange Act of 1934 and the Investment Company Act of 1940, the registrant has duly caused this report to be signed on its behalf by the undersigned, thereunto duly authorized.
Fidelity Destiny Portfolios
By: | /s/Stacie M. Smith |
Stacie M. Smith | |
President and Treasurer | |
Date: | November 21, 2023 |
Pursuant to the requirements of the Securities Exchange Act of 1934 and the Investment Company Act of 1940, this report has been signed below by the following persons on behalf of the registrant and in the capacities and on the dates indicated.
By: | /s/Stacie M. Smith |
Stacie M. Smith | |
President and Treasurer | |
Date: | November 21, 2023 |
By: | /s/John J. Burke III |
John J. Burke III | |
Chief Financial Officer | |
Date: | November 21, 2023 |