UNITED STATES
SECURITIES AND EXCHANGE COMMISSION
Washington, D.C. 20549
FORM N-CSR
CERTIFIED SHAREHOLDER REPORT OF REGISTERED
MANAGEMENT INVESTMENT COMPANIES
Investment Company Act file number 811-01352
Fidelity Devonshire Trust
(Exact name of registrant as specified in charter)
245 Summer St., Boston, MA 02210
(Address of principal executive offices) (Zip code)
Cynthia Lo Bessette, Secretary
245 Summer St.
Boston, Massachusetts 02210
(Name and address of agent for service)
Registrant's telephone number, including area code:
617-563-7000
| |
Date of fiscal year end: | January 31 |
|
|
Date of reporting period: | July 31, 2021 |
Item 1.
Reports to Stockholders
Fidelity® Equity-Income Fund
Semi-Annual Report
July 31, 2021


Contents
To view a fund's proxy voting guidelines and proxy voting record for the 12-month period ended June 30, visit http://www.fidelity.com/proxyvotingresults or visit the Securities and Exchange Commission's (SEC) web site at http://www.sec.gov.
You may also call 1-800-544-8544 if you’re an individual investing directly with Fidelity, call 1-800-835-5092 if you’re a plan sponsor or participant with Fidelity as your recordkeeper or call 1-877-208-0098 on institutional accounts or if you’re an advisor or invest through one to request a free copy of the proxy voting guidelines.
Standard & Poor's, S&P and S&P 500 are registered service marks of The McGraw-Hill Companies, Inc. and have been licensed for use by Fidelity Distributors Corporation.
Other third-party marks appearing herein are the property of their respective owners.
All other marks appearing herein are registered or unregistered trademarks or service marks of FMR LLC or an affiliated company. © 2021 FMR LLC. All rights reserved.
This report and the financial statements contained herein are submitted for the general information of the shareholders of the Fund. This report is not authorized for distribution to prospective investors in the Fund unless preceded or accompanied by an effective prospectus.
A fund files its complete schedule of portfolio holdings with the SEC for the first and third quarters of each fiscal year on Form N-PORT. Forms N-PORT are available on the SEC’s web site at http://www.sec.gov. A fund's Forms N-PORT may be reviewed and copied at the SEC’s Public Reference Room in Washington, DC. Information regarding the operation of the SEC's Public Reference Room may be obtained by calling 1-800-SEC-0330.
For a complete list of a fund's portfolio holdings, view the most recent holdings listing, semiannual report, or annual report on Fidelity's web site at http://www.fidelity.com, http://www.institutional.fidelity.com, or http://www.401k.com, as applicable.
NOT FDIC INSURED •MAY LOSE VALUE •NO BANK GUARANTEE
Neither the Fund nor Fidelity Distributors Corporation is a bank.
Note to Shareholders:
Early in 2020, the outbreak and spread of a new coronavirus emerged as a public health emergency that had a major influence on financial markets, primarily based on its impact on the global economy and the outlook for corporate earnings. The virus causes a respiratory disease known as COVID-19. On March 11, 2020 the World Health Organization declared the COVID-19 outbreak a pandemic, citing sustained risk of further global spread.
In the weeks following, as the crisis worsened, we witnessed an escalating human tragedy with wide-scale social and economic consequences from coronavirus-containment measures. The outbreak of COVID-19 prompted a number of measures to limit the spread, including travel and border restrictions, quarantines, and restrictions on large gatherings. In turn, these resulted in lower consumer activity, diminished demand for a wide range of products and services, disruption in manufacturing and supply chains, and – given the wide variability in outcomes regarding the outbreak – significant market uncertainty and volatility. Amid the turmoil, global governments and central banks took unprecedented action to help support consumers, businesses, and the broader economies, and to limit disruption to financial systems.
The situation continues to unfold, and the extent and duration of its impact on financial markets and the economy remain highly uncertain. Extreme events such as the coronavirus crisis are “exogenous shocks” that can have significant adverse effects on mutual funds and their investments. Although multiple asset classes may be affected by market disruption, the duration and impact may not be the same for all types of assets.
Fidelity is committed to helping you stay informed amid news about COVID-19 and during increased market volatility, and we’re taking extra steps to be responsive to customer needs. We encourage you to visit our websites, where we offer ongoing updates, commentary, and analysis on the markets and our funds.
Investment Summary (Unaudited)
Top Ten Stocks as of July 31, 2021
| | % of fund's net assets |
| JPMorgan Chase & Co. | 3.3 |
| Bank of America Corp. | 2.5 |
| Johnson & Johnson | 2.2 |
| Danaher Corp. | 2.2 |
| Wells Fargo & Co. | 2.2 |
| UnitedHealth Group, Inc. | 2.2 |
| The Walt Disney Co. | 1.9 |
| Procter & Gamble Co. | 1.8 |
| Comcast Corp. Class A | 1.8 |
| Cisco Systems, Inc. | 1.8 |
| | 21.9 |
Top Five Market Sectors as of July 31, 2021
| | % of fund's net assets |
| Financials | 18.9 |
| Health Care | 18.2 |
| Industrials | 11.2 |
| Information Technology | 10.6 |
| Communication Services | 8.6 |
Asset Allocation (% of fund's net assets)
| As of July 31, 2021* |
| | Stocks | 97.5% |
| | Other Investments | 0.2% |
| | Short-Term Investments and Net Other Assets (Liabilities) | 2.3% |

* Foreign investments - 17.6%
Schedule of Investments July 31, 2021 (Unaudited)
Showing Percentage of Net Assets
| Common Stocks - 97.5% | | | |
| | | Shares | Value (000s) |
| COMMUNICATION SERVICES - 8.6% | | | |
| Diversified Telecommunication Services - 0.8% | | | |
| AT&T, Inc. | | 695,382 | $19,505 |
| Verizon Communications, Inc. | | 777,185 | 43,351 |
| | | | 62,856 |
| Entertainment - 1.9% | | | |
| The Walt Disney Co. (a) | | 840,640 | 147,969 |
| Interactive Media & Services - 1.3% | | | |
| Alphabet, Inc. Class A (a) | | 38,547 | 103,866 |
| Media - 3.3% | | | |
| Comcast Corp. Class A | | 2,413,127 | 141,964 |
| Interpublic Group of Companies, Inc. | | 1,780,860 | 62,971 |
| Shaw Communications, Inc. Class B | | 680,784 | 19,884 |
| WPP PLC | | 2,826,603 | 36,557 |
| | | | 261,376 |
| Wireless Telecommunication Services - 1.3% | | | |
| Rogers Communications, Inc. Class B (non-vtg.) | | 143,054 | 7,302 |
| T-Mobile U.S., Inc. (a) | | 620,717 | 89,396 |
| | | | 96,698 |
|
| TOTAL COMMUNICATION SERVICES | | | 672,765 |
|
| CONSUMER DISCRETIONARY - 6.2% | | | |
| Hotels, Restaurants & Leisure - 1.2% | | | |
| McDonald's Corp. | | 381,144 | 92,507 |
| Household Durables - 0.6% | | | |
| Tempur Sealy International, Inc. | | 1,031,592 | 44,637 |
| Internet & Direct Marketing Retail - 0.2% | | | |
| eBay, Inc. | | 293,829 | 20,042 |
| Multiline Retail - 1.5% | | | |
| Kohl's Corp. | | 744,222 | 37,806 |
| Nordstrom, Inc. (a) | | 460,069 | 15,228 |
| Target Corp. | | 261,180 | 68,181 |
| | | | 121,215 |
| Specialty Retail - 1.9% | | | |
| Best Buy Co., Inc. | | 209,543 | 23,542 |
| Burlington Stores, Inc. (a) | | 122,580 | 41,040 |
| Dick's Sporting Goods, Inc. (b) | | 219,941 | 22,905 |
| Lowe's Companies, Inc. | | 103,954 | 20,031 |
| The Home Depot, Inc. | | 62,755 | 20,596 |
| TJX Companies, Inc. | | 292,088 | 20,099 |
| | | | 148,213 |
| Textiles, Apparel & Luxury Goods - 0.8% | | | |
| PVH Corp. (a) | | 214,751 | 22,467 |
| Tapestry, Inc. (a) | | 923,703 | 39,073 |
| | | | 61,540 |
|
| TOTAL CONSUMER DISCRETIONARY | | | 488,154 |
|
| CONSUMER STAPLES - 7.9% | | | |
| Beverages - 2.3% | | | |
| Diageo PLC | | 812,334 | 40,281 |
| Keurig Dr. Pepper, Inc. (b) | | 1,616,021 | 56,900 |
| The Coca-Cola Co. | | 1,470,675 | 83,873 |
| | | | 181,054 |
| Food & Staples Retailing - 2.0% | | | |
| BJ's Wholesale Club Holdings, Inc. (a) | | 490,037 | 24,815 |
| Costco Wholesale Corp. | | 80,157 | 34,445 |
| Walmart, Inc. | | 669,441 | 95,429 |
| | | | 154,689 |
| Food Products - 1.8% | | | |
| Bunge Ltd. | | 269,072 | 20,888 |
| Lamb Weston Holdings, Inc. | | 459,047 | 30,651 |
| Mondelez International, Inc. | | 1,138,497 | 72,021 |
| Nestle SA (Reg. S) | | 164,056 | 20,774 |
| | | | 144,334 |
| Household Products - 1.8% | | | |
| Procter & Gamble Co. | | 1,016,115 | 144,522 |
|
| TOTAL CONSUMER STAPLES | | | 624,599 |
|
| ENERGY - 5.4% | | | |
| Oil, Gas & Consumable Fuels - 5.4% | | | |
| Canadian Natural Resources Ltd. | | 1,073,303 | 35,418 |
| ConocoPhillips Co. | | 661,436 | 37,080 |
| Enterprise Products Partners LP | | 1,617,921 | 36,516 |
| Exxon Mobil Corp. | | 2,383,485 | 137,217 |
| Hess Corp. | | 312,500 | 23,888 |
| Imperial Oil Ltd. | | 1,205,598 | 33,029 |
| Phillips 66 Co. | | 501,539 | 36,828 |
| Suncor Energy, Inc. | | 2,357,442 | 46,408 |
| Thungela Resources Ltd. (a)(b) | | 60,989 | 189 |
| Valero Energy Corp. | | 525,207 | 35,173 |
| | | | 421,746 |
| FINANCIALS - 18.9% | | | |
| Banks - 12.4% | | | |
| Bank of America Corp. | | 5,059,614 | 194,087 |
| Citigroup, Inc. | | 1,551,072 | 104,883 |
| Huntington Bancshares, Inc./Ohio | | 3,258,775 | 45,884 |
| JPMorgan Chase & Co. | | 1,725,780 | 261,945 |
| M&T Bank Corp. | | 628,142 | 84,077 |
| PNC Financial Services Group, Inc. | | 603,548 | 110,093 |
| Wells Fargo & Co. | | 3,758,898 | 172,684 |
| | | | 973,653 |
| Capital Markets - 1.6% | | | |
| BlackRock, Inc. Class A | | 83,085 | 72,049 |
| KKR & Co. LP | | 906,977 | 57,829 |
| | | | 129,878 |
| Consumer Finance - 1.6% | | | |
| Capital One Financial Corp. | | 779,296 | 126,012 |
| Insurance - 3.3% | | | |
| American Financial Group, Inc. | | 328,920 | 41,605 |
| American International Group, Inc. | | 553,352 | 26,201 |
| Chubb Ltd. | | 403,661 | 68,114 |
| Hartford Financial Services Group, Inc. | | 569,829 | 36,253 |
| Old Republic International Corp. | | 1,334,404 | 32,906 |
| The Travelers Companies, Inc. | | 350,872 | 52,252 |
| | | | 257,331 |
|
| TOTAL FINANCIALS | | | 1,486,874 |
|
| HEALTH CARE - 18.2% | | | |
| Biotechnology - 2.6% | | | |
| AbbVie, Inc. | | 852,290 | 99,121 |
| Amgen, Inc. | | 443,315 | 107,078 |
| | | | 206,199 |
| Health Care Equipment & Supplies - 2.2% | | | |
| Danaher Corp. | | 580,624 | 172,730 |
| Health Care Providers & Services - 3.0% | | | |
| Cigna Corp. | | 291,867 | 66,981 |
| UnitedHealth Group, Inc. | | 415,961 | 171,467 |
| | | | 238,448 |
| Pharmaceuticals - 10.4% | | | |
| AstraZeneca PLC (United Kingdom) | | 669,616 | 76,945 |
| Bristol-Myers Squibb Co. | | 2,026,435 | 137,534 |
| Eli Lilly & Co. | | 515,480 | 125,519 |
| Johnson & Johnson | | 1,019,128 | 175,494 |
| Merck & Co., Inc. | | 1,457,200 | 112,015 |
| Roche Holding AG (participation certificate) | | 209,052 | 80,759 |
| Sanofi SA | | 1,022,904 | 105,434 |
| | | | 813,700 |
|
| TOTAL HEALTH CARE | | | 1,431,077 |
|
| INDUSTRIALS - 11.2% | | | |
| Aerospace & Defense - 2.1% | | | |
| Huntington Ingalls Industries, Inc. | | 88,500 | 18,154 |
| Northrop Grumman Corp. | | 179,393 | 65,123 |
| The Boeing Co. (a) | | 344,721 | 78,072 |
| | | | 161,349 |
| Air Freight & Logistics - 1.4% | | | |
| Deutsche Post AG | | 566,658 | 38,403 |
| United Parcel Service, Inc. Class B | | 379,589 | 72,638 |
| | | | 111,041 |
| Building Products - 0.8% | | | |
| Johnson Controls International PLC | | 845,015 | 60,351 |
| Electrical Equipment - 0.8% | | | |
| AMETEK, Inc. | | 464,267 | 64,556 |
| Industrial Conglomerates - 2.8% | | | |
| General Electric Co. | | 7,165,765 | 92,797 |
| Hitachi Ltd. | | 337,900 | 19,436 |
| Roper Technologies, Inc. | | 148,046 | 72,741 |
| Siemens AG | | 241,535 | 37,687 |
| | | | 222,661 |
| Machinery - 2.5% | | | |
| Crane Co. | | 233,384 | 22,692 |
| Fortive Corp. | | 514,467 | 37,381 |
| ITT, Inc. | | 464,254 | 45,455 |
| Nordson Corp. | | 143,148 | 32,370 |
| Otis Worldwide Corp. | | 636,732 | 57,019 |
| | | | 194,917 |
| Marine - 0.2% | | | |
| A.P. Moller - Maersk A/S Series B | | 6,667 | 18,502 |
| Trading Companies & Distributors - 0.3% | | | |
| Watsco, Inc. | | 80,640 | 22,776 |
| Transportation Infrastructure - 0.3% | | | |
| Aena SME SA (a)(c) | | 155,900 | 24,818 |
|
| TOTAL INDUSTRIALS | | | 880,971 |
|
| INFORMATION TECHNOLOGY - 10.6% | | | |
| Communications Equipment - 1.8% | | | |
| Cisco Systems, Inc. | | 2,513,554 | 139,175 |
| IT Services - 2.6% | | | |
| Accenture PLC Class A | | 178,900 | 56,833 |
| Amdocs Ltd. | | 1,062,256 | 81,911 |
| Genpact Ltd. | | 898,351 | 44,747 |
| Visa, Inc. Class A | | 82,653 | 20,365 |
| | | | 203,856 |
| Semiconductors & Semiconductor Equipment - 2.7% | | | |
| NXP Semiconductors NV | | 451,050 | 93,092 |
| Qualcomm, Inc. | | 259,517 | 38,876 |
| Taiwan Semiconductor Manufacturing Co. Ltd. sponsored ADR | | 667,276 | 77,831 |
| | | | 209,799 |
| Software - 2.1% | | | |
| Microsoft Corp. | | 366,642 | 104,460 |
| NortonLifeLock, Inc. | | 861,814 | 21,390 |
| Open Text Corp. | | 771,790 | 40,087 |
| | | | 165,937 |
| Technology Hardware, Storage & Peripherals - 1.4% | | | |
| Apple, Inc. | | 278,556 | 40,630 |
| Samsung Electronics Co. Ltd. | | 1,081,010 | 73,614 |
| | | | 114,244 |
|
| TOTAL INFORMATION TECHNOLOGY | | | 833,011 |
|
| MATERIALS - 2.9% | | | |
| Chemicals - 1.2% | | | |
| Linde PLC | | 274,382 | 84,342 |
| Nutrien Ltd. | | 128,400 | 7,634 |
| | | | 91,976 |
| Containers & Packaging - 1.3% | | | |
| Crown Holdings, Inc. | | 545,948 | 54,464 |
| Packaging Corp. of America | | 326,900 | 46,256 |
| | | | 100,720 |
| Metals & Mining - 0.4% | | | |
| Anglo American PLC (United Kingdom) | | 566,977 | 25,125 |
| Lundin Mining Corp. | | 871,700 | 7,944 |
| | | | 33,069 |
|
| TOTAL MATERIALS | | | 225,765 |
|
| REAL ESTATE - 2.3% | | | |
| Equity Real Estate Investment Trusts (REITs) - 2.3% | | | |
| American Tower Corp. | | 186,177 | 52,651 |
| Lamar Advertising Co. Class A | | 761,697 | 81,197 |
| Public Storage | | 145,624 | 45,505 |
| | | | 179,353 |
| UTILITIES - 5.3% | | | |
| Electric Utilities - 2.7% | | | |
| Exelon Corp. | | 984,336 | 46,067 |
| NextEra Energy, Inc. | | 1,377,226 | 107,286 |
| NRG Energy, Inc. | | 1,090,709 | 44,981 |
| PG&E Corp. (a) | | 1,354,272 | 11,904 |
| | | | 210,238 |
| Independent Power and Renewable Electricity Producers - 0.4% | | | |
| Vistra Corp. | | 1,884,922 | 36,096 |
| Multi-Utilities - 2.2% | | | |
| Ameren Corp. | | 432,496 | 36,295 |
| CenterPoint Energy, Inc. | | 1,333,966 | 33,963 |
| Dominion Energy, Inc. | | 824,648 | 61,741 |
| WEC Energy Group, Inc. | | 425,090 | 40,018 |
| | | | 172,017 |
|
| TOTAL UTILITIES | | | 418,351 |
|
| TOTAL COMMON STOCKS | | | |
| (Cost $5,297,172) | | | 7,662,666 |
|
| Other - 0.2% | | | |
| Energy - 0.2% | | | |
| Oil, Gas & Consumable Fuels - 0.2% | | | |
| Utica Shale Drilling Program (non-operating revenue interest) (d)(e)(f) | | | |
| (Cost $22,679) | | 22,678,929 | 11,823 |
|
| Money Market Funds - 2.6% | | | |
| Fidelity Cash Central Fund 0.06% (g) | | 173,861,350 | 173,896 |
| Fidelity Securities Lending Cash Central Fund 0.06% (g)(h) | | 30,349,323 | 30,352 |
| TOTAL MONEY MARKET FUNDS | | | |
| (Cost $204,248) | | | 204,248 |
| TOTAL INVESTMENT IN SECURITIES - 100.3% | | | |
| (Cost $5,524,099) | | | 7,878,737 |
| NET OTHER ASSETS (LIABILITIES) - (0.3)% | | | (23,234) |
| NET ASSETS - 100% | | | $7,855,503 |
Legend
(a) Non-income producing
(b) Security or a portion of the security is on loan at period end.
(c) Security exempt from registration under Rule 144A of the Securities Act of 1933. These securities may be resold in transactions exempt from registration, normally to qualified institutional buyers. At the end of the period, the value of these securities amounted to $24,818,000 or 0.3% of net assets.
(d) Investment is owned by a wholly-owned subsidiary (Subsidiary) that is treated as a corporation for U.S. tax purposes.
(e) Restricted securities (including private placements) - Investment in securities not registered under the Securities Act of 1933 (excluding 144A issues). At the end of the period, the value of restricted securities (excluding 144A issues) amounted to $11,823,000 or 0.2% of net assets.
(f) Level 3 security
(g) Affiliated fund that is generally available only to investment companies and other accounts managed by Fidelity Investments. The rate quoted is the annualized seven-day yield of the fund at period end. A complete unaudited listing of the fund's holdings as of its most recent quarter end is available upon request. In addition, each Fidelity Central Fund's financial statements are available on the SEC's website or upon request.
(h) Investment made with cash collateral received from securities on loan.
Additional information on each restricted holding is as follows:
| Security | Acquisition Date | Acquisition Cost (000s) |
| Utica Shale Drilling Program (non-operating revenue interest) | 10/5/16 - 9/1/17 | $22,679 |
Affiliated Central Funds
Information regarding fiscal year to date income earned by the Fund from investments in Fidelity Central Funds is as follows:
| Fund | Income earned |
| | (Amounts in thousands) |
| Fidelity Cash Central Fund | $59 |
| Fidelity Securities Lending Cash Central Fund | 41 |
| Total | $100 |
Amounts in the income column in the above table include any capital gain distributions from underlying funds, which are presented in the corresponding line-item in the Statement of Operations, if applicable. Amount for Fidelity Securities Lending Cash Central Fund represents the income earned on investing cash collateral, less rebates paid to borrowers and any lending agent fees associated with the loan, plus any premium payments received for lending certain types of securities.
Fiscal year to date information regarding the Fund's investments in Fidelity Central Funds, including the ownership percentage, is presented below.
| Fund (Amounts in thousands) | Value, beginning of period | Purchases | Sales Proceeds | Realized Gain/Loss | Change in Unrealized appreciation (depreciation) | Value, end of period | % ownership, end of period |
| Fidelity Cash Central Fund 0.06% | $137,942 | $369,834 | $333,879 | $(1) | $-- | $173,896 | 0.3% |
| Fidelity Securities Lending Cash Central Fund 0.06% | 19,580 | 319,344 | 308,572 | -- | -- | 30,352 | 0.1% |
| Total | $157,522 | $689,178 | $642,451 | $(1) | $-- | $204,248 | |
Investment Valuation
The following is a summary of the inputs used, as of July 31, 2021, involving the Fund's assets and liabilities carried at fair value. The inputs or methodology used for valuing securities may not be an indication of the risk associated with investing in those securities. For more information on valuation inputs, and their aggregation into the levels used below, please refer to the Investment Valuation section in the accompanying Notes to Financial Statements.
| | Valuation Inputs at Reporting Date: |
| Description | Total | Level 1 | Level 2 | Level 3 |
| (Amounts in thousands) | | | | |
| Investments in Securities: | | | | |
| Equities: | | | | |
| Communication Services | $672,765 | $636,208 | $36,557 | $-- |
| Consumer Discretionary | 488,154 | 488,154 | -- | -- |
| Consumer Staples | 624,599 | 563,544 | 61,055 | -- |
| Energy | 421,746 | 421,746 | -- | -- |
| Financials | 1,486,874 | 1,486,874 | -- | -- |
| Health Care | 1,431,077 | 1,167,939 | 263,138 | -- |
| Industrials | 880,971 | 766,943 | 114,028 | -- |
| Information Technology | 833,011 | 833,011 | -- | -- |
| Materials | 225,765 | 200,640 | 25,125 | -- |
| Real Estate | 179,353 | 179,353 | -- | -- |
| Utilities | 418,351 | 418,351 | -- | -- |
| Other | 11,823 | -- | -- | 11,823 |
| Money Market Funds | 204,248 | 204,248 | -- | -- |
| Total Investments in Securities: | $7,878,737 | $7,367,011 | $499,903 | $11,823 |
Other Information
Distribution of investments by country or territory of incorporation, as a percentage of Total Net Assets, is as follows (Unaudited):
| United States of America | 82.4% |
| Ireland | 2.6% |
| Canada | 2.5% |
| Switzerland | 2.1% |
| United Kingdom | 1.8% |
| France | 1.4% |
| Netherlands | 1.2% |
| Bailiwick of Guernsey | 1.0% |
| Taiwan | 1.0% |
| Germany | 1.0% |
| Others (Individually Less Than 1%) | 3.0% |
| | 100.0% |
See accompanying notes which are an integral part of the financial statements.
Financial Statements
Statement of Assets and Liabilities
| Amounts in thousands (except per-share amounts) | | July 31, 2021 (Unaudited) |
| Assets | | |
Investment in securities, at value (including securities loaned of $29,885) — See accompanying schedule:
Unaffiliated issuers (cost $5,319,851) | $7,674,489 | |
| Fidelity Central Funds (cost $204,248) | 204,248 | |
| Total Investment in Securities (cost $5,524,099) | | $7,878,737 |
| Restricted cash | | 189 |
| Receivable for fund shares sold | | 2,035 |
| Dividends receivable | | 11,939 |
| Distributions receivable from Fidelity Central Funds | | 12 |
| Prepaid expenses | | 6 |
| Other receivables | | 1,321 |
| Total assets | | 7,894,239 |
| Liabilities | | |
| Payable for fund shares redeemed | $3,486 | |
| Accrued management fee | 2,772 | |
| Other affiliated payables | 881 | |
| Other payables and accrued expenses | 1,245 | |
| Collateral on securities loaned | 30,352 | |
| Total liabilities | | 38,736 |
| Net Assets | | $7,855,503 |
| Net Assets consist of: | | |
| Paid in capital | | $4,959,976 |
| Total accumulated earnings (loss) | | 2,895,527 |
| Net Assets | | $7,855,503 |
| Net Asset Value and Maximum Offering Price | | |
| Equity-Income: | | |
| Net Asset Value, offering price and redemption price per share ($7,101,399 ÷ 99,539 shares) | | $71.34 |
| Class K: | | |
| Net Asset Value, offering price and redemption price per share ($754,104 ÷ 10,578 shares) | | $71.29 |
See accompanying notes which are an integral part of the financial statements.
Statement of Operations
| Amounts in thousands | | Six months ended July 31, 2021 (Unaudited) |
| Investment Income | | |
| Dividends | | $83,232 |
| Income from Fidelity Central Funds (including $41 from security lending) | | 100 |
| Total income | | 83,332 |
| Expenses | | |
| Management fee | $16,008 | |
| Transfer agent fees | 4,542 | |
| Accounting fees | 592 | |
| Custodian fees and expenses | 67 | |
| Independent trustees' fees and expenses | 14 | |
| Registration fees | 85 | |
| Audit | 50 | |
| Legal | 11 | |
| Miscellaneous | 18 | |
| Total expenses before reductions | 21,387 | |
| Expense reductions | (275) | |
| Total expenses after reductions | | 21,112 |
| Net investment income (loss) | | 62,220 |
| Realized and Unrealized Gain (Loss) | | |
| Net realized gain (loss) on: | | |
| Investment securities: | | |
| Unaffiliated issuers | 580,342 | |
| Fidelity Central Funds | (1) | |
| Foreign currency transactions | (236) | |
| Total net realized gain (loss) | | 580,105 |
| Change in net unrealized appreciation (depreciation) on: | | |
| Investment securities: | | |
| Unaffiliated issuers | 565,274 | |
| Assets and liabilities in foreign currencies | (29) | |
| Total change in net unrealized appreciation (depreciation) | | 565,245 |
| Net gain (loss) | | 1,145,350 |
| Net increase (decrease) in net assets resulting from operations | | $1,207,570 |
See accompanying notes which are an integral part of the financial statements.
Statement of Changes in Net Assets
| Amounts in thousands | Six months ended July 31, 2021 (Unaudited) | Year ended January 31, 2021 |
| Increase (Decrease) in Net Assets | | |
| Operations | | |
| Net investment income (loss) | $62,220 | $100,292 |
| Net realized gain (loss) | 580,105 | 200,391 |
| Change in net unrealized appreciation (depreciation) | 565,245 | 156,037 |
| Net increase (decrease) in net assets resulting from operations | 1,207,570 | 456,720 |
| Distributions to shareholders | (166,416) | (219,443) |
| Share transactions - net increase (decrease) | 219,385 | 191,539 |
| Total increase (decrease) in net assets | 1,260,539 | 428,816 |
| Net Assets | | |
| Beginning of period | 6,594,964 | 6,166,148 |
| End of period | $7,855,503 | $6,594,964 |
See accompanying notes which are an integral part of the financial statements.
Financial Highlights
Fidelity Equity-Income Fund
| | Six months ended (Unaudited) July 31, | Years endedJanuary 31, | | | | |
| | 2021 | 2021 | 2020 | 2019 | 2018 | 2017 |
| Selected Per–Share Data | | | | | | |
| Net asset value, beginning of period | $61.74 | $59.36 | $54.70 | $63.45 | $57.76 | $48.57 |
| Income from Investment Operations | | | | | | |
| Net investment income (loss)A | .57 | .97 | 1.19 | 1.44 | 1.30 | 1.22 |
| Net realized and unrealized gain (loss) | 10.57 | 3.52 | 7.81 | (5.22) | 8.52 | 10.43 |
| Total from investment operations | 11.14 | 4.49 | 9.00 | (3.78) | 9.82 | 11.65 |
| Distributions from net investment income | (.54) | (.94) | (1.10) | (1.39) | (1.20)B | (1.36) |
| Distributions from net realized gain | (1.00) | (1.17) | (3.24) | (3.58) | (2.93)B | (1.10) |
| Total distributions | (1.54) | (2.11) | (4.34) | (4.97) | (4.13) | (2.46) |
| Net asset value, end of period | $71.34 | $61.74 | $59.36 | $54.70 | $63.45 | $57.76 |
| Total ReturnC,D | 18.23% | 7.93% | 16.69% | (5.91)% | 17.57% | 24.42% |
| Ratios to Average Net AssetsE,F | | | | | | |
| Expenses before reductions | .58%G | .60% | .60% | .61% | .61% | .63% |
| Expenses net of fee waivers, if any | .58%G | .60% | .60% | .61% | .61% | .63% |
| Expenses net of all reductions | .57%G | .59% | .60% | .60% | .61% | .62% |
| Net investment income (loss) | 1.64%G | 1.75% | 2.04% | 2.50% | 2.18% | 2.27% |
| Supplemental Data | | | | | | |
| Net assets, end of period (in millions) | $7,101 | $5,940 | $5,378 | $5,016 | $5,921 | $6,686 |
| Portfolio turnover rateH | 54%G,I | 50%I | 32%I | 24%I | 33% | 36% |
A Calculated based on average shares outstanding during the period.
B The amounts shown reflect certain reclassifications related to book to tax differences that were made in the year shown.
C Total returns for periods of less than one year are not annualized.
D Total returns would have been lower if certain expenses had not been reduced during the applicable periods shown.
E Fees and expenses of any underlying mutual funds or exchange-traded funds (ETFs) are not included in the Fund's expense ratio. The Fund indirectly bears its proportionate share of these expenses. For additional expense information related to investments in Fidelity Central Funds, please refer to the "Investments in Fidelity Central Funds" note found in the Notes to Financial Statements section of the most recent Annual or Semi-Annual report.
F Expense ratios reflect operating expenses of the class. Expenses before reductions do not reflect amounts reimbursed, waived, or reduced through arrangements with the investment adviser, brokerage services, or other offset arrangements, if applicable, and do not represent the amount paid by the class during periods when reimbursements, waivers or reductions occur.
G Annualized
H Amount does not include the portfolio activity of any underlying mutual funds or exchange-traded funds (ETFs).
I Portfolio turnover rate excludes securities received or delivered in-kind.
See accompanying notes which are an integral part of the financial statements.
Fidelity Equity-Income Fund Class K
| | Six months ended (Unaudited) July 31, | Years endedJanuary 31, | | | | |
| | 2021 | 2021 | 2020 | 2019 | 2018 | 2017 |
| Selected Per–Share Data | | | | | | |
| Net asset value, beginning of period | $61.69 | $59.31 | $54.67 | $63.41 | $57.73 | $48.55 |
| Income from Investment Operations | | | | | | |
| Net investment income (loss)A | .60 | 1.02 | 1.24 | 1.51 | 1.36 | 1.28 |
| Net realized and unrealized gain (loss) | 10.57 | 3.52 | 7.80 | (5.22) | 8.51 | 10.42 |
| Total from investment operations | 11.17 | 4.54 | 9.04 | (3.71) | 9.87 | 11.70 |
| Distributions from net investment income | (.57) | (.99) | (1.16) | (1.45) | (1.26)B | (1.42) |
| Distributions from net realized gain | (1.00) | (1.17) | (3.24) | (3.58) | (2.93)B | (1.10) |
| Total distributions | (1.57) | (2.16) | (4.40) | (5.03) | (4.19) | (2.52) |
| Net asset value, end of period | $71.29 | $61.69 | $59.31 | $54.67 | $63.41 | $57.73 |
| Total ReturnC,D | 18.29% | 8.04% | 16.77% | (5.81)% | 17.68% | 24.56% |
| Ratios to Average Net AssetsE,F | | | | | | |
| Expenses before reductions | .49%G | .50% | .51% | .51% | .51% | .52% |
| Expenses net of fee waivers, if any | .49%G | .50% | .51% | .51% | .51% | .52% |
| Expenses net of all reductions | .48%G | .50% | .50% | .50% | .51% | .51% |
| Net investment income (loss) | 1.73%G | 1.84% | 2.13% | 2.60% | 2.28% | 2.39% |
| Supplemental Data | | | | | | |
| Net assets, end of period (in millions) | $754 | $655 | $788 | $807 | $1,623 | $1,791 |
| Portfolio turnover rateH | 54%G,I | 50%I | 32%I | 24%I | 33% | 36% |
A Calculated based on average shares outstanding during the period.
B The amounts shown reflect certain reclassifications related to book to tax differences that were made in the year shown.
C Total returns for periods of less than one year are not annualized.
D Total returns would have been lower if certain expenses had not been reduced during the applicable periods shown.
E Fees and expenses of any underlying mutual funds or exchange-traded funds (ETFs) are not included in the Fund's expense ratio. The Fund indirectly bears its proportionate share of these expenses. For additional expense information related to investments in Fidelity Central Funds, please refer to the "Investments in Fidelity Central Funds" note found in the Notes to Financial Statements section of the most recent Annual or Semi-Annual report.
F Expense ratios reflect operating expenses of the class. Expenses before reductions do not reflect amounts reimbursed, waived, or reduced through arrangements with the investment adviser, brokerage services, or other offset arrangements, if applicable, and do not represent the amount paid by the class during periods when reimbursements, waivers or reductions occur.
G Annualized
H Amount does not include the portfolio activity of any underlying mutual funds or exchange-traded funds (ETFs).
I Portfolio turnover rate excludes securities received or delivered in-kind.
See accompanying notes which are an integral part of the financial statements.
Notes to Financial Statements (Unaudited)
For the period ended July 31, 2021
(Amounts in thousands except percentages)
1. Organization.
Fidelity Equity-Income Fund (the Fund) is a fund of Fidelity Devonshire Trust (the Trust) and is authorized to issue an unlimited number of shares. The Trust is registered under the Investment Company Act of 1940, as amended (the 1940 Act), as an open-end management investment company organized as a Massachusetts business trust. The Fund offers Equity-Income and Class K shares, each of which has equal rights as to assets and voting privileges. Each class has exclusive voting rights with respect to matters that affect that class.
2. Investments in Fidelity Central Funds.
Funds may invest in Fidelity Central Funds, which are open-end investment companies generally available only to other investment companies and accounts managed by the investment adviser and its affiliates. The Schedule of Investments lists any Fidelity Central Funds held as an investment as of period end, but does not include the underlying holdings of each Fidelity Central Fund. An investing fund indirectly bears its proportionate share of the expenses of the underlying Fidelity Central Funds.
Based on its investment objective, each Fidelity Central Fund may invest or participate in various investment vehicles or strategies that are similar to those of the investing fund. These strategies are consistent with the investment objectives of the investing fund and may involve certain economic risks which may cause a decline in value of each of the Fidelity Central Funds and thus a decline in the value of the investing fund.
| Fidelity Central Fund | Investment Manager | Investment Objective | Investment Practices | Expense Ratio(a) |
| Fidelity Money Market Central Funds | Fidelity Management & Research Company LLC (FMR) | Each fund seeks to obtain a high level of current income consistent with the preservation of capital and liquidity. | Short-term Investments | Ranged from less than .005% to .01% |
(a) Expenses expressed as a percentage of average net assets and are as of each underlying Central Fund's most recent annual or semi-annual shareholder report.
A complete unaudited list of holdings for each Fidelity Central Fund is available upon request or at the Securities and Exchange Commission website at www.sec.gov. In addition, the financial statements of the Fidelity Central Funds which contain the significant accounting policies (including investment valuation policies) of those funds, and are not covered by the Report of Independent Registered Public Accounting Firm, are available on the Securities and Exchange Commission website or upon request.
3. Significant Accounting Policies.
The Fund is an investment company and applies the accounting and reporting guidance of the Financial Accounting Standards Board (FASB) Accounting Standards Codification Topic 946 Financial Services - Investment Companies. The financial statements have been prepared in conformity with accounting principles generally accepted in the United States of America (GAAP), which require management to make certain estimates and assumptions at the date of the financial statements. Actual results could differ from those estimates. Subsequent events, if any, through the date that the financial statements were issued have been evaluated in the preparation of the financial statements. The Fund's Schedule of Investments lists any underlying mutual funds or exchange-traded funds (ETFs) but does not include the underlying holdings of these funds. The following summarizes the significant accounting policies of the Fund:
Investment Valuation. Investments are valued as of 4:00 p.m. Eastern time on the last calendar day of the period. The Board of Trustees (the Board) has delegated the day to day responsibility for the valuation of the Fund's investments to the Fair Value Committee (the Committee) established by the Fund's investment adviser. In accordance with valuation policies and procedures approved by the Board, the Fund attempts to obtain prices from one or more third party pricing vendors or brokers to value its investments. When current market prices, quotations or currency exchange rates are not readily available or reliable, investments will be fair valued in good faith by the Committee, in accordance with procedures adopted by the Board. Factors used in determining fair value vary by investment type and may include market or investment specific events. The frequency with which these procedures are used cannot be predicted and they may be utilized to a significant extent. The Committee oversees the Fund's valuation policies and procedures and reports to the Board on the Committee's activities and fair value determinations. The Board monitors the appropriateness of the procedures used in valuing the Fund's investments and ratifies the fair value determinations of the Committee.
The Fund categorizes the inputs to valuation techniques used to value its investments into a disclosure hierarchy consisting of three levels as shown below:
- Level 1 – quoted prices in active markets for identical investments
- Level 2 – other significant observable inputs (including quoted prices for similar investments, interest rates, prepayment speeds, etc.)
- Level 3 – unobservable inputs (including the Fund's own assumptions based on the best information available)
Valuation techniques used to value the Fund's investments by major category are as follows:
Equity securities, including restricted securities, for which market quotations are readily available, are valued at the last reported sale price or official closing price as reported by a third party pricing vendor on the primary market or exchange on which they are traded and are categorized as Level 1 in the hierarchy. In the event there were no sales during the day or closing prices are not available, securities are valued at the last quoted bid price or may be valued using the last available price and are generally categorized as Level 2 in the hierarchy. For foreign equity securities, when market or security specific events arise, comparisons to the valuation of American Depositary Receipts (ADRs), futures contracts, Exchange-Traded Funds (ETFs) and certain indexes as well as quoted prices for similar securities may be used and would be categorized as Level 2 in the hierarchy. For equity securities, including restricted securities, where observable inputs are limited, assumptions about market activity and risk are used and these securities may be categorized as Level 3 in the hierarchy.
Investments in open-end mutual funds, including the Fidelity Central Funds, are valued at their closing net asset value (NAV) each business day and are categorized as Level 1 in the hierarchy.
Changes in valuation techniques may result in transfers in or out of an assigned level within the disclosure hierarchy. The aggregate value of investments by input level as of July 31, 2021 is included at the end of the Fund's Schedule of Investments.
Foreign Currency. Certain Funds may use foreign currency contracts to facilitate transactions in foreign-denominated securities. Gains and losses from these transactions may arise from changes in the value of the foreign currency or if the counterparties do not perform under the contracts' terms.
Foreign-denominated assets, including investment securities, and liabilities are translated into U.S. dollars at the exchange rates at period end. Purchases and sales of investment securities, income and dividends received, and expenses denominated in foreign currencies are translated into U.S. dollars at the exchange rate in effect on the transaction date.
The effects of exchange rate fluctuations on investments are included with the net realized and unrealized gain (loss) on investment securities. Other foreign currency transactions resulting in realized and unrealized gain (loss) are disclosed separately.
Investment Transactions and Income. For financial reporting purposes, the Fund's investment holdings and NAV include trades executed through the end of the last business day of the period. The NAV per share for processing shareholder transactions is calculated as of the close of business of the New York Stock Exchange (NYSE), normally 4:00 p.m. Eastern time and includes trades executed through the end of the prior business day. Gains and losses on securities sold are determined on the basis of identified cost and include proceeds received from litigation. Dividend income is recorded on the ex-dividend date, except for certain dividends from foreign securities where the ex-dividend date may have passed, which are recorded as soon as the Fund is informed of the ex-dividend date. Non-cash dividends included in dividend income, if any, are recorded at the fair market value of the securities received. Income and capital gain distributions from Fidelity Central Funds, if any, are recorded on the ex-dividend date. Certain distributions received by the Fund represent a return of capital or capital gain. The Fund determines the components of these distributions subsequent to the ex-dividend date, based upon receipt of tax filings or other correspondence relating to the underlying investment. These distributions are recorded as a reduction of cost of investments and/or as a realized gain. Investment income is recorded net of foreign taxes withheld where recovery of such taxes is uncertain.
Class Allocations and Expenses. Investment income, realized and unrealized capital gains and losses, common expenses of a fund, and certain fund-level expense reductions, if any, are allocated daily on a pro-rata basis to each class based on the relative net assets of each class to the total net assets of a fund. Each class differs with respect to transfer agent and distribution and service plan fees incurred, as applicable. Certain expense reductions may also differ by class, if applicable. For the reporting period, the allocated portion of income and expenses to each class as a percent of its average net assets may vary due to the timing of recording these transactions in relation to fluctuating net assets of the classes. Expenses directly attributable to a fund are charged to that fund. Expenses attributable to more than one fund are allocated among the respective funds on the basis of relative net assets or other appropriate methods. Expenses included in the accompanying financial statements reflect the expenses of that fund and do not include any expenses associated with any underlying mutual funds or exchange-traded funds. Although not included in a fund's expenses, a fund indirectly bears its proportionate share of these expenses through the net asset value of each underlying mutual fund or exchange-traded fund. Expense estimates are accrued in the period to which they relate and adjustments are made when actual amounts are known.
Deferred Trustee Compensation. Under a Deferred Compensation Plan (the Plan) for certain Funds, certain independent Trustees have elected to defer receipt of a portion of their annual compensation. Deferred amounts are invested in affiliated mutual funds, are marked-to-market and remain in a fund until distributed in accordance with the Plan. The investment of deferred amounts and the offsetting payable to the Trustees presented below are included in the accompanying Statement of Assets and Liabilities in other receivables and other payables and accrued expenses, as applicable.
| Fidelity Equity-Income Fund | $1,155 |
Income Tax Information and Distributions to Shareholders. Each year, the Fund intends to qualify as a regulated investment company under Subchapter M of the Internal Revenue Code, including distributing substantially all of its taxable income and realized gains. As a result, no provision for U.S. Federal income taxes is required. The Fund files a U.S. federal tax return, in addition to state and local tax returns as required. The Fund's federal income tax returns are subject to examination by the Internal Revenue Service (IRS) for a period of three fiscal years after they are filed. State and local tax returns may be subject to examination for an additional fiscal year depending on the jurisdiction. Foreign taxes are provided for based on the Fund's understanding of the tax rules and rates that exist in the foreign markets in which it invests.
Distributions are declared and recorded on the ex-dividend date. Income and capital gain distributions are declared separately for each class. Income and capital gain distributions are determined in accordance with income tax regulations, which may differ from GAAP.
Capital accounts within the financial statements are adjusted for permanent book-tax differences. These adjustments have no impact on net assets or the results of operations. Capital accounts are not adjusted for temporary book-tax differences which will reverse in a subsequent period.
Book-tax differences are primarily due to foreign currency transactions, passive foreign investment companies (PFIC), redemptions in kind, partnerships, deferred trustees compensation and losses deferred due to wash sales.
As of period end, the cost and unrealized appreciation (depreciation) in securities, and derivatives if applicable, for federal income tax purposes were as follows:
| Gross unrealized appreciation | $2,433,456 |
| Gross unrealized depreciation | (110,733) |
| Net unrealized appreciation (depreciation) | $2,322,723 |
| Tax cost | $5,556,014 |
Restricted Securities (including Private Placements). Funds may invest in securities that are subject to legal or contractual restrictions on resale. These securities generally may be resold in transactions exempt from registration or to the public if the securities are registered. Disposal of these securities may involve time-consuming negotiations and expense, and prompt sale at an acceptable price may be difficult. Information regarding restricted securities held at period end is included at the end of the Schedule of Investments, if applicable.
Consolidated Subsidiary. The Funds included in the table below hold certain investments through a wholly-owned subsidiary ("Subsidiary"), which may be subject to federal and state taxes upon disposition.
As of period end, investments in Subsidiaries were as follows:
| | $ Amount | % of Net Assets |
| Fidelity Equity-Income Fund | 12,012 | .15 |
The financial statements have been consolidated to include the Subsidiary accounts where applicable. Accordingly, all inter-company transactions and balances have been eliminated.
At period end, any estimated tax liability for these investments is presented as "Deferred taxes" in the Statement of Assets and Liabilities and included in "Change in net unrealized appreciation (depreciation) on investment securities" in the Statement of Operations. The tax liability incurred may differ materially depending on conditions when these investments are disposed. Any cash held by a Subsidiary is restricted as to its use and is presented as "Restricted cash" in the Statement of Assets and Liabilities, if applicable.
4. Purchases and Sales of Investments.
Purchases and sales of securities, other than short-term securities and in-kind transactions, as applicable, are noted in the table below.
| | Purchases ($) | Sales ($) |
| Fidelity Equity-Income Fund | 2,044,151 | 1,936,039 |
Unaffiliated Redemptions In-Kind. Shares that were redeemed in-kind for investments, including accrued interest and cash, if any, are shown in the table below. The net realized gain or loss on investments delivered through in-kind redemptions is included in the accompanying Statement of Operations. The amount of the in-kind redemptions is included in share transactions in the accompanying Statement of Changes in Net Assets. There was no gain or loss for federal income tax purposes.
| | Shares | Total net realized gain or loss
($) | Total Proceeds
($) | Participating classes |
| Fidelity Equity-Income Fund | 415 | 13,022 | 29,474 | Class K |
Prior Fiscal Year Unaffiliated Redemptions In-Kind. Shares that were redeemed in-kind for investments, including accrued interest and cash, if any, are shown in the table below; along with realized gain or loss on investments delivered through in-kind redemptions. The amount of the in-kind redemptions is included in share transactions in the accompanying Statement of Changes in Net Assets. There was no gain or loss for federal income tax purposes.
| | Shares | Total net realized gain or loss
($) | Total Proceeds
($) | Participating classes |
| Fidelity Equity-Income Fund | 20 | 379 | 1,116 | Class K |
5. Fees and Other Transactions with Affiliates.
Management Fee. Fidelity Management & Research Company LLC (the investment adviser) and its affiliates provide the Fund with investment management related services for which the Fund pays a monthly management fee. The management fee is the sum of an individual fund fee rate that is based on an annual rate of .20% of the Fund's average net assets and an annualized group fee rate that averaged .23% during the period. The group fee rate is based upon the monthly average net assets of a group of registered investment companies with which the investment adviser has management contracts. The group fee rate decreases as assets under management increase and increases as assets under management decrease. For the reporting period, the total annualized management fee rate was .43% of the Fund's average net assets.
Transfer Agent Fees. Fidelity Investments Institutional Operations Company LLC (FIIOC), an affiliate of the investment adviser, is the transfer, dividend disbursing and shareholder servicing agent for each class of the Fund. FIIOC receives account fees and asset-based fees that vary according to the account size and type of account of the shareholders of the respective classes of the Fund, except for Class K. FIIOC receives an asset-based fee of Class K's average net assets. FIIOC pays for typesetting, printing and mailing of shareholder reports, except proxy statements.
For the period, transfer agent fees for each class were as follows:
| | Amount | % of Class-Level Average Net Assets(a) |
| Equity-Income | $4,385 | .13 |
| Class K | 157 | .04 |
| | $4,542 | |
(a) Annualized
Accounting Fees. Fidelity Service Company, Inc. (FSC), an affiliate of the investment adviser, maintains the Fund's accounting records. The accounting fee is based on the level of average net assets for each month. For the period, the fees were equivalent to the following annualized rates:
| | % of Average Net Assets |
| Fidelity Equity-Income Fund | .02 |
Brokerage Commissions. A portion of portfolio transactions were placed with brokerage firms which are affiliates of the investment adviser. Brokerage commissions are included in net realized gain (loss) and change in net unrealized appreciation (depreciation) in the Statement of Operations. The commissions paid to these affiliated firms were as follows:
| | Amount |
| Fidelity Equity-Income Fund | $48 |
Interfund Trades. Funds may purchase from or sell securities to other Fidelity Funds under procedures adopted by the Board. The procedures have been designed to ensure these interfund trades are executed in accordance with Rule 17a-7 of the 1940 Act. Any interfund trades are included within the respective purchases and sales amounts shown in the Purchases and Sales of Investments note and are noted in the table below.
| | Purchases ($) | Sales ($) |
| Fidelity Equity-Income Fund | 159,953 | 105,061 |
6. Committed Line of Credit.
Certain Funds participate with other funds managed by the investment adviser or an affiliate in a $4.25 billion credit facility (the "line of credit") to be utilized for temporary or emergency purposes to fund shareholder redemptions or for other short-term liquidity purposes. The participating funds have agreed to pay commitment fees on their pro-rata portion of the line of credit, which are reflected in Miscellaneous expenses on the Statement of Operations, and are listed below. During the period, there were no borrowings on this line of credit.
| | Amount |
| Fidelity Equity-Income Fund | $7 |
7. Security Lending.
Funds lend portfolio securities from time to time in order to earn additional income. Lending agents are used, including National Financial Services (NFS), an affiliate of the investment adviser. Pursuant to a securities lending agreement, NFS will receive a fee, which is capped at 9.9% of a fund's daily lending revenue, for its services as lending agent. A fund may lend securities to certain qualified borrowers, including NFS. On the settlement date of the loan, a fund receives collateral (in the form of U.S. Treasury obligations, letters of credit and/or cash) against the loaned securities and maintains collateral in an amount not less than 100% of the market value of the loaned securities during the period of the loan. The market value of the loaned securities is determined at the close of business of a fund and any additional required collateral is delivered to a fund on the next business day. A fund or borrower may terminate the loan at any time, and if the borrower defaults on its obligation to return the securities loaned because of insolvency or other reasons, a fund may apply collateral received from the borrower against the obligation. A fund may experience delays and costs in recovering the securities loaned. Any cash collateral received is invested in the Fidelity Securities Lending Cash Central Fund. Any loaned securities are identified as such in the Schedule of Investments, and the value of loaned securities and cash collateral at period end, as applicable, are presented in the Statement of Assets and Liabilities. Security lending income represents the income earned on investing cash collateral, less rebates paid to borrowers and any lending agent fees associated with the loan, plus any premium payments received for lending certain types of securities. Security lending income is presented in the Statement of Operations as a component of income from Fidelity Central Funds. Affiliated security lending activity, if any, was as follows:
| | Total Security Lending Fees Paid to NFS | Security Lending Income From Securities Loaned to NFS | Value of Securities Loaned to NFS at Period End |
| Fidelity Equity-Income Fund | $3 | $– | $– |
8. Expense Reductions.
Commissions paid to certain brokers with whom the investment adviser, or its affiliates, places trades on behalf of the Fund include an amount in addition to trade execution, which may be rebated back to the Fund to offset expenses. This amount totaled $218 for the period.
In addition, during the period the investment adviser or an affiliate reimbursed and/or waived a portion of fund-level operating expenses in the amount of $57.
9. Distributions to Shareholders.
Distributions to shareholders of each class were as follows:
| | Six months ended
July 31, 2021 | Year ended
January 31, 2021 |
| Fidelity Equity-Income Fund | | |
| Distributions to shareholders | | |
| Equity-Income | $149,587 | $194,422 |
| Class K | 16,829 | 25,021 |
| Total | $166,416 | $219,443 |
10. Share Transactions.
Share transactions for each class were as follows and may contain in-kind transactions, automatic conversions between classes or exchanges between affiliated funds:
| | Shares | Shares | Dollars | Dollars |
| | Six months ended July 31, 2021 | Year ended January 31, 2021 | Six months ended July 31, 2021 | Year ended January 31, 2021 |
| Fidelity Equity-Income Fund | | | | |
| Equity-Income | | | | |
| Shares sold | 6,761 | 16,474 | $462,873 | $933,030 |
| Reinvestment of distributions | 2,101 | 3,211 | 140,355 | 182,273 |
| Shares redeemed | (5,536) | (14,077) | (380,098) | (770,384) |
| Net increase (decrease) | 3,326 | 5,608 | $223,130 | $344,919 |
| Class K | | | | |
| Shares sold | 1,452 | 2,059 | $99,299 | $115,985 |
| Reinvestment of distributions | 252 | 445 | 16,829 | 25,021 |
| Shares redeemed | (1,737) | (5,183) | (119,873) | (294,386) |
| Net increase (decrease) | (33) | (2,679) | $(3,745) | $(153,380) |
11. Other.
Fund's organizational documents provide former and current trustees and officers with a limited indemnification against liabilities arising in connection with the performance of their duties to the fund. In the normal course of business, the fund may also enter into contracts that provide general indemnifications. The fund's maximum exposure under these arrangements is unknown as this would be dependent on future claims that may be made against the fund. The risk of material loss from such claims is considered remote.
12. Coronavirus (COVID-19) Pandemic.
An outbreak of COVID-19 first detected in China during December 2019 has since spread globally and was declared a pandemic by the World Health Organization during March 2020. Developments that disrupt global economies and financial markets, such as the COVID-19 pandemic, may magnify factors that affect the Fund's performance.
Shareholder Expense Example
As a shareholder, you incur two types of costs: (1) transaction costs, which may include sales charges (loads) on purchase payments or redemption proceeds, as applicable and (2) ongoing costs, which generally include management fees, distribution and/or service (12b-1) fees and other Fund expenses. This Example is intended to help you understand your ongoing costs (in dollars) of investing in a fund and to compare these costs with the ongoing costs of investing in other mutual funds.
The Example is based on an investment of $1,000 invested at the beginning of the period and held for the entire period (February 1, 2021 to July 31, 2021).
Actual Expenses
The first line of the accompanying table provides information about actual account values and actual expenses. You may use the information in this line, together with the amount you invested, to estimate the expenses that you paid over the period. Simply divide your account value by $1,000.00 (for example, an $8,600 account value divided by $1,000.00 = 8.6), then multiply the result by the number in the first line for a class/Fund under the heading entitled "Expenses Paid During Period" to estimate the expenses you paid on your account during this period. If any fund is a shareholder of any underlying mutual funds or exchange-traded funds (ETFs) (the Underlying Funds), such fund indirectly bears its proportional share of the expenses of the Underlying Funds in addition to the direct expenses incurred presented in the table. These fees and expenses are not included in the annualized expense ratio used to calculate the expense estimate in the table below.
Hypothetical Example for Comparison Purposes
The second line of the accompanying table provides information about hypothetical account values and hypothetical expenses based on the actual expense ratio and an assumed rate of return of 5% per year before expenses, which is not the actual return. The hypothetical account values and expenses may not be used to estimate the actual ending account balance or expenses you paid for the period. You may use this information to compare the ongoing costs of investing in the Fund and other funds. To do so, compare this 5% hypothetical example with the 5% hypothetical examples that appear in the shareholder reports of the other funds. If any fund is a shareholder of any Underlying Funds, such fund indirectly bears its proportional share of the expenses of the Underlying Funds in addition to the direct expenses as presented in the table. These fees and expenses are not included in the annualized expense ratio used to calculate the expense estimate in the table below.
Please note that the expenses shown in the table are meant to highlight your ongoing costs only and do not reflect any transaction costs. Therefore, the second line of the table is useful in comparing ongoing costs only, and will not help you determine the relative total costs of owning different funds.
| | Annualized Expense Ratio-A | Beginning
Account Value
February 1, 2021 | Ending
Account Value
July 31, 2021 | Expenses Paid
During Period-B
February 1, 2021
to July 31, 2021 |
| Fidelity Equity-Income Fund | | | | |
| Equity-Income | .58% | | | |
| Actual | | $1,000.00 | $1,182.30 | $3.14 |
| Hypothetical-C | | $1,000.00 | $1,021.92 | $2.91 |
| Class K | .49% | | | |
| Actual | | $1,000.00 | $1,182.90 | $2.65 |
| Hypothetical-C | | $1,000.00 | $1,022.36 | $2.46 |
A Annualized expense ratio reflects expenses net of applicable fee waivers.
B Expenses are equal to the annualized expense ratio, multiplied by the average account value over the period, multiplied by 181/ 365 (to reflect the one-half year period). The fees and expenses of any Underlying Funds are not included in each annualized expense ratio.
C 5% return per year before expenses
Board Approval of Investment Advisory Contracts and Management Fees
Fidelity Equity-Income Fund
Each year, the Board of Trustees, including the Independent Trustees (together, the Board), votes on the renewal of the management contract with Fidelity Management & Research Company LLC (FMR) and the sub-advisory agreements (together, the Advisory Contracts) for the fund. FMR and the sub-advisers are referred to herein as the Investment Advisers. The Board, assisted by the advice of fund counsel and Independent Trustees' counsel, requests and considers a broad range of information relevant to the renewal of the Advisory Contracts throughout the year.
The Board meets regularly and, at each of its meetings, covers an extensive agenda of topics and materials and considers factors that are relevant to its annual consideration of the renewal of the fund's Advisory Contracts, including the services and support provided to the fund and its shareholders. The Board has established various standing committees (Committees), each composed of and chaired by Independent Trustees with varying backgrounds, to which the Board has assigned specific subject matter responsibilities in order to enhance effective decision-making by the Board. The Board, acting directly and through its Committees, requests and receives information concerning the annual consideration of the renewal of the fund's Advisory Contracts. The Board also meets as needed to review matters specifically related to the Board's annual consideration of the renewal of the Advisory Contracts. Members of the Board may also meet with trustees of other Fidelity funds through joint ad hoc committees to discuss certain matters relevant to all of the Fidelity funds.
At its May 2021 meeting, the Board unanimously determined to renew the fund's Advisory Contracts. In reaching its determination, the Board considered all factors it believed relevant, including (i) the nature, extent, and quality of the services provided to the fund and its shareholders (including the investment performance of the fund); (ii) the competitiveness of the fund's management fee and total expense ratio relative to peer funds; (iii) the total costs of the services provided by and the profits realized by Fidelity from its relationships with the fund; and (iv) the extent to which, if any, economies of scale exist and are realized as the fund grows, and whether any economies of scale are appropriately shared with fund shareholders.
In considering whether to renew the Advisory Contracts for the fund, the Board reached a determination, with the assistance of fund counsel and Independent Trustees' counsel and through the exercise of its business judgment, that the renewal of the Advisory Contracts was in the best interests of the fund and its shareholders and that the compensation payable under the Advisory Contracts was fair and reasonable. The Board's decision to renew the Advisory Contracts was not based on any single factor, but rather was based on a comprehensive consideration of all the information provided to the Board at its meetings throughout the year. The Board, in reaching its determination to renew the Advisory Contracts, was aware that shareholders of the fund have a broad range of investment choices available to them, including a wide choice among funds offered by Fidelity's competitors, and that the fund's shareholders, who have the opportunity to review and weigh the disclosure provided by the fund in its prospectus and other public disclosures, have chosen to invest in this fund, which is part of the Fidelity family of funds.
Nature, Extent, and Quality of Services Provided. The Board considered Fidelity's staffing as it relates to the fund, including the backgrounds of investment personnel of Fidelity, and also considered the fund's investment objective, strategies, and related investment philosophy. The Independent Trustees also had discussions with senior management of Fidelity's investment operations and investment groups. The Board considered the structure of the investment personnel compensation program and whether this structure provides appropriate incentives to act in the best interests of the fund. Additionally, the Board considered the portfolio managers' investments, if any, in the funds that they manage.
Resources Dedicated to Investment Management and Support Services. The Board and the Fund Oversight and Research Committees reviewed the general qualifications and capabilities of Fidelity's investment staff, including its size, education, experience, and resources, as well as Fidelity's approach to recruiting, training, managing, and compensating investment personnel. The Board noted that Fidelity has continued to increase the resources devoted to non-U.S. offices, including expansion of Fidelity's global investment organization. The Board also noted that Fidelity's analysts have extensive resources, tools and capabilities that allow them to conduct sophisticated quantitative and fundamental analysis, as well as credit analysis of issuers, counterparties and guarantors. Further, the Board considered that Fidelity's investment professionals have sufficient access to global information and data so as to provide competitive investment results over time, and that those professionals also have access to sophisticated tools that permit them to assess portfolio construction and risk and performance attribution characteristics continuously, as well as to transmit new information and research conclusions rapidly around the world. Additionally, in its deliberations, the Board considered Fidelity's trading, risk management, compliance, and technology and operations capabilities and resources, which are integral parts of the investment management process. The Board also considered Fidelity's investments in business continuity planning, and its success in continuously providing services to the fund notwithstanding the severe disruptions caused by the COVID-19 pandemic.
Shareholder and Administrative Services. The Board considered (i) the nature, extent, quality, and cost of advisory, administrative, and shareholder services performed by the Investment Advisers and their affiliates under the Advisory Contracts and under separate agreements covering transfer agency, pricing and bookkeeping, and securities lending services for the fund; (ii) the nature and extent of the supervision of third party service providers, principally custodians, subcustodians, and pricing vendors; and (iii) the resources devoted to, and the record of compliance with, the fund's compliance policies and procedures. The Board also reviewed the allocation of fund brokerage, including allocations to brokers affiliated with the Investment Advisers, the use of brokerage commissions to pay fund expenses, and the use of "soft" commission dollars to pay for research services.
The Board noted that the growth of fund assets over time across the complex allows Fidelity to reinvest in the development of services designed to enhance the value and convenience of the Fidelity funds as investment vehicles. These services include 24-hour access to account information and market information over the Internet and through telephone representatives, investor education materials and asset allocation tools, and the expanded availability of Fidelity Investor Centers.
The Board noted that, in the past, it and the boards of certain other Fidelity funds had formed an ad hoc Committee on Transfer Agency Fees to review the variety of transfer agency fee structures throughout the industry and Fidelity's competitive positioning with respect to industry participants.
Investment in a Large Fund Family. The Board considered the benefits to shareholders of investing in a Fidelity fund, including the benefits of investing in a fund that is part of a large family of funds offering a variety of investment disciplines and providing a large variety of mutual fund investor services. The Board noted that Fidelity had taken, or had made recommendations that resulted in the Fidelity funds taking, a number of actions over the previous year that benefited particular funds, including: (i) continuing to dedicate additional resources to Fidelity's investment research process, which includes meetings with management of issuers of securities in which the funds invest, and to the support of the senior management team that oversees asset management; (ii) continuing efforts to enhance Fidelity's global research capabilities; (iii) launching new funds and ETFs with innovative structures, strategies and pricing and making other enhancements to meet client needs; (iv) launching new share classes of existing funds; (v) eliminating purchase minimums and broadening eligibility requirements for certain funds and share classes; (vi) approving the reduction in the holding period for the Class C to Class A conversion policy; (vii) reducing management fees and total expenses for certain target date funds and classes and index funds; (viii) lowering expenses for certain existing funds and classes by implementing or lowering expense caps; (ix) rationalizing product lines and gaining increased efficiencies from fund mergers, liquidations, and share class consolidations; (x) continuing to develop, acquire and implement systems and technology to improve services to the funds and shareholders, strengthen information security, and increase efficiency; and (xi) continuing to implement enhancements to further strengthen Fidelity's product line to increase investors' probability of success in achieving their investment goals, including retirement income goals.
Investment Performance. The Board considered whether the fund has operated in accordance with its investment objective, as well as its record of compliance with its investment restrictions and its performance history. The Board noted that there were portfolio management changes in January 2018 and April 2019. The Board will continue to monitor closely the fund's performance, taking into account the portfolio management changes.
The Board took into account discussions that occur at Board meetings throughout the year with representatives of the Investment Advisers about fund investment performance. In this regard the Board noted that as part of regularly scheduled fund reviews and other reports to the Board on fund performance, the Board considers annualized return information for the fund for different time periods, measured against an appropriate securities market index (benchmark index) and an appropriate peer group of funds with similar objectives (peer group). In its evaluation of fund investment performance, the Board gave particular attention to information indicating changes in performance of certain Fidelity funds for specific time periods and discussed with the Investment Advisers the reasons for any overperformance or underperformance.
In addition to reviewing absolute and relative fund performance, the Independent Trustees periodically consider the appropriateness of fund performance metrics in evaluating the results achieved. In general, the Independent Trustees believe that fund performance should be evaluated based on net performance (after fees and expenses) of both the highest performing and lowest performing fund share classes, where applicable, compared to appropriate benchmark indices, over appropriate time periods that may include full market cycles, and compared to peer groups, as applicable, over the same periods, taking into account relevant factors including the following: general market conditions; issuer-specific information; and fund cash flows and other factors.
The Independent Trustees recognize that shareholders evaluate performance on a net basis over their own holding periods, for which one-, three-, and five-year periods are often used as a proxy. For this reason, the performance information reviewed by the Board also included net cumulative total return information for the fund and an appropriate benchmark index and peer group for the most recent one-, three-, and five-year periods ended September 30, 2020, as shown below. Returns are shown compared to the 25th percentile (top of box, 75% beaten) and 75th percentile (bottom of box, 25% beaten) of the peer universe.
Fidelity Equity-Income Fund

Based on its review, the Board concluded that the nature, extent, and quality of services provided to the fund under the Advisory Contracts should continue to benefit the shareholders of the fund.
Competitiveness of Management Fee and Total Expense Ratio. The Board considered the fund's management fee and total expense ratio compared to "mapped groups" of competitive funds and classes created for the purpose of facilitating the Trustees' competitive analysis of management fees and total expenses. Fidelity creates "mapped groups" by combining similar Lipper investment objective categories that have comparable investment mandates. Combining Lipper investment objective categories aids the Board's management fee and total expense ratio comparisons by broadening the competitive group used for comparison.
Management Fee. The Board considered two proprietary management fee comparisons for the 12-month periods ended September 30 (June 30 for periods ended 2019 and 2018 and December 31 for periods prior to 2018) shown in basis points (BP) in the chart below. The group of Lipper funds used by the Board for management fee comparisons is referred to below as the "Total Mapped Group." The Total Mapped Group is broader than the Lipper peer group used by the Board for performance comparisons because the Total Mapped Group combines several Lipper investment objective categories while the Lipper peer group does not. The Total Mapped Group comparison focuses on a fund's standing in terms of gross management fees before expense reimbursements or caps relative to the total universe of funds with comparable investment mandates, regardless of whether their management fee structures also are comparable. Funds with comparable investment mandates offer exposure to similar types of securities. Funds with comparable management fee structures have similar management fee contractual arrangements (
e.g., flat rate charged for advisory services, all-inclusive fee rate,
etc.). "TMG %" represents the percentage of funds in the Total Mapped Group that had management fees that were lower than the fund's. For example, a hypothetical TMG % of 20% would mean that 80% of the funds in the Total Mapped Group had higher, and 20% had lower, management fees than the fund. The fund's actual TMG %s and the number of funds in the Total Mapped Group are in the chart below. The "Asset-Sized Peer Group" (ASPG) comparison focuses on a fund's standing relative to a subset of non-Fidelity funds within the Total Mapped Group that are similar in size and management fee structure. For example, if a fund is in the first quartile of the ASPG, the fund's management fee ranks in the least expensive or lowest 25% of funds in the ASPG. The ASPG represents at least 15% of the funds in the Total Mapped Group with comparable asset size and management fee structures, subject to a minimum of 50 funds (or all funds in the Total Mapped Group if fewer than 50). Additional information, such as the ASPG quartile in which the fund's management fee rate ranked, is also included in the chart and was considered by the Board.
Fidelity Equity-Income Fund

The Board noted that the fund's management fee rate ranked below the median of its Total Mapped Group and below the median of its ASPG for the 12-month period ended September 30, 2020.
The Board noted that, in the past, it and the boards of other Fidelity funds had formed an ad hoc Committee on Group Fee to conduct an in-depth review of the "group fee" component of the management fee of funds with such management fee structures. The Committee's focus included the mechanics of the group fee, the competitive landscape of group fee structures, Fidelity funds with no group fee component and investment products not included in group fee assets. The Board also considered that, for funds subject to the group fee, FMR agreed to voluntarily waive fees over a specified period of time in amounts designed to account for assets converted from certain funds to certain collective investment trusts.
The Board also noted that, in 2013, the ad hoc Committee on Management Fees was formed to conduct an in-depth review of the management fee rates of Fidelity's active equity mutual funds. The Committee focused on the following areas: (i) standard fee structures; (ii) research consumption and trading evolution; (iii) management fee competitiveness/profitability by category; and (iv) factors that drive institutional pricing.
Based on its review, the Board concluded that the fund's management fee is fair and reasonable in light of the services that the fund receives and the other factors considered.
Total Expense Ratio. In its review of each class's total expense ratio, the Board considered the fund's management fee rate as well as other fund or class expenses, as applicable, such as transfer agent fees, pricing and bookkeeping fees, and custodial, legal, and audit fees. The Board also noted that Fidelity may agree to waive fees or reimburse expenses from time to time, and the extent to which, if any, it has done so for the fund. As part of its review, the Board also considered the current and historical total expense ratios of each class of the fund compared to competitive fund median expenses. The fund's representative class is compared to those funds and classes in the Total Mapped Group (used by the Board for management fee comparisons) that have a similar sales load structure (SLTG). The Board also considered a total expense ASPG comparison for the representative class, which focuses on the total expenses of the representative class relative to a subset of non-Fidelity funds within the total expense SLTG. The total expense ASPG is limited to 15 larger and 15 smaller classes in fund average assets for a total of 30 classes, where possible. The total expense ASPG comparison excludes performance adjustments and fund-paid 12b-1 fees to eliminate variability in fee structures.
The Board noted that the total expense ratio of the retail class ranked below the SLTG competitive median and below the ASPG competitive median for the 12-month period ended September 30, 2020.
Fees Charged to Other Fidelity Clients. The Board also considered Fidelity fee structures and other information with respect to clients of Fidelity, such as other funds advised or subadvised by Fidelity, pension plan clients, and other institutional clients with similar mandates. The Board noted that a joint ad hoc committee created by it and the boards of other Fidelity funds periodically reviews and compares Fidelity's institutional investment advisory business with its business of providing services to the Fidelity funds and also noted the most recent findings of the committee. The Board noted that the committee's review included a consideration of the differences in services provided, fees charged, and costs incurred, as well as competition in the markets serving the different categories of clients.
Based on its review of total expense ratios and fees charged to other Fidelity clients, the Board concluded that the total expense ratio of each class of the fund was reasonable in light of the services that the fund and its shareholders receive and the other factors considered.
Costs of the Services and Profitability. The Board considered the revenues earned and the expenses incurred by Fidelity in conducting the business of developing, marketing, distributing, managing, administering and servicing the fund and servicing the fund's shareholders. The Board also considered the level of Fidelity's profits in respect of all the Fidelity funds.
On an annual basis, Fidelity presents to the Board information about the profitability of its relationships with the fund. Fidelity calculates profitability information for each fund, as well as aggregate profitability information for groups of Fidelity funds and all Fidelity funds, using a series of detailed revenue and cost allocation methodologies which originate with the books and records of Fidelity on which Fidelity's audited financial statements are based. The Audit Committee of the Board reviews any significant changes from the prior year's methodologies and the full Board approves such changes.
A public accounting firm has been engaged annually by the Board as part of the Board's assessment of Fidelity's profitability analysis. The engagement includes the review and assessment of the methodologies used by Fidelity in determining the revenues and expenses attributable to Fidelity's mutual fund business, and completion of agreed-upon procedures in respect of the mathematical accuracy of certain fund profitability information and its conformity to established allocation methodologies. After considering the reports issued under the engagement and information provided by Fidelity, the Board concluded that while other allocation methods may also be reasonable, Fidelity's profitability methodologies are reasonable in all material respects.
The Board also reviewed Fidelity's non-fund businesses and potential indirect benefits such businesses may have received as a result of their association with Fidelity's mutual fund business (i.e., fall-out benefits) as well as cases where Fidelity's affiliates may benefit from the funds' business. The Board considered areas where potential indirect benefits to the Fidelity funds from their relationships with Fidelity may exist. The Board also considered that in 2019 a joint ad hoc committee created by it and the boards of other Fidelity funds evaluated potential fall-out benefits (PFOB Committee). The Board noted that it considered the PFOB Committee's findings in connection with its consideration of the renewal of the Advisory Contracts.
The Board considered the costs of the services provided by and the profits realized by Fidelity in connection with the operation of the fund, including the conclusions of the PFOB Committee, and was satisfied that the profitability was not excessive.
Economies of Scale. The Board considered whether there have been economies of scale in respect of the management of the Fidelity funds, whether the Fidelity funds (including the fund) have appropriately benefited from any such economies of scale, and whether there is potential for realization of any further economies of scale. The Board considered the extent to which the fund will benefit from economies of scale as assets grow through increased services to the fund, through waivers or reimbursements, or through fee or expense ratio reductions. The Board also noted that a committee (the Economies of Scale Committee) created by it and the boards of other Fidelity funds periodically analyzes whether Fidelity attains economies of scale in respect of the management and servicing of the Fidelity funds, whether the Fidelity funds have appropriately benefited from such economies of scale, and whether there is potential for realization of any further economies of scale.
The Board recognized that the fund's management contract incorporates a "group fee" structure, which provides for lower group fee rates as total "group assets" increase, and for higher group fee rates as total "group assets" decrease ("group assets" as defined in the management contracts). FMR calculates the group fee rates based on a tiered asset "breakpoint" schedule that varies based on asset class. The Board considered that the group fee is designed to deliver the benefits of economies of scale to fund shareholders when total Fidelity fund assets increase, even if assets of any particular fund are unchanged or have declined, because some portion of Fidelity's costs are attributable to services provided to all Fidelity funds, and all funds benefit if those costs can be allocated among more assets. The Board further considered that Fidelity agreed to impose a temporary fee waiver in the form of additional breakpoints to the current breakpoint schedule. The Board concluded that, given the group fee structure, fund shareholders will benefit from lower management fees as "group assets" increase at the fund complex level, regardless of whether Fidelity achieves any such economies of scale.
The Board concluded, taking into account the analysis of the Economies of Scale Committee, that economies of scale, if any, are being appropriately shared between fund shareholders and Fidelity.
Additional Information Requested by the Board. In order to develop fully the factual basis for consideration of the Fidelity funds' advisory contracts, the Board requested and received additional information on certain topics, including: (i) fund flow and performance trends, in particular the underperformance of certain funds and strategies, and Fidelity's long-term strategies for certain funds; (ii) consideration of expanding the use of performance fees for additional funds; (iii) Fidelity's pricing philosophy compared to competitors; (iv) metrics for evaluating index fund and ETF performance and information about ETF trading characteristics; (v) the methodology with respect to evaluating competitive fund data and peer group classifications and fee and expense comparisons; (vi) the expense structures for different funds and classes and information about the differences between various expense structures; (vii) group fee breakpoints; (viii) information regarding other accounts managed by Fidelity and sub-advisory arrangements; and (ix) Fidelity's philosophies and strategies for evaluating funds and classes with lower or declining asset levels.
Based on its evaluation of all of the conclusions noted above, and after considering all factors it believed relevant, the Board concluded that the advisory fee arrangements are fair and reasonable, and that the fund's Advisory Contracts should be renewed.
Liquidity Risk Management Program
The Securities and Exchange Commission adopted Rule 22e-4 under the Investment Company Act of 1940 (the Liquidity Rule) to promote effective liquidity risk management throughout the open-end investment company industry, thereby reducing the risk that funds will be unable to meet their redemption obligations and mitigating dilution of the interests of fund shareholders.
The Fund has adopted and implemented a liquidity risk management program pursuant to the Liquidity Rule (the Program) effective December 1, 2018. The Program is reasonably designed to assess and manage the Fund’s liquidity risk and to comply with the requirements of the Liquidity Rule. The Fund’s Board of Trustees (the Board) has designated the Fund’s investment adviser as administrator of the Program. The Fidelity advisers have established a Liquidity Risk Management Committee (the LRM Committee) to manage the Program for each of the Fidelity Funds. The LRM Committee monitors the adequacy and effectiveness of implementation of the Program and on a periodic basis assesses each Fund’s liquidity risk based on a variety of factors including (1) the Fund’s investment strategy, (2) portfolio liquidity and cash flow projections during normal and reasonably foreseeable stressed conditions, (3) shareholder redemptions, (4) borrowings and other funding sources and (5) in the case of exchange-traded funds, certain additional factors including the effect of the Fund’s prices and spreads, market participants, and basket compositions on the overall liquidity of the Fund’s portfolio, as applicable.
In accordance with the Program, each of the Fund’s portfolio investments is classified into one of four liquidity categories described below based on a determination of a reasonable expectation for how long it would take to convert the investment to cash (or sell or dispose of the investment) without significantly changing its market value.
- Highly liquid investments – cash or convertible to cash within three business days or less
- Moderately liquid investments – convertible to cash in three to seven calendar days
- Less liquid investments – can be sold or disposed of, but not settled, within seven calendar days
- Illiquid investments – cannot be sold or disposed of within seven calendar days
Liquidity classification determinations take into account a variety of factors including various market, trading and investment-specific considerations, as well as market depth, and generally utilize analysis from a third-party liquidity metrics service.
The Liquidity Rule places a 15% limit on a fund’s illiquid investments and requires funds that do not primarily hold assets that are highly liquid investments to determine and maintain a minimum percentage of the fund’s net assets to be invested in highly liquid investments (highly liquid investment minimum or HLIM). The Program includes provisions reasonably designed to comply with the 15% limit on illiquid investments and for determining, periodically reviewing and complying with the HLIM requirement as applicable.
At a recent meeting of the Fund’s Board of Trustees, the LRM Committee provided a written report to the Board pertaining to the operation, adequacy, and effectiveness of implementation of the Program for the annual period from December 1, 2019 through November 30, 2020. The report concluded that the Program has been implemented and is operating effectively and is reasonably designed to assess and manage the Fund’s liquidity risk.

EQU-SANN-0921
1.536123.124
Fidelity® Series All-Sector Equity Fund
Fidelity® Series Stock Selector Large Cap Value Fund
Fidelity® Series Value Discovery Fund
Semi-Annual Report
July 31, 2021
Contents
To view a fund's proxy voting guidelines and proxy voting record for the 12-month period ended June 30, visit http://www.fidelity.com/proxyvotingresults or visit the Securities and Exchange Commission's (SEC) web site at http://www.sec.gov.
You may also call 1-800-544-8544 to request a free copy of the proxy voting guidelines.
Standard & Poor's, S&P and S&P 500 are registered service marks of The McGraw-Hill Companies, Inc. and have been licensed for use by Fidelity Distributors Corporation.
Other third-party marks appearing herein are the property of their respective owners.
All other marks appearing herein are registered or unregistered trademarks or service marks of FMR LLC or an affiliated company. © 2021 FMR LLC. All rights reserved.
This report and the financial statements contained herein are submitted for the general information of the shareholders of the Funds. This report is not authorized for distribution to prospective investors in the Funds unless preceded or accompanied by an effective prospectus.
A fund files its complete schedule of portfolio holdings with the SEC for the first and third quarters of each fiscal year on Form N-PORT. Forms N-PORT are available on the SEC’s web site at http://www.sec.gov. A fund's Forms N-PORT may be reviewed and copied at the SEC’s Public Reference Room in Washington, DC. Information regarding the operation of the SEC's Public Reference Room may be obtained by calling 1-800-SEC-0330.
For a complete list of a fund's portfolio holdings, view the most recent holdings listing, semiannual report, or annual report on Fidelity's web site at http://www.fidelity.com, http://www.institutional.fidelity.com, or http://www.401k.com, as applicable.
NOT FDIC INSURED •MAY LOSE VALUE •NO BANK GUARANTEE
Neither the Funds nor Fidelity Distributors Corporation is a bank.
Note to Shareholders:
Early in 2020, the outbreak and spread of a new coronavirus emerged as a public health emergency that had a major influence on financial markets, primarily based on its impact on the global economy and the outlook for corporate earnings. The virus causes a respiratory disease known as COVID-19. On March 11, 2020 the World Health Organization declared the COVID-19 outbreak a pandemic, citing sustained risk of further global spread.
In the weeks following, as the crisis worsened, we witnessed an escalating human tragedy with wide-scale social and economic consequences from coronavirus-containment measures. The outbreak of COVID-19 prompted a number of measures to limit the spread, including travel and border restrictions, quarantines, and restrictions on large gatherings. In turn, these resulted in lower consumer activity, diminished demand for a wide range of products and services, disruption in manufacturing and supply chains, and – given the wide variability in outcomes regarding the outbreak – significant market uncertainty and volatility. Amid the turmoil, global governments and central banks took unprecedented action to help support consumers, businesses, and the broader economies, and to limit disruption to financial systems.
The situation continues to unfold, and the extent and duration of its impact on financial markets and the economy remain highly uncertain. Extreme events such as the coronavirus crisis are “exogenous shocks” that can have significant adverse effects on mutual funds and their investments. Although multiple asset classes may be affected by market disruption, the duration and impact may not be the same for all types of assets.
Fidelity is committed to helping you stay informed amid news about COVID-19 and during increased market volatility, and we’re taking extra steps to be responsive to customer needs. We encourage you to visit our websites, where we offer ongoing updates, commentary, and analysis on the markets and our funds.
Fidelity® Series All-Sector Equity Fund
Investment Summary (Unaudited)
Top Ten Stocks as of July 31, 2021
| | % of fund's net assets |
| Microsoft Corp. | 5.9 |
| Apple, Inc. | 4.3 |
| Alphabet, Inc. Class C | 3.7 |
| Amazon.com, Inc. | 3.6 |
| Facebook, Inc. Class A | 2.3 |
| MasterCard, Inc. Class A | 1.8 |
| Jabil, Inc. | 1.7 |
| UnitedHealth Group, Inc. | 1.5 |
| The Home Depot, Inc. | 1.3 |
| NVIDIA Corp. | 1.2 |
| | 27.3 |
Top Five Market Sectors as of July 31, 2021
| | % of fund's net assets |
| Information Technology | 26.9 |
| Health Care | 12.9 |
| Consumer Discretionary | 12.0 |
| Financials | 10.9 |
| Communication Services | 10.3 |
Asset Allocation (% of fund's net assets)
| As of July 31, 2021* |
| | Stocks and Equity Futures | 99.4% |
| | Short-Term Investments and Net Other Assets (Liabilities) | 0.6% |

* Foreign investments - 3.8%
Fidelity® Series All-Sector Equity Fund
Schedule of Investments July 31, 2021 (Unaudited)
Showing Percentage of Net Assets
| Common Stocks - 98.0% | | | |
| | | Shares | Value |
| COMMUNICATION SERVICES - 10.3% | | | |
| Entertainment - 1.8% | | | |
| Activision Blizzard, Inc. | | 87,111 | $7,284,222 |
| Electronic Arts, Inc. | | 34,690 | 4,993,972 |
| Live Nation Entertainment, Inc. (a) | | 5,910 | 466,240 |
| Netflix, Inc. (a) | | 37,670 | 19,496,862 |
| Spotify Technology SA (a) | | 15,440 | 3,530,665 |
| The Walt Disney Co. (a) | | 200,487 | 35,289,722 |
| World Wrestling Entertainment, Inc. Class A (b) | | 4,400 | 217,272 |
| | | | 71,278,955 |
| Interactive Media & Services - 6.8% | | | |
| Alphabet, Inc.: | | | |
| Class A (a) | | 3,500 | 9,430,855 |
| Class C (a) | | 52,426 | 141,781,923 |
| Facebook, Inc. Class A (a) | | 254,590 | 90,710,417 |
| IAC (a) | | 2,680 | 367,937 |
| Match Group, Inc. (a) | | 25,075 | 3,993,695 |
| Snap, Inc. Class A (a) | | 62,630 | 4,660,925 |
| TripAdvisor, Inc. (a) | | 11,470 | 435,287 |
| Twitter, Inc. (a) | | 104,410 | 7,282,598 |
| Vimeo, Inc. (a) | | 51,200 | 2,293,760 |
| Zoominfo Technologies, Inc. (a) | | 47,400 | 2,547,750 |
| | | | 263,505,147 |
| Media - 1.0% | | | |
| Altice U.S.A., Inc. Class A (a) | | 60,630 | 1,863,160 |
| Comcast Corp. Class A | | 415,368 | 24,436,099 |
| Interpublic Group of Companies, Inc. | | 27,830 | 984,069 |
| Liberty Media Corp.: | | | |
| Liberty Formula One Group Series C (a) | | 11,520 | 540,634 |
| Liberty SiriusXM Series A (a) | | 24,320 | 1,135,501 |
| Liberty SiriusXM Series C (a) | | 3,165 | 146,223 |
| Nexstar Broadcasting Group, Inc. Class A | | 9,800 | 1,441,286 |
| ViacomCBS, Inc. Class B | | 183,670 | 7,517,613 |
| | | | 38,064,585 |
| Wireless Telecommunication Services - 0.7% | | | |
| T-Mobile U.S., Inc. (a) | | 196,802 | 28,343,424 |
|
| TOTAL COMMUNICATION SERVICES | | | 401,192,111 |
|
| CONSUMER DISCRETIONARY - 12.0% | | | |
| Auto Components - 0.6% | | | |
| Aptiv PLC (a) | | 132,300 | 22,074,255 |
| Automobiles - 0.9% | | | |
| Tesla, Inc. (a) | | 50,800 | 34,909,760 |
| Diversified Consumer Services - 0.3% | | | |
| Duolingo, Inc. | | 2,100 | 294,525 |
| Service Corp. International | | 155,700 | 9,729,693 |
| | | | 10,024,218 |
| Hotels, Restaurants & Leisure - 1.5% | | | |
| Booking Holdings, Inc. (a) | | 10,290 | 22,414,295 |
| Las Vegas Sands Corp. (a) | | 328,100 | 13,895,035 |
| Marriott International, Inc. Class A (a) | | 149,000 | 21,751,020 |
| | | | 58,060,350 |
| Household Durables - 0.3% | | | |
| Lennar Corp. Class A | | 117,200 | 12,323,580 |
| Internet & Direct Marketing Retail - 3.6% | | | |
| Amazon.com, Inc. (a) | | 41,335 | 137,545,933 |
| Chewy, Inc. (a)(b) | | 13,152 | 1,100,822 |
| eBay, Inc. | | 20,460 | 1,395,577 |
| | | | 140,042,332 |
| Multiline Retail - 0.4% | | | |
| Dollar Tree, Inc. (a) | | 146,100 | 14,579,319 |
| Specialty Retail - 3.5% | | | |
| Best Buy Co., Inc. | | 167,600 | 18,829,860 |
| Burlington Stores, Inc. (a) | | 69,660 | 23,322,168 |
| The Home Depot, Inc. | | 149,779 | 49,155,970 |
| TJX Companies, Inc. | | 339,796 | 23,381,363 |
| Ulta Beauty, Inc. (a) | | 60,300 | 20,248,740 |
| | | | 134,938,101 |
| Textiles, Apparel & Luxury Goods - 0.9% | | | |
| NIKE, Inc. Class B | | 220,900 | 37,002,959 |
|
| TOTAL CONSUMER DISCRETIONARY | | | 463,954,874 |
|
| CONSUMER STAPLES - 5.3% | | | |
| Beverages - 1.9% | | | |
| Boston Beer Co., Inc. Class A (a) | | 2,085 | 1,480,350 |
| Constellation Brands, Inc. Class A (sub. vtg.) | | 42,568 | 9,549,705 |
| Keurig Dr. Pepper, Inc. | | 132,576 | 4,668,001 |
| Monster Beverage Corp. (a) | | 97,874 | 9,231,476 |
| PepsiCo, Inc. | | 149,882 | 23,523,980 |
| The Coca-Cola Co. | | 406,782 | 23,198,777 |
| | | | 71,652,289 |
| Food & Staples Retailing - 1.2% | | | |
| BJ's Wholesale Club Holdings, Inc. (a) | | 27,600 | 1,397,664 |
| Costco Wholesale Corp. | | 49,836 | 21,415,526 |
| Walgreens Boots Alliance, Inc. | | 85,823 | 4,046,554 |
| Walmart, Inc. | | 139,500 | 19,885,725 |
| | | | 46,745,469 |
| Food Products - 0.6% | | | |
| Bunge Ltd. | | 25,107 | 1,949,056 |
| Darling Ingredients, Inc. (a) | | 29,731 | 2,053,520 |
| Freshpet, Inc. (a) | | 7,269 | 1,064,545 |
| Lamb Weston Holdings, Inc. | | 63,332 | 4,228,678 |
| Mondelez International, Inc. | | 225,017 | 14,234,575 |
| | | | 23,530,374 |
| Household Products - 1.0% | | | |
| Procter & Gamble Co. | | 261,160 | 37,144,787 |
| The Clorox Co. | | 15,196 | 2,748,804 |
| | | | 39,893,591 |
| Personal Products - 0.3% | | | |
| Estee Lauder Companies, Inc. Class A | | 32,958 | 11,002,369 |
| Herbalife Nutrition Ltd. (a) | | 36,716 | 1,870,313 |
| | | | 12,872,682 |
| Tobacco - 0.3% | | | |
| Altria Group, Inc. | | 187,505 | 9,007,740 |
|
| TOTAL CONSUMER STAPLES | | | 203,702,145 |
|
| ENERGY - 2.4% | | | |
| Energy Equipment & Services - 0.3% | | | |
| Baker Hughes Co. Class A | | 163,300 | 3,468,492 |
| Halliburton Co. | | 292,600 | 6,050,968 |
| | | | 9,519,460 |
| Oil, Gas & Consumable Fuels - 2.1% | | | |
| Cheniere Energy, Inc. (a) | | 62,800 | 5,333,604 |
| ConocoPhillips Co. | | 57,900 | 3,245,874 |
| EOG Resources, Inc. | | 6,300 | 459,018 |
| EQT Corp. (a) | | 22,500 | 413,775 |
| Exxon Mobil Corp. | | 695,624 | 40,047,074 |
| Hess Corp. | | 200,900 | 15,356,796 |
| Kosmos Energy Ltd. (a) | | 60,662 | 140,129 |
| Marathon Petroleum Corp. | | 500 | 27,610 |
| Murphy Oil Corp. | | 229,864 | 4,990,347 |
| Phillips 66 Co. | | 82,400 | 6,050,632 |
| Range Resources Corp. (a) | | 66,000 | 1,005,180 |
| Targa Resources Corp. | | 81,300 | 3,423,543 |
| Valero Energy Corp. | | 36,500 | 2,444,405 |
| | | | 82,937,987 |
|
| TOTAL ENERGY | | | 92,457,447 |
|
| FINANCIALS - 10.9% | | | |
| Banks - 4.3% | | | |
| Bank of America Corp. | | 1,152,487 | 44,209,401 |
| Citigroup, Inc. | | 48,484 | 3,278,488 |
| Citizens Financial Group, Inc. | | 228,500 | 9,633,560 |
| Comerica, Inc. | | 54,000 | 3,707,640 |
| First Horizon National Corp. | | 293,900 | 4,540,755 |
| JPMorgan Chase & Co. | | 175,500 | 26,637,390 |
| M&T Bank Corp. | | 46,049 | 6,163,659 |
| PNC Financial Services Group, Inc. | | 91,300 | 16,654,033 |
| Signature Bank | | 24,300 | 5,515,371 |
| Wells Fargo & Co. | | 1,001,800 | 46,022,692 |
| | | | 166,362,989 |
| Capital Markets - 2.5% | | | |
| Bank of New York Mellon Corp. | | 459,600 | 23,591,268 |
| BlackRock, Inc. Class A | | 23,800 | 20,638,646 |
| Cboe Global Markets, Inc. | | 39,800 | 4,715,106 |
| Goldman Sachs Group, Inc. | | 22,600 | 8,472,288 |
| Morgan Stanley | | 243,300 | 23,351,934 |
| State Street Corp. | | 128,300 | 11,180,062 |
| StepStone Group, Inc. Class A | | 47,900 | 2,179,929 |
| Virtu Financial, Inc. Class A | | 180,132 | 4,636,598 |
| | | | 98,765,831 |
| Consumer Finance - 2.0% | | | |
| Ally Financial, Inc. | | 102,400 | 5,259,264 |
| American Express Co. | | 157,800 | 26,909,634 |
| Capital One Financial Corp. | | 279,605 | 45,212,129 |
| | | | 77,381,027 |
| Diversified Financial Services - 0.2% | | | |
| Voya Financial, Inc. | | 130,600 | 8,410,640 |
| Insurance - 1.9% | | | |
| American International Group, Inc. | | 174,600 | 8,267,310 |
| Arch Capital Group Ltd. (a) | | 131,900 | 5,144,100 |
| Arthur J. Gallagher & Co. | | 52,700 | 7,341,637 |
| Hartford Financial Services Group, Inc. | | 244,000 | 15,523,280 |
| Marsh & McLennan Companies, Inc. | | 23,600 | 3,474,392 |
| Principal Financial Group, Inc. | | 79,400 | 4,933,122 |
| Reinsurance Group of America, Inc. | | 28,000 | 3,085,040 |
| The Travelers Companies, Inc. | | 129,100 | 19,225,572 |
| Willis Towers Watson PLC | | 33,200 | 6,841,856 |
| | | | 73,836,309 |
|
| TOTAL FINANCIALS | | | 424,756,796 |
|
| HEALTH CARE - 12.9% | | | |
| Biotechnology - 1.8% | | | |
| Amgen, Inc. | | 98,003 | 23,671,645 |
| Biogen, Inc. (a) | | 4,900 | 1,600,977 |
| Blueprint Medicines Corp. (a) | | 28,000 | 2,460,360 |
| Horizon Therapeutics PLC (a) | | 184,600 | 18,463,692 |
| Neurocrine Biosciences, Inc. (a) | | 56,800 | 5,294,328 |
| Regeneron Pharmaceuticals, Inc. (a) | | 31,900 | 18,330,059 |
| | | | 69,821,061 |
| Health Care Equipment & Supplies - 3.8% | | | |
| Abbott Laboratories | | 244,200 | 29,543,316 |
| Boston Scientific Corp. (a) | | 693,110 | 31,605,816 |
| Danaher Corp. | | 17,500 | 5,206,075 |
| DexCom, Inc. (a) | | 17,300 | 8,918,323 |
| Envista Holdings Corp. (a) | | 216,100 | 9,309,588 |
| Intuitive Surgical, Inc. (a) | | 23,300 | 23,101,018 |
| ResMed, Inc. | | 35,100 | 9,540,180 |
| Stryker Corp. | | 115,700 | 31,347,758 |
| | | | 148,572,074 |
| Health Care Providers & Services - 3.5% | | | |
| AmerisourceBergen Corp. | | 95,000 | 11,606,150 |
| Cigna Corp. | | 10,000 | 2,294,900 |
| Guardant Health, Inc. (a) | | 32,200 | 3,535,560 |
| HCA Holdings, Inc. | | 90,200 | 22,387,640 |
| Humana, Inc. | | 54,400 | 23,166,784 |
| Oak Street Health, Inc. (a) | | 19,700 | 1,241,888 |
| Surgery Partners, Inc. (a) | | 251,800 | 13,738,208 |
| UnitedHealth Group, Inc. | | 143,400 | 59,112,348 |
| | | | 137,083,478 |
| Health Care Technology - 0.2% | | | |
| Health Catalyst, Inc. (a) | | 101,400 | 5,887,284 |
| Life Sciences Tools & Services - 1.0% | | | |
| Avantor, Inc. (a) | | 234,500 | 8,812,510 |
| Thermo Fisher Scientific, Inc. | | 58,500 | 31,590,585 |
| | | | 40,403,095 |
| Pharmaceuticals - 2.6% | | | |
| Bristol-Myers Squibb Co. | | 431,200 | 29,265,544 |
| Eli Lilly & Co. | | 138,466 | 33,716,471 |
| Merck & Co., Inc. | | 29,100 | 2,236,917 |
| Royalty Pharma PLC | | 263,100 | 10,050,420 |
| Zoetis, Inc. Class A | | 120,900 | 24,506,430 |
| | | | 99,775,782 |
|
| TOTAL HEALTH CARE | | | 501,542,774 |
|
| INDUSTRIALS - 9.5% | | | |
| Aerospace & Defense - 3.0% | | | |
| General Dynamics Corp. | | 100,400 | 19,681,412 |
| Lockheed Martin Corp. | | 53,500 | 19,884,345 |
| Northrop Grumman Corp. | | 54,800 | 19,893,496 |
| Raytheon Technologies Corp. | | 321,748 | 27,975,989 |
| The Boeing Co. (a) | | 130,500 | 29,555,640 |
| | | | 116,990,882 |
| Air Freight & Logistics - 0.8% | | | |
| FedEx Corp. | | 80,199 | 22,451,710 |
| United Parcel Service, Inc. Class B | | 34,500 | 6,601,920 |
| | | | 29,053,630 |
| Construction & Engineering - 0.5% | | | |
| AECOM (a) | | 291,400 | 18,346,544 |
| Electrical Equipment - 1.1% | | | |
| Sensata Technologies, Inc. PLC (a) | | 449,039 | 26,322,666 |
| Sunrun, Inc. (a) | | 328,395 | 17,395,083 |
| | | | 43,717,749 |
| Industrial Conglomerates - 1.1% | | | |
| 3M Co. | | 43,200 | 8,551,008 |
| General Electric Co. | | 2,206,319 | 28,571,831 |
| Honeywell International, Inc. | | 20,800 | 4,862,832 |
| | | | 41,985,671 |
| Machinery - 1.3% | | | |
| Allison Transmission Holdings, Inc. | | 597,100 | 23,830,261 |
| Caterpillar, Inc. | | 121,900 | 25,202,825 |
| Flowserve Corp. | | 26,612 | 1,120,099 |
| | | | 50,153,185 |
| Marine - 0.4% | | | |
| Kirby Corp. (a) | | 272,800 | 15,797,848 |
| Professional Services - 0.8% | | | |
| Nielsen Holdings PLC | | 1,331,684 | 31,547,594 |
| Road & Rail - 0.5% | | | |
| Norfolk Southern Corp. | | 44,218 | 11,400,727 |
| Uber Technologies, Inc. (a) | | 200,670 | 8,721,118 |
| | | | 20,121,845 |
|
| TOTAL INDUSTRIALS | | | 367,714,948 |
|
| INFORMATION TECHNOLOGY - 26.9% | | | |
| Communications Equipment - 0.1% | | | |
| CommScope Holding Co., Inc. (a) | | 15,900 | 336,444 |
| Lumentum Holdings, Inc. (a) | | 12,600 | 1,058,274 |
| | | | 1,394,718 |
| Electronic Equipment & Components - 1.9% | | | |
| Avnet, Inc. | | 19,400 | 801,608 |
| Corning, Inc. | | 107,600 | 4,504,136 |
| Flex Ltd. (a) | | 130,300 | 2,341,491 |
| Jabil, Inc. | | 1,131,117 | 67,346,706 |
| | | | 74,993,941 |
| IT Services - 5.4% | | | |
| Alliance Data Systems Corp. | | 8,400 | 783,300 |
| Cognizant Technology Solutions Corp. Class A | | 20,300 | 1,492,659 |
| DXC Technology Co. (a) | | 26,000 | 1,039,480 |
| Euronet Worldwide, Inc. (a) | | 12,900 | 1,842,378 |
| Fidelity National Information Services, Inc. | | 42,658 | 6,358,175 |
| Fiserv, Inc. (a) | | 41,400 | 4,765,554 |
| FleetCor Technologies, Inc. (a) | | 3,100 | 800,482 |
| Genpact Ltd. | | 147,100 | 7,327,051 |
| Global Payments, Inc. | | 64,800 | 12,532,968 |
| GoDaddy, Inc. (a) | | 47,005 | 3,941,369 |
| MasterCard, Inc. Class A | | 184,000 | 71,012,960 |
| MongoDB, Inc. Class A (a) | | 9,800 | 3,517,416 |
| PayPal Holdings, Inc. (a) | | 122,600 | 33,779,978 |
| Sabre Corp. (a) | | 17,100 | 201,609 |
| Square, Inc. (a) | | 34,700 | 8,579,922 |
| Twilio, Inc. Class A (a) | | 15,100 | 5,641,209 |
| Visa, Inc. Class A | | 180,400 | 44,448,756 |
| WEX, Inc. (a) | | 5,700 | 1,081,461 |
| | | | 209,146,727 |
| Semiconductors & Semiconductor Equipment - 3.7% | | | |
| Advanced Micro Devices, Inc. (a) | | 45,612 | 4,843,538 |
| Applied Materials, Inc. | | 79,800 | 11,166,414 |
| Lam Research Corp. | | 9,030 | 5,755,812 |
| Marvell Technology, Inc. | | 414,900 | 25,105,599 |
| Microchip Technology, Inc. | | 46,100 | 6,597,832 |
| Micron Technology, Inc. | | 214,960 | 16,676,597 |
| NVIDIA Corp. | | 239,420 | 46,684,506 |
| ON Semiconductor Corp. (a) | | 573,768 | 22,411,378 |
| Qualcomm, Inc. | | 8,104 | 1,213,979 |
| Semtech Corp. (a) | | 10,900 | 674,819 |
| Universal Display Corp. | | 4,000 | 937,960 |
| Xilinx, Inc. | | 19,500 | 2,921,880 |
| | | | 144,990,314 |
| Software - 11.1% | | | |
| Adobe, Inc. (a) | | 31,100 | 19,332,693 |
| Anaplan, Inc. (a) | | 128,800 | 7,367,360 |
| Autodesk, Inc. (a) | | 80,035 | 25,701,640 |
| Avalara, Inc. (a) | | 14,800 | 2,474,116 |
| Blend Labs, Inc. | | 23,500 | 424,410 |
| Ceridian HCM Holding, Inc. (a) | | 33,000 | 3,247,200 |
| Cloudflare, Inc. (a) | | 10,500 | 1,245,615 |
| Confluent, Inc. | | 8,500 | 333,115 |
| Coupa Software, Inc. (a) | | 11,100 | 2,408,700 |
| Elastic NV (a) | | 21,400 | 3,168,484 |
| Everbridge, Inc. (a)(b) | | 8,900 | 1,256,858 |
| FireEye, Inc. (a) | | 67,800 | 1,369,560 |
| Five9, Inc. (a) | | 17,600 | 3,542,704 |
| HubSpot, Inc. (a) | | 4,400 | 2,622,488 |
| Intuit, Inc. | | 16,500 | 8,744,505 |
| LivePerson, Inc. (a) | | 25,400 | 1,617,726 |
| Microsoft Corp. | | 802,900 | 228,754,239 |
| Momentive Global, Inc. (a) | | 381,740 | 8,016,540 |
| NortonLifeLock, Inc. | | 31,400 | 779,348 |
| Nutanix, Inc. Class A (a) | | 11,700 | 421,434 |
| Palo Alto Networks, Inc. (a) | | 25,700 | 10,255,585 |
| PTC, Inc. (a) | | 24,500 | 3,318,525 |
| Qualtrics International, Inc. | | 10,900 | 454,857 |
| Rapid7, Inc. (a) | | 9,600 | 1,092,000 |
| RingCentral, Inc. (a) | | 10,500 | 2,806,335 |
| Salesforce.com, Inc. (a) | | 125,042 | 30,251,411 |
| ServiceNow, Inc. (a) | | 19,600 | 11,522,644 |
| Splunk, Inc. (a) | | 29,000 | 4,117,420 |
| SS&C Technologies Holdings, Inc. | | 68,000 | 5,330,520 |
| Viant Technology, Inc. | | 4,900 | 84,721 |
| VMware, Inc. Class A (a)(b) | | 16,600 | 2,552,084 |
| Vonage Holdings Corp. (a) | | 62,000 | 884,120 |
| Workday, Inc. Class A (a) | | 63,300 | 14,837,520 |
| Yext, Inc. (a) | | 285,449 | 3,719,400 |
| Zendesk, Inc. (a) | | 73,000 | 9,528,690 |
| Zoom Video Communications, Inc. Class A (a) | | 19,400 | 7,335,140 |
| | | | 430,919,707 |
| Technology Hardware, Storage & Peripherals - 4.7% | | | |
| Apple, Inc. | | 1,153,836 | 168,298,519 |
| HP, Inc. | | 249,200 | 7,194,404 |
| Pure Storage, Inc. Class A (a) | | 36,400 | 710,528 |
| Western Digital Corp. (a) | | 94,100 | 6,109,913 |
| Xerox Holdings Corp. | | 24,700 | 596,011 |
| | | | 182,909,375 |
|
| TOTAL INFORMATION TECHNOLOGY | | | 1,044,354,782 |
|
| MATERIALS - 2.3% | | | |
| Chemicals - 1.1% | | | |
| Air Products & Chemicals, Inc. | | 14,477 | 4,213,241 |
| Albemarle Corp. U.S. | | 17,600 | 3,626,304 |
| DuPont de Nemours, Inc. | | 30,585 | 2,295,404 |
| Ecolab, Inc. | | 15,482 | 3,418,890 |
| FMC Corp. | | 19,648 | 2,101,354 |
| International Flavors & Fragrances, Inc. | | 24,312 | 3,662,360 |
| Linde PLC | | 31,486 | 9,678,482 |
| LyondellBasell Industries NV Class A | | 21,300 | 2,115,729 |
| Olin Corp. | | 167,900 | 7,896,337 |
| Sherwin-Williams Co. | | 11,855 | 3,450,161 |
| | | | 42,458,262 |
| Construction Materials - 0.3% | | | |
| Martin Marietta Materials, Inc. | | 17,939 | 6,517,239 |
| Vulcan Materials Co. | | 32,400 | 5,831,676 |
| | | | 12,348,915 |
| Containers & Packaging - 0.1% | | | |
| Crown Holdings, Inc. | | 55,200 | 5,506,752 |
| Metals & Mining - 0.8% | | | |
| Freeport-McMoRan, Inc. | | 569,234 | 21,687,815 |
| Newmont Corp. | | 64,600 | 4,058,172 |
| Reliance Steel & Aluminum Co. | | 15,869 | 2,493,813 |
| Royal Gold, Inc. | | 13,400 | 1,628,368 |
| | | | 29,868,168 |
|
| TOTAL MATERIALS | | | 90,182,097 |
|
| REAL ESTATE - 3.2% | | | |
| Equity Real Estate Investment Trusts (REITs) - 2.8% | | | |
| Alexandria Real Estate Equities, Inc. | | 26,900 | 5,416,046 |
| American Tower Corp. | | 49,400 | 13,970,320 |
| Corporate Office Properties Trust (SBI) | | 54,600 | 1,607,424 |
| CubeSmart | | 154,100 | 7,652,606 |
| Digital Realty Trust, Inc. | | 41,600 | 6,413,056 |
| Douglas Emmett, Inc. | | 165,200 | 5,517,680 |
| Equity Lifestyle Properties, Inc. | | 103,100 | 8,639,780 |
| Invitation Homes, Inc. | | 281,000 | 11,431,080 |
| Kilroy Realty Corp. | | 75,000 | 5,195,250 |
| Mid-America Apartment Communities, Inc. | | 64,200 | 12,397,020 |
| Prologis (REIT), Inc. | | 125,400 | 16,056,216 |
| SBA Communications Corp. Class A | | 11,600 | 3,955,484 |
| Ventas, Inc. | | 81,700 | 4,884,026 |
| VICI Properties, Inc. | | 101,100 | 3,153,309 |
| | | | 106,289,297 |
| Real Estate Management & Development - 0.4% | | | |
| Cushman & Wakefield PLC (a) | | 135,600 | 2,531,652 |
| Jones Lang LaSalle, Inc. (a) | | 59,800 | 13,309,686 |
| | | | 15,841,338 |
|
| TOTAL REAL ESTATE | | | 122,130,635 |
|
| UTILITIES - 2.3% | | | |
| Electric Utilities - 1.6% | | | |
| Edison International | | 93,300 | 5,084,850 |
| Entergy Corp. | | 22,200 | 2,284,824 |
| Evergy, Inc. | | 90,400 | 5,895,888 |
| Exelon Corp. | | 183,993 | 8,610,872 |
| FirstEnergy Corp. | | 186,000 | 7,127,520 |
| NextEra Energy, Inc. | | 194,040 | 15,115,716 |
| NRG Energy, Inc. | | 46,200 | 1,905,288 |
| PG&E Corp. (a) | | 645,493 | 5,673,883 |
| Southern Co. | | 145,100 | 9,267,537 |
| | | | 60,966,378 |
| Independent Power and Renewable Electricity Producers - 0.1% | | | |
| The AES Corp. | | 143,500 | 3,400,950 |
| Vistra Corp. | | 151,000 | 2,891,650 |
| | | | 6,292,600 |
| Multi-Utilities - 0.6% | | | |
| CenterPoint Energy, Inc. | | 103,790 | 2,642,493 |
| Dominion Energy, Inc. | | 115,041 | 8,613,120 |
| NiSource, Inc. | | 124,200 | 3,076,434 |
| Public Service Enterprise Group, Inc. | | 28,900 | 1,798,447 |
| Sempra Energy | | 55,944 | 7,309,084 |
| | | | 23,439,578 |
|
| TOTAL UTILITIES | | | 90,698,556 |
|
| TOTAL COMMON STOCKS | | | |
| (Cost $2,021,205,304) | | | 3,802,687,165 |
| | | Principal Amount | Value |
|
| U.S. Treasury Obligations - 0.2% | | | |
| U.S. Treasury Bills, yield at date of purchase 0.04% to 0.05% 9/30/21 to 10/28/21 (c) | | | |
| (Cost $7,279,304) | | 7,280,000 | 7,279,180 |
| | | Shares | Value |
|
| Money Market Funds - 4.2% | | | |
| Fidelity Cash Central Fund 0.06% (d) | | 159,148,925 | $159,180,755 |
| Fidelity Securities Lending Cash Central Fund 0.06% (d)(e) | | 4,641,041 | 4,641,505 |
| TOTAL MONEY MARKET FUNDS | | | |
| (Cost $163,821,139) | | | 163,822,260 |
| TOTAL INVESTMENT IN SECURITIES - 102.4% | | | |
| (Cost $2,192,305,747) | | | 3,973,788,605 |
| NET OTHER ASSETS (LIABILITIES) - (2.4)% | | | (91,701,086) |
| NET ASSETS - 100% | | | $3,882,087,519 |
| Futures Contracts | | | | | |
| | Number of contracts | Expiration Date | Notional Amount | Value | Unrealized Appreciation/(Depreciation) |
| Purchased | | | | | |
| Equity Index Contracts | | | | | |
| CME E-mini S&P 500 Index Contracts (United States) | 239 | Sept. 2021 | $52,454,525 | $506,735 | $506,735 |
The notional amount of futures purchased as a percentage of Net Assets is 1.4%
Legend
(a) Non-income producing
(b) Security or a portion of the security is on loan at period end.
(c) Security or a portion of the security was pledged to cover margin requirements for futures contracts. At period end, the value of securities pledged amounted to $2,679,791.
(d) Affiliated fund that is generally available only to investment companies and other accounts managed by Fidelity Investments. The rate quoted is the annualized seven-day yield of the fund at period end. A complete unaudited listing of the fund's holdings as of its most recent quarter end is available upon request. In addition, each Fidelity Central Fund's financial statements are available on the SEC's website or upon request.
(e) Investment made with cash collateral received from securities on loan.
Affiliated Central Funds
Information regarding fiscal year to date income earned by the Fund from investments in Fidelity Central Funds is as follows:
| Fund | Income earned |
| Fidelity Cash Central Fund | $15,987 |
| Fidelity Securities Lending Cash Central Fund | 14,206 |
| Total | $30,193 |
Amounts in the income column in the above table include any capital gain distributions from underlying funds, which are presented in the corresponding line-item in the Statement of Operations, if applicable. Amount for Fidelity Securities Lending Cash Central Fund represents the income earned on investing cash collateral, less rebates paid to borrowers and any lending agent fees associated with the loan, plus any premium payments received for lending certain types of securities.
Fiscal year to date information regarding the Fund's investments in Fidelity Central Funds, including the ownership percentage, is presented below.
| Fund | Value, beginning of period | Purchases | Sales Proceeds | Realized Gain/Loss | Change in Unrealized appreciation (depreciation) | Value, end of period | % ownership, end of period |
| Fidelity Cash Central Fund 0.06% | $72,392,381 | $790,123,416 | $703,334,641 | $(401) | $-- | $159,180,755 | 0.2% |
| Fidelity Securities Lending Cash Central Fund 0.06% | 5,784,355 | 50,155,178 | 51,298,028 | -- | -- | 4,641,505 | 0.0% |
| Total | $78,176,736 | $840,278,594 | $754,632,669 | $(401) | $-- | $163,822,260 | |
Investment Valuation
The following is a summary of the inputs used, as of July 31, 2021, involving the Fund's assets and liabilities carried at fair value. The inputs or methodology used for valuing securities may not be an indication of the risk associated with investing in those securities. For more information on valuation inputs, and their aggregation into the levels used below, please refer to the Investment Valuation section in the accompanying Notes to Financial Statements.
| | Valuation Inputs at Reporting Date: |
| Description | Total | Level 1 | Level 2 | Level 3 |
| Investments in Securities: | | | | |
| Equities: | | | | |
| Communication Services | $401,192,111 | $401,192,111 | $-- | $-- |
| Consumer Discretionary | 463,954,874 | 463,954,874 | -- | -- |
| Consumer Staples | 203,702,145 | 203,702,145 | -- | -- |
| Energy | 92,457,447 | 92,457,447 | -- | -- |
| Financials | 424,756,796 | 424,756,796 | -- | -- |
| Health Care | 501,542,774 | 501,542,774 | -- | -- |
| Industrials | 367,714,948 | 367,714,948 | -- | -- |
| Information Technology | 1,044,354,782 | 1,044,354,782 | -- | -- |
| Materials | 90,182,097 | 90,182,097 | -- | -- |
| Real Estate | 122,130,635 | 122,130,635 | -- | -- |
| Utilities | 90,698,556 | 90,698,556 | -- | -- |
| U.S. Government and Government Agency Obligations | 7,279,180 | -- | 7,279,180 | -- |
| Money Market Funds | 163,822,260 | 163,822,260 | -- | -- |
| Total Investments in Securities: | $3,973,788,605 | $3,966,509,425 | $7,279,180 | $-- |
| Derivative Instruments: | | | | |
| Assets | | | | |
| Futures Contracts | $506,735 | $506,735 | $-- | $-- |
| Total Assets | $506,735 | $506,735 | $-- | $-- |
| Total Derivative Instruments: | $506,735 | $506,735 | $-- | $-- |
Value of Derivative Instruments
The following table is a summary of the Fund's value of derivative instruments by primary risk exposure as of July 31, 2021. For additional information on derivative instruments, please refer to the Derivative Instruments section in the accompanying Notes to Financial Statements.
| Primary Risk Exposure / Derivative Type | Value |
| | Asset | Liability |
| Equity Risk | | |
| Futures Contracts(a) | $506,735 | $0 |
| Total Equity Risk | 506,735 | 0 |
| Total Value of Derivatives | $506,735 | $0 |
(a) Reflects gross cumulative appreciation (depreciation) on futures contracts as presented in the Schedule of Investments. In the Statement of Assets and Liabilities, the period end daily variation margin is included in receivable or payable for daily variation margin on futures contracts, and the net cumulative appreciation (depreciation) is included in Total accumulated earnings (loss).
See accompanying notes which are an integral part of the financial statements.
Fidelity® Series All-Sector Equity Fund
Financial Statements
Statement of Assets and Liabilities
| | | July 31, 2021 (Unaudited) |
| Assets | | |
Investment in securities, at value (including securities loaned of $4,510,372) — See accompanying schedule:
Unaffiliated issuers (cost $2,028,484,608) | $3,809,966,345 | |
| Fidelity Central Funds (cost $163,821,139) | 163,822,260 | |
| Total Investment in Securities (cost $2,192,305,747) | | $3,973,788,605 |
| Cash | | 236,819 |
| Receivable for investments sold | | 10,511,592 |
| Receivable for fund shares sold | | 11,703 |
| Dividends receivable | | 2,121,350 |
| Distributions receivable from Fidelity Central Funds | | 6,121 |
| Other receivables | | 101,119 |
| Total assets | | 3,986,777,309 |
| Liabilities | | |
| Payable for investments purchased | $17,168,262 | |
| Payable for fund shares redeemed | 82,243,905 | |
| Payable for daily variation margin on futures contracts | 607,696 | |
| Other payables and accrued expenses | 27,952 | |
| Collateral on securities loaned | 4,641,975 | |
| Total liabilities | | 104,689,790 |
| Net Assets | | $3,882,087,519 |
| Net Assets consist of: | | |
| Paid in capital | | $1,765,490,663 |
| Total accumulated earnings (loss) | | 2,116,596,856 |
| Net Assets | | $3,882,087,519 |
| Net Asset Value, offering price and redemption price per share ($3,882,087,519 ÷ 300,127,983 shares) | | $12.93 |
See accompanying notes which are an integral part of the financial statements.
Statement of Operations
| | | Six months ended July 31, 2021 (Unaudited) |
| Investment Income | | |
| Dividends | | $20,852,896 |
| Interest | | 249 |
| Income from Fidelity Central Funds (including $14,206 from security lending) | | 30,193 |
| Total income | | 20,883,338 |
| Expenses | | |
| Custodian fees and expenses | $33,252 | |
| Independent trustees' fees and expenses | 7,485 | |
| Total expenses | | 40,737 |
| Net investment income (loss) | | 20,842,601 |
| Realized and Unrealized Gain (Loss) | | |
| Net realized gain (loss) on: | | |
| Investment securities: | | |
| Unaffiliated issuers | 321,704,597 | |
| Fidelity Central Funds | (401) | |
| Foreign currency transactions | (993) | |
| Futures contracts | 4,827,739 | |
| Total net realized gain (loss) | | 326,530,942 |
| Change in net unrealized appreciation (depreciation) on: | | |
| Investment securities: | | |
| Unaffiliated issuers | 334,222,017 | |
| Assets and liabilities in foreign currencies | (2,025) | |
| Futures contracts | 909,725 | |
| Total change in net unrealized appreciation (depreciation) | | 335,129,717 |
| Net gain (loss) | | 661,660,659 |
| Net increase (decrease) in net assets resulting from operations | | $682,503,260 |
See accompanying notes which are an integral part of the financial statements.
Statement of Changes in Net Assets
| | Six months ended July 31, 2021 (Unaudited) | Year ended January 31, 2021 |
| Increase (Decrease) in Net Assets | | |
| Operations | | |
| Net investment income (loss) | $20,842,601 | $49,883,400 |
| Net realized gain (loss) | 326,530,942 | 375,196,187 |
| Change in net unrealized appreciation (depreciation) | 335,129,717 | 330,422,945 |
| Net increase (decrease) in net assets resulting from operations | 682,503,260 | 755,502,532 |
| Distributions to shareholders | (179,164,847) | (440,518,195) |
| Share transactions | | |
| Proceeds from sales of shares | 157,754,164 | 172,524,328 |
| Reinvestment of distributions | 179,164,847 | 440,518,195 |
| Cost of shares redeemed | (647,564,017) | (719,507,203) |
| Net increase (decrease) in net assets resulting from share transactions | (310,645,006) | (106,464,680) |
| Total increase (decrease) in net assets | 192,693,407 | 208,519,657 |
| Net Assets | | |
| Beginning of period | 3,689,394,112 | 3,480,874,455 |
| End of period | $3,882,087,519 | $3,689,394,112 |
| Other Information | | |
| Shares | | |
| Sold | 12,888,047 | 17,312,431 |
| Issued in reinvestment of distributions | 15,743,835 | 43,606,246 |
| Redeemed | (52,388,145) | (71,429,879) |
| Net increase (decrease) | (23,756,263) | (10,511,202) |
See accompanying notes which are an integral part of the financial statements.
Financial Highlights
Fidelity Series All-Sector Equity Fund
| | Six months ended (Unaudited) July 31, | Years endedJanuary 31, | | | | |
| | 2021 | 2021 | 2020 | 2019 | 2018 | 2017 |
| Selected Per–Share Data | | | | | | |
| Net asset value, beginning of period | $11.39 | $10.41 | $9.35 | $13.46 | $12.33 | $12.02 |
| Income from Investment Operations | | | | | | |
| Net investment income (loss)A | .07 | .15B | .17 | .21 | .18 | .12 |
| Net realized and unrealized gain (loss) | 2.03 | 2.22 | 1.78 | (.79) | 2.80 | 2.33 |
| Total from investment operations | 2.10 | 2.37 | 1.95 | (.58) | 2.98 | 2.45 |
| Distributions from net investment income | –C | (.17) | (.18) | (.22) | (.19) | (.18) |
| Distributions from net realized gain | (.55) | (1.23) | (.71) | (3.31) | (1.66) | (1.96) |
| Total distributions | (.56)D | (1.39)D | (.89) | (3.53) | (1.85) | (2.14) |
| Net asset value, end of period | $12.93 | $11.39 | $10.41 | $9.35 | $13.46 | $12.33 |
| Total ReturnE,F | 19.08% | 24.94% | 21.33% | (3.23)% | 25.62% | 21.03% |
| Ratios to Average Net AssetsG,H | | | | | | |
| Expenses before reductions | - %I,J | - %J | - %J | - %J | .20% | .68% |
| Expenses net of fee waivers, if any | - %I,J | - %J | - %J | - %J | .20% | .68% |
| Expenses net of all reductions | - %I,J | - %J | - %J | - %J | .20% | .67% |
| Net investment income (loss) | 1.06%I | 1.47%B | 1.68% | 1.68% | 1.37% | .95% |
| Supplemental Data | | | | | | |
| Net assets, end of period (000 omitted) | $3,882,088 | $3,689,394 | $3,480,874 | $3,598,453 | $6,550,143 | $2,736,748 |
| Portfolio turnover rateK | 30%I | 64% | 59% | 65% | 61% | 43% |
A Calculated based on average shares outstanding during the period.
B Net investment income per share reflects one or more large, non-recurring dividend(s) which amounted to $.02 per share. Excluding such non-recurring dividend(s), the ratio of net investment income (loss) to average net assets would have been 1.32%.
C Amount represents less than $.005 per share.
D Total distributions per share do not sum due to rounding.
E Total returns for periods of less than one year are not annualized.
F Total returns would have been lower if certain expenses had not been reduced during the applicable periods shown.
G Fees and expenses of any underlying mutual funds or exchange-traded funds (ETFs) are not included in the Fund's expense ratio. The Fund indirectly bears its proportionate share of these expenses. For additional expense information related to investments in Fidelity Central Funds, please refer to the "Investments in Fidelity Central Funds" note found in the Notes to Financial Statements section of the most recent Annual or Semi-Annual report.
H Expense ratios reflect operating expenses of the class. Expenses before reductions do not reflect amounts reimbursed, waived, or reduced through arrangements with the investment advisor, brokerage services, or other offset arrangements, if applicable, and do not represent the amount paid by the class during periods when reimbursements, waivers or reductions occur.
I Annualized
J Amount represents less than .005%.
K Amount does not include the portfolio activity of any underlying mutual funds or exchange-traded funds (ETFs).
See accompanying notes which are an integral part of the financial statements.
Fidelity® Series Stock Selector Large Cap Value Fund
Investment Summary (Unaudited)
Top Ten Stocks as of July 31, 2021
| | % of fund's net assets |
| Capital One Financial Corp. | 2.9 |
| UnitedHealth Group, Inc. | 2.4 |
| Wells Fargo & Co. | 2.4 |
| Johnson & Johnson | 2.1 |
| Bank of America Corp. | 2.1 |
| Cisco Systems, Inc. | 2.1 |
| Procter & Gamble Co. | 2.1 |
| Thermo Fisher Scientific, Inc. | 2.0 |
| The Walt Disney Co. | 1.9 |
| Verizon Communications, Inc. | 1.6 |
| | 21.6 |
Top Five Market Sectors as of July 31, 2021
| | % of fund's net assets |
| Financials | 20.2 |
| Health Care | 16.6 |
| Industrials | 11.7 |
| Information Technology | 10.1 |
| Communication Services | 8.4 |
Asset Allocation (% of fund's net assets)
| As of July 31, 2021* |
| | Stocks | 98.4% |
| | Short-Term Investments and Net Other Assets (Liabilities) | 1.6% |

* Foreign investments - 8.6%
Fidelity® Series Stock Selector Large Cap Value Fund
Schedule of Investments July 31, 2021 (Unaudited)
Showing Percentage of Net Assets
| Common Stocks - 97.1% | | | |
| | | Shares | Value |
| COMMUNICATION SERVICES - 8.4% | | | |
| Diversified Telecommunication Services - 2.8% | | | |
| AT&T, Inc. | | 3,124,510 | $87,642,505 |
| Liberty Global PLC Class C (a) | | 1,735,225 | 46,608,144 |
| Verizon Communications, Inc. | | 3,393,278 | 189,277,047 |
| | | | 323,527,696 |
| Entertainment - 2.0% | | | |
| Cinemark Holdings, Inc. (a)(b) | | 935,119 | 14,522,398 |
| The Walt Disney Co. (a) | | 1,223,117 | 215,293,054 |
| | | | 229,815,452 |
| Interactive Media & Services - 1.8% | | | |
| Alphabet, Inc. Class A (a) | | 63,054 | 169,900,895 |
| Facebook, Inc. Class A (a) | | 112,350 | 40,030,305 |
| | | | 209,931,200 |
| Media - 1.8% | | | |
| Cogeco Communications, Inc. | | 262,100 | 24,817,147 |
| Comcast Corp. Class A | | 931,179 | 54,781,261 |
| Interpublic Group of Companies, Inc. | | 1,550,519 | 54,826,352 |
| Omnicom Group, Inc. | | 917,263 | 66,795,092 |
| | | | 201,219,852 |
|
| TOTAL COMMUNICATION SERVICES | | | 964,494,200 |
|
| CONSUMER DISCRETIONARY - 5.6% | | | |
| Auto Components - 0.9% | | | |
| Aptiv PLC (a) | | 596,200 | 99,475,970 |
| Hotels, Restaurants & Leisure - 1.3% | | | |
| Las Vegas Sands Corp. (a) | | 1,501,600 | 63,592,760 |
| Marriott International, Inc. Class A (a) | | 611,700 | 89,295,966 |
| | | | 152,888,726 |
| Household Durables - 0.6% | | | |
| Lennar Corp. Class A | | 681,500 | 71,659,725 |
| Multiline Retail - 0.6% | | | |
| Dollar Tree, Inc. (a) | | 625,900 | 62,458,561 |
| Specialty Retail - 2.2% | | | |
| Best Buy Co., Inc. | | 815,200 | 91,587,720 |
| Burlington Stores, Inc. (a) | | 253,990 | 85,035,852 |
| Ulta Beauty, Inc. (a) | | 235,960 | 79,235,368 |
| | | | 255,858,940 |
|
| TOTAL CONSUMER DISCRETIONARY | | | 642,341,922 |
|
| CONSUMER STAPLES - 7.1% | | | |
| Beverages - 1.5% | | | |
| Diageo PLC | | 288,077 | 14,284,661 |
| Keurig Dr. Pepper, Inc. | | 1,081,900 | 38,093,699 |
| Monster Beverage Corp. (a) | | 252,800 | 23,844,096 |
| PepsiCo, Inc. | | 106,100 | 16,652,395 |
| The Coca-Cola Co. | | 1,413,000 | 80,583,390 |
| | | | 173,458,241 |
| Food & Staples Retailing - 1.0% | | | |
| U.S. Foods Holding Corp. (a) | | 109,700 | 3,767,098 |
| Walmart, Inc. | | 738,571 | 105,283,296 |
| | | | 109,050,394 |
| Food Products - 1.1% | | | |
| Darling Ingredients, Inc. (a) | | 305,500 | 21,100,885 |
| McCormick & Co., Inc. (non-vtg.) | | 60,400 | 5,083,868 |
| Mondelez International, Inc. | | 1,366,452 | 86,441,754 |
| Post Holdings, Inc. (a) | | 31,100 | 3,182,774 |
| TreeHouse Foods, Inc. (a) | | 259,733 | 11,532,145 |
| | | | 127,341,426 |
| Household Products - 2.4% | | | |
| Kimberly-Clark Corp. | | 273,700 | 37,146,564 |
| Procter & Gamble Co. | | 1,694,372 | 240,990,530 |
| | | | 278,137,094 |
| Tobacco - 1.1% | | | |
| Altria Group, Inc. | | 1,928,200 | 92,630,728 |
| Philip Morris International, Inc. | | 323,100 | 32,339,079 |
| | | | 124,969,807 |
|
| TOTAL CONSUMER STAPLES | | | 812,956,962 |
|
| ENERGY - 4.5% | | | |
| Oil, Gas & Consumable Fuels - 4.5% | | | |
| Canadian Natural Resources Ltd. | | 1,424,400 | 47,004,287 |
| Cenovus Energy, Inc. (Canada) | | 8,879,947 | 74,094,460 |
| Cheniere Energy, Inc. (a) | | 988,800 | 83,978,784 |
| Exxon Mobil Corp. | | 3,218,400 | 185,283,288 |
| Hess Corp. | | 988,600 | 75,568,584 |
| Royal Dutch Shell PLC Class A (United Kingdom) | | 2,484,866 | 49,948,147 |
| | | | 515,877,550 |
| FINANCIALS - 20.2% | | | |
| Banks - 7.9% | | | |
| Bank of America Corp. | | 6,379,686 | 244,724,755 |
| Citigroup, Inc. | | 537,844 | 36,369,011 |
| Citizens Financial Group, Inc. | | 789,782 | 33,297,209 |
| Comerica, Inc. | | 390,978 | 26,844,549 |
| First Horizon National Corp. | | 1,976,327 | 30,534,252 |
| JPMorgan Chase & Co. | | 1,016,826 | 154,333,850 |
| PNC Financial Services Group, Inc. | | 418,176 | 76,279,484 |
| Societe Generale Series A | | 1,215,054 | 35,583,749 |
| Wells Fargo & Co. | | 5,860,273 | 269,220,942 |
| | | | 907,187,801 |
| Capital Markets - 4.4% | | | |
| Bank of New York Mellon Corp. | | 3,350,087 | 171,959,966 |
| BlackRock, Inc. Class A | | 163,757 | 142,005,158 |
| Cboe Global Markets, Inc. | | 200,023 | 23,696,725 |
| Morgan Stanley | | 1,520,870 | 145,973,103 |
| Virtu Financial, Inc. Class A | | 898,613 | 23,130,299 |
| | | | 506,765,251 |
| Consumer Finance - 4.2% | | | |
| American Express Co. | | 864,684 | 147,454,563 |
| Capital One Financial Corp. | | 2,077,667 | 335,958,749 |
| | | | 483,413,312 |
| Diversified Financial Services - 1.4% | | | |
| Berkshire Hathaway, Inc. Class B (a) | | 352,811 | 98,183,773 |
| Voya Financial, Inc. | | 993,688 | 63,993,507 |
| | | | 162,177,280 |
| Insurance - 2.3% | | | |
| American International Group, Inc. | | 1,157,517 | 54,808,430 |
| Hartford Financial Services Group, Inc. | | 1,504,604 | 95,722,906 |
| The Travelers Companies, Inc. | | 753,118 | 112,154,333 |
| | | | 262,685,669 |
|
| TOTAL FINANCIALS | | | 2,322,229,313 |
|
| HEALTH CARE - 16.6% | | | |
| Biotechnology - 0.2% | | | |
| Biogen, Inc. (a) | | 66,200 | 21,629,526 |
| Health Care Equipment & Supplies - 3.3% | | | |
| Abbott Laboratories | | 686,900 | 83,101,162 |
| Boston Scientific Corp. (a) | | 1,772,300 | 80,816,880 |
| Danaher Corp. | | 434,700 | 129,318,903 |
| Teleflex, Inc. | | 217,400 | 86,401,282 |
| | | | 379,638,227 |
| Health Care Providers & Services - 5.4% | | | |
| Cardinal Health, Inc. | | 1,181,400 | 70,151,532 |
| Centene Corp. (a) | | 861,900 | 59,134,959 |
| CVS Health Corp. | | 578,036 | 47,607,045 |
| Humana, Inc. | | 219,700 | 93,561,442 |
| McKesson Corp. | | 375,600 | 76,558,548 |
| UnitedHealth Group, Inc. | | 655,500 | 270,210,210 |
| | | | 617,223,736 |
| Life Sciences Tools & Services - 3.8% | | | |
| Bio-Rad Laboratories, Inc. Class A (a) | | 151,800 | 112,257,618 |
| IQVIA Holdings, Inc. (a) | | 361,800 | 89,617,860 |
| Thermo Fisher Scientific, Inc. | | 430,000 | 232,204,300 |
| | | | 434,079,778 |
| Pharmaceuticals - 3.9% | | | |
| Bristol-Myers Squibb Co. | | 1,617,600 | 109,786,512 |
| Johnson & Johnson | | 1,422,506 | 244,955,533 |
| Merck & Co., Inc. | | 1,268,200 | 97,486,534 |
| | | | 452,228,579 |
|
| TOTAL HEALTH CARE | | | 1,904,799,846 |
|
| INDUSTRIALS - 11.7% | | | |
| Aerospace & Defense - 4.5% | | | |
| General Dynamics Corp. | | 440,872 | 86,424,138 |
| Lockheed Martin Corp. | | 69,700 | 25,905,399 |
| Northrop Grumman Corp. | | 273,640 | 99,336,793 |
| Raytheon Technologies Corp. | | 1,658,059 | 144,168,230 |
| The Boeing Co. (a) | | 692,616 | 156,863,672 |
| | | | 512,698,232 |
| Air Freight & Logistics - 0.7% | | | |
| FedEx Corp. | | 291,298 | 81,548,875 |
| Construction & Engineering - 0.7% | | | |
| AECOM (a) | | 1,313,059 | 82,670,195 |
| Electrical Equipment - 1.0% | | | |
| Sensata Technologies, Inc. PLC (a) | | 2,025,653 | 118,743,779 |
| Industrial Conglomerates - 1.4% | | | |
| General Electric Co. | | 11,106,364 | 143,827,414 |
| Honeywell International, Inc. | | 64,721 | 15,131,123 |
| | | | 158,958,537 |
| Machinery - 0.7% | | | |
| Caterpillar, Inc. | | 418,476 | 86,519,913 |
| Marine - 0.4% | | | |
| Kirby Corp. (a) | | 763,306 | 44,203,050 |
| Professional Services - 1.5% | | | |
| Nielsen Holdings PLC | | 7,239,677 | 171,507,948 |
| Road & Rail - 0.4% | | | |
| Norfolk Southern Corp. | | 183,392 | 47,283,959 |
| Trading Companies & Distributors - 0.4% | | | |
| Univar, Inc. (a) | | 1,764,200 | 43,293,468 |
|
| TOTAL INDUSTRIALS | | | 1,347,427,956 |
|
| INFORMATION TECHNOLOGY - 10.1% | | | |
| Communications Equipment - 3.1% | | | |
| Cisco Systems, Inc. | | 4,398,229 | 243,529,940 |
| F5 Networks, Inc. (a) | | 539,080 | 111,325,411 |
| | | | 354,855,351 |
| Electronic Equipment & Components - 0.5% | | | |
| Vontier Corp. | | 1,636,918 | 52,954,297 |
| IT Services - 4.2% | | | |
| Amdocs Ltd. | | 2,170,509 | 167,367,949 |
| Fiserv, Inc. (a) | | 1,095,941 | 126,153,769 |
| GoDaddy, Inc. (a) | | 933,225 | 78,250,916 |
| IBM Corp. | | 788,378 | 111,129,763 |
| | | | 482,902,397 |
| Semiconductors & Semiconductor Equipment - 0.7% | | | |
| Intel Corp. | | 1,540,472 | 82,754,156 |
| Software - 1.3% | | | |
| Check Point Software Technologies Ltd. (a) | | 609,489 | 77,466,052 |
| NortonLifeLock, Inc. | | 766,723 | 19,030,065 |
| SS&C Technologies Holdings, Inc. | | 755,993 | 59,262,291 |
| | | | 155,758,408 |
| Technology Hardware, Storage & Peripherals - 0.3% | | | |
| NCR Corp. (a) | | 678,463 | 30,123,757 |
|
| TOTAL INFORMATION TECHNOLOGY | | | 1,159,348,366 |
|
| MATERIALS - 3.3% | | | |
| Chemicals - 1.4% | | | |
| Huntsman Corp. | | 1,609,200 | 42,498,972 |
| Olin Corp. | | 1,794,951 | 84,416,546 |
| The Chemours Co. LLC | | 1,093,300 | 36,352,225 |
| | | | 163,267,743 |
| Construction Materials - 0.4% | | | |
| Eagle Materials, Inc. | | 286,200 | 40,445,784 |
| Containers & Packaging - 0.4% | | | |
| O-I Glass, Inc. (a) | | 3,017,065 | 44,622,391 |
| Metals& Mining - 1.1% | | | |
| Freeport-McMoRan, Inc. | | 1,605,600 | 61,173,360 |
| Newmont Corp. | | 1,105,100 | 69,422,382 |
| | | | 130,595,742 |
|
| TOTAL MATERIALS | | | 378,931,660 |
|
| REAL ESTATE - 4.8% | | | |
| Equity Real Estate Investment Trusts (REITs) - 4.2% | | | |
| Digital Realty Trust, Inc. | | 308,400 | 47,542,944 |
| Douglas Emmett, Inc. | | 1,196,200 | 39,953,080 |
| Equity Lifestyle Properties, Inc. | | 565,200 | 47,363,760 |
| Invitation Homes, Inc. | | 2,173,300 | 88,409,844 |
| Mid-America Apartment Communities, Inc. | | 544,700 | 105,181,570 |
| Prologis (REIT), Inc. | | 797,163 | 102,068,751 |
| Welltower, Inc. | | 557,600 | 48,433,136 |
| | | | 478,953,085 |
| Real Estate Management & Development - 0.6% | | | |
| Cushman & Wakefield PLC (a) | | 3,686,100 | 68,819,487 |
|
| TOTAL REAL ESTATE | | | 547,772,572 |
|
| UTILITIES - 4.8% | | | |
| Electric Utilities - 2.8% | | | |
| Edison International | | 1,217,800 | 66,370,100 |
| Exelon Corp. | | 1,640,400 | 76,770,720 |
| FirstEnergy Corp. | | 1,351,400 | 51,785,648 |
| PG&E Corp. (a) | | 5,968,148 | 52,460,021 |
| Southern Co. | | 1,135,200 | 72,505,224 |
| | | | 319,891,713 |
| Independent Power and Renewable Electricity Producers - 0.8% | | | |
| The AES Corp. | | 2,364,600 | 56,041,020 |
| Vistra Corp. | | 2,141,333 | 41,006,527 |
| | | | 97,047,547 |
| Multi-Utilities - 1.2% | | | |
| CenterPoint Energy, Inc. | | 2,277,600 | 57,987,696 |
| Sempra Energy | | 576,600 | 75,332,790 |
| | | | 133,320,486 |
|
| TOTAL UTILITIES | | | 550,259,746 |
|
| TOTAL COMMON STOCKS | | | |
| (Cost $8,309,781,813) | | | 11,146,440,093 |
|
| Money Market Funds - 2.0% | | | |
| Fidelity Cash Central Fund 0.06% (c) | | 213,109,175 | 213,151,798 |
| Fidelity Securities Lending Cash Central Fund 0.06% (c)(d) | | 9,539,421 | 9,540,375 |
| TOTAL MONEY MARKET FUNDS | | | |
| (Cost $222,691,312) | | | 222,692,173 |
|
| Equity Funds - 1.3% | | | |
| Domestic Equity Funds - 1.3% | | | |
| iShares Russell 1000 Value Index ETF (b) | | | |
| (Cost $134,840,203) | | 919,772 | 147,135,927 |
| TOTAL INVESTMENT IN SECURITIES - 100.4% | | | |
| (Cost $8,667,313,328) | | | 11,516,268,193 |
| NET OTHER ASSETS (LIABILITIES) - (0.4)% | | | (40,915,699) |
| NET ASSETS - 100% | | | $11,475,352,494 |
Security Type Abbreviations
ETF – Exchange-Traded Fund
Legend
(a) Non-income producing
(b) Security or a portion of the security is on loan at period end.
(c) Affiliated fund that is generally available only to investment companies and other accounts managed by Fidelity Investments. The rate quoted is the annualized seven-day yield of the fund at period end. A complete unaudited listing of the fund's holdings as of its most recent quarter end is available upon request. In addition, each Fidelity Central Fund's financial statements are available on the SEC's website or upon request.
(d) Investment made with cash collateral received from securities on loan.
Affiliated Central Funds
Information regarding fiscal year to date income earned by the Fund from investments in Fidelity Central Funds is as follows:
| Fund | Income earned |
| Fidelity Cash Central Fund | $56,440 |
| Fidelity Securities Lending Cash Central Fund | 6,070 |
| Total | $62,510 |
Amounts in the income column in the above table include any capital gain distributions from underlying funds, which are presented in the corresponding line-item in the Statement of Operations, if applicable. Amount for Fidelity Securities Lending Cash Central Fund represents the income earned on investing cash collateral, less rebates paid to borrowers and any lending agent fees associated with the loan, plus any premium payments received for lending certain types of securities.
Fiscal year to date information regarding the Fund's investments in Fidelity Central Funds, including the ownership percentage, is presented below.
| Fund | Value, beginning of period | Purchases | Sales Proceeds | Realized Gain/Loss | Change in Unrealized appreciation (depreciation) | Value, end of period | % ownership, end of period |
| Fidelity Cash Central Fund 0.06% | $306,031,809 | $3,249,960,132 | $3,342,839,291 | $(852) | $-- | $213,151,798 | 0.3% |
| Fidelity Securities Lending Cash Central Fund 0.06% | 45,627,778 | 196,000,327 | 232,087,730 | -- | -- | 9,540,375 | 0.0% |
| Total | $351,659,587 | $3,445,960,459 | $3,574,927,021 | $(852) | $-- | $222,692,173 | |
Investment Valuation
The following is a summary of the inputs used, as of July 31, 2021, involving the Fund's assets and liabilities carried at fair value. The inputs or methodology used for valuing securities may not be an indication of the risk associated with investing in those securities. For more information on valuation inputs, and their aggregation into the levels used below, please refer to the Investment Valuation section in the accompanying Notes to Financial Statements.
| | Valuation Inputs at Reporting Date: |
| Description | Total | Level 1 | Level 2 | Level 3 |
| Investments in Securities: | | | | |
| Equities: | | | | |
| Communication Services | $964,494,200 | $964,494,200 | $-- | $-- |
| Consumer Discretionary | 642,341,922 | 642,341,922 | -- | -- |
| Consumer Staples | 812,956,962 | 798,672,301 | 14,284,661 | -- |
| Energy | 515,877,550 | 465,929,403 | 49,948,147 | -- |
| Financials | 2,322,229,313 | 2,286,645,564 | 35,583,749 | -- |
| Health Care | 1,904,799,846 | 1,904,799,846 | -- | -- |
| Industrials | 1,347,427,956 | 1,347,427,956 | -- | -- |
| Information Technology | 1,159,348,366 | 1,159,348,366 | -- | -- |
| Materials | 378,931,660 | 378,931,660 | -- | -- |
| Real Estate | 547,772,572 | 547,772,572 | -- | -- |
| Utilities | 550,259,746 | 550,259,746 | -- | -- |
| Money Market Funds | 222,692,173 | 222,692,173 | -- | -- |
| Equity Funds | 147,135,927 | 147,135,927 | -- | -- |
| Total Investments in Securities: | $11,516,268,193 | $11,416,451,636 | $99,816,557 | $-- |
See accompanying notes which are an integral part of the financial statements.
Fidelity® Series Stock Selector Large Cap Value Fund
Financial Statements
Statement of Assets and Liabilities
| | | July 31, 2021 (Unaudited) |
| Assets | | |
Investment in securities, at value (including securities loaned of $9,180,915) — See accompanying schedule:
Unaffiliated issuers (cost $8,444,622,016) | $11,293,576,020 | |
| Fidelity Central Funds (cost $222,691,312) | 222,692,173 | |
| Total Investment in Securities (cost $8,667,313,328) | | $11,516,268,193 |
| Foreign currency held at value (cost $628) | | 628 |
| Receivable for investments sold | | 291,777,137 |
| Receivable for fund shares sold | | 29,580 |
| Dividends receivable | | 13,868,352 |
| Distributions receivable from Fidelity Central Funds | | 10,718 |
| Other receivables | | 354 |
| Total assets | | 11,821,954,962 |
| Liabilities | | |
| Payable to custodian bank | $3,777,516 | |
| Payable for investments purchased | 164,338,169 | |
| Payable for fund shares redeemed | 168,910,869 | |
| Other payables and accrued expenses | 35,539 | |
| Collateral on securities loaned | 9,540,375 | |
| Total liabilities | | 346,602,468 |
| Net Assets | | $11,475,352,494 |
| Net Assets consist of: | | |
| Paid in capital | | $7,540,707,691 |
| Total accumulated earnings (loss) | | 3,934,644,803 |
| Net Assets | | $11,475,352,494 |
| Net Asset Value, offering price and redemption price per share ($11,475,352,494 ÷ 752,023,891 shares) | | $15.26 |
See accompanying notes which are an integral part of the financial statements.
Statement of Operations
| | | Six months ended July 31, 2021 (Unaudited) |
| Investment Income | | |
| Dividends | | $105,158,357 |
| Income from Fidelity Central Funds (including $6,070 from security lending) | | 62,510 |
| Total income | | 105,220,867 |
| Expenses | | |
| Custodian fees and expenses | $44,139 | |
| Independent trustees' fees and expenses | 22,139 | |
| Interest | 3,401 | |
| Total expenses | | 69,679 |
| Net investment income (loss) | | 105,151,188 |
| Realized and Unrealized Gain (Loss) | | |
| Net realized gain (loss) on: | | |
| Investment securities: | | |
| Unaffiliated issuers | 1,190,588,047 | |
| Fidelity Central Funds | (852) | |
| Foreign currency transactions | (80,812) | |
| Futures contracts | (2,374,172) | |
| Total net realized gain (loss) | | 1,188,132,211 |
| Change in net unrealized appreciation (depreciation) on: | | |
| Investment securities: | | |
| Unaffiliated issuers | 879,085,906 | |
| Assets and liabilities in foreign currencies | (3,413) | |
| Total change in net unrealized appreciation (depreciation) | | 879,082,493 |
| Net gain (loss) | | 2,067,214,704 |
| Net increase (decrease) in net assets resulting from operations | | $2,172,365,892 |
See accompanying notes which are an integral part of the financial statements.
Statement of Changes in Net Assets
| | Six months ended July 31, 2021 (Unaudited) | Year ended January 31, 2021 |
| Increase (Decrease) in Net Assets | | |
| Operations | | |
| Net investment income (loss) | $105,151,188 | $239,234,260 |
| Net realized gain (loss) | 1,188,132,211 | (169,717,772) |
| Change in net unrealized appreciation (depreciation) | 879,082,493 | 581,047,119 |
| Net increase (decrease) in net assets resulting from operations | 2,172,365,892 | 650,563,607 |
| Distributions to shareholders | (11,689,827) | (403,310,833) |
| Share transactions | | |
| Proceeds from sales of shares | 537,036,783 | 1,765,293,646 |
| Reinvestment of distributions | 11,689,827 | 403,310,832 |
| Cost of shares redeemed | (2,165,105,958) | (1,458,449,071) |
| Net increase (decrease) in net assets resulting from share transactions | (1,616,379,348) | 710,155,407 |
| Total increase (decrease) in net assets | 544,296,717 | 957,408,181 |
| Net Assets | | |
| Beginning of period | 10,931,055,777 | 9,973,647,596 |
| End of period | $11,475,352,494 | $10,931,055,777 |
| Other Information | | |
| Shares | | |
| Sold | 36,608,874 | 160,242,895 |
| Issued in reinvestment of distributions | 847,703 | 34,324,353 |
| Redeemed | (150,449,588) | (129,885,545) |
| Net increase (decrease) | (112,993,011) | 64,681,703 |
See accompanying notes which are an integral part of the financial statements.
Financial Highlights
Fidelity Series Stock Selector Large Cap Value Fund
| | Six months ended (Unaudited) July 31, | Years endedJanuary 31, | | | | |
| | 2021 | 2021 | 2020 | 2019 | 2018 | 2017 |
| Selected Per–Share Data | | | | | | |
| Net asset value, beginning of period | $12.64 | $12.46 | $11.57 | $13.47 | $12.49 | $10.38 |
| Income from Investment Operations | | | | | | |
| Net investment income (loss)A | .13 | .28B | .28 | .29 | .28C | .17 |
| Net realized and unrealized gain (loss) | 2.50 | .39 | 1.33 | (1.01) | 1.63 | 2.25 |
| Total from investment operations | 2.63 | .67 | 1.61 | (.72) | 1.91 | 2.42 |
| Distributions from net investment income | (.01) | (.28) | (.31) | (.27) | (.28) | (.16) |
| Distributions from net realized gain | – | (.21) | (.41) | (.90) | (.65) | (.14) |
| Total distributions | (.01) | (.49) | (.72) | (1.18)D | (.93) | (.31)D |
| Net asset value, end of period | $15.26 | $12.64 | $12.46 | $11.57 | $13.47 | $12.49 |
| Total ReturnE,F | 20.85% | 5.74% | 13.98% | (5.07)% | 15.62% | 23.49% |
| Ratios to Average Net AssetsG,H | | | | | | |
| Expenses before reductions | - %I,J | - %J | - %J | - %J | .20% | .67% |
| Expenses net of fee waivers, if any | - %I,J | - %J | - %J | - %J | .20% | .67% |
| Expenses net of all reductions | - %I,J | - %J | - %J | - %J | .20% | .66% |
| Net investment income (loss) | 1.81%I | 2.54%B | 2.32% | 2.33% | 2.13%C | 1.51% |
| Supplemental Data | | | | | | |
| Net assets, end of period (000 omitted) | $11,475,352 | $10,931,056 | $9,973,648 | $10,531,018 | $10,485,796 | $3,615,123 |
| Portfolio turnover rateK | 97%I | 94% | 65%L | 87%M | 61% | 54% |
A Calculated based on average shares outstanding during the period.
B Net investment income per share reflects one or more large, non-recurring dividend(s) which amounted to $.03 per share. Excluding such non-recurring dividend(s), the ratio of net investment income (loss) to average net assets would have been 2.23%.
C Net investment income per share reflects one or more large, non-recurring dividend(s) which amounted to $.03 per share. Excluding such non-recurring dividend(s), the ratio of net investment income (loss) to average net assets would have been 1.87%.
D Total distributions per share do not sum due to rounding.
E Total returns for periods of less than one year are not annualized.
F Total returns would have been lower if certain expenses had not been reduced during the applicable periods shown.
G Fees and expenses of any underlying mutual funds or exchange-traded funds (ETFs) are not included in the Fund's expense ratio. The Fund indirectly bears its proportionate share of these expenses. For additional expense information related to investments in Fidelity Central Funds, please refer to the "Investments in Fidelity Central Funds" note found in the Notes to Financial Statements section of the most recent Annual or Semi-Annual report.
H Expense ratios reflect operating expenses of the class. Expenses before reductions do not reflect amounts reimbursed, waived, or reduced through arrangements with the investment advisor, brokerage services, or other offset arrangements, if applicable, and do not represent the amount paid by the class during periods when reimbursements, waivers or reductions occur.
I Annualized
J Amount represents less than .005%.
K Amount does not include the portfolio activity of any underlying mutual funds or exchange-traded funds (ETFs).
L Portfolio turnover rate excludes securities received or delivered in-kind.
M The portfolio turnover rate does not include the assets acquired in the merger.
See accompanying notes which are an integral part of the financial statements.
Fidelity® Series Value Discovery Fund
Investment Summary (Unaudited)
Top Ten Stocks as of July 31, 2021
| | % of fund's net assets |
| Berkshire Hathaway, Inc. Class B | 3.9 |
| Comcast Corp. Class A | 3.2 |
| UnitedHealth Group, Inc. | 2.5 |
| Bristol-Myers Squibb Co. | 2.4 |
| Alphabet, Inc. Class A | 2.4 |
| CBRE Group, Inc. | 2.3 |
| Procter & Gamble Co. | 2.3 |
| Bank of America Corp. | 2.3 |
| JPMorgan Chase & Co. | 2.2 |
| Cigna Corp. | 2.2 |
| | 25.7 |
Top Five Market Sectors as of July 31, 2021
| | % of fund's net assets |
| Health Care | 18.8 |
| Financials | 18.3 |
| Industrials | 11.7 |
| Communication Services | 10.5 |
| Information Technology | 8.8 |
Asset Allocation (% of fund's net assets)
| As of July 31, 2021* |
| | Stocks | 96.9% |
| | Other Investments | 0.2% |
| | Short-Term Investments and Net Other Assets (Liabilities) | 2.9% |

* Foreign investments - 18.7%
Fidelity® Series Value Discovery Fund
Schedule of Investments July 31, 2021 (Unaudited)
Showing Percentage of Net Assets
| Common Stocks - 95.1% | | | |
| | | Shares | Value |
| COMMUNICATION SERVICES - 10.5% | | | |
| Diversified Telecommunication Services - 1.7% | | | |
| Verizon Communications, Inc. | | 2,873,700 | $160,294,986 |
| Entertainment - 0.3% | | | |
| Lions Gate Entertainment Corp. Class B (a) | | 2,053,234 | 27,431,206 |
| Interactive Media & Services - 2.9% | | | |
| Alphabet, Inc. Class A (a) | | 83,691 | 225,507,910 |
| Facebook, Inc. Class A (a) | | 141,300 | 50,345,190 |
| | | | 275,853,100 |
| Media - 5.6% | | | |
| Comcast Corp. Class A | | 5,214,304 | 306,757,504 |
| Fox Corp. Class A | | 823,410 | 29,362,801 |
| Interpublic Group of Companies, Inc. | | 4,231,314 | 149,619,263 |
| WPP PLC | | 4,266,162 | 55,174,409 |
| | | | 540,913,977 |
|
| TOTAL COMMUNICATION SERVICES | | | 1,004,493,269 |
|
| CONSUMER DISCRETIONARY - 4.4% | | | |
| Auto Components - 0.3% | | | |
| Lear Corp. | | 140,613 | 24,604,463 |
| Household Durables - 0.4% | | | |
| Whirlpool Corp. | | 196,424 | 43,515,773 |
| Multiline Retail - 1.1% | | | |
| Dollar General Corp. | | 455,639 | 105,999,857 |
| Specialty Retail - 1.2% | | | |
| Best Buy Co., Inc. | | 752,200 | 84,509,670 |
| Lowe's Companies, Inc. | | 148,300 | 28,575,927 |
| | | | 113,085,597 |
| Textiles, Apparel & Luxury Goods - 1.4% | | | |
| PVH Corp. (a) | | 603,985 | 63,188,911 |
| Tapestry, Inc. (a) | | 1,634,955 | 69,158,597 |
| | | | 132,347,508 |
|
| TOTAL CONSUMER DISCRETIONARY | | | 419,553,198 |
|
| CONSUMER STAPLES - 7.2% | | | |
| Beverages - 0.4% | | | |
| Coca-Cola European Partners PLC | | 640,943 | 39,776,923 |
| Food & Staples Retailing - 1.5% | | | |
| Kroger Co. | | 2,372,100 | 96,544,470 |
| U.S. Foods Holding Corp. (a) | | 1,335,830 | 45,872,402 |
| | | | 142,416,872 |
| Food Products - 2.0% | | | |
| Mondelez International, Inc. | | 2,203,200 | 139,374,432 |
| Tyson Foods, Inc. Class A | | 766,200 | 54,752,652 |
| | | | 194,127,084 |
| Household Products - 3.3% | | | |
| Procter & Gamble Co. | | 1,553,200 | 220,911,636 |
| Reckitt Benckiser Group PLC | | 905,200 | 69,247,488 |
| Spectrum Brands Holdings, Inc. | | 288,527 | 25,202,833 |
| | | | 315,361,957 |
|
| TOTAL CONSUMER STAPLES | | | 691,682,836 |
|
| ENERGY - 1.3% | | | |
| Energy Equipment & Services - 0.1% | | | |
| Hoegh LNG Partners LP (b) | | 1,153,654 | 6,322,024 |
| Oil, Gas & Consumable Fuels - 1.2% | | | |
| Dynagas LNG Partners LP (a)(b) | | 994,300 | 3,022,672 |
| Parex Resources, Inc. | | 4,768,269 | 78,350,044 |
| Teekay LNG Partners LP | | 2,552,592 | 36,987,058 |
| | | | 118,359,774 |
|
| TOTAL ENERGY | | | 124,681,798 |
|
| FINANCIALS - 18.3% | | | |
| Banks - 7.0% | | | |
| Bank of America Corp. | | 5,734,900 | 219,990,764 |
| Cullen/Frost Bankers, Inc. | | 235,300 | 25,252,396 |
| JPMorgan Chase & Co. | | 1,407,000 | 213,554,460 |
| M&T Bank Corp. | | 652,644 | 87,356,399 |
| PNC Financial Services Group, Inc. | | 679,600 | 123,965,836 |
| | | | 670,119,855 |
| Capital Markets - 1.7% | | | |
| Affiliated Managers Group, Inc. | | 457,331 | 72,459,524 |
| BlackRock, Inc. Class A | | 38,900 | 33,732,913 |
| Invesco Ltd. | | 1,267,824 | 30,909,549 |
| State Street Corp. | | 290,139 | 25,282,712 |
| | | | 162,384,698 |
| Consumer Finance - 2.3% | | | |
| Capital One Financial Corp. | | 544,374 | 88,025,276 |
| Discover Financial Services | | 1,074,734 | 133,610,931 |
| | | | 221,636,207 |
| Diversified Financial Services - 3.9% | | | |
| Berkshire Hathaway, Inc. Class B (a) | | 1,366,266 | 380,218,161 |
| Insurance - 3.4% | | | |
| Allstate Corp. | | 214,003 | 27,831,090 |
| American International Group, Inc. | | 936,200 | 44,329,070 |
| Chubb Ltd. | | 748,139 | 126,240,975 |
| The Travelers Companies, Inc. | | 868,370 | 129,317,660 |
| | | | 327,718,795 |
|
| TOTAL FINANCIALS | | | 1,762,077,716 |
|
| HEALTH CARE - 18.8% | | | |
| Biotechnology - 2.3% | | | |
| Amgen, Inc. | | 517,198 | 124,924,005 |
| Regeneron Pharmaceuticals, Inc. (a) | | 166,600 | 95,730,026 |
| | | | 220,654,031 |
| Health Care Providers & Services - 10.1% | | | |
| Anthem, Inc. | | 297,626 | 114,291,360 |
| Centene Corp. (a) | | 2,892,403 | 198,447,770 |
| Cigna Corp. | | 913,707 | 209,686,619 |
| CVS Health Corp. | | 1,187,634 | 97,813,536 |
| Humana, Inc. | | 260,422 | 110,903,313 |
| UnitedHealth Group, Inc. | | 579,144 | 238,734,740 |
| | | | 969,877,338 |
| Pharmaceuticals - 6.4% | | | |
| AstraZeneca PLC sponsored ADR | | 2,192,054 | 125,473,171 |
| Bristol-Myers Squibb Co. | | 3,359,248 | 227,992,162 |
| Roche Holding AG (participation certificate) | | 401,509 | 155,107,821 |
| Sanofi SA sponsored ADR | | 2,072,278 | 106,846,654 |
| | | | 615,419,808 |
|
| TOTAL HEALTH CARE | | | 1,805,951,177 |
|
| INDUSTRIALS - 11.7% | | | |
| Aerospace & Defense - 2.4% | | | |
| L3Harris Technologies, Inc. | | 385,300 | 87,362,922 |
| Northrop Grumman Corp. | | 388,300 | 140,960,666 |
| | | | 228,323,588 |
| Air Freight & Logistics - 0.6% | | | |
| Deutsche Post AG | | 837,600 | 56,765,198 |
| Building Products - 1.4% | | | |
| Johnson Controls International PLC | | 921,600 | 65,820,672 |
| Owens Corning | | 141,000 | 13,558,560 |
| Trane Technologies PLC | | 286,571 | 58,348,721 |
| | | | 137,727,953 |
| Electrical Equipment - 0.7% | | | |
| Regal Beloit Corp. | | 424,200 | 62,454,966 |
| Industrial Conglomerates - 2.4% | | | |
| 3M Co. | | 607,500 | 120,248,550 |
| Siemens AG | | 727,400 | 113,498,521 |
| | | | 233,747,071 |
| Machinery - 4.2% | | | |
| ITT, Inc. | | 796,900 | 78,024,479 |
| Oshkosh Corp. | | 1,027,200 | 122,801,760 |
| Otis Worldwide Corp. | | 803,700 | 71,971,335 |
| Pentair PLC | | 1,030,717 | 75,932,921 |
| Stanley Black & Decker, Inc. | | 299,400 | 58,996,770 |
| | | | 407,727,265 |
|
| TOTAL INDUSTRIALS | | | 1,126,746,041 |
|
| INFORMATION TECHNOLOGY - 7.0% | | | |
| Communications Equipment - 2.1% | | | |
| Cisco Systems, Inc. | | 3,669,775 | 203,195,442 |
| Electronic Equipment & Components - 1.4% | | | |
| TE Connectivity Ltd. | | 912,238 | 134,527,738 |
| IT Services - 2.3% | | | |
| Amdocs Ltd. | | 845,478 | 65,194,809 |
| Capgemini SA | | 269,500 | 58,264,300 |
| Cognizant Technology Solutions Corp. Class A | | 1,308,479 | 96,212,461 |
| | | | 219,671,570 |
| Semiconductors & Semiconductor Equipment - 0.6% | | | |
| NXP Semiconductors NV | | 291,200 | 60,100,768 |
| Software - 0.6% | | | |
| NortonLifeLock, Inc. | | 2,103,328 | 52,204,601 |
|
| TOTAL INFORMATION TECHNOLOGY | | | 669,700,119 |
|
| MATERIALS - 3.3% | | | |
| Chemicals - 1.4% | | | |
| DuPont de Nemours, Inc. | | 938,895 | 70,464,070 |
| International Flavors & Fragrances, Inc. | | 407,060 | 61,319,518 |
| | | | 131,783,588 |
| Metals & Mining - 1.9% | | | |
| BHP Group Ltd. sponsored ADR | | 160,100 | 12,577,456 |
| Lundin Mining Corp. | | 7,664,500 | 69,850,405 |
| Newmont Corp. | | 1,594,029 | 100,136,902 |
| | | | 182,564,763 |
|
| TOTAL MATERIALS | | | 314,348,351 |
|
| REAL ESTATE - 4.2% | | | |
| Equity Real Estate Investment Trusts (REITs) - 1.9% | | | |
| American Tower Corp. | | 411,400 | 116,343,920 |
| Simon Property Group, Inc. | | 511,394 | 64,701,569 |
| | | | 181,045,489 |
| Real Estate Management & Development - 2.3% | | | |
| CBRE Group, Inc. (a) | | 2,292,772 | 221,160,787 |
|
| TOTAL REAL ESTATE | | | 402,206,276 |
|
| UTILITIES - 8.4% | | | |
| Electric Utilities - 7.0% | | | |
| Duke Energy Corp. | | 982,400 | 103,260,064 |
| Entergy Corp. | | 47,200 | 4,857,824 |
| Evergy, Inc. | | 1,496,600 | 97,608,252 |
| Exelon Corp. | | 2,503,606 | 117,168,761 |
| PG&E Corp. (a) | | 8,164,300 | 71,764,197 |
| Portland General Electric Co. | | 1,273,600 | 62,279,040 |
| PPL Corp. | | 2,484,000 | 70,471,080 |
| Southern Co. | | 2,271,476 | 145,079,172 |
| | | | 672,488,390 |
| Multi-Utilities - 1.4% | | | |
| Dominion Energy, Inc. | | 1,792,100 | 134,174,527 |
|
| TOTAL UTILITIES | | | 806,662,917 |
|
| TOTAL COMMON STOCKS | | | |
| (Cost $6,507,014,533) | | | 9,128,103,698 |
|
| Nonconvertible Preferred Stocks - 1.8% | | | |
| ENERGY - 0.0% | | | |
| Oil, Gas & Consumable Fuels - 0.0% | | | |
| Dynagas LNG Partners LP 9.00% | | 188,872 | 4,804,923 |
| INFORMATION TECHNOLOGY - 1.8% | | | |
| Technology Hardware, Storage & Peripherals - 1.8% | | | |
| Samsung Electronics Co. Ltd. | | 2,693,430 | 168,462,042 |
| TOTAL NONCONVERTIBLE PREFERRED STOCKS | | | |
| (Cost $112,952,033) | | | 173,266,965 |
|
| Other - 0.2% | | | |
| ENERGY - 0.2% | | | |
| Oil, Gas & Consumable Fuels – 0.2% | | | |
| Utica Shale Drilling Program (non-operating revenue interest) (c)(d)(e) | | | |
| (Cost $39,369,027) | | 39,369,027 | 20,523,074 |
|
| Money Market Funds - 2.8% | | | |
| Fidelity Cash Central Fund 0.06% (f) | | 272,240,379 | 272,294,827 |
| Fidelity Securities Lending Cash Central Fund 0.06% (f)(g) | | 71,277 | 71,284 |
| TOTAL MONEY MARKET FUNDS | | | |
| (Cost $272,366,111) | | | 272,366,111 |
| TOTAL INVESTMENT IN SECURITIES - 99.9% | | | |
| (Cost $6,931,701,704) | | | 9,594,259,848 |
| NET OTHER ASSETS (LIABILITIES) - 0.1% | | | 9,945,801 |
| NET ASSETS - 100% | | | $9,604,205,649 |
Legend
(a) Non-income producing
(b) Security or a portion of the security is on loan at period end.
(c) Investment is owned by a wholly-owned subsidiary (Subsidiary) that is treated as a corporation for U.S. tax purposes.
(d) Restricted securities (including private placements) - Investment in securities not registered under the Securities Act of 1933 (excluding 144A issues). At the end of the period, the value of restricted securities (excluding 144A issues) amounted to $20,523,074 or 0.2% of net assets.
(e) Level 3 security
(f) Affiliated fund that is generally available only to investment companies and other accounts managed by Fidelity Investments. The rate quoted is the annualized seven-day yield of the fund at period end. A complete unaudited listing of the fund's holdings as of its most recent quarter end is available upon request. In addition, each Fidelity Central Fund's financial statements are available on the SEC's website or upon request.
(g) Investment made with cash collateral received from securities on loan.
Additional information on each restricted holding is as follows:
| Security | Acquisition Date | Acquisition Cost |
| Utica Shale Drilling Program (non-operating revenue interest) | 10/5/16 - 10/30/18 | $39,369,027 |
Affiliated Central Funds
Information regarding fiscal year to date income earned by the Fund from investments in Fidelity Central Funds is as follows:
| Fund | Income earned |
| Fidelity Cash Central Fund | $35,067 |
| Fidelity Securities Lending Cash Central Fund | 117,276 |
| Total | $152,343 |
Amounts in the income column in the above table include any capital gain distributions from underlying funds, which are presented in the corresponding line-item in the Statement of Operations, if applicable. Amount for Fidelity Securities Lending Cash Central Fund represents the income earned on investing cash collateral, less rebates paid to borrowers and any lending agent fees associated with the loan, plus any premium payments received for lending certain types of securities.
Fiscal year to date information regarding the Fund's investments in Fidelity Central Funds, including the ownership percentage, is presented below.
| Fund | Value, beginning of period | Purchases | Sales Proceeds | Realized Gain/Loss | Change in Unrealized appreciation (depreciation) | Value, end of period | % ownership, end of period |
| Fidelity Cash Central Fund 0.06% | $135,461,575 | $1,394,491,053 | $1,257,658,215 | $414 | $-- | $272,294,827 | 0.4% |
| Fidelity Securities Lending Cash Central Fund 0.06% | 15,411,395 | 453,074,296 | 468,414,407 | -- | -- | 71,284 | 0.0% |
| Total | $150,872,970 | $1,847,565,349 | $1,726,072,622 | $414 | $-- | $272,366,111 | |
Investment Valuation
The following is a summary of the inputs used, as of July 31, 2021, involving the Fund's assets and liabilities carried at fair value. The inputs or methodology used for valuing securities may not be an indication of the risk associated with investing in those securities. For more information on valuation inputs, and their aggregation into the levels used below, please refer to the Investment Valuation section in the accompanying Notes to Financial Statements.
| | Valuation Inputs at Reporting Date: |
| Description | Total | Level 1 | Level 2 | Level 3 |
| Investments in Securities: | | | | |
| Equities: | | | | |
| Communication Services | $1,004,493,269 | $949,318,860 | $55,174,409 | $-- |
| Consumer Discretionary | 419,553,198 | 419,553,198 | -- | -- |
| Consumer Staples | 691,682,836 | 622,435,348 | 69,247,488 | -- |
| Energy | 129,486,721 | 129,486,721 | -- | -- |
| Financials | 1,762,077,716 | 1,762,077,716 | -- | -- |
| Health Care | 1,805,951,177 | 1,650,843,356 | 155,107,821 | -- |
| Industrials | 1,126,746,041 | 956,482,322 | 170,263,719 | -- |
| Information Technology | 838,162,161 | 838,162,161 | -- | -- |
| Materials | 314,348,351 | 314,348,351 | -- | -- |
| Real Estate | 402,206,276 | 402,206,276 | -- | -- |
| Utilities | 806,662,917 | 806,662,917 | -- | -- |
| Other | 20,523,074 | -- | -- | 20,523,074 |
| Money Market Funds | 272,366,111 | 272,366,111 | -- | -- |
| Total Investments in Securities: | $9,594,259,848 | $9,123,943,337 | $449,793,437 | $20,523,074 |
Other Information
Distribution of investments by country or territory of incorporation, as a percentage of Total Net Assets, is as follows (Unaudited):
| United States of America | 81.3% |
| Switzerland | 4.3% |
| United Kingdom | 2.4% |
| Ireland | 2.1% |
| Canada | 1.8% |
| Germany | 1.8% |
| Korea (South) | 1.8% |
| France | 1.7% |
| Others (Individually Less Than 1%) | 2.8% |
| | 100.0% |
See accompanying notes which are an integral part of the financial statements.
Fidelity® Series Value Discovery Fund
Financial Statements
Statement of Assets and Liabilities
| | | July 31, 2021 (Unaudited) |
| Assets | | |
Investment in securities, at value (including securities loaned of $65,512) — See accompanying schedule:
Unaffiliated issuers (cost $6,659,335,593) | $9,321,893,737 | |
| Fidelity Central Funds (cost $272,366,111) | 272,366,111 | |
| Total Investment in Securities (cost $6,931,701,704) | | $9,594,259,848 |
| Restricted cash | | 327,300 |
| Receivable for investments sold | | 122,400,206 |
| Receivable for fund shares sold | | 42,545 |
| Dividends receivable | | 11,610,418 |
| Distributions receivable from Fidelity Central Funds | | 19,976 |
| Other receivables | | 414 |
| Total assets | | 9,728,660,707 |
| Liabilities | | |
| Payable for fund shares redeemed | $124,292,073 | |
| Other payables and accrued expenses | 91,335 | |
| Collateral on securities loaned | 71,650 | |
| Total liabilities | | 124,455,058 |
| Net Assets | | $9,604,205,649 |
| Net Assets consist of: | | |
| Paid in capital | | $6,516,647,271 |
| Total accumulated earnings (loss) | | 3,087,558,378 |
| Net Assets | | $9,604,205,649 |
| Net Asset Value, offering price and redemption price per share ($9,604,205,649 ÷ 565,357,450 shares) | | $16.99 |
See accompanying notes which are an integral part of the financial statements.
Statement of Operations
| | | Six months ended July 31, 2021 (Unaudited) |
| Investment Income | | |
| Dividends | | $93,503,032 |
| Income from Fidelity Central Funds (including $117,276 from security lending) | | 152,343 |
| Total income | | 93,655,375 |
| Expenses | | |
| Custodian fees and expenses | $115,621 | |
| Independent trustees' fees and expenses | 18,295 | |
| Interest | 1,958 | |
| Total expenses before reductions | 135,874 | |
| Expense reductions | (9) | |
| Total expenses after reductions | | 135,865 |
| Net investment income (loss) | | 93,519,510 |
| Realized and Unrealized Gain (Loss) | | |
| Net realized gain (loss) on: | | |
| Investment securities: | | |
| Unaffiliated issuers | 587,132,225 | |
| Fidelity Central Funds | 414 | |
| Foreign currency transactions | 44,549 | |
| Total net realized gain (loss) | | 587,177,188 |
| Change in net unrealized appreciation (depreciation) on: | | |
| Investment securities: | | |
| Unaffiliated issuers | 968,481,613 | |
| Assets and liabilities in foreign currencies | 15,183 | |
| Total change in net unrealized appreciation (depreciation) | | 968,496,796 |
| Net gain (loss) | | 1,555,673,984 |
| Net increase (decrease) in net assets resulting from operations | | $1,649,193,494 |
See accompanying notes which are an integral part of the financial statements.
Statement of Changes in Net Assets
| | Six months ended July 31, 2021 (Unaudited) | Year ended January 31, 2021 |
| Increase (Decrease) in Net Assets | | |
| Operations | | |
| Net investment income (loss) | $93,519,510 | $193,222,691 |
| Net realized gain (loss) | 587,177,188 | (239,998,622) |
| Change in net unrealized appreciation (depreciation) | 968,496,796 | 1,119,378,150 |
| Net increase (decrease) in net assets resulting from operations | 1,649,193,494 | 1,072,602,219 |
| Distributions to shareholders | (9,334,445) | (259,945,106) |
| Share transactions | | |
| Proceeds from sales of shares | 629,837,468 | 1,507,960,345 |
| Reinvestment of distributions | 9,334,445 | 259,945,106 |
| Cost of shares redeemed | (1,646,535,371) | (1,165,843,350) |
| Net increase (decrease) in net assets resulting from share transactions | (1,007,363,458) | 602,062,101 |
| Total increase (decrease) in net assets | 632,495,591 | 1,414,719,214 |
| Net Assets | | |
| Beginning of period | 8,971,710,058 | 7,556,990,844 |
| End of period | $9,604,205,649 | $8,971,710,058 |
| Other Information | | |
| Shares | | |
| Sold | 38,755,578 | 121,271,306 |
| Issued in reinvestment of distributions | 609,696 | 19,586,697 |
| Redeemed | (101,661,683) | (93,992,823) |
| Net increase (decrease) | (62,296,409) | 46,865,180 |
See accompanying notes which are an integral part of the financial statements.
Financial Highlights
Fidelity Series Value Discovery Fund
| | Six months ended (Unaudited) July 31, | Years endedJanuary 31, | | | | |
| | 2021 | 2021 | 2020 | 2019 | 2018 | 2017 |
| Selected Per–Share Data | | | | | | |
| Net asset value, beginning of period | $14.29 | $13.01 | $12.19 | $13.89 | $13.03 | $10.83 |
| Income from Investment Operations | | | | | | |
| Net investment income (loss)A | .16 | .32B | .32 | .32 | .31 | .27 |
| Net realized and unrealized gain (loss) | 2.56 | 1.39 | 1.03 | (1.20) | 1.58 | 2.44 |
| Total from investment operations | 2.72 | 1.71 | 1.35 | (.88) | 1.89 | 2.71 |
| Distributions from net investment income | (.02) | (.30) | (.34) | (.30) | (.25)C | (.26) |
| Distributions from net realized gain | – | (.13) | (.19) | (.52) | (.78)C | (.25) |
| Total distributions | (.02) | (.43) | (.53) | (.82) | (1.03) | (.51) |
| Net asset value, end of period | $16.99 | $14.29 | $13.01 | $12.19 | $13.89 | $13.03 |
| Total ReturnD,E | 19.01% | 13.45% | 10.95% | (6.12)% | 15.05% | 25.40% |
| Ratios to Average Net AssetsF,G | | | | | | |
| Expenses before reductions | - %H,I | - %I | - %I | - %I | .27% | .62% |
| Expenses net of fee waivers, if any | - %H,I | - %I | - %I | - %I | .27% | .62% |
| Expenses net of all reductions | - %H,I | - %I | - %I | - %I | .26% | .62% |
| Net investment income (loss) | 1.94%H | 2.54%B | 2.49% | 2.47% | 2.29% | 2.21% |
| Supplemental Data | | | | | | |
| Net assets, end of period (000 omitted) | $9,604,206 | $8,971,710 | $7,556,991 | $7,742,285 | $7,430,718 | $5,063,707 |
| Portfolio turnover rateJ | 33%H | 75% | 47%K | 40%L | 74%K | 42% |
A Calculated based on average shares outstanding during the period.
B Net investment income per share reflects one or more large, non-recurring dividend(s) which amounted to $.04 per share. Excluding such non-recurring dividend(s), the ratio of net investment income (loss) to average net assets would have been 2.25%.
C The amounts shown reflect certain reclassifications related to book to tax differences that were made in the year shown.
D Total returns for periods of less than one year are not annualized.
E Total returns would have been lower if certain expenses had not been reduced during the applicable periods shown.
F Fees and expenses of any underlying mutual funds or exchange-traded funds (ETFs) are not included in the Fund's expense ratio. The Fund indirectly bears its proportionate share of these expenses. For additional expense information related to investments in Fidelity Central Funds, please refer to the "Investments in Fidelity Central Funds" note found in the Notes to Financial Statements section of the most recent Annual or Semi-Annual report.
G Expense ratios reflect operating expenses of the class. Expenses before reductions do not reflect amounts reimbursed, waived, or reduced through arrangements with the investment advisor, brokerage services, or other offset arrangements, if applicable, and do not represent the amount paid by the class during periods when reimbursements, waivers or reductions occur.
H Annualized
I Amount represents less than .005%.
J Amount does not include the portfolio activity of any underlying mutual funds or exchange-traded funds (ETFs).
K Portfolio turnover rate excludes securities received or delivered in-kind.
L The portfolio turnover rate does not include the assets acquired in the merger.
See accompanying notes which are an integral part of the financial statements.
Notes to Financial Statements (Unaudited)
For the period ended July 31, 2021
1. Organization.
Fidelity Series All-Sector Equity Fund, Fidelity Series Stock Selector Large Cap Value Fund and Fidelity Series Value Discovery Fund (the Funds) are funds of Fidelity Devonshire Trust (the Trust). The Trust is registered under the Investment Company Act of 1940, as amended (the 1940 Act), as an open-end management investment company organized as a Massachusetts business trust. Each Fund is authorized to issue an unlimited number of shares. Shares are offered only to certain other Fidelity funds and Fidelity managed 529 plans.
2. Investments in Fidelity Central Funds.
Funds may invest in Fidelity Central Funds, which are open-end investment companies generally available only to other investment companies and accounts managed by the investment adviser and its affiliates. The Schedule of Investments lists any Fidelity Central Funds held as an investment as of period end, but does not include the underlying holdings of each Fidelity Central Fund. An investing fund indirectly bears its proportionate share of the expenses of the underlying Fidelity Central Funds.
Based on its investment objective, each Fidelity Central Fund may invest or participate in various investment vehicles or strategies that are similar to those of the investing fund. These strategies are consistent with the investment objectives of the investing fund and may involve certain economic risks which may cause a decline in value of each of the Fidelity Central Funds and thus a decline in the value of the investing fund.
| Fidelity Central Fund | Investment Manager | Investment Objective | Investment Practices | Expense Ratio(a) |
| Fidelity Money Market Central Funds | Fidelity Management & Research Company LLC (FMR) | Each fund seeks to obtain a high level of current income consistent with the preservation of capital and liquidity. | Short-term Investments | Ranged from less than .005% to .01% |
(a) Expenses expressed as a percentage of average net assets and are as of each underlying Central Fund's most recent annual or semi-annual shareholder report.
A complete unaudited list of holdings for each Fidelity Central Fund is available upon request or at the Securities and Exchange Commission website at www.sec.gov. In addition, the financial statements of the Fidelity Central Funds which contain the significant accounting policies (including investment valuation policies) of those funds, and are not covered by the Report of Independent Registered Public Accounting Firm, are available on the Securities and Exchange Commission website or upon request.
3. Significant Accounting Policies.
Each Fund is an investment company and applies the accounting and reporting guidance of the Financial Accounting Standards Board (FASB) Accounting Standards Codification Topic 946 Financial Services - Investment Companies. The financial statements have been prepared in conformity with accounting principles generally accepted in the United States of America (GAAP), which require management to make certain estimates and assumptions at the date of the financial statements. Actual results could differ from those estimates. Subsequent events, if any, through the date that the financial statements were issued have been evaluated in the preparation of the financial statements. Each Fund's Schedule of Investments lists any underlying mutual funds or exchange-traded funds (ETFs) but does not include the underlying holdings of these funds. The following summarizes the significant accounting policies of each Fund:
Investment Valuation. Investments are valued as of 4:00 p.m. Eastern time on the last calendar day of the period. The Board of Trustees (the Board) has delegated the day to day responsibility for the valuation of each Fund's investments to the Fair Value Committee (the Committee) established by each Fund's investment adviser. In accordance with valuation policies and procedures approved by the Board, each Fund attempts to obtain prices from one or more third party pricing vendors or brokers to value its investments. When current market prices, quotations or currency exchange rates are not readily available or reliable, investments will be fair valued in good faith by the Committee, in accordance with procedures adopted by the Board. Factors used in determining fair value vary by investment type and may include market or investment specific events, changes in interest rates and credit quality. The frequency with which these procedures are used cannot be predicted and they may be utilized to a significant extent. The Committee oversees each Fund's valuation policies and procedures and reports to the Board on the Committee's activities and fair value determinations. The Board monitors the appropriateness of the procedures used in valuing each Fund's investments and ratifies the fair value determinations of the Committee.
Each Fund categorizes the inputs to valuation techniques used to value its investments into a disclosure hierarchy consisting of three levels as shown below:
- Level 1 – quoted prices in active markets for identical investments
- Level 2 – other significant observable inputs (including quoted prices for similar investments, interest rates, prepayment speeds, etc.)
- Level 3 – unobservable inputs (including the Fund's own assumptions based on the best information available)
Valuation techniques used to value each Fund's investments by major category are as follows:
Equity securities, including restricted securities, for which market quotations are readily available, are valued at the last reported sale price or official closing price as reported by a third party pricing vendor on the primary market or exchange on which they are traded and are categorized as Level 1 in the hierarchy. In the event there were no sales during the day or closing prices are not available, securities are valued at the last quoted bid price or may be valued using the last available price and are generally categorized as Level 2 in the hierarchy. For foreign equity securities, when market or security specific events arise, comparisons to the valuation of American Depositary Receipts (ADRs), futures contracts, Exchange-Traded Funds (ETFs) and certain indexes as well as quoted prices for similar securities may be used and would be categorized as Level 2 in the hierarchy. For equity securities, including restricted securities, where observable inputs are limited, assumptions about market activity and risk are used and these securities may be categorized as Level 3 in the hierarchy.
Debt securities, including restricted securities, are valued based on evaluated prices received from third party pricing vendors or from brokers who make markets in such securities. U.S. government and government agency obligations are valued by pricing vendors who utilize matrix pricing which considers yield or price of bonds of comparable quality, coupon, maturity and type or by broker-supplied prices. When independent prices are unavailable or unreliable, debt securities may be valued utilizing pricing methodologies which consider similar factors that would be used by third party pricing vendors. Debt securities are generally categorized as Level 2 in the hierarchy but may be Level 3 depending on the circumstances. ETFs are valued at their last sale price or official closing price as reported by a third party pricing vendor on the primary market or exchange on which they are traded and are categorized as Level 1 in the hierarchy. In the event there were no sales during the day but the exchange reports a closing bid level, ETFs are valued at the closing bid and would be categorized as Level 1 in the hierarchy. In the event there was no closing bid, ETFs may be valued by another method that the Board believes reflects fair value in accordance with the Board's fair value pricing policies and may be categorized as Level 2 in the hierarchy.
Futures contracts are valued at the settlement price established each day by the board of trade or exchange on which they are traded and are categorized as Level 1 in the hierarchy. Investments in open-end mutual funds, including the Fidelity Central Funds, are valued at their closing net asset value (NAV) each business day and are categorized as Level 1 in the hierarchy.
Changes in valuation techniques may result in transfers in or out of an assigned level within the disclosure hierarchy. The aggregate value of investments by input level as of July 31, 2021 is included at the end of each Fund's Schedule of Investments.
Foreign Currency. Certain Funds may use foreign currency contracts to facilitate transactions in foreign-denominated securities. Gains and losses from these transactions may arise from changes in the value of the foreign currency or if the counterparties do not perform under the contracts' terms.
Foreign-denominated assets, including investment securities, and liabilities are translated into U.S. dollars at the exchange rates at period end. Purchases and sales of investment securities, income and dividends received, and expenses denominated in foreign currencies are translated into U.S. dollars at the exchange rate in effect on the transaction date.
The effects of exchange rate fluctuations on investments are included with the net realized and unrealized gain (loss) on investment securities. Other foreign currency transactions resulting in realized and unrealized gain (loss) are disclosed separately.
Investment Transactions and Income. For financial reporting purposes, the Funds' investment holdings and NAV include trades executed through the end of the last business day of the period. The NAV per share for processing shareholder transactions is calculated as of the close of business of the New York Stock Exchange (NYSE), normally 4:00 p.m. Eastern time and includes trades executed through the end of the prior business day. Gains and losses on securities sold are determined on the basis of identified cost and for certain Funds include proceeds received from litigation. Dividend income is recorded on the ex-dividend date, except for certain dividends from foreign securities where the ex-dividend date may have passed, which are recorded as soon as the Funds are informed of the ex-dividend date. Non-cash dividends included in dividend income, if any, are recorded at the fair market value of the securities received. Income and capital gain distributions from Fidelity Central Funds, if any, are recorded on the ex-dividend date. Certain distributions received by the Funds represent a return of capital or capital gain. The Funds determine the components of these distributions subsequent to the ex-dividend date, based upon receipt of tax filings or other correspondence relating to the underlying investment. These distributions are recorded as a reduction of cost of investments and/or as a realized gain. Interest income is accrued as earned and includes coupon interest and amortization of premium and accretion of discount on debt securities as applicable. Investment income is recorded net of foreign taxes withheld where recovery of such taxes is uncertain.
Expenses. Expenses directly attributable to a fund are charged to that fund. Expenses attributable to more than one fund are allocated among the respective funds on the basis of relative net assets or other appropriate methods. Expenses included in the accompanying financial statements reflect the expenses of that fund and do not include any expenses associated with any underlying mutual funds or exchange-traded funds. Although not included in a fund's expenses, a fund indirectly bears its proportionate share of these expenses through the net asset value of each underlying mutual fund or exchange-traded fund. Expense estimates are accrued in the period to which they relate and adjustments are made when actual amounts are known.
Income Tax Information and Distributions to Shareholders. Each year, each Fund intends to qualify as a regulated investment company under Subchapter M of the Internal Revenue Code, including distributing substantially all of its taxable income and realized gains. As a result, no provision for U.S. Federal income taxes is required. Each Fund files a U.S. federal tax return, in addition to state and local tax returns as required. Each Fund's federal income tax returns are subject to examination by the Internal Revenue Service (IRS) for a period of three fiscal years after they are filed. State and local tax returns may be subject to examination for an additional fiscal year depending on the jurisdiction. Foreign taxes are provided for based on each Fund's understanding of the tax rules and rates that exist in the foreign markets in which it invests.
Distributions are declared and recorded on the ex-dividend date. Income and capital gain distributions are determined in accordance with income tax regulations, which may differ from GAAP.
Capital accounts within the financial statements are adjusted for permanent book-tax differences. These adjustments have no impact on net assets or the results of operations. Capital accounts are not adjusted for temporary book-tax differences which will reverse in a subsequent period.
Book-tax differences are primarily due to futures contracts, foreign currency transactions, certain foreign taxes, passive foreign investment companies (PFIC), market discount, partnerships, capital loss carryforwards, losses deferred due to wash sales and excise tax regulations.
As of period end, the cost and unrealized appreciation (depreciation) in securities, and derivatives if applicable, for federal income tax purposes were as follows for each Fund:
| | Tax cost | Gross unrealized appreciation | Gross unrealized depreciation | Net unrealized appreciation (depreciation) |
| Fidelity Series All-Sector Equity Fund | $2,199,694,129 | $1,804,685,400 | $(30,084,189) | $1,774,601,211 |
| Fidelity Series Stock Selector Large Cap Value Fund | 8,693,278,082 | 2,917,999,341 | (95,009,230) | 2,822,990,111 |
| Fidelity Series Value Discovery Fund | 6,941,893,883 | 2,770,565,288 | (118,199,323) | 2,652,365,965 |
Capital loss carryforwards are only available to offset future capital gains of the Funds to the extent provided by regulations and may be limited. The capital loss carryforward information presented below, including any applicable limitation, is estimated as of prior fiscal period end and is subject to adjustment.
| | No expiration | | |
| | Short-term | Long-term | Total capital loss carryforward |
| Fidelity Series Stock Selector Large Cap Value Fund | (96,982,484) | (26,954,853) | (123,937,337) |
| Fidelity Series Value Discovery Fund | (18,792,169) | (216,321,427) | (235,113,596) |
Restricted Securities (including Private Placements). Funds may invest in securities that are subject to legal or contractual restrictions on resale. These securities generally may be resold in transactions exempt from registration or to the public if the securities are registered. Disposal of these securities may involve time-consuming negotiations and expense, and prompt sale at an acceptable price may be difficult. Information regarding restricted securities held at period end is included at the end of the Schedule of Investments, if applicable.
Consolidated Subsidiary. The Funds included in the table below hold certain investments through a wholly-owned subsidiary ("Subsidiary"), which may be subject to federal and state taxes upon disposition.
As of period end, investments in Subsidiaries were as follows:
| | $ Amount | % of Net Assets |
| Fidelity Series Value Discovery Fund | 20,850,374 | .22 |
The financial statements have been consolidated to include the Subsidiary accounts where applicable. Accordingly, all inter-company transactions and balances have been eliminated.
At period end, any estimated tax liability for these investments is presented as "Deferred taxes" in the Statement of Assets and Liabilities and included in "Change in net unrealized appreciation (depreciation) on investment securities" in the Statement of Operations. The tax liability incurred may differ materially depending on conditions when these investments are disposed. Any cash held by a Subsidiary is restricted as to its use and is presented as "Restricted cash" in the Statement of Assets and Liabilities, if applicable.
4. Derivative Instruments.
Risk Exposures and the Use of Derivative Instruments. The Funds' investment objective allows the Funds to enter into various types of derivative contracts, including futures contracts. Derivatives are investments whose value is primarily derived from underlying assets, indices or reference rates and may be transacted on an exchange or over-the-counter (OTC). Derivatives may involve a future commitment to buy or sell a specified asset based on specified terms, to exchange future cash flows at periodic intervals based on a notional principal amount, or for one party to make one or more payments upon the occurrence of specified events in exchange for periodic payments from the other party.
The Funds used derivatives to increase returns and to manage exposure to certain risks as defined below. The success of any strategy involving derivatives depends on analysis of numerous economic factors, and if the strategies for investment do not work as intended, the Funds may not achieve their objectives.
The Funds' use of derivatives increased or decreased their exposure to the following risk:
| Equity Risk | Equity risk relates to the fluctuations in the value of financial instruments as a result of changes in market prices (other than those arising from interest rate risk or foreign exchange risk), whether caused by factors specific to an individual investment, its issuer, or all factors affecting all instruments traded in a market or market segment.
|
The Funds are also exposed to additional risks from investing in derivatives, such as liquidity risk and counterparty credit risk. Liquidity risk is the risk that the Funds will be unable to close out the derivative in the open market in a timely manner. Counterparty credit risk is the risk that the counterparty will not be able to fulfill its obligation to the Funds. Counterparty credit risk related to exchange-traded futures contracts may be mitigated by the protection provided by the exchange on which they trade.
Investing in derivatives may involve greater risks than investing in the underlying assets directly and, to varying degrees, may involve risk of loss in excess of any initial investment and collateral received and amounts recognized in the Statement of Assets and Liabilities. In addition, there may be the risk that the change in value of the derivative contract does not correspond to the change in value of the underlying instrument.
Futures Contracts. A futures contract is an agreement between two parties to buy or sell a specified underlying instrument for a fixed price at a specified future date. The Funds used futures contracts to manage their exposure to the stock market.
Upon entering into a futures contract, a fund is required to deposit either cash or securities (initial margin) with a clearing broker in an amount equal to a certain percentage of the face value of the contract. Futures contracts are marked-to-market daily and subsequent daily payments (variation margin) are made or received by a fund depending on the daily fluctuations in the value of the futures contracts and are recorded as unrealized appreciation or (depreciation). This receivable and/or payable, if any, is included in daily variation margin on futures contracts in the Statement of Assets and Liabilities. Realized gain or (loss) is recorded upon the expiration or closing of a futures contract. The net realized gain (loss) and change in net unrealized appreciation (depreciation) on futures contracts during the period is presented in the Statement of Operations.
Any open futures contracts at period end are presented in the Schedule of Investments under the caption "Futures Contracts". The notional amount at value reflects each contract's exposure to the underlying instrument or index at period end and is representative of volume of activity during the period. Securities deposited to meet initial margin requirements are identified in the Schedule of Investments.
5. Purchases and Sales of Investments.
Purchases and sales of securities, other than short-term securities and in-kind transactions, as applicable, are noted in the table below.
| | Purchases ($) | Sales ($) |
| Fidelity Series All-Sector Equity Fund | 567,004,682 | 1,053,372,457 |
| Fidelity Series Stock Selector Large Cap Value Fund | 5,386,083,937 | 6,769,827,933 |
| Fidelity Series Value Discovery Fund | 1,511,323,728 | 2,591,309,590 |
6. Fees and Other Transactions with Affiliates.
Management Fee. Fidelity Management & Research Company LLC (the investment adviser) and its affiliates provide the Funds with investment management related services for which the Funds do not pay a management fee. Under the management contract, the investment adviser or an affiliate pays all ordinary operating expenses of the Funds, except custody fees, fees and expenses of the independent Trustees, and certain miscellaneous expenses such as proxy and shareholder meeting expenses.
Brokerage Commissions. A portion of portfolio transactions were placed with brokerage firms which are affiliates of the investment adviser. Brokerage commissions are included in net realized gain (loss) and change in net unrealized appreciation (depreciation) in the Statement of Operations. The commissions paid to these affiliated firms were as follows:
| | Amount |
| Fidelity Series All-Sector Equity Fund | $12,558 |
| Fidelity Series Stock Selector Large Cap Value Fund | 92,950 |
| Fidelity Series Value Discovery Fund | 25,566 |
Interfund Lending Program. Pursuant to an Exemptive Order issued by the Securities and Exchange Commission (the SEC), each Fund, along with other registered investment companies having management contracts with Fidelity Management & Research Company LLC (FMR), or other affiliated entities of FMR, may participate in an interfund lending program. This program provides an alternative credit facility allowing each Fund to borrow from, or lend money to, other participating affiliated funds. At period end, there were no interfund loans outstanding. Activity in this program during the period for which loans were outstanding was as follows:
| | Borrower or Lender | Average Loan Balance | Weighted Average Interest Rate | Interest Expense |
| Fidelity Series Stock Selector Large Cap Value Fund | Borrower | $211,111,500 | .29% | $3,401 |
| Fidelity Series Value Discovery Fund | Borrower | $81,395,333 | .29% | $1,958 |
Interfund Trades. Funds may purchase from or sell securities to other Fidelity Funds under procedures adopted by the Board. The procedures have been designed to ensure these interfund trades are executed in accordance with Rule 17a-7 of the 1940 Act. Any interfund trades are included within the respective purchases and sales amounts shown in the Purchases and Sales of Investments note and are noted in the table below.
| | Purchases ($) | Sales ($) |
| Fidelity Series All-Sector Equity Fund | 42,979,188 | 63,576,470 |
| Fidelity Series Stock Selector Large Cap Value Fund | 267,093,553 | 573,015,092 |
| Fidelity Series Value Discovery Fund | 88,857,870 | 280,752,259 |
7. Committed Line of Credit.
Certain Funds participate with other funds managed by the investment adviser or an affiliate in a $4.25 billion credit facility (the "line of credit") to be utilized for temporary or emergency purposes to fund shareholder redemptions or for other short-term liquidity purposes. The commitment fees on the pro-rata portion of the line of credit are borne by the investment adviser. During the period, there were no borrowings on this line of credit.
8. Security Lending.
Funds lend portfolio securities from time to time in order to earn additional income. Lending agents are used, including National Financial Services (NFS), an affiliate of the investment adviser. Pursuant to a securities lending agreement, NFS will receive a fee, which is capped at 9.9% of a fund's daily lending revenue, for its services as lending agent. A fund may lend securities to certain qualified borrowers, including NFS. On the settlement date of the loan, a fund receives collateral (in the form of U.S. Treasury obligations, letters of credit and/or cash) against the loaned securities and maintains collateral in an amount not less than 100% of the market value of the loaned securities during the period of the loan. The market value of the loaned securities is determined at the close of business of a fund and any additional required collateral is delivered to a fund on the next business day. A fund or borrower may terminate the loan at any time, and if the borrower defaults on its obligation to return the securities loaned because of insolvency or other reasons, a fund may apply collateral received from the borrower against the obligation. A fund may experience delays and costs in recovering the securities loaned. Any cash collateral received is invested in the Fidelity Securities Lending Cash Central Fund. Any loaned securities are identified as such in the Schedule of Investments, and the value of loaned securities and cash collateral at period end, as applicable, are presented in the Statement of Assets and Liabilities. Security lending income represents the income earned on investing cash collateral, less rebates paid to borrowers and any lending agent fees associated with the loan, plus any premium payments received for lending certain types of securities. Security lending income is presented in the Statement of Operations as a component of income from Fidelity Central Funds. Affiliated security lending activity, if any, was as follows:
| | Total Security Lending Fees Paid to NFS | Security Lending Income From Securities Loaned to NFS | Value of Securities Loaned to NFS at Period End |
| Fidelity Series All-Sector Equity Fund | $1,541 | $– | $– |
| Fidelity Series Stock Selector Large Cap Value Fund | $600 | $– | $– |
| Fidelity Series Value Discovery Fund | $12,686 | $– | $– |
9. Expense Reductions.
Through arrangements with each applicable Fund's custodian, credits realized as a result of certain uninvested cash balances were used to reduce each applicable Fund's expenses. All of the applicable expense reductions are noted in the table below.
| | Custodian credits |
| Fidelity Series Value Discovery Fund | 9 |
10. Other.
Fund's organizational documents provide former and current trustees and officers with a limited indemnification against liabilities arising in connection with the performance of their duties to the fund. In the normal course of business, the fund may also enter into contracts that provide general indemnifications. The fund's maximum exposure under these arrangements is unknown as this would be dependent on future claims that may be made against the fund. The risk of material loss from such claims is considered remote.
At the end of the period, mutual funds and accounts managed by the investment adviser or its affiliates were the owners of record of all of the outstanding shares of the Funds.
11. Coronavirus (COVID-19) Pandemic.
An outbreak of COVID-19 first detected in China during December 2019 has since spread globally and was declared a pandemic by the World Health Organization during March 2020. Developments that disrupt global economies and financial markets, such as the COVID-19 pandemic, may magnify factors that affect the Funds' performance.
Shareholder Expense Example
As a shareholder, you incur two types of costs: (1) transaction costs, which may include sales charges (loads) on purchase payments or redemption proceeds, as applicable and (2) ongoing costs, which generally include management fees, distribution and/or service (12b-1) fees and other Fund expenses. This Example is intended to help you understand your ongoing costs (in dollars) of investing in a fund and to compare these costs with the ongoing costs of investing in other mutual funds.
The Example is based on an investment of $1,000 invested at the beginning of the period and held for the entire period (February 1, 2021 to July 31, 2021).
Actual Expenses
The first line of the accompanying table provides information about actual account values and actual expenses. You may use the information in this line, together with the amount you invested, to estimate the expenses that you paid over the period. Simply divide your account value by $1,000.00 (for example, an $8,600 account value divided by $1,000.00 = 8.6), then multiply the result by the number in the first line for a class/Fund under the heading entitled "Expenses Paid During Period" to estimate the expenses you paid on your account during this period. If any fund is a shareholder of any underlying mutual funds or exchange-traded funds (ETFs) (the Underlying Funds), such fund indirectly bears its proportional share of the expenses of the Underlying Funds in addition to the direct expenses incurred presented in the table. These fees and expenses are not included in the annualized expense ratio used to calculate the expense estimate in the table below.
Hypothetical Example for Comparison Purposes
The second line of the accompanying table provides information about hypothetical account values and hypothetical expenses based on the actual expense ratio and an assumed rate of return of 5% per year before expenses, which is not the actual return. The hypothetical account values and expenses may not be used to estimate the actual ending account balance or expenses you paid for the period. You may use this information to compare the ongoing costs of investing in the Fund and other funds. To do so, compare this 5% hypothetical example with the 5% hypothetical examples that appear in the shareholder reports of the other funds. If any fund is a shareholder of any Underlying Funds, such fund indirectly bears its proportional share of the expenses of the Underlying Funds in addition to the direct expenses as presented in the table. These fees and expenses are not included in the annualized expense ratio used to calculate the expense estimate in the table below.
Please note that the expenses shown in the table are meant to highlight your ongoing costs only and do not reflect any transaction costs. Therefore, the second line of the table is useful in comparing ongoing costs only, and will not help you determine the relative total costs of owning different funds.
| | Annualized Expense Ratio-A | Beginning
Account Value
February 1, 2021 | Ending
Account Value
July 31, 2021 | Expenses Paid
During Period-B
February 1, 2021
to July 31, 2021 |
| Fidelity Series All-Sector Equity Fund | - %-C | | | |
| Actual | | $1,000.00 | $1,190.80 | $--D |
| Hypothetical-E | | $1,000.00 | $1,024.79 | $--D |
| Fidelity Series Stock Selector Large Cap Value Fund | - %-C | | | |
| Actual | | $1,000.00 | $1,208.50 | $--D |
| Hypothetical-E | | $1,000.00 | $1,024.79 | $--D |
| Fidelity Series Value Discovery Fund | - %-C | | | |
| Actual | | $1,000.00 | $1,190.10 | $--D |
| Hypothetical-E | | $1,000.00 | $1,024.79 | $--D |
A Annualized expense ratio reflects expenses net of applicable fee waivers.
B Expenses are equal to the annualized expense ratio, multiplied by the average account value over the period, multiplied by 181/ 365 (to reflect the one-half year period). The fees and expenses of any Underlying Funds are not included in each annualized expense ratio.
C Amount represents less than .005%.
D Amount represents less than $.005.
E 5% return per year before expenses
Board Approval of Investment Advisory Contracts and Management Fees
Fidelity Series All-Sector Equity Fund
Fidelity Series Value Discovery Fund
Fidelity Series Stock Selector Large Cap Value Fund
Each year, the Board of Trustees, including the Independent Trustees (together, the Board), votes on the renewal of the management contract with Fidelity Management & Research Company LLC (FMR) and the sub-advisory agreements (together, the Advisory Contracts) for each fund. FMR and the sub-advisers are referred to herein as the Investment Advisers. The Board, assisted by the advice of fund counsel and Independent Trustees' counsel, requests and considers a broad range of information relevant to the renewal of the Advisory Contracts throughout the year.
The Board meets regularly and, at each of its meetings, covers an extensive agenda of topics and materials and considers factors that are relevant to its annual consideration of the renewal of each fund's Advisory Contracts, including the services and support provided to each fund and its shareholders. The Board has established various standing committees (Committees), each composed of and chaired by Independent Trustees with varying backgrounds, to which the Board has assigned specific subject matter responsibilities in order to enhance effective decision-making by the Board. The Board, acting directly and through its Committees, requests and receives information concerning the annual consideration of the renewal of each fund's Advisory Contracts. The Board also meets as needed to review matters specifically related to the Board's annual consideration of the renewal of the Advisory Contracts. Members of the Board may also meet with trustees of other Fidelity funds through joint ad hoc committees to discuss certain matters relevant to all of the Fidelity funds.
At its May 2021 meeting, the Board unanimously determined to renew each fund's Advisory Contracts. In considering whether to renew the Advisory Contracts for each fund, the Board considered all factors it believed relevant and reached a determination, with the assistance of fund counsel and Independent Trustees' counsel and through the exercise of its business judgment, that the renewal of the Advisory Contracts was in the best interests of each fund and its shareholders and the fact that no fee is payable under the management contracts was fair and reasonable.
Nature, Extent, and Quality of Services Provided. The Board considered Fidelity's staffing as it relates to the funds, including the backgrounds of investment personnel of Fidelity, and also considered the funds' investment objectives, strategies, and related investment philosophies. The Independent Trustees also had discussions with senior management of Fidelity's investment operations and investment groups. The Board considered the structure of the investment personnel compensation program and whether this structure provides appropriate incentives to act in the best interests of each fund.
Resources Dedicated to Investment Management and Support Services. The Board and the Fund Oversight and Research Committees reviewed the general qualifications and capabilities of Fidelity's investment staff, including its size, education, experience, and resources, as well as Fidelity's approach to recruiting, training, managing, and compensating investment personnel. The Board noted that Fidelity has continued to increase the resources devoted to non-U.S. offices, including expansion of Fidelity's global investment organization. The Board also noted that Fidelity's analysts have extensive resources, tools and capabilities that allow them to conduct sophisticated quantitative and fundamental analysis, as well as credit analysis of issuers, counterparties and guarantors. Further, the Board considered that Fidelity's investment professionals have sufficient access to global information and data so as to provide competitive investment results over time, and that those professionals also have access to sophisticated tools that permit them to assess portfolio construction and risk and performance attribution characteristics continuously, as well as to transmit new information and research conclusions rapidly around the world. Additionally, in its deliberations, the Board considered Fidelity's trading, risk management, compliance, and technology and operations capabilities and resources, which are integral parts of the investment management process. The Board also considered Fidelity's investments in business continuity planning, and its success in continuously providing services to the fund notwithstanding the severe disruptions caused by the COVID-19 pandemic.
Administrative Services. The Board considered (i) the nature, extent, quality, and cost of advisory and administrative services performed by the Investment Advisers and their affiliates under the Advisory Contracts and under separate agreements covering transfer agency, pricing and bookkeeping, and securities lending services for each fund; (ii) the nature and extent of the supervision of third party service providers, principally custodians, subcustodians, and pricing vendors; and (iii) the resources devoted to, and the record of compliance with, each fund's compliance policies and procedures. The Board also reviewed the allocation of fund brokerage, including allocations to brokers affiliated with the Investment Advisers, the use of brokerage commissions to pay fund expenses, and the use of "soft" commission dollars to pay for research services.
Investment Performance. The Board considered whether each fund has operated in accordance with its investment objective, as well as its record of compliance with its investment restrictions. The Board reviewed each fund's absolute investment performance, as well as each fund's relative investment performance, but did not consider performance to be a material factor in its decision to renew each fund's Advisory Contracts, as the funds are not publicly offered as a stand-alone investment product. In this regard, the Board noted that each fund is designed to offer an investment option for other investment companies and 529 plans managed by Fidelity and ultimately to enhance the performance of those investment companies and 529 plans. The Board noted that there were portfolio management changes for the Fidelity Series All-Sector Equity Fund in March 2019, November 2019, and. The Board will continue to monitor closely the fund's performance, taking into account the portfolio management change.
Based on its review, the Board concluded that the nature, extent, and quality of services provided to each fund under the Advisory Contracts should continue to benefit the shareholders of each fund.
Competitiveness of Management Fee and Total Expense Ratio. The Board considered that the fund does not pay FMR a management fee for investment advisory services, but that FMR receives fees for providing services to funds that invest in the fund. The Board noted that FMR or an affiliate undertakes to pay all operating expenses of the fund, except transfer agent fees, 12b-1 fees, Independent Trustee fees and expenses, custodian fees and expenses, proxy and shareholder meeting expenses, interest, taxes, and extraordinary expenses (such as litigation expenses). The Board further noted that the fund pays its non-operating expenses, including brokerage commissions and fees and expenses associated with the fund's securities lending program, if applicable.
The Board further considered that FMR has contractually agreed to reimburse each fund to the extent that total operating expenses, with certain exceptions, as a percentage of its average net assets, exceed 0.003% through May 31, 2024.
Based on its review, the Board considered that each fund does not pay a management fee and concluded that the total expense ratio of each fund was reasonable in light of the services that the fund and its shareholders receive and the other factors considered.
Costs of the Services and Profitability. The Board considered the level of Fidelity's profits in respect of all the Fidelity funds.
A public accounting firm has been engaged annually by the Board as part of the Board's assessment of Fidelity's profitability analysis. The engagement includes the review and assessment of the methodologies used by Fidelity in determining the revenues and expenses attributable to Fidelity's mutual fund business, and completion of agreed-upon procedures in respect of the mathematical accuracy of certain fund profitability information and its conformity to established allocation methodologies. After considering the reports issued under the engagement and information provided by Fidelity, the Board concluded that while other allocation methods may also be reasonable, Fidelity's profitability methodologies are reasonable in all material respects.
The Board also reviewed Fidelity's non-fund businesses and potential indirect benefits such businesses may have received as a result of their association with Fidelity's mutual fund business (i.e., fall-out benefits) as well as cases where Fidelity's affiliates may benefit from the funds' business. The Board considered areas where potential indirect benefits to the Fidelity funds from their relationships with Fidelity may exist. The Board also considered that in 2019 a joint ad hoc committee created by it and the boards of other Fidelity funds evaluated potential fall-out benefits (PFOB Committee). The Board noted that it considered the PFOB Committee's findings in connection with its consideration of the renewal of the Advisory Contracts.
The Board concluded that the costs of the services provided by and the profits realized by Fidelity in connection with the operation of each fund were not relevant to the renewal of the Advisory Contracts because each fund pays no advisory fees and FMR bears all expenses of each fund with certain exceptions.
Economies of Scale. The Board concluded that because each fund pays no advisory fees and FMR bears all expenses of each fund with certain exceptions, the realization of economies of scale was not a material factor in the Board's decision to renew each fund's Advisory Contracts.
Additional Information Requested by the Board. In order to develop fully the factual basis for consideration of the Fidelity funds' advisory contracts, the Board requested and received additional information on certain topics, including: (i) fund flow and performance trends, in particular the underperformance of certain funds and strategies, and Fidelity's long-term strategies for certain funds; (ii) consideration of expanding the use of performance fees for additional funds; (iii) Fidelity's pricing philosophy compared to competitors; (iv) metrics for evaluating index fund and ETF performance and information about ETF trading characteristics; (v) the methodology with respect to evaluating competitive fund data and peer group classifications and fee and expense comparisons; (vi) the expense structures for different funds and classes and information about the differences between various expense structures; (vii) group fee breakpoints; (viii) information regarding other accounts managed by Fidelity and sub-advisory arrangements; and (ix) Fidelity's philosophies and strategies for evaluating funds and classes with lower or declining asset levels.
Based on its evaluation of all of the conclusions noted above, and after considering all factors it believed relevant, the Board concluded that the advisory fee arrangements are fair and reasonable, and that each fund's Advisory Contracts should be renewed.
Liquidity Risk Management Program
The Securities and Exchange Commission adopted Rule 22e-4 under the Investment Company Act of 1940 (the Liquidity Rule) to promote effective liquidity risk management throughout the open-end investment company industry, thereby reducing the risk that funds will be unable to meet their redemption obligations and mitigating dilution of the interests of fund shareholders.
The Funds have adopted and implemented a liquidity risk management program pursuant to the Liquidity Rule (the Program) effective December 1, 2018. The Program is reasonably designed to assess and manage each Fund’s liquidity risk and to comply with the requirements of the Liquidity Rule. Each Fund’s Board of Trustees (the Board) has designated each Fund’s investment adviser as administrator of the Program. The Fidelity advisers have established a Liquidity Risk Management Committee (the LRM Committee) to manage the Program for each of the Fidelity Funds. The LRM Committee monitors the adequacy and effectiveness of implementation of the Program and on a periodic basis assesses each Fund’s liquidity risk based on a variety of factors including (1) the Fund’s investment strategy, (2) portfolio liquidity and cash flow projections during normal and reasonably foreseeable stressed conditions, (3) shareholder redemptions, (4) borrowings and other funding sources and (5) in the case of exchange-traded funds, certain additional factors including the effect of the Fund’s prices and spreads, market participants, and basket compositions on the overall liquidity of the Fund’s portfolio, as applicable.
In accordance with the Program, each of the Fund’s portfolio investments is classified into one of four liquidity categories described below based on a determination of a reasonable expectation for how long it would take to convert the investment to cash (or sell or dispose of the investment) without significantly changing its market value.
- Highly liquid investments – cash or convertible to cash within three business days or less
- Moderately liquid investments – convertible to cash in three to seven calendar days
- Less liquid investments – can be sold or disposed of, but not settled, within seven calendar days
- Illiquid investments – cannot be sold or disposed of within seven calendar days
Liquidity classification determinations take into account a variety of factors including various market, trading and investment-specific considerations, as well as market depth, and generally utilize analysis from a third-party liquidity metrics service.
The Liquidity Rule places a 15% limit on a fund’s illiquid investments and requires funds that do not primarily hold assets that are highly liquid investments to determine and maintain a minimum percentage of the fund’s net assets to be invested in highly liquid investments (highly liquid investment minimum or HLIM). The Program includes provisions reasonably designed to comply with the 15% limit on illiquid investments and for determining, periodically reviewing and complying with the HLIM requirement as applicable.
At a recent meeting of the Fund’s Board of Trustees, the LRM Committee provided a written report to the Board pertaining to the operation, adequacy, and effectiveness of implementation of the Program for the annual period from December 1, 2019 through November 30, 2020. The report concluded that the Program has been implemented and is operating effectively and is reasonably designed to assess and manage the Fund’s liquidity risk.
EDT-LDT-SANN-0921
1.956974.108
Fidelity® Stock Selector Large Cap Value Fund
Semi-Annual Report
July 31, 2021
Includes Fidelity and Fidelity Advisor share classes
Contents
To view a fund's proxy voting guidelines and proxy voting record for the 12-month period ended June 30, visit http://www.fidelity.com/proxyvotingresults or visit the Securities and Exchange Commission's (SEC) web site at http://www.sec.gov.
You may also call 1-800-544-8544 if you’re an individual investing directly with Fidelity, call 1-800-835-5092 if you’re a plan sponsor or participant with Fidelity as your recordkeeper or call 1-877-208-0098 on institutional accounts or if you’re an advisor or invest through one to request a free copy of the proxy voting guidelines.
Standard & Poor's, S&P and S&P 500 are registered service marks of The McGraw-Hill Companies, Inc. and have been licensed for use by Fidelity Distributors Corporation.
Other third-party marks appearing herein are the property of their respective owners.
All other marks appearing herein are registered or unregistered trademarks or service marks of FMR LLC or an affiliated company. © 2021 FMR LLC. All rights reserved.
This report and the financial statements contained herein are submitted for the general information of the shareholders of the Fund. This report is not authorized for distribution to prospective investors in the Fund unless preceded or accompanied by an effective prospectus.
A fund files its complete schedule of portfolio holdings with the SEC for the first and third quarters of each fiscal year on Form N-PORT. Forms N-PORT are available on the SEC’s web site at http://www.sec.gov. A fund's Forms N-PORT may be reviewed and copied at the SEC’s Public Reference Room in Washington, DC. Information regarding the operation of the SEC's Public Reference Room may be obtained by calling 1-800-SEC-0330.
For a complete list of a fund's portfolio holdings, view the most recent holdings listing, semiannual report, or annual report on Fidelity's web site at http://www.fidelity.com, http://www.institutional.fidelity.com, or http://www.401k.com, as applicable.
NOT FDIC INSURED •MAY LOSE VALUE •NO BANK GUARANTEE
Neither the Fund nor Fidelity Distributors Corporation is a bank.
Note to Shareholders:
Early in 2020, the outbreak and spread of a new coronavirus emerged as a public health emergency that had a major influence on financial markets, primarily based on its impact on the global economy and the outlook for corporate earnings. The virus causes a respiratory disease known as COVID-19. On March 11, 2020 the World Health Organization declared the COVID-19 outbreak a pandemic, citing sustained risk of further global spread.
In the weeks following, as the crisis worsened, we witnessed an escalating human tragedy with wide-scale social and economic consequences from coronavirus-containment measures. The outbreak of COVID-19 prompted a number of measures to limit the spread, including travel and border restrictions, quarantines, and restrictions on large gatherings. In turn, these resulted in lower consumer activity, diminished demand for a wide range of products and services, disruption in manufacturing and supply chains, and – given the wide variability in outcomes regarding the outbreak – significant market uncertainty and volatility. Amid the turmoil, global governments and central banks took unprecedented action to help support consumers, businesses, and the broader economies, and to limit disruption to financial systems.
The situation continues to unfold, and the extent and duration of its impact on financial markets and the economy remain highly uncertain. Extreme events such as the coronavirus crisis are “exogenous shocks” that can have significant adverse effects on mutual funds and their investments. Although multiple asset classes may be affected by market disruption, the duration and impact may not be the same for all types of assets.
Fidelity is committed to helping you stay informed amid news about COVID-19 and during increased market volatility, and we’re taking extra steps to be responsive to customer needs. We encourage you to visit our websites, where we offer ongoing updates, commentary, and analysis on the markets and our funds.
Investment Summary (Unaudited)
Top Ten Stocks as of July 31, 2021
| | % of fund's net assets |
| Capital One Financial Corp. | 2.9 |
| UnitedHealth Group, Inc. | 2.4 |
| Wells Fargo & Co. | 2.3 |
| Johnson & Johnson | 2.1 |
| Cisco Systems, Inc. | 2.1 |
| Procter & Gamble Co. | 2.1 |
| Bank of America Corp. | 2.1 |
| Thermo Fisher Scientific, Inc. | 2.0 |
| The Walt Disney Co. | 1.9 |
| Verizon Communications, Inc. | 1.6 |
| | 21.5 |
Top Five Market Sectors as of July 31, 2021
| | % of fund's net assets |
| Financials | 20.3 |
| Health Care | 16.6 |
| Industrials | 11.8 |
| Information Technology | 10.1 |
| Communication Services | 8.4 |
Asset Allocation (% of fund's net assets)
| As of July 31, 2021* |
| | Stocks | 98.4% |
| | Short-Term Investments and Net Other Assets (Liabilities) | 1.6% |

* Foreign investments - 8.6%
Schedule of Investments July 31, 2021 (Unaudited)
Showing Percentage of Net Assets
| Common Stocks - 97.4% | | | |
| | | Shares | Value |
| COMMUNICATION SERVICES - 8.4% | | | |
| Diversified Telecommunication Services - 2.8% | | | |
| AT&T, Inc. | | 147,891 | $4,148,343 |
| Liberty Global PLC Class C (a) | | 82,156 | 2,206,710 |
| Verizon Communications, Inc. | | 160,693 | 8,963,456 |
| | | | 15,318,509 |
| Entertainment - 2.0% | | | |
| Cinemark Holdings, Inc. (a)(b) | | 44,400 | 689,532 |
| The Walt Disney Co. (a) | | 57,954 | 10,201,063 |
| | | | 10,890,595 |
| Interactive Media & Services - 1.8% | | | |
| Alphabet, Inc. Class A (a) | | 2,825 | 7,612,047 |
| Facebook, Inc. Class A (a) | | 5,318 | 1,894,803 |
| | | | 9,506,850 |
| Media - 1.8% | | | |
| Cogeco Communications, Inc. | | 12,500 | 1,183,572 |
| Comcast Corp. Class A | | 44,136 | 2,596,521 |
| Interpublic Group of Companies, Inc. | | 73,410 | 2,595,778 |
| Omnicom Group, Inc. | | 43,426 | 3,162,281 |
| | | | 9,538,152 |
|
| TOTAL COMMUNICATION SERVICES | | | 45,254,106 |
|
| CONSUMER DISCRETIONARY - 5.7% | | | |
| Auto Components - 0.9% | | | |
| Aptiv PLC (a) | | 28,110 | 4,690,154 |
| Hotels, Restaurants & Leisure - 1.3% | | | |
| Las Vegas Sands Corp. (a) | | 70,850 | 3,000,498 |
| Marriott International, Inc. Class A (a) | | 28,850 | 4,211,523 |
| | | | 7,212,021 |
| Household Durables - 0.6% | | | |
| Lennar Corp. Class A | | 32,060 | 3,371,109 |
| Multiline Retail - 0.6% | | | |
| Dollar Tree, Inc. (a) | | 29,470 | 2,940,811 |
| Specialty Retail - 2.3% | | | |
| Best Buy Co., Inc. | | 38,490 | 4,324,352 |
| Burlington Stores, Inc. (a) | | 12,011 | 4,021,283 |
| Ulta Beauty, Inc. (a) | | 11,050 | 3,710,590 |
| | | | 12,056,225 |
|
| TOTAL CONSUMER DISCRETIONARY | | | 30,270,320 |
|
| CONSUMER STAPLES - 7.1% | | | |
| Beverages - 1.5% | | | |
| Diageo PLC | | 13,471 | 667,977 |
| Keurig Dr. Pepper, Inc. | | 50,775 | 1,787,788 |
| Monster Beverage Corp. (a) | | 11,831 | 1,115,900 |
| PepsiCo, Inc. | | 4,982 | 781,925 |
| The Coca-Cola Co. | | 66,166 | 3,773,447 |
| | | | 8,127,037 |
| Food & Staples Retailing - 1.0% | | | |
| U.S. Foods Holding Corp. (a) | | 5,200 | 178,568 |
| Walmart, Inc. | | 34,587 | 4,930,377 |
| | | | 5,108,945 |
| Food Products - 1.1% | | | |
| Darling Ingredients, Inc. (a) | | 14,358 | 991,707 |
| McCormick & Co., Inc. (non-vtg.) | | 2,800 | 235,676 |
| Mondelez International, Inc. | | 64,049 | 4,051,740 |
| Post Holdings, Inc. (a) | | 1,500 | 153,510 |
| TreeHouse Foods, Inc. (a) | | 12,145 | 539,238 |
| | | | 5,971,871 |
| Household Products - 2.4% | | | |
| Kimberly-Clark Corp. | | 12,844 | 1,743,188 |
| Procter & Gamble Co. | | 79,428 | 11,297,044 |
| | | | 13,040,232 |
| Tobacco - 1.1% | | | |
| Altria Group, Inc. | | 90,436 | 4,344,545 |
| Philip Morris International, Inc. | | 15,100 | 1,511,359 |
| | | | 5,855,904 |
|
| TOTAL CONSUMER STAPLES | | | 38,103,989 |
|
| ENERGY - 4.5% | | | |
| Oil, Gas & Consumable Fuels - 4.5% | | | |
| Canadian Natural Resources Ltd. | | 67,100 | 2,214,257 |
| Cenovus Energy, Inc. (Canada) | | 418,300 | 3,490,304 |
| Cheniere Energy, Inc. (a) | | 46,600 | 3,957,738 |
| Exxon Mobil Corp. | | 151,600 | 8,727,612 |
| Hess Corp. | | 46,600 | 3,562,104 |
| Royal Dutch Shell PLC Class A (United Kingdom) | | 117,038 | 2,352,574 |
| | | | 24,304,589 |
| FINANCIALS - 20.3% | | | |
| Banks - 7.8% | | | |
| Bank of America Corp. | | 289,072 | 11,088,802 |
| Citigroup, Inc. | | 33,573 | 2,270,206 |
| Citizens Financial Group, Inc. | | 36,335 | 1,531,884 |
| Comerica, Inc. | | 17,520 | 1,202,923 |
| First Horizon National Corp. | | 89,020 | 1,375,359 |
| JPMorgan Chase & Co. | | 48,239 | 7,321,715 |
| PNC Financial Services Group, Inc. | | 19,237 | 3,509,021 |
| Societe Generale Series A | | 54,709 | 1,602,193 |
| Wells Fargo & Co. | | 265,148 | 12,180,899 |
| | | | 42,083,002 |
| Capital Markets - 4.4% | | | |
| Bank of New York Mellon Corp. | | 165,723 | 8,506,562 |
| BlackRock, Inc. Class A | | 7,323 | 6,350,286 |
| Cboe Global Markets, Inc. | | 9,027 | 1,069,429 |
| Morgan Stanley | | 68,466 | 6,571,367 |
| Virtu Financial, Inc. Class A | | 39,300 | 1,011,582 |
| | | | 23,509,226 |
| Consumer Finance - 4.1% | | | |
| American Express Co. | | 38,866 | 6,627,819 |
| Capital One Financial Corp. | | 95,987 | 15,521,093 |
| | | | 22,148,912 |
| Diversified Financial Services - 1.8% | | | |
| Berkshire Hathaway, Inc. Class B (a) | | 23,828 | 6,631,094 |
| Voya Financial, Inc. | | 44,724 | 2,880,226 |
| | | | 9,511,320 |
| Insurance - 2.2% | | | |
| American International Group, Inc. | | 61,882 | 2,930,113 |
| Hartford Financial Services Group, Inc. | | 58,885 | 3,746,264 |
| The Travelers Companies, Inc. | | 35,155 | 5,235,283 |
| | | | 11,911,660 |
|
| TOTAL FINANCIALS | | | 109,164,120 |
|
| HEALTH CARE - 16.6% | | | |
| Biotechnology - 0.2% | | | |
| Biogen, Inc. (a) | | 3,100 | 1,012,863 |
| Health Care Equipment & Supplies - 3.3% | | | |
| Abbott Laboratories | | 32,200 | 3,895,556 |
| Boston Scientific Corp. (a) | | 83,100 | 3,789,360 |
| Danaher Corp. | | 20,400 | 6,068,796 |
| Teleflex, Inc. | | 10,200 | 4,053,786 |
| | | | 17,807,498 |
| Health Care Providers & Services - 5.4% | | | |
| Cardinal Health, Inc. | | 55,400 | 3,289,652 |
| Centene Corp. (a) | | 40,400 | 2,771,844 |
| CVS Health Corp. | | 27,134 | 2,234,756 |
| Humana, Inc. | | 10,300 | 4,386,358 |
| McKesson Corp. | | 17,600 | 3,587,408 |
| UnitedHealth Group, Inc. | | 30,700 | 12,655,154 |
| | | | 28,925,172 |
| Life Sciences Tools & Services - 3.8% | | | |
| Bio-Rad Laboratories, Inc. Class A (a) | | 7,100 | 5,250,521 |
| IQVIA Holdings, Inc. (a) | | 17,000 | 4,210,900 |
| Thermo Fisher Scientific, Inc. | | 20,200 | 10,908,202 |
| | | | 20,369,623 |
| Pharmaceuticals - 3.9% | | | |
| Bristol-Myers Squibb Co. | | 75,900 | 5,151,333 |
| Johnson & Johnson | | 66,785 | 11,500,377 |
| Merck & Co., Inc. | | 59,500 | 4,573,765 |
| | | | 21,225,475 |
|
| TOTAL HEALTH CARE | | | 89,340,631 |
|
| INDUSTRIALS - 11.8% | | | |
| Aerospace & Defense - 4.5% | | | |
| General Dynamics Corp. | | 20,768 | 4,071,151 |
| Lockheed Martin Corp. | | 3,200 | 1,189,344 |
| Northrop Grumman Corp. | | 12,890 | 4,679,328 |
| Raytheon Technologies Corp. | | 78,105 | 6,791,230 |
| The Boeing Co. (a) | | 32,614 | 7,386,419 |
| | | | 24,117,472 |
| Air Freight & Logistics - 0.7% | | | |
| FedEx Corp. | | 13,722 | 3,841,474 |
| Construction & Engineering - 0.7% | | | |
| AECOM (a) | | 61,888 | 3,896,468 |
| Electrical Equipment - 1.0% | | | |
| Sensata Technologies, Inc. PLC (a) | | 95,480 | 5,597,038 |
| Industrial Conglomerates - 1.4% | | | |
| General Electric Co. | | 523,219 | 6,775,686 |
| Honeywell International, Inc. | | 3,049 | 712,826 |
| | | | 7,488,512 |
| Machinery - 0.8% | | | |
| Caterpillar, Inc. | | 19,846 | 4,103,161 |
| Marine - 0.4% | | | |
| Kirby Corp. (a) | | 35,983 | 2,083,776 |
| Professional Services - 1.5% | | | |
| Nielsen Holdings PLC | | 341,036 | 8,079,143 |
| Road & Rail - 0.4% | | | |
| Norfolk Southern Corp. | | 8,645 | 2,228,940 |
| Trading Companies & Distributors - 0.4% | | | |
| Univar, Inc. (a) | | 82,062 | 2,013,801 |
|
| TOTAL INDUSTRIALS | | | 63,449,785 |
|
| INFORMATION TECHNOLOGY - 10.1% | | | |
| Communications Equipment - 3.1% | | | |
| Cisco Systems, Inc. | | 206,138 | 11,413,861 |
| F5 Networks, Inc. (a) | | 25,292 | 5,223,051 |
| | | | 16,636,912 |
| Electronic Equipment & Components - 0.5% | | | |
| Vontier Corp. | | 76,691 | 2,480,954 |
| IT Services - 4.2% | | | |
| Amdocs Ltd. | | 101,760 | 7,846,714 |
| Fiserv, Inc. (a) | | 51,355 | 5,911,474 |
| GoDaddy, Inc. (a) | | 43,697 | 3,663,993 |
| IBM Corp. | | 36,912 | 5,203,116 |
| | | | 22,625,297 |
| Semiconductors & Semiconductor Equipment - 0.7% | | | |
| Intel Corp. | | 72,242 | 3,880,840 |
| Software - 1.3% | | | |
| Check Point Software Technologies Ltd. (a) | | 28,576 | 3,632,010 |
| NortonLifeLock, Inc. | | 35,976 | 892,924 |
| SS&C Technologies Holdings, Inc. | | 35,366 | 2,772,341 |
| | | | 7,297,275 |
| Technology Hardware, Storage & Peripherals - 0.3% | | | |
| NCR Corp. (a) | | 31,841 | 1,413,740 |
|
| TOTAL INFORMATION TECHNOLOGY | | | 54,335,018 |
|
| MATERIALS - 3.3% | | | |
| Chemicals - 1.4% | | | |
| Huntsman Corp. | | 74,851 | 1,976,815 |
| Olin Corp. | | 83,508 | 3,927,381 |
| The Chemours Co. LLC | | 50,857 | 1,690,995 |
| | | | 7,595,191 |
| Construction Materials - 0.4% | | | |
| Eagle Materials, Inc. | | 13,255 | 1,873,197 |
| Containers & Packaging - 0.4% | | | |
| O-I Glass, Inc. (a) | | 156,100 | 2,308,719 |
| Metals & Mining - 1.1% | | | |
| Freeport-McMoRan, Inc. | | 74,684 | 2,845,460 |
| Newmont Corp. | | 51,404 | 3,229,199 |
| | | | 6,074,659 |
|
| TOTAL MATERIALS | | | 17,851,766 |
|
| REAL ESTATE - 4.8% | | | |
| Equity Real Estate Investment Trusts (REITs) - 4.2% | | | |
| Digital Realty Trust, Inc. | | 13,800 | 2,127,408 |
| Douglas Emmett, Inc. | | 57,800 | 1,930,520 |
| Equity Lifestyle Properties, Inc. | | 25,100 | 2,103,380 |
| Invitation Homes, Inc. | | 90,100 | 3,665,268 |
| Mid-America Apartment Communities, Inc. | | 26,800 | 5,175,080 |
| Prologis (REIT), Inc. | | 36,800 | 4,711,872 |
| Welltower, Inc. | | 32,100 | 2,788,206 |
| | | | 22,501,734 |
| Real Estate Management & Development - 0.6% | | | |
| Cushman & Wakefield PLC (a) | | 172,200 | 3,214,974 |
|
| TOTAL REAL ESTATE | | | 25,716,708 |
|
| UTILITIES - 4.8% | | | |
| Electric Utilities - 2.8% | | | |
| Edison International | | 57,298 | 3,122,741 |
| Exelon Corp. | | 77,086 | 3,607,625 |
| FirstEnergy Corp. | | 63,513 | 2,433,818 |
| PG&E Corp. (a) | | 280,471 | 2,465,340 |
| Southern Co. | | 53,390 | 3,410,019 |
| | | | 15,039,543 |
| Independent Power and Renewable Electricity Producers - 0.8% | | | |
| The AES Corp. | | 111,135 | 2,633,900 |
| Vistra Corp. | | 100,673 | 1,927,888 |
| | | | 4,561,788 |
| Multi-Utilities - 1.2% | | | |
| CenterPoint Energy, Inc. | | 107,024 | 2,724,831 |
| Sempra Energy | | 27,070 | 3,536,696 |
| | | | 6,261,527 |
|
| TOTAL UTILITIES | | | 25,862,858 |
|
| TOTAL COMMON STOCKS | | | |
| (Cost $409,765,238) | | | 523,653,890 |
|
| Money Market Funds - 2.0% | | | |
| Fidelity Cash Central Fund 0.06% (c) | | 10,414,690 | 10,416,773 |
| Fidelity Securities Lending Cash Central Fund 0.06% (c)(d) | | 484,202 | 484,250 |
| TOTAL MONEY MARKET FUNDS | | | |
| (Cost $10,900,946) | | | 10,901,023 |
|
| Equity Funds - 1.0% | | | |
| Domestic Equity Funds - 1.0% | | | |
| iShares Russell 1000 Value Index ETF | | | |
| (Cost $5,253,411) | | 32,700 | 5,231,019 |
| TOTAL INVESTMENT IN SECURITIES - 100.4% | | | |
| (Cost $425,919,595) | | | 539,785,932 |
| NET OTHER ASSETS (LIABILITIES) - (0.4)% | | | (2,105,348) |
| NET ASSETS - 100% | | | $537,680,584 |
Security Type Abbreviations
ETF – Exchange-Traded Fund
Legend
(a) Non-income producing
(b) Security or a portion of the security is on loan at period end.
(c) Affiliated fund that is generally available only to investment companies and other accounts managed by Fidelity Investments. The rate quoted is the annualized seven-day yield of the fund at period end. A complete unaudited listing of the fund's holdings as of its most recent quarter end is available upon request. In addition, each Fidelity Central Fund's financial statements are available on the SEC's website or upon request.
(d) Investment made with cash collateral received from securities on loan.
Affiliated Central Funds
Information regarding fiscal year to date income earned by the Fund from investments in Fidelity Central Funds is as follows:
| Fund | Income earned |
| Fidelity Cash Central Fund | $2,902 |
| Fidelity Securities Lending Cash Central Fund | 125 |
| Total | $3,027 |
Amounts in the income column in the above table include any capital gain distributions from underlying funds, which are presented in the corresponding line-item in the Statement of Operations, if applicable. Amount for Fidelity Securities Lending Cash Central Fund represents the income earned on investing cash collateral, less rebates paid to borrowers and any lending agent fees associated with the loan, plus any premium payments received for lending certain types of securities.
Fiscal year to date information regarding the Fund's investments in Fidelity Central Funds, including the ownership percentage, is presented below.
| Fund | Value, beginning of period | Purchases | Sales Proceeds | Realized Gain/Loss | Change in Unrealized appreciation (depreciation) | Value, end of period | % ownership, end of period |
| Fidelity Cash Central Fund 0.06% | $11,657,805 | $113,116,379 | $114,357,428 | $17 | $-- | $10,416,773 | 0.0% |
| Fidelity Securities Lending Cash Central Fund 0.06% | 548,625 | 13,988,244 | 14,052,619 | -- | -- | 484,250 | 0.0% |
| Total | $12,206,430 | $127,104,623 | $128,410,047 | $17 | $-- | $10,901,023 | |
Investment Valuation
The following is a summary of the inputs used, as of July 31, 2021, involving the Fund's assets and liabilities carried at fair value. The inputs or methodology used for valuing securities may not be an indication of the risk associated with investing in those securities. For more information on valuation inputs, and their aggregation into the levels used below, please refer to the Investment Valuation section in the accompanying Notes to Financial Statements.
| | Valuation Inputs at Reporting Date: |
| Description | Total | Level 1 | Level 2 | Level 3 |
| Investments in Securities: | | | | |
| Equities: | | | | |
| Communication Services | $45,254,106 | $45,254,106 | $-- | $-- |
| Consumer Discretionary | 30,270,320 | 30,270,320 | -- | -- |
| Consumer Staples | 38,103,989 | 37,436,012 | 667,977 | -- |
| Energy | 24,304,589 | 21,952,015 | 2,352,574 | -- |
| Financials | 109,164,120 | 107,561,927 | 1,602,193 | -- |
| Health Care | 89,340,631 | 89,340,631 | -- | -- |
| Industrials | 63,449,785 | 63,449,785 | -- | -- |
| Information Technology | 54,335,018 | 54,335,018 | -- | -- |
| Materials | 17,851,766 | 17,851,766 | -- | -- |
| Real Estate | 25,716,708 | 25,716,708 | -- | -- |
| Utilities | 25,862,858 | 25,862,858 | -- | -- |
| Money Market Funds | 10,901,023 | 10,901,023 | -- | -- |
| Equity Funds | 5,231,019 | 5,231,019 | -- | -- |
| Total Investments in Securities: | $539,785,932 | $535,163,188 | $4,622,744 | $-- |
See accompanying notes which are an integral part of the financial statements.
Financial Statements
Statement of Assets and Liabilities
| | | July 31, 2021 (Unaudited) |
| Assets | | |
Investment in securities, at value (including securities loaned of $462,794) — See accompanying schedule:
Unaffiliated issuers (cost $415,018,649) | $528,884,909 | |
| Fidelity Central Funds (cost $10,900,946) | 10,901,023 | |
| Total Investment in Securities (cost $425,919,595) | | $539,785,932 |
| Receivable for investments sold | | 6,830,073 |
| Receivable for fund shares sold | | 167,364 |
| Dividends receivable | | 662,129 |
| Distributions receivable from Fidelity Central Funds | | 545 |
| Prepaid expenses | | 381 |
| Other receivables | | 15,358 |
| Total assets | | 547,461,782 |
| Liabilities | | |
| Payable to custodian bank | $1,503,540 | |
| Payable for investments purchased | 7,292,186 | |
| Payable for fund shares redeemed | 122,909 | |
| Accrued management fee | 239,353 | |
| Distribution and service plan fees payable | 16,984 | |
| Other affiliated payables | 86,739 | |
| Other payables and accrued expenses | 35,237 | |
| Collateral on securities loaned | 484,250 | |
| Total liabilities | | 9,781,198 |
| Net Assets | | $537,680,584 |
| Net Assets consist of: | | |
| Paid in capital | | $417,160,122 |
| Total accumulated earnings (loss) | | 120,520,462 |
| Net Assets | | $537,680,584 |
| Net Asset Value and Maximum Offering Price | | |
| Class A: | | |
| Net Asset Value and redemption price per share ($31,463,464 ÷ 1,216,803 shares)(a) | | $25.86 |
| Maximum offering price per share (100/94.25 of $25.86) | | $27.44 |
| Class M: | | |
| Net Asset Value and redemption price per share ($11,332,932 ÷ 439,834 shares)(a) | | $25.77 |
| Maximum offering price per share (100/96.50 of $25.77) | | $26.70 |
| Class C: | | |
| Net Asset Value and offering price per share ($7,016,664 ÷ 279,502 shares)(a) | | $25.10 |
| Stock Selector Large Cap Value: | | |
| Net Asset Value, offering price and redemption price per share ($456,330,239 ÷ 17,453,249 shares) | | $26.15 |
| Class I: | | |
| Net Asset Value, offering price and redemption price per share ($15,171,968 ÷ 577,929 shares) | | $26.25 |
| Class Z: | | |
| Net Asset Value, offering price and redemption price per share ($16,365,317 ÷ 629,887 shares) | | $25.98 |
(a) Redemption price per share is equal to net asset value less any applicable contingent deferred sales charge.
See accompanying notes which are an integral part of the financial statements.
Statement of Operations
| | | Six months ended July 31, 2021 (Unaudited) |
| Investment Income | | |
| Dividends | | $4,680,333 |
| Income from Fidelity Central Funds (including $125 from security lending) | | 3,027 |
| Total income | | 4,683,360 |
| Expenses | | |
| Management fee | | |
| Basic fee | $1,354,323 | |
| Performance adjustment | 4,986 | |
| Transfer agent fees | 398,412 | |
| Distribution and service plan fees | 98,607 | |
| Accounting fees | 98,917 | |
| Custodian fees and expenses | 13,777 | |
| Independent trustees' fees and expenses | 953 | |
| Registration fees | 52,446 | |
| Audit | 25,553 | |
| Legal | 1,440 | |
| Miscellaneous | 989 | |
| Total expenses before reductions | 2,050,403 | |
| Expense reductions | (27,871) | |
| Total expenses after reductions | | 2,022,532 |
| Net investment income (loss) | | 2,660,828 |
| Realized and Unrealized Gain (Loss) | | |
| Net realized gain (loss) on: | | |
| Investment securities: | | |
| Unaffiliated issuers | 37,017,275 | |
| Fidelity Central Funds | 17 | |
| Foreign currency transactions | (1,976) | |
| Total net realized gain (loss) | | 37,015,316 |
| Change in net unrealized appreciation (depreciation) on: | | |
| Investment securities: | | |
| Unaffiliated issuers | 49,864,159 | |
| Assets and liabilities in foreign currencies | (422) | |
| Total change in net unrealized appreciation (depreciation) | | 49,863,737 |
| Net gain (loss) | | 86,879,053 |
| Net increase (decrease) in net assets resulting from operations | | $89,539,881 |
See accompanying notes which are an integral part of the financial statements.
Statement of Changes in Net Assets
| | Six months ended July 31, 2021 (Unaudited) | Year ended January 31, 2021 |
| Increase (Decrease) in Net Assets | | |
| Operations | | |
| Net investment income (loss) | $2,660,828 | $8,020,829 |
| Net realized gain (loss) | 37,015,316 | (27,852,844) |
| Change in net unrealized appreciation (depreciation) | 49,863,737 | 35,340,040 |
| Net increase (decrease) in net assets resulting from operations | 89,539,881 | 15,508,025 |
| Distributions to shareholders | – | (10,445,347) |
| Share transactions - net increase (decrease) | 5,727,936 | (61,933,907) |
| Total increase (decrease) in net assets | 95,267,817 | (56,871,229) |
| Net Assets | | |
| Beginning of period | 442,412,767 | 499,283,996 |
| End of period | $537,680,584 | $442,412,767 |
See accompanying notes which are an integral part of the financial statements.
Financial Highlights
Fidelity Stock Selector Large Cap Value Fund Class A
| | Six months ended (Unaudited) July 31, | Years endedJanuary 31, | | | | |
| | 2021 | 2021 | 2020 | 2019 | 2018 | 2017 |
| Selected Per–Share Data | | | | | | |
| Net asset value, beginning of period | $21.53 | $20.92 | $18.80 | $21.26 | $18.63 | $15.37 |
| Income from Investment Operations | | | | | | |
| Net investment income (loss)A | .10 | .32B | .29 | .26 | .25C | .19 |
| Net realized and unrealized gain (loss) | 4.23 | .71 | 2.14 | (1.45) | 2.54 | 3.27 |
| Total from investment operations | 4.33 | 1.03 | 2.43 | (1.19) | 2.79 | 3.46 |
| Distributions from net investment income | – | (.42) | (.31) | (.24) | (.16) | (.20) |
| Distributions from net realized gain | – | – | – | (1.03) | – | – |
| Total distributions | – | (.42) | (.31) | (1.27) | (.16) | (.20) |
| Net asset value, end of period | $25.86 | $21.53 | $20.92 | $18.80 | $21.26 | $18.63 |
| Total ReturnD,E,F | 20.11% | 5.03% | 12.92% | (5.46)% | 15.02% | 22.48% |
| Ratios to Average Net AssetsG,H | | | | | | |
| Expenses before reductions | 1.05%I | .94% | .93% | .96% | 1.02% | 1.05% |
| Expenses net of fee waivers, if any | 1.05%I | .94% | .93% | .96% | 1.02% | 1.05% |
| Expenses net of all reductions | 1.04%I | .93% | .93% | .95% | 1.01% | 1.05% |
| Net investment income (loss) | .77%I | 1.67%B | 1.45% | 1.28% | 1.27%C | 1.10% |
| Supplemental Data | | | | | | |
| Net assets, end of period (000 omitted) | $31,463 | $22,580 | $25,576 | $25,204 | $27,297 | $31,054 |
| Portfolio turnover rateJ | 89%I | 104% | 68%K | 92% | 90% | 51% |
A Calculated based on average shares outstanding during the period.
B Net investment income per share reflects one or more large, non-recurring dividend(s) which amounted to $.07 per share. Excluding such non-recurring dividend(s), the ratio of net investment income (loss) to average net assets would have been 1.32%.
C Net investment income per share reflects one or more large, non-recurring dividend(s) which amounted to $.07 per share. Excluding such non-recurring dividend(s), the ratio of net investment income (loss) to average net assets would have been .90%.
D Total returns for periods of less than one year are not annualized.
E Total returns would have been lower if certain expenses had not been reduced during the applicable periods shown.
F Total returns do not include the effect of the sales charges.
G Fees and expenses of any underlying mutual funds or exchange-traded funds (ETFs) are not included in the Fund's expense ratio. The Fund indirectly bears its proportionate share of these expenses. For additional expense information related to investments in Fidelity Central Funds, please refer to the "Investments in Fidelity Central Funds" note found in the Notes to Financial Statements section of the most recent Annual or Semi-Annual report.
H Expense ratios reflect operating expenses of the class. Expenses before reductions do not reflect amounts reimbursed, waived, or reduced through arrangements with the investment adviser, brokerage services, or other offset arrangements, if applicable, and do not represent the amount paid by the class during periods when reimbursements, waivers or reductions occur.
I Annualized
J Amount does not include the portfolio activity of any underlying mutual funds or exchange-traded funds (ETFs).
K Portfolio turnover rate excludes securities received or delivered in-kind.
See accompanying notes which are an integral part of the financial statements.
Fidelity Stock Selector Large Cap Value Fund Class M
| | Six months ended (Unaudited) July 31, | Years endedJanuary 31, | | | | |
| | 2021 | 2021 | 2020 | 2019 | 2018 | 2017 |
| Selected Per–Share Data | | | | | | |
| Net asset value, beginning of period | $21.48 | $20.88 | $18.77 | $21.24 | $18.61 | $15.36 |
| Income from Investment Operations | | | | | | |
| Net investment income (loss)A | .06 | .26B | .23 | .19 | .19C | .13 |
| Net realized and unrealized gain (loss) | 4.23 | .70 | 2.13 | (1.44) | 2.54 | 3.26 |
| Total from investment operations | 4.29 | .96 | 2.36 | (1.25) | 2.73 | 3.39 |
| Distributions from net investment income | – | (.36) | (.25) | (.18) | (.10) | (.14) |
| Distributions from net realized gain | – | – | – | (1.03) | – | – |
| Total distributions | – | (.36) | (.25) | (1.22)D | (.10) | (.14) |
| Net asset value, end of period | $25.77 | $21.48 | $20.88 | $18.77 | $21.24 | $18.61 |
| Total ReturnE,F,G | 19.97% | 4.70% | 12.59% | (5.78)% | 14.70% | 22.04% |
| Ratios to Average Net AssetsH,I | | | | | | |
| Expenses before reductions | 1.32%J | 1.23% | 1.24% | 1.28% | 1.34% | 1.39% |
| Expenses net of fee waivers, if any | 1.32%J | 1.23% | 1.23% | 1.28% | 1.34% | 1.39% |
| Expenses net of all reductions | 1.31%J | 1.22% | 1.23% | 1.27% | 1.33% | 1.39% |
| Net investment income (loss) | .50%J | 1.38%B | 1.15% | .96% | .95%C | .76% |
| Supplemental Data | | | | | | |
| Net assets, end of period (000 omitted) | $11,333 | $9,526 | $10,385 | $9,542 | $10,615 | $10,704 |
| Portfolio turnover rateK | 89%J | 104% | 68%L | 92% | 90% | 51% |
A Calculated based on average shares outstanding during the period.
B Net investment income per share reflects one or more large, non-recurring dividend(s) which amounted to $.07 per share. Excluding such non-recurring dividend(s), the ratio of net investment income (loss) to average net assets would have been 1.03%.
C Net investment income per share reflects one or more large, non-recurring dividend(s) which amounted to $.07 per share. Excluding such non-recurring dividend(s), the ratio of net investment income (loss) to average net assets would have been .58%.
D Total distributions per share do not sum due to rounding.
E Total returns for periods of less than one year are not annualized.
F Total returns would have been lower if certain expenses had not been reduced during the applicable periods shown.
G Total returns do not include the effect of the sales charges.
H Fees and expenses of any underlying mutual funds or exchange-traded funds (ETFs) are not included in the Fund's expense ratio. The Fund indirectly bears its proportionate share of these expenses. For additional expense information related to investments in Fidelity Central Funds, please refer to the "Investments in Fidelity Central Funds" note found in the Notes to Financial Statements section of the most recent Annual or Semi-Annual report.
I Expense ratios reflect operating expenses of the class. Expenses before reductions do not reflect amounts reimbursed, waived, or reduced through arrangements with the investment adviser, brokerage services, or other offset arrangements, if applicable, and do not represent the amount paid by the class during periods when reimbursements, waivers or reductions occur.
J Annualized
K Amount does not include the portfolio activity of any underlying mutual funds or exchange-traded funds (ETFs).
L Portfolio turnover rate excludes securities received or delivered in-kind.
See accompanying notes which are an integral part of the financial statements.
Fidelity Stock Selector Large Cap Value Fund Class C
| | Six months ended (Unaudited) July 31, | Years endedJanuary 31, | | | | |
| | 2021 | 2021 | 2020 | 2019 | 2018 | 2017 |
| Selected Per–Share Data | | | | | | |
| Net asset value, beginning of period | $20.99 | $20.40 | $18.37 | $20.81 | $18.25 | $15.09 |
| Income from Investment Operations | | | | | | |
| Net investment income (loss)A | (.01) | .16B | .12 | .09 | .08C | .05 |
| Net realized and unrealized gain (loss) | 4.12 | .68 | 2.08 | (1.42) | 2.49 | 3.18 |
| Total from investment operations | 4.11 | .84 | 2.20 | (1.33) | 2.57 | 3.23 |
| Distributions from net investment income | – | (.25) | (.17) | (.08) | (.01) | (.07) |
| Distributions from net realized gain | – | – | – | (1.03) | – | – |
| Total distributions | – | (.25) | (.17) | (1.11) | (.01) | (.07) |
| Net asset value, end of period | $25.10 | $20.99 | $20.40 | $18.37 | $20.81 | $18.25 |
| Total ReturnD,E,F | 19.58% | 4.19% | 11.96% | (6.26)% | 14.07% | 21.43% |
| Ratios to Average Net AssetsG,H | | | | | | |
| Expenses before reductions | 1.88%I | 1.76% | 1.78% | 1.80% | 1.86% | 1.88% |
| Expenses net of fee waivers, if any | 1.88%I | 1.76% | 1.77% | 1.80% | 1.85% | 1.88% |
| Expenses net of all reductions | 1.87%I | 1.75% | 1.77% | 1.79% | 1.85% | 1.87% |
| Net investment income (loss) | (.05)%I | .86%B | .61% | .44% | .43%C | .27% |
| Supplemental Data | | | | | | |
| Net assets, end of period (000 omitted) | $7,017 | $6,723 | $8,813 | $9,813 | $10,703 | $10,802 |
| Portfolio turnover rateJ | 89%I | 104% | 68%K | 92% | 90% | 51% |
A Calculated based on average shares outstanding during the period.
B Net investment income per share reflects one or more large, non-recurring dividend(s) which amounted to $.06 per share. Excluding such non-recurring dividend(s), the ratio of net investment income (loss) to average net assets would have been .51%.
C Net investment income per share reflects one or more large, non-recurring dividend(s) which amounted to $.07 per share. Excluding such non-recurring dividend(s), the ratio of net investment income (loss) to average net assets would have been .06%.
D Total returns for periods of less than one year are not annualized.
E Total returns would have been lower if certain expenses had not been reduced during the applicable periods shown.
F Total returns do not include the effect of the contingent deferred sales charge.
G Fees and expenses of any underlying mutual funds or exchange-traded funds (ETFs) are not included in the Fund's expense ratio. The Fund indirectly bears its proportionate share of these expenses. For additional expense information related to investments in Fidelity Central Funds, please refer to the "Investments in Fidelity Central Funds" note found in the Notes to Financial Statements section of the most recent Annual or Semi-Annual report.
H Expense ratios reflect operating expenses of the class. Expenses before reductions do not reflect amounts reimbursed, waived, or reduced through arrangements with the investment adviser, brokerage services, or other offset arrangements, if applicable, and do not represent the amount paid by the class during periods when reimbursements, waivers or reductions occur.
I Annualized
J Amount does not include the portfolio activity of any underlying mutual funds or exchange-traded funds (ETFs).
K Portfolio turnover rate excludes securities received or delivered in-kind.
See accompanying notes which are an integral part of the financial statements.
Fidelity Stock Selector Large Cap Value Fund
| | Six months ended (Unaudited) July 31, | Years endedJanuary 31, | | | | |
| | 2021 | 2021 | 2020 | 2019 | 2018 | 2017 |
| Selected Per–Share Data | | | | | | |
| Net asset value, beginning of period | $21.73 | $21.11 | $18.94 | $21.41 | $18.76 | $15.47 |
| Income from Investment Operations | | | | | | |
| Net investment income (loss)A | .13 | .38B | .35 | .32 | .31C | .24 |
| Net realized and unrealized gain (loss) | 4.29 | .72 | 2.16 | (1.46) | 2.57 | 3.29 |
| Total from investment operations | 4.42 | 1.10 | 2.51 | (1.14) | 2.88 | 3.53 |
| Distributions from net investment income | – | (.48) | (.34) | (.29) | (.23) | (.24) |
| Distributions from net realized gain | – | – | – | (1.03) | – | – |
| Total distributions | – | (.48) | (.34) | (1.33)D | (.23) | (.24) |
| Net asset value, end of period | $26.15 | $21.73 | $21.11 | $18.94 | $21.41 | $18.76 |
| Total ReturnE,F | 20.34% | 5.31% | 13.24% | (5.20)% | 15.39% | 22.82% |
| Ratios to Average Net AssetsG,H | | | | | | |
| Expenses before reductions | .75%I | .64% | .64% | .67% | .73% | .77% |
| Expenses net of fee waivers, if any | .75%I | .64% | .64% | .67% | .73% | .77% |
| Expenses net of all reductions | .74%I | .63% | .64% | .66% | .72% | .76% |
| Net investment income (loss) | 1.07%I | 1.97%B | 1.74% | 1.57% | 1.56%C | 1.38% |
| Supplemental Data | | | | | | |
| Net assets, end of period (000 omitted) | $456,330 | $373,322 | $432,154 | $806,342 | $989,001 | $703,722 |
| Portfolio turnover rateJ | 89%I | 104% | 68%K | 92% | 90% | 51% |
A Calculated based on average shares outstanding during the period.
B Net investment income per share reflects one or more large, non-recurring dividend(s) which amounted to $.07 per share. Excluding such non-recurring dividend(s), the ratio of net investment income (loss) to average net assets would have been 1.62%.
C Net investment income per share reflects one or more large, non-recurring dividend(s) which amounted to $.07 per share. Excluding such non-recurring dividend(s), the ratio of net investment income (loss) to average net assets would have been 1.19%.
D Total distributions per share do not sum due to rounding.
E Total returns for periods of less than one year are not annualized.
F Total returns would have been lower if certain expenses had not been reduced during the applicable periods shown.
G Fees and expenses of any underlying mutual funds or exchange-traded funds (ETFs) are not included in the Fund's expense ratio. The Fund indirectly bears its proportionate share of these expenses. For additional expense information related to investments in Fidelity Central Funds, please refer to the "Investments in Fidelity Central Funds" note found in the Notes to Financial Statements section of the most recent Annual or Semi-Annual report.
H Expense ratios reflect operating expenses of the class. Expenses before reductions do not reflect amounts reimbursed, waived, or reduced through arrangements with the investment adviser, brokerage services, or other offset arrangements, if applicable, and do not represent the amount paid by the class during periods when reimbursements, waivers or reductions occur.
I Annualized
J Amount does not include the portfolio activity of any underlying mutual funds or exchange-traded funds (ETFs).
K Portfolio turnover rate excludes securities received or delivered in-kind.
See accompanying notes which are an integral part of the financial statements.
Fidelity Stock Selector Large Cap Value Fund Class I
| | Six months ended (Unaudited) July 31, | Years endedJanuary 31, | | | | |
| | 2021 | 2021 | 2020 | 2019 | 2018 | 2017 |
| Selected Per–Share Data | | | | | | |
| Net asset value, beginning of period | $21.82 | $21.22 | $18.82 | $21.28 | $18.66 | $15.40 |
| Income from Investment Operations | | | | | | |
| Net investment income (loss)A | .14 | .38B | .34 | .31 | .30C | .23 |
| Net realized and unrealized gain (loss) | 4.29 | .72 | 2.14 | (1.45) | 2.55 | 3.27 |
| Total from investment operations | 4.43 | 1.10 | 2.48 | (1.14) | 2.85 | 3.50 |
| Distributions from net investment income | – | (.50) | (.08) | (.29) | (.23) | (.24) |
| Distributions from net realized gain | – | – | – | (1.03) | – | – |
| Total distributions | – | (.50) | (.08) | (1.32) | (.23) | (.24) |
| Net asset value, end of period | $26.25 | $21.82 | $21.22 | $18.82 | $21.28 | $18.66 |
| Total ReturnD,E | 20.30% | 5.31% | 13.20% | (5.20)% | 15.33% | 22.72% |
| Ratios to Average Net AssetsF,G | | | | | | |
| Expenses before reductions | .74%H | .67% | .67% | .69% | .76% | .84% |
| Expenses net of fee waivers, if any | .74%H | .67% | .66% | .69% | .76% | .84% |
| Expenses net of all reductions | .73%H | .66% | .66% | .68% | .75% | .84% |
| Net investment income (loss) | 1.09%H | 1.94%B | 1.72% | 1.55% | 1.53%C | 1.30% |
| Supplemental Data | | | | | | |
| Net assets, end of period (000 omitted) | $15,172 | $9,420 | $9,450 | $98,119 | $118,319 | $11,273 |
| Portfolio turnover rateI | 89%H | 104% | 68%J | 92% | 90% | 51% |
A Calculated based on average shares outstanding during the period.
B Net investment income per share reflects one or more large, non-recurring dividend(s) which amounted to $.07 per share. Excluding such non-recurring dividend(s), the ratio of net investment income (loss) to average net assets would have been 1.59%.
C Net investment income per share reflects one or more large, non-recurring dividend(s) which amounted to $.07 per share. Excluding such non-recurring dividend(s), the ratio of net investment income (loss) to average net assets would have been 1.16%.
D Total returns for periods of less than one year are not annualized.
E Total returns would have been lower if certain expenses had not been reduced during the applicable periods shown.
F Fees and expenses of any underlying mutual funds or exchange-traded funds (ETFs) are not included in the Fund's expense ratio. The Fund indirectly bears its proportionate share of these expenses. For additional expense information related to investments in Fidelity Central Funds, please refer to the "Investments in Fidelity Central Funds" note found in the Notes to Financial Statements section of the most recent Annual or Semi-Annual report.
G Expense ratios reflect operating expenses of the class. Expenses before reductions do not reflect amounts reimbursed, waived, or reduced through arrangements with the investment adviser, brokerage services, or other offset arrangements, if applicable, and do not represent the amount paid by the class during periods when reimbursements, waivers or reductions occur.
H Annualized
I Amount does not include the portfolio activity of any underlying mutual funds or exchange-traded funds (ETFs).
J Portfolio turnover rate excludes securities received or delivered in-kind.
See accompanying notes which are an integral part of the financial statements.
Fidelity Stock Selector Large Cap Value Fund Class Z
| | Six months ended (Unaudited) July 31, | Years endedJanuary 31, | | | |
| | 2021 | 2021 | 2020 | 2019 | 2018 A |
| Selected Per–Share Data | | | | | |
| Net asset value, beginning of period | $21.58 | $20.97 | $18.84 | $21.30 | $18.64 |
| Income from Investment Operations | | | | | |
| Net investment income (loss)B | .15 | .41C | .38 | .34 | .34D |
| Net realized and unrealized gain (loss) | 4.25 | .71 | 2.14 | (1.45) | 2.57 |
| Total from investment operations | 4.40 | 1.12 | 2.52 | (1.11) | 2.91 |
| Distributions from net investment income | – | (.51) | (.39) | (.32) | (.25) |
| Distributions from net realized gain | – | – | – | (1.03) | – |
| Total distributions | – | (.51) | (.39) | (1.35) | (.25) |
| Net asset value, end of period | $25.98 | $21.58 | $20.97 | $18.84 | $21.30 |
| Total ReturnE,F | 20.39% | 5.43% | 13.38% | (5.04)% | 15.65% |
| Ratios to Average Net AssetsG,H | | | | | |
| Expenses before reductions | .64%I | .52% | .52% | .55% | .60% |
| Expenses net of fee waivers, if any | .64%I | .52% | .52% | .55% | .60% |
| Expenses net of all reductions | .63%I | .51% | .51% | .54% | .59% |
| Net investment income (loss) | 1.18%I | 2.10%C | 1.86% | 1.70% | 1.68%D |
| Supplemental Data | | | | | |
| Net assets, end of period (000 omitted) | $16,365 | $20,841 | $12,905 | $858 | $888 |
| Portfolio turnover rateJ | 89%I | 104% | 68%K | 92% | 90% |
A For the period February 1, 2017 (commencement of sale of shares) to January 31, 2018.
B Calculated based on average shares outstanding during the period.
C Net investment income per share reflects one or more large, non-recurring dividend(s) which amounted to $.07 per share. Excluding such non-recurring dividend(s), the ratio of net investment income (loss) to average net assets would have been 1.75%.
D Net investment income per share reflects one or more large, non-recurring dividend(s) which amounted to $.07 per share. Excluding such non-recurring dividend(s), the ratio of net investment income (loss) to average net assets would have been 1.31%.
E Total returns for periods of less than one year are not annualized.
F Total returns would have been lower if certain expenses had not been reduced during the applicable periods shown.
G Fees and expenses of any underlying mutual funds or exchange-traded funds (ETFs) are not included in the Fund's expense ratio. The Fund indirectly bears its proportionate share of these expenses. For additional expense information related to investments in Fidelity Central Funds, please refer to the "Investments in Fidelity Central Funds" note found in the Notes to Financial Statements section of the most recent Annual or Semi-Annual report.
H Expense ratios reflect operating expenses of the class. Expenses before reductions do not reflect amounts reimbursed, waived, or reduced through arrangements with the investment adviser, brokerage services, or other offset arrangements, if applicable, and do not represent the amount paid by the class during periods when reimbursements, waivers or reductions occur.
I Annualized
J Amount does not include the portfolio activity of any underlying mutual funds or exchange-traded funds (ETFs).
K Portfolio turnover rate excludes securities received or delivered in-kind.
See accompanying notes which are an integral part of the financial statements.
Notes to Financial Statements (Unaudited)
For the period ended July 31, 2021
1. Organization.
Fidelity Stock Selector Large Cap Value Fund (the Fund) is a fund of Fidelity Devonshire Trust (the Trust) and is authorized to issue an unlimited number of shares. The Trust is registered under the Investment Company Act of 1940, as amended (the 1940 Act), as an open-end management investment company organized as a Massachusetts business trust. The Fund offers Class A, Class M, Class C, Stock Selector Large Cap Value, Class I and Class Z shares, each of which has equal rights as to assets and voting privileges. Each class has exclusive voting rights with respect to matters that affect that class. Effective June 21, 2021, Class C shares will automatically convert to Class A shares after a holding period of eight years from the initial date of purchase, with certain exceptions. Prior to June 21, 2021, Class C shares automatically converted to Class A shares after a holding period of ten years from the initial date of purchase, with certain exceptions.
2. Investments in Fidelity Central Funds.
Funds may invest in Fidelity Central Funds, which are open-end investment companies generally available only to other investment companies and accounts managed by the investment adviser and its affiliates. The Schedule of Investments lists any Fidelity Central Funds held as an investment as of period end, but does not include the underlying holdings of each Fidelity Central Fund. An investing fund indirectly bears its proportionate share of the expenses of the underlying Fidelity Central Funds.
Based on its investment objective, each Fidelity Central Fund may invest or participate in various investment vehicles or strategies that are similar to those of the investing fund. These strategies are consistent with the investment objectives of the investing fund and may involve certain economic risks which may cause a decline in value of each of the Fidelity Central Funds and thus a decline in the value of the investing fund.
| Fidelity Central Fund | Investment Manager | Investment Objective | Investment Practices | Expense Ratio(a) |
| Fidelity Money Market Central Funds | Fidelity Management & Research Company LLC (FMR) | Each fund seeks to obtain a high level of current income consistent with the preservation of capital and liquidity. | Short-term Investments | Ranged from less than .005% to .01% |
(a) Expenses expressed as a percentage of average net assets and are as of each underlying Central Fund's most recent annual or semi-annual shareholder report.
A complete unaudited list of holdings for each Fidelity Central Fund is available upon request or at the Securities and Exchange Commission website at www.sec.gov. In addition, the financial statements of the Fidelity Central Funds which contain the significant accounting policies (including investment valuation policies) of those funds, and are not covered by the Report of Independent Registered Public Accounting Firm, are available on the Securities and Exchange Commission website or upon request.
3. Significant Accounting Policies.
The Fund is an investment company and applies the accounting and reporting guidance of the Financial Accounting Standards Board (FASB) Accounting Standards Codification Topic 946 Financial Services - Investment Companies. The financial statements have been prepared in conformity with accounting principles generally accepted in the United States of America (GAAP), which require management to make certain estimates and assumptions at the date of the financial statements. Actual results could differ from those estimates. Subsequent events, if any, through the date that the financial statements were issued have been evaluated in the preparation of the financial statements. The Fund's Schedule of Investments lists any underlying mutual funds or exchange-traded funds (ETFs) but does not include the underlying holdings of these funds. The following summarizes the significant accounting policies of the Fund:
Investment Valuation. Investments are valued as of 4:00 p.m. Eastern time on the last calendar day of the period. The Board of Trustees (the Board) has delegated the day to day responsibility for the valuation of the Fund's investments to the Fair Value Committee (the Committee) established by the Fund's investment adviser. In accordance with valuation policies and procedures approved by the Board, the Fund attempts to obtain prices from one or more third party pricing vendors or brokers to value its investments. When current market prices, quotations or currency exchange rates are not readily available or reliable, investments will be fair valued in good faith by the Committee, in accordance with procedures adopted by the Board. Factors used in determining fair value vary by investment type and may include market or investment specific events. The frequency with which these procedures are used cannot be predicted and they may be utilized to a significant extent. The Committee oversees the Fund's valuation policies and procedures and reports to the Board on the Committee's activities and fair value determinations. The Board monitors the appropriateness of the procedures used in valuing the Fund's investments and ratifies the fair value determinations of the Committee.
The Fund categorizes the inputs to valuation techniques used to value its investments into a disclosure hierarchy consisting of three levels as shown below:
- Level 1 – quoted prices in active markets for identical investments
- Level 2 – other significant observable inputs (including quoted prices for similar investments, interest rates, prepayment speeds, etc.)
- Level 3 – unobservable inputs (including the Fund's own assumptions based on the best information available)
Valuation techniques used to value the Fund's investments by major category are as follows:
Equity securities, including restricted securities, for which market quotations are readily available, are valued at the last reported sale price or official closing price as reported by a third party pricing vendor on the primary market or exchange on which they are traded and are categorized as Level 1 in the hierarchy. In the event there were no sales during the day or closing prices are not available, securities are valued at the last quoted bid price or may be valued using the last available price and are generally categorized as Level 2 in the hierarchy. For foreign equity securities, when market or security specific events arise, comparisons to the valuation of American Depositary Receipts (ADRs), futures contracts, Exchange-Traded Funds (ETFs) and certain indexes as well as quoted prices for similar securities may be used and would be categorized as Level 2 in the hierarchy. For equity securities, including restricted securities, where observable inputs are limited, assumptions about market activity and risk are used and these securities may be categorized as Level 3 in the hierarchy.
ETFs are valued at their last sale price or official closing price as reported by a third party pricing vendor on the primary market or exchange on which they are traded and are categorized as Level 1 in the hierarchy. In the event there were no sales during the day but the exchange reports a closing bid level, ETFs are valued at the closing bid and would be categorized as Level 1 in the hierarchy. In the event there was no closing bid, ETFs may be valued by another method that the Board believes reflects fair value in accordance with the Board's fair value pricing policies and may be categorized as Level 2 in the hierarchy.
Investments in open-end mutual funds, including the Fidelity Central Funds, are valued at their closing net asset value (NAV) each business day and are categorized as Level 1 in the hierarchy.
Changes in valuation techniques may result in transfers in or out of an assigned level within the disclosure hierarchy. The aggregate value of investments by input level as of July 31, 2021 is included at the end of the Fund's Schedule of Investments.
Foreign Currency. Certain Funds may use foreign currency contracts to facilitate transactions in foreign-denominated securities. Gains and losses from these transactions may arise from changes in the value of the foreign currency or if the counterparties do not perform under the contracts' terms.
Foreign-denominated assets, including investment securities, and liabilities are translated into U.S. dollars at the exchange rates at period end. Purchases and sales of investment securities, income and dividends received, and expenses denominated in foreign currencies are translated into U.S. dollars at the exchange rate in effect on the transaction date.
The effects of exchange rate fluctuations on investments are included with the net realized and unrealized gain (loss) on investment securities. Other foreign currency transactions resulting in realized and unrealized gain (loss) are disclosed separately.
Investment Transactions and Income. For financial reporting purposes, the Fund's investment holdings and NAV include trades executed through the end of the last business day of the period. The NAV per share for processing shareholder transactions is calculated as of the close of business of the New York Stock Exchange (NYSE), normally 4:00 p.m. Eastern time and includes trades executed through the end of the prior business day. Gains and losses on securities sold are determined on the basis of identified cost and include proceeds received from litigation. Dividend income is recorded on the ex-dividend date, except for certain dividends from foreign securities where the ex-dividend date may have passed, which are recorded as soon as the Fund is informed of the ex-dividend date. Non-cash dividends included in dividend income, if any, are recorded at the fair market value of the securities received. Income and capital gain distributions from Fidelity Central Funds, if any, are recorded on the ex-dividend date. Certain distributions received by the Fund represent a return of capital or capital gain. The Fund determines the components of these distributions subsequent to the ex-dividend date, based upon receipt of tax filings or other correspondence relating to the underlying investment. These distributions are recorded as a reduction of cost of investments and/or as a realized gain. Investment income is recorded net of foreign taxes withheld where recovery of such taxes is uncertain.
Class Allocations and Expenses. Investment income, realized and unrealized capital gains and losses, common expenses of a fund, and certain fund-level expense reductions, if any, are allocated daily on a pro-rata basis to each class based on the relative net assets of each class to the total net assets of a fund. Each class differs with respect to transfer agent and distribution and service plan fees incurred, as applicable. Certain expense reductions may also differ by class, if applicable. For the reporting period, the allocated portion of income and expenses to each class as a percent of its average net assets may vary due to the timing of recording these transactions in relation to fluctuating net assets of the classes. Expenses directly attributable to a fund are charged to that fund. Expenses attributable to more than one fund are allocated among the respective funds on the basis of relative net assets or other appropriate methods. Expenses included in the accompanying financial statements reflect the expenses of that fund and do not include any expenses associated with any underlying mutual funds or exchange-traded funds. Although not included in a fund's expenses, a fund indirectly bears its proportionate share of these expenses through the net asset value of each underlying mutual fund or exchange-traded fund. Expense estimates are accrued in the period to which they relate and adjustments are made when actual amounts are known.
Income Tax Information and Distributions to Shareholders. Each year, the Fund intends to qualify as a regulated investment company under Subchapter M of the Internal Revenue Code, including distributing substantially all of its taxable income and realized gains. As a result, no provision for U.S. Federal income taxes is required. The Fund files a U.S. federal tax return, in addition to state and local tax returns as required. The Fund's federal income tax returns are subject to examination by the Internal Revenue Service (IRS) for a period of three fiscal years after they are filed. State and local tax returns may be subject to examination for an additional fiscal year depending on the jurisdiction. Foreign taxes are provided for based on the Fund's understanding of the tax rules and rates that exist in the foreign markets in which it invests.
Distributions are declared and recorded on the ex-dividend date. Income and capital gain distributions are declared separately for each class. Income and capital gain distributions are determined in accordance with income tax regulations, which may differ from GAAP.
Capital accounts within the financial statements are adjusted for permanent book-tax differences. These adjustments have no impact on net assets or the results of operations. Capital accounts are not adjusted for temporary book-tax differences which will reverse in a subsequent period.
Book-tax differences are primarily due to futures contracts, foreign currency transactions, passive foreign investment companies (PFIC), market discount, capital loss carryforwards and losses deferred due to wash sales.
As of period end, the cost and unrealized appreciation (depreciation) in securities, and derivatives if applicable, for federal income tax purposes were as follows:
| Gross unrealized appreciation | $118,026,428 |
| Gross unrealized depreciation | (7,444,770) |
| Net unrealized appreciation (depreciation) | $110,581,658 |
| Tax cost | $429,204,274 |
Capital loss carryforwards are only available to offset future capital gains of the Fund to the extent provided by regulations and may be limited. The capital loss carryforward information presented below, including any applicable limitation, is estimated as of prior fiscal period end and is subject to adjustment.
| No expiration | |
| Short-term | $(5,680,937) |
| Long-term | (23,143,568) |
| Total capital loss carryforward | $(28,824,505) |
4. Purchases and Sales of Investments.
Purchases and sales of securities, other than short-term securities and in-kind transactions, as applicable, are noted in the table below.
| | Purchases ($) | Sales ($) |
| Fidelity Stock Selector Large Cap Value Fund | 233,059,534 | 221,891,723 |
5. Fees and Other Transactions with Affiliates.
Management Fee. Fidelity Management & Research Company LLC (the investment adviser) and its affiliates provide the Fund with investment management related services for which the Fund pays a monthly management fee. The management fee is the sum of an individual fund fee rate that is based on an annual rate of .30% of the Fund's average net assets and an annualized group fee rate that averaged .23% during the period. The group fee rate is based upon the monthly average net assets of a group of registered investment companies with which the investment adviser has management contracts. The group fee rate decreases as assets under management increase and increases as assets under management decrease. In addition, the management fee is subject to a performance adjustment (up to a maximum of +/- .20% of the Fund's average net assets over a 36 month performance period). The upward or downward adjustment to the management fee is based on the relative investment performance of Stock Selector Large Cap Value as compared to its benchmark index, the Russell 1000 Value Index, over the same 36 month performance period. For the reporting period, the total annualized management fee rate, including the performance adjustment, was .53% of the Fund's average net assets. The performance adjustment included in the management fee rate may be higher or lower than the maximum performance adjustment rate due to the difference between the average net assets for the reporting and performance periods.
Distribution and Service Plan Fees. In accordance with Rule 12b-1 of the 1940 Act, the Fund has adopted separate Distribution and Service Plans for each class of shares. Certain classes pay Fidelity Distributors Company LLC (FDC), an affiliate of the investment adviser, separate Distribution and Service Fees, each of which is based on an annual percentage of each class' average net assets. In addition, FDC may pay financial intermediaries for selling shares of the Fund and providing shareholder support services. For the period, the Distribution and Service Fee rates, total fees and amounts retained by FDC were as follows:
| | Distribution Fee | Service Fee | Total Fees | Retained by FDC |
| Class A | -% | .25% | $34,104 | $872 |
| Class M | .25% | .25% | 27,256 | 377 |
| Class C | .75% | .25% | 37,247 | 5,707 |
| | | | $98,607 | $6,956 |
Sales Load. FDC may receive a front-end sales charge of up to 5.75% for selling Class A shares and 3.50% for selling Class M shares, some of which is paid to financial intermediaries for selling shares of the Fund. Depending on the holding period, FDC may receive contingent deferred sales charges levied on Class A, Class M and Class C redemptions. The deferred sales charges are 1.00% for Class C shares, 1.00% for certain purchases of Class A shares and .25% for certain purchases of Class M shares.
For the period, sales charge amounts retained by FDC were as follows:
| | Retained by FDC |
| Class A | $6,664 |
| Class M | 937 |
| Class C(a) | 697 |
| | $8,298 |
(a) When Class C shares are initially sold, FDC pays commissions from its own resources to financial intermediaries through which the sales are made.
Transfer Agent Fees. Fidelity Investments Institutional Operations Company LLC (FIIOC), an affiliate of the investment adviser, is the transfer, dividend disbursing and shareholder servicing agent for each class of the Fund. FIIOC receives account fees and asset-based fees that vary according to the account size and type of account of the shareholders of the respective classes of the Fund, except for Class Z. FIIOC receives an asset-based fee of Class Z's average net assets. FIIOC pays for typesetting, printing and mailing of shareholder reports, except proxy statements.
For the period, transfer agent fees for each class were as follows:
| | Amount | % of Class-Level Average Net Assets(a) |
| Class A | $27,712 | .20 |
| Class M | 11,984 | .22 |
| Class C | 10,368 | .28 |
| Stock Selector Large Cap Value | 333,855 | .15 |
| Class I | 10,697 | .14 |
| Class Z | 3,796 | .04 |
| | $398,412 | |
(a) Annualized
Accounting Fees. Fidelity Service Company, Inc. (FSC), an affiliate of the investment adviser, maintains the Fund's accounting records. The accounting fee is based on the level of average net assets for each month. For the period, the fees were equivalent to the following annualized rates:
| | % of Average Net Assets |
| Fidelity Stock Selector Large Cap Value Fund | .04 |
Brokerage Commissions. A portion of portfolio transactions were placed with brokerage firms which are affiliates of the investment adviser. Brokerage commissions are included in net realized gain (loss) and change in net unrealized appreciation (depreciation) in the Statement of Operations. The commissions paid to these affiliated firms were as follows:
| | Amount |
| Fidelity Stock Selector Large Cap Value Fund | $3,468 |
Interfund Trades. Funds may purchase from or sell securities to other Fidelity Funds under procedures adopted by the Board. The procedures have been designed to ensure these interfund trades are executed in accordance with Rule 17a-7 of the 1940 Act. Any interfund trades are included within the respective purchases and sales amounts shown in the Purchases and Sales of Investments note and are noted in the table below.
| | Purchases ($) | Sales ($) |
| Fidelity Stock Selector Large Cap Value Fund | 26,513,177 | 29,879,448 |
6. Committed Line of Credit.
Certain Funds participate with other funds managed by the investment adviser or an affiliate in a $4.25 billion credit facility (the "line of credit") to be utilized for temporary or emergency purposes to fund shareholder redemptions or for other short-term liquidity purposes. The participating funds have agreed to pay commitment fees on their pro-rata portion of the line of credit, which are reflected in Miscellaneous expenses on the Statement of Operations, and are listed below. During the period, there were no borrowings on this line of credit.
| | Amount |
| Fidelity Stock Selector Large Cap Value Fund | $455 |
7. Security Lending.
Funds lend portfolio securities from time to time in order to earn additional income. Lending agents are used, including National Financial Services (NFS), an affiliate of the investment adviser. Pursuant to a securities lending agreement, NFS will receive a fee, which is capped at 9.9% of a fund's daily lending revenue, for its services as lending agent. A fund may lend securities to certain qualified borrowers, including NFS. On the settlement date of the loan, a fund receives collateral (in the form of U.S. Treasury obligations, letters of credit and/or cash) against the loaned securities and maintains collateral in an amount not less than 100% of the market value of the loaned securities during the period of the loan. The market value of the loaned securities is determined at the close of business of a fund and any additional required collateral is delivered to a fund on the next business day. A fund or borrower may terminate the loan at any time, and if the borrower defaults on its obligation to return the securities loaned because of insolvency or other reasons, a fund may apply collateral received from the borrower against the obligation. A fund may experience delays and costs in recovering the securities loaned. Any cash collateral received is invested in the Fidelity Securities Lending Cash Central Fund. Any loaned securities are identified as such in the Schedule of Investments, and the value of loaned securities and cash collateral at period end, as applicable, are presented in the Statement of Assets and Liabilities. Security lending income represents the income earned on investing cash collateral, less rebates paid to borrowers and any lending agent fees associated with the loan, plus any premium payments received for lending certain types of securities. Security lending income is presented in the Statement of Operations as a component of income from Fidelity Central Funds. Affiliated security lending activity, if any, was as follows:
| | Total Security Lending Fees Paid to NFS | Security Lending Income From Securities Loaned to NFS | Value of Securities Loaned to NFS at Period End |
| Fidelity Stock Selector Large Cap Value Fund | $12 | $– | $– |
8. Expense Reductions.
Commissions paid to certain brokers with whom the investment adviser, or its affiliates, places trades on behalf of the Fund include an amount in addition to trade execution, which may be rebated back to the Fund to offset expenses. This amount totaled $23,895 for the period.
In addition, during the period the investment adviser or an affiliate reimbursed and/or waived a portion of fund-level operating expenses in the amount of $3,976.
9. Distributions to Shareholders.
Distributions to shareholders of each class were as follows:
| | Six months ended
July 31, 2021 | Year ended
January 31, 2021 |
| Fidelity Stock Selector Large Cap Value Fund | | |
| Distributions to shareholders | | |
| Class A | $– | $486,919 |
| Class M | – | 166,759 |
| Class C | – | 89,164 |
| Stock Selector Large Cap Value | – | 8,684,384 |
| Class I | – | 353,431 |
| Class Z | – | 664,690 |
| Total | $– | $10,445,347 |
10. Share Transactions.
Share transactions for each class were as follows and may contain in-kind transactions, automatic conversions between classes or exchanges between affiliated funds:
| | Shares | Shares | Dollars | Dollars |
| | Six months ended July 31, 2021 | Year ended January 31, 2021 | Six months ended July 31, 2021 | Year ended January 31, 2021 |
| Fidelity Stock Selector Large Cap Value Fund | | | | |
| Class A | | | | |
| Shares sold | 281,756 | 232,147 | $7,136,989 | $4,461,724 |
| Reinvestment of distributions | – | 20,946 | – | 429,721 |
| Shares redeemed | (113,916) | (426,592) | (2,809,098) | (8,148,341) |
| Net increase (decrease) | 167,840 | (173,499) | $4,327,891 | $(3,256,896) |
| Class M | | | | |
| Shares sold | 21,702 | 42,288 | $531,732 | $792,314 |
| Reinvestment of distributions | – | 8,161 | – | 166,631 |
| Shares redeemed | (25,389) | (104,335) | (614,722) | (1,906,589) |
| Net increase (decrease) | (3,687) | (53,886) | $(82,990) | $(947,644) |
| Class C | | | | |
| Shares sold | 62,700 | 49,121 | $1,543,665 | $906,243 |
| Reinvestment of distributions | – | 4,543 | – | 89,038 |
| Shares redeemed | (103,575) | (165,220) | (2,527,303) | (2,804,394) |
| Net increase (decrease) | (40,875) | (111,556) | $(983,638) | $(1,809,113) |
| Stock Selector Large Cap Value | | | | |
| Shares sold | 1,762,431 | 1,689,962 | $44,576,555 | $32,116,561 |
| Reinvestment of distributions | – | 397,914 | – | 8,258,831 |
| Shares redeemed | (1,486,505) | (5,381,493) | (37,351,664) | (102,662,962) |
| Net increase (decrease) | 275,926 | (3,293,617) | $7,224,891 | $(62,287,570) |
| Class I | | | | |
| Shares sold | 399,946 | 805,395 | $9,604,864 | $16,819,328 |
| Reinvestment of distributions | – | 9,970 | – | 211,831 |
| Shares redeemed | (253,725) | (828,944) | (6,406,657) | (17,024,870) |
| Net increase (decrease) | 146,221 | (13,579) | $3,198,207 | $6,289 |
| Class Z | | | | |
| Shares sold | 103,705 | 1,113,226 | $2,598,802 | $22,107,144 |
| Reinvestment of distributions | – | 26,137 | – | 549,160 |
| Shares redeemed | (439,372) | (789,221) | (10,555,227) | (16,295,277) |
| Net increase (decrease) | (335,667) | 350,142 | $(7,956,425) | $6,361,027 |
11. Other.
Fund's organizational documents provide former and current trustees and officers with a limited indemnification against liabilities arising in connection with the performance of their duties to the fund. In the normal course of business, the fund may also enter into contracts that provide general indemnifications. The fund's maximum exposure under these arrangements is unknown as this would be dependent on future claims that may be made against the fund. The risk of material loss from such claims is considered remote.
12. Coronavirus (COVID-19) Pandemic.
An outbreak of COVID-19 first detected in China during December 2019 has since spread globally and was declared a pandemic by the World Health Organization during March 2020. Developments that disrupt global economies and financial markets, such as the COVID-19 pandemic, may magnify factors that affect the Fund's performance.
Shareholder Expense Example
As a shareholder, you incur two types of costs: (1) transaction costs, which may include sales charges (loads) on purchase payments or redemption proceeds, as applicable and (2) ongoing costs, which generally include management fees, distribution and/or service (12b-1) fees and other Fund expenses. This Example is intended to help you understand your ongoing costs (in dollars) of investing in a fund and to compare these costs with the ongoing costs of investing in other mutual funds.
The Example is based on an investment of $1,000 invested at the beginning of the period and held for the entire period (February 1, 2021 to July 31, 2021).
Actual Expenses
The first line of the accompanying table provides information about actual account values and actual expenses. You may use the information in this line, together with the amount you invested, to estimate the expenses that you paid over the period. Simply divide your account value by $1,000.00 (for example, an $8,600 account value divided by $1,000.00 = 8.6), then multiply the result by the number in the first line for a class/Fund under the heading entitled "Expenses Paid During Period" to estimate the expenses you paid on your account during this period. If any fund is a shareholder of any underlying mutual funds or exchange-traded funds (ETFs) (the Underlying Funds), such fund indirectly bears its proportional share of the expenses of the Underlying Funds in addition to the direct expenses incurred presented in the table. These fees and expenses are not included in the annualized expense ratio used to calculate the expense estimate in the table below.
Hypothetical Example for Comparison Purposes
The second line of the accompanying table provides information about hypothetical account values and hypothetical expenses based on the actual expense ratio and an assumed rate of return of 5% per year before expenses, which is not the actual return. The hypothetical account values and expenses may not be used to estimate the actual ending account balance or expenses you paid for the period. You may use this information to compare the ongoing costs of investing in the Fund and other funds. To do so, compare this 5% hypothetical example with the 5% hypothetical examples that appear in the shareholder reports of the other funds. If any fund is a shareholder of any Underlying Funds, such fund indirectly bears its proportional share of the expenses of the Underlying Funds in addition to the direct expenses as presented in the table. These fees and expenses are not included in the annualized expense ratio used to calculate the expense estimate in the table below.
Please note that the expenses shown in the table are meant to highlight your ongoing costs only and do not reflect any transaction costs. Therefore, the second line of the table is useful in comparing ongoing costs only, and will not help you determine the relative total costs of owning different funds. In addition, if these transactional costs were included, your costs would have been higher.
| | Annualized Expense Ratio-A | Beginning
Account Value
February 1, 2021 | Ending
Account Value
July 31, 2021 | Expenses Paid
During Period-B
February 1, 2021
to July 31, 2021 |
| Fidelity Stock Selector Large Cap Value Fund | | | | |
| Class A | 1.05% | | | |
| Actual | | $1,000.00 | $1,201.10 | $5.73 |
| Hypothetical-C | | $1,000.00 | $1,019.59 | $5.26 |
| Class M | 1.32% | | | |
| Actual | | $1,000.00 | $1,199.70 | $7.20 |
| Hypothetical-C | | $1,000.00 | $1,018.25 | $6.61 |
| Class C | 1.88% | | | |
| Actual | | $1,000.00 | $1,195.80 | $10.24 |
| Hypothetical-C | | $1,000.00 | $1,015.47 | $9.39 |
| Stock Selector Large Cap Value | .75% | | | |
| Actual | | $1,000.00 | $1,203.40 | $4.10 |
| Hypothetical-C | | $1,000.00 | $1,021.08 | $3.76 |
| Class I | .74% | | | |
| Actual | | $1,000.00 | $1,203.00 | $4.04 |
| Hypothetical-C | | $1,000.00 | $1,021.12 | $3.71 |
| Class Z | .64% | | | |
| Actual | | $1,000.00 | $1,203.90 | $3.50 |
| Hypothetical-C | | $1,000.00 | $1,021.62 | $3.21 |
A Annualized expense ratio reflects expenses net of applicable fee waivers.
B Expenses are equal to the annualized expense ratio, multiplied by the average account value over the period, multiplied by 181/ 365 (to reflect the one-half year period). The fees and expenses of any Underlying Funds are not included in each annualized expense ratio.
C 5% return per year before expenses
Board Approval of Investment Advisory Contracts and Management Fees
Fidelity Stock Selector Large Cap Value Fund
Each year, the Board of Trustees, including the Independent Trustees (together, the Board), votes on the renewal of the management contract with Fidelity Management & Research Company LLC (FMR) and the sub-advisory agreements (together, the Advisory Contracts) for the fund. FMR and the sub-advisers are referred to herein as the Investment Advisers. The Board, assisted by the advice of fund counsel and Independent Trustees' counsel, requests and considers a broad range of information relevant to the renewal of the Advisory Contracts throughout the year.
The Board meets regularly and, at each of its meetings, covers an extensive agenda of topics and materials and considers factors that are relevant to its annual consideration of the renewal of the fund's Advisory Contracts, including the services and support provided to the fund and its shareholders. The Board has established various standing committees (Committees), each composed of and chaired by Independent Trustees with varying backgrounds, to which the Board has assigned specific subject matter responsibilities in order to enhance effective decision-making by the Board. The Board, acting directly and through its Committees, requests and receives information concerning the annual consideration of the renewal of the fund's Advisory Contracts. The Board also meets as needed to review matters specifically related to the Board's annual consideration of the renewal of the Advisory Contracts. Members of the Board may also meet with trustees of other Fidelity funds through joint ad hoc committees to discuss certain matters relevant to all of the Fidelity funds.
At its May 2021 meeting, the Board unanimously determined to renew the fund's Advisory Contracts. In reaching its determination, the Board considered all factors it believed relevant, including (i) the nature, extent, and quality of the services provided to the fund and its shareholders (including the investment performance of the fund); (ii) the competitiveness of the fund's management fee and total expense ratio relative to peer funds; (iii) the total costs of the services provided by and the profits realized by Fidelity from its relationships with the fund; and (iv) the extent to which, if any, economies of scale exist and are realized as the fund grows, and whether any economies of scale are appropriately shared with fund shareholders.
In considering whether to renew the Advisory Contracts for the fund, the Board reached a determination, with the assistance of fund counsel and Independent Trustees' counsel and through the exercise of its business judgment, that the renewal of the Advisory Contracts was in the best interests of the fund and its shareholders and that the compensation payable under the Advisory Contracts was fair and reasonable. The Board's decision to renew the Advisory Contracts was not based on any single factor, but rather was based on a comprehensive consideration of all the information provided to the Board at its meetings throughout the year. The Board, in reaching its determination to renew the Advisory Contracts, was aware that shareholders of the fund have a broad range of investment choices available to them, including a wide choice among funds offered by Fidelity's competitors, and that the fund's shareholders, who have the opportunity to review and weigh the disclosure provided by the fund in its prospectus and other public disclosures, have chosen to invest in this fund, which is part of the Fidelity family of funds.
Nature, Extent, and Quality of Services Provided. The Board considered Fidelity's staffing as it relates to the fund, including the backgrounds of investment personnel of Fidelity, and also considered the fund's investment objective, strategies, and related investment philosophy. The Independent Trustees also had discussions with senior management of Fidelity's investment operations and investment groups. The Board considered the structure of the investment personnel compensation program and whether this structure provides appropriate incentives to act in the best interests of the fund. Additionally, the Board considered the portfolio managers' investments, if any, in the funds that they manage.
Resources Dedicated to Investment Management and Support Services. The Board and the Fund Oversight and Research Committees reviewed the general qualifications and capabilities of Fidelity's investment staff, including its size, education, experience, and resources, as well as Fidelity's approach to recruiting, training, managing, and compensating investment personnel. The Board noted that Fidelity has continued to increase the resources devoted to non-U.S. offices, including expansion of Fidelity's global investment organization. The Board also noted that Fidelity's analysts have extensive resources, tools and capabilities that allow them to conduct sophisticated quantitative and fundamental analysis, as well as credit analysis of issuers, counterparties and guarantors. Further, the Board considered that Fidelity's investment professionals have sufficient access to global information and data so as to provide competitive investment results over time, and that those professionals also have access to sophisticated tools that permit them to assess portfolio construction and risk and performance attribution characteristics continuously, as well as to transmit new information and research conclusions rapidly around the world. Additionally, in its deliberations, the Board considered Fidelity's trading, risk management, compliance, and technology and operations capabilities and resources, which are integral parts of the investment management process. The Board also considered Fidelity's investments in business continuity planning, and its success in continuously providing services to the fund notwithstanding the severe disruptions caused by the COVID-19 pandemic.
Shareholder and Administrative Services. The Board considered (i) the nature, extent, quality, and cost of advisory, administrative, and shareholder services performed by the Investment Advisers and their affiliates under the Advisory Contracts and under separate agreements covering transfer agency, pricing and bookkeeping, and securities lending services for the fund; (ii) the nature and extent of the supervision of third party service providers, principally custodians, subcustodians, and pricing vendors; and (iii) the resources devoted to, and the record of compliance with, the fund's compliance policies and procedures. The Board also reviewed the allocation of fund brokerage, including allocations to brokers affiliated with the Investment Advisers, the use of brokerage commissions to pay fund expenses, and the use of "soft" commission dollars to pay for research services.
The Board noted that the growth of fund assets over time across the complex allows Fidelity to reinvest in the development of services designed to enhance the value and convenience of the Fidelity funds as investment vehicles. These services include 24-hour access to account information and market information over the Internet and through telephone representatives, investor education materials and asset allocation tools, and the expanded availability of Fidelity Investor Centers.
The Board noted that, in the past, it and the boards of certain other Fidelity funds had formed an ad hoc Committee on Transfer Agency Fees to review the variety of transfer agency fee structures throughout the industry and Fidelity's competitive positioning with respect to industry participants.
Investment in a Large Fund Family. The Board considered the benefits to shareholders of investing in a Fidelity fund, including the benefits of investing in a fund that is part of a large family of funds offering a variety of investment disciplines and providing a large variety of mutual fund investor services. The Board noted that Fidelity had taken, or had made recommendations that resulted in the Fidelity funds taking, a number of actions over the previous year that benefited particular funds, including: (i) continuing to dedicate additional resources to Fidelity's investment research process, which includes meetings with management of issuers of securities in which the funds invest, and to the support of the senior management team that oversees asset management; (ii) continuing efforts to enhance Fidelity's global research capabilities; (iii) launching new funds and ETFs with innovative structures, strategies and pricing and making other enhancements to meet client needs; (iv) launching new share classes of existing funds; (v) eliminating purchase minimums and broadening eligibility requirements for certain funds and share classes; (vi) approving the reduction in the holding period for the Class C to Class A conversion policy; (vii) reducing management fees and total expenses for certain target date funds and classes and index funds; (viii) lowering expenses for certain existing funds and classes by implementing or lowering expense caps; (ix) rationalizing product lines and gaining increased efficiencies from fund mergers, liquidations, and share class consolidations; (x) continuing to develop, acquire and implement systems and technology to improve services to the funds and shareholders, strengthen information security, and increase efficiency; and (xi) continuing to implement enhancements to further strengthen Fidelity's product line to increase investors' probability of success in achieving their investment goals, including retirement income goals.
Investment Performance. The Board considered whether the fund has operated in accordance with its investment objective, as well as its record of compliance with its investment restrictions and its performance history. The Board noted that there was a portfolio management change for the fund in April 2018. The Board will continue to monitor closely the fund's performance, taking into account the portfolio management change.
The Board took into account discussions that occur at Board meetings throughout the year with representatives of the Investment Advisers about fund investment performance. In this regard the Board noted that as part of regularly scheduled fund reviews and other reports to the Board on fund performance, the Board considers annualized return information for the fund for different time periods, measured against an appropriate securities market index (benchmark index) and an appropriate peer group of funds with similar objectives (peer group). In its evaluation of fund investment performance, the Board gave particular attention to information indicating changes in performance of certain Fidelity funds for specific time periods and discussed with the Investment Advisers the reasons for any overperformance or underperformance.
In addition to reviewing absolute and relative fund performance, the Independent Trustees periodically consider the appropriateness of fund performance metrics in evaluating the results achieved. In general, the Independent Trustees believe that fund performance should be evaluated based on net performance (after fees and expenses) of both the highest performing and lowest performing fund share classes, where applicable, compared to appropriate benchmark indices, over appropriate time periods that may include full market cycles, and compared to peer groups, as applicable, over the same periods, taking into account relevant factors including the following: general market conditions; issuer-specific information; and fund cash flows and other factors.
The Independent Trustees recognize that shareholders evaluate performance on a net basis over their own holding periods, for which one-, three-, and five-year periods are often used as a proxy. For this reason, the performance information reviewed by the Board also included net cumulative total return information for the fund and an appropriate benchmark index and peer group for the most recent one-, three-, and five-year periods ended September 30, 2020, as shown below. Returns are shown compared to the 25th percentile (top of box, 75% beaten) and 75th percentile (bottom of box, 25% beaten) of the peer universe.
Fidelity Stock Selector Large Cap Value Fund
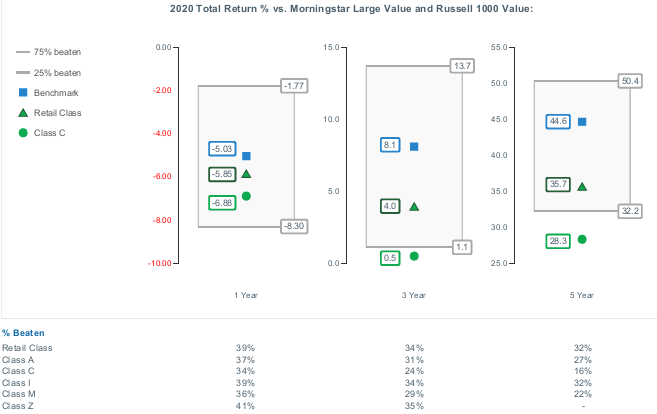
The Board considered the fund's underperformance for different time periods ended September 30, 2020 (which periods are reflected in the charts above). The Board's discussions with FMR regarding underperformance cover topics including, but not limited to: the longer-term track record of a fund's portfolio manager(s); broader trends in the market that may adversely impact a fund's performance; attribution reports on contributors to the fund's underperformance; and the applicable portfolio manager's explanation of his or her underperformance. The Board engages with FMR on steps that might be taken to address a fund's underperformance.
The Board also considered that the fund's management fee is subject to upward or downward adjustment depending upon whether, and to what extent, the fund's investment performance for the performance period (a rolling 36-month period) exceeds, or is exceeded by, a securities index, thus leading to a performance adjustment for the same period. The Board noted that the performance adjustment provides FMR with a strong economic incentive to seek to achieve superior long-term performance for the fund's shareholders and helps to more closely align the interests of FMR and the shareholders of the fund.
Based on its review, the Board concluded that the nature, extent, and quality of services provided to the fund under the Advisory Contracts should continue to benefit the shareholders of the fund.
Competitiveness of Management Fee and Total Expense Ratio. The Board considered the fund's management fee and total expense ratio compared to "mapped groups" of competitive funds and classes created for the purpose of facilitating the Trustees' competitive analysis of management fees and total expenses. Fidelity creates "mapped groups" by combining similar Lipper investment objective categories that have comparable investment mandates. Combining Lipper investment objective categories aids the Board's management fee and total expense ratio comparisons by broadening the competitive group used for comparison.
Management Fee. The Board considered two proprietary management fee comparisons for the 12-month periods ended September 30 (June 30 for periods ended 2019 and 2018 and December 31 for periods prior to 2018) shown in basis points (BP) in the chart below. The group of Lipper funds used by the Board for management fee comparisons is referred to below as the "Total Mapped Group." The Total Mapped Group comparison focuses on a fund's standing in terms of gross management fees before expense reimbursements or caps, and without giving effect to the fund's performance adjustment, relative to the total universe of funds with comparable investment mandates, regardless of whether their management fee structures also are comparable. Funds with comparable investment mandates offer exposure to similar types of securities. Funds with comparable management fee structures have similar management fee contractual arrangements (
e.g., flat rate charged for advisory services, all-inclusive fee rate,
etc.). "TMG %" represents the percentage of funds in the Total Mapped Group that had management fees that were lower than the fund's. For example, a hypothetical TMG % of 20% would mean that 80% of the funds in the Total Mapped Group had higher, and 20% had lower, management fees than the fund. The fund's actual TMG %s and the number of funds in the Total Mapped Group are in the chart below. The "Asset-Sized Peer Group" (ASPG) comparison focuses on a fund's standing relative to a subset of non-Fidelity funds within the Total Mapped Group that are similar in size and management fee structure without taking into account performance adjustments, if any. For example, if a fund is in the first quartile of the ASPG, the fund's management fee ranks in the least expensive or lowest 25% of funds in the ASPG. The ASPG represents at least 15% of the funds in the Total Mapped Group with comparable asset size and management fee structures, subject to a minimum of 50 funds (or all funds in the Total Mapped Group if fewer than 50). Additional information, such as the ASPG quartile in which the fund's management fee rate ranked and the impact of the fund's performance adjustment, is also included in the chart and was considered by the Board.
Fidelity Stock Selector Large Cap Value Fund
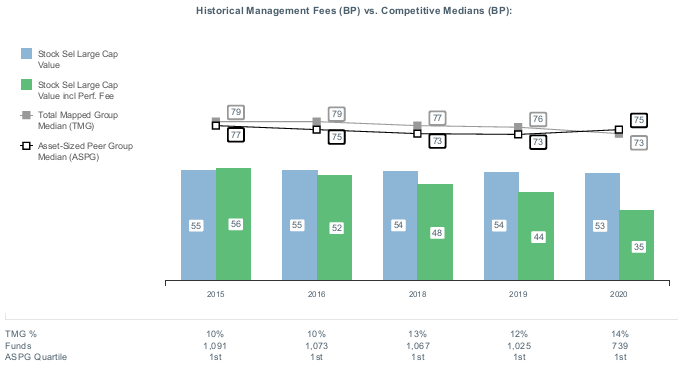
The Board noted that the fund's management fee rate ranked below the median of its Total Mapped Group and below the median of its ASPG for the 12-month period ended September 30, 2020. The Board also noted the effect of the fund's performance adjustment, if any, on the fund's management fee ranking.
The Board noted that, in the past, it and the boards of other Fidelity funds had formed an ad hoc Committee on Group Fee to conduct an in-depth review of the "group fee" component of the management fee of funds with such management fee structures. The Committee's focus included the mechanics of the group fee, the competitive landscape of group fee structures, Fidelity funds with no group fee component and investment products not included in group fee assets. The Board also considered that, for funds subject to the group fee, FMR agreed to voluntarily waive fees over a specified period of time in amounts designed to account for assets converted from certain funds to certain collective investment trusts.
The Board also noted that, in 2013, the ad hoc Committee on Management Fees was formed to conduct an in-depth review of the management fee rates of Fidelity's active equity mutual funds. The Committee focused on the following areas: (i) standard fee structures; (ii) research consumption and trading evolution; (iii) management fee competitiveness/profitability by category; and (iv) factors that drive institutional pricing.
Based on its review, the Board concluded that the fund's management fee is fair and reasonable in light of the services that the fund receives and the other factors considered.
Total Expense Ratio. In its review of each class's total expense ratio, the Board considered the fund's management fee rate as well as other fund or class expenses, as applicable, such as transfer agent fees, pricing and bookkeeping fees, fund-paid 12b-1 fees, and custodial, legal, and audit fees. The Board noted the impact of the fund's performance adjustment. The Board also noted that Fidelity may agree to waive fees or reimburse expenses from time to time, and the extent to which, if any, it has done so for the fund. As part of its review, the Board also considered the current and historical total expense ratios of a representative class of the fund compared to competitive fund median expenses. The fund's representative class is compared to those funds and classes in the Total Mapped Group (used by the Board for management fee comparisons) that have a similar sales load structure (SLTG). The Board also considered a total expense ASPG comparison for the representative class, which focuses on the total expenses of the representative class relative to a subset of non-Fidelity funds within the total expense SLTG. The total expense ASPG is limited to 15 larger and 15 smaller classes in fund average assets for a total of 30 classes, where possible. The total expense ASPG comparison excludes performance adjustments and fund-paid 12b-1 fees to eliminate variability in fee structures.
The Board noted that the total expense ratio of the retail class ranked below the SLTG competitive median and below the ASPG competitive median for the 12-month period ended September 30, 2020.
Fees Charged to Other Fidelity Clients. The Board also considered Fidelity fee structures and other information with respect to clients of Fidelity, such as other funds advised or subadvised by Fidelity, pension plan clients, and other institutional clients with similar mandates. The Board noted that a joint ad hoc committee created by it and the boards of other Fidelity funds periodically reviews and compares Fidelity's institutional investment advisory business with its business of providing services to the Fidelity funds and also noted the most recent findings of the committee. The Board noted that the committee's review included a consideration of the differences in services provided, fees charged, and costs incurred, as well as competition in the markets serving the different categories of clients.
Based on its review of total expense ratios and fees charged to other Fidelity clients, the Board concluded that the total expense ratio of each class of the fund was reasonable in light of the services that the fund and its shareholders receive and the other factors considered.
Costs of the Services and Profitability. The Board considered the revenues earned and the expenses incurred by Fidelity in conducting the business of developing, marketing, distributing, managing, administering and servicing the fund and servicing the fund's shareholders. The Board also considered the level of Fidelity's profits in respect of all the Fidelity funds.
On an annual basis, Fidelity presents to the Board information about the profitability of its relationships with the fund. Fidelity calculates profitability information for each fund, as well as aggregate profitability information for groups of Fidelity funds and all Fidelity funds, using a series of detailed revenue and cost allocation methodologies which originate with the books and records of Fidelity on which Fidelity's audited financial statements are based. The Audit Committee of the Board reviews any significant changes from the prior year's methodologies and the full Board approves such changes.
A public accounting firm has been engaged annually by the Board as part of the Board's assessment of Fidelity's profitability analysis. The engagement includes the review and assessment of the methodologies used by Fidelity in determining the revenues and expenses attributable to Fidelity's mutual fund business, and completion of agreed-upon procedures in respect of the mathematical accuracy of certain fund profitability information and its conformity to established allocation methodologies. After considering the reports issued under the engagement and information provided by Fidelity, the Board concluded that while other allocation methods may also be reasonable, Fidelity's profitability methodologies are reasonable in all material respects.
The Board also reviewed Fidelity's non-fund businesses and potential indirect benefits such businesses may have received as a result of their association with Fidelity's mutual fund business (i.e., fall-out benefits) as well as cases where Fidelity's affiliates may benefit from the funds' business. The Board considered areas where potential indirect benefits to the Fidelity funds from their relationships with Fidelity may exist. The Board also considered that in 2019 a joint ad hoc committee created by it and the boards of other Fidelity funds evaluated potential fall-out benefits (PFOB Committee). The Board noted that it considered the PFOB Committee's findings in connection with its consideration of the renewal of the Advisory Contracts.
The Board considered the costs of the services provided by and the profits realized by Fidelity in connection with the operation of the fund, including the conclusions of the PFOB Committee, and was satisfied that the profitability was not excessive.
Economies of Scale. The Board considered whether there have been economies of scale in respect of the management of the Fidelity funds, whether the Fidelity funds (including the fund) have appropriately benefited from any such economies of scale, and whether there is potential for realization of any further economies of scale. The Board considered the extent to which the fund will benefit from economies of scale as assets grow through increased services to the fund, through waivers or reimbursements, or through fee or expense ratio reductions. The Board also noted that a committee (the Economies of Scale Committee) created by it and the boards of other Fidelity funds periodically analyzes whether Fidelity attains economies of scale in respect of the management and servicing of the Fidelity funds, whether the Fidelity funds have appropriately benefited from such economies of scale, and whether there is potential for realization of any further economies of scale.
The Board recognized that the fund's management contract incorporates a "group fee" structure, which provides for lower group fee rates as total "group assets" increase, and for higher group fee rates as total "group assets" decrease ("group assets" as defined in the management contract). FMR calculates the group fee rates based on a tiered asset "breakpoint" schedule that varies based on asset class. The Board considered that the group fee is designed to deliver the benefits of economies of scale to fund shareholders when total Fidelity fund assets increase, even if assets of any particular fund are unchanged or have declined, because some portion of Fidelity's costs are attributable to services provided to all Fidelity funds, and all funds benefit if those costs can be allocated among more assets. The Board further considered that Fidelity agreed to impose a temporary fee waiver in the form of additional breakpoints to the current breakpoint schedule. The Board concluded that, given the group fee structure, fund shareholders will benefit from lower management fees as "group assets" increase at the fund complex level, regardless of whether Fidelity achieves any such economies of scale.
The Board concluded, taking into account the analysis of the Economies of Scale Committee, that economies of scale, if any, are being appropriately shared between fund shareholders and Fidelity.
Additional Information Requested by the Board. In order to develop fully the factual basis for consideration of the Fidelity funds' advisory contracts, the Board requested and received additional information on certain topics, including: (i) fund flow and performance trends, in particular the underperformance of certain funds and strategies, and Fidelity's long-term strategies for certain funds; (ii) consideration of expanding the use of performance fees for additional funds; (iii) Fidelity's pricing philosophy compared to competitors; (iv) metrics for evaluating index fund and ETF performance and information about ETF trading characteristics; (v) the methodology with respect to evaluating competitive fund data and peer group classifications and fee and expense comparisons; (vi) the expense structures for different funds and classes and information about the differences between various expense structures; (vii) group fee breakpoints; (viii) information regarding other accounts managed by Fidelity and sub-advisory arrangements; and (ix) Fidelity's philosophies and strategies for evaluating funds and classes with lower or declining asset levels.
Based on its evaluation of all of the conclusions noted above, and after considering all factors it believed relevant, the Board concluded that the advisory fee arrangements are fair and reasonable, and that the fund's Advisory Contracts should be renewed.
Liquidity Risk Management Program
The Securities and Exchange Commission adopted Rule 22e-4 under the Investment Company Act of 1940 (the Liquidity Rule) to promote effective liquidity risk management throughout the open-end investment company industry, thereby reducing the risk that funds will be unable to meet their redemption obligations and mitigating dilution of the interests of fund shareholders.
The Fund has adopted and implemented a liquidity risk management program pursuant to the Liquidity Rule (the Program) effective December 1, 2018. The Program is reasonably designed to assess and manage the Fund’s liquidity risk and to comply with the requirements of the Liquidity Rule. The Fund’s Board of Trustees (the Board) has designated the Fund’s investment adviser as administrator of the Program. The Fidelity advisers have established a Liquidity Risk Management Committee (the LRM Committee) to manage the Program for each of the Fidelity Funds. The LRM Committee monitors the adequacy and effectiveness of implementation of the Program and on a periodic basis assesses each Fund’s liquidity risk based on a variety of factors including (1) the Fund’s investment strategy, (2) portfolio liquidity and cash flow projections during normal and reasonably foreseeable stressed conditions, (3) shareholder redemptions, (4) borrowings and other funding sources and (5) in the case of exchange-traded funds, certain additional factors including the effect of the Fund’s prices and spreads, market participants, and basket compositions on the overall liquidity of the Fund’s portfolio, as applicable.
In accordance with the Program, each of the Fund’s portfolio investments is classified into one of four liquidity categories described below based on a determination of a reasonable expectation for how long it would take to convert the investment to cash (or sell or dispose of the investment) without significantly changing its market value.
- Highly liquid investments – cash or convertible to cash within three business days or less
- Moderately liquid investments – convertible to cash in three to seven calendar days
- Less liquid investments – can be sold or disposed of, but not settled, within seven calendar days
- Illiquid investments – cannot be sold or disposed of within seven calendar days
Liquidity classification determinations take into account a variety of factors including various market, trading and investment-specific considerations, as well as market depth, and generally utilize analysis from a third-party liquidity metrics service.
The Liquidity Rule places a 15% limit on a fund’s illiquid investments and requires funds that do not primarily hold assets that are highly liquid investments to determine and maintain a minimum percentage of the fund’s net assets to be invested in highly liquid investments (highly liquid investment minimum or HLIM). The Program includes provisions reasonably designed to comply with the 15% limit on illiquid investments and for determining, periodically reviewing and complying with the HLIM requirement as applicable.
At a recent meeting of the Fund’s Board of Trustees, the LRM Committee provided a written report to the Board pertaining to the operation, adequacy, and effectiveness of implementation of the Program for the annual period from December 1, 2019 through November 30, 2020. The report concluded that the Program has been implemented and is operating effectively and is reasonably designed to assess and manage the Fund’s liquidity risk.
LCV-SANN-0921
1.900197.112
Fidelity® Mid Cap Value Fund
Semi-Annual Report
July 31, 2021
Includes Fidelity and Fidelity Advisor share classes
Contents
To view a fund's proxy voting guidelines and proxy voting record for the 12-month period ended June 30, visit http://www.fidelity.com/proxyvotingresults or visit the Securities and Exchange Commission's (SEC) web site at http://www.sec.gov.
You may also call 1-800-544-8544 if you’re an individual investing directly with Fidelity, call 1-800-835-5092 if you’re a plan sponsor or participant with Fidelity as your recordkeeper or call 1-877-208-0098 on institutional accounts or if you’re an advisor or invest through one to request a free copy of the proxy voting guidelines.
Standard & Poor's, S&P and S&P 500 are registered service marks of The McGraw-Hill Companies, Inc. and have been licensed for use by Fidelity Distributors Corporation.
Other third-party marks appearing herein are the property of their respective owners.
All other marks appearing herein are registered or unregistered trademarks or service marks of FMR LLC or an affiliated company. © 2021 FMR LLC. All rights reserved.
This report and the financial statements contained herein are submitted for the general information of the shareholders of the Fund. This report is not authorized for distribution to prospective investors in the Fund unless preceded or accompanied by an effective prospectus.
A fund files its complete schedule of portfolio holdings with the SEC for the first and third quarters of each fiscal year on Form N-PORT. Forms N-PORT are available on the SEC’s web site at http://www.sec.gov. A fund's Forms N-PORT may be reviewed and copied at the SEC’s Public Reference Room in Washington, DC. Information regarding the operation of the SEC's Public Reference Room may be obtained by calling 1-800-SEC-0330.
For a complete list of a fund's portfolio holdings, view the most recent holdings listing, semiannual report, or annual report on Fidelity's web site at http://www.fidelity.com, http://www.institutional.fidelity.com, or http://www.401k.com, as applicable.
NOT FDIC INSURED •MAY LOSE VALUE •NO BANK GUARANTEE
Neither the Fund nor Fidelity Distributors Corporation is a bank.
Note to Shareholders:
Early in 2020, the outbreak and spread of a new coronavirus emerged as a public health emergency that had a major influence on financial markets, primarily based on its impact on the global economy and the outlook for corporate earnings. The virus causes a respiratory disease known as COVID-19. On March 11, 2020 the World Health Organization declared the COVID-19 outbreak a pandemic, citing sustained risk of further global spread.
In the weeks following, as the crisis worsened, we witnessed an escalating human tragedy with wide-scale social and economic consequences from coronavirus-containment measures. The outbreak of COVID-19 prompted a number of measures to limit the spread, including travel and border restrictions, quarantines, and restrictions on large gatherings. In turn, these resulted in lower consumer activity, diminished demand for a wide range of products and services, disruption in manufacturing and supply chains, and – given the wide variability in outcomes regarding the outbreak – significant market uncertainty and volatility. Amid the turmoil, global governments and central banks took unprecedented action to help support consumers, businesses, and the broader economies, and to limit disruption to financial systems.
The situation continues to unfold, and the extent and duration of its impact on financial markets and the economy remain highly uncertain. Extreme events such as the coronavirus crisis are “exogenous shocks” that can have significant adverse effects on mutual funds and their investments. Although multiple asset classes may be affected by market disruption, the duration and impact may not be the same for all types of assets.
Fidelity is committed to helping you stay informed amid news about COVID-19 and during increased market volatility, and we’re taking extra steps to be responsive to customer needs. We encourage you to visit our websites, where we offer ongoing updates, commentary, and analysis on the markets and our funds.
Investment Summary (Unaudited)
Top Ten Stocks as of July 31, 2021
| | % of fund's net assets |
| CBRE Group, Inc. | 5.9 |
| Reliance Steel & Aluminum Co. | 5.1 |
| Jones Lang LaSalle, Inc. | 4.6 |
| Synchrony Financial | 4.4 |
| Best Buy Co., Inc. | 4.2 |
| Williams-Sonoma, Inc. | 3.6 |
| Interpublic Group of Companies, Inc. | 3.0 |
| Amdocs Ltd. | 2.7 |
| MDU Resources Group, Inc. | 2.7 |
| NRG Energy, Inc. | 2.3 |
| | 38.5 |
Top Five Market Sectors as of July 31, 2021
| | % of fund's net assets |
| Industrials | 18.2 |
| Financials | 15.0 |
| Consumer Discretionary | 12.3 |
| Real Estate | 12.2 |
| Utilities | 8.3 |
Asset Allocation (% of fund's net assets)
| As of July 31, 2021* |
| | Stocks | 99.2% |
| | Short-Term Investments and Net Other Assets (Liabilities) | 0.8% |

* Foreign investments - 7.2%
Schedule of Investments July 31, 2021 (Unaudited)
Showing Percentage of Net Assets
| Common Stocks - 99.2% | | | |
| | | Shares | Value |
| COMMUNICATION SERVICES - 4.4% | | | |
| Entertainment - 1.0% | | | |
| Electronic Arts, Inc. | | 105,200 | $15,144,592 |
| Media - 3.4% | | | |
| DISH Network Corp. Class A (a) | | 76,700 | 3,212,963 |
| Fox Corp. Class A | | 101,900 | 3,633,754 |
| Interpublic Group of Companies, Inc. | | 1,273,469 | 45,029,864 |
| | | | 51,876,581 |
|
| TOTAL COMMUNICATION SERVICES | | | 67,021,173 |
|
| CONSUMER DISCRETIONARY - 12.3% | | | |
| Distributors - 0.5% | | | |
| LKQ Corp. (a) | | 169,400 | 8,597,050 |
| Household Durables - 2.6% | | | |
| Garmin Ltd. | | 66,100 | 10,390,920 |
| Lennar Corp. Class A | | 92,200 | 9,694,830 |
| PulteGroup, Inc. | | 262,900 | 14,425,323 |
| Whirlpool Corp. | | 20,500 | 4,541,570 |
| | | | 39,052,643 |
| Multiline Retail - 0.5% | | | |
| Dollar Tree, Inc. (a) | | 72,400 | 7,224,796 |
| Specialty Retail - 8.7% | | | |
| Best Buy Co., Inc. | | 560,912 | 63,018,463 |
| Dick's Sporting Goods, Inc. | | 71,600 | 7,456,424 |
| Lowe's Companies, Inc. | | 32,100 | 6,185,349 |
| Williams-Sonoma, Inc. | | 364,839 | 55,346,076 |
| | | | 132,006,312 |
|
| TOTAL CONSUMER DISCRETIONARY | | | 186,880,801 |
|
| CONSUMER STAPLES - 3.9% | | | |
| Food & Staples Retailing - 0.6% | | | |
| Kroger Co. | | 238,000 | 9,686,600 |
| Food Products - 3.3% | | | |
| Ingredion, Inc. | | 289,393 | 25,411,599 |
| The J.M. Smucker Co. | | 188,184 | 24,672,804 |
| | | | 50,084,403 |
|
| TOTAL CONSUMER STAPLES | | | 59,771,003 |
|
| ENERGY - 2.9% | | | |
| Energy Equipment & Services - 2.0% | | | |
| Baker Hughes Co. Class A | | 1,415,300 | 30,060,972 |
| Oil, Gas & Consumable Fuels - 0.9% | | | |
| Antero Midstream GP LP (b) | | 95,100 | 903,450 |
| Black Stone Minerals LP | | 33,500 | 356,775 |
| Kinder Morgan, Inc. | | 218,500 | 3,797,530 |
| Sunoco Logistics Partners, LP | | 29,600 | 1,125,096 |
| Targa Resources Corp. | | 89,000 | 3,747,790 |
| Teekay LNG Partners LP | | 169,400 | 2,454,606 |
| World Fuel Services Corp. | | 47,200 | 1,626,512 |
| | | | 14,011,759 |
|
| TOTAL ENERGY | | | 44,072,731 |
|
| FINANCIALS - 15.0% | | | |
| Banks - 2.9% | | | |
| M&T Bank Corp. | | 247,800 | 33,168,030 |
| Popular, Inc. | | 155,500 | 11,314,180 |
| | | | 44,482,210 |
| Capital Markets - 2.0% | | | |
| Federated Hermes, Inc. | | 240,200 | 7,792,088 |
| State Street Corp. | | 263,600 | 22,970,104 |
| | | | 30,762,192 |
| Consumer Finance - 4.4% | | | |
| Synchrony Financial | | 1,420,546 | 66,794,073 |
| Insurance - 5.7% | | | |
| Allstate Corp. | | 116,400 | 15,137,820 |
| American National Group, Inc. | | 4,200 | 692,916 |
| Hartford Financial Services Group, Inc. | | 316,300 | 20,123,006 |
| MetLife, Inc. | | 474,380 | 27,371,726 |
| Old Republic International Corp. | | 957,700 | 23,616,882 |
| | | | 86,942,350 |
|
| TOTAL FINANCIALS | | | 228,980,825 |
|
| HEALTH CARE - 7.1% | | | |
| Biotechnology - 1.3% | | | |
| Amgen, Inc. | | 33,668 | 8,132,169 |
| Regeneron Pharmaceuticals, Inc. (a) | | 16,300 | 9,366,143 |
| United Therapeutics Corp. (a) | | 13,600 | 2,474,248 |
| | | | 19,972,560 |
| Health Care Equipment & Supplies - 0.6% | | | |
| Hologic, Inc. (a) | | 130,200 | 9,770,208 |
| Health Care Providers & Services - 2.8% | | | |
| Cigna Corp. | | 40,400 | 9,271,396 |
| Quest Diagnostics, Inc. (b) | | 57,600 | 8,167,680 |
| Universal Health Services, Inc. Class B | | 151,621 | 24,321,525 |
| | | | 41,760,601 |
| Pharmaceuticals - 2.4% | | | |
| AstraZeneca PLC sponsored ADR | | 158,047 | 9,046,610 |
| Jazz Pharmaceuticals PLC (a) | | 164,513 | 27,888,244 |
| | | | 36,934,854 |
|
| TOTAL HEALTH CARE | | | 108,438,223 |
|
| INDUSTRIALS - 18.2% | | | |
| Aerospace & Defense - 0.4% | | | |
| Huntington Ingalls Industries, Inc. | | 30,800 | 6,318,004 |
| Building Products - 1.1% | | | |
| Fortune Brands Home & Security, Inc. | | 99,600 | 9,708,012 |
| UFP Industries, Inc. | | 98,200 | 7,292,332 |
| | | | 17,000,344 |
| Construction & Engineering - 1.5% | | | |
| EMCOR Group, Inc. | | 189,100 | 23,034,271 |
| Electrical Equipment - 4.0% | | | |
| Acuity Brands, Inc. | | 178,851 | 31,366,888 |
| Encore Wire Corp. | | 100,100 | 7,850,843 |
| Hubbell, Inc. Class B | | 110,800 | 22,210,968 |
| | | | 61,428,699 |
| Machinery - 6.0% | | | |
| Allison Transmission Holdings, Inc. | | 596,300 | 23,798,333 |
| Crane Co. | | 285,767 | 27,785,125 |
| Dover Corp. | | 86,300 | 14,422,456 |
| ITT, Inc. | | 136,500 | 13,364,715 |
| Mueller Industries, Inc. | | 188,400 | 8,176,560 |
| Timken Co. | | 43,000 | 3,418,500 |
| | | | 90,965,689 |
| Professional Services - 3.2% | | | |
| CACI International, Inc. Class A (a) | | 51,000 | 13,614,960 |
| FTI Consulting, Inc. (a) | | 28,900 | 4,210,730 |
| Manpower, Inc. | | 256,626 | 30,430,711 |
| | | | 48,256,401 |
| Road & Rail - 1.1% | | | |
| Knight-Swift Transportation Holdings, Inc. Class A | | 219,000 | 10,882,110 |
| Ryder System, Inc. | | 48,800 | 3,716,120 |
| Werner Enterprises, Inc. | | 47,000 | 2,148,370 |
| | | | 16,746,600 |
| Trading Companies & Distributors - 0.9% | | | |
| Boise Cascade Co. | | 19,700 | 1,007,655 |
| MSC Industrial Direct Co., Inc. Class A | | 135,300 | 12,064,701 |
| | | | 13,072,356 |
|
| TOTAL INDUSTRIALS | | | 276,822,364 |
|
| INFORMATION TECHNOLOGY - 8.2% | | | |
| Communications Equipment - 0.3% | | | |
| Juniper Networks, Inc. | | 173,300 | 4,876,662 |
| Electronic Equipment & Components - 2.3% | | | |
| Avnet, Inc. | | 173,400 | 7,164,888 |
| CDW Corp. | | 23,600 | 4,327,060 |
| Sanmina Corp. (a) | | 131,000 | 5,033,020 |
| SYNNEX Corp. | | 152,300 | 18,205,942 |
| | | | 34,730,910 |
| IT Services - 3.3% | | | |
| Accenture PLC Class A | | 22,600 | 7,179,568 |
| Amdocs Ltd. | | 539,097 | 41,569,770 |
| Sykes Enterprises, Inc. (a) | | 31,900 | 1,711,754 |
| | | | 50,461,092 |
| Software - 1.1% | | | |
| Aspen Technology, Inc. (a) | | 16,400 | 2,398,664 |
| Citrix Systems, Inc. | | 66,300 | 6,679,725 |
| SS&C Technologies Holdings, Inc. | | 90,100 | 7,062,939 |
| | | | 16,141,328 |
| Technology Hardware, Storage & Peripherals - 1.2% | | | |
| HP, Inc. | | 333,600 | 9,631,032 |
| Xerox Holdings Corp. | | 393,000 | 9,483,090 |
| | | | 19,114,122 |
|
| TOTAL INFORMATION TECHNOLOGY | | | 125,324,114 |
|
| MATERIALS - 6.7% | | | |
| Chemicals - 1.2% | | | |
| Minerals Technologies, Inc. | | 44,800 | 3,593,856 |
| NewMarket Corp. | | 44,700 | 14,121,177 |
| | | | 17,715,033 |
| Containers & Packaging - 0.2% | | | |
| Berry Global Group, Inc. (a) | | 45,000 | 2,893,050 |
| Metals & Mining - 5.1% | | | |
| Reliance Steel & Aluminum Co. | | 489,538 | 76,930,897 |
| Paper & Forest Products - 0.2% | | | |
| Schweitzer-Mauduit International, Inc. | | 92,600 | 3,641,958 |
|
| TOTAL MATERIALS | | | 101,180,938 |
|
| REAL ESTATE - 12.2% | | | |
| Equity Real Estate Investment Trusts (REITs) - 1.7% | | | |
| Equity Commonwealth | | 189,800 | 4,989,842 |
| Gaming & Leisure Properties | | 243,542 | 11,529,278 |
| Highwoods Properties, Inc. (SBI) | | 204,600 | 9,757,374 |
| | | | 26,276,494 |
| Real Estate Management & Development - 10.5% | | | |
| CBRE Group, Inc. (a) | | 930,456 | 89,751,786 |
| Jones Lang LaSalle, Inc. (a) | | 314,519 | 70,002,494 |
| | | | 159,754,280 |
|
| TOTAL REAL ESTATE | | | 186,030,774 |
|
| UTILITIES - 8.3% | | | |
| Electric Utilities - 4.8% | | | |
| Exelon Corp. | | 132,784 | 6,214,291 |
| NRG Energy, Inc. (b) | | 839,539 | 34,622,588 |
| OGE Energy Corp. | | 965,474 | 32,584,748 |
| | | | 73,421,627 |
| Independent Power and Renewable Electricity Producers - 0.8% | | | |
| Vistra Corp. | | 590,600 | 11,309,990 |
| Multi-Utilities - 2.7% | | | |
| MDU Resources Group, Inc. | | 1,304,272 | 41,371,508 |
|
| TOTAL UTILITIES | | | 126,103,125 |
|
| TOTAL COMMON STOCKS | | | |
| (Cost $1,127,350,031) | | | 1,510,626,071 |
|
| Money Market Funds - 3.5% | | | |
| Fidelity Cash Central Fund 0.06% (c) | | 11,192,087 | 11,194,326 |
| Fidelity Securities Lending Cash Central Fund 0.06% (c)(d) | | 42,216,172 | 42,220,394 |
| TOTAL MONEY MARKET FUNDS | | | |
| (Cost $53,414,720) | | | 53,414,720 |
| TOTAL INVESTMENT IN SECURITIES - 102.7% | | | |
| (Cost $1,180,764,751) | | | 1,564,040,791 |
| NET OTHER ASSETS (LIABILITIES) - (2.7)% | | | (41,624,906) |
| NET ASSETS - 100% | | | $1,522,415,885 |
Legend
(a) Non-income producing
(b) Security or a portion of the security is on loan at period end.
(c) Affiliated fund that is generally available only to investment companies and other accounts managed by Fidelity Investments. The rate quoted is the annualized seven-day yield of the fund at period end. A complete unaudited listing of the fund's holdings as of its most recent quarter end is available upon request. In addition, each Fidelity Central Fund's financial statements are available on the SEC's website or upon request.
(d) Investment made with cash collateral received from securities on loan.
Affiliated Central Funds
Information regarding fiscal year to date income earned by the Fund from investments in Fidelity Central Funds is as follows:
| Fund | Income earned |
| Fidelity Cash Central Fund | $3,356 |
| Fidelity Securities Lending Cash Central Fund | 6,936 |
| Total | $10,292 |
Amounts in the income column in the above table include any capital gain distributions from underlying funds, which are presented in the corresponding line-item in the Statement of Operations, if applicable. Amount for Fidelity Securities Lending Cash Central Fund represents the income earned on investing cash collateral, less rebates paid to borrowers and any lending agent fees associated with the loan, plus any premium payments received for lending certain types of securities.
Fiscal year to date information regarding the Fund's investments in Fidelity Central Funds, including the ownership percentage, is presented below.
| Fund | Value, beginning of period | Purchases | Sales Proceeds | Realized Gain/Loss | Change in Unrealized appreciation (depreciation) | Value, end of period | % ownership, end of period |
| Fidelity Cash Central Fund 0.06% | $28,001,175 | $110,235,086 | $127,041,369 | $(566) | $-- | $11,194,326 | 0.0% |
| Fidelity Securities Lending Cash Central Fund 0.06% | 37,710,919 | 126,064,551 | 121,555,076 | -- | -- | 42,220,394 | 0.1% |
| Total | $65,712,094 | $236,299,637 | $248,596,445 | $(566) | $-- | $53,414,720 | |
Investment Valuation
The following is a summary of the inputs used, as of July 31, 2021, involving the Fund's assets and liabilities carried at fair value. The inputs or methodology used for valuing securities may not be an indication of the risk associated with investing in those securities. For more information on valuation inputs, and their aggregation into the levels used below, please refer to the Investment Valuation section in the accompanying Notes to Financial Statements.
| | Valuation Inputs at Reporting Date: |
| Description | Total | Level 1 | Level 2 | Level 3 |
| Investments in Securities: | | | | |
| Equities: | | | | |
| Communication Services | $67,021,173 | $67,021,173 | $-- | $-- |
| Consumer Discretionary | 186,880,801 | 186,880,801 | -- | -- |
| Consumer Staples | 59,771,003 | 59,771,003 | -- | -- |
| Energy | 44,072,731 | 44,072,731 | -- | -- |
| Financials | 228,980,825 | 228,980,825 | -- | -- |
| Health Care | 108,438,223 | 108,438,223 | -- | -- |
| Industrials | 276,822,364 | 276,822,364 | -- | -- |
| Information Technology | 125,324,114 | 125,324,114 | -- | -- |
| Materials | 101,180,938 | 101,180,938 | -- | -- |
| Real Estate | 186,030,774 | 186,030,774 | -- | -- |
| Utilities | 126,103,125 | 126,103,125 | -- | -- |
| Money Market Funds | 53,414,720 | 53,414,720 | -- | -- |
| Total Investments in Securities: | $1,564,040,791 | $1,564,040,791 | $-- | $-- |
See accompanying notes which are an integral part of the financial statements.
Financial Statements
Statement of Assets and Liabilities
| | | July 31, 2021 (Unaudited) |
| Assets | | |
Investment in securities, at value (including securities loaned of $40,810,226) — See accompanying schedule:
Unaffiliated issuers (cost $1,127,350,031) | $1,510,626,071 | |
| Fidelity Central Funds (cost $53,414,720) | 53,414,720 | |
| Total Investment in Securities (cost $1,180,764,751) | | $1,564,040,791 |
| Receivable for fund shares sold | | 866,304 |
| Dividends receivable | | 1,060,083 |
| Distributions receivable from Fidelity Central Funds | | 987 |
| Prepaid expenses | | 1,072 |
| Other receivables | | 14,238 |
| Total assets | | 1,565,983,475 |
| Liabilities | | |
| Payable for fund shares redeemed | $556,421 | |
| Accrued management fee | 436,459 | |
| Distribution and service plan fees payable | 86,016 | |
| Other affiliated payables | 249,960 | |
| Other payables and accrued expenses | 30,059 | |
| Collateral on securities loaned | 42,208,675 | |
| Total liabilities | | 43,567,590 |
| Net Assets | | $1,522,415,885 |
| Net Assets consist of: | | |
| Paid in capital | | $1,285,388,899 |
| Total accumulated earnings (loss) | | 237,026,986 |
| Net Assets | | $1,522,415,885 |
| Net Asset Value and Maximum Offering Price | | |
| Class A: | | |
| Net Asset Value and redemption price per share ($156,998,306 ÷ 5,612,478 shares)(a) | | $27.97 |
| Maximum offering price per share (100/94.25 of $27.97) | | $29.68 |
| Class M: | | |
| Net Asset Value and redemption price per share ($38,137,296 ÷ 1,372,579 shares)(a) | | $27.79 |
| Maximum offering price per share (100/96.50 of $27.79) | | $28.80 |
| Class C: | | |
| Net Asset Value and offering price per share ($45,919,574 ÷ 1,709,927 shares)(a) | | $26.85 |
| Mid Cap Value: | | |
| Net Asset Value, offering price and redemption price per share ($1,146,995,295 ÷ 40,291,971 shares) | | $28.47 |
| Class I: | | |
| Net Asset Value, offering price and redemption price per share ($110,684,963 ÷ 3,924,021 shares) | | $28.21 |
| Class Z: | | |
| Net Asset Value, offering price and redemption price per share ($23,680,451 ÷ 839,929 shares) | | $28.19 |
(a) Redemption price per share is equal to net asset value less any applicable contingent deferred sales charge.
See accompanying notes which are an integral part of the financial statements.
Statement of Operations
| | | Six months ended July 31, 2021 (Unaudited) |
| Investment Income | | |
| Dividends | | $13,931,294 |
| Income from Fidelity Central Funds (including $6,936 from security lending) | | 10,292 |
| Total income | | 13,941,586 |
| Expenses | | |
| Management fee | | |
| Basic fee | $3,835,935 | |
| Performance adjustment | (1,665,167) | |
| Transfer agent fees | 1,221,661 | |
| Distribution and service plan fees | 515,859 | |
| Accounting fees | 229,180 | |
| Custodian fees and expenses | 5,373 | |
| Independent trustees' fees and expenses | 2,689 | |
| Registration fees | 62,227 | |
| Audit | 25,712 | |
| Legal | 4,615 | |
| Interest | 73 | |
| Miscellaneous | 3,671 | |
| Total expenses before reductions | 4,241,828 | |
| Expense reductions | (43,919) | |
| Total expenses after reductions | | 4,197,909 |
| Net investment income (loss) | | 9,743,677 |
| Realized and Unrealized Gain (Loss) | | |
| Net realized gain (loss) on: | | |
| Investment securities: | | |
| Unaffiliated issuers | 38,460,389 | |
| Fidelity Central Funds | (566) | |
| Total net realized gain (loss) | | 38,459,823 |
| Change in net unrealized appreciation (depreciation) on investment securities | | 239,102,039 |
| Net gain (loss) | | 277,561,862 |
| Net increase (decrease) in net assets resulting from operations | | $287,305,539 |
See accompanying notes which are an integral part of the financial statements.
Statement of Changes in Net Assets
| | Six months ended July 31, 2021 (Unaudited) | Year ended January 31, 2021 |
| Increase (Decrease) in Net Assets | | |
| Operations | | |
| Net investment income (loss) | $9,743,677 | $23,863,421 |
| Net realized gain (loss) | 38,459,823 | (67,360,610) |
| Change in net unrealized appreciation (depreciation) | 239,102,039 | 69,179,648 |
| Net increase (decrease) in net assets resulting from operations | 287,305,539 | 25,682,459 |
| Distributions to shareholders | – | (23,901,751) |
| Share transactions - net increase (decrease) | 5,636,871 | (328,621,412) |
| Total increase (decrease) in net assets | 292,942,410 | (326,840,704) |
| Net Assets | | |
| Beginning of period | 1,229,473,475 | 1,556,314,179 |
| End of period | $1,522,415,885 | $1,229,473,475 |
See accompanying notes which are an integral part of the financial statements.
Financial Highlights
Fidelity Mid Cap Value Fund Class A
| | Six months ended (Unaudited) July 31, | Years endedJanuary 31, | | | | |
| | 2021 | 2021 | 2020 | 2019 | 2018 | 2017 |
| Selected Per–Share Data | | | | | | |
| Net asset value, beginning of period | $22.67 | $21.75 | $20.91 | $26.62 | $24.94 | $20.52 |
| Income from Investment Operations | | | | | | |
| Net investment income (loss)A | .15 | .35 | .38 | .39 | .44B | .29 |
| Net realized and unrealized gain (loss) | 5.15 | .97 | .83 | (3.35) | 3.54 | 4.40 |
| Total from investment operations | 5.30 | 1.32 | 1.21 | (2.96) | 3.98 | 4.69 |
| Distributions from net investment income | – | (.40) | (.37) | (.40) | (.43) | (.27) |
| Distributions from net realized gain | – | – | – | (2.35) | (1.87) | – |
| Total distributions | – | (.40) | (.37) | (2.75) | (2.30) | (.27) |
| Redemption fees added to paid in capitalA | – | – | – | – | – | –C |
| Net asset value, end of period | $27.97 | $22.67 | $21.75 | $20.91 | $26.62 | $24.94 |
| Total ReturnD,E,F | 23.38% | 6.12% | 5.72% | (11.23)% | 16.13% | 22.87% |
| Ratios to Average Net AssetsG,H | | | | | | |
| Expenses before reductions | .80%I | .73% | .76% | .82% | .98% | 1.01% |
| Expenses net of fee waivers, if any | .80%I | .73% | .76% | .82% | .98% | 1.01% |
| Expenses net of all reductions | .79%I | .72% | .75% | .81% | .97% | 1.00% |
| Net investment income (loss) | 1.11%I | 1.79% | 1.77% | 1.66% | 1.67%B | 1.25% |
| Supplemental Data | | | | | | |
| Net assets, end of period (000 omitted) | $156,998 | $122,838 | $141,439 | $173,538 | $255,907 | $299,124 |
| Portfolio turnover rateJ | 20%I | 67% | 83%K | 80%K | 138%K | 83% |
A Calculated based on average shares outstanding during the period.
B Net investment income per share reflects one or more large, non-recurring dividend(s) which amounted to $.17 per share. Excluding such non-recurring dividend(s), the ratio of net investment income (loss) to average net assets would have been 1.18%.
C Amount represents less than $.005 per share.
D Total returns for periods of less than one year are not annualized.
E Total returns would have been lower if certain expenses had not been reduced during the applicable periods shown.
F Total returns do not include the effect of the sales charges.
G Fees and expenses of any underlying mutual funds or exchange-traded funds (ETFs) are not included in the Fund's expense ratio. The Fund indirectly bears its proportionate share of these expenses. For additional expense information related to investments in Fidelity Central Funds, please refer to the "Investments in Fidelity Central Funds" note found in the Notes to Financial Statements section of the most recent Annual or Semi-Annual report.
H Expense ratios reflect operating expenses of the class. Expenses before reductions do not reflect amounts reimbursed, waived, or reduced through arrangements with the investment adviser, brokerage services, or other offset arrangements, if applicable, and do not represent the amount paid by the class during periods when reimbursements, waivers or reductions occur.
I Annualized
J Amount does not include the portfolio activity of any underlying mutual funds or exchange-traded funds (ETFs).
K Portfolio turnover rate excludes securities received or delivered in-kind.
See accompanying notes which are an integral part of the financial statements.
Fidelity Mid Cap Value Fund Class M
| | Six months ended (Unaudited) July 31, | Years endedJanuary 31, | | | | |
| | 2021 | 2021 | 2020 | 2019 | 2018 | 2017 |
| Selected Per–Share Data | | | | | | |
| Net asset value, beginning of period | $22.54 | $21.65 | $20.82 | $26.51 | $24.84 | $20.46 |
| Income from Investment Operations | | | | | | |
| Net investment income (loss)A | .11 | .29 | .32 | .32 | .36B | .22 |
| Net realized and unrealized gain (loss) | 5.14 | .95 | .82 | (3.33) | 3.54 | 4.38 |
| Total from investment operations | 5.25 | 1.24 | 1.14 | (3.01) | 3.90 | 4.60 |
| Distributions from net investment income | – | (.35) | (.31) | (.33) | (.35) | (.22) |
| Distributions from net realized gain | – | – | – | (2.35) | (1.87) | – |
| Total distributions | – | (.35) | (.31) | (2.68) | (2.23)C | (.22) |
| Redemption fees added to paid in capitalA | – | – | – | – | – | –D |
| Net asset value, end of period | $27.79 | $22.54 | $21.65 | $20.82 | $26.51 | $24.84 |
| Total ReturnE,F,G | 23.29% | 5.76% | 5.44% | (11.48)% | 15.84% | 22.48% |
| Ratios to Average Net AssetsH,I | | | | | | |
| Expenses before reductions | 1.06%J | 1.01% | 1.03% | 1.10% | 1.25% | 1.29% |
| Expenses net of fee waivers, if any | 1.06%J | 1.01% | 1.03% | 1.10% | 1.25% | 1.29% |
| Expenses net of all reductions | 1.06%J | 1.00% | 1.02% | 1.09% | 1.24% | 1.29% |
| Net investment income (loss) | .85%J | 1.51% | 1.50% | 1.39% | 1.40%B | .96% |
| Supplemental Data | | | | | | |
| Net assets, end of period (000 omitted) | $38,137 | $30,549 | $35,684 | $41,540 | $57,807 | $60,761 |
| Portfolio turnover rateK | 20%J | 67% | 83%L | 80%L | 138%L | 83% |
A Calculated based on average shares outstanding during the period.
B Net investment income per share reflects one or more large, non-recurring dividend(s) which amounted to $.17 per share. Excluding such non-recurring dividend(s), the ratio of net investment income (loss) to average net assets would have been .76%.
C Total distributions per share do not sum due to rounding.
D Amount represents less than $.005 per share.
E Total returns for periods of less than one year are not annualized.
F Total returns would have been lower if certain expenses had not been reduced during the applicable periods shown.
G Total returns do not include the effect of the sales charges.
H Fees and expenses of any underlying mutual funds or exchange-traded funds (ETFs) are not included in the Fund's expense ratio. The Fund indirectly bears its proportionate share of these expenses. For additional expense information related to investments in Fidelity Central Funds, please refer to the "Investments in Fidelity Central Funds" note found in the Notes to Financial Statements section of the most recent Annual or Semi-Annual report.
I Expense ratios reflect operating expenses of the class. Expenses before reductions do not reflect amounts reimbursed, waived, or reduced through arrangements with the investment adviser, brokerage services, or other offset arrangements, if applicable, and do not represent the amount paid by the class during periods when reimbursements, waivers or reductions occur.
J Annualized
K Amount does not include the portfolio activity of any underlying mutual funds or exchange-traded funds (ETFs).
L Portfolio turnover rate excludes securities received or delivered in-kind.
See accompanying notes which are an integral part of the financial statements.
Fidelity Mid Cap Value Fund Class C
| | Six months ended (Unaudited) July 31, | Years endedJanuary 31, | | | | |
| | 2021 | 2021 | 2020 | 2019 | 2018 | 2017 |
| Selected Per–Share Data | | | | | | |
| Net asset value, beginning of period | $21.84 | $20.99 | $20.19 | $25.76 | $24.22 | $19.95 |
| Income from Investment Operations | | | | | | |
| Net investment income (loss)A | .05 | .19 | .21 | .21 | .23B | .11 |
| Net realized and unrealized gain (loss) | 4.96 | .91 | .80 | (3.23) | 3.43 | 4.27 |
| Total from investment operations | 5.01 | 1.10 | 1.01 | (3.02) | 3.66 | 4.38 |
| Distributions from net investment income | – | (.25) | (.21) | (.20) | (.25) | (.11) |
| Distributions from net realized gain | – | – | – | (2.35) | (1.87) | – |
| Total distributions | – | (.25) | (.21) | (2.55) | (2.12) | (.11) |
| Redemption fees added to paid in capitalA | – | – | – | – | – | –C |
| Net asset value, end of period | $26.85 | $21.84 | $20.99 | $20.19 | $25.76 | $24.22 |
| Total ReturnD,E,F | 22.94% | 5.26% | 4.96% | (11.89)% | 15.28% | 21.97% |
| Ratios to Average Net AssetsG,H | | | | | | |
| Expenses before reductions | 1.56%I | 1.49% | 1.51% | 1.56% | 1.72% | 1.76% |
| Expenses net of fee waivers, if any | 1.56%I | 1.49% | 1.51% | 1.56% | 1.72% | 1.76% |
| Expenses net of all reductions | 1.55%I | 1.48% | 1.50% | 1.55% | 1.71% | 1.75% |
| Net investment income (loss) | .35%I | 1.04% | 1.02% | .92% | .93%B | .50% |
| Supplemental Data | | | | | | |
| Net assets, end of period (000 omitted) | $45,920 | $43,128 | $60,685 | $85,519 | $138,506 | $144,503 |
| Portfolio turnover rateJ | 20%I | 67% | 83%K | 80%K | 138%K | 83% |
A Calculated based on average shares outstanding during the period.
B Net investment income per share reflects one or more large, non-recurring dividend(s) which amounted to $.16 per share. Excluding such non-recurring dividend(s), the ratio of net investment income (loss) to average net assets would have been .44%.
C Amount represents less than $.005 per share.
D Total returns for periods of less than one year are not annualized.
E Total returns would have been lower if certain expenses had not been reduced during the applicable periods shown.
F Total returns do not include the effect of the contingent deferred sales charge.
G Fees and expenses of any underlying mutual funds or exchange-traded funds (ETFs) are not included in the Fund's expense ratio. The Fund indirectly bears its proportionate share of these expenses. For additional expense information related to investments in Fidelity Central Funds, please refer to the "Investments in Fidelity Central Funds" note found in the Notes to Financial Statements section of the most recent Annual or Semi-Annual report.
H Expense ratios reflect operating expenses of the class. Expenses before reductions do not reflect amounts reimbursed, waived, or reduced through arrangements with the investment adviser, brokerage services, or other offset arrangements, if applicable, and do not represent the amount paid by the class during periods when reimbursements, waivers or reductions occur.
I Annualized
J Amount does not include the portfolio activity of any underlying mutual funds or exchange-traded funds (ETFs).
K Portfolio turnover rate excludes securities received or delivered in-kind.
See accompanying notes which are an integral part of the financial statements.
Fidelity Mid Cap Value Fund
| | Six months ended (Unaudited) July 31, | Years endedJanuary 31, | | | | |
| | 2021 | 2021 | 2020 | 2019 | 2018 | 2017 |
| Selected Per–Share Data | | | | | | |
| Net asset value, beginning of period | $23.03 | $22.09 | $21.23 | $26.99 | $25.24 | $20.76 |
| Income from Investment Operations | | | | | | |
| Net investment income (loss)A | .19 | .41 | .45 | .47 | .52B | .35 |
| Net realized and unrealized gain (loss) | 5.25 | .99 | .84 | (3.41) | 3.60 | 4.46 |
| Total from investment operations | 5.44 | 1.40 | 1.29 | (2.94) | 4.12 | 4.81 |
| Distributions from net investment income | – | (.46) | (.43) | (.47) | (.50) | (.33) |
| Distributions from net realized gain | – | – | – | (2.35) | (1.87) | – |
| Total distributions | – | (.46) | (.43) | (2.82) | (2.37) | (.33) |
| Redemption fees added to paid in capitalA | – | – | – | – | – | –C |
| Net asset value, end of period | $28.47 | $23.03 | $22.09 | $21.23 | $26.99 | $25.24 |
| Total ReturnD,E | 23.62% | 6.37% | 6.03% | (10.97)% | 16.51% | 23.19% |
| Ratios to Average Net AssetsF,G | | | | | | |
| Expenses before reductions | .50%H | .44% | .46% | .53% | .69% | .73% |
| Expenses net of fee waivers, if any | .50%H | .43% | .46% | .53% | .69% | .73% |
| Expenses net of all reductions | .50%H | .43% | .45% | .52% | .68% | .72% |
| Net investment income (loss) | 1.41%H | 2.09% | 2.07% | 1.96% | 1.96%B | 1.53% |
| Supplemental Data | | | | | | |
| Net assets, end of period (000 omitted) | $1,146,995 | $920,386 | $1,156,286 | $1,456,510 | $2,332,143 | $2,426,359 |
| Portfolio turnover rateI | 20%H | 67% | 83%J | 80%J | 138%J | 83% |
A Calculated based on average shares outstanding during the period.
B Net investment income per share reflects one or more large, non-recurring dividend(s) which amounted to $.17 per share. Excluding such non-recurring dividend(s), the ratio of net investment income (loss) to average net assets would have been 1.47%.
C Amount represents less than $.005 per share.
D Total returns for periods of less than one year are not annualized.
E Total returns would have been lower if certain expenses had not been reduced during the applicable periods shown.
F Fees and expenses of any underlying mutual funds or exchange-traded funds (ETFs) are not included in the Fund's expense ratio. The Fund indirectly bears its proportionate share of these expenses. For additional expense information related to investments in Fidelity Central Funds, please refer to the "Investments in Fidelity Central Funds" note found in the Notes to Financial Statements section of the most recent Annual or Semi-Annual report.
G Expense ratios reflect operating expenses of the class. Expenses before reductions do not reflect amounts reimbursed, waived, or reduced through arrangements with the investment adviser, brokerage services, or other offset arrangements, if applicable, and do not represent the amount paid by the class during periods when reimbursements, waivers or reductions occur.
H Annualized
I Amount does not include the portfolio activity of any underlying mutual funds or exchange-traded funds (ETFs).
J Portfolio turnover rate excludes securities received or delivered in-kind.
See accompanying notes which are an integral part of the financial statements.
Fidelity Mid Cap Value Fund Class I
| | Six months ended (Unaudited) July 31, | Years endedJanuary 31, | | | | |
| | 2021 | 2021 | 2020 | 2019 | 2018 | 2017 |
| Selected Per–Share Data | | | | | | |
| Net asset value, beginning of period | $22.82 | $21.88 | $21.03 | $26.77 | $25.05 | $20.61 |
| Income from Investment Operations | | | | | | |
| Net investment income (loss)A | .19 | .41 | .45 | .46 | .51B | .35 |
| Net realized and unrealized gain (loss) | 5.20 | .98 | .83 | (3.38) | 3.58 | 4.43 |
| Total from investment operations | 5.39 | 1.39 | 1.28 | (2.92) | 4.09 | 4.78 |
| Distributions from net investment income | – | (.45) | (.43) | (.47) | (.50) | (.34) |
| Distributions from net realized gain | – | – | – | (2.35) | (1.87) | – |
| Total distributions | – | (.45) | (.43) | (2.82) | (2.37) | (.34) |
| Redemption fees added to paid in capitalA | – | – | – | – | – | –C |
| Net asset value, end of period | $28.21 | $22.82 | $21.88 | $21.03 | $26.77 | $25.05 |
| Total ReturnD,E | 23.62% | 6.41% | 6.01% | (10.99)% | 16.52% | 23.19% |
| Ratios to Average Net AssetsF,G | | | | | | |
| Expenses before reductions | .52%H | .42% | .46% | .53% | .69% | .73% |
| Expenses net of fee waivers, if any | .51%H | .42% | .46% | .53% | .69% | .73% |
| Expenses net of all reductions | .51%H | .41% | .45% | .52% | .68% | .73% |
| Net investment income (loss) | 1.40%H | 2.10% | 2.07% | 1.95% | 1.95%B | 1.53% |
| Supplemental Data | | | | | | |
| Net assets, end of period (000 omitted) | $110,685 | $94,586 | $127,647 | $244,054 | $410,868 | $363,949 |
| Portfolio turnover rateI | 20%H | 67% | 83%J | 80%J | 138%J | 83% |
A Calculated based on average shares outstanding during the period.
B Net investment income per share reflects one or more large, non-recurring dividend(s) which amounted to $.17 per share. Excluding such non-recurring dividend(s), the ratio of net investment income (loss) to average net assets would have been 1.47%.
C Amount represents less than $.005 per share.
D Total returns for periods of less than one year are not annualized.
E Total returns would have been lower if certain expenses had not been reduced during the applicable periods shown.
F Fees and expenses of any underlying mutual funds or exchange-traded funds (ETFs) are not included in the Fund's expense ratio. The Fund indirectly bears its proportionate share of these expenses. For additional expense information related to investments in Fidelity Central Funds, please refer to the "Investments in Fidelity Central Funds" note found in the Notes to Financial Statements section of the most recent Annual or Semi-Annual report.
G Expense ratios reflect operating expenses of the class. Expenses before reductions do not reflect amounts reimbursed, waived, or reduced through arrangements with the investment adviser, brokerage services, or other offset arrangements, if applicable, and do not represent the amount paid by the class during periods when reimbursements, waivers or reductions occur.
H Annualized
I Amount does not include the portfolio activity of any underlying mutual funds or exchange-traded funds (ETFs).
J Portfolio turnover rate excludes securities received or delivered in-kind.
See accompanying notes which are an integral part of the financial statements.
Fidelity Mid Cap Value Fund Class Z
| | Six months ended (Unaudited) July 31, | Years endedJanuary 31, | | | |
| | 2021 | 2021 | 2020 | 2019 | 2018 A |
| Selected Per–Share Data | | | | | |
| Net asset value, beginning of period | $22.80 | $21.86 | $21.01 | $26.76 | $25.03 |
| Income from Investment Operations | | | | | |
| Net investment income (loss)B | .21 | .43 | .48 | .49 | .56C |
| Net realized and unrealized gain (loss) | 5.18 | .99 | .83 | (3.38) | 3.59 |
| Total from investment operations | 5.39 | 1.42 | 1.31 | (2.89) | 4.15 |
| Distributions from net investment income | – | (.48) | (.46) | (.51) | (.54) |
| Distributions from net realized gain | – | – | – | (2.35) | (1.87) |
| Total distributions | – | (.48) | (.46) | (2.86) | (2.42)D |
| Net asset value, end of period | $28.19 | $22.80 | $21.86 | $21.01 | $26.76 |
| Total ReturnE,F | 23.64% | 6.54% | 6.19% | (10.86)% | 16.74% |
| Ratios to Average Net AssetsG,H | | | | | |
| Expenses before reductions | .39%I | .29% | .33% | .40% | .56% |
| Expenses net of fee waivers, if any | .38%I | .29% | .33% | .40% | .56% |
| Expenses net of all reductions | .38%I | .28% | .32% | .39% | .55% |
| Net investment income (loss) | 1.53%I | 2.23% | 2.20% | 2.09% | 2.09%C |
| Supplemental Data | | | | | |
| Net assets, end of period (000 omitted) | $23,680 | $17,987 | $34,573 | $35,972 | $32,974 |
| Portfolio turnover rateJ | 20%I | 67% | 83%K | 80%K | 138%K |
A For the period February 1, 2017 (commencement of sale of shares) to January 31, 2018.
B Calculated based on average shares outstanding during the period.
C Net investment income per share reflects one or more large, non-recurring dividend(s) which amounted to $.17 per share. Excluding such non-recurring dividend(s), the ratio of net investment income (loss) to average net assets would have been 1.60%.
D Total distributions per share do not sum due to rounding.
E Total returns for periods of less than one year are not annualized.
F Total returns would have been lower if certain expenses had not been reduced during the applicable periods shown.
G Fees and expenses of any underlying mutual funds or exchange-traded funds (ETFs) are not included in the Fund's expense ratio. The Fund indirectly bears its proportionate share of these expenses. For additional expense information related to investments in Fidelity Central Funds, please refer to the "Investments in Fidelity Central Funds" note found in the Notes to Financial Statements section of the most recent Annual or Semi-Annual report.
H Expense ratios reflect operating expenses of the class. Expenses before reductions do not reflect amounts reimbursed, waived, or reduced through arrangements with the investment adviser, brokerage services, or other offset arrangements, if applicable, and do not represent the amount paid by the class during periods when reimbursements, waivers or reductions occur.
I Annualized
J Amount does not include the portfolio activity of any underlying mutual funds or exchange-traded funds (ETFs).
K Portfolio turnover rate excludes securities received or delivered in-kind.
See accompanying notes which are an integral part of the financial statements.
Notes to Financial Statements (Unaudited)
For the period ended July 31, 2021
1. Organization.
Fidelity Mid Cap Value Fund (the Fund) is a fund of Fidelity Devonshire Trust (the Trust) and is authorized to issue an unlimited number of shares. The Trust is registered under the Investment Company Act of 1940, as amended (the 1940 Act), as an open-end management investment company organized as a Massachusetts business trust. The Fund offers Class A, Class M, Class C, Mid Cap Value, Class I and Class Z shares, each of which has equal rights as to assets and voting privileges. Each class has exclusive voting rights with respect to matters that affect that class. Effective June 21, 2021, Class C shares will automatically convert to Class A shares after a holding period of eight years from the initial date of purchase, with certain exceptions. Prior to June 21, 2021, Class C shares automatically converted to Class A shares after a holding period of ten years from the initial date of purchase, with certain exceptions.
2. Investments in Fidelity Central Funds.
Funds may invest in Fidelity Central Funds, which are open-end investment companies generally available only to other investment companies and accounts managed by the investment adviser and its affiliates. The Schedule of Investments lists any Fidelity Central Funds held as an investment as of period end, but does not include the underlying holdings of each Fidelity Central Fund. An investing fund indirectly bears its proportionate share of the expenses of the underlying Fidelity Central Funds.
Based on its investment objective, each Fidelity Central Fund may invest or participate in various investment vehicles or strategies that are similar to those of the investing fund. These strategies are consistent with the investment objectives of the investing fund and may involve certain economic risks which may cause a decline in value of each of the Fidelity Central Funds and thus a decline in the value of the investing fund.
| Fidelity Central Fund | Investment Manager | Investment Objective | Investment Practices | Expense Ratio(a) |
| Fidelity Money Market Central Funds | Fidelity Management & Research Company LLC (FMR) | Each fund seeks to obtain a high level of current income consistent with the preservation of capital and liquidity. | Short-term Investments | Ranged from less than .005% to .01% |
(a) Expenses expressed as a percentage of average net assets and are as of each underlying Central Fund's most recent annual or semi-annual shareholder report.
A complete unaudited list of holdings for each Fidelity Central Fund is available upon request or at the Securities and Exchange Commission website at www.sec.gov. In addition, the financial statements of the Fidelity Central Funds which contain the significant accounting policies (including investment valuation policies) of those funds, and are not covered by the Report of Independent Registered Public Accounting Firm, are available on the Securities and Exchange Commission website or upon request.
3. Significant Accounting Policies.
The Fund is an investment company and applies the accounting and reporting guidance of the Financial Accounting Standards Board (FASB) Accounting Standards Codification Topic 946 Financial Services - Investment Companies. The financial statements have been prepared in conformity with accounting principles generally accepted in the United States of America (GAAP), which require management to make certain estimates and assumptions at the date of the financial statements. Actual results could differ from those estimates. Subsequent events, if any, through the date that the financial statements were issued have been evaluated in the preparation of the financial statements. The Fund's Schedule of Investments lists any underlying mutual funds or exchange-traded funds (ETFs) but does not include the underlying holdings of these funds. The following summarizes the significant accounting policies of the Fund:
Investment Valuation. Investments are valued as of 4:00 p.m. Eastern time on the last calendar day of the period. The Board of Trustees (the Board) has delegated the day to day responsibility for the valuation of the Fund's investments to the Fair Value Committee (the Committee) established by the Fund's investment adviser. In accordance with valuation policies and procedures approved by the Board, the Fund attempts to obtain prices from one or more third party pricing vendors or brokers to value its investments. When current market prices, quotations or currency exchange rates are not readily available or reliable, investments will be fair valued in good faith by the Committee, in accordance with procedures adopted by the Board. Factors used in determining fair value vary by investment type and may include market or investment specific events. The frequency with which these procedures are used cannot be predicted and they may be utilized to a significant extent. The Committee oversees the Fund's valuation policies and procedures and reports to the Board on the Committee's activities and fair value determinations. The Board monitors the appropriateness of the procedures used in valuing the Fund's investments and ratifies the fair value determinations of the Committee.
The Fund categorizes the inputs to valuation techniques used to value its investments into a disclosure hierarchy consisting of three levels as shown below:
- Level 1 – quoted prices in active markets for identical investments
- Level 2 – other significant observable inputs (including quoted prices for similar investments, interest rates, prepayment speeds, etc.)
- Level 3 – unobservable inputs (including the Fund's own assumptions based on the best information available)
Valuation techniques used to value the Fund's investments by major category are as follows:
Equity securities, including restricted securities, for which market quotations are readily available, are valued at the last reported sale price or official closing price as reported by a third party pricing vendor on the primary market or exchange on which they are traded and are categorized as Level 1 in the hierarchy. In the event there were no sales during the day or closing prices are not available, securities are valued at the last quoted bid price or may be valued using the last available price and are generally categorized as Level 2 in the hierarchy. For foreign equity securities, when market or security specific events arise, comparisons to the valuation of American Depositary Receipts (ADRs), futures contracts, Exchange-Traded Funds (ETFs) and certain indexes as well as quoted prices for similar securities may be used and would be categorized as Level 2 in the hierarchy. For equity securities, including restricted securities, where observable inputs are limited, assumptions about market activity and risk are used and these securities may be categorized as Level 3 in the hierarchy.
Investments in open-end mutual funds, including the Fidelity Central Funds, are valued at their closing net asset value (NAV) each business day and are categorized as Level 1 in the hierarchy.
Changes in valuation techniques may result in transfers in or out of an assigned level within the disclosure hierarchy. The aggregate value of investments by input level as of July 31, 2021 is included at the end of the Fund's Schedule of Investments.
Investment Transactions and Income. For financial reporting purposes, the Fund's investment holdings and NAV include trades executed through the end of the last business day of the period. The NAV per share for processing shareholder transactions is calculated as of the close of business of the New York Stock Exchange (NYSE), normally 4:00 p.m. Eastern time and includes trades executed through the end of the prior business day. Gains and losses on securities sold are determined on the basis of identified cost and include proceeds received from litigation. Dividend income is recorded on the ex-dividend date, except for certain dividends from foreign securities where the ex-dividend date may have passed, which are recorded as soon as the Fund is informed of the ex-dividend date. Non-cash dividends included in dividend income, if any, are recorded at the fair market value of the securities received. Income and capital gain distributions from Fidelity Central Funds, if any, are recorded on the ex-dividend date. Certain distributions received by the Fund represent a return of capital or capital gain. The Fund determines the components of these distributions subsequent to the ex-dividend date, based upon receipt of tax filings or other correspondence relating to the underlying investment. These distributions are recorded as a reduction of cost of investments and/or as a realized gain.
Class Allocations and Expenses. Investment income, realized and unrealized capital gains and losses, common expenses of a fund, and certain fund-level expense reductions, if any, are allocated daily on a pro-rata basis to each class based on the relative net assets of each class to the total net assets of a fund. Each class differs with respect to transfer agent and distribution and service plan fees incurred, as applicable. Certain expense reductions may also differ by class, if applicable. For the reporting period, the allocated portion of income and expenses to each class as a percent of its average net assets may vary due to the timing of recording these transactions in relation to fluctuating net assets of the classes. Expenses directly attributable to a fund are charged to that fund. Expenses attributable to more than one fund are allocated among the respective funds on the basis of relative net assets or other appropriate methods. Expenses included in the accompanying financial statements reflect the expenses of that fund and do not include any expenses associated with any underlying mutual funds or exchange-traded funds. Although not included in a fund's expenses, a fund indirectly bears its proportionate share of these expenses through the net asset value of each underlying mutual fund or exchange-traded fund. Expense estimates are accrued in the period to which they relate and adjustments are made when actual amounts are known.
Income Tax Information and Distributions to Shareholders. Each year, the Fund intends to qualify as a regulated investment company under Subchapter M of the Internal Revenue Code, including distributing substantially all of its taxable income and realized gains. As a result, no provision for U.S. Federal income taxes is required. The Fund files a U.S. federal tax return, in addition to state and local tax returns as required. The Fund's federal income tax returns are subject to examination by the Internal Revenue Service (IRS) for a period of three fiscal years after they are filed. State and local tax returns may be subject to examination for an additional fiscal year depending on the jurisdiction.
Distributions are declared and recorded on the ex-dividend date. Income and capital gain distributions are declared separately for each class. Income and capital gain distributions are determined in accordance with income tax regulations, which may differ from GAAP.
Capital accounts within the financial statements are adjusted for permanent book-tax differences. These adjustments have no impact on net assets or the results of operations. Capital accounts are not adjusted for temporary book-tax differences which will reverse in a subsequent period.
Book-tax differences are primarily due to foreign currency transactions, partnerships, capital loss carryforwards and losses deferred due to wash sales and excise tax regulations.
As of period end, the cost and unrealized appreciation (depreciation) in securities, and derivatives if applicable, for federal income tax purposes were as follows:
| Gross unrealized appreciation | $419,707,152 |
| Gross unrealized depreciation | (36,617,520) |
| Net unrealized appreciation (depreciation) | $383,089,632 |
| Tax cost | $1,180,951,159 |
Capital loss carryforwards are only available to offset future capital gains of the Fund to the extent provided by regulations and may be limited. The capital loss carryforward information presented below, including any applicable limitation, is estimated as of prior fiscal period end and is subject to adjustment.
| No expiration | |
| Short-term | $(76,084,154) |
| Long-term | (118,194,879) |
| Total capital loss carryforward | $(194,279,033) |
4. Purchases and Sales of Investments.
Purchases and sales of securities, other than short-term securities and in-kind transactions, as applicable, are noted in the table below.
| | Purchases ($) | Sales ($) |
| Fidelity Mid Cap Value Fund | 161,437,919 | 142,410,006 |
5. Fees and Other Transactions with Affiliates.
Management Fee. Fidelity Management & Research Company LLC (the investment adviser) and its affiliates provide the Fund with investment management related services for which the Fund pays a monthly management fee. The management fee is the sum of an individual fund fee rate that is based on an annual rate of .30% of the Fund's average net assets and an annualized group fee rate that averaged .23% during the period. The group fee rate is based upon the monthly average net assets of a group of registered investment companies with which the investment adviser has management contracts. The group fee rate decreases as assets under management increase and increases as assets under management decrease. In addition, the management fee is subject to a performance adjustment (up to a maximum of +/- .20% of the Fund's average net assets over a 36 month performance period). The upward or downward adjustment to the management fee is based on the relative investment performance of Mid Cap Value as compared to its benchmark index, the Russell Midcap Value Index, over the same 36 month performance period. For the reporting period, the total annualized management fee rate, including the performance adjustment, was .30% of the Fund's average net assets. The performance adjustment included in the management fee rate may be higher or lower than the maximum performance adjustment rate due to the difference between the average net assets for the reporting and performance periods.
Distribution and Service Plan Fees. In accordance with Rule 12b-1 of the 1940 Act, the Fund has adopted separate Distribution and Service Plans for each class of shares. Certain classes pay Fidelity Distributors Company LLC (FDC), an affiliate of the investment adviser, separate Distribution and Service Fees, each of which is based on an annual percentage of each class' average net assets. In addition, FDC may pay financial intermediaries for selling shares of the Fund and providing shareholder support services. For the period, the Distribution and Service Fee rates, total fees and amounts retained by FDC were as follows:
| | Distribution Fee | Service Fee | Total Fees | Retained by FDC |
| Class A | -% | .25% | $185,349 | $3,146 |
| Class M | .25% | .25% | 91,762 | 703 |
| Class C | .75% | .25% | 238,748 | 13,140 |
| | | | $515,859 | $16,989 |
Sales Load. FDC may receive a front-end sales charge of up to 5.75% for selling Class A shares and 3.50% for selling Class M shares, some of which is paid to financial intermediaries for selling shares of the Fund. Depending on the holding period, FDC may receive contingent deferred sales charges levied on Class A, Class M and Class C redemptions. The deferred sales charges are 1.00% for Class C shares, 1.00% for certain purchases of Class A shares and .25% for certain purchases of Class M shares.
For the period, sales charge amounts retained by FDC were as follows:
| | Retained by FDC |
| Class A | $24,774 |
| Class M | 3,823 |
| Class C(a) | 271 |
| | $28,868 |
(a) When Class C shares are initially sold, FDC pays commissions from its own resources to financial intermediaries through which the sales are made.
Transfer Agent Fees. Fidelity Investments Institutional Operations Company LLC (FIIOC), an affiliate of the investment adviser, is the transfer, dividend disbursing and shareholder servicing agent for each class of the Fund. FIIOC receives account fees and asset-based fees that vary according to the account size and type of account of the shareholders of the respective classes of the Fund, except for Class Z. FIIOC receives an asset-based fee of Class Z's average net assets. FIIOC pays for typesetting, printing and mailing of shareholder reports, except proxy statements.
For the period, transfer agent fees for each class were as follows:
| | Amount | % of Class-Level Average Net Assets(a) |
| Class A | $154,351 | .21 |
| Class M | 40,566 | .22 |
| Class C | 52,359 | .22 |
| Mid Cap Value | 876,788 | .16 |
| Class I | 92,854 | .17 |
| Class Z | 4,743 | .04 |
| | $1,221,661 | |
(a) Annualized
Accounting Fees. Fidelity Service Company, Inc. (FSC), an affiliate of the investment adviser, maintains the Fund's accounting records. The accounting fee is based on the level of average net assets for each month. For the period, the fees were equivalent to the following annualized rates:
| | % of Average Net Assets |
| Fidelity Mid Cap Value Fund | .03 |
Brokerage Commissions. A portion of portfolio transactions were placed with brokerage firms which are affiliates of the investment adviser. Brokerage commissions are included in net realized gain (loss) and change in net unrealized appreciation (depreciation) in the Statement of Operations. The commissions paid to these affiliated firms were as follows:
| | Amount |
| Fidelity Mid Cap Value Fund | $1,721 |
Interfund Lending Program. Pursuant to an Exemptive Order issued by the Securities and Exchange Commission (the SEC), the Fund, along with other registered investment companies having management contracts with Fidelity Management & Research Company LLC (FMR), or other affiliated entities of FMR, may participate in an interfund lending program. This program provides an alternative credit facility allowing the Fund to borrow from, or lend money to, other participating affiliated funds. At period end, there were no interfund loans outstanding. Activity in this program during the period for which loans were outstanding was as follows:
| | Borrower or Lender | Average Loan Balance | Weighted Average Interest Rate | Interest Expense |
| Fidelity Mid Cap Value Fund | Borrower | $9,011,000 | .29% | $73 |
Interfund Trades. Funds may purchase from or sell securities to other Fidelity Funds under procedures adopted by the Board. The procedures have been designed to ensure these interfund trades are executed in accordance with Rule 17a-7 of the 1940 Act. Any interfund trades are included within the respective purchases and sales amounts shown in the Purchases and Sales of Investments note and are noted in the table below.
| | Purchases ($) | Sales ($) |
| Fidelity Mid Cap Value Fund | 13,969,403 | 22,020,995 |
6. Committed Line of Credit.
Certain Funds participate with other funds managed by the investment adviser or an affiliate in a $4.25 billion credit facility (the "line of credit") to be utilized for temporary or emergency purposes to fund shareholder redemptions or for other short-term liquidity purposes. The participating funds have agreed to pay commitment fees on their pro-rata portion of the line of credit, which are reflected in Miscellaneous expenses on the Statement of Operations, and are listed below. During the period, there were no borrowings on this line of credit.
| | Amount |
| Fidelity Mid Cap Value Fund | $1,287 |
7. Security Lending.
Funds lend portfolio securities from time to time in order to earn additional income. Lending agents are used, including National Financial Services (NFS), an affiliate of the investment adviser. Pursuant to a securities lending agreement, NFS will receive a fee, which is capped at 9.9% of a fund's daily lending revenue, for its services as lending agent. A fund may lend securities to certain qualified borrowers, including NFS. On the settlement date of the loan, a fund receives collateral (in the form of U.S. Treasury obligations, letters of credit and/or cash) against the loaned securities and maintains collateral in an amount not less than 100% of the market value of the loaned securities during the period of the loan. The market value of the loaned securities is determined at the close of business of a fund and any additional required collateral is delivered to a fund on the next business day. A fund or borrower may terminate the loan at any time, and if the borrower defaults on its obligation to return the securities loaned because of insolvency or other reasons, a fund may apply collateral received from the borrower against the obligation. A fund may experience delays and costs in recovering the securities loaned. Any cash collateral received is invested in the Fidelity Securities Lending Cash Central Fund. Any loaned securities are identified as such in the Schedule of Investments, and the value of loaned securities and cash collateral at period end, as applicable, are presented in the Statement of Assets and Liabilities. Security lending income represents the income earned on investing cash collateral, less rebates paid to borrowers and any lending agent fees associated with the loan, plus any premium payments received for lending certain types of securities. Security lending income is presented in the Statement of Operations as a component of income from Fidelity Central Funds. Affiliated security lending activity, if any, was as follows:
| | Total Security Lending Fees Paid to NFS | Security Lending Income From Securities Loaned to NFS | Value of Securities Loaned to NFS at Period End |
| Fidelity Mid Cap Value Fund | $713 | $– | $– |
8. Expense Reductions.
Commissions paid to certain brokers with whom the investment adviser, or its affiliates, places trades on behalf of the Fund include an amount in addition to trade execution, which may be rebated back to the Fund to offset expenses. This amount totaled $32,762 for the period.
In addition, during the period the investment adviser or an affiliate reimbursed and/or waived a portion of fund-level operating expenses in the amount of $11,157.
9. Distributions to Shareholders.
Distributions to shareholders of each class were as follows:
| | Six months ended
July 31, 2021 | Year ended
January 31, 2021 |
| Fidelity Mid Cap Value Fund | | |
| Distributions to shareholders | | |
| Class A | $– | $2,163,678 |
| Class M | – | 465,254 |
| Class C | – | 513,185 |
| Mid Cap Value | – | 18,752,263 |
| Class I | – | 1,638,592 |
| Class Z | – | 368,779 |
| Total | $– | $23,901,751 |
10. Share Transactions.
Share transactions for each class were as follows and may contain in-kind transactions, automatic conversions between classes or exchanges between affiliated funds:
| | Shares | Shares | Dollars | Dollars |
| | Six months ended July 31, 2021 | Year ended January 31, 2021 | Six months ended July 31, 2021 | Year ended January 31, 2021 |
| Fidelity Mid Cap Value Fund | | | | |
| Class A | | | | |
| Shares sold | 809,651 | 917,329 | $21,858,711 | $17,574,702 |
| Reinvestment of distributions | – | 95,063 | – | 2,107,549 |
| Shares redeemed | (616,828) | (2,094,919) | (16,590,886) | (40,636,481) |
| Net increase (decrease) | 192,823 | (1,082,527) | $5,267,825 | $(20,954,230) |
| Class M | | | | |
| Shares sold | 199,404 | 153,342 | $5,365,040 | $3,056,204 |
| Reinvestment of distributions | – | 20,936 | – | 461,857 |
| Shares redeemed | (181,985) | (467,588) | (4,873,271) | (8,724,533) |
| Net increase (decrease) | 17,419 | (293,310) | $491,769 | $(5,206,472) |
| Class C | | | | |
| Shares sold | 135,985 | 119,309 | $3,568,064 | $2,185,949 |
| Reinvestment of distributions | – | 23,849 | – | 510,123 |
| Shares redeemed | (400,624) | (1,060,142) | (10,288,453) | (19,578,112) |
| Net increase (decrease) | (264,639) | (916,984) | $(6,720,389) | $(16,882,040) |
| Mid Cap Value | | | | |
| Shares sold | 4,360,635 | 3,482,266 | $120,423,203 | $69,370,479 |
| Reinvestment of distributions | – | 796,192 | – | 17,930,244 |
| Shares redeemed | (4,031,413) | (16,671,262) | (109,783,139) | (327,351,759) |
| Net increase (decrease) | 329,222 | (12,392,804) | $10,640,064 | $(240,051,036) |
| Class I | | | | |
| Shares sold | 703,812 | 2,174,158 | $19,169,284 | $44,402,514 |
| Reinvestment of distributions | – | 72,727 | – | 1,622,550 |
| Shares redeemed | (924,211) | (3,935,478) | (24,566,827) | (75,322,550) |
| Net increase (decrease) | (220,399) | (1,688,593) | $(5,397,543) | $(29,297,486) |
| Class Z | | | | |
| Shares sold | 167,541 | 1,066,509 | $4,456,434 | $19,594,806 |
| Reinvestment of distributions | – | 15,261 | – | 340,157 |
| Shares redeemed | (116,655) | (1,874,633) | (3,101,289) | (36,165,111) |
| Net increase (decrease) | 50,886 | (792,863) | $1,355,145 | $(16,230,148) |
11. Other.
Fund's organizational documents provide former and current trustees and officers with a limited indemnification against liabilities arising in connection with the performance of their duties to the fund. In the normal course of business, the fund may also enter into contracts that provide general indemnifications. The fund's maximum exposure under these arrangements is unknown as this would be dependent on future claims that may be made against the fund. The risk of material loss from such claims is considered remote.
12. Coronavirus (COVID-19) Pandemic.
An outbreak of COVID-19 first detected in China during December 2019 has since spread globally and was declared a pandemic by the World Health Organization during March 2020. Developments that disrupt global economies and financial markets, such as the COVID-19 pandemic, may magnify factors that affect the Fund's performance.
Shareholder Expense Example
As a shareholder, you incur two types of costs: (1) transaction costs, which may include sales charges (loads) on purchase payments or redemption proceeds, as applicable and (2) ongoing costs, which generally include management fees, distribution and/or service (12b-1) fees and other Fund expenses. This Example is intended to help you understand your ongoing costs (in dollars) of investing in a fund and to compare these costs with the ongoing costs of investing in other mutual funds.
The Example is based on an investment of $1,000 invested at the beginning of the period and held for the entire period (February 1, 2021 to July 31, 2021).
Actual Expenses
The first line of the accompanying table provides information about actual account values and actual expenses. You may use the information in this line, together with the amount you invested, to estimate the expenses that you paid over the period. Simply divide your account value by $1,000.00 (for example, an $8,600 account value divided by $1,000.00 = 8.6), then multiply the result by the number in the first line for a class/Fund under the heading entitled "Expenses Paid During Period" to estimate the expenses you paid on your account during this period. If any fund is a shareholder of any underlying mutual funds or exchange-traded funds (ETFs) (the Underlying Funds), such fund indirectly bears its proportional share of the expenses of the Underlying Funds in addition to the direct expenses incurred presented in the table. These fees and expenses are not included in the annualized expense ratio used to calculate the expense estimate in the table below.
Hypothetical Example for Comparison Purposes
The second line of the accompanying table provides information about hypothetical account values and hypothetical expenses based on the actual expense ratio and an assumed rate of return of 5% per year before expenses, which is not the actual return. The hypothetical account values and expenses may not be used to estimate the actual ending account balance or expenses you paid for the period. You may use this information to compare the ongoing costs of investing in the Fund and other funds. To do so, compare this 5% hypothetical example with the 5% hypothetical examples that appear in the shareholder reports of the other funds. If any fund is a shareholder of any Underlying Funds, such fund indirectly bears its proportional share of the expenses of the Underlying Funds in addition to the direct expenses as presented in the table. These fees and expenses are not included in the annualized expense ratio used to calculate the expense estimate in the table below.
Please note that the expenses shown in the table are meant to highlight your ongoing costs only and do not reflect any transaction costs. Therefore, the second line of the table is useful in comparing ongoing costs only, and will not help you determine the relative total costs of owning different funds. In addition, if these transactional costs were included, your costs would have been higher.
| | Annualized Expense Ratio-A | Beginning
Account Value
February 1, 2021 | Ending
Account Value
July 31, 2021 | Expenses Paid
During Period-B
February 1, 2021
to July 31, 2021 |
| Fidelity Mid Cap Value Fund | | | | |
| Class A | .80% | | | |
| Actual | | $1,000.00 | $1,233.80 | $4.43 |
| Hypothetical-C | | $1,000.00 | $1,020.83 | $4.01 |
| Class M | 1.06% | | | |
| Actual | | $1,000.00 | $1,232.90 | $5.87 |
| Hypothetical-C | | $1,000.00 | $1,019.54 | $5.31 |
| Class C | 1.56% | | | |
| Actual | | $1,000.00 | $1,229.40 | $8.62 |
| Hypothetical-C | | $1,000.00 | $1,017.06 | $7.80 |
| Mid Cap Value | .50% | | | |
| Actual | | $1,000.00 | $1,236.20 | $2.77 |
| Hypothetical-C | | $1,000.00 | $1,022.32 | $2.51 |
| Class I | .51% | | | |
| Actual | | $1,000.00 | $1,236.20 | $2.83 |
| Hypothetical-C | | $1,000.00 | $1,022.27 | $2.56 |
| Class Z | .38% | | | |
| Actual | | $1,000.00 | $1,236.40 | $2.11 |
| Hypothetical-C | | $1,000.00 | $1,022.91 | $1.91 |
A Annualized expense ratio reflects expenses net of applicable fee waivers.
B Expenses are equal to the annualized expense ratio, multiplied by the average account value over the period, multiplied by 181/ 365 (to reflect the one-half year period). The fees and expenses of any Underlying Funds are not included in each annualized expense ratio.
C 5% return per year before expenses
Board Approval of Investment Advisory Contracts and Management Fees
Fidelity Mid Cap Value Fund
Each year, the Board of Trustees, including the Independent Trustees (together, the Board), votes on the renewal of the management contract with Fidelity Management & Research Company LLC (FMR) and the sub-advisory agreements (together, the Advisory Contracts) for the fund. FMR and the sub-advisers are referred to herein as the Investment Advisers. The Board, assisted by the advice of fund counsel and Independent Trustees' counsel, requests and considers a broad range of information relevant to the renewal of the Advisory Contracts throughout the year.
The Board meets regularly and, at each of its meetings, covers an extensive agenda of topics and materials and considers factors that are relevant to its annual consideration of the renewal of the fund's Advisory Contracts, including the services and support provided to the fund and its shareholders. The Board has established various standing committees (Committees), each composed of and chaired by Independent Trustees with varying backgrounds, to which the Board has assigned specific subject matter responsibilities in order to enhance effective decision-making by the Board. The Board, acting directly and through its Committees, requests and receives information concerning the annual consideration of the renewal of the fund's Advisory Contracts. The Board also meets as needed to review matters specifically related to the Board's annual consideration of the renewal of the Advisory Contracts. Members of the Board may also meet with trustees of other Fidelity funds through joint ad hoc committees to discuss certain matters relevant to all of the Fidelity funds.
At its May 2021 meeting, the Board unanimously determined to renew the fund's Advisory Contracts. In reaching its determination, the Board considered all factors it believed relevant, including (i) the nature, extent, and quality of the services provided to the fund and its shareholders (including the investment performance of the fund); (ii) the competitiveness of the fund's management fee and total expense ratio relative to peer funds; (iii) the total costs of the services provided by and the profits realized by Fidelity from its relationships with the fund; and (iv) the extent to which, if any, economies of scale exist and are realized as the fund grows, and whether any economies of scale are appropriately shared with fund shareholders.
In considering whether to renew the Advisory Contracts for the fund, the Board reached a determination, with the assistance of fund counsel and Independent Trustees' counsel and through the exercise of its business judgment, that the renewal of the Advisory Contracts was in the best interests of the fund and its shareholders and that the compensation payable under the Advisory Contracts was fair and reasonable. The Board's decision to renew the Advisory Contracts was not based on any single factor, but rather was based on a comprehensive consideration of all the information provided to the Board at its meetings throughout the year. The Board, in reaching its determination to renew the Advisory Contracts, was aware that shareholders of the fund have a broad range of investment choices available to them, including a wide choice among funds offered by Fidelity's competitors, and that the fund's shareholders, who have the opportunity to review and weigh the disclosure provided by the fund in its prospectus and other public disclosures, have chosen to invest in this fund, which is part of the Fidelity family of funds.
Nature, Extent, and Quality of Services Provided. The Board considered Fidelity's staffing as it relates to the fund, including the backgrounds of investment personnel of Fidelity, and also considered the fund's investment objective, strategies, and related investment philosophy. The Independent Trustees also had discussions with senior management of Fidelity's investment operations and investment groups. The Board considered the structure of the investment personnel compensation program and whether this structure provides appropriate incentives to act in the best interests of the fund. Additionally, the Board considered the portfolio managers' investments, if any, in the funds that they manage.
Resources Dedicated to Investment Management and Support Services. The Board and the Fund Oversight and Research Committees reviewed the general qualifications and capabilities of Fidelity's investment staff, including its size, education, experience, and resources, as well as Fidelity's approach to recruiting, training, managing, and compensating investment personnel. The Board noted that Fidelity has continued to increase the resources devoted to non-U.S. offices, including expansion of Fidelity's global investment organization. The Board also noted that Fidelity's analysts have extensive resources, tools and capabilities that allow them to conduct sophisticated quantitative and fundamental analysis, as well as credit analysis of issuers, counterparties and guarantors. Further, the Board considered that Fidelity's investment professionals have sufficient access to global information and data so as to provide competitive investment results over time, and that those professionals also have access to sophisticated tools that permit them to assess portfolio construction and risk and performance attribution characteristics continuously, as well as to transmit new information and research conclusions rapidly around the world. Additionally, in its deliberations, the Board considered Fidelity's trading, risk management, compliance, and technology and operations capabilities and resources, which are integral parts of the investment management process. The Board also considered Fidelity's investments in business continuity planning, and its success in continuously providing services to the fund notwithstanding the severe disruptions caused by the COVID-19 pandemic.
Shareholder and Administrative Services. The Board considered (i) the nature, extent, quality, and cost of advisory, administrative, and shareholder services performed by the Investment Advisers and their affiliates under the Advisory Contracts and under separate agreements covering transfer agency, pricing and bookkeeping, and securities lending services for the fund; (ii) the nature and extent of the supervision of third party service providers, principally custodians, subcustodians, and pricing vendors; and (iii) the resources devoted to, and the record of compliance with, the fund's compliance policies and procedures. The Board also reviewed the allocation of fund brokerage, including allocations to brokers affiliated with the Investment Advisers, the use of brokerage commissions to pay fund expenses, and the use of "soft" commission dollars to pay for research services.
The Board noted that the growth of fund assets over time across the complex allows Fidelity to reinvest in the development of services designed to enhance the value and convenience of the Fidelity funds as investment vehicles. These services include 24-hour access to account information and market information over the Internet and through telephone representatives, investor education materials and asset allocation tools, and the expanded availability of Fidelity Investor Centers.
The Board noted that, in the past, it and the boards of certain other Fidelity funds had formed an ad hoc Committee on Transfer Agency Fees to review the variety of transfer agency fee structures throughout the industry and Fidelity's competitive positioning with respect to industry participants.
Investment in a Large Fund Family. The Board considered the benefits to shareholders of investing in a Fidelity fund, including the benefits of investing in a fund that is part of a large family of funds offering a variety of investment disciplines and providing a large variety of mutual fund investor services. The Board noted that Fidelity had taken, or had made recommendations that resulted in the Fidelity funds taking, a number of actions over the previous year that benefited particular funds, including: (i) continuing to dedicate additional resources to Fidelity's investment research process, which includes meetings with management of issuers of securities in which the funds invest, and to the support of the senior management team that oversees asset management; (ii) continuing efforts to enhance Fidelity's global research capabilities; (iii) launching new funds and ETFs with innovative structures, strategies and pricing and making other enhancements to meet client needs; (iv) launching new share classes of existing funds; (v) eliminating purchase minimums and broadening eligibility requirements for certain funds and share classes; (vi) approving the reduction in the holding period for the Class C to Class A conversion policy; (vii) reducing management fees and total expenses for certain target date funds and classes and index funds; (viii) lowering expenses for certain existing funds and classes by implementing or lowering expense caps; (ix) rationalizing product lines and gaining increased efficiencies from fund mergers, liquidations, and share class consolidations; (x) continuing to develop, acquire and implement systems and technology to improve services to the funds and shareholders, strengthen information security, and increase efficiency; and (xi) continuing to implement enhancements to further strengthen Fidelity's product line to increase investors' probability of success in achieving their investment goals, including retirement income goals.
Investment Performance. The Board considered whether the fund has operated in accordance with its investment objective, as well as its record of compliance with its investment restrictions and its performance history.
The Board took into account discussions that occur at Board meetings throughout the year with representatives of the Investment Advisers about fund investment performance. In this regard the Board noted that as part of regularly scheduled fund reviews and other reports to the Board on fund performance, the Board considers annualized return information for the fund for different time periods, measured against an appropriate securities market index (benchmark index) and an appropriate peer group of funds with similar objectives (peer group). In its evaluation of fund investment performance, the Board gave particular attention to information indicating changes in performance of certain Fidelity funds for specific time periods and discussed with the Investment Advisers the reasons for any overperformance or underperformance.
In addition to reviewing absolute and relative fund performance, the Independent Trustees periodically consider the appropriateness of fund performance metrics in evaluating the results achieved. In general, the Independent Trustees believe that fund performance should be evaluated based on net performance (after fees and expenses) of both the highest performing and lowest performing fund share classes, where applicable, compared to appropriate benchmark indices, over appropriate time periods that may include full market cycles, and compared to peer groups, as applicable, over the same periods, taking into account relevant factors including the following: general market conditions; issuer-specific information; and fund cash flows and other factors.
The Independent Trustees recognize that shareholders evaluate performance on a net basis over their own holding periods, for which one-, three-, and five-year periods are often used as a proxy. For this reason, the performance information reviewed by the Board also included net cumulative total return information for the fund and an appropriate benchmark index and peer group for the most recent one-, three-, and five-year periods ended September 30, 2020, as shown below. Returns are shown compared to the 25th percentile (top of box, 75% beaten) and 75th percentile (bottom of box, 25% beaten) of the peer universe.
Fidelity Mid Cap Value Fund

The Board considered the fund's underperformance for different time periods ended December 31, 2020 (which periods are not reflected in the chart above). The Board's discussions with FMR regarding underperformance cover topics including, but not limited to: the longer-term track record of a fund's portfolio manager(s); broader trends in the market that may adversely impact a fund's performance; and attribution reports on contributors to the fund's underperformance. The Board engages with FMR on steps that might be taken to address a fund's underperformance.
The Board also considered that the fund's management fee is subject to upward or downward adjustment depending upon whether, and to what extent, the fund's investment performance for the performance period (a rolling 36-month period) exceeds, or is exceeded by, a securities index, thus leading to a performance adjustment for the same period. The Board noted that the performance adjustment provides FMR with a strong economic incentive to seek to achieve superior long-term performance for the fund's shareholders and helps to more closely align the interests of FMR and the shareholders of the fund.
Based on its review, the Board concluded that the nature, extent, and quality of services provided to the fund under the Advisory Contracts should continue to benefit the shareholders of the fund.
Competitiveness of Management Fee and Total Expense Ratio. The Board considered the fund's management fee and total expense ratio compared to "mapped groups" of competitive funds and classes created for the purpose of facilitating the Trustees' competitive analysis of management fees and total expenses. Fidelity creates "mapped groups" by combining similar Lipper investment objective categories that have comparable investment mandates. Combining Lipper investment objective categories aids the Board's management fee and total expense ratio comparisons by broadening the competitive group used for comparison.
Management Fee. The Board considered two proprietary management fee comparisons for the 12-month periods ended September 30 (June 30 for periods ended 2019 and 2018 and December 31 for periods prior to 2018) shown in basis points (BP) in the chart below. The group of Lipper funds used by the Board for management fee comparisons is referred to below as the "Total Mapped Group." The Total Mapped Group comparison focuses on a fund's standing in terms of gross management fees before expense reimbursements or caps, and without giving effect to the fund's performance adjustment, relative to the total universe of funds with comparable investment mandates, regardless of whether their management fee structures also are comparable. Funds with comparable investment mandates offer exposure to similar types of securities. Funds with comparable management fee structures have similar management fee contractual arrangements (
e.g., flat rate charged for advisory services, all-inclusive fee rate,
etc.). "TMG %" represents the percentage of funds in the Total Mapped Group that had management fees that were lower than the fund's. For example, a hypothetical TMG % of 20% would mean that 80% of the funds in the Total Mapped Group had higher, and 20% had lower, management fees than the fund. The fund's actual TMG %s and the number of funds in the Total Mapped Group are in the chart below. The "Asset-Sized Peer Group" (ASPG) comparison focuses on a fund's standing relative to a subset of non-Fidelity funds within the Total Mapped Group that are similar in size and management fee structure without taking into account performance adjustments, if any. For example, if a fund is in the first quartile of the ASPG, the fund's management fee ranks in the least expensive or lowest 25% of funds in the ASPG. The ASPG represents at least 15% of the funds in the Total Mapped Group with comparable asset size and management fee structures, subject to a minimum of 50 funds (or all funds in the Total Mapped Group if fewer than 50). Additional information, such as the ASPG quartile in which the fund's management fee rate ranked and the impact of the fund's performance adjustment, is also included in the chart and was considered by the Board.
Fidelity Mid Cap Value Fund

The Board noted that the fund's management fee rate ranked below the median of its Total Mapped Group and below the median of its ASPG for the 12-month period ended September 30, 2020. The Board also noted the effect of the fund's performance adjustment, if any, on the fund's management fee ranking.
The Board noted that, in the past, it and the boards of other Fidelity funds had formed an ad hoc Committee on Group Fee to conduct an in-depth review of the "group fee" component of the management fee of funds with such management fee structures. The Committee's focus included the mechanics of the group fee, the competitive landscape of group fee structures, Fidelity funds with no group fee component and investment products not included in group fee assets. The Board also considered that, for funds subject to the group fee, FMR agreed to voluntarily waive fees over a specified period of time in amounts designed to account for assets converted from certain funds to certain collective investment trusts.
The Board also noted that, in 2013, the ad hoc Committee on Management Fees was formed to conduct an in-depth review of the management fee rates of Fidelity's active equity mutual funds. The Committee focused on the following areas: (i) standard fee structures; (ii) research consumption and trading evolution; (iii) management fee competitiveness/profitability by category; and (iv) factors that drive institutional pricing.
Based on its review, the Board concluded that the fund's management fee is fair and reasonable in light of the services that the fund receives and the other factors considered.
Total Expense Ratio. In its review of each class's total expense ratio, the Board considered the fund's management fee rate as well as other fund or class expenses, as applicable, such as transfer agent fees, pricing and bookkeeping fees, fund-paid 12b-1 fees, and custodial, legal, and audit fees. The Board noted the impact of the fund's performance adjustment. The Board also noted that Fidelity may agree to waive fees or reimburse expenses from time to time, and the extent to which, if any, it has done so for the fund. As part of its review, the Board also considered the current and historical total expense ratios of a representative class of the fund compared to competitive fund median expenses. The fund's representative class is compared to those funds and classes in the Total Mapped Group (used by the Board for management fee comparisons) that have a similar sales load structure (SLTG). The Board also considered a total expense ASPG comparison for the representative class, which focuses on the total expenses of the representative class relative to a subset of non-Fidelity funds within the total expense SLTG. The total expense ASPG is limited to 15 larger and 15 smaller classes in fund average assets for a total of 30 classes, where possible. The total expense ASPG comparison excludes performance adjustments and fund-paid 12b-1 fees to eliminate variability in fee structures.
The Board noted that the total expense ratio of the retail class ranked below the SLTG competitive median and below the ASPG competitive median for the 12-month period ended September 30, 2020.
Fees Charged to Other Fidelity Clients. The Board also considered Fidelity fee structures and other information with respect to clients of Fidelity, such as other funds advised or subadvised by Fidelity, pension plan clients, and other institutional clients with similar mandates. The Board noted that a joint ad hoc committee created by it and the boards of other Fidelity funds periodically reviews and compares Fidelity's institutional investment advisory business with its business of providing services to the Fidelity funds and also noted the most recent findings of the committee. The Board noted that the committee's review included a consideration of the differences in services provided, fees charged, and costs incurred, as well as competition in the markets serving the different categories of clients.
Based on its review of total expense ratios and fees charged to other Fidelity clients, the Board concluded that the total expense ratio of each class of the fund was reasonable in light of the services that the fund and its shareholders receive and the other factors considered.
Costs of the Services and Profitability. The Board considered the revenues earned and the expenses incurred by Fidelity in conducting the business of developing, marketing, distributing, managing, administering and servicing the fund and servicing the fund's shareholders. The Board also considered the level of Fidelity's profits in respect of all the Fidelity funds.
On an annual basis, Fidelity presents to the Board information about the profitability of its relationships with the fund. Fidelity calculates profitability information for each fund, as well as aggregate profitability information for groups of Fidelity funds and all Fidelity funds, using a series of detailed revenue and cost allocation methodologies which originate with the books and records of Fidelity on which Fidelity's audited financial statements are based. The Audit Committee of the Board reviews any significant changes from the prior year's methodologies and the full Board approves such changes.
A public accounting firm has been engaged annually by the Board as part of the Board's assessment of Fidelity's profitability analysis. The engagement includes the review and assessment of the methodologies used by Fidelity in determining the revenues and expenses attributable to Fidelity's mutual fund business, and completion of agreed-upon procedures in respect of the mathematical accuracy of certain fund profitability information and its conformity to established allocation methodologies. After considering the reports issued under the engagement and information provided by Fidelity, the Board concluded that while other allocation methods may also be reasonable, Fidelity's profitability methodologies are reasonable in all material respects.
The Board also reviewed Fidelity's non-fund businesses and potential indirect benefits such businesses may have received as a result of their association with Fidelity's mutual fund business (i.e., fall-out benefits) as well as cases where Fidelity's affiliates may benefit from the funds' business. The Board considered areas where potential indirect benefits to the Fidelity funds from their relationships with Fidelity may exist. The Board also considered that in 2019 a joint ad hoc committee created by it and the boards of other Fidelity funds evaluated potential fall-out benefits (PFOB Committee). The Board noted that it considered the PFOB Committee's findings in connection with its consideration of the renewal of the Advisory Contracts.
The Board considered the costs of the services provided by and the profits realized by Fidelity in connection with the operation of the fund, including the conclusions of the PFOB Committee, and was satisfied that the profitability was not excessive.
Economies of Scale. The Board considered whether there have been economies of scale in respect of the management of the Fidelity funds, whether the Fidelity funds (including the fund) have appropriately benefited from any such economies of scale, and whether there is potential for realization of any further economies of scale. The Board considered the extent to which the fund will benefit from economies of scale as assets grow through increased services to the fund, through waivers or reimbursements, or through fee or expense ratio reductions. The Board also noted that a committee (the Economies of Scale Committee) created by it and the boards of other Fidelity funds periodically analyzes whether Fidelity attains economies of scale in respect of the management and servicing of the Fidelity funds, whether the Fidelity funds have appropriately benefited from such economies of scale, and whether there is potential for realization of any further economies of scale.
The Board recognized that the fund's management contract incorporates a "group fee" structure, which provides for lower group fee rates as total "group assets" increase, and for higher group fee rates as total "group assets" decrease ("group assets" as defined in the management contract). FMR calculates the group fee rates based on a tiered asset "breakpoint" schedule that varies based on asset class. The Board considered that the group fee is designed to deliver the benefits of economies of scale to fund shareholders when total Fidelity fund assets increase, even if assets of any particular fund are unchanged or have declined, because some portion of Fidelity's costs are attributable to services provided to all Fidelity funds, and all funds benefit if those costs can be allocated among more assets. The Board further considered that Fidelity agreed to impose a temporary fee waiver in the form of additional breakpoints to the current breakpoint schedule. The Board concluded that, given the group fee structure, fund shareholders will benefit from lower management fees as "group assets" increase at the fund complex level, regardless of whether Fidelity achieves any such economies of scale.
The Board concluded, taking into account the analysis of the Economies of Scale Committee, that economies of scale, if any, are being appropriately shared between fund shareholders and Fidelity.
Additional Information Requested by the Board. In order to develop fully the factual basis for consideration of the Fidelity funds' advisory contracts, the Board requested and received additional information on certain topics, including: (i) fund flow and performance trends, in particular the underperformance of certain funds and strategies, and Fidelity's long-term strategies for certain funds; (ii) consideration of expanding the use of performance fees for additional funds; (iii) Fidelity's pricing philosophy compared to competitors; (iv) metrics for evaluating index fund and ETF performance and information about ETF trading characteristics; (v) the methodology with respect to evaluating competitive fund data and peer group classifications and fee and expense comparisons; (vi) the expense structures for different funds and classes and information about the differences between various expense structures; (vii) group fee breakpoints; (viii) information regarding other accounts managed by Fidelity and sub-advisory arrangements; and (ix) Fidelity's philosophies and strategies for evaluating funds and classes with lower or declining asset levels.
Based on its evaluation of all of the conclusions noted above, and after considering all factors it believed relevant, the Board concluded that the advisory fee arrangements are fair and reasonable, and that the fund's Advisory Contracts should be renewed.
Liquidity Risk Management Program
The Securities and Exchange Commission adopted Rule 22e-4 under the Investment Company Act of 1940 (the Liquidity Rule) to promote effective liquidity risk management throughout the open-end investment company industry, thereby reducing the risk that funds will be unable to meet their redemption obligations and mitigating dilution of the interests of fund shareholders.
The Fund has adopted and implemented a liquidity risk management program pursuant to the Liquidity Rule (the Program) effective December 1, 2018. The Program is reasonably designed to assess and manage the Fund’s liquidity risk and to comply with the requirements of the Liquidity Rule. The Fund’s Board of Trustees (the Board) has designated the Fund’s investment adviser as administrator of the Program. The Fidelity advisers have established a Liquidity Risk Management Committee (the LRM Committee) to manage the Program for each of the Fidelity Funds. The LRM Committee monitors the adequacy and effectiveness of implementation of the Program and on a periodic basis assesses each Fund’s liquidity risk based on a variety of factors including (1) the Fund’s investment strategy, (2) portfolio liquidity and cash flow projections during normal and reasonably foreseeable stressed conditions, (3) shareholder redemptions, (4) borrowings and other funding sources and (5) in the case of exchange-traded funds, certain additional factors including the effect of the Fund’s prices and spreads, market participants, and basket compositions on the overall liquidity of the Fund’s portfolio, as applicable.
In accordance with the Program, each of the Fund’s portfolio investments is classified into one of four liquidity categories described below based on a determination of a reasonable expectation for how long it would take to convert the investment to cash (or sell or dispose of the investment) without significantly changing its market value.
- Highly liquid investments – cash or convertible to cash within three business days or less
- Moderately liquid investments – convertible to cash in three to seven calendar days
- Less liquid investments – can be sold or disposed of, but not settled, within seven calendar days
- Illiquid investments – cannot be sold or disposed of within seven calendar days
Liquidity classification determinations take into account a variety of factors including various market, trading and investment-specific considerations, as well as market depth, and generally utilize analysis from a third-party liquidity metrics service.
The Liquidity Rule places a 15% limit on a fund’s illiquid investments and requires funds that do not primarily hold assets that are highly liquid investments to determine and maintain a minimum percentage of the fund’s net assets to be invested in highly liquid investments (highly liquid investment minimum or HLIM). The Program includes provisions reasonably designed to comply with the 15% limit on illiquid investments and for determining, periodically reviewing and complying with the HLIM requirement as applicable.
At a recent meeting of the Fund’s Board of Trustees, the LRM Committee provided a written report to the Board pertaining to the operation, adequacy, and effectiveness of implementation of the Program for the annual period from December 1, 2019 through November 30, 2020. The report concluded that the Program has been implemented and is operating effectively and is reasonably designed to assess and manage the Fund’s liquidity risk.
MCV-SANN-0921
1.900183.112
Fidelity Flex® Funds
Fidelity Flex® Mid Cap Value Fund
Semi-Annual Report
July 31, 2021
Contents
To view a fund's proxy voting guidelines and proxy voting record for the 12-month period ended June 30, visit http://www.fidelity.com/proxyvotingresults or visit the Securities and Exchange Commission's (SEC) web site at http://www.sec.gov.
You may also call 1-800-544-3455 (for managed account clients) or 1-800-835-5092 (for retirement plan participants) to request a free copy of the proxy voting guidelines.
Standard & Poor's, S&P and S&P 500 are registered service marks of The McGraw-Hill Companies, Inc. and have been licensed for use by Fidelity Distributors Corporation.
Other third-party marks appearing herein are the property of their respective owners.
All other marks appearing herein are registered or unregistered trademarks or service marks of FMR LLC or an affiliated company. © 2021 FMR LLC. All rights reserved.
This report and the financial statements contained herein are submitted for the general information of the shareholders of the Fund. This report is not authorized for distribution to prospective investors in the Fund unless preceded or accompanied by an effective prospectus.
A fund files its complete schedule of portfolio holdings with the SEC for the first and third quarters of each fiscal year on Form N-PORT. Forms N-PORT are available on the SEC’s web site at http://www.sec.gov. A fund's Forms N-PORT may be reviewed and copied at the SEC’s Public Reference Room in Washington, DC. Information regarding the operation of the SEC's Public Reference Room may be obtained by calling 1-800-SEC-0330.
For a complete list of a fund's portfolio holdings, view the most recent holdings listing, semiannual report, or annual report on Fidelity's web site at http://www.fidelity.com, http://www.institutional.fidelity.com, or http://www.401k.com, as applicable.
NOT FDIC INSURED •MAY LOSE VALUE •NO BANK GUARANTEE
Neither the Fund nor Fidelity Distributors Corporation is a bank.
Note to Shareholders:
Early in 2020, the outbreak and spread of a new coronavirus emerged as a public health emergency that had a major influence on financial markets, primarily based on its impact on the global economy and the outlook for corporate earnings. The virus causes a respiratory disease known as COVID-19. On March 11, 2020 the World Health Organization declared the COVID-19 outbreak a pandemic, citing sustained risk of further global spread.
In the weeks following, as the crisis worsened, we witnessed an escalating human tragedy with wide-scale social and economic consequences from coronavirus-containment measures. The outbreak of COVID-19 prompted a number of measures to limit the spread, including travel and border restrictions, quarantines, and restrictions on large gatherings. In turn, these resulted in lower consumer activity, diminished demand for a wide range of products and services, disruption in manufacturing and supply chains, and – given the wide variability in outcomes regarding the outbreak – significant market uncertainty and volatility. Amid the turmoil, global governments and central banks took unprecedented action to help support consumers, businesses, and the broader economies, and to limit disruption to financial systems.
The situation continues to unfold, and the extent and duration of its impact on financial markets and the economy remain highly uncertain. Extreme events such as the coronavirus crisis are “exogenous shocks” that can have significant adverse effects on mutual funds and their investments. Although multiple asset classes may be affected by market disruption, the duration and impact may not be the same for all types of assets.
Fidelity is committed to helping you stay informed amid news about COVID-19 and during increased market volatility, and we’re taking extra steps to be responsive to customer needs. We encourage you to visit our websites, where we offer ongoing updates, commentary, and analysis on the markets and our funds.
Investment Summary (Unaudited)
Top Ten Stocks as of July 31, 2021
| | % of fund's net assets |
| Cigna Corp. | 2.4 |
| Equity Lifestyle Properties, Inc. | 2.4 |
| CubeSmart | 2.3 |
| Canadian Natural Resources Ltd. | 1.9 |
| Americold Realty Trust | 1.7 |
| SS&C Technologies Holdings, Inc. | 1.7 |
| Edison International | 1.6 |
| Equinix, Inc. | 1.6 |
| The AES Corp. | 1.6 |
| Laboratory Corp. of America Holdings | 1.6 |
| | 18.8 |
Top Five Market Sectors as of July 31, 2021
| | % of fund's net assets |
| Financials | 19.4 |
| Industrials | 19.3 |
| Consumer Discretionary | 9.3 |
| Real Estate | 9.3 |
| Utilities | 8.4 |
Asset Allocation (% of fund's net assets)
| As of July 31, 2021* |
| | Stocks | 99.9% |
| | Short-Term Investments and Net Other Assets (Liabilities) | 0.1% |

* Foreign investments - 15.3%
Schedule of Investments July 31, 2021 (Unaudited)
Showing Percentage of Net Assets
| Common Stocks - 99.9% | | | |
| | | Shares | Value |
| COMMUNICATION SERVICES - 2.6% | | | |
| Diversified Telecommunication Services - 0.6% | | | |
| Liberty Global PLC Class C (a) | | 7,789 | $209,213 |
| Media - 2.0% | | | |
| Interpublic Group of Companies, Inc. | | 12,892 | 455,861 |
| Nexstar Broadcasting Group, Inc. Class A | | 1,866 | 274,433 |
| | | | 730,294 |
|
| TOTAL COMMUNICATION SERVICES | | | 939,507 |
|
| CONSUMER DISCRETIONARY - 9.3% | | | |
| Auto Components - 0.5% | | | |
| Adient PLC (a) | | 4,642 | 195,567 |
| Distributors - 1.3% | | | |
| LKQ Corp. (a) | | 9,259 | 469,894 |
| Diversified Consumer Services - 0.8% | | | |
| Laureate Education, Inc. Class A (a) | | 19,055 | 282,205 |
| Hotels, Restaurants & Leisure - 1.1% | | | |
| Caesars Entertainment, Inc. (a) | | 4,662 | 407,272 |
| Household Durables - 2.3% | | | |
| Mohawk Industries, Inc. (a) | | 2,496 | 486,470 |
| Taylor Morrison Home Corp. (a) | | 13,756 | 368,936 |
| | | | 855,406 |
| Internet & Direct Marketing Retail - 1.2% | | | |
| eBay, Inc. | | 6,569 | 448,071 |
| Leisure Products - 1.1% | | | |
| Mattel, Inc. (a) | | 19,334 | 419,934 |
| Specialty Retail - 1.0% | | | |
| Gap, Inc. | | 12,072 | 352,140 |
|
| TOTAL CONSUMER DISCRETIONARY | | | 3,430,489 |
|
| CONSUMER STAPLES - 5.0% | | | |
| Beverages - 1.1% | | | |
| Primo Water Corp. | | 24,144 | 399,100 |
| Food & Staples Retailing - 1.1% | | | |
| BJ's Wholesale Club Holdings, Inc. (a) | | 7,715 | 390,688 |
| Food Products - 1.3% | | | |
| Darling Ingredients, Inc. (a) | | 6,786 | 468,709 |
| Household Products - 0.7% | | | |
| Reynolds Consumer Products, Inc. | | 9,060 | 257,757 |
| Tobacco - 0.8% | | | |
| Altria Group, Inc. | | 6,523 | 313,365 |
|
| TOTAL CONSUMER STAPLES | | | 1,829,619 |
|
| ENERGY - 5.2% | | | |
| Energy Equipment & Services - 0.5% | | | |
| Liberty Oilfield Services, Inc. Class A (a) | | 18,708 | 190,635 |
| Oil, Gas & Consumable Fuels - 4.7% | | | |
| Canadian Natural Resources Ltd. | | 21,007 | 693,218 |
| Cheniere Energy, Inc. (a) | | 6,047 | 513,572 |
| Hess Corp. | | 6,810 | 520,556 |
| | | | 1,727,346 |
|
| TOTAL ENERGY | | | 1,917,981 |
|
| FINANCIALS - 19.4% | | | |
| Banks - 2.6% | | | |
| East West Bancorp, Inc. | | 3,886 | 276,489 |
| First Citizens Bancshares, Inc. | | 460 | 359,991 |
| Signature Bank | | 1,451 | 329,333 |
| | | | 965,813 |
| Capital Markets - 4.9% | | | |
| Ameriprise Financial, Inc. | | 2,202 | 567,147 |
| Bank of New York Mellon Corp. | | 5,592 | 287,037 |
| Lazard Ltd. Class A | | 10,031 | 473,463 |
| LPL Financial | | 3,300 | 465,432 |
| | | | 1,793,079 |
| Consumer Finance - 4.6% | | | |
| Capital One Financial Corp. | | 2,371 | 383,391 |
| OneMain Holdings, Inc. | | 7,756 | 473,116 |
| SLM Corp. | | 22,642 | 426,349 |
| Synchrony Financial | | 9,130 | 429,293 |
| | | | 1,712,149 |
| Diversified Financial Services - 0.9% | | | |
| Voya Financial, Inc. | | 5,366 | 345,570 |
| Insurance - 6.4% | | | |
| American Financial Group, Inc. | | 3,806 | 481,421 |
| Arch Capital Group Ltd. (a) | | 12,159 | 474,201 |
| Assurant, Inc. | | 3,079 | 485,897 |
| Fairfax Financial Holdings Ltd. (sub. vtg.) | | 431 | 181,555 |
| Reinsurance Group of America, Inc. | | 2,283 | 251,541 |
| The Travelers Companies, Inc. | | 3,120 | 464,630 |
| | | | 2,339,245 |
|
| TOTAL FINANCIALS | | | 7,155,856 |
|
| HEALTH CARE - 7.3% | | | |
| Health Care Providers & Services - 5.3% | | | |
| Centene Corp. (a) | | 7,259 | 498,040 |
| Cigna Corp. | | 3,831 | 879,177 |
| Laboratory Corp. of America Holdings (a) | | 1,948 | 576,900 |
| | | | 1,954,117 |
| Pharmaceuticals - 2.0% | | | |
| Bristol-Myers Squibb Co. | | 5,773 | 391,814 |
| Jazz Pharmaceuticals PLC (a) | | 2,036 | 345,143 |
| | | | 736,957 |
|
| TOTAL HEALTH CARE | | | 2,691,074 |
|
| INDUSTRIALS - 19.3% | | | |
| Air Freight & Logistics - 1.9% | | | |
| FedEx Corp. | | 926 | 259,234 |
| XPO Logistics, Inc. (a) | | 3,149 | 436,735 |
| | | | 695,969 |
| Building Products - 2.7% | | | |
| Builders FirstSource, Inc. (a) | | 10,983 | 488,744 |
| Jeld-Wen Holding, Inc. (a) | | 18,472 | 489,139 |
| | | | 977,883 |
| Commercial Services & Supplies - 1.1% | | | |
| The Brink's Co. | | 5,243 | 403,501 |
| Construction & Engineering - 1.9% | | | |
| Fluor Corp. (a) | | 18,664 | 310,942 |
| Willscot Mobile Mini Holdings (a) | | 14,039 | 403,060 |
| | | | 714,002 |
| Machinery - 1.9% | | | |
| Allison Transmission Holdings, Inc. | | 9,273 | 370,085 |
| Crane Co. | | 3,353 | 326,012 |
| | | | 696,097 |
| Marine - 1.0% | | | |
| Kirby Corp. (a) | | 6,019 | 348,560 |
| Professional Services - 3.9% | | | |
| ASGN, Inc. (a) | | 3,173 | 320,885 |
| KBR, Inc. | | 7,166 | 277,324 |
| Manpower, Inc. | | 3,236 | 383,725 |
| Nielsen Holdings PLC | | 19,542 | 462,950 |
| | | | 1,444,884 |
| Road & Rail - 2.0% | | | |
| Ryder System, Inc. | | 3,437 | 261,728 |
| TFI International, Inc. (Canada) | | 4,271 | 478,108 |
| | | | 739,836 |
| Trading Companies & Distributors - 2.9% | | | |
| AerCap Holdings NV (a) | | 5,057 | 268,021 |
| Beacon Roofing Supply, Inc. (a) | | 8,142 | 435,434 |
| Univar, Inc. (a) | | 15,183 | 372,591 |
| | | | 1,076,046 |
|
| TOTAL INDUSTRIALS | | | 7,096,778 |
|
| INFORMATION TECHNOLOGY - 5.8% | | | |
| Electronic Equipment & Components - 1.4% | | | |
| Flex Ltd. (a) | | 27,569 | 495,415 |
| IT Services - 2.0% | | | |
| DXC Technology Co. (a) | | 10,844 | 433,543 |
| Unisys Corp. (a) | | 14,286 | 319,292 |
| | | | 752,835 |
| Software - 1.7% | | | |
| SS&C Technologies Holdings, Inc. | | 7,806 | 611,912 |
| Technology Hardware, Storage & Peripherals - 0.7% | | | |
| NCR Corp. (a) | | 6,166 | 273,770 |
|
| TOTAL INFORMATION TECHNOLOGY | | | 2,133,932 |
|
| MATERIALS - 8.3% | | | |
| Chemicals - 3.3% | | | |
| Axalta Coating Systems Ltd. (a) | | 13,877 | 417,698 |
| Olin Corp. | | 10,031 | 471,758 |
| Tronox Holdings PLC | | 17,346 | 319,687 |
| | | | 1,209,143 |
| Construction Materials - 1.0% | | | |
| Eagle Materials, Inc. | | 2,583 | 365,030 |
| Containers & Packaging - 3.0% | | | |
| Berry Global Group, Inc. (a) | | 6,139 | 394,676 |
| Crown Holdings, Inc. | | 3,877 | 386,770 |
| O-I Glass, Inc. (a) | | 21,082 | 311,803 |
| | | | 1,093,249 |
| Metals & Mining - 1.0% | | | |
| Arconic Corp. (a) | | 5,459 | 196,196 |
| Constellium NV (a) | | 10,287 | 194,116 |
| | | | 390,312 |
|
| TOTAL MATERIALS | | | 3,057,734 |
|
| REAL ESTATE - 9.3% | | | |
| Equity Real Estate Investment Trusts (REITs) - 9.3% | | | |
| American Tower Corp. | | 1,672 | 472,842 |
| Americold Realty Trust | | 16,690 | 648,407 |
| CubeSmart | | 16,848 | 836,672 |
| Equinix, Inc. | | 710 | 582,491 |
| Equity Lifestyle Properties, Inc. | | 10,383 | 870,095 |
| | | | 3,410,507 |
| Real Estate Management & Development - 0.0% | | | |
| Cushman & Wakefield PLC (a) | | 835 | 15,589 |
|
| TOTAL REAL ESTATE | | | 3,426,096 |
|
| UTILITIES - 8.4% | | | |
| Electric Utilities - 3.7% | | | |
| Edison International | | 10,806 | 588,927 |
| NRG Energy, Inc. | | 8,016 | 330,580 |
| PG&E Corp. (a) | | 50,182 | 441,100 |
| | | | 1,360,607 |
| Independent Power and Renewable Electricity Producers - 2.2% | | | |
| The AES Corp. | | 24,479 | 580,152 |
| Vistra Corp. | | 11,412 | 218,540 |
| | | | 798,692 |
| Multi-Utilities - 2.5% | | | |
| CenterPoint Energy, Inc. | | 17,052 | 434,144 |
| MDU Resources Group, Inc. | | 15,574 | 494,007 |
| | | | 928,151 |
|
| TOTAL UTILITIES | | | 3,087,450 |
|
| TOTAL COMMON STOCKS | | | |
| (Cost $28,030,139) | | | 36,766,516 |
| | | Principal Amount | Value |
|
| U.S. Treasury Obligations - 0.1% | | | |
| U.S. Treasury Bills, yield at date of purchase 0.04% to 0.05% 10/14/21 | | | |
| (Cost $49,995) | | 50,000 | 49,995 |
| | | Shares | Value |
|
| Money Market Funds - 0.4% | | | |
| Fidelity Cash Central Fund 0.06% (b) | | | |
| (Cost $128,221) | | 128,196 | 128,221 |
| TOTAL INVESTMENT IN SECURITIES - 100.4% | | | |
| (Cost $28,208,355) | | | 36,944,732 |
| NET OTHER ASSETS (LIABILITIES) - (0.4)% | | | (148,131) |
| NET ASSETS - 100% | | | $36,796,601 |
Legend
(a) Non-income producing
(b) Affiliated fund that is generally available only to investment companies and other accounts managed by Fidelity Investments. The rate quoted is the annualized seven-day yield of the fund at period end. A complete unaudited listing of the fund's holdings as of its most recent quarter end is available upon request. In addition, each Fidelity Central Fund's financial statements are available on the SEC's website or upon request.
Affiliated Central Funds
Information regarding fiscal year to date income earned by the Fund from investments in Fidelity Central Funds is as follows:
| Fund | Income earned |
| Fidelity Cash Central Fund | $235 |
| Total | $235 |
Amounts in the income column in the above table include any capital gain distributions from underlying funds, which are presented in the corresponding line-item in the Statement of Operations, if applicable.
Fiscal year to date information regarding the Fund's investments in Fidelity Central Funds, including the ownership percentage, is presented below.
| Fund | Value, beginning of period | Purchases | Sales Proceeds | Realized Gain/Loss | Change in Unrealized appreciation (depreciation) | Value, end of period | % ownership, end of period |
| Fidelity Cash Central Fund 0.06% | $256,574 | $10,229,364 | $10,357,718 | $1 | $-- | $128,221 | 0.0% |
| Total | $256,574 | $10,229,364 | $10,357,718 | $1 | $-- | $128,221 | |
Investment Valuation
The following is a summary of the inputs used, as of July 31, 2021, involving the Fund's assets and liabilities carried at fair value. The inputs or methodology used for valuing securities may not be an indication of the risk associated with investing in those securities. For more information on valuation inputs, and their aggregation into the levels used below, please refer to the Investment Valuation section in the accompanying Notes to Financial Statements.
| | Valuation Inputs at Reporting Date: |
| Description | Total | Level 1 | Level 2 | Level 3 |
| Investments in Securities: | | | | |
| Equities: | | | | |
| Communication Services | $939,507 | $939,507 | $-- | $-- |
| Consumer Discretionary | 3,430,489 | 3,430,489 | -- | -- |
| Consumer Staples | 1,829,619 | 1,829,619 | -- | -- |
| Energy | 1,917,981 | 1,917,981 | -- | -- |
| Financials | 7,155,856 | 7,155,856 | -- | -- |
| Health Care | 2,691,074 | 2,691,074 | -- | -- |
| Industrials | 7,096,778 | 7,096,778 | -- | -- |
| Information Technology | 2,133,932 | 2,133,932 | -- | -- |
| Materials | 3,057,734 | 3,057,734 | -- | -- |
| Real Estate | 3,426,096 | 3,426,096 | -- | -- |
| Utilities | 3,087,450 | 3,087,450 | -- | -- |
| U.S. Government and Government Agency Obligations | 49,995 | -- | 49,995 | -- |
| Money Market Funds | 128,221 | 128,221 | -- | -- |
| Total Investments in Securities: | $36,944,732 | $36,894,737 | $49,995 | $-- |
Other Information
Distribution of investments by country or territory of incorporation, as a percentage of Total Net Assets, is as follows (Unaudited):
| United States of America | 84.7% |
| Canada | 4.8% |
| Bermuda | 3.7% |
| United Kingdom | 2.8% |
| Ireland | 1.4% |
| Singapore | 1.4% |
| Others (Individually Less Than 1%) | 1.2% |
| | 100.0% |
See accompanying notes which are an integral part of the financial statements.
Financial Statements
Statement of Assets and Liabilities
| | | July 31, 2021 (Unaudited) |
| Assets | | |
Investment in securities, at value — See accompanying schedule:
Unaffiliated issuers (cost $28,080,134) | $36,816,511 | |
| Fidelity Central Funds (cost $128,221) | 128,221 | |
| Total Investment in Securities (cost $28,208,355) | | $36,944,732 |
| Foreign currency held at value (cost $142) | | 159 |
| Receivable for fund shares sold | | 20,875 |
| Dividends receivable | | 30,979 |
| Distributions receivable from Fidelity Central Funds | | 24 |
| Total assets | | 36,996,769 |
| Liabilities | | |
| Payable to custodian bank | $185,764 | |
| Payable for fund shares redeemed | 14,404 | |
| Total liabilities | | 200,168 |
| Net Assets | | $36,796,601 |
| Net Assets consist of: | | |
| Paid in capital | | $25,324,580 |
| Total accumulated earnings (loss) | | 11,472,021 |
| Net Assets | | $36,796,601 |
| Net Asset Value, offering price and redemption price per share ($36,796,601 ÷ 2,461,181 shares) | | $14.95 |
See accompanying notes which are an integral part of the financial statements.
Statement of Operations
| | | Six months ended July 31, 2021 (Unaudited) |
| Investment Income | | |
| Dividends | | $338,465 |
| Interest | | 20 |
| Income from Fidelity Central Funds | | 235 |
| Total income | | 338,720 |
| Expenses | | |
| Independent trustees' fees and expenses | $70 | |
| Total expenses | | 70 |
| Net investment income (loss) | | 338,650 |
| Realized and Unrealized Gain (Loss) | | |
| Net realized gain (loss) on: | | |
| Investment securities: | | |
| Unaffiliated issuers | 5,008,784 | |
| Fidelity Central Funds | 1 | |
| Foreign currency transactions | (32) | |
| Futures contracts | 36,910 | |
| Total net realized gain (loss) | | 5,045,663 |
| Change in net unrealized appreciation (depreciation) on: | | |
| Investment securities: | | |
| Unaffiliated issuers | 1,994,857 | |
| Assets and liabilities in foreign currencies | 2 | |
| Total change in net unrealized appreciation (depreciation) | | 1,994,859 |
| Net gain (loss) | | 7,040,522 |
| Net increase (decrease) in net assets resulting from operations | | $7,379,172 |
See accompanying notes which are an integral part of the financial statements.
Statement of Changes in Net Assets
| | Six months ended July 31, 2021 (Unaudited) | Year ended January 31, 2021 |
| Increase (Decrease) in Net Assets | | |
| Operations | | |
| Net investment income (loss) | $338,650 | $560,384 |
| Net realized gain (loss) | 5,045,663 | (2,383,756) |
| Change in net unrealized appreciation (depreciation) | 1,994,859 | 5,386,588 |
| Net increase (decrease) in net assets resulting from operations | 7,379,172 | 3,563,216 |
| Distributions to shareholders | – | (809,255) |
| Share transactions | | |
| Proceeds from sales of shares | 6,496,500 | 18,921,702 |
| Reinvestment of distributions | – | 809,255 |
| Cost of shares redeemed | (10,405,777) | (25,603,734) |
| Net increase (decrease) in net assets resulting from share transactions | (3,909,277) | (5,872,777) |
| Total increase (decrease) in net assets | 3,469,895 | (3,118,816) |
| Net Assets | | |
| Beginning of period | 33,326,706 | 36,445,522 |
| End of period | $36,796,601 | $33,326,706 |
| Other Information | | |
| Shares | | |
| Sold | 448,380 | 1,990,765 |
| Issued in reinvestment of distributions | – | 73,321 |
| Redeemed | (718,623) | (2,649,563) |
| Net increase (decrease) | (270,243) | (585,477) |
See accompanying notes which are an integral part of the financial statements.
Financial Highlights
Fidelity Flex Mid Cap Value Fund
| | Six months ended (Unaudited) July 31, | Years endedJanuary 31, | | | |
| | 2021 | 2021 | 2020 | 2019 | 2018 A |
| Selected Per–Share Data | | | | | |
| Net asset value, beginning of period | $12.20 | $10.99 | $9.51 | $11.14 | $10.00 |
| Income from Investment Operations | | | | | |
| Net investment income (loss)B | .13 | .19 | .18 | .20 | .17 |
| Net realized and unrealized gain (loss) | 2.62 | 1.29 | 1.37 | (1.18) | 1.10 |
| Total from investment operations | 2.75 | 1.48 | 1.55 | (.98) | 1.27 |
| Distributions from net investment income | – | (.20) | (.07) | (.21) | (.10) |
| Distributions from net realized gain | – | (.07) | – | (.44) | (.03) |
| Total distributions | – | (.27) | (.07) | (.65) | (.13) |
| Net asset value, end of period | $14.95 | $12.20 | $10.99 | $9.51 | $11.14 |
| Total ReturnC | 22.54% | 13.69% | 16.26% | (8.60)% | 12.72% |
| Ratios to Average Net AssetsD,E | | | | | |
| Expenses before reductionsF | - %G | -% | -% | -% | - %G |
| Expenses net of fee waivers, if anyF | - %G | -% | -% | -% | - %G |
| Expenses net of all reductionsF | - %G | -% | -% | -% | - %G |
| Net investment income (loss) | 1.83%G | 1.88% | 1.71% | 1.88% | 1.76%G |
| Supplemental Data | | | | | |
| Net assets, end of period (000 omitted) | $36,797 | $33,327 | $36,446 | $2,721 | $2,869 |
| Portfolio turnover rateH | 89%G | 119% | 89% | 218% | 137%G |
A For the period March 8, 2017 (commencement of operations) to January 31, 2018.
B Calculated based on average shares outstanding during the period.
C Total returns for periods of less than one year are not annualized.
D Fees and expenses of any underlying mutual funds or exchange-traded funds (ETFs) are not included in the Fund's expense ratio. The Fund indirectly bears its proportionate share of these expenses. For additional expense information related to investments in Fidelity Central Funds, please refer to the "Investments in Fidelity Central Funds" note found in the Notes to Financial Statements section of the most recent Annual or Semi-Annual report.
E Expense ratios reflect operating expenses of the class. Expenses before reductions do not reflect amounts reimbursed, waived, or reduced through arrangements with the investment advisor, brokerage services, or other offset arrangements, if applicable, and do not represent the amount paid by the class during periods when reimbursements, waivers or reductions occur.
F Amount represents less than .005%.
G Annualized
H Amount does not include the portfolio activity of any underlying mutual funds or exchange-traded funds (ETFs).
See accompanying notes which are an integral part of the financial statements.
Notes to Financial Statements (Unaudited)
For the period ended July 31, 2021
1. Organization.
Fidelity Flex Mid Cap Value Fund (the Fund) is a fund of Fidelity Devonshire Trust (the Trust) and is authorized to issue an unlimited number of shares. Share transactions on the Statement of Changes in Net Assets may contain exchanges between affiliated funds. The Trust is registered under the Investment Company Act of 1940, as amended (the 1940 Act), as an open-end management investment company organized as a Massachusetts business trust. The Fund is available only to certain fee-based accounts and advisory programs offered by Fidelity.
2. Investments in Fidelity Central Funds.
Funds may invest in Fidelity Central Funds, which are open-end investment companies generally available only to other investment companies and accounts managed by the investment adviser and its affiliates. The Schedule of Investments lists any Fidelity Central Funds held as an investment as of period end, but does not include the underlying holdings of each Fidelity Central Fund. An investing fund indirectly bears its proportionate share of the expenses of the underlying Fidelity Central Funds.
Based on its investment objective, each Fidelity Central Fund may invest or participate in various investment vehicles or strategies that are similar to those of the investing fund. These strategies are consistent with the investment objectives of the investing fund and may involve certain economic risks which may cause a decline in value of each of the Fidelity Central Funds and thus a decline in the value of the investing fund.
| Fidelity Central Fund | Investment Manager | Investment Objective | Investment Practices | Expense Ratio(a) |
| Fidelity Money Market Central Funds | Fidelity Management & Research Company LLC (FMR) | Each fund seeks to obtain a high level of current income consistent with the preservation of capital and liquidity. | Short-term Investments | Ranged from less than .005% to .01% |
(a) Expenses expressed as a percentage of average net assets and are as of each underlying Central Fund's most recent annual or semi-annual shareholder report.
A complete unaudited list of holdings for each Fidelity Central Fund is available upon request or at the Securities and Exchange Commission website at www.sec.gov. In addition, the financial statements of the Fidelity Central Funds which contain the significant accounting policies (including investment valuation policies) of those funds, and are not covered by the Report of Independent Registered Public Accounting Firm, are available on the Securities and Exchange Commission website or upon request.
3. Significant Accounting Policies.
The Fund is an investment company and applies the accounting and reporting guidance of the Financial Accounting Standards Board (FASB) Accounting Standards Codification Topic 946 Financial Services - Investment Companies. The financial statements have been prepared in conformity with accounting principles generally accepted in the United States of America (GAAP), which require management to make certain estimates and assumptions at the date of the financial statements. Actual results could differ from those estimates. Subsequent events, if any, through the date that the financial statements were issued have been evaluated in the preparation of the financial statements. The Fund's Schedule of Investments lists any underlying mutual funds or exchange-traded funds (ETFs) but does not include the underlying holdings of these funds. The following summarizes the significant accounting policies of the Fund:
Investment Valuation. Investments are valued as of 4:00 p.m. Eastern time on the last calendar day of the period. The Board of Trustees (the Board) has delegated the day to day responsibility for the valuation of the Fund's investments to the Fair Value Committee (the Committee) established by the Fund's investment adviser. In accordance with valuation policies and procedures approved by the Board, the Fund attempts to obtain prices from one or more third party pricing vendors or brokers to value its investments. When current market prices, quotations or currency exchange rates are not readily available or reliable, investments will be fair valued in good faith by the Committee, in accordance with procedures adopted by the Board. Factors used in determining fair value vary by investment type and may include market or investment specific events, changes in interest rates and credit quality. The frequency with which these procedures are used cannot be predicted and they may be utilized to a significant extent. The Committee oversees the Fund's valuation policies and procedures and reports to the Board on the Committee's activities and fair value determinations. The Board monitors the appropriateness of the procedures used in valuing the Fund's investments and ratifies the fair value determinations of the Committee.
The Fund categorizes the inputs to valuation techniques used to value its investments into a disclosure hierarchy consisting of three levels as shown below:
- Level 1 – quoted prices in active markets for identical investments
- Level 2 – other significant observable inputs (including quoted prices for similar investments, interest rates, prepayment speeds, etc.)
- Level 3 – unobservable inputs (including the Fund's own assumptions based on the best information available)
Valuation techniques used to value the Fund's investments by major category are as follows:
Equity securities, including restricted securities, for which market quotations are readily available, are valued at the last reported sale price or official closing price as reported by a third party pricing vendor on the primary market or exchange on which they are traded and are categorized as Level 1 in the hierarchy. In the event there were no sales during the day or closing prices are not available, securities are valued at the last quoted bid price or may be valued using the last available price and are generally categorized as Level 2 in the hierarchy. For foreign equity securities, when market or security specific events arise, comparisons to the valuation of American Depositary Receipts (ADRs), futures contracts, Exchange-Traded Funds (ETFs) and certain indexes as well as quoted prices for similar securities may be used and would be categorized as Level 2 in the hierarchy. For equity securities, including restricted securities, where observable inputs are limited, assumptions about market activity and risk are used and these securities may be categorized as Level 3 in the hierarchy.
Debt securities, including restricted securities, are valued based on evaluated prices received from third party pricing vendors or from brokers who make markets in such securities. U.S. government and government agency obligations are valued by pricing vendors who utilize matrix pricing which considers yield or price of bonds of comparable quality, coupon, maturity and type or by broker-supplied prices. When independent prices are unavailable or unreliable, debt securities may be valued utilizing pricing methodologies which consider similar factors that would be used by third party pricing vendors. Debt securities are generally categorized as Level 2 in the hierarchy but may be Level 3 depending on the circumstances.
Investments in open-end mutual funds, including the Fidelity Central Funds, are valued at their closing net asset value (NAV) each business day and are categorized as Level 1 in the hierarchy.
Changes in valuation techniques may result in transfers in or out of an assigned level within the disclosure hierarchy. The aggregate value of investments by input level as of July 31, 2021 is included at the end of the Fund's Schedule of Investments.
Foreign Currency. Certain Funds may use foreign currency contracts to facilitate transactions in foreign-denominated securities. Gains and losses from these transactions may arise from changes in the value of the foreign currency or if the counterparties do not perform under the contracts' terms.
Foreign-denominated assets, including investment securities, and liabilities are translated into U.S. dollars at the exchange rates at period end. Purchases and sales of investment securities, income and dividends received, and expenses denominated in foreign currencies are translated into U.S. dollars at the exchange rate in effect on the transaction date.
The effects of exchange rate fluctuations on investments are included with the net realized and unrealized gain (loss) on investment securities. Other foreign currency transactions resulting in realized and unrealized gain (loss) are disclosed separately.
Investment Transactions and Income. For financial reporting purposes, the Fund's investment holdings and NAV include trades executed through the end of the last business day of the period. The NAV per share for processing shareholder transactions is calculated as of the close of business of the New York Stock Exchange (NYSE), normally 4:00 p.m. Eastern time and includes trades executed through the end of the prior business day. Gains and losses on securities sold are determined on the basis of identified cost. Dividend income is recorded on the ex-dividend date, except for certain dividends from foreign securities where the ex-dividend date may have passed, which are recorded as soon as the Fund is informed of the ex-dividend date. Non-cash dividends included in dividend income, if any, are recorded at the fair market value of the securities received. Income and capital gain distributions from Fidelity Central Funds, if any, are recorded on the ex-dividend date. Certain distributions received by the Fund represent a return of capital or capital gain. The Fund determines the components of these distributions subsequent to the ex-dividend date, based upon receipt of tax filings or other correspondence relating to the underlying investment. These distributions are recorded as a reduction of cost of investments and/or as a realized gain. Interest income is accrued as earned and includes coupon interest and amortization of premium and accretion of discount on debt securities as applicable. Investment income is recorded net of foreign taxes withheld where recovery of such taxes is uncertain.
Expenses. Expenses directly attributable to a fund are charged to that fund. Expenses attributable to more than one fund are allocated among the respective funds on the basis of relative net assets or other appropriate methods. Expenses included in the accompanying financial statements reflect the expenses of that fund and do not include any expenses associated with any underlying mutual funds or exchange-traded funds. Although not included in a fund's expenses, a fund indirectly bears its proportionate share of these expenses through the net asset value of each underlying mutual fund or exchange-traded fund. Expense estimates are accrued in the period to which they relate and adjustments are made when actual amounts are known.
Income Tax Information and Distributions to Shareholders. Each year, the Fund intends to qualify as a regulated investment company under Subchapter M of the Internal Revenue Code, including distributing substantially all of its taxable income and realized gains. As a result, no provision for U.S. Federal income taxes is required. The Fund files a U.S. federal tax return, in addition to state and local tax returns as required. The Fund's federal income tax returns are subject to examination by the Internal Revenue Service (IRS) for a period of three fiscal years after they are filed. State and local tax returns may be subject to examination for an additional fiscal year depending on the jurisdiction. Foreign taxes are provided for based on the Fund's understanding of the tax rules and rates that exist in the foreign markets in which it invests.
Distributions are declared and recorded on the ex-dividend date. Income and capital gain distributions are determined in accordance with income tax regulations, which may differ from GAAP.
Capital accounts within the financial statements are adjusted for permanent book-tax differences. These adjustments have no impact on net assets or the results of operations. Capital accounts are not adjusted for temporary book-tax differences which will reverse in a subsequent period.
Book-tax differences are primarily due to capital loss carryforwards, futures contracts, foreign currency transactions, partnerships and losses deferred due to wash sales and excise tax regulations.
As of period end, the cost and unrealized appreciation (depreciation) in securities, and derivatives if applicable, for federal income tax purposes were as follows:
| Gross unrealized appreciation | $9,267,455 |
| Gross unrealized depreciation | (722,967) |
| Net unrealized appreciation (depreciation) | $8,544,488 |
| Tax cost | $28,400,244 |
Capital loss carryforwards are only available to offset future capital gains of the Fund to the extent provided by regulations and may be limited. The capital loss carryforward information presented below, including any applicable limitation, is estimated as of prior fiscal period end and is subject to adjustment.
| No expiration | |
| Short-term | $(2,277,305) |
| Total capital loss carryforward | $(2,277,305) |
4. Derivative Instruments.
Risk Exposures and the Use of Derivative Instruments. The Fund's investment objective allows the Fund to enter into various types of derivative contracts, including futures contracts. Derivatives are investments whose value is primarily derived from underlying assets, indices or reference rates and may be transacted on an exchange or over-the-counter (OTC). Derivatives may involve a future commitment to buy or sell a specified asset based on specified terms, to exchange future cash flows at periodic intervals based on a notional principal amount, or for one party to make one or more payments upon the occurrence of specified events in exchange for periodic payments from the other party.
The Fund used derivatives to increase returns and to manage exposure to certain risks as defined below. The success of any strategy involving derivatives depends on analysis of numerous economic factors, and if the strategies for investment do not work as intended, the Fund may not achieve its objectives.
The Fund's use of derivatives increased or decreased its exposure to the following risk:
| Equity Risk | Equity risk relates to the fluctuations in the value of financial instruments as a result of changes in market prices (other than those arising from interest rate risk or foreign exchange risk), whether caused by factors specific to an individual investment, its issuer, or all factors affecting all instruments traded in a market or market segment.
|
The Fund is also exposed to additional risks from investing in derivatives, such as liquidity risk and counterparty credit risk. Liquidity risk is the risk that the Fund will be unable to close out the derivative in the open market in a timely manner. Counterparty credit risk is the risk that the counterparty will not be able to fulfill its obligation to the Fund. Counterparty credit risk related to exchange-traded futures contracts may be mitigated by the protection provided by the exchange on which they trade.
Investing in derivatives may involve greater risks than investing in the underlying assets directly and, to varying degrees, may involve risk of loss in excess of any initial investment and collateral received and amounts recognized in the Statement of Assets and Liabilities. In addition, there may be the risk that the change in value of the derivative contract does not correspond to the change in value of the underlying instrument.
Futures Contracts. A futures contract is an agreement between two parties to buy or sell a specified underlying instrument for a fixed price at a specified future date. The Fund used futures contracts to manage its exposure to the stock market.
Upon entering into a futures contract, a fund is required to deposit either cash or securities (initial margin) with a clearing broker in an amount equal to a certain percentage of the face value of the contract. Futures contracts are marked-to-market daily and subsequent daily payments (variation margin) are made or received by a fund depending on the daily fluctuations in the value of the futures contracts and are recorded as unrealized appreciation or (depreciation). This receivable and/or payable, if any, is included in daily variation margin on futures contracts in the Statement of Assets and Liabilities. Realized gain or (loss) is recorded upon the expiration or closing of a futures contract. The net realized gain (loss) and change in net unrealized appreciation (depreciation) on futures contracts during the period is presented in the Statement of Operations.
Any open futures contracts at period end are presented in the Schedule of Investments under the caption "Futures Contracts". The notional amount at value reflects each contract's exposure to the underlying instrument or index at period end and is representative of volume of activity during the period.
5. Purchases and Sales of Investments.
Purchases and sales of securities, other than short-term securities and in-kind transactions, as applicable, are noted in the table below.
| | Purchases ($) | Sales ($) |
| Fidelity Flex Mid Cap Value Fund | 15,819,217 | 18,973,004 |
6. Fees and Other Transactions with Affiliates.
Management Fee. Fidelity Management & Research Company LLC (the investment adviser) and its affiliates provide the Fund with investment management related services and the Fund does not pay any fees for these services. Under the management contract, the investment adviser or an affiliate pays all other expenses of the Fund, excluding fees and expenses of the independent Trustees, and certain miscellaneous expenses such as proxy and shareholder meeting expenses.
Brokerage Commissions. A portion of portfolio transactions were placed with brokerage firms which are affiliates of the investment adviser. Brokerage commissions are included in net realized gain (loss) and change in net unrealized appreciation (depreciation) in the Statement of Operations. The commissions paid to these affiliated firms were as follows:
| | Amount |
| Fidelity Flex Mid Cap Value Fund | $319 |
Interfund Trades. Funds may purchase from or sell securities to other Fidelity Funds under procedures adopted by the Board. The procedures have been designed to ensure these interfund trades are executed in accordance with Rule 17a-7 of the 1940 Act. Any interfund trades are included within the respective purchases and sales amounts shown in the Purchases and Sales of Investments note and are noted in the table below.
| | Purchases ($) | Sales ($) |
| Fidelity Flex Mid Cap Value Fund | 329,531 | 525,962 |
7. Committed Line of Credit.
Certain Funds participate with other funds managed by the investment adviser or an affiliate in a $4.25 billion credit facility (the "line of credit") to be utilized for temporary or emergency purposes to fund shareholder redemptions or for other short-term liquidity purposes. The commitment fees on the pro-rata portion of the line of credit are borne by the investment adviser. During the period, there were no borrowings on this line of credit.
8. Other.
Fund's organizational documents provide former and current trustees and officers with a limited indemnification against liabilities arising in connection with the performance of their duties to the fund. In the normal course of business, the fund may also enter into contracts that provide general indemnifications. The fund's maximum exposure under these arrangements is unknown as this would be dependent on future claims that may be made against the fund. The risk of material loss from such claims is considered remote.
9. Coronavirus (COVID-19) Pandemic.
An outbreak of COVID-19 first detected in China during December 2019 has since spread globally and was declared a pandemic by the World Health Organization during March 2020. Developments that disrupt global economies and financial markets, such as the COVID-19 pandemic, may magnify factors that affect the Fund's performance.
Shareholder Expense Example
As a shareholder, you incur two types of costs: (1) transaction costs, which may include sales charges (loads) on purchase payments or redemption proceeds, as applicable and (2) ongoing costs, which generally include management fees, distribution and/or service (12b-1) fees and other Fund expenses. This Example is intended to help you understand your ongoing costs (in dollars) of investing in a fund and to compare these costs with the ongoing costs of investing in other mutual funds.
The Example is based on an investment of $1,000 invested at the beginning of the period and held for the entire period (February 1, 2021 to July 31, 2021).
Actual Expenses
The first line of the accompanying table provides information about actual account values and actual expenses. You may use the information in this line, together with the amount you invested, to estimate the expenses that you paid over the period. Simply divide your account value by $1,000.00 (for example, an $8,600 account value divided by $1,000.00 = 8.6), then multiply the result by the number in the first line for a class/Fund under the heading entitled "Expenses Paid During Period" to estimate the expenses you paid on your account during this period. If any fund is a shareholder of any underlying mutual funds or exchange-traded funds (ETFs) (the Underlying Funds), such fund indirectly bears its proportional share of the expenses of the Underlying Funds in addition to the direct expenses incurred presented in the table. These fees and expenses are not included in the annualized expense ratio used to calculate the expense estimate in the table below.
Hypothetical Example for Comparison Purposes
The second line of the accompanying table provides information about hypothetical account values and hypothetical expenses based on the actual expense ratio and an assumed rate of return of 5% per year before expenses, which is not the actual return. The hypothetical account values and expenses may not be used to estimate the actual ending account balance or expenses you paid for the period. You may use this information to compare the ongoing costs of investing in the Fund and other funds. To do so, compare this 5% hypothetical example with the 5% hypothetical examples that appear in the shareholder reports of the other funds. If any fund is a shareholder of any Underlying Funds, such fund indirectly bears its proportional share of the expenses of the Underlying Funds in addition to the direct expenses as presented in the table. These fees and expenses are not included in the annualized expense ratio used to calculate the expense estimate in the table below.
Please note that the expenses shown in the table are meant to highlight your ongoing costs only and do not reflect any transaction costs. Therefore, the second line of the table is useful in comparing ongoing costs only, and will not help you determine the relative total costs of owning different funds.
| | Annualized Expense Ratio-A | Beginning
Account Value
February 1, 2021 | Ending
Account Value
July 31, 2021 | Expenses Paid
During Period-B
February 1, 2021
to July 31, 2021 |
| Fidelity Flex Mid Cap Value Fund | - %-C | | | |
| Actual | | $1,000.00 | $1,225.40 | $--D |
| Hypothetical-E | | $1,000.00 | $1,024.79 | $--D |
A Annualized expense ratio reflects expenses net of applicable fee waivers.
B Expenses are equal to the annualized expense ratio, multiplied by the average account value over the period, multiplied by 181/ 365 (to reflect the one-half year period). The fees and expenses of any Underlying Funds are not included in each annualized expense ratio.
C Amount represents less than .005%.
D Amount represents less than $.005.
E 5% return per year before expenses
Board Approval of Investment Advisory Contracts and Management Fees
Fidelity Flex Mid Cap Value Fund
Each year, the Board of Trustees, including the Independent Trustees (together, the Board), votes on the renewal of the management contract with Fidelity Management & Research Company LLC (FMR) and the sub-advisory agreements (together, the Advisory Contracts) for the fund. FMR and the sub-advisers are referred to herein as the Investment Advisers. The Board, assisted by the advice of fund counsel and Independent Trustees' counsel, requests and considers a broad range of information relevant to the renewal of the Advisory Contracts throughout the year.
The Board meets regularly and, at each of its meetings, covers an extensive agenda of topics and materials and considers factors that are relevant to its annual consideration of the renewal of the fund's Advisory Contracts, including the services and support provided to the fund and its shareholders. The Board has established various standing committees (Committees), each composed of and chaired by Independent Trustees with varying backgrounds, to which the Board has assigned specific subject matter responsibilities in order to enhance effective decision-making by the Board. The Board, acting directly and through its Committees, requests and receives information concerning the annual consideration of the renewal of the fund's Advisory Contracts. The Board also meets as needed to review matters specifically related to the Board's annual consideration of the renewal of the Advisory Contracts. Members of the Board may also meet with trustees of other Fidelity funds through joint ad hoc committees to discuss certain matters relevant to all of the Fidelity funds.
At its May 2021 meeting, the Board unanimously determined to renew the fund's Advisory Contracts. In considering whether to renew the Advisory Contracts for the fund, the Board considered all factors it believed relevant and reached a determination, with the assistance of fund counsel and Independent Trustees' counsel and through the exercise of its business judgment, that the renewal of the Advisory Contracts was in the best interests of the fund and its shareholders and the fact that no fee is payable under the management contract was fair and reasonable.
Nature, Extent, and Quality of Services Provided. The Board considered Fidelity's staffing as it relates to the fund, including the backgrounds of investment personnel of Fidelity, and also considered the fund's investment objective, strategies, and related investment philosophy. The Independent Trustees also had discussions with senior management of Fidelity's investment operations and investment groups. The Board considered the structure of the investment personnel compensation program and whether this structure provides appropriate incentives to act in the best interests of the fund. Additionally, the Board considered the portfolio managers' investments, if any, in the funds that they manage.
Resources Dedicated to Investment Management and Support Services. The Board and the Fund Oversight and Research Committees reviewed the general qualifications and capabilities of Fidelity's investment staff, including its size, education, experience, and resources, as well as Fidelity's approach to recruiting, training, managing, and compensating investment personnel. The Board noted that Fidelity has continued to increase the resources devoted to non-U.S. offices, including expansion of Fidelity's global investment organization. The Board also noted that Fidelity's analysts have extensive resources, tools and capabilities that allow them to conduct sophisticated quantitative and fundamental analysis, as well as credit analysis of issuers, counterparties and guarantors. Further, the Board considered that Fidelity's investment professionals have sufficient access to global information and data so as to provide competitive investment results over time, and that those professionals also have access to sophisticated tools that permit them to assess portfolio construction and risk and performance attribution characteristics continuously, as well as to transmit new information and research conclusions rapidly around the world. Additionally, in its deliberations, the Board considered Fidelity's trading, risk management, compliance, and technology and operations capabilities and resources, which are integral parts of the investment management process. The Board also considered Fidelity's investments in business continuity planning, and its success in continuously providing services to the fund notwithstanding the severe disruptions caused by the COVID-19 pandemic.
Shareholder and Administrative Services. The Board considered (i) the nature, extent, quality, and cost of advisory, administrative, and shareholder services performed by the Investment Advisers and their affiliates under the Advisory Contracts and under separate agreements covering transfer agency, pricing and bookkeeping, and securities lending services for the fund; (ii) the nature and extent of the supervision of third party service providers, principally custodians, subcustodians, and pricing vendors; and (iii) the resources devoted to, and the record of compliance with, the fund's compliance policies and procedures. The Board also reviewed the allocation of fund brokerage, including allocations to brokers affiliated with the Investment Advisers, the use of brokerage commissions to pay fund expenses, and the use of "soft" commission dollars to pay for research services.
The Board noted that the growth of fund assets over time across the complex allows Fidelity to reinvest in the development of services designed to enhance the value and convenience of the Fidelity funds as investment vehicles. These services include 24-hour access to account information and market information over the Internet and through telephone representatives, investor education materials and asset allocation tools, and the expanded availability of Fidelity Investor Centers.
Investment in a Large Fund Family. The Board considered the benefits to shareholders of investing in a Fidelity fund, including the benefits of investing in a fund that is part of a large family of funds offering a variety of investment disciplines and providing a large variety of mutual fund investor services. The Board noted that Fidelity had taken, or had made recommendations that resulted in the Fidelity funds taking, a number of actions over the previous year that benefited particular funds, including: (i) continuing to dedicate additional resources to Fidelity's investment research process, which includes meetings with management of issuers of securities in which the funds invest, and to the support of the senior management team that oversees asset management; (ii) continuing efforts to enhance Fidelity's global research capabilities; (iii) launching new funds and ETFs with innovative structures, strategies and pricing and making other enhancements to meet client needs; (iv) launching new share classes of existing funds; (v) eliminating purchase minimums and broadening eligibility requirements for certain funds and share classes; (vi) approving the reduction in the holding period for the Class C to Class A conversion policy; (vii) reducing management fees and total expenses for certain target date funds and classes and index funds; (viii) lowering expenses for certain existing funds and classes by implementing or lowering expense caps; (ix) rationalizing product lines and gaining increased efficiencies from fund mergers, liquidations, and share class consolidations; (x) continuing to develop, acquire and implement systems and technology to improve services to the funds and shareholders, strengthen information security, and increase efficiency; and (xi) continuing to implement enhancements to further strengthen Fidelity's product line to increase investors' probability of success in achieving their investment goals, including retirement income goals.
Investment Performance. The Board considered whether the fund has operated in accordance with its investment objective, as well as its record of compliance with its investment restrictions. The Board reviewed the fund's absolute investment performance, as well as the fund's relative investment performance. The Board did not consider performance to be a material factor in its decision to renew the fund's Advisory Contracts, as the fund is not publicly offered as a stand-alone investment product. In this regard, the Board noted that the fund is available exclusively to certain fee-based accounts and advisor programs offered by Fidelity, including certain employer-sponsored plans and discretionary investment programs.
Based on its review, the Board concluded that the nature, extent, and quality of services provided to the fund under the Advisory Contracts should continue to benefit the shareholders of the fund.
Competitiveness of Management Fee and Total Expense Ratio. The Board noted that the fund is available exclusively through certain Fidelity fee-based accounts and advisory programs. The Board considered that the fund does not pay FMR a management fee for investment advisory services, but that FMR is indirectly compensated for its services out of Fidelity fee-based account and advisory program fees. The Board also noted that FMR or an affiliate undertakes to pay all operating expenses of the fund, except Independent Trustee fees and expenses, proxy and shareholder meeting expenses, interest, taxes, and extraordinary expenses (such as litigation expenses). The Board further noted that the fund pays its non-operating expenses, including brokerage commissions and fees and expenses associated with the fund's securities lending program, if applicable.
Based on its review, the Board considered that the fund does not pay a management fee and concluded that the total expense ratio of the fund was reasonable in light of the services that the fund and its shareholders receive and the other factors considered.
Costs of the Services and Profitability. The Board considered the level of Fidelity's profits in respect of all the Fidelity funds.
A public accounting firm has been engaged annually by the Board as part of the Board's assessment of Fidelity's profitability analysis. The engagement includes the review and assessment of the methodologies used by Fidelity in determining the revenues and expenses attributable to Fidelity's mutual fund business, and completion of agreed-upon procedures in respect of the mathematical accuracy of certain fund profitability information and its conformity to established allocation methodologies. After considering the reports issued under the engagement and information provided by Fidelity, the Board concluded that while other allocation methods may also be reasonable, Fidelity's profitability methodologies are reasonable in all material respects.
The Board also reviewed Fidelity's non-fund businesses and potential indirect benefits such businesses may have received as a result of their association with Fidelity's mutual fund business (i.e., fall-out benefits) as well as cases where Fidelity's affiliates may benefit from the funds' business. The Board considered areas where potential indirect benefits to the Fidelity funds from their relationships with Fidelity may exist. The Board also considered that in 2019 a joint ad hoc committee created by it and the boards of other Fidelity funds evaluated potential fall-out benefits (PFOB Committee). The Board noted that it considered the PFOB Committee's findings in connection with its consideration of the renewal of the Advisory Contracts.
The Board concluded that the costs of the services provided by and the profits realized by Fidelity in connection with the operation of the fund were not relevant to the renewal of the Advisory Contracts because the fund pays no advisory fees and FMR or an affiliate bears all expenses of the fund with limited exceptions.
Economies of Scale. The Board concluded that because the fund pays no advisory fees and FMR or an affiliate bears all expenses of the fund with limited exceptions, the realization of economies of scale was not a material factor in the Board's decision to renew the fund's Advisory Contracts.
Additional Information Requested by the Board. In order to develop fully the factual basis for consideration of the Fidelity funds' advisory contracts, the Board requested and received additional information on certain topics, including: (i) fund flow and performance trends, in particular the underperformance of certain funds and strategies, and Fidelity's long-term strategies for certain funds; (ii) consideration of expanding the use of performance fees for additional funds; (iii) Fidelity's pricing philosophy compared to competitors; (iv) metrics for evaluating index fund and ETF performance and information about ETF trading characteristics; (v) the methodology with respect to evaluating competitive fund data and peer group classifications and fee and expense comparisons; (vi) the expense structures for different funds and classes and information about the differences between various expense structures; (vii) group fee breakpoints; (viii) information regarding other accounts managed by Fidelity and sub-advisory arrangements; and (ix) Fidelity's philosophies and strategies for evaluating funds and classes with lower or declining asset levels.
Based on its evaluation of all of the conclusions noted above, and after considering all factors it believed relevant, the Board concluded that the advisory fee arrangements are fair and reasonable, and that the fund's Advisory Contracts should be renewed.
Liquidity Risk Management Program
The Securities and Exchange Commission adopted Rule 22e-4 under the Investment Company Act of 1940 (the Liquidity Rule) to promote effective liquidity risk management throughout the open-end investment company industry, thereby reducing the risk that funds will be unable to meet their redemption obligations and mitigating dilution of the interests of fund shareholders.
The Fund has adopted and implemented a liquidity risk management program pursuant to the Liquidity Rule (the Program) effective December 1, 2018. The Program is reasonably designed to assess and manage the Fund’s liquidity risk and to comply with the requirements of the Liquidity Rule. The Fund’s Board of Trustees (the Board) has designated the Fund’s investment adviser as administrator of the Program. The Fidelity advisers have established a Liquidity Risk Management Committee (the LRM Committee) to manage the Program for each of the Fidelity Funds. The LRM Committee monitors the adequacy and effectiveness of implementation of the Program and on a periodic basis assesses each Fund’s liquidity risk based on a variety of factors including (1) the Fund’s investment strategy, (2) portfolio liquidity and cash flow projections during normal and reasonably foreseeable stressed conditions, (3) shareholder redemptions, (4) borrowings and other funding sources and (5) in the case of exchange-traded funds, certain additional factors including the effect of the Fund’s prices and spreads, market participants, and basket compositions on the overall liquidity of the Fund’s portfolio, as applicable.
In accordance with the Program, each of the Fund’s portfolio investments is classified into one of four liquidity categories described below based on a determination of a reasonable expectation for how long it would take to convert the investment to cash (or sell or dispose of the investment) without significantly changing its market value.
- Highly liquid investments – cash or convertible to cash within three business days or less
- Moderately liquid investments – convertible to cash in three to seven calendar days
- Less liquid investments – can be sold or disposed of, but not settled, within seven calendar days
- Illiquid investments – cannot be sold or disposed of within seven calendar days
Liquidity classification determinations take into account a variety of factors including various market, trading and investment-specific considerations, as well as market depth, and generally utilize analysis from a third-party liquidity metrics service.
The Liquidity Rule places a 15% limit on a fund’s illiquid investments and requires funds that do not primarily hold assets that are highly liquid investments to determine and maintain a minimum percentage of the fund’s net assets to be invested in highly liquid investments (highly liquid investment minimum or HLIM). The Program includes provisions reasonably designed to comply with the 15% limit on illiquid investments and for determining, periodically reviewing and complying with the HLIM requirement as applicable.
At a recent meeting of the Fund’s Board of Trustees, the LRM Committee provided a written report to the Board pertaining to the operation, adequacy, and effectiveness of implementation of the Program for the annual period from December 1, 2019 through November 30, 2020. The report concluded that the Program has been implemented and is operating effectively and is reasonably designed to assess and manage the Fund’s liquidity risk.
ZMV-SANN-0921
1.9881566.104
Fidelity® Mid Cap Value K6 Fund
Semi-Annual Report
July 31, 2021
Contents
To view a fund's proxy voting guidelines and proxy voting record for the 12-month period ended June 30, visit http://www.fidelity.com/proxyvotingresults or visit the Securities and Exchange Commission's (SEC) web site at http://www.sec.gov.
You may also call 1-800-835-5092 to request a free copy of the proxy voting guidelines.
Standard & Poor's, S&P and S&P 500 are registered service marks of The McGraw-Hill Companies, Inc. and have been licensed for use by Fidelity Distributors Corporation.
Other third-party marks appearing herein are the property of their respective owners.
All other marks appearing herein are registered or unregistered trademarks or service marks of FMR LLC or an affiliated company. © 2021 FMR LLC. All rights reserved.
This report and the financial statements contained herein are submitted for the general information of the shareholders of the Fund. This report is not authorized for distribution to prospective investors in the Fund unless preceded or accompanied by an effective prospectus.
A fund files its complete schedule of portfolio holdings with the SEC for the first and third quarters of each fiscal year on Form N-PORT. Forms N-PORT are available on the SEC’s web site at http://www.sec.gov. A fund's Forms N-PORT may be reviewed and copied at the SEC’s Public Reference Room in Washington, DC. Information regarding the operation of the SEC's Public Reference Room may be obtained by calling 1-800-SEC-0330.
For a complete list of a fund's portfolio holdings, view the most recent holdings listing, semiannual report, or annual report on Fidelity's web site at http://www.fidelity.com, http://www.institutional.fidelity.com, or http://www.401k.com, as applicable.
NOT FDIC INSURED •MAY LOSE VALUE •NO BANK GUARANTEE
Neither the Fund nor Fidelity Distributors Corporation is a bank.
Note to Shareholders:
Early in 2020, the outbreak and spread of a new coronavirus emerged as a public health emergency that had a major influence on financial markets, primarily based on its impact on the global economy and the outlook for corporate earnings. The virus causes a respiratory disease known as COVID-19. On March 11, 2020 the World Health Organization declared the COVID-19 outbreak a pandemic, citing sustained risk of further global spread.
In the weeks following, as the crisis worsened, we witnessed an escalating human tragedy with wide-scale social and economic consequences from coronavirus-containment measures. The outbreak of COVID-19 prompted a number of measures to limit the spread, including travel and border restrictions, quarantines, and restrictions on large gatherings. In turn, these resulted in lower consumer activity, diminished demand for a wide range of products and services, disruption in manufacturing and supply chains, and – given the wide variability in outcomes regarding the outbreak – significant market uncertainty and volatility. Amid the turmoil, global governments and central banks took unprecedented action to help support consumers, businesses, and the broader economies, and to limit disruption to financial systems.
The situation continues to unfold, and the extent and duration of its impact on financial markets and the economy remain highly uncertain. Extreme events such as the coronavirus crisis are “exogenous shocks” that can have significant adverse effects on mutual funds and their investments. Although multiple asset classes may be affected by market disruption, the duration and impact may not be the same for all types of assets.
Fidelity is committed to helping you stay informed amid news about COVID-19 and during increased market volatility, and we’re taking extra steps to be responsive to customer needs. We encourage you to visit our websites, where we offer ongoing updates, commentary, and analysis on the markets and our funds.
Investment Summary (Unaudited)
Top Ten Stocks as of July 31, 2021
| | % of fund's net assets |
| CBRE Group, Inc. | 6.0 |
| Reliance Steel & Aluminum Co. | 5.1 |
| Jones Lang LaSalle, Inc. | 4.6 |
| Synchrony Financial | 4.4 |
| Best Buy Co., Inc. | 4.1 |
| Williams-Sonoma, Inc. | 3.6 |
| Interpublic Group of Companies, Inc. | 3.0 |
| Amdocs Ltd. | 2.7 |
| MDU Resources Group, Inc. | 2.7 |
| NRG Energy, Inc. | 2.3 |
| | 38.5 |
Top Five Market Sectors as of July 31, 2021
| | % of fund's net assets |
| Industrials | 18.3 |
| Financials | 15.1 |
| Real Estate | 12.3 |
| Consumer Discretionary | 12.3 |
| Utilities | 8.3 |
Asset Allocation (% of fund's net assets)
| As of July 31, 2021* |
| | Stocks | 99.6% |
| | Short-Term Investments and Net Other Assets (Liabilities) | 0.4% |

* Foreign investments - 7.3%
Schedule of Investments July 31, 2021 (Unaudited)
Showing Percentage of Net Assets
| Common Stocks - 99.6% | | | |
| | | Shares | Value |
| COMMUNICATION SERVICES - 4.4% | | | |
| Entertainment - 1.0% | | | |
| Electronic Arts, Inc. | | 2,535 | $364,939 |
| Media - 3.4% | | | |
| DISH Network Corp. Class A (a) | | 1,800 | 75,402 |
| Fox Corp. Class A | | 2,400 | 85,584 |
| Interpublic Group of Companies, Inc. | | 30,049 | 1,062,533 |
| | | | 1,223,519 |
|
| TOTAL COMMUNICATION SERVICES | | | 1,588,458 |
|
| CONSUMER DISCRETIONARY - 12.3% | | | |
| Distributors - 0.6% | | | |
| LKQ Corp. (a) | | 4,000 | 203,000 |
| Household Durables - 2.6% | | | |
| Garmin Ltd. | | 1,600 | 251,520 |
| Lennar Corp. Class A | | 2,200 | 231,330 |
| PulteGroup, Inc. | | 6,277 | 344,419 |
| Whirlpool Corp. | | 467 | 103,459 |
| | | | 930,728 |
| Multiline Retail - 0.5% | | | |
| Dollar Tree, Inc. (a) | | 1,700 | 169,643 |
| Specialty Retail - 8.6% | | | |
| Best Buy Co., Inc. | | 13,210 | 1,484,144 |
| Dick's Sporting Goods, Inc. | | 1,700 | 177,038 |
| Lowe's Companies, Inc. | | 700 | 134,883 |
| Williams-Sonoma, Inc. | | 8,428 | 1,278,528 |
| | | | 3,074,593 |
|
| TOTAL CONSUMER DISCRETIONARY | | | 4,377,964 |
|
| CONSUMER STAPLES - 4.0% | | | |
| Food & Staples Retailing - 0.7% | | | |
| Kroger Co. | | 5,705 | 232,194 |
| Food Products - 3.3% | | | |
| Ingredion, Inc. | | 6,850 | 601,499 |
| The J.M. Smucker Co. | | 4,428 | 580,555 |
| | | | 1,182,054 |
|
| TOTAL CONSUMER STAPLES | | | 1,414,248 |
|
| ENERGY - 2.9% | | | |
| Energy Equipment & Services - 2.0% | | | |
| Baker Hughes Co. Class A | | 33,414 | 709,713 |
| Oil, Gas & Consumable Fuels - 0.9% | | | |
| Antero Midstream GP LP | | 2,100 | 19,950 |
| Black Stone Minerals LP | | 600 | 6,390 |
| Kinder Morgan, Inc. | | 5,100 | 88,638 |
| Sunoco Logistics Partners, LP | | 700 | 26,607 |
| Targa Resources Corp. | | 2,100 | 88,431 |
| Teekay LNG Partners LP | | 3,900 | 56,511 |
| World Fuel Services Corp. | | 1,158 | 39,905 |
| | | | 326,432 |
|
| TOTAL ENERGY | | | 1,036,145 |
|
| FINANCIALS - 15.1% | | | |
| Banks - 2.9% | | | |
| M&T Bank Corp. | | 5,819 | 778,873 |
| Popular, Inc. | | 3,700 | 269,212 |
| | | | 1,048,085 |
| Capital Markets - 2.0% | | | |
| Federated Hermes, Inc. | | 5,628 | 182,572 |
| State Street Corp. | | 6,237 | 543,492 |
| | | | 726,064 |
| Consumer Finance - 4.4% | | | |
| Synchrony Financial | | 33,527 | 1,576,440 |
| Insurance - 5.8% | | | |
| Allstate Corp. | | 2,758 | 358,678 |
| American National Group, Inc. | | 95 | 15,673 |
| Hartford Financial Services Group, Inc. | | 7,428 | 472,569 |
| MetLife, Inc. | | 11,190 | 645,663 |
| Old Republic International Corp. | | 22,578 | 556,773 |
| | | | 2,049,356 |
|
| TOTAL FINANCIALS | | | 5,399,945 |
|
| HEALTH CARE - 7.1% | | | |
| Biotechnology - 1.3% | | | |
| Amgen, Inc. | | 779 | 188,160 |
| Regeneron Pharmaceuticals, Inc. (a) | | 400 | 229,844 |
| United Therapeutics Corp. (a) | | 277 | 50,395 |
| | | | 468,399 |
| Health Care Equipment & Supplies - 0.6% | | | |
| Hologic, Inc. (a) | | 3,100 | 232,624 |
| Health Care Providers & Services - 2.7% | | | |
| Cigna Corp. | | 900 | 206,541 |
| Quest Diagnostics, Inc. | | 1,300 | 184,340 |
| Universal Health Services, Inc. Class B | | 3,598 | 577,155 |
| | | | 968,036 |
| Pharmaceuticals - 2.5% | | | |
| AstraZeneca PLC sponsored ADR | | 3,777 | 216,195 |
| Jazz Pharmaceuticals PLC (a) | | 3,891 | 659,602 |
| | | | 875,797 |
|
| TOTAL HEALTH CARE | | | 2,544,856 |
|
| INDUSTRIALS - 18.3% | | | |
| Aerospace & Defense - 0.4% | | | |
| Huntington Ingalls Industries, Inc. | | 700 | 143,591 |
| Building Products - 1.1% | | | |
| Fortune Brands Home & Security, Inc. | | 2,378 | 231,784 |
| UFP Industries, Inc. | | 2,345 | 174,140 |
| | | | 405,924 |
| Construction & Engineering - 1.5% | | | |
| EMCOR Group, Inc. | | 4,504 | 548,632 |
| Electrical Equipment - 4.1% | | | |
| Acuity Brands, Inc. | | 4,206 | 737,648 |
| Encore Wire Corp. | | 2,340 | 183,526 |
| Hubbell, Inc. Class B | | 2,626 | 526,408 |
| | | | 1,447,582 |
| Machinery - 6.0% | | | |
| Allison Transmission Holdings, Inc. | | 14,073 | 561,653 |
| Crane Co. | | 6,789 | 660,094 |
| Dover Corp. | | 2,000 | 334,240 |
| ITT, Inc. | | 3,274 | 320,557 |
| Mueller Industries, Inc. | | 4,404 | 191,134 |
| Timken Co. | | 1,000 | 79,500 |
| | | | 2,147,178 |
| Professional Services - 3.2% | | | |
| CACI International, Inc. Class A (a) | | 1,200 | 320,352 |
| FTI Consulting, Inc. (a) | | 700 | 101,990 |
| Manpower, Inc. | | 6,075 | 720,374 |
| | | | 1,142,716 |
| Road & Rail - 1.1% | | | |
| Knight-Swift Transportation Holdings, Inc. Class A | | 5,200 | 258,388 |
| Ryder System, Inc. | | 1,100 | 83,765 |
| Werner Enterprises, Inc. | | 1,100 | 50,281 |
| | | | 392,434 |
| Trading Companies & Distributors - 0.9% | | | |
| Boise Cascade Co. | | 500 | 25,575 |
| MSC Industrial Direct Co., Inc. Class A | | 3,174 | 283,026 |
| | | | 308,601 |
|
| TOTAL INDUSTRIALS | | | 6,536,658 |
|
| INFORMATION TECHNOLOGY - 8.3% | | | |
| Communications Equipment - 0.3% | | | |
| Juniper Networks, Inc. | | 4,027 | 113,320 |
| Electronic Equipment & Components - 2.3% | | | |
| Avnet, Inc. | | 4,032 | 166,602 |
| CDW Corp. | | 500 | 91,675 |
| Sanmina Corp. (a) | | 3,093 | 118,833 |
| SYNNEX Corp. | | 3,560 | 425,562 |
| | | | 802,672 |
| IT Services - 3.3% | | | |
| Accenture PLC Class A | | 562 | 178,536 |
| Amdocs Ltd. | | 12,690 | 978,526 |
| Sykes Enterprises, Inc. (a) | | 700 | 37,562 |
| | | | 1,194,624 |
| Software - 1.1% | | | |
| Aspen Technology, Inc. (a) | | 400 | 58,504 |
| Citrix Systems, Inc. | | 1,600 | 161,200 |
| SS&C Technologies Holdings, Inc. | | 2,100 | 164,619 |
| | | | 384,323 |
| Technology Hardware, Storage & Peripherals - 1.3% | | | |
| HP, Inc. | | 7,900 | 228,073 |
| Xerox Holdings Corp. | | 9,456 | 228,173 |
| | | | 456,246 |
|
| TOTAL INFORMATION TECHNOLOGY | | | 2,951,185 |
|
| MATERIALS - 6.6% | | | |
| Chemicals - 1.1% | | | |
| Minerals Technologies, Inc. | | 1,029 | 82,546 |
| NewMarket Corp. | | 1,029 | 325,071 |
| | | | 407,617 |
| Containers & Packaging - 0.2% | | | |
| Berry Global Group, Inc. (a) | | 1,000 | 64,290 |
| Metals & Mining - 5.1% | | | |
| Reliance Steel & Aluminum Co. | | 11,513 | 1,809,268 |
| Paper & Forest Products - 0.2% | | | |
| Schweitzer-Mauduit International, Inc. | | 2,154 | 84,717 |
|
| TOTAL MATERIALS | | | 2,365,892 |
|
| REAL ESTATE - 12.3% | | | |
| Equity Real Estate Investment Trusts (REITs) - 1.7% | | | |
| Equity Commonwealth | | 4,399 | 115,650 |
| Gaming & Leisure Properties | | 5,833 | 276,134 |
| Highwoods Properties, Inc. (SBI) | | 4,861 | 231,821 |
| | | | 623,605 |
| Real Estate Management & Development - 10.6% | | | |
| CBRE Group, Inc. (a) | | 21,998 | 2,121,927 |
| Jones Lang LaSalle, Inc. (a) | | 7,420 | 1,651,469 |
| | | | 3,773,396 |
|
| TOTAL REAL ESTATE | | | 4,397,001 |
|
| UTILITIES - 8.3% | | | |
| Electric Utilities - 4.9% | | | |
| Exelon Corp. | | 3,157 | 147,748 |
| NRG Energy, Inc. | | 19,823 | 817,501 |
| OGE Energy Corp. | | 22,772 | 768,555 |
| | | | 1,733,804 |
| Independent Power and Renewable Electricity Producers - 0.7% | | | |
| Vistra Corp. | | 14,003 | 268,157 |
| Multi-Utilities - 2.7% | | | |
| MDU Resources Group, Inc. | | 30,833 | 978,023 |
|
| TOTAL UTILITIES | | | 2,979,984 |
|
| TOTAL COMMON STOCKS | | | |
| (Cost $26,593,444) | | | 35,592,336 |
|
| Money Market Funds - 1.2% | | | |
| Fidelity Cash Central Fund 0.06% (b) | | | |
| (Cost $431,997) | | 431,911 | 431,997 |
| TOTAL INVESTMENT IN SECURITIES - 100.8% | | | |
| (Cost $27,025,441) | | | 36,024,333 |
| NET OTHER ASSETS (LIABILITIES) - (0.8)% | | | (299,483) |
| NET ASSETS - 100% | | | $35,724,850 |
Legend
(a) Non-income producing
(b) Affiliated fund that is generally available only to investment companies and other accounts managed by Fidelity Investments. The rate quoted is the annualized seven-day yield of the fund at period end. A complete unaudited listing of the fund's holdings as of its most recent quarter end is available upon request. In addition, each Fidelity Central Fund's financial statements are available on the SEC's website or upon request.
Affiliated Central Funds
Information regarding fiscal year to date income earned by the Fund from investments in Fidelity Central Funds is as follows:
| Fund | Income earned |
| Fidelity Cash Central Fund | $92 |
| Fidelity Securities Lending Cash Central Fund | 27 |
| Total | $119 |
Amounts in the income column in the above table include any capital gain distributions from underlying funds, which are presented in the corresponding line-item in the Statement of Operations, if applicable. Amount for Fidelity Securities Lending Cash Central Fund represents the income earned on investing cash collateral, less rebates paid to borrowers and any lending agent fees associated with the loan, plus any premium payments received for lending certain types of securities.
Fiscal year to date information regarding the Fund's investments in Fidelity Central Funds, including the ownership percentage, is presented below.
| Fund | Value, beginning of period | Purchases | Sales Proceeds | Realized Gain/Loss | Change in Unrealized appreciation (depreciation) | Value, end of period | % ownership, end of period |
| Fidelity Cash Central Fund 0.06% | $264,532 | $5,207,086 | $5,039,621 | $-- | $-- | $431,997 | 0.0% |
| Fidelity Securities Lending Cash Central Fund 0.06% | -- | 799,277 | 799,277 | -- | -- | -- | 0.0% |
| Total | $264,532 | $6,006,363 | $5,838,898 | $-- | $-- | $431,997 | |
Investment Valuation
The following is a summary of the inputs used, as of July 31, 2021, involving the Fund's assets and liabilities carried at fair value. The inputs or methodology used for valuing securities may not be an indication of the risk associated with investing in those securities. For more information on valuation inputs, and their aggregation into the levels used below, please refer to the Investment Valuation section in the accompanying Notes to Financial Statements.
| | Valuation Inputs at Reporting Date: |
| Description | Total | Level 1 | Level 2 | Level 3 |
| Investments in Securities: | | | | |
| Equities: | | | | |
| Communication Services | $1,588,458 | $1,588,458 | $-- | $-- |
| Consumer Discretionary | 4,377,964 | 4,377,964 | -- | -- |
| Consumer Staples | 1,414,248 | 1,414,248 | -- | -- |
| Energy | 1,036,145 | 1,036,145 | -- | -- |
| Financials | 5,399,945 | 5,399,945 | -- | -- |
| Health Care | 2,544,856 | 2,544,856 | -- | -- |
| Industrials | 6,536,658 | 6,536,658 | -- | -- |
| Information Technology | 2,951,185 | 2,951,185 | -- | -- |
| Materials | 2,365,892 | 2,365,892 | -- | -- |
| Real Estate | 4,397,001 | 4,397,001 | -- | -- |
| Utilities | 2,979,984 | 2,979,984 | -- | -- |
| Money Market Funds | 431,997 | 431,997 | -- | -- |
| Total Investments in Securities: | $36,024,333 | $36,024,333 | $-- | $-- |
See accompanying notes which are an integral part of the financial statements.
Financial Statements
Statement of Assets and Liabilities
| | | July 31, 2021 (Unaudited) |
| Assets | | |
Investment in securities, at value — See accompanying schedule:
Unaffiliated issuers (cost $26,593,444) | $35,592,336 | |
| Fidelity Central Funds (cost $431,997) | 431,997 | |
| Total Investment in Securities (cost $27,025,441) | | $36,024,333 |
| Cash | | 10,694 |
| Receivable for fund shares sold | | 15,158 |
| Dividends receivable | | 24,766 |
| Distributions receivable from Fidelity Central Funds | | 19 |
| Other receivables | | 418 |
| Total assets | | 36,075,388 |
| Liabilities | | |
| Payable for fund shares redeemed | $337,272 | |
| Accrued management fee | 13,266 | |
| Total liabilities | | 350,538 |
| Net Assets | | $35,724,850 |
| Net Assets consist of: | | |
| Paid in capital | | $34,239,194 |
| Total accumulated earnings (loss) | | 1,485,656 |
| Net Assets | | $35,724,850 |
| Net Asset Value, offering price and redemption price per share ($35,724,850 ÷ 2,714,838 shares) | | $13.16 |
See accompanying notes which are an integral part of the financial statements.
Statement of Operations
| | | Six months ended July 31, 2021 (Unaudited) |
| Investment Income | | |
| Dividends | | $322,073 |
| Income from Fidelity Central Funds (including $27 from security lending) | | 119 |
| Total income | | 322,192 |
| Expenses | | |
| Management fee | $76,049 | |
| Independent trustees' fees and expenses | 63 | |
| Total expenses before reductions | 76,112 | |
| Expense reductions | (1,063) | |
| Total expenses after reductions | | 75,049 |
| Net investment income (loss) | | 247,143 |
| Realized and Unrealized Gain (Loss) | | |
| Net realized gain (loss) on: | | |
| Investment securities: | | |
| Unaffiliated issuers | 760,839 | |
| Total net realized gain (loss) | | 760,839 |
| Change in net unrealized appreciation (depreciation) on investment securities | | 5,534,636 |
| Net gain (loss) | | 6,295,475 |
| Net increase (decrease) in net assets resulting from operations | | $6,542,618 |
See accompanying notes which are an integral part of the financial statements.
Statement of Changes in Net Assets
| | Six months ended July 31, 2021 (Unaudited) | Year ended January 31, 2021 |
| Increase (Decrease) in Net Assets | | |
| Operations | | |
| Net investment income (loss) | $247,143 | $806,667 |
| Net realized gain (loss) | 760,839 | (2,435,601) |
| Change in net unrealized appreciation (depreciation) | 5,534,636 | 1,921,020 |
| Net increase (decrease) in net assets resulting from operations | 6,542,618 | 292,086 |
| Distributions to shareholders | – | (859,404) |
| Share transactions | | |
| Proceeds from sales of shares | 5,239,628 | 5,595,450 |
| Reinvestment of distributions | – | 859,404 |
| Cost of shares redeemed | (3,461,696) | (31,670,830) |
| Net increase (decrease) in net assets resulting from share transactions | 1,777,932 | (25,215,976) |
| Total increase (decrease) in net assets | 8,320,550 | (25,783,294) |
| Net Assets | | |
| Beginning of period | 27,404,300 | 53,187,594 |
| End of period | $35,724,850 | $27,404,300 |
| Other Information | | |
| Shares | | |
| Sold | 414,253 | 622,935 |
| Issued in reinvestment of distributions | – | 83,383 |
| Redeemed | (274,240) | (3,306,292) |
| Net increase (decrease) | 140,013 | (2,599,974) |
See accompanying notes which are an integral part of the financial statements.
Financial Highlights
Fidelity Mid Cap Value K6 Fund
| | Six months ended (Unaudited) July 31, | Years endedJanuary 31, | | | |
| | 2021 | 2021 | 2020 | 2019 | 2018 A |
| Selected Per–Share Data | | | | | |
| Net asset value, beginning of period | $10.64 | $10.28 | $9.85 | $11.35 | $10.00 |
| Income from Investment Operations | | | | | |
| Net investment income (loss)B | .09 | .19 | .21 | .21 | .11 |
| Net realized and unrealized gain (loss) | 2.43 | .40C | .40 | (1.44) | 1.33 |
| Total from investment operations | 2.52 | .59 | .61 | (1.23) | 1.44 |
| Distributions from net investment income | – | (.23) | (.18) | (.22) | (.09) |
| Distributions from net realized gain | – | – | – | (.05) | – |
| Total distributions | – | (.23) | (.18) | (.27) | (.09) |
| Net asset value, end of period | $13.16 | $10.64 | $10.28 | $9.85 | $11.35 |
| Total ReturnD,E | 23.68% | 5.83% | 6.15% | (10.82)% | 14.38% |
| Ratios to Average Net AssetsF,G | | | | | |
| Expenses before reductions | .45%H | .45% | .45% | .45% | .45%H |
| Expenses net of fee waivers, if any | .45%H | .45% | .45% | .45% | .45%H |
| Expenses net of all reductions | .44%H | .44% | .44% | .44% | .45%H |
| Net investment income (loss) | 1.46%H | 2.07% | 2.05% | 2.05% | 1.52%H |
| Supplemental Data | | | | | |
| Net assets, end of period (000 omitted) | $35,725 | $27,404 | $53,188 | $48,924 | $67,563 |
| Portfolio turnover rateI | 22%H | 73%J | 102%J | 89%J | 142%H,J |
A For the period May 25, 2017 (commencement of operations) to January 31, 2018.
B Calculated based on average shares outstanding during the period.
C The amount shown for a share outstanding does not correspond with the aggregate net gain (loss) on investments for the period due to the timing of sales and repurchases of shares in relation to fluctuating market values of the investments of the Fund.
D Total returns for periods of less than one year are not annualized.
E Total returns would have been lower if certain expenses had not been reduced during the applicable periods shown.
F Fees and expenses of any underlying mutual funds or exchange-traded funds (ETFs) are not included in the Fund's expense ratio. The Fund indirectly bears its proportionate share of these expenses. For additional expense information related to investments in Fidelity Central Funds, please refer to the "Investments in Fidelity Central Funds" note found in the Notes to Financial Statements section of the most recent Annual or Semi-Annual report.
G Expense ratios reflect operating expenses of the class. Expenses before reductions do not reflect amounts reimbursed, waived, or reduced through arrangements with the investment advisor, brokerage services, or other offset arrangements, if applicable, and do not represent the amount paid by the class during periods when reimbursements, waivers or reductions occur.
H Annualized
I Amount does not include the portfolio activity of any underlying mutual funds or exchange-traded funds (ETFs).
J Portfolio turnover rate excludes securities received or delivered in-kind.
See accompanying notes which are an integral part of the financial statements.
Notes to Financial Statements (Unaudited)
For the period ended July 31, 2021
1. Organization.
Fidelity Mid Cap Value K6 Fund (the Fund) is a fund of Fidelity Devonshire Trust (the Trust) and is authorized to issue an unlimited number of shares. Share transactions on the Statement of Changes in Net Assets may contain exchanges between affiliated funds. The Trust is registered under the Investment Company Act of 1940, as amended (the 1940 Act), as an open-end management investment company organized as a Massachusetts business trust. Shares generally are available only to employer-sponsored retirement plans that are recordkept by Fidelity, or to certain employer-sponsored retirement plans that are not recordkept by Fidelity.
2. Investments in Fidelity Central Funds.
Funds may invest in Fidelity Central Funds, which are open-end investment companies generally available only to other investment companies and accounts managed by the investment adviser and its affiliates. The Schedule of Investments lists any Fidelity Central Funds held as an investment as of period end, but does not include the underlying holdings of each Fidelity Central Fund. An investing fund indirectly bears its proportionate share of the expenses of the underlying Fidelity Central Funds.
Based on its investment objective, each Fidelity Central Fund may invest or participate in various investment vehicles or strategies that are similar to those of the investing fund. These strategies are consistent with the investment objectives of the investing fund and may involve certain economic risks which may cause a decline in value of each of the Fidelity Central Funds and thus a decline in the value of the investing fund.
| Fidelity Central Fund | Investment Manager | Investment Objective | Investment Practices | Expense Ratio(a) |
| Fidelity Money Market Central Funds | Fidelity Management & Research Company LLC (FMR) | Each fund seeks to obtain a high level of current income consistent with the preservation of capital and liquidity. | Short-term Investments | Ranged from less than .005% to .01% |
(a) Expenses expressed as a percentage of average net assets and are as of each underlying Central Fund's most recent annual or semi-annual shareholder report.
A complete unaudited list of holdings for each Fidelity Central Fund is available upon request or at the Securities and Exchange Commission website at www.sec.gov. In addition, the financial statements of the Fidelity Central Funds which contain the significant accounting policies (including investment valuation policies) of those funds, and are not covered by the Report of Independent Registered Public Accounting Firm, are available on the Securities and Exchange Commission website or upon request.
3. Significant Accounting Policies.
The Fund is an investment company and applies the accounting and reporting guidance of the Financial Accounting Standards Board (FASB) Accounting Standards Codification Topic 946 Financial Services - Investment Companies. The financial statements have been prepared in conformity with accounting principles generally accepted in the United States of America (GAAP), which require management to make certain estimates and assumptions at the date of the financial statements. Actual results could differ from those estimates. Subsequent events, if any, through the date that the financial statements were issued have been evaluated in the preparation of the financial statements. The Fund's Schedule of Investments lists any underlying mutual funds or exchange-traded funds (ETFs) but does not include the underlying holdings of these funds. The following summarizes the significant accounting policies of the Fund:
Investment Valuation. Investments are valued as of 4:00 p.m. Eastern time on the last calendar day of the period. The Board of Trustees (the Board) has delegated the day to day responsibility for the valuation of the Fund's investments to the Fair Value Committee (the Committee) established by the Fund's investment adviser. In accordance with valuation policies and procedures approved by the Board, the Fund attempts to obtain prices from one or more third party pricing vendors or brokers to value its investments. When current market prices, quotations or currency exchange rates are not readily available or reliable, investments will be fair valued in good faith by the Committee, in accordance with procedures adopted by the Board. Factors used in determining fair value vary by investment type and may include market or investment specific events. The frequency with which these procedures are used cannot be predicted and they may be utilized to a significant extent. The Committee oversees the Fund's valuation policies and procedures and reports to the Board on the Committee's activities and fair value determinations. The Board monitors the appropriateness of the procedures used in valuing the Fund's investments and ratifies the fair value determinations of the Committee.
The Fund categorizes the inputs to valuation techniques used to value its investments into a disclosure hierarchy consisting of three levels as shown below:
- Level 1 – quoted prices in active markets for identical investments
- Level 2 – other significant observable inputs (including quoted prices for similar investments, interest rates, prepayment speeds, etc.)
- Level 3 – unobservable inputs (including the Fund's own assumptions based on the best information available)
Valuation techniques used to value the Fund's investments by major category are as follows:
Equity securities, including restricted securities, for which market quotations are readily available, are valued at the last reported sale price or official closing price as reported by a third party pricing vendor on the primary market or exchange on which they are traded and are categorized as Level 1 in the hierarchy. In the event there were no sales during the day or closing prices are not available, securities are valued at the last quoted bid price or may be valued using the last available price and are generally categorized as Level 2 in the hierarchy. For foreign equity securities, when market or security specific events arise, comparisons to the valuation of American Depositary Receipts (ADRs), futures contracts, Exchange-Traded Funds (ETFs) and certain indexes as well as quoted prices for similar securities may be used and would be categorized as Level 2 in the hierarchy. For equity securities, including restricted securities, where observable inputs are limited, assumptions about market activity and risk are used and these securities may be categorized as Level 3 in the hierarchy.
Investments in open-end mutual funds, including the Fidelity Central Funds, are valued at their closing net asset value (NAV) each business day and are categorized as Level 1 in the hierarchy.
Changes in valuation techniques may result in transfers in or out of an assigned level within the disclosure hierarchy. The aggregate value of investments by input level as of July 31, 2021 is included at the end of the Fund's Schedule of Investments.
Investment Transactions and Income. For financial reporting purposes, the Fund's investment holdings and NAV include trades executed through the end of the last business day of the period. The NAV per share for processing shareholder transactions is calculated as of the close of business of the New York Stock Exchange (NYSE), normally 4:00 p.m. Eastern time and includes trades executed through the end of the prior business day. Gains and losses on securities sold are determined on the basis of identified cost. Dividend income is recorded on the ex-dividend date, except for certain dividends from foreign securities where the ex-dividend date may have passed, which are recorded as soon as the Fund is informed of the ex-dividend date. Non-cash dividends included in dividend income, if any, are recorded at the fair market value of the securities received. Income and capital gain distributions from Fidelity Central Funds, if any, are recorded on the ex-dividend date. Certain distributions received by the Fund represent a return of capital or capital gain. The Fund determines the components of these distributions subsequent to the ex-dividend date, based upon receipt of tax filings or other correspondence relating to the underlying investment. These distributions are recorded as a reduction of cost of investments and/or as a realized gain.
Expenses. Expenses directly attributable to a fund are charged to that fund. Expenses attributable to more than one fund are allocated among the respective funds on the basis of relative net assets or other appropriate methods. Expenses included in the accompanying financial statements reflect the expenses of that fund and do not include any expenses associated with any underlying mutual funds or exchange-traded funds. Although not included in a fund's expenses, a fund indirectly bears its proportionate share of these expenses through the net asset value of each underlying mutual fund or exchange-traded fund. Expense estimates are accrued in the period to which they relate and adjustments are made when actual amounts are known.
Income Tax Information and Distributions to Shareholders. Each year, the Fund intends to qualify as a regulated investment company under Subchapter M of the Internal Revenue Code, including distributing substantially all of its taxable income and realized gains. As a result, no provision for U.S. Federal income taxes is required. The Fund files a U.S. federal tax return, in addition to state and local tax returns as required. The Fund's federal income tax returns are subject to examination by the Internal Revenue Service (IRS) for a period of three fiscal years after they are filed. State and local tax returns may be subject to examination for an additional fiscal year depending on the jurisdiction.
Distributions are declared and recorded on the ex-dividend date. Income and capital gain distributions are determined in accordance with income tax regulations, which may differ from GAAP.
Capital accounts within the financial statements are adjusted for permanent book-tax differences. These adjustments have no impact on net assets or the results of operations. Capital accounts are not adjusted for temporary book-tax differences which will reverse in a subsequent period.
Book-tax differences are primarily due to foreign currency transactions redemptions in kind, partnerships, capital loss carryforwards and losses deferred due to wash sales and excise tax regulations.
As of period end, the cost and unrealized appreciation (depreciation) in securities, and derivatives if applicable, for federal income tax purposes were as follows:
| Gross unrealized appreciation | $9,664,401 |
| Gross unrealized depreciation | (756,440) |
| Net unrealized appreciation (depreciation) | $8,907,961 |
| Tax cost | $27,116,372 |
The Fund intends to elect to defer to its next fiscal year $19,474 of ordinary losses recognized during the period January 1, 2021 to January 31, 2021.
Capital loss carryforwards are only available to offset future capital gains of the Fund to the extent provided by regulations and may be limited. The capital loss carryforward information presented below, including any applicable limitation, is estimated as of prior fiscal period end and is subject to adjustment.
| No expiration | |
| Short-term | $(5,583,144) |
| Long-term | (2,873,583) |
| Total capital loss carryforward | $(8,456,727) |
Due to large redemptions in a prior period, approximately $1,849,024 of the Fund's realized capital losses are subject to limitation. Due to this limitation, the Fund will only be permitted to use approximately $1,170,413 of those capital losses per year to offset capital gains.
4. Purchases and Sales of Investments.
Purchases and sales of securities, other than short-term securities and in-kind transactions, as applicable, are noted in the table below.
| | Purchases ($) | Sales ($) |
| Fidelity Mid Cap Value K6 Fund | 5,817,963 | 3,683,227 |
Prior Fiscal Year Unaffiliated Redemptions In-Kind. Shares that were redeemed in-kind for investments, including accrued interest and cash, if any, are shown in the table below; along with realized gain or loss on investments delivered through in-kind redemptions. The amount of the in-kind redemptions is included in share transactions in the accompanying Statement of Changes in Net Assets. There was no gain or loss for federal income tax purposes.
| | Shares | Total net realized gain or loss
($) | Total Proceeds
($) |
| Fidelity Mid Cap Value K6 Fund | 198,493 | 102,357 | 1,794,378 |
5. Fees and Other Transactions with Affiliates.
Management Fee. Fidelity Management & Research Company LLC (the investment adviser) and its affiliates provide the Fund with investment management related services for which the Fund pays a monthly management fee that is based on an annual rate of .45% of average net assets. Under the management contract, the investment adviser or an affiliate pays all other expenses of the Fund, excluding fees and expenses of the independent Trustees, and certain miscellaneous expenses such as proxy and shareholder meeting expenses.
Brokerage Commissions. A portion of portfolio transactions were placed with brokerage firms which are affiliates of the investment adviser. Brokerage commissions are included in net realized gain (loss) and change in net unrealized appreciation (depreciation) in the Statement of Operations. The commissions paid to these affiliated firms were as follows:
| | Amount |
| Fidelity Mid Cap Value K6 Fund | $62 |
Interfund Trades. Funds may purchase from or sell securities to other Fidelity Funds under procedures adopted by the Board. The procedures have been designed to ensure these interfund trades are executed in accordance with Rule 17a-7 of the 1940 Act. Any interfund trades are included within the respective purchases and sales amounts shown in the Purchases and Sales of Investments note and are noted in the table below.
| | Purchases ($) | Sales ($) |
| Fidelity Mid Cap Value K6 Fund | 417,322 | 518,293 |
6. Committed Line of Credit.
Certain Funds participate with other funds managed by the investment adviser or an affiliate in a $4.25 billion credit facility (the "line of credit") to be utilized for temporary or emergency purposes to fund shareholder redemptions or for other short-term liquidity purposes. The commitment fees on the pro-rata portion of the line of credit are borne by the investment adviser. During the period, there were no borrowings on this line of credit.
7. Security Lending.
Funds lend portfolio securities from time to time in order to earn additional income. Lending agents are used, including National Financial Services (NFS), an affiliate of the investment adviser. Pursuant to a securities lending agreement, NFS will receive a fee, which is capped at 9.9% of a fund's daily lending revenue, for its services as lending agent. A fund may lend securities to certain qualified borrowers, including NFS. On the settlement date of the loan, a fund receives collateral (in the form of U.S. Treasury obligations, letters of credit and/or cash) against the loaned securities and maintains collateral in an amount not less than 100% of the market value of the loaned securities during the period of the loan. The market value of the loaned securities is determined at the close of business of a fund and any additional required collateral is delivered to a fund on the next business day. A fund or borrower may terminate the loan at any time, and if the borrower defaults on its obligation to return the securities loaned because of insolvency or other reasons, a fund may apply collateral received from the borrower against the obligation. A fund may experience delays and costs in recovering the securities loaned. Any cash collateral received is invested in the Fidelity Securities Lending Cash Central Fund. Any loaned securities are identified as such in the Schedule of Investments, and the value of loaned securities and cash collateral at period end, as applicable, are presented in the Statement of Assets and Liabilities. Security lending income represents the income earned on investing cash collateral, less rebates paid to borrowers and any lending agent fees associated with the loan, plus any premium payments received for lending certain types of securities. Security lending income is presented in the Statement of Operations as a component of income from Fidelity Central Funds. Affiliated security lending activity, if any, was as follows:
| | Total Security Lending Fees Paid to NFS | Security Lending Income From Securities Loaned to NFS | Value of Securities Loaned to NFS at Period End |
| Fidelity Mid Cap Value K6 Fund | $3 | $– | $– |
8. Expense Reductions.
Commissions paid to certain brokers with whom the investment adviser, or its affiliates, places trades on behalf of the Fund include an amount in addition to trade execution, which may be rebated back to the Fund to offset expenses. This amount totaled $1,062 for the period. In addition, through arrangements with the Fund's custodian, credits realized as a result of certain uninvested cash balances were used to reduce the Fund's expenses by $1.
9. Other.
Fund's organizational documents provide former and current trustees and officers with a limited indemnification against liabilities arising in connection with the performance of their duties to the fund. In the normal course of business, the fund may also enter into contracts that provide general indemnifications. The fund's maximum exposure under these arrangements is unknown as this would be dependent on future claims that may be made against the fund. The risk of material loss from such claims is considered remote.
10. Coronavirus (COVID-19) Pandemic.
An outbreak of COVID-19 first detected in China during December 2019 has since spread globally and was declared a pandemic by the World Health Organization during March 2020. Developments that disrupt global economies and financial markets, such as the COVID-19 pandemic, may magnify factors that affect the Fund's performance.
Shareholder Expense Example
As a shareholder, you incur two types of costs: (1) transaction costs, which may include sales charges (loads) on purchase payments or redemption proceeds, as applicable and (2) ongoing costs, which generally include management fees, distribution and/or service (12b-1) fees and other Fund expenses. This Example is intended to help you understand your ongoing costs (in dollars) of investing in a fund and to compare these costs with the ongoing costs of investing in other mutual funds.
The Example is based on an investment of $1,000 invested at the beginning of the period and held for the entire period (February 1, 2021 to July 31, 2021).
Actual Expenses
The first line of the accompanying table provides information about actual account values and actual expenses. You may use the information in this line, together with the amount you invested, to estimate the expenses that you paid over the period. Simply divide your account value by $1,000.00 (for example, an $8,600 account value divided by $1,000.00 = 8.6), then multiply the result by the number in the first line for a class/Fund under the heading entitled "Expenses Paid During Period" to estimate the expenses you paid on your account during this period. If any fund is a shareholder of any underlying mutual funds or exchange-traded funds (ETFs) (the Underlying Funds), such fund indirectly bears its proportional share of the expenses of the Underlying Funds in addition to the direct expenses incurred presented in the table. These fees and expenses are not included in the annualized expense ratio used to calculate the expense estimate in the table below.
Hypothetical Example for Comparison Purposes
The second line of the accompanying table provides information about hypothetical account values and hypothetical expenses based on the actual expense ratio and an assumed rate of return of 5% per year before expenses, which is not the actual return. The hypothetical account values and expenses may not be used to estimate the actual ending account balance or expenses you paid for the period. You may use this information to compare the ongoing costs of investing in the Fund and other funds. To do so, compare this 5% hypothetical example with the 5% hypothetical examples that appear in the shareholder reports of the other funds. If any fund is a shareholder of any Underlying Funds, such fund indirectly bears its proportional share of the expenses of the Underlying Funds in addition to the direct expenses as presented in the table. These fees and expenses are not included in the annualized expense ratio used to calculate the expense estimate in the table below.
Please note that the expenses shown in the table are meant to highlight your ongoing costs only and do not reflect any transaction costs. Therefore, the second line of the table is useful in comparing ongoing costs only, and will not help you determine the relative total costs of owning different funds.
| | Annualized Expense Ratio-A | Beginning
Account Value
February 1, 2021 | Ending
Account Value
July 31, 2021 | Expenses Paid
During Period-B
February 1, 2021
to July 31, 2021 |
| Fidelity Mid Cap Value K6 Fund | .45% | | | |
| Actual | | $1,000.00 | $1,236.80 | $2.50 |
| Hypothetical-C | | $1,000.00 | $1,022.56 | $2.26 |
A Annualized expense ratio reflects expenses net of applicable fee waivers.
B Expenses are equal to the annualized expense ratio, multiplied by the average account value over the period, multiplied by 181/ 365 (to reflect the one-half year period). The fees and expenses of any Underlying Funds are not included in each annualized expense ratio.
C 5% return per year before expenses
Board Approval of Investment Advisory Contracts and Management Fees
Fidelity Mid Cap Value K6 Fund
Each year, the Board of Trustees, including the Independent Trustees (together, the Board), votes on the renewal of the management contract with Fidelity Management & Research Company LLC (FMR) and the sub-advisory agreements (together, the Advisory Contracts) for the fund. FMR and the sub-advisers are referred to herein as the Investment Advisers. The Board, assisted by the advice of fund counsel and Independent Trustees' counsel, requests and considers a broad range of information relevant to the renewal of the Advisory Contracts throughout the year.
The Board meets regularly and, at each of its meetings, covers an extensive agenda of topics and materials and considers factors that are relevant to its annual consideration of the renewal of the fund's Advisory Contracts, including the services and support provided to the fund and its shareholders. The Board has established various standing committees (Committees), each composed of and chaired by Independent Trustees with varying backgrounds, to which the Board has assigned specific subject matter responsibilities in order to enhance effective decision-making by the Board. The Board, acting directly and through its Committees, requests and receives information concerning the annual consideration of the renewal of the fund's Advisory Contracts. The Board also meets as needed to review matters specifically related to the Board's annual consideration of the renewal of the Advisory Contracts. Members of the Board may also meet with trustees of other Fidelity funds through joint ad hoc committees to discuss certain matters relevant to all of the Fidelity funds.
At its May 2021 meeting, the Board unanimously determined to renew the fund's Advisory Contracts. In reaching its determination, the Board considered all factors it believed relevant, including (i) the nature, extent, and quality of the services provided to the fund and its shareholders (including the investment performance of the fund); (ii) the competitiveness of the fund's management fee and total expense ratio relative to peer funds; (iii) the total costs of the services provided by and the profits realized by Fidelity from its relationships with the fund; and (iv) the extent to which, if any, economies of scale exist and are realized as the fund grows, and whether any economies of scale are appropriately shared with fund shareholders.
In considering whether to renew the Advisory Contracts for the fund, the Board reached a determination, with the assistance of fund counsel and Independent Trustees' counsel and through the exercise of its business judgment, that the renewal of the Advisory Contracts was in the best interests of the fund and its shareholders and that the compensation payable under the Advisory Contracts was fair and reasonable. The Board's decision to renew the Advisory Contracts was not based on any single factor, but rather was based on a comprehensive consideration of all the information provided to the Board at its meetings throughout the year. The Board, in reaching its determination to renew the Advisory Contracts, was aware that shareholders of the fund have a broad range of investment choices available to them, including a wide choice among funds offered by Fidelity's competitors, and that the fund's shareholders, who have the opportunity to review and weigh the disclosure provided by the fund in its prospectus and other public disclosures, have chosen to invest in this fund, which is part of the Fidelity family of funds.
Nature, Extent, and Quality of Services Provided. The Board considered Fidelity's staffing as it relates to the fund, including the backgrounds of investment personnel of Fidelity, and also considered the fund's investment objective, strategies, and related investment philosophy. The Independent Trustees also had discussions with senior management of Fidelity's investment operations and investment groups. The Board considered the structure of the investment personnel compensation program and whether this structure provides appropriate incentives to act in the best interests of the fund. Additionally, the Board considered the portfolio managers' investments, if any, in the funds that they manage.
Resources Dedicated to Investment Management and Support Services. The Board and the Fund Oversight and Research Committees reviewed the general qualifications and capabilities of Fidelity's investment staff, including its size, education, experience, and resources, as well as Fidelity's approach to recruiting, training, managing, and compensating investment personnel. The Board noted that Fidelity has continued to increase the resources devoted to non-U.S. offices, including expansion of Fidelity's global investment organization. The Board also noted that Fidelity's analysts have extensive resources, tools and capabilities that allow them to conduct sophisticated quantitative and fundamental analysis, as well as credit analysis of issuers, counterparties and guarantors. Further, the Board considered that Fidelity's investment professionals have sufficient access to global information and data so as to provide competitive investment results over time, and that those professionals also have access to sophisticated tools that permit them to assess portfolio construction and risk and performance attribution characteristics continuously, as well as to transmit new information and research conclusions rapidly around the world. Additionally, in its deliberations, the Board considered Fidelity's trading, risk management, compliance, and technology and operations capabilities and resources, which are integral parts of the investment management process. The Board also considered Fidelity's investments in business continuity planning, and its success in continuously providing services to the fund notwithstanding the severe disruptions caused by the COVID-19 pandemic.
Shareholder and Administrative Services. The Board considered (i) the nature, extent, quality, and cost of advisory, administrative, and shareholder services performed by the Investment Advisers and their affiliates under the Advisory Contracts and under separate agreements covering transfer agency, pricing and bookkeeping, and securities lending services for the fund; (ii) the nature and extent of the supervision of third party service providers, principally custodians, subcustodians, and pricing vendors; and (iii) the resources devoted to, and the record of compliance with, the fund's compliance policies and procedures. The Board also reviewed the allocation of fund brokerage, including allocations to brokers affiliated with the Investment Advisers, the use of brokerage commissions to pay fund expenses, and the use of "soft" commission dollars to pay for research services.
The Board noted that the growth of fund assets over time across the complex allows Fidelity to reinvest in the development of services designed to enhance the value and convenience of the Fidelity funds as investment vehicles. These services include 24-hour access to account information and market information over the Internet and through telephone representatives, investor education materials and asset allocation tools, and the expanded availability of Fidelity Investor Centers.
The Board noted that, in the past, it and the boards of certain other Fidelity funds had formed an ad hoc Committee on Transfer Agency Fees to review the variety of transfer agency fee structures throughout the industry and Fidelity's competitive positioning with respect to industry participants.
Investment in a Large Fund Family. The Board considered the benefits to shareholders of investing in a Fidelity fund, including the benefits of investing in a fund that is part of a large family of funds offering a variety of investment disciplines and providing a large variety of mutual fund investor services. The Board noted that Fidelity had taken, or had made recommendations that resulted in the Fidelity funds taking, a number of actions over the previous year that benefited particular funds, including: (i) continuing to dedicate additional resources to Fidelity's investment research process, which includes meetings with management of issuers of securities in which the funds invest, and to the support of the senior management team that oversees asset management; (ii) continuing efforts to enhance Fidelity's global research capabilities; (iii) launching new funds and ETFs with innovative structures, strategies and pricing and making other enhancements to meet client needs; (iv) launching new share classes of existing funds; (v) eliminating purchase minimums and broadening eligibility requirements for certain funds and share classes; (vi) approving the reduction in the holding period for the Class C to Class A conversion policy; (vii) reducing management fees and total expenses for certain target date funds and classes and index funds; (viii) lowering expenses for certain existing funds and classes by implementing or lowering expense caps; (ix) rationalizing product lines and gaining increased efficiencies from fund mergers, liquidations, and share class consolidations; (x) continuing to develop, acquire and implement systems and technology to improve services to the funds and shareholders, strengthen information security, and increase efficiency; and (xi) continuing to implement enhancements to further strengthen Fidelity's product line to increase investors' probability of success in achieving their investment goals, including retirement income goals.
Investment Performance. The Board considered whether the fund has operated in accordance with its investment objective, as well as its record of compliance with its investment restrictions and its performance history.
The Board took into account discussions that occur at Board meetings throughout the year with representatives of the Investment Advisers about fund investment performance. In this regard the Board noted that as part of regularly scheduled fund reviews and other reports to the Board on fund performance, the Board considers annualized return information for the fund for different time periods, measured against an appropriate securities market index (benchmark index) and an appropriate peer group of funds with similar objectives (peer group). In its evaluation of fund investment performance, the Board gave particular attention to information indicating changes in performance of certain Fidelity funds for specific time periods and discussed with the Investment Advisers the reasons for any overperformance or underperformance.
In addition to reviewing absolute and relative fund performance, the Independent Trustees periodically consider the appropriateness of fund performance metrics in evaluating the results achieved. In general, the Independent Trustees believe that fund performance should be evaluated based on net performance (after fees and expenses) of both the highest performing and lowest performing fund share classes, where applicable, compared to appropriate benchmark indices, over appropriate time periods that may include full market cycles, and compared to peer groups, as applicable, over the same periods, taking into account relevant factors including the following: general market conditions; issuer-specific information; and fund cash flows and other factors.
The Independent Trustees recognize that shareholders evaluate performance on a net basis over their own holding periods, for which one-, three-, and five-year periods are often used as a proxy. For this reason, the performance information reviewed by the Board also included net cumulative total return information for the fund and an appropriate benchmark index and peer group for the most recent one- and three-year periods ended September 30, 2020, as shown below. Returns are shown compared to the 25th percentile (top of box, 75% beaten) and 75th percentile (bottom of box, 25% beaten) of the peer universe.
Fidelity Mid Cap Value K6 Fund

The Board considered the fund's underperformance for different time periods ended September 30, 2020 and for different time periods ended December 31, 2020 (which periods are not reflected in the chart above). The Board's discussions with FMR regarding underperformance cover topics including, but not limited to: the longer-term track record of a fund's portfolio manager(s); broader trends in the market that may adversely impact a fund's performance; and attribution reports on contributors to the fund's underperformance. The Board engages with FMR on steps that might be taken to address a fund's underperformance.
Based on its review, the Board concluded that the nature, extent, and quality of services provided to the fund under the Advisory Contracts should continue to benefit the shareholders of the fund.
Competitiveness of Management Fee and Total Expense Ratio. The Board considered the fund's management fee and total expense ratio compared to "mapped groups" of competitive funds and classes created for the purpose of facilitating the Trustees' competitive analysis of management fees and total expenses. Fidelity creates "mapped groups" by combining similar Lipper investment objective categories that have comparable investment mandates. Combining Lipper investment objective categories aids the Board's management fee and total expense ratio comparisons by broadening the competitive group used for comparison.
Management Fee. The Board considered two proprietary management fee comparisons for the 12-month periods ended September 30 (June 30 for the period ended 2019) shown in basis points (BP) in the chart below. The group of Lipper funds used by the Board for management fee comparisons is referred to below as the "Total Mapped Group." The Total Mapped Group comparison focuses on a fund's standing in terms of gross management fees before expense reimbursements or caps relative to the total universe of funds with comparable investment mandates, regardless of whether their management fee structures also are comparable. Funds with comparable investment mandates offer exposure to similar types of securities. Funds with comparable management fee structures have similar management fee contractual arrangements (
e.g., flat rate charged for advisory services, all-inclusive fee rate,
etc.). "TMG %" represents the percentage of funds in the Total Mapped Group that had management fees that were lower than the fund's. For example, a hypothetical TMG % of 20% would mean that 80% of the funds in the Total Mapped Group had higher, and 20% had lower, management fees than the fund. The fund's actual TMG %s and the number of funds in the Total Mapped Group are in the chart below. The "Asset-Sized Peer Group" (ASPG) comparison focuses on a fund's standing relative to a subset of non-Fidelity funds within the Total Mapped Group that are similar in size and management fee structure. For example, if a fund is in the first quartile of the ASPG, the fund's management fee ranks in the least expensive or lowest 25% of funds in the ASPG. The ASPG represents at least 15% of the funds in the Total Mapped Group with comparable asset size and management fee structures, subject to a minimum of 50 funds (or all funds in the Total Mapped Group if fewer than 50). Additional information, such as the ASPG quartile in which the fund's management fee rate ranked, is also included in the chart and was considered by the Board.
Fidelity Mid Cap Value K6 Fund

The Board noted that the fund's management fee rate ranked below the median of its Total Mapped Group and below the median of its ASPG for the 12-month period ended September 30, 2020.
The Board noted that, in the past, it and the boards of other Fidelity funds had formed an ad hoc Committee on Group Fee to conduct an in-depth review of the "group fee" component of the management fee of funds with such management fee structures. The Committee's focus included the mechanics of the group fee, the competitive landscape of group fee structures, Fidelity funds with no group fee component (such as the fund) and investment products not included in group fee assets. The Board also considered that, for funds subject to the group fee, FMR agreed to voluntarily waive fees over a specified period of time in amounts designed to account for assets converted from certain funds to certain collective investment trusts.
The Board also noted that, in 2013, the ad hoc Committee on Management Fees was formed to conduct an in-depth review of the management fee rates of Fidelity's active equity mutual funds. The Committee focused on the following areas: (i) standard fee structures; (ii) research consumption and trading evolution; (iii) management fee competitiveness/profitability by category; and (iv) factors that drive institutional pricing.
Based on its review, the Board concluded that the fund's management fee is fair and reasonable in light of the services that the fund receives and the other factors considered.
Total Expense Ratio. In its review of the fund's total expense ratio, the Board considered the fund's unitary fee rate as well as other fund expenses paid by FMR under the fund's management contract, such as transfer agent fees, pricing and bookkeeping fees, and custodial, legal, and audit fees. The Board also noted that Fidelity may agree to waive fees or reimburse expenses from time to time, and the extent to which, if any, it has done so for the fund. As part of its review, the Board also considered the current and historical total expense ratios of the fund compared to competitive fund median expenses. The fund is compared to those funds and classes in the Total Mapped Group (used by the Board for management fee comparisons) that have a similar sales load structure (SLTG). The Board also considered a total expense ASPG comparison for the fund, which focuses on the total expenses of the fund relative to a subset of non-Fidelity funds within the total expense SLTG. The total expense ASPG is limited to 15 larger and 15 smaller classes in fund average assets for a total of 30 classes, where possible. The total expense ASPG comparison excludes performance adjustments and fund-paid 12b-1 fees to eliminate variability in fee structures.
The Board noted that the fund's total expense ratio ranked below the SLTG competitive median and below the ASPG competitive median for the 12-month period ended September 30, 2020.
Fees Charged to Other Fidelity Clients. The Board also considered Fidelity fee structures and other information with respect to clients of Fidelity, such as other funds advised or subadvised by Fidelity, pension plan clients, and other institutional clients with similar mandates. The Board noted that a joint ad hoc committee created by it and the boards of other Fidelity funds periodically reviews and compares Fidelity's institutional investment advisory business with its business of providing services to the Fidelity funds and also noted the most recent findings of the committee. The Board noted that the committee's review included a consideration of the differences in services provided, fees charged, and costs incurred, as well as competition in the markets serving the different categories of clients.
Based on its review of total expense ratios and fees charged to other Fidelity clients, the Board concluded that the fund's total expense ratio was reasonable in light of the services that the fund and its shareholders receive and the other factors considered.
Costs of the Services and Profitability. The Board considered the revenues earned and the expenses incurred by Fidelity in conducting the business of developing, marketing, distributing, managing, administering and servicing the fund and servicing the fund's shareholders. The Board also considered the level of Fidelity's profits in respect of all the Fidelity funds.
On an annual basis, Fidelity presents to the Board information about the profitability of its relationships with the fund. Fidelity calculates profitability information for each fund, as well as aggregate profitability information for groups of Fidelity funds and all Fidelity funds, using a series of detailed revenue and cost allocation methodologies which originate with the books and records of Fidelity on which Fidelity's audited financial statements are based. The Audit Committee of the Board reviews any significant changes from the prior year's methodologies and the full Board approves such changes.
A public accounting firm has been engaged annually by the Board as part of the Board's assessment of Fidelity's profitability analysis. The engagement includes the review and assessment of the methodologies used by Fidelity in determining the revenues and expenses attributable to Fidelity's mutual fund business, and completion of agreed-upon procedures in respect of the mathematical accuracy of certain fund profitability information and its conformity to established allocation methodologies. After considering the reports issued under the engagement and information provided by Fidelity, the Board concluded that while other allocation methods may also be reasonable, Fidelity's profitability methodologies are reasonable in all material respects.
The Board also reviewed Fidelity's non-fund businesses and potential indirect benefits such businesses may have received as a result of their association with Fidelity's mutual fund business (i.e., fall-out benefits) as well as cases where Fidelity's affiliates may benefit from the funds' business. The Board considered areas where potential indirect benefits to the Fidelity funds from their relationships with Fidelity may exist. The Board also considered that in 2019 a joint ad hoc committee created by it and the boards of other Fidelity funds evaluated potential fall-out benefits (PFOB Committee). The Board noted that it considered the PFOB Committee's findings in connection with its consideration of the renewal of the Advisory Contracts.
The Board considered the costs of the services provided by and the profits realized by Fidelity in connection with the operation of the fund, including the conclusions of the PFOB Committee, and was satisfied that the profitability was not excessive.
Economies of Scale. The Board considered whether there have been economies of scale in respect of the management of the Fidelity funds, whether the Fidelity funds (including the fund) have appropriately benefited from any such economies of scale, and whether there is potential for realization of any further economies of scale. The Board considered the extent to which the fund will benefit from economies of scale as assets grow through increased services to the fund, through waivers or reimbursements, or through fee or expense ratio reductions. The Board recognized that, due to the fund's current contractual arrangements, its expense ratio will not decline if the fund's operating costs decrease as assets grow, or rise as assets decrease. The Board also noted that a committee (the Economies of Scale Committee) created by it and the boards of other Fidelity funds periodically analyzes whether Fidelity attains economies of scale in respect of the management and servicing of the Fidelity funds, whether the Fidelity funds have appropriately benefited from such economies of scale, and whether there is potential for realization of any further economies of scale.
The Board concluded, taking into account the analysis of the Economies of Scale Committee, that economies of scale, if any, are being appropriately shared between fund shareholders and Fidelity.
Additional Information Requested by the Board. In order to develop fully the factual basis for consideration of the Fidelity funds' advisory contracts, the Board requested and received additional information on certain topics, including: (i) fund flow and performance trends, in particular the underperformance of certain funds and strategies, and Fidelity's long-term strategies for certain funds; (ii) consideration of expanding the use of performance fees for additional funds; (iii) Fidelity's pricing philosophy compared to competitors; (iv) metrics for evaluating index fund and ETF performance and information about ETF trading characteristics; (v) the methodology with respect to evaluating competitive fund data and peer group classifications and fee and expense comparisons; (vi) the expense structures for different funds and classes and information about the differences between various expense structures; (vii) group fee breakpoints; (viii) information regarding other accounts managed by Fidelity and sub-advisory arrangements; and (ix) Fidelity's philosophies and strategies for evaluating funds and classes with lower or declining asset levels.
Based on its evaluation of all of the conclusions noted above, and after considering all factors it believed relevant, the Board concluded that the advisory fee arrangements are fair and reasonable, and that the fund's Advisory Contracts should be renewed.
Liquidity Risk Management Program
The Securities and Exchange Commission adopted Rule 22e-4 under the Investment Company Act of 1940 (the Liquidity Rule) to promote effective liquidity risk management throughout the open-end investment company industry, thereby reducing the risk that funds will be unable to meet their redemption obligations and mitigating dilution of the interests of fund shareholders.
The Fund has adopted and implemented a liquidity risk management program pursuant to the Liquidity Rule (the Program) effective December 1, 2018. The Program is reasonably designed to assess and manage the Fund’s liquidity risk and to comply with the requirements of the Liquidity Rule. The Fund’s Board of Trustees (the Board) has designated the Fund’s investment adviser as administrator of the Program. The Fidelity advisers have established a Liquidity Risk Management Committee (the LRM Committee) to manage the Program for each of the Fidelity Funds. The LRM Committee monitors the adequacy and effectiveness of implementation of the Program and on a periodic basis assesses each Fund’s liquidity risk based on a variety of factors including (1) the Fund’s investment strategy, (2) portfolio liquidity and cash flow projections during normal and reasonably foreseeable stressed conditions, (3) shareholder redemptions, (4) borrowings and other funding sources and (5) in the case of exchange-traded funds, certain additional factors including the effect of the Fund’s prices and spreads, market participants, and basket compositions on the overall liquidity of the Fund’s portfolio, as applicable.
In accordance with the Program, each of the Fund’s portfolio investments is classified into one of four liquidity categories described below based on a determination of a reasonable expectation for how long it would take to convert the investment to cash (or sell or dispose of the investment) without significantly changing its market value.
- Highly liquid investments – cash or convertible to cash within three business days or less
- Moderately liquid investments – convertible to cash in three to seven calendar days
- Less liquid investments – can be sold or disposed of, but not settled, within seven calendar days
- Illiquid investments – cannot be sold or disposed of within seven calendar days
Liquidity classification determinations take into account a variety of factors including various market, trading and investment-specific considerations, as well as market depth, and generally utilize analysis from a third-party liquidity metrics service.
The Liquidity Rule places a 15% limit on a fund’s illiquid investments and requires funds that do not primarily hold assets that are highly liquid investments to determine and maintain a minimum percentage of the fund’s net assets to be invested in highly liquid investments (highly liquid investment minimum or HLIM). The Program includes provisions reasonably designed to comply with the 15% limit on illiquid investments and for determining, periodically reviewing and complying with the HLIM requirement as applicable.
At a recent meeting of the Fund’s Board of Trustees, the LRM Committee provided a written report to the Board pertaining to the operation, adequacy, and effectiveness of implementation of the Program for the annual period from December 1, 2019 through November 30, 2020. The report concluded that the Program has been implemented and is operating effectively and is reasonably designed to assess and manage the Fund’s liquidity risk.
MCVK6-SANN-0921
1.9883982.104
Fidelity® Equity-Income K6 Fund
Semi-Annual Report
July 31, 2021
Contents
To view a fund's proxy voting guidelines and proxy voting record for the 12-month period ended June 30, visit http://www.fidelity.com/proxyvotingresults or visit the Securities and Exchange Commission's (SEC) web site at http://www.sec.gov.
You may also call 1-800-835-5092 to request a free copy of the proxy voting guidelines.
Standard & Poor's, S&P and S&P 500 are registered service marks of The McGraw-Hill Companies, Inc. and have been licensed for use by Fidelity Distributors Corporation.
Other third-party marks appearing herein are the property of their respective owners.
All other marks appearing herein are registered or unregistered trademarks or service marks of FMR LLC or an affiliated company. © 2021 FMR LLC. All rights reserved.
This report and the financial statements contained herein are submitted for the general information of the shareholders of the Fund. This report is not authorized for distribution to prospective investors in the Fund unless preceded or accompanied by an effective prospectus.
A fund files its complete schedule of portfolio holdings with the SEC for the first and third quarters of each fiscal year on Form N-PORT. Forms N-PORT are available on the SEC’s web site at http://www.sec.gov. A fund's Forms N-PORT may be reviewed and copied at the SEC’s Public Reference Room in Washington, DC. Information regarding the operation of the SEC's Public Reference Room may be obtained by calling 1-800-SEC-0330.
For a complete list of a fund's portfolio holdings, view the most recent holdings listing, semiannual report, or annual report on Fidelity's web site at http://www.fidelity.com, http://www.institutional.fidelity.com, or http://www.401k.com, as applicable.
NOT FDIC INSURED •MAY LOSE VALUE •NO BANK GUARANTEE
Neither the Fund nor Fidelity Distributors Corporation is a bank.
Note to Shareholders:
Early in 2020, the outbreak and spread of a new coronavirus emerged as a public health emergency that had a major influence on financial markets, primarily based on its impact on the global economy and the outlook for corporate earnings. The virus causes a respiratory disease known as COVID-19. On March 11, 2020 the World Health Organization declared the COVID-19 outbreak a pandemic, citing sustained risk of further global spread.
In the weeks following, as the crisis worsened, we witnessed an escalating human tragedy with wide-scale social and economic consequences from coronavirus-containment measures. The outbreak of COVID-19 prompted a number of measures to limit the spread, including travel and border restrictions, quarantines, and restrictions on large gatherings. In turn, these resulted in lower consumer activity, diminished demand for a wide range of products and services, disruption in manufacturing and supply chains, and – given the wide variability in outcomes regarding the outbreak – significant market uncertainty and volatility. Amid the turmoil, global governments and central banks took unprecedented action to help support consumers, businesses, and the broader economies, and to limit disruption to financial systems.
The situation continues to unfold, and the extent and duration of its impact on financial markets and the economy remain highly uncertain. Extreme events such as the coronavirus crisis are “exogenous shocks” that can have significant adverse effects on mutual funds and their investments. Although multiple asset classes may be affected by market disruption, the duration and impact may not be the same for all types of assets.
Fidelity is committed to helping you stay informed amid news about COVID-19 and during increased market volatility, and we’re taking extra steps to be responsive to customer needs. We encourage you to visit our websites, where we offer ongoing updates, commentary, and analysis on the markets and our funds.
Investment Summary (Unaudited)
Top Ten Stocks as of July 31, 2021
| | % of fund's net assets |
| JPMorgan Chase & Co. | 3.3 |
| Bank of America Corp. | 2.5 |
| Johnson & Johnson | 2.2 |
| Wells Fargo & Co. | 2.2 |
| Danaher Corp. | 2.2 |
| UnitedHealth Group, Inc. | 2.2 |
| The Walt Disney Co. | 1.9 |
| Procter & Gamble Co. | 1.8 |
| Comcast Corp. Class A | 1.8 |
| Cisco Systems, Inc. | 1.8 |
| | 21.9 |
Top Five Market Sectors as of July 31, 2021
| | % of fund's net assets |
| Financials | 18.9 |
| Health Care | 18.2 |
| Industrials | 11.3 |
| Information Technology | 10.6 |
| Communication Services | 8.6 |
Asset Allocation (% of fund's net assets)
| As of July 31, 2021* |
| | Stocks | 97.8% |
| | Short-Term Investments and Net Other Assets (Liabilities) | 2.2% |

* Foreign investments - 17.7%
Schedule of Investments July 31, 2021 (Unaudited)
Showing Percentage of Net Assets
| Common Stocks - 97.8% | | | |
| | | Shares | Value |
| COMMUNICATION SERVICES - 8.6% | | | |
| Diversified Telecommunication Services - 0.8% | | | |
| AT&T, Inc. | | 9,394 | $263,502 |
| Verizon Communications, Inc. | | 10,901 | 608,058 |
| | | | 871,560 |
| Entertainment - 1.9% | | | |
| The Walt Disney Co. (a) | | 11,590 | 2,040,072 |
| Interactive Media & Services - 1.4% | | | |
| Alphabet, Inc. Class A (a) | | 537 | 1,446,963 |
| Media - 3.3% | | | |
| Comcast Corp. Class A | | 33,444 | 1,967,511 |
| Interpublic Group of Companies, Inc. | | 24,287 | 858,788 |
| Shaw Communications, Inc. Class B | | 9,549 | 278,908 |
| WPP PLC | | 39,291 | 508,152 |
| | | | 3,613,359 |
| Wireless Telecommunication Services - 1.2% | | | |
| Rogers Communications, Inc. Class B (non-vtg.) | | 2,046 | 104,432 |
| T-Mobile U.S., Inc. (a) | | 8,505 | 1,224,890 |
| | | | 1,329,322 |
|
| TOTAL COMMUNICATION SERVICES | | | 9,301,276 |
|
| CONSUMER DISCRETIONARY - 6.3% | | | |
| Hotels, Restaurants & Leisure - 1.2% | | | |
| McDonald's Corp. | | 5,246 | 1,273,257 |
| Household Durables - 0.6% | | | |
| Tempur Sealy International, Inc. | | 14,468 | 626,030 |
| Internet & Direct Marketing Retail - 0.2% | | | |
| eBay, Inc. | | 4,121 | 281,093 |
| Multiline Retail - 1.6% | | | |
| Kohl's Corp. | | 10,439 | 530,301 |
| Nordstrom, Inc. (a) | | 6,452 | 213,561 |
| Target Corp. | | 3,663 | 956,226 |
| | | | 1,700,088 |
| Specialty Retail - 1.9% | | | |
| Best Buy Co., Inc. | | 2,940 | 330,309 |
| Burlington Stores, Inc. (a) | | 1,719 | 575,521 |
| Dick's Sporting Goods, Inc. | | 3,085 | 321,272 |
| Lowe's Companies, Inc. | | 1,473 | 283,832 |
| The Home Depot, Inc. | | 880 | 288,807 |
| TJX Companies, Inc. | | 4,096 | 281,846 |
| | | | 2,081,587 |
| Textiles, Apparel & Luxury Goods - 0.8% | | | |
| PVH Corp. (a) | | 3,043 | 318,359 |
| Tapestry, Inc. (a) | | 12,499 | 528,708 |
| | | | 847,067 |
|
| TOTAL CONSUMER DISCRETIONARY | | | 6,809,122 |
|
| CONSUMER STAPLES - 7.9% | | | |
| Beverages - 2.3% | | | |
| Diageo PLC | | 11,399 | 565,234 |
| Keurig Dr. Pepper, Inc. | | 22,666 | 798,070 |
| The Coca-Cola Co. | | 20,226 | 1,153,489 |
| | | | 2,516,793 |
| Food & Staples Retailing - 2.0% | | | |
| BJ's Wholesale Club Holdings, Inc. (a) | | 6,917 | 350,277 |
| Costco Wholesale Corp. | | 1,125 | 483,435 |
| Walmart, Inc. | | 9,189 | 1,309,892 |
| | | | 2,143,604 |
| Food Products - 1.8% | | | |
| Bunge Ltd. | | 3,679 | 285,601 |
| Lamb Weston Holdings, Inc. | | 6,209 | 414,575 |
| Mondelez International, Inc. | | 15,568 | 984,832 |
| Nestle SA (Reg. S) | | 2,331 | 295,174 |
| | | | 1,980,182 |
| Household Products - 1.8% | | | |
| Procter & Gamble Co. | | 14,052 | 1,998,616 |
|
| TOTAL CONSUMER STAPLES | | | 8,639,195 |
|
| ENERGY - 5.4% | | | |
| Oil, Gas & Consumable Fuels - 5.4% | | | |
| Canadian Natural Resources Ltd. | | 15,053 | 496,739 |
| ConocoPhillips Co. | | 9,277 | 520,069 |
| Enterprise Products Partners LP | | 22,691 | 512,136 |
| Exxon Mobil Corp. | | 33,028 | 1,901,422 |
| Hess Corp. | | 4,383 | 335,037 |
| Imperial Oil Ltd. | | 16,909 | 463,249 |
| Phillips 66 Co. | | 7,035 | 516,580 |
| Suncor Energy, Inc. | | 33,063 | 650,872 |
| Thungela Resources Ltd. (a) | | 678 | 2,101 |
| Valero Energy Corp. | | 7,396 | 495,310 |
| | | | 5,893,515 |
| FINANCIALS - 18.9% | | | |
| Banks - 12.3% | | | |
| Bank of America Corp. | | 69,761 | 2,676,032 |
| Citigroup, Inc. | | 21,355 | 1,444,025 |
| Huntington Bancshares, Inc./Ohio | | 45,704 | 643,512 |
| JPMorgan Chase & Co. | | 23,805 | 3,613,115 |
| M&T Bank Corp. | | 8,610 | 1,152,449 |
| PNC Financial Services Group, Inc. | | 8,265 | 1,507,619 |
| Wells Fargo & Co. | | 52,119 | 2,394,347 |
| | | | 13,431,099 |
| Capital Markets - 1.7% | | | |
| BlackRock, Inc. Class A | | 1,165 | 1,010,253 |
| KKR & Co. LP | | 12,721 | 811,091 |
| | | | 1,821,344 |
| Consumer Finance - 1.6% | | | |
| Capital One Financial Corp. | | 10,730 | 1,735,041 |
| Insurance - 3.3% | | | |
| American Financial Group, Inc. | | 4,464 | 564,651 |
| American International Group, Inc. | | 7,761 | 367,483 |
| Chubb Ltd. | | 5,662 | 955,406 |
| Hartford Financial Services Group, Inc. | | 7,992 | 508,451 |
| Old Republic International Corp. | | 18,020 | 444,373 |
| The Travelers Companies, Inc. | | 4,922 | 732,984 |
| | | | 3,573,348 |
|
| TOTAL FINANCIALS | | | 20,560,832 |
|
| HEALTH CARE - 18.2% | | | |
| Biotechnology - 2.6% | | | |
| AbbVie, Inc. | | 11,754 | 1,366,990 |
| Amgen, Inc. | | 6,118 | 1,477,742 |
| | | | 2,844,732 |
| Health Care Equipment & Supplies - 2.2% | | | |
| Danaher Corp. | | 8,043 | 2,392,712 |
| Health Care Providers & Services - 3.0% | | | |
| Cigna Corp. | | 3,994 | 916,583 |
| UnitedHealth Group, Inc. | | 5,734 | 2,363,669 |
| | | | 3,280,252 |
| Pharmaceuticals - 10.4% | | | |
| AstraZeneca PLC (United Kingdom) | | 9,205 | 1,057,745 |
| Bristol-Myers Squibb Co. | | 28,021 | 1,901,785 |
| Eli Lilly & Co. | | 7,129 | 1,735,912 |
| Johnson & Johnson | | 14,094 | 2,426,987 |
| Merck & Co., Inc. | | 20,138 | 1,548,008 |
| Roche Holding AG (participation certificate) | | 2,872 | 1,109,489 |
| Sanofi SA | | 14,060 | 1,449,211 |
| | | | 11,229,137 |
|
| TOTAL HEALTH CARE | | | 19,746,833 |
|
| INDUSTRIALS - 11.3% | | | |
| Aerospace & Defense - 2.1% | | | |
| Huntington Ingalls Industries, Inc. | | 1,241 | 254,566 |
| Northrop Grumman Corp. | | 2,516 | 913,358 |
| The Boeing Co. (a) | | 4,735 | 1,072,383 |
| | | | 2,240,307 |
| Air Freight & Logistics - 1.4% | | | |
| Deutsche Post AG | | 7,957 | 539,256 |
| United Parcel Service, Inc. Class B | | 5,324 | 1,018,801 |
| | | | 1,558,057 |
| Building Products - 0.8% | | | |
| Johnson Controls International PLC | | 11,851 | 846,398 |
| Electrical Equipment - 0.8% | | | |
| AMETEK, Inc. | | 6,512 | 905,494 |
| Industrial Conglomerates - 2.9% | | | |
| General Electric Co. | | 98,819 | 1,279,706 |
| Hitachi Ltd. | | 4,700 | 270,340 |
| Roper Technologies, Inc. | | 2,077 | 1,020,513 |
| Siemens AG | | 3,388 | 528,640 |
| | | | 3,099,199 |
| Machinery - 2.5% | | | |
| Crane Co. | | 3,273 | 318,234 |
| Fortive Corp. | | 7,216 | 524,315 |
| ITT, Inc. | | 6,512 | 637,590 |
| Nordson Corp. | | 2,008 | 454,069 |
| Otis Worldwide Corp. | | 8,930 | 799,682 |
| | | | 2,733,890 |
| Marine - 0.2% | | | |
| A.P. Moller - Maersk A/S Series B | | 93 | 258,096 |
| Trading Companies & Distributors - 0.3% | | | |
| Watsco, Inc. | | 1,131 | 319,440 |
| Transportation Infrastructure - 0.3% | | | |
| Aena SME SA (a)(b) | | 2,200 | 350,228 |
|
| TOTAL INDUSTRIALS | | | 12,311,109 |
|
| INFORMATION TECHNOLOGY - 10.6% | | | |
| Communications Equipment - 1.8% | | | |
| Cisco Systems, Inc. | | 34,753 | 1,924,274 |
| IT Services - 2.6% | | | |
| Accenture PLC Class A | | 2,509 | 797,059 |
| Amdocs Ltd. | | 14,599 | 1,125,729 |
| Genpact Ltd. | | 12,493 | 622,276 |
| Visa, Inc. Class A | | 1,171 | 288,523 |
| | | | 2,833,587 |
| Semiconductors & Semiconductor Equipment - 2.7% | | | |
| NXP Semiconductors NV | | 6,126 | 1,264,345 |
| Qualcomm, Inc. | | 3,612 | 541,078 |
| Taiwan Semiconductor Manufacturing Co. Ltd. sponsored ADR | | 9,159 | 1,068,306 |
| | | | 2,873,729 |
| Software - 2.1% | | | |
| Microsoft Corp. | | 5,043 | 1,436,801 |
| NortonLifeLock, Inc. | | 12,088 | 300,024 |
| Open Text Corp. | | 10,825 | 562,248 |
| | | | 2,299,073 |
| Technology Hardware, Storage & Peripherals - 1.4% | | | |
| Apple, Inc. | | 3,750 | 546,975 |
| Samsung Electronics Co. Ltd. | | 14,847 | 1,011,043 |
| | | | 1,558,018 |
|
| TOTAL INFORMATION TECHNOLOGY | | | 11,488,681 |
|
| MATERIALS - 2.9% | | | |
| Chemicals - 1.2% | | | |
| Linde PLC | | 3,748 | 1,152,098 |
| Nutrien Ltd. | | 1,801 | 107,084 |
| | | | 1,259,182 |
| Containers & Packaging - 1.3% | | | |
| Crown Holdings, Inc. | | 7,618 | 759,972 |
| Packaging Corp. of America | | 4,585 | 648,778 |
| | | | 1,408,750 |
| Metals & Mining - 0.4% | | | |
| Anglo American PLC (United Kingdom) | | 7,962 | 352,828 |
| Lundin Mining Corp. | | 12,225 | 111,413 |
| | | | 464,241 |
|
| TOTAL MATERIALS | | | 3,132,173 |
|
| REAL ESTATE - 2.3% | | | |
| Equity Real Estate Investment Trusts (REITs) - 2.3% | | | |
| American Tower Corp. | | 2,612 | 738,674 |
| Lamar Advertising Co. Class A | | 10,383 | 1,106,828 |
| Public Storage | | 2,038 | 636,834 |
| | | | 2,482,336 |
| UTILITIES - 5.4% | | | |
| Electric Utilities - 2.7% | | | |
| Exelon Corp. | | 13,805 | 646,074 |
| NextEra Energy, Inc. | | 19,015 | 1,481,269 |
| NRG Energy, Inc. | | 15,297 | 630,848 |
| PG&E Corp. (a) | | 18,994 | 166,957 |
| | | | 2,925,148 |
| Independent Power and Renewable Electricity Producers - 0.5% | | | |
| Vistra Corp. | | 26,437 | 506,269 |
| Multi-Utilities - 2.2% | | | |
| Ameren Corp. | | 6,066 | 509,059 |
| CenterPoint Energy, Inc. | | 18,709 | 476,331 |
| Dominion Energy, Inc. | | 11,265 | 843,411 |
| WEC Energy Group, Inc. | | 5,962 | 561,263 |
| | | | 2,390,064 |
|
| TOTAL UTILITIES | | | 5,821,481 |
|
| TOTAL COMMON STOCKS | | | |
| (Cost $87,008,663) | | | 106,186,553 |
|
| Money Market Funds - 2.2% | | | |
| Fidelity Cash Central Fund 0.06% (c) | | | |
| (Cost $2,411,842) | | 2,411,360 | 2,411,842 |
| TOTAL INVESTMENT IN SECURITIES - 100.0% | | | |
| (Cost $89,420,505) | | | 108,598,395 |
| NET OTHER ASSETS (LIABILITIES) - 0.0% | | | 46,158 |
| NET ASSETS - 100% | | | $108,644,553 |
Legend
(a) Non-income producing
(b) Security exempt from registration under Rule 144A of the Securities Act of 1933. These securities may be resold in transactions exempt from registration, normally to qualified institutional buyers. At the end of the period, the value of these securities amounted to $350,228 or 0.3% of net assets.
(c) Affiliated fund that is generally available only to investment companies and other accounts managed by Fidelity Investments. The rate quoted is the annualized seven-day yield of the fund at period end. A complete unaudited listing of the fund's holdings as of its most recent quarter end is available upon request. In addition, each Fidelity Central Fund's financial statements are available on the SEC's website or upon request.
Affiliated Central Funds
Information regarding fiscal year to date income earned by the Fund from investments in Fidelity Central Funds is as follows:
| Fund | Income earned |
| Fidelity Cash Central Fund | $678 |
| Fidelity Securities Lending Cash Central Fund | 223 |
| Total | $901 |
Amounts in the income column in the above table include any capital gain distributions from underlying funds, which are presented in the corresponding line-item in the Statement of Operations, if applicable. Amount for Fidelity Securities Lending Cash Central Fund represents the income earned on investing cash collateral, less rebates paid to borrowers and any lending agent fees associated with the loan, plus any premium payments received for lending certain types of securities.
Fiscal year to date information regarding the Fund's investments in Fidelity Central Funds, including the ownership percentage, is presented below.
| Fund | Value, beginning of period | Purchases | Sales Proceeds | Realized Gain/Loss | Change in Unrealized appreciation (depreciation) | Value, end of period | % ownership, end of period |
| Fidelity Cash Central Fund 0.06% | $1,322,775 | $12,143,516 | $11,054,449 | $-- | $-- | $2,411,842 | 0.0% |
| Fidelity Securities Lending Cash Central Fund 0.06% | 338,975 | 951,889 | 1,290,864 | -- | -- | -- | 0.0% |
| Total | $1,661,750 | $13,095,405 | $12,345,313 | $-- | $-- | $2,411,842 | |
Investment Valuation
The following is a summary of the inputs used, as of July 31, 2021, involving the Fund's assets and liabilities carried at fair value. The inputs or methodology used for valuing securities may not be an indication of the risk associated with investing in those securities. For more information on valuation inputs, and their aggregation into the levels used below, please refer to the Investment Valuation section in the accompanying Notes to Financial Statements.
| | Valuation Inputs at Reporting Date: |
| Description | Total | Level 1 | Level 2 | Level 3 |
| Investments in Securities: | | | | |
| Equities: | | | | |
| Communication Services | $9,301,276 | $8,793,124 | $508,152 | $-- |
| Consumer Discretionary | 6,809,122 | 6,809,122 | -- | -- |
| Consumer Staples | 8,639,195 | 7,778,787 | 860,408 | -- |
| Energy | 5,893,515 | 5,893,515 | -- | -- |
| Financials | 20,560,832 | 20,560,832 | -- | -- |
| Health Care | 19,746,833 | 16,130,388 | 3,616,445 | -- |
| Industrials | 12,311,109 | 10,714,777 | 1,596,332 | -- |
| Information Technology | 11,488,681 | 11,488,681 | -- | -- |
| Materials | 3,132,173 | 2,779,345 | 352,828 | -- |
| Real Estate | 2,482,336 | 2,482,336 | -- | -- |
| Utilities | 5,821,481 | 5,821,481 | -- | -- |
| Money Market Funds | 2,411,842 | 2,411,842 | -- | -- |
| Total Investments in Securities: | $108,598,395 | $101,664,230 | $6,934,165 | $-- |
Other Information
Distribution of investments by country or territory of incorporation, as a percentage of Total Net Assets, is as follows (Unaudited):
| United States of America | 82.3% |
| Ireland | 2.6% |
| Canada | 2.5% |
| Switzerland | 2.2% |
| United Kingdom | 1.8% |
| France | 1.4% |
| Netherlands | 1.2% |
| Bailiwick of Guernsey | 1.0% |
| Taiwan | 1.0% |
| Germany | 1.0% |
| Others (Individually Less Than 1%) | 3.0% |
| | 100.0% |
See accompanying notes which are an integral part of the financial statements.
Financial Statements
Statement of Assets and Liabilities
| | | July 31, 2021 (Unaudited) |
| Assets | | |
Investment in securities, at value — See accompanying schedule:
Unaffiliated issuers (cost $87,008,663) | $106,186,553 | |
| Fidelity Central Funds (cost $2,411,842) | 2,411,842 | |
| Total Investment in Securities (cost $89,420,505) | | $108,598,395 |
| Receivable for fund shares sold | | 75,119 |
| Dividends receivable | | 144,026 |
| Distributions receivable from Fidelity Central Funds | | 133 |
| Other receivables | | 1,327 |
| Total assets | | 108,819,000 |
| Liabilities | | |
| Payable for fund shares redeemed | $143,639 | |
| Accrued management fee | 30,808 | |
| Total liabilities | | 174,447 |
| Net Assets | | $108,644,553 |
| Net Assets consist of: | | |
| Paid in capital | | $87,790,710 |
| Total accumulated earnings (loss) | | 20,853,843 |
| Net Assets | | $108,644,553 |
| Net Asset Value, offering price and redemption price per share ($108,644,553 ÷ 8,083,458 shares) | | $13.44 |
See accompanying notes which are an integral part of the financial statements.
Statement of Operations
| | | Six months ended July 31, 2021 (Unaudited) |
| Investment Income | | |
| Dividends | | $962,551 |
| Income from Fidelity Central Funds (including $223 from security lending) | | 901 |
| Total income | | 963,452 |
| Expenses | | |
| Management fee | $148,753 | |
| Independent trustees' fees and expenses | 149 | |
| Total expenses before reductions | 148,902 | |
| Expense reductions | (2,845) | |
| Total expenses after reductions | | 146,057 |
| Net investment income (loss) | | 817,395 |
| Realized and Unrealized Gain (Loss) | | |
| Net realized gain (loss) on: | | |
| Investment securities: | | |
| Unaffiliated issuers | 3,135,377 | |
| Foreign currency transactions | (1,965) | |
| Total net realized gain (loss) | | 3,133,412 |
| Change in net unrealized appreciation (depreciation) on: | | |
| Investment securities: | | |
| Unaffiliated issuers | 8,508,468 | |
| Assets and liabilities in foreign currencies | (21) | |
| Total change in net unrealized appreciation (depreciation) | | 8,508,447 |
| Net gain (loss) | | 11,641,859 |
| Net increase (decrease) in net assets resulting from operations | | $12,459,254 |
See accompanying notes which are an integral part of the financial statements.
Statement of Changes in Net Assets
| | Six months ended July 31, 2021 (Unaudited) | Year ended January 31, 2021 |
| Increase (Decrease) in Net Assets | | |
| Operations | | |
| Net investment income (loss) | $817,395 | $1,056,508 |
| Net realized gain (loss) | 3,133,412 | (1,601,329) |
| Change in net unrealized appreciation (depreciation) | 8,508,447 | 6,731,655 |
| Net increase (decrease) in net assets resulting from operations | 12,459,254 | 6,186,834 |
| Distributions to shareholders | (757,085) | (1,074,032) |
| Share transactions | | |
| Proceeds from sales of shares | 41,322,118 | 23,475,441 |
| Reinvestment of distributions | 757,085 | 1,074,032 |
| Cost of shares redeemed | (9,194,414) | (14,135,739) |
| Net increase (decrease) in net assets resulting from share transactions | 32,884,789 | 10,413,734 |
| Total increase (decrease) in net assets | 44,586,958 | 15,526,536 |
| Net Assets | | |
| Beginning of period | 64,057,595 | 48,531,059 |
| End of period | $108,644,553 | $64,057,595 |
| Other Information | | |
| Shares | | |
| Sold | 3,135,905 | 2,433,324 |
| Issued in reinvestment of distributions | 57,477 | 110,007 |
| Redeemed | (710,117) | (1,423,790) |
| Net increase (decrease) | 2,483,265 | 1,119,541 |
See accompanying notes which are an integral part of the financial statements.
Financial Highlights
Fidelity Equity-Income K6 Fund
| | Six months ended (Unaudited) July 31, | Years endedJanuary 31, | |
| | 2021 | 2021 | 2020 A |
| Selected Per–Share Data | | | |
| Net asset value, beginning of period | $11.44 | $10.83 | $10.00 |
| Income from Investment Operations | | | |
| Net investment income (loss)B | .12 | .20 | .12 |
| Net realized and unrealized gain (loss) | 1.99 | .62 | .79 |
| Total from investment operations | 2.11 | .82 | .91 |
| Distributions from net investment income | (.11) | (.20) | (.08) |
| Distributions from net realized gain | – | (.01) | –C |
| Total distributions | (.11) | (.21) | (.08) |
| Net asset value, end of period | $13.44 | $11.44 | $10.83 |
| Total ReturnD,E | 18.45% | 7.97% | 9.14% |
| Ratios to Average Net AssetsF,G | | | |
| Expenses before reductions | .34%H | .34% | .34%H |
| Expenses net of fee waivers, if any | .34%H | .34% | .34%H |
| Expenses net of all reductions | .33%H | .34% | .34%H |
| Net investment income (loss) | 1.86%H | 1.98% | 1.78%H |
| Supplemental Data | | | |
| Net assets, end of period (000 omitted) | $108,645 | $64,058 | $48,531 |
| Portfolio turnover rateI | 69%H,J | 70%J | 21%H,J |
A For the period June 13, 2019 (commencement of operations) to January 31, 2020.
B Calculated based on average shares outstanding during the period.
C Amount represents less than $.005 per share.
D Total returns for periods of less than one year are not annualized.
E Total returns would have been lower if certain expenses had not been reduced during the applicable periods shown.
F Fees and expenses of any underlying mutual funds or exchange-traded funds (ETFs) are not included in the Fund's expense ratio. The Fund indirectly bears its proportionate share of these expenses. For additional expense information related to investments in Fidelity Central Funds, please refer to the "Investments in Fidelity Central Funds" note found in the Notes to Financial Statements section of the most recent Annual or Semi-Annual report.
G Expense ratios reflect operating expenses of the class. Expenses before reductions do not reflect amounts reimbursed, waived, or reduced through arrangements with the investment advisor, brokerage services, or other offset arrangements, if applicable, and do not represent the amount paid by the class during periods when reimbursements, waivers or reductions occur.
H Annualized
I Amount does not include the portfolio activity of any underlying mutual funds or exchange-traded funds (ETFs).
J Portfolio turnover rate excludes securities received or delivered in-kind.
See accompanying notes which are an integral part of the financial statements.
Notes to Financial Statements (Unaudited)
For the period ended July 31, 2021
1. Organization.
Fidelity Equity-Income K6 Fund (the Fund) is a fund of Fidelity Devonshire Trust (the Trust) and is authorized to issue an unlimited number of shares. Share transactions on the Statement of Changes in Net Assets may contain exchanges between affiliated funds. The Trust is registered under the Investment Company Act of 1940, as amended (the 1940 Act), as an open-end management investment company organized as a Massachusetts business trust. Shares generally are available only to employer-sponsored retirement plans that are recordkept by Fidelity, or to certain employer-sponsored retirement plans that are not recordkept by Fidelity.
2. Investments in Fidelity Central Funds.
Funds may invest in Fidelity Central Funds, which are open-end investment companies generally available only to other investment companies and accounts managed by the investment adviser and its affiliates. The Schedule of Investments lists any Fidelity Central Funds held as an investment as of period end, but does not include the underlying holdings of each Fidelity Central Fund. An investing fund indirectly bears its proportionate share of the expenses of the underlying Fidelity Central Funds.
Based on its investment objective, each Fidelity Central Fund may invest or participate in various investment vehicles or strategies that are similar to those of the investing fund. These strategies are consistent with the investment objectives of the investing fund and may involve certain economic risks which may cause a decline in value of each of the Fidelity Central Funds and thus a decline in the value of the investing fund.
| Fidelity Central Fund | Investment Manager | Investment Objective | Investment Practices | Expense Ratio(a) |
| Fidelity Money Market Central Funds | Fidelity Management & Research Company LLC (FMR) | Each fund seeks to obtain a high level of current income consistent with the preservation of capital and liquidity. | Short-term Investments | Ranged from less than .005% to .01% |
(a) Expenses expressed as a percentage of average net assets and are as of each underlying Central Fund's most recent annual or semi-annual shareholder report.
A complete unaudited list of holdings for each Fidelity Central Fund is available upon request or at the Securities and Exchange Commission website at www.sec.gov. In addition, the financial statements of the Fidelity Central Funds which contain the significant accounting policies (including investment valuation policies) of those funds, and are not covered by the Report of Independent Registered Public Accounting Firm, are available on the Securities and Exchange Commission website or upon request.
3. Significant Accounting Policies.
The Fund is an investment company and applies the accounting and reporting guidance of the Financial Accounting Standards Board (FASB) Accounting Standards Codification Topic 946 Financial Services - Investment Companies. The financial statements have been prepared in conformity with accounting principles generally accepted in the United States of America (GAAP), which require management to make certain estimates and assumptions at the date of the financial statements. Actual results could differ from those estimates. Subsequent events, if any, through the date that the financial statements were issued have been evaluated in the preparation of the financial statements. The Fund's Schedule of Investments lists any underlying mutual funds or exchange-traded funds (ETFs) but does not include the underlying holdings of these funds. The following summarizes the significant accounting policies of the Fund:
Investment Valuation. Investments are valued as of 4:00 p.m. Eastern time on the last calendar day of the period. The Board of Trustees (the Board) has delegated the day to day responsibility for the valuation of the Fund's investments to the Fair Value Committee (the Committee) established by the Fund's investment adviser. In accordance with valuation policies and procedures approved by the Board, the Fund attempts to obtain prices from one or more third party pricing vendors or brokers to value its investments. When current market prices, quotations or currency exchange rates are not readily available or reliable, investments will be fair valued in good faith by the Committee, in accordance with procedures adopted by the Board. Factors used in determining fair value vary by investment type and may include market or investment specific events. The frequency with which these procedures are used cannot be predicted and they may be utilized to a significant extent. The Committee oversees the Fund's valuation policies and procedures and reports to the Board on the Committee's activities and fair value determinations. The Board monitors the appropriateness of the procedures used in valuing the Fund's investments and ratifies the fair value determinations of the Committee.
The Fund categorizes the inputs to valuation techniques used to value its investments into a disclosure hierarchy consisting of three levels as shown below:
- Level 1 – quoted prices in active markets for identical investments
- Level 2 – other significant observable inputs (including quoted prices for similar investments, interest rates, prepayment speeds, etc.)
- Level 3 – unobservable inputs (including the Fund's own assumptions based on the best information available)
Valuation techniques used to value the Fund's investments by major category are as follows:
Equity securities, including restricted securities, for which market quotations are readily available, are valued at the last reported sale price or official closing price as reported by a third party pricing vendor on the primary market or exchange on which they are traded and are categorized as Level 1 in the hierarchy. In the event there were no sales during the day or closing prices are not available, securities are valued at the last quoted bid price or may be valued using the last available price and are generally categorized as Level 2 in the hierarchy. For foreign equity securities, when market or security specific events arise, comparisons to the valuation of American Depositary Receipts (ADRs), futures contracts, Exchange-Traded Funds (ETFs) and certain indexes as well as quoted prices for similar securities may be used and would be categorized as Level 2 in the hierarchy. For equity securities, including restricted securities, where observable inputs are limited, assumptions about market activity and risk are used and these securities may be categorized as Level 3 in the hierarchy.
Investments in open-end mutual funds, including the Fidelity Central Funds, are valued at their closing net asset value (NAV) each business day and are categorized as Level 1 in the hierarchy.
Changes in valuation techniques may result in transfers in or out of an assigned level within the disclosure hierarchy. The aggregate value of investments by input level as of July 31, 2021 is included at the end of the Fund's Schedule of Investments.
Foreign Currency. Certain Funds may use foreign currency contracts to facilitate transactions in foreign-denominated securities. Gains and losses from these transactions may arise from changes in the value of the foreign currency or if the counterparties do not perform under the contracts' terms.
Foreign-denominated assets, including investment securities, and liabilities are translated into U.S. dollars at the exchange rates at period end. Purchases and sales of investment securities, income and dividends received, and expenses denominated in foreign currencies are translated into U.S. dollars at the exchange rate in effect on the transaction date.
The effects of exchange rate fluctuations on investments are included with the net realized and unrealized gain (loss) on investment securities. Other foreign currency transactions resulting in realized and unrealized gain (loss) are disclosed separately.
Investment Transactions and Income. For financial reporting purposes, the Fund's investment holdings and NAV include trades executed through the end of the last business day of the period. The NAV per share for processing shareholder transactions is calculated as of the close of business of the New York Stock Exchange (NYSE), normally 4:00 p.m. Eastern time and includes trades executed through the end of the prior business day. Gains and losses on securities sold are determined on the basis of identified cost. Dividend income is recorded on the ex-dividend date, except for certain dividends from foreign securities where the ex-dividend date may have passed, which are recorded as soon as the Fund is informed of the ex-dividend date. Non-cash dividends included in dividend income, if any, are recorded at the fair market value of the securities received. Income and capital gain distributions from Fidelity Central Funds, if any, are recorded on the ex-dividend date. Certain distributions received by the Fund represent a return of capital or capital gain. The Fund determines the components of these distributions subsequent to the ex-dividend date, based upon receipt of tax filings or other correspondence relating to the underlying investment. These distributions are recorded as a reduction of cost of investments and/or as a realized gain. Investment income is recorded net of foreign taxes withheld where recovery of such taxes is uncertain.
Expenses. Expenses directly attributable to a fund are charged to that fund. Expenses attributable to more than one fund are allocated among the respective funds on the basis of relative net assets or other appropriate methods. Expenses included in the accompanying financial statements reflect the expenses of that fund and do not include any expenses associated with any underlying mutual funds or exchange-traded funds. Although not included in a fund's expenses, a fund indirectly bears its proportionate share of these expenses through the net asset value of each underlying mutual fund or exchange-traded fund. Expense estimates are accrued in the period to which they relate and adjustments are made when actual amounts are known.
Income Tax Information and Distributions to Shareholders. Each year, the Fund intends to qualify as a regulated investment company under Subchapter M of the Internal Revenue Code, including distributing substantially all of its taxable income and realized gains. As a result, no provision for U.S. Federal income taxes is required. The Fund files a U.S. federal tax return, in addition to state and local tax returns as required. The Fund's federal income tax returns are subject to examination by the Internal Revenue Service (IRS) for a period of three fiscal years after they are filed. State and local tax returns may be subject to examination for an additional fiscal year depending on the jurisdiction. Foreign taxes are provided for based on the Fund's understanding of the tax rules and rates that exist in the foreign markets in which it invests.
Distributions are declared and recorded on the ex-dividend date. Income and capital gain distributions are determined in accordance with income tax regulations, which may differ from GAAP.
Capital accounts within the financial statements are adjusted for permanent book-tax differences. These adjustments have no impact on net assets or the results of operations. Capital accounts are not adjusted for temporary book-tax differences which will reverse in a subsequent period.
Book-tax differences are primarily due to foreign currency transactions, passive foreign investment companies (PFIC), partnerships, capital loss carryforwards and losses deferred due to wash sales.
As of period end, the cost and unrealized appreciation (depreciation) in securities, and derivatives if applicable, for federal income tax purposes were as follows:
| Gross unrealized appreciation | $20,101,149 |
| Gross unrealized depreciation | (1,347,246) |
| Net unrealized appreciation (depreciation) | $18,753,903 |
| Tax cost | $89,844,492 |
Capital loss carryforwards are only available to offset future capital gains of the Fund to the extent provided by regulations and may be limited. The capital loss carryforward information presented below, including any applicable limitation, is estimated as of prior fiscal period end and is subject to adjustment.
| No expiration | |
| Short-term | $(994,971) |
Restricted Securities (including Private Placements). Funds may invest in securities that are subject to legal or contractual restrictions on resale. These securities generally may be resold in transactions exempt from registration or to the public if the securities are registered. Disposal of these securities may involve time-consuming negotiations and expense, and prompt sale at an acceptable price may be difficult. Information regarding restricted securities held at period end is included at the end of the Schedule of Investments, if applicable.
4. Purchases and Sales of Investments.
Purchases and sales of securities, other than short-term securities and in-kind transactions, as applicable, are noted in the table below.
| | Purchases ($) | Sales ($) |
| Fidelity Equity-Income K6 Fund | 30,945,292 | 27,491,317 |
Unaffiliated Exchanges In-Kind. Shares that were exchanged for investments, including accrued interest and cash, if any, are shown in the table below. The amount of in-kind exchanges is included in share transactions in the accompanying Statement of Changes in Net Assets.
| | Shares | Total Proceeds
($) |
| Fidelity Equity-Income K6 Fund | 2,202,584 | 29,474,296 |
Prior Year Unaffiliated Exchanges In-Kind. Shares that were exchanged for investments, including accrued interest and cash, if any, are shown in the table below. The amount of in-kind exchanges is included in share transactions in the accompanying Statement of Changes in Net Assets.
| | Shares | Total Proceeds
($) |
| Fidelity Equity-Income K6 Fund | 109,169 | 1,115,704 |
5. Fees and Other Transactions with Affiliates.
Management Fee. Fidelity Management & Research Company LLC (the investment adviser) and its affiliates provide the Fund with investment management related services for which the Fund pays a monthly management fee that is based on an annual rate of .34% of average net assets. Under the management contract, the investment adviser or an affiliate pays all other expenses of the Fund, excluding fees and expenses of the independent Trustees, and certain miscellaneous expenses such as proxy and shareholder meeting expenses.
Brokerage Commissions. A portion of portfolio transactions were placed with brokerage firms which are affiliates of the investment adviser. Brokerage commissions are included in net realized gain (loss) and change in net unrealized appreciation (depreciation) in the Statement of Operations. The commissions paid to these affiliated firms were as follows:
| | Amount |
| Fidelity Equity-Income K6 Fund | $610 |
Interfund Trades. Funds may purchase from or sell securities to other Fidelity Funds under procedures adopted by the Board. The procedures have been designed to ensure these interfund trades are executed in accordance with Rule 17a-7 of the 1940 Act. Any interfund trades are included within the respective purchases and sales amounts shown in the Purchases and Sales of Investments note and are noted in the table below.
| | Purchases ($) | Sales ($) |
| Fidelity Equity-Income K6 Fund | 1,673,174 | 1,307,847 |
6. Committed Line of Credit.
Certain Funds participate with other funds managed by the investment adviser or an affiliate in a $4.25 billion credit facility (the "line of credit") to be utilized for temporary or emergency purposes to fund shareholder redemptions or for other short-term liquidity purposes. The commitment fees on the pro-rata portion of the line of credit are borne by the investment adviser. During the period, there were no borrowings on this line of credit.
7. Security Lending.
Funds lend portfolio securities from time to time in order to earn additional income. Lending agents are used, including National Financial Services (NFS), an affiliate of the investment adviser. Pursuant to a securities lending agreement, NFS will receive a fee, which is capped at 9.9% of a fund's daily lending revenue, for its services as lending agent. A fund may lend securities to certain qualified borrowers, including NFS. On the settlement date of the loan, a fund receives collateral (in the form of U.S. Treasury obligations, letters of credit and/or cash) against the loaned securities and maintains collateral in an amount not less than 100% of the market value of the loaned securities during the period of the loan. The market value of the loaned securities is determined at the close of business of a fund and any additional required collateral is delivered to a fund on the next business day. A fund or borrower may terminate the loan at any time, and if the borrower defaults on its obligation to return the securities loaned because of insolvency or other reasons, a fund may apply collateral received from the borrower against the obligation. A fund may experience delays and costs in recovering the securities loaned. Any cash collateral received is invested in the Fidelity Securities Lending Cash Central Fund. Any loaned securities are identified as such in the Schedule of Investments, and the value of loaned securities and cash collateral at period end, as applicable, are presented in the Statement of Assets and Liabilities. Security lending income represents the income earned on investing cash collateral, less rebates paid to borrowers and any lending agent fees associated with the loan, plus any premium payments received for lending certain types of securities. Security lending income is presented in the Statement of Operations as a component of income from Fidelity Central Funds. Affiliated security lending activity, if any, was as follows:
| | Total Security Lending Fees Paid to NFS | Security Lending Income From Securities Loaned to NFS | Value of Securities Loaned to NFS at Period End |
| Fidelity Equity-Income K6 Fund | $23 | $– | $– |
8. Expense Reductions.
Commissions paid to certain brokers with whom the investment adviser, or its affiliates, places trades on behalf of the Fund include an amount in addition to trade execution, which may be rebated back to the Fund to offset expenses. This amount totaled $2,842 for the period. In addition, through arrangements with the Fund's custodian, credits realized as a result of certain uninvested cash balances were used to reduce the Fund's expenses by $3.
9. Other.
Fund's organizational documents provide former and current trustees and officers with a limited indemnification against liabilities arising in connection with the performance of their duties to the fund. In the normal course of business, the fund may also enter into contracts that provide general indemnifications. The fund's maximum exposure under these arrangements is unknown as this would be dependent on future claims that may be made against the fund. The risk of material loss from such claims is considered remote.
10. Coronavirus (COVID-19) Pandemic.
An outbreak of COVID-19 first detected in China during December 2019 has since spread globally and was declared a pandemic by the World Health Organization during March 2020. Developments that disrupt global economies and financial markets, such as the COVID-19 pandemic, may magnify factors that affect the Fund's performance.
Shareholder Expense Example
As a shareholder, you incur two types of costs: (1) transaction costs, which may include sales charges (loads) on purchase payments or redemption proceeds, as applicable and (2) ongoing costs, which generally include management fees, distribution and/or service (12b-1) fees and other Fund expenses. This Example is intended to help you understand your ongoing costs (in dollars) of investing in a fund and to compare these costs with the ongoing costs of investing in other mutual funds.
The Example is based on an investment of $1,000 invested at the beginning of the period and held for the entire period (February 1, 2021 to July 31, 2021).
Actual Expenses
The first line of the accompanying table provides information about actual account values and actual expenses. You may use the information in this line, together with the amount you invested, to estimate the expenses that you paid over the period. Simply divide your account value by $1,000.00 (for example, an $8,600 account value divided by $1,000.00 = 8.6), then multiply the result by the number in the first line for a class/Fund under the heading entitled "Expenses Paid During Period" to estimate the expenses you paid on your account during this period. If any fund is a shareholder of any underlying mutual funds or exchange-traded funds (ETFs) (the Underlying Funds), such fund indirectly bears its proportional share of the expenses of the Underlying Funds in addition to the direct expenses incurred presented in the table. These fees and expenses are not included in the annualized expense ratio used to calculate the expense estimate in the table below.
Hypothetical Example for Comparison Purposes
The second line of the accompanying table provides information about hypothetical account values and hypothetical expenses based on the actual expense ratio and an assumed rate of return of 5% per year before expenses, which is not the actual return. The hypothetical account values and expenses may not be used to estimate the actual ending account balance or expenses you paid for the period. You may use this information to compare the ongoing costs of investing in the Fund and other funds. To do so, compare this 5% hypothetical example with the 5% hypothetical examples that appear in the shareholder reports of the other funds. If any fund is a shareholder of any Underlying Funds, such fund indirectly bears its proportional share of the expenses of the Underlying Funds in addition to the direct expenses as presented in the table. These fees and expenses are not included in the annualized expense ratio used to calculate the expense estimate in the table below.
Please note that the expenses shown in the table are meant to highlight your ongoing costs only and do not reflect any transaction costs. Therefore, the second line of the table is useful in comparing ongoing costs only, and will not help you determine the relative total costs of owning different funds.
| | Annualized Expense Ratio-A | Beginning
Account Value
February 1, 2021 | Ending
Account Value
July 31, 2021 | Expenses Paid
During Period-B
February 1, 2021
to July 31, 2021 |
| Fidelity Equity-Income K6 Fund | .34% | | | |
| Actual | | $1,000.00 | $1,184.50 | $1.84 |
| Hypothetical-C | | $1,000.00 | $1,023.11 | $1.71 |
A Annualized expense ratio reflects expenses net of applicable fee waivers.
B Expenses are equal to the annualized expense ratio, multiplied by the average account value over the period, multiplied by 181/ 365 (to reflect the one-half year period). The fees and expenses of any Underlying Funds are not included in each annualized expense ratio.
C 5% return per year before expenses
Board Approval of Investment Advisory Contracts and Management Fees
Fidelity Equity-Income K6 Fund
Each year, the Board of Trustees, including the Independent Trustees (together, the Board), votes on the renewal of the management contract with Fidelity Management & Research Company LLC (FMR) and the sub-advisory agreements (together, the Advisory Contracts) for the fund. FMR and the sub-advisers are referred to herein as the Investment Advisers. The Board, assisted by the advice of fund counsel and Independent Trustees' counsel, requests and considers a broad range of information relevant to the renewal of the Advisory Contracts throughout the year.
The Board meets regularly and, at each of its meetings, covers an extensive agenda of topics and materials and considers factors that are relevant to its annual consideration of the renewal of the fund's Advisory Contracts, including the services and support provided to the fund and its shareholders. The Board has established various standing committees (Committees), each composed of and chaired by Independent Trustees with varying backgrounds, to which the Board has assigned specific subject matter responsibilities in order to enhance effective decision-making by the Board. The Board, acting directly and through its Committees, requests and receives information concerning the annual consideration of the renewal of the fund's Advisory Contracts. The Board also meets as needed to review matters specifically related to the Board's annual consideration of the renewal of the Advisory Contracts. Members of the Board may also meet with trustees of other Fidelity funds through joint ad hoc committees to discuss certain matters relevant to all of the Fidelity funds.
At its May 2021 meeting, the Board unanimously determined to renew the fund's Advisory Contracts. In reaching its determination, the Board considered all factors it believed relevant, including (i) the nature, extent, and quality of the services provided to the fund and its shareholders (including the investment performance of the fund); (ii) the competitiveness of the fund's management fee and total expense ratio relative to peer funds; (iii) the total costs of the services provided by and the profits realized by Fidelity from its relationships with the fund; and (iv) the extent to which, if any, economies of scale exist and are realized as the fund grows, and whether any economies of scale are appropriately shared with fund shareholders.
In considering whether to renew the Advisory Contracts for the fund, the Board reached a determination, with the assistance of fund counsel and Independent Trustees' counsel and through the exercise of its business judgment, that the renewal of the Advisory Contracts was in the best interests of the fund and its shareholders and that the compensation payable under the Advisory Contracts was fair and reasonable. The Board's decision to renew the Advisory Contracts was not based on any single factor, but rather was based on a comprehensive consideration of all the information provided to the Board at its meetings throughout the year. The Board, in reaching its determination to renew the Advisory Contracts, was aware that shareholders of the fund have a broad range of investment choices available to them, including a wide choice among funds offered by Fidelity's competitors, and that the fund's shareholders, who have the opportunity to review and weigh the disclosure provided by the fund in its prospectus and other public disclosures, have chosen to invest in this fund, which is part of the Fidelity family of funds.
Nature, Extent, and Quality of Services Provided. The Board considered Fidelity's staffing as it relates to the fund, including the backgrounds of investment personnel of Fidelity, and also considered the fund's investment objective, strategies, and related investment philosophy. The Independent Trustees also had discussions with senior management of Fidelity's investment operations and investment groups. The Board considered the structure of the investment personnel compensation program and whether this structure provides appropriate incentives to act in the best interests of the fund. Additionally, the Board considered the portfolio managers' investments, if any, in the funds that they manage.
Resources Dedicated to Investment Management and Support Services. The Board and the Fund Oversight and Research Committees reviewed the general qualifications and capabilities of Fidelity's investment staff, including its size, education, experience, and resources, as well as Fidelity's approach to recruiting, training, managing, and compensating investment personnel. The Board noted that Fidelity has continued to increase the resources devoted to non-U.S. offices, including expansion of Fidelity's global investment organization. The Board also noted that Fidelity's analysts have extensive resources, tools and capabilities that allow them to conduct sophisticated quantitative and fundamental analysis, as well as credit analysis of issuers, counterparties and guarantors. Further, the Board considered that Fidelity's investment professionals have sufficient access to global information and data so as to provide competitive investment results over time, and that those professionals also have access to sophisticated tools that permit them to assess portfolio construction and risk and performance attribution characteristics continuously, as well as to transmit new information and research conclusions rapidly around the world. Additionally, in its deliberations, the Board considered Fidelity's trading, risk management, compliance, and technology and operations capabilities and resources, which are integral parts of the investment management process. The Board also considered Fidelity's investments in business continuity planning, and its success in continuously providing services to the fund notwithstanding the severe disruptions caused by the COVID-19 pandemic.
Shareholder and Administrative Services. The Board considered (i) the nature, extent, quality, and cost of advisory, administrative, and shareholder services performed by the Investment Advisers and their affiliates under the Advisory Contracts and under separate agreements covering transfer agency, pricing and bookkeeping, and securities lending services for the fund; (ii) the nature and extent of the supervision of third party service providers, principally custodians, subcustodians, and pricing vendors; and (iii) the resources devoted to, and the record of compliance with, the fund's compliance policies and procedures. The Board also reviewed the allocation of fund brokerage, including allocations to brokers affiliated with the Investment Advisers, the use of brokerage commissions to pay fund expenses, and the use of "soft" commission dollars to pay for research services.
The Board noted that the growth of fund assets over time across the complex allows Fidelity to reinvest in the development of services designed to enhance the value and convenience of the Fidelity funds as investment vehicles. These services include 24-hour access to account information and market information over the Internet and through telephone representatives, investor education materials and asset allocation tools, and the expanded availability of Fidelity Investor Centers.
The Board noted that, in the past, it and the boards of certain other Fidelity funds had formed an ad hoc Committee on Transfer Agency Fees to review the variety of transfer agency fee structures throughout the industry and Fidelity's competitive positioning with respect to industry participants.
Investment in a Large Fund Family. The Board considered the benefits to shareholders of investing in a Fidelity fund, including the benefits of investing in a fund that is part of a large family of funds offering a variety of investment disciplines and providing a large variety of mutual fund investor services. The Board noted that Fidelity had taken, or had made recommendations that resulted in the Fidelity funds taking, a number of actions over the previous year that benefited particular funds, including: (i) continuing to dedicate additional resources to Fidelity's investment research process, which includes meetings with management of issuers of securities in which the funds invest, and to the support of the senior management team that oversees asset management; (ii) continuing efforts to enhance Fidelity's global research capabilities; (iii) launching new funds and ETFs with innovative structures, strategies and pricing and making other enhancements to meet client needs; (iv) launching new share classes of existing funds; (v) eliminating purchase minimums and broadening eligibility requirements for certain funds and share classes; (vi) approving the reduction in the holding period for the Class C to Class A conversion policy; (vii) reducing management fees and total expenses for certain target date funds and classes and index funds; (viii) lowering expenses for certain existing funds and classes by implementing or lowering expense caps; (ix) rationalizing product lines and gaining increased efficiencies from fund mergers, liquidations, and share class consolidations; (x) continuing to develop, acquire and implement systems and technology to improve services to the funds and shareholders, strengthen information security, and increase efficiency; and (xi) continuing to implement enhancements to further strengthen Fidelity's product line to increase investors' probability of success in achieving their investment goals, including retirement income goals.
Investment Performance. The Board considered whether the fund has operated in accordance with its investment objective, as well as its record of compliance with its investment restrictions and its performance history.
The Board took into account discussions that occur at Board meetings throughout the year with representatives of the Investment Advisers about fund investment performance. In this regard the Board noted that as part of regularly scheduled fund reviews and other reports to the Board on fund performance, the Board considers annualized return information for the fund for different time periods, measured against an appropriate securities market index (benchmark index) and an appropriate peer group of funds with similar objectives (peer group). In its evaluation of fund investment performance, the Board gave particular attention to information indicating changes in performance of certain Fidelity funds for specific time periods and discussed with the Investment Advisers the reasons for any overperformance or underperformance.
In addition to reviewing absolute and relative fund performance, the Independent Trustees periodically consider the appropriateness of fund performance metrics in evaluating the results achieved. In general, the Independent Trustees believe that fund performance should be evaluated based on net performance (after fees and expenses) of both the highest performing and lowest performing fund share classes, where applicable, compared to appropriate benchmark indices, over appropriate time periods that may include full market cycles, and compared to peer groups, as applicable, over the same periods, taking into account relevant factors including the following: general market conditions; issuer-specific information; and fund cash flows and other factors.
The Independent Trustees recognize that shareholders evaluate performance on a net basis over their own holding periods, for which one-, three-, and five-year periods are often used as a proxy. For this reason, the performance information reviewed by the Board also included net total return information for the fund and an appropriate benchmark index and peer group for the most recent one-year period ended September 30, 2020, as shown below. Returns are shown compared to the 25th percentile (top of box, 75% beaten) and 75th percentile (bottom of box, 25% beaten) of the peer universe.
Fidelity Equity-Income K6 Fund

Based on its review, the Board concluded that the nature, extent, and quality of services provided to the fund under the Advisory Contracts should continue to benefit the shareholders of the fund.
Competitiveness of Management Fee and Total Expense Ratio. The Board considered the fund's management fee and total expense ratio compared to "mapped groups" of competitive funds and classes created for the purpose of facilitating the Trustees' competitive analysis of management fees and total expenses. Fidelity creates "mapped groups" by combining similar Lipper investment objective categories that have comparable investment mandates. Combining Lipper investment objective categories aids the Board's management fee and total expense ratio comparisons by broadening the competitive group used for comparison.
Management Fee. The Board considered two proprietary management fee comparisons for the 12-month (or shorter) periods ended September 30 (June 30 for the period ended 2019) shown in basis points (BP) in the chart below. The group of Lipper funds used by the Board for management fee comparisons is referred to below as the "Total Mapped Group." The Total Mapped Group is broader than the Lipper peer group used by the Board for performance comparisons because the Total Mapped Group combines several Lipper investment objective categories while the Lipper peer group does not. The Total Mapped Group comparison focuses on a fund's standing in terms of gross management fees before expense reimbursements or caps relative to the total universe of funds with comparable investment mandates, regardless of whether their management fee structures also are comparable. Funds with comparable investment mandates offer exposure to similar types of securities. Funds with comparable management fee structures have similar management fee contractual arrangements (
e.g., flat rate charged for advisory services, all-inclusive fee rate,
etc.). "TMG %" represents the percentage of funds in the Total Mapped Group that had management fees that were lower than the fund's. For example, a hypothetical TMG % of 20% would mean that 80% of the funds in the Total Mapped Group had higher, and 20% had lower, management fees than the fund. The fund's actual TMG %s and the number of funds in the Total Mapped Group are in the chart below. The "Asset-Sized Peer Group" (ASPG) comparison focuses on a fund's standing relative to a subset of non-Fidelity funds within the Total Mapped Group that are similar in size and management fee structure. For example, if a fund is in the first quartile of the ASPG, the fund's management fee ranks in the least expensive or lowest 25% of funds in the ASPG. The ASPG represents at least 15% of the funds in the Total Mapped Group with comparable asset size and management fee structures, subject to a minimum of 50 funds (or all funds in the Total Mapped Group if fewer than 50). Additional information, such as the ASPG quartile in which the fund's management fee rate ranked, is also included in the chart and was considered by the Board.
Fidelity Equity-Income K6 Fund

The Board noted that the fund's management fee rate ranked below the median of its Total Mapped Group and below the median of its ASPG for the 12-month period ended September 30, 2020.
The Board noted that, in the past, it and the boards of other Fidelity funds had formed an ad hoc Committee on Group Fee to conduct an in-depth review of the "group fee" component of the management fee of funds with such management fee structures. The Committee's focus included the mechanics of the group fee, the competitive landscape of group fee structures, Fidelity funds with no group fee component (such as the fund) and investment products not included in group fee assets. The Board also considered that, for funds subject to the group fee, FMR agreed to voluntarily waive fees over a specified period of time in amounts designed to account for assets converted from certain funds to certain collective investment trusts.
The Board also noted that, in 2013, the ad hoc Committee on Management Fees was formed to conduct an in-depth review of the management fee rates of Fidelity's active equity mutual funds. The Committee focused on the following areas: (i) standard fee structures; (ii) research consumption and trading evolution; (iii) management fee competitiveness/profitability by category; and (iv) factors that drive institutional pricing.
Based on its review, the Board concluded that the fund's management fee is fair and reasonable in light of the services that the fund receives and the other factors considered.
Total Expense Ratio. In its review of the fund's total expense ratio, the Board considered the fund's unitary fee rate as well as other fund expenses paid by FMR under the fund's management contract, such as transfer agent fees, pricing and bookkeeping fees, and custodial, legal, and audit fees. The Board also noted that Fidelity may agree to waive fees or reimburse expenses from time to time, and the extent to which, if any, it has done so for the fund. As part of its review, the Board also considered the current and historical total expense ratios of the fund compared to competitive fund median expenses. The fund is compared to those funds and classes in the Total Mapped Group (used by the Board for management fee comparisons) that have a similar sales load structure (SLTG). The Board also considered a total expense ASPG comparison for the fund, which focuses on the total expenses of the fund relative to a subset of non-Fidelity funds within the total expense SLTG. The total expense ASPG is limited to 15 larger and 15 smaller classes in fund average assets for a total of 30 classes, where possible. The total expense ASPG comparison excludes performance adjustments and fund-paid 12b-1 fees to eliminate variability in fee structures.
The Board noted that the fund's total expense ratio ranked below the SLTG competitive median and below the ASPG competitive median for the 12-month period ended September 30, 2020.
Fees Charged to Other Fidelity Clients. The Board also considered Fidelity fee structures and other information with respect to clients of Fidelity, such as other funds advised or subadvised by Fidelity, pension plan clients, and other institutional clients with similar mandates. The Board noted that a joint ad hoc committee created by it and the boards of other Fidelity funds periodically reviews and compares Fidelity's institutional investment advisory business with its business of providing services to the Fidelity funds and also noted the most recent findings of the committee. The Board noted that the committee's review included a consideration of the differences in services provided, fees charged, and costs incurred, as well as competition in the markets serving the different categories of clients.
Based on its review of total expense ratios and fees charged to other Fidelity clients, the Board concluded that the fund's total expense ratio was reasonable in light of the services that the fund and its shareholders receive and the other factors considered.
Costs of the Services and Profitability. The Board considered the revenues earned and the expenses incurred by Fidelity in conducting the business of developing, marketing, distributing, managing, administering and servicing the fund and servicing the fund's shareholders. The Board also considered the level of Fidelity's profits in respect of all the Fidelity funds.
On an annual basis, Fidelity presents to the Board information about the profitability of its relationships with the fund. Fidelity calculates profitability information for each fund, as well as aggregate profitability information for groups of Fidelity funds and all Fidelity funds, using a series of detailed revenue and cost allocation methodologies which originate with the books and records of Fidelity on which Fidelity's audited financial statements are based. The Audit Committee of the Board reviews any significant changes from the prior year's methodologies and the full Board approves such changes.
A public accounting firm has been engaged annually by the Board as part of the Board's assessment of Fidelity's profitability analysis. The engagement includes the review and assessment of the methodologies used by Fidelity in determining the revenues and expenses attributable to Fidelity's mutual fund business, and completion of agreed-upon procedures in respect of the mathematical accuracy of certain fund profitability information and its conformity to established allocation methodologies. After considering the reports issued under the engagement and information provided by Fidelity, the Board concluded that while other allocation methods may also be reasonable, Fidelity's profitability methodologies are reasonable in all material respects.
The Board also reviewed Fidelity's non-fund businesses and potential indirect benefits such businesses may have received as a result of their association with Fidelity's mutual fund business (i.e., fall-out benefits) as well as cases where Fidelity's affiliates may benefit from the funds' business. The Board considered areas where potential indirect benefits to the Fidelity funds from their relationships with Fidelity may exist. The Board also considered that in 2019 a joint ad hoc committee created by it and the boards of other Fidelity funds evaluated potential fall-out benefits (PFOB Committee). The Board noted that it considered the PFOB Committee's findings in connection with its consideration of the renewal of the Advisory Contracts.
The Board considered the costs of the services provided by and the profits realized by Fidelity in connection with the operation of the fund, including the conclusions of the PFOB Committee, and was satisfied that the profitability was not excessive.
Economies of Scale. The Board considered whether there have been economies of scale in respect of the management of the Fidelity funds, whether the Fidelity funds (including the fund) have appropriately benefited from any such economies of scale, and whether there is potential for realization of any further economies of scale. The Board considered the extent to which the fund will benefit from economies of scale as assets grow through increased services to the fund, through waivers or reimbursements, or through fee or expense ratio reductions. The Board recognized that, due to the fund's current contractual arrangements, its expense ratio will not decline if the fund's operating costs decrease as assets grow, or rise as assets decrease. The Board also noted that a committee (the Economies of Scale Committee) created by it and the boards of other Fidelity funds periodically analyzes whether Fidelity attains economies of scale in respect of the management and servicing of the Fidelity funds, whether the Fidelity funds have appropriately benefited from such economies of scale, and whether there is potential for realization of any further economies of scale.
The Board concluded, taking into account the analysis of the Economies of Scale Committee, that economies of scale, if any, are being appropriately shared between fund shareholders and Fidelity.
Additional Information Requested by the Board. In order to develop fully the factual basis for consideration of the Fidelity funds' advisory contracts, the Board requested and received additional information on certain topics, including: (i) fund flow and performance trends, in particular the underperformance of certain funds and strategies, and Fidelity's long-term strategies for certain funds; (ii) consideration of expanding the use of performance fees for additional funds; (iii) Fidelity's pricing philosophy compared to competitors; (iv) metrics for evaluating index fund and ETF performance and information about ETF trading characteristics; (v) the methodology with respect to evaluating competitive fund data and peer group classifications and fee and expense comparisons; (vi) the expense structures for different funds and classes and information about the differences between various expense structures; (vii) group fee breakpoints; (viii) information regarding other accounts managed by Fidelity and sub-advisory arrangements; and (ix) Fidelity's philosophies and strategies for evaluating funds and classes with lower or declining asset levels.
Based on its evaluation of all of the conclusions noted above, and after considering all factors it believed relevant, the Board concluded that the advisory fee arrangements are fair and reasonable, and that the fund's Advisory Contracts should be renewed.
Liquidity Risk Management Program
The Securities and Exchange Commission adopted Rule 22e-4 under the Investment Company Act of 1940 (the Liquidity Rule) to promote effective liquidity risk management throughout the open-end investment company industry, thereby reducing the risk that funds will be unable to meet their redemption obligations and mitigating dilution of the interests of fund shareholders.
The Fund has adopted and implemented a liquidity risk management program pursuant to the Liquidity Rule (the Program) effective December 1, 2018. The Program is reasonably designed to assess and manage the Fund’s liquidity risk and to comply with the requirements of the Liquidity Rule. The Fund’s Board of Trustees (the Board) has designated the Fund’s investment adviser as administrator of the Program. The Fidelity advisers have established a Liquidity Risk Management Committee (the LRM Committee) to manage the Program for each of the Fidelity Funds. The LRM Committee monitors the adequacy and effectiveness of implementation of the Program and on a periodic basis assesses each Fund’s liquidity risk based on a variety of factors including (1) the Fund’s investment strategy, (2) portfolio liquidity and cash flow projections during normal and reasonably foreseeable stressed conditions, (3) shareholder redemptions, (4) borrowings and other funding sources and (5) in the case of exchange-traded funds, certain additional factors including the effect of the Fund’s prices and spreads, market participants, and basket compositions on the overall liquidity of the Fund’s portfolio, as applicable.
In accordance with the Program, each of the Fund’s portfolio investments is classified into one of four liquidity categories described below based on a determination of a reasonable expectation for how long it would take to convert the investment to cash (or sell or dispose of the investment) without significantly changing its market value.
- Highly liquid investments – cash or convertible to cash within three business days or less
- Moderately liquid investments – convertible to cash in three to seven calendar days
- Less liquid investments – can be sold or disposed of, but not settled, within seven calendar days
- Illiquid investments – cannot be sold or disposed of within seven calendar days
Liquidity classification determinations take into account a variety of factors including various market, trading and investment-specific considerations, as well as market depth, and generally utilize analysis from a third-party liquidity metrics service.
The Liquidity Rule places a 15% limit on a fund’s illiquid investments and requires funds that do not primarily hold assets that are highly liquid investments to determine and maintain a minimum percentage of the fund’s net assets to be invested in highly liquid investments (highly liquid investment minimum or HLIM). The Program includes provisions reasonably designed to comply with the 15% limit on illiquid investments and for determining, periodically reviewing and complying with the HLIM requirement as applicable.
At a recent meeting of the Fund’s Board of Trustees, the LRM Committee provided a written report to the Board pertaining to the operation, adequacy, and effectiveness of implementation of the Program for the annual period from December 1, 2019 through November 30, 2020. The report concluded that the Program has been implemented and is operating effectively and is reasonably designed to assess and manage the Fund’s liquidity risk.
EQU-K6-SANN-0921
1.9893875.102
Item 2.
Code of Ethics
Not applicable.
Item 3.
Audit Committee Financial Expert
Not applicable.
Item 4.
Principal Accountant Fees and Services
Not applicable.
Item 5.
Audit Committee of Listed Registrants
Not applicable.
Item 6.
Investments
(a)
Not applicable.
(b)
Not applicable
Item 7.
Disclosure of Proxy Voting Policies and Procedures for Closed-End Management Investment Companies
Not applicable.
Item 8.
Portfolio Managers of Closed-End Management Investment Companies
Not applicable.
Item 9.
Purchase of Equity Securities by Closed-End Management Investment Company and Affiliated Purchasers
Not applicable.
Item 10.
Submission of Matters to a Vote of Security Holders
There were no material changes to the procedures by which shareholders may recommend nominees to the Fidelity Devonshire Trust’s Board of Trustees.
Item 11.
Controls and Procedures
(a)(i) The President and Treasurer and the Chief Financial Officer have concluded that the Fidelity Devonshire Trust’s (the “Trust”) disclosure controls and procedures (as defined in Rule 30a-3(c) under the Investment Company Act) provide reasonable
assurances that material information relating to the Trust is made known to them by the appropriate persons, based on their evaluation of these controls and procedures as of a date within 90 days of the filing date of this report.
(a)(ii) There was no change in the Trust’s internal control over financial reporting (as defined in Rule 30a-3(d) under the Investment Company Act) that occurred during the period covered by this report that has materially affected, or is reasonably likely to materially affect, the Trust’s internal control over financial reporting.
Item 12.
Disclosure of Securities Lending Activities for Closed-End Management
Investment Companies
Not applicable.
Item 13.
Exhibits
SIGNATURES
Pursuant to the requirements of the Securities Exchange Act of 1934 and the Investment Company Act of 1940, the registrant has duly caused this report to be signed on its behalf by the undersigned, thereunto duly authorized.
Fidelity Devonshire Trust
| |
By: | /s/Stacie M. Smith |
| Stacie M. Smith |
| President and Treasurer |
|
|
Date: | September 21, 2021 |
Pursuant to the requirements of the Securities Exchange Act of 1934 and the Investment Company Act of 1940, this report has been signed below by the following persons on behalf of the registrant and in the capacities and on the dates indicated.
| |
By: | /s/Stacie M. Smith |
| Stacie M. Smith |
| President and Treasurer |
|
|
Date: | September 21, 2021 |
| |
By: | /s/John J. Burke III |
| John J. Burke III |
| Chief Financial Officer |
|
|
Date: | September 21, 2021 |