UNITED STATES
SECURITIES AND EXCHANGE COMMISSION
Washington, D.C. 20549
FORM N-CSR
CERTIFIED SHAREHOLDER REPORT OF REGISTERED
MANAGEMENT INVESTMENT COMPANIES
Investment Company Act file number 811-215
Fidelity Hastings Street Trust
(Exact name of registrant as specified in charter)
82 Devonshire St., Boston, Massachusetts 02109
(Address of principal executive offices) (Zip code)
Scott C. Goebel, Secretary
82 Devonshire St.
Boston, Massachusetts 02109
(Name and address of agent for service)
Registrant's telephone number, including area code: 617-563-7000
Date of fiscal year end: | June 30 |
| |
Date of reporting period: | June 30, 2012 |
Item 1. Reports to Stockholders
Fidelity Fifty®
Annual Report
June 30, 2012
(Fidelity Cover Art)
Contents
Performance | (Click Here) | How the fund has done over time. |
Management's Discussion of Fund Performance | (Click Here) | The Portfolio Manager's review of fund performance and strategy. |
Shareholder Expense Example | (Click Here) | An example of shareholder expenses. |
Investment Changes | (Click Here) | A summary of major shifts in the fund's investments over the past six months. |
Investments | (Click Here) | A complete list of the fund's investments with their market values. |
Financial Statements | (Click Here) | Statements of assets and liabilities, operations, and changes in net assets, as well as financial highlights. |
Notes | (Click Here) | Notes to the financial statements. |
Report of Independent Registered Public Accounting Firm | (Click Here) | |
Trustees and Officers | (Click Here) | |
Distributions | (Click Here) | |
To view a fund's proxy voting guidelines and proxy voting record for the 12-month period ended June 30, visit http://www.fidelity.com/proxyvotingresults or visit the Securities and Exchange Commission's (SEC) web site at http://www.sec.gov. You may also call 1-800-544-8544 to request a free copy of the proxy voting guidelines.
Standard & Poor's, S&P and S&P 500 are registered service marks of The McGraw-Hill Companies, Inc. and have been licensed for use by Fidelity Distributors Corporation.
Other third party marks appearing herein are the property of their respective owners.
All other marks appearing herein are registered or unregistered trademarks or service marks of FMR LLC or an affiliated company. © 2012 FMR LLC. All rights reserved.
Annual Report
This report and the financial statements contained herein are submitted for the general information of the shareholders of the fund. This report is not authorized for distribution to prospective investors in the fund unless preceded or accompanied by an effective prospectus.
A fund files its complete schedule of portfolio holdings with the SEC for the first and third quarters of each fiscal year on Form N-Q. Forms N-Q are available on the SEC's web site at http://www.sec.gov. A fund's Forms N-Q may be reviewed and copied at the SEC's Public Reference Room in Washington, DC. Information regarding the operation of the SEC's Public Reference Room may be obtained by calling 1-800-SEC-0330. For a complete list of a fund's portfolio holdings, view the most recent holdings listing, semiannual report, or annual report on Fidelity's web site at http://www.fidelity.com, http://www.advisor.fidelity.com, or http://www.401k.com, as applicable.
NOT FDIC INSURED • MAY LOSE VALUE • NO BANK GUARANTEE
Neither the fund nor Fidelity Distributors Corporation is a bank.
Annual Report
Average annual total return reflects the change in the value of an investment, assuming reinvestment of the fund's distributions from dividend income and capital gains (the profits earned upon the sale of securities that have grown in value, if any) and assuming a constant rate of performance each year. The $10,000 table and the fund's returns do not reflect the deduction of taxes that a shareholder would pay on fund distributions or the redemption of fund shares. During periods of reimbursement by Fidelity, a fund's total return will be greater than it would be had the reimbursement not occurred. How a fund did yesterday is no guarantee of how it will do tomorrow.
Average Annual Total Returns
Periods ended June 30, 2012 | Past 1
year | Past 5
years | Past 10
years |
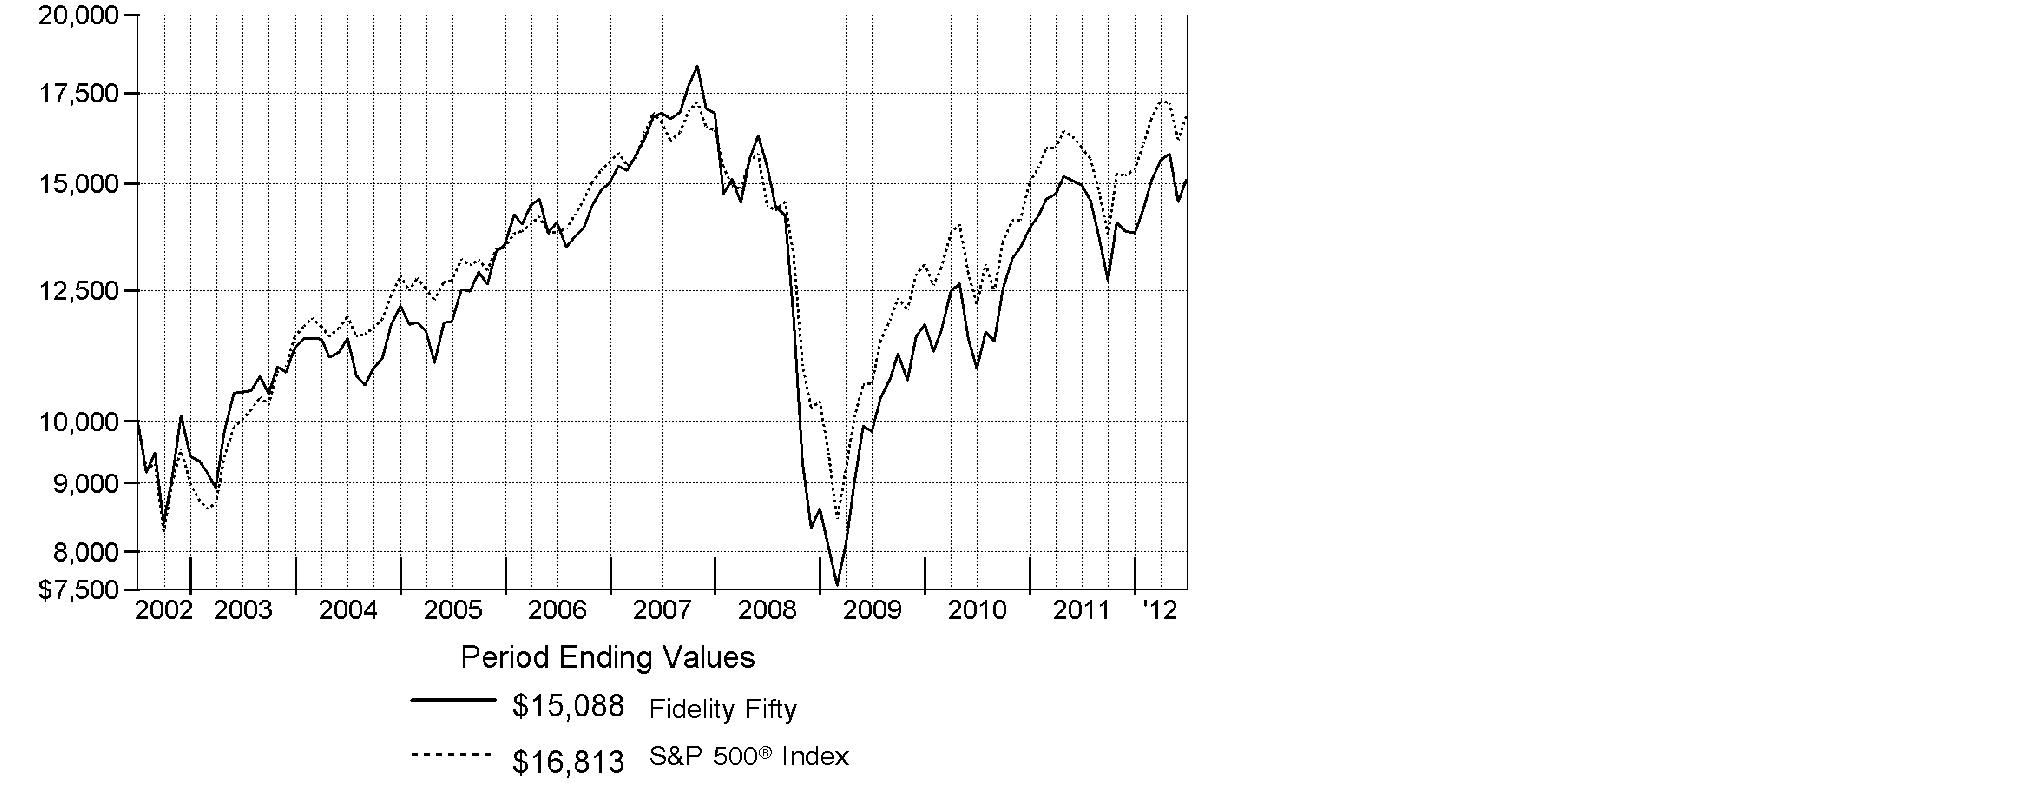
Fidelity Fifty® | 0.93% | -2.25% | 4.20% |
$10,000 Over 10 Years
Let's say hypothetically that $10,000 was invested in Fidelity Fifty® on June 30, 2002. The chart shows how the value of your investment would have changed, and also shows how the S&P 500® Index performed over the same period.
Annual Report
Market Recap: Major U.S. equity benchmarks posted solid gains for the 12 months ending June 30, 2012, even amid the period's uncertain investment environment. The broad-based S&P 500® Index returned 5.45%, while the blue-chip-laden Dow Jones Industrial AverageSM and the technology-heavy Nasdaq Composite® Index gained 6.63% and 6.99%, respectively. Volatility marked the first half of the period, as equities plummeted last summer and early fall on Europe's debt woes, debate over the U.S. debt ceiling and the credit-rating downgrade that followed. Beginning in October, healthier manufacturing, consumer and housing data rejuvenated markets and investors' appetite for stocks, leading major equity benchmarks to their best first-quarter performance since 1998. Stocks slipped again in the spring, as more eurozone trouble and a marked slowdown in China put the brakes on earlier momentum, until optimism reappeared in June. For the period, five of the 10 major market segments within the S&P 500® posted a double-digit gain, led by the more-defensive utilities, consumer staples and telecommunication services sectors, each of which rose about 15%. Conversely, energy (-8%) and materials (-7%) struggled the most. Given Europe's turmoil and local currency weakness, foreign developed-markets stocks lost ground, with the MSCI® EAFE® Index returning -13.70%.
Comments from Stephen DuFour, Portfolio Manager of Fidelity Fifty® Fund: For the year, the fund gained 0.93%, lagging the S&P 500. Security selection accounted for all the relative underperformance, with the biggest impact coming from industrials - especially capital goods - energy and information technology. In capital goods, untimely ownership of commercial building materials manufacturer Carlisle Companies hurt. Not owning the big, integrated energy providers in the index proved costly, as they beat more commodity-driven names. Disappointments within tech included France-based telecom equipment provider Alcatel-Lucent, whose stock fell sharply because plans for a new telecom network were delayed, and software company Informatica, whose shares sank as Europe's economy weakened. Elsewhere, an investment in satellite radio company Sirius XM Radio declined because of slowing auto production in Japan. Conversely, the fund benefited from underweighting financials, particularly the big money center banks in the index. Security selection within consumer discretionary also helped, led by discount retailer TJX Companies. Elsewhere, shares of credit card processor MasterCard climbed, as more people globally paid with plastic. Many of these stocks were not in the index, and some were not in the portfolio at period end.
The views expressed above reflect those of the portfolio manager(s) only through the end of the period as stated on the cover of this report and do not necessarily represent the views of Fidelity or any other person in the Fidelity organization. Any such views are subject to change at any time based upon market or other conditions and Fidelity disclaims any responsibility to update such views. These views may not be relied on as investment advice and, because investment decisions for a Fidelity fund are based on numerous factors, may not be relied on as an indication of trading intent on behalf of any Fidelity fund.
Annual Report
Shareholder Expense Example
As a shareholder of the Fund, you incur two types of costs: (1) transaction costs, and (2) ongoing costs, including management fees and other Fund expenses. This Example is intended to help you understand your ongoing costs (in dollars) of investing in the Fund and to compare these costs with the ongoing costs of investing in other mutual funds.
The Example is based on an investment of $1,000 invested at the beginning of the period and held for the entire period (January 1, 2012 to June 30, 2012).
Actual Expenses
The first line of the accompanying table provides information about actual account values and actual expenses. You may use the information in this line, together with the amount you invested, to estimate the expenses that you paid over the period. Simply divide your account value by $1,000.00 (for example, an $8,600 account value divided by $1,000.00 = 8.6), then multiply the result by the number in the first line under the heading entitled "Expenses Paid During Period" to estimate the expenses you paid on your account during this period. A small balance maintenance fee of $12.00 that is charged once a year may apply for certain accounts with a value of less than $2,000. This fee is not included in the table below. If it was, the estimate of expenses you paid during the period would be higher, and your ending account value lower, by this amount. In addition, the Fund, as a shareholder in the underlying Fidelity Central Funds, will indirectly bear its pro-rata share of the fees and expenses incurred by the underlying Fidelity Central Funds. These fees and expenses are not included in the Fund's annualized expense ratio used to calculate the expense estimate in the table below.
Hypothetical Example for Comparison Purposes
The second line of the accompanying table provides information about hypothetical account values and hypothetical expenses based on the Fund's actual expense ratio and an assumed rate of return of 5% per year before expenses, which is not the Fund's actual return. The hypothetical account values and expenses may not be used to estimate the actual ending account balance or expenses you paid for the period. You may use this information to compare the ongoing costs of investing in the Fund and other funds. To do so, compare this 5% hypothetical example with the 5% hypothetical examples that appear in the shareholder reports of the other funds. A small balance maintenance fee of $12.00 that is charged once a year may apply for certain accounts with a value of less than $2,000. This fee is not included in the table below. If it was, the estimate of expenses you paid during the period would be higher, and your ending account value lower, by this amount. In addition, the Fund, as a shareholder in the underlying Fidelity Central Funds, will indirectly bear its pro-rata share of the fees and expenses incurred by the underlying Fidelity Central Funds. These fees and expenses are not included in the Fund's annualized expense ratio used to calculate the expense estimate in the table below.
Please note that the expenses shown in the table are meant to highlight your ongoing costs only and do not reflect any transaction costs. Therefore, the second line of the table is useful in comparing ongoing costs only, and will not help you determine the relative total costs of owning different funds.
Annual Report
Shareholder Expense Example - continued
| Annualized
Expense Ratio | Beginning
Account Value
January 1, 2012 | Ending
Account Value
June 30, 2012 | Expenses Paid
During Period*
January 1, 2012
to June 30, 2012 |
Actual | .91% | $ 1,000.00 | $ 1,094.60 | $ 4.74 |
Hypothetical (5% return per year before expenses) | | $ 1,000.00 | $ 1,020.34 | $ 4.57 |
* Expenses are equal to the Fund's annualized expense ratio, multiplied by the average account value over the period, multiplied by 182/366 (to reflect the one-half year period).
Annual Report
Investment Changes (Unaudited)
Top Ten Stocks as of June 30, 2012 |
| % of fund's
net assets | % of fund's net assets
6 months ago |
MasterCard, Inc. Class A | 7.6 | 4.7 |
Citrix Systems, Inc. | 6.2 | 4.4 |
Wells Fargo & Co. | 6.0 | 0.0 |
TJX Companies, Inc. | 4.6 | 3.2 |
UnitedHealth Group, Inc. | 4.6 | 3.1 |
Estee Lauder Companies, Inc. Class A | 4.5 | 2.3 |
Apple, Inc. | 4.2 | 3.7 |
Sempra Energy | 4.1 | 0.0 |
Biogen Idec, Inc. | 3.9 | 2.6 |
Union Pacific Corp. | 3.6 | 4.4 |
| 49.3 | |
Top Five Market Sectors as of June 30, 2012 |
| % of fund's
net assets | % of fund's net assets
6 months ago |
Information Technology | 25.5 | 23.5 |
Health Care | 15.8 | 15.6 |
Consumer Discretionary | 14.5 | 9.2 |
Consumer Staples | 11.7 | 10.6 |
Financials | 11.0 | 11.2 |
Asset Allocation (% of fund's net assets) |
As of June 30, 2012* | As of December 31, 2011** |
 | Stocks 99.7% | | | Stocks 99.6% | |
 | Short-Term
Investments and
Net Other Assets (Liabilities) 0.3% | | | Short-Term
Investments and
Net Other Assets (Liabilities) 0.4% | |
* Foreign investments | 2.0% | | ** Foreign investments | 9.0% | |

Annual Report
Investments June 30, 2012
Showing Percentage of Net Assets
Common Stocks - 99.7% |
| Shares | | Value |
CONSUMER DISCRETIONARY - 14.5% |
Hotels, Restaurants & Leisure - 0.3% |
Las Vegas Sands Corp. | 14,000 | | $ 608,860 |
Wyndham Worldwide Corp. | 28,800 | | 1,518,912 |
| | 2,127,772 |
Internet & Catalog Retail - 0.9% |
Amazon.com, Inc. (a) | 26,000 | | 5,937,100 |
Media - 2.7% |
Comcast Corp. Class A | 268,900 | | 8,596,733 |
Discovery Communications, Inc. (a) | 176,000 | | 9,504,000 |
| | 18,100,733 |
Multiline Retail - 2.8% |
Dollar General Corp. (a) | 342,000 | | 18,601,380 |
Specialty Retail - 7.6% |
Bed Bath & Beyond, Inc. (a) | 111,000 | | 6,859,800 |
Cabela's, Inc. Class A (a) | 186,800 | | 7,062,908 |
PetSmart, Inc. | 86,000 | | 5,863,480 |
TJX Companies, Inc. | 727,000 | | 31,210,110 |
| | 50,996,298 |
Textiles, Apparel & Luxury Goods - 0.2% |
NIKE, Inc. Class B | 20,000 | | 1,755,600 |
TOTAL CONSUMER DISCRETIONARY | | 97,518,883 |
CONSUMER STAPLES - 11.7% |
Beverages - 4.1% |
Anheuser-Busch InBev SA NV | 175,000 | | 13,797,222 |
Beam, Inc. | 82,000 | | 5,124,180 |
The Coca-Cola Co. | 109,000 | | 8,522,710 |
| | 27,444,112 |
Personal Products - 4.5% |
Estee Lauder Companies, Inc. Class A | 566,000 | | 30,631,920 |
Tobacco - 3.1% |
Altria Group, Inc. | 599,800 | | 20,723,090 |
TOTAL CONSUMER STAPLES | | 78,799,122 |
ENERGY - 3.8% |
Oil, Gas & Consumable Fuels - 3.8% |
Cabot Oil & Gas Corp. | 35,000 | | 1,379,000 |
Common Stocks - continued |
| Shares | | Value |
ENERGY - continued |
Oil, Gas & Consumable Fuels - continued |
Noble Energy, Inc. | 155,689 | | $ 13,205,541 |
Pioneer Natural Resources Co. | 122,500 | | 10,805,725 |
| | 25,390,266 |
FINANCIALS - 11.0% |
Capital Markets - 0.0% |
Raymond James Financial, Inc. | 1,000 | | 34,240 |
Commercial Banks - 6.2% |
Fifth Third Bancorp | 75,000 | | 1,005,000 |
Wells Fargo & Co. | 1,213,000 | | 40,562,720 |
| | 41,567,720 |
Consumer Finance - 1.8% |
Discover Financial Services | 350,500 | | 12,120,290 |
Real Estate Investment Trusts - 3.0% |
American Tower Corp. | 293,000 | | 20,483,630 |
TOTAL FINANCIALS | | 74,205,880 |
HEALTH CARE - 15.8% |
Biotechnology - 7.8% |
Amgen, Inc. | 210,000 | | 15,338,400 |
Biogen Idec, Inc. (a) | 181,600 | | 26,219,408 |
Gilead Sciences, Inc. (a) | 219,000 | | 11,230,320 |
| | 52,788,128 |
Health Care Providers & Services - 5.7% |
Catalyst Health Solutions, Inc. (a) | 81,000 | | 7,568,640 |
UnitedHealth Group, Inc. | 525,700 | | 30,753,450 |
| | 38,322,090 |
Pharmaceuticals - 2.3% |
Pfizer, Inc. | 660,000 | | 15,180,000 |
TOTAL HEALTH CARE | | 106,290,218 |
INDUSTRIALS - 9.7% |
Industrial Conglomerates - 3.5% |
General Electric Co. | 1,108,000 | | 23,090,720 |
Machinery - 0.9% |
PACCAR, Inc. | 160,000 | | 6,270,400 |
Professional Services - 0.1% |
Equifax, Inc. | 13,600 | | 633,760 |
Common Stocks - continued |
| Shares | | Value |
INDUSTRIALS - continued |
Road & Rail - 5.2% |
J.B. Hunt Transport Services, Inc. | 115,000 | | $ 6,854,000 |
Kansas City Southern | 56,800 | | 3,951,008 |
Union Pacific Corp. | 204,000 | | 24,339,240 |
| | 35,144,248 |
TOTAL INDUSTRIALS | | 65,139,128 |
INFORMATION TECHNOLOGY - 25.5% |
Computers & Peripherals - 4.2% |
Apple, Inc. (a) | 47,726 | | 27,871,984 |
Internet Software & Services - 1.8% |
eBay, Inc. (a) | 238,100 | | 10,002,581 |
Facebook, Inc. Class A (d) | 59,000 | | 1,836,080 |
Google, Inc. Class A (a) | 800 | | 464,056 |
| | 12,302,717 |
IT Services - 7.6% |
MasterCard, Inc. Class A | 118,500 | | 50,968,035 |
Semiconductors & Semiconductor Equipment - 0.2% |
Cirrus Logic, Inc. (a) | 54,200 | | 1,619,496 |
Software - 11.7% |
Citrix Systems, Inc. (a) | 494,800 | | 41,533,512 |
Intuit, Inc. | 339,000 | | 20,119,650 |
salesforce.com, Inc. (a) | 121,600 | | 16,812,416 |
| | 78,465,578 |
TOTAL INFORMATION TECHNOLOGY | | 171,227,810 |
MATERIALS - 1.5% |
Chemicals - 1.5% |
Ecolab, Inc. | 55,000 | | 3,769,150 |
Sherwin-Williams Co. | 48,000 | | 6,352,800 |
| | 10,121,950 |
TELECOMMUNICATION SERVICES - 1.2% |
Diversified Telecommunication Services - 1.2% |
Verizon Communications, Inc. | 183,000 | | 8,132,520 |
UTILITIES - 5.0% |
Electric Utilities - 0.9% |
NextEra Energy, Inc. | 90,000 | | 6,192,900 |
Common Stocks - continued |
| Shares | | Value |
UTILITIES - continued |
Multi-Utilities - 4.1% |
Sempra Energy | 395,000 | | $ 27,207,600 |
TOTAL UTILITIES | | 33,400,500 |
TOTAL COMMON STOCKS (Cost $619,837,159) |
670,226,277
|
Money Market Funds - 1.5% |
| | | |
Fidelity Cash Central Fund, 0.17% (b) | 6,498,237 | | 6,498,237 |
Fidelity Securities Lending Cash Central Fund, 0.18% (b)(c) | 3,456,000 | | 3,456,000 |
TOTAL MONEY MARKET FUNDS (Cost $9,954,237) |
9,954,237
|
TOTAL INVESTMENT PORTFOLIO - 101.2% (Cost $629,791,396) | | 680,180,514 |
NET OTHER ASSETS (LIABILITIES) - (1.2)% | | (8,346,187) |
NET ASSETS - 100% | $ 671,834,327 |
Legend |
(a) Non-income producing |
(b) Affiliated fund that is available only to investment companies and other accounts managed by Fidelity Investments. The rate quoted is the annualized seven-day yield of the fund at period end. A complete unaudited listing of the fund's holdings as of its most recent quarter end is available upon request. In addition, each Fidelity Central Fund's financial statements, which are not covered by the Fund's Report of Independent Registered Public Accounting Firm, are available on the SEC's website or upon request. |
(c) Investment made with cash collateral received from securities on loan. |
(d) Security or a portion of the security is on loan at period end. |
Affiliated Central Funds |
Information regarding fiscal year to date income earned by the Fund from investments in Fidelity Central Funds is as follows: |
Fund | Income earned |
Fidelity Cash Central Fund | $ 15,553 |
Fidelity Securities Lending Cash Central Fund | 91,387 |
Total | $ 106,940 |
Other Information |
The following is a summary of the inputs used, as of June 30, 2012, involving the Fund's assets and liabilities carried at fair value. The inputs or methodology used for valuing securities may not be an indication of the risk associated with investing in those securities. For more information on valuation inputs, and their aggregation into the levels used in the table below, please refer to the Security Valuation section in the accompanying Notes to Financial Statements. |
Valuation Inputs at Reporting Date: |
Description | Total | Level 1 | Level 2 | Level 3 |
Investments in Securities: | | | | |
Equities: | | | | |
Consumer Discretionary | $ 97,518,883 | $ 97,518,883 | $ - | $ - |
Consumer Staples | 78,799,122 | 65,001,900 | 13,797,222 | - |
Energy | 25,390,266 | 25,390,266 | - | - |
Financials | 74,205,880 | 74,205,880 | - | - |
Health Care | 106,290,218 | 106,290,218 | - | - |
Industrials | 65,139,128 | 65,139,128 | - | - |
Information Technology | 171,227,810 | 171,227,810 | - | - |
Materials | 10,121,950 | 10,121,950 | - | - |
Telecommunication Services | 8,132,520 | 8,132,520 | - | - |
Utilities | 33,400,500 | 33,400,500 | - | - |
Money Market Funds | 9,954,237 | 9,954,237 | - | - |
Total Investments in Securities: | $ 680,180,514 | $ 666,383,292 | $ 13,797,222 | $ - |
See accompanying notes which are an integral part of the financial statements.
Annual Report
Statement of Assets and Liabilities
| June 30, 2012 |
| | |
Assets | | |
Investment in securities, at value (including securities loaned of $3,358,260) - See accompanying schedule: Unaffiliated issuers (cost $619,837,159) | $ 670,226,277 | |
Fidelity Central Funds (cost $9,954,237) | 9,954,237 | |
Total Investments (cost $629,791,396) | | $ 680,180,514 |
Receivable for investments sold | | 12,533,040 |
Receivable for fund shares sold | | 309,342 |
Dividends receivable | | 893,595 |
Distributions receivable from Fidelity Central Funds | | 3,495 |
Other receivables | | 12,544 |
Total assets | | 693,932,530 |
| | |
Liabilities | | |
Payable for investments purchased | $ 17,244,606 | |
Payable for fund shares redeemed | 934,832 | |
Accrued management fee | 250,296 | |
Other affiliated payables | 168,034 | |
Other payables and accrued expenses | 44,435 | |
Collateral on securities loaned, at value | 3,456,000 | |
Total liabilities | | 22,098,203 |
| | |
Net Assets | | $ 671,834,327 |
Net Assets consist of: | | |
Paid in capital | | $ 938,554,964 |
Undistributed net investment income | | 710,785 |
Accumulated undistributed net realized gain (loss) on investments and foreign currency transactions | | (317,819,876) |
Net unrealized appreciation (depreciation) on investments and assets and liabilities in foreign currencies | | 50,388,454 |
Net Assets, for 35,193,867 shares outstanding | | $ 671,834,327 |
Net Asset Value, offering price and redemption price per share ($671,834,327 ÷ 35,193,867 shares) | | $ 19.09 |
See accompanying notes which are an integral part of the financial statements.
Annual Report
Statement of Operations
| Year ended June 30, 2012 |
| | |
Investment Income | | |
Dividends | | $ 8,074,380 |
Interest | | 8 |
Income from Fidelity Central Funds | | 106,940 |
Total income | | 8,181,328 |
| | |
Expenses | | |
Management fee
Basic fee | $ 3,857,719 | |
Performance adjustment | 346,675 | |
Transfer agent fees | 1,860,705 | |
Accounting and security lending fees | 252,102 | |
Custodian fees and expenses | 53,000 | |
Independent trustees' compensation | 4,536 | |
Registration fees | 28,730 | |
Audit | 45,025 | |
Legal | 3,740 | |
Miscellaneous | 7,848 | |
Total expenses before reductions | 6,460,080 | |
Expense reductions | (90,102) | 6,369,978 |
Net investment income (loss) | | 1,811,350 |
Realized and Unrealized Gain (Loss) Net realized gain (loss) on: | | |
Investment securities: | | |
Unaffiliated issuers | (6,893,675) | |
Foreign currency transactions | (7,473) | |
Total net realized gain (loss) | | (6,901,148) |
Change in net unrealized appreciation (depreciation) on: Investment securities | (1,644,719) | |
Assets and liabilities in foreign currencies | (7,167) | |
Total change in net unrealized appreciation (depreciation) | | (1,651,886) |
Net gain (loss) | | (8,553,034) |
Net increase (decrease) in net assets resulting from operations | | $ (6,741,684) |
See accompanying notes which are an integral part of the financial statements.
Annual Report
Financial Statements - continued
Statement of Changes in Net Assets
| Year ended
June 30,
2012 | Year ended
June 30,
2011 |
Increase (Decrease) in Net Assets | | |
Operations | | |
Net investment income (loss) | $ 1,811,350 | $ 2,788,435 |
Net realized gain (loss) | (6,901,148) | 142,775,602 |
Change in net unrealized appreciation (depreciation) | (1,651,886) | 82,974,653 |
Net increase (decrease) in net assets resulting
from operations | (6,741,684) | 228,538,690 |
Distributions to shareholders from net investment income | (2,053,471) | (3,894,838) |
Share transactions
Proceeds from sales of shares | 68,737,170 | 153,070,782 |
Reinvestment of distributions | 2,000,531 | 3,796,707 |
Cost of shares redeemed | (215,475,338) | (202,176,588) |
Net increase (decrease) in net assets resulting from share transactions | (144,737,637) | (45,309,099) |
Total increase (decrease) in net assets | (153,532,792) | 179,334,753 |
| | |
Net Assets | | |
Beginning of period | 825,367,119 | 646,032,366 |
End of period (including undistributed net investment income of $710,785 and undistributed net investment income of $958,686, respectively) | $ 671,834,327 | $ 825,367,119 |
Other Information Shares | | |
Sold | 3,783,341 | 8,809,200 |
Issued in reinvestment of distributions | 116,157 | 236,504 |
Redeemed | (12,219,872) | (11,836,889) |
Net increase (decrease) | (8,320,374) | (2,791,185) |
See accompanying notes which are an integral part of the financial statements.
Annual Report
Financial Highlights
Years ended June 30, | 2012 | 2011 | 2010 | 2009 | 2008 |
Selected Per-Share Data | | | | | |
Net asset value, beginning of period | $ 18.97 | $ 13.95 | $ 12.59 | $ 19.95 | $ 26.09 |
Income from Investment Operations | | | | | |
Net investment income (loss) B | .05 | .06 | .07 | .09 | (.02) |
Net realized and unrealized gain (loss) | .12 E | 5.05 | 1.35 | (7.36) | (1.85) |
Total from investment operations | .17 | 5.11 | 1.42 | (7.27) | (1.87) |
Distributions from net investment income | (.05) | (.09) | (.05) | (.05) | (.02) |
Distributions from net realized gain | - | - | (.02) | (.04) | (4.25) |
Total distributions | (.05) | (.09) | (.06) G | (.09) | (4.27) |
Net asset value, end of period | $ 19.09 | $ 18.97 | $ 13.95 | $ 12.59 | $ 19.95 |
Total Return A | .93% | 36.71% | 11.26% | (36.47)% | (8.50)% |
Ratios to Average Net Assets C,F | | | | |
Expenses before reductions | .94% | .71% | .73% | .71% | .99% |
Expenses net of fee waivers, if any | .94% | .71% | .73% | .71% | .99% |
Expenses net of all reductions | .92% | .69% | .69% | .70% | .98% |
Net investment income (loss) | .26% | .36% | .50% | .67% | (.08)% |
Supplemental Data | | | | | |
Net assets, end of period (000 omitted) | $ 671,834 | $ 825,367 | $ 646,032 | $ 691,141 | $ 1,302,477 |
Portfolio turnover rate D | 277% | 257% | 246% | 424% | 173% |
A Total returns would have been lower if certain expenses had not been reduced during the applicable periods shown.
B Calculated based on average shares outstanding during the period.
C Fees and expenses of any underlying Fidelity Central Funds are not included in the Fund's expense ratio. The Fund indirectly bears its proportionate share of the expenses of any underlying Fidelity Central Funds.
D Amount does not include the portfolio activity of any underlying Fidelity Central Funds.
E The amount shown for a share outstanding does not correspond with the aggregate net gain (loss) on investments for the period due to the timing of sales and repurchases of shares in relation to fluctuating market values of the investments of the Fund.
F Expense ratios reflect operating expenses of the Fund. Expenses before reductions do not reflect amounts reimbursed by the investment adviser or reductions from brokerage service arrangements or reductions from other expense offset arrangements and do not represent the amount paid by the Fund during periods when reimbursements or reductions occur. Expenses net of fee waivers reflect expenses after reimbursement by the investment adviser but prior to reductions from brokerage service arrangements or other expense offset arrangements. Expenses net of all reductions represent the net expenses paid by the Fund.
G Total distributions of $.06 per share is comprised of distributions from net investment income of $.045 and distributions from net realized gain of $.015 per share.
See accompanying notes which are an integral part of the financial statements.
Annual Report
Notes to Financial Statements
For the period ended June 30, 2012
1. Organization.
Fidelity Fifty (the Fund) is a non-diversified fund of Fidelity Hastings Street Trust (the Trust) and is authorized to issue an unlimited number of shares. The Trust is registered under the Investment Company Act of 1940, as amended (the 1940 Act), as an open-end management investment company organized as a Massachusetts business trust.
2. Investments in Fidelity Central Funds.
The Fund invests in Fidelity Central Funds, which are open-end investment companies available only to other investment companies and accounts managed by Fidelity Management & Research Company (FMR) and its affiliates. The Fund's Schedule of Investments lists each of the Fidelity Central Funds held as of period end, if any, as an investment of the Fund, but does not include the underlying holdings of each Fidelity Central Fund. As an Investing Fund, the Fund indirectly bears its proportionate share of the expenses of the underlying Fidelity Central Funds.
The Money Market Central Funds seek preservation of capital and current income and are managed by Fidelity Investments Money Management, Inc. (FIMM), an affiliate of FMR.
A complete unaudited list of holdings for each Fidelity Central Fund is available upon request or at the Securities and Exchange Commission (the SEC) web site at www.sec.gov. In addition, the financial statements of the Fidelity Central Funds, which are not covered by the Fund's Report of Independent Registered Public Accounting Firm, are available on the SEC web site or upon request.
3. Significant Accounting Policies.
The financial statements have been prepared in conformity with accounting principles generally accepted in the United States of America (GAAP), which require management to make certain estimates and assumptions at the date of the financial statements. Actual results could differ from those estimates. Subsequent events, if any, through the date that the financial statements were issued have been evaluated in the preparation of the financial statements. The following summarizes the significant accounting policies of the Fund:
Security Valuation. Investments are valued as of 4:00 p.m. Eastern time on the last calendar day of the period. In accordance with valuation policies and procedures approved by the Board of Trustees (the Board), the Fund attempts to obtain prices from one or more third party pricing vendor or broker to value its investments. When current market prices, quotations or rates are not readily available or reliable, securities will be fair valued in good faith by the FMR Fair Value Committee (the Committee), in accordance with procedures adopted by the Fund's Board. Factors used in determining fair
Annual Report
Notes to Financial Statements - continued
3. Significant Accounting Policies - continued
Security Valuation - continued
value vary by security type and may include market or security specific events. The frequency with which these procedures are used cannot be predicted and they may be utilized to a significant extent. The Committee oversees the Fund's valuation policies and procedures and is responsible for approving and reporting to the Board all fair value determinations.
The Fund categorizes the inputs to valuation techniques used to value its investments into a disclosure hierarchy consisting of three levels as shown below:
Level 1 - quoted prices in active markets for identical investments
Level 2 - other significant observable inputs (including quoted prices for similar investments, interest rates, prepayment speeds, etc.)
Level 3 - unobservable inputs (including the Fund's own assumptions based on the best information available)
Valuation techniques used to value the Fund's investments by major category are as follows:
Equity securities, including restricted securities, for which market quotations are readily available, are valued at the last reported sale price or official closing price as reported by a third party pricing vendor on the primary market or exchange on which they are traded and are categorized as Level 1 in the hierarchy. In the event there were no sales during the day or closing prices are not available, securities are valued at the last quoted bid price or may be valued using the last available price and are generally categorized as Level 2 in the hierarchy. For foreign equity securities, when significant market or security specific events arise, comparisons to the valuation of American Depositary Receipts (ADRs), futures contracts, Exchange-Traded Funds (ETFs) and certain indexes as well as quoted prices for similar securities are used and are categorized as Level 2 in the hierarchy. Utilizing these techniques may result in transfers between Level 1 and Level 2.
Investments in open-end mutual funds, including the Fidelity Central Funds, are valued at their closing net asset value each business day and are categorized as Level 1 in the hierarchy.
Changes in valuation techniques may result in transfers in or out of an assigned level within the disclosure hierarchy. The aggregate value of investments by input level, as of June 30, 2012, is included at the end of the Fund's Schedule of Investments.
Annual Report
3. Significant Accounting Policies - continued
Foreign Currency Translation. The Fund may use foreign currency contracts to facilitate transactions in foreign-denominated securities. Gains and losses from these transactions may arise from changes in the value of the foreign currency or if the counterparties do not perform under the contracts' terms.
Foreign-denominated assets, including investment securities, and liabilities are translated into U.S. dollars at the exchange rates at period end. Purchases and sales of investment securities, income and dividends received and expenses denominated in foreign currencies are translated into U.S. dollars at the exchange rate in effect on the transaction date.
The effects of exchange rate fluctuations on investments are included with the net realized and unrealized gain (loss) on investment securities. Other foreign currency transactions resulting in realized and unrealized gain (loss) are disclosed separately.
Investment Transactions and Income. For financial reporting purposes, the Fund's investment holdings and NAV include trades executed through the end of the last business day of the period. The NAV per share for processing shareholder transactions is calculated as of the close of business of the New York Stock Exchange (NYSE), normally 4:00 p.m. Eastern time and includes trades executed through the end of the prior business day. Gains and losses on securities sold are determined on the basis of identified cost and may include proceeds received from litigation. Dividend income is recorded on the ex-dividend date, except for certain dividends from foreign securities where the ex-dividend date may have passed, which are recorded as soon as the Fund is informed of the ex-dividend date. Non-cash dividends included in dividend income, if any, are recorded at the fair market value of the securities received. Distributions received on securities that represent a return of capital or capital gain are recorded as a reduction of cost of investments and/or as a realized gain. The Fund estimates the components of distributions received that may be considered return of capital distributions or capital gain distributions. Interest income and distributions from the Fidelity Central Funds are accrued as earned. Interest income includes coupon interest and amortization of premium and accretion of discount on debt securities. Investment income is recorded net of foreign taxes withheld where recovery of such taxes is uncertain.
Expenses. Expenses directly attributable to a fund are charged to that fund. Expenses attributable to more than one fund are allocated among the respective funds on the basis of relative net assets or other appropriate methods. Expense estimates are accrued in the period to which they relate and adjustments are made when actual amounts are known.
Income Tax Information and Distributions to Shareholders. Each year, the Fund intends to qualify as a regulated investment company under Subchapter M of the Internal Revenue Code, including distributing substantially all of its taxable income and
Annual Report
Notes to Financial Statements - continued
3. Significant Accounting Policies - continued
Income Tax Information and Distributions to Shareholders - continued
realized gains. As a result, no provision for income taxes is required. As of June 30, 2012, the Fund did not have any unrecognized tax benefits in the financial statements; nor is the Fund aware of any tax positions for which it is reasonably possible that the total amounts of unrecognized tax benefits will significantly change in the next twelve months. The Fund files a U.S. federal tax return, in addition to state and local tax returns as required. A fund's federal income tax returns are subject to examination by the Internal Revenue Service (IRS) for a period of three fiscal years after they are filed. State and local tax returns may be subject to examination for an additional fiscal year depending on the jurisdiction. Foreign taxes are provided for based on the Fund's understanding of the tax rules and rates that exist in the foreign markets in which it invests.
Distributions are declared and recorded on the ex-dividend date. Income and capital gain distributions are determined in accordance with income tax regulations, which may differ from GAAP.
Capital accounts within the financial statements are adjusted for permanent book-tax differences. These adjustments have no impact on net assets or the results of operations. Temporary book-tax differences will reverse in a subsequent period.
Book-tax differences are primarily due to foreign currency transactions, deferred trustees compensation, capital loss carryforwards and losses deferred due to wash sales.
The federal tax cost of investment securities and unrealized appreciation (depreciation) as of period end were as follows:
Gross unrealized appreciation | $ 55,878,094 |
Gross unrealized depreciation | (10,128,798) |
Net unrealized appreciation (depreciation) on securities and other investments | $ 45,749,296 |
| |
Tax Cost | $ 634,431,218 |
The tax-based components of distributable earnings as of period end were as follows:
Undistributed ordinary income | $ 710,803 |
Capital loss carryforward | $ (313,180,055) |
Net unrealized appreciation (depreciation) | $ 45,748,632 |
Capital loss carryforwards are only available to offset future capital gains of the Fund to the extent provided by regulations and may be limited. Under the Regulated Investment Company Modernization Act of 2010 (the Act), the Fund is permitted to carry forward
Annual Report
3. Significant Accounting Policies - continued
Income Tax Information and Distributions to Shareholders - continued
capital losses incurred in taxable years beginning after December 22, 2010 for an unlimited period and such capital losses are required to be used prior to any losses that expire. Capital loss carryforwards were as follows:
Fiscal year of expiration | |
2017 | $ (309,884,990) |
No expiration | |
Short-term | (3,295,065) |
Total capital loss carryforward | $ (313,180,055) |
The tax character of distributions paid was as follows:
| June 30, 2012 | June 30, 2011 |
Ordinary Income | $ 2,053,471 | $ 3,894,838 |
New Accounting Pronouncement. In December 2011, the Financial Accounting Standards Board issued Accounting Standard Update No. 2011-11, Disclosures about Offsetting Assets and Liabilities. The update creates new disclosure requirements requiring entities to disclose both gross and net information for derivatives and other financial instruments that are either offset in the Statement of Assets and Liabilities or subject to an enforceable master netting arrangement or similar agreement. The disclosure requirements are effective for interim and annual reporting periods beginning on or after January 1, 2013. Management is currently evaluating the impact of the update's adoption on the Fund's financial statement disclosures.
4. Purchases and Sales of Investments.
Purchases and sales of securities, other than short-term securities, aggregated $1,910,373,369 and $2,051,610,933, respectively.
5. Fees and Other Transactions with Affiliates.
Management Fee. FMR and its affiliates provide the Fund with investment management related services for which the Fund pays a monthly management fee. The management fee is the sum of an individual fund fee rate that is based on an annual rate of .30% of the Fund's average net assets and an annualized group fee rate that averaged .26% during the period. The group fee rate is based upon the average net assets of all the mutual funds advised by FMR. The group fee rate decreases as assets under management increase and increases as assets under management decrease. In addition, the management fee is subject to a performance adjustment (up to a maximum of ± .20% of the Fund's average net assets over a 36 month performance period). The upward or
Annual Report
Notes to Financial Statements - continued
5. Fees and Other Transactions with Affiliates - continued
Management Fee - continued
downward adjustment to the management fee is based on the Fund's relative investment performance as compared to an appropriate benchmark index. For the period, the total annual management fee rate, including the performance adjustment, was .61% of the Fund's average net assets.
Transfer Agent Fees. Fidelity Investments Institutional Operations Company, Inc. (FIIOC), an affiliate of FMR, is the Fund's transfer, dividend disbursing and shareholder servicing agent. FIIOC receives account fees and asset-based fees that vary according to account size and type of account. FIIOC pays for typesetting, printing and mailing of shareholder reports, except proxy statements. For the period, the transfer agent fees were equivalent to an annual rate of .27% of average net assets.
Accounting and Security Lending Fees. Fidelity Service Company, Inc. (FSC), an affiliate of FMR, maintains the Fund's accounting records. The accounting fee is based on the level of average net assets for each month. Under a separate contract, FSC administers the security lending program. The security lending fee is based on the number and duration of lending transactions.
Brokerage Commissions. The Fund placed a portion of its portfolio transactions with brokerage firms which are affiliates of the investment adviser. The commissions paid to these affiliated firms were $66,625 for the period.
6. Committed Line of Credit.
The Fund participates with other funds managed by FMR or an affiliate in a $4.25 billion credit facility (the "line of credit") to be utilized for temporary or emergency purposes to fund shareholder redemptions or for other short-term liquidity purposes. The Fund has agreed to pay commitment fees on its pro-rata portion of the line of credit, which amounted to $2,031 and is reflected in Miscellaneous expenses on the Statement of Operations. During the period, there were no borrowings on this line of credit.
7. Security Lending.
The Fund lends portfolio securities through a lending agent from time to time in order to earn additional income. For equity securities, a lending agent is used and may loan securities to certain qualified borrowers, including Fidelity Capital Markets (FCM), a broker-dealer affiliated with the Fund. On the settlement date of the loan, the Fund receives collateral (in the form of U.S. Treasury obligations, letters of credit and/or cash) against the loaned securities and maintains collateral in an amount not less than 100% of the market value of the loaned securities during the period of the loan. The market value of the loaned securities is determined at the close of business of the Fund and any
Annual Report
7. Security Lending - continued
additional required collateral is delivered to the Fund on the next business day. If the borrower defaults on its obligation to return the securities loaned because of insolvency or other reasons, a fund could experience delays and costs in recovering the securities loaned or in gaining access to the collateral. Any cash collateral received is invested in the Fidelity Securities Lending Cash Central Fund. The value of loaned securities and cash collateral at period end are disclosed on the Fund's Statement of Assets and Liabilities. Security lending income represents the income earned on investing cash collateral, less rebates paid to borrowers and any lending agent fees associated with the loan, plus any premium payments received for lending certain types of securities. Security lending income is presented in the Statement of Operations as a component of income from Fidelity Central Funds. Total security lending income during the period amounted to $91,387. During the period, there were no securities loaned to FCM.
8. Expense Reductions.
Many of the brokers with whom FMR places trades on behalf of the Fund provided services to the Fund in addition to trade execution. These services included payments of certain expenses on behalf of the Fund totaling $90,063 for the period. In addition, through arrangements with the Fund's custodian, credits realized as a result of uninvested cash balances were used to reduce the Fund's expenses. During the period, these credits reduced the Fund's custody expenses by $39.
9. Other.
The Fund's organizational documents provide former and current trustees and officers with a limited indemnification against liabilities arising in connection with the performance of their duties to the Fund. In the normal course of business, the Fund may also enter into contracts that provide general indemnifications. The Fund's maximum exposure under these arrangements is unknown as this would be dependent on future claims that may be made against the Fund. The risk of material loss from such claims is considered remote.
Annual Report
To the Trustees of Fidelity Hastings Street Trust and the Shareholders of Fidelity Fifty:
In our opinion, the accompanying statement of assets and liabilities, including the schedule of investments, and the related statements of operations and of changes in net assets and the financial highlights present fairly, in all material respects, the financial position of Fidelity Fifty (a fund of Fidelity Hastings Street Trust) at June 30, 2012, the results of its operations for the year then ended, the changes in its net assets for each of the two years in the period then ended and the financial highlights for each of the five years in the period then ended, in conformity with accounting principles generally accepted in the United States of America. These financial statements and financial highlights (hereafter referred to as "financial statements") are the responsibility of the Fidelity Fifty's management. Our responsibility is to express an opinion on these financial statements based on our audits. We conducted our audits of these financial statements in accordance with the standards of the Public Company Accounting Oversight Board (United States). Those standards require that we plan and perform the audit to obtain reasonable assurance about whether the financial statements are free of material misstatement. An audit includes examining, on a test basis, evidence supporting the amounts and disclosures in the financial statements, assessing the accounting principles used and significant estimates made by management, and evaluating the overall financial statement presentation. We believe that our audits, which included confirmation of securities at June 30, 2012 by correspondence with the custodian and brokers, provide a reasonable basis for our opinion.
/s/ PricewaterhouseCoopers LLP
PricewaterhouseCoopers LLP
Boston, Massachusetts
August 10, 2012
Annual Report
The Trustees, Members of the Advisory Board, and executive officers of the trust and fund, as applicable, are listed below. The Board of Trustees governs the fund and is responsible for protecting the interests of shareholders. The Trustees are experienced executives who meet periodically throughout the year to oversee the fund's activities, review contractual arrangements with companies that provide services to the fund, oversee management of the risks associated with such activities and contractual arrangements, and review the fund's performance. Except for James C. Curvey, each of the Trustees oversees 228 funds advised by FMR or an affiliate. Mr. Curvey oversees 435 funds advised by FMR or an affiliate.
The Trustees hold office without limit in time except that (a) any Trustee may resign; (b) any Trustee may be removed by written instrument, signed by at least two-thirds of the number of Trustees prior to such removal; (c) any Trustee who requests to be retired or who has become incapacitated by illness or injury may be retired by written instrument signed by a majority of the other Trustees; and (d) any Trustee may be removed at any special meeting of shareholders by a two-thirds vote of the outstanding voting securities of the trust. Each Trustee who is not an interested person (as defined in the 1940 Act) (Independent Trustee), shall retire not later than the last day of the calendar year in which his or her 75th birthday occurs. The Independent Trustees may waive this mandatory retirement age policy with respect to individual Trustees. The executive officers and Advisory Board Members hold office without limit in time, except that any officer and Advisory Board Member may resign or may be removed by a vote of a majority of the Trustees at any regular meeting or any special meeting of the Trustees. Except as indicated, each individual has held the office shown or other offices in the same company for the past five years.
Experience, Skills, Attributes, and Qualifications of the Fund's Trustees. The Governance and Nominating Committee has adopted a statement of policy that describes the experience, qualifications, attributes, and skills that are necessary and desirable for potential Independent Trustee candidates (Statement of Policy). The Board believes that each Trustee satisfied at the time he or she was initially elected or appointed a Trustee, and continues to satisfy, the standards contemplated by the Statement of Policy. The Governance and Nominating Committee also engages professional search firms to help identify potential Independent Trustee candidates who have the experience, qualifications, attributes, and skills consistent with the Statement of Policy. From time to time, additional criteria based on the composition and skills of the current Independent Trustees, as well as experience or skills that may be appropriate in light of future changes to board composition, business conditions, and regulatory or other developments, have also been considered by the professional search firms and the Governance and Nominating Committee. In addition, the Board takes into account the Trustees' commitment and participation in Board and committee meetings, as well as their leadership of standing and ad hoc committees throughout their tenure.
In determining that a particular Trustee was and continues to be qualified to serve as a Trustee, the Board has considered a variety of criteria, none of which, in isolation, was controlling. The Board believes that, collectively, the Trustees have balanced and diverse experience, qualifications, attributes, and skills, which allow the Board to operate effectively in governing the fund and protecting the interests of shareholders. Information about the specific experience, skills, attributes, and qualifications of each Trustee, which in each case led to the Board's conclusion that the Trustee should serve (or continue to serve) as a trustee of the fund, is provided below.
Annual Report
Trustees and Officers - continued
Board Structure and Oversight Function. James C. Curvey is an interested person (as defined in the 1940 Act) and currently serves as Chairman. The Trustees have determined that an interested Chairman is appropriate and benefits shareholders because an interested Chairman has a personal and professional stake in the quality and continuity of services provided to the fund. Independent Trustees exercise their informed business judgment to appoint an individual of their choosing to serve as Chairman, regardless of whether the Trustee happens to be independent or a member of management. The Independent Trustees have determined that they can act independently and effectively without having an Independent Trustee serve as Chairman and that a key structural component for assuring that they are in a position to do so is for the Independent Trustees to constitute a substantial majority for the Board. The Independent Trustees also regularly meet in executive session. Ned C. Lautenbach serves as Chairman of the Independent Trustees and as such (i) acts as a liaison between the Independent Trustees and management with respect to matters important to the Independent Trustees and (ii) with management prepares agendas for Board meetings.
Fidelity funds are overseen by different Boards of Trustees. The fund's Board oversees Fidelity's equity and high income funds and another Board oversees Fidelity's investment-grade bond, money market, and asset allocation funds. The asset allocation funds may invest in Fidelity funds overseen by the fund's Board. The use of separate Boards, each with its own committee structure, allows the Trustees of each group of Fidelity funds to focus on the unique issues of the funds they oversee, including common research, investment, and operational issues. On occasion, the separate Boards establish joint committees to address issues of overlapping consequences for the Fidelity funds overseen by each Board.
The Trustees operate using a system of committees to facilitate the timely and efficient consideration of all matters of importance to the Trustees, the fund, and fund shareholders and to facilitate compliance with legal and regulatory requirements and oversight of the fund's activities and associated risks. The Board, acting through its committees, has charged FMR and its affiliates with (i) identifying events or circumstances the occurrence of which could have demonstrably adverse effects on the fund's business and/or reputation; (ii) implementing processes and controls to lessen the possibility that such events or circumstances occur or to mitigate the effects of such events or circumstances if they do occur; and (iii) creating and maintaining a system designed to evaluate continuously business and market conditions in order to facilitate the identification and implementation processes described in (i) and (ii) above. Because the day-to-day operations and activities of the fund are carried out by or through FMR, its affiliates and other service providers, the fund's exposure to risks is mitigated but not eliminated by the processes overseen by the Trustees. While each of the Board's committees has responsibility for overseeing different aspects of the fund's activities, oversight is exercised primarily through the Operations, Audit, and Compliance Committees. In addition, the Independent Trustees have worked with FMR to enhance the Board's oversight of investment and financial risks, legal and regulatory risks, technology risks, and operational risks, including the development of additional risk reporting to the Board. For example, a working group comprised of Independent Trustees and FMR has worked and continues to work to review the Fidelity funds' valuation-related activities, reporting and risk management. Appropriate personnel, including but not limited to the fund's Chief Compliance Officer (CCO), FMR's internal auditor, the independent accountants, the fund's Treasurer and portfolio management personnel, make periodic reports to the Board's committees, as appropriate, including an annual review of FMR's risk management program for the Fidelity funds. The responsibilities of each standing committee, including their oversight responsibilities, are described further under "Standing Committees of the Fund's Trustees."
Annual Report
The fund's Statement of Additional Information (SAI) includes more information about the Trustees. To request a free copy, call Fidelity at 1-800-544-8544.
Interested Trustees*:
Correspondence intended for each Trustee who is an interested person may be sent to Fidelity Investments, 82 Devonshire Street, Boston, Massachusetts 02109.
Name, Age; Principal Occupations and Other Relevant Experience+ |
James C. Curvey (77) |
| Year of Election or Appointment: 2007 Mr. Curvey is Trustee and Chairman of the Board of Trustees of certain Trusts. Mr. Curvey also serves as Trustee (2007-present) of other investment companies advised by FMR. Mr. Curvey is a Director of Fidelity Investments Money Management, Inc. (2009-present), Director of Fidelity Research & Analysis Co. (2009-present) and Director of FMR and FMR Co., Inc. (2007-present). Mr. Curvey is also Vice Chairman (2007-present) and Director of FMR LLC. In addition, Mr. Curvey serves as an Overseer for the Boston Symphony Orchestra and a member of the Trustees of Villanova University. Previously, Mr. Curvey was the Vice Chairman (2006-2007) and Director (2000-2007) of FMR Corp. |
Ronald P. O'Hanley (55) |
| Year of Election or Appointment: 2011 Mr. O'Hanley is Director of FMR Co., Inc. (2010-present), Director of Fidelity Investments Money Management, Inc. (2010-present), Director of Fidelity Research & Analysis Company (2010-present), President of Fidelity Asset Management and Corporate Services and a member of Fidelity's Executive Committee (2010-present). Previously, Mr. O'Hanley served as President and Chief Executive Officer of BNY Mellon Asset Management (2007-2010). Mr. O'Hanley also served as Vice Chairman of Bank New York Mellon Corp. and a member of that firm's Executive Committee. Prior to the 2007 merger of The Bank of New York and Mellon Financial Corporation, he was Vice Chairman of Mellon Financial Corporation and President and Chief Executive Officer of Mellon Asset Management. He joined Mellon in February 1997. Mr. O'Hanley currently serves as Chairman of the Boston Public Library Foundation Board of Directors and sits on the Board of Directors of Beth Israel Deaconess Medical Center, the Board of Trustees of the Marine Biological Laboratory and the Advisory Board of the Maxwell School of Citizenship and Public Administration at Syracuse University. Mr. O'Hanley also chairs the Council on Asset Management for the Financial Services Roundtable and is a member of the Board of Directors of Institutional Investor's U.S. Institute. |
* Trustees have been determined to be "Interested Trustees" by virtue of, among other things, their affiliation with the trust or various entities under common control with FMR.
+ The information above includes each Trustee's principal occupation during the last five years and other information relating to the experience, attributes, and skills relevant to each Trustee's qualifications to serve as a Trustee, which led to the conclusion that each Trustee should serve as a Trustee for the fund.
Annual Report
Independent Trustees:
Correspondence intended for each Independent Trustee (that is, the Trustees other than the Interested Trustees) may be sent to Fidelity Investments, P.O. Box 55235, Boston, Massachusetts 02205-5235.
Name, Age; Principal Occupations and Other Relevant Experience+ |
Dennis J. Dirks (64) |
| Year of Election or Appointment: 2005 Prior to his retirement in May 2003, Mr. Dirks was Chief Operating Officer and a member of the Board of The Depository Trust & Clearing Corporation (DTCC). He also served as President, Chief Operating Officer, and Board member of The Depository Trust Company (DTC) and President and Board member of the National Securities Clearing Corporation (NSCC). In addition, Mr. Dirks served as Chief Executive Officer and Board member of the Government Securities Clearing Corporation, Chief Executive Officer and Board member of the Mortgage-Backed Securities Clearing Corporation, as a Trustee and a member of the Finance Committee of Manhattan College (2005-2008), and as a Trustee and a member of the Finance Committee of AHRC of Nassau County (2006-2008). Mr. Dirks is a member of the Independent Directors Council (IDC) Governing Council (2010-present) and Board of Directors for The Brookville Center for Children's Services, Inc. (2009-present). |
Alan J. Lacy (58) |
| Year of Election or Appointment: 2008 Mr. Lacy serves as Senior Adviser (2007-present) of Oak Hill Capital Partners, L.P. (private equity). Mr. Lacy also served as Chief Executive Officer (2000-2005) and Vice Chairman (2005-2006) of Sears Holdings Corporation and Sears, Roebuck and Co. (retail). In addition, Mr. Lacy serves as a member of the Board of Directors of Dave & Buster's, Inc. (restaurant and entertainment complexes, 2010-present), The Hillman Companies, Inc. (hardware wholesalers, 2010-present), and Bristol-Myers Squibb Company (global pharmaceuticals, 2007-present). Mr. Lacy is a member of the Board of Trustees of The National Parks Conservation Association (2006-present). Previously, Mr. Lacy served as Chairman of the Board of Trustees of the National Parks Conservation Association (2008-2011) and as a member of the Board of Directors for the Western Union Company (global money transfer, 2006-2011). |
Ned C. Lautenbach (68) |
| Year of Election or Appointment: 2000 Mr. Lautenbach is Chairman of the Independent Trustees of the Equity and High Income Funds (2006-present). Mr. Lautenbach currently serves as the Lead Director of the Eaton Corporation Board of Directors (diversified industrial, 1997-present). Mr. Lautenbach is also a member of the Board of Directors of the Philharmonic Center for the Arts in Naples, Florida (1999-present); a member of the Board of Trustees of Fairfield University (2005-present); and a member of the Council on Foreign Relations (1994-present). Previously, Mr. Lautenbach was a Partner/Advisory Partner at Clayton, Dubilier & Rice, LLC (private equity investment, 1998-2010), as well as a Director of Sony Corporation (2006-2007). |
Joseph Mauriello (67) |
| Year of Election or Appointment: 2008 Prior to his retirement in January 2006, Mr. Mauriello served in numerous senior management positions including Deputy Chairman and Chief Operating Officer (2004-2005), and Vice Chairman of Financial Services (2002-2004) of KPMG LLP US (professional services, 1965-2005). Mr. Mauriello currently serves as a member of the Board of Directors of XL Group plc. (global insurance and re-insurance, 2006-present). Previously, Mr. Mauriello served as a Director of the Hamilton Funds of the Bank of New York (2006-2007) and Arcadia Resources Inc. (health care services and products, 2007-2012). |
Robert W. Selander (61) |
| Year of Election or Appointment: 2011 Previously, Mr. Selander served as a Member of the Advisory Board of Fidelity's Equity and High Income Funds (2011), Executive Vice Chairman (2010), Chief Executive Officer (2009-2010), and President and Chief Executive Officer (1997-2009) of Mastercard, Inc. |
Cornelia M. Small (67) |
| Year of Election or Appointment: 2005 Ms. Small is a member of the Board of Directors of the Teagle Foundation (2009-present). Ms. Small is also a member of the Investment Committee, and Chair (2008-present) and a member of the Board of Trustees of Smith College. In addition, Ms. Small serves on the Investment Committee of the Berkshire Taconic Community Foundation (2008-present). Previously, Ms. Small served as Chairperson of the Investment Committee (2002-2008) of Smith College. In addition, Ms. Small served as Chief Investment Officer, Director of Global Equity Investments, and a member of the Board of Directors of Scudder, Stevens & Clark and Scudder Kemper Investments. |
William S. Stavropoulos (73) |
| Year of Election or Appointment: 2001 Mr. Stavropoulos is Vice Chairman of the Independent Trustees of the Equity and High Income Funds (2006-present). Mr. Stavropoulos serves as President and Founder of the Michigan Baseball Foundation, the Great Lakes Loons (2007-present). Mr. Stavropoulos is Chairman Emeritus of the Board of Directors of The Dow Chemical Company, where he previously served in numerous senior management positions, including President, CEO (1995-2000; 2002-2004), Chairman of the Executive Committee (2000-2006), and as a member of the Board of Directors (1990-2006). Currently, Mr. Stavropoulos is Chairman of Univar (global distributor of commodity and specialty chemicals, 2010-present), a Director of Teradata Corporation (data warehousing and technology solutions, 2008-present), Chemical Financial Corporation, Maersk Inc. (industrial conglomerate), Tyco International, Inc. (multinational manufacturing and services, 2007-present), and a member of the Advisory Board for Metalmark Capital (private equity investment, 2005-present). Mr. Stavropoulos is a special advisor to Clayton, Dubilier & Rice, LLC (private equity investment). In addition, Mr. Stavropoulos is a member of the University of Notre Dame Advisory Council for the College of Science. |
David M. Thomas (63) |
| Year of Election or Appointment: 2008 Previously, Mr. Thomas served as Executive Chairman (2005-2006) and Chairman and Chief Executive Officer (2000-2005) of IMS Health, Inc. (pharmaceutical and healthcare information solutions). In addition, Mr. Thomas serves as a member of the Board of Directors of Fortune Brands, Inc. (consumer products), and Interpublic Group of Companies, Inc. (marketing communication, 2004-present). |
Michael E. Wiley (61) |
| Year of Election or Appointment: 2008 Mr. Wiley also serves as a Director of Asia Pacific Exploration Consolidated (international oil and gas exploration and production, 2008-present). Mr. Wiley serves as a Director of Tesoro Corporation (independent oil refiner and marketer, 2005-present), and a Director of Bill Barrett Corporation (exploration and production, 2005-present). In addition, Mr. Wiley also serves as a Director of Post Oak Bank (privately-held bank, 2004-present). Previously, Mr. Wiley served as a member of the Board of Trustees of the University of Tulsa (2000-2006; 2007-2010), as a Senior Energy Advisor of Katzenbach Partners, LLC (consulting, 2006-2007), as an Advisory Director of Riverstone Holdings (private investment), Chairman, President, and CEO of Baker Hughes, Inc. (oilfield services, 2000-2004), and as Director of Spinnaker Exploration Company (exploration and production, 2001-2005). |
Annual Report
Trustees and Officers - continued
+ The information above includes each Trustee's principal occupation during the last five years and other information relating to the experience, attributes, and skills relevant to each Trustee's qualifications to serve as a Trustee, which led to the conclusion that each Trustee should serve as a Trustee for the fund.
Advisory Board Members and Executive Officers:
Correspondence intended for David A. Rosow and Garnett A. Smith may be sent to Fidelity Investments, P.O. Box 55235, Boston, Massachusetts 02205-5235. Correspondence intended for each executive officer, Edward C. Johnson 3d, and Peter S. Lynch may be sent to Fidelity Investments, 82 Devonshire Street, Boston, Massachusetts 02109.
Name, Age; Principal Occupation |
Edward C. Johnson 3d (82) |
| Year of Election or Appointment: 2011 Member of the Advisory Board of Fidelity's Equity and High Income Funds. Mr. Johnson serves as Chief Executive Officer, Chairman, and a Director of FMR LLC, and also serves as Chairman and Director of FIL Limited. Previously, Mr. Johnson served as a Trustee and Chairman of the Board of certain Fidelity Trusts, Chairman and a Director of FMR, Chairman and a Director of FMR Co., Inc., and President of FMR LLC (2006-2007). |
Peter S. Lynch (68) |
| Year of Election or Appointment: 2003 Member of the Advisory Board of Fidelity's Equity and High Income Funds. Mr. Lynch is Vice Chairman and a Director of FMR and FMR Co., Inc. In addition, Mr. Lynch serves as a Trustee of Boston College and as the Chairman of the Inner-City Scholarship Fund. Previously, Mr. Lynch served on the Special Olympics International Board of Directors (1997-2006). |
David A. Rosow (69) |
| Year of Election or Appointment: 2012 Member of the Advisory Board of Fidelity's Equity and High Income Funds. Chairman and Chief Executive Officer of International Golf Group, Inc. (golf course development, 1990-present). Previously, Mr. Rosow served as Chairman and Chief Executive Officer of Rosow & Company, Inc. (private investment company, 1989-2011), a Lead Director of Hudson United Bancorp (2001-2006) and as a Director of TD Banknorth (1996-2006). In addition, Mr. Rosow is a member (2008-present) and President (2009-present) of the Town Council of Palm Beach, Florida. |
Garnett A. Smith (64) |
| Year of Election or Appointment: 2012 Member of the Advisory Board of Fidelity's Equity and High Income Funds. Prior to Mr. Smith's retirement, he served as Chairman and Chief Executive Officer of Inbrand Corp. (manufacturer of personal absorbent products, 1990-1997). He also served as President (1986-1990) of Inbrand Corp. Prior to his employment with Inbrand Corp., he was employed by a retail fabric chain and North Carolina National Bank. In addition, Mr. Smith is a board member of the Jackson Hole Land Trust (2009-present). |
Kenneth B. Robins (42) |
| Year of Election or Appointment: 2008 President and Treasurer of Fidelity's Equity and High Income Funds. Mr. Robins also serves as President and Treasurer (2010-present) and Assistant Treasurer (2009-present) of other Fidelity funds and is an employee of Fidelity Investments (2004-present). Previously, Mr. Robins served as Deputy Treasurer of the Fidelity funds (2005-2008) and Treasurer and Chief Financial Officer of The North Carolina Capital Management Trust: Cash and Term Portfolios (2006-2008). |
Bruce T. Herring (46) |
| Year of Election or Appointment: 2006 Vice President of certain Equity Funds. Mr. Herring also serves as President of Fidelity Research & Analysis Company (2010-present), Chief Investment Officer and Director of Fidelity Management & Research (U.K.) Inc. (2010-present) and Group Chief Investment Officer of FMR. Previously, Mr. Herring served as Vice President (2005-2006) and Senior Vice President (2006-2007) of Fidelity Management & Research Company, Vice President of FMR Co., Inc. (2001-2007) and as a portfolio manager for Fidelity U.S. Equity Funds. |
Brian B. Hogan (47) |
| Year of Election or Appointment: 2009 Vice President of Equity and High Income Funds. Mr. Hogan also serves as President of FMR's Equity Division (2009-present). Previously, Mr. Hogan served as Senior Vice President, Equity Research of FMR (2006-2009) and as a portfolio manager. |
Scott C. Goebel (44) |
| Year of Election or Appointment: 2008 Secretary and Chief Legal Officer (CLO) of the Fidelity funds. Mr. Goebel also serves as Secretary of Fidelity Investments Money Management, Inc. (FIMM) (2010-present) and Fidelity Research and Analysis Company (FRAC) (2010-present); Secretary and CLO of The North Carolina Capital Management Trust: Cash and Term Portfolios (2008-present); General Counsel, Secretary, and Senior Vice President of FMR (2008-present) and FMR Co., Inc. (2008-present); employed by FMR LLC or an affiliate (2001-present); Chief Legal Officer of Fidelity Management & Research (Hong Kong) Limited (2008-present) and Assistant Secretary of Fidelity Management & Research (Japan) Inc. (2008-present), and Fidelity Management & Research (U.K.) Inc. (2008-present). Previously, Mr. Goebel served as Assistant Secretary of FIMM (2008-2010), FRAC (2008-2010), and the Funds (2007-2008) and as Vice President and Secretary of Fidelity Distributors Corporation (FDC) (2005-2007). |
William C. Coffey (43) |
| Year of Election or Appointment: 2009 Assistant Secretary of Fidelity's Equity and High Income Funds. Mr. Coffey also serves as Senior Vice President and Deputy General Counsel of FMR LLC (2010-present), and is an employee of Fidelity Investments. Previously, Mr. Coffey served as Vice President and Associate General Counsel of FMR LLC (2005-2009). |
Elizabeth Paige Baumann (44) |
| Year of Election or Appointment: 2012 Anti-Money Laundering (AML) Officer of the Fidelity funds. Ms. Baumann also serves as AML Officer of The North Carolina Capital Management Trust: Cash and Term Portfolios (2012-present), Chief AML Officer of FMR LLC (2012-present), and is an employee of Fidelity Investments. Previously, Ms. Baumann served as Vice President and Deputy Anti-Money Laundering Officer (2007-2012). |
Christine Reynolds (53) |
| Year of Election or Appointment: 2008 Chief Financial Officer of the Fidelity funds. Ms. Reynolds became President of Fidelity Pricing and Cash Management Services (FPCMS) in August 2008. Ms. Reynolds served as Chief Operating Officer of FPCMS (2007-2008). Previously, Ms. Reynolds served as President, Treasurer, and Anti-Money Laundering officer of the Fidelity funds (2004-2007). |
Joseph A. Hanlon (44) |
| Year of Election or Appointment: 2012 Chief Compliance Officer of Fidelity's Equity and High Income Funds. Mr. Hanlon serves as Compliance Officer of FMR, FMR Co., Inc., Fidelity Investments Money Management, Inc. (FIMM), Fidelity Research and Analysis Company (FRAC), Fidelity Management & Research (Japan) Inc., Fidelity Management & Research (U.K.) Inc., Fidelity Management & Research (Hong Kong), and Strategic Advisers, Inc. (2009-present), as Senior Vice President of the Fidelity Asset Management Division (2009-present), and is an employee of Fidelity Investments. |
Joseph F. Zambello (55) |
| Year of Election or Appointment: 2011 Deputy Treasurer of the Fidelity funds. Mr. Zambello is an employee of Fidelity Investments. Previously, Mr. Zambello served as Vice President of FMR's Program Management Group (2009-2011) and Vice President of the Transfer Agent Oversight Group (2005-2009). |
Adrien E. Deberghes (44) |
| Year of Election or Appointment: 2008 Deputy Treasurer of Fidelity's Equity and High Income Funds. Mr. Deberghes also serves as Vice President (2011-present) and Assistant Treasurer (2010-present) of other Fidelity funds, and is an employee of Fidelity Investments (2008-present). Previously, Mr. Deberghes served as Senior Vice President of Mutual Fund Administration at State Street Corporation (2007-2008), Senior Director of Mutual Fund Administration at Investors Bank & Trust (2005-2007), and Director of Finance for Dunkin' Brands (2000-2005). |
Stephanie J. Dorsey (43) |
| Year of Election or Appointment: 2010 Assistant Treasurer of Fidelity's Equity and High Income Funds. Ms. Dorsey also serves as Deputy Treasurer of other Fidelity funds (2008-present) and is an employee of Fidelity Investments (2008-present). Previously, Ms. Dorsey served as Treasurer (2004-2008) of the JPMorgan Mutual Funds and Vice President (2004-2008) of JPMorgan Chase Bank. |
John R. Hebble (54) |
| Year of Election or Appointment: 2009 Assistant Treasurer of Fidelity's Equity and High Income Funds. Mr. Hebble also serves as President (2011-present), Treasurer, and Chief Financial Officer of The North Carolina Capital Management Trust: Cash and Term Portfolios (2008-present), President and Treasurer of other Fidelity funds (2008-present) and is an employee of Fidelity Investments. |
Gary W. Ryan (53) |
| Year of Election or Appointment: 2005 Assistant Treasurer of the Fidelity funds. Mr. Ryan is an employee of Fidelity Investments. Previously, Mr. Ryan served as Vice President of Fund Reporting in Fidelity Pricing and Cash Management Services (FPCMS) (1999-2005). |
Jonathan Davis (44) |
| Year of Election or Appointment: 2010 Assistant Treasurer of the Fidelity funds. Mr. Davis is also Assistant Treasurer of Fidelity Rutland Square Trust II and Fidelity Commonwealth Trust II. Mr. Davis is an employee of Fidelity Investments. Previously, Mr. Davis served as Vice President and Associate General Counsel of FMR LLC (2003-2010). |
Annual Report
The fund designates 100% of the dividends distributed during the fiscal year as qualifying for the dividends-received deduction for corporate shareholders.
The fund designates 100% of the dividends distributed during the fiscal year as amounts which may be taken into account as a dividend for the purposes of the maximum rate under section 1(h)(11) of the Internal Revenue Code.
The fund will notify shareholders in January 2013 of amounts for use in preparing 2012 income tax returns.
Annual Report
Investment Adviser
Fidelity Management & Research Company
Boston, MA
Investment Sub-Advisers
Fidelity Management & Research
(Hong Kong) Limited
Fidelity Management & Research
(Japan) Inc.
FMR Co., Inc.
Fidelity Management & Research
(U.K.) Inc.
General Distributor
Fidelity Distributors Corporation
Smithfield, RI
Transfer and Service Agents
Fidelity Investments Institutional
Operations Company, Inc.
Boston, MA
Fidelity Service Company, Inc.
Boston, MA
Custodian
Citibank, N.A.
New York, NY
The Fidelity Telephone Connection
Mutual Fund 24-Hour Service
Exchanges/Redemptions
and Account Assistance 1-800-544-6666
Product Information 1-800-544-6666
Retirement Accounts 1-800-544-4774
(8 a.m. - 9 p.m.)
TDD Service 1-800-544-0118
for the deaf and hearing impaired
(9 a.m. - 9 p.m. Eastern time)
Fidelity Automated Service
Telephone (FAST®)
1-800-544-5555
Automated line for quickest service
FIF-UANN-0812
1.787732.109
(Fidelity Investment logo)(registered trademark)
Corporate Headquarters
82 Devonshire St., Boston, MA 02109
www.fidelity.com
Fidelity®
Fund
Annual Report
June 30, 2012
(Fidelity Cover Art)
Contents
Performance | (Click Here) | How the fund has done over time. |
Management's Discussion of Fund Performance | (Click Here) | The Portfolio Manager's review of fund performance and strategy. |
Shareholder Expense Example | (Click Here) | An example of shareholder expenses. |
Investment Changes | (Click Here) | A summary of major shifts in the fund's investments over the past six months. |
Investments | (Click Here) | A complete list of the fund's investments with their market values. |
Financial Statements | (Click Here) | Statements of assets and liabilities, operations, and changes in net assets, as well as financial highlights. |
Notes | (Click Here) | Notes to the financial statements. |
Report of Independent Registered Public Accounting Firm | (Click Here) | |
Trustees and Officers | (Click Here) | |
Distributions | (Click Here) | |
Proxy Voting Results | (Click Here) | |
To view a fund's proxy voting guidelines and proxy voting record for the 12-month period ended June 30, visit http://www.fidelity.com/proxyvotingresults or visit the Securities and Exchange Commission's (SEC) web site at http://www.sec.gov. You may also call 1-800-544-8544 to request a free copy of the proxy voting guidelines.
Standard & Poor's, S&P and S&P 500 are registered service marks of The McGraw-Hill Companies, Inc. and have been licensed for use by Fidelity Distributors Corporation.
Other third party marks appearing herein are the property of their respective owners.
All other marks appearing herein are registered or unregistered trademarks or service marks of FMR LLC or an affiliated company. © 2012 FMR LLC. All rights reserved.
Annual Report
This report and the financial statements contained herein are submitted for the general information of the shareholders of the fund. This report is not authorized for distribution to prospective investors in the fund unless preceded or accompanied by an effective prospectus.
A fund files its complete schedule of portfolio holdings with the SEC for the first and third quarters of each fiscal year on Form N-Q. Forms N-Q are available on the SEC's web site at http://www.sec.gov. A fund's Forms N-Q may be reviewed and copied at the SEC's Public Reference Room in Washington, DC. Information regarding the operation of the SEC's Public Reference Room may be obtained by calling 1-800-SEC-0330. For a complete list of a fund's portfolio holdings, view the most recent holdings listing, semiannual report, or annual report on Fidelity's web site at http://www.fidelity.com, http://www.advisor.fidelity.com, or http://www.401k.com, as applicable.
NOT FDIC INSURED • MAY LOSE VALUE • NO BANK GUARANTEE
Neither the fund nor Fidelity Distributors Corporation is a bank.
Annual Report
Average annual total return reflects the change in the value of an investment, assuming reinvestment of the class' distributions from dividend income and capital gains (the profits earned upon the sale of securities that have grown in value, if any) and assuming a constant rate of performance each year. The $10,000 table and the fund's returns do not reflect the deduction of taxes that a shareholder would pay on fund distributions or the redemption of fund shares. During periods of reimbursement by Fidelity, a fund's total return will be greater than it would be had the reimbursement not occurred. How a fund did yesterday is no guarantee of how it will do tomorrow.
Average Annual Total Returns
Periods ended June 30, 2012 | Past 1
year | Past 5
years | Past 10
years |
Fidelity® Fund | 1.21% | 0.09% | 5.09% |
$10,000 Over 10 Years
Let's say hypothetically that $10,000 was invested in Fidelity® Fund, a class of the fund, on June 30, 2002. The chart shows how the value of your investment would have changed, and also shows how the S&P 500® Index performed over the same period.
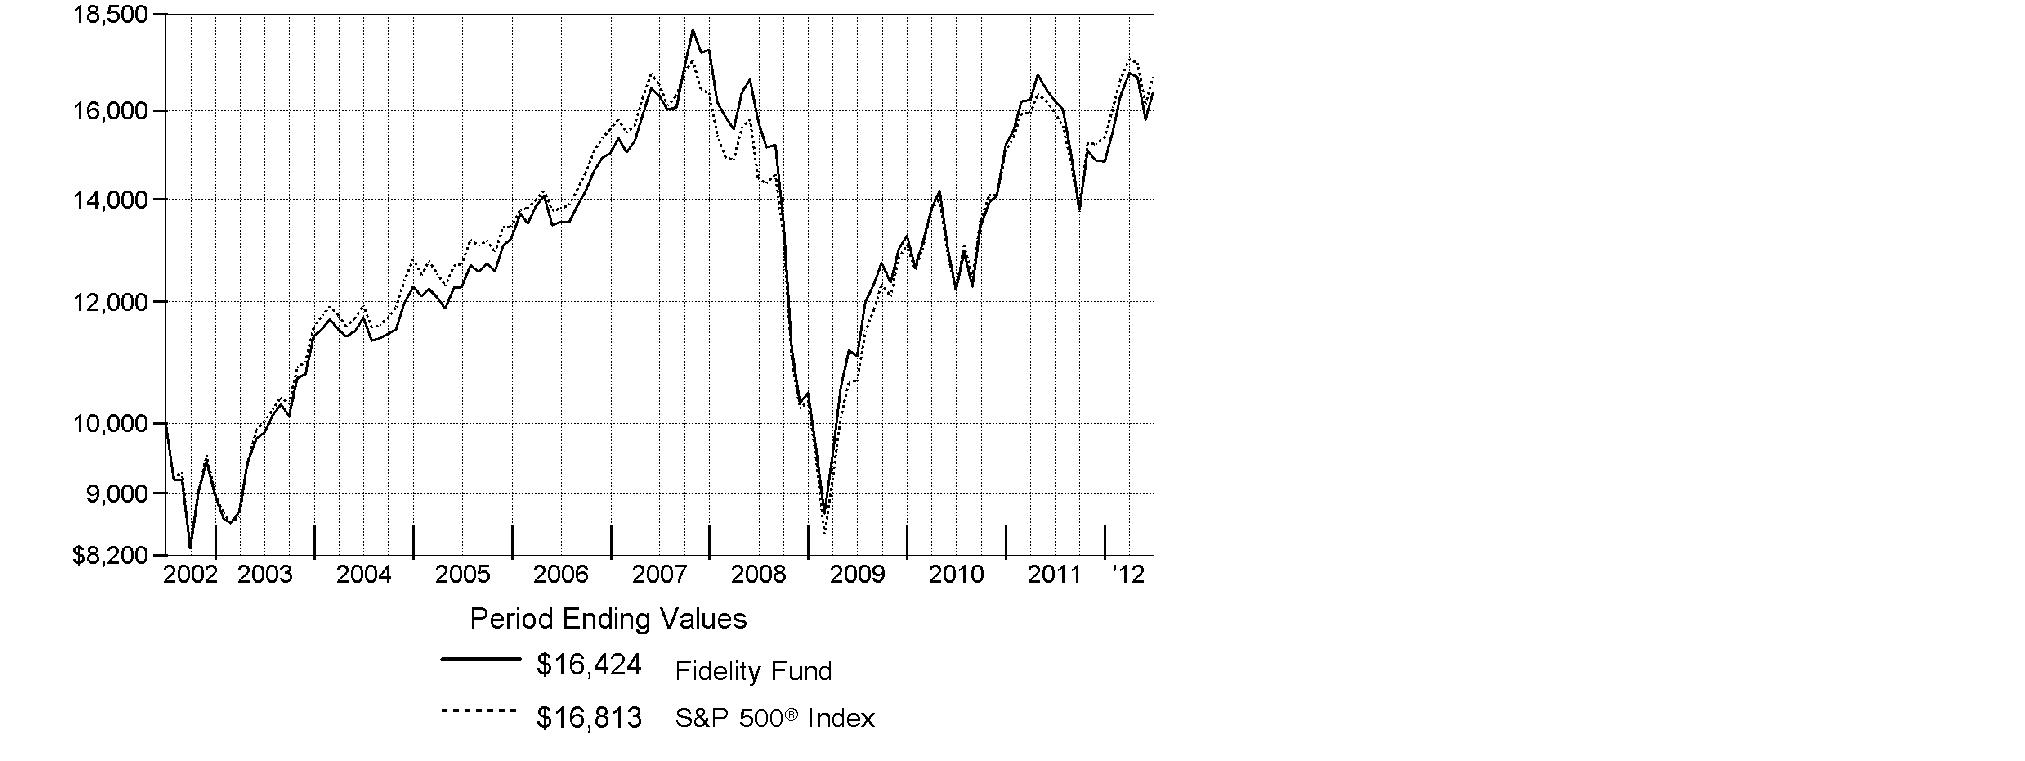
Annual Report
Market Recap: Major U.S. equity benchmarks posted solid gains for the 12 months ending June 30, 2012, even amid the period's uncertain investment environment. The broad-based S&P 500® Index returned 5.45%, while the blue-chip-laden Dow Jones Industrial AverageSM and the technology-heavy Nasdaq Composite® Index gained 6.63% and 6.99%, respectively. Volatility marked the first half of the period, as equities plummeted last summer and early fall on Europe's debt woes, debate over the U.S. debt ceiling and the credit-rating downgrade that followed. Beginning in October, healthier manufacturing, consumer and housing data rejuvenated markets and investors' appetite for stocks, leading major equity benchmarks to their best first-quarter performance since 1998. Stocks slipped again in the spring, as more eurozone trouble and a marked slowdown in China put the brakes on earlier momentum, until optimism reappeared in June. For the period, five of the 10 major market segments within the S&P 500® posted a double-digit gain, led by the more-defensive utilities, consumer staples and telecommunication services sectors, each which rose about 15%. Conversely, energy (-8%) and materials (-7%) struggled the most. Given Europe's turmoil and local currency weakness, foreign developed-markets stocks lost ground, with the MSCI® EAFE® Index returning -13.70%.
Comments from John Avery, Portfolio Manager of Fidelity® Fund: During the year, the fund's Retail Class shares returned 1.21%, lagging the S&P 500®. Versus the index, stock picking in the software and services segment of information technology weighed on relative performance, as did security selection in energy and financials. A cash position averaging roughly 3% also hurt, while the fund's foreign holdings disappointed in part due to a stronger U.S. dollar. At the individual stock level, the fund's out-of-index position in Australian gold miner Newcrest Mining suffered a sizable loss, as the price of gold fell and gold stocks underperformed the metal. Occidental Petroleum, commercial bank Citigroup and Green Mountain Coffee Roasters detracted as well. I sold Newcrest Mining and Green Mountain during the period. Conversely, stock selection in the hardware/equipment segment of technology added value, along with industry positioning in financials and stock picking in consumer discretionary. Apple was by far the fund's largest individual contributor, as the company reported impressive sales and earnings numbers driven by the popularity of its iPhone® smartphone and iPad® tablet device. Aerospace components and services supplier Goodrich proved rewarding when the company received a takeover bid from United Technologies in September 2011. I sold Goodrich to nail down profits. Coffee roaster and retailer Starbucks also contributed.
The views expressed above reflect those of the portfolio manager(s) only through the end of the period as stated on the cover of this report and do not necessarily represent the views of Fidelity or any other person in the Fidelity organization. Any such views are subject to change at any time based upon market or other conditions and Fidelity disclaims any responsibility to update such views. These views may not be relied on as investment advice and, because investment decisions for a Fidelity fund are based on numerous factors, may not be relied on as an indication of trading intent on behalf of any Fidelity fund.
Annual Report
Shareholder Expense Example
As a shareholder of the Fund, you incur two types of costs: (1) transaction costs, and (2) ongoing costs, including management fees and other Fund expenses. This Example is intended to help you understand your ongoing costs (in dollars) of investing in the Fund and to compare these costs with the ongoing costs of investing in other mutual funds.
The Example is based on an investment of $1,000 invested at the beginning of the period and held for the entire period (January 1, 2012 to June 30, 2012).
Actual Expenses
The first line of the accompanying table for each class of the Fund provides information about actual account values and actual expenses. You may use the information in this line, together with the amount you invested, to estimate the expenses that you paid over the period. Simply divide your account value by $1,000.00 (for example, an $8,600 account value divided by $1,000.00 = 8.6), then multiply the result by the number in the first line for a class of the Fund under the heading entitled "Expenses Paid During Period" to estimate the expenses you paid on your account during this period. A small balance maintenance fee of $12.00 that is charged once a year may apply for certain accounts with a value of less than $2,000. This fee is not included in the table below. If it was, the estimate of expenses you paid during the period would be higher, and your ending account value lower, by this amount. In addition, the Fund, as a shareholder in the underlying Fidelity Central Funds, will indirectly bear its pro-rata share of the fees and expenses incurred by the underlying Fidelity Central Funds. These fees and expenses are not included in the Fund's annualized expense ratio used to calculate the expense estimate in the table below.
Hypothetical Example for Comparison Purposes
The second line of the accompanying table for each class of the Fund provides information about hypothetical account values and hypothetical expenses based on a Class' actual expense ratio and an assumed rate of return of 5% per year before expenses, which is not the Class' actual return. The hypothetical account values and expenses may not be used to estimate the actual ending account balance or expenses you paid for the period. You may use this information to compare the ongoing costs of investing in the Fund and other funds. To do so, compare this 5% hypothetical example with the 5% hypothetical examples that appear in the shareholder reports of the other funds. A small balance maintenance fee of $12.00 that is charged once a year may apply for certain accounts with a value of less than $2,000. This fee is not included in the table below. If it was, the estimate of expenses you paid during the period would be higher, and your ending account value lower, by this amount. In addition, the Fund, as a shareholder in the underlying Fidelity Central Funds, will indirectly bear its pro-rata share of the fees and expenses incurred by the underlying Fidelity Central Funds. These fees and expenses are not included in the Fund's annualized expense ratio used to calculate the expense estimate in the table below.
Please note that the expenses shown in the table are meant to highlight your ongoing costs only and do not reflect any transaction costs. Therefore, the second line of the table is useful in comparing ongoing costs only, and will not help you determine the relative total costs of owning different funds.
Annual Report
Shareholder Expense Example - continued
| Annualized
Expense Ratio | Beginning
Account Value
January 1, 2012 | Ending
Account Value
June 30, 2012 | Expenses Paid
During Period*
January 1, 2012
to June 30, 2012 |
Fidelity Fund | .58% | | | |
Actual | | $ 1,000.00 | $ 1,107.90 | $ 3.04 |
HypotheticalA | | $ 1,000.00 | $ 1,021.98 | $ 2.92 |
Class K | .43% | | | |
Actual | | $ 1,000.00 | $ 1,108.50 | $ 2.25 |
HypotheticalA | | $ 1,000.00 | $ 1,022.73 | $ 2.16 |
A 5% return per year before expenses
* Expenses are equal to each Class' annualized expense ratio, multiplied by the average account value over the period, multiplied by 182/366 (to reflect the one-half year period).
Annual Report
Investment Changes (Unaudited)
Top Ten Stocks as of June 30, 2012 |
| % of fund's
net assets | % of fund's net assets
6 months ago |
Apple, Inc. | 6.8 | 6.0 |
Wells Fargo & Co. | 2.8 | 1.9 |
Chevron Corp. | 2.6 | 3.1 |
IBM Corp. | 2.1 | 1.1 |
The Coca-Cola Co. | 2.1 | 2.1 |
Union Pacific Corp. | 2.0 | 2.0 |
Microsoft Corp. | 1.9 | 0.0 |
Pfizer, Inc. | 1.8 | 1.0 |
Amgen, Inc. | 1.8 | 1.6 |
Philip Morris International, Inc. | 1.7 | 2.0 |
| 25.6 | |
Top Five Market Sectors as of June 30, 2012 |
| % of fund's
net assets | % of fund's net assets
6 months ago |
Information Technology | 20.3 | 21.8 |
Health Care | 14.9 | 12.4 |
Consumer Staples | 13.0 | 14.7 |
Financials | 12.4 | 10.9 |
Consumer Discretionary | 10.8 | 10.0 |
Asset Allocation (% of fund's net assets) |
As of June 30, 2012 * | As of December 31, 2011 ** |
 | Stocks 95.8% | | | Stocks 99.3% | |
 | Convertible
Securities 0.1% | |  | Convertible
Securities 0.0% | |
 | Short-Term
Investments and
Net Other Assets
(Liabilities) 4.1% | | | Short-Term
Investments and
Net Other Assets
(Liabilities) 0.7% | |
* Foreign investments | 9.2% | | ** Foreign investments | 15.0% | |

Annual Report
Investments June 30, 2012
Showing Percentage of Net Assets
Common Stocks - 95.8% |
| Shares | | Value (000s) |
CONSUMER DISCRETIONARY - 10.8% |
Automobiles - 0.1% |
Harley-Davidson, Inc. | 110,100 | | $ 5,035 |
Hotels, Restaurants & Leisure - 2.1% |
Las Vegas Sands Corp. | 245,600 | | 10,681 |
McDonald's Corp. | 352,300 | | 31,189 |
Starbucks Corp. | 797,498 | | 42,523 |
Yum! Brands, Inc. | 396,700 | | 25,555 |
| | 109,948 |
Household Durables - 1.3% |
D.R. Horton, Inc. | 2,171,000 | | 39,903 |
Ryland Group, Inc. | 1,003,600 | | 25,672 |
| | 65,575 |
Internet & Catalog Retail - 0.8% |
Amazon.com, Inc. (a) | 190,300 | | 43,455 |
Media - 2.2% |
Comcast Corp. Class A | 1,882,200 | | 60,174 |
The Walt Disney Co. | 1,077,400 | | 52,254 |
| | 112,428 |
Multiline Retail - 0.3% |
Dollar General Corp. (a) | 290,800 | | 15,817 |
Specialty Retail - 3.0% |
Bed Bath & Beyond, Inc. (a) | 163,900 | | 10,129 |
Home Depot, Inc. | 868,900 | | 46,043 |
Lowe's Companies, Inc. | 2,044,200 | | 58,137 |
TJX Companies, Inc. | 1,018,900 | | 43,741 |
| | 158,050 |
Textiles, Apparel & Luxury Goods - 1.0% |
Ralph Lauren Corp. | 291,473 | | 40,824 |
VF Corp. | 76,700 | | 10,236 |
| | 51,060 |
TOTAL CONSUMER DISCRETIONARY | | 561,368 |
CONSUMER STAPLES - 13.0% |
Beverages - 2.9% |
Beam, Inc. | 169,300 | | 10,580 |
Dr Pepper Snapple Group, Inc. | 237,300 | | 10,382 |
Grupo Modelo SAB de CV Series C | 2,373,700 | | 20,990 |
The Coca-Cola Co. | 1,413,100 | | 110,490 |
| | 152,442 |
Common Stocks - continued |
| Shares | | Value (000s) |
CONSUMER STAPLES - continued |
Food & Staples Retailing - 2.8% |
CVS Caremark Corp. | 1,356,400 | | $ 63,385 |
Drogasil SA | 1,317,678 | | 13,285 |
Wal-Mart Stores, Inc. | 954,700 | | 66,562 |
| | 143,232 |
Food Products - 1.2% |
Kraft Foods, Inc. Class A | 1,028,100 | | 39,705 |
Mead Johnson Nutrition Co. Class A | 282,500 | | 22,744 |
| | 62,449 |
Household Products - 0.9% |
Colgate-Palmolive Co. | 207,200 | | 21,570 |
Kimberly-Clark Corp. | 323,800 | | 27,125 |
| | 48,695 |
Personal Products - 0.3% |
Herbalife Ltd. | 340,001 | | 16,432 |
Tobacco - 4.9% |
British American Tobacco PLC (United Kingdom) | 608,100 | | 30,916 |
Imperial Tobacco Group PLC | 555,264 | | 21,349 |
Japan Tobacco, Inc. | 1,858,000 | | 55,044 |
Lorillard, Inc. | 417,800 | | 55,129 |
Philip Morris International, Inc. | 1,023,300 | | 89,293 |
| | 251,731 |
TOTAL CONSUMER STAPLES | | 674,981 |
ENERGY - 8.0% |
Energy Equipment & Services - 0.4% |
Ocean Rig UDW, Inc. (United States) | 770,510 | | 10,410 |
Seadrill Ltd. | 301,400 | | 10,706 |
| | 21,116 |
Oil, Gas & Consumable Fuels - 7.6% |
Anadarko Petroleum Corp. | 233,800 | | 15,478 |
Cheniere Energy, Inc. (a) | 782,800 | | 11,538 |
Chevron Corp. | 1,253,700 | | 132,265 |
EV Energy Partners LP | 259,500 | | 13,094 |
Exxon Mobil Corp. | 871,400 | | 74,566 |
Golar LNG Ltd. (NASDAQ) | 284,300 | | 10,718 |
HollyFrontier Corp. | 165,200 | | 5,853 |
InterOil Corp. (a)(d) | 173,900 | | 12,121 |
Marathon Oil Corp. | 450,900 | | 11,530 |
Common Stocks - continued |
| Shares | | Value (000s) |
ENERGY - continued |
Oil, Gas & Consumable Fuels - continued |
Marathon Petroleum Corp. | 565,300 | | $ 25,393 |
Occidental Petroleum Corp. | 421,400 | | 36,143 |
Williams Companies, Inc. | 1,022,000 | | 29,454 |
WPX Energy, Inc. | 755,300 | | 12,221 |
| | 390,374 |
TOTAL ENERGY | | 411,490 |
FINANCIALS - 12.4% |
Capital Markets - 0.5% |
Morgan Stanley | 643,300 | | 9,386 |
T. Rowe Price Group, Inc. | 280,200 | | 17,641 |
| | 27,027 |
Commercial Banks - 5.5% |
M&T Bank Corp. | 171,200 | | 14,136 |
SunTrust Banks, Inc. | 925,400 | | 22,422 |
U.S. Bancorp | 2,611,000 | | 83,970 |
Wells Fargo & Co. | 4,344,567 | | 145,282 |
Zions Bancorporation | 1,028,751 | | 19,978 |
| | 285,788 |
Consumer Finance - 1.5% |
American Express Co. | 567,092 | | 33,010 |
Discover Financial Services | 1,263,400 | | 43,688 |
| | 76,698 |
Diversified Financial Services - 1.8% |
Citigroup, Inc. | 1,240,410 | | 34,000 |
JPMorgan Chase & Co. | 1,611,000 | | 57,561 |
| | 91,561 |
Insurance - 1.1% |
Berkshire Hathaway, Inc. Class B (a) | 418,600 | | 34,882 |
The Chubb Corp. | 298,900 | | 21,766 |
| | 56,648 |
Real Estate Investment Trusts - 2.0% |
American Tower Corp. | 450,400 | | 31,487 |
AvalonBay Communities, Inc. | 190,600 | | 26,966 |
Public Storage | 90,200 | | 13,026 |
Common Stocks - continued |
| Shares | | Value (000s) |
FINANCIALS - continued |
Real Estate Investment Trusts - continued |
Simon Property Group, Inc. | 167,900 | | $ 26,135 |
Weyerhaeuser Co. | 341,800 | | 7,643 |
| | 105,257 |
TOTAL FINANCIALS | | 642,979 |
HEALTH CARE - 14.9% |
Biotechnology - 4.9% |
Acorda Therapeutics, Inc. (a) | 551,237 | | 12,987 |
Alexion Pharmaceuticals, Inc. (a) | 116,600 | | 11,578 |
Amgen, Inc. | 1,277,900 | | 93,338 |
Biogen Idec, Inc. (a) | 389,600 | | 56,250 |
BioMarin Pharmaceutical, Inc. (a) | 356,400 | | 14,106 |
Gilead Sciences, Inc. (a) | 396,400 | | 20,327 |
Theravance, Inc. (a) | 602,900 | | 13,396 |
Vertex Pharmaceuticals, Inc. (a) | 588,500 | | 32,909 |
| | 254,891 |
Health Care Equipment & Supplies - 0.4% |
Covidien PLC | 366,900 | | 19,629 |
Health Care Providers & Services - 2.2% |
Henry Schein, Inc. (a) | 351,300 | | 27,574 |
McKesson Corp. | 433,300 | | 40,622 |
UnitedHealth Group, Inc. | 783,300 | | 45,823 |
| | 114,019 |
Pharmaceuticals - 7.4% |
Allergan, Inc. | 426,900 | | 39,518 |
AVANIR Pharmaceuticals Class A (a)(d) | 1,337,500 | | 5,243 |
Elan Corp. PLC sponsored ADR (a) | 1,598,296 | | 23,319 |
Eli Lilly & Co. | 578,000 | | 24,802 |
GlaxoSmithKline PLC sponsored ADR | 569,400 | | 25,948 |
Johnson & Johnson | 1,160,400 | | 78,397 |
Merck & Co., Inc. | 1,511,300 | | 63,097 |
Perrigo Co. | 222,300 | | 26,216 |
Pfizer, Inc. | 4,121,500 | | 94,795 |
| | 381,335 |
TOTAL HEALTH CARE | | 769,874 |
Common Stocks - continued |
| Shares | | Value (000s) |
INDUSTRIALS - 7.3% |
Aerospace & Defense - 2.7% |
Precision Castparts Corp. | 301,900 | | $ 49,660 |
Textron, Inc. | 1,156,000 | | 28,750 |
United Technologies Corp. | 803,700 | | 60,703 |
| | 139,113 |
Building Products - 0.9% |
Armstrong World Industries, Inc. | 948,400 | | 46,623 |
Owens Corning (a) | 45,000 | | 1,284 |
| | 47,907 |
Construction & Engineering - 0.1% |
Foster Wheeler AG (a) | 228,400 | | 3,958 |
Industrial Conglomerates - 1.4% |
Danaher Corp. | 1,054,600 | | 54,924 |
Tyco International Ltd. | 288,700 | | 15,258 |
| | 70,182 |
Machinery - 0.1% |
Cummins, Inc. | 81,100 | | 7,859 |
Marine - 0.1% |
DryShips, Inc. (a)(d) | 3,601,800 | | 7,888 |
Road & Rail - 2.0% |
Union Pacific Corp. | 857,400 | | 102,296 |
TOTAL INDUSTRIALS | | 379,203 |
INFORMATION TECHNOLOGY - 20.3% |
Communications Equipment - 2.2% |
Motorola Solutions, Inc. | 1,374,000 | | 66,103 |
QUALCOMM, Inc. | 898,300 | | 50,017 |
| | 116,120 |
Computers & Peripherals - 6.8% |
Apple, Inc. (a) | 602,700 | | 351,978 |
Electronic Equipment & Components - 1.0% |
Amphenol Corp. Class A | 971,638 | | 53,362 |
Internet Software & Services - 2.3% |
eBay, Inc. (a) | 813,900 | | 34,192 |
Facebook, Inc. Class B (a)(e) | 260,071 | | 7,284 |
Google, Inc. Class A (a) | 125,100 | | 72,567 |
LinkedIn Corp. (a) | 24,200 | | 2,572 |
| | 116,615 |
Common Stocks - continued |
| Shares | | Value (000s) |
INFORMATION TECHNOLOGY - continued |
IT Services - 2.6% |
Fidelity National Information Services, Inc. | 698,800 | | $ 23,815 |
IBM Corp. | 571,700 | | 111,813 |
| | 135,628 |
Semiconductors & Semiconductor Equipment - 2.3% |
Altera Corp. | 379,800 | | 12,852 |
ASML Holding NV | 907,000 | | 46,638 |
Cymer, Inc. (a) | 18,100 | | 1,067 |
NXP Semiconductors NV (a) | 562,600 | | 13,080 |
ON Semiconductor Corp. (a) | 1,043,000 | | 7,405 |
Samsung Electronics Co. Ltd. | 15,718 | | 16,704 |
Taiwan Semiconductor Manufacturing Co. Ltd. sponsored ADR | 1,597,300 | | 22,298 |
| | 120,044 |
Software - 3.1% |
Check Point Software Technologies Ltd. (a) | 458,000 | | 22,712 |
Citrix Systems, Inc. (a) | 478,900 | | 40,199 |
Microsoft Corp. | 3,142,500 | | 96,129 |
| | 159,040 |
TOTAL INFORMATION TECHNOLOGY | | 1,052,787 |
MATERIALS - 2.4% |
Chemicals - 2.2% |
Eastman Chemical Co. | 535,700 | | 26,983 |
Monsanto Co. | 483,300 | | 40,008 |
Sherwin-Williams Co. | 120,600 | | 15,961 |
W.R. Grace & Co. (a) | 577,200 | | 29,120 |
| | 112,072 |
Metals & Mining - 0.2% |
Goldcorp, Inc. | 325,800 | | 12,266 |
TOTAL MATERIALS | | 124,338 |
TELECOMMUNICATION SERVICES - 2.9% |
Diversified Telecommunication Services - 2.3% |
CenturyLink, Inc. | 533,900 | | 21,084 |
Iliad SA | 120,165 | | 17,374 |
Verizon Communications, Inc. | 1,801,100 | | 80,041 |
| | 118,499 |
Common Stocks - continued |
| Shares | | Value (000s) |
TELECOMMUNICATION SERVICES - continued |
Wireless Telecommunication Services - 0.6% |
Vodafone Group PLC sponsored ADR | 1,126,300 | | $ 31,739 |
TOTAL TELECOMMUNICATION SERVICES | | 150,238 |
UTILITIES - 3.8% |
Electric Utilities - 2.6% |
Duke Energy Corp. | 783,400 | | 18,065 |
Edison International | 529,400 | | 24,458 |
FirstEnergy Corp. | 340,900 | | 16,769 |
NextEra Energy, Inc. | 658,100 | | 45,284 |
PPL Corp. | 397,000 | | 11,041 |
Southern Co. | 366,400 | | 16,964 |
| | 132,581 |
Gas Utilities - 0.7% |
ONEOK, Inc. | 849,200 | | 35,930 |
Multi-Utilities - 0.5% |
Sempra Energy | 393,200 | | 27,084 |
TOTAL UTILITIES | | 195,595 |
TOTAL COMMON STOCKS (Cost $4,320,823) |
4,962,853
|
Convertible Preferred Stocks - 0.1% |
| | | |
INDUSTRIALS - 0.1% |
Aerospace & Defense - 0.1% |
United Technologies Corp. 7.50% (Cost $5,280) | 105,600 | | 5,564 |
Money Market Funds - 4.6% |
| Shares | | Value (000s) |
Fidelity Cash Central Fund, 0.17% (b) | 224,357,552 | | $ 224,358 |
Fidelity Securities Lending Cash Central Fund, 0.18% (b)(c) | 12,150,750 | | 12,151 |
TOTAL MONEY MARKET FUNDS (Cost $236,509) |
236,509
|
TOTAL INVESTMENT PORTFOLIO - 100.5% (Cost $4,562,612) | | 5,204,926 |
NET OTHER ASSETS (LIABILITIES) - (0.5)% | | (26,435) |
NET ASSETS - 100% | $ 5,178,491 |
Legend |
(a) Non-income producing |
(b) Affiliated fund that is available only to investment companies and other accounts managed by Fidelity Investments. The rate quoted is the annualized seven-day yield of the fund at period end. A complete unaudited listing of the fund's holdings as of its most recent quarter end is available upon request. In addition, each Fidelity Central Fund's financial statements, which are not covered by the Fund's Report of Independent Registered Public Accounting Firm, are available on the SEC's website or upon request. |
(c) Investment made with cash collateral received from securities on loan. |
(d) Security or a portion of the security is on loan at period end. |
(e) Restricted securities - Investment in securities not registered under the Securities Act of 1933 (excluding 144A issues). At the end of the period, the value of restricted securities (excluding 144A issues) amounted to $7,284,000 or 0.1% of net assets. |
Additional information on each restricted holding is as follows: |
Security | Acquisition
Date | Acquisition
Cost (000s) |
Facebook, Inc. Class B | 3/31/11 - 5/19/11 | $ 6,504 |
Affiliated Central Funds |
Information regarding fiscal year to date income earned by the Fund from investments in Fidelity Central Funds is as follows: |
Fund | Income earned
(Amounts in thousands) |
Fidelity Cash Central Fund | $ 210 |
Fidelity Securities Lending Cash Central Fund | 489 |
Total | $ 699 |
Other Information |
The following is a summary of the inputs used, as of June 30, 2012, involving the Fund's assets and liabilities carried at fair value. The inputs or methodology used for valuing securities may not be an indication of the risk associated with investing in those securities. For more information on valuation inputs, and their aggregation into the levels used in the tables below, please refer to the Security Valuation section in the accompanying Notes to Financial Statements. |
Valuation Inputs at Reporting Date: |
Description
(Amounts in thousands) | Total | Level 1 | Level 2 | Level 3 |
Investments in Securities: | | | | |
Equities: | | | | |
Consumer Discretionary | $ 561,368 | $ 561,368 | $ - | $ - |
Consumer Staples | 674,981 | 589,021 | 85,960 | - |
Energy | 411,490 | 411,490 | - | - |
Financials | 642,979 | 642,979 | - | - |
Health Care | 769,874 | 769,874 | - | - |
Industrials | 384,767 | 384,767 | - | - |
Information Technology | 1,052,787 | 1,028,799 | 23,988 | - |
Materials | 124,338 | 124,338 | - | - |
Telecommunication Services | 150,238 | 150,238 | - | - |
Utilities | 195,595 | 195,595 | - | - |
Money Market Funds | 236,509 | 236,509 | - | - |
Total Investments in Securities: | $ 5,204,926 | $ 5,094,978 | $ 109,948 | $ - |
See accompanying notes which are an integral part of the financial statements.
Annual Report
Statement of Assets and Liabilities
Amounts in thousands (except per-share amounts) | June 30, 2012 |
| | |
Assets | | |
Investment in securities, at value (including securities loaned of $12,014) - See accompanying schedule: Unaffiliated issuers (cost $4,326,103) | $ 4,968,417 | |
Fidelity Central Funds (cost $236,509) | 236,509 | |
Total Investments (cost $4,562,612) | | $ 5,204,926 |
Cash | | 1 |
Receivable for investments sold | | 42,985 |
Receivable for fund shares sold | | 2,153 |
Dividends receivable | | 7,868 |
Distributions receivable from Fidelity Central Funds | | 109 |
Other receivables | | 252 |
Total assets | | 5,258,294 |
| | |
Liabilities | | |
Payable for investments purchased | $ 49,326 | |
Payable for fund shares redeemed | 15,769 | |
Accrued management fee | 1,462 | |
Other affiliated payables | 847 | |
Other payables and accrued expenses | 248 | |
Collateral on securities loaned, at value | 12,151 | |
Total liabilities | | 79,803 |
| | |
Net Assets | | $ 5,178,491 |
Net Assets consist of: | | |
Paid in capital | | $ 4,755,464 |
Undistributed net investment income | | 31,540 |
Accumulated undistributed net realized gain (loss) on investments and foreign currency transactions | | (250,833) |
Net unrealized appreciation (depreciation) on investments and assets and liabilities in foreign currencies | | 642,320 |
Net Assets | | $ 5,178,491 |
See accompanying notes which are an integral part of the financial statements.
Annual Report
Statement of Assets and Liabilities - continued
Amounts in thousands (except per-share amounts) | June 30, 2012 |
| | |
Fidelity Fund:
Net Asset Value, offering price and redemption price per share ($4,364,272 ÷ 126,463 shares) | | $ 34.51 |
| | |
Class K:
Net Asset Value, offering price and redemption price per share ($814,219 ÷ 23,586 shares) | | $ 34.52 |
See accompanying notes which are an integral part of the financial statements.
Annual Report
Financial Statements - continued
Statement of Operations
Amounts in thousands | Year ended June 30, 2012 |
| | |
Investment Income | | |
Dividends | | $ 87,443 |
Income from Fidelity Central Funds | | 699 |
Total income | | 88,142 |
| | |
Expenses | | |
Management fee | $ 17,974 | |
Transfer agent fees | 9,464 | |
Accounting and security lending fees | 1,092 | |
Custodian fees and expenses | 148 | |
Independent trustees' compensation | 34 | |
Registration fees | 80 | |
Audit | 78 | |
Legal | 38 | |
Miscellaneous | 56 | |
Total expenses before reductions | 28,964 | |
Expense reductions | (385) | 28,579 |
Net investment income (loss) | | 59,563 |
Realized and Unrealized Gain (Loss) Net realized gain (loss) on: | | |
Investment securities: | | |
Unaffiliated issuers | 143,221 | |
Foreign currency transactions | (469) | |
Total net realized gain (loss) | | 142,752 |
Change in net unrealized appreciation (depreciation) on: Investment securities | (169,721) | |
Assets and liabilities in foreign currencies | (75) | |
Total change in net unrealized appreciation (depreciation) | | (169,796) |
Net gain (loss) | | (27,044) |
Net increase (decrease) in net assets resulting from operations | | $ 32,519 |
See accompanying notes which are an integral part of the financial statements.
Annual Report
Statement of Changes in Net Assets
Amounts in thousands | Year ended
June 30,
2012 | Year ended
June 30,
2011 |
Increase (Decrease) in Net Assets | | |
Operations | | |
Net investment income (loss) | $ 59,563 | $ 48,655 |
Net realized gain (loss) | 142,752 | 481,210 |
Change in net unrealized appreciation (depreciation) | (169,796) | 1,002,664 |
Net increase (decrease) in net assets resulting
from operations | 32,519 | 1,532,529 |
Distributions to shareholders from net investment income | (36,948) | (48,886) |
Share transactions - net increase (decrease) | (552,271) | (586,286) |
Total increase (decrease) in net assets | (556,700) | 897,357 |
| | |
Net Assets | | |
Beginning of period | 5,735,191 | 4,837,834 |
End of period (including undistributed net investment income of $31,540 and undistributed net investment income of $10,601, respectively) | $ 5,178,491 | $ 5,735,191 |
See accompanying notes which are an integral part of the financial statements.
Annual Report
Financial Highlights - Fidelity Fund
Years ended June 30, | 2012 | 2011 | 2010 | 2009 | 2008 |
Selected Per-Share Data | | | | |
Net asset value, beginning of period | $ 34.35 | $ 26.08 | $ 23.95 | $ 35.69 | $ 38.98 |
Income from Investment Operations | | | | | |
Net investment income (loss) B | .37 | .27 E | .23 | .44 | .37 |
Net realized and unrealized gain (loss) | .02 F | 8.27 | 2.25 | (10.77) | (1.65) |
Total from investment operations | .39 | 8.54 | 2.48 | (10.33) | (1.28) |
Distributions from net investment income | (.23) | (.27) | (.35) | (.42) | (.38) |
Distributions from net realized gain | - | - | - | (.99) | (1.63) |
Total distributions | (.23) | (.27) | (.35) | (1.41) | (2.01) |
Net asset value, end of period | $ 34.51 | $ 34.35 | $ 26.08 | $ 23.95 | $ 35.69 |
Total Return A | 1.21% | 32.89% | 10.40% | (29.74)% | (3.73)% |
Ratios to Average Net Assets C, G | | | | |
Expenses before reductions | .58% | .59% | .61% | .64% | .56% |
Expenses net of fee waivers, if any | .58% | .59% | .61% | .64% | .56% |
Expenses net of all reductions | .58% | .58% | .60% | .64% | .55% |
Net investment income (loss) | 1.13% | .86% E | .82% | 1.73% | .98% |
Supplemental Data | | | | |
Net assets, end of period (in millions) | $ 4,364 | $ 5,072 | $ 4,412 | $ 4,442 | $ 7,174 |
Portfolio turnover rate D | 102% | 88% | 77% | 91% | 80% |
A Total returns would have been lower if certain expenses had not been reduced during the applicable periods shown.
B Calculated based on average shares outstanding during the period.
C Fees and expenses of any underlying Fidelity Central Funds are not included in the Fund's expense ratio. The Fund indirectly bears its proportionate share of the expenses of any underlying Fidelity Central Funds.
D Amount does not include the portfolio activity of any underlying Fidelity Central Funds.
E Investment income per share reflects a large, non-recurring dividend which amounted to $.08 per share. Excluding this non-recurring dividend, the ratio of net investment income (loss) to average net assets would have been .60%.
F The amount shown for a share outstanding does not correspond with the aggregate net gain (loss) on investments for the period due to the timing of sales and repurchases of shares in relation to fluctuating market values of the investments of the Fund.
G Expense ratios reflect operating expenses of the class. Expenses before reductions do not reflect amounts reimbursed by the investment adviser or reductions from brokerage service arrangements or reductions from other expense offset arrangements and do not represent the amount paid by the class during periods when reimbursements or reductions occur. Expenses net of fee waivers reflect expenses after reimbursement by the investment adviser but prior to reductions from brokerage service arrangements or other expense offset arrangements. Expenses net of all reductions represent the net expenses paid by the class.
See accompanying notes which are an integral part of the financial statements.
Annual Report
Financial Highlights - Class K
Years ended June 30, | 2012 | 2011 | 2010 | 2009 | 2008 I |
Selected Per-Share Data | | | | |
Net asset value, beginning of period | $ 34.35 | $ 26.08 | $ 23.96 | $ 35.70 | $ 37.54 |
Income from Investment Operations | | | | | |
Net investment income (loss) D | .42 | .32 G | .28 | .42 | .05 |
Net realized and unrealized gain (loss) | .02 H | 8.27 | 2.24 | (10.70) | (1.89) |
Total from investment operations | .44 | 8.59 | 2.52 | (10.28) | (1.84) |
Distributions from net investment income | (.27) | (.32) | (.40) | (.47) | - |
Distributions from net realized gain | - | - | - | (.99) | - |
Total distributions | (.27) | (.32) | (.40) | (1.46) | - |
Net asset value, end of period | $ 34.52 | $ 34.35 | $ 26.08 | $ 23.96 | $ 35.70 |
Total Return B, C | 1.37% | 33.10% | 10.54% | (29.59)% | (4.90)% |
Ratios to Average Net Assets E, J | | | | |
Expenses before reductions | .43% | .43% | .44% | .45% | .43% A |
Expenses net of fee waivers, if any | .43% | .43% | .44% | .45% | .43% A |
Expenses net of all reductions | .42% | .42% | .43% | .45% | .43% A |
Net investment income (loss) | 1.29% | 1.02% G | .99% | 1.92% | 1.00% A |
Supplemental Data | | | | |
Net assets, end of period (000 omitted) | $ 814,219 | $ 662,929 | $ 425,831 | $ 274,168 | $ 95 |
Portfolio turnover rate F | 102% | 88% | 77% | 91% | 80% |
A Annualized
B Total returns for periods of less than one year are not annualized.
C Total returns would have been lower if certain expenses had not been reduced during the applicable periods shown.
D Calculated based on average shares outstanding during the period.
E Fees and expenses of any underlying Fidelity Central Funds are not included in the Fund's expense ratio. The Fund indirectly bears its proportionate share of the expenses of any underlying Fidelity Central Funds.
F Amount does not include the portfolio activity of any underlying Fidelity Central Funds.
G Investment income per share reflects a large, non-recurring dividend which amounted to $.08 per share. Excluding this non-recurring dividend, the ratio of net investment income (loss) to average net assets would have been .76%.
H The amount shown for a share outstanding does not correspond with the aggregate net gain (loss) on investments for the period due to the timing of sales and repurchases of shares in relation to fluctuating market values of the investments of the Fund.
I For the period May 9, 2008 (commencement of sale of shares) to June 30, 2008.
J Expense ratios reflect operating expenses of the class. Expenses before reductions do not reflect amounts reimbursed by the investment adviser or reductions from brokerage service arrangements or reductions from other expense offset arrangements and do not represent the amount paid by the class during periods when reimbursements or reductions occur. Expense ratios before reductions for start-up periods may not be representative of longer-term operating periods. Expenses net of fee waivers reflect expenses after reimbursement by the investment adviser but prior to reductions from brokerage service arrangements or other expense offset arrangements. Expenses net of all reductions represent the net expenses paid by the class.
See accompanying notes which are an integral part of the financial statements.
Annual Report
Notes to Financial Statements
For the period ended June 30, 2012
(Amounts in thousands except percentages)
1. Organization.
Fidelity Fund (the Fund) is a fund of Fidelity Hastings Street Trust (the Trust) and is authorized to issue an unlimited number of shares. The Trust is registered under the Investment Company Act of 1940, as amended (the 1940 Act), as an open-end management investment company organized as a Massachusetts business trust. The Fund offers Fidelity Fund and Class K shares, each of which has equal rights as to assets and voting privileges. Each class has exclusive voting rights with respect to matters that affect that class. Investment income, realized and unrealized capital gains and losses, the common expenses of the Fund, and certain fund-level expense reductions, if any, are allocated on a pro-rata basis to each class based on the relative net assets of each class to the total net assets of the Fund. Each class differs with respect to transfer agent fees incurred. Certain expense reductions may also differ by class.
2. Investments in Fidelity Central Funds.
The Fund invests in Fidelity Central Funds, which are open-end investment companies available only to other investment companies and accounts managed by Fidelity Management & Research Company (FMR) and its affiliates. The Fund's Schedule of Investments lists each of the Fidelity Central Funds held as of period end, if any, as an investment of the Fund, but does not include the underlying holdings of each Fidelity Central Fund. As an Investing Fund, the Fund indirectly bears its proportionate share of the expenses of the underlying Fidelity Central Funds.
The Money Market Central Funds seek preservation of capital and current income and are managed by Fidelity Investments Money Management, Inc. (FIMM), an affiliate of FMR.
A complete unaudited list of holdings for each Fidelity Central Fund is available upon request or at the Securities and Exchange Commission (the SEC) web site at www.sec.gov. In addition, the financial statements of the Fidelity Central Funds, which are not covered by the Fund's Report of Independent Registered Public Accounting Firm, are available on the SEC web site or upon request.
3. Significant Accounting Policies.
The financial statements have been prepared in conformity with accounting principles generally accepted in the United States of America (GAAP), which require management to make certain estimates and assumptions at the date of the financial statements. Actual results could differ from those estimates. Subsequent events, if any, through the date that the financial statements were issued have been evaluated in the preparation of the financial statements. The following summarizes the significant accounting policies of the Fund:
Annual Report
Notes to Financial Statements - continued
(Amounts in thousands except percentages)
3. Significant Accounting Policies - continued
Security Valuation. Investments are valued as of 4:00 p.m. Eastern time on the last calendar day of the period. In accordance with valuation policies and procedures approved by the Board of Trustees (the Board), the Fund attempts to obtain prices from one or more third party pricing vendor or broker to value its investments. When current market prices, quotations or rates are not readily available or reliable, securities will be fair valued in good faith by the FMR Fair Value Committee (the Committee), in accordance with procedures adopted by the Fund's Board. Factors used in determining fair value vary by security type and may include market or security specific events. The frequency with which these procedures are used cannot be predicted and they may be utilized to a significant extent. The Committee oversees the Fund's valuation policies and procedures and is responsible for approving and reporting to the Board all fair value determinations.
The Fund categorizes the inputs to valuation techniques used to value its investments into a disclosure hierarchy consisting of three levels as shown below:
Level 1 - quoted prices in active markets for identical investments
Level 2 - other significant observable inputs (including quoted prices for similar investments, interest rates, prepayment speeds, etc.)
Level 3 - unobservable inputs (including the Fund's own assumptions based on the best information available)
Valuation techniques used to value the Fund's investments by major category are as follows:
Equity securities, including restricted securities, for which market quotations are readily available, are valued at the last reported sale price or official closing price as reported by a third party pricing vendor on the primary market or exchange on which they are traded and are categorized as Level 1 in the hierarchy. In the event there were no sales during the day or closing prices are not available, securities are valued at the last quoted bid price or may be valued using the last available price and are generally categorized as Level 2 in the hierarchy. For foreign equity securities, when significant market or security specific events arise, comparisons to the valuation of American Depositary Receipts (ADRs), futures contracts, Exchange-Traded Funds (ETFs) and certain indexes as well as quoted prices for similar securities are used and are categorized as Level 2 in the hierarchy. Utilizing these techniques may result in transfers between Level 1 and Level 2. For restricted equity securities and private placements where observable inputs are limited, assumptions about market activity and risk are used and these securities are categorized as Level 3 in the hierarchy.
Annual Report
3. Significant Accounting Policies - continued
Security Valuation - continued
Investments in open-end mutual funds, including the Fidelity Central Funds, are valued at their closing net asset value each business day and are categorized as Level 1 in the hierarchy.
Changes in valuation techniques may result in transfers in or out of an assigned level within the disclosure hierarchy. The aggregate value of investments by input level, as of June 30, 2012, is included at the end of the Fund's Schedule of Investments.
Foreign Currency Translation. The Fund may use foreign currency contracts to facilitate transactions in foreign-denominated securities. Gains and losses from these transactions may arise from changes in the value of the foreign currency or if the counterparties do not perform under the contracts' terms.
Foreign-denominated assets, including investment securities, and liabilities are translated into U.S. dollars at the exchange rates at period end. Purchases and sales of investment securities, income and dividends received and expenses denominated in foreign currencies are translated into U.S. dollars at the exchange rate in effect on the transaction date.
The effects of exchange rate fluctuations on investments are included with the net realized and unrealized gain (loss) on investment securities. Other foreign currency transactions resulting in realized and unrealized gain (loss) are disclosed separately.
Investment Transactions and Income. For financial reporting purposes, the Fund's investment holdings and NAV include trades executed through the end of the last business day of the period. The NAV per share for processing shareholder transactions is calculated as of the close of business of the New York Stock Exchange (NYSE), normally 4:00 p.m. Eastern time and includes trades executed through the end of the prior business day. Gains and losses on securities sold are determined on the basis of identified cost and may include proceeds received from litigation. Dividend income is recorded on the ex-dividend date, except for certain dividends from foreign securities where the ex-dividend date may have passed, which are recorded as soon as the Fund is informed of the ex-dividend date. Non-cash dividends included in dividend income, if any, are recorded at the fair market value of the securities received. Distributions received on securities that represent a return of capital or capital gain are recorded as a reduction of cost of investments and/or as a realized gain. The Fund estimates the components of distributions received that may be considered return of capital distributions or capital gain distributions. Interest income and distributions from the Fidelity Central Funds are accrued as earned. Interest income includes coupon interest and amortization of
Annual Report
Notes to Financial Statements - continued
(Amounts in thousands except percentages)
3. Significant Accounting Policies - continued
Investment Transactions and Income - continued
premium and accretion of discount on debt securities. Investment income is recorded net of foreign taxes withheld where recovery of such taxes is uncertain.
Expenses. Expenses directly attributable to a fund are charged to that fund. Expenses attributable to more than one fund are allocated among the respective funds on the basis of relative net assets or other appropriate methods. Expense estimates are accrued in the period to which they relate and adjustments are made when actual amounts are known.
Deferred Trustee Compensation. Under a Deferred Compensation Plan (the Plan), independent Trustees may elect to defer receipt of a portion of their annual compensation. Deferred amounts are invested in a cross-section of Fidelity funds, are marked-to-market and remain in the Fund until distributed in accordance with the Plan. The investment of deferred amounts and the offsetting payable to the Trustees are included in the accompanying Statement of Assets and Liabilities.
Income Tax Information and Distributions to Shareholders. Each year, the Fund intends to qualify as a regulated investment company under Subchapter M of the Internal Revenue Code, including distributing substantially all of its taxable income and realized gains. As a result, no provision for income taxes is required. As of June 30, 2012, the Fund did not have any unrecognized tax benefits in the financial statements; nor is the Fund aware of any tax positions for which it is reasonably possible that the total amounts of unrecognized tax benefits will significantly change in the next twelve months. The Fund files a U.S. federal tax return, in addition to state and local tax returns as required. A fund's federal income tax returns are subject to examination by the Internal Revenue Service (IRS) for a period of three fiscal years after they are filed. State and local tax returns may be subject to examination for an additional fiscal year depending on the jurisdiction. Foreign taxes are provided for based on the Fund's understanding of the tax rules and rates that exist in the foreign markets in which it invests.
Distributions are declared and recorded on the ex-dividend date. Income dividends and capital gain distributions are declared separately for each class. Income and capital gain distributions are determined in accordance with income tax regulations, which may differ from GAAP.
Capital accounts within the financial statements are adjusted for permanent book-tax differences. These adjustments have no impact on net assets or the results of operations. Temporary book-tax differences will reverse in a subsequent period.
Annual Report
3. Significant Accounting Policies - continued
Income Tax Information and Distributions to Shareholders - continued
Book-tax differences are primarily due to equity-debt classifications, foreign currency transactions, deferred trustees compensation, partnerships, capital loss carryforwards, losses deferred due to wash sales and excise tax regulations.
The federal tax cost of investment securities and unrealized appreciation (depreciation) as of period end were as follows:
Gross unrealized appreciation | $ 756,255 |
Gross unrealized depreciation | (133,447) |
Net unrealized appreciation (depreciation) on securities and other investments | $ 622,808 |
| |
Tax Cost | $ 4,582,118 |
The tax-based components of distributable earnings as of period end were as follows:
Undistributed ordinary income | $ 31,722 |
Capital loss carryforward | $ (185,683) |
Net unrealized appreciation (depreciation) | $ 622,814 |
Capital loss carryforwards are only available to offset future capital gains of the Fund to the extent provided by regulations and may be limited. Under the Regulated Investment Company Modernization Act of 2010 (the Act), the Fund is permitted to carry forward capital losses incurred in taxable years beginning after December 22, 2010 for an unlimited period and such capital losses are required to be used prior to any losses that expire. Capital loss carryforwards were as follows:
Fiscal year of expiration | |
2018 | $ (185,683) |
The tax character of distributions paid was as follows:
| June 30, 2012 | June 30, 2011 |
Ordinary Income | $ 36,948 | $ 48,886 |
New Accounting Pronouncement. In December 2011, the Financial Accounting Standards Board issued Accounting Standard Update No. 2011-11, Disclosures about Offsetting Assets and Liabilities. The update creates new disclosure requirements requiring entities to disclose both gross and net information for derivatives and other financial instruments that are either offset in the Statement of Assets and Liabilities or subject to an enforceable master netting arrangement or similar agreement. The
Annual Report
Notes to Financial Statements - continued
(Amounts in thousands except percentages)
3. Significant Accounting Policies - continued
New Accounting Pronouncement - continued
disclosure requirements are effective for interim and annual reporting periods beginning on or after January 1, 2013. Management is currently evaluating the impact of the update's adoption on the Fund's financial statement disclosures.
4. Operating Policies.
Restricted Securities. The Fund may invest in securities that are subject to legal or contractual restrictions on resale. These securities generally may be resold in transactions exempt from registration or to the public if the securities are registered. Disposal of these securities may involve time-consuming negotiations and expense, and prompt sale at an acceptable price may be difficult. Information regarding restricted securities is included at the end of the Fund's Schedule of Investments.
5. Purchases and Sales of Investments.
Purchases and sales of securities, other than short-term securities, aggregated $5,156,968 and $5,761,734, respectively.
6. Fees and Other Transactions with Affiliates.
Management Fee. FMR and its affiliates provide the Fund with investment management related services for which the Fund pays a monthly management fee. The management fee is the sum of an individual fund fee rate that is based on an annual rate of .09% of the Fund's average net assets and an annualized group fee rate that averaged .26% during the period. The group fee rate is based upon the average net assets of all the mutual funds advised by FMR. The group fee rate decreases as assets under management increase and increases as assets under management decrease. For the period, the total annual management fee rate was .35% of the Fund's average net assets.
Transfer Agent Fees. Fidelity Investments Institutional Operations Company, Inc. (FIIOC), an affiliate of FMR, is the transfer, dividend disbursing and shareholder servicing agent for each class of the Fund. FIIOC receives account fees and asset-based fees that vary according to the account size and type of account of the shareholders of Fidelity Fund. FIIOC receives an asset-based fee of Class K's average net assets. FIIOC pays for
Annual Report
6. Fees and Other Transactions with Affiliates - continued
Transfer Agent Fees - continued
typesetting, printing and mailing of shareholder reports, except proxy statements. For the period, transfer agent fees for each class were as follows:
| Amount | % of
Average
Net Assets |
Fidelity Fund | 9,101 | .20 |
Class K | 363 | .05 |
| $ 9,464 | |
Accounting and Security Lending Fees. Fidelity Service Company, Inc. (FSC), an affiliate of FMR, maintains the Fund's accounting records. The accounting fee is based on the level of average net assets for each month. Under a separate contract, FSC administers the security lending program. The security lending fee is based on the number and duration of lending transactions.
Brokerage Commissions. The Fund placed a portion of its portfolio transactions with brokerage firms which are affiliates of the investment adviser. The commissions paid to these affiliated firms were $123 for the period.
7. Committed Line of Credit.
The Fund participates with other funds managed by FMR or an affiliate in a $4.25 billion credit facility (the "line of credit") to be utilized for temporary or emergency purposes to fund shareholder redemptions or for other short-term liquidity purposes. The Fund has agreed to pay commitment fees on its pro-rata portion of the line of credit, which amounted to $15 and is reflected in Miscellaneous expenses on the Statement of Operations. During the period, there were no borrowings on this line of credit.
8. Security Lending.
The Fund lends portfolio securities through a lending agent from time to time in order to earn additional income. For equity securities, a lending agent is used and may loan securities to certain qualified borrowers, including Fidelity Capital Markets (FCM), a broker-dealer affiliated with the Fund. On the settlement date of the loan, the Fund receives collateral (in the form of U.S. Treasury obligations, letters of credit and/or cash) against the loaned securities and maintains collateral in an amount not less than 100% of the market value of the loaned securities during the period of the loan. The market value of the loaned securities is determined at the close of business of the Fund and any additional required collateral is delivered to the Fund on the next business day. If the borrower defaults on its obligation to return the securities loaned because of insolvency
Annual Report
Notes to Financial Statements - continued
(Amounts in thousands except percentages)
8. Security Lending - continued
or other reasons, a fund could experience delays and costs in recovering the securities loaned or in gaining access to the collateral. Any cash collateral received is invested in the Fidelity Securities Lending Cash Central Fund. The value of loaned securities and cash collateral at period end are disclosed on the Fund's Statement of Assets and Liabilities. Security lending income represents the income earned on investing cash collateral, less rebates paid to borrowers and any lending agent fees associated with the loan, plus any premium payments received for lending certain types of securities. Security lending income is presented in the Statement of Operations as a component of income from Fidelity Central Funds. Total security lending income during the period amounted to $489, including $2 from securities loaned to FCM.
9. Expense Reductions.
FMR voluntarily agreed to reimburse a portion of the Fund's operating expenses. During the period, this reimbursement reduced the fund's expenses by $47.
Many of the brokers with whom FMR places trades on behalf of the Fund provided services to the Fund in addition to trade execution. These services included payments of certain expenses on behalf of the Fund totaling $338 for the period.
In addition, through arrangements with each class' transfer agent, credits realized as a result of uninvested U.S. dollar cash balances were used to reduce the Fund's expenses. During the period, these credits reduced Class K's transfer agent expense by four-hundred and ninety seven dollars.
10. Distributions to Shareholders.
Distributions to shareholders of each class were as follows:
Years ended June 30, | 2012 | 2011 |
From net investment income | | |
Fidelity Fund | $ 31,576 | $ 43,443 |
Class K | 5,372 | 5,443 |
Total | $ 36,948 | $ 48,886 |
11. Share Transactions.
Transactions for each class of shares were as follows:
| Shares | Dollars |
Years ended June 30, | 2012 | 2011 | 2012 | 2011 |
Fidelity Fund | | | | |
Shares sold | 9,192 | 12,228 | $ 299,999 | $ 381,793 |
Reinvestment of distributions | 967 | 1,352 | 29,465 | 40,642 |
Shares redeemed | (31,358) | (35,089) | (1,019,919) | (1,103,552) |
Net increase (decrease) | (21,199) | (21,509) | $ (690,455) | $ (681,117) |
Annual Report
11. Share Transactions - continued
| Shares | Dollars |
Years ended June 30, | 2012 | 2011 | 2012 | 2011 |
Class K | | | | |
Shares sold | 9,901 | 6,007 | $ 323,105 | $ 189,048 |
Reinvestment of distributions | 176 | 180 | 5,372 | 5,443 |
Shares redeemed | (5,788) | (3,216) | (190,293) | (99,660) |
Net increase (decrease) | 4,289 | 2,971 | $ 138,184 | $ 94,831 |
12. Other.
The Fund's organizational documents provide former and current trustees and officers with a limited indemnification against liabilities arising in connection with the performance of their duties to the Fund. In the normal course of business, the Fund may also enter into contracts that provide general indemnifications. The Fund's maximum exposure under these arrangements is unknown as this would be dependent on future claims that may be made against the Fund. The risk of material loss from such claims is considered remote.
Annual Report
To the Trustees of Fidelity Hastings Street Trust and the Shareholders of Fidelity Fund:
In our opinion, the accompanying statement of assets and liabilities, including the schedule of investments, and the related statements of operations and of changes in net assets and the financial highlights present fairly, in all material respects, the financial position of Fidelity Fund (a fund of Fidelity Hastings Street Trust) at June 30, 2012, the results of its operations for the year then ended, the changes in its net assets for each of the two years in the period then ended and the financial highlights for each of the periods indicated, in conformity with accounting principles generally accepted in the United States of America. These financial statements and financial highlights (hereafter referred to as "financial statements") are the responsibility of the Fidelity Fund's management. Our responsibility is to express an opinion on these financial statements based on our audits. We conducted our audits of these financial statements in accordance with the standards of the Public Company Accounting Oversight Board (United States). Those standards require that we plan and perform the audit to obtain reasonable assurance about whether the financial statements are free of material misstatement. An audit includes examining, on a test basis, evidence supporting the amounts and disclosures in the financial statements, assessing the accounting principles used and significant estimates made by management, and evaluating the overall financial statement presentation. We believe that our audits, which included confirmation of securities at June 30, 2012 by correspondence with the custodian and brokers, provide a reasonable basis for our opinion.
/s/ PricewaterhouseCoopers LLP
PricewaterhouseCoopers LLP
Boston, Massachusetts
August 14, 2012
Annual Report
The Trustees, Members of the Advisory Board, and executive officers of the trust and fund, as applicable, are listed below. The Board of Trustees governs the fund and is responsible for protecting the interests of shareholders. The Trustees are experienced executives who meet periodically throughout the year to oversee the fund's activities, review contractual arrangements with companies that provide services to the fund, oversee management of the risks associated with such activities and contractual arrangements, and review the fund's performance. Except for James C. Curvey, each of the Trustees oversees 228 funds advised by FMR or an affiliate. Mr. Curvey oversees 435 funds advised by FMR or an affiliate.
The Trustees hold office without limit in time except that (a) any Trustee may resign; (b) any Trustee may be removed by written instrument, signed by at least two-thirds of the number of Trustees prior to such removal; (c) any Trustee who requests to be retired or who has become incapacitated by illness or injury may be retired by written instrument signed by a majority of the other Trustees; and (d) any Trustee may be removed at any special meeting of shareholders by a two-thirds vote of the outstanding voting securities of the trust. Each Trustee who is not an interested person (as defined in the 1940 Act) (Independent Trustee), shall retire not later than the last day of the calendar year in which his or her 75th birthday occurs. The Independent Trustees may waive this mandatory retirement age policy with respect to individual Trustees. The executive officers and Advisory Board Members hold office without limit in time, except that any officer and Advisory Board Member may resign or may be removed by a vote of a majority of the Trustees at any regular meeting or any special meeting of the Trustees. Except as indicated, each individual has held the office shown or other offices in the same company for the past five years.
Experience, Skills, Attributes, and Qualifications of the Fund's Trustees. The Governance and Nominating Committee has adopted a statement of policy that describes the experience, qualifications, attributes, and skills that are necessary and desirable for potential Independent Trustee candidates (Statement of Policy). The Board believes that each Trustee satisfied at the time he or she was initially elected or appointed a Trustee, and continues to satisfy, the standards contemplated by the Statement of Policy. The Governance and Nominating Committee also engages professional search firms to help identify potential Independent Trustee candidates who have the experience, qualifications, attributes, and skills consistent with the Statement of Policy. From time to time, additional criteria based on the composition and skills of the current Independent Trustees, as well as experience or skills that may be appropriate in light of future changes to board composition, business conditions, and regulatory or other developments, have also been considered by the professional search firms and the Governance and Nominating Committee. In addition, the Board takes into account the Trustees' commitment and participation in Board and committee meetings, as well as their leadership of standing and ad hoc committees throughout their tenure.
In determining that a particular Trustee was and continues to be qualified to serve as a Trustee, the Board has considered a variety of criteria, none of which, in isolation, was controlling. The Board believes that, collectively, the Trustees have balanced and diverse experience, qualifications, attributes, and skills, which allow the Board to operate effectively in governing the fund and protecting the interests of shareholders. Information about the specific experience, skills, attributes, and qualifications of each Trustee, which in each case led to the Board's conclusion that the Trustee should serve (or continue to serve) as a trustee of the fund, is provided below.
Annual Report
Trustees and Officers - continued
Board Structure and Oversight Function. James C. Curvey is an interested person (as defined in the 1940 Act) and currently serves as Chairman. The Trustees have determined that an interested Chairman is appropriate and benefits shareholders because an interested Chairman has a personal and professional stake in the quality and continuity of services provided to the fund. Independent Trustees exercise their informed business judgment to appoint an individual of their choosing to serve as Chairman, regardless of whether the Trustee happens to be independent or a member of management. The Independent Trustees have determined that they can act independently and effectively without having an Independent Trustee serve as Chairman and that a key structural component for assuring that they are in a position to do so is for the Independent Trustees to constitute a substantial majority for the Board. The Independent Trustees also regularly meet in executive session. Ned C. Lautenbach serves as Chairman of the Independent Trustees and as such (i) acts as a liaison between the Independent Trustees and management with respect to matters important to the Independent Trustees and (ii) with management prepares agendas for Board meetings.
Fidelity funds are overseen by different Boards of Trustees. The fund's Board oversees Fidelity's equity and high income funds and another Board oversees Fidelity's investment-grade bond, money market, and asset allocation funds. The asset allocation funds may invest in Fidelity funds overseen by the fund's Board. The use of separate Boards, each with its own committee structure, allows the Trustees of each group of Fidelity funds to focus on the unique issues of the funds they oversee, including common research, investment, and operational issues. On occasion, the separate Boards establish joint committees to address issues of overlapping consequences for the Fidelity funds overseen by each Board.
The Trustees operate using a system of committees to facilitate the timely and efficient consideration of all matters of importance to the Trustees, the fund, and fund shareholders and to facilitate compliance with legal and regulatory requirements and oversight of the fund's activities and associated risks. The Board, acting through its committees, has charged FMR and its affiliates with (i) identifying events or circumstances the occurrence of which could have demonstrably adverse effects on the fund's business and/or reputation; (ii) implementing processes and controls to lessen the possibility that such events or circumstances occur or to mitigate the effects of such events or circumstances if they do occur; and (iii) creating and maintaining a system designed to evaluate continuously business and market conditions in order to facilitate the identification and implementation processes described in (i) and (ii) above. Because the day-to-day operations and activities of the fund are carried out by or through FMR, its affiliates and other service providers, the fund's exposure to risks is mitigated but not eliminated by the processes overseen by the Trustees. While each of the Board's committees has responsibility for overseeing different aspects of the fund's activities, oversight is exercised primarily through the Operations, Audit, and Compliance Committees. In addition, the Independent Trustees have worked with FMR to enhance the Board's oversight of investment and financial risks, legal and regulatory risks, technology risks, and operational risks, including the development of additional risk reporting to the Board. For example, a working group comprised of Independent Trustees and FMR has worked and continues to work to review the Fidelity funds' valuation-related activities, reporting and risk management. Appropriate personnel, including but not limited to the fund's Chief Compliance Officer (CCO), FMR's internal auditor, the independent accountants, the fund's Treasurer and portfolio management personnel, make periodic reports to the Board's committees, as appropriate, including an annual review of FMR's risk management program for the Fidelity funds. The responsibilities of each standing committee, including their oversight responsibilities, are described further under "Standing Committees of the Fund's Trustees."
Annual Report
The fund's Statement of Additional Information (SAI) includes more information about the Trustees. To request a free copy, call Fidelity at 1-800-544-8544.
Interested Trustees*:
Correspondence intended for each Trustee who is an interested person may be sent to Fidelity Investments, 82 Devonshire Street, Boston, Massachusetts 02109.
Name, Age; Principal Occupations and Other Relevant Experience+ |
James C. Curvey (77) |
| Year of Election or Appointment: 2007 Mr. Curvey is Trustee and Chairman of the Board of Trustees of certain Trusts. Mr. Curvey also serves as Trustee (2007-present) of other investment companies advised by FMR. Mr. Curvey is a Director of Fidelity Investments Money Management, Inc. (2009-present), Director of Fidelity Research & Analysis Co. (2009-present) and Director of FMR and FMR Co., Inc. (2007-present). Mr. Curvey is also Vice Chairman (2007-present) and Director of FMR LLC. In addition, Mr. Curvey serves as an Overseer for the Boston Symphony Orchestra and a member of the Trustees of Villanova University. Previously, Mr. Curvey was the Vice Chairman (2006-2007) and Director (2000-2007) of FMR Corp. |
Ronald P. O'Hanley (55) |
| Year of Election or Appointment: 2011 Mr. O'Hanley is Director of FMR Co., Inc. (2010-present), Director of Fidelity Investments Money Management, Inc. (2010-present), Director of Fidelity Research & Analysis Company (2010-present), President of Fidelity Asset Management and Corporate Services and a member of Fidelity's Executive Committee (2010-present). Previously, Mr. O'Hanley served as President and Chief Executive Officer of BNY Mellon Asset Management (2007-2010). Mr. O'Hanley also served as Vice Chairman of Bank New York Mellon Corp. and a member of that firm's Executive Committee. Prior to the 2007 merger of The Bank of New York and Mellon Financial Corporation, he was Vice Chairman of Mellon Financial Corporation and President and Chief Executive Officer of Mellon Asset Management. He joined Mellon in February 1997. Mr. O'Hanley currently serves as Chairman of the Boston Public Library Foundation Board of Directors and sits on the Board of Directors of Beth Israel Deaconess Medical Center, the Board of Trustees of the Marine Biological Laboratory and the Advisory Board of the Maxwell School of Citizenship and Public Administration at Syracuse University. Mr. O'Hanley also chairs the Council on Asset Management for the Financial Services Roundtable and is a member of the Board of Directors of Institutional Investor's U.S. Institute. |
* Trustees have been determined to be "Interested Trustees" by virtue of, among other things, their affiliation with the trust or various entities under common control with FMR.
+ The information above includes each Trustee's principal occupation during the last five years and other information relating to the experience, attributes, and skills relevant to each Trustee's qualifications to serve as a Trustee, which led to the conclusion that each Trustee should serve as a Trustee for the fund.
Annual Report
Independent Trustees:
Correspondence intended for each Independent Trustee (that is, the Trustees other than the Interested Trustees) may be sent to Fidelity Investments, P.O. Box 55235, Boston, Massachusetts 02205-5235.
Name, Age; Principal Occupations and Other Relevant Experience+ |
Dennis J. Dirks (64) |
| Year of Election or Appointment: 2005 Prior to his retirement in May 2003, Mr. Dirks was Chief Operating Officer and a member of the Board of The Depository Trust & Clearing Corporation (DTCC). He also served as President, Chief Operating Officer, and Board member of The Depository Trust Company (DTC) and President and Board member of the National Securities Clearing Corporation (NSCC). In addition, Mr. Dirks served as Chief Executive Officer and Board member of the Government Securities Clearing Corporation, Chief Executive Officer and Board member of the Mortgage-Backed Securities Clearing Corporation, as a Trustee and a member of the Finance Committee of Manhattan College (2005-2008), and as a Trustee and a member of the Finance Committee of AHRC of Nassau County (2006-2008). Mr. Dirks is a member of the Independent Directors Council (IDC) Governing Council (2010-present) and Board of Directors for The Brookville Center for Children's Services, Inc. (2009-present). |
Alan J. Lacy (58) |
| Year of Election or Appointment: 2008 Mr. Lacy serves as Senior Adviser (2007-present) of Oak Hill Capital Partners, L.P. (private equity). Mr. Lacy also served as Chief Executive Officer (2000-2005) and Vice Chairman (2005-2006) of Sears Holdings Corporation and Sears, Roebuck and Co. (retail). In addition, Mr. Lacy serves as a member of the Board of Directors of Dave & Buster's, Inc. (restaurant and entertainment complexes, 2010-present), The Hillman Companies, Inc. (hardware wholesalers, 2010-present), and Bristol-Myers Squibb Company (global pharmaceuticals, 2007-present). Mr. Lacy is a member of the Board of Trustees of The National Parks Conservation Association (2006-present). Previously, Mr. Lacy served as Chairman of the Board of Trustees of the National Parks Conservation Association (2008-2011) and as a member of the Board of Directors for the Western Union Company (global money transfer, 2006-2011). |
Ned C. Lautenbach (68) |
| Year of Election or Appointment: 2000 Mr. Lautenbach is Chairman of the Independent Trustees of the Equity and High Income Funds (2006-present). Mr. Lautenbach currently serves as the Lead Director of the Eaton Corporation Board of Directors (diversified industrial, 1997-present). Mr. Lautenbach is also a member of the Board of Directors of the Philharmonic Center for the Arts in Naples, Florida (1999-present); a member of the Board of Trustees of Fairfield University (2005-present); and a member of the Council on Foreign Relations (1994-present). Previously, Mr. Lautenbach was a Partner/Advisory Partner at Clayton, Dubilier & Rice, LLC (private equity investment, 1998-2010), as well as a Director of Sony Corporation (2006-2007). |
Joseph Mauriello (67) |
| Year of Election or Appointment: 2008 Prior to his retirement in January 2006, Mr. Mauriello served in numerous senior management positions including Deputy Chairman and Chief Operating Officer (2004-2005), and Vice Chairman of Financial Services (2002-2004) of KPMG LLP US (professional services, 1965-2005). Mr. Mauriello currently serves as a member of the Board of Directors of XL Group plc. (global insurance and re-insurance, 2006-present). Previously, Mr. Mauriello served as a Director of the Hamilton Funds of the Bank of New York (2006-2007) and Arcadia Resources Inc. (health care services and products, 2007-2012). |
Robert W. Selander (61) |
| Year of Election or Appointment: 2011 Previously, Mr. Selander served as a Member of the Advisory Board of Fidelity's Equity and High Income Funds (2011), Executive Vice Chairman (2010), Chief Executive Officer (2009-2010), and President and Chief Executive Officer (1997-2009) of Mastercard, Inc. |
Cornelia M. Small (67) |
| Year of Election or Appointment: 2005 Ms. Small is a member of the Board of Directors of the Teagle Foundation (2009-present). Ms. Small is also a member of the Investment Committee, and Chair (2008-present) and a member of the Board of Trustees of Smith College. In addition, Ms. Small serves on the Investment Committee of the Berkshire Taconic Community Foundation (2008-present). Previously, Ms. Small served as Chairperson of the Investment Committee (2002-2008) of Smith College. In addition, Ms. Small served as Chief Investment Officer, Director of Global Equity Investments, and a member of the Board of Directors of Scudder, Stevens & Clark and Scudder Kemper Investments. |
William S. Stavropoulos (73) |
| Year of Election or Appointment: 2001 Mr. Stavropoulos is Vice Chairman of the Independent Trustees of the Equity and High Income Funds (2006-present). Mr. Stavropoulos serves as President and Founder of the Michigan Baseball Foundation, the Great Lakes Loons (2007-present). Mr. Stavropoulos is Chairman Emeritus of the Board of Directors of The Dow Chemical Company, where he previously served in numerous senior management positions, including President, CEO (1995-2000; 2002-2004), Chairman of the Executive Committee (2000-2006), and as a member of the Board of Directors (1990-2006). Currently, Mr. Stavropoulos is Chairman of Univar (global distributor of commodity and specialty chemicals, 2010-present), a Director of Teradata Corporation (data warehousing and technology solutions, 2008-present), Chemical Financial Corporation, Maersk Inc. (industrial conglomerate), Tyco International, Inc. (multinational manufacturing and services, 2007-present), and a member of the Advisory Board for Metalmark Capital (private equity investment, 2005-present). Mr. Stavropoulos is a special advisor to Clayton, Dubilier & Rice, LLC (private equity investment). In addition, Mr. Stavropoulos is a member of the University of Notre Dame Advisory Council for the College of Science. |
David M. Thomas (63) |
| Year of Election or Appointment: 2008 Previously, Mr. Thomas served as Executive Chairman (2005-2006) and Chairman and Chief Executive Officer (2000-2005) of IMS Health, Inc. (pharmaceutical and healthcare information solutions). In addition, Mr. Thomas serves as a member of the Board of Directors of Fortune Brands, Inc. (consumer products), and Interpublic Group of Companies, Inc. (marketing communication, 2004-present). |
Michael E. Wiley (61) |
| Year of Election or Appointment: 2008 Mr. Wiley also serves as a Director of Asia Pacific Exploration Consolidated (international oil and gas exploration and production, 2008-present). Mr. Wiley serves as a Director of Tesoro Corporation (independent oil refiner and marketer, 2005-present), and a Director of Bill Barrett Corporation (exploration and production, 2005-present). In addition, Mr. Wiley also serves as a Director of Post Oak Bank (privately-held bank, 2004-present). Previously, Mr. Wiley served as a member of the Board of Trustees of the University of Tulsa (2000-2006; 2007-2010), as a Senior Energy Advisor of Katzenbach Partners, LLC (consulting, 2006-2007), as an Advisory Director of Riverstone Holdings (private investment), Chairman, President, and CEO of Baker Hughes, Inc. (oilfield services, 2000-2004), and as Director of Spinnaker Exploration Company (exploration and production, 2001-2005). |
Annual Report
Trustees and Officers - continued
+ The information above includes each Trustee's principal occupation during the last five years and other information relating to the experience, attributes, and skills relevant to each Trustee's qualifications to serve as a Trustee, which led to the conclusion that each Trustee should serve as a Trustee for the fund.
Advisory Board Members and Executive Officers:
Correspondence intended for David A. Rosow and Garnett A. Smith may be sent to Fidelity Investments, P.O. Box 55235, Boston, Massachusetts 02205-5235. Correspondence intended for each executive officer, Edward C. Johnson 3d, and Peter S. Lynch may be sent to Fidelity Investments, 82 Devonshire Street, Boston, Massachusetts 02109.
Name, Age; Principal Occupation |
Edward C. Johnson 3d (82) |
| Year of Election or Appointment: 2011 Member of the Advisory Board of Fidelity's Equity and High Income Funds. Mr. Johnson serves as Chief Executive Officer, Chairman, and a Director of FMR LLC, and also serves as Chairman and Director of FIL Limited. Previously, Mr. Johnson served as a Trustee and Chairman of the Board of certain Fidelity Trusts, Chairman and a Director of FMR, Chairman and a Director of FMR Co., Inc., and President of FMR LLC (2006-2007). |
Peter S. Lynch (68) |
| Year of Election or Appointment: 2003 Member of the Advisory Board of Fidelity's Equity and High Income Funds. Mr. Lynch is Vice Chairman and a Director of FMR and FMR Co., Inc. In addition, Mr. Lynch serves as a Trustee of Boston College and as the Chairman of the Inner-City Scholarship Fund. Previously, Mr. Lynch served on the Special Olympics International Board of Directors (1997-2006). |
David A. Rosow (69) |
| Year of Election or Appointment: 2012 Member of the Advisory Board of Fidelity's Equity and High Income Funds. Chairman and Chief Executive Officer of International Golf Group, Inc. (golf course development, 1990-present). Previously, Mr. Rosow served as Chairman and Chief Executive Officer of Rosow & Company, Inc. (private investment company, 1989-2011), a Lead Director of Hudson United Bancorp (2001-2006) and as a Director of TD Banknorth (1996-2006). In addition, Mr. Rosow is a member (2008-present) and President (2009-present) of the Town Council of Palm Beach, Florida. |
Garnett A. Smith (64) |
| Year of Election or Appointment: 2012 Member of the Advisory Board of Fidelity's Equity and High Income Funds. Prior to Mr. Smith's retirement, he served as Chairman and Chief Executive Officer of Inbrand Corp. (manufacturer of personal absorbent products, 1990-1997). He also served as President (1986-1990) of Inbrand Corp. Prior to his employment with Inbrand Corp., he was employed by a retail fabric chain and North Carolina National Bank. In addition, Mr. Smith is a board member of the Jackson Hole Land Trust (2009-present). |
Kenneth B. Robins (42) |
| Year of Election or Appointment: 2008 President and Treasurer of Fidelity's Equity and High Income Funds. Mr. Robins also serves as President and Treasurer (2010-present) and Assistant Treasurer (2009-present) of other Fidelity funds and is an employee of Fidelity Investments (2004-present). Previously, Mr. Robins served as Deputy Treasurer of the Fidelity funds (2005-2008) and Treasurer and Chief Financial Officer of The North Carolina Capital Management Trust: Cash and Term Portfolios (2006-2008). |
Bruce T. Herring (46) |
| Year of Election or Appointment: 2006 Vice President of certain Equity Funds. Mr. Herring also serves as President of Fidelity Research & Analysis Company (2010-present), Chief Investment Officer and Director of Fidelity Management & Research (U.K.) Inc. (2010-present) and Group Chief Investment Officer of FMR. Previously, Mr. Herring served as Vice President (2005-2006) and Senior Vice President (2006-2007) of Fidelity Management & Research Company, Vice President of FMR Co., Inc. (2001-2007) and as a portfolio manager for Fidelity U.S. Equity Funds. |
Brian B. Hogan (47) |
| Year of Election or Appointment: 2009 Vice President of Equity and High Income Funds. Mr. Hogan also serves as President of FMR's Equity Division (2009-present). Previously, Mr. Hogan served as Senior Vice President, Equity Research of FMR (2006-2009) and as a portfolio manager. |
Scott C. Goebel (44) |
| Year of Election or Appointment: 2008 Secretary and Chief Legal Officer (CLO) of the Fidelity funds. Mr. Goebel also serves as Secretary of Fidelity Investments Money Management, Inc. (FIMM) (2010-present) and Fidelity Research and Analysis Company (FRAC) (2010-present); Secretary and CLO of The North Carolina Capital Management Trust: Cash and Term Portfolios (2008-present); General Counsel, Secretary, and Senior Vice President of FMR (2008-present) and FMR Co., Inc. (2008-present); employed by FMR LLC or an affiliate (2001-present); Chief Legal Officer of Fidelity Management & Research (Hong Kong) Limited (2008-present) and Assistant Secretary of Fidelity Management & Research (Japan) Inc. (2008-present), and Fidelity Management & Research (U.K.) Inc. (2008-present). Previously, Mr. Goebel served as Assistant Secretary of FIMM (2008-2010), FRAC (2008-2010), and the Funds (2007-2008) and as Vice President and Secretary of Fidelity Distributors Corporation (FDC) (2005-2007). |
William C. Coffey (43) |
| Year of Election or Appointment: 2009 Assistant Secretary of Fidelity's Equity and High Income Funds. Mr. Coffey also serves as Senior Vice President and Deputy General Counsel of FMR LLC (2010-present), and is an employee of Fidelity Investments. Previously, Mr. Coffey served as Vice President and Associate General Counsel of FMR LLC (2005-2009). |
Elizabeth Paige Baumann (44) |
| Year of Election or Appointment: 2012 Anti-Money Laundering (AML) Officer of the Fidelity funds. Ms. Baumann also serves as AML Officer of The North Carolina Capital Management Trust: Cash and Term Portfolios (2012-present), Chief AML Officer of FMR LLC (2012-present), and is an employee of Fidelity Investments. Previously, Ms. Baumann served as Vice President and Deputy Anti-Money Laundering Officer (2007-2012). |
Christine Reynolds (53) |
| Year of Election or Appointment: 2008 Chief Financial Officer of the Fidelity funds. Ms. Reynolds became President of Fidelity Pricing and Cash Management Services (FPCMS) in August 2008. Ms. Reynolds served as Chief Operating Officer of FPCMS (2007-2008). Previously, Ms. Reynolds served as President, Treasurer, and Anti-Money Laundering officer of the Fidelity funds (2004-2007). |
Joseph A. Hanlon (44) |
| Year of Election or Appointment: 2012 Chief Compliance Officer of Fidelity's Equity and High Income Funds. Mr. Hanlon serves as Compliance Officer of FMR, FMR Co., Inc., Fidelity Investments Money Management, Inc. (FIMM), Fidelity Research and Analysis Company (FRAC), Fidelity Management & Research (Japan) Inc., Fidelity Management & Research (U.K.) Inc., Fidelity Management & Research (Hong Kong), and Strategic Advisers, Inc. (2009-present), as Senior Vice President of the Fidelity Asset Management Division (2009-present), and is an employee of Fidelity Investments. |
Joseph F. Zambello (55) |
| Year of Election or Appointment: 2011 Deputy Treasurer of the Fidelity funds. Mr. Zambello is an employee of Fidelity Investments. Previously, Mr. Zambello served as Vice President of FMR's Program Management Group (2009-2011) and Vice President of the Transfer Agent Oversight Group (2005-2009). |
Adrien E. Deberghes (44) |
| Year of Election or Appointment: 2008 Deputy Treasurer of Fidelity's Equity and High Income Funds. Mr. Deberghes also serves as Vice President (2011-present) and Assistant Treasurer (2010-present) of other Fidelity funds, and is an employee of Fidelity Investments (2008-present). Previously, Mr. Deberghes served as Senior Vice President of Mutual Fund Administration at State Street Corporation (2007-2008), Senior Director of Mutual Fund Administration at Investors Bank & Trust (2005-2007), and Director of Finance for Dunkin' Brands (2000-2005). |
Stephanie J. Dorsey (43) |
| Year of Election or Appointment: 2010 Assistant Treasurer of Fidelity's Equity and High Income Funds. Ms. Dorsey also serves as Deputy Treasurer of other Fidelity funds (2008-present) and is an employee of Fidelity Investments (2008-present). Previously, Ms. Dorsey served as Treasurer (2004-2008) of the JPMorgan Mutual Funds and Vice President (2004-2008) of JPMorgan Chase Bank. |
John R. Hebble (54) |
| Year of Election or Appointment: 2009 Assistant Treasurer of Fidelity's Equity and High Income Funds. Mr. Hebble also serves as President (2011-present), Treasurer, and Chief Financial Officer of The North Carolina Capital Management Trust: Cash and Term Portfolios (2008-present), President and Treasurer of other Fidelity funds (2008-present) and is an employee of Fidelity Investments. |
Gary W. Ryan (53) |
| Year of Election or Appointment: 2005 Assistant Treasurer of the Fidelity funds. Mr. Ryan is an employee of Fidelity Investments. Previously, Mr. Ryan served as Vice President of Fund Reporting in Fidelity Pricing and Cash Management Services (FPCMS) (1999-2005). |
Jonathan Davis (44) |
| Year of Election or Appointment: 2010 Assistant Treasurer of the Fidelity funds. Mr. Davis is also Assistant Treasurer of Fidelity Rutland Square Trust II and Fidelity Commonwealth Trust II. Mr. Davis is an employee of Fidelity Investments. Previously, Mr. Davis served as Vice President and Associate General Counsel of FMR LLC (2003-2010). |
Annual Report
Fidelity Fund designates 100% of the dividends distributed in August and December, during the fiscal year as qualifying for the dividends-received deduction for corporate shareholders.
Fidelity Fund designates 100% of the dividends distributed during the fiscal year as amounts which may be taken into account as a dividend for purposes of the maximum rate under section 1(h)(11) of the Internal Revenue Code.
The fund will notify shareholders in January 2013 of amounts for use in preparing 2012 income tax returns.
Annual Report
A special meeting of the fund's shareholders was held on August 10, 2011. The results of votes taken among shareholders on the proposals before them are reported below. Each vote reported represents one dollar of net asset value held on the record date for the meeting.
PROPOSAL 1 |
To amend the fund's fundamental investment policies to remove references relating to selecting securities for income characteristics. |
| # of
Votes | % of
Votes |
Affirmative | 2,216,149,778.24 | 74.262 |
Against | 568,108,489.09 | 19.037 |
Abstain | 199,977,103.94 | 6.701 |
TOTAL | 2,984,235,371.27 | 100.000 |
PROPOSAL 2 A |
Contingent upon the approval of Proposal 3, to increase the individual fund fee rate component of the management fee to 0.30%. |
| # of
Votes | % of
Votes |
Affirmative | 1,710,896,326.31 | 57.331 |
Against | 1,114,308,132.65 | 37.340 |
Abstain | 159,030,912.31 | 5.329 |
TOTAL | 2,984,235,371.27 | 100.000 |
PROPOSAL 3 A |
Contingent upon the approval of Proposal 2, to include a performance adjustment component to the management fee and to give the Trustees the authority to change the fund's performance adjustment index going forward, without a shareholder vote, subject to applicable law. |
| # of
Votes | % of
Votes |
Affirmative | 1,765,324,795.01 | 59.155 |
Against | 1,046,524,203.94 | 35.068 |
Abstain | 172,386,372.32 | 5.777 |
TOTAL | 2,984,235,371.27 | 100.000 |
A Proposal was not approved by shareholders.
Annual Report
Investment Adviser
Fidelity Management &
Research Company
Boston, MA
Investment Sub-Advisers
FMR Co., Inc.
Fidelity Management & Research
(U.K.) Inc.
Fidelity Management & Research
(Hong Kong) Limited
Fidelity Management & Research
(Japan) Inc.
General Distributor
Fidelity Distributors Corporation
Smithfield, RI
Transfer and Service Agents
Fidelity Investments Institutional
Operations Company, Inc.
Boston, MA
Fidelity Service Company, Inc.
Boston, MA
Custodian
The Northern Trust Company
Chicago, IL
The Fidelity Telephone Connection
Mutual Fund 24-Hour Service
Exchanges/Redemptions
and Account Assistance 1-800-544-6666
Product Information 1-800-544-6666
Retirement Accounts 1-800-544-4774
(8 a.m. - 9 p.m.)
TDD Service 1-800-544-0118
for the deaf and hearing impaired
(9 a.m. - 9 p.m. Eastern time)
Fidelity Automated Service
Telephone (FAST®)
1-800-544-5555
Automated line for quickest service
FID-UANN-0812
1.787731.109
(Fidelity Investment logo)(registered trademark)
Corporate Headquarters
82 Devonshire St., Boston, MA 02109
www.fidelity.com
Fidelity®
Fund -
Class K
Annual Report
June 30, 2012
(Fidelity Cover Art)
Contents
Performance | (Click Here) | How the fund has done over time. |
Management's Discussion of Fund Performance | (Click Here) | The Portfolio Manager's review of fund performance and strategy. |
Shareholder Expense Example | (Click Here) | An example of shareholder expenses. |
Investment Changes | (Click Here) | A summary of major shifts in the fund's investments over the past six months. |
Investments | (Click Here) | A complete list of the fund's investments with their market values. |
Financial Statements | (Click Here) | Statements of assets and liabilities, operations, and changes in net assets, as well as financial highlights. |
Notes | (Click Here) | Notes to the financial statements. |
Report of Independent Registered Public Accounting Firm | (Click Here) | |
Trustees and Officers | (Click Here) | |
Distributions | (Click Here) | |
Proxy Voting Results | (Click Here) | |
To view a fund's proxy voting guidelines and proxy voting record for the 12-month period ended June 30, visit http://www.fidelity.com/proxyvotingresults or visit the Securities and Exchange Commission's (SEC) web site at http://www.sec.gov. You may also call 1-800-835-5092 to request a free copy of the proxy voting guidelines.
Standard & Poor's, S&P and S&P 500 are registered service marks of The McGraw-Hill Companies, Inc. and have been licensed for use by Fidelity Distributors Corporation.
Other third party marks appearing herein are the property of their respective owners.
All other marks appearing herein are registered or unregistered trademarks or service marks of FMR LLC or an affiliated company. © 2012 FMR LLC. All rights reserved.
Annual Report
This report and the financial statements contained herein are submitted for the general information of the shareholders of the fund. This report is not authorized for distribution to prospective investors in the fund unless preceded or accompanied by an effective prospectus.
A fund files its complete schedule of portfolio holdings with the SEC for the first and third quarters of each fiscal year on Form N-Q. Forms N-Q are available on the SEC's web site at http://www.sec.gov. A fund's Forms N-Q may be reviewed and copied at the SEC's Public Reference Room in Washington, DC. Information regarding the operation of the SEC's Public Reference Room may be obtained by calling 1-800-SEC-0330. For a complete list of a fund's portfolio holdings, view the most recent holdings listing, semiannual report, or annual report on Fidelity's web site at http://www.fidelity.com, http://www.advisor.fidelity.com, or http://www.401k.com, as applicable.
NOT FDIC INSURED • MAY LOSE VALUE • NO BANK GUARANTEE
Neither the fund nor Fidelity Distributors Corporation is a bank.
Annual Report
Average annual total return reflects the change in the value of an investment, assuming reinvestment of the class' distributions from dividend income and capital gains (the profits earned upon the sale of securities that have grown in value, if any) and assuming a constant rate of performance each year. The $10,000 table and the fund's returns do not reflect the deduction of taxes that a shareholder would pay on fund distributions or the redemption of fund shares. During periods of reimbursement by Fidelity, a fund's total return will be greater than it would be had the reimbursement not occurred. How a fund did yesterday is no guarantee of how it will do tomorrow.
Average Annual Total Returns
Periods ended June 30, 2012 | Past 1
year | Past 5
years | Past 10
years |
Class K A | 1.37% | 0.23% | 5.16% |
A The initial offering of Class K shares took place on May 9, 2008. Returns prior to May 9, 2008 are
those of Fidelity® Fund, the original class of the fund.
$10,000 Over 10 Years
Let's say hypothetically that $10,000 was invested in Fidelity® Fund - Class K on June 30, 2002. The chart shows how the value of your investment would have changed, and also shows how the S&P 500® Index performed over the same period. The initial offering of Class K took place on May 9, 2008. See above for additional information regarding the performance of Class K.
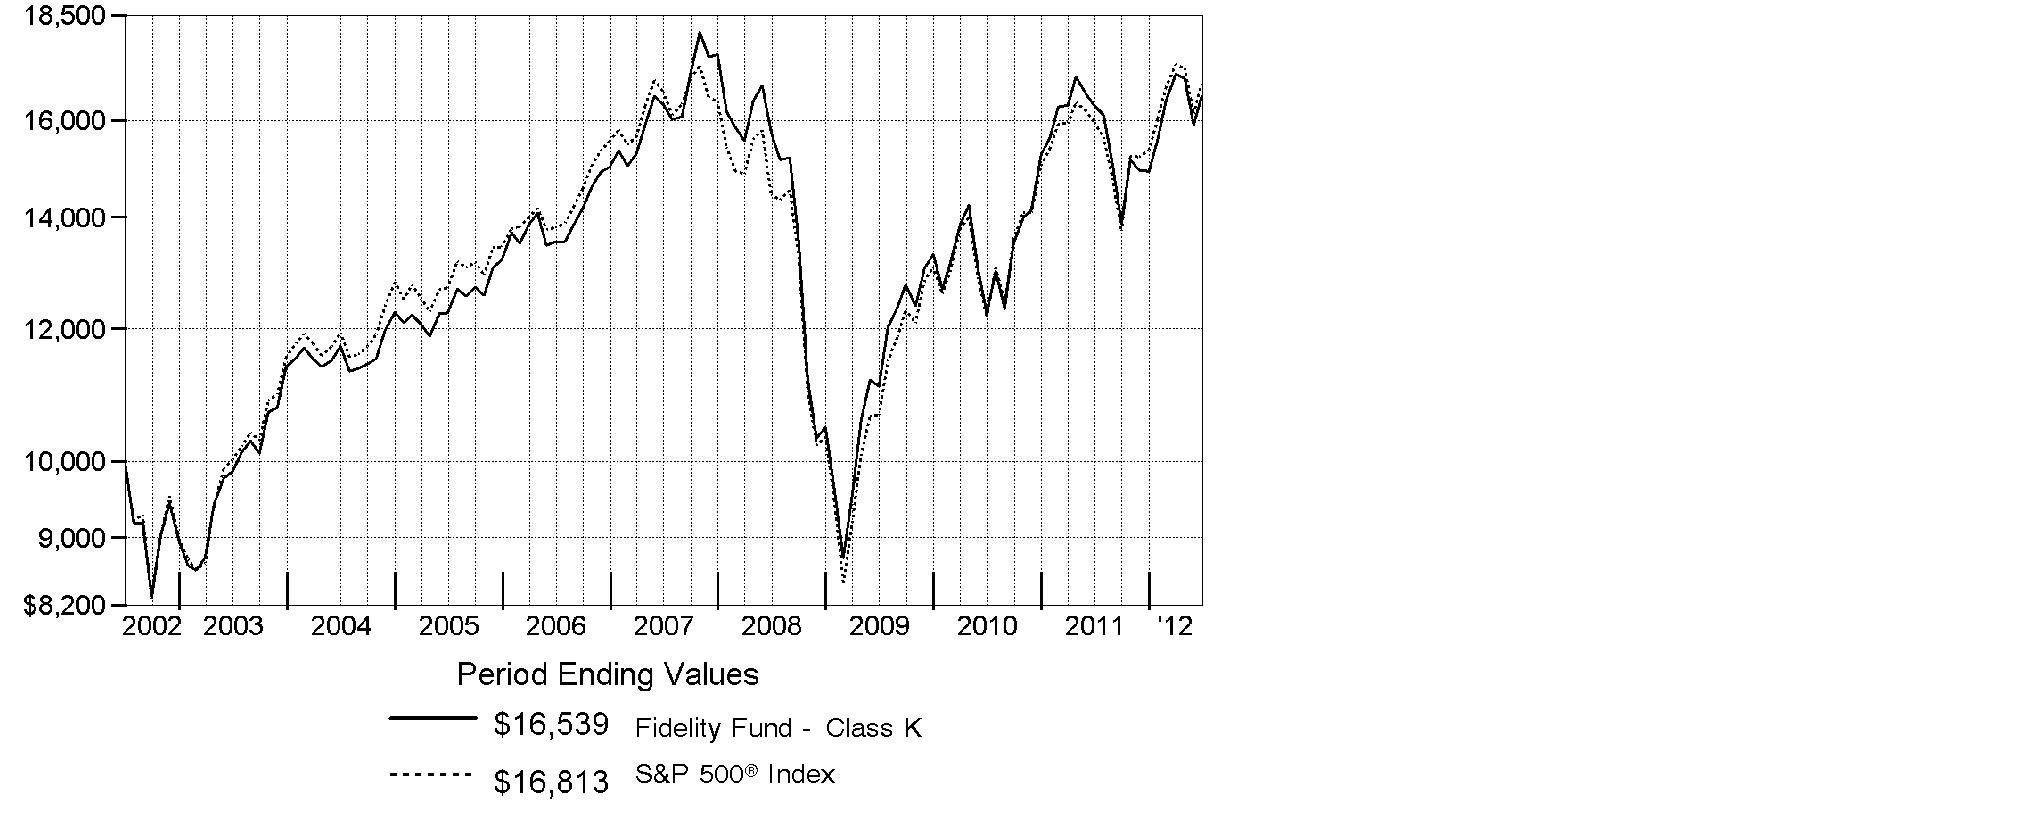
Annual Report
Market Recap: Major U.S. equity benchmarks posted solid gains for the 12 months ending June 30, 2012, even amid the period's uncertain investment environment. The broad-based S&P 500® Index returned 5.45%, while the blue-chip-laden Dow Jones Industrial AverageSM and the technology-heavy Nasdaq Composite® Index gained 6.63% and 6.99%, respectively. Volatility marked the first half of the period, as equities plummeted last summer and early fall on Europe's debt woes, debate over the U.S. debt ceiling and the credit-rating downgrade that followed. Beginning in October, healthier manufacturing, consumer and housing data rejuvenated markets and investors' appetite for stocks, leading major equity benchmarks to their best first-quarter performance since 1998. Stocks slipped again in the spring, as more eurozone trouble and a marked slowdown in China put the brakes on earlier momentum, until optimism reappeared in June. For the period, five of the 10 major market segments within the S&P 500® posted a double-digit gain, led by the more-defensive utilities, consumer staples and telecommunication services sectors, each which rose about 15%. Conversely, energy (-8%) and materials (-7%) struggled the most. Given Europe's turmoil and local currency weakness, foreign developed-markets stocks lost ground, with the MSCI® EAFE® Index returning -13.70%.
Comments from John Avery, Portfolio Manager of Fidelity® Fund: During the year, the fund's Class K shares returned 1.37%, lagging the S&P 500®. Versus the index, stock picking in the software and services segment of information technology weighed on relative performance, as did security selection in energy and financials. A cash position averaging roughly 3% also hurt, while the fund's foreign holdings disappointed in part due to a stronger U.S. dollar. At the individual stock level, the fund's out-of-index position in Australian gold miner Newcrest Mining suffered a sizable loss, as the price of gold fell and gold stocks underperformed the metal. Occidental Petroleum, commercial bank Citigroup and Green Mountain Coffee Roasters detracted as well. I sold Newcrest Mining and Green Mountain during the period. Conversely, stock selection in the hardware/equipment segment of technology added value, along with industry positioning in financials and stock picking in consumer discretionary. Apple was by far the fund's largest individual contributor, as the company reported impressive sales and earnings numbers driven by the popularity of its iPhone® smartphone and iPad® tablet device. Aerospace components and services supplier Goodrich proved rewarding when the company received a takeover bid from United Technologies in September 2011. I sold Goodrich to nail down profits. Coffee roaster and retailer Starbucks also contributed.
The views expressed above reflect those of the portfolio manager(s) only through the end of the period as stated on the cover of this report and do not necessarily represent the views of Fidelity or any other person in the Fidelity organization. Any such views are subject to change at any time based upon market or other conditions and Fidelity disclaims any responsibility to update such views. These views may not be relied on as investment advice and, because investment decisions for a Fidelity fund are based on numerous factors, may not be relied on as an indication of trading intent on behalf of any Fidelity fund.
Annual Report
Shareholder Expense Example
As a shareholder of the Fund, you incur two types of costs: (1) transaction costs, and (2) ongoing costs, including management fees and other Fund expenses. This Example is intended to help you understand your ongoing costs (in dollars) of investing in the Fund and to compare these costs with the ongoing costs of investing in other mutual funds.
The Example is based on an investment of $1,000 invested at the beginning of the period and held for the entire period (January 1, 2012 to June 30, 2012).
Actual Expenses
The first line of the accompanying table for each class of the Fund provides information about actual account values and actual expenses. You may use the information in this line, together with the amount you invested, to estimate the expenses that you paid over the period. Simply divide your account value by $1,000.00 (for example, an $8,600 account value divided by $1,000.00 = 8.6), then multiply the result by the number in the first line for a class of the Fund under the heading entitled "Expenses Paid During Period" to estimate the expenses you paid on your account during this period. A small balance maintenance fee of $12.00 that is charged once a year may apply for certain accounts with a value of less than $2,000. This fee is not included in the table below. If it was, the estimate of expenses you paid during the period would be higher, and your ending account value lower, by this amount. In addition, the Fund, as a shareholder in the underlying Fidelity Central Funds, will indirectly bear its pro-rata share of the fees and expenses incurred by the underlying Fidelity Central Funds. These fees and expenses are not included in the Fund's annualized expense ratio used to calculate the expense estimate in the table below.
Hypothetical Example for Comparison Purposes
The second line of the accompanying table for each class of the Fund provides information about hypothetical account values and hypothetical expenses based on a Class' actual expense ratio and an assumed rate of return of 5% per year before expenses, which is not the Class' actual return. The hypothetical account values and expenses may not be used to estimate the actual ending account balance or expenses you paid for the period. You may use this information to compare the ongoing costs of investing in the Fund and other funds. To do so, compare this 5% hypothetical example with the 5% hypothetical examples that appear in the shareholder reports of the other funds. A small balance maintenance fee of $12.00 that is charged once a year may apply for certain accounts with a value of less than $2,000. This fee is not included in the table below. If it was, the estimate of expenses you paid during the period would be higher, and your ending account value lower, by this amount. In addition, the Fund, as a shareholder in the underlying Fidelity Central Funds, will indirectly bear its pro-rata share of the fees and expenses incurred by the underlying Fidelity Central Funds. These fees and expenses are not included in the Fund's annualized expense ratio used to calculate the expense estimate in the table below.
Please note that the expenses shown in the table are meant to highlight your ongoing costs only and do not reflect any transaction costs. Therefore, the second line of the table is useful in comparing ongoing costs only, and will not help you determine the relative total costs of owning different funds.
Annual Report
| Annualized
Expense Ratio | Beginning
Account Value
January 1, 2012 | Ending
Account Value
June 30, 2012 | Expenses Paid
During Period*
January 1, 2012
to June 30, 2012 |
Fidelity Fund | .58% | | | |
Actual | | $ 1,000.00 | $ 1,107.90 | $ 3.04 |
HypotheticalA | | $ 1,000.00 | $ 1,021.98 | $ 2.92 |
Class K | .43% | | | |
Actual | | $ 1,000.00 | $ 1,108.50 | $ 2.25 |
HypotheticalA | | $ 1,000.00 | $ 1,022.73 | $ 2.16 |
A 5% return per year before expenses
* Expenses are equal to each Class' annualized expense ratio, multiplied by the average account value over the period, multiplied by 182/366 (to reflect the one-half year period).
Annual Report
Investment Changes (Unaudited)
Top Ten Stocks as of June 30, 2012 |
| % of fund's
net assets | % of fund's net assets
6 months ago |
Apple, Inc. | 6.8 | 6.0 |
Wells Fargo & Co. | 2.8 | 1.9 |
Chevron Corp. | 2.6 | 3.1 |
IBM Corp. | 2.1 | 1.1 |
The Coca-Cola Co. | 2.1 | 2.1 |
Union Pacific Corp. | 2.0 | 2.0 |
Microsoft Corp. | 1.9 | 0.0 |
Pfizer, Inc. | 1.8 | 1.0 |
Amgen, Inc. | 1.8 | 1.6 |
Philip Morris International, Inc. | 1.7 | 2.0 |
| 25.6 | |
Top Five Market Sectors as of June 30, 2012 |
| % of fund's
net assets | % of fund's net assets
6 months ago |
Information Technology | 20.3 | 21.8 |
Health Care | 14.9 | 12.4 |
Consumer Staples | 13.0 | 14.7 |
Financials | 12.4 | 10.9 |
Consumer Discretionary | 10.8 | 10.0 |
Asset Allocation (% of fund's net assets) |
As of June 30, 2012 * | As of December 31, 2011 ** |
| Stocks 95.8% | | | Stocks 99.3% | |
| Convertible
Securities 0.1% | | | Convertible
Securities 0.0% | |
| Short-Term
Investments and
Net Other Assets
(Liabilities) 4.1% | | | Short-Term
Investments and
Net Other Assets
(Liabilities) 0.7% | |
* Foreign investments | 9.2% | | ** Foreign investments | 15.0% | |

Annual Report
Investments June 30, 2012
Showing Percentage of Net Assets
Common Stocks - 95.8% |
| Shares | | Value (000s) |
CONSUMER DISCRETIONARY - 10.8% |
Automobiles - 0.1% |
Harley-Davidson, Inc. | 110,100 | | $ 5,035 |
Hotels, Restaurants & Leisure - 2.1% |
Las Vegas Sands Corp. | 245,600 | | 10,681 |
McDonald's Corp. | 352,300 | | 31,189 |
Starbucks Corp. | 797,498 | | 42,523 |
Yum! Brands, Inc. | 396,700 | | 25,555 |
| | 109,948 |
Household Durables - 1.3% |
D.R. Horton, Inc. | 2,171,000 | | 39,903 |
Ryland Group, Inc. | 1,003,600 | | 25,672 |
| | 65,575 |
Internet & Catalog Retail - 0.8% |
Amazon.com, Inc. (a) | 190,300 | | 43,455 |
Media - 2.2% |
Comcast Corp. Class A | 1,882,200 | | 60,174 |
The Walt Disney Co. | 1,077,400 | | 52,254 |
| | 112,428 |
Multiline Retail - 0.3% |
Dollar General Corp. (a) | 290,800 | | 15,817 |
Specialty Retail - 3.0% |
Bed Bath & Beyond, Inc. (a) | 163,900 | | 10,129 |
Home Depot, Inc. | 868,900 | | 46,043 |
Lowe's Companies, Inc. | 2,044,200 | | 58,137 |
TJX Companies, Inc. | 1,018,900 | | 43,741 |
| | 158,050 |
Textiles, Apparel & Luxury Goods - 1.0% |
Ralph Lauren Corp. | 291,473 | | 40,824 |
VF Corp. | 76,700 | | 10,236 |
| | 51,060 |
TOTAL CONSUMER DISCRETIONARY | | 561,368 |
CONSUMER STAPLES - 13.0% |
Beverages - 2.9% |
Beam, Inc. | 169,300 | | 10,580 |
Dr Pepper Snapple Group, Inc. | 237,300 | | 10,382 |
Grupo Modelo SAB de CV Series C | 2,373,700 | | 20,990 |
The Coca-Cola Co. | 1,413,100 | | 110,490 |
| | 152,442 |
Common Stocks - continued |
| Shares | | Value (000s) |
CONSUMER STAPLES - continued |
Food & Staples Retailing - 2.8% |
CVS Caremark Corp. | 1,356,400 | | $ 63,385 |
Drogasil SA | 1,317,678 | | 13,285 |
Wal-Mart Stores, Inc. | 954,700 | | 66,562 |
| | 143,232 |
Food Products - 1.2% |
Kraft Foods, Inc. Class A | 1,028,100 | | 39,705 |
Mead Johnson Nutrition Co. Class A | 282,500 | | 22,744 |
| | 62,449 |
Household Products - 0.9% |
Colgate-Palmolive Co. | 207,200 | | 21,570 |
Kimberly-Clark Corp. | 323,800 | | 27,125 |
| | 48,695 |
Personal Products - 0.3% |
Herbalife Ltd. | 340,001 | | 16,432 |
Tobacco - 4.9% |
British American Tobacco PLC (United Kingdom) | 608,100 | | 30,916 |
Imperial Tobacco Group PLC | 555,264 | | 21,349 |
Japan Tobacco, Inc. | 1,858,000 | | 55,044 |
Lorillard, Inc. | 417,800 | | 55,129 |
Philip Morris International, Inc. | 1,023,300 | | 89,293 |
| | 251,731 |
TOTAL CONSUMER STAPLES | | 674,981 |
ENERGY - 8.0% |
Energy Equipment & Services - 0.4% |
Ocean Rig UDW, Inc. (United States) | 770,510 | | 10,410 |
Seadrill Ltd. | 301,400 | | 10,706 |
| | 21,116 |
Oil, Gas & Consumable Fuels - 7.6% |
Anadarko Petroleum Corp. | 233,800 | | 15,478 |
Cheniere Energy, Inc. (a) | 782,800 | | 11,538 |
Chevron Corp. | 1,253,700 | | 132,265 |
EV Energy Partners LP | 259,500 | | 13,094 |
Exxon Mobil Corp. | 871,400 | | 74,566 |
Golar LNG Ltd. (NASDAQ) | 284,300 | | 10,718 |
HollyFrontier Corp. | 165,200 | | 5,853 |
InterOil Corp. (a)(d) | 173,900 | | 12,121 |
Marathon Oil Corp. | 450,900 | | 11,530 |
Common Stocks - continued |
| Shares | | Value (000s) |
ENERGY - continued |
Oil, Gas & Consumable Fuels - continued |
Marathon Petroleum Corp. | 565,300 | | $ 25,393 |
Occidental Petroleum Corp. | 421,400 | | 36,143 |
Williams Companies, Inc. | 1,022,000 | | 29,454 |
WPX Energy, Inc. | 755,300 | | 12,221 |
| | 390,374 |
TOTAL ENERGY | | 411,490 |
FINANCIALS - 12.4% |
Capital Markets - 0.5% |
Morgan Stanley | 643,300 | | 9,386 |
T. Rowe Price Group, Inc. | 280,200 | | 17,641 |
| | 27,027 |
Commercial Banks - 5.5% |
M&T Bank Corp. | 171,200 | | 14,136 |
SunTrust Banks, Inc. | 925,400 | | 22,422 |
U.S. Bancorp | 2,611,000 | | 83,970 |
Wells Fargo & Co. | 4,344,567 | | 145,282 |
Zions Bancorporation | 1,028,751 | | 19,978 |
| | 285,788 |
Consumer Finance - 1.5% |
American Express Co. | 567,092 | | 33,010 |
Discover Financial Services | 1,263,400 | | 43,688 |
| | 76,698 |
Diversified Financial Services - 1.8% |
Citigroup, Inc. | 1,240,410 | | 34,000 |
JPMorgan Chase & Co. | 1,611,000 | | 57,561 |
| | 91,561 |
Insurance - 1.1% |
Berkshire Hathaway, Inc. Class B (a) | 418,600 | | 34,882 |
The Chubb Corp. | 298,900 | | 21,766 |
| | 56,648 |
Real Estate Investment Trusts - 2.0% |
American Tower Corp. | 450,400 | | 31,487 |
AvalonBay Communities, Inc. | 190,600 | | 26,966 |
Public Storage | 90,200 | | 13,026 |
Common Stocks - continued |
| Shares | | Value (000s) |
FINANCIALS - continued |
Real Estate Investment Trusts - continued |
Simon Property Group, Inc. | 167,900 | | $ 26,135 |
Weyerhaeuser Co. | 341,800 | | 7,643 |
| | 105,257 |
TOTAL FINANCIALS | | 642,979 |
HEALTH CARE - 14.9% |
Biotechnology - 4.9% |
Acorda Therapeutics, Inc. (a) | 551,237 | | 12,987 |
Alexion Pharmaceuticals, Inc. (a) | 116,600 | | 11,578 |
Amgen, Inc. | 1,277,900 | | 93,338 |
Biogen Idec, Inc. (a) | 389,600 | | 56,250 |
BioMarin Pharmaceutical, Inc. (a) | 356,400 | | 14,106 |
Gilead Sciences, Inc. (a) | 396,400 | | 20,327 |
Theravance, Inc. (a) | 602,900 | | 13,396 |
Vertex Pharmaceuticals, Inc. (a) | 588,500 | | 32,909 |
| | 254,891 |
Health Care Equipment & Supplies - 0.4% |
Covidien PLC | 366,900 | | 19,629 |
Health Care Providers & Services - 2.2% |
Henry Schein, Inc. (a) | 351,300 | | 27,574 |
McKesson Corp. | 433,300 | | 40,622 |
UnitedHealth Group, Inc. | 783,300 | | 45,823 |
| | 114,019 |
Pharmaceuticals - 7.4% |
Allergan, Inc. | 426,900 | | 39,518 |
AVANIR Pharmaceuticals Class A (a)(d) | 1,337,500 | | 5,243 |
Elan Corp. PLC sponsored ADR (a) | 1,598,296 | | 23,319 |
Eli Lilly & Co. | 578,000 | | 24,802 |
GlaxoSmithKline PLC sponsored ADR | 569,400 | | 25,948 |
Johnson & Johnson | 1,160,400 | | 78,397 |
Merck & Co., Inc. | 1,511,300 | | 63,097 |
Perrigo Co. | 222,300 | | 26,216 |
Pfizer, Inc. | 4,121,500 | | 94,795 |
| | 381,335 |
TOTAL HEALTH CARE | | 769,874 |
Common Stocks - continued |
| Shares | | Value (000s) |
INDUSTRIALS - 7.3% |
Aerospace & Defense - 2.7% |
Precision Castparts Corp. | 301,900 | | $ 49,660 |
Textron, Inc. | 1,156,000 | | 28,750 |
United Technologies Corp. | 803,700 | | 60,703 |
| | 139,113 |
Building Products - 0.9% |
Armstrong World Industries, Inc. | 948,400 | | 46,623 |
Owens Corning (a) | 45,000 | | 1,284 |
| | 47,907 |
Construction & Engineering - 0.1% |
Foster Wheeler AG (a) | 228,400 | | 3,958 |
Industrial Conglomerates - 1.4% |
Danaher Corp. | 1,054,600 | | 54,924 |
Tyco International Ltd. | 288,700 | | 15,258 |
| | 70,182 |
Machinery - 0.1% |
Cummins, Inc. | 81,100 | | 7,859 |
Marine - 0.1% |
DryShips, Inc. (a)(d) | 3,601,800 | | 7,888 |
Road & Rail - 2.0% |
Union Pacific Corp. | 857,400 | | 102,296 |
TOTAL INDUSTRIALS | | 379,203 |
INFORMATION TECHNOLOGY - 20.3% |
Communications Equipment - 2.2% |
Motorola Solutions, Inc. | 1,374,000 | | 66,103 |
QUALCOMM, Inc. | 898,300 | | 50,017 |
| | 116,120 |
Computers & Peripherals - 6.8% |
Apple, Inc. (a) | 602,700 | | 351,978 |
Electronic Equipment & Components - 1.0% |
Amphenol Corp. Class A | 971,638 | | 53,362 |
Internet Software & Services - 2.3% |
eBay, Inc. (a) | 813,900 | | 34,192 |
Facebook, Inc. Class B (a)(e) | 260,071 | | 7,284 |
Google, Inc. Class A (a) | 125,100 | | 72,567 |
LinkedIn Corp. (a) | 24,200 | | 2,572 |
| | 116,615 |
Common Stocks - continued |
| Shares | | Value (000s) |
INFORMATION TECHNOLOGY - continued |
IT Services - 2.6% |
Fidelity National Information Services, Inc. | 698,800 | | $ 23,815 |
IBM Corp. | 571,700 | | 111,813 |
| | 135,628 |
Semiconductors & Semiconductor Equipment - 2.3% |
Altera Corp. | 379,800 | | 12,852 |
ASML Holding NV | 907,000 | | 46,638 |
Cymer, Inc. (a) | 18,100 | | 1,067 |
NXP Semiconductors NV (a) | 562,600 | | 13,080 |
ON Semiconductor Corp. (a) | 1,043,000 | | 7,405 |
Samsung Electronics Co. Ltd. | 15,718 | | 16,704 |
Taiwan Semiconductor Manufacturing Co. Ltd. sponsored ADR | 1,597,300 | | 22,298 |
| | 120,044 |
Software - 3.1% |
Check Point Software Technologies Ltd. (a) | 458,000 | | 22,712 |
Citrix Systems, Inc. (a) | 478,900 | | 40,199 |
Microsoft Corp. | 3,142,500 | | 96,129 |
| | 159,040 |
TOTAL INFORMATION TECHNOLOGY | | 1,052,787 |
MATERIALS - 2.4% |
Chemicals - 2.2% |
Eastman Chemical Co. | 535,700 | | 26,983 |
Monsanto Co. | 483,300 | | 40,008 |
Sherwin-Williams Co. | 120,600 | | 15,961 |
W.R. Grace & Co. (a) | 577,200 | | 29,120 |
| | 112,072 |
Metals & Mining - 0.2% |
Goldcorp, Inc. | 325,800 | | 12,266 |
TOTAL MATERIALS | | 124,338 |
TELECOMMUNICATION SERVICES - 2.9% |
Diversified Telecommunication Services - 2.3% |
CenturyLink, Inc. | 533,900 | | 21,084 |
Iliad SA | 120,165 | | 17,374 |
Verizon Communications, Inc. | 1,801,100 | | 80,041 |
| | 118,499 |
Common Stocks - continued |
| Shares | | Value (000s) |
TELECOMMUNICATION SERVICES - continued |
Wireless Telecommunication Services - 0.6% |
Vodafone Group PLC sponsored ADR | 1,126,300 | | $ 31,739 |
TOTAL TELECOMMUNICATION SERVICES | | 150,238 |
UTILITIES - 3.8% |
Electric Utilities - 2.6% |
Duke Energy Corp. | 783,400 | | 18,065 |
Edison International | 529,400 | | 24,458 |
FirstEnergy Corp. | 340,900 | | 16,769 |
NextEra Energy, Inc. | 658,100 | | 45,284 |
PPL Corp. | 397,000 | | 11,041 |
Southern Co. | 366,400 | | 16,964 |
| | 132,581 |
Gas Utilities - 0.7% |
ONEOK, Inc. | 849,200 | | 35,930 |
Multi-Utilities - 0.5% |
Sempra Energy | 393,200 | | 27,084 |
TOTAL UTILITIES | | 195,595 |
TOTAL COMMON STOCKS (Cost $4,320,823) |
4,962,853
|
Convertible Preferred Stocks - 0.1% |
| | | |
INDUSTRIALS - 0.1% |
Aerospace & Defense - 0.1% |
United Technologies Corp. 7.50% (Cost $5,280) | 105,600 | | 5,564 |
Money Market Funds - 4.6% |
| Shares | | Value (000s) |
Fidelity Cash Central Fund, 0.17% (b) | 224,357,552 | | $ 224,358 |
Fidelity Securities Lending Cash Central Fund, 0.18% (b)(c) | 12,150,750 | | 12,151 |
TOTAL MONEY MARKET FUNDS (Cost $236,509) |
236,509
|
TOTAL INVESTMENT PORTFOLIO - 100.5% (Cost $4,562,612) | | 5,204,926 |
NET OTHER ASSETS (LIABILITIES) - (0.5)% | | (26,435) |
NET ASSETS - 100% | $ 5,178,491 |
Legend |
(a) Non-income producing |
(b) Affiliated fund that is available only to investment companies and other accounts managed by Fidelity Investments. The rate quoted is the annualized seven-day yield of the fund at period end. A complete unaudited listing of the fund's holdings as of its most recent quarter end is available upon request. In addition, each Fidelity Central Fund's financial statements, which are not covered by the Fund's Report of Independent Registered Public Accounting Firm, are available on the SEC's website or upon request. |
(c) Investment made with cash collateral received from securities on loan. |
(d) Security or a portion of the security is on loan at period end. |
(e) Restricted securities - Investment in securities not registered under the Securities Act of 1933 (excluding 144A issues). At the end of the period, the value of restricted securities (excluding 144A issues) amounted to $7,284,000 or 0.1% of net assets. |
Additional information on each restricted holding is as follows: |
Security | Acquisition
Date | Acquisition
Cost (000s) |
Facebook, Inc. Class B | 3/31/11 - 5/19/11 | $ 6,504 |
Affiliated Central Funds |
Information regarding fiscal year to date income earned by the Fund from investments in Fidelity Central Funds is as follows: |
Fund | Income earned
(Amounts in thousands) |
Fidelity Cash Central Fund | $ 210 |
Fidelity Securities Lending Cash Central Fund | 489 |
Total | $ 699 |
Other Information |
The following is a summary of the inputs used, as of June 30, 2012, involving the Fund's assets and liabilities carried at fair value. The inputs or methodology used for valuing securities may not be an indication of the risk associated with investing in those securities. For more information on valuation inputs, and their aggregation into the levels used in the tables below, please refer to the Security Valuation section in the accompanying Notes to Financial Statements. |
Valuation Inputs at Reporting Date: |
Description
(Amounts in thousands) | Total | Level 1 | Level 2 | Level 3 |
Investments in Securities: | | | | |
Equities: | | | | |
Consumer Discretionary | $ 561,368 | $ 561,368 | $ - | $ - |
Consumer Staples | 674,981 | 589,021 | 85,960 | - |
Energy | 411,490 | 411,490 | - | - |
Financials | 642,979 | 642,979 | - | - |
Health Care | 769,874 | 769,874 | - | - |
Industrials | 384,767 | 384,767 | - | - |
Information Technology | 1,052,787 | 1,028,799 | 23,988 | - |
Materials | 124,338 | 124,338 | - | - |
Telecommunication Services | 150,238 | 150,238 | - | - |
Utilities | 195,595 | 195,595 | - | - |
Money Market Funds | 236,509 | 236,509 | - | - |
Total Investments in Securities: | $ 5,204,926 | $ 5,094,978 | $ 109,948 | $ - |
See accompanying notes which are an integral part of the financial statements.
Annual Report
Statement of Assets and Liabilities
Amounts in thousands (except per-share amounts) | June 30, 2012 |
| | |
Assets | | |
Investment in securities, at value (including securities loaned of $12,014) - See accompanying schedule: Unaffiliated issuers (cost $4,326,103) | $ 4,968,417 | |
Fidelity Central Funds (cost $236,509) | 236,509 | |
Total Investments (cost $4,562,612) | | $ 5,204,926 |
Cash | | 1 |
Receivable for investments sold | | 42,985 |
Receivable for fund shares sold | | 2,153 |
Dividends receivable | | 7,868 |
Distributions receivable from Fidelity Central Funds | | 109 |
Other receivables | | 252 |
Total assets | | 5,258,294 |
| | |
Liabilities | | |
Payable for investments purchased | $ 49,326 | |
Payable for fund shares redeemed | 15,769 | |
Accrued management fee | 1,462 | |
Other affiliated payables | 847 | |
Other payables and accrued expenses | 248 | |
Collateral on securities loaned, at value | 12,151 | |
Total liabilities | | 79,803 |
| | |
Net Assets | | $ 5,178,491 |
Net Assets consist of: | | |
Paid in capital | | $ 4,755,464 |
Undistributed net investment income | | 31,540 |
Accumulated undistributed net realized gain (loss) on investments and foreign currency transactions | | (250,833) |
Net unrealized appreciation (depreciation) on investments and assets and liabilities in foreign currencies | | 642,320 |
Net Assets | | $ 5,178,491 |
See accompanying notes which are an integral part of the financial statements.
Annual Report
Financial Statements - continued
Statement of Assets and Liabilities - continued
Amounts in thousands (except per-share amounts) | June 30, 2012 |
| | |
Fidelity Fund:
Net Asset Value, offering price and redemption price per share ($4,364,272 ÷ 126,463 shares) | | $ 34.51 |
| | |
Class K:
Net Asset Value, offering price and redemption price per share ($814,219 ÷ 23,586 shares) | | $ 34.52 |
See accompanying notes which are an integral part of the financial statements.
Annual Report
Statement of Operations
Amounts in thousands | Year ended June 30, 2012 |
| | |
Investment Income | | |
Dividends | | $ 87,443 |
Income from Fidelity Central Funds | | 699 |
Total income | | 88,142 |
| | |
Expenses | | |
Management fee | $ 17,974 | |
Transfer agent fees | 9,464 | |
Accounting and security lending fees | 1,092 | |
Custodian fees and expenses | 148 | |
Independent trustees' compensation | 34 | |
Registration fees | 80 | |
Audit | 78 | |
Legal | 38 | |
Miscellaneous | 56 | |
Total expenses before reductions | 28,964 | |
Expense reductions | (385) | 28,579 |
Net investment income (loss) | | 59,563 |
Realized and Unrealized Gain (Loss) Net realized gain (loss) on: | | |
Investment securities: | | |
Unaffiliated issuers | 143,221 | |
Foreign currency transactions | (469) | |
Total net realized gain (loss) | | 142,752 |
Change in net unrealized appreciation (depreciation) on: Investment securities | (169,721) | |
Assets and liabilities in foreign currencies | (75) | |
Total change in net unrealized appreciation (depreciation) | | (169,796) |
Net gain (loss) | | (27,044) |
Net increase (decrease) in net assets resulting from operations | | $ 32,519 |
See accompanying notes which are an integral part of the financial statements.
Annual Report
Financial Statements - continued
Statement of Changes in Net Assets
Amounts in thousands | Year ended
June 30,
2012 | Year ended
June 30,
2011 |
Increase (Decrease) in Net Assets | | |
Operations | | |
Net investment income (loss) | $ 59,563 | $ 48,655 |
Net realized gain (loss) | 142,752 | 481,210 |
Change in net unrealized appreciation (depreciation) | (169,796) | 1,002,664 |
Net increase (decrease) in net assets resulting
from operations | 32,519 | 1,532,529 |
Distributions to shareholders from net investment income | (36,948) | (48,886) |
Share transactions - net increase (decrease) | (552,271) | (586,286) |
Total increase (decrease) in net assets | (556,700) | 897,357 |
| | |
Net Assets | | |
Beginning of period | 5,735,191 | 4,837,834 |
End of period (including undistributed net investment income of $31,540 and undistributed net investment income of $10,601, respectively) | $ 5,178,491 | $ 5,735,191 |
See accompanying notes which are an integral part of the financial statements.
Annual Report
Financial Highlights - Fidelity Fund
Years ended June 30, | 2012 | 2011 | 2010 | 2009 | 2008 |
Selected Per-Share Data | | | | |
Net asset value, beginning of period | $ 34.35 | $ 26.08 | $ 23.95 | $ 35.69 | $ 38.98 |
Income from Investment Operations | | | | | |
Net investment income (loss) B | .37 | .27 E | .23 | .44 | .37 |
Net realized and unrealized gain (loss) | .02 F | 8.27 | 2.25 | (10.77) | (1.65) |
Total from investment operations | .39 | 8.54 | 2.48 | (10.33) | (1.28) |
Distributions from net investment income | (.23) | (.27) | (.35) | (.42) | (.38) |
Distributions from net realized gain | - | - | - | (.99) | (1.63) |
Total distributions | (.23) | (.27) | (.35) | (1.41) | (2.01) |
Net asset value, end of period | $ 34.51 | $ 34.35 | $ 26.08 | $ 23.95 | $ 35.69 |
Total Return A | 1.21% | 32.89% | 10.40% | (29.74)% | (3.73)% |
Ratios to Average Net Assets C, G | | | | |
Expenses before reductions | .58% | .59% | .61% | .64% | .56% |
Expenses net of fee waivers, if any | .58% | .59% | .61% | .64% | .56% |
Expenses net of all reductions | .58% | .58% | .60% | .64% | .55% |
Net investment income (loss) | 1.13% | .86% E | .82% | 1.73% | .98% |
Supplemental Data | | | | |
Net assets, end of period (in millions) | $ 4,364 | $ 5,072 | $ 4,412 | $ 4,442 | $ 7,174 |
Portfolio turnover rate D | 102% | 88% | 77% | 91% | 80% |
A Total returns would have been lower if certain expenses had not been reduced during the applicable periods shown.
B Calculated based on average shares outstanding during the period.
C Fees and expenses of any underlying Fidelity Central Funds are not included in the Fund's expense ratio. The Fund indirectly bears its proportionate share of the expenses of any underlying Fidelity Central Funds.
D Amount does not include the portfolio activity of any underlying Fidelity Central Funds.
E Investment income per share reflects a large, non-recurring dividend which amounted to $.08 per share. Excluding this non-recurring dividend, the ratio of net investment income (loss) to average net assets would have been .60%.
F The amount shown for a share outstanding does not correspond with the aggregate net gain (loss) on investments for the period due to the timing of sales and repurchases of shares in relation to fluctuating market values of the investments of the Fund.
G Expense ratios reflect operating expenses of the class. Expenses before reductions do not reflect amounts reimbursed by the investment adviser or reductions from brokerage service arrangements or reductions from other expense offset arrangements and do not represent the amount paid by the class during periods when reimbursements or reductions occur. Expenses net of fee waivers reflect expenses after reimbursement by the investment adviser but prior to reductions from brokerage service arrangements or other expense offset arrangements. Expenses net of all reductions represent the net expenses paid by the class.
See accompanying notes which are an integral part of the financial statements.
Annual Report
Financial Highlights - Class K
Years ended June 30, | 2012 | 2011 | 2010 | 2009 | 2008 I |
Selected Per-Share Data | | | | |
Net asset value, beginning of period | $ 34.35 | $ 26.08 | $ 23.96 | $ 35.70 | $ 37.54 |
Income from Investment Operations | | | | | |
Net investment income (loss) D | .42 | .32 G | .28 | .42 | .05 |
Net realized and unrealized gain (loss) | .02 H | 8.27 | 2.24 | (10.70) | (1.89) |
Total from investment operations | .44 | 8.59 | 2.52 | (10.28) | (1.84) |
Distributions from net investment income | (.27) | (.32) | (.40) | (.47) | - |
Distributions from net realized gain | - | - | - | (.99) | - |
Total distributions | (.27) | (.32) | (.40) | (1.46) | - |
Net asset value, end of period | $ 34.52 | $ 34.35 | $ 26.08 | $ 23.96 | $ 35.70 |
Total Return B, C | 1.37% | 33.10% | 10.54% | (29.59)% | (4.90)% |
Ratios to Average Net Assets E, J | | | | |
Expenses before reductions | .43% | .43% | .44% | .45% | .43% A |
Expenses net of fee waivers, if any | .43% | .43% | .44% | .45% | .43% A |
Expenses net of all reductions | .42% | .42% | .43% | .45% | .43% A |
Net investment income (loss) | 1.29% | 1.02% G | .99% | 1.92% | 1.00% A |
Supplemental Data | | | | |
Net assets, end of period (000 omitted) | $ 814,219 | $ 662,929 | $ 425,831 | $ 274,168 | $ 95 |
Portfolio turnover rate F | 102% | 88% | 77% | 91% | 80% |
A Annualized
B Total returns for periods of less than one year are not annualized.
C Total returns would have been lower if certain expenses had not been reduced during the applicable periods shown.
D Calculated based on average shares outstanding during the period.
E Fees and expenses of any underlying Fidelity Central Funds are not included in the Fund's expense ratio. The Fund indirectly bears its proportionate share of the expenses of any underlying Fidelity Central Funds.
F Amount does not include the portfolio activity of any underlying Fidelity Central Funds.
G Investment income per share reflects a large, non-recurring dividend which amounted to $.08 per share. Excluding this non-recurring dividend, the ratio of net investment income (loss) to average net assets would have been .76%.
H The amount shown for a share outstanding does not correspond with the aggregate net gain (loss) on investments for the period due to the timing of sales and repurchases of shares in relation to fluctuating market values of the investments of the Fund.
I For the period May 9, 2008 (commencement of sale of shares) to June 30, 2008.
J Expense ratios reflect operating expenses of the class. Expenses before reductions do not reflect amounts reimbursed by the investment adviser or reductions from brokerage service arrangements or reductions from other expense offset arrangements and do not represent the amount paid by the class during periods when reimbursements or reductions occur. Expense ratios before reductions for start-up periods may not be representative of longer-term operating periods. Expenses net of fee waivers reflect expenses after reimbursement by the investment adviser but prior to reductions from brokerage service arrangements or other expense offset arrangements. Expenses net of all reductions represent the net expenses paid by the class.
See accompanying notes which are an integral part of the financial statements.
Annual Report
Notes to Financial Statements
For the period ended June 30, 2012
(Amounts in thousands except percentages)
1. Organization.
Fidelity Fund (the Fund) is a fund of Fidelity Hastings Street Trust (the Trust) and is authorized to issue an unlimited number of shares. The Trust is registered under the Investment Company Act of 1940, as amended (the 1940 Act), as an open-end management investment company organized as a Massachusetts business trust. The Fund offers Fidelity Fund and Class K shares, each of which has equal rights as to assets and voting privileges. Each class has exclusive voting rights with respect to matters that affect that class. Investment income, realized and unrealized capital gains and losses, the common expenses of the Fund, and certain fund-level expense reductions, if any, are allocated on a pro-rata basis to each class based on the relative net assets of each class to the total net assets of the Fund. Each class differs with respect to transfer agent fees incurred. Certain expense reductions may also differ by class.
2. Investments in Fidelity Central Funds.
The Fund invests in Fidelity Central Funds, which are open-end investment companies available only to other investment companies and accounts managed by Fidelity Management & Research Company (FMR) and its affiliates. The Fund's Schedule of Investments lists each of the Fidelity Central Funds held as of period end, if any, as an investment of the Fund, but does not include the underlying holdings of each Fidelity Central Fund. As an Investing Fund, the Fund indirectly bears its proportionate share of the expenses of the underlying Fidelity Central Funds.
The Money Market Central Funds seek preservation of capital and current income and are managed by Fidelity Investments Money Management, Inc. (FIMM), an affiliate of FMR.
A complete unaudited list of holdings for each Fidelity Central Fund is available upon request or at the Securities and Exchange Commission (the SEC) web site at www.sec.gov. In addition, the financial statements of the Fidelity Central Funds, which are not covered by the Fund's Report of Independent Registered Public Accounting Firm, are available on the SEC web site or upon request.
3. Significant Accounting Policies.
The financial statements have been prepared in conformity with accounting principles generally accepted in the United States of America (GAAP), which require management to make certain estimates and assumptions at the date of the financial statements. Actual results could differ from those estimates. Subsequent events, if any, through the date that the financial statements were issued have been evaluated in the preparation of the financial statements. The following summarizes the significant accounting policies of the Fund:
Annual Report
3. Significant Accounting Policies - continued
Security Valuation. Investments are valued as of 4:00 p.m. Eastern time on the last calendar day of the period. In accordance with valuation policies and procedures approved by the Board of Trustees (the Board), the Fund attempts to obtain prices from one or more third party pricing vendor or broker to value its investments. When current market prices, quotations or rates are not readily available or reliable, securities will be fair valued in good faith by the FMR Fair Value Committee (the Committee), in accordance with procedures adopted by the Fund's Board. Factors used in determining fair value vary by security type and may include market or security specific events. The frequency with which these procedures are used cannot be predicted and they may be utilized to a significant extent. The Committee oversees the Fund's valuation policies and procedures and is responsible for approving and reporting to the Board all fair value determinations.
The Fund categorizes the inputs to valuation techniques used to value its investments into a disclosure hierarchy consisting of three levels as shown below:
Level 1 - quoted prices in active markets for identical investments
Level 2 - other significant observable inputs (including quoted prices for similar investments, interest rates, prepayment speeds, etc.)
Level 3 - unobservable inputs (including the Fund's own assumptions based on the best information available)
Valuation techniques used to value the Fund's investments by major category are as follows:
Equity securities, including restricted securities, for which market quotations are readily available, are valued at the last reported sale price or official closing price as reported by a third party pricing vendor on the primary market or exchange on which they are traded and are categorized as Level 1 in the hierarchy. In the event there were no sales during the day or closing prices are not available, securities are valued at the last quoted bid price or may be valued using the last available price and are generally categorized as Level 2 in the hierarchy. For foreign equity securities, when significant market or security specific events arise, comparisons to the valuation of American Depositary Receipts (ADRs), futures contracts, Exchange-Traded Funds (ETFs) and certain indexes as well as quoted prices for similar securities are used and are categorized as Level 2 in the hierarchy. Utilizing these techniques may result in transfers between Level 1 and Level 2. For restricted equity securities and private placements where observable inputs are limited, assumptions about market activity and risk are used and these securities are categorized as Level 3 in the hierarchy.
Annual Report
Notes to Financial Statements - continued
(Amounts in thousands except percentages)
3. Significant Accounting Policies - continued
Security Valuation - continued
Investments in open-end mutual funds, including the Fidelity Central Funds, are valued at their closing net asset value each business day and are categorized as Level 1 in the hierarchy.
Changes in valuation techniques may result in transfers in or out of an assigned level within the disclosure hierarchy. The aggregate value of investments by input level, as of June 30, 2012, is included at the end of the Fund's Schedule of Investments.
Foreign Currency Translation. The Fund may use foreign currency contracts to facilitate transactions in foreign-denominated securities. Gains and losses from these transactions may arise from changes in the value of the foreign currency or if the counterparties do not perform under the contracts' terms.
Foreign-denominated assets, including investment securities, and liabilities are translated into U.S. dollars at the exchange rates at period end. Purchases and sales of investment securities, income and dividends received and expenses denominated in foreign currencies are translated into U.S. dollars at the exchange rate in effect on the transaction date.
The effects of exchange rate fluctuations on investments are included with the net realized and unrealized gain (loss) on investment securities. Other foreign currency transactions resulting in realized and unrealized gain (loss) are disclosed separately.
Investment Transactions and Income. For financial reporting purposes, the Fund's investment holdings and NAV include trades executed through the end of the last business day of the period. The NAV per share for processing shareholder transactions is calculated as of the close of business of the New York Stock Exchange (NYSE), normally 4:00 p.m. Eastern time and includes trades executed through the end of the prior business day. Gains and losses on securities sold are determined on the basis of identified cost and may include proceeds received from litigation. Dividend income is recorded on the ex-dividend date, except for certain dividends from foreign securities where the ex-dividend date may have passed, which are recorded as soon as the Fund is informed of the ex-dividend date. Non-cash dividends included in dividend income, if any, are recorded at the fair market value of the securities received. Distributions received on securities that represent a return of capital or capital gain are recorded as a reduction of cost of investments and/or as a realized gain. The Fund estimates the components of distributions received that may be considered return of capital distributions or capital gain distributions. Interest income and distributions from the Fidelity Central Funds are accrued as earned. Interest income includes coupon interest and amortization of
Annual Report
3. Significant Accounting Policies - continued
Investment Transactions and Income - continued
premium and accretion of discount on debt securities. Investment income is recorded net of foreign taxes withheld where recovery of such taxes is uncertain.
Expenses. Expenses directly attributable to a fund are charged to that fund. Expenses attributable to more than one fund are allocated among the respective funds on the basis of relative net assets or other appropriate methods. Expense estimates are accrued in the period to which they relate and adjustments are made when actual amounts are known.
Deferred Trustee Compensation. Under a Deferred Compensation Plan (the Plan), independent Trustees may elect to defer receipt of a portion of their annual compensation. Deferred amounts are invested in a cross-section of Fidelity funds, are marked-to-market and remain in the Fund until distributed in accordance with the Plan. The investment of deferred amounts and the offsetting payable to the Trustees are included in the accompanying Statement of Assets and Liabilities.
Income Tax Information and Distributions to Shareholders. Each year, the Fund intends to qualify as a regulated investment company under Subchapter M of the Internal Revenue Code, including distributing substantially all of its taxable income and realized gains. As a result, no provision for income taxes is required. As of June 30, 2012, the Fund did not have any unrecognized tax benefits in the financial statements; nor is the Fund aware of any tax positions for which it is reasonably possible that the total amounts of unrecognized tax benefits will significantly change in the next twelve months. The Fund files a U.S. federal tax return, in addition to state and local tax returns as required. A fund's federal income tax returns are subject to examination by the Internal Revenue Service (IRS) for a period of three fiscal years after they are filed. State and local tax returns may be subject to examination for an additional fiscal year depending on the jurisdiction. Foreign taxes are provided for based on the Fund's understanding of the tax rules and rates that exist in the foreign markets in which it invests.
Distributions are declared and recorded on the ex-dividend date. Income dividends and capital gain distributions are declared separately for each class. Income and capital gain distributions are determined in accordance with income tax regulations, which may differ from GAAP.
Capital accounts within the financial statements are adjusted for permanent book-tax differences. These adjustments have no impact on net assets or the results of operations. Temporary book-tax differences will reverse in a subsequent period.
Annual Report
Notes to Financial Statements - continued
(Amounts in thousands except percentages)
3. Significant Accounting Policies - continued
Income Tax Information and Distributions to Shareholders - continued
Book-tax differences are primarily due to equity-debt classifications, foreign currency transactions, deferred trustees compensation, partnerships, capital loss carryforwards, losses deferred due to wash sales and excise tax regulations.
The federal tax cost of investment securities and unrealized appreciation (depreciation) as of period end were as follows:
Gross unrealized appreciation | $ 756,255 |
Gross unrealized depreciation | (133,447) |
Net unrealized appreciation (depreciation) on securities and other investments | $ 622,808 |
| |
Tax Cost | $ 4,582,118 |
The tax-based components of distributable earnings as of period end were as follows:
Undistributed ordinary income | $ 31,722 |
Capital loss carryforward | $ (185,683) |
Net unrealized appreciation (depreciation) | $ 622,814 |
Capital loss carryforwards are only available to offset future capital gains of the Fund to the extent provided by regulations and may be limited. Under the Regulated Investment Company Modernization Act of 2010 (the Act), the Fund is permitted to carry forward capital losses incurred in taxable years beginning after December 22, 2010 for an unlimited period and such capital losses are required to be used prior to any losses that expire. Capital loss carryforwards were as follows:
Fiscal year of expiration | |
2018 | $ (185,683) |
The tax character of distributions paid was as follows:
| June 30, 2012 | June 30, 2011 |
Ordinary Income | $ 36,948 | $ 48,886 |
New Accounting Pronouncement. In December 2011, the Financial Accounting Standards Board issued Accounting Standard Update No. 2011-11, Disclosures about Offsetting Assets and Liabilities. The update creates new disclosure requirements requiring entities to disclose both gross and net information for derivatives and other financial instruments that are either offset in the Statement of Assets and Liabilities or subject to an enforceable master netting arrangement or similar agreement. The
Annual Report
3. Significant Accounting Policies - continued
New Accounting Pronouncement - continued
disclosure requirements are effective for interim and annual reporting periods beginning on or after January 1, 2013. Management is currently evaluating the impact of the update's adoption on the Fund's financial statement disclosures.
4. Operating Policies.
Restricted Securities. The Fund may invest in securities that are subject to legal or contractual restrictions on resale. These securities generally may be resold in transactions exempt from registration or to the public if the securities are registered. Disposal of these securities may involve time-consuming negotiations and expense, and prompt sale at an acceptable price may be difficult. Information regarding restricted securities is included at the end of the Fund's Schedule of Investments.
5. Purchases and Sales of Investments.
Purchases and sales of securities, other than short-term securities, aggregated $5,156,968 and $5,761,734, respectively.
6. Fees and Other Transactions with Affiliates.
Management Fee. FMR and its affiliates provide the Fund with investment management related services for which the Fund pays a monthly management fee. The management fee is the sum of an individual fund fee rate that is based on an annual rate of .09% of the Fund's average net assets and an annualized group fee rate that averaged .26% during the period. The group fee rate is based upon the average net assets of all the mutual funds advised by FMR. The group fee rate decreases as assets under management increase and increases as assets under management decrease. For the period, the total annual management fee rate was .35% of the Fund's average net assets.
Transfer Agent Fees. Fidelity Investments Institutional Operations Company, Inc. (FIIOC), an affiliate of FMR, is the transfer, dividend disbursing and shareholder servicing agent for each class of the Fund. FIIOC receives account fees and asset-based fees that vary according to the account size and type of account of the shareholders of Fidelity Fund. FIIOC receives an asset-based fee of Class K's average net assets. FIIOC pays for
Annual Report
Notes to Financial Statements - continued
(Amounts in thousands except percentages)
6. Fees and Other Transactions with Affiliates - continued
Transfer Agent Fees - continued
typesetting, printing and mailing of shareholder reports, except proxy statements. For the period, transfer agent fees for each class were as follows:
| Amount | % of
Average
Net Assets |
Fidelity Fund | 9,101 | .20 |
Class K | 363 | .05 |
| $ 9,464 | |
Accounting and Security Lending Fees. Fidelity Service Company, Inc. (FSC), an affiliate of FMR, maintains the Fund's accounting records. The accounting fee is based on the level of average net assets for each month. Under a separate contract, FSC administers the security lending program. The security lending fee is based on the number and duration of lending transactions.
Brokerage Commissions. The Fund placed a portion of its portfolio transactions with brokerage firms which are affiliates of the investment adviser. The commissions paid to these affiliated firms were $123 for the period.
7. Committed Line of Credit.
The Fund participates with other funds managed by FMR or an affiliate in a $4.25 billion credit facility (the "line of credit") to be utilized for temporary or emergency purposes to fund shareholder redemptions or for other short-term liquidity purposes. The Fund has agreed to pay commitment fees on its pro-rata portion of the line of credit, which amounted to $15 and is reflected in Miscellaneous expenses on the Statement of Operations. During the period, there were no borrowings on this line of credit.
8. Security Lending.
The Fund lends portfolio securities through a lending agent from time to time in order to earn additional income. For equity securities, a lending agent is used and may loan securities to certain qualified borrowers, including Fidelity Capital Markets (FCM), a broker-dealer affiliated with the Fund. On the settlement date of the loan, the Fund receives collateral (in the form of U.S. Treasury obligations, letters of credit and/or cash) against the loaned securities and maintains collateral in an amount not less than 100% of the market value of the loaned securities during the period of the loan. The market value of the loaned securities is determined at the close of business of the Fund and any additional required collateral is delivered to the Fund on the next business day. If the borrower defaults on its obligation to return the securities loaned because of insolvency
Annual Report
8. Security Lending - continued
or other reasons, a fund could experience delays and costs in recovering the securities loaned or in gaining access to the collateral. Any cash collateral received is invested in the Fidelity Securities Lending Cash Central Fund. The value of loaned securities and cash collateral at period end are disclosed on the Fund's Statement of Assets and Liabilities. Security lending income represents the income earned on investing cash collateral, less rebates paid to borrowers and any lending agent fees associated with the loan, plus any premium payments received for lending certain types of securities. Security lending income is presented in the Statement of Operations as a component of income from Fidelity Central Funds. Total security lending income during the period amounted to $489, including $2 from securities loaned to FCM.
9. Expense Reductions.
FMR voluntarily agreed to reimburse a portion of the Fund's operating expenses. During the period, this reimbursement reduced the fund's expenses by $47.
Many of the brokers with whom FMR places trades on behalf of the Fund provided services to the Fund in addition to trade execution. These services included payments of certain expenses on behalf of the Fund totaling $338 for the period.
In addition, through arrangements with each class' transfer agent, credits realized as a result of uninvested U.S. dollar cash balances were used to reduce the Fund's expenses. During the period, these credits reduced Class K's transfer agent expense by four-hundred and ninety seven dollars.
10. Distributions to Shareholders.
Distributions to shareholders of each class were as follows:
Years ended June 30, | 2012 | 2011 |
From net investment income | | |
Fidelity Fund | $ 31,576 | $ 43,443 |
Class K | 5,372 | 5,443 |
Total | $ 36,948 | $ 48,886 |
11. Share Transactions.
Transactions for each class of shares were as follows:
| Shares | Dollars |
Years ended June 30, | 2012 | 2011 | 2012 | 2011 |
Fidelity Fund | | | | |
Shares sold | 9,192 | 12,228 | $ 299,999 | $ 381,793 |
Reinvestment of distributions | 967 | 1,352 | 29,465 | 40,642 |
Shares redeemed | (31,358) | (35,089) | (1,019,919) | (1,103,552) |
Net increase (decrease) | (21,199) | (21,509) | $ (690,455) | $ (681,117) |
Annual Report
Notes to Financial Statements - continued
(Amounts in thousands except percentages)
11. Share Transactions - continued
| Shares | Dollars |
Years ended June 30, | 2012 | 2011 | 2012 | 2011 |
Class K | | | | |
Shares sold | 9,901 | 6,007 | $ 323,105 | $ 189,048 |
Reinvestment of distributions | 176 | 180 | 5,372 | 5,443 |
Shares redeemed | (5,788) | (3,216) | (190,293) | (99,660) |
Net increase (decrease) | 4,289 | 2,971 | $ 138,184 | $ 94,831 |
12. Other.
The Fund's organizational documents provide former and current trustees and officers with a limited indemnification against liabilities arising in connection with the performance of their duties to the Fund. In the normal course of business, the Fund may also enter into contracts that provide general indemnifications. The Fund's maximum exposure under these arrangements is unknown as this would be dependent on future claims that may be made against the Fund. The risk of material loss from such claims is considered remote.
Annual Report
To the Trustees of Fidelity Hastings Street Trust and the Shareholders of Fidelity Fund:
In our opinion, the accompanying statement of assets and liabilities, including the schedule of investments, and the related statements of operations and of changes in net assets and the financial highlights present fairly, in all material respects, the financial position of Fidelity Fund (a fund of Fidelity Hastings Street Trust) at June 30, 2012, the results of its operations for the year then ended, the changes in its net assets for each of the two years in the period then ended and the financial highlights for each of the periods indicated, in conformity with accounting principles generally accepted in the United States of America. These financial statements and financial highlights (hereafter referred to as "financial statements") are the responsibility of the Fidelity Fund's management. Our responsibility is to express an opinion on these financial statements based on our audits. We conducted our audits of these financial statements in accordance with the standards of the Public Company Accounting Oversight Board (United States). Those standards require that we plan and perform the audit to obtain reasonable assurance about whether the financial statements are free of material misstatement. An audit includes examining, on a test basis, evidence supporting the amounts and disclosures in the financial statements, assessing the accounting principles used and significant estimates made by management, and evaluating the overall financial statement presentation. We believe that our audits, which included confirmation of securities at June 30, 2012 by correspondence with the custodian and brokers, provide a reasonable basis for our opinion.
/s/ PricewaterhouseCoopers LLP
PricewaterhouseCoopers LLP
Boston, Massachusetts
August 14, 2012
Annual Report
The Trustees, Members of the Advisory Board, and executive officers of the trust and fund, as applicable, are listed below. The Board of Trustees governs the fund and is responsible for protecting the interests of shareholders. The Trustees are experienced executives who meet periodically throughout the year to oversee the fund's activities, review contractual arrangements with companies that provide services to the fund, oversee management of the risks associated with such activities and contractual arrangements, and review the fund's performance. Except for James C. Curvey, each of the Trustees oversees 228 funds advised by FMR or an affiliate. Mr. Curvey oversees 435 funds advised by FMR or an affiliate.
The Trustees hold office without limit in time except that (a) any Trustee may resign; (b) any Trustee may be removed by written instrument, signed by at least two-thirds of the number of Trustees prior to such removal; (c) any Trustee who requests to be retired or who has become incapacitated by illness or injury may be retired by written instrument signed by a majority of the other Trustees; and (d) any Trustee may be removed at any special meeting of shareholders by a two-thirds vote of the outstanding voting securities of the trust. Each Trustee who is not an interested person (as defined in the 1940 Act) (Independent Trustee), shall retire not later than the last day of the calendar year in which his or her 75th birthday occurs. The Independent Trustees may waive this mandatory retirement age policy with respect to individual Trustees. The executive officers and Advisory Board Members hold office without limit in time, except that any officer and Advisory Board Member may resign or may be removed by a vote of a majority of the Trustees at any regular meeting or any special meeting of the Trustees. Except as indicated, each individual has held the office shown or other offices in the same company for the past five years.
Experience, Skills, Attributes, and Qualifications of the Fund's Trustees. The Governance and Nominating Committee has adopted a statement of policy that describes the experience, qualifications, attributes, and skills that are necessary and desirable for potential Independent Trustee candidates (Statement of Policy). The Board believes that each Trustee satisfied at the time he or she was initially elected or appointed a Trustee, and continues to satisfy, the standards contemplated by the Statement of Policy. The Governance and Nominating Committee also engages professional search firms to help identify potential Independent Trustee candidates who have the experience, qualifications, attributes, and skills consistent with the Statement of Policy. From time to time, additional criteria based on the composition and skills of the current Independent Trustees, as well as experience or skills that may be appropriate in light of future changes to board composition, business conditions, and regulatory or other developments, have also been considered by the professional search firms and the Governance and Nominating Committee. In addition, the Board takes into account the Trustees' commitment and participation in Board and committee meetings, as well as their leadership of standing and ad hoc committees throughout their tenure.
In determining that a particular Trustee was and continues to be qualified to serve as a Trustee, the Board has considered a variety of criteria, none of which, in isolation, was controlling. The Board believes that, collectively, the Trustees have balanced and diverse experience, qualifications, attributes, and skills, which allow the Board to operate effectively in governing the fund and protecting the interests of shareholders. Information about the specific experience, skills, attributes, and qualifications of each Trustee, which in each case led to the Board's conclusion that the Trustee should serve (or continue to serve) as a trustee of the fund, is provided below.
Annual Report
Board Structure and Oversight Function. James C. Curvey is an interested person (as defined in the 1940 Act) and currently serves as Chairman. The Trustees have determined that an interested Chairman is appropriate and benefits shareholders because an interested Chairman has a personal and professional stake in the quality and continuity of services provided to the fund. Independent Trustees exercise their informed business judgment to appoint an individual of their choosing to serve as Chairman, regardless of whether the Trustee happens to be independent or a member of management. The Independent Trustees have determined that they can act independently and effectively without having an Independent Trustee serve as Chairman and that a key structural component for assuring that they are in a position to do so is for the Independent Trustees to constitute a substantial majority for the Board. The Independent Trustees also regularly meet in executive session. Ned C. Lautenbach serves as Chairman of the Independent Trustees and as such (i) acts as a liaison between the Independent Trustees and management with respect to matters important to the Independent Trustees and (ii) with management prepares agendas for Board meetings.
Fidelity funds are overseen by different Boards of Trustees. The fund's Board oversees Fidelity's equity and high income funds and another Board oversees Fidelity's investment-grade bond, money market, and asset allocation funds. The asset allocation funds may invest in Fidelity funds overseen by the fund's Board. The use of separate Boards, each with its own committee structure, allows the Trustees of each group of Fidelity funds to focus on the unique issues of the funds they oversee, including common research, investment, and operational issues. On occasion, the separate Boards establish joint committees to address issues of overlapping consequences for the Fidelity funds overseen by each Board.
The Trustees operate using a system of committees to facilitate the timely and efficient consideration of all matters of importance to the Trustees, the fund, and fund shareholders and to facilitate compliance with legal and regulatory requirements and oversight of the fund's activities and associated risks. The Board, acting through its committees, has charged FMR and its affiliates with (i) identifying events or circumstances the occurrence of which could have demonstrably adverse effects on the fund's business and/or reputation; (ii) implementing processes and controls to lessen the possibility that such events or circumstances occur or to mitigate the effects of such events or circumstances if they do occur; and (iii) creating and maintaining a system designed to evaluate continuously business and market conditions in order to facilitate the identification and implementation processes described in (i) and (ii) above. Because the day-to-day operations and activities of the fund are carried out by or through FMR, its affiliates and other service providers, the fund's exposure to risks is mitigated but not eliminated by the processes overseen by the Trustees. While each of the Board's committees has responsibility for overseeing different aspects of the fund's activities, oversight is exercised primarily through the Operations, Audit, and Compliance Committees. In addition, the Independent Trustees have worked with FMR to enhance the Board's oversight of investment and financial risks, legal and regulatory risks, technology risks, and operational risks, including the development of additional risk reporting to the Board. For example, a working group comprised of Independent Trustees and FMR has worked and continues to work to review the Fidelity funds' valuation-related activities, reporting and risk management. Appropriate personnel, including but not limited to the fund's Chief Compliance Officer (CCO), FMR's internal auditor, the independent accountants, the fund's Treasurer and portfolio management personnel, make periodic reports to the Board's committees, as appropriate, including an annual review of FMR's risk management program for the Fidelity funds. The responsibilities of each standing committee, including their oversight responsibilities, are described further under "Standing Committees of the Fund's Trustees."
Annual Report
Trustees and Officers - continued
The fund's Statement of Additional Information (SAI) includes more information about the Trustees. To request a free copy, call Fidelity at 1-800-835-5092.
Correspondence intended for each Trustee who is an interested person may be sent to Fidelity Investments, 82 Devonshire Street, Boston, Massachusetts 02109.
Name, Age; Principal Occupations and Other Relevant Experience+ |
James C. Curvey (77) |
| Year of Election or Appointment: 2007 Mr. Curvey is Trustee and Chairman of the Board of Trustees of certain Trusts. Mr. Curvey also serves as Trustee (2007-present) of other investment companies advised by FMR. Mr. Curvey is a Director of Fidelity Investments Money Management, Inc. (2009-present), Director of Fidelity Research & Analysis Co. (2009-present) and Director of FMR and FMR Co., Inc. (2007-present). Mr. Curvey is also Vice Chairman (2007-present) and Director of FMR LLC. In addition, Mr. Curvey serves as an Overseer for the Boston Symphony Orchestra and a member of the Trustees of Villanova University. Previously, Mr. Curvey was the Vice Chairman (2006-2007) and Director (2000-2007) of FMR Corp. |
Ronald P. O'Hanley (55) |
| Year of Election or Appointment: 2011 Mr. O'Hanley is Director of FMR Co., Inc. (2010-present), Director of Fidelity Investments Money Management, Inc. (2010-present), Director of Fidelity Research & Analysis Company (2010-present), President of Fidelity Asset Management and Corporate Services and a member of Fidelity's Executive Committee (2010-present). Previously, Mr. O'Hanley served as President and Chief Executive Officer of BNY Mellon Asset Management (2007-2010). Mr. O'Hanley also served as Vice Chairman of Bank New York Mellon Corp. and a member of that firm's Executive Committee. Prior to the 2007 merger of The Bank of New York and Mellon Financial Corporation, he was Vice Chairman of Mellon Financial Corporation and President and Chief Executive Officer of Mellon Asset Management. He joined Mellon in February 1997. Mr. O'Hanley currently serves as Chairman of the Boston Public Library Foundation Board of Directors and sits on the Board of Directors of Beth Israel Deaconess Medical Center, the Board of Trustees of the Marine Biological Laboratory and the Advisory Board of the Maxwell School of Citizenship and Public Administration at Syracuse University. Mr. O'Hanley also chairs the Council on Asset Management for the Financial Services Roundtable and is a member of the Board of Directors of Institutional Investor's U.S. Institute. |
* Trustees have been determined to be "Interested Trustees" by virtue of, among other things, their affiliation with the trust or various entities under common control with FMR.
+ The information above includes each Trustee's principal occupation during the last five years and other information relating to the experience, attributes, and skills relevant to each Trustee's qualifications to serve as a Trustee, which led to the conclusion that each Trustee should serve as a Trustee for the fund.
Annual Report
Trustees and Officers - continued
Independent Trustees:
Correspondence intended for each Independent Trustee (that is, the Trustees other than the Interested Trustees) may be sent to Fidelity Investments, P.O. Box 55235, Boston, Massachusetts 02205-5235.
Name, Age; Principal Occupations and Other Relevant Experience+ |
Dennis J. Dirks (64) |
| Year of Election or Appointment: 2005 Prior to his retirement in May 2003, Mr. Dirks was Chief Operating Officer and a member of the Board of The Depository Trust & Clearing Corporation (DTCC). He also served as President, Chief Operating Officer, and Board member of The Depository Trust Company (DTC) and President and Board member of the National Securities Clearing Corporation (NSCC). In addition, Mr. Dirks served as Chief Executive Officer and Board member of the Government Securities Clearing Corporation, Chief Executive Officer and Board member of the Mortgage-Backed Securities Clearing Corporation, as a Trustee and a member of the Finance Committee of Manhattan College (2005-2008), and as a Trustee and a member of the Finance Committee of AHRC of Nassau County (2006-2008). Mr. Dirks is a member of the Independent Directors Council (IDC) Governing Council (2010-present) and Board of Directors for The Brookville Center for Children's Services, Inc. (2009-present). |
Alan J. Lacy (58) |
| Year of Election or Appointment: 2008 Mr. Lacy serves as Senior Adviser (2007-present) of Oak Hill Capital Partners, L.P. (private equity). Mr. Lacy also served as Chief Executive Officer (2000-2005) and Vice Chairman (2005-2006) of Sears Holdings Corporation and Sears, Roebuck and Co. (retail). In addition, Mr. Lacy serves as a member of the Board of Directors of Dave & Buster's, Inc. (restaurant and entertainment complexes, 2010-present), The Hillman Companies, Inc. (hardware wholesalers, 2010-present), and Bristol-Myers Squibb Company (global pharmaceuticals, 2007-present). Mr. Lacy is a member of the Board of Trustees of The National Parks Conservation Association (2006-present). Previously, Mr. Lacy served as Chairman of the Board of Trustees of the National Parks Conservation Association (2008-2011) and as a member of the Board of Directors for the Western Union Company (global money transfer, 2006-2011). |
Ned C. Lautenbach (68) |
| Year of Election or Appointment: 2000 Mr. Lautenbach is Chairman of the Independent Trustees of the Equity and High Income Funds (2006-present). Mr. Lautenbach currently serves as the Lead Director of the Eaton Corporation Board of Directors (diversified industrial, 1997-present). Mr. Lautenbach is also a member of the Board of Directors of the Philharmonic Center for the Arts in Naples, Florida (1999-present); a member of the Board of Trustees of Fairfield University (2005-present); and a member of the Council on Foreign Relations (1994-present). Previously, Mr. Lautenbach was a Partner/Advisory Partner at Clayton, Dubilier & Rice, LLC (private equity investment, 1998-2010), as well as a Director of Sony Corporation (2006-2007). |
Joseph Mauriello (67) |
| Year of Election or Appointment: 2008 Prior to his retirement in January 2006, Mr. Mauriello served in numerous senior management positions including Deputy Chairman and Chief Operating Officer (2004-2005), and Vice Chairman of Financial Services (2002-2004) of KPMG LLP US (professional services, 1965-2005). Mr. Mauriello currently serves as a member of the Board of Directors of XL Group plc. (global insurance and re-insurance, 2006-present). Previously, Mr. Mauriello served as a Director of the Hamilton Funds of the Bank of New York (2006-2007) and Arcadia Resources Inc. (health care services and products, 2007-2012). |
Robert W. Selander (61) |
| Year of Election or Appointment: 2011 Previously, Mr. Selander served as a Member of the Advisory Board of Fidelity's Equity and High Income Funds (2011), Executive Vice Chairman (2010), Chief Executive Officer (2009-2010), and President and Chief Executive Officer (1997-2009) of Mastercard, Inc. |
Cornelia M. Small (67) |
| Year of Election or Appointment: 2005 Ms. Small is a member of the Board of Directors of the Teagle Foundation (2009-present). Ms. Small is also a member of the Investment Committee, and Chair (2008-present) and a member of the Board of Trustees of Smith College. In addition, Ms. Small serves on the Investment Committee of the Berkshire Taconic Community Foundation (2008-present). Previously, Ms. Small served as Chairperson of the Investment Committee (2002-2008) of Smith College. In addition, Ms. Small served as Chief Investment Officer, Director of Global Equity Investments, and a member of the Board of Directors of Scudder, Stevens & Clark and Scudder Kemper Investments. |
William S. Stavropoulos (73) |
| Year of Election or Appointment: 2001 Mr. Stavropoulos is Vice Chairman of the Independent Trustees of the Equity and High Income Funds (2006-present). Mr. Stavropoulos serves as President and Founder of the Michigan Baseball Foundation, the Great Lakes Loons (2007-present). Mr. Stavropoulos is Chairman Emeritus of the Board of Directors of The Dow Chemical Company, where he previously served in numerous senior management positions, including President, CEO (1995-2000; 2002-2004), Chairman of the Executive Committee (2000-2006), and as a member of the Board of Directors (1990-2006). Currently, Mr. Stavropoulos is Chairman of Univar (global distributor of commodity and specialty chemicals, 2010-present), a Director of Teradata Corporation (data warehousing and technology solutions, 2008-present), Chemical Financial Corporation, Maersk Inc. (industrial conglomerate), Tyco International, Inc. (multinational manufacturing and services, 2007-present), and a member of the Advisory Board for Metalmark Capital (private equity investment, 2005-present). Mr. Stavropoulos is a special advisor to Clayton, Dubilier & Rice, LLC (private equity investment). In addition, Mr. Stavropoulos is a member of the University of Notre Dame Advisory Council for the College of Science. |
David M. Thomas (63) |
| Year of Election or Appointment: 2008 Previously, Mr. Thomas served as Executive Chairman (2005-2006) and Chairman and Chief Executive Officer (2000-2005) of IMS Health, Inc. (pharmaceutical and healthcare information solutions). In addition, Mr. Thomas serves as a member of the Board of Directors of Fortune Brands, Inc. (consumer products), and Interpublic Group of Companies, Inc. (marketing communication, 2004-present). |
Michael E. Wiley (61) |
| Year of Election or Appointment: 2008 Mr. Wiley also serves as a Director of Asia Pacific Exploration Consolidated (international oil and gas exploration and production, 2008-present). Mr. Wiley serves as a Director of Tesoro Corporation (independent oil refiner and marketer, 2005-present), and a Director of Bill Barrett Corporation (exploration and production, 2005-present). In addition, Mr. Wiley also serves as a Director of Post Oak Bank (privately-held bank, 2004-present). Previously, Mr. Wiley served as a member of the Board of Trustees of the University of Tulsa (2000-2006; 2007-2010), as a Senior Energy Advisor of Katzenbach Partners, LLC (consulting, 2006-2007), as an Advisory Director of Riverstone Holdings (private investment), Chairman, President, and CEO of Baker Hughes, Inc. (oilfield services, 2000-2004), and as Director of Spinnaker Exploration Company (exploration and production, 2001-2005). |
Annual Report
+ The information above includes each Trustee's principal occupation during the last five years and other information relating to the experience, attributes, and skills relevant to each Trustee's qualifications to serve as a Trustee, which led to the conclusion that each Trustee should serve as a Trustee for the fund.
Advisory Board Members and Executive Officers:
Correspondence intended for David A. Rosow and Garnett A. Smith may be sent to Fidelity Investments, P.O. Box 55235, Boston, Massachusetts 02205-5235. Correspondence intended for each executive officer, and Edward C. Johnson 3d and Peter S. Lynch may be sent to Fidelity Investments, 82 Devonshire Street, Boston, Massachusetts 02109.
Name, Age; Principal Occupation |
Edward C. Johnson 3d (82) |
| Year of Election or Appointment: 2011 Member of the Advisory Board of Fidelity's Equity and High Income Funds. Mr. Johnson serves as Chief Executive Officer, Chairman, and a Director of FMR LLC, and also serves as Chairman and Director of FIL Limited. Previously, Mr. Johnson served as a Trustee and Chairman of the Board of certain Fidelity Trusts, Chairman and a Director of FMR, Chairman and a Director of FMR Co., Inc., and President of FMR LLC (2006-2007). |
Peter S. Lynch (68) |
| Year of Election or Appointment: 2003 Member of the Advisory Board of Fidelity's Equity and High Income Funds. Mr. Lynch is Vice Chairman and a Director of FMR and FMR Co., Inc. In addition, Mr. Lynch serves as a Trustee of Boston College and as the Chairman of the Inner-City Scholarship Fund. Previously, Mr. Lynch served on the Special Olympics International Board of Directors (1997-2006). |
David A. Rosow (69) |
| Year of Election or Appointment: 2012 Member of the Advisory Board of Fidelity's Equity and High Income Funds. Chairman and Chief Executive Officer of International Golf Group, Inc. (golf course development, 1990-present). Previously, Mr. Rosow served as Chairman and Chief Executive Officer of Rosow & Company, Inc. (private investment company, 1989-2011), a Lead Director of Hudson United Bancorp (2001-2006) and as a Director of TD Banknorth (1996-2006). In addition, Mr. Rosow is a member (2008-present) and President (2009-present) of the Town Council of Palm Beach, Florida. |
Garnett A. Smith (64) |
| Year of Election or Appointment: 2012 Member of the Advisory Board of Fidelity's Equity and High Income Funds. Prior to Mr. Smith's retirement, he served as Chairman and Chief Executive Officer of Inbrand Corp. (manufacturer of personal absorbent products, 1990-1997). He also served as President (1986-1990) of Inbrand Corp. Prior to his employment with Inbrand Corp., he was employed by a retail fabric chain and North Carolina National Bank. In addition, Mr. Smith is a board member of the Jackson Hole Land Trust (2009-present). |
Kenneth B. Robins (42) |
| Year of Election or Appointment: 2008 President and Treasurer of Fidelity's Equity and High Income Funds. Mr. Robins also serves as President and Treasurer (2010-present) and Assistant Treasurer (2009-present) of other Fidelity funds and is an employee of Fidelity Investments (2004-present). Previously, Mr. Robins served as Deputy Treasurer of the Fidelity funds (2005-2008) and Treasurer and Chief Financial Officer of The North Carolina Capital Management Trust: Cash and Term Portfolios (2006-2008). |
Bruce T. Herring (46) |
| Year of Election or Appointment: 2006 Vice President of certain Equity Funds. Mr. Herring also serves as President of Fidelity Research & Analysis Company (2010-present), Chief Investment Officer and Director of Fidelity Management & Research (U.K.) Inc. (2010-present) and Group Chief Investment Officer of FMR. Previously, Mr. Herring served as Vice President (2005-2006) and Senior Vice President (2006-2007) of Fidelity Management & Research Company, Vice President of FMR Co., Inc. (2001-2007) and as a portfolio manager for Fidelity U.S. Equity Funds. |
Brian B. Hogan (47) |
| Year of Election or Appointment: 2009 Vice President of Equity and High Income Funds. Mr. Hogan also serves as President of FMR's Equity Division (2009-present). Previously, Mr. Hogan served as Senior Vice President, Equity Research of FMR (2006-2009) and as a portfolio manager. |
Scott C. Goebel (44) |
| Year of Election or Appointment: 2008 Secretary and Chief Legal Officer (CLO) of the Fidelity funds. Mr. Goebel also serves as Secretary of Fidelity Investments Money Management, Inc. (FIMM) (2010-present) and Fidelity Research and Analysis Company (FRAC) (2010-present); Secretary and CLO of The North Carolina Capital Management Trust: Cash and Term Portfolios (2008-present); General Counsel, Secretary, and Senior Vice President of FMR (2008-present) and FMR Co., Inc. (2008-present); employed by FMR LLC or an affiliate (2001-present); Chief Legal Officer of Fidelity Management & Research (Hong Kong) Limited (2008-present) and Assistant Secretary of Fidelity Management & Research (Japan) Inc. (2008-present), and Fidelity Management & Research (U.K.) Inc. (2008-present). Previously, Mr. Goebel served as Assistant Secretary of FIMM (2008-2010), FRAC (2008-2010), and the Funds (2007-2008) and as Vice President and Secretary of Fidelity Distributors Corporation (FDC) (2005-2007). |
William C. Coffey (43) |
| Year of Election or Appointment: 2009 Assistant Secretary of Fidelity's Equity and High Income Funds. Mr. Coffey also serves as Senior Vice President and Deputy General Counsel of FMR LLC (2010-present), and is an employee of Fidelity Investments. Previously, Mr. Coffey served as Vice President and Associate General Counsel of FMR LLC (2005-2009). |
Elizabeth Paige Baumann (44) |
| Year of Election or Appointment: 2012 Anti-Money Laundering (AML) Officer of the Fidelity funds. Ms. Baumann also serves as AML Officer of The North Carolina Capital Management Trust: Cash and Term Portfolios (2012-present), Chief AML Officer of FMR LLC (2012-present), and is an employee of Fidelity Investments. Previously, Ms. Baumann served as Vice President and Deputy Anti-Money Laundering Officer (2007-2012). |
Christine Reynolds (53) |
| Year of Election or Appointment: 2008 Chief Financial Officer of the Fidelity funds. Ms. Reynolds became President of Fidelity Pricing and Cash Management Services (FPCMS) in August 2008. Ms. Reynolds served as Chief Operating Officer of FPCMS (2007-2008). Previously, Ms. Reynolds served as President, Treasurer, and Anti-Money Laundering officer of the Fidelity funds (2004-2007). |
Joseph A. Hanlon (44) |
| Year of Election or Appointment: 2012 Chief Compliance Officer of Fidelity's Equity and High Income Funds. Mr. Hanlon serves as Compliance Officer of FMR, FMR Co., Inc., Fidelity Investments Money Management, Inc. (FIMM), Fidelity Research and Analysis Company (FRAC), Fidelity Management & Research (Japan) Inc., Fidelity Management & Research (U.K.) Inc., Fidelity Management & Research (Hong Kong), and Strategic Advisers, Inc. (2009-present), as Senior Vice President of the Fidelity Asset Management Division (2009-present), and is an employee of Fidelity Investments. |
Joseph F. Zambello (55) |
| Year of Election or Appointment: 2011 Deputy Treasurer of the Fidelity funds. Mr. Zambello is an employee of Fidelity Investments. Previously, Mr. Zambello served as Vice President of FMR's Program Management Group (2009-2011) and Vice President of the Transfer Agent Oversight Group (2005-2009). |
Adrien E. Deberghes (44) |
| Year of Election or Appointment: 2008 Deputy Treasurer of Fidelity's Equity and High Income Funds. Mr. Deberghes also serves as Vice President (2011-present) and Assistant Treasurer (2010-present) of other Fidelity funds, and is an employee of Fidelity Investments (2008-present). Previously, Mr. Deberghes served as Senior Vice President of Mutual Fund Administration at State Street Corporation (2007-2008), Senior Director of Mutual Fund Administration at Investors Bank & Trust (2005-2007), and Director of Finance for Dunkin' Brands (2000-2005). |
Stephanie J. Dorsey (43) |
| Year of Election or Appointment: 2010 Assistant Treasurer of Fidelity's Equity and High Income Funds. Ms. Dorsey also serves as Deputy Treasurer of other Fidelity funds (2008-present) and is an employee of Fidelity Investments (2008-present). Previously, Ms. Dorsey served as Treasurer (2004-2008) of the JPMorgan Mutual Funds and Vice President (2004-2008) of JPMorgan Chase Bank. |
John R. Hebble (54) |
| Year of Election or Appointment: 2009 Assistant Treasurer of Fidelity's Equity and High Income Funds. Mr. Hebble also serves as President (2011-present), Treasurer, and Chief Financial Officer of The North Carolina Capital Management Trust: Cash and Term Portfolios (2008-present), President and Treasurer of other Fidelity funds (2008-present) and is an employee of Fidelity Investments. |
Gary W. Ryan (53) |
| Year of Election or Appointment: 2005 Assistant Treasurer of the Fidelity funds. Mr. Ryan is an employee of Fidelity Investments. Previously, Mr. Ryan served as Vice President of Fund Reporting in Fidelity Pricing and Cash Management Services (FPCMS) (1999-2005). |
Jonathan Davis (44) |
| Year of Election or Appointment: 2010 Assistant Treasurer of the Fidelity funds. Mr. Davis is also Assistant Treasurer of Fidelity Rutland Square Trust II and Fidelity Commonwealth Trust II. Mr. Davis is an employee of Fidelity Investments. Previously, Mr. Davis served as Vice President and Associate General Counsel of FMR LLC (2003-2010). |
Annual Report
Class K designates 100% of the dividends distributed in August and December, during the fiscal year as qualifying for the dividends-received deduction for corporate shareholders.
Class K designates 100% of the dividends distributed during the fiscal year as amounts which may be taken into account as a dividend for purposes of the maximum rate under section 1(h)(11) of the Internal Revenue Code.
The fund will notify shareholders in January 2013 of amounts for use in preparing 2012 income tax returns.
Annual Report
A special meeting of the fund's shareholders was held on August 10, 2011. The results of votes taken among shareholders on the proposals before them are reported below. Each vote reported represents one dollar of net asset value held on the record date for the meeting.
PROPOSAL 1 |
To amend the fund's fundamental investment policies to remove references relating to selecting securities for income characteristics. |
| # of
Votes | % of
Votes |
Affirmative | 2,216,149,778.24 | 74.262 |
Against | 568,108,489.09 | 19.037 |
Abstain | 199,977,103.94 | 6.701 |
TOTAL | 2,984,235,371.27 | 100.000 |
PROPOSAL 2 A |
Contingent upon the approval of Proposal 3, to increase the individual fund fee rate component of the management fee to 0.30%. |
| # of
Votes | % of
Votes |
Affirmative | 1,710,896,326.31 | 57.331 |
Against | 1,114,308,132.65 | 37.340 |
Abstain | 159,030,912.31 | 5.329 |
TOTAL | 2,984,235,371.27 | 100.000 |
PROPOSAL 3 A |
Contingent upon the approval of Proposal 2, to include a performance adjustment component to the management fee and to give the Trustees the authority to change the fund's performance adjustment index going forward, without a shareholder vote, subject to applicable law. |
| # of
Votes | % of
Votes |
Affirmative | 1,765,324,795.01 | 59.155 |
Against | 1,046,524,203.94 | 35.068 |
Abstain | 172,386,372.32 | 5.777 |
TOTAL | 2,984,235,371.27 | 100.000 |
A Proposal was not approved by shareholders.
Annual Report
Investment Adviser
Fidelity Management &
Research Company
Boston, MA
Investment Sub-Advisers
FMR Co., Inc.
Fidelity Management & Research
(U.K.) Inc.
Fidelity Management & Research
(Hong Kong) Limited
Fidelity Management & Research
(Japan) Inc.
General Distributor
Fidelity Distributors Corporation
Smithfield, RI
Transfer and Service Agents
Fidelity Investments Institutional
Operations Company, Inc.
Boston, MA
Fidelity Service Company, Inc.
Boston, MA
Custodian
The Northern Trust Company
Chicago, IL
FID-K-UANN-0812
1.863249.103
(Fidelity Investment logo)(registered trademark)
Corporate Headquarters
82 Devonshire St., Boston, MA 02109
www.fidelity.com
Fidelity®
Growth Discovery Fund
Annual Report
June 30, 2012
(Fidelity Cover Art)
Contents
Performance | (Click Here) | How the fund has done over time. |
Management's Discussion of Fund Performance | (Click Here) | The Portfolio Manager's review of fund performance and strategy. |
Shareholder Expense Example | (Click Here) | An example of shareholder expenses. |
Investment Changes | (Click Here) | A summary of major shifts in the fund's investments over the past six months. |
Investments | (Click Here) | A complete list of the fund's investments with their market values. |
Financial Statements | (Click Here) | Statements of assets and liabilities, operations, and changes in net assets, as well as financial highlights. |
Notes | (Click Here) | Notes to the financial statements. |
Report of Independent Registered Public Accounting Firm | (Click Here) | |
Trustees and Officers | (Click Here) | |
Distributions | (Click Here) | |
To view a fund's proxy voting guidelines and proxy voting record for the 12-month period ended June 30, visit http://www.fidelity.com/proxyvotingresults or visit the Securities and Exchange Commission's (SEC) web site at http://www.sec.gov. You may also call 1-800-544-8544 to request a free copy of the proxy voting guidelines.
Standard & Poor's, S&P and S&P 500 are registered service marks of The McGraw-Hill Companies, Inc. and have been licensed for use by Fidelity Distributors Corporation.
Other third party marks appearing herein are the property of their respective owners.
All other marks appearing herein are registered or unregistered trademarks or service marks of FMR LLC or an affiliated company. © 2012 FMR LLC. All rights reserved.
Annual Report
This report and the financial statements contained herein are submitted for the general information of the shareholders of the fund. This report is not authorized for distribution to prospective investors in the fund unless preceded or accompanied by an effective prospectus.
A fund files its complete schedule of portfolio holdings with the SEC for the first and third quarters of each fiscal year on Form N-Q. Forms N-Q are available on the SEC's web site at http://www.sec.gov. A fund's Forms N-Q may be reviewed and copied at the SEC's Public Reference Room in Washington, DC. Information regarding the operation of the SEC's Public Reference Room may be obtained by calling 1-800-SEC-0330. For a complete list of a fund's portfolio holdings, view the most recent holdings listing, semiannual report, or annual report on Fidelity's web site at http://www.fidelity.com, http://www.advisor.fidelity.com, or http://www.401k.com, as applicable.
NOT FDIC INSURED • MAY LOSE VALUE • NO BANK GUARANTEE
Neither the fund nor Fidelity Distributors Corporation is a bank.
Annual Report
Average annual total return reflects the change in the value of an investment, assuming reinvestment of the class' distributions from dividend income and capital gains (the profits earned upon the sale of securities that have grown in value, if any) and assuming a constant rate of performance each year. The $10,000 table and the fund's returns do not reflect the deduction of taxes that a shareholder would pay on fund distributions or the redemption of fund shares. During periods of reimbursement by Fidelity, a fund's total return will be greater than it would be had the reimbursement not occurred. How a fund did yesterday is no guarantee of how it will do tomorrow.
Average Annual Total Returns
Periods ended June 30, 2012 | Past 1
year | Past 5
years | Past 10
years |
Fidelity® Growth Discovery FundA | 2.07% | 1.49% | 5.65% |
A Prior to February 1, 2007, Fidelity® Growth Discovery Fund operated under certain different investment policies. The fund's historical performance may not represent its current investment policies.
$10,000 Over 10 Years
Let's say hypothetically that $10,000 was invested in Fidelity Growth Discovery Fund, a class of the fund, on June 30, 2002. The chart shows how the value of your investment would have changed, and also shows how the Russell 3000® Growth Index performed over the same period.
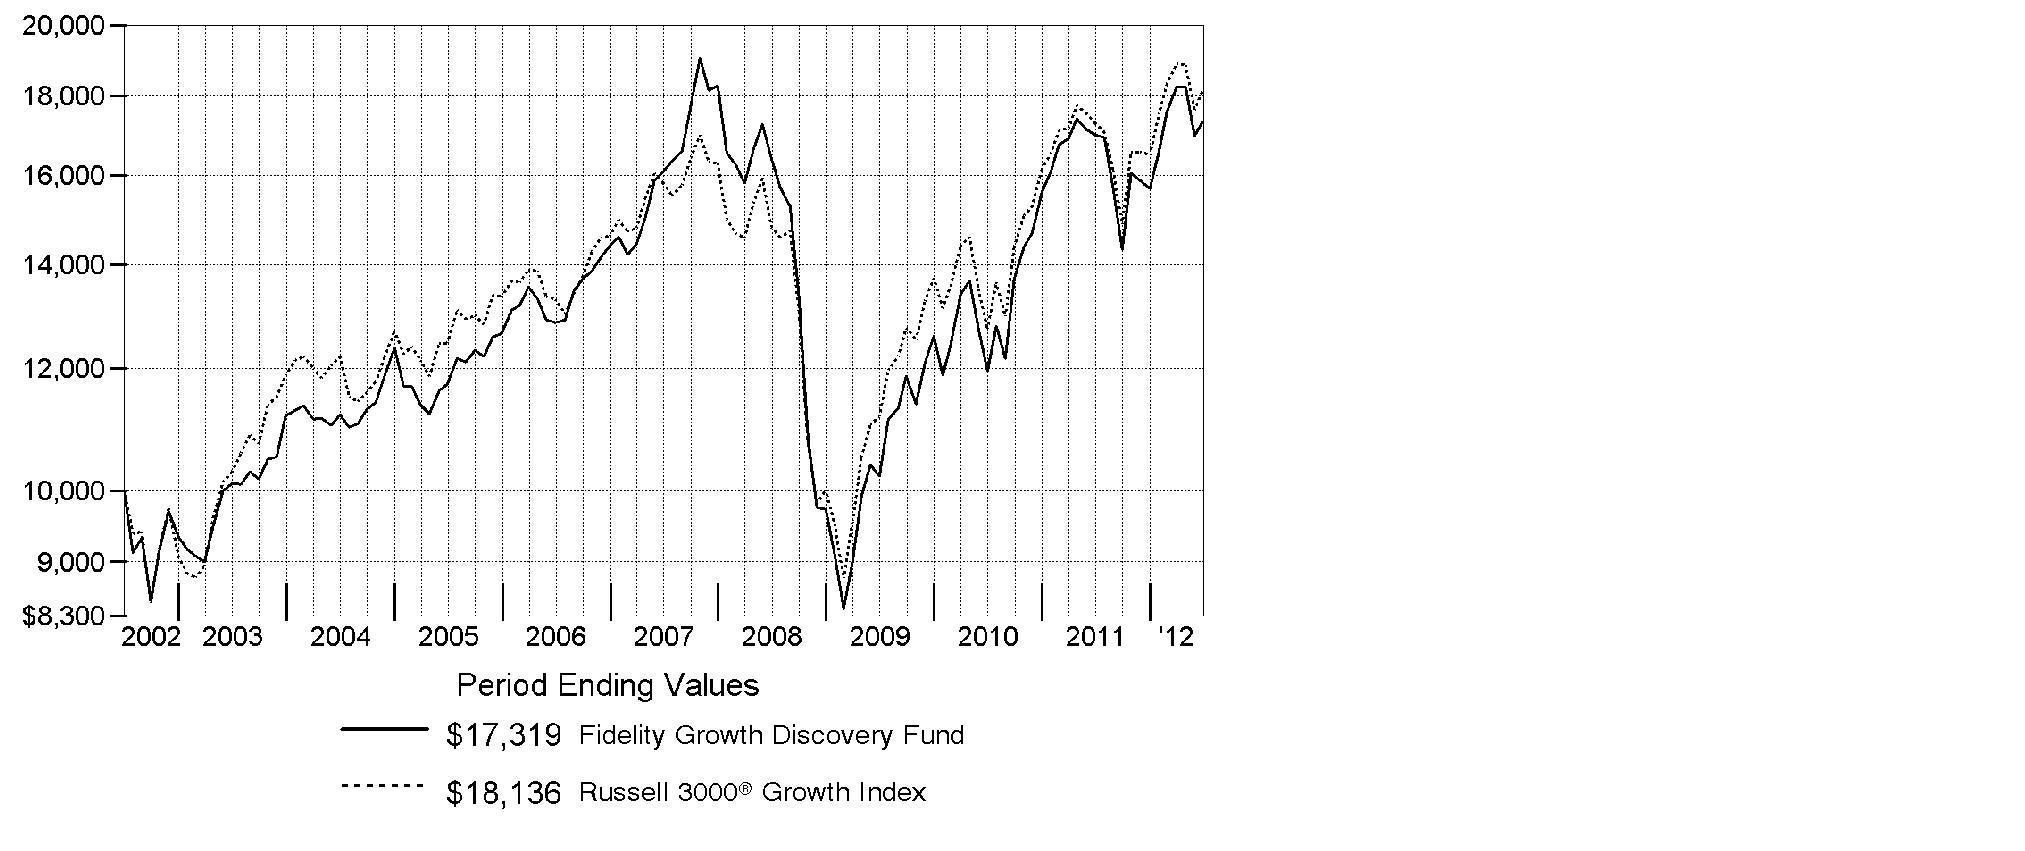
Annual Report
Market Recap: Major U.S. equity benchmarks posted solid gains for the 12 months ending June 30, 2012, even amid the period's uncertain investment environment. The broad-based S&P 500® Index returned 5.45%, while the blue-chip-laden Dow Jones Industrial AverageSM and the technology-heavy Nasdaq Composite® Index gained 6.63% and 6.99%, respectively. Volatility marked the first half of the period, as equities plummeted last summer and early fall on Europe's debt woes, debate over the U.S. debt ceiling and the credit-rating downgrade that followed. Beginning in October, healthier manufacturing, consumer and housing data rejuvenated markets and investors' appetite for stocks, leading major equity benchmarks to their best first-quarter performance since 1998. Stocks slipped again in the spring, as more eurozone trouble and a marked slowdown in China put the brakes on earlier momentum, until optimism reappeared in June. For the period, five of the 10 major market segments within the S&P 500® posted a double-digit gain, led by the more-defensive utilities, consumer staples and telecommunication services sectors, each of which rose about 15%. Conversely, energy (-8%) and materials (-7%) struggled the most. Given Europe's turmoil and local currency weakness, foreign developed-markets stocks lost ground, with the MSCI® EAFE® Index returning -13.70%.
Comments from Jason Weiner, Portfolio Manager of Fidelity® Growth Discovery Fund: For the year, the fund's Retail Class shares advanced 2.07%, trailing the 5.05% result of the Russell 3000® Growth Index. Picks in the food, beverage and tobacco industry hurt, primarily due to the fund's investment in Green Mountain Coffee Roasters, the biggest relative detractor. The stock struggled as investors became fearful that the firm wouldn't be able to sustain its rapid growth and some well-known short sellers were openly critical about the stock. In May, Green Mountain overestimated the amount of demand for its products and reduced its capital expenditure program, causing shares to plummet. Picks in energy also hurt, including Halliburton and Baker Hughes, which were among the fund's biggest detractors. The fund had disappointing results within health care and financials, and its foreign holdings detracted overall, hampered in part by a generally stronger U.S. dollar. Conversely, overweighting tech giant Apple - by far the fund's largest holding - was the biggest relative contributor, as continued strong sales of the company's iPhone® 4S smartphone boosted its stock. Security selection within consumer discretionary and the capital goods segment of industrials helped, including aircraft-components maker Goodrich. I sold Goodrich before period end.
The views expressed above reflect those of the portfolio manager(s) only through the end of the period as stated on the cover of this report and do not necessarily represent the views of Fidelity or any other person in the Fidelity organization. Any such views are subject to change at any time based upon market or other conditions and Fidelity disclaims any responsibility to update such views. These views may not be relied on as investment advice and, because investment decisions for a Fidelity fund are based on numerous factors, may not be relied on as an indication of trading intent on behalf of any Fidelity fund.
Annual Report
Shareholder Expense Example
As a shareholder of the Fund, you incur two types of costs: (1) transaction costs, and (2) ongoing costs, including management fees and other Fund expenses. This Example is intended to help you understand your ongoing costs (in dollars) of investing in the Fund and to compare these costs with the ongoing costs of investing in other mutual funds.
The Example is based on an investment of $1,000 invested at the beginning of the period and held for the entire period (January 1, 2012 to June 30, 2012).
Actual Expenses
The first line of the accompanying table for each class of the Fund provides information about actual account values and actual expenses. You may use the information in this line, together with the amount you invested, to estimate the expenses that you paid over the period. Simply divide your account value by $1,000.00 (for example, an $8,600 account value divided by $1,000.00 = 8.6), then multiply the result by the number in the first line for a class of the Fund under the heading entitled "Expenses Paid During Period" to estimate the expenses you paid on your account during this period. A small balance maintenance fee of $12.00 that is charged once a year may apply for certain accounts with a value of less than $2,000. This fee is not included in the table below. If it was, the estimate of expenses you paid during the period would be higher, and your ending account value lower, by this amount. In addition, the Fund, as a shareholder in the underlying Fidelity Central Funds, will indirectly bear its pro-rata share of the fees and expenses incurred by the underlying Fidelity Central Funds. These fees and expenses are not included in the Fund's annualized expense ratio used to calculate the expense estimate in the table below.
Hypothetical Example for Comparison Purposes
The second line of the accompanying table for each class of the Fund provides information about hypothetical account values and hypothetical expenses based on a Class' actual expense ratio and an assumed rate of return of 5% per year before expenses, which is not the Class' actual return. The hypothetical account values and expenses may not be used to estimate the actual ending account balance or expenses you paid for the period. You may use this information to compare the ongoing costs of investing in the Fund and other funds. To do so, compare this 5% hypothetical example with the 5% hypothetical examples that appear in the shareholder reports of the other funds. A small balance maintenance fee of $12.00 that is charged once a year may apply for certain accounts with a value of less than $2,000. This fee is not included in the table below. If it was, the estimate of expenses you paid during the period would be higher, and your ending account value lower, by this amount. In addition, the Fund, as a shareholder in the underlying Fidelity Central Funds, will indirectly bear its pro-rata share of the fees and expenses incurred by the underlying Fidelity Central Funds. These fees and expenses are not included in the Fund's annualized expense ratio used to calculate the expense estimate in the table below.
Please note that the expenses shown in the table are meant to highlight your ongoing costs only and do not reflect any transaction costs. Therefore, the second line of the table is useful in comparing ongoing costs only, and will not help you determine the relative total costs of owning different funds.
Annual Report
Shareholder Expense Example - continued
| Annualized
Expense Ratio | Beginning
Account Value
January 1, 2012 | Ending
Account Value
June 30, 2012 | Expenses Paid
During Period*
January 1, 2012
to June 30, 2012 |
Growth Discovery | .88% | | | |
Actual | | $ 1,000.00 | $ 1,104.70 | $ 4.61 |
HypotheticalA | | $ 1,000.00 | $ 1,020.49 | $ 4.42 |
Class K | .71% | | | |
Actual | | $ 1,000.00 | $ 1,105.50 | $ 3.72 |
HypotheticalA | | $ 1,000.00 | $ 1,021.33 | $ 3.57 |
A 5% return per year before expenses
* Expenses are equal to each Class' annualized expense ratio, multiplied by the average account value over the period, multiplied by 182/366 (to reflect the one-half year period).
Annual Report
Investment Changes (Unaudited)
Top Ten Stocks as of June 30, 2012 |
| % of fund's
net assets | % of fund's net assets
6 months ago |
Apple, Inc. | 11.4 | 8.7 |
QUALCOMM, Inc. | 2.8 | 2.2 |
Harley-Davidson, Inc. | 2.1 | 0.8 |
The Coca-Cola Co. | 2.0 | 1.3 |
Home Depot, Inc. | 2.0 | 0.4 |
Express Scripts Holding Co. | 1.7 | 0.0 |
Citrix Systems, Inc. | 1.7 | 1.1 |
Danaher Corp. | 1.6 | 1.5 |
Philip Morris International, Inc. | 1.4 | 1.4 |
Google, Inc. Class A | 1.4 | 4.1 |
| 28.1 | |
Top Five Market Sectors as of June 30, 2012 |
| % of fund's
net assets | % of fund's net assets
6 months ago |
Information Technology | 31.7 | 32.9 |
Consumer Discretionary | 18.3 | 16.6 |
Industrials | 14.2 | 14.4 |
Consumer Staples | 11.4 | 8.7 |
Health Care | 6.1 | 4.3 |
Asset Allocation (% of fund's net assets) |
As of June 30, 2012* | As of December 31, 2011** |
| Stocks 94.3% | | | Stocks 96.5% | |
| Short-Term
Investments and
Net Other Assets
(Liabilities) 5.7% | | | Short-Term
Investments and
Net Other Assets
(Liabilities) 3.5% | |
* Foreign investments | 13.1% | | ** Foreign investments | 14.4% | |

Annual Report
Investments June 30, 2012
Showing Percentage of Net Assets
Common Stocks - 94.3% |
| Shares | | Value (000s) |
CONSUMER DISCRETIONARY - 18.3% |
Automobiles - 2.5% |
Harley-Davidson, Inc. | 468,676 | | $ 21,433 |
Tesla Motors, Inc. (a)(d) | 133,392 | | 4,174 |
| | 25,607 |
Diversified Consumer Services - 0.7% |
Anhanguera Educacional Participacoes SA | 277,600 | | 3,538 |
Kroton Educacional SA unit (a) | 222,400 | | 3,217 |
| | 6,755 |
Hotels, Restaurants & Leisure - 3.3% |
Arcos Dorados Holdings, Inc. | 153,100 | | 2,263 |
Chipotle Mexican Grill, Inc. (a) | 4,507 | | 1,712 |
Dunkin' Brands Group, Inc. | 132,569 | | 4,552 |
McDonald's Corp. | 139,500 | | 12,350 |
Sonic Corp. (a) | 104,200 | | 1,044 |
Starbucks Corp. | 228,026 | | 12,158 |
| | 34,079 |
Household Durables - 0.7% |
Mohawk Industries, Inc. (a) | 37,086 | | 2,590 |
Tupperware Brands Corp. | 90,208 | | 4,940 |
| | 7,530 |
Internet & Catalog Retail - 1.4% |
Amazon.com, Inc. (a) | 60,208 | | 13,748 |
Media - 0.6% |
Discovery Communications, Inc. Class C (non-vtg.) (a) | 112,550 | | 5,638 |
Multiline Retail - 2.0% |
Dollar General Corp. (a) | 140,058 | | 7,618 |
Dollarama, Inc. | 184,190 | | 11,068 |
Dollarama, Inc. (a)(e) | 25,900 | | 1,556 |
| | 20,242 |
Specialty Retail - 6.2% |
Bed Bath & Beyond, Inc. (a) | 104,195 | | 6,439 |
GNC Holdings, Inc. | 214,189 | | 8,396 |
Home Depot, Inc. | 380,450 | | 20,160 |
PetSmart, Inc. | 26,900 | | 1,834 |
Ross Stores, Inc. | 137,766 | | 8,606 |
TJX Companies, Inc. | 166,118 | | 7,131 |
Ulta Salon, Cosmetics & Fragrance, Inc. | 37,385 | | 3,491 |
Vitamin Shoppe, Inc. (a) | 136,905 | | 7,520 |
| | 63,577 |
Common Stocks - continued |
| Shares | | Value (000s) |
CONSUMER DISCRETIONARY - continued |
Textiles, Apparel & Luxury Goods - 0.9% |
lululemon athletica, Inc. (a) | 51,000 | | $ 3,041 |
NIKE, Inc. Class B | 57,157 | | 5,017 |
Ralph Lauren Corp. | 10,032 | | 1,405 |
| | 9,463 |
TOTAL CONSUMER DISCRETIONARY | | 186,639 |
CONSUMER STAPLES - 11.4% |
Beverages - 3.5% |
Anheuser-Busch InBev SA NV ADR | 34,200 | | 2,724 |
Monster Beverage Corp. (a) | 122,193 | | 8,700 |
SABMiller PLC | 78,500 | | 3,141 |
The Coca-Cola Co. | 264,980 | | 20,719 |
| | 35,284 |
Food & Staples Retailing - 0.9% |
Costco Wholesale Corp. | 32,700 | | 3,107 |
Drogasil SA | 134,324 | | 1,354 |
Whole Foods Market, Inc. | 56,120 | | 5,349 |
| | 9,810 |
Food Products - 2.0% |
Green Mountain Coffee Roasters, Inc. (a)(d) | 359,172 | | 7,823 |
Mead Johnson Nutrition Co. Class A | 55,931 | | 4,503 |
The Hershey Co. | 96,577 | | 6,956 |
Want Want China Holdings Ltd. | 659,000 | | 815 |
| | 20,097 |
Household Products - 1.3% |
Colgate-Palmolive Co. | 124,903 | | 13,002 |
Personal Products - 1.1% |
Estee Lauder Companies, Inc. Class A | 25,068 | | 1,357 |
Herbalife Ltd. | 207,929 | | 10,049 |
| | 11,406 |
Tobacco - 2.6% |
Altria Group, Inc. | 32,870 | | 1,136 |
British American Tobacco PLC sponsored ADR | 89,400 | | 9,130 |
Common Stocks - continued |
| Shares | | Value (000s) |
CONSUMER STAPLES - continued |
Tobacco - continued |
Philip Morris International, Inc. | 169,900 | | $ 14,825 |
Swedish Match Co. AB | 43,600 | | 1,757 |
| | 26,848 |
TOTAL CONSUMER STAPLES | | 116,447 |
ENERGY - 5.8% |
Energy Equipment & Services - 2.6% |
Cameron International Corp. (a) | 77,200 | | 3,297 |
Dresser-Rand Group, Inc. (a) | 91,305 | | 4,067 |
National Oilwell Varco, Inc. | 73,200 | | 4,717 |
Oceaneering International, Inc. | 111,349 | | 5,329 |
Poseidon Concepts Corp. (d) | 382,800 | | 4,689 |
Schlumberger Ltd. | 77,756 | | 5,047 |
| | 27,146 |
Oil, Gas & Consumable Fuels - 3.2% |
Atlas Pipeline Partners, LP | 157,463 | | 4,910 |
Concho Resources, Inc. (a) | 61,421 | | 5,228 |
Kosmos Energy Ltd. (a) | 266,347 | | 2,943 |
Markwest Energy Partners LP | 45,360 | | 2,237 |
Noble Energy, Inc. | 25,300 | | 2,146 |
Pioneer Natural Resources Co. | 40,600 | | 3,581 |
Targa Resources Corp. | 60,451 | | 2,581 |
Valero Energy Corp. | 151,207 | | 3,652 |
Williams Companies, Inc. | 173,800 | | 5,009 |
| | 32,287 |
TOTAL ENERGY | | 59,433 |
FINANCIALS - 2.5% |
Capital Markets - 0.4% |
GP Investments Ltd. (depositary receipt) (a) | 362,094 | | 846 |
Invesco Ltd. | 151,821 | | 3,431 |
| | 4,277 |
Commercial Banks - 0.2% |
First Republic Bank (a) | 52,076 | | 1,750 |
Common Stocks - continued |
| Shares | | Value (000s) |
FINANCIALS - continued |
Consumer Finance - 0.2% |
Mahindra & Mahindra Financial Services Ltd. | 75,209 | | $ 882 |
Shriram Transport Finance Co. Ltd. | 165,090 | | 1,584 |
| | 2,466 |
Diversified Financial Services - 0.3% |
CME Group, Inc. | 12,392 | | 3,322 |
Real Estate Investment Trusts - 1.3% |
American Tower Corp. | 143,828 | | 10,055 |
Public Storage | 20,030 | | 2,893 |
| | 12,948 |
Real Estate Management & Development - 0.1% |
BR Malls Participacoes SA | 48,300 | | 553 |
TOTAL FINANCIALS | | 25,316 |
HEALTH CARE - 6.1% |
Biotechnology - 2.1% |
Aegerion Pharmaceuticals, Inc. (a) | 32,100 | | 476 |
Amgen, Inc. | 84,000 | | 6,135 |
AVEO Pharmaceuticals, Inc. (a)(d) | 214,164 | | 2,604 |
Biogen Idec, Inc. (a) | 65,379 | | 9,439 |
Biovitrum AB (a) | 612,148 | | 2,080 |
Cytokinetics, Inc. | 480,700 | | 308 |
Cytokinetics, Inc. warrants 6/25/17 (a) | 288,420 | | 2 |
| | 21,044 |
Health Care Equipment & Supplies - 0.2% |
Conceptus, Inc. (a) | 73,300 | | 1,453 |
Edwards Lifesciences Corp. (a) | 6,200 | | 640 |
| | 2,093 |
Health Care Providers & Services - 1.8% |
Apollo Hospitals Enterprise Ltd. | 42,413 | | 472 |
Express Scripts Holding Co. (a) | 314,409 | | 17,553 |
| | 18,025 |
Life Sciences Tools & Services - 0.1% |
Illumina, Inc. (a) | 22,700 | | 917 |
Common Stocks - continued |
| Shares | | Value (000s) |
HEALTH CARE - continued |
Pharmaceuticals - 1.9% |
Novo Nordisk A/S Series B | 48,477 | | $ 7,031 |
Valeant Pharmaceuticals International, Inc. (Canada) (a)(d) | 282,925 | | 12,691 |
| | 19,722 |
TOTAL HEALTH CARE | | 61,801 |
INDUSTRIALS - 14.2% |
Aerospace & Defense - 3.1% |
Honeywell International, Inc. | 71,444 | | 3,989 |
Precision Castparts Corp. | 55,353 | | 9,105 |
Textron, Inc. | 41,700 | | 1,037 |
TransDigm Group, Inc. (a) | 52,458 | | 7,045 |
United Technologies Corp. | 134,070 | | 10,126 |
| | 31,302 |
Air Freight & Logistics - 0.9% |
United Parcel Service, Inc. Class B | 122,945 | | 9,683 |
Building Products - 0.3% |
USG Corp. (a)(d) | 137,700 | | 2,623 |
Commercial Services & Supplies - 0.0% |
Aggreko PLC | 15,912 | | 516 |
Electrical Equipment - 1.7% |
AMETEK, Inc. | 84,165 | | 4,201 |
Regal-Beloit Corp. | 71,191 | | 4,432 |
Roper Industries, Inc. | 87,067 | | 8,583 |
| | 17,216 |
Industrial Conglomerates - 1.6% |
Danaher Corp. | 315,600 | | 16,436 |
Machinery - 2.5% |
CLARCOR, Inc. | 109,451 | | 5,271 |
Graco, Inc. | 46,623 | | 2,148 |
Ingersoll-Rand PLC | 254,591 | | 10,739 |
Manitowoc Co., Inc. | 354,785 | | 4,151 |
Terex Corp. (a) | 179,700 | | 3,204 |
| | 25,513 |
Professional Services - 3.1% |
Advisory Board Co. (a) | 125,878 | | 6,242 |
Corporate Executive Board Co. | 188,006 | | 7,686 |
Equifax, Inc. | 218,703 | | 10,192 |
Common Stocks - continued |
| Shares | | Value (000s) |
INDUSTRIALS - continued |
Professional Services - continued |
IHS, Inc. Class A (a) | 57,285 | | $ 6,171 |
Qualicorp SA | 160,700 | | 1,405 |
| | 31,696 |
Road & Rail - 0.1% |
J.B. Hunt Transport Services, Inc. | 20,000 | | 1,192 |
Trading Companies & Distributors - 0.9% |
MSC Industrial Direct Co., Inc. Class A | 37,530 | | 2,460 |
W.W. Grainger, Inc. | 33,838 | | 6,471 |
| | 8,931 |
TOTAL INDUSTRIALS | | 145,108 |
INFORMATION TECHNOLOGY - 31.7% |
Communications Equipment - 3.5% |
Acme Packet, Inc. (a)(d) | 222,499 | | 4,150 |
QUALCOMM, Inc. | 507,439 | | 28,254 |
Riverbed Technology, Inc. (a) | 212,248 | | 3,428 |
| | 35,832 |
Computers & Peripherals - 12.3% |
Apple, Inc. (a) | 198,902 | | 116,163 |
SanDisk Corp. (a) | 248,678 | | 9,072 |
| | 125,235 |
Electronic Equipment & Components - 0.2% |
InvenSense, Inc. (d) | 151,012 | | 1,706 |
Internet Software & Services - 4.6% |
Active Network, Inc. (a) | 66,704 | | 1,027 |
Baidu.com, Inc. sponsored ADR (a) | 24,960 | | 2,870 |
Bankrate, Inc. | 272,578 | | 5,013 |
Blucora, Inc. (a) | 172,485 | | 2,125 |
CoStar Group, Inc. (a) | 29,950 | | 2,432 |
Google, Inc. Class A (a) | 25,123 | | 14,573 |
MercadoLibre, Inc. | 28,258 | | 2,142 |
SPS Commerce, Inc. (a) | 65,005 | | 1,975 |
VeriSign, Inc. (a) | 325,224 | | 14,170 |
| | 46,327 |
IT Services - 1.7% |
Cardtronics, Inc. (a) | 76,888 | | 2,323 |
Heartland Payment Systems, Inc. | 117,404 | | 3,532 |
MasterCard, Inc. Class A | 6,300 | | 2,710 |
Common Stocks - continued |
| Shares | | Value (000s) |
INFORMATION TECHNOLOGY - continued |
IT Services - continued |
ServiceSource International, Inc. (a) | 246,837 | | $ 3,419 |
Visa, Inc. Class A | 40,400 | | 4,995 |
| | 16,979 |
Semiconductors & Semiconductor Equipment - 3.9% |
Altera Corp. | 71,518 | | 2,420 |
ASML Holding NV | 122,000 | | 6,273 |
Avago Technologies Ltd. | 197,009 | | 7,073 |
Broadcom Corp. Class A | 262,548 | | 8,874 |
Cirrus Logic, Inc. (a) | 50,275 | | 1,502 |
Ezchip Semiconductor Ltd. (a) | 68,441 | | 2,740 |
MagnaChip Semiconductor Corp. (a) | 189,252 | | 1,804 |
Maxim Integrated Products, Inc. | 38,500 | | 987 |
PMC-Sierra, Inc. (a) | 260,016 | | 1,596 |
Texas Instruments, Inc. | 241,100 | | 6,917 |
| | 40,186 |
Software - 5.5% |
ANSYS, Inc. (a) | 79,558 | | 5,021 |
Citrix Systems, Inc. (a) | 205,447 | | 17,245 |
Computer Modelling Group Ltd. | 133,000 | | 2,269 |
Intuit, Inc. | 72,393 | | 4,297 |
Red Hat, Inc. (a) | 68,900 | | 3,891 |
salesforce.com, Inc. (a) | 91,566 | | 12,660 |
SolarWinds, Inc. (a) | 131,127 | | 5,712 |
VMware, Inc. Class A (a) | 55,575 | | 5,060 |
| | 56,155 |
TOTAL INFORMATION TECHNOLOGY | | 322,420 |
MATERIALS - 3.1% |
Chemicals - 2.5% |
Albemarle Corp. | 17,200 | | 1,026 |
FMC Corp. | 134,946 | | 7,217 |
Monsanto Co. | 76,481 | | 6,331 |
Praxair, Inc. | 69,200 | | 7,524 |
Sherwin-Williams Co. | 28,600 | | 3,785 |
| | 25,883 |
Common Stocks - continued |
| Shares | | Value (000s) |
MATERIALS - continued |
Metals & Mining - 0.6% |
Kenmare Resources PLC (a) | 1,214,702 | | $ 751 |
Newmont Mining Corp. | 107,703 | | 5,225 |
| | 5,976 |
TOTAL MATERIALS | | 31,859 |
TELECOMMUNICATION SERVICES - 1.2% |
Wireless Telecommunication Services - 1.2% |
SBA Communications Corp. Class A (a) | 125,512 | | 7,160 |
TIM Participacoes SA sponsored ADR (d) | 167,209 | | 4,592 |
| | 11,752 |
TOTAL COMMON STOCKS (Cost $809,985) |
960,775
|
Money Market Funds - 4.5% |
| | | |
Fidelity Cash Central Fund, 0.17% (b) | 24,292,518 | | 24,293 |
Fidelity Securities Lending Cash Central Fund, 0.18% (b)(c) | 21,535,351 | | 21,535 |
TOTAL MONEY MARKET FUNDS (Cost $45,828) |
45,828
|
TOTAL INVESTMENT PORTFOLIO - 98.8% (Cost $855,813) | | 1,006,603 |
NET OTHER ASSETS (LIABILITIES) - 1.2% | | 12,032 |
NET ASSETS - 100% | $ 1,018,635 |
Legend |
(a) Non-income producing |
(b) Affiliated fund that is available only to investment companies and other accounts managed by Fidelity Investments. The rate quoted is the annualized seven-day yield of the fund at period end. A complete unaudited listing of the fund's holdings as of its most recent quarter end is available upon request. In addition, each Fidelity Central Fund's financial statements, which are not covered by the Fund's Report of Independent Registered Public Accounting Firm, are available on the SEC's website or upon request. |
(c) Investment made with cash collateral received from securities on loan. |
(d) Security or a portion of the security is on loan at period end. |
(e) Security exempt from registration under Rule 144A of the Securities Act of 1933. These securities may be resold in transactions exempt from registration, normally to qualified institutional buyers. At the end of the period, the value of these securities amounted to $1,556,000 or 0.2% of net assets. |
Affiliated Central Funds |
Information regarding fiscal year to date income earned by the Fund from investments in Fidelity Central Funds is as follows: |
Fund | Income earned
(Amounts in thousands) |
Fidelity Cash Central Fund | $ 33 |
Fidelity Securities Lending Cash Central Fund | 400 |
Total | $ 433 |
Other Information |
The following is a summary of the inputs used, as of June 30, 2012, involving the Fund's assets and liabilities carried at fair value. The inputs or methodology used for valuing securities may not be an indication of the risk associated with investing in those securities. For more information on valuation inputs, and their aggregation into the levels used in the table below, please refer to the Security Valuation section in the accompanying Notes to Financial Statements. |
Valuation Inputs at Reporting Date: |
Description
(Amounts in thousands) | Total | Level 1 | Level 2 | Level 3 |
Investments in Securities: | | | | |
Equities: | | | | |
Consumer Discretionary | $ 186,639 | $ 186,639 | $ - | $ - |
Consumer Staples | 116,447 | 115,632 | 815 | - |
Energy | 59,433 | 59,433 | - | - |
Financials | 25,316 | 22,850 | 2,466 | - |
Health Care | 61,801 | 54,296 | 7,505 | - |
Industrials | 145,108 | 145,108 | - | - |
Information Technology | 322,420 | 322,420 | - | - |
Materials | 31,859 | 31,859 | - | - |
Telecommunication Services | 11,752 | 11,752 | - | - |
Money Market Funds | 45,828 | 45,828 | - | - |
Total Investments in Securities: | $ 1,006,603 | $ 995,817 | $ 10,786 | $ - |
Distribution of investments by country or territory of incorporation, as a percentage of total net assets, is as follows. (Unaudited) |
United States of America | 86.9% |
Canada | 3.1% |
Brazil | 1.5% |
Cayman Islands | 1.4% |
United Kingdom | 1.2% |
Ireland | 1.2% |
Others (Individually Less Than 1%) | 4.7% |
| 100.0% |
See accompanying notes which are an integral part of the financial statements.
Annual Report
Statement of Assets and Liabilities
Amounts in thousands (except per-share amounts) | June 30, 2012 |
| | |
Assets | | |
Investment in securities, at value (including securities loaned of $21,946) - See accompanying schedule: Unaffiliated issuers (cost $809,985) | $ 960,775 | |
Fidelity Central Funds (cost $45,828) | 45,828 | |
Total Investments (cost $855,813) | | $ 1,006,603 |
Receivable for investments sold | | 47,058 |
Receivable for fund shares sold | | 749 |
Dividends receivable | | 559 |
Distributions receivable from Fidelity Central Funds | | 78 |
Other receivables | | 30 |
Total assets | | 1,055,077 |
| | |
Liabilities | | |
Payable for investments purchased | $ 13,380 | |
Payable for fund shares redeemed | 719 | |
Accrued management fee | 568 | |
Other affiliated payables | 192 | |
Other payables and accrued expenses | 48 | |
Collateral on securities loaned, at value | 21,535 | |
Total liabilities | | 36,442 |
| | |
Net Assets | | $ 1,018,635 |
Net Assets consist of: | | |
Paid in capital | | $ 1,440,845 |
Undistributed net investment income | | 962 |
Accumulated undistributed net realized gain (loss) on investments and foreign currency transactions | | (573,955) |
Net unrealized appreciation (depreciation) on investments and assets and liabilities in foreign currencies | | 150,783 |
Net Assets | | $ 1,018,635 |
See accompanying notes which are an integral part of the financial statements.
Annual Report
Financial Statements - continued
Statement of Assets and Liabilities - continued
Amounts in thousands (except per-share amounts) | June 30, 2012 |
| | |
Growth Discovery:
Net Asset Value, offering price and redemption price per share ($874,679 ÷ 57,976 shares) | | $ 15.09 |
| | |
Class K:
Net Asset Value, offering price and redemption price per share ($143,956 ÷ 9,539 shares) | | $ 15.09 |
See accompanying notes which are an integral part of the financial statements.
Annual Report
Statement of Operations
Amounts in thousands | Year ended June 30, 2012 |
| | |
Investment Income | | |
Dividends | | $ 10,644 |
Income from Fidelity Central Funds | | 433 |
Total income | | 11,077 |
| | |
Expenses | | |
Management fee
Basic fee | $ 5,752 | |
Performance adjustment | (282) | |
Transfer agent fees | 2,023 | |
Accounting and security lending fees | 345 | |
Custodian fees and expenses | 58 | |
Independent trustees' compensation | 7 | |
Registration fees | 66 | |
Audit | 54 | |
Legal | 5 | |
Miscellaneous | 9 | |
Total expenses before reductions | 8,037 | |
Expense reductions | (34) | 8,003 |
Net investment income (loss) | | 3,074 |
Realized and Unrealized Gain (Loss) Net realized gain (loss) on: | | |
Investment securities: | | |
Unaffiliated issuers | 13,970 | |
Foreign currency transactions | (227) | |
Total net realized gain (loss) | | 13,743 |
Change in net unrealized appreciation (depreciation) on: Investment securities | (766) | |
Assets and liabilities in foreign currencies | (1) | |
Total change in net unrealized appreciation (depreciation) | | (767) |
Net gain (loss) | | 12,976 |
Net increase (decrease) in net assets resulting from operations | | $ 16,050 |
See accompanying notes which are an integral part of the financial statements.
Annual Report
Financial Statements - continued
Statement of Changes in Net Assets
Amounts in thousands | Year ended
June 30,
2012 | Year ended
June 30,
2011 |
Increase (Decrease) in Net Assets | | |
Operations | | |
Net investment income (loss) | $ 3,074 | $ 3,581 |
Net realized gain (loss) | 13,743 | 102,766 |
Change in net unrealized appreciation (depreciation) | (767) | 165,724 |
Net increase (decrease) in net assets resulting
from operations | 16,050 | 272,071 |
Distributions to shareholders from net investment income | (2,613) | (2,086) |
Distributions to shareholders from net realized gain | (4,056) | (3,054) |
Total distributions | (6,669) | (5,140) |
Share transactions - net increase (decrease) | (69,861) | 166,122 |
Total increase (decrease) in net assets | (60,480) | 433,053 |
| | |
Net Assets | | |
Beginning of period | 1,079,115 | 646,062 |
End of period (including undistributed net investment income of $962 and undistributed net investment income of $1,925, respectively) | $ 1,018,635 | $ 1,079,115 |
See accompanying notes which are an integral part of the financial statements.
Annual Report
Financial Highlights - Growth Discovery
Years ended June 30, | 2012 | 2011 | 2010 | 2009 | 2008 |
Selected Per-Share Data | | | | | |
Net asset value, beginning of period | $ 14.88 | $ 10.54 | $ 9.04 | $ 14.61 | $ 14.36 |
Income from Investment Operations | | | | | |
Net investment income (loss) B | .04 | .05 | .01 | .04 | .09 |
Net realized and unrealized gain (loss) | .26 | 4.37 | 1.52 | (5.54) | .20 |
Total from investment operations | .30 | 4.42 | 1.53 | (5.50) | .29 |
Distributions from net investment income | (.03) | (.03) | (.03) | (.07) | (.04) |
Distributions from net realized gain | (.06) | (.05) | (.01) | - | - |
Total distributions | (.09) | (.08) | (.03) F | (.07) | (.04) |
Net asset value, end of period | $ 15.09 | $ 14.88 | $ 10.54 | $ 9.04 | $ 14.61 |
Total Return A | 2.07% | 42.09% | 16.96% | (37.75)% | 1.98% |
Ratios to Average Net Assets C, E | | | | | |
Expenses before reductions | .81% | .63% | .76% | .90% | .91% |
Expenses net of fee waivers, if any | .81% | .63% | .76% | .90% | .91% |
Expenses net of all reductions | .80% | .62% | .75% | .89% | .90% |
Net investment income (loss) | .27% | .39% | .08% | .36% | .57% |
Supplemental Data | | | | | |
Net assets, end of period (in millions) | $ 875 | $ 932 | $ 604 | $ 777 | $ 1,768 |
Portfolio turnover rate D | 74% | 72% | 87% | 166% | 150% |
A Total returns would have been lower if certain expenses had not been reduced during the applicable periods shown.
B Calculated based on average shares outstanding during the period.
C Fees and expenses of any underlying Fidelity Central Funds are not included in the Fund's expense ratio. The Fund indirectly bears its proportionate share of the expenses of any underlying Fidelity Central Funds.
D Amount does not include the portfolio activity of any underlying Fidelity Central Funds.
E Expense ratios reflect operating expenses of the class. Expenses before reductions do not reflect amounts reimbursed by the investment adviser or reductions from brokerage service arrangements or reductions from other expense offset arrangements and do not represent the amount paid by the class during periods when reimbursements or reductions occur. Expenses net of fee waivers reflect expenses after reimbursement by the investment adviser but prior to reductions from brokerage service arrangements or other expense offset arrangements. Expenses net of all reductions represent the net expenses paid by the class.
F Total distributions of $.03 per share is comprised of distributions from net investment income of $.027 and distributions from net realized gain of $.005 per share.
See accompanying notes which are an integral part of the financial statements.
Annual Report
Financial Highlights - Class K
Years ended June 30, | 2012 | 2011 | 2010 | 2009 | 2008 G |
Selected Per-Share Data | | | | | |
Net asset value, beginning of period | $ 14.88 | $ 10.55 | $ 9.05 | $ 14.62 | $ 14.94 |
Income from Investment
Operations | | | | |
Net investment income (loss) D | .06 | .08 | .03 | .05 | .03 |
Net realized and unrealized gain (loss) | .26 | 4.36 | 1.53 | (5.53) | (.35) |
Total from investment operations | .32 | 4.44 | 1.56 | (5.48) | (.32) |
Distributions from net investment income | (.06) | (.06) | (.05) | (.09) | - |
Distributions from net realized gain | (.06) | (.05) | (.01) | - | - |
Total distributions | (.11) J | (.11) | (.06) I | (.09) | - |
Net asset value, end of period | $ 15.09 | $ 14.88 | $ 10.55 | $ 9.05 | $ 14.62 |
Total Return B, C | 2.27% | 42.26% | 17.25% | (37.60)% | (2.14)% |
Ratios to Average Net Assets E, H | | | | | |
Expenses before reductions | .64% | .44% | .53% | .67% | .76% A |
Expenses net of fee waivers, if any | .64% | .44% | .53% | .67% | .76% A |
Expenses net of all reductions | .63% | .43% | .52% | .67% | .75% A |
Net investment income (loss) | .44% | .58% | .31% | .59% | 1.44% A |
Supplemental Data | | | | | |
Net assets, end of period (000 omitted) | $ 143,956 | $ 146,740 | $ 42,570 | $ 30,939 | $ 98 |
Portfolio turnover rate F | 74% | 72% | 87% | 166% | 150% |
A Annualized
B Total returns for periods of less than one year are not annualized.
C Total returns would have been lower if certain expenses had not been reduced during the applicable periods shown.
D Calculated based on average shares outstanding during the period.
E Fees and expenses of any underlying Fidelity Central Funds are not included in the Fund's expense ratio. The Fund indirectly bears its proportionate share of the expenses of any underlying Fidelity Central Funds.
F Amount does not include the portfolio activity of any underlying Fidelity Central Funds.
G For the period May 9, 2008 (commencement of sale of shares) to June 30, 2008.
H Expense ratios reflect operating expenses of the class. Expenses before reductions do not reflect amounts reimbursed by the investment adviser or reductions from brokerage service arrangements or reductions from other expense offset arrangements and do not represent the amount paid by the class during periods when reimbursements or reductions occur. Expense ratios before reductions for start-up periods may not be representative of longer-term operating periods. Expenses net of fee waivers reflect expenses after reimbursement by the investment adviser but prior to reductions from brokerage service arrangements or other expense offset arrangements. Expenses net of all reductions represent the net expenses paid by the class.
I Total distributions of $.06 per share is comprised of distributions from net investment income of $.054 and distributions from net realized gain of $.005 per share.
J Total distributions of $.11 per share is comprised of distributions from net investment income of $.058 and distributions from net realized gain of $.055 per share.
See accompanying notes which are an integral part of the financial statements.
Annual Report
Notes to Financial Statements
For the period ended June 30, 2012
(Amounts in thousands except percentages)
1. Organization.
Fidelity Growth Discovery Fund (the Fund) is a fund of Fidelity Hastings Street Trust (the Trust) and is authorized to issue an unlimited number of shares. The Trust is registered under the Investment Company Act of 1940, as amended (the 1940 Act), as an open-end management investment company organized as a Massachusetts business trust. The Fund offers Growth Discovery and Class K shares, each of which, has equal rights as to assets and voting privileges. Each class has exclusive voting rights with respect to matters that affect that class. Investment income, realized and unrealized capital gains and losses, the common expenses of the Fund, and certain fund-level expense reductions, if any, are allocated on a pro-rata basis to each class based on the relative net assets of each class to the total net assets of the Fund. Each class differs with respect to transfer agent fees incurred. Certain expense reductions may also differ by class.
2. Investments in Fidelity Central Funds.
The Fund invests in Fidelity Central Funds, which are open-end investment companies available only to other investment companies and accounts managed by Fidelity Management & Research Company (FMR) and its affiliates. The Fund's Schedule of Investments lists each of the Fidelity Central Funds held as of period end, if any, as an investment of the Fund, but do not include the underlying holdings of each Fidelity Central Fund. As an Investing Fund, the Fund indirectly bears its proportionate share of the expenses of the underlying Fidelity Central Funds.
The Money Market Central Funds seek preservation of capital and current income and are managed by Fidelity Investments Money Management, Inc. (FIMM), an affiliate of FMR.
A complete unaudited list of holdings for each Fidelity Central Fund is available upon request or at the Securities and Exchange Commission (the SEC) web site at www.sec.gov. In addition, the financial statements of the Fidelity Central Funds, which are not covered by the Fund's Report of Independent Registered Public Accounting Firm, are available on the SEC web site or upon request.
3. Significant Accounting Policies.
The financial statements have been prepared in conformity with accounting principles generally accepted in the United States of America (GAAP), which require management to make certain estimates and assumptions at the date of the financial statements. Actual results could differ from those estimates. Subsequent events, if any, through the date that the financial statements were issued have been evaluated in the preparation of the financial statements. The following summarizes the significant accounting policies of the Fund:
Annual Report
3. Significant Accounting Policies - continued
Security Valuation. Investments are valued as of 4:00 p.m. Eastern time on the last calendar day of the period. In accordance with valuation policies and procedures approved by the Board of Trustees (the Board), the Fund attempts to obtain prices from one or more third party pricing vendor or broker to value its investments. When current market prices, quotations or rates are not readily available or reliable, securities will be fair valued in good faith by the FMR Fair Value Committee (the Committee), in accordance with procedures adopted by the Fund's Board. Factors used in determining fair value vary by security type and may include market or security specific events. The frequency with which these procedures are used cannot be predicted and they may be utilized to a significant extent. The Committee oversees the Fund's valuation policies and procedures and is responsible for approving and reporting to the Board all fair value determinations.
The Fund categorizes the inputs to valuation techniques used to value its investments into a disclosure hierarchy consisting of three levels as shown below:
Level 1 - quoted prices in active markets for identical investments
Level 2 - other significant observable inputs (including quoted prices for similar investments, interest rates, prepayment speeds, etc.)
Level 3 - unobservable inputs (including the Fund's own assumptions based on the best information available)
Valuation techniques used to value the Fund's investments by major category are as follows:
Equity securities, including restricted securities, for which market quotations are readily available, are valued at the last reported sale price or official closing price as reported by a third party pricing vendor on the primary market or exchange on which they are traded and are categorized as Level 1 in the hierarchy. In the event there were no sales during the day or closing prices are not available, securities are valued at the last quoted bid price or may be valued using the last available price and are generally categorized as Level 2 in the hierarchy. For foreign equity securities, when significant market or security specific events arise, comparisons to the valuation of American Depositary Receipts (ADRs), futures contracts, Exchange-Traded Funds (ETFs)and certain indexes as well as quoted prices for similar securities are used and are categorized as Level 2 in the hierarchy. Utilizing these techniques may result in transfers between Level 1 and Level 2. For restricted equity securities and private placements where observable inputs are limited, assumptions about market activity and risk are used and these securities are categorized as Level 3 in the hierarchy.
Annual Report
Notes to Financial Statements - continued
(Amounts in thousands except percentages)
3. Significant Accounting Policies - continued
Security Valuation - continued
Investments in open-end mutual funds, including the Fidelity Central Funds, are valued at their closing net asset value each business day and are categorized as Level 1 in the hierarchy.
Changes in valuation techniques may result in transfers in or out of an assigned level within the disclosure hierarchy. The aggregate value of investments by input level, as of June 30, 2012, is included at the end of the Fund's Schedule of Investments.
Foreign Currency Translation. The Fund may use foreign currency contracts to facilitate transactions in foreign-denominated securities. Gains and losses from these transactions may arise from changes in the value of the foreign currency or if the counterparties do not perform under the contracts' terms.
Foreign-denominated assets, including investment securities, and liabilities are translated into U.S. dollars at the exchange rates at period end. Purchases and sales of investment securities, income and dividends received and expenses denominated in foreign currencies are translated into U.S. dollars at the exchange rate in effect on the transaction date.
The effects of exchange rate fluctuations on investments are included with the net realized and unrealized gain (loss) on investment securities. Other foreign currency transactions resulting in realized and unrealized gain (loss) are disclosed separately.
Investment Transactions and Income. For financial reporting purposes, the Fund's investment holdings and NAV include trades executed through the end of the last business day of the period. The NAV per share for processing shareholder transactions is calculated as of the close of business of the New York Stock Exchange (NYSE), normally 4:00 p.m. Eastern time and includes trades executed through the end of the prior business day. Gains and losses on securities sold are determined on the basis of identified cost and may include proceeds received from litigation. Dividend income is recorded on the ex-dividend date, except for certain dividends from foreign securities where the ex-dividend date may have passed, which are recorded as soon as the Fund is informed of the ex-dividend date. Non-cash dividends included in dividend income, if any, are recorded at the fair market value of the securities received. Distributions received on securities that represent a return of capital or capital gain are recorded as a reduction of cost of investments and/or as a realized gain. The Fund estimates the components of distributions received that may be considered return of capital distributions or capital gain distributions. Interest income and distributions from the Fidelity Central Funds are accrued as earned. Interest income includes coupon interest and amortization of premium and accretion of discount on debt securities. Investment income is recorded net of foreign taxes withheld where recovery of such taxes is uncertain.
Annual Report
3. Significant Accounting Policies - continued
Expenses. Expenses directly attributable to a fund are charged to that fund. Expenses attributable to more than one fund are allocated among the respective funds on the basis of relative net assets or other appropriate methods. Expense estimates are accrued in the period to which they relate and adjustments are made when actual amounts are known.
Income Tax Information and Distributions to Shareholders. Each year, the Fund intends to qualify as a regulated investment company under Subchapter M of the Internal Revenue Code, including distributing substantially all of its taxable income and realized gains. As a result, no provision for income taxes is required. As of June 30, 2012, the Fund did not have any unrecognized tax benefits in the financial statements; nor is the Fund aware of any tax positions for which it is reasonably possible that the total amounts of unrecognized tax benefits will significantly change in the next twelve months. The Fund files a U.S. federal tax return, in addition to state and local tax returns as required. A fund's federal income tax returns are subject to examination by the Internal Revenue Service (IRS) for a period of three fiscal years after they are filed. State and local tax returns may be subject to examination for an additional fiscal year depending on the jurisdiction. Foreign taxes are provided for based on the Fund's understanding of the tax rules and rates that exist in the foreign markets in which it invests.
Distributions are declared and recorded on the ex-dividend date. Income dividends and capital gain distributions are declared separately for each class. Income and capital gain distributions are determined in accordance with income tax regulations, which may differ from GAAP.
Capital accounts within the financial statements are adjusted for permanent book-tax differences. These adjustments have no impact on net assets or the results of operations. Temporary book-tax differences will reverse in a subsequent period.
Book-tax differences are primarily due to foreign currency transactions, passive foreign Investment companies (PFIC), partnerships, capital loss carryfowards and losses deferred due to wash sales and excise tax regulations.
The federal tax cost of investment securities and unrealized appreciation (depreciation) as of period end were as follows:
Gross unrealized appreciation | $ 193,117 |
Gross unrealized depreciation | (44,898) |
Net unrealized appreciation (depreciation) on securities and other investments | $ 148,219 |
| |
Tax Cost | $ 858,384 |
Annual Report
Notes to Financial Statements - continued
(Amounts in thousands except percentages)
3. Significant Accounting Policies - continued
Income Tax Information and Distributions to Shareholders - continued
The tax-based components of distributable earnings as of period end were as follows:
Undistributed ordinary income | $ 962 |
Capital loss carryforward | $ (540,298) |
Net unrealized appreciation (depreciation) | $ 148,212 |
Capital loss carryforwards are only available to offset future capital gains of the Fund to the extent provided by regulations and may be limited. Under the Regulated Investment Company Modernization Act of 2010 (the Act), the Fund is permitted to carry forward capital losses incurred in taxable years beginning after December 22, 2010 for an unlimited period and such capital losses are required to be used prior to any losses that expire. Capital loss carryforwards were as follows:
Fiscal year of expiration | |
2017 | $ (279,867) |
2018 | (260,431) |
Total capital loss carryforward | $ (540,298) |
The Fund intends to elect to defer to its fiscal year ending June 30, 2013 approximately $31,085 of capital losses recognized during the period November 1, 2011 to June 30, 2012.
The tax character of distributions paid was as follows:
| June 30, 2012 | June 30, 2011 |
Ordinary Income | $ 6,669 | $ 5,140 |
New Accounting Pronouncement. In December 2011, the Financial Accounting Standards Board issued Accounting Standard Update No. 2011-11, Disclosures about Offsetting Assets and Liabilities. The update creates new disclosure requirements requiring entities to disclose both gross and net information for derivatives and other financial instruments that are either offset in the Statement of Assets and Liabilities or subject to an enforceable master netting arrangement or similar agreement. The disclosure requirements are effective for interim and annual reporting periods beginning on or after January 1, 2013. Management is currently evaluating the impact of the update's adoption on the Fund's financial statement disclosures.
4. Operating Policies.
Restricted Securities. The Fund may invest in securities that are subject to legal or contractual restrictions on resale. These securities generally may be resold in transactions exempt from registration or to the public if the securities are registered.
Annual Report
4. Operating Policies - continued
Restricted Securities - continued
Disposal of these securities may involve time-consuming negotiations and expense, and prompt sale at an acceptable price may be difficult. Information regarding restricted securities is included at the end of the Fund's Schedule of Investments.
5. Purchases and Sales of Investments.
Purchases and sales of securities, other than short-term securities, aggregated $739,559 and $854,846, respectively.
6. Fees and Other Transactions with Affiliates.
Management Fee. FMR and its affiliates provide the Fund with investment management related services for which the Fund pays a monthly management fee. The management fee is the sum of an individual fund fee rate that is based on an annual rate of .30% of the Fund's average net assets and an annualized group fee rate that averaged .26% during the period. The group fee rate is based upon the average net assets of all the mutual funds advised by FMR. The group fee rate decreases as assets under management increase and increases as assets under management decrease. In addition, the management fee is subject to a performance adjustment (up to a maximum of ± .20% of the Fund's average net assets over a 36 month performance period). The upward or downward adjustment to the management fee is based on the relative investment performance of Growth Discovery as compared to an appropriate benchmark index. For the period, the total annual management fee rate, including the performance adjustment, was .53% of the Fund's average net assets.
Transfer Agent Fees. Fidelity Investments Institutional Operations Company, Inc. (FIIOC), an affiliate of FMR, is the transfer, dividend disbursing and shareholder servicing agent for each class of the Fund. FIIOC receives account fees and asset-based fees that vary according to the account size and type of account of the shareholders of Growth Discovery. FIIOC receives an asset-based fee of Class K's average net assets. FIIOC pays for typesetting, printing and mailing of shareholder reports, except proxy statements. For the period, transfer agent fees for each class were as follows:
| Amount | % of
Average
Net Assets |
Growth Discovery | $ 1,943 | .22 |
Class K | 80 | .05 |
| $ 2,023 | |
Annual Report
Notes to Financial Statements - continued
(Amounts in thousands except percentages)
6. Fees and Other Transactions with Affiliates - continued
Accounting and Security Lending Fees. Fidelity Service Company, Inc. (FSC), an affiliate of FMR, maintains the Fund's accounting records. The accounting fee is based on the level of average net assets for each month. Under a separate contract, FSC administers the security lending program. The security lending fee is based on the number and duration of lending transactions.
Brokerage Commissions. The Fund placed a portion of its portfolio transactions with brokerage firms which are affiliates of the investment adviser. The commissions paid to these affiliated firms were $15 for the period.
Interfund Lending Program. Pursuant to an Exemptive Order issued by the SEC, the Fund, along with other registered investment companies having management contracts with FMR, may participate in an interfund lending program. This program provides an alternative credit facility allowing the funds to borrow from, or lend money to, other participating affiliated funds. At period end, there were no interfund loans outstanding. The Fund's activity in this program during the period for which loans were outstanding was as follows:
Borrower or Lender | Average
Loan Balance | Weighted Average
Interest Rate | Interest
Expense |
Borrower | $ 7,579 | .41% | $ -* |
* Amount represents eighty-six dollars
7. Committed Line of Credit.
The Fund participates with other funds managed by FMR or an affiliate in a $4.25 billion credit facility (the "line of credit") to be utilized for temporary or emergency purposes to fund shareholder redemptions or for other short-term liquidity purposes. The Fund has agreed to pay commitment fees on its pro-rata portion of the line of credit, which amounted to $3 and is reflected in Miscellaneous expenses on the Statement of Operations. During the period, there were no borrowings on this line of credit.
8. Security Lending.
The Fund lends portfolio securities through a lending agent from time to time in order to earn additional income. For equity securities, a lending agent is used and may loan securities to certain qualified borrowers, including Fidelity Capital Markets (FCM), a broker-dealer affiliated with the Fund. On the settlement date of the loan, the Fund receives collateral (in the form of U.S. Treasury obligations, letters of credit and/or cash) against the loaned securities and maintains collateral in an amount not less than 100% of the market value of the loaned securities during the period of the loan. The market value of the loaned securities is determined at the close of business of the Fund and any
Annual Report
8. Security Lending - continued
additional required collateral is delivered to the Fund on the next business day. If the borrower defaults on its obligation to return the securities loaned because of insolvency or other reasons, a fund could experience delays and costs in recovering the securities loaned or in gaining access to the collateral. Any cash collateral received is invested in the Fidelity Securities Lending Cash Central Fund. The value of loaned securities and cash collateral at period end are disclosed on the Fund's Statement of Assets and Liabilities. The value of securities loaned to FCM at period end was $2,445. Security lending income represents the income earned on investing cash collateral, less rebates paid to borrowers and any lending agent fees associated with the loan, plus any premium payments received for lending certain types of securities. Security lending income is presented in the Statement of Operations as a component of income from Fidelity Central Funds. Total security lending income during the period amounted to $400, including $75 from securities loaned to FCM.
9. Expense Reductions.
Many of the brokers with whom FMR places trades on behalf of the Fund provided services to the Fund in addition to trade execution. These services included payments of certain expenses on behalf of the Fund totaling $34 for the period.
10. Distributions to Shareholders.
Distributions to shareholders of each class were as follows:
Years ended June 30, | 2012 | 2011 |
From net investment income | | |
Growth Discovery | $ 2,023 | $ 1,816 |
Class K | 590 | 270 |
Total | $ 2,613 | $ 2,086 |
From net realized gain | | |
Growth Discovery | $ 3,518 | $ 2,827 |
Class K | 538 | 227 |
Total | $ 4,056 | $ 3,054 |
Annual Report
Notes to Financial Statements - continued
(Amounts in thousands except percentages)
11. Share Transactions.
Transactions for each class of shares were as follows:
| Shares | Dollars |
Years ended June 30, | 2012 | 2011 | 2012 | 2011 |
Growth Discovery | | | | |
Shares sold | 15,041 | 19,688 | $ 218,798 | $ 275,535 |
Reinvestment of distributions | 395 | 350 | 5,284 | 4,463 |
Shares redeemed | (20,132) | (14,640) | (287,440) | (196,217) |
Net increase (decrease) | (4,696) | 5,398 | $ (63,358) | $ 83,781 |
Class K | | | | |
Shares sold | 5,792 | 7,755 | $ 82,594 | $ 109,446 |
Reinvestment of distributions | 84 | 39 | 1,128 | 497 |
Shares redeemed | (6,196) | (1,966) | (90,225) | (27,602) |
Net increase (decrease) | (320) | 5,828 | $ (6,503) | $ 82,341 |
12. Other.
The Fund's organizational documents provide former and current trustees and officers with a limited indemnification against liabilities arising in connection with the performance of their duties to the Fund. In the normal course of business, the Fund may also enter into contracts that provide general indemnifications. The Fund's maximum exposure under these arrangements is unknown as this would be dependent on future claims that may be made against the Fund. The risk of material loss from such claims is considered remote.
Annual Report
To the Trustees of Fidelity Hastings Street Trust and the Shareholders of Fidelity Growth Discovery Fund:
In our opinion, the accompanying statement of assets and liabilities, including the schedule of investments, and the related statements of operations and of changes in net assets and the financial highlights present fairly, in all material respects, the financial position of Fidelity Growth Discovery Fund (a fund of Fidelity Hastings Street Trust) at June 30, 2012, the results of its operations for the year then ended, the changes in its net assets for each of the two years in the period then ended and the financial highlights for each of the periods indicated, in conformity with accounting principles generally accepted in the United States of America. These financial statements and financial highlights (hereafter referred to as "financial statements") are the responsibility of the Fidelity Growth Discovery Fund's management. Our responsibility is to express an opinion on these financial statements based on our audits. We conducted our audits of these financial statements in accordance with the standards of the Public Company Accounting Oversight Board (United States). Those standards require that we plan and perform the audit to obtain reasonable assurance about whether the financial statements are free of material misstatement. An audit includes examining, on a test basis, evidence supporting the amounts and disclosures in the financial statements, assessing the accounting principles used and significant estimates made by management, and evaluating the overall financial statement presentation. We believe that our audits, which included confirmation of securities at June 30, 2012 by correspondence with the custodian and brokers, provide a reasonable basis for our opinion.
/s/ PricewaterhouseCoopers LLP
PricewaterhouseCoopers LLP
Boston, Massachusetts
August 10, 2012
Annual Report
The Trustees, Members of the Advisory Board, and executive officers of the trust and fund, as applicable, are listed below. The Board of Trustees governs the fund and is responsible for protecting the interests of shareholders. The Trustees are experienced executives who meet periodically throughout the year to oversee the fund's activities, review contractual arrangements with companies that provide services to the fund, oversee management of the risks associated with such activities and contractual arrangements, and review the fund's performance. Except for James C. Curvey, each of the Trustees oversees 228 funds advised by FMR or an affiliate. Mr. Curvey oversees 435 funds advised by FMR or an affiliate.
The Trustees hold office without limit in time except that (a) any Trustee may resign; (b) any Trustee may be removed by written instrument, signed by at least two-thirds of the number of Trustees prior to such removal; (c) any Trustee who requests to be retired or who has become incapacitated by illness or injury may be retired by written instrument signed by a majority of the other Trustees; and (d) any Trustee may be removed at any special meeting of shareholders by a two-thirds vote of the outstanding voting securities of the trust. Each Trustee who is not an interested person (as defined in the 1940 Act) (Independent Trustee), shall retire not later than the last day of the calendar year in which his or her 75th birthday occurs. The Independent Trustees may waive this mandatory retirement age policy with respect to individual Trustees. The executive officers and Advisory Board Members hold office without limit in time, except that any officer and Advisory Board Member may resign or may be removed by a vote of a majority of the Trustees at any regular meeting or any special meeting of the Trustees. Except as indicated, each individual has held the office shown or other offices in the same company for the past five years.
Experience, Skills, Attributes, and Qualifications of the Fund's Trustees. The Governance and Nominating Committee has adopted a statement of policy that describes the experience, qualifications, attributes, and skills that are necessary and desirable for potential Independent Trustee candidates (Statement of Policy). The Board believes that each Trustee satisfied at the time he or she was initially elected or appointed a Trustee, and continues to satisfy, the standards contemplated by the Statement of Policy. The Governance and Nominating Committee also engages professional search firms to help identify potential Independent Trustee candidates who have the experience, qualifications, attributes, and skills consistent with the Statement of Policy. From time to time, additional criteria based on the composition and skills of the current Independent Trustees, as well as experience or skills that may be appropriate in light of future changes to board composition, business conditions, and regulatory or other developments, have also been considered by the professional search firms and the Governance and Nominating Committee. In addition, the Board takes into account the Trustees' commitment and participation in Board and committee meetings, as well as their leadership of standing and ad hoc committees throughout their tenure.
In determining that a particular Trustee was and continues to be qualified to serve as a Trustee, the Board has considered a variety of criteria, none of which, in isolation, was controlling. The Board believes that, collectively, the Trustees have balanced and diverse experience, qualifications, attributes, and skills, which allow the Board to operate effectively in governing the fund and protecting the interests of shareholders. Information about the specific experience, skills, attributes, and qualifications of each Trustee, which in each case led to the Board's conclusion that the Trustee should serve (or continue to serve) as a trustee of the fund, is provided below.
Annual Report
Trustees and Officers - continued
Board Structure and Oversight Function. James C. Curvey is an interested person (as defined in the 1940 Act) and currently serves as Chairman. The Trustees have determined that an interested Chairman is appropriate and benefits shareholders because an interested Chairman has a personal and professional stake in the quality and continuity of services provided to the fund. Independent Trustees exercise their informed business judgment to appoint an individual of their choosing to serve as Chairman, regardless of whether the Trustee happens to be independent or a member of management. The Independent Trustees have determined that they can act independently and effectively without having an Independent Trustee serve as Chairman and that a key structural component for assuring that they are in a position to do so is for the Independent Trustees to constitute a substantial majority for the Board. The Independent Trustees also regularly meet in executive session. Ned C. Lautenbach serves as Chairman of the Independent Trustees and as such (i) acts as a liaison between the Independent Trustees and management with respect to matters important to the Independent Trustees and (ii) with management prepares agendas for Board meetings.
Fidelity funds are overseen by different Boards of Trustees. The fund's Board oversees Fidelity's equity and high income funds and another Board oversees Fidelity's investment-grade bond, money market, and asset allocation funds. The asset allocation funds may invest in Fidelity funds overseen by the fund's Board. The use of separate Boards, each with its own committee structure, allows the Trustees of each group of Fidelity funds to focus on the unique issues of the funds they oversee, including common research, investment, and operational issues. On occasion, the separate Boards establish joint committees to address issues of overlapping consequences for the Fidelity funds overseen by each Board.
The Trustees operate using a system of committees to facilitate the timely and efficient consideration of all matters of importance to the Trustees, the fund, and fund shareholders and to facilitate compliance with legal and regulatory requirements and oversight of the fund's activities and associated risks. The Board, acting through its committees, has charged FMR and its affiliates with (i) identifying events or circumstances the occurrence of which could have demonstrably adverse effects on the fund's business and/or reputation; (ii) implementing processes and controls to lessen the possibility that such events or circumstances occur or to mitigate the effects of such events or circumstances if they do occur; and (iii) creating and maintaining a system designed to evaluate continuously business and market conditions in order to facilitate the identification and implementation processes described in (i) and (ii) above. Because the day-to-day operations and activities of the fund are carried out by or through FMR, its affiliates and other service providers, the fund's exposure to risks is mitigated but not eliminated by the processes overseen by the Trustees. While each of the Board's committees has responsibility for overseeing different aspects of the fund's activities, oversight is exercised primarily through the Operations, Audit, and Compliance Committees. In addition, the Independent Trustees have worked with FMR to enhance the Board's oversight of investment and financial risks, legal and regulatory risks, technology risks, and operational risks, including the development of additional risk reporting to the Board. For example, a working group comprised of Independent Trustees and FMR has worked and continues to work to review the Fidelity funds' valuation-related activities, reporting and risk management. Appropriate personnel, including but not limited to the fund's Chief Compliance Officer (CCO), FMR's internal auditor, the independent accountants, the fund's Treasurer and portfolio management personnel, make periodic reports to the Board's committees, as appropriate, including an annual review of FMR's risk management program for the Fidelity funds. The responsibilities of each standing committee, including their oversight responsibilities, are described further under "Standing Committees of the Fund's Trustees."
Annual Report
The fund's Statement of Additional Information (SAI) includes more information about the Trustees. To request a free copy, call Fidelity at 1-800-544-8544.
Interested Trustees*:
Correspondence intended for each Trustee who is an interested person may be sent to Fidelity Investments, 82 Devonshire Street, Boston, Massachusetts 02109.
Name, Age; Principal Occupations and Other Relevant Experience+ |
James C. Curvey (77) |
| Year of Election or Appointment: 2007 Mr. Curvey is Trustee and Chairman of the Board of Trustees of certain Trusts. Mr. Curvey also serves as Trustee (2007-present) of other investment companies advised by FMR. Mr. Curvey is a Director of Fidelity Investments Money Management, Inc. (2009-present), Director of Fidelity Research & Analysis Co. (2009-present) and Director of FMR and FMR Co., Inc. (2007-present). Mr. Curvey is also Vice Chairman (2007-present) and Director of FMR LLC. In addition, Mr. Curvey serves as an Overseer for the Boston Symphony Orchestra and a member of the Trustees of Villanova University. Previously, Mr. Curvey was the Vice Chairman (2006-2007) and Director (2000-2007) of FMR Corp. |
Ronald P. O'Hanley (55) |
| Year of Election or Appointment: 2011 Mr. O'Hanley is Director of FMR Co., Inc. (2010-present), Director of Fidelity Investments Money Management, Inc. (2010-present), Director of Fidelity Research & Analysis Company (2010-present), President of Fidelity Asset Management and Corporate Services and a member of Fidelity's Executive Committee (2010-present). Previously, Mr. O'Hanley served as President and Chief Executive Officer of BNY Mellon Asset Management (2007-2010). Mr. O'Hanley also served as Vice Chairman of Bank New York Mellon Corp. and a member of that firm's Executive Committee. Prior to the 2007 merger of The Bank of New York and Mellon Financial Corporation, he was Vice Chairman of Mellon Financial Corporation and President and Chief Executive Officer of Mellon Asset Management. He joined Mellon in February 1997. Mr. O'Hanley currently serves as Chairman of the Boston Public Library Foundation Board of Directors and sits on the Board of Directors of Beth Israel Deaconess Medical Center, the Board of Trustees of the Marine Biological Laboratory and the Advisory Board of the Maxwell School of Citizenship and Public Administration at Syracuse University. Mr. O'Hanley also chairs the Council on Asset Management for the Financial Services Roundtable and is a member of the Board of Directors of Institutional Investor's U.S. Institute. |
* Trustees have been determined to be "Interested Trustees" by virtue of, among other things, their affiliation with the trust or various entities under common control with FMR.
+ The information above includes each Trustee's principal occupation during the last five years and other information relating to the experience, attributes, and skills relevant to each Trustee's qualifications to serve as a Trustee, which led to the conclusion that each Trustee should serve as a Trustee for the fund.
Annual Report
Independent Trustees:
Correspondence intended for each Independent Trustee (that is, the Trustees other than the Interested Trustees) may be sent to Fidelity Investments, P.O. Box 55235, Boston, Massachusetts 02205-5235.
Name, Age; Principal Occupations and Other Relevant Experience+ |
Dennis J. Dirks (64) |
| Year of Election or Appointment: 2005 Prior to his retirement in May 2003, Mr. Dirks was Chief Operating Officer and a member of the Board of The Depository Trust & Clearing Corporation (DTCC). He also served as President, Chief Operating Officer, and Board member of The Depository Trust Company (DTC) and President and Board member of the National Securities Clearing Corporation (NSCC). In addition, Mr. Dirks served as Chief Executive Officer and Board member of the Government Securities Clearing Corporation, Chief Executive Officer and Board member of the Mortgage-Backed Securities Clearing Corporation, as a Trustee and a member of the Finance Committee of Manhattan College (2005-2008), and as a Trustee and a member of the Finance Committee of AHRC of Nassau County (2006-2008). Mr. Dirks is a member of the Independent Directors Council (IDC) Governing Council (2010-present) and Board of Directors for The Brookville Center for Children's Services, Inc. (2009-present). |
Alan J. Lacy (58) |
| Year of Election or Appointment: 2008 Mr. Lacy serves as Senior Adviser (2007-present) of Oak Hill Capital Partners, L.P. (private equity). Mr. Lacy also served as Chief Executive Officer (2000-2005) and Vice Chairman (2005-2006) of Sears Holdings Corporation and Sears, Roebuck and Co. (retail). In addition, Mr. Lacy serves as a member of the Board of Directors of Dave & Buster's, Inc. (restaurant and entertainment complexes, 2010-present), The Hillman Companies, Inc. (hardware wholesalers, 2010-present), and Bristol-Myers Squibb Company (global pharmaceuticals, 2007-present). Mr. Lacy is a member of the Board of Trustees of The National Parks Conservation Association (2006-present). Previously, Mr. Lacy served as Chairman of the Board of Trustees of the National Parks Conservation Association (2008-2011) and as a member of the Board of Directors for the Western Union Company (global money transfer, 2006-2011). |
Ned C. Lautenbach (68) |
| Year of Election or Appointment: 2000 Mr. Lautenbach is Chairman of the Independent Trustees of the Equity and High Income Funds (2006-present). Mr. Lautenbach currently serves as the Lead Director of the Eaton Corporation Board of Directors (diversified industrial, 1997-present). Mr. Lautenbach is also a member of the Board of Directors of the Philharmonic Center for the Arts in Naples, Florida (1999-present); a member of the Board of Trustees of Fairfield University (2005-present); and a member of the Council on Foreign Relations (1994-present). Previously, Mr. Lautenbach was a Partner/Advisory Partner at Clayton, Dubilier & Rice, LLC (private equity investment, 1998-2010), as well as a Director of Sony Corporation (2006-2007). |
Joseph Mauriello (67) |
| Year of Election or Appointment: 2008 Prior to his retirement in January 2006, Mr. Mauriello served in numerous senior management positions including Deputy Chairman and Chief Operating Officer (2004-2005), and Vice Chairman of Financial Services (2002-2004) of KPMG LLP US (professional services, 1965-2005). Mr. Mauriello currently serves as a member of the Board of Directors of XL Group plc. (global insurance and re-insurance, 2006-present). Previously, Mr. Mauriello served as a Director of the Hamilton Funds of the Bank of New York (2006-2007) and Arcadia Resources Inc. (health care services and products, 2007-2012). |
Robert W. Selander (61) |
| Year of Election or Appointment: 2011 Previously, Mr. Selander served as a Member of the Advisory Board of Fidelity's Equity and High Income Funds (2011), Executive Vice Chairman (2010), Chief Executive Officer (2009-2010), and President and Chief Executive Officer (1997-2009) of Mastercard, Inc. |
Cornelia M. Small (67) |
| Year of Election or Appointment: 2005 Ms. Small is a member of the Board of Directors of the Teagle Foundation (2009-present). Ms. Small is also a member of the Investment Committee, and Chair (2008-present) and a member of the Board of Trustees of Smith College. In addition, Ms. Small serves on the Investment Committee of the Berkshire Taconic Community Foundation (2008-present). Previously, Ms. Small served as Chairperson of the Investment Committee (2002-2008) of Smith College. In addition, Ms. Small served as Chief Investment Officer, Director of Global Equity Investments, and a member of the Board of Directors of Scudder, Stevens & Clark and Scudder Kemper Investments. |
William S. Stavropoulos (73) |
| Year of Election or Appointment: 2001 Mr. Stavropoulos is Vice Chairman of the Independent Trustees of the Equity and High Income Funds (2006-present). Mr. Stavropoulos serves as President and Founder of the Michigan Baseball Foundation, the Great Lakes Loons (2007-present). Mr. Stavropoulos is Chairman Emeritus of the Board of Directors of The Dow Chemical Company, where he previously served in numerous senior management positions, including President, CEO (1995-2000; 2002-2004), Chairman of the Executive Committee (2000-2006), and as a member of the Board of Directors (1990-2006). Currently, Mr. Stavropoulos is Chairman of Univar (global distributor of commodity and specialty chemicals, 2010-present), a Director of Teradata Corporation (data warehousing and technology solutions, 2008-present), Chemical Financial Corporation, Maersk Inc. (industrial conglomerate), Tyco International, Inc. (multinational manufacturing and services, 2007-present), and a member of the Advisory Board for Metalmark Capital (private equity investment, 2005-present). Mr. Stavropoulos is a special advisor to Clayton, Dubilier & Rice, LLC (private equity investment). In addition, Mr. Stavropoulos is a member of the University of Notre Dame Advisory Council for the College of Science. |
David M. Thomas (63) |
| Year of Election or Appointment: 2008 Previously, Mr. Thomas served as Executive Chairman (2005-2006) and Chairman and Chief Executive Officer (2000-2005) of IMS Health, Inc. (pharmaceutical and healthcare information solutions). In addition, Mr. Thomas serves as a member of the Board of Directors of Fortune Brands, Inc. (consumer products), and Interpublic Group of Companies, Inc. (marketing communication, 2004-present). |
Michael E. Wiley (61) |
| Year of Election or Appointment: 2008 Mr. Wiley also serves as a Director of Asia Pacific Exploration Consolidated (international oil and gas exploration and production, 2008-present). Mr. Wiley serves as a Director of Tesoro Corporation (independent oil refiner and marketer, 2005-present), and a Director of Bill Barrett Corporation (exploration and production, 2005-present). In addition, Mr. Wiley also serves as a Director of Post Oak Bank (privately-held bank, 2004-present). Previously, Mr. Wiley served as a member of the Board of Trustees of the University of Tulsa (2000-2006; 2007-2010), as a Senior Energy Advisor of Katzenbach Partners, LLC (consulting, 2006-2007), as an Advisory Director of Riverstone Holdings (private investment), Chairman, President, and CEO of Baker Hughes, Inc. (oilfield services, 2000-2004), and as Director of Spinnaker Exploration Company (exploration and production, 2001-2005). |
Annual Report
Trustees and Officers - continued
+ The information above includes each Trustee's principal occupation during the last five years and other information relating to the experience, attributes, and skills relevant to each Trustee's qualifications to serve as a Trustee, which led to the conclusion that each Trustee should serve as a Trustee for the fund.
Advisory Board Members and Executive Officers:
Correspondence intended for David A. Rosow and Garnett A. Smith may be sent to Fidelity Investments, P.O. Box 55235, Boston, Massachusetts 02205-5235. Correspondence intended for each executive officer, Edward C. Johnson 3d, and Peter S. Lynch may be sent to Fidelity Investments, 82 Devonshire Street, Boston, Massachusetts 02109.
Name, Age; Principal Occupation |
Edward C. Johnson 3d (82) |
| Year of Election or Appointment: 2011 Member of the Advisory Board of Fidelity's Equity and High Income Funds. Mr. Johnson serves as Chief Executive Officer, Chairman, and a Director of FMR LLC, and also serves as Chairman and Director of FIL Limited. Previously, Mr. Johnson served as a Trustee and Chairman of the Board of certain Fidelity Trusts, Chairman and a Director of FMR, Chairman and a Director of FMR Co., Inc., and President of FMR LLC (2006-2007). |
Peter S. Lynch (68) |
| Year of Election or Appointment: 2003 Member of the Advisory Board of Fidelity's Equity and High Income Funds. Mr. Lynch is Vice Chairman and a Director of FMR and FMR Co., Inc. In addition, Mr. Lynch serves as a Trustee of Boston College and as the Chairman of the Inner-City Scholarship Fund. Previously, Mr. Lynch served on the Special Olympics International Board of Directors (1997-2006). |
David A. Rosow (69) |
| Year of Election or Appointment: 2012 Member of the Advisory Board of Fidelity's Equity and High Income Funds. Chairman and Chief Executive Officer of International Golf Group, Inc. (golf course development, 1990-present). Previously, Mr. Rosow served as Chairman and Chief Executive Officer of Rosow & Company, Inc. (private investment company, 1989-2011), a Lead Director of Hudson United Bancorp (2001-2006) and as a Director of TD Banknorth (1996-2006). In addition, Mr. Rosow is a member (2008-present) and President (2009-present) of the Town Council of Palm Beach, Florida. |
Garnett A. Smith (64) |
| Year of Election or Appointment: 2012 Member of the Advisory Board of Fidelity's Equity and High Income Funds. Prior to Mr. Smith's retirement, he served as Chairman and Chief Executive Officer of Inbrand Corp. (manufacturer of personal absorbent products, 1990-1997). He also served as President (1986-1990) of Inbrand Corp. Prior to his employment with Inbrand Corp., he was employed by a retail fabric chain and North Carolina National Bank. In addition, Mr. Smith is a board member of the Jackson Hole Land Trust (2009-present). |
Kenneth B. Robins (42) |
| Year of Election or Appointment: 2008 President and Treasurer of Fidelity's Equity and High Income Funds. Mr. Robins also serves as President and Treasurer (2010-present) and Assistant Treasurer (2009-present) of other Fidelity funds and is an employee of Fidelity Investments (2004-present). Previously, Mr. Robins served as Deputy Treasurer of the Fidelity funds (2005-2008) and Treasurer and Chief Financial Officer of The North Carolina Capital Management Trust: Cash and Term Portfolios (2006-2008). |
Bruce T. Herring (46) |
| Year of Election or Appointment: 2006 Vice President of certain Equity Funds. Mr. Herring also serves as President of Fidelity Research & Analysis Company (2010-present), Chief Investment Officer and Director of Fidelity Management & Research (U.K.) Inc. (2010-present) and Group Chief Investment Officer of FMR. Previously, Mr. Herring served as Vice President (2005-2006) and Senior Vice President (2006-2007) of Fidelity Management & Research Company, Vice President of FMR Co., Inc. (2001-2007) and as a portfolio manager for Fidelity U.S. Equity Funds. |
Brian B. Hogan (47) |
| Year of Election or Appointment: 2009 Vice President of Equity and High Income Funds. Mr. Hogan also serves as President of FMR's Equity Division (2009-present). Previously, Mr. Hogan served as Senior Vice President, Equity Research of FMR (2006-2009) and as a portfolio manager. |
Scott C. Goebel (44) |
| Year of Election or Appointment: 2008 Secretary and Chief Legal Officer (CLO) of the Fidelity funds. Mr. Goebel also serves as Secretary of Fidelity Investments Money Management, Inc. (FIMM) (2010-present) and Fidelity Research and Analysis Company (FRAC) (2010-present); Secretary and CLO of The North Carolina Capital Management Trust: Cash and Term Portfolios (2008-present); General Counsel, Secretary, and Senior Vice President of FMR (2008-present) and FMR Co., Inc. (2008-present); employed by FMR LLC or an affiliate (2001-present); Chief Legal Officer of Fidelity Management & Research (Hong Kong) Limited (2008-present) and Assistant Secretary of Fidelity Management & Research (Japan) Inc. (2008-present), and Fidelity Management & Research (U.K.) Inc. (2008-present). Previously, Mr. Goebel served as Assistant Secretary of FIMM (2008-2010), FRAC (2008-2010), and the Funds (2007-2008) and as Vice President and Secretary of Fidelity Distributors Corporation (FDC) (2005-2007). |
William C. Coffey (43) |
| Year of Election or Appointment: 2009 Assistant Secretary of Fidelity's Equity and High Income Funds. Mr. Coffey also serves as Senior Vice President and Deputy General Counsel of FMR LLC (2010-present), and is an employee of Fidelity Investments. Previously, Mr. Coffey served as Vice President and Associate General Counsel of FMR LLC (2005-2009). |
Elizabeth Paige Baumann (44) |
| Year of Election or Appointment: 2012 Anti-Money Laundering (AML) Officer of the Fidelity funds. Ms. Baumann also serves as AML Officer of The North Carolina Capital Management Trust: Cash and Term Portfolios (2012-present), Chief AML Officer of FMR LLC (2012-present), and is an employee of Fidelity Investments. Previously, Ms. Baumann served as Vice President and Deputy Anti-Money Laundering Officer (2007-2012). |
Christine Reynolds (53) |
| Year of Election or Appointment: 2008 Chief Financial Officer of the Fidelity funds. Ms. Reynolds became President of Fidelity Pricing and Cash Management Services (FPCMS) in August 2008. Ms. Reynolds served as Chief Operating Officer of FPCMS (2007-2008). Previously, Ms. Reynolds served as President, Treasurer, and Anti-Money Laundering officer of the Fidelity funds (2004-2007). |
Joseph A. Hanlon (44) |
| Year of Election or Appointment: 2012 Chief Compliance Officer of Fidelity's Equity and High Income Funds. Mr. Hanlon serves as Compliance Officer of FMR, FMR Co., Inc., Fidelity Investments Money Management, Inc. (FIMM), Fidelity Research and Analysis Company (FRAC), Fidelity Management & Research (Japan) Inc., Fidelity Management & Research (U.K.) Inc., Fidelity Management & Research (Hong Kong), and Strategic Advisers, Inc. (2009-present), as Senior Vice President of the Fidelity Asset Management Division (2009-present), and is an employee of Fidelity Investments. |
Joseph F. Zambello (55) |
| Year of Election or Appointment: 2011 Deputy Treasurer of the Fidelity funds. Mr. Zambello is an employee of Fidelity Investments. Previously, Mr. Zambello served as Vice President of FMR's Program Management Group (2009-2011) and Vice President of the Transfer Agent Oversight Group (2005-2009). |
Adrien E. Deberghes (44) |
| Year of Election or Appointment: 2008 Deputy Treasurer of Fidelity's Equity and High Income Funds. Mr. Deberghes also serves as Vice President (2011-present) and Assistant Treasurer (2010-present) of other Fidelity funds, and is an employee of Fidelity Investments (2008-present). Previously, Mr. Deberghes served as Senior Vice President of Mutual Fund Administration at State Street Corporation (2007-2008), Senior Director of Mutual Fund Administration at Investors Bank & Trust (2005-2007), and Director of Finance for Dunkin' Brands (2000-2005). |
Stephanie J. Dorsey (43) |
| Year of Election or Appointment: 2010 Assistant Treasurer of Fidelity's Equity and High Income Funds. Ms. Dorsey also serves as Deputy Treasurer of other Fidelity funds (2008-present) and is an employee of Fidelity Investments (2008-present). Previously, Ms. Dorsey served as Treasurer (2004-2008) of the JPMorgan Mutual Funds and Vice President (2004-2008) of JPMorgan Chase Bank. |
John R. Hebble (54) |
| Year of Election or Appointment: 2009 Assistant Treasurer of Fidelity's Equity and High Income Funds. Mr. Hebble also serves as President (2011-present), Treasurer, and Chief Financial Officer of The North Carolina Capital Management Trust: Cash and Term Portfolios (2008-present), President and Treasurer of other Fidelity funds (2008-present) and is an employee of Fidelity Investments. |
Gary W. Ryan (53) |
| Year of Election or Appointment: 2005 Assistant Treasurer of the Fidelity funds. Mr. Ryan is an employee of Fidelity Investments. Previously, Mr. Ryan served as Vice President of Fund Reporting in Fidelity Pricing and Cash Management Services (FPCMS) (1999-2005). |
Jonathan Davis (44) |
| Year of Election or Appointment: 2010 Assistant Treasurer of the Fidelity funds. Mr. Davis is also Assistant Treasurer of Fidelity Rutland Square Trust II and Fidelity Commonwealth Trust II. Mr. Davis is an employee of Fidelity Investments. Previously, Mr. Davis served as Vice President and Associate General Counsel of FMR LLC (2003-2010). |
Annual Report
Growth Discovery designates 61% and 100% of the dividend distributed in August and December, respectively, during the fiscal year as qualifying for the dividends-received deduction for corporate shareholders.
Growth Discovery designates 88% and 100% of the dividend distributed in August and December, respectively, during the fiscal year as amounts which may be taken into account as a dividend for the purposes of the maximum rate under section 1(h)(11) of the Internal Revenue Code.
The fund will notify shareholders in January 2013 of amounts for use in preparing 2012 income tax returns.
Annual Report
Investment Adviser
Fidelity Management &
Research Company
Boston, MA
Investment Sub-Advisers
FMR Co., Inc.
Fidelity Management & Research
(U.K.) Inc.
Fidelity Management & Research
(Japan) Inc.
Fidelity Management & Research
(Hong Kong) Limited
General Distributor
Fidelity Distributors Corporation
Smithfield, RI
Transfer and Service Agents
Fidelity Investments Institutional
Operations Company, Inc.
Boston, MA
Fidelity Service Company, Inc.
Boston, MA
Custodian
Brown Brothers Harriman & Co.
Boston, MA
The Fidelity Telephone Connection
Mutual Fund 24-Hour Service
Exchanges/Redemptions
and Account Assistance 1-800-544-6666
Product Information 1-800-544-6666
Retirement Accounts 1-800-544-4774
(8 a.m. - 9 p.m.)
TDD Service 1-800-544-0118
for the deaf and hearing impaired
(9 a.m. - 9 p.m. Eastern time)
Fidelity Automated Service
Telephone (FAST ®)
1-800-544-5555
Automated line for quickest service
CII-UANN-0812
1.787730.109
(Fidelity Investment logo)(registered trademark)
Corporate Headquarters
82 Devonshire St., Boston, MA 02109
www.fidelity.com
Fidelity®
Growth Discovery
Fund -
Class K
Annual Report
June 30, 2012
(Fidelity Cover Art)
Contents
Performance | (Click Here) | How the fund has done over time. |
Management's Discussion of Fund Performance | (Click Here) | The Portfolio Manager's review of fund performance and strategy. |
Shareholder Expense Example | (Click Here) | An example of shareholder expenses. |
Investment Changes | (Click Here) | A summary of major shifts in the fund's investments over the past six months. |
Investments | (Click Here) | A complete list of the fund's investments with their market values. |
Financial Statements | (Click Here) | Statements of assets and liabilities, operations, and changes in net assets, as well as financial highlights. |
Notes | (Click Here) | Notes to the financial statements. |
Report of Independent Registered Public Accounting Firm | (Click Here) | |
Trustees and Officers | (Click Here) | |
Distributions | (Click Here) | |
To view a fund's proxy voting guidelines and proxy voting record for the 12-month period ended June 30, visit http://www.fidelity.com/proxyvotingresults or visit the Securities and Exchange Commission's (SEC) web site at http://www.sec.gov. You may also call 1-800-835-5092 to request a free copy of the proxy voting guidelines.
Standard & Poor's, S&P and S&P 500 are registered service marks of The McGraw-Hill Companies, Inc. and have been licensed for use by Fidelity Distributors Corporation.
Other third party marks appearing herein are the property of their respective owners.
All other marks appearing herein are registered or unregistered trademarks or service marks of FMR LLC or an affiliated company. © 2012 FMR LLC. All rights reserved.
Annual Report
This report and the financial statements contained herein are submitted for the general information of the shareholders of the fund. This report is not authorized for distribution to prospective investors in the fund unless preceded or accompanied by an effective prospectus.
A fund files its complete schedule of portfolio holdings with the SEC for the first and third quarters of each fiscal year on Form N-Q. Forms N-Q are available on the SEC's web site at http://www.sec.gov. A fund's Forms N-Q may be reviewed and copied at the SEC's Public Reference Room in Washington, DC. Information regarding the operation of the SEC's Public Reference Room may be obtained by calling 1-800-SEC-0330. For a complete list of a fund's portfolio holdings, view the most recent holdings listing, semiannual report, or annual report on Fidelity's web site at http://www.fidelity.com, http://www.advisor.fidelity.com, or http://www.401k.com, as applicable.
NOT FDIC INSURED • MAY LOSE VALUE • NO BANK GUARANTEE
Neither the fund nor Fidelity Distributors Corporation is a bank.
Annual Report
Average annual total return reflects the change in the value of an investment, assuming reinvestment of the class' distributions from dividend income and capital gains (the profits earned upon the sale of securities that have grown in value, if any) and assuming a constant rate of performance each year. The $10,000 table and the fund's returns do not reflect the deduction of taxes that a shareholder would pay on fund distributions or the redemption of fund shares. During periods of reimbursement by Fidelity, a fund's total return will be greater than it would be had the reimbursement not occurred. How a fund did yesterday is no guarantee of how it will do tomorrow.
Average Annual Total Returns
Periods ended June 30, 2012 | Past 1
year | Past 5
years | Past 10
years |
Class K A, B | 2.27% | 1.67% | 5.74% |
A Prior to February 1, 2007, the fund operated under certain different investment policies. The fund's historical performance may not represent its current investment policies.
B The initial offering of Class K shares took place on May 9, 2008. Returns prior to May 9, 2008 are those of Fidelity® Growth Discovery Fund, the original class of the fund.
$10,000 Over 10 Years
Let's say hypothetically that $10,000 was invested in Fidelity® Growth Discovery Fund - Class K on June 30, 2002. The chart shows how the value of your investment would have changed, and also shows how the Russell 3000® Growth Index performed over the same period. The initial offering of Class K took place on May 9, 2008. See above for additional information regarding the performance of Class K.
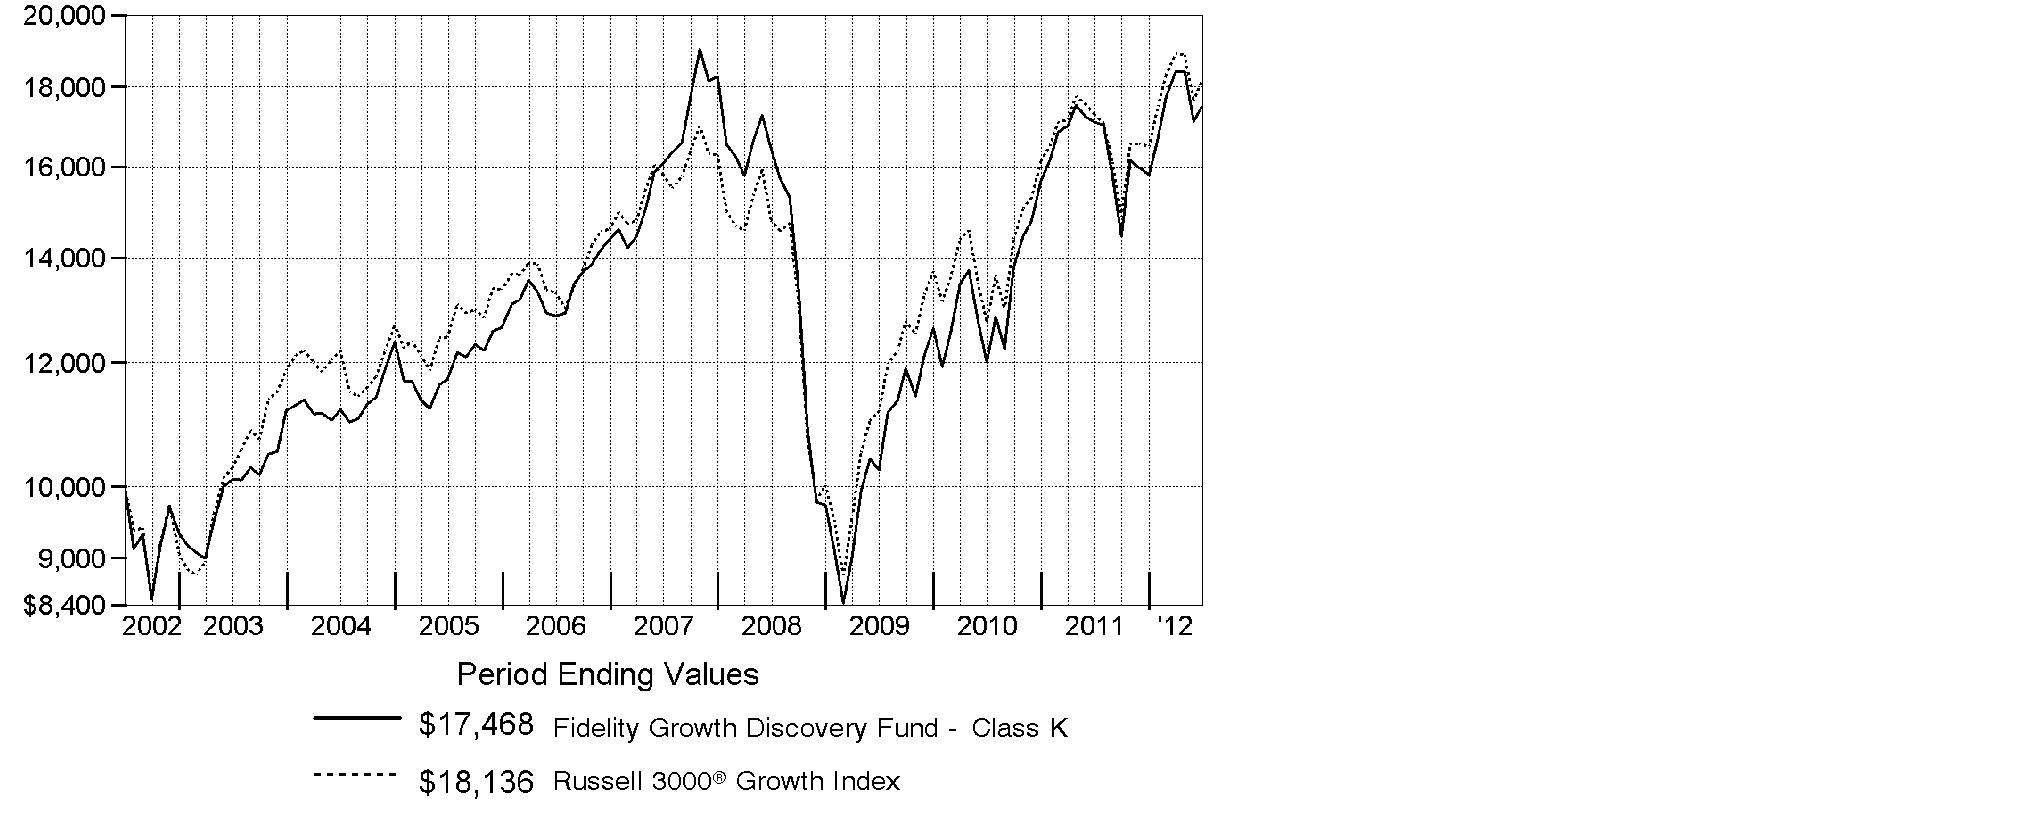
Annual Report
Market Recap: Major U.S. equity benchmarks posted solid gains for the 12 months ending June 30, 2012, even amid the period's uncertain investment environment. The broad-based S&P 500® Index returned 5.45%, while the blue-chip-laden Dow Jones Industrial AverageSM and the technology-heavy Nasdaq Composite® Index gained 6.63% and 6.99%, respectively. Volatility marked the first half of the period, as equities plummeted last summer and early fall on Europe's debt woes, debate over the U.S. debt ceiling and the credit-rating downgrade that followed. Beginning in October, healthier manufacturing, consumer and housing data rejuvenated markets and investors' appetite for stocks, leading major equity benchmarks to their best first-quarter performance since 1998. Stocks slipped again in the spring, as more eurozone trouble and a marked slowdown in China put the brakes on earlier momentum, until optimism reappeared in June. For the period, five of the 10 major market segments within the S&P 500® posted a double-digit gain, led by the more-defensive utilities, consumer staples and telecommunication services sectors, each of which rose about 15%. Conversely, energy (-8%) and materials (-7%) struggled the most. Given Europe's turmoil and local currency weakness, foreign developed-markets stocks lost ground, with the MSCI® EAFE® Index returning -13.70%.
Comments from Jason Weiner, Portfolio Manager of Fidelity® Growth Discovery Fund: For the year, the fund's Class K shares advanced 2.27%, trailing the 5.05% result of the Russell 3000® Growth Index. Picks in the food, beverage and tobacco industry hurt, primarily due to the fund's investment in Green Mountain Coffee Roasters, the biggest relative detractor. The stock struggled as investors became fearful that the firm wouldn't be able to sustain its rapid growth and some well-known short sellers were openly critical about the stock. In May, Green Mountain overestimated the amount of demand for its products and reduced its capital expenditure program, causing shares to plummet. Picks in energy also hurt, including Halliburton and Baker Hughes, which were among the fund's biggest detractors. The fund had disappointing results within health care and financials, and its foreign holdings detracted overall, hampered in part by a generally stronger U.S. dollar. Conversely, overweighting tech giant Apple - by far the fund's largest holding - was the biggest relative contributor, as continued strong sales of the company's iPhone® 4S smartphone boosted its stock. Security selection within consumer discretionary and the capital goods segment of industrials helped, including aircraft-components maker Goodrich. I sold Goodrich before period end.
The views expressed above reflect those of the portfolio manager(s) only through the end of the period as stated on the cover of this report and do not necessarily represent the views of Fidelity or any other person in the Fidelity organization. Any such views are subject to change at any time based upon market or other conditions and Fidelity disclaims any responsibility to update such views. These views may not be relied on as investment advice and, because investment decisions for a Fidelity fund are based on numerous factors, may not be relied on as an indication of trading intent on behalf of any Fidelity fund.
Annual Report
Shareholder Expense Example
As a shareholder of the Fund, you incur two types of costs: (1) transaction costs, and (2) ongoing costs, including management fees and other Fund expenses. This Example is intended to help you understand your ongoing costs (in dollars) of investing in the Fund and to compare these costs with the ongoing costs of investing in other mutual funds.
The Example is based on an investment of $1,000 invested at the beginning of the period and held for the entire period (January 1, 2012 to June 30, 2012).
Actual Expenses
The first line of the accompanying table for each class of the Fund provides information about actual account values and actual expenses. You may use the information in this line, together with the amount you invested, to estimate the expenses that you paid over the period. Simply divide your account value by $1,000.00 (for example, an $8,600 account value divided by $1,000.00 = 8.6), then multiply the result by the number in the first line for a class of the Fund under the heading entitled "Expenses Paid During Period" to estimate the expenses you paid on your account during this period. A small balance maintenance fee of $12.00 that is charged once a year may apply for certain accounts with a value of less than $2,000. This fee is not included in the table below. If it was, the estimate of expenses you paid during the period would be higher, and your ending account value lower, by this amount. In addition, the Fund, as a shareholder in the underlying Fidelity Central Funds, will indirectly bear its pro-rata share of the fees and expenses incurred by the underlying Fidelity Central Funds. These fees and expenses are not included in the Fund's annualized expense ratio used to calculate the expense estimate in the table below.
Hypothetical Example for Comparison Purposes
The second line of the accompanying table for each class of the Fund provides information about hypothetical account values and hypothetical expenses based on a Class' actual expense ratio and an assumed rate of return of 5% per year before expenses, which is not the Class' actual return. The hypothetical account values and expenses may not be used to estimate the actual ending account balance or expenses you paid for the period. You may use this information to compare the ongoing costs of investing in the Fund and other funds. To do so, compare this 5% hypothetical example with the 5% hypothetical examples that appear in the shareholder reports of the other funds. A small balance maintenance fee of $12.00 that is charged once a year may apply for certain accounts with a value of less than $2,000. This fee is not included in the table below. If it was, the estimate of expenses you paid during the period would be higher, and your ending account value lower, by this amount. In addition, the Fund, as a shareholder in the underlying Fidelity Central Funds, will indirectly bear its pro-rata share of the fees and expenses incurred by the underlying Fidelity Central Funds. These fees and expenses are not included in the Fund's annualized expense ratio used to calculate the expense estimate in the table below.
Please note that the expenses shown in the table are meant to highlight your ongoing costs only and do not reflect any transaction costs. Therefore, the second line of the table is useful in comparing ongoing costs only, and will not help you determine the relative total costs of owning different funds.
Annual Report
| Annualized
Expense Ratio | Beginning
Account Value
January 1, 2012 | Ending
Account Value
June 30, 2012 | Expenses Paid
During Period*
January 1, 2012
to June 30, 2012 |
Growth Discovery | .88% | | | |
Actual | | $ 1,000.00 | $ 1,104.70 | $ 4.61 |
HypotheticalA | | $ 1,000.00 | $ 1,020.49 | $ 4.42 |
Class K | .71% | | | |
Actual | | $ 1,000.00 | $ 1,105.50 | $ 3.72 |
HypotheticalA | | $ 1,000.00 | $ 1,021.33 | $ 3.57 |
A 5% return per year before expenses
* Expenses are equal to each Class' annualized expense ratio, multiplied by the average account value over the period, multiplied by 182/366 (to reflect the one-half year period).
Annual Report
Investment Changes (Unaudited)
Top Ten Stocks as of June 30, 2012 |
| % of fund's
net assets | % of fund's net assets
6 months ago |
Apple, Inc. | 11.4 | 8.7 |
QUALCOMM, Inc. | 2.8 | 2.2 |
Harley-Davidson, Inc. | 2.1 | 0.8 |
The Coca-Cola Co. | 2.0 | 1.3 |
Home Depot, Inc. | 2.0 | 0.4 |
Express Scripts Holding Co. | 1.7 | 0.0 |
Citrix Systems, Inc. | 1.7 | 1.1 |
Danaher Corp. | 1.6 | 1.5 |
Philip Morris International, Inc. | 1.4 | 1.4 |
Google, Inc. Class A | 1.4 | 4.1 |
| 28.1 | |
Top Five Market Sectors as of June 30, 2012 |
| % of fund's
net assets | % of fund's net assets
6 months ago |
Information Technology | 31.7 | 32.9 |
Consumer Discretionary | 18.3 | 16.6 |
Industrials | 14.2 | 14.4 |
Consumer Staples | 11.4 | 8.7 |
Health Care | 6.1 | 4.3 |
Asset Allocation (% of fund's net assets) |
As of June 30, 2012* | As of December 31, 2011** |
| Stocks 94.3% | | | Stocks 96.5% | |
| Short-Term
Investments and
Net Other Assets
(Liabilities) 5.7% | | | Short-Term
Investments and
Net Other Assets
(Liabilities) 3.5% | |
* Foreign investments | 13.1% | | ** Foreign investments | 14.4% | |

Annual Report
Investments June 30, 2012
Showing Percentage of Net Assets
Common Stocks - 94.3% |
| Shares | | Value (000s) |
CONSUMER DISCRETIONARY - 18.3% |
Automobiles - 2.5% |
Harley-Davidson, Inc. | 468,676 | | $ 21,433 |
Tesla Motors, Inc. (a)(d) | 133,392 | | 4,174 |
| | 25,607 |
Diversified Consumer Services - 0.7% |
Anhanguera Educacional Participacoes SA | 277,600 | | 3,538 |
Kroton Educacional SA unit (a) | 222,400 | | 3,217 |
| | 6,755 |
Hotels, Restaurants & Leisure - 3.3% |
Arcos Dorados Holdings, Inc. | 153,100 | | 2,263 |
Chipotle Mexican Grill, Inc. (a) | 4,507 | | 1,712 |
Dunkin' Brands Group, Inc. | 132,569 | | 4,552 |
McDonald's Corp. | 139,500 | | 12,350 |
Sonic Corp. (a) | 104,200 | | 1,044 |
Starbucks Corp. | 228,026 | | 12,158 |
| | 34,079 |
Household Durables - 0.7% |
Mohawk Industries, Inc. (a) | 37,086 | | 2,590 |
Tupperware Brands Corp. | 90,208 | | 4,940 |
| | 7,530 |
Internet & Catalog Retail - 1.4% |
Amazon.com, Inc. (a) | 60,208 | | 13,748 |
Media - 0.6% |
Discovery Communications, Inc. Class C (non-vtg.) (a) | 112,550 | | 5,638 |
Multiline Retail - 2.0% |
Dollar General Corp. (a) | 140,058 | | 7,618 |
Dollarama, Inc. | 184,190 | | 11,068 |
Dollarama, Inc. (a)(e) | 25,900 | | 1,556 |
| | 20,242 |
Specialty Retail - 6.2% |
Bed Bath & Beyond, Inc. (a) | 104,195 | | 6,439 |
GNC Holdings, Inc. | 214,189 | | 8,396 |
Home Depot, Inc. | 380,450 | | 20,160 |
PetSmart, Inc. | 26,900 | | 1,834 |
Ross Stores, Inc. | 137,766 | | 8,606 |
TJX Companies, Inc. | 166,118 | | 7,131 |
Ulta Salon, Cosmetics & Fragrance, Inc. | 37,385 | | 3,491 |
Vitamin Shoppe, Inc. (a) | 136,905 | | 7,520 |
| | 63,577 |
Common Stocks - continued |
| Shares | | Value (000s) |
CONSUMER DISCRETIONARY - continued |
Textiles, Apparel & Luxury Goods - 0.9% |
lululemon athletica, Inc. (a) | 51,000 | | $ 3,041 |
NIKE, Inc. Class B | 57,157 | | 5,017 |
Ralph Lauren Corp. | 10,032 | | 1,405 |
| | 9,463 |
TOTAL CONSUMER DISCRETIONARY | | 186,639 |
CONSUMER STAPLES - 11.4% |
Beverages - 3.5% |
Anheuser-Busch InBev SA NV ADR | 34,200 | | 2,724 |
Monster Beverage Corp. (a) | 122,193 | | 8,700 |
SABMiller PLC | 78,500 | | 3,141 |
The Coca-Cola Co. | 264,980 | | 20,719 |
| | 35,284 |
Food & Staples Retailing - 0.9% |
Costco Wholesale Corp. | 32,700 | | 3,107 |
Drogasil SA | 134,324 | | 1,354 |
Whole Foods Market, Inc. | 56,120 | | 5,349 |
| | 9,810 |
Food Products - 2.0% |
Green Mountain Coffee Roasters, Inc. (a)(d) | 359,172 | | 7,823 |
Mead Johnson Nutrition Co. Class A | 55,931 | | 4,503 |
The Hershey Co. | 96,577 | | 6,956 |
Want Want China Holdings Ltd. | 659,000 | | 815 |
| | 20,097 |
Household Products - 1.3% |
Colgate-Palmolive Co. | 124,903 | | 13,002 |
Personal Products - 1.1% |
Estee Lauder Companies, Inc. Class A | 25,068 | | 1,357 |
Herbalife Ltd. | 207,929 | | 10,049 |
| | 11,406 |
Tobacco - 2.6% |
Altria Group, Inc. | 32,870 | | 1,136 |
British American Tobacco PLC sponsored ADR | 89,400 | | 9,130 |
Common Stocks - continued |
| Shares | | Value (000s) |
CONSUMER STAPLES - continued |
Tobacco - continued |
Philip Morris International, Inc. | 169,900 | | $ 14,825 |
Swedish Match Co. AB | 43,600 | | 1,757 |
| | 26,848 |
TOTAL CONSUMER STAPLES | | 116,447 |
ENERGY - 5.8% |
Energy Equipment & Services - 2.6% |
Cameron International Corp. (a) | 77,200 | | 3,297 |
Dresser-Rand Group, Inc. (a) | 91,305 | | 4,067 |
National Oilwell Varco, Inc. | 73,200 | | 4,717 |
Oceaneering International, Inc. | 111,349 | | 5,329 |
Poseidon Concepts Corp. (d) | 382,800 | | 4,689 |
Schlumberger Ltd. | 77,756 | | 5,047 |
| | 27,146 |
Oil, Gas & Consumable Fuels - 3.2% |
Atlas Pipeline Partners, LP | 157,463 | | 4,910 |
Concho Resources, Inc. (a) | 61,421 | | 5,228 |
Kosmos Energy Ltd. (a) | 266,347 | | 2,943 |
Markwest Energy Partners LP | 45,360 | | 2,237 |
Noble Energy, Inc. | 25,300 | | 2,146 |
Pioneer Natural Resources Co. | 40,600 | | 3,581 |
Targa Resources Corp. | 60,451 | | 2,581 |
Valero Energy Corp. | 151,207 | | 3,652 |
Williams Companies, Inc. | 173,800 | | 5,009 |
| | 32,287 |
TOTAL ENERGY | | 59,433 |
FINANCIALS - 2.5% |
Capital Markets - 0.4% |
GP Investments Ltd. (depositary receipt) (a) | 362,094 | | 846 |
Invesco Ltd. | 151,821 | | 3,431 |
| | 4,277 |
Commercial Banks - 0.2% |
First Republic Bank (a) | 52,076 | | 1,750 |
Common Stocks - continued |
| Shares | | Value (000s) |
FINANCIALS - continued |
Consumer Finance - 0.2% |
Mahindra & Mahindra Financial Services Ltd. | 75,209 | | $ 882 |
Shriram Transport Finance Co. Ltd. | 165,090 | | 1,584 |
| | 2,466 |
Diversified Financial Services - 0.3% |
CME Group, Inc. | 12,392 | | 3,322 |
Real Estate Investment Trusts - 1.3% |
American Tower Corp. | 143,828 | | 10,055 |
Public Storage | 20,030 | | 2,893 |
| | 12,948 |
Real Estate Management & Development - 0.1% |
BR Malls Participacoes SA | 48,300 | | 553 |
TOTAL FINANCIALS | | 25,316 |
HEALTH CARE - 6.1% |
Biotechnology - 2.1% |
Aegerion Pharmaceuticals, Inc. (a) | 32,100 | | 476 |
Amgen, Inc. | 84,000 | | 6,135 |
AVEO Pharmaceuticals, Inc. (a)(d) | 214,164 | | 2,604 |
Biogen Idec, Inc. (a) | 65,379 | | 9,439 |
Biovitrum AB (a) | 612,148 | | 2,080 |
Cytokinetics, Inc. | 480,700 | | 308 |
Cytokinetics, Inc. warrants 6/25/17 (a) | 288,420 | | 2 |
| | 21,044 |
Health Care Equipment & Supplies - 0.2% |
Conceptus, Inc. (a) | 73,300 | | 1,453 |
Edwards Lifesciences Corp. (a) | 6,200 | | 640 |
| | 2,093 |
Health Care Providers & Services - 1.8% |
Apollo Hospitals Enterprise Ltd. | 42,413 | | 472 |
Express Scripts Holding Co. (a) | 314,409 | | 17,553 |
| | 18,025 |
Life Sciences Tools & Services - 0.1% |
Illumina, Inc. (a) | 22,700 | | 917 |
Common Stocks - continued |
| Shares | | Value (000s) |
HEALTH CARE - continued |
Pharmaceuticals - 1.9% |
Novo Nordisk A/S Series B | 48,477 | | $ 7,031 |
Valeant Pharmaceuticals International, Inc. (Canada) (a)(d) | 282,925 | | 12,691 |
| | 19,722 |
TOTAL HEALTH CARE | | 61,801 |
INDUSTRIALS - 14.2% |
Aerospace & Defense - 3.1% |
Honeywell International, Inc. | 71,444 | | 3,989 |
Precision Castparts Corp. | 55,353 | | 9,105 |
Textron, Inc. | 41,700 | | 1,037 |
TransDigm Group, Inc. (a) | 52,458 | | 7,045 |
United Technologies Corp. | 134,070 | | 10,126 |
| | 31,302 |
Air Freight & Logistics - 0.9% |
United Parcel Service, Inc. Class B | 122,945 | | 9,683 |
Building Products - 0.3% |
USG Corp. (a)(d) | 137,700 | | 2,623 |
Commercial Services & Supplies - 0.0% |
Aggreko PLC | 15,912 | | 516 |
Electrical Equipment - 1.7% |
AMETEK, Inc. | 84,165 | | 4,201 |
Regal-Beloit Corp. | 71,191 | | 4,432 |
Roper Industries, Inc. | 87,067 | | 8,583 |
| | 17,216 |
Industrial Conglomerates - 1.6% |
Danaher Corp. | 315,600 | | 16,436 |
Machinery - 2.5% |
CLARCOR, Inc. | 109,451 | | 5,271 |
Graco, Inc. | 46,623 | | 2,148 |
Ingersoll-Rand PLC | 254,591 | | 10,739 |
Manitowoc Co., Inc. | 354,785 | | 4,151 |
Terex Corp. (a) | 179,700 | | 3,204 |
| | 25,513 |
Professional Services - 3.1% |
Advisory Board Co. (a) | 125,878 | | 6,242 |
Corporate Executive Board Co. | 188,006 | | 7,686 |
Equifax, Inc. | 218,703 | | 10,192 |
Common Stocks - continued |
| Shares | | Value (000s) |
INDUSTRIALS - continued |
Professional Services - continued |
IHS, Inc. Class A (a) | 57,285 | | $ 6,171 |
Qualicorp SA | 160,700 | | 1,405 |
| | 31,696 |
Road & Rail - 0.1% |
J.B. Hunt Transport Services, Inc. | 20,000 | | 1,192 |
Trading Companies & Distributors - 0.9% |
MSC Industrial Direct Co., Inc. Class A | 37,530 | | 2,460 |
W.W. Grainger, Inc. | 33,838 | | 6,471 |
| | 8,931 |
TOTAL INDUSTRIALS | | 145,108 |
INFORMATION TECHNOLOGY - 31.7% |
Communications Equipment - 3.5% |
Acme Packet, Inc. (a)(d) | 222,499 | | 4,150 |
QUALCOMM, Inc. | 507,439 | | 28,254 |
Riverbed Technology, Inc. (a) | 212,248 | | 3,428 |
| | 35,832 |
Computers & Peripherals - 12.3% |
Apple, Inc. (a) | 198,902 | | 116,163 |
SanDisk Corp. (a) | 248,678 | | 9,072 |
| | 125,235 |
Electronic Equipment & Components - 0.2% |
InvenSense, Inc. (d) | 151,012 | | 1,706 |
Internet Software & Services - 4.6% |
Active Network, Inc. (a) | 66,704 | | 1,027 |
Baidu.com, Inc. sponsored ADR (a) | 24,960 | | 2,870 |
Bankrate, Inc. | 272,578 | | 5,013 |
Blucora, Inc. (a) | 172,485 | | 2,125 |
CoStar Group, Inc. (a) | 29,950 | | 2,432 |
Google, Inc. Class A (a) | 25,123 | | 14,573 |
MercadoLibre, Inc. | 28,258 | | 2,142 |
SPS Commerce, Inc. (a) | 65,005 | | 1,975 |
VeriSign, Inc. (a) | 325,224 | | 14,170 |
| | 46,327 |
IT Services - 1.7% |
Cardtronics, Inc. (a) | 76,888 | | 2,323 |
Heartland Payment Systems, Inc. | 117,404 | | 3,532 |
MasterCard, Inc. Class A | 6,300 | | 2,710 |
Common Stocks - continued |
| Shares | | Value (000s) |
INFORMATION TECHNOLOGY - continued |
IT Services - continued |
ServiceSource International, Inc. (a) | 246,837 | | $ 3,419 |
Visa, Inc. Class A | 40,400 | | 4,995 |
| | 16,979 |
Semiconductors & Semiconductor Equipment - 3.9% |
Altera Corp. | 71,518 | | 2,420 |
ASML Holding NV | 122,000 | | 6,273 |
Avago Technologies Ltd. | 197,009 | | 7,073 |
Broadcom Corp. Class A | 262,548 | | 8,874 |
Cirrus Logic, Inc. (a) | 50,275 | | 1,502 |
Ezchip Semiconductor Ltd. (a) | 68,441 | | 2,740 |
MagnaChip Semiconductor Corp. (a) | 189,252 | | 1,804 |
Maxim Integrated Products, Inc. | 38,500 | | 987 |
PMC-Sierra, Inc. (a) | 260,016 | | 1,596 |
Texas Instruments, Inc. | 241,100 | | 6,917 |
| | 40,186 |
Software - 5.5% |
ANSYS, Inc. (a) | 79,558 | | 5,021 |
Citrix Systems, Inc. (a) | 205,447 | | 17,245 |
Computer Modelling Group Ltd. | 133,000 | | 2,269 |
Intuit, Inc. | 72,393 | | 4,297 |
Red Hat, Inc. (a) | 68,900 | | 3,891 |
salesforce.com, Inc. (a) | 91,566 | | 12,660 |
SolarWinds, Inc. (a) | 131,127 | | 5,712 |
VMware, Inc. Class A (a) | 55,575 | | 5,060 |
| | 56,155 |
TOTAL INFORMATION TECHNOLOGY | | 322,420 |
MATERIALS - 3.1% |
Chemicals - 2.5% |
Albemarle Corp. | 17,200 | | 1,026 |
FMC Corp. | 134,946 | | 7,217 |
Monsanto Co. | 76,481 | | 6,331 |
Praxair, Inc. | 69,200 | | 7,524 |
Sherwin-Williams Co. | 28,600 | | 3,785 |
| | 25,883 |
Common Stocks - continued |
| Shares | | Value (000s) |
MATERIALS - continued |
Metals & Mining - 0.6% |
Kenmare Resources PLC (a) | 1,214,702 | | $ 751 |
Newmont Mining Corp. | 107,703 | | 5,225 |
| | 5,976 |
TOTAL MATERIALS | | 31,859 |
TELECOMMUNICATION SERVICES - 1.2% |
Wireless Telecommunication Services - 1.2% |
SBA Communications Corp. Class A (a) | 125,512 | | 7,160 |
TIM Participacoes SA sponsored ADR (d) | 167,209 | | 4,592 |
| | 11,752 |
TOTAL COMMON STOCKS (Cost $809,985) |
960,775
|
Money Market Funds - 4.5% |
| | | |
Fidelity Cash Central Fund, 0.17% (b) | 24,292,518 | | 24,293 |
Fidelity Securities Lending Cash Central Fund, 0.18% (b)(c) | 21,535,351 | | 21,535 |
TOTAL MONEY MARKET FUNDS (Cost $45,828) |
45,828
|
TOTAL INVESTMENT PORTFOLIO - 98.8% (Cost $855,813) | | 1,006,603 |
NET OTHER ASSETS (LIABILITIES) - 1.2% | | 12,032 |
NET ASSETS - 100% | $ 1,018,635 |
Legend |
(a) Non-income producing |
(b) Affiliated fund that is available only to investment companies and other accounts managed by Fidelity Investments. The rate quoted is the annualized seven-day yield of the fund at period end. A complete unaudited listing of the fund's holdings as of its most recent quarter end is available upon request. In addition, each Fidelity Central Fund's financial statements, which are not covered by the Fund's Report of Independent Registered Public Accounting Firm, are available on the SEC's website or upon request. |
(c) Investment made with cash collateral received from securities on loan. |
(d) Security or a portion of the security is on loan at period end. |
(e) Security exempt from registration under Rule 144A of the Securities Act of 1933. These securities may be resold in transactions exempt from registration, normally to qualified institutional buyers. At the end of the period, the value of these securities amounted to $1,556,000 or 0.2% of net assets. |
Affiliated Central Funds |
Information regarding fiscal year to date income earned by the Fund from investments in Fidelity Central Funds is as follows: |
Fund | Income earned
(Amounts in thousands) |
Fidelity Cash Central Fund | $ 33 |
Fidelity Securities Lending Cash Central Fund | 400 |
Total | $ 433 |
Other Information |
The following is a summary of the inputs used, as of June 30, 2012, involving the Fund's assets and liabilities carried at fair value. The inputs or methodology used for valuing securities may not be an indication of the risk associated with investing in those securities. For more information on valuation inputs, and their aggregation into the levels used in the table below, please refer to the Security Valuation section in the accompanying Notes to Financial Statements. |
Valuation Inputs at Reporting Date: |
Description
(Amounts in thousands) | Total | Level 1 | Level 2 | Level 3 |
Investments in Securities: | | | | |
Equities: | | | | |
Consumer Discretionary | $ 186,639 | $ 186,639 | $ - | $ - |
Consumer Staples | 116,447 | 115,632 | 815 | - |
Energy | 59,433 | 59,433 | - | - |
Financials | 25,316 | 22,850 | 2,466 | - |
Health Care | 61,801 | 54,296 | 7,505 | - |
Industrials | 145,108 | 145,108 | - | - |
Information Technology | 322,420 | 322,420 | - | - |
Materials | 31,859 | 31,859 | - | - |
Telecommunication Services | 11,752 | 11,752 | - | - |
Money Market Funds | 45,828 | 45,828 | - | - |
Total Investments in Securities: | $ 1,006,603 | $ 995,817 | $ 10,786 | $ - |
Distribution of investments by country or territory of incorporation, as a percentage of total net assets, is as follows. (Unaudited) |
United States of America | 86.9% |
Canada | 3.1% |
Brazil | 1.5% |
Cayman Islands | 1.4% |
United Kingdom | 1.2% |
Ireland | 1.2% |
Others (Individually Less Than 1%) | 4.7% |
| 100.0% |
See accompanying notes which are an integral part of the financial statements.
Annual Report
Statement of Assets and Liabilities
Amounts in thousands (except per-share amounts) | June 30, 2012 |
| | |
Assets | | |
Investment in securities, at value (including securities loaned of $21,946) - See accompanying schedule: Unaffiliated issuers (cost $809,985) | $ 960,775 | |
Fidelity Central Funds (cost $45,828) | 45,828 | |
Total Investments (cost $855,813) | | $ 1,006,603 |
Receivable for investments sold | | 47,058 |
Receivable for fund shares sold | | 749 |
Dividends receivable | | 559 |
Distributions receivable from Fidelity Central Funds | | 78 |
Other receivables | | 30 |
Total assets | | 1,055,077 |
| | |
Liabilities | | |
Payable for investments purchased | $ 13,380 | |
Payable for fund shares redeemed | 719 | |
Accrued management fee | 568 | |
Other affiliated payables | 192 | |
Other payables and accrued expenses | 48 | |
Collateral on securities loaned, at value | 21,535 | |
Total liabilities | | 36,442 |
| | |
Net Assets | | $ 1,018,635 |
Net Assets consist of: | | |
Paid in capital | | $ 1,440,845 |
Undistributed net investment income | | 962 |
Accumulated undistributed net realized gain (loss) on investments and foreign currency transactions | | (573,955) |
Net unrealized appreciation (depreciation) on investments and assets and liabilities in foreign currencies | | 150,783 |
Net Assets | | $ 1,018,635 |
See accompanying notes which are an integral part of the financial statements.
Annual Report
Statement of Assets and Liabilities - continued
Amounts in thousands (except per-share amounts) | June 30, 2012 |
| | |
Growth Discovery:
Net Asset Value, offering price and redemption price per share ($874,679 ÷ 57,976 shares) | | $ 15.09 |
| | |
Class K:
Net Asset Value, offering price and redemption price per share ($143,956 ÷ 9,539 shares) | | $ 15.09 |
See accompanying notes which are an integral part of the financial statements.
Annual Report
Financial Statements - continued
Statement of Operations
Amounts in thousands | Year ended June 30, 2012 |
| | |
Investment Income | | |
Dividends | | $ 10,644 |
Income from Fidelity Central Funds | | 433 |
Total income | | 11,077 |
| | |
Expenses | | |
Management fee
Basic fee | $ 5,752 | |
Performance adjustment | (282) | |
Transfer agent fees | 2,023 | |
Accounting and security lending fees | 345 | |
Custodian fees and expenses | 58 | |
Independent trustees' compensation | 7 | |
Registration fees | 66 | |
Audit | 54 | |
Legal | 5 | |
Miscellaneous | 9 | |
Total expenses before reductions | 8,037 | |
Expense reductions | (34) | 8,003 |
Net investment income (loss) | | 3,074 |
Realized and Unrealized Gain (Loss) Net realized gain (loss) on: | | |
Investment securities: | | |
Unaffiliated issuers | 13,970 | |
Foreign currency transactions | (227) | |
Total net realized gain (loss) | | 13,743 |
Change in net unrealized appreciation (depreciation) on: Investment securities | (766) | |
Assets and liabilities in foreign currencies | (1) | |
Total change in net unrealized appreciation (depreciation) | | (767) |
Net gain (loss) | | 12,976 |
Net increase (decrease) in net assets resulting from operations | | $ 16,050 |
See accompanying notes which are an integral part of the financial statements.
Annual Report
Statement of Changes in Net Assets
Amounts in thousands | Year ended
June 30,
2012 | Year ended
June 30,
2011 |
Increase (Decrease) in Net Assets | | |
Operations | | |
Net investment income (loss) | $ 3,074 | $ 3,581 |
Net realized gain (loss) | 13,743 | 102,766 |
Change in net unrealized appreciation (depreciation) | (767) | 165,724 |
Net increase (decrease) in net assets resulting
from operations | 16,050 | 272,071 |
Distributions to shareholders from net investment income | (2,613) | (2,086) |
Distributions to shareholders from net realized gain | (4,056) | (3,054) |
Total distributions | (6,669) | (5,140) |
Share transactions - net increase (decrease) | (69,861) | 166,122 |
Total increase (decrease) in net assets | (60,480) | 433,053 |
| | |
Net Assets | | |
Beginning of period | 1,079,115 | 646,062 |
End of period (including undistributed net investment income of $962 and undistributed net investment income of $1,925, respectively) | $ 1,018,635 | $ 1,079,115 |
See accompanying notes which are an integral part of the financial statements.
Annual Report
Financial Highlights - Growth Discovery
Years ended June 30, | 2012 | 2011 | 2010 | 2009 | 2008 |
Selected Per-Share Data | | | | | |
Net asset value, beginning of period | $ 14.88 | $ 10.54 | $ 9.04 | $ 14.61 | $ 14.36 |
Income from Investment Operations | | | | | |
Net investment income (loss) B | .04 | .05 | .01 | .04 | .09 |
Net realized and unrealized gain (loss) | .26 | 4.37 | 1.52 | (5.54) | .20 |
Total from investment operations | .30 | 4.42 | 1.53 | (5.50) | .29 |
Distributions from net investment income | (.03) | (.03) | (.03) | (.07) | (.04) |
Distributions from net realized gain | (.06) | (.05) | (.01) | - | - |
Total distributions | (.09) | (.08) | (.03) F | (.07) | (.04) |
Net asset value, end of period | $ 15.09 | $ 14.88 | $ 10.54 | $ 9.04 | $ 14.61 |
Total Return A | 2.07% | 42.09% | 16.96% | (37.75)% | 1.98% |
Ratios to Average Net Assets C, E | | | | | |
Expenses before reductions | .81% | .63% | .76% | .90% | .91% |
Expenses net of fee waivers, if any | .81% | .63% | .76% | .90% | .91% |
Expenses net of all reductions | .80% | .62% | .75% | .89% | .90% |
Net investment income (loss) | .27% | .39% | .08% | .36% | .57% |
Supplemental Data | | | | | |
Net assets, end of period (in millions) | $ 875 | $ 932 | $ 604 | $ 777 | $ 1,768 |
Portfolio turnover rate D | 74% | 72% | 87% | 166% | 150% |
A Total returns would have been lower if certain expenses had not been reduced during the applicable periods shown.
B Calculated based on average shares outstanding during the period.
C Fees and expenses of any underlying Fidelity Central Funds are not included in the Fund's expense ratio. The Fund indirectly bears its proportionate share of the expenses of any underlying Fidelity Central Funds.
D Amount does not include the portfolio activity of any underlying Fidelity Central Funds.
E Expense ratios reflect operating expenses of the class. Expenses before reductions do not reflect amounts reimbursed by the investment adviser or reductions from brokerage service arrangements or reductions from other expense offset arrangements and do not represent the amount paid by the class during periods when reimbursements or reductions occur. Expenses net of fee waivers reflect expenses after reimbursement by the investment adviser but prior to reductions from brokerage service arrangements or other expense offset arrangements. Expenses net of all reductions represent the net expenses paid by the class.
F Total distributions of $.03 per share is comprised of distributions from net investment income of $.027 and distributions from net realized gain of $.005 per share.
See accompanying notes which are an integral part of the financial statements.
Annual Report
Financial Highlights - Class K
Years ended June 30, | 2012 | 2011 | 2010 | 2009 | 2008 G |
Selected Per-Share Data | | | | | |
Net asset value, beginning of period | $ 14.88 | $ 10.55 | $ 9.05 | $ 14.62 | $ 14.94 |
Income from Investment
Operations | | | | |
Net investment income (loss) D | .06 | .08 | .03 | .05 | .03 |
Net realized and unrealized gain (loss) | .26 | 4.36 | 1.53 | (5.53) | (.35) |
Total from investment operations | .32 | 4.44 | 1.56 | (5.48) | (.32) |
Distributions from net investment income | (.06) | (.06) | (.05) | (.09) | - |
Distributions from net realized gain | (.06) | (.05) | (.01) | - | - |
Total distributions | (.11) J | (.11) | (.06) I | (.09) | - |
Net asset value, end of period | $ 15.09 | $ 14.88 | $ 10.55 | $ 9.05 | $ 14.62 |
Total Return B, C | 2.27% | 42.26% | 17.25% | (37.60)% | (2.14)% |
Ratios to Average Net Assets E, H | | | | | |
Expenses before reductions | .64% | .44% | .53% | .67% | .76% A |
Expenses net of fee waivers, if any | .64% | .44% | .53% | .67% | .76% A |
Expenses net of all reductions | .63% | .43% | .52% | .67% | .75% A |
Net investment income (loss) | .44% | .58% | .31% | .59% | 1.44% A |
Supplemental Data | | | | | |
Net assets, end of period (000 omitted) | $ 143,956 | $ 146,740 | $ 42,570 | $ 30,939 | $ 98 |
Portfolio turnover rate F | 74% | 72% | 87% | 166% | 150% |
A Annualized
B Total returns for periods of less than one year are not annualized.
C Total returns would have been lower if certain expenses had not been reduced during the applicable periods shown.
D Calculated based on average shares outstanding during the period.
E Fees and expenses of any underlying Fidelity Central Funds are not included in the Fund's expense ratio. The Fund indirectly bears its proportionate share of the expenses of any underlying Fidelity Central Funds.
F Amount does not include the portfolio activity of any underlying Fidelity Central Funds.
G For the period May 9, 2008 (commencement of sale of shares) to June 30, 2008.
H Expense ratios reflect operating expenses of the class. Expenses before reductions do not reflect amounts reimbursed by the investment adviser or reductions from brokerage service arrangements or reductions from other expense offset arrangements and do not represent the amount paid by the class during periods when reimbursements or reductions occur. Expense ratios before reductions for start-up periods may not be representative of longer-term operating periods. Expenses net of fee waivers reflect expenses after reimbursement by the investment adviser but prior to reductions from brokerage service arrangements or other expense offset arrangements. Expenses net of all reductions represent the net expenses paid by the class.
I Total distributions of $.06 per share is comprised of distributions from net investment income of $.054 and distributions from net realized gain of $.005 per share.
J Total distributions of $.11 per share is comprised of distributions from net investment income of $.058 and distributions from net realized gain of $.055 per share.
See accompanying notes which are an integral part of the financial statements.
Annual Report
Notes to Financial Statements
For the period ended June 30, 2012
(Amounts in thousands except percentages)
1. Organization.
Fidelity Growth Discovery Fund (the Fund) is a fund of Fidelity Hastings Street Trust (the Trust) and is authorized to issue an unlimited number of shares. The Trust is registered under the Investment Company Act of 1940, as amended (the 1940 Act), as an open-end management investment company organized as a Massachusetts business trust. The Fund offers Growth Discovery and Class K shares, each of which, has equal rights as to assets and voting privileges. Each class has exclusive voting rights with respect to matters that affect that class. Investment income, realized and unrealized capital gains and losses, the common expenses of the Fund, and certain fund-level expense reductions, if any, are allocated on a pro-rata basis to each class based on the relative net assets of each class to the total net assets of the Fund. Each class differs with respect to transfer agent fees incurred. Certain expense reductions may also differ by class.
2. Investments in Fidelity Central Funds.
The Fund invests in Fidelity Central Funds, which are open-end investment companies available only to other investment companies and accounts managed by Fidelity Management & Research Company (FMR) and its affiliates. The Fund's Schedule of Investments lists each of the Fidelity Central Funds held as of period end, if any, as an investment of the Fund, but do not include the underlying holdings of each Fidelity Central Fund. As an Investing Fund, the Fund indirectly bears its proportionate share of the expenses of the underlying Fidelity Central Funds.
The Money Market Central Funds seek preservation of capital and current income and are managed by Fidelity Investments Money Management, Inc. (FIMM), an affiliate of FMR.
A complete unaudited list of holdings for each Fidelity Central Fund is available upon request or at the Securities and Exchange Commission (the SEC) web site at www.sec.gov. In addition, the financial statements of the Fidelity Central Funds, which are not covered by the Fund's Report of Independent Registered Public Accounting Firm, are available on the SEC web site or upon request.
3. Significant Accounting Policies.
The financial statements have been prepared in conformity with accounting principles generally accepted in the United States of America (GAAP), which require management to make certain estimates and assumptions at the date of the financial statements. Actual results could differ from those estimates. Subsequent events, if any, through the date that the financial statements were issued have been evaluated in the preparation of the financial statements. The following summarizes the significant accounting policies of the Fund:
Annual Report
Notes to Financial Statements - continued
(Amounts in thousands except percentages)
3. Significant Accounting Policies - continued
Security Valuation. Investments are valued as of 4:00 p.m. Eastern time on the last calendar day of the period. In accordance with valuation policies and procedures approved by the Board of Trustees (the Board), the Fund attempts to obtain prices from one or more third party pricing vendor or broker to value its investments. When current market prices, quotations or rates are not readily available or reliable, securities will be fair valued in good faith by the FMR Fair Value Committee (the Committee), in accordance with procedures adopted by the Fund's Board. Factors used in determining fair value vary by security type and may include market or security specific events. The frequency with which these procedures are used cannot be predicted and they may be utilized to a significant extent. The Committee oversees the Fund's valuation policies and procedures and is responsible for approving and reporting to the Board all fair value determinations.
The Fund categorizes the inputs to valuation techniques used to value its investments into a disclosure hierarchy consisting of three levels as shown below:
Level 1 - quoted prices in active markets for identical investments
Level 2 - other significant observable inputs (including quoted prices for similar investments, interest rates, prepayment speeds, etc.)
Level 3 - unobservable inputs (including the Fund's own assumptions based on the best information available)
Valuation techniques used to value the Fund's investments by major category are as follows:
Equity securities, including restricted securities, for which market quotations are readily available, are valued at the last reported sale price or official closing price as reported by a third party pricing vendor on the primary market or exchange on which they are traded and are categorized as Level 1 in the hierarchy. In the event there were no sales during the day or closing prices are not available, securities are valued at the last quoted bid price or may be valued using the last available price and are generally categorized as Level 2 in the hierarchy. For foreign equity securities, when significant market or security specific events arise, comparisons to the valuation of American Depositary Receipts (ADRs), futures contracts, Exchange-Traded Funds (ETFs)and certain indexes as well as quoted prices for similar securities are used and are categorized as Level 2 in the hierarchy. Utilizing these techniques may result in transfers between Level 1 and Level 2. For restricted equity securities and private placements where observable inputs are limited, assumptions about market activity and risk are used and these securities are categorized as Level 3 in the hierarchy.
Annual Report
3. Significant Accounting Policies - continued
Security Valuation - continued
Investments in open-end mutual funds, including the Fidelity Central Funds, are valued at their closing net asset value each business day and are categorized as Level 1 in the hierarchy.
Changes in valuation techniques may result in transfers in or out of an assigned level within the disclosure hierarchy. The aggregate value of investments by input level, as of June 30, 2012, is included at the end of the Fund's Schedule of Investments.
Foreign Currency Translation. The Fund may use foreign currency contracts to facilitate transactions in foreign-denominated securities. Gains and losses from these transactions may arise from changes in the value of the foreign currency or if the counterparties do not perform under the contracts' terms.
Foreign-denominated assets, including investment securities, and liabilities are translated into U.S. dollars at the exchange rates at period end. Purchases and sales of investment securities, income and dividends received and expenses denominated in foreign currencies are translated into U.S. dollars at the exchange rate in effect on the transaction date.
The effects of exchange rate fluctuations on investments are included with the net realized and unrealized gain (loss) on investment securities. Other foreign currency transactions resulting in realized and unrealized gain (loss) are disclosed separately.
Investment Transactions and Income. For financial reporting purposes, the Fund's investment holdings and NAV include trades executed through the end of the last business day of the period. The NAV per share for processing shareholder transactions is calculated as of the close of business of the New York Stock Exchange (NYSE), normally 4:00 p.m. Eastern time and includes trades executed through the end of the prior business day. Gains and losses on securities sold are determined on the basis of identified cost and may include proceeds received from litigation. Dividend income is recorded on the ex-dividend date, except for certain dividends from foreign securities where the ex-dividend date may have passed, which are recorded as soon as the Fund is informed of the ex-dividend date. Non-cash dividends included in dividend income, if any, are recorded at the fair market value of the securities received. Distributions received on securities that represent a return of capital or capital gain are recorded as a reduction of cost of investments and/or as a realized gain. The Fund estimates the components of distributions received that may be considered return of capital distributions or capital gain distributions. Interest income and distributions from the Fidelity Central Funds are accrued as earned. Interest income includes coupon interest and amortization of premium and accretion of discount on debt securities. Investment income is recorded net of foreign taxes withheld where recovery of such taxes is uncertain.
Annual Report
Notes to Financial Statements - continued
(Amounts in thousands except percentages)
3. Significant Accounting Policies - continued
Expenses. Expenses directly attributable to a fund are charged to that fund. Expenses attributable to more than one fund are allocated among the respective funds on the basis of relative net assets or other appropriate methods. Expense estimates are accrued in the period to which they relate and adjustments are made when actual amounts are known.
Income Tax Information and Distributions to Shareholders. Each year, the Fund intends to qualify as a regulated investment company under Subchapter M of the Internal Revenue Code, including distributing substantially all of its taxable income and realized gains. As a result, no provision for income taxes is required. As of June 30, 2012, the Fund did not have any unrecognized tax benefits in the financial statements; nor is the Fund aware of any tax positions for which it is reasonably possible that the total amounts of unrecognized tax benefits will significantly change in the next twelve months. The Fund files a U.S. federal tax return, in addition to state and local tax returns as required. A fund's federal income tax returns are subject to examination by the Internal Revenue Service (IRS) for a period of three fiscal years after they are filed. State and local tax returns may be subject to examination for an additional fiscal year depending on the jurisdiction. Foreign taxes are provided for based on the Fund's understanding of the tax rules and rates that exist in the foreign markets in which it invests.
Distributions are declared and recorded on the ex-dividend date. Income dividends and capital gain distributions are declared separately for each class. Income and capital gain distributions are determined in accordance with income tax regulations, which may differ from GAAP.
Capital accounts within the financial statements are adjusted for permanent book-tax differences. These adjustments have no impact on net assets or the results of operations. Temporary book-tax differences will reverse in a subsequent period.
Book-tax differences are primarily due to foreign currency transactions, passive foreign Investment companies (PFIC), partnerships, capital loss carryfowards and losses deferred due to wash sales and excise tax regulations.
The federal tax cost of investment securities and unrealized appreciation (depreciation) as of period end were as follows:
Gross unrealized appreciation | $ 193,117 |
Gross unrealized depreciation | (44,898) |
Net unrealized appreciation (depreciation) on securities and other investments | $ 148,219 |
| |
Tax Cost | $ 858,384 |
Annual Report
3. Significant Accounting Policies - continued
Income Tax Information and Distributions to Shareholders - continued
The tax-based components of distributable earnings as of period end were as follows:
Undistributed ordinary income | $ 962 |
Capital loss carryforward | $ (540,298) |
Net unrealized appreciation (depreciation) | $ 148,212 |
Capital loss carryforwards are only available to offset future capital gains of the Fund to the extent provided by regulations and may be limited. Under the Regulated Investment Company Modernization Act of 2010 (the Act), the Fund is permitted to carry forward capital losses incurred in taxable years beginning after December 22, 2010 for an unlimited period and such capital losses are required to be used prior to any losses that expire. Capital loss carryforwards were as follows:
Fiscal year of expiration | |
2017 | $ (279,867) |
2018 | (260,431) |
Total capital loss carryforward | $ (540,298) |
The Fund intends to elect to defer to its fiscal year ending June 30, 2013 approximately $31,085 of capital losses recognized during the period November 1, 2011 to June 30, 2012.
The tax character of distributions paid was as follows:
| June 30, 2012 | June 30, 2011 |
Ordinary Income | $ 6,669 | $ 5,140 |
New Accounting Pronouncement. In December 2011, the Financial Accounting Standards Board issued Accounting Standard Update No. 2011-11, Disclosures about Offsetting Assets and Liabilities. The update creates new disclosure requirements requiring entities to disclose both gross and net information for derivatives and other financial instruments that are either offset in the Statement of Assets and Liabilities or subject to an enforceable master netting arrangement or similar agreement. The disclosure requirements are effective for interim and annual reporting periods beginning on or after January 1, 2013. Management is currently evaluating the impact of the update's adoption on the Fund's financial statement disclosures.
4. Operating Policies.
Restricted Securities. The Fund may invest in securities that are subject to legal or contractual restrictions on resale. These securities generally may be resold in transactions exempt from registration or to the public if the securities are registered.
Annual Report
Notes to Financial Statements - continued
(Amounts in thousands except percentages)
4. Operating Policies - continued
Restricted Securities - continued
Disposal of these securities may involve time-consuming negotiations and expense, and prompt sale at an acceptable price may be difficult. Information regarding restricted securities is included at the end of the Fund's Schedule of Investments.
5. Purchases and Sales of Investments.
Purchases and sales of securities, other than short-term securities, aggregated $739,559 and $854,846, respectively.
6. Fees and Other Transactions with Affiliates.
Management Fee. FMR and its affiliates provide the Fund with investment management related services for which the Fund pays a monthly management fee. The management fee is the sum of an individual fund fee rate that is based on an annual rate of .30% of the Fund's average net assets and an annualized group fee rate that averaged .26% during the period. The group fee rate is based upon the average net assets of all the mutual funds advised by FMR. The group fee rate decreases as assets under management increase and increases as assets under management decrease. In addition, the management fee is subject to a performance adjustment (up to a maximum of ± .20% of the Fund's average net assets over a 36 month performance period). The upward or downward adjustment to the management fee is based on the relative investment performance of Growth Discovery as compared to an appropriate benchmark index. For the period, the total annual management fee rate, including the performance adjustment, was .53% of the Fund's average net assets.
Transfer Agent Fees. Fidelity Investments Institutional Operations Company, Inc. (FIIOC), an affiliate of FMR, is the transfer, dividend disbursing and shareholder servicing agent for each class of the Fund. FIIOC receives account fees and asset-based fees that vary according to the account size and type of account of the shareholders of Growth Discovery. FIIOC receives an asset-based fee of Class K's average net assets. FIIOC pays for typesetting, printing and mailing of shareholder reports, except proxy statements. For the period, transfer agent fees for each class were as follows:
| Amount | % of
Average
Net Assets |
Growth Discovery | $ 1,943 | .22 |
Class K | 80 | .05 |
| $ 2,023 | |
Annual Report
6. Fees and Other Transactions with Affiliates - continued
Accounting and Security Lending Fees. Fidelity Service Company, Inc. (FSC), an affiliate of FMR, maintains the Fund's accounting records. The accounting fee is based on the level of average net assets for each month. Under a separate contract, FSC administers the security lending program. The security lending fee is based on the number and duration of lending transactions.
Brokerage Commissions. The Fund placed a portion of its portfolio transactions with brokerage firms which are affiliates of the investment adviser. The commissions paid to these affiliated firms were $15 for the period.
Interfund Lending Program. Pursuant to an Exemptive Order issued by the SEC, the Fund, along with other registered investment companies having management contracts with FMR, may participate in an interfund lending program. This program provides an alternative credit facility allowing the funds to borrow from, or lend money to, other participating affiliated funds. At period end, there were no interfund loans outstanding. The Fund's activity in this program during the period for which loans were outstanding was as follows:
Borrower or Lender | Average
Loan Balance | Weighted Average
Interest Rate | Interest
Expense |
Borrower | $ 7,579 | .41% | $ -* |
* Amount represents eighty-six dollars
7. Committed Line of Credit.
The Fund participates with other funds managed by FMR or an affiliate in a $4.25 billion credit facility (the "line of credit") to be utilized for temporary or emergency purposes to fund shareholder redemptions or for other short-term liquidity purposes. The Fund has agreed to pay commitment fees on its pro-rata portion of the line of credit, which amounted to $3 and is reflected in Miscellaneous expenses on the Statement of Operations. During the period, there were no borrowings on this line of credit.
8. Security Lending.
The Fund lends portfolio securities through a lending agent from time to time in order to earn additional income. For equity securities, a lending agent is used and may loan securities to certain qualified borrowers, including Fidelity Capital Markets (FCM), a broker-dealer affiliated with the Fund. On the settlement date of the loan, the Fund receives collateral (in the form of U.S. Treasury obligations, letters of credit and/or cash) against the loaned securities and maintains collateral in an amount not less than 100% of the market value of the loaned securities during the period of the loan. The market value of the loaned securities is determined at the close of business of the Fund and any
Annual Report
Notes to Financial Statements - continued
(Amounts in thousands except percentages)
8. Security Lending - continued
additional required collateral is delivered to the Fund on the next business day. If the borrower defaults on its obligation to return the securities loaned because of insolvency or other reasons, a fund could experience delays and costs in recovering the securities loaned or in gaining access to the collateral. Any cash collateral received is invested in the Fidelity Securities Lending Cash Central Fund. The value of loaned securities and cash collateral at period end are disclosed on the Fund's Statement of Assets and Liabilities. The value of securities loaned to FCM at period end was $2,445. Security lending income represents the income earned on investing cash collateral, less rebates paid to borrowers and any lending agent fees associated with the loan, plus any premium payments received for lending certain types of securities. Security lending income is presented in the Statement of Operations as a component of income from Fidelity Central Funds. Total security lending income during the period amounted to $400, including $75 from securities loaned to FCM.
9. Expense Reductions.
Many of the brokers with whom FMR places trades on behalf of the Fund provided services to the Fund in addition to trade execution. These services included payments of certain expenses on behalf of the Fund totaling $34 for the period.
10. Distributions to Shareholders.
Distributions to shareholders of each class were as follows:
Years ended June 30, | 2012 | 2011 |
From net investment income | | |
Growth Discovery | $ 2,023 | $ 1,816 |
Class K | 590 | 270 |
Total | $ 2,613 | $ 2,086 |
From net realized gain | | |
Growth Discovery | $ 3,518 | $ 2,827 |
Class K | 538 | 227 |
Total | $ 4,056 | $ 3,054 |
Annual Report
11. Share Transactions.
Transactions for each class of shares were as follows:
| Shares | Dollars |
Years ended June 30, | 2012 | 2011 | 2012 | 2011 |
Growth Discovery | | | | |
Shares sold | 15,041 | 19,688 | $ 218,798 | $ 275,535 |
Reinvestment of distributions | 395 | 350 | 5,284 | 4,463 |
Shares redeemed | (20,132) | (14,640) | (287,440) | (196,217) |
Net increase (decrease) | (4,696) | 5,398 | $ (63,358) | $ 83,781 |
Class K | | | | |
Shares sold | 5,792 | 7,755 | $ 82,594 | $ 109,446 |
Reinvestment of distributions | 84 | 39 | 1,128 | 497 |
Shares redeemed | (6,196) | (1,966) | (90,225) | (27,602) |
Net increase (decrease) | (320) | 5,828 | $ (6,503) | $ 82,341 |
12. Other.
The Fund's organizational documents provide former and current trustees and officers with a limited indemnification against liabilities arising in connection with the performance of their duties to the Fund. In the normal course of business, the Fund may also enter into contracts that provide general indemnifications. The Fund's maximum exposure under these arrangements is unknown as this would be dependent on future claims that may be made against the Fund. The risk of material loss from such claims is considered remote.
Annual Report
To the Trustees of Fidelity Hastings Street Trust and the Shareholders of Fidelity Growth Discovery Fund:
In our opinion, the accompanying statement of assets and liabilities, including the schedule of investments, and the related statements of operations and of changes in net assets and the financial highlights present fairly, in all material respects, the financial position of Fidelity Growth Discovery Fund (a fund of Fidelity Hastings Street Trust) at June 30, 2012, the results of its operations for the year then ended, the changes in its net assets for each of the two years in the period then ended and the financial highlights for each of the periods indicated, in conformity with accounting principles generally accepted in the United States of America. These financial statements and financial highlights (hereafter referred to as "financial statements") are the responsibility of the Fidelity Growth Discovery Fund's management. Our responsibility is to express an opinion on these financial statements based on our audits. We conducted our audits of these financial statements in accordance with the standards of the Public Company Accounting Oversight Board (United States). Those standards require that we plan and perform the audit to obtain reasonable assurance about whether the financial statements are free of material misstatement. An audit includes examining, on a test basis, evidence supporting the amounts and disclosures in the financial statements, assessing the accounting principles used and significant estimates made by management, and evaluating the overall financial statement presentation. We believe that our audits, which included confirmation of securities at June 30, 2012 by correspondence with the custodian and brokers, provide a reasonable basis for our opinion.
/s/ PricewaterhouseCoopers LLP
PricewaterhouseCoopers LLP
Boston, Massachusetts
August 10, 2012
Annual Report
The Trustees, Members of the Advisory Board, and executive officers of the trust and fund, as applicable, are listed below. The Board of Trustees governs the fund and is responsible for protecting the interests of shareholders. The Trustees are experienced executives who meet periodically throughout the year to oversee the fund's activities, review contractual arrangements with companies that provide services to the fund, oversee management of the risks associated with such activities and contractual arrangements, and review the fund's performance. Except for James C. Curvey, each of the Trustees oversees 228 funds advised by FMR or an affiliate. Mr. Curvey oversees 435 funds advised by FMR or an affiliate.
The Trustees hold office without limit in time except that (a) any Trustee may resign; (b) any Trustee may be removed by written instrument, signed by at least two-thirds of the number of Trustees prior to such removal; (c) any Trustee who requests to be retired or who has become incapacitated by illness or injury may be retired by written instrument signed by a majority of the other Trustees; and (d) any Trustee may be removed at any special meeting of shareholders by a two-thirds vote of the outstanding voting securities of the trust. Each Trustee who is not an interested person (as defined in the 1940 Act) (Independent Trustee), shall retire not later than the last day of the calendar year in which his or her 75th birthday occurs. The Independent Trustees may waive this mandatory retirement age policy with respect to individual Trustees. The executive officers and Advisory Board Members hold office without limit in time, except that any officer and Advisory Board Member may resign or may be removed by a vote of a majority of the Trustees at any regular meeting or any special meeting of the Trustees. Except as indicated, each individual has held the office shown or other offices in the same company for the past five years.
Experience, Skills, Attributes, and Qualifications of the Fund's Trustees. The Governance and Nominating Committee has adopted a statement of policy that describes the experience, qualifications, attributes, and skills that are necessary and desirable for potential Independent Trustee candidates (Statement of Policy). The Board believes that each Trustee satisfied at the time he or she was initially elected or appointed a Trustee, and continues to satisfy, the standards contemplated by the Statement of Policy. The Governance and Nominating Committee also engages professional search firms to help identify potential Independent Trustee candidates who have the experience, qualifications, attributes, and skills consistent with the Statement of Policy. From time to time, additional criteria based on the composition and skills of the current Independent Trustees, as well as experience or skills that may be appropriate in light of future changes to board composition, business conditions, and regulatory or other developments, have also been considered by the professional search firms and the Governance and Nominating Committee. In addition, the Board takes into account the Trustees' commitment and participation in Board and committee meetings, as well as their leadership of standing and ad hoc committees throughout their tenure.
In determining that a particular Trustee was and continues to be qualified to serve as a Trustee, the Board has considered a variety of criteria, none of which, in isolation, was controlling. The Board believes that, collectively, the Trustees have balanced and diverse experience, qualifications, attributes, and skills, which allow the Board to operate effectively in governing the fund and protecting the interests of shareholders. Information about the specific experience, skills, attributes, and qualifications of each Trustee, which in each case led to the Board's conclusion that the Trustee should serve (or continue to serve) as a trustee of the fund, is provided below.
Annual Report
Board Structure and Oversight Function. James C. Curvey is an interested person (as defined in the 1940 Act) and currently serves as Chairman. The Trustees have determined that an interested Chairman is appropriate and benefits shareholders because an interested Chairman has a personal and professional stake in the quality and continuity of services provided to the fund. Independent Trustees exercise their informed business judgment to appoint an individual of their choosing to serve as Chairman, regardless of whether the Trustee happens to be independent or a member of management. The Independent Trustees have determined that they can act independently and effectively without having an Independent Trustee serve as Chairman and that a key structural component for assuring that they are in a position to do so is for the Independent Trustees to constitute a substantial majority for the Board. The Independent Trustees also regularly meet in executive session. Ned C. Lautenbach serves as Chairman of the Independent Trustees and as such (i) acts as a liaison between the Independent Trustees and management with respect to matters important to the Independent Trustees and (ii) with management prepares agendas for Board meetings.
Fidelity funds are overseen by different Boards of Trustees. The fund's Board oversees Fidelity's equity and high income funds and another Board oversees Fidelity's investment-grade bond, money market, and asset allocation funds. The asset allocation funds may invest in Fidelity funds overseen by the fund's Board. The use of separate Boards, each with its own committee structure, allows the Trustees of each group of Fidelity funds to focus on the unique issues of the funds they oversee, including common research, investment, and operational issues. On occasion, the separate Boards establish joint committees to address issues of overlapping consequences for the Fidelity funds overseen by each Board.
The Trustees operate using a system of committees to facilitate the timely and efficient consideration of all matters of importance to the Trustees, the fund, and fund shareholders and to facilitate compliance with legal and regulatory requirements and oversight of the fund's activities and associated risks. The Board, acting through its committees, has charged FMR and its affiliates with (i) identifying events or circumstances the occurrence of which could have demonstrably adverse effects on the fund's business and/or reputation; (ii) implementing processes and controls to lessen the possibility that such events or circumstances occur or to mitigate the effects of such events or circumstances if they do occur; and (iii) creating and maintaining a system designed to evaluate continuously business and market conditions in order to facilitate the identification and implementation processes described in (i) and (ii) above. Because the day-to-day operations and activities of the fund are carried out by or through FMR, its affiliates and other service providers, the fund's exposure to risks is mitigated but not eliminated by the processes overseen by the Trustees. While each of the Board's committees has responsibility for overseeing different aspects of the fund's activities, oversight is exercised primarily through the Operations, Audit, and Compliance Committees. In addition, the Independent Trustees have worked with FMR to enhance the Board's oversight of investment and financial risks, legal and regulatory risks, technology risks, and operational risks, including the development of additional risk reporting to the Board. For example, a working group comprised of Independent Trustees and FMR has worked and continues to work to review the Fidelity funds' valuation-related activities, reporting and risk management. Appropriate personnel, including but not limited to the fund's Chief Compliance Officer (CCO), FMR's internal auditor, the independent accountants, the fund's Treasurer and portfolio management personnel, make periodic reports to the Board's committees, as appropriate, including an annual review of FMR's risk management program for the Fidelity funds. The responsibilities of each standing committee, including their oversight responsibilities, are described further under "Standing Committees of the Fund's Trustees."
Annual Report
Trustees and Officers - continued
The fund's Statement of Additional Information (SAI) includes more information about the Trustees. To request a free copy, call Fidelity at 1-800-544-8544.
Interested Trustees*:
Correspondence intended for each Trustee who is an interested person may be sent to Fidelity Investments, 82 Devonshire Street, Boston, Massachusetts 02109.
Name, Age; Principal Occupations and Other Relevant Experience+ |
James C. Curvey (77) |
| Year of Election or Appointment: 2007 Mr. Curvey is Trustee and Chairman of the Board of Trustees of certain Trusts. Mr. Curvey also serves as Trustee (2007-present) of other investment companies advised by FMR. Mr. Curvey is a Director of Fidelity Investments Money Management, Inc. (2009-present), Director of Fidelity Research & Analysis Co. (2009-present) and Director of FMR and FMR Co., Inc. (2007-present). Mr. Curvey is also Vice Chairman (2007-present) and Director of FMR LLC. In addition, Mr. Curvey serves as an Overseer for the Boston Symphony Orchestra and a member of the Trustees of Villanova University. Previously, Mr. Curvey was the Vice Chairman (2006-2007) and Director (2000-2007) of FMR Corp. |
Ronald P. O'Hanley (55) |
| Year of Election or Appointment: 2011 Mr. O'Hanley is Director of FMR Co., Inc. (2010-present), Director of Fidelity Investments Money Management, Inc. (2010-present), Director of Fidelity Research & Analysis Company (2010-present), President of Fidelity Asset Management and Corporate Services and a member of Fidelity's Executive Committee (2010-present). Previously, Mr. O'Hanley served as President and Chief Executive Officer of BNY Mellon Asset Management (2007-2010). Mr. O'Hanley also served as Vice Chairman of Bank New York Mellon Corp. and a member of that firm's Executive Committee. Prior to the 2007 merger of The Bank of New York and Mellon Financial Corporation, he was Vice Chairman of Mellon Financial Corporation and President and Chief Executive Officer of Mellon Asset Management. He joined Mellon in February 1997. Mr. O'Hanley currently serves as Chairman of the Boston Public Library Foundation Board of Directors and sits on the Board of Directors of Beth Israel Deaconess Medical Center, the Board of Trustees of the Marine Biological Laboratory and the Advisory Board of the Maxwell School of Citizenship and Public Administration at Syracuse University. Mr. O'Hanley also chairs the Council on Asset Management for the Financial Services Roundtable and is a member of the Board of Directors of Institutional Investor's U.S. Institute. |
* Trustees have been determined to be "Interested Trustees" by virtue of, among other things, their affiliation with the trust or various entities under common control with FMR.
+ The information above includes each Trustee's principal occupation during the last five years and other information relating to the experience, attributes, and skills relevant to each Trustee's qualifications to serve as a Trustee, which led to the conclusion that each Trustee should serve as a Trustee for the fund.
Annual Report
Trustees and Officers - continued
Independent Trustees:
Correspondence intended for each Independent Trustee (that is, the Trustees other than the Interested Trustees) may be sent to Fidelity Investments, P.O. Box 55235, Boston, Massachusetts 02205-5235.
Name, Age; Principal Occupations and Other Relevant Experience+ |
Dennis J. Dirks (64) |
| Year of Election or Appointment: 2005 Prior to his retirement in May 2003, Mr. Dirks was Chief Operating Officer and a member of the Board of The Depository Trust & Clearing Corporation (DTCC). He also served as President, Chief Operating Officer, and Board member of The Depository Trust Company (DTC) and President and Board member of the National Securities Clearing Corporation (NSCC). In addition, Mr. Dirks served as Chief Executive Officer and Board member of the Government Securities Clearing Corporation, Chief Executive Officer and Board member of the Mortgage-Backed Securities Clearing Corporation, as a Trustee and a member of the Finance Committee of Manhattan College (2005-2008), and as a Trustee and a member of the Finance Committee of AHRC of Nassau County (2006-2008). Mr. Dirks is a member of the Independent Directors Council (IDC) Governing Council (2010-present) and Board of Directors for The Brookville Center for Children's Services, Inc. (2009-present). |
Alan J. Lacy (58) |
| Year of Election or Appointment: 2008 Mr. Lacy serves as Senior Adviser (2007-present) of Oak Hill Capital Partners, L.P. (private equity). Mr. Lacy also served as Chief Executive Officer (2000-2005) and Vice Chairman (2005-2006) of Sears Holdings Corporation and Sears, Roebuck and Co. (retail). In addition, Mr. Lacy serves as a member of the Board of Directors of Dave & Buster's, Inc. (restaurant and entertainment complexes, 2010-present), The Hillman Companies, Inc. (hardware wholesalers, 2010-present), and Bristol-Myers Squibb Company (global pharmaceuticals, 2007-present). Mr. Lacy is a member of the Board of Trustees of The National Parks Conservation Association (2006-present). Previously, Mr. Lacy served as Chairman of the Board of Trustees of the National Parks Conservation Association (2008-2011) and as a member of the Board of Directors for the Western Union Company (global money transfer, 2006-2011). |
Ned C. Lautenbach (68) |
| Year of Election or Appointment: 2000 Mr. Lautenbach is Chairman of the Independent Trustees of the Equity and High Income Funds (2006-present). Mr. Lautenbach currently serves as the Lead Director of the Eaton Corporation Board of Directors (diversified industrial, 1997-present). Mr. Lautenbach is also a member of the Board of Directors of the Philharmonic Center for the Arts in Naples, Florida (1999-present); a member of the Board of Trustees of Fairfield University (2005-present); and a member of the Council on Foreign Relations (1994-present). Previously, Mr. Lautenbach was a Partner/Advisory Partner at Clayton, Dubilier & Rice, LLC (private equity investment, 1998-2010), as well as a Director of Sony Corporation (2006-2007). |
Joseph Mauriello (67) |
| Year of Election or Appointment: 2008 Prior to his retirement in January 2006, Mr. Mauriello served in numerous senior management positions including Deputy Chairman and Chief Operating Officer (2004-2005), and Vice Chairman of Financial Services (2002-2004) of KPMG LLP US (professional services, 1965-2005). Mr. Mauriello currently serves as a member of the Board of Directors of XL Group plc. (global insurance and re-insurance, 2006-present). Previously, Mr. Mauriello served as a Director of the Hamilton Funds of the Bank of New York (2006-2007) and Arcadia Resources Inc. (health care services and products, 2007-2012). |
Robert W. Selander (61) |
| Year of Election or Appointment: 2011 Previously, Mr. Selander served as a Member of the Advisory Board of Fidelity's Equity and High Income Funds (2011), Executive Vice Chairman (2010), Chief Executive Officer (2009-2010), and President and Chief Executive Officer (1997-2009) of Mastercard, Inc. |
Cornelia M. Small (67) |
| Year of Election or Appointment: 2005 Ms. Small is a member of the Board of Directors of the Teagle Foundation (2009-present). Ms. Small is also a member of the Investment Committee, and Chair (2008-present) and a member of the Board of Trustees of Smith College. In addition, Ms. Small serves on the Investment Committee of the Berkshire Taconic Community Foundation (2008-present). Previously, Ms. Small served as Chairperson of the Investment Committee (2002-2008) of Smith College. In addition, Ms. Small served as Chief Investment Officer, Director of Global Equity Investments, and a member of the Board of Directors of Scudder, Stevens & Clark and Scudder Kemper Investments. |
William S. Stavropoulos (73) |
| Year of Election or Appointment: 2001 Mr. Stavropoulos is Vice Chairman of the Independent Trustees of the Equity and High Income Funds (2006-present). Mr. Stavropoulos serves as President and Founder of the Michigan Baseball Foundation, the Great Lakes Loons (2007-present). Mr. Stavropoulos is Chairman Emeritus of the Board of Directors of The Dow Chemical Company, where he previously served in numerous senior management positions, including President, CEO (1995-2000; 2002-2004), Chairman of the Executive Committee (2000-2006), and as a member of the Board of Directors (1990-2006). Currently, Mr. Stavropoulos is Chairman of Univar (global distributor of commodity and specialty chemicals, 2010-present), a Director of Teradata Corporation (data warehousing and technology solutions, 2008-present), Chemical Financial Corporation, Maersk Inc. (industrial conglomerate), Tyco International, Inc. (multinational manufacturing and services, 2007-present), and a member of the Advisory Board for Metalmark Capital (private equity investment, 2005-present). Mr. Stavropoulos is a special advisor to Clayton, Dubilier & Rice, LLC (private equity investment). In addition, Mr. Stavropoulos is a member of the University of Notre Dame Advisory Council for the College of Science. |
David M. Thomas (63) |
| Year of Election or Appointment: 2008 Previously, Mr. Thomas served as Executive Chairman (2005-2006) and Chairman and Chief Executive Officer (2000-2005) of IMS Health, Inc. (pharmaceutical and healthcare information solutions). In addition, Mr. Thomas serves as a member of the Board of Directors of Fortune Brands, Inc. (consumer products), and Interpublic Group of Companies, Inc. (marketing communication, 2004-present). |
Michael E. Wiley (61) |
| Year of Election or Appointment: 2008 Mr. Wiley also serves as a Director of Asia Pacific Exploration Consolidated (international oil and gas exploration and production, 2008-present). Mr. Wiley serves as a Director of Tesoro Corporation (independent oil refiner and marketer, 2005-present), and a Director of Bill Barrett Corporation (exploration and production, 2005-present). In addition, Mr. Wiley also serves as a Director of Post Oak Bank (privately-held bank, 2004-present). Previously, Mr. Wiley served as a member of the Board of Trustees of the University of Tulsa (2000-2006; 2007-2010), as a Senior Energy Advisor of Katzenbach Partners, LLC (consulting, 2006-2007), as an Advisory Director of Riverstone Holdings (private investment), Chairman, President, and CEO of Baker Hughes, Inc. (oilfield services, 2000-2004), and as Director of Spinnaker Exploration Company (exploration and production, 2001-2005). |
Annual Report
+ The information above includes each Trustee's principal occupation during the last five years and other information relating to the experience, attributes, and skills relevant to each Trustee's qualifications to serve as a Trustee, which led to the conclusion that each Trustee should serve as a Trustee for the fund.
Advisory Board Members and Executive Officers:
Correspondence intended for David A. Rosow and Garnett A. Smith may be sent to Fidelity Investments, P.O. Box 55235, Boston, Massachusetts 02205-5235. Correspondence intended for each executive officer, Edward C. Johnson 3d, and Peter S. Lynch may be sent to Fidelity Investments, 82 Devonshire Street, Boston, Massachusetts 02109.
Name, Age; Principal Occupation |
Edward C. Johnson 3d (82) |
| Year of Election or Appointment: 2011 Member of the Advisory Board of Fidelity's Equity and High Income Funds. Mr. Johnson serves as Chief Executive Officer, Chairman, and a Director of FMR LLC, and also serves as Chairman and Director of FIL Limited. Previously, Mr. Johnson served as a Trustee and Chairman of the Board of certain Fidelity Trusts, Chairman and a Director of FMR, Chairman and a Director of FMR Co., Inc., and President of FMR LLC (2006-2007). |
Peter S. Lynch (68) |
| Year of Election or Appointment: 2003 Member of the Advisory Board of Fidelity's Equity and High Income Funds. Mr. Lynch is Vice Chairman and a Director of FMR and FMR Co., Inc. In addition, Mr. Lynch serves as a Trustee of Boston College and as the Chairman of the Inner-City Scholarship Fund. Previously, Mr. Lynch served on the Special Olympics International Board of Directors (1997-2006). |
David A. Rosow (69) |
| Year of Election or Appointment: 2012 Member of the Advisory Board of Fidelity's Equity and High Income Funds. Chairman and Chief Executive Officer of International Golf Group, Inc. (golf course development, 1990-present). Previously, Mr. Rosow served as Chairman and Chief Executive Officer of Rosow & Company, Inc. (private investment company, 1989-2011), a Lead Director of Hudson United Bancorp (2001-2006) and as a Director of TD Banknorth (1996-2006). In addition, Mr. Rosow is a member (2008-present) and President (2009-present) of the Town Council of Palm Beach, Florida. |
Garnett A. Smith (64) |
| Year of Election or Appointment: 2012 Member of the Advisory Board of Fidelity's Equity and High Income Funds. Prior to Mr. Smith's retirement, he served as Chairman and Chief Executive Officer of Inbrand Corp. (manufacturer of personal absorbent products, 1990-1997). He also served as President (1986-1990) of Inbrand Corp. Prior to his employment with Inbrand Corp., he was employed by a retail fabric chain and North Carolina National Bank. In addition, Mr. Smith is a board member of the Jackson Hole Land Trust (2009-present). |
Kenneth B. Robins (42) |
| Year of Election or Appointment: 2008 President and Treasurer of Fidelity's Equity and High Income Funds. Mr. Robins also serves as President and Treasurer (2010-present) and Assistant Treasurer (2009-present) of other Fidelity funds and is an employee of Fidelity Investments (2004-present). Previously, Mr. Robins served as Deputy Treasurer of the Fidelity funds (2005-2008) and Treasurer and Chief Financial Officer of The North Carolina Capital Management Trust: Cash and Term Portfolios (2006-2008). |
Bruce T. Herring (46) |
| Year of Election or Appointment: 2006 Vice President of certain Equity Funds. Mr. Herring also serves as President of Fidelity Research & Analysis Company (2010-present), Chief Investment Officer and Director of Fidelity Management & Research (U.K.) Inc. (2010-present) and Group Chief Investment Officer of FMR. Previously, Mr. Herring served as Vice President (2005-2006) and Senior Vice President (2006-2007) of Fidelity Management & Research Company, Vice President of FMR Co., Inc. (2001-2007) and as a portfolio manager for Fidelity U.S. Equity Funds. |
Brian B. Hogan (47) |
| Year of Election or Appointment: 2009 Vice President of Equity and High Income Funds. Mr. Hogan also serves as President of FMR's Equity Division (2009-present). Previously, Mr. Hogan served as Senior Vice President, Equity Research of FMR (2006-2009) and as a portfolio manager. |
Scott C. Goebel (44) |
| Year of Election or Appointment: 2008 Secretary and Chief Legal Officer (CLO) of the Fidelity funds. Mr. Goebel also serves as Secretary of Fidelity Investments Money Management, Inc. (FIMM) (2010-present) and Fidelity Research and Analysis Company (FRAC) (2010-present); Secretary and CLO of The North Carolina Capital Management Trust: Cash and Term Portfolios (2008-present); General Counsel, Secretary, and Senior Vice President of FMR (2008-present) and FMR Co., Inc. (2008-present); employed by FMR LLC or an affiliate (2001-present); Chief Legal Officer of Fidelity Management & Research (Hong Kong) Limited (2008-present) and Assistant Secretary of Fidelity Management & Research (Japan) Inc. (2008-present), and Fidelity Management & Research (U.K.) Inc. (2008-present). Previously, Mr. Goebel served as Assistant Secretary of FIMM (2008-2010), FRAC (2008-2010), and the Funds (2007-2008) and as Vice President and Secretary of Fidelity Distributors Corporation (FDC) (2005-2007). |
William C. Coffey (43) |
| Year of Election or Appointment: 2009 Assistant Secretary of Fidelity's Equity and High Income Funds. Mr. Coffey also serves as Senior Vice President and Deputy General Counsel of FMR LLC (2010-present), and is an employee of Fidelity Investments. Previously, Mr. Coffey served as Vice President and Associate General Counsel of FMR LLC (2005-2009). |
Elizabeth Paige Baumann (44) |
| Year of Election or Appointment: 2012 Anti-Money Laundering (AML) Officer of the Fidelity funds. Ms. Baumann also serves as AML Officer of The North Carolina Capital Management Trust: Cash and Term Portfolios (2012-present), Chief AML Officer of FMR LLC (2012-present), and is an employee of Fidelity Investments. Previously, Ms. Baumann served as Vice President and Deputy Anti-Money Laundering Officer (2007-2012). |
Christine Reynolds (53) |
| Year of Election or Appointment: 2008 Chief Financial Officer of the Fidelity funds. Ms. Reynolds became President of Fidelity Pricing and Cash Management Services (FPCMS) in August 2008. Ms. Reynolds served as Chief Operating Officer of FPCMS (2007-2008). Previously, Ms. Reynolds served as President, Treasurer, and Anti-Money Laundering officer of the Fidelity funds (2004-2007). |
Joseph A. Hanlon (44) |
| Year of Election or Appointment: 2012 Chief Compliance Officer of Fidelity's Equity and High Income Funds. Mr. Hanlon serves as Compliance Officer of FMR, FMR Co., Inc., Fidelity Investments Money Management, Inc. (FIMM), Fidelity Research and Analysis Company (FRAC), Fidelity Management & Research (Japan) Inc., Fidelity Management & Research (U.K.) Inc., Fidelity Management & Research (Hong Kong), and Strategic Advisers, Inc. (2009-present), as Senior Vice President of the Fidelity Asset Management Division (2009-present), and is an employee of Fidelity Investments. |
Joseph F. Zambello (55) |
| Year of Election or Appointment: 2011 Deputy Treasurer of the Fidelity funds. Mr. Zambello is an employee of Fidelity Investments. Previously, Mr. Zambello served as Vice President of FMR's Program Management Group (2009-2011) and Vice President of the Transfer Agent Oversight Group (2005-2009). |
Adrien E. Deberghes (44) |
| Year of Election or Appointment: 2008 Deputy Treasurer of Fidelity's Equity and High Income Funds. Mr. Deberghes also serves as Vice President (2011-present) and Assistant Treasurer (2010-present) of other Fidelity funds, and is an employee of Fidelity Investments (2008-present). Previously, Mr. Deberghes served as Senior Vice President of Mutual Fund Administration at State Street Corporation (2007-2008), Senior Director of Mutual Fund Administration at Investors Bank & Trust (2005-2007), and Director of Finance for Dunkin' Brands (2000-2005). |
Stephanie J. Dorsey (43) |
| Year of Election or Appointment: 2010 Assistant Treasurer of Fidelity's Equity and High Income Funds. Ms. Dorsey also serves as Deputy Treasurer of other Fidelity funds (2008-present) and is an employee of Fidelity Investments (2008-present). Previously, Ms. Dorsey served as Treasurer (2004-2008) of the JPMorgan Mutual Funds and Vice President (2004-2008) of JPMorgan Chase Bank. |
John R. Hebble (54) |
| Year of Election or Appointment: 2009 Assistant Treasurer of Fidelity's Equity and High Income Funds. Mr. Hebble also serves as President (2011-present), Treasurer, and Chief Financial Officer of The North Carolina Capital Management Trust: Cash and Term Portfolios (2008-present), President and Treasurer of other Fidelity funds (2008-present) and is an employee of Fidelity Investments. |
Gary W. Ryan (53) |
| Year of Election or Appointment: 2005 Assistant Treasurer of the Fidelity funds. Mr. Ryan is an employee of Fidelity Investments. Previously, Mr. Ryan served as Vice President of Fund Reporting in Fidelity Pricing and Cash Management Services (FPCMS) (1999-2005). |
Jonathan Davis (44) |
| Year of Election or Appointment: 2010 Assistant Treasurer of the Fidelity funds. Mr. Davis is also Assistant Treasurer of Fidelity Rutland Square Trust II and Fidelity Commonwealth Trust II. Mr. Davis is an employee of Fidelity Investments. Previously, Mr. Davis served as Vice President and Associate General Counsel of FMR LLC (2003-2010). |
Annual Report
Class K designates 52% and 100% of the dividend distributed in August and December, respectively, during the fiscal year as qualifying for the dividends-received deduction for corporate shareholders.
Class K designates 75% and 100% of the dividend distributed in August and December, respectively, during the fiscal year as amounts which may be taken into account as a dividend for the purposes of the maximum rate under section 1(h)(11) of the Internal Revenue Code.
The fund will notify shareholders in January 2013 of amounts for use in preparing 2012 income tax returns.
Annual Report
Investment Adviser
Fidelity Management &
Research Company
Boston, MA
Investment Sub-Advisers
FMR Co., Inc.
Fidelity Management & Research
(U.K.) Inc.
Fidelity Management & Research
(Japan) Inc.
Fidelity Management & Research
(Hong Kong) Limited
General Distributor
Fidelity Distributors Corporation
Smithfield, RI
Transfer and Service Agents
Fidelity Investments Institutional
Operations Company, Inc.
Boston, MA
Fidelity Service Company, Inc.
Boston, MA
Custodian
Brown Brothers Harriman & Co.
Boston, MA
CII-K-UANN-0812
1.863270.103
(Fidelity Investment logo)(registered trademark)
Corporate Headquarters
82 Devonshire St., Boston, MA 02109
www.fidelity.com
Fidelity®
Mega Cap Stock
Fund
Annual Report
June 30, 2012
(Fidelity Cover Art)
Contents
Performance | (Click Here) | How the fund has done over time. |
Management's Discussion of Fund Performance | (Click Here) | The Portfolio Manager's review of fund performance and strategy. |
Shareholder Expense Example | (Click Here) | An example of shareholder expenses. |
Investment Changes | (Click Here) | A summary of major shifts in the fund's investments over the past six months. |
Investments | (Click Here) | A complete list of the fund's investments with their market values. |
Financial Statements | (Click Here) | Statements of assets and liabilities, operations, and changes in net assets, as well as financial highlights. |
Notes | (Click Here) | Notes to the financial statements. |
Report of Independent Registered Public Accounting Firm | (Click Here) | |
Trustees and Officers | (Click Here) | |
Distributions | (Click Here) | |
To view a fund's proxy voting guidelines and proxy voting record for the 12-month period ended June 30, visit http://www.fidelity.com/proxyvotingresults or visit the Securities and Exchange Commission's (SEC) web site at http://www.sec.gov. You may also call 1-800-544-8544 to request a free copy of the proxy voting guidelines.
Standard & Poor's, S&P and S&P 500 are registered service marks of The McGraw-Hill Companies, Inc. and have been licensed for use by Fidelity Distributors Corporation.
Other third party marks appearing herein are the property of their respective owners.
All other marks appearing herein are registered or unregistered trademarks or service marks of FMR LLC or an affiliated company. © 2012 FMR LLC. All rights reserved.
This report and the financial statements contained herein are submitted for the general information of the shareholders of the fund. This report is not authorized for distribution to prospective investors in the fund unless preceded or accompanied by an effective prospectus.
A fund files its complete schedule of portfolio holdings with the SEC for the first and third quarters of each fiscal year on Form N-Q. Forms N-Q are available on the SEC's web site at http://www.sec.gov. A fund's Forms N-Q may be reviewed and copied at the SEC's Public Reference Room in Washington, DC. Information regarding the operation of the SEC's Public Reference Room may be obtained by calling 1-800-SEC-0330. For a complete list of a fund's portfolio holdings, view the most recent holdings listing, semiannual report, or annual report on Fidelity's web site at http://www.fidelity.com, http://www.advisor.fidelity.com, or http://www.401k.com, as applicable.
NOT FDIC INSURED • MAY LOSE VALUE • NO BANK GUARANTEE
Neither the fund nor Fidelity Distributors Corporation is a bank.
Annual Report
Average annual total return reflects the change in the value of an investment, assuming reinvestment of the class' distributions from dividend income and capital gains (the profits earned upon the sale of securities that have grown in value, if any) and assuming a constant rate of performance each year. The $10,000 table and the fund's returns do not reflect the deduction of taxes that a shareholder would pay on fund distributions or the redemption of fund shares. During periods of reimbursement by Fidelity, a fund's total return will be greater than it would be had the reimbursement not occurred. How a fund did yesterday is no guarantee of how it will do tomorrow.
Average Annual Total Returns
Periods ended June 30, 2012 | Past 1
year | Past 5
years | Past 10
years |
Fidelity® Mega Cap Stock Fund A | 7.83% | 0.62% | 5.48% |
A Prior to December 1, 2007, Fidelity Mega Cap Stock Fund operated under certain different investment policies. The fund's historical performance may not represent its current investment policies.
$10,000 Over 10 Years
Let's say hypothetically that $10,000 was invested in Fidelity® Mega Cap Stock Fund, a class of the fund, on June 30, 2002. The chart shows how the value of your investment would have changed, and also shows how the S&P 500® Index performed over the same period.
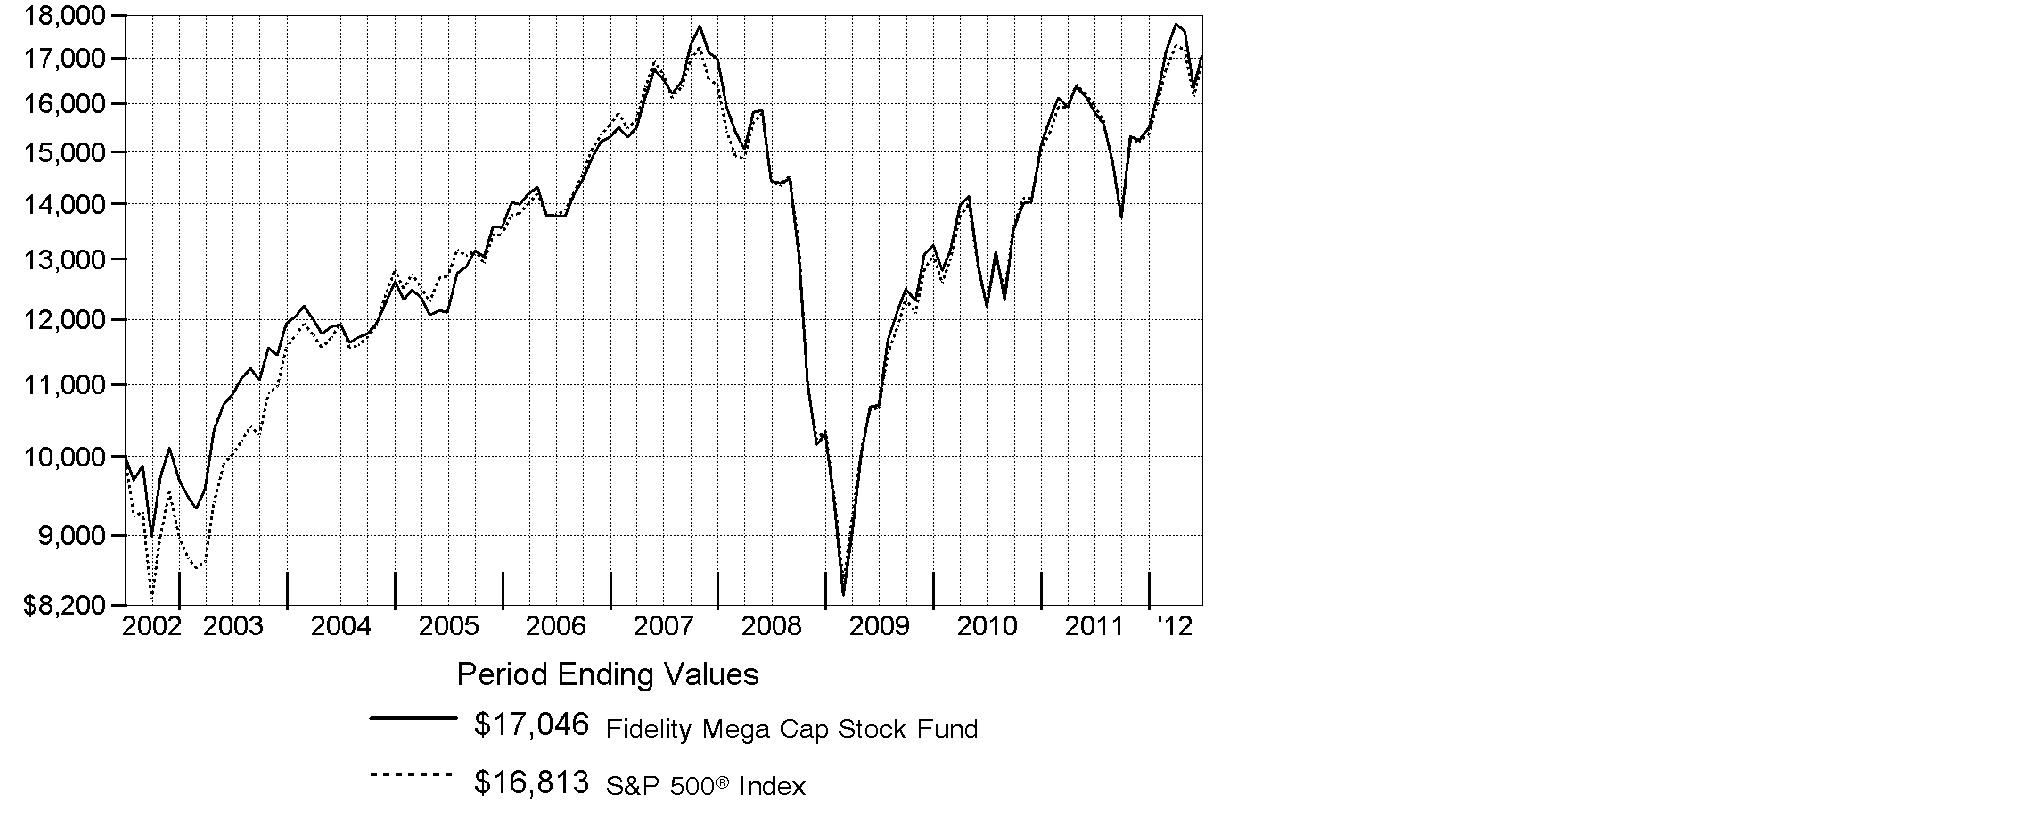
Annual Report
Market Recap: Major U.S. equity benchmarks posted solid gains for the 12 months ending June 30, 2012, even amid the period's uncertain investment environment. The broad-based S&P 500® Index returned 5.45%, while the blue-chip-laden Dow Jones Industrial AverageSM and the technology-heavy Nasdaq Composite® Index gained 6.63% and 6.99%, respectively. Volatility marked the first half of the period, as equities plummeted last summer and early fall on Europe's debt woes, debate over the U.S. debt ceiling and the credit-rating downgrade that followed. Beginning in October, healthier manufacturing, consumer and housing data rejuvenated markets and investors' appetite for stocks, leading major equity benchmarks to their best first-quarter performance since 1998. Stocks slipped again in the spring, as more eurozone trouble and a marked slowdown in China put the brakes on earlier momentum, until optimism reappeared in June. For the period, five of the 10 major market segments within the S&P 500® posted a double-digit gain, led by the more-defensive utilities, consumer staples and telecommunication services sectors, each which rose about 15%. Conversely, energy (-8%) and materials (-7%) struggled the most. Given Europe's turmoil and local currency weakness, foreign developed-markets stocks lost ground, with the MSCI® EAFE® Index returning -13.70%.
Comments from Matthew Fruhan, Portfolio Manager of Fidelity® Mega Cap Stock Fund: For the year, the fund's Retail Class shares gained 7.83%, ahead of the mega-cap proxy Russell Top 200® Index, which rose 7.04%, and the S&P 500®. Relative to the Russell index, stock selection within information technology was a bright spot, especially software/services names. Sector positioning overall also was helpful. Conversely, my picks in consumer staples notably detracted, as did positioning in telecommunication services. The fund's foreign investments hurt overall, due in part to a stronger U.S. dollar. The top contributor was U.K.-based Autonomy, an enterprise software maker. The stock rose sharply in August on a generous takeover bid from Hewlett-Packard. I sold Autonomy shortly after the announcement. A sizable stake in Wells Fargo helped, as earnings estimates were revised higher due to loan growth and favorable credit trends. An overweight in MasterCard boosted performance because earnings estimates for the card-processing company increased. Conversely, JPMorgan Chase was the largest relative detractor because its stock lagged, due in part to new capital standards for financial firms. In capital goods, an overweight in Ingersoll-Rand hurt because management missed short-term financial targets. Autonomy and Ingersoll-Rand were not in the index.
The views expressed above reflect those of the portfolio manager(s) only through the end of the period as stated on the cover of this report and do not necessarily represent the views of Fidelity or any other person in the Fidelity organization. Any such views are subject to change at any time based upon market or other conditions and Fidelity disclaims any responsibility to update such views. These views may not be relied on as investment advice and, because investment decisions for a Fidelity fund are based on numerous factors, may not be relied on as an indication of trading intent on behalf of any Fidelity fund.
Annual Report
Shareholder Expense Example
As a shareholder of the Fund, you incur two types of costs: (1) transaction costs, including sales charges (loads) on purchase payments or redemption proceeds, and (2) ongoing costs, including management fees, distribution and/or service (12b-1) fees and other Fund expenses. This Example is intended to help you understand your ongoing costs (in dollars) of investing in the Fund and to compare these costs with the ongoing costs of investing in other mutual funds.
The Example is based on an investment of $1,000 invested at the beginning of the period and held for the entire period (January 1, 2012 to June 30, 2012).
Actual Expenses
The first line of the accompanying table for each class of the Fund provides information about actual account values and actual expenses. You may use the information in this line, together with the amount you invested, to estimate the expenses that you paid over the period. Simply divide your account value by $1,000.00 (for example, an $8,600 account value divided by $1,000.00 = 8.6), then multiply the result by the number in the first line for a class of the Fund under the heading entitled "Expenses Paid During Period" to estimate the expenses you paid on your account during this period. A small balance maintenance fee of $12.00 that is charged once a year may apply for certain accounts with a value of less than $2,000. This fee is not included in the table below. If it was, the estimate of expenses you paid during the period would be higher, and your ending account value lower, by this amount. In addition, the Fund, as a shareholder in the underlying Fidelity Central Funds, will indirectly bear its pro-rata share of the fees and expenses incurred by the underlying Fidelity Central Funds. These fees and expenses are not included in the Fund's annualized expense ratio used to calculate the expense estimate in the table below.
Hypothetical Example for Comparison Purposes
The second line of the accompanying table for each class of the Fund provides information about hypothetical account values and hypothetical expenses based on a Class' actual expense ratio and an assumed rate of return of 5% per year before expenses, which is not the Class' actual return. The hypothetical account values and expenses may not be used to estimate the actual ending account balance or expenses you paid for the period. You may use this information to compare the ongoing costs of investing in the Fund and other funds. To do so, compare this 5% hypothetical example with the 5% hypothetical examples that appear in the shareholder reports of the other funds. A small balance maintenance fee of $12.00 that is charged once a year may apply for certain accounts with a value of less than $2,000. This fee is not included in the table below. If it was, the estimate of expenses you paid during the period would be higher, and your ending account value lower, by this amount. In addition, the Fund, as a shareholder in the underlying Fidelity Central Funds, will indirectly bear its pro-rata share of the fees and expenses incurred by the underlying Fidelity Central Funds. These fees and expenses are not included in the Fund's annualized expense ratio used to calculate the expense estimate in the table below.
Please note that the expenses shown in the table are meant to highlight your ongoing costs only and do not reflect any transaction costs. Therefore, the second line of the table is useful in comparing ongoing costs only, and will not help you determine the relative total costs of owning different funds. In addition, if these transactional costs were included, your costs would have been higher.
Annual Report
| Annualized
Expense Ratio | Beginning
Account Value
January 1, 2012 | Ending
Account Value
June 30, 2012 | Expenses Paid
During Period*
January 1, 2012
to June 30, 2012 |
Class A | 1.01% | | | |
Actual | | $ 1,000.00 | $ 1,099.50 | $ 5.27 |
HypotheticalA | | $ 1,000.00 | $ 1,019.84 | $ 5.07 |
Class T | 1.32% | | | |
Actual | | $ 1,000.00 | $ 1,097.30 | $ 6.88 |
HypotheticalA | | $ 1,000.00 | $ 1,018.30 | $ 6.62 |
Class B | 1.82% | | | |
Actual | | $ 1,000.00 | $ 1,093.70 | $ 9.47 |
HypotheticalA | | $ 1,000.00 | $ 1,015.81 | $ 9.12 |
Class C | 1.78% | | | |
Actual | | $ 1,000.00 | $ 1,095.20 | $ 9.27 |
HypotheticalA | | $ 1,000.00 | $ 1,016.01 | $ 8.92 |
Mega Cap Stock | .74% | | | |
Actual | | $ 1,000.00 | $ 1,100.00 | $ 3.86 |
HypotheticalA | | $ 1,000.00 | $ 1,021.18 | $ 3.72 |
Institutional Class | .77% | | | |
Actual | | $ 1,000.00 | $ 1,100.30 | $ 4.02 |
HypotheticalA | | $ 1,000.00 | $ 1,021.03 | $ 3.87 |
A 5% return per year before expenses
* Expenses are equal to each Class' annualized expense ratio, multiplied by the average account value over the period, multiplied by 182/366 (to reflect the one-half year period).
Annual Report
Investment Changes (Unaudited)
Top Ten Stocks as of June 30, 2012 |
| % of fund's
net assets | % of fund's net assets
6 months ago |
Apple, Inc. | 6.1 | 5.1 |
Wells Fargo & Co. | 4.2 | 4.6 |
JPMorgan Chase & Co. | 3.9 | 4.0 |
Exxon Mobil Corp. | 3.3 | 4.4 |
Chevron Corp. | 3.1 | 3.4 |
General Electric Co. | 3.0 | 3.0 |
Microsoft Corp. | 2.7 | 2.2 |
Comcast Corp. Class A (special) (non-vtg.) | 2.5 | 1.5 |
Procter & Gamble Co. | 2.4 | 2.5 |
Google, Inc. Class A | 2.3 | 3.0 |
| 33.5 | |
Top Five Market Sectors as of June 30, 2012 |
| % of fund's
net assets | % of fund's net assets
6 months ago |
Information Technology | 20.9 | 23.5 |
Financials | 15.5 | 15.8 |
Energy | 14.0 | 13.8 |
Health Care | 13.0 | 10.1 |
Consumer Discretionary | 12.6 | 11.9 |
Asset Allocation (% of fund's net assets) |
As of June 30, 2012 * | As of December 31, 2011 ** |
| Stocks 99.5% | | | Stocks and
Equity Futures 99.1% | |
 | Convertible
Securities 0.1% | |  | Convertible
Securities 0.0% | |
| Short-Term
Investments and
Net Other Assets
(Liabilities) 0.4% | | | Short-Term
Investments and
Net Other Assets
(Liabilities) 0.9% | |
* Foreign investments | 9.7% | | ** Foreign investments | 10.0% | |

Annual Report
Investments June 30, 2012
Showing Percentage of Net Assets
Common Stocks - 98.9% |
| Shares | | Value |
CONSUMER DISCRETIONARY - 12.0% |
Auto Components - 0.4% |
Johnson Controls, Inc. | 231,500 | | $ 6,414,865 |
Automobiles - 0.4% |
Bayerische Motoren Werke AG (BMW) | 83,426 | | 6,010,419 |
Hotels, Restaurants & Leisure - 1.0% |
McDonald's Corp. | 139,300 | | 12,332,229 |
Yum! Brands, Inc. | 37,500 | | 2,415,750 |
| | 14,747,979 |
Media - 6.3% |
Comcast Corp. Class A (special) (non-vtg.) | 1,176,600 | | 36,945,240 |
The Walt Disney Co. | 291,800 | | 14,152,300 |
Thomson Reuters Corp. | 123,200 | | 3,505,652 |
Time Warner Cable, Inc. | 73,200 | | 6,009,720 |
Time Warner, Inc. | 668,600 | | 25,741,100 |
Viacom, Inc. Class B (non-vtg.) | 151,200 | | 7,109,424 |
| | 93,463,436 |
Multiline Retail - 1.6% |
Target Corp. | 392,000 | | 22,810,480 |
Specialty Retail - 2.3% |
Home Depot, Inc. | 211,900 | | 11,228,581 |
Lowe's Companies, Inc. | 790,900 | | 22,493,196 |
| | 33,721,777 |
TOTAL CONSUMER DISCRETIONARY | | 177,168,956 |
CONSUMER STAPLES - 11.2% |
Beverages - 2.9% |
PepsiCo, Inc. | 303,300 | | 21,431,178 |
The Coca-Cola Co. | 273,900 | | 21,416,241 |
| | 42,847,419 |
Food & Staples Retailing - 1.7% |
CVS Caremark Corp. | 272,800 | | 12,747,944 |
Walgreen Co. | 411,800 | | 12,181,044 |
| | 24,928,988 |
Food Products - 0.7% |
Kellogg Co. | 216,000 | | 10,655,280 |
Household Products - 4.7% |
Colgate-Palmolive Co. | 100,800 | | 10,493,280 |
Kimberly-Clark Corp. | 234,400 | | 19,635,688 |
Common Stocks - continued |
| Shares | | Value |
CONSUMER STAPLES - continued |
Household Products - continued |
Procter & Gamble Co. | 570,700 | | $ 34,955,375 |
Reckitt Benckiser Group PLC | 74,600 | | 3,931,491 |
| | 69,015,834 |
Tobacco - 1.2% |
British American Tobacco PLC sponsored ADR | 114,500 | | 11,692,740 |
Philip Morris International, Inc. | 70,430 | | 6,145,722 |
| | 17,838,462 |
TOTAL CONSUMER STAPLES | | 165,285,983 |
ENERGY - 14.0% |
Energy Equipment & Services - 2.5% |
Halliburton Co. | 571,100 | | 16,213,529 |
National Oilwell Varco, Inc. | 90,500 | | 5,831,820 |
Schlumberger Ltd. | 223,900 | | 14,533,349 |
| | 36,578,698 |
Oil, Gas & Consumable Fuels - 11.5% |
Apache Corp. | 118,000 | | 10,371,020 |
BP PLC sponsored ADR | 171,800 | | 6,964,772 |
Chevron Corp. | 440,300 | | 46,451,650 |
Exxon Mobil Corp. | 566,171 | | 48,447,252 |
Occidental Petroleum Corp. | 192,200 | | 16,484,994 |
Royal Dutch Shell PLC Class A sponsored ADR | 285,500 | | 19,251,265 |
Suncor Energy, Inc. | 522,000 | | 15,094,470 |
Williams Companies, Inc. | 230,300 | | 6,637,246 |
| | 169,702,669 |
TOTAL ENERGY | | 206,281,367 |
FINANCIALS - 15.5% |
Capital Markets - 2.3% |
BlackRock, Inc. Class A | 20,700 | | 3,515,274 |
Charles Schwab Corp. | 877,100 | | 11,340,903 |
Goldman Sachs Group, Inc. | 49,600 | | 4,754,656 |
Morgan Stanley | 656,800 | | 9,582,712 |
Northern Trust Corp. | 101,200 | | 4,657,224 |
| | 33,850,769 |
Commercial Banks - 6.0% |
BB&T Corp. | 247,400 | | 7,632,290 |
Common Stocks - continued |
| Shares | | Value |
FINANCIALS - continued |
Commercial Banks - continued |
Standard Chartered PLC (United Kingdom) | 66,063 | | $ 1,432,467 |
U.S. Bancorp | 560,200 | | 18,016,032 |
Wells Fargo & Co. | 1,843,830 | | 61,657,675 |
| | 88,738,464 |
Diversified Financial Services - 6.3% |
Bank of America Corp. | 545,300 | | 4,460,554 |
Citigroup, Inc. | 789,870 | | 21,650,337 |
CME Group, Inc. | 32,900 | | 8,820,819 |
JPMorgan Chase & Co. | 1,625,600 | | 58,082,688 |
| | 93,014,398 |
Insurance - 0.9% |
ACE Ltd. | 27,700 | | 2,053,401 |
MetLife, Inc. | 372,800 | | 11,500,880 |
| | 13,554,281 |
TOTAL FINANCIALS | | 229,157,912 |
HEALTH CARE - 13.0% |
Biotechnology - 1.0% |
Amgen, Inc. | 196,290 | | 14,337,022 |
Health Care Equipment & Supplies - 0.7% |
Baxter International, Inc. | 117,000 | | 6,218,550 |
St. Jude Medical, Inc. | 108,400 | | 4,326,244 |
| | 10,544,794 |
Health Care Providers & Services - 3.1% |
Aetna, Inc. | 239,600 | | 9,289,292 |
McKesson Corp. | 192,700 | | 18,065,625 |
UnitedHealth Group, Inc. | 27,000 | | 1,579,500 |
WellPoint, Inc. | 279,300 | | 17,816,547 |
| | 46,750,964 |
Life Sciences Tools & Services - 0.3% |
Thermo Fisher Scientific, Inc. | 92,100 | | 4,780,911 |
Pharmaceuticals - 7.9% |
Abbott Laboratories | 258,200 | | 16,646,154 |
Eli Lilly & Co. | 108,400 | | 4,651,444 |
GlaxoSmithKline PLC sponsored ADR | 217,200 | | 9,897,804 |
Johnson & Johnson | 490,400 | | 33,131,424 |
Common Stocks - continued |
| Shares | | Value |
HEALTH CARE - continued |
Pharmaceuticals - continued |
Merck & Co., Inc. | 759,100 | | $ 31,692,425 |
Pfizer, Inc. | 883,100 | | 20,311,300 |
| | 116,330,551 |
TOTAL HEALTH CARE | | 192,744,242 |
INDUSTRIALS - 9.3% |
Aerospace & Defense - 2.7% |
Honeywell International, Inc. | 144,200 | | 8,052,128 |
Raytheon Co. | 155,100 | | 8,777,109 |
The Boeing Co. | 125,900 | | 9,354,370 |
United Technologies Corp. | 179,300 | | 13,542,529 |
| | 39,726,136 |
Air Freight & Logistics - 0.9% |
United Parcel Service, Inc. Class B | 177,800 | | 14,003,528 |
Electrical Equipment - 0.4% |
Emerson Electric Co. | 133,700 | | 6,227,746 |
Industrial Conglomerates - 4.1% |
Danaher Corp. | 166,700 | | 8,681,736 |
General Electric Co. | 2,162,500 | | 45,066,500 |
Tyco International Ltd. | 134,000 | | 7,081,900 |
| | 60,830,136 |
Machinery - 0.9% |
Atlas Copco AB (A Shares) | 20,100 | | 431,205 |
Illinois Tool Works, Inc. | 118,900 | | 6,288,621 |
Ingersoll-Rand PLC | 161,540 | | 6,813,757 |
| | 13,533,583 |
Road & Rail - 0.3% |
Union Pacific Corp. | 31,000 | | 3,698,610 |
TOTAL INDUSTRIALS | | 138,019,739 |
INFORMATION TECHNOLOGY - 20.9% |
Communications Equipment - 2.0% |
Cisco Systems, Inc. | 939,300 | | 16,127,781 |
QUALCOMM, Inc. | 228,000 | | 12,695,040 |
| | 28,822,821 |
Computers & Peripherals - 7.3% |
Apple, Inc. (a) | 155,001 | | 90,520,584 |
Common Stocks - continued |
| Shares | | Value |
INFORMATION TECHNOLOGY - continued |
Computers & Peripherals - continued |
EMC Corp. (a) | 463,700 | | $ 11,884,631 |
Hewlett-Packard Co. | 274,800 | | 5,526,228 |
| | 107,931,443 |
Electronic Equipment & Components - 0.4% |
Corning, Inc. | 418,500 | | 5,411,205 |
Internet Software & Services - 2.3% |
Google, Inc. Class A (a) | 58,350 | | 33,847,085 |
IT Services - 4.4% |
Accenture PLC Class A | 42,600 | | 2,559,834 |
Cognizant Technology Solutions Corp. Class A (a) | 185,600 | | 11,136,000 |
IBM Corp. | 76,000 | | 14,864,080 |
MasterCard, Inc. Class A | 48,900 | | 21,032,379 |
Visa, Inc. Class A | 121,100 | | 14,971,593 |
| | 64,563,886 |
Semiconductors & Semiconductor Equipment - 0.3% |
Broadcom Corp. Class A | 151,500 | | 5,120,700 |
Software - 4.2% |
Microsoft Corp. | 1,311,200 | | 40,109,608 |
Oracle Corp. | 632,300 | | 18,779,310 |
salesforce.com, Inc. (a) | 26,500 | | 3,663,890 |
| | 62,552,808 |
TOTAL INFORMATION TECHNOLOGY | | 308,249,948 |
MATERIALS - 1.0% |
Chemicals - 0.9% |
Air Products & Chemicals, Inc. | 13,000 | | 1,049,490 |
E.I. du Pont de Nemours & Co. | 117,600 | | 5,947,032 |
Syngenta AG (Switzerland) | 17,510 | | 5,994,114 |
| | 12,990,636 |
Metals & Mining - 0.1% |
Freeport-McMoRan Copper & Gold, Inc. | 57,800 | | 1,969,246 |
TOTAL MATERIALS | | 14,959,882 |
TELECOMMUNICATION SERVICES - 0.8% |
Wireless Telecommunication Services - 0.8% |
Vodafone Group PLC sponsored ADR | 410,900 | | 11,579,162 |
Common Stocks - continued |
| Shares | | Value |
UTILITIES - 1.2% |
Electric Utilities - 0.7% |
Duke Energy Corp. | 54,300 | | $ 1,252,158 |
FirstEnergy Corp. | 91,100 | | 4,481,209 |
NextEra Energy, Inc. | 52,800 | | 3,633,168 |
PPL Corp. | 47,030 | | 1,307,904 |
| | 10,674,439 |
Multi-Utilities - 0.5% |
National Grid PLC | 400,442 | | 4,243,895 |
PG&E Corp. | 78,200 | | 3,540,114 |
| | 7,784,009 |
TOTAL UTILITIES | | 18,458,448 |
TOTAL COMMON STOCKS (Cost $1,380,548,550) |
1,461,905,639
|
Preferred Stocks - 0.7% |
| | | |
Convertible Preferred Stocks - 0.1% |
INDUSTRIALS - 0.1% |
Aerospace & Defense - 0.1% |
United Technologies Corp. 7.50% | 30,000 | | 1,580,700 |
Nonconvertible Preferred Stocks - 0.6% |
CONSUMER DISCRETIONARY - 0.6% |
Automobiles - 0.6% |
Volkswagen AG | 54,300 | | 8,562,095 |
TOTAL PREFERRED STOCKS (Cost $10,396,129) |
10,142,795
|
Money Market Funds - 0.4% |
| Shares | | Value |
Fidelity Cash Central Fund, 0.17% (b)
(Cost $5,340,245) | 5,340,245 | | $ 5,340,245 |
TOTAL INVESTMENT PORTFOLIO - 100.0% (Cost $1,396,284,924) | | 1,477,388,679 |
NET OTHER ASSETS (LIABILITIES) - 0.0% | | (42,272) |
NET ASSETS - 100% | $ 1,477,346,407 |
Legend |
(a) Non-income producing |
(b) Affiliated fund that is available only to investment companies and other accounts managed by Fidelity Investments. The rate quoted is the annualized seven-day yield of the fund at period end. A complete unaudited listing of the fund's holdings as of its most recent quarter end is available upon request. In addition, each Fidelity Central Fund's financial statements, which are not covered by the Fund's Report of Independent Registered Public Accounting Firm, are available on the SEC's website or upon request. |
Affiliated Central Funds |
Information regarding fiscal year to date income earned by the Fund from investments in Fidelity Central Funds is as follows: |
Fund | Income earned |
Fidelity Cash Central Fund | $ 13,361 |
Fidelity Securities Lending Cash Central Fund | 147,642 |
Total | $ 161,003 |
Other Information |
The following is a summary of the inputs used, as of June 30, 2012, involving the Fund's assets and liabilities carried at fair value. The inputs or methodology used for valuing securities may not be an indication of the risk associated with investing in those securities. For more information on valuation inputs, and their aggregation into the levels used in the table below, please refer to the Security Valuation section in the accompanying Notes to Financial Statements. |
Valuation Inputs at Reporting Date: |
Description | Total | Level 1 | Level 2 | Level 3 |
Investments in Securities: | | | | |
Equities: | | | | |
Consumer Discretionary | $ 185,731,051 | $ 185,731,051 | $ - | $ - |
Consumer Staples | 165,285,983 | 165,285,983 | - | - |
Energy | 206,281,367 | 206,281,367 | - | - |
Financials | 229,157,912 | 229,157,912 | - | - |
Health Care | 192,744,242 | 192,744,242 | - | - |
Industrials | 139,600,439 | 139,600,439 | - | - |
Information Technology | 308,249,948 | 308,249,948 | - | - |
Materials | 14,959,882 | 8,965,768 | 5,994,114 | - |
Telecommunication Services | 11,579,162 | 11,579,162 | - | - |
Utilities | 18,458,448 | 14,214,553 | 4,243,895 | - |
Money Market Funds | 5,340,245 | 5,340,245 | - | - |
Total Investments in Securities: | $ 1,477,388,679 | $ 1,467,150,670 | $ 10,238,009 | $ - |
See accompanying notes which are an integral part of the financial statements.
Annual Report
Statement of Assets and Liabilities
| June 30, 2012 |
| | |
Assets | | |
Investment in securities, at value - See accompanying schedule: Unaffiliated issuers (cost $1,390,944,679) | $ 1,472,048,434 | |
Fidelity Central Funds (cost $5,340,245) | 5,340,245 | |
Total Investments (cost $1,396,284,924) | | $ 1,477,388,679 |
Receivable for investments sold | | 4,513,052 |
Receivable for fund shares sold | | 112,201,019 |
Dividends receivable | | 2,618,855 |
Distributions receivable from Fidelity Central Funds | | 600 |
Other receivables | | 15,040 |
Total assets | | 1,596,737,245 |
| | |
Liabilities | | |
Payable for investments purchased | $ 117,396,851 | |
Payable for fund shares redeemed | 1,141,354 | |
Accrued management fee | 503,966 | |
Distribution and service plan fees payable | 5,498 | |
Other affiliated payables | 292,121 | |
Other payables and accrued expenses | 51,048 | |
Total liabilities | | 119,390,838 |
| | |
Net Assets | | $ 1,477,346,407 |
Net Assets consist of: | | |
Paid in capital | | $ 1,505,792,572 |
Undistributed net investment income | | 10,984,843 |
Accumulated undistributed net realized gain (loss) on investments and foreign currency transactions | | (120,530,812) |
Net unrealized appreciation (depreciation) on investments and assets and liabilities in foreign currencies | | 81,099,804 |
Net Assets | | $ 1,477,346,407 |
See accompanying notes which are an integral part of the financial statements.
Annual Report
Statement of Assets and Liabilities - continued
| June 30, 2012 |
| | |
Calculation of Maximum Offering Price Class A:
Net Asset Value and redemption price per share ($8,527,011 ÷ 771,793 shares) | | $ 11.05 |
| | |
Maximum offering price per share (100/94.25 of $11.05) | | $ 11.72 |
Class T:
Net Asset Value and redemption price per share ($2,293,345 ÷ 207,585 shares) | | $ 11.05 |
| | |
Maximum offering price per share (100/96.50 of $11.05) | | $ 11.45 |
Class B:
Net Asset Value and offering price per share ($703,627 ÷ 64,122 shares)A | | $ 10.97 |
| | |
Class C:
Net Asset Value and offering price per share ($2,845,398 ÷ 260,413 shares)A | | $ 10.93 |
| | |
| | |
Mega Cap Stock:
Net Asset Value, offering price and redemption price per share ($1,287,144,341 ÷ 115,843,358 shares) | | $ 11.11 |
| | |
Institutional Class:
Net Asset Value, offering price and redemption price per share ($175,832,685 ÷ 15,867,859 shares) | | $ 11.08 |
A Redemption price per share is equal to net asset value less any applicable contingent deferred sales charge.
See accompanying notes which are an integral part of the financial statements.
Annual Report
Financial Statements - continued
Statement of Operations
| Year ended June 30, 2012 |
| | |
Investment Income | | |
Dividends | | $ 26,585,526 |
Interest | | 11,400 |
Income from Fidelity Central Funds | | 161,003 |
Total income | | 26,757,929 |
| | |
Expenses | | |
Management fee | $ 5,326,645 | |
Transfer agent fees | 2,841,812 | |
Distribution and service plan fees | 57,115 | |
Accounting and security lending fees | 377,501 | |
Custodian fees and expenses | 56,633 | |
Independent trustees' compensation | 7,188 | |
Registration fees | 144,593 | |
Audit | 48,095 | |
Legal | 5,010 | |
Interest | 6,291 | |
Miscellaneous | 9,521 | |
Total expenses before reductions | 8,880,404 | |
Expense reductions | (26,452) | 8,853,952 |
Net investment income (loss) | | 17,903,977 |
Realized and Unrealized Gain (Loss) Net realized gain (loss) on: | | |
Investment securities: | | |
Unaffiliated issuers | 43,339,638 | |
Foreign currency transactions | 724 | |
Futures contracts | (142,240) | |
Total net realized gain (loss) | | 43,198,122 |
Change in net unrealized appreciation (depreciation) on: Investment securities | 29,111,014 | |
Assets and liabilities in foreign currencies | (12,065) | |
Total change in net unrealized appreciation (depreciation) | | 29,098,949 |
Net gain (loss) | | 72,297,071 |
Net increase (decrease) in net assets resulting from operations | | $ 90,201,048 |
See accompanying notes which are an integral part of the financial statements.
Annual Report
Statement of Changes in Net Assets
| Year ended
June 30,
2012 | Year ended
June 30,
2011 |
Increase (Decrease) in Net Assets | | |
Operations | | |
Net investment income (loss) | $ 17,903,977 | $ 7,510,892 |
Net realized gain (loss) | 43,198,122 | 43,232,954 |
Change in net unrealized appreciation (depreciation) | 29,098,949 | 104,537,333 |
Net increase (decrease) in net assets resulting
from operations | 90,201,048 | 155,281,179 |
Distributions to shareholders from net investment income | (11,753,098) | (4,840,262) |
Share transactions - net increase (decrease) | 468,368,181 | 273,329,633 |
Total increase (decrease) in net assets | 546,816,131 | 423,770,550 |
| | |
Net Assets | | |
Beginning of period | 930,530,276 | 506,759,726 |
End of period (including undistributed net investment income of $10,984,843 and undistributed net investment income of $4,847,983, respectively) | $ 1,477,346,407 | $ 930,530,276 |
See accompanying notes which are an integral part of the financial statements.
Annual Report
Financial Highlights - Class A
Years ended June 30, | 2012 | 2011 | 2010 | 2009 | 2008 H |
Selected Per-Share Data | | | | |
Net asset value, beginning of period | $ 10.37 | $ 8.07 | $ 7.20 | $ 9.89 | $ 10.61 |
Income from Investment Operations | | | | | |
Net investment income (loss) E | .13 | .07 | .06 | .10 | .05 |
Net realized and unrealized gain (loss) | .64 | 2.28 | .92 | (2.65) | (.77) |
Total from investment operations | .77 | 2.35 | .98 | (2.55) | (.72) |
Distributions from net investment income | (.09) | (.05) | (.11) | (.12) | - |
Distributions from net realized gain | - | - | - | (.02) | - |
Total distributions | (.09) | (.05) | (.11) | (.14) | - |
Net asset value, end of period | $ 11.05 | $ 10.37 | $ 8.07 | $ 7.20 | $ 9.89 |
Total Return B, C, D | 7.57% | 29.23% | 13.65% | (25.98)% | (6.79)% |
Ratios to Average Net Assets F, I | | | | |
Expenses before reductions | 1.02% | 1.06% | 1.10% | 1.13% | 1.02% A |
Expenses net of fee waivers, if any | 1.02% | 1.06% | 1.10% | 1.13% | 1.02% A |
Expenses net of all reductions | 1.02% | 1.06% | 1.10% | 1.13% | 1.01% A |
Net investment income (loss) | 1.28% | .76% | .66% | 1.44% | 1.24% A |
Supplemental Data | | | | |
Net assets, end of period (000 omitted) | $ 8,527 | $ 4,169 | $ 2,238 | $ 806 | $ 106 |
Portfolio turnover rate G | 57% | 53% | 97% | 138% | 97% |
A Annualized
B Total returns for periods of less than one year are not annualized.
C Total returns would have been lower if certain expenses had not been reduced during the applicable periods shown.
D Total returns do not include the effect of the sales charges.
E Calculated based on average shares outstanding during the period.
F Fees and expenses of any underlying Fidelity Central Funds are not included in the Fund's expense ratio. The Fund indirectly bears its proportionate share of the expenses of any underlying Fidelity Central Funds.
G Amount does not include the portfolio activity of any underlying Fidelity Central Funds.
H For the period February 5, 2008 (commencement of sale of shares) to June 30, 2008.
I Expense ratios reflect operating expenses of the class. Expenses before reductions do not reflect amounts reimbursed by the investment adviser or reductions from brokerage service arrangements or reductions from other expense offset arrangements and do not represent the amount paid by the class during periods when reimbursements or reductions occur. Expense ratios before reductions for start-up periods may not be representative of longer-term operating periods. Expenses net of fee waivers reflect expenses after reimbursement by the investment adviser but prior to reductions from brokerage service arrangements or other expense offset arrangements. Expenses net of all reductions represent the net expenses paid by the class.
See accompanying notes which are an integral part of the financial statements.
Annual Report
Financial Highlights - Class T
Years ended June 30, | 2012 | 2011 | 2010 | 2009 | 2008 H |
Selected Per-Share Data | | | | |
Net asset value, beginning of period | $ 10.38 | $ 8.07 | $ 7.20 | $ 9.88 | $ 10.61 |
Income from Investment Operations | | | | | |
Net investment income (loss) E | .10 | .05 | .03 | .09 | .04 |
Net realized and unrealized gain (loss) | .64 | 2.29 | .93 | (2.67) | (.77) |
Total from investment operations | .74 | 2.34 | .96 | (2.58) | (.73) |
Distributions from net investment income | (.07) | (.03) | (.09) | (.08) | - |
Distributions from net realized gain | - | - | - | (.02) | - |
Total distributions | (.07) | (.03) | (.09) | (.10) | - |
Net asset value, end of period | $ 11.05 | $ 10.38 | $ 8.07 | $ 7.20 | $ 9.88 |
Total Return B, C, D | 7.19% | 29.08% | 13.32% | (26.21)% | (6.88)% |
Ratios to Average Net Assets F, I | | | | |
Expenses before reductions | 1.32% | 1.32% | 1.36% | 1.36% | 1.32% A |
Expenses net of fee waivers, if any | 1.32% | 1.32% | 1.36% | 1.36% | 1.32% A |
Expenses net of all reductions | 1.32% | 1.32% | 1.35% | 1.36% | 1.32% A |
Net investment income (loss) | .98% | .50% | .41% | 1.21% | .89% A |
Supplemental Data | | | | |
Net assets, end of period (000 omitted) | $ 2,293 | $ 1,682 | $ 1,073 | $ 446 | $ 136 |
Portfolio turnover rate G | 57% | 53% | 97% | 138% | 97% |
A Annualized
B Total returns for periods of less than one year are not annualized.
C Total returns would have been lower if certain expenses had not been reduced during the applicable periods shown.
D Total returns do not include the effect of the sales charges.
E Calculated based on average shares outstanding during the period.
F Fees and expenses of any underlying Fidelity Central Funds are not included in the Fund's expense ratio. The Fund indirectly bears its proportionate share of the expenses of any underlying Fidelity Central Funds.
G Amount does not include the portfolio activity of any underlying Fidelity Central Funds.
H For the period February 5, 2008 (commencement of sale of shares) to June 30, 2008.
I Expense ratios reflect operating expenses of the class. Expenses before reductions do not reflect amounts reimbursed by the investment adviser or reductions from brokerage service arrangements or reductions from other expense offset arrangements and do not represent the amount paid by the class during periods when reimbursements or reductions occur. Expense ratios before reductions for start-up periods may not be representative of longer-term operating periods. Expenses net of fee waivers reflect expenses after reimbursement by the investment adviser but prior to reductions from brokerage service arrangements or other expense offset arrangements. Expenses net of all reductions represent the net expenses paid by the class.
See accompanying notes which are an integral part of the financial statements.
Annual Report
Financial Highlights - Class B
Years ended June 30, | 2012 | 2011 | 2010 | 2009 | 2008 I |
Selected Per-Share Data | | | | |
Net asset value, beginning of period | $ 10.30 | $ 8.02 | $ 7.19 | $ 9.87 | $ 10.61 |
Income from Investment Operations | | | | | |
Net investment income (loss) E | .05 | - K | (.01) | .05 | .02 |
Net realized and unrealized gain (loss) | .63 | 2.28 | .92 | (2.66) | (.76) |
Total from investment operations | .68 | 2.28 | .91 | (2.61) | (.74) |
Distributions from net investment income | (.01) | - | (.08) | (.05) | - |
Distributions from net realized gain | - | - | - | (.02) | - |
Total distributions | (.01) | - | (.08) | (.07) | - |
Net asset value, end of period | $ 10.97 | $ 10.30 | $ 8.02 | $ 7.19 | $ 9.87 |
Total Return B, C, D | 6.62% | 28.43% | 12.60% | (26.56)% | (6.97)% |
Ratios to Average Net Assets F, J | | | | |
Expenses before reductions | 1.82% | 1.83% | 1.88% | 1.88% | 1.73% A |
Expenses net of fee waivers, if any | 1.82% | 1.83% | 1.88% | 1.88% | 1.73% A |
Expenses net of all reductions | 1.81% | 1.82% | 1.88% | 1.88% | 1.73% A |
Net investment income (loss) | .49% | .00% H | (.12)% | .68% | .52% A |
Supplemental Data | | | | |
Net assets, end of period (000 omitted) | $ 704 | $ 764 | $ 667 | $ 263 | $ 107 |
Portfolio turnover rate G | 57% | 53% | 97% | 138% | 97% |
A Annualized
B Total returns for periods of less than one year are not annualized.
C Total returns would have been lower if certain expenses had not been reduced during the applicable periods shown.
D Total returns do not include the effect of the contingent deferred sales charge.
E Calculated based on average shares outstanding during the period.
F Fees and expenses of any underlying Fidelity Central Funds are not included in the Fund's expense ratio. The Fund indirectly bears its proportionate share of the expenses of any underlying Fidelity Central Funds.
G Amount does not include the portfolio activity of any underlying Fidelity Central Funds.
H Amount represents less than .01%.
I For the period February 5, 2008 (commencement of sale of shares) to June 30, 2008.
J Expense ratios reflect operating expenses of the class. Expenses before reductions do not reflect amounts reimbursed by the investment adviser or reductions from brokerage service arrangements or reductions from other expense offset arrangements and do not represent the amount paid by the class during periods when reimbursements or reductions occur. Expense ratios before reductions for start-up periods may not be representative of longer-term operating periods. Expenses net of fee waivers reflect expenses after reimbursement by the investment adviser but prior to reductions from brokerage service arrangements or other expense offset arrangements. Expenses net of all reductions represent the net expenses paid by the class.
K Amount represents less than $.01 per share.
See accompanying notes which are an integral part of the financial statements.
Annual Report
Financial Highlights - Class C
Years ended June 30, | 2012 | 2011 | 2010 | 2009 | 2008 H |
Selected Per-Share Data | | | | |
Net asset value, beginning of period | $ 10.28 | $ 8.01 | $ 7.16 | $ 9.87 | $ 10.61 |
Income from Investment Operations | | | | | |
Net investment income (loss) E | .05 | - J | (.01) | .05 | .02 |
Net realized and unrealized gain (loss) | .64 | 2.27 | .92 | (2.66) | (.76) |
Total from investment operations | .69 | 2.27 | .91 | (2.61) | (.74) |
Distributions from net investment income | (.04) | - | (.06) | (.08) | - |
Distributions from net realized gain | - | - | - | (.02) | - |
Total distributions | (.04) | - | (.06) | (.10) | - |
Net asset value, end of period | $ 10.93 | $ 10.28 | $ 8.01 | $ 7.16 | $ 9.87 |
Total Return B, C, D | 6.74% | 28.34% | 12.72% | (26.56)% | (6.97)% |
Ratios to Average Net Assets F, I | | | | |
Expenses before reductions | 1.79% | 1.81% | 1.86% | 1.88% | 1.71% A |
Expenses net of fee waivers, if any | 1.79% | 1.81% | 1.86% | 1.88% | 1.71% A |
Expenses net of all reductions | 1.79% | 1.81% | 1.85% | 1.88% | 1.71% A |
Net investment income (loss) | .51% | .01% | (.10)% | .69% | .55% A |
Supplemental Data | | | | |
Net assets, end of period (000 omitted) | $ 2,845 | $ 1,913 | $ 807 | $ 470 | $ 98 |
Portfolio turnover rate G | 57% | 53% | 97% | 138% | 97% |
A Annualized
B Total returns for periods of less than one year are not annualized.
C Total returns would have been lower if certain expenses had not been reduced during the applicable periods shown.
D Total returns do not include the effect of the contingent deferred sales charge.
E Calculated based on average shares outstanding during the period.
F Fees and expenses of any underlying Fidelity Central Funds are not included in the Fund's expense ratio. The Fund indirectly bears its proportionate share of the expenses of any underlying Fidelity Central Funds.
G Amount does not include the portfolio activity of any underlying Fidelity Central Funds.
H For the period February 5, 2008 (commencement of sale of shares) to June 30, 2008.
I Expense ratios reflect operating expenses of the class. Expenses before reductions do not reflect amounts reimbursed by the investment adviser or reductions from brokerage service arrangements or reductions from other expense offset arrangements and do not represent the amount paid by the class during periods when reimbursements or reductions occur. Expense ratios before reductions for start-up periods may not be representative of longer-term operating periods. Expenses net of fee waivers reflect expenses after reimbursement by the investment adviser but prior to reductions from brokerage service arrangements or other expense offset arrangements. Expenses net of all reductions represent the net expenses paid by the class.
J Amount represents less than $.01 per share.
See accompanying notes which are an integral part of the financial statements.
Annual Report
Financial Highlights - Mega Cap Stock
Years ended June 30, | 2012 | 2011 | 2010 | 2009 | 2008 |
Selected Per-Share Data | | | | |
Net asset value, beginning of period | $ 10.43 | $ 8.11 | $ 7.23 | $ 9.91 | $ 12.06 |
Income from Investment Operations | | | | | |
Net investment income (loss) B | .16 | .10 | .08 | .13 | .14 |
Net realized and unrealized gain (loss) | .64 | 2.29 | .93 | (2.67) | (1.60) |
Total from investment operations | .80 | 2.39 | 1.01 | (2.54) | (1.46) |
Distributions from net investment income | (.12) | (.07) | (.13) | (.12) | (.07) |
Distributions from net realized gain | - | - | - | (.02) | (.62) |
Total distributions | (.12) | (.07) | (.13) | (.14) | (.69) |
Net asset value, end of period | $ 11.11 | $ 10.43 | $ 8.11 | $ 7.23 | $ 9.91 |
Total Return A | 7.83% | 29.61% | 13.93% | (25.77)% | (12.73)% |
Ratios to Average Net Assets C, E | | | | |
Expenses before reductions | .76% | .79% | .81% | .79% | .75% |
Expenses net of fee waivers, if any | .76% | .79% | .80% | .78% | .74% |
Expenses net of all reductions | .75% | .78% | .79% | .78% | .74% |
Net investment income (loss) | 1.55% | 1.04% | .96% | 1.78% | 1.28% |
Supplemental Data | | | | |
Net assets, end of period (000 omitted) | $ 1,287,144 | $ 785,233 | $ 500,407 | $ 253,164 | $ 667,542 |
Portfolio turnover rate D | 57% | 53% | 97% | 138% | 97% |
A Total returns would have been lower if certain expenses had not been reduced during the applicable periods shown.
B Calculated based on average shares outstanding during the period.
C Fees and expenses of any underlying Fidelity Central Funds are not included in the Fund's expense ratio. The Fund indirectly bears its proportionate share of the expenses of any underlying Fidelity Central Funds.
D Amount does not include the portfolio activity of any underlying Fidelity Central Funds.
E Expense ratios reflect operating expenses of the class. Expenses before reductions do not reflect amounts reimbursed by the investment adviser or reductions from brokerage service arrangements or reductions from other expense offset arrangements and do not represent the amount paid by the class during periods when reimbursements or reductions occur. Expenses net of fee waivers reflect expenses after reimbursement by the investment adviser but prior to reductions from brokerage service arrangements or other expense offset arrangements. Expenses net of all reductions represent the net expenses paid by the class.
See accompanying notes which are an integral part of the financial statements.
Annual Report
Financial Highlights - Institutional Class
Years ended June 30, | 2012 | 2011 | 2010 | 2009 | 2008 G |
Selected Per-Share Data | | | | |
Net asset value, beginning of period | $ 10.40 | $ 8.09 | $ 7.22 | $ 9.91 | $ 10.61 |
Income from Investment Operations | | | | | |
Net investment income (loss) D | .16 | .10 | .08 | .13 | .07 |
Net realized and unrealized gain (loss) | .63 | 2.30 | .92 | (2.67) | (.77) |
Total from investment operations | .79 | 2.40 | 1.00 | (2.54) | (.70) |
Distributions from net investment income | (.11) | (.09) | (.13) | (.13) | - |
Distributions from net realized gain | - | - | - | (.02) | - |
Total distributions | (.11) | (.09) | (.13) | (.15) | - |
Net asset value, end of period | $ 11.08 | $ 10.40 | $ 8.09 | $ 7.22 | $ 9.91 |
Total Return B, C | 7.77% | 29.74% | 13.89% | (25.81)% | (6.60)% |
Ratios to Average Net Assets E, H | | | | |
Expenses before reductions | .78% | .79% | .88% | .77% | .70% A |
Expenses net of fee waivers, if any | .78% | .79% | .88% | .77% | .70% A |
Expenses net of all reductions | .77% | .78% | .87% | .77% | .70% A |
Net investment income (loss) | 1.53% | 1.04% | .88% | 1.79% | 1.57% A |
Supplemental Data | | | | |
Net assets, end of period (000 omitted) | $ 175,833 | $ 136,768 | $ 1,568 | $ 515 | $ 93 |
Portfolio turnover rate F | 57% | 53% | 97% | 138% | 97% |
A Annualized
B Total returns for periods of less than one year are not annualized.
C Total returns would have been lower if certain expenses had not been reduced during the applicable periods shown.
D Calculated based on average shares outstanding during the period.
E Fees and expenses of any underlying Fidelity Central Funds are not included in the Fund's expense ratio. The Fund indirectly bears its proportionate share of the expenses of any underlying Fidelity Central Funds.
F Amount does not include the portfolio activity of any underlying Fidelity Central Funds.
G For the period February 5, 2008 (commencement of sale of shares) to June 30, 2008.
H Expense ratios reflect operating expenses of the class. Expenses before reductions do not reflect amounts reimbursed by the investment adviser or reductions from brokerage service arrangements or reductions from other expense offset arrangements and do not represent the amount paid by the class during periods when reimbursements or reductions occur. Expense ratios before reductions for start-up periods may not be representative of longer-term operating periods. Expenses net of fee waivers reflect expenses after reimbursement by the investment adviser but prior to reductions from brokerage service arrangements or other expense offset arrangements. Expenses net of all reductions represent the net expenses paid by the class.
See accompanying notes which are an integral part of the financial statements.
Annual Report
Notes to Financial Statements
For the period ended June 30, 2012
1. Organization.
Fidelity® Mega Cap Stock Fund (the Fund) is a fund of Fidelity Hastings Street Trust (the Trust) and is authorized to issue an unlimited number of shares. The Trust is registered under the Investment Company Act of 1940, as amended (the 1940 Act), as an open-end management investment company organized as a Massachusetts business trust. The Fund offers Class A, Class T, Class C, Mega Cap Stock and Institutional Class shares, each of which, along with Class B shares, has equal rights as to assets and voting privileges. Effective after the close of business on September 1, 2010, Class B shares were closed to new accounts and additional purchases, except for exchanges and reinvestments. Each class has exclusive voting rights with respect to matters that affect that class. Class B shares will automatically convert to Class A shares after a holding period of seven years from the initial date of purchase. Investment income, realized and unrealized capital gains and losses, the common expenses of the Fund, and certain fund-level expense reductions, if any, are allocated on a pro-rata basis to each class based on the relative net assets of each class to the total net assets of the Fund. Each class differs with respect to transfer agent and distribution and service plan fees incurred. Certain expense reductions may also differ by class.
2. Investments in Fidelity Central Funds.
The Fund invests in Fidelity Central Funds, which are open-end investment companies available only to other investment companies and accounts managed by Fidelity Management & Research Company (FMR) and its affiliates. The Fund's Schedule of Investments lists each of the Fidelity Central Funds held as of period end, if any, as an investment of the Fund, but does not include the underlying holdings of each Fidelity Central Fund. As an Investing Fund, the Fund indirectly bears its proportionate share of the expenses of the underlying Fidelity Central Funds.
The Money Market Central Funds seek preservation of capital and current income and are managed by Fidelity Investments Money Management, Inc. (FIMM), an affiliate of FMR.
A complete unaudited list of holdings for each Fidelity Central Fund is available upon request or at the Securities and Exchange Commission (the SEC) web site at www.sec.gov. In addition, the financial statements of the Fidelity Central Funds, which are not covered by the Fund's Report of Independent Registered Public Accounting Firm, are available on the SEC web site or upon request.
3. Significant Accounting Policies.
The financial statements have been prepared in conformity with accounting principles generally accepted in the United States of America (GAAP), which require management to make certain estimates and assumptions at the date of the financial statements.
Annual Report
Notes to Financial Statements - continued
3. Significant Accounting Policies - continued
Actual results could differ from those estimates. Subsequent events, if any, through the date that the financial statements were issued have been evaluated in the preparation of the financial statements. The following summarizes the significant accounting policies of the Fund:
Security Valuation. Investments are valued as of 4:00 p.m. Eastern time on the last calendar day of the period. In accordance with valuation policies and procedures approved by the Board of Trustees (the Board), the Fund attempts to obtain prices from one or more third party pricing vendor or broker to value its investments. When current market prices, quotations or rates are not readily available or reliable, securities will be fair valued in good faith by the FMR Fair Value Committee (the Committee), in accordance with procedures adopted by the Fund's Board. Factors used in determining fair value vary by security type and may include market or security specific events. The frequency with which these procedures are used cannot be predicted and they may be utilized to a significant extent. The Committee oversees the Fund's valuation policies and procedures and is responsible for approving and reporting to the Board all fair value determinations.
The Fund categorizes the inputs to valuation techniques used to value its investments into a disclosure hierarchy consisting of three levels as shown below:
Level 1 - quoted prices in active markets for identical investments
Level 2 - other significant observable inputs (including quoted prices for similar investments, interest rates, prepayment speeds, etc.)
Level 3 - unobservable inputs (including the Fund's own assumptions based on the best information available)
Valuation techniques used to value the Fund's investments by major category are as follows:
Equity securities, including restricted securities, for which market quotations are readily available, are valued at the last reported sale price or official closing price as reported by a third party pricing vendor on the primary market or exchange on which they are traded and are categorized as Level 1 in the hierarchy. In the event there were no sales during the day or closing prices are not available, securities are valued at the last quoted bid price or may be valued using the last available price and are generally categorized as Level 2 in the hierarchy. For foreign equity securities, when significant market or security specific events arise, comparisons to the valuation of American Depositary Receipts (ADRs), futures contracts, Exchange-Traded Funds (ETFs) and certain indexes as well as quoted prices for similar securities are used and are categorized as Level 2 in the hierarchy. Utilizing these techniques may result in transfers between Level 1 and Level 2.
Annual Report
3. Significant Accounting Policies - continued
Security Valuation - continued
For restricted equity securities and private placements where observable inputs are limited, assumptions about market activity and risk are used and these securities are categorized as Level 3 in the hierarchy.
Investments in open-end mutual funds, including the Fidelity Central Funds, are valued at their closing net asset value each business day and are categorized as Level 1 in the hierarchy.
Changes in valuation techniques may result in transfers in or out of an assigned level within the disclosure hierarchy. The aggregate value of investments by input level, as of June 30, 2012, is included at the end of the Fund's Schedule of Investments.
Foreign Currency Translation. The Fund may use foreign currency contracts to facilitate transactions in foreign-denominated securities. Gains and losses from these transactions may arise from changes in the value of the foreign currency or if the counterparties do not perform under the contracts' terms.
Foreign-denominated assets, including investment securities, and liabilities are translated into U.S. dollars at the exchange rates at period end. Purchases and sales of investment securities, income and dividends received and expenses denominated in foreign currencies are translated into U.S. dollars at the exchange rate in effect on the transaction date.
The effects of exchange rate fluctuations on investments are included with the net realized and unrealized gain (loss) on investment securities. Other foreign currency transactions resulting in realized and unrealized gain (loss) are disclosed separately.
Investment Transactions and Income. For financial reporting purposes, the Fund's investment holdings and NAV include trades executed through the end of the last business day of the period. The NAV per share for processing shareholder transactions is calculated as of the close of business of the New York Stock Exchange (NYSE), normally 4:00 p.m. Eastern time and includes trades executed through the end of the prior business day. Gains and losses on securities sold are determined on the basis of identified cost and may include proceeds received from litigation. Dividend income is recorded on the ex-dividend date, except for certain dividends from foreign securities where the ex-dividend date may have passed, which are recorded as soon as the Fund is informed of the ex-dividend date. Non-cash dividends included in dividend income, if any, are recorded at the fair market value of the securities received. Distributions received on securities that represent a return of capital or capital gain are recorded as a reduction of cost of investments and/or as a realized gain. The Fund estimates the components of distributions received that may be considered return of capital distributions or capital
Annual Report
Notes to Financial Statements - continued
3. Significant Accounting Policies - continued
Investment Transactions and Income - continued
gain distributions. Interest income and distributions from the Fidelity Central Funds are accrued as earned. Interest income includes coupon interest and amortization of premium and accretion of discount on debt securities. Investment income is recorded net of foreign taxes withheld where recovery of such taxes is uncertain.
Expenses. Expenses directly attributable to a fund are charged to that fund. Expenses attributable to more than one fund are allocated among the respective funds on the basis of relative net assets or other appropriate methods. Expense estimates are accrued in the period to which they relate and adjustments are made when actual amounts are known.
Income Tax Information and Distributions to Shareholders. Each year, the Fund intends to qualify as a regulated investment company under Subchapter M of the Internal Revenue Code, including distributing substantially all of its taxable income and realized gains. As a result, no provision for income taxes is required. As of June 30, 2012, the Fund did not have any unrecognized tax benefits in the financial statements; nor is the Fund aware of any tax positions for which it is reasonably possible that the total amounts of unrecognized tax benefits will significantly change in the next twelve months. The Fund files a U.S. federal tax return, in addition to state and local tax returns as required. A fund's federal income tax returns are subject to examination by the Internal Revenue Service (IRS) for a period of three fiscal years after they are filed. State and local tax returns may be subject to examination for an additional fiscal year depending on the jurisdiction. Foreign taxes are provided for based on the Fund's understanding of the tax rules and rates that exist in the foreign markets in which it invests.
Distributions are declared and recorded on the ex-dividend date. Income dividends and capital gain distributions are declared separately for each class. Income and capital gain distributions are determined in accordance with income tax regulations, which may differ from GAAP.
Capital accounts within the financial statements are adjusted for permanent book-tax differences. These adjustments have no impact on net assets or the results of operations. Temporary book-tax differences will reverse in a subsequent period.
Book-tax differences are primarily due to foreign currency transactions, market discount, futures transactions, equity-debt classifications, capital loss carryforwards, and losses deferred due to wash sales.
Annual Report
3. Significant Accounting Policies - continued
Income Tax Information and Distributions to Shareholders - continued
The federal tax cost of investment securities and unrealized appreciation (depreciation) as of period end were as follows:
Gross unrealized appreciation | $ 145,345,483 |
Gross unrealized depreciation | (72,327,832) |
Net unrealized appreciation (depreciation) on securities and other investments | $ 73,017,651 |
| |
Tax Cost | $ 1,404,371,028 |
The tax-based components of distributable earnings as of period end were as follows:
Undistributed ordinary income | $ 10,989,705 |
Capital loss carryforward | $ (112,444,708) |
Net unrealized appreciation (depreciation) | $ 73,013,700 |
Capital loss carryforwards are only available to offset future capital gains of the Fund to the extent provided by regulations and may be limited. Under the Regulated Investment Company Modernization Act of 2010 (the Act), the Fund is permitted to carry forward capital losses incurred in taxable years beginning after December 22, 2010 for an unlimited period and such capital losses are required to be used prior to any losses that expire. Capital loss carryforwards were as follows:
Fiscal year of expiration | |
2017 | $ (3,091,486) |
2018 | (109,353,222) |
Total capital loss carry forward | $ (112,444,708) |
The tax character of distributions paid was as follows:
| June 30, 2012 | June 30, 2011 |
Ordinary Income | $ 11,753,098 | $ 4,840,262 |
New Accounting Pronouncement. In December 2011, the Financial Accounting Standards Board issued Accounting Standard Update No. 2011-11, Disclosures about Offsetting Assets and Liabilities. The update creates new disclosure requirements requiring entities to disclose both gross and net information for derivatives and other financial instruments that are either offset in the Statement of Assets and Liabilities or
Annual Report
Notes to Financial Statements - continued
3. Significant Accounting Policies - continued
New Accounting Pronouncement - continued
subject to an enforceable master netting arrangement or similar agreement. The disclosure requirements are effective for interim and annual reporting periods beginning on or after January 1, 2013. Management is currently evaluating the impact of the update's adoption on the Fund's financial statement disclosures.
4. Derivative Instruments.
Risk Exposures and the Use of Derivative Instruments. The Fund's investment objectives allow the Fund to enter into various types of derivative contracts, including futures contracts. Derivatives are investments whose value is derived from underlying assets, indices or reference rates and may be transacted on an exchange or over-the-counter (OTC). Derivatives may involve a future commitment to buy or sell a specified instrument based on specified terms, or to exchange future cash flows at periodic intervals based on a notional principal amount. The Fund used derivatives to increase returns and to manage exposure to certain risks as defined below. The success of any strategy involving derivatives depends on analysis of numerous economic factors, and if the strategies for investment do not work as intended, the Fund may not achieve its objectives.
The Fund's use of derivatives increased or decreased its exposure to the following risk:
Equity Risk | Equity risk relates to the fluctuations in the value of financial instruments as a result of changes in market prices (other than those arising from interest rate risk or foreign exchange risk), whether caused by factors specific to an individual investment, its issuer, or all factors affecting all instruments traded in a market or market segment. |
The Fund is also exposed to additional risks from investing in derivatives, such as liquidity risk and counterparty credit risk. Liquidity risk is the risk that the Fund will be unable to close out the derivative in the open market in a timely manner. Counterparty credit risk is the risk that the counterparty will not be able to fulfill its obligation to the Fund. Counterparty credit risk related to exchange-traded futures contracts is minimal because of the protection provided by the exchange on which they trade. Investing in derivatives may involve greater risks than investing in the underlying assets directly and, to varying degrees, involves risk of loss in excess of the initial investment, if any, collateral received and amounts recognized in the Statement of Assets and Liabilities. In addition, for futures contracts, there is the risk that the change in value of the derivative contract may not correspond to the change in value of the underlying instrument.
Annual Report
4. Derivative Instruments - continued
Futures Contracts. A futures contract is an agreement between two parties to buy or sell a specified underlying instrument for a fixed price at a specified future date. The Fund used futures contracts to manage its exposure to the stock market.
Upon entering into a futures contract, a fund is required to deposit either cash or securities (initial margin) with a clearing broker in an amount equal to a certain percentage of the face value of the contract. Futures contracts are marked-to-market daily and subsequent payments are made or received by a fund depending on the daily fluctuations in the value of the futures contracts and are recorded as unrealized appreciation or (depreciation). This receivable and/or payable is included in daily variation margin on futures contracts in the Statement of Assets and Liabilities. Realized gain or (loss) is recorded upon the expiration or closing of a futures contract.
Any open futures contracts at period end are shown in the Schedule of Investments under the caption "Futures Contracts." The underlying face amount at value reflects each contract's exposure to the underlying instrument at period end.
During the period the Fund recognized net realized gain (loss) of $142,240 related to its investment in futures contracts. This amount is included in the Statement of Operations.
5. Purchases and Sales of Investments.
Purchases and sales of securities, other than short-term securities, aggregated $1,133,217,548 and $662,913,700, respectively.
6. Fees and Other Transactions with Affiliates.
Management Fee. FMR and its affiliates provide the Fund with investment management related services for which the Fund pays a monthly management fee. The management fee is the sum of an individual fund fee rate that is based on an annual rate of .20% of the Fund's average net assets and an annualized group fee rate that averaged .26% during the period. The group fee rate is based upon the average net assets of all the mutual funds advised by FMR. The group fee rate decreases as assets under management increase and increases as assets under management decrease. For the period, the total annual management fee rate was .46% of the Fund's average net assets.
Distribution and Service Plan Fees. In accordance with Rule 12b-1 of the 1940 Act, the Fund has adopted separate Distribution and Service Plans for each class of shares. Certain classes pay Fidelity Distributors Corporation (FDC), an affiliate of FMR, separate Distribution and Service Fees, each of which is based on an annual percentage of each class' average net assets. In addition, FDC may pay financial intermediaries for selling shares of the Fund and providing shareholder support services. For the period,
Annual Report
Notes to Financial Statements - continued
6. Fees and Other Transactions with Affiliates - continued
Distribution and Service Plan Fees - continued
the Distribution and Service Fee rates, total fees and amounts retained by FDC were as follows:
| Distribution
Fee | Service
Fee | Total Fees | Retained
by FDC |
Class A | -% | .25% | $ 13,476 | $ 686 |
Class T | .25% | .25% | 9,514 | 2 |
Class B | .75% | .25% | 6,768 | 5,080 |
Class C | .75% | .25% | 27,357 | 7,297 |
| | | $ 57,115 | $ 13,065 |
Sales Load. FDC may receive a front-end sales charge of up to 5.75% for selling Class A shares and 3.50% for selling Class T shares, some of which is paid to financial intermediaries for selling shares of the Fund. Depending on the holding period, FDC may receive contingent deferred sales charges levied on Class A, Class T, Class B, and Class C redemptions. The deferred sales charges range from 5.00% to 1.00% for Class B shares, 1.00% for Class C shares, 1.00% for certain purchases of Class A shares and .25% for certain purchases of Class T shares.
For the period, sales charge amounts retained by FDC were as follows:
| Retained
by FDC |
Class A | $ 8,921 |
Class T | 1,792 |
Class B* | 918 |
Class C* | 377 |
| $ 12,008 |
* When Class B and Class C shares are initially sold, FDC pays commissions from its own resources to financial intermediaries through which the sales are made.
Transfer Agent Fees. Fidelity Investments Institutional Operations Company, Inc. (FIIOC), an affiliate of FMR, is the transfer, dividend disbursing and shareholder servicing agent for each class of the Fund. FIIOC receives account fees and asset-based fees that vary according to the account size and type of account of the shareholders of the respective classes of the Fund. FIIOC pays for typesetting, printing and mailing of
Annual Report
6. Fees and Other Transactions with Affiliates - continued
Transfer Agent Fees - continued
shareholder reports, except proxy statements. For the period, transfer agent fees for each class were as follows:
| Amount | % of
Average
Net Assets |
Class A | $ 14,015 | .26 |
Class T | 5,823 | .31 |
Class B | 2,029 | .30 |
Class C | 7,486 | .27 |
Mega Cap Stock | 2,433,166 | .24 |
Institutional Class | 379,293 | .26 |
| $ 2,841,812 | |
Accounting and Security Lending Fees. Fidelity Service Company, Inc. (FSC), an affiliate of FMR, maintains the Fund's accounting records. The accounting fee is based on the level of average net assets for each month. Under a separate contract, FSC administers the security lending program. The security lending fee is based on the number and duration of lending transactions.
Brokerage Commissions. The Fund placed a portion of its portfolio transactions with brokerage firms which are affiliates of the investment adviser. The commissions paid to these affiliated firms were $29,554 for the period.
Interfund Lending Program. Pursuant to an Exemptive Order issued by the SEC, the Fund, along with other registered investment companies having management contracts with FMR, may participate in an interfund lending program. This program provides an alternative credit facility allowing the funds to borrow from, or lend money to, other participating affiliated funds. At period end, there were no interfund loans outstanding. The Fund's activity in this program during the period for which loans were outstanding was as follows:
Borrower or Lender | Average Loan
Balance | Weighted Average
Interest Rate | Interest
Expense |
Borrower | $ 38,846,643 | .41% | $ 6,238 |
7. Committed Line of Credit.
The Fund participates with other funds managed by FMR or an affiliate in a $4.25 billion credit facility (the "line of credit") to be utilized for temporary or emergency purposes to fund shareholder redemptions or for other short-term liquidity purposes. The Fund has
Annual Report
Notes to Financial Statements - continued
7. Committed Line of Credit - continued
agreed to pay commitment fees on its pro-rata portion of the line of credit, which amounted to $2,931 and is reflected in Miscellaneous expenses on the Statement of Operations. During the period, there were no borrowings on this line of credit.
8. Security Lending.
The Fund lends portfolio securities through a lending agent from time to time in order to earn additional income. For equity securities, a lending agent is used and may loan securities to certain qualified borrowers, including Fidelity Capital Markets (FCM), a broker-dealer affiliated with the Fund. On the settlement date of the loan, the Fund receives collateral (in the form of U.S. Treasury obligations, letters of credit and/or cash) against the loaned securities and maintains collateral in an amount not less than 100% of the market value of the loaned securities during the period of the loan. The market value of the loaned securities is determined at the close of business of the Fund and any additional required collateral is delivered to the Fund on the next business day. If the borrower defaults on its obligation to return the securities loaned because of insolvency or other reasons, a fund could experience delays and costs in recovering the securities loaned or in gaining access to the collateral. Any cash collateral received is invested in the Fidelity Securities Lending Cash Central Fund. At period end, there were no security loans outstanding. Security lending income represents the income earned on investing cash collateral, less rebates paid to borrowers and any lending agent fees associated with the loan, plus any premium payments received for lending certain types of securities. Security lending income is presented in the Statement of Operations as a component of income from Fidelity Central Funds. Total security lending income during the period amounted to $147,642. During the period, there were no securities loaned to FCM.
9. Bank Borrowings.
The Fund is permitted to have bank borrowings for temporary or emergency purposes to fund shareholder redemptions or for other short-term liquidity requirements. The Fund has established borrowing arrangements with certain banks. The interest rate on the borrowings is the bank's base rate, as revised from time to time. The average loan balance during the period for which loans were outstanding amounted to $3,312,000. The weighted average interest rate was .58%. The interest expense amounted to $53 under the bank borrowing program. At period end, there were no bank borrowings outstanding.
10. Expense Reductions.
Many of the brokers with whom FMR places trades on behalf of the Fund provided services to the Fund in addition to trade execution. These services included payments of certain expenses on behalf of the Fund totaling $26,452 for the period.
Annual Report
11. Distributions to Shareholders.
Distributions to shareholders of each class were as follows:
Years ended June 30, | 2012 | 2011 |
From net investment income | | |
Class A | $ 41,978 | $ 15,699 |
Class T | 11,957 | 4,295 |
Class B | 701 | - |
Class C | 10,116 | - |
Mega Cap Stock | 10,229,962 | 4,094,618 |
Institutional Class | 1,458,384 | 725,650 |
Total | $ 11,753,098 | $ 4,840,262 |
12. Share Transactions.
Transactions for each class of shares were as follows:
| Shares | Dollars |
Years ended June 30, | 2012 | 2011 | 2012 | 2011 |
Class A | | | | |
Shares sold | 486,313 | 220,973 | $ 5,118,655 | $ 2,204,584 |
Reinvestment of distributions | 3,634 | 1,526 | 35,610 | 14,210 |
Shares redeemed | (120,131) | (97,950) | (1,250,294) | (951,110) |
Net increase (decrease) | 369,816 | 124,549 | $ 3,903,971 | $ 1,267,684 |
Class T | | | | |
Shares sold | 105,560 | 70,794 | $ 1,103,327 | $ 699,083 |
Reinvestment of distributions | 1,213 | 459 | 11,925 | 4,248 |
Shares redeemed | (61,297) | (42,060) | (633,953) | (396,340) |
Net increase (decrease) | 45,476 | 29,193 | $ 481,299 | $ 306,991 |
Class B | | | | |
Shares sold | 9,865 | 19,392 | $ 101,146 | $ 183,567 |
Reinvestment of distributions | 69 | - | 689 | - |
Shares redeemed | (20,058) | (28,265) | (199,056) | (272,700) |
Net increase (decrease) | (10,124) | (8,873) | $ (97,221) | $ (89,133) |
Class C | | | | |
Shares sold | 229,191 | 96,864 | $ 2,376,452 | $ 975,147 |
Reinvestment of distributions | 856 | - | 8,451 | - |
Shares redeemed | (155,763) | (11,544) | (1,568,860) | (114,846) |
Net increase (decrease) | 74,284 | 85,320 | $ 816,043 | $ 860,301 |
Annual Report
Notes to Financial Statements - continued
12. Share Transactions - continued
| Shares | Dollars |
Years ended June 30, | 2012 | 2011 | 2012 | 2011 |
Mega Cap Stock | | | | |
Shares sold | 74,953,852 | 34,124,104 | $ 795,313,856 | $ 350,713,479 |
Reinvestment of distributions | 965,264 | 418,751 | 9,476,451 | 3,910,800 |
Shares redeemed | (35,350,283) | (20,989,740) | (369,162,567) | (199,951,600) |
Net increase (decrease) | 40,568,833 | 13,553,115 | $ 435,627,740 | $ 154,672,679 |
Institutional Class | | | | |
Shares sold | 7,943,118 | 16,010,762 | $ 80,524,837 | $ 148,274,212 |
Reinvestment of distributions | 144,898 | 75,239 | 1,415,456 | 703,651 |
Shares redeemed | (5,373,433) | (3,126,457) | (54,303,944) | (32,666,752) |
Net increase (decrease) | 2,714,583 | 12,959,544 | $ 27,636,349 | $ 116,311,111 |
13. Other.
The Fund's organizational documents provide former and current trustees and officers with a limited indemnification against liabilities arising in connection with the performance of their duties to the Fund. In the normal course of business, the Fund may also enter into contracts that provide general indemnifications. The Fund's maximum exposure under these arrangements is unknown as this would be dependent on future claims that may be made against the Fund. The risk of material loss from such claims is considered remote.
Annual Report
To the Trustees of Fidelity Hastings Street Trust and the Shareholders of Fidelity Mega Cap Stock Fund:
In our opinion, the accompanying statement of assets and liabilities, including the schedule of investments, and the related statements of operations and of changes in net assets and the financial highlights present fairly, in all material respects, the financial position of Fidelity Mega Cap Stock Fund (a fund of Fidelity Hastings Street Trust) at June 30, 2012, the results of its operations for the year then ended, the changes in its net assets for each of the two years in the period then ended and the financial highlights for each of the periods indicated, in conformity with accounting principles generally accepted in the United States of America. These financial statements and financial highlights (hereafter referred to as "financial statements") are the responsibility of the Fidelity Mega Cap Stock Fund's management. Our responsibility is to express an opinion on these financial statements based on our audits. We conducted our audits of these financial statements in accordance with the standards of the Public Company Accounting Oversight Board (United States). Those standards require that we plan and perform the audit to obtain reasonable assurance about whether the financial statements are free of material misstatement. An audit includes examining, on a test basis, evidence supporting the amounts and disclosures in the financial statements, assessing the accounting principles used and significant estimates made by management, and evaluating the overall financial statement presentation. We believe that our audits, which included confirmation of securities at June 30, 2012 by correspondence with the custodian and brokers, provide a reasonable basis for our opinion.
/s/ PricewaterhouseCoopers LLP
PricewaterhouseCoopers LLP
Boston, Massachusetts
August 10, 2012
Annual Report
The Trustees, Members of the Advisory Board, and executive officers of the trust and fund, as applicable, are listed below. The Board of Trustees governs the fund and is responsible for protecting the interests of shareholders. The Trustees are experienced executives who meet periodically throughout the year to oversee the fund's activities, review contractual arrangements with companies that provide services to the fund, oversee management of the risks associated with such activities and contractual arrangements, and review the fund's performance. Except for James C. Curvey, each of the Trustees oversees 228 funds advised by FMR or an affiliate. Mr. Curvey oversees 435 funds advised by FMR or an affiliate.
The Trustees hold office without limit in time except that (a) any Trustee may resign; (b) any Trustee may be removed by written instrument, signed by at least two-thirds of the number of Trustees prior to such removal; (c) any Trustee who requests to be retired or who has become incapacitated by illness or injury may be retired by written instrument signed by a majority of the other Trustees; and (d) any Trustee may be removed at any special meeting of shareholders by a two-thirds vote of the outstanding voting securities of the trust. Each Trustee who is not an interested person (as defined in the 1940 Act) (Independent Trustee), shall retire not later than the last day of the calendar year in which his or her 75th birthday occurs. The Independent Trustees may waive this mandatory retirement age policy with respect to individual Trustees. The executive officers and Advisory Board Members hold office without limit in time, except that any officer and Advisory Board Member may resign or may be removed by a vote of a majority of the Trustees at any regular meeting or any special meeting of the Trustees. Except as indicated, each individual has held the office shown or other offices in the same company for the past five years.
Experience, Skills, Attributes, and Qualifications of the Fund's Trustees. The Governance and Nominating Committee has adopted a statement of policy that describes the experience, qualifications, attributes, and skills that are necessary and desirable for potential Independent Trustee candidates (Statement of Policy). The Board believes that each Trustee satisfied at the time he or she was initially elected or appointed a Trustee, and continues to satisfy, the standards contemplated by the Statement of Policy. The Governance and Nominating Committee also engages professional search firms to help identify potential Independent Trustee candidates who have the experience, qualifications, attributes, and skills consistent with the Statement of Policy. From time to time, additional criteria based on the composition and skills of the current Independent Trustees, as well as experience or skills that may be appropriate in light of future changes to board composition, business conditions, and regulatory or other developments, have also been considered by the professional search firms and the Governance and Nominating Committee. In addition, the Board takes into account the Trustees' commitment and participation in Board and committee meetings, as well as their leadership of standing and ad hoc committees throughout their tenure.
In determining that a particular Trustee was and continues to be qualified to serve as a Trustee, the Board has considered a variety of criteria, none of which, in isolation, was controlling. The Board believes that, collectively, the Trustees have balanced and diverse experience, qualifications, attributes, and skills, which allow the Board to operate effectively in governing the fund and protecting the interests of shareholders. Information about the specific experience, skills, attributes, and qualifications of each Trustee, which in each case led to the Board's conclusion that the Trustee should serve (or continue to serve) as a trustee of the fund, is provided below.
Annual Report
Board Structure and Oversight Function. James C. Curvey is an interested person (as defined in the 1940 Act) and currently serves as Chairman. The Trustees have determined that an interested Chairman is appropriate and benefits shareholders because an interested Chairman has a personal and professional stake in the quality and continuity of services provided to the fund. Independent Trustees exercise their informed business judgment to appoint an individual of their choosing to serve as Chairman, regardless of whether the Trustee happens to be independent or a member of management. The Independent Trustees have determined that they can act independently and effectively without having an Independent Trustee serve as Chairman and that a key structural component for assuring that they are in a position to do so is for the Independent Trustees to constitute a substantial majority for the Board. The Independent Trustees also regularly meet in executive session. Ned C. Lautenbach serves as Chairman of the Independent Trustees and as such (i) acts as a liaison between the Independent Trustees and management with respect to matters important to the Independent Trustees and (ii) with management prepares agendas for Board meetings.
Fidelity funds are overseen by different Boards of Trustees. The fund's Board oversees Fidelity's equity and high income funds and another Board oversees Fidelity's investment-grade bond, money market, and asset allocation funds. The asset allocation funds may invest in Fidelity funds overseen by the fund's Board. The use of separate Boards, each with its own committee structure, allows the Trustees of each group of Fidelity funds to focus on the unique issues of the funds they oversee, including common research, investment, and operational issues. On occasion, the separate Boards establish joint committees to address issues of overlapping consequences for the Fidelity funds overseen by each Board.
The Trustees operate using a system of committees to facilitate the timely and efficient consideration of all matters of importance to the Trustees, the fund, and fund shareholders and to facilitate compliance with legal and regulatory requirements and oversight of the fund's activities and associated risks. The Board, acting through its committees, has charged FMR and its affiliates with (i) identifying events or circumstances the occurrence of which could have demonstrably adverse effects on the fund's business and/or reputation; (ii) implementing processes and controls to lessen the possibility that such events or circumstances occur or to mitigate the effects of such events or circumstances if they do occur; and (iii) creating and maintaining a system designed to evaluate continuously business and market conditions in order to facilitate the identification and implementation processes described in (i) and (ii) above. Because the day-to-day operations and activities of the fund are carried out by or through FMR, its affiliates and other service providers, the fund's exposure to risks is mitigated but not eliminated by the processes overseen by the Trustees. While each of the Board's committees has responsibility for overseeing different aspects of the fund's activities, oversight is exercised primarily through the Operations, Audit, and Compliance Committees. In addition, the Independent Trustees have worked with FMR to enhance the Board's oversight of investment and financial risks, legal and regulatory risks, technology risks, and operational risks, including the development of additional risk reporting to the Board. For example, a working group comprised of Independent Trustees and FMR has worked and continues to work to review the Fidelity funds' valuation-related activities, reporting and risk management. Appropriate personnel, including but not limited to the fund's Chief Compliance Officer (CCO), FMR's internal auditor, the independent accountants, the fund's Treasurer and portfolio management personnel, make periodic reports to the Board's committees, as appropriate, including an annual review of FMR's risk management program for the Fidelity funds. The responsibilities of each standing committee, including their oversight responsibilities, are described further under "Standing Committees of the Fund's Trustees."
Annual Report
Trustees and Officers - continued
The fund's Statement of Additional Information (SAI) includes more information about the Trustees. To request a free copy, call Fidelity at 1-800-544-8544.
Interested Trustees*:
Correspondence intended for each Trustee who is an interested person may be sent to Fidelity Investments, 82 Devonshire Street, Boston, Massachusetts 02109.
Name, Age; Principal Occupations and Other Relevant Experience+ |
James C. Curvey (77) |
| Year of Election or Appointment: 2007 Mr. Curvey is Trustee and Chairman of the Board of Trustees of certain Trusts. Mr. Curvey also serves as Trustee (2007-present) of other investment companies advised by FMR. Mr. Curvey is a Director of Fidelity Investments Money Management, Inc. (2009-present), Director of Fidelity Research & Analysis Co. (2009-present) and Director of FMR and FMR Co., Inc. (2007-present). Mr. Curvey is also Vice Chairman (2007-present) and Director of FMR LLC. In addition, Mr. Curvey serves as an Overseer for the Boston Symphony Orchestra and a member of the Trustees of Villanova University. Previously, Mr. Curvey was the Vice Chairman (2006-2007) and Director (2000-2007) of FMR Corp. |
Ronald P. O'Hanley (55) |
| Year of Election or Appointment: 2011 Mr. O'Hanley is Director of FMR Co., Inc. (2010-present), Director of Fidelity Investments Money Management, Inc. (2010-present), Director of Fidelity Research & Analysis Company (2010-present), President of Fidelity Asset Management and Corporate Services and a member of Fidelity's Executive Committee (2010-present). Previously, Mr. O'Hanley served as President and Chief Executive Officer of BNY Mellon Asset Management (2007-2010). Mr. O'Hanley also served as Vice Chairman of Bank New York Mellon Corp. and a member of that firm's Executive Committee. Prior to the 2007 merger of The Bank of New York and Mellon Financial Corporation, he was Vice Chairman of Mellon Financial Corporation and President and Chief Executive Officer of Mellon Asset Management. He joined Mellon in February 1997. Mr. O'Hanley currently serves as Chairman of the Boston Public Library Foundation Board of Directors and sits on the Board of Directors of Beth Israel Deaconess Medical Center, the Board of Trustees of the Marine Biological Laboratory and the Advisory Board of the Maxwell School of Citizenship and Public Administration at Syracuse University. Mr. O'Hanley also chairs the Council on Asset Management for the Financial Services Roundtable and is a member of the Board of Directors of Institutional Investor's U.S. Institute. |
* Trustees have been determined to be "Interested Trustees" by virtue of, among other things, their affiliation with the trust or various entities under common control with FMR.
+ The information above includes each Trustee's principal occupation during the last five years and other information relating to the experience, attributes, and skills relevant to each Trustee's qualifications to serve as a Trustee, which led to the conclusion that each Trustee should serve as a Trustee for the fund.
Annual Report
Trustees and Officers - continued
Independent Trustees:
Correspondence intended for each Independent Trustee (that is, the Trustees other than the Interested Trustees) may be sent to Fidelity Investments, P.O. Box 55235, Boston, Massachusetts 02205-5235.
Name, Age; Principal Occupations and Other Relevant Experience+ |
Dennis J. Dirks (64) |
| Year of Election or Appointment: 2005 Prior to his retirement in May 2003, Mr. Dirks was Chief Operating Officer and a member of the Board of The Depository Trust & Clearing Corporation (DTCC). He also served as President, Chief Operating Officer, and Board member of The Depository Trust Company (DTC) and President and Board member of the National Securities Clearing Corporation (NSCC). In addition, Mr. Dirks served as Chief Executive Officer and Board member of the Government Securities Clearing Corporation, Chief Executive Officer and Board member of the Mortgage-Backed Securities Clearing Corporation, as a Trustee and a member of the Finance Committee of Manhattan College (2005-2008), and as a Trustee and a member of the Finance Committee of AHRC of Nassau County (2006-2008). Mr. Dirks is a member of the Independent Directors Council (IDC) Governing Council (2010-present) and Board of Directors for The Brookville Center for Children's Services, Inc. (2009-present). |
Alan J. Lacy (58) |
| Year of Election or Appointment: 2008 Mr. Lacy serves as Senior Adviser (2007-present) of Oak Hill Capital Partners, L.P. (private equity). Mr. Lacy also served as Chief Executive Officer (2000-2005) and Vice Chairman (2005-2006) of Sears Holdings Corporation and Sears, Roebuck and Co. (retail). In addition, Mr. Lacy serves as a member of the Board of Directors of Dave & Buster's, Inc. (restaurant and entertainment complexes, 2010-present), The Hillman Companies, Inc. (hardware wholesalers, 2010-present), and Bristol-Myers Squibb Company (global pharmaceuticals, 2007-present). Mr. Lacy is a member of the Board of Trustees of The National Parks Conservation Association (2006-present). Previously, Mr. Lacy served as Chairman of the Board of Trustees of the National Parks Conservation Association (2008-2011) and as a member of the Board of Directors for the Western Union Company (global money transfer, 2006-2011). |
Ned C. Lautenbach (68) |
| Year of Election or Appointment: 2000 Mr. Lautenbach is Chairman of the Independent Trustees of the Equity and High Income Funds (2006-present). Mr. Lautenbach currently serves as the Lead Director of the Eaton Corporation Board of Directors (diversified industrial, 1997-present). Mr. Lautenbach is also a member of the Board of Directors of the Philharmonic Center for the Arts in Naples, Florida (1999-present); a member of the Board of Trustees of Fairfield University (2005-present); and a member of the Council on Foreign Relations (1994-present). Previously, Mr. Lautenbach was a Partner/Advisory Partner at Clayton, Dubilier & Rice, LLC (private equity investment, 1998-2010), as well as a Director of Sony Corporation (2006-2007). |
Joseph Mauriello (67) |
| Year of Election or Appointment: 2008 Prior to his retirement in January 2006, Mr. Mauriello served in numerous senior management positions including Deputy Chairman and Chief Operating Officer (2004-2005), and Vice Chairman of Financial Services (2002-2004) of KPMG LLP US (professional services, 1965-2005). Mr. Mauriello currently serves as a member of the Board of Directors of XL Group plc. (global insurance and re-insurance, 2006-present). Previously, Mr. Mauriello served as a Director of the Hamilton Funds of the Bank of New York (2006-2007) and Arcadia Resources Inc. (health care services and products, 2007-2012). |
Robert W. Selander (61) |
| Year of Election or Appointment: 2011 Previously, Mr. Selander served as a Member of the Advisory Board of Fidelity's Equity and High Income Funds (2011), Executive Vice Chairman (2010), Chief Executive Officer (2009-2010), and President and Chief Executive Officer (1997-2009) of Mastercard, Inc. |
Cornelia M. Small (67) |
| Year of Election or Appointment: 2005 Ms. Small is a member of the Board of Directors of the Teagle Foundation (2009-present). Ms. Small is also a member of the Investment Committee, and Chair (2008-present) and a member of the Board of Trustees of Smith College. In addition, Ms. Small serves on the Investment Committee of the Berkshire Taconic Community Foundation (2008-present). Previously, Ms. Small served as Chairperson of the Investment Committee (2002-2008) of Smith College. In addition, Ms. Small served as Chief Investment Officer, Director of Global Equity Investments, and a member of the Board of Directors of Scudder, Stevens & Clark and Scudder Kemper Investments. |
William S. Stavropoulos (73) |
| Year of Election or Appointment: 2001 Mr. Stavropoulos is Vice Chairman of the Independent Trustees of the Equity and High Income Funds (2006-present). Mr. Stavropoulos serves as President and Founder of the Michigan Baseball Foundation, the Great Lakes Loons (2007-present). Mr. Stavropoulos is Chairman Emeritus of the Board of Directors of The Dow Chemical Company, where he previously served in numerous senior management positions, including President, CEO (1995-2000; 2002-2004), Chairman of the Executive Committee (2000-2006), and as a member of the Board of Directors (1990-2006). Currently, Mr. Stavropoulos is Chairman of Univar (global distributor of commodity and specialty chemicals, 2010-present), a Director of Teradata Corporation (data warehousing and technology solutions, 2008-present), Chemical Financial Corporation, Maersk Inc. (industrial conglomerate), Tyco International, Inc. (multinational manufacturing and services, 2007-present), and a member of the Advisory Board for Metalmark Capital (private equity investment, 2005-present). Mr. Stavropoulos is a special advisor to Clayton, Dubilier & Rice, LLC (private equity investment). In addition, Mr. Stavropoulos is a member of the University of Notre Dame Advisory Council for the College of Science. |
David M. Thomas (63) |
| Year of Election or Appointment: 2008 Previously, Mr. Thomas served as Executive Chairman (2005-2006) and Chairman and Chief Executive Officer (2000-2005) of IMS Health, Inc. (pharmaceutical and healthcare information solutions). In addition, Mr. Thomas serves as a member of the Board of Directors of Fortune Brands, Inc. (consumer products), and Interpublic Group of Companies, Inc. (marketing communication, 2004-present). |
Michael E. Wiley (61) |
| Year of Election or Appointment: 2008 Mr. Wiley also serves as a Director of Asia Pacific Exploration Consolidated (international oil and gas exploration and production, 2008-present). Mr. Wiley serves as a Director of Tesoro Corporation (independent oil refiner and marketer, 2005-present), and a Director of Bill Barrett Corporation (exploration and production, 2005-present). In addition, Mr. Wiley also serves as a Director of Post Oak Bank (privately-held bank, 2004-present). Previously, Mr. Wiley served as a member of the Board of Trustees of the University of Tulsa (2000-2006; 2007-2010), as a Senior Energy Advisor of Katzenbach Partners, LLC (consulting, 2006-2007), as an Advisory Director of Riverstone Holdings (private investment), Chairman, President, and CEO of Baker Hughes, Inc. (oilfield services, 2000-2004), and as Director of Spinnaker Exploration Company (exploration and production, 2001-2005). |
Annual Report
+ The information above includes each Trustee's principal occupation during the last five years and other information relating to the experience, attributes, and skills relevant to each Trustee's qualifications to serve as a Trustee, which led to the conclusion that each Trustee should serve as a Trustee for the fund.
Advisory Board Members and Executive Officers:
Correspondence intended for each executive officer, Edward C. Johnson 3d, Peter S. Lynch, David A. Rosow, and Garnett A. Smith may be sent to Fidelity Investments, 82 Devonshire Street, Boston, Massachusetts 02109.
Name, Age; Principal Occupation |
Edward C. Johnson 3d (82) |
| Year of Election or Appointment: 2011 Member of the Advisory Board of Fidelity's Equity and High Income Funds. Mr. Johnson serves as Chief Executive Officer, Chairman, and a Director of FMR LLC, and also serves as Chairman and Director of FIL Limited. Previously, Mr. Johnson served as a Trustee and Chairman of the Board of certain Fidelity Trusts, Chairman and a Director of FMR, Chairman and a Director of FMR Co., Inc., and President of FMR LLC (2006-2007). |
Peter S. Lynch (68) |
| Year of Election or Appointment: 2003 Member of the Advisory Board of Fidelity's Equity and High Income Funds. Mr. Lynch is Vice Chairman and a Director of FMR and FMR Co., Inc. In addition, Mr. Lynch serves as a Trustee of Boston College and as the Chairman of the Inner-City Scholarship Fund. Previously, Mr. Lynch served on the Special Olympics International Board of Directors (1997-2006). |
David A. Rosow (69) |
| Year of Election or Appointment: 2012 Member of the Advisory Board of Fidelity's Equity and High Income Funds. Chairman and Chief Executive Officer of International Golf Group, Inc. (golf course development, 1990-present). Previously, Mr. Rosow served as Chairman and Chief Executive Officer of Rosow & Company, Inc. (private investment company, 1989-2011), a Lead Director of Hudson United Bancorp (2001-2006) and as a Director of TD Banknorth (1996-2006). In addition, Mr. Rosow is a member (2008-present) and President (2009-present) of the Town Council of Palm Beach, Florida. |
Garnett A. Smith (64) |
| Year of Election or Appointment: 2012 Member of the Advisory Board of Fidelity's Equity and High Income Funds. Prior to Mr. Smith's retirement, he served as Chairman and Chief Executive Officer of Inbrand Corp. (manufacturer of personal absorbent products, 1990-1997). He also served as President (1986-1990) of Inbrand Corp. Prior to his employment with Inbrand Corp., he was employed by a retail fabric chain and North Carolina National Bank. In addition, Mr. Smith is a board member of the Jackson Hole Land Trust (2009-present). |
Kenneth B. Robins (42) |
| Year of Election or Appointment: 2008 President and Treasurer of Fidelity's Equity and High Income Funds. Mr. Robins also serves as President and Treasurer (2010-present) and Assistant Treasurer (2009-present) of other Fidelity funds and is an employee of Fidelity Investments (2004-present). Previously, Mr. Robins served as Deputy Treasurer of the Fidelity funds (2005-2008) and Treasurer and Chief Financial Officer of The North Carolina Capital Management Trust: Cash and Term Portfolios (2006-2008). |
Bruce T. Herring (46) |
| Year of Election or Appointment: 2006 Vice President of certain Equity Funds. Mr. Herring also serves as President of Fidelity Research & Analysis Company (2010-present), Chief Investment Officer and Director of Fidelity Management & Research (U.K.) Inc. (2010-present) and Group Chief Investment Officer of FMR. Previously, Mr. Herring served as Vice President (2005-2006) and Senior Vice President (2006-2007) of Fidelity Management & Research Company, Vice President of FMR Co., Inc. (2001-2007) and as a portfolio manager for Fidelity U.S. Equity Funds. |
Brian B. Hogan (47) |
| Year of Election or Appointment: 2009 Vice President of Equity and High Income Funds. Mr. Hogan also serves as President of FMR's Equity Division (2009-present). Previously, Mr. Hogan served as Senior Vice President, Equity Research of FMR (2006-2009) and as a portfolio manager. |
Scott C. Goebel (44) |
| Year of Election or Appointment: 2008 Secretary and Chief Legal Officer (CLO) of the Fidelity funds. Mr. Goebel also serves as Secretary of Fidelity Investments Money Management, Inc. (FIMM) (2010-present) and Fidelity Research and Analysis Company (FRAC) (2010-present); Secretary and CLO of The North Carolina Capital Management Trust: Cash and Term Portfolios (2008-present); General Counsel, Secretary, and Senior Vice President of FMR (2008-present) and FMR Co., Inc. (2008-present); employed by FMR LLC or an affiliate (2001-present); Chief Legal Officer of Fidelity Management & Research (Hong Kong) Limited (2008-present) and Assistant Secretary of Fidelity Management & Research (Japan) Inc. (2008-present), and Fidelity Management & Research (U.K.) Inc. (2008-present). Previously, Mr. Goebel served as Assistant Secretary of FIMM (2008-2010), FRAC (2008-2010), and the Funds (2007-2008) and as Vice President and Secretary of Fidelity Distributors Corporation (FDC) (2005-2007). |
William C. Coffey (43) |
| Year of Election or Appointment: 2009 Assistant Secretary of Fidelity's Equity and High Income Funds. Mr. Coffey also serves as Senior Vice President and Deputy General Counsel of FMR LLC (2010-present), and is an employee of Fidelity Investments. Previously, Mr. Coffey served as Vice President and Associate General Counsel of FMR LLC (2005-2009). |
Elizabeth Paige Baumann (44) |
| Year of Election or Appointment: 2012 Anti-Money Laundering (AML) Officer of the Fidelity funds. Ms. Baumann also serves as AML Officer of The North Carolina Capital Management Trust: Cash and Term Portfolios (2012-present), Chief AML Officer of FMR LLC (2012-present), and is an employee of Fidelity Investments. Previously, Ms. Baumann served as Vice President and Deputy Anti-Money Laundering Officer (2007-2012). |
Christine Reynolds (53) |
| Year of Election or Appointment: 2008 Chief Financial Officer of the Fidelity funds. Ms. Reynolds became President of Fidelity Pricing and Cash Management Services (FPCMS) in August 2008. Ms. Reynolds served as Chief Operating Officer of FPCMS (2007-2008). Previously, Ms. Reynolds served as President, Treasurer, and Anti-Money Laundering officer of the Fidelity funds (2004-2007). |
Joseph A. Hanlon (44) |
| Year of Election or Appointment: 2012 Chief Compliance Officer of Fidelity's Equity and High Income Funds. Mr. Hanlon serves as Compliance Officer of FMR, FMR Co., Inc., Fidelity Investments Money Management, Inc. (FIMM), Fidelity Research and Analysis Company (FRAC), Fidelity Management & Research (Japan) Inc., Fidelity Management & Research (U.K.) Inc., Fidelity Management & Research (Hong Kong), and Strategic Advisers, Inc. (2009-present), as Senior Vice President of the Fidelity Asset Management Division (2009-present), and is an employee of Fidelity Investments. |
Joseph F. Zambello (55) |
| Year of Election or Appointment: 2011 Deputy Treasurer of the Fidelity funds. Mr. Zambello is an employee of Fidelity Investments. Previously, Mr. Zambello served as Vice President of FMR's Program Management Group (2009-2011) and Vice President of the Transfer Agent Oversight Group (2005-2009). |
Adrien E. Deberghes (44) |
| Year of Election or Appointment: 2008 Deputy Treasurer of Fidelity's Equity and High Income Funds. Mr. Deberghes also serves as Vice President (2011-present) and Assistant Treasurer (2010-present) of other Fidelity funds, and is an employee of Fidelity Investments (2008-present). Previously, Mr. Deberghes served as Senior Vice President of Mutual Fund Administration at State Street Corporation (2007-2008), Senior Director of Mutual Fund Administration at Investors Bank & Trust (2005-2007), and Director of Finance for Dunkin' Brands (2000-2005). |
Stephanie J. Dorsey (43) |
| Year of Election or Appointment: 2010 Assistant Treasurer of Fidelity's Equity and High Income Funds. Ms. Dorsey also serves as Deputy Treasurer of other Fidelity funds (2008-present) and is an employee of Fidelity Investments (2008-present). Previously, Ms. Dorsey served as Treasurer (2004-2008) of the JPMorgan Mutual Funds and Vice President (2004-2008) of JPMorgan Chase Bank. |
John R. Hebble (54) |
| Year of Election or Appointment: 2009 Assistant Treasurer of Fidelity's Equity and High Income Funds. Mr. Hebble also serves as President (2011-present), Treasurer, and Chief Financial Officer of The North Carolina Capital Management Trust: Cash and Term Portfolios (2008-present), President and Treasurer of other Fidelity funds (2008-present) and is an employee of Fidelity Investments. |
Gary W. Ryan (53) |
| Year of Election or Appointment: 2005 Assistant Treasurer of the Fidelity funds. Mr. Ryan is an employee of Fidelity Investments. Previously, Mr. Ryan served as Vice President of Fund Reporting in Fidelity Pricing and Cash Management Services (FPCMS) (1999-2005). |
Jonathan Davis (44) |
| Year of Election or Appointment: 2010 Assistant Treasurer of the Fidelity funds. Mr. Davis is also Assistant Treasurer of Fidelity Rutland Square Trust II and Fidelity Commonwealth Trust II. Mr. Davis is an employee of Fidelity Investments. Previously, Mr. Davis served as Vice President and Associate General Counsel of FMR LLC (2003-2010). |
Annual Report
Mega Cap Stock designates 100% of the dividends distributed during the fiscal year as qualifying for the dividends-received deduction for corporate shareholders.
Mega Cap Stock designates 100% of the dividends distributed during the fiscal year as amounts which may be taken into account as a dividend for the purposes of the maximum rate under section 1(h)(11) of the Internal Revenue Code.
The fund will notify shareholders in January 2013 of amounts for use in preparing 2012 income tax returns.
Annual Report
Investment Adviser
Fidelity Management & Research Company
Boston, MA
Investment Sub-Advisers
FMR Co., Inc.
Fidelity Management & Research
(U.K.) Inc.
Fidelity Management & Research
(Hong Kong) Limited
Fidelity Management & Research
(Japan) Inc.
General Distributor
Fidelity Distributors Corporation
Smithfield, RI
Transfer and Service Agents
Fidelity Investments Institutional
Operations Company, Inc.
Boston, MA
Fidelity Service Company, Inc.
Boston, MA
Custodian
JPMorgan Chase Bank
New York, NY
The Fidelity Telephone Connection
Mutual Fund 24-Hour Service
Exchanges/Redemptions
and Account Assistance 1-800-544-6666
Product Information 1-800-544-6666
Retirement Accounts 1-800-544-4774
(8 a.m. - 9 p.m.)
TDD Service 1-800-544-0118
for the deaf and hearing impaired
(9 a.m. - 9 p.m. Eastern time)
Fidelity Automated Service
Telephone (FAST®)
1-800-544-5555
Automated line for quickest service
GII-UANN-0812
1.787733.109
(Fidelity Investment logo)(registered trademark)
Corporate Headquarters
82 Devonshire St., Boston, MA 02109
www.fidelity.com
(Fidelity Investment logo)(registered trademark)
Fidelity Advisor®
Mega Cap Stock
Fund - Class A, Class T, Class B
and Class C
Annual Report
June 30, 2012
(Fidelity Cover Art)
Class A, Class T, Class B,
and Class C are classes of
Fidelity® Mega Cap Stock Fund
Contents
Performance | (Click Here) | How the fund has done over time. |
Management's Discussion of Fund Performance | (Click Here) | The Portfolio Manager's review of fund performance and strategy. |
Shareholder Expense Example | (Click Here) | An example of shareholder expenses. |
Investment Changes | (Click Here) | A summary of major shifts in the fund's investments over the past six months. |
Investments | (Click Here) | A complete list of the fund's investments with their market values. |
Financial Statements | (Click Here) | Statements of assets and liabilities, operations, and changes in net assets, as well as financial highlights. |
Notes | (Click Here) | Notes to the financial statements. |
Report of Independent Registered Public Accounting Firm | (Click Here) | |
Trustees and Officers | (Click Here) | |
Distributions | (Click Here) | |
To view a fund's proxy voting guidelines and proxy voting record for the 12-month period ended June 30, visit http://www.fidelity.com/proxyvotingresults or visit the Securities and Exchange Commission's (SEC) web site at http://www.sec.gov. You may also call 1-877-208-0098 to request a free copy of the proxy voting guidelines.
Standard & Poor's, S&P and S&P 500 are registered service marks of The McGraw-Hill Companies, Inc. and have been licensed for use by Fidelity Distributors Corporation.
Other third party marks appearing herein are the property of their respective owners.
All other marks appearing herein are registered or unregistered trademarks or service marks of FMR LLC or an affiliated company. © 2012 FMR LLC. All rights reserved.
This report and the financial statements contained herein are submitted for the general information of the shareholders of the fund. This report is not authorized for distribution to prospective investors in the fund unless preceded or accompanied by an effective prospectus.
A fund files its complete schedule of portfolio holdings with the SEC for the first and third quarters of each fiscal year on Form N-Q. Forms N-Q are available on the SEC's web site at http://www.sec.gov. A fund's Forms N-Q may be reviewed and copied at the SEC's Public Reference Room in Washington, DC. Information regarding the operation of the SEC's Public Reference Room may be obtained by calling 1-800-SEC-0330. For a complete list of a fund's portfolio holdings, view the most recent holdings listing, semiannual report, or annual report on Fidelity's web site at http://www.fidelity.com, http://www.advisor.fidelity.com, or http://www.401k.com, as applicable.
NOT FDIC INSURED • MAY LOSE VALUE • NO BANK GUARANTEE
Neither the fund nor Fidelity Distributors Corporation is a bank.
Annual Report
Average annual total return reflects the change in the value of an investment, assuming reinvestment of the class' distributions from dividend income and capital gains (the profits earned upon the sale of securities that have grown in value, if any) and assuming a constant rate of performance each year. The $10,000 table and the fund's returns do not reflect the deduction of taxes that a shareholder would pay on fund distributions or the redemption of fund shares. During periods of reimbursement by Fidelity, a fund's total return will be greater than it would be had the reimbursement not occurred. How a fund did yesterday is no guarantee of how it will do tomorrow.
Average Annual Total Returns
Periods ended June 30, 2012 | Past 1
year | Past 5
years | Past 10
years |
Class A (incl. 5.75% sales charge) A, E | 1.39% | -0.81% | 4.72% |
Class T (incl. 3.50% sales charge) B, E | 3.44% | -0.58% | 4.85% |
Class B (incl. contingent deferred sales charge) C, E | 1.62% | -0.69% | 4.98% |
Class C (incl. contingent deferred sales charge) D, E | 5.74% | -0.29% | 5.00% |
A Class A shares bear a 0.25% 12b-1 fee. The initial offering of Class A shares took place on February 5, 2008. Returns prior to February 5, 2008, are those of Fidelity® Mega Cap Stock Fund, the original class of the fund, which has no 12b-1 fee. Had Class A's 12b-1 fee been reflected, returns prior to February 5, 2008, would have been lower.
B Class T shares bear a 0.50% 12b-1 fee. The initial offering of Class T shares took place on February 5, 2008. Returns prior to February 5, 2008, are those of Fidelity Mega Cap Stock Fund, the original class of the fund, which has no 12b-1 fee. Had Class T's 12b-1 fee been reflected, returns prior to February 5, 2008, would have been lower.
C Class B shares bear a 1.00% 12b-1 fee. The initial offering of Class B shares took place on February 5, 2008. Returns prior to February 5, 2008, are those of Fidelity Mega Cap Stock Fund, the original class of the fund, which has no 12b-1 fee. Had Class B's 12b-1 fee been reflected, returns prior to February 5, 2008, would have been lower. Class B shares' contingent deferred sales charges included in the past one year, past five years, and past ten years total return figures are 5%, 2%, and 0%, respectively.
D Class C shares bear a 1.00% 12b-1 fee. The initial offering of Class C shares took place on February 5, 2008. Returns prior to February 5, 2008, are those of Fidelity Mega Cap Stock Fund, the original class of the fund, which has no 12b-1 fee. Had Class C's 12b-1 fee been reflected, returns prior to February 5, 2008, would have been lower. Class C shares' contingent deferred sales charges included in the past one year, past five years, and past ten years total return figures are 1%, 0%, and 0%, respectively.
E Prior to December 1, 2007, the fund operated under certain different investment policies. The fund's historical performance may not represent its current investment policies.
Annual Report
$10,000 Over 10 Years
Let's say hypothetically that $10,000 was invested in Fidelity Advisor® Mega Cap Stock Fund - Class A on June 30, 2002, and the current 5.75% sales charge was paid. The chart shows how the value of your investment would have changed, and also shows how the S&P 500® Index performed over the same period. The initial offering of Class A took place on February 5, 2008. See the previous page for additional information regarding the performance of Class A.
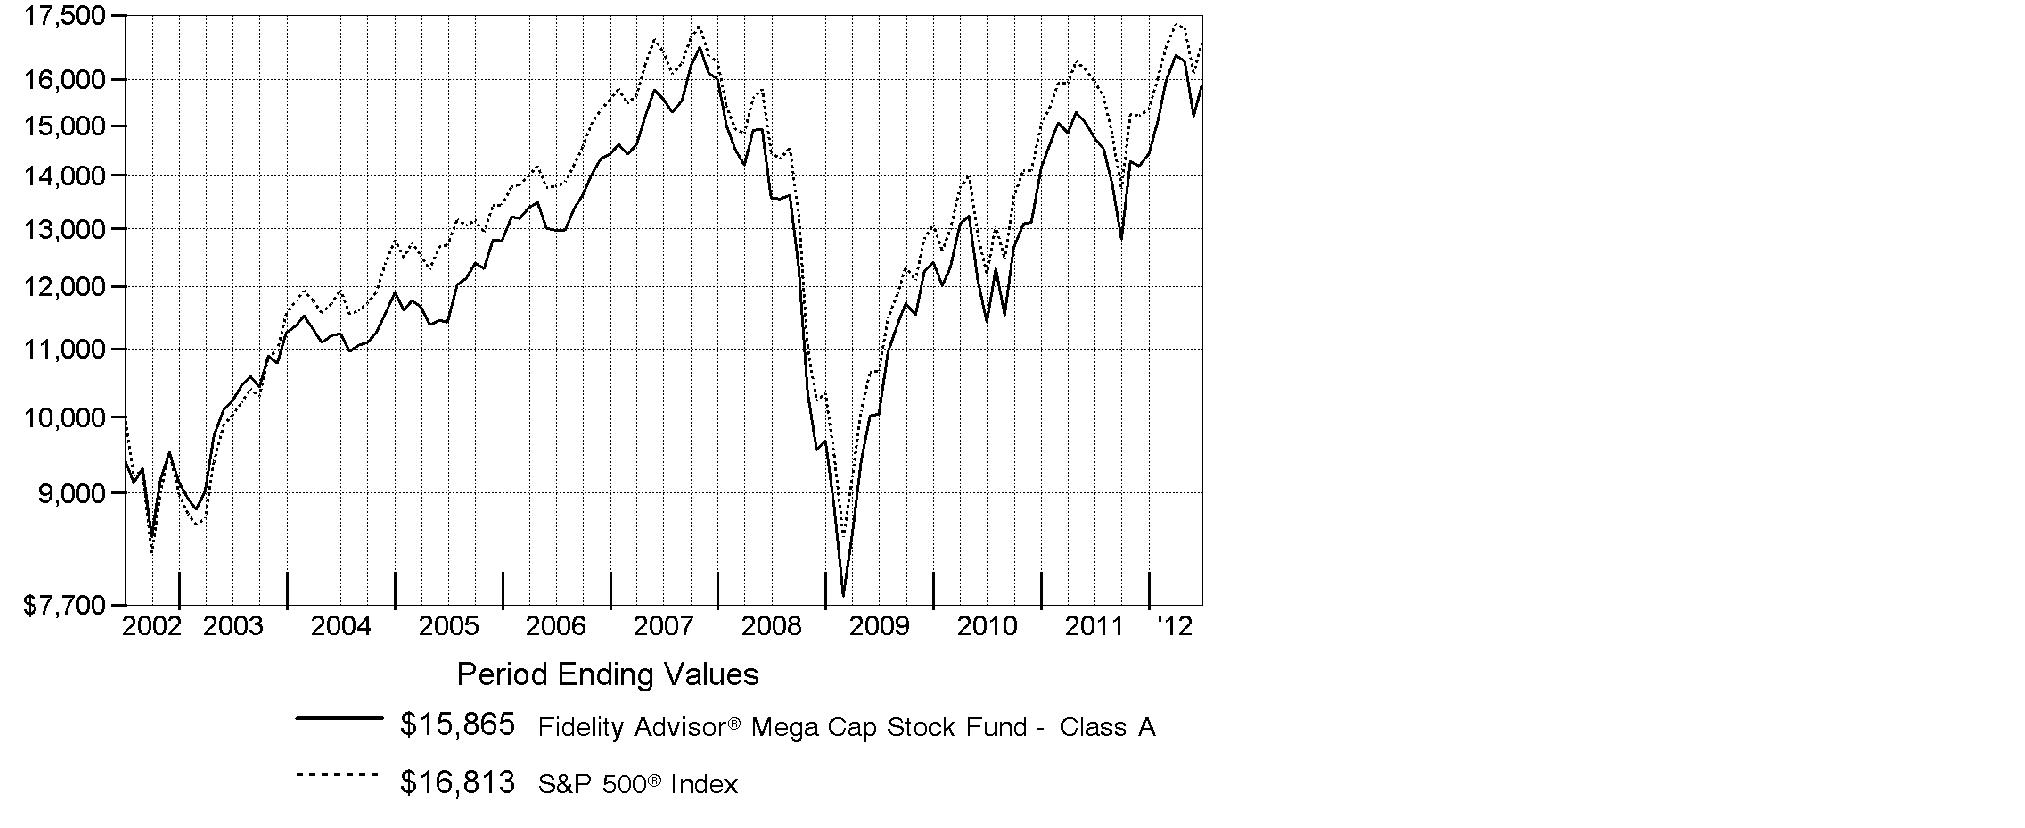
Annual Report
Market Recap: Major U.S. equity benchmarks posted solid gains for the 12 months ending June 30, 2012, even amid the period's uncertain investment environment. The broad-based S&P 500® Index returned 5.45%, while the blue-chip-laden Dow Jones Industrial AverageSM and the technology-heavy Nasdaq Composite® Index gained 6.63% and 6.99%, respectively. Volatility marked the first half of the period, as equities plummeted last summer and early fall on Europe's debt woes, debate over the U.S. debt ceiling and the credit-rating downgrade that followed. Beginning in October, healthier manufacturing, consumer and housing data rejuvenated markets and investors' appetite for stocks, leading major equity benchmarks to their best first-quarter performance since 1998. Stocks slipped again in the spring, as more eurozone trouble and a marked slowdown in China put the brakes on earlier momentum, until optimism reappeared in June. For the period, five of the 10 major market segments within the S&P 500® posted a double-digit gain, led by the more-defensive utilities, consumer staples and telecommunication services sectors, each of which rose about 15%. Conversely, energy (-8%) and materials (-7%) struggled the most. Given Europe's turmoil and local currency weakness, foreign developed-markets stocks lost ground, with the MSCI® EAFE® Index returning -13.70%.
Comments from Matthew Fruhan, Portfolio Manager of Fidelity Advisor® Mega Cap Stock Fund: For the year, the fund's Class A, Class T, Class B and Class C shares returned 7.57%, 7.19%, 6.62% and 6.74%, respectively (excluding sales charges), ahead of the mega-cap proxy Russell Top 200® Index, which rose 7.04%, and the S&P 500®. Relative to the Russell index, stock selection within information technology was a bright spot, especially software/services names. Sector positioning overall also was helpful. Conversely, my picks in consumer staples notably detracted, as did positioning in telecommunication services. The fund's foreign investments hurt overall, due in part to a stronger U.S. dollar. The top contributor was U.K.-based Autonomy, an enterprise software maker. The stock rose sharply in August on a generous takeover bid from Hewlett-Packard. I sold Autonomy shortly after the announcement. A sizable stake in Wells Fargo helped, as earnings estimates were revised higher due to loan growth and favorable credit trends. An overweight in MasterCard boosted performance because earnings estimates for the card-processing company increased. Conversely, JPMorgan Chase was the largest relative detractor because its stock lagged, due in part to new capital standards for financial firms. In capital goods, an overweight in Ingersoll-Rand hurt because management missed short-term financial targets. Autonomy and Ingersoll-Rand were not in the index.
Annual Report
The views expressed above reflect those of the portfolio manager(s) only through the end of the period as stated on the cover of this report and do not necessarily represent the views of Fidelity or any other person in the Fidelity organization. Any such views are subject to change at any time based upon market or other conditions and Fidelity disclaims any responsibility to update such views. These views may not be relied on as investment advice and, because investment decisions for a Fidelity fund are based on numerous factors, may not be relied on as an indication of trading intent on behalf of any Fidelity fund.
Annual Report
Shareholder Expense Example
As a shareholder of the Fund, you incur two types of costs: (1) transaction costs, including sales charges (loads) on purchase payments or redemption proceeds, and (2) ongoing costs, including management fees, distribution and/or service (12b-1) fees and other Fund expenses. This Example is intended to help you understand your ongoing costs (in dollars) of investing in the Fund and to compare these costs with the ongoing costs of investing in other mutual funds.
The Example is based on an investment of $1,000 invested at the beginning of the period and held for the entire period (January 1, 2012 to June 30, 2012).
Actual Expenses
The first line of the accompanying table for each class of the Fund provides information about actual account values and actual expenses. You may use the information in this line, together with the amount you invested, to estimate the expenses that you paid over the period. Simply divide your account value by $1,000.00 (for example, an $8,600 account value divided by $1,000.00 = 8.6), then multiply the result by the number in the first line for a class of the Fund under the heading entitled "Expenses Paid During Period" to estimate the expenses you paid on your account during this period. A small balance maintenance fee of $12.00 that is charged once a year may apply for certain accounts with a value of less than $2,000. This fee is not included in the table below. If it was, the estimate of expenses you paid during the period would be higher, and your ending account value lower, by this amount. In addition, the Fund, as a shareholder in the underlying Fidelity Central Funds, will indirectly bear its pro-rata share of the fees and expenses incurred by the underlying Fidelity Central Funds. These fees and expenses are not included in the Fund's annualized expense ratio used to calculate the expense estimate in the table below.
Hypothetical Example for Comparison Purposes
The second line of the accompanying table for each class of the Fund provides information about hypothetical account values and hypothetical expenses based on a Class' actual expense ratio and an assumed rate of return of 5% per year before expenses, which is not the Class' actual return. The hypothetical account values and expenses may not be used to estimate the actual ending account balance or expenses you paid for the period. You may use this information to compare the ongoing costs of investing in the Fund and other funds. To do so, compare this 5% hypothetical example with the 5% hypothetical examples that appear in the shareholder reports of the other funds. A small balance maintenance fee of $12.00 that is charged once a year may apply for certain accounts with a value of less than $2,000. This fee is not included in the table below. If it was, the estimate of expenses you paid during the period would be higher, and your ending account value lower, by this amount. In addition, the Fund, as a shareholder in the underlying Fidelity Central Funds, will indirectly bear its pro-rata share of the fees and expenses incurred by the underlying Fidelity Central Funds. These fees and expenses are not included in the Fund's annualized expense ratio used to calculate the expense estimate in the table below.
Please note that the expenses shown in the table are meant to highlight your ongoing costs only and do not reflect any transaction costs. Therefore, the second line of the table is useful in comparing ongoing costs only, and will not help you determine the relative total costs of owning different funds. In addition, if these transactional costs were included, your costs would have been higher.
Annual Report
| Annualized
Expense Ratio | Beginning
Account Value
January 1, 2012 | Ending
Account Value
June 30, 2012 | Expenses Paid
During Period*
January 1, 2012
to June 30, 2012 |
Class A | 1.01% | | | |
Actual | | $ 1,000.00 | $ 1,099.50 | $ 5.27 |
HypotheticalA | | $ 1,000.00 | $ 1,019.84 | $ 5.07 |
Class T | 1.32% | | | |
Actual | | $ 1,000.00 | $ 1,097.30 | $ 6.88 |
HypotheticalA | | $ 1,000.00 | $ 1,018.30 | $ 6.62 |
Class B | 1.82% | | | |
Actual | | $ 1,000.00 | $ 1,093.70 | $ 9.47 |
HypotheticalA | | $ 1,000.00 | $ 1,015.81 | $ 9.12 |
Class C | 1.78% | | | |
Actual | | $ 1,000.00 | $ 1,095.20 | $ 9.27 |
HypotheticalA | | $ 1,000.00 | $ 1,016.01 | $ 8.92 |
Mega Cap Stock | .74% | | | |
Actual | | $ 1,000.00 | $ 1,100.00 | $ 3.86 |
HypotheticalA | | $ 1,000.00 | $ 1,021.18 | $ 3.72 |
Institutional Class | .77% | | | |
Actual | | $ 1,000.00 | $ 1,100.30 | $ 4.02 |
HypotheticalA | | $ 1,000.00 | $ 1,021.03 | $ 3.87 |
A 5% return per year before expenses
* Expenses are equal to each Class' annualized expense ratio, multiplied by the average account value over the period, multiplied by 182/366 (to reflect the one-half year period).
Annual Report
Investment Changes (Unaudited)
Top Ten Stocks as of June 30, 2012 |
| % of fund's
net assets | % of fund's net assets
6 months ago |
Apple, Inc. | 6.1 | 5.1 |
Wells Fargo & Co. | 4.2 | 4.6 |
JPMorgan Chase & Co. | 3.9 | 4.0 |
Exxon Mobil Corp. | 3.3 | 4.4 |
Chevron Corp. | 3.1 | 3.4 |
General Electric Co. | 3.0 | 3.0 |
Microsoft Corp. | 2.7 | 2.2 |
Comcast Corp. Class A (special) (non-vtg.) | 2.5 | 1.5 |
Procter & Gamble Co. | 2.4 | 2.5 |
Google, Inc. Class A | 2.3 | 3.0 |
| 33.5 | |
Top Five Market Sectors as of June 30, 2012 |
| % of fund's
net assets | % of fund's net assets
6 months ago |
Information Technology | 20.9 | 23.5 |
Financials | 15.5 | 15.8 |
Energy | 14.0 | 13.8 |
Health Care | 13.0 | 10.1 |
Consumer Discretionary | 12.6 | 11.9 |
Asset Allocation (% of fund's net assets) |
As of June 30, 2012 * | As of December 31, 2011 ** |
| Stocks 99.5% | | | Stocks and
Equity Futures 99.1% | |
| Convertible
Securities 0.1% | | | Convertible
Securities 0.0% | |
| Short-Term
Investments and
Net Other Assets
(Liabilities) 0.4% | | | Short-Term
Investments and
Net Other Assets
(Liabilities) 0.9% | |
* Foreign investments | 9.7% | | ** Foreign investments | 10.0% | |

Annual Report
Investments June 30, 2012
Showing Percentage of Net Assets
Common Stocks - 98.9% |
| Shares | | Value |
CONSUMER DISCRETIONARY - 12.0% |
Auto Components - 0.4% |
Johnson Controls, Inc. | 231,500 | | $ 6,414,865 |
Automobiles - 0.4% |
Bayerische Motoren Werke AG (BMW) | 83,426 | | 6,010,419 |
Hotels, Restaurants & Leisure - 1.0% |
McDonald's Corp. | 139,300 | | 12,332,229 |
Yum! Brands, Inc. | 37,500 | | 2,415,750 |
| | 14,747,979 |
Media - 6.3% |
Comcast Corp. Class A (special) (non-vtg.) | 1,176,600 | | 36,945,240 |
The Walt Disney Co. | 291,800 | | 14,152,300 |
Thomson Reuters Corp. | 123,200 | | 3,505,652 |
Time Warner Cable, Inc. | 73,200 | | 6,009,720 |
Time Warner, Inc. | 668,600 | | 25,741,100 |
Viacom, Inc. Class B (non-vtg.) | 151,200 | | 7,109,424 |
| | 93,463,436 |
Multiline Retail - 1.6% |
Target Corp. | 392,000 | | 22,810,480 |
Specialty Retail - 2.3% |
Home Depot, Inc. | 211,900 | | 11,228,581 |
Lowe's Companies, Inc. | 790,900 | | 22,493,196 |
| | 33,721,777 |
TOTAL CONSUMER DISCRETIONARY | | 177,168,956 |
CONSUMER STAPLES - 11.2% |
Beverages - 2.9% |
PepsiCo, Inc. | 303,300 | | 21,431,178 |
The Coca-Cola Co. | 273,900 | | 21,416,241 |
| | 42,847,419 |
Food & Staples Retailing - 1.7% |
CVS Caremark Corp. | 272,800 | | 12,747,944 |
Walgreen Co. | 411,800 | | 12,181,044 |
| | 24,928,988 |
Food Products - 0.7% |
Kellogg Co. | 216,000 | | 10,655,280 |
Household Products - 4.7% |
Colgate-Palmolive Co. | 100,800 | | 10,493,280 |
Kimberly-Clark Corp. | 234,400 | | 19,635,688 |
Common Stocks - continued |
| Shares | | Value |
CONSUMER STAPLES - continued |
Household Products - continued |
Procter & Gamble Co. | 570,700 | | $ 34,955,375 |
Reckitt Benckiser Group PLC | 74,600 | | 3,931,491 |
| | 69,015,834 |
Tobacco - 1.2% |
British American Tobacco PLC sponsored ADR | 114,500 | | 11,692,740 |
Philip Morris International, Inc. | 70,430 | | 6,145,722 |
| | 17,838,462 |
TOTAL CONSUMER STAPLES | | 165,285,983 |
ENERGY - 14.0% |
Energy Equipment & Services - 2.5% |
Halliburton Co. | 571,100 | | 16,213,529 |
National Oilwell Varco, Inc. | 90,500 | | 5,831,820 |
Schlumberger Ltd. | 223,900 | | 14,533,349 |
| | 36,578,698 |
Oil, Gas & Consumable Fuels - 11.5% |
Apache Corp. | 118,000 | | 10,371,020 |
BP PLC sponsored ADR | 171,800 | | 6,964,772 |
Chevron Corp. | 440,300 | | 46,451,650 |
Exxon Mobil Corp. | 566,171 | | 48,447,252 |
Occidental Petroleum Corp. | 192,200 | | 16,484,994 |
Royal Dutch Shell PLC Class A sponsored ADR | 285,500 | | 19,251,265 |
Suncor Energy, Inc. | 522,000 | | 15,094,470 |
Williams Companies, Inc. | 230,300 | | 6,637,246 |
| | 169,702,669 |
TOTAL ENERGY | | 206,281,367 |
FINANCIALS - 15.5% |
Capital Markets - 2.3% |
BlackRock, Inc. Class A | 20,700 | | 3,515,274 |
Charles Schwab Corp. | 877,100 | | 11,340,903 |
Goldman Sachs Group, Inc. | 49,600 | | 4,754,656 |
Morgan Stanley | 656,800 | | 9,582,712 |
Northern Trust Corp. | 101,200 | | 4,657,224 |
| | 33,850,769 |
Commercial Banks - 6.0% |
BB&T Corp. | 247,400 | | 7,632,290 |
Common Stocks - continued |
| Shares | | Value |
FINANCIALS - continued |
Commercial Banks - continued |
Standard Chartered PLC (United Kingdom) | 66,063 | | $ 1,432,467 |
U.S. Bancorp | 560,200 | | 18,016,032 |
Wells Fargo & Co. | 1,843,830 | | 61,657,675 |
| | 88,738,464 |
Diversified Financial Services - 6.3% |
Bank of America Corp. | 545,300 | | 4,460,554 |
Citigroup, Inc. | 789,870 | | 21,650,337 |
CME Group, Inc. | 32,900 | | 8,820,819 |
JPMorgan Chase & Co. | 1,625,600 | | 58,082,688 |
| | 93,014,398 |
Insurance - 0.9% |
ACE Ltd. | 27,700 | | 2,053,401 |
MetLife, Inc. | 372,800 | | 11,500,880 |
| | 13,554,281 |
TOTAL FINANCIALS | | 229,157,912 |
HEALTH CARE - 13.0% |
Biotechnology - 1.0% |
Amgen, Inc. | 196,290 | | 14,337,022 |
Health Care Equipment & Supplies - 0.7% |
Baxter International, Inc. | 117,000 | | 6,218,550 |
St. Jude Medical, Inc. | 108,400 | | 4,326,244 |
| | 10,544,794 |
Health Care Providers & Services - 3.1% |
Aetna, Inc. | 239,600 | | 9,289,292 |
McKesson Corp. | 192,700 | | 18,065,625 |
UnitedHealth Group, Inc. | 27,000 | | 1,579,500 |
WellPoint, Inc. | 279,300 | | 17,816,547 |
| | 46,750,964 |
Life Sciences Tools & Services - 0.3% |
Thermo Fisher Scientific, Inc. | 92,100 | | 4,780,911 |
Pharmaceuticals - 7.9% |
Abbott Laboratories | 258,200 | | 16,646,154 |
Eli Lilly & Co. | 108,400 | | 4,651,444 |
GlaxoSmithKline PLC sponsored ADR | 217,200 | | 9,897,804 |
Johnson & Johnson | 490,400 | | 33,131,424 |
Common Stocks - continued |
| Shares | | Value |
HEALTH CARE - continued |
Pharmaceuticals - continued |
Merck & Co., Inc. | 759,100 | | $ 31,692,425 |
Pfizer, Inc. | 883,100 | | 20,311,300 |
| | 116,330,551 |
TOTAL HEALTH CARE | | 192,744,242 |
INDUSTRIALS - 9.3% |
Aerospace & Defense - 2.7% |
Honeywell International, Inc. | 144,200 | | 8,052,128 |
Raytheon Co. | 155,100 | | 8,777,109 |
The Boeing Co. | 125,900 | | 9,354,370 |
United Technologies Corp. | 179,300 | | 13,542,529 |
| | 39,726,136 |
Air Freight & Logistics - 0.9% |
United Parcel Service, Inc. Class B | 177,800 | | 14,003,528 |
Electrical Equipment - 0.4% |
Emerson Electric Co. | 133,700 | | 6,227,746 |
Industrial Conglomerates - 4.1% |
Danaher Corp. | 166,700 | | 8,681,736 |
General Electric Co. | 2,162,500 | | 45,066,500 |
Tyco International Ltd. | 134,000 | | 7,081,900 |
| | 60,830,136 |
Machinery - 0.9% |
Atlas Copco AB (A Shares) | 20,100 | | 431,205 |
Illinois Tool Works, Inc. | 118,900 | | 6,288,621 |
Ingersoll-Rand PLC | 161,540 | | 6,813,757 |
| | 13,533,583 |
Road & Rail - 0.3% |
Union Pacific Corp. | 31,000 | | 3,698,610 |
TOTAL INDUSTRIALS | | 138,019,739 |
INFORMATION TECHNOLOGY - 20.9% |
Communications Equipment - 2.0% |
Cisco Systems, Inc. | 939,300 | | 16,127,781 |
QUALCOMM, Inc. | 228,000 | | 12,695,040 |
| | 28,822,821 |
Computers & Peripherals - 7.3% |
Apple, Inc. (a) | 155,001 | | 90,520,584 |
Common Stocks - continued |
| Shares | | Value |
INFORMATION TECHNOLOGY - continued |
Computers & Peripherals - continued |
EMC Corp. (a) | 463,700 | | $ 11,884,631 |
Hewlett-Packard Co. | 274,800 | | 5,526,228 |
| | 107,931,443 |
Electronic Equipment & Components - 0.4% |
Corning, Inc. | 418,500 | | 5,411,205 |
Internet Software & Services - 2.3% |
Google, Inc. Class A (a) | 58,350 | | 33,847,085 |
IT Services - 4.4% |
Accenture PLC Class A | 42,600 | | 2,559,834 |
Cognizant Technology Solutions Corp. Class A (a) | 185,600 | | 11,136,000 |
IBM Corp. | 76,000 | | 14,864,080 |
MasterCard, Inc. Class A | 48,900 | | 21,032,379 |
Visa, Inc. Class A | 121,100 | | 14,971,593 |
| | 64,563,886 |
Semiconductors & Semiconductor Equipment - 0.3% |
Broadcom Corp. Class A | 151,500 | | 5,120,700 |
Software - 4.2% |
Microsoft Corp. | 1,311,200 | | 40,109,608 |
Oracle Corp. | 632,300 | | 18,779,310 |
salesforce.com, Inc. (a) | 26,500 | | 3,663,890 |
| | 62,552,808 |
TOTAL INFORMATION TECHNOLOGY | | 308,249,948 |
MATERIALS - 1.0% |
Chemicals - 0.9% |
Air Products & Chemicals, Inc. | 13,000 | | 1,049,490 |
E.I. du Pont de Nemours & Co. | 117,600 | | 5,947,032 |
Syngenta AG (Switzerland) | 17,510 | | 5,994,114 |
| | 12,990,636 |
Metals & Mining - 0.1% |
Freeport-McMoRan Copper & Gold, Inc. | 57,800 | | 1,969,246 |
TOTAL MATERIALS | | 14,959,882 |
TELECOMMUNICATION SERVICES - 0.8% |
Wireless Telecommunication Services - 0.8% |
Vodafone Group PLC sponsored ADR | 410,900 | | 11,579,162 |
Common Stocks - continued |
| Shares | | Value |
UTILITIES - 1.2% |
Electric Utilities - 0.7% |
Duke Energy Corp. | 54,300 | | $ 1,252,158 |
FirstEnergy Corp. | 91,100 | | 4,481,209 |
NextEra Energy, Inc. | 52,800 | | 3,633,168 |
PPL Corp. | 47,030 | | 1,307,904 |
| | 10,674,439 |
Multi-Utilities - 0.5% |
National Grid PLC | 400,442 | | 4,243,895 |
PG&E Corp. | 78,200 | | 3,540,114 |
| | 7,784,009 |
TOTAL UTILITIES | | 18,458,448 |
TOTAL COMMON STOCKS (Cost $1,380,548,550) |
1,461,905,639
|
Preferred Stocks - 0.7% |
| | | |
Convertible Preferred Stocks - 0.1% |
INDUSTRIALS - 0.1% |
Aerospace & Defense - 0.1% |
United Technologies Corp. 7.50% | 30,000 | | 1,580,700 |
Nonconvertible Preferred Stocks - 0.6% |
CONSUMER DISCRETIONARY - 0.6% |
Automobiles - 0.6% |
Volkswagen AG | 54,300 | | 8,562,095 |
TOTAL PREFERRED STOCKS (Cost $10,396,129) |
10,142,795
|
Money Market Funds - 0.4% |
| Shares | | Value |
Fidelity Cash Central Fund, 0.17% (b)
(Cost $5,340,245) | 5,340,245 | | $ 5,340,245 |
TOTAL INVESTMENT PORTFOLIO - 100.0% (Cost $1,396,284,924) | | 1,477,388,679 |
NET OTHER ASSETS (LIABILITIES) - 0.0% | | (42,272) |
NET ASSETS - 100% | $ 1,477,346,407 |
Legend |
(a) Non-income producing |
(b) Affiliated fund that is available only to investment companies and other accounts managed by Fidelity Investments. The rate quoted is the annualized seven-day yield of the fund at period end. A complete unaudited listing of the fund's holdings as of its most recent quarter end is available upon request. In addition, each Fidelity Central Fund's financial statements, which are not covered by the Fund's Report of Independent Registered Public Accounting Firm, are available on the SEC's website or upon request. |
Affiliated Central Funds |
Information regarding fiscal year to date income earned by the Fund from investments in Fidelity Central Funds is as follows: |
Fund | Income earned |
Fidelity Cash Central Fund | $ 13,361 |
Fidelity Securities Lending Cash Central Fund | 147,642 |
Total | $ 161,003 |
Other Information |
The following is a summary of the inputs used, as of June 30, 2012, involving the Fund's assets and liabilities carried at fair value. The inputs or methodology used for valuing securities may not be an indication of the risk associated with investing in those securities. For more information on valuation inputs, and their aggregation into the levels used in the table below, please refer to the Security Valuation section in the accompanying Notes to Financial Statements. |
Valuation Inputs at Reporting Date: |
Description | Total | Level 1 | Level 2 | Level 3 |
Investments in Securities: | | | | |
Equities: | | | | |
Consumer Discretionary | $ 185,731,051 | $ 185,731,051 | $ - | $ - |
Consumer Staples | 165,285,983 | 165,285,983 | - | - |
Energy | 206,281,367 | 206,281,367 | - | - |
Financials | 229,157,912 | 229,157,912 | - | - |
Health Care | 192,744,242 | 192,744,242 | - | - |
Industrials | 139,600,439 | 139,600,439 | - | - |
Information Technology | 308,249,948 | 308,249,948 | - | - |
Materials | 14,959,882 | 8,965,768 | 5,994,114 | - |
Telecommunication Services | 11,579,162 | 11,579,162 | - | - |
Utilities | 18,458,448 | 14,214,553 | 4,243,895 | - |
Money Market Funds | 5,340,245 | 5,340,245 | - | - |
Total Investments in Securities: | $ 1,477,388,679 | $ 1,467,150,670 | $ 10,238,009 | $ - |
See accompanying notes which are an integral part of the financial statements.
Annual Report
Statement of Assets and Liabilities
| June 30, 2012 |
| | |
Assets | | |
Investment in securities, at value - See accompanying schedule: Unaffiliated issuers (cost $1,390,944,679) | $ 1,472,048,434 | |
Fidelity Central Funds (cost $5,340,245) | 5,340,245 | |
Total Investments (cost $1,396,284,924) | | $ 1,477,388,679 |
Receivable for investments sold | | 4,513,052 |
Receivable for fund shares sold | | 112,201,019 |
Dividends receivable | | 2,618,855 |
Distributions receivable from Fidelity Central Funds | | 600 |
Other receivables | | 15,040 |
Total assets | | 1,596,737,245 |
| | |
Liabilities | | |
Payable for investments purchased | $ 117,396,851 | |
Payable for fund shares redeemed | 1,141,354 | |
Accrued management fee | 503,966 | |
Distribution and service plan fees payable | 5,498 | |
Other affiliated payables | 292,121 | |
Other payables and accrued expenses | 51,048 | |
Total liabilities | | 119,390,838 |
| | |
Net Assets | | $ 1,477,346,407 |
Net Assets consist of: | | |
Paid in capital | | $ 1,505,792,572 |
Undistributed net investment income | | 10,984,843 |
Accumulated undistributed net realized gain (loss) on investments and foreign currency transactions | | (120,530,812) |
Net unrealized appreciation (depreciation) on investments and assets and liabilities in foreign currencies | | 81,099,804 |
Net Assets | | $ 1,477,346,407 |
See accompanying notes which are an integral part of the financial statements.
Annual Report
Statement of Assets and Liabilities - continued
| June 30, 2012 |
| | |
Calculation of Maximum Offering Price Class A:
Net Asset Value and redemption price per share ($8,527,011 ÷ 771,793 shares) | | $ 11.05 |
| | |
Maximum offering price per share (100/94.25 of $11.05) | | $ 11.72 |
Class T:
Net Asset Value and redemption price per share ($2,293,345 ÷ 207,585 shares) | | $ 11.05 |
| | |
Maximum offering price per share (100/96.50 of $11.05) | | $ 11.45 |
Class B:
Net Asset Value and offering price per share ($703,627 ÷ 64,122 shares)A | | $ 10.97 |
| | |
Class C:
Net Asset Value and offering price per share ($2,845,398 ÷ 260,413 shares)A | | $ 10.93 |
| | |
| | |
Mega Cap Stock:
Net Asset Value, offering price and redemption price per share ($1,287,144,341 ÷ 115,843,358 shares) | | $ 11.11 |
| | |
Institutional Class:
Net Asset Value, offering price and redemption price per share ($175,832,685 ÷ 15,867,859 shares) | | $ 11.08 |
A Redemption price per share is equal to net asset value less any applicable contingent deferred sales charge.
See accompanying notes which are an integral part of the financial statements.
Annual Report
Financial Statements - continued
Statement of Operations
| Year ended June 30, 2012 |
| | |
Investment Income | | |
Dividends | | $ 26,585,526 |
Interest | | 11,400 |
Income from Fidelity Central Funds | | 161,003 |
Total income | | 26,757,929 |
| | |
Expenses | | |
Management fee | $ 5,326,645 | |
Transfer agent fees | 2,841,812 | |
Distribution and service plan fees | 57,115 | |
Accounting and security lending fees | 377,501 | |
Custodian fees and expenses | 56,633 | |
Independent trustees' compensation | 7,188 | |
Registration fees | 144,593 | |
Audit | 48,095 | |
Legal | 5,010 | |
Interest | 6,291 | |
Miscellaneous | 9,521 | |
Total expenses before reductions | 8,880,404 | |
Expense reductions | (26,452) | 8,853,952 |
Net investment income (loss) | | 17,903,977 |
Realized and Unrealized Gain (Loss) Net realized gain (loss) on: | | |
Investment securities: | | |
Unaffiliated issuers | 43,339,638 | |
Foreign currency transactions | 724 | |
Futures contracts | (142,240) | |
Total net realized gain (loss) | | 43,198,122 |
Change in net unrealized appreciation (depreciation) on: Investment securities | 29,111,014 | |
Assets and liabilities in foreign currencies | (12,065) | |
Total change in net unrealized appreciation (depreciation) | | 29,098,949 |
Net gain (loss) | | 72,297,071 |
Net increase (decrease) in net assets resulting from operations | | $ 90,201,048 |
See accompanying notes which are an integral part of the financial statements.
Annual Report
Statement of Changes in Net Assets
| Year ended
June 30,
2012 | Year ended
June 30,
2011 |
Increase (Decrease) in Net Assets | | |
Operations | | |
Net investment income (loss) | $ 17,903,977 | $ 7,510,892 |
Net realized gain (loss) | 43,198,122 | 43,232,954 |
Change in net unrealized appreciation (depreciation) | 29,098,949 | 104,537,333 |
Net increase (decrease) in net assets resulting
from operations | 90,201,048 | 155,281,179 |
Distributions to shareholders from net investment income | (11,753,098) | (4,840,262) |
Share transactions - net increase (decrease) | 468,368,181 | 273,329,633 |
Total increase (decrease) in net assets | 546,816,131 | 423,770,550 |
| | |
Net Assets | | |
Beginning of period | 930,530,276 | 506,759,726 |
End of period (including undistributed net investment income of $10,984,843 and undistributed net investment income of $4,847,983, respectively) | $ 1,477,346,407 | $ 930,530,276 |
See accompanying notes which are an integral part of the financial statements.
Annual Report
Financial Highlights - Class A
Years ended June 30, | 2012 | 2011 | 2010 | 2009 | 2008 H |
Selected Per-Share Data | | | | |
Net asset value, beginning of period | $ 10.37 | $ 8.07 | $ 7.20 | $ 9.89 | $ 10.61 |
Income from Investment Operations | | | | | |
Net investment income (loss) E | .13 | .07 | .06 | .10 | .05 |
Net realized and unrealized gain (loss) | .64 | 2.28 | .92 | (2.65) | (.77) |
Total from investment operations | .77 | 2.35 | .98 | (2.55) | (.72) |
Distributions from net investment income | (.09) | (.05) | (.11) | (.12) | - |
Distributions from net realized gain | - | - | - | (.02) | - |
Total distributions | (.09) | (.05) | (.11) | (.14) | - |
Net asset value, end of period | $ 11.05 | $ 10.37 | $ 8.07 | $ 7.20 | $ 9.89 |
Total Return B, C, D | 7.57% | 29.23% | 13.65% | (25.98)% | (6.79)% |
Ratios to Average Net Assets F, I | | | | |
Expenses before reductions | 1.02% | 1.06% | 1.10% | 1.13% | 1.02% A |
Expenses net of fee waivers, if any | 1.02% | 1.06% | 1.10% | 1.13% | 1.02% A |
Expenses net of all reductions | 1.02% | 1.06% | 1.10% | 1.13% | 1.01% A |
Net investment income (loss) | 1.28% | .76% | .66% | 1.44% | 1.24% A |
Supplemental Data | | | | |
Net assets, end of period (000 omitted) | $ 8,527 | $ 4,169 | $ 2,238 | $ 806 | $ 106 |
Portfolio turnover rate G | 57% | 53% | 97% | 138% | 97% |
A Annualized
B Total returns for periods of less than one year are not annualized.
C Total returns would have been lower if certain expenses had not been reduced during the applicable periods shown.
D Total returns do not include the effect of the sales charges.
E Calculated based on average shares outstanding during the period.
F Fees and expenses of any underlying Fidelity Central Funds are not included in the Fund's expense ratio. The Fund indirectly bears its proportionate share of the expenses of any underlying Fidelity Central Funds.
G Amount does not include the portfolio activity of any underlying Fidelity Central Funds.
H For the period February 5, 2008 (commencement of sale of shares) to June 30, 2008.
I Expense ratios reflect operating expenses of the class. Expenses before reductions do not reflect amounts reimbursed by the investment adviser or reductions from brokerage service arrangements or reductions from other expense offset arrangements and do not represent the amount paid by the class during periods when reimbursements or reductions occur. Expense ratios before reductions for start-up periods may not be representative of longer-term operating periods. Expenses net of fee waivers reflect expenses after reimbursement by the investment adviser but prior to reductions from brokerage service arrangements or other expense offset arrangements. Expenses net of all reductions represent the net expenses paid by the class.
See accompanying notes which are an integral part of the financial statements.
Annual Report
Financial Highlights - Class T
Years ended June 30, | 2012 | 2011 | 2010 | 2009 | 2008 H |
Selected Per-Share Data | | | | |
Net asset value, beginning of period | $ 10.38 | $ 8.07 | $ 7.20 | $ 9.88 | $ 10.61 |
Income from Investment Operations | | | | | |
Net investment income (loss) E | .10 | .05 | .03 | .09 | .04 |
Net realized and unrealized gain (loss) | .64 | 2.29 | .93 | (2.67) | (.77) |
Total from investment operations | .74 | 2.34 | .96 | (2.58) | (.73) |
Distributions from net investment income | (.07) | (.03) | (.09) | (.08) | - |
Distributions from net realized gain | - | - | - | (.02) | - |
Total distributions | (.07) | (.03) | (.09) | (.10) | - |
Net asset value, end of period | $ 11.05 | $ 10.38 | $ 8.07 | $ 7.20 | $ 9.88 |
Total Return B, C, D | 7.19% | 29.08% | 13.32% | (26.21)% | (6.88)% |
Ratios to Average Net Assets F, I | | | | |
Expenses before reductions | 1.32% | 1.32% | 1.36% | 1.36% | 1.32% A |
Expenses net of fee waivers, if any | 1.32% | 1.32% | 1.36% | 1.36% | 1.32% A |
Expenses net of all reductions | 1.32% | 1.32% | 1.35% | 1.36% | 1.32% A |
Net investment income (loss) | .98% | .50% | .41% | 1.21% | .89% A |
Supplemental Data | | | | |
Net assets, end of period (000 omitted) | $ 2,293 | $ 1,682 | $ 1,073 | $ 446 | $ 136 |
Portfolio turnover rate G | 57% | 53% | 97% | 138% | 97% |
A Annualized
B Total returns for periods of less than one year are not annualized.
C Total returns would have been lower if certain expenses had not been reduced during the applicable periods shown.
D Total returns do not include the effect of the sales charges.
E Calculated based on average shares outstanding during the period.
F Fees and expenses of any underlying Fidelity Central Funds are not included in the Fund's expense ratio. The Fund indirectly bears its proportionate share of the expenses of any underlying Fidelity Central Funds.
G Amount does not include the portfolio activity of any underlying Fidelity Central Funds.
H For the period February 5, 2008 (commencement of sale of shares) to June 30, 2008.
I Expense ratios reflect operating expenses of the class. Expenses before reductions do not reflect amounts reimbursed by the investment adviser or reductions from brokerage service arrangements or reductions from other expense offset arrangements and do not represent the amount paid by the class during periods when reimbursements or reductions occur. Expense ratios before reductions for start-up periods may not be representative of longer-term operating periods. Expenses net of fee waivers reflect expenses after reimbursement by the investment adviser but prior to reductions from brokerage service arrangements or other expense offset arrangements. Expenses net of all reductions represent the net expenses paid by the class.
See accompanying notes which are an integral part of the financial statements.
Annual Report
Financial Highlights - Class B
Years ended June 30, | 2012 | 2011 | 2010 | 2009 | 2008 I |
Selected Per-Share Data | | | | |
Net asset value, beginning of period | $ 10.30 | $ 8.02 | $ 7.19 | $ 9.87 | $ 10.61 |
Income from Investment Operations | | | | | |
Net investment income (loss) E | .05 | - K | (.01) | .05 | .02 |
Net realized and unrealized gain (loss) | .63 | 2.28 | .92 | (2.66) | (.76) |
Total from investment operations | .68 | 2.28 | .91 | (2.61) | (.74) |
Distributions from net investment income | (.01) | - | (.08) | (.05) | - |
Distributions from net realized gain | - | - | - | (.02) | - |
Total distributions | (.01) | - | (.08) | (.07) | - |
Net asset value, end of period | $ 10.97 | $ 10.30 | $ 8.02 | $ 7.19 | $ 9.87 |
Total Return B, C, D | 6.62% | 28.43% | 12.60% | (26.56)% | (6.97)% |
Ratios to Average Net Assets F, J | | | | |
Expenses before reductions | 1.82% | 1.83% | 1.88% | 1.88% | 1.73% A |
Expenses net of fee waivers, if any | 1.82% | 1.83% | 1.88% | 1.88% | 1.73% A |
Expenses net of all reductions | 1.81% | 1.82% | 1.88% | 1.88% | 1.73% A |
Net investment income (loss) | .49% | .00% H | (.12)% | .68% | .52% A |
Supplemental Data | | | | |
Net assets, end of period (000 omitted) | $ 704 | $ 764 | $ 667 | $ 263 | $ 107 |
Portfolio turnover rate G | 57% | 53% | 97% | 138% | 97% |
A Annualized
B Total returns for periods of less than one year are not annualized.
C Total returns would have been lower if certain expenses had not been reduced during the applicable periods shown.
D Total returns do not include the effect of the contingent deferred sales charge.
E Calculated based on average shares outstanding during the period.
F Fees and expenses of any underlying Fidelity Central Funds are not included in the Fund's expense ratio. The Fund indirectly bears its proportionate share of the expenses of any underlying Fidelity Central Funds.
G Amount does not include the portfolio activity of any underlying Fidelity Central Funds.
H Amount represents less than .01%.
I For the period February 5, 2008 (commencement of sale of shares) to June 30, 2008.
J Expense ratios reflect operating expenses of the class. Expenses before reductions do not reflect amounts reimbursed by the investment adviser or reductions from brokerage service arrangements or reductions from other expense offset arrangements and do not represent the amount paid by the class during periods when reimbursements or reductions occur. Expense ratios before reductions for start-up periods may not be representative of longer-term operating periods. Expenses net of fee waivers reflect expenses after reimbursement by the investment adviser but prior to reductions from brokerage service arrangements or other expense offset arrangements. Expenses net of all reductions represent the net expenses paid by the class.
K Amount represents less than $.01 per share.
See accompanying notes which are an integral part of the financial statements.
Annual Report
Financial Highlights - Class C
Years ended June 30, | 2012 | 2011 | 2010 | 2009 | 2008 H |
Selected Per-Share Data | | | | |
Net asset value, beginning of period | $ 10.28 | $ 8.01 | $ 7.16 | $ 9.87 | $ 10.61 |
Income from Investment Operations | | | | | |
Net investment income (loss) E | .05 | - J | (.01) | .05 | .02 |
Net realized and unrealized gain (loss) | .64 | 2.27 | .92 | (2.66) | (.76) |
Total from investment operations | .69 | 2.27 | .91 | (2.61) | (.74) |
Distributions from net investment income | (.04) | - | (.06) | (.08) | - |
Distributions from net realized gain | - | - | - | (.02) | - |
Total distributions | (.04) | - | (.06) | (.10) | - |
Net asset value, end of period | $ 10.93 | $ 10.28 | $ 8.01 | $ 7.16 | $ 9.87 |
Total Return B, C, D | 6.74% | 28.34% | 12.72% | (26.56)% | (6.97)% |
Ratios to Average Net Assets F, I | | | | |
Expenses before reductions | 1.79% | 1.81% | 1.86% | 1.88% | 1.71% A |
Expenses net of fee waivers, if any | 1.79% | 1.81% | 1.86% | 1.88% | 1.71% A |
Expenses net of all reductions | 1.79% | 1.81% | 1.85% | 1.88% | 1.71% A |
Net investment income (loss) | .51% | .01% | (.10)% | .69% | .55% A |
Supplemental Data | | | | |
Net assets, end of period (000 omitted) | $ 2,845 | $ 1,913 | $ 807 | $ 470 | $ 98 |
Portfolio turnover rate G | 57% | 53% | 97% | 138% | 97% |
A Annualized
B Total returns for periods of less than one year are not annualized.
C Total returns would have been lower if certain expenses had not been reduced during the applicable periods shown.
D Total returns do not include the effect of the contingent deferred sales charge.
E Calculated based on average shares outstanding during the period.
F Fees and expenses of any underlying Fidelity Central Funds are not included in the Fund's expense ratio. The Fund indirectly bears its proportionate share of the expenses of any underlying Fidelity Central Funds.
G Amount does not include the portfolio activity of any underlying Fidelity Central Funds.
H For the period February 5, 2008 (commencement of sale of shares) to June 30, 2008.
I Expense ratios reflect operating expenses of the class. Expenses before reductions do not reflect amounts reimbursed by the investment adviser or reductions from brokerage service arrangements or reductions from other expense offset arrangements and do not represent the amount paid by the class during periods when reimbursements or reductions occur. Expense ratios before reductions for start-up periods may not be representative of longer-term operating periods. Expenses net of fee waivers reflect expenses after reimbursement by the investment adviser but prior to reductions from brokerage service arrangements or other expense offset arrangements. Expenses net of all reductions represent the net expenses paid by the class.
J Amount represents less than $.01 per share.
See accompanying notes which are an integral part of the financial statements.
Annual Report
Financial Highlights - Mega Cap Stock
Years ended June 30, | 2012 | 2011 | 2010 | 2009 | 2008 |
Selected Per-Share Data | | | | |
Net asset value, beginning of period | $ 10.43 | $ 8.11 | $ 7.23 | $ 9.91 | $ 12.06 |
Income from Investment Operations | | | | | |
Net investment income (loss) B | .16 | .10 | .08 | .13 | .14 |
Net realized and unrealized gain (loss) | .64 | 2.29 | .93 | (2.67) | (1.60) |
Total from investment operations | .80 | 2.39 | 1.01 | (2.54) | (1.46) |
Distributions from net investment income | (.12) | (.07) | (.13) | (.12) | (.07) |
Distributions from net realized gain | - | - | - | (.02) | (.62) |
Total distributions | (.12) | (.07) | (.13) | (.14) | (.69) |
Net asset value, end of period | $ 11.11 | $ 10.43 | $ 8.11 | $ 7.23 | $ 9.91 |
Total Return A | 7.83% | 29.61% | 13.93% | (25.77)% | (12.73)% |
Ratios to Average Net Assets C, E | | | | |
Expenses before reductions | .76% | .79% | .81% | .79% | .75% |
Expenses net of fee waivers, if any | .76% | .79% | .80% | .78% | .74% |
Expenses net of all reductions | .75% | .78% | .79% | .78% | .74% |
Net investment income (loss) | 1.55% | 1.04% | .96% | 1.78% | 1.28% |
Supplemental Data | | | | |
Net assets, end of period (000 omitted) | $ 1,287,144 | $ 785,233 | $ 500,407 | $ 253,164 | $ 667,542 |
Portfolio turnover rate D | 57% | 53% | 97% | 138% | 97% |
A Total returns would have been lower if certain expenses had not been reduced during the applicable periods shown.
B Calculated based on average shares outstanding during the period.
C Fees and expenses of any underlying Fidelity Central Funds are not included in the Fund's expense ratio. The Fund indirectly bears its proportionate share of the expenses of any underlying Fidelity Central Funds.
D Amount does not include the portfolio activity of any underlying Fidelity Central Funds.
E Expense ratios reflect operating expenses of the class. Expenses before reductions do not reflect amounts reimbursed by the investment adviser or reductions from brokerage service arrangements or reductions from other expense offset arrangements and do not represent the amount paid by the class during periods when reimbursements or reductions occur. Expenses net of fee waivers reflect expenses after reimbursement by the investment adviser but prior to reductions from brokerage service arrangements or other expense offset arrangements. Expenses net of all reductions represent the net expenses paid by the class.
See accompanying notes which are an integral part of the financial statements.
Annual Report
Financial Highlights - Institutional Class
Years ended June 30, | 2012 | 2011 | 2010 | 2009 | 2008 G |
Selected Per-Share Data | | | | |
Net asset value, beginning of period | $ 10.40 | $ 8.09 | $ 7.22 | $ 9.91 | $ 10.61 |
Income from Investment Operations | | | | | |
Net investment income (loss) D | .16 | .10 | .08 | .13 | .07 |
Net realized and unrealized gain (loss) | .63 | 2.30 | .92 | (2.67) | (.77) |
Total from investment operations | .79 | 2.40 | 1.00 | (2.54) | (.70) |
Distributions from net investment income | (.11) | (.09) | (.13) | (.13) | - |
Distributions from net realized gain | - | - | - | (.02) | - |
Total distributions | (.11) | (.09) | (.13) | (.15) | - |
Net asset value, end of period | $ 11.08 | $ 10.40 | $ 8.09 | $ 7.22 | $ 9.91 |
Total Return B, C | 7.77% | 29.74% | 13.89% | (25.81)% | (6.60)% |
Ratios to Average Net Assets E, H | | | | |
Expenses before reductions | .78% | .79% | .88% | .77% | .70% A |
Expenses net of fee waivers, if any | .78% | .79% | .88% | .77% | .70% A |
Expenses net of all reductions | .77% | .78% | .87% | .77% | .70% A |
Net investment income (loss) | 1.53% | 1.04% | .88% | 1.79% | 1.57% A |
Supplemental Data | | | | |
Net assets, end of period (000 omitted) | $ 175,833 | $ 136,768 | $ 1,568 | $ 515 | $ 93 |
Portfolio turnover rate F | 57% | 53% | 97% | 138% | 97% |
A Annualized
B Total returns for periods of less than one year are not annualized.
C Total returns would have been lower if certain expenses had not been reduced during the applicable periods shown.
D Calculated based on average shares outstanding during the period.
E Fees and expenses of any underlying Fidelity Central Funds are not included in the Fund's expense ratio. The Fund indirectly bears its proportionate share of the expenses of any underlying Fidelity Central Funds.
F Amount does not include the portfolio activity of any underlying Fidelity Central Funds.
G For the period February 5, 2008 (commencement of sale of shares) to June 30, 2008.
H Expense ratios reflect operating expenses of the class. Expenses before reductions do not reflect amounts reimbursed by the investment adviser or reductions from brokerage service arrangements or reductions from other expense offset arrangements and do not represent the amount paid by the class during periods when reimbursements or reductions occur. Expense ratios before reductions for start-up periods may not be representative of longer-term operating periods. Expenses net of fee waivers reflect expenses after reimbursement by the investment adviser but prior to reductions from brokerage service arrangements or other expense offset arrangements. Expenses net of all reductions represent the net expenses paid by the class.
See accompanying notes which are an integral part of the financial statements.
Annual Report
Notes to Financial Statements
For the period ended June 30, 2012
1. Organization.
Fidelity® Mega Cap Stock Fund (the Fund) is a fund of Fidelity Hastings Street Trust (the Trust) and is authorized to issue an unlimited number of shares. The Trust is registered under the Investment Company Act of 1940, as amended (the 1940 Act), as an open-end management investment company organized as a Massachusetts business trust. The Fund offers Class A, Class T, Class C, Mega Cap Stock and Institutional Class shares, each of which, along with Class B shares, has equal rights as to assets and voting privileges. Effective after the close of business on September 1, 2010, Class B shares were closed to new accounts and additional purchases, except for exchanges and reinvestments. Each class has exclusive voting rights with respect to matters that affect that class. Class B shares will automatically convert to Class A shares after a holding period of seven years from the initial date of purchase. Investment income, realized and unrealized capital gains and losses, the common expenses of the Fund, and certain fund-level expense reductions, if any, are allocated on a pro-rata basis to each class based on the relative net assets of each class to the total net assets of the Fund. Each class differs with respect to transfer agent and distribution and service plan fees incurred. Certain expense reductions may also differ by class.
2. Investments in Fidelity Central Funds.
The Fund invests in Fidelity Central Funds, which are open-end investment companies available only to other investment companies and accounts managed by Fidelity Management & Research Company (FMR) and its affiliates. The Fund's Schedule of Investments lists each of the Fidelity Central Funds held as of period end, if any, as an investment of the Fund, but does not include the underlying holdings of each Fidelity Central Fund. As an Investing Fund, the Fund indirectly bears its proportionate share of the expenses of the underlying Fidelity Central Funds.
The Money Market Central Funds seek preservation of capital and current income and are managed by Fidelity Investments Money Management, Inc. (FIMM), an affiliate of FMR.
A complete unaudited list of holdings for each Fidelity Central Fund is available upon request or at the Securities and Exchange Commission (the SEC) web site at www.sec.gov. In addition, the financial statements of the Fidelity Central Funds, which are not covered by the Fund's Report of Independent Registered Public Accounting Firm, are available on the SEC web site or upon request.
3. Significant Accounting Policies.
The financial statements have been prepared in conformity with accounting principles generally accepted in the United States of America (GAAP), which require management to make certain estimates and assumptions at the date of the financial statements.
Annual Report
Notes to Financial Statements - continued
3. Significant Accounting Policies - continued
Actual results could differ from those estimates. Subsequent events, if any, through the date that the financial statements were issued have been evaluated in the preparation of the financial statements. The following summarizes the significant accounting policies of the Fund:
Security Valuation. Investments are valued as of 4:00 p.m. Eastern time on the last calendar day of the period. In accordance with valuation policies and procedures approved by the Board of Trustees (the Board), the Fund attempts to obtain prices from one or more third party pricing vendor or broker to value its investments. When current market prices, quotations or rates are not readily available or reliable, securities will be fair valued in good faith by the FMR Fair Value Committee (the Committee), in accordance with procedures adopted by the Fund's Board. Factors used in determining fair value vary by security type and may include market or security specific events. The frequency with which these procedures are used cannot be predicted and they may be utilized to a significant extent. The Committee oversees the Fund's valuation policies and procedures and is responsible for approving and reporting to the Board all fair value determinations.
The Fund categorizes the inputs to valuation techniques used to value its investments into a disclosure hierarchy consisting of three levels as shown below:
Level 1 - quoted prices in active markets for identical investments
Level 2 - other significant observable inputs (including quoted prices for similar investments, interest rates, prepayment speeds, etc.)
Level 3 - unobservable inputs (including the Fund's own assumptions based on the best information available)
Valuation techniques used to value the Fund's investments by major category are as follows:
Equity securities, including restricted securities, for which market quotations are readily available, are valued at the last reported sale price or official closing price as reported by a third party pricing vendor on the primary market or exchange on which they are traded and are categorized as Level 1 in the hierarchy. In the event there were no sales during the day or closing prices are not available, securities are valued at the last quoted bid price or may be valued using the last available price and are generally categorized as Level 2 in the hierarchy. For foreign equity securities, when significant market or security specific events arise, comparisons to the valuation of American Depositary Receipts (ADRs), futures contracts, Exchange-Traded Funds (ETFs) and certain indexes as well as quoted prices for similar securities are used and are categorized as Level 2 in the hierarchy. Utilizing these techniques may result in transfers between Level 1 and Level 2.
Annual Report
3. Significant Accounting Policies - continued
Security Valuation - continued
For restricted equity securities and private placements where observable inputs are limited, assumptions about market activity and risk are used and these securities are categorized as Level 3 in the hierarchy.
Investments in open-end mutual funds, including the Fidelity Central Funds, are valued at their closing net asset value each business day and are categorized as Level 1 in the hierarchy.
Changes in valuation techniques may result in transfers in or out of an assigned level within the disclosure hierarchy. The aggregate value of investments by input level, as of June 30, 2012, is included at the end of the Fund's Schedule of Investments.
Foreign Currency Translation. The Fund may use foreign currency contracts to facilitate transactions in foreign-denominated securities. Gains and losses from these transactions may arise from changes in the value of the foreign currency or if the counterparties do not perform under the contracts' terms.
Foreign-denominated assets, including investment securities, and liabilities are translated into U.S. dollars at the exchange rates at period end. Purchases and sales of investment securities, income and dividends received and expenses denominated in foreign currencies are translated into U.S. dollars at the exchange rate in effect on the transaction date.
The effects of exchange rate fluctuations on investments are included with the net realized and unrealized gain (loss) on investment securities. Other foreign currency transactions resulting in realized and unrealized gain (loss) are disclosed separately.
Investment Transactions and Income. For financial reporting purposes, the Fund's investment holdings and NAV include trades executed through the end of the last business day of the period. The NAV per share for processing shareholder transactions is calculated as of the close of business of the New York Stock Exchange (NYSE), normally 4:00 p.m. Eastern time and includes trades executed through the end of the prior business day. Gains and losses on securities sold are determined on the basis of identified cost and may include proceeds received from litigation. Dividend income is recorded on the ex-dividend date, except for certain dividends from foreign securities where the ex-dividend date may have passed, which are recorded as soon as the Fund is informed of the ex-dividend date. Non-cash dividends included in dividend income, if any, are recorded at the fair market value of the securities received. Distributions received on securities that represent a return of capital or capital gain are recorded as a reduction of cost of investments and/or as a realized gain. The Fund estimates the components of distributions received that may be considered return of capital distributions or capital
Annual Report
Notes to Financial Statements - continued
3. Significant Accounting Policies - continued
Investment Transactions and Income - continued
gain distributions. Interest income and distributions from the Fidelity Central Funds are accrued as earned. Interest income includes coupon interest and amortization of premium and accretion of discount on debt securities. Investment income is recorded net of foreign taxes withheld where recovery of such taxes is uncertain.
Expenses. Expenses directly attributable to a fund are charged to that fund. Expenses attributable to more than one fund are allocated among the respective funds on the basis of relative net assets or other appropriate methods. Expense estimates are accrued in the period to which they relate and adjustments are made when actual amounts are known.
Income Tax Information and Distributions to Shareholders. Each year, the Fund intends to qualify as a regulated investment company under Subchapter M of the Internal Revenue Code, including distributing substantially all of its taxable income and realized gains. As a result, no provision for income taxes is required. As of June 30, 2012, the Fund did not have any unrecognized tax benefits in the financial statements; nor is the Fund aware of any tax positions for which it is reasonably possible that the total amounts of unrecognized tax benefits will significantly change in the next twelve months. The Fund files a U.S. federal tax return, in addition to state and local tax returns as required. A fund's federal income tax returns are subject to examination by the Internal Revenue Service (IRS) for a period of three fiscal years after they are filed. State and local tax returns may be subject to examination for an additional fiscal year depending on the jurisdiction. Foreign taxes are provided for based on the Fund's understanding of the tax rules and rates that exist in the foreign markets in which it invests.
Distributions are declared and recorded on the ex-dividend date. Income dividends and capital gain distributions are declared separately for each class. Income and capital gain distributions are determined in accordance with income tax regulations, which may differ from GAAP.
Capital accounts within the financial statements are adjusted for permanent book-tax differences. These adjustments have no impact on net assets or the results of operations. Temporary book-tax differences will reverse in a subsequent period.
Book-tax differences are primarily due to foreign currency transactions, market discount, futures transactions, equity-debt classifications, capital loss carryforwards, and losses deferred due to wash sales.
Annual Report
3. Significant Accounting Policies - continued
Income Tax Information and Distributions to Shareholders - continued
The federal tax cost of investment securities and unrealized appreciation (depreciation) as of period end were as follows:
Gross unrealized appreciation | $ 145,345,483 |
Gross unrealized depreciation | (72,327,832) |
Net unrealized appreciation (depreciation) on securities and other investments | $ 73,017,651 |
| |
Tax Cost | $ 1,404,371,028 |
The tax-based components of distributable earnings as of period end were as follows:
Undistributed ordinary income | $ 10,989,705 |
Capital loss carryforward | $ (112,444,708) |
Net unrealized appreciation (depreciation) | $ 73,013,700 |
Capital loss carryforwards are only available to offset future capital gains of the Fund to the extent provided by regulations and may be limited. Under the Regulated Investment Company Modernization Act of 2010 (the Act), the Fund is permitted to carry forward capital losses incurred in taxable years beginning after December 22, 2010 for an unlimited period and such capital losses are required to be used prior to any losses that expire. Capital loss carryforwards were as follows:
Fiscal year of expiration | |
2017 | $ (3,091,486) |
2018 | (109,353,222) |
Total capital loss carry forward | $ (112,444,708) |
The tax character of distributions paid was as follows:
| June 30, 2012 | June 30, 2011 |
Ordinary Income | $ 11,753,098 | $ 4,840,262 |
New Accounting Pronouncement. In December 2011, the Financial Accounting Standards Board issued Accounting Standard Update No. 2011-11, Disclosures about Offsetting Assets and Liabilities. The update creates new disclosure requirements requiring entities to disclose both gross and net information for derivatives and other financial instruments that are either offset in the Statement of Assets and Liabilities or
Annual Report
Notes to Financial Statements - continued
3. Significant Accounting Policies - continued
New Accounting Pronouncement - continued
subject to an enforceable master netting arrangement or similar agreement. The disclosure requirements are effective for interim and annual reporting periods beginning on or after January 1, 2013. Management is currently evaluating the impact of the update's adoption on the Fund's financial statement disclosures.
4. Derivative Instruments.
Risk Exposures and the Use of Derivative Instruments. The Fund's investment objectives allow the Fund to enter into various types of derivative contracts, including futures contracts. Derivatives are investments whose value is derived from underlying assets, indices or reference rates and may be transacted on an exchange or over-the-counter (OTC). Derivatives may involve a future commitment to buy or sell a specified instrument based on specified terms, or to exchange future cash flows at periodic intervals based on a notional principal amount. The Fund used derivatives to increase returns and to manage exposure to certain risks as defined below. The success of any strategy involving derivatives depends on analysis of numerous economic factors, and if the strategies for investment do not work as intended, the Fund may not achieve its objectives.
The Fund's use of derivatives increased or decreased its exposure to the following risk:
Equity Risk | Equity risk relates to the fluctuations in the value of financial instruments as a result of changes in market prices (other than those arising from interest rate risk or foreign exchange risk), whether caused by factors specific to an individual investment, its issuer, or all factors affecting all instruments traded in a market or market segment. |
The Fund is also exposed to additional risks from investing in derivatives, such as liquidity risk and counterparty credit risk. Liquidity risk is the risk that the Fund will be unable to close out the derivative in the open market in a timely manner. Counterparty credit risk is the risk that the counterparty will not be able to fulfill its obligation to the Fund. Counterparty credit risk related to exchange-traded futures contracts is minimal because of the protection provided by the exchange on which they trade. Investing in derivatives may involve greater risks than investing in the underlying assets directly and, to varying degrees, involves risk of loss in excess of the initial investment, if any, collateral received and amounts recognized in the Statement of Assets and Liabilities. In addition, for futures contracts, there is the risk that the change in value of the derivative contract may not correspond to the change in value of the underlying instrument.
Annual Report
4. Derivative Instruments - continued
Futures Contracts. A futures contract is an agreement between two parties to buy or sell a specified underlying instrument for a fixed price at a specified future date. The Fund used futures contracts to manage its exposure to the stock market.
Upon entering into a futures contract, a fund is required to deposit either cash or securities (initial margin) with a clearing broker in an amount equal to a certain percentage of the face value of the contract. Futures contracts are marked-to-market daily and subsequent payments are made or received by a fund depending on the daily fluctuations in the value of the futures contracts and are recorded as unrealized appreciation or (depreciation). This receivable and/or payable is included in daily variation margin on futures contracts in the Statement of Assets and Liabilities. Realized gain or (loss) is recorded upon the expiration or closing of a futures contract.
Any open futures contracts at period end are shown in the Schedule of Investments under the caption "Futures Contracts." The underlying face amount at value reflects each contract's exposure to the underlying instrument at period end.
During the period the Fund recognized net realized gain (loss) of $142,240 related to its investment in futures contracts. This amount is included in the Statement of Operations.
5. Purchases and Sales of Investments.
Purchases and sales of securities, other than short-term securities, aggregated $1,133,217,548 and $662,913,700, respectively.
6. Fees and Other Transactions with Affiliates.
Management Fee. FMR and its affiliates provide the Fund with investment management related services for which the Fund pays a monthly management fee. The management fee is the sum of an individual fund fee rate that is based on an annual rate of .20% of the Fund's average net assets and an annualized group fee rate that averaged .26% during the period. The group fee rate is based upon the average net assets of all the mutual funds advised by FMR. The group fee rate decreases as assets under management increase and increases as assets under management decrease. For the period, the total annual management fee rate was .46% of the Fund's average net assets.
Distribution and Service Plan Fees. In accordance with Rule 12b-1 of the 1940 Act, the Fund has adopted separate Distribution and Service Plans for each class of shares. Certain classes pay Fidelity Distributors Corporation (FDC), an affiliate of FMR, separate Distribution and Service Fees, each of which is based on an annual percentage of each class' average net assets. In addition, FDC may pay financial intermediaries for selling shares of the Fund and providing shareholder support services. For the period,
Annual Report
Notes to Financial Statements - continued
6. Fees and Other Transactions with Affiliates - continued
Distribution and Service Plan Fees - continued
the Distribution and Service Fee rates, total fees and amounts retained by FDC were as follows:
| Distribution
Fee | Service
Fee | Total Fees | Retained
by FDC |
Class A | -% | .25% | $ 13,476 | $ 686 |
Class T | .25% | .25% | 9,514 | 2 |
Class B | .75% | .25% | 6,768 | 5,080 |
Class C | .75% | .25% | 27,357 | 7,297 |
| | | $ 57,115 | $ 13,065 |
Sales Load. FDC may receive a front-end sales charge of up to 5.75% for selling Class A shares and 3.50% for selling Class T shares, some of which is paid to financial intermediaries for selling shares of the Fund. Depending on the holding period, FDC may receive contingent deferred sales charges levied on Class A, Class T, Class B, and Class C redemptions. The deferred sales charges range from 5.00% to 1.00% for Class B shares, 1.00% for Class C shares, 1.00% for certain purchases of Class A shares and .25% for certain purchases of Class T shares.
For the period, sales charge amounts retained by FDC were as follows:
| Retained
by FDC |
Class A | $ 8,921 |
Class T | 1,792 |
Class B* | 918 |
Class C* | 377 |
| $ 12,008 |
* When Class B and Class C shares are initially sold, FDC pays commissions from its own resources to financial intermediaries through which the sales are made.
Transfer Agent Fees. Fidelity Investments Institutional Operations Company, Inc. (FIIOC), an affiliate of FMR, is the transfer, dividend disbursing and shareholder servicing agent for each class of the Fund. FIIOC receives account fees and asset-based fees that vary according to the account size and type of account of the shareholders of the respective classes of the Fund. FIIOC pays for typesetting, printing and mailing of
Annual Report
6. Fees and Other Transactions with Affiliates - continued
Transfer Agent Fees - continued
shareholder reports, except proxy statements. For the period, transfer agent fees for each class were as follows:
| Amount | % of
Average
Net Assets |
Class A | $ 14,015 | .26 |
Class T | 5,823 | .31 |
Class B | 2,029 | .30 |
Class C | 7,486 | .27 |
Mega Cap Stock | 2,433,166 | .24 |
Institutional Class | 379,293 | .26 |
| $ 2,841,812 | |
Accounting and Security Lending Fees. Fidelity Service Company, Inc. (FSC), an affiliate of FMR, maintains the Fund's accounting records. The accounting fee is based on the level of average net assets for each month. Under a separate contract, FSC administers the security lending program. The security lending fee is based on the number and duration of lending transactions.
Brokerage Commissions. The Fund placed a portion of its portfolio transactions with brokerage firms which are affiliates of the investment adviser. The commissions paid to these affiliated firms were $29,554 for the period.
Interfund Lending Program. Pursuant to an Exemptive Order issued by the SEC, the Fund, along with other registered investment companies having management contracts with FMR, may participate in an interfund lending program. This program provides an alternative credit facility allowing the funds to borrow from, or lend money to, other participating affiliated funds. At period end, there were no interfund loans outstanding. The Fund's activity in this program during the period for which loans were outstanding was as follows:
Borrower or Lender | Average Loan
Balance | Weighted Average
Interest Rate | Interest
Expense |
Borrower | $ 38,846,643 | .41% | $ 6,238 |
7. Committed Line of Credit.
The Fund participates with other funds managed by FMR or an affiliate in a $4.25 billion credit facility (the "line of credit") to be utilized for temporary or emergency purposes to fund shareholder redemptions or for other short-term liquidity purposes. The Fund has
Annual Report
Notes to Financial Statements - continued
7. Committed Line of Credit - continued
agreed to pay commitment fees on its pro-rata portion of the line of credit, which amounted to $2,931 and is reflected in Miscellaneous expenses on the Statement of Operations. During the period, there were no borrowings on this line of credit.
8. Security Lending.
The Fund lends portfolio securities through a lending agent from time to time in order to earn additional income. For equity securities, a lending agent is used and may loan securities to certain qualified borrowers, including Fidelity Capital Markets (FCM), a broker-dealer affiliated with the Fund. On the settlement date of the loan, the Fund receives collateral (in the form of U.S. Treasury obligations, letters of credit and/or cash) against the loaned securities and maintains collateral in an amount not less than 100% of the market value of the loaned securities during the period of the loan. The market value of the loaned securities is determined at the close of business of the Fund and any additional required collateral is delivered to the Fund on the next business day. If the borrower defaults on its obligation to return the securities loaned because of insolvency or other reasons, a fund could experience delays and costs in recovering the securities loaned or in gaining access to the collateral. Any cash collateral received is invested in the Fidelity Securities Lending Cash Central Fund. At period end, there were no security loans outstanding. Security lending income represents the income earned on investing cash collateral, less rebates paid to borrowers and any lending agent fees associated with the loan, plus any premium payments received for lending certain types of securities. Security lending income is presented in the Statement of Operations as a component of income from Fidelity Central Funds. Total security lending income during the period amounted to $147,642. During the period, there were no securities loaned to FCM.
9. Bank Borrowings.
The Fund is permitted to have bank borrowings for temporary or emergency purposes to fund shareholder redemptions or for other short-term liquidity requirements. The Fund has established borrowing arrangements with certain banks. The interest rate on the borrowings is the bank's base rate, as revised from time to time. The average loan balance during the period for which loans were outstanding amounted to $3,312,000. The weighted average interest rate was .58%. The interest expense amounted to $53 under the bank borrowing program. At period end, there were no bank borrowings outstanding.
10. Expense Reductions.
Many of the brokers with whom FMR places trades on behalf of the Fund provided services to the Fund in addition to trade execution. These services included payments of certain expenses on behalf of the Fund totaling $26,452 for the period.
Annual Report
11. Distributions to Shareholders.
Distributions to shareholders of each class were as follows:
Years ended June 30, | 2012 | 2011 |
From net investment income | | |
Class A | $ 41,978 | $ 15,699 |
Class T | 11,957 | 4,295 |
Class B | 701 | - |
Class C | 10,116 | - |
Mega Cap Stock | 10,229,962 | 4,094,618 |
Institutional Class | 1,458,384 | 725,650 |
Total | $ 11,753,098 | $ 4,840,262 |
12. Share Transactions.
Transactions for each class of shares were as follows:
| Shares | Dollars |
Years ended June 30, | 2012 | 2011 | 2012 | 2011 |
Class A | | | | |
Shares sold | 486,313 | 220,973 | $ 5,118,655 | $ 2,204,584 |
Reinvestment of distributions | 3,634 | 1,526 | 35,610 | 14,210 |
Shares redeemed | (120,131) | (97,950) | (1,250,294) | (951,110) |
Net increase (decrease) | 369,816 | 124,549 | $ 3,903,971 | $ 1,267,684 |
Class T | | | | |
Shares sold | 105,560 | 70,794 | $ 1,103,327 | $ 699,083 |
Reinvestment of distributions | 1,213 | 459 | 11,925 | 4,248 |
Shares redeemed | (61,297) | (42,060) | (633,953) | (396,340) |
Net increase (decrease) | 45,476 | 29,193 | $ 481,299 | $ 306,991 |
Class B | | | | |
Shares sold | 9,865 | 19,392 | $ 101,146 | $ 183,567 |
Reinvestment of distributions | 69 | - | 689 | - |
Shares redeemed | (20,058) | (28,265) | (199,056) | (272,700) |
Net increase (decrease) | (10,124) | (8,873) | $ (97,221) | $ (89,133) |
Class C | | | | |
Shares sold | 229,191 | 96,864 | $ 2,376,452 | $ 975,147 |
Reinvestment of distributions | 856 | - | 8,451 | - |
Shares redeemed | (155,763) | (11,544) | (1,568,860) | (114,846) |
Net increase (decrease) | 74,284 | 85,320 | $ 816,043 | $ 860,301 |
Annual Report
Notes to Financial Statements - continued
12. Share Transactions - continued
| Shares | Dollars |
Years ended June 30, | 2012 | 2011 | 2012 | 2011 |
Mega Cap Stock | | | | |
Shares sold | 74,953,852 | 34,124,104 | $ 795,313,856 | $ 350,713,479 |
Reinvestment of distributions | 965,264 | 418,751 | 9,476,451 | 3,910,800 |
Shares redeemed | (35,350,283) | (20,989,740) | (369,162,567) | (199,951,600) |
Net increase (decrease) | 40,568,833 | 13,553,115 | $ 435,627,740 | $ 154,672,679 |
Institutional Class | | | | |
Shares sold | 7,943,118 | 16,010,762 | $ 80,524,837 | $ 148,274,212 |
Reinvestment of distributions | 144,898 | 75,239 | 1,415,456 | 703,651 |
Shares redeemed | (5,373,433) | (3,126,457) | (54,303,944) | (32,666,752) |
Net increase (decrease) | 2,714,583 | 12,959,544 | $ 27,636,349 | $ 116,311,111 |
13. Other.
The Fund's organizational documents provide former and current trustees and officers with a limited indemnification against liabilities arising in connection with the performance of their duties to the Fund. In the normal course of business, the Fund may also enter into contracts that provide general indemnifications. The Fund's maximum exposure under these arrangements is unknown as this would be dependent on future claims that may be made against the Fund. The risk of material loss from such claims is considered remote.
Annual Report
To the Trustees of Fidelity Hastings Street Trust and the Shareholders of Fidelity Mega Cap Stock Fund:
In our opinion, the accompanying statement of assets and liabilities, including the schedule of investments, and the related statements of operations and of changes in net assets and the financial highlights present fairly, in all material respects, the financial position of Fidelity Mega Cap Stock Fund (a fund of Fidelity Hastings Street Trust) at June 30, 2012, the results of its operations for the year then ended, the changes in its net assets for each of the two years in the period then ended and the financial highlights for each of the periods indicated, in conformity with accounting principles generally accepted in the United States of America. These financial statements and financial highlights (hereafter referred to as "financial statements") are the responsibility of the Fidelity Mega Cap Stock Fund's management. Our responsibility is to express an opinion on these financial statements based on our audits. We conducted our audits of these financial statements in accordance with the standards of the Public Company Accounting Oversight Board (United States). Those standards require that we plan and perform the audit to obtain reasonable assurance about whether the financial statements are free of material misstatement. An audit includes examining, on a test basis, evidence supporting the amounts and disclosures in the financial statements, assessing the accounting principles used and significant estimates made by management, and evaluating the overall financial statement presentation. We believe that our audits, which included confirmation of securities at June 30, 2012 by correspondence with the custodian and brokers, provide a reasonable basis for our opinion.
/s/ PricewaterhouseCoopers LLP
PricewaterhouseCoopers LLP
Boston, Massachusetts
August 10, 2012
Annual Report
The Trustees, Members of the Advisory Board, and executive officers of the trust and fund, as applicable, are listed below. The Board of Trustees governs the fund and is responsible for protecting the interests of shareholders. The Trustees are experienced executives who meet periodically throughout the year to oversee the fund's activities, review contractual arrangements with companies that provide services to the fund, oversee management of the risks associated with such activities and contractual arrangements, and review the fund's performance. Except for James C. Curvey, each of the Trustees oversees 228 funds advised by FMR or an affiliate. Mr. Curvey oversees 435 funds advised by FMR or an affiliate.
The Trustees hold office without limit in time except that (a) any Trustee may resign; (b) any Trustee may be removed by written instrument, signed by at least two-thirds of the number of Trustees prior to such removal; (c) any Trustee who requests to be retired or who has become incapacitated by illness or injury may be retired by written instrument signed by a majority of the other Trustees; and (d) any Trustee may be removed at any special meeting of shareholders by a two-thirds vote of the outstanding voting securities of the trust. Each Trustee who is not an interested person (as defined in the 1940 Act) (Independent Trustee), shall retire not later than the last day of the calendar year in which his or her 75th birthday occurs. The Independent Trustees may waive this mandatory retirement age policy with respect to individual Trustees. The executive officers and Advisory Board Members hold office without limit in time, except that any officer and Advisory Board Member may resign or may be removed by a vote of a majority of the Trustees at any regular meeting or any special meeting of the Trustees. Except as indicated, each individual has held the office shown or other offices in the same company for the past five years.
Experience, Skills, Attributes, and Qualifications of the Fund's Trustees. The Governance and Nominating Committee has adopted a statement of policy that describes the experience, qualifications, attributes, and skills that are necessary and desirable for potential Independent Trustee candidates (Statement of Policy). The Board believes that each Trustee satisfied at the time he or she was initially elected or appointed a Trustee, and continues to satisfy, the standards contemplated by the Statement of Policy. The Governance and Nominating Committee also engages professional search firms to help identify potential Independent Trustee candidates who have the experience, qualifications, attributes, and skills consistent with the Statement of Policy. From time to time, additional criteria based on the composition and skills of the current Independent Trustees, as well as experience or skills that may be appropriate in light of future changes to board composition, business conditions, and regulatory or other developments, have also been considered by the professional search firms and the Governance and Nominating Committee. In addition, the Board takes into account the Trustees' commitment and participation in Board and committee meetings, as well as their leadership of standing and ad hoc committees throughout their tenure.
In determining that a particular Trustee was and continues to be qualified to serve as a Trustee, the Board has considered a variety of criteria, none of which, in isolation, was controlling. The Board believes that, collectively, the Trustees have balanced and diverse experience, qualifications, attributes, and skills, which allow the Board to operate effectively in governing the fund and protecting the interests of shareholders. Information about the specific experience, skills, attributes, and qualifications of each Trustee, which in each case led to the Board's conclusion that the Trustee should serve (or continue to serve) as a trustee of the fund, is provided below.
Annual Report
Board Structure and Oversight Function. James C. Curvey is an interested person (as defined in the 1940 Act) and currently serves as Chairman. The Trustees have determined that an interested Chairman is appropriate and benefits shareholders because an interested Chairman has a personal and professional stake in the quality and continuity of services provided to the fund. Independent Trustees exercise their informed business judgment to appoint an individual of their choosing to serve as Chairman, regardless of whether the Trustee happens to be independent or a member of management. The Independent Trustees have determined that they can act independently and effectively without having an Independent Trustee serve as Chairman and that a key structural component for assuring that they are in a position to do so is for the Independent Trustees to constitute a substantial majority for the Board. The Independent Trustees also regularly meet in executive session. Ned C. Lautenbach serves as Chairman of the Independent Trustees and as such (i) acts as a liaison between the Independent Trustees and management with respect to matters important to the Independent Trustees and (ii) with management prepares agendas for Board meetings.
Fidelity funds are overseen by different Boards of Trustees. The fund's Board oversees Fidelity's equity and high income funds and another Board oversees Fidelity's investment-grade bond, money market, and asset allocation funds. The asset allocation funds may invest in Fidelity funds overseen by the fund's Board. The use of separate Boards, each with its own committee structure, allows the Trustees of each group of Fidelity funds to focus on the unique issues of the funds they oversee, including common research, investment, and operational issues. On occasion, the separate Boards establish joint committees to address issues of overlapping consequences for the Fidelity funds overseen by each Board.
The Trustees operate using a system of committees to facilitate the timely and efficient consideration of all matters of importance to the Trustees, the fund, and fund shareholders and to facilitate compliance with legal and regulatory requirements and oversight of the fund's activities and associated risks. The Board, acting through its committees, has charged FMR and its affiliates with (i) identifying events or circumstances the occurrence of which could have demonstrably adverse effects on the fund's business and/or reputation; (ii) implementing processes and controls to lessen the possibility that such events or circumstances occur or to mitigate the effects of such events or circumstances if they do occur; and (iii) creating and maintaining a system designed to evaluate continuously business and market conditions in order to facilitate the identification and implementation processes described in (i) and (ii) above. Because the day-to-day operations and activities of the fund are carried out by or through FMR, its affiliates and other service providers, the fund's exposure to risks is mitigated but not eliminated by the processes overseen by the Trustees. While each of the Board's committees has responsibility for overseeing different aspects of the fund's activities, oversight is exercised primarily through the Operations, Audit, and Compliance Committees. In addition, the Independent Trustees have worked with FMR to enhance the Board's oversight of investment and financial risks, legal and regulatory risks, technology risks, and operational risks, including the development of additional risk reporting to the Board. For example, a working group comprised of Independent Trustees and FMR has worked and continues to work to review the Fidelity funds' valuation-related activities, reporting and risk management. Appropriate personnel, including but not limited to the fund's Chief Compliance Officer (CCO), FMR's internal auditor, the independent accountants, the fund's Treasurer and portfolio management personnel, make periodic reports to the Board's committees, as appropriate, including an annual review of FMR's risk management program for the Fidelity funds. The responsibilities of each standing committee, including their oversight responsibilities, are described further under "Standing Committees of the Fund's Trustees."
Annual Report
Trustees and Officers - continued
The fund's Statement of Additional Information (SAI) includes more information about the Trustees. To request a free copy, call Fidelity at 1-877-208-0098.
Interested Trustees*:
Correspondence intended for each Trustee who is an interested person may be sent to Fidelity Investments, 82 Devonshire Street, Boston, Massachusetts 02109.
Name, Age; Principal Occupations and Other Relevant Experience+ |
James C. Curvey (77) |
| Year of Election or Appointment: 2007 Mr. Curvey is Trustee and Chairman of the Board of Trustees of certain Trusts. Mr. Curvey also serves as Trustee (2007-present) of other investment companies advised by FMR. Mr. Curvey is a Director of Fidelity Investments Money Management, Inc. (2009-present), Director of Fidelity Research & Analysis Co. (2009-present) and Director of FMR and FMR Co., Inc. (2007-present). Mr. Curvey is also Vice Chairman (2007-present) and Director of FMR LLC. In addition, Mr. Curvey serves as an Overseer for the Boston Symphony Orchestra and a member of the Trustees of Villanova University. Previously, Mr. Curvey was the Vice Chairman (2006-2007) and Director (2000-2007) of FMR Corp. |
Ronald P. O'Hanley (55) |
| Year of Election or Appointment: 2011 Mr. O'Hanley is Director of FMR Co., Inc. (2010-present), Director of Fidelity Investments Money Management, Inc. (2010-present), Director of Fidelity Research & Analysis Company (2010-present), President of Fidelity Asset Management and Corporate Services and a member of Fidelity's Executive Committee (2010-present). Previously, Mr. O'Hanley served as President and Chief Executive Officer of BNY Mellon Asset Management (2007-2010). Mr. O'Hanley also served as Vice Chairman of Bank New York Mellon Corp. and a member of that firm's Executive Committee. Prior to the 2007 merger of The Bank of New York and Mellon Financial Corporation, he was Vice Chairman of Mellon Financial Corporation and President and Chief Executive Officer of Mellon Asset Management. He joined Mellon in February 1997. Mr. O'Hanley currently serves as Chairman of the Boston Public Library Foundation Board of Directors and sits on the Board of Directors of Beth Israel Deaconess Medical Center, the Board of Trustees of the Marine Biological Laboratory and the Advisory Board of the Maxwell School of Citizenship and Public Administration at Syracuse University. Mr. O'Hanley also chairs the Council on Asset Management for the Financial Services Roundtable and is a member of the Board of Directors of Institutional Investor's U.S. Institute. |
* Trustees have been determined to be "Interested Trustees" by virtue of, among other things, their affiliation with the trust or various entities under common control with FMR.
+ The information above includes each Trustee's principal occupation during the last five years and other information relating to the experience, attributes, and skills relevant to each Trustee's qualifications to serve as a Trustee, which led to the conclusion that each Trustee should serve as a Trustee for the fund.
Annual Report
Trustees and Officers - continued
Independent Trustees:
Correspondence intended for each Independent Trustee (that is, the Trustees other than the Interested Trustees) may be sent to Fidelity Investments, P.O. Box 55235, Boston, Massachusetts 02205-5235.
Name, Age; Principal Occupations and Other Relevant Experience+ |
Dennis J. Dirks (64) |
| Year of Election or Appointment: 2005 Prior to his retirement in May 2003, Mr. Dirks was Chief Operating Officer and a member of the Board of The Depository Trust & Clearing Corporation (DTCC). He also served as President, Chief Operating Officer, and Board member of The Depository Trust Company (DTC) and President and Board member of the National Securities Clearing Corporation (NSCC). In addition, Mr. Dirks served as Chief Executive Officer and Board member of the Government Securities Clearing Corporation, Chief Executive Officer and Board member of the Mortgage-Backed Securities Clearing Corporation, as a Trustee and a member of the Finance Committee of Manhattan College (2005-2008), and as a Trustee and a member of the Finance Committee of AHRC of Nassau County (2006-2008). Mr. Dirks is a member of the Independent Directors Council (IDC) Governing Council (2010-present) and Board of Directors for The Brookville Center for Children's Services, Inc. (2009-present). |
Alan J. Lacy (58) |
| Year of Election or Appointment: 2008 Mr. Lacy serves as Senior Adviser (2007-present) of Oak Hill Capital Partners, L.P. (private equity). Mr. Lacy also served as Chief Executive Officer (2000-2005) and Vice Chairman (2005-2006) of Sears Holdings Corporation and Sears, Roebuck and Co. (retail). In addition, Mr. Lacy serves as a member of the Board of Directors of Dave & Buster's, Inc. (restaurant and entertainment complexes, 2010-present), The Hillman Companies, Inc. (hardware wholesalers, 2010-present), and Bristol-Myers Squibb Company (global pharmaceuticals, 2007-present). Mr. Lacy is a member of the Board of Trustees of The National Parks Conservation Association (2006-present). Previously, Mr. Lacy served as Chairman of the Board of Trustees of the National Parks Conservation Association (2008-2011) and as a member of the Board of Directors for the Western Union Company (global money transfer, 2006-2011). |
Ned C. Lautenbach (68) |
| Year of Election or Appointment: 2000 Mr. Lautenbach is Chairman of the Independent Trustees of the Equity and High Income Funds (2006-present). Mr. Lautenbach currently serves as the Lead Director of the Eaton Corporation Board of Directors (diversified industrial, 1997-present). Mr. Lautenbach is also a member of the Board of Directors of the Philharmonic Center for the Arts in Naples, Florida (1999-present); a member of the Board of Trustees of Fairfield University (2005-present); and a member of the Council on Foreign Relations (1994-present). Previously, Mr. Lautenbach was a Partner/Advisory Partner at Clayton, Dubilier & Rice, LLC (private equity investment, 1998-2010), as well as a Director of Sony Corporation (2006-2007). |
Joseph Mauriello (67) |
| Year of Election or Appointment: 2008 Prior to his retirement in January 2006, Mr. Mauriello served in numerous senior management positions including Deputy Chairman and Chief Operating Officer (2004-2005), and Vice Chairman of Financial Services (2002-2004) of KPMG LLP US (professional services, 1965-2005). Mr. Mauriello currently serves as a member of the Board of Directors of XL Group plc. (global insurance and re-insurance, 2006-present). Previously, Mr. Mauriello served as a Director of the Hamilton Funds of the Bank of New York (2006-2007) and Arcadia Resources Inc. (health care services and products, 2007-2012). |
Robert W. Selander (61) |
| Year of Election or Appointment: 2011 Previously, Mr. Selander served as a Member of the Advisory Board of Fidelity's Equity and High Income Funds (2011), Executive Vice Chairman (2010), Chief Executive Officer (2009-2010), and President and Chief Executive Officer (1997-2009) of Mastercard, Inc. |
Cornelia M. Small (67) |
| Year of Election or Appointment: 2005 Ms. Small is a member of the Board of Directors of the Teagle Foundation (2009-present). Ms. Small is also a member of the Investment Committee, and Chair (2008-present) and a member of the Board of Trustees of Smith College. In addition, Ms. Small serves on the Investment Committee of the Berkshire Taconic Community Foundation (2008-present). Previously, Ms. Small served as Chairperson of the Investment Committee (2002-2008) of Smith College. In addition, Ms. Small served as Chief Investment Officer, Director of Global Equity Investments, and a member of the Board of Directors of Scudder, Stevens & Clark and Scudder Kemper Investments. |
William S. Stavropoulos (73) |
| Year of Election or Appointment: 2001 Mr. Stavropoulos is Vice Chairman of the Independent Trustees of the Equity and High Income Funds (2006-present). Mr. Stavropoulos serves as President and Founder of the Michigan Baseball Foundation, the Great Lakes Loons (2007-present). Mr. Stavropoulos is Chairman Emeritus of the Board of Directors of The Dow Chemical Company, where he previously served in numerous senior management positions, including President, CEO (1995-2000; 2002-2004), Chairman of the Executive Committee (2000-2006), and as a member of the Board of Directors (1990-2006). Currently, Mr. Stavropoulos is Chairman of Univar (global distributor of commodity and specialty chemicals, 2010-present), a Director of Teradata Corporation (data warehousing and technology solutions, 2008-present), Chemical Financial Corporation, Maersk Inc. (industrial conglomerate), Tyco International, Inc. (multinational manufacturing and services, 2007-present), and a member of the Advisory Board for Metalmark Capital (private equity investment, 2005-present). Mr. Stavropoulos is a special advisor to Clayton, Dubilier & Rice, LLC (private equity investment). In addition, Mr. Stavropoulos is a member of the University of Notre Dame Advisory Council for the College of Science. |
David M. Thomas (63) |
| Year of Election or Appointment: 2008 Previously, Mr. Thomas served as Executive Chairman (2005-2006) and Chairman and Chief Executive Officer (2000-2005) of IMS Health, Inc. (pharmaceutical and healthcare information solutions). In addition, Mr. Thomas serves as a member of the Board of Directors of Fortune Brands, Inc. (consumer products), and Interpublic Group of Companies, Inc. (marketing communication, 2004-present). |
Michael E. Wiley (61) |
| Year of Election or Appointment: 2008 Mr. Wiley also serves as a Director of Asia Pacific Exploration Consolidated (international oil and gas exploration and production, 2008-present). Mr. Wiley serves as a Director of Tesoro Corporation (independent oil refiner and marketer, 2005-present), and a Director of Bill Barrett Corporation (exploration and production, 2005-present). In addition, Mr. Wiley also serves as a Director of Post Oak Bank (privately-held bank, 2004-present). Previously, Mr. Wiley served as a member of the Board of Trustees of the University of Tulsa (2000-2006; 2007-2010), as a Senior Energy Advisor of Katzenbach Partners, LLC (consulting, 2006-2007), as an Advisory Director of Riverstone Holdings (private investment), Chairman, President, and CEO of Baker Hughes, Inc. (oilfield services, 2000-2004), and as Director of Spinnaker Exploration Company (exploration and production, 2001-2005). |
Annual Report
+ The information above includes each Trustee's principal occupation during the last five years and other information relating to the experience, attributes, and skills relevant to each Trustee's qualifications to serve as a Trustee, which led to the conclusion that each Trustee should serve as a Trustee for the fund.
Advisory Board Members and Executive Officers:
Correspondence intended for each executive officer, Edward C. Johnson 3d, Peter S. Lynch, David A. Rosow, and Garnett A. Smith may be sent to Fidelity Investments, 82 Devonshire Street, Boston, Massachusetts 02109.
Name, Age; Principal Occupation |
Edward C. Johnson 3d (82) |
| Year of Election or Appointment: 2011 Member of the Advisory Board of Fidelity's Equity and High Income Funds. Mr. Johnson serves as Chief Executive Officer, Chairman, and a Director of FMR LLC, and also serves as Chairman and Director of FIL Limited. Previously, Mr. Johnson served as a Trustee and Chairman of the Board of certain Fidelity Trusts, Chairman and a Director of FMR, Chairman and a Director of FMR Co., Inc., and President of FMR LLC (2006-2007). |
Peter S. Lynch (68) |
| Year of Election or Appointment: 2003 Member of the Advisory Board of Fidelity's Equity and High Income Funds. Mr. Lynch is Vice Chairman and a Director of FMR and FMR Co., Inc. In addition, Mr. Lynch serves as a Trustee of Boston College and as the Chairman of the Inner-City Scholarship Fund. Previously, Mr. Lynch served on the Special Olympics International Board of Directors (1997-2006). |
David A. Rosow (69) |
| Year of Election or Appointment: 2012 Member of the Advisory Board of Fidelity's Equity and High Income Funds. Chairman and Chief Executive Officer of International Golf Group, Inc. (golf course development, 1990-present). Previously, Mr. Rosow served as Chairman and Chief Executive Officer of Rosow & Company, Inc. (private investment company, 1989-2011), a Lead Director of Hudson United Bancorp (2001-2006) and as a Director of TD Banknorth (1996-2006). In addition, Mr. Rosow is a member (2008-present) and President (2009-present) of the Town Council of Palm Beach, Florida. |
Garnett A. Smith (64) |
| Year of Election or Appointment: 2012 Member of the Advisory Board of Fidelity's Equity and High Income Funds. Prior to Mr. Smith's retirement, he served as Chairman and Chief Executive Officer of Inbrand Corp. (manufacturer of personal absorbent products, 1990-1997). He also served as President (1986-1990) of Inbrand Corp. Prior to his employment with Inbrand Corp., he was employed by a retail fabric chain and North Carolina National Bank. In addition, Mr. Smith is a board member of the Jackson Hole Land Trust (2009-present). |
Kenneth B. Robins (42) |
| Year of Election or Appointment: 2008 President and Treasurer of Fidelity's Equity and High Income Funds. Mr. Robins also serves as President and Treasurer (2010-present) and Assistant Treasurer (2009-present) of other Fidelity funds and is an employee of Fidelity Investments (2004-present). Previously, Mr. Robins served as Deputy Treasurer of the Fidelity funds (2005-2008) and Treasurer and Chief Financial Officer of The North Carolina Capital Management Trust: Cash and Term Portfolios (2006-2008). |
Bruce T. Herring (46) |
| Year of Election or Appointment: 2006 Vice President of certain Equity Funds. Mr. Herring also serves as President of Fidelity Research & Analysis Company (2010-present), Chief Investment Officer and Director of Fidelity Management & Research (U.K.) Inc. (2010-present) and Group Chief Investment Officer of FMR. Previously, Mr. Herring served as Vice President (2005-2006) and Senior Vice President (2006-2007) of Fidelity Management & Research Company, Vice President of FMR Co., Inc. (2001-2007) and as a portfolio manager for Fidelity U.S. Equity Funds. |
Brian B. Hogan (47) |
| Year of Election or Appointment: 2009 Vice President of Equity and High Income Funds. Mr. Hogan also serves as President of FMR's Equity Division (2009-present). Previously, Mr. Hogan served as Senior Vice President, Equity Research of FMR (2006-2009) and as a portfolio manager. |
Scott C. Goebel (44) |
| Year of Election or Appointment: 2008 Secretary and Chief Legal Officer (CLO) of the Fidelity funds. Mr. Goebel also serves as Secretary of Fidelity Investments Money Management, Inc. (FIMM) (2010-present) and Fidelity Research and Analysis Company (FRAC) (2010-present); Secretary and CLO of The North Carolina Capital Management Trust: Cash and Term Portfolios (2008-present); General Counsel, Secretary, and Senior Vice President of FMR (2008-present) and FMR Co., Inc. (2008-present); employed by FMR LLC or an affiliate (2001-present); Chief Legal Officer of Fidelity Management & Research (Hong Kong) Limited (2008-present) and Assistant Secretary of Fidelity Management & Research (Japan) Inc. (2008-present), and Fidelity Management & Research (U.K.) Inc. (2008-present). Previously, Mr. Goebel served as Assistant Secretary of FIMM (2008-2010), FRAC (2008-2010), and the Funds (2007-2008) and as Vice President and Secretary of Fidelity Distributors Corporation (FDC) (2005-2007). |
William C. Coffey (43) |
| Year of Election or Appointment: 2009 Assistant Secretary of Fidelity's Equity and High Income Funds. Mr. Coffey also serves as Senior Vice President and Deputy General Counsel of FMR LLC (2010-present), and is an employee of Fidelity Investments. Previously, Mr. Coffey served as Vice President and Associate General Counsel of FMR LLC (2005-2009). |
Elizabeth Paige Baumann (44) |
| Year of Election or Appointment: 2012 Anti-Money Laundering (AML) Officer of the Fidelity funds. Ms. Baumann also serves as AML Officer of The North Carolina Capital Management Trust: Cash and Term Portfolios (2012-present), Chief AML Officer of FMR LLC (2012-present), and is an employee of Fidelity Investments. Previously, Ms. Baumann served as Vice President and Deputy Anti-Money Laundering Officer (2007-2012). |
Christine Reynolds (53) |
| Year of Election or Appointment: 2008 Chief Financial Officer of the Fidelity funds. Ms. Reynolds became President of Fidelity Pricing and Cash Management Services (FPCMS) in August 2008. Ms. Reynolds served as Chief Operating Officer of FPCMS (2007-2008). Previously, Ms. Reynolds served as President, Treasurer, and Anti-Money Laundering officer of the Fidelity funds (2004-2007). |
Joseph A. Hanlon (44) |
| Year of Election or Appointment: 2012 Chief Compliance Officer of Fidelity's Equity and High Income Funds. Mr. Hanlon serves as Compliance Officer of FMR, FMR Co., Inc., Fidelity Investments Money Management, Inc. (FIMM), Fidelity Research and Analysis Company (FRAC), Fidelity Management & Research (Japan) Inc., Fidelity Management & Research (U.K.) Inc., Fidelity Management & Research (Hong Kong), and Strategic Advisers, Inc. (2009-present), as Senior Vice President of the Fidelity Asset Management Division (2009-present), and is an employee of Fidelity Investments. |
Joseph F. Zambello (55) |
| Year of Election or Appointment: 2011 Deputy Treasurer of the Fidelity funds. Mr. Zambello is an employee of Fidelity Investments. Previously, Mr. Zambello served as Vice President of FMR's Program Management Group (2009-2011) and Vice President of the Transfer Agent Oversight Group (2005-2009). |
Adrien E. Deberghes (44) |
| Year of Election or Appointment: 2008 Deputy Treasurer of Fidelity's Equity and High Income Funds. Mr. Deberghes also serves as Vice President (2011-present) and Assistant Treasurer (2010-present) of other Fidelity funds, and is an employee of Fidelity Investments (2008-present). Previously, Mr. Deberghes served as Senior Vice President of Mutual Fund Administration at State Street Corporation (2007-2008), Senior Director of Mutual Fund Administration at Investors Bank & Trust (2005-2007), and Director of Finance for Dunkin' Brands (2000-2005). |
Stephanie J. Dorsey (43) |
| Year of Election or Appointment: 2010 Assistant Treasurer of Fidelity's Equity and High Income Funds. Ms. Dorsey also serves as Deputy Treasurer of other Fidelity funds (2008-present) and is an employee of Fidelity Investments (2008-present). Previously, Ms. Dorsey served as Treasurer (2004-2008) of the JPMorgan Mutual Funds and Vice President (2004-2008) of JPMorgan Chase Bank. |
John R. Hebble (54) |
| Year of Election or Appointment: 2009 Assistant Treasurer of Fidelity's Equity and High Income Funds. Mr. Hebble also serves as President (2011-present), Treasurer, and Chief Financial Officer of The North Carolina Capital Management Trust: Cash and Term Portfolios (2008-present), President and Treasurer of other Fidelity funds (2008-present) and is an employee of Fidelity Investments. |
Gary W. Ryan (53) |
| Year of Election or Appointment: 2005 Assistant Treasurer of the Fidelity funds. Mr. Ryan is an employee of Fidelity Investments. Previously, Mr. Ryan served as Vice President of Fund Reporting in Fidelity Pricing and Cash Management Services (FPCMS) (1999-2005). |
Jonathan Davis (44) |
| Year of Election or Appointment: 2010 Assistant Treasurer of the Fidelity funds. Mr. Davis is also Assistant Treasurer of Fidelity Rutland Square Trust II and Fidelity Commonwealth Trust II. Mr. Davis is an employee of Fidelity Investments. Previously, Mr. Davis served as Vice President and Associate General Counsel of FMR LLC (2003-2010). |
Annual Report
Class A, Class T, Class B and Class C designate 100% of the dividends distributed during the fiscal year as qualifying for the dividends-received deduction for corporate shareholders.
Class A, Class T, Class B and Class C designate 100% of the dividends distributed during the fiscal year as amounts which may be taken into account as a dividend for the purposes of the maximum rate under section 1(h)(11) of the Internal Revenue Code.
The fund will notify shareholders in January 2013 of amounts for use in preparing 2012 income tax returns.
Annual Report
Investment Adviser
Fidelity Management & Research Company
Boston, MA
Investment Sub-Advisers
FMR Co., Inc.
Fidelity Management & Research
(U.K.) Inc.
Fidelity Management & Research
(Hong Kong) Limited
Fidelity Management & Research
(Japan) Inc.
General Distributor
Fidelity Distributors Corporation
Smithfield, RI
Transfer and Service Agents
Fidelity Investments Institutional Operations Company, Inc.
Boston, MA
Fidelity Service Company, Inc.
Boston, MA
Custodian
JPMorgan Chase Bank
New York, NY
AGII-UANN-0812
1.855226.104
(Fidelity Investment logo)(registered trademark)
(Fidelity Investment logo)(registered trademark)
Fidelity Advisor®
Mega Cap Stock
Fund - Institutional Class
Annual Report
June 30, 2012
(Fidelity Cover Art)
Institutional Class
is a class of Fidelity®
Mega Cap Stock Fund
Contents
Performance | (Click Here) | How the fund has done over time. |
Management's Discussion of Fund Performance | (Click Here) | The Portfolio Manager's review of fund performance and strategy. |
Shareholder Expense Example | (Click Here) | An example of shareholder expenses. |
Investment Changes | (Click Here) | A summary of major shifts in the fund's investments over the past six months. |
Investments | (Click Here) | A complete list of the fund's investments with their market values. |
Financial Statements | (Click Here) | Statements of assets and liabilities, operations, and changes in net assets, as well as financial highlights. |
Notes | (Click Here) | Notes to the financial statements. |
Report of Independent Registered Public Accounting Firm | (Click Here) | |
Trustees and Officers | (Click Here) | |
Distributions | (Click Here) | |
To view a fund's proxy voting guidelines and proxy voting record for the 12-month period ended June 30, visit http://www.fidelity.com/proxyvotingresults or visit the Securities and Exchange Commission's (SEC) web site at http://www.sec.gov. You may also call 1-877-208-0098 to request a free copy of the proxy voting guidelines.
Standard & Poor's, S&P and S&P 500 are registered service marks of The McGraw-Hill Companies, Inc. and have been licensed for use by Fidelity Distributors Corporation.
Other third party marks appearing herein are the property of their respective owners.
All other marks appearing herein are registered or unregistered trademarks or service marks of FMR LLC or an affiliated company. © 2012 FMR LLC. All rights reserved.
This report and the financial statements contained herein are submitted for the general information of the shareholders of the fund. This report is not authorized for distribution to prospective investors in the fund unless preceded or accompanied by an effective prospectus.
A fund files its complete schedule of portfolio holdings with the SEC for the first and third quarters of each fiscal year on Form N-Q. Forms N-Q are available on the SEC's web site at http://www.sec.gov. A fund's Forms N-Q may be reviewed and copied at the SEC's Public Reference Room in Washington, DC. Information regarding the operation of the SEC's Public Reference Room may be obtained by calling 1-800-SEC-0330. For a complete list of a fund's portfolio holdings, view the most recent holdings listing, semiannual report, or annual report on Fidelity's web site at http://www.fidelity.com, http://www.advisor.fidelity.com, or http://www.401k.com, as applicable.
NOT FDIC INSURED • MAY LOSE VALUE • NO BANK GUARANTEE
Neither the fund nor Fidelity Distributors Corporation is a bank.
Annual Report
Average annual total return reflects the change in the value of an investment, assuming reinvestment of the class' distributions from dividend income and capital gains (the profits earned upon the sale of securities that have grown in value, if any) and assuming a constant rate of performance each year. The $10,000 table and the fund's returns do not reflect the deduction of taxes that a shareholder would pay on fund distributions or the redemption of fund shares. During periods of reimbursement by Fidelity, a fund's total return will be greater than it would be had the reimbursement not occurred. How a fund did yesterday is no guarantee of how it will do tomorrow.
Average Annual Total Returns
Periods ended June 30, 2012 | Past 1
year | Past 5
years | Past 10
Years |
Institutional Class A, B | 7.77% | 0.61% | 5.47% |
A The initial offering of Institutional Class shares took place on February 5, 2008. Returns prior to February 5, 2008, are those of Fidelity® Mega Cap Stock Fund, the original class of the fund.
B Prior to December 1, 2007, the fund operated under certain different investment policies. The fund's historical performance may not represent its current investment policies.
$10,000 Over 10 Years
Let's say hypothetically that $10,000 was invested in Fidelity Advisor® Mega Cap Stock Fund - Institutional Class on June 30, 2002. The chart shows how the value of your investment would have changed, and also shows how the S&P 500�� Index performed over the same period. The initial offering of Institutional Class took place on February 5, 2008. See above for additional information regarding the performance of Institutional Class.
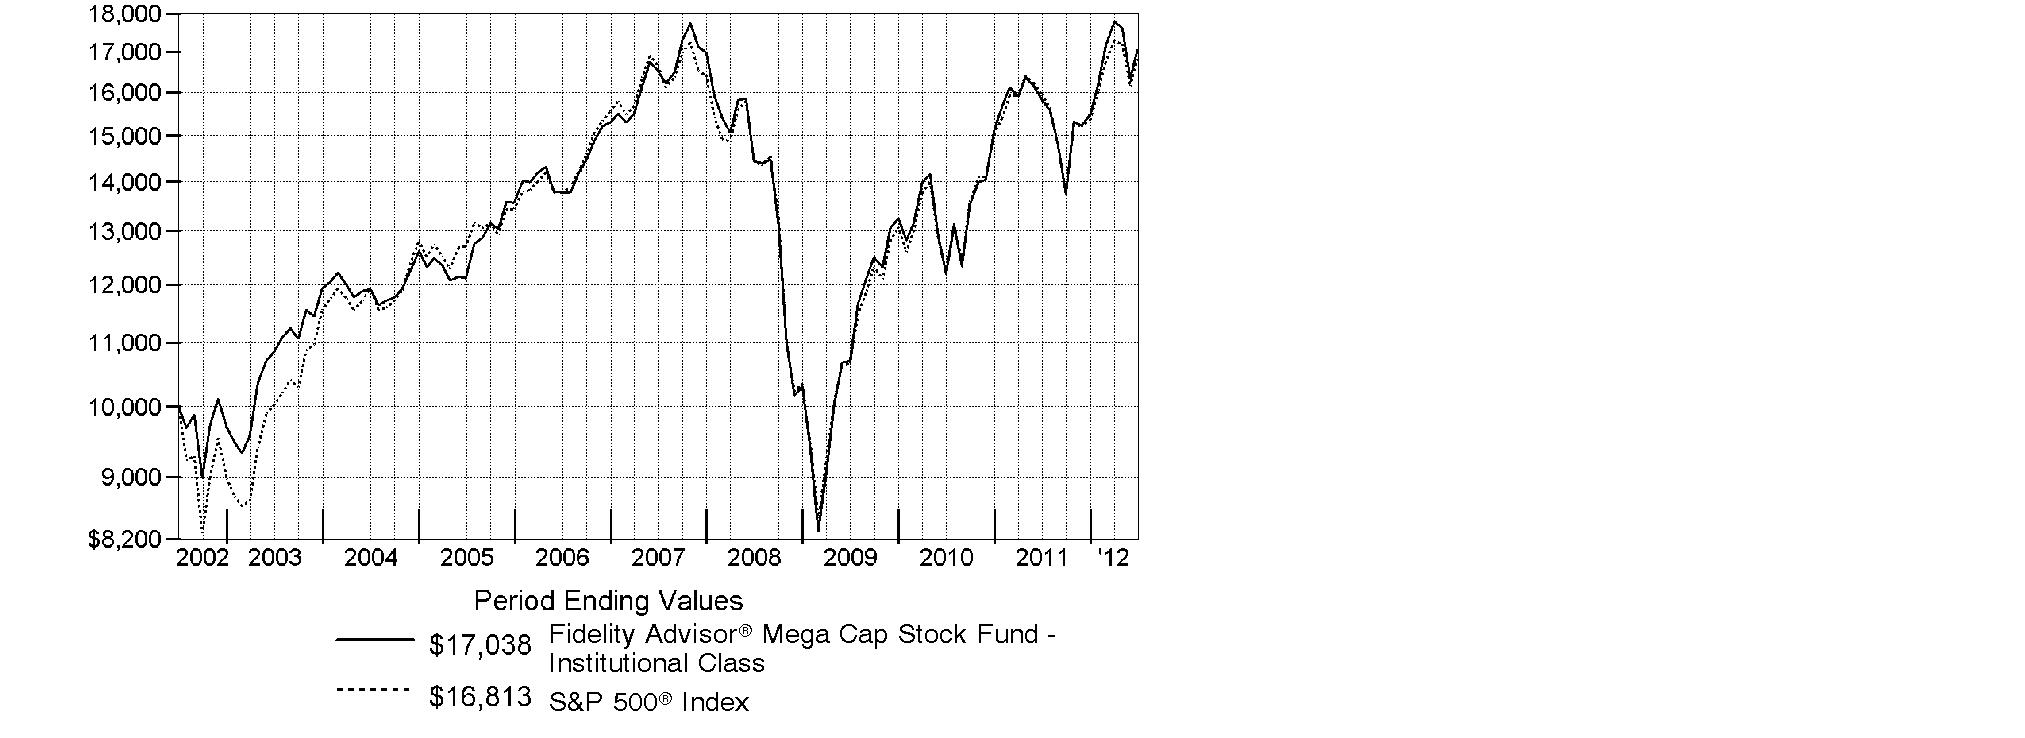
Annual Report
Market Recap: Major U.S. equity benchmarks posted solid gains for the 12 months ending June 30, 2012, even amid the period's uncertain investment environment. The broad-based S&P 500® Index returned 5.45%, while the blue-chip-laden Dow Jones Industrial AverageSM and the technology-heavy Nasdaq Composite® Index gained 6.63% and 6.99%, respectively. Volatility marked the first half of the period, as equities plummeted last summer and early fall on Europe's debt woes, debate over the U.S. debt ceiling and the credit-rating downgrade that followed. Beginning in October, healthier manufacturing, consumer and housing data rejuvenated markets and investors' appetite for stocks, leading major equity benchmarks to their best first-quarter performance since 1998. Stocks slipped again in the spring, as more eurozone trouble and a marked slowdown in China put the brakes on earlier momentum, until optimism reappeared in June. For the period, five of the 10 major market segments within the S&P 500® posted a double-digit gain, led by the more-defensive utilities, consumer staples and telecommunication services sectors, each of which rose about 15%. Conversely, energy (-8%) and materials (-7%) struggled the most. Given Europe's turmoil and local currency weakness, foreign developed-markets stocks lost ground, with the MSCI® EAFE® Index returning -13.70%.
Comments from Matthew Fruhan, Portfolio Manager of Fidelity Advisor® Mega Cap Stock Fund: For the year, the fund's Institutional Class shares returned 7.77%, ahead of the Russell Top 200® Index, which rose 7.04%, and the S&P 500®. Positioning within information technology was a bright spot, especially software/services names. Sector positioning overall also was helpful. Conversely, my picks in consumer staples detracted, as did positioning in telecommunication services. The fund's foreign investments hurt, due in part to a stronger U.S. dollar. The top contributor was U.K.-based Autonomy, an enterprise software maker. The stock rose sharply in August on a generous takeover bid from Hewlett-Packard. I sold Autonomy shortly after the announcement. A sizable stake in Wells Fargo helped, as earnings estimates were revised higher due to loan growth and favorable credit trends. An overweight in MasterCard boosted performance because earnings estimates for the card-processing company increased. Conversely, JPMorgan Chase was the largest relative detractor because its stock lagged, due in part to new capital standards for financial firms. In capital goods, an overweight in Ingersoll-Rand hurt because management missed short-term financial targets. Autonomy and Ingersoll-Rand were not in the index.
Annual Report
The views expressed above reflect those of the portfolio manager(s) only through the end of the period as stated on the cover of this report and do not necessarily represent the views of Fidelity or any other person in the Fidelity organization. Any such views are subject to change at any time based upon market or other conditions and Fidelity disclaims any responsibility to update such views. These views may not be relied on as investment advice and, because investment decisions for a Fidelity fund are based on numerous factors, may not be relied on as an indication of trading intent on behalf of any Fidelity fund.
Annual Report
Shareholder Expense Example
As a shareholder of the Fund, you incur two types of costs: (1) transaction costs, including sales charges (loads) on purchase payments or redemption proceeds, and (2) ongoing costs, including management fees, distribution and/or service (12b-1) fees and other Fund expenses. This Example is intended to help you understand your ongoing costs (in dollars) of investing in the Fund and to compare these costs with the ongoing costs of investing in other mutual funds.
The Example is based on an investment of $1,000 invested at the beginning of the period and held for the entire period (January 1, 2012 to June 30, 2012).
Actual Expenses
The first line of the accompanying table for each class of the Fund provides information about actual account values and actual expenses. You may use the information in this line, together with the amount you invested, to estimate the expenses that you paid over the period. Simply divide your account value by $1,000.00 (for example, an $8,600 account value divided by $1,000.00 = 8.6), then multiply the result by the number in the first line for a class of the Fund under the heading entitled "Expenses Paid During Period" to estimate the expenses you paid on your account during this period. A small balance maintenance fee of $12.00 that is charged once a year may apply for certain accounts with a value of less than $2,000. This fee is not included in the table below. If it was, the estimate of expenses you paid during the period would be higher, and your ending account value lower, by this amount. In addition, the Fund, as a shareholder in the underlying Fidelity Central Funds, will indirectly bear its pro-rata share of the fees and expenses incurred by the underlying Fidelity Central Funds. These fees and expenses are not included in the Fund's annualized expense ratio used to calculate the expense estimate in the table below.
Hypothetical Example for Comparison Purposes
The second line of the accompanying table for each class of the Fund provides information about hypothetical account values and hypothetical expenses based on a Class' actual expense ratio and an assumed rate of return of 5% per year before expenses, which is not the Class' actual return. The hypothetical account values and expenses may not be used to estimate the actual ending account balance or expenses you paid for the period. You may use this information to compare the ongoing costs of investing in the Fund and other funds. To do so, compare this 5% hypothetical example with the 5% hypothetical examples that appear in the shareholder reports of the other funds. A small balance maintenance fee of $12.00 that is charged once a year may apply for certain accounts with a value of less than $2,000. This fee is not included in the table below. If it was, the estimate of expenses you paid during the period would be higher, and your ending account value lower, by this amount. In addition, the Fund, as a shareholder in the underlying Fidelity Central Funds, will indirectly bear its pro-rata share of the fees and expenses incurred by the underlying Fidelity Central Funds. These fees and expenses are not included in the Fund's annualized expense ratio used to calculate the expense estimate in the table below.
Please note that the expenses shown in the table are meant to highlight your ongoing costs only and do not reflect any transaction costs. Therefore, the second line of the table is useful in comparing ongoing costs only, and will not help you determine the relative total costs of owning different funds. In addition, if these transactional costs were included, your costs would have been higher.
Annual Report
| Annualized
Expense Ratio | Beginning
Account Value
January 1, 2012 | Ending
Account Value
June 30, 2012 | Expenses Paid
During Period*
January 1, 2012
to June 30, 2012 |
Class A | 1.01% | | | |
Actual | | $ 1,000.00 | $ 1,099.50 | $ 5.27 |
HypotheticalA | | $ 1,000.00 | $ 1,019.84 | $ 5.07 |
Class T | 1.32% | | | |
Actual | | $ 1,000.00 | $ 1,097.30 | $ 6.88 |
HypotheticalA | | $ 1,000.00 | $ 1,018.30 | $ 6.62 |
Class B | 1.82% | | | |
Actual | | $ 1,000.00 | $ 1,093.70 | $ 9.47 |
HypotheticalA | | $ 1,000.00 | $ 1,015.81 | $ 9.12 |
Class C | 1.78% | | | |
Actual | | $ 1,000.00 | $ 1,095.20 | $ 9.27 |
HypotheticalA | | $ 1,000.00 | $ 1,016.01 | $ 8.92 |
Mega Cap Stock | .74% | | | |
Actual | | $ 1,000.00 | $ 1,100.00 | $ 3.86 |
HypotheticalA | | $ 1,000.00 | $ 1,021.18 | $ 3.72 |
Institutional Class | .77% | | | |
Actual | | $ 1,000.00 | $ 1,100.30 | $ 4.02 |
HypotheticalA | | $ 1,000.00 | $ 1,021.03 | $ 3.87 |
A 5% return per year before expenses
* Expenses are equal to each Class' annualized expense ratio, multiplied by the average account value over the period, multiplied by 182/366 (to reflect the one-half year period).
Annual Report
Investment Changes (Unaudited)
Top Ten Stocks as of June 30, 2012 |
| % of fund's
net assets | % of fund's net assets
6 months ago |
Apple, Inc. | 6.1 | 5.1 |
Wells Fargo & Co. | 4.2 | 4.6 |
JPMorgan Chase & Co. | 3.9 | 4.0 |
Exxon Mobil Corp. | 3.3 | 4.4 |
Chevron Corp. | 3.1 | 3.4 |
General Electric Co. | 3.0 | 3.0 |
Microsoft Corp. | 2.7 | 2.2 |
Comcast Corp. Class A (special) (non-vtg.) | 2.5 | 1.5 |
Procter & Gamble Co. | 2.4 | 2.5 |
Google, Inc. Class A | 2.3 | 3.0 |
| 33.5 | |
Top Five Market Sectors as of June 30, 2012 |
| % of fund's
net assets | % of fund's net assets
6 months ago |
Information Technology | 20.9 | 23.5 |
Financials | 15.5 | 15.8 |
Energy | 14.0 | 13.8 |
Health Care | 13.0 | 10.1 |
Consumer Discretionary | 12.6 | 11.9 |
Asset Allocation (% of fund's net assets) |
As of June 30, 2012 * | As of December 31, 2011 ** |
| Stocks 99.5% | | | Stocks and
Equity Futures 99.1% | |
| Convertible
Securities 0.1% | | | Convertible
Securities 0.0% | |
| Short-Term
Investments and
Net Other Assets
(Liabilities) 0.4% | | | Short-Term
Investments and
Net Other Assets
(Liabilities) 0.9% | |
* Foreign investments | 9.7% | | ** Foreign investments | 10.0% | |

Annual Report
Investments June 30, 2012
Showing Percentage of Net Assets
Common Stocks - 98.9% |
| Shares | | Value |
CONSUMER DISCRETIONARY - 12.0% |
Auto Components - 0.4% |
Johnson Controls, Inc. | 231,500 | | $ 6,414,865 |
Automobiles - 0.4% |
Bayerische Motoren Werke AG (BMW) | 83,426 | | 6,010,419 |
Hotels, Restaurants & Leisure - 1.0% |
McDonald's Corp. | 139,300 | | 12,332,229 |
Yum! Brands, Inc. | 37,500 | | 2,415,750 |
| | 14,747,979 |
Media - 6.3% |
Comcast Corp. Class A (special) (non-vtg.) | 1,176,600 | | 36,945,240 |
The Walt Disney Co. | 291,800 | | 14,152,300 |
Thomson Reuters Corp. | 123,200 | | 3,505,652 |
Time Warner Cable, Inc. | 73,200 | | 6,009,720 |
Time Warner, Inc. | 668,600 | | 25,741,100 |
Viacom, Inc. Class B (non-vtg.) | 151,200 | | 7,109,424 |
| | 93,463,436 |
Multiline Retail - 1.6% |
Target Corp. | 392,000 | | 22,810,480 |
Specialty Retail - 2.3% |
Home Depot, Inc. | 211,900 | | 11,228,581 |
Lowe's Companies, Inc. | 790,900 | | 22,493,196 |
| | 33,721,777 |
TOTAL CONSUMER DISCRETIONARY | | 177,168,956 |
CONSUMER STAPLES - 11.2% |
Beverages - 2.9% |
PepsiCo, Inc. | 303,300 | | 21,431,178 |
The Coca-Cola Co. | 273,900 | | 21,416,241 |
| | 42,847,419 |
Food & Staples Retailing - 1.7% |
CVS Caremark Corp. | 272,800 | | 12,747,944 |
Walgreen Co. | 411,800 | | 12,181,044 |
| | 24,928,988 |
Food Products - 0.7% |
Kellogg Co. | 216,000 | | 10,655,280 |
Household Products - 4.7% |
Colgate-Palmolive Co. | 100,800 | | 10,493,280 |
Kimberly-Clark Corp. | 234,400 | | 19,635,688 |
Common Stocks - continued |
| Shares | | Value |
CONSUMER STAPLES - continued |
Household Products - continued |
Procter & Gamble Co. | 570,700 | | $ 34,955,375 |
Reckitt Benckiser Group PLC | 74,600 | | 3,931,491 |
| | 69,015,834 |
Tobacco - 1.2% |
British American Tobacco PLC sponsored ADR | 114,500 | | 11,692,740 |
Philip Morris International, Inc. | 70,430 | | 6,145,722 |
| | 17,838,462 |
TOTAL CONSUMER STAPLES | | 165,285,983 |
ENERGY - 14.0% |
Energy Equipment & Services - 2.5% |
Halliburton Co. | 571,100 | | 16,213,529 |
National Oilwell Varco, Inc. | 90,500 | | 5,831,820 |
Schlumberger Ltd. | 223,900 | | 14,533,349 |
| | 36,578,698 |
Oil, Gas & Consumable Fuels - 11.5% |
Apache Corp. | 118,000 | | 10,371,020 |
BP PLC sponsored ADR | 171,800 | | 6,964,772 |
Chevron Corp. | 440,300 | | 46,451,650 |
Exxon Mobil Corp. | 566,171 | | 48,447,252 |
Occidental Petroleum Corp. | 192,200 | | 16,484,994 |
Royal Dutch Shell PLC Class A sponsored ADR | 285,500 | | 19,251,265 |
Suncor Energy, Inc. | 522,000 | | 15,094,470 |
Williams Companies, Inc. | 230,300 | | 6,637,246 |
| | 169,702,669 |
TOTAL ENERGY | | 206,281,367 |
FINANCIALS - 15.5% |
Capital Markets - 2.3% |
BlackRock, Inc. Class A | 20,700 | | 3,515,274 |
Charles Schwab Corp. | 877,100 | | 11,340,903 |
Goldman Sachs Group, Inc. | 49,600 | | 4,754,656 |
Morgan Stanley | 656,800 | | 9,582,712 |
Northern Trust Corp. | 101,200 | | 4,657,224 |
| | 33,850,769 |
Commercial Banks - 6.0% |
BB&T Corp. | 247,400 | | 7,632,290 |
Common Stocks - continued |
| Shares | | Value |
FINANCIALS - continued |
Commercial Banks - continued |
Standard Chartered PLC (United Kingdom) | 66,063 | | $ 1,432,467 |
U.S. Bancorp | 560,200 | | 18,016,032 |
Wells Fargo & Co. | 1,843,830 | | 61,657,675 |
| | 88,738,464 |
Diversified Financial Services - 6.3% |
Bank of America Corp. | 545,300 | | 4,460,554 |
Citigroup, Inc. | 789,870 | | 21,650,337 |
CME Group, Inc. | 32,900 | | 8,820,819 |
JPMorgan Chase & Co. | 1,625,600 | | 58,082,688 |
| | 93,014,398 |
Insurance - 0.9% |
ACE Ltd. | 27,700 | | 2,053,401 |
MetLife, Inc. | 372,800 | | 11,500,880 |
| | 13,554,281 |
TOTAL FINANCIALS | | 229,157,912 |
HEALTH CARE - 13.0% |
Biotechnology - 1.0% |
Amgen, Inc. | 196,290 | | 14,337,022 |
Health Care Equipment & Supplies - 0.7% |
Baxter International, Inc. | 117,000 | | 6,218,550 |
St. Jude Medical, Inc. | 108,400 | | 4,326,244 |
| | 10,544,794 |
Health Care Providers & Services - 3.1% |
Aetna, Inc. | 239,600 | | 9,289,292 |
McKesson Corp. | 192,700 | | 18,065,625 |
UnitedHealth Group, Inc. | 27,000 | | 1,579,500 |
WellPoint, Inc. | 279,300 | | 17,816,547 |
| | 46,750,964 |
Life Sciences Tools & Services - 0.3% |
Thermo Fisher Scientific, Inc. | 92,100 | | 4,780,911 |
Pharmaceuticals - 7.9% |
Abbott Laboratories | 258,200 | | 16,646,154 |
Eli Lilly & Co. | 108,400 | | 4,651,444 |
GlaxoSmithKline PLC sponsored ADR | 217,200 | | 9,897,804 |
Johnson & Johnson | 490,400 | | 33,131,424 |
Common Stocks - continued |
| Shares | | Value |
HEALTH CARE - continued |
Pharmaceuticals - continued |
Merck & Co., Inc. | 759,100 | | $ 31,692,425 |
Pfizer, Inc. | 883,100 | | 20,311,300 |
| | 116,330,551 |
TOTAL HEALTH CARE | | 192,744,242 |
INDUSTRIALS - 9.3% |
Aerospace & Defense - 2.7% |
Honeywell International, Inc. | 144,200 | | 8,052,128 |
Raytheon Co. | 155,100 | | 8,777,109 |
The Boeing Co. | 125,900 | | 9,354,370 |
United Technologies Corp. | 179,300 | | 13,542,529 |
| | 39,726,136 |
Air Freight & Logistics - 0.9% |
United Parcel Service, Inc. Class B | 177,800 | | 14,003,528 |
Electrical Equipment - 0.4% |
Emerson Electric Co. | 133,700 | | 6,227,746 |
Industrial Conglomerates - 4.1% |
Danaher Corp. | 166,700 | | 8,681,736 |
General Electric Co. | 2,162,500 | | 45,066,500 |
Tyco International Ltd. | 134,000 | | 7,081,900 |
| | 60,830,136 |
Machinery - 0.9% |
Atlas Copco AB (A Shares) | 20,100 | | 431,205 |
Illinois Tool Works, Inc. | 118,900 | | 6,288,621 |
Ingersoll-Rand PLC | 161,540 | | 6,813,757 |
| | 13,533,583 |
Road & Rail - 0.3% |
Union Pacific Corp. | 31,000 | | 3,698,610 |
TOTAL INDUSTRIALS | | 138,019,739 |
INFORMATION TECHNOLOGY - 20.9% |
Communications Equipment - 2.0% |
Cisco Systems, Inc. | 939,300 | | 16,127,781 |
QUALCOMM, Inc. | 228,000 | | 12,695,040 |
| | 28,822,821 |
Computers & Peripherals - 7.3% |
Apple, Inc. (a) | 155,001 | | 90,520,584 |
Common Stocks - continued |
| Shares | | Value |
INFORMATION TECHNOLOGY - continued |
Computers & Peripherals - continued |
EMC Corp. (a) | 463,700 | | $ 11,884,631 |
Hewlett-Packard Co. | 274,800 | | 5,526,228 |
| | 107,931,443 |
Electronic Equipment & Components - 0.4% |
Corning, Inc. | 418,500 | | 5,411,205 |
Internet Software & Services - 2.3% |
Google, Inc. Class A (a) | 58,350 | | 33,847,085 |
IT Services - 4.4% |
Accenture PLC Class A | 42,600 | | 2,559,834 |
Cognizant Technology Solutions Corp. Class A (a) | 185,600 | | 11,136,000 |
IBM Corp. | 76,000 | | 14,864,080 |
MasterCard, Inc. Class A | 48,900 | | 21,032,379 |
Visa, Inc. Class A | 121,100 | | 14,971,593 |
| | 64,563,886 |
Semiconductors & Semiconductor Equipment - 0.3% |
Broadcom Corp. Class A | 151,500 | | 5,120,700 |
Software - 4.2% |
Microsoft Corp. | 1,311,200 | | 40,109,608 |
Oracle Corp. | 632,300 | | 18,779,310 |
salesforce.com, Inc. (a) | 26,500 | | 3,663,890 |
| | 62,552,808 |
TOTAL INFORMATION TECHNOLOGY | | 308,249,948 |
MATERIALS - 1.0% |
Chemicals - 0.9% |
Air Products & Chemicals, Inc. | 13,000 | | 1,049,490 |
E.I. du Pont de Nemours & Co. | 117,600 | | 5,947,032 |
Syngenta AG (Switzerland) | 17,510 | | 5,994,114 |
| | 12,990,636 |
Metals & Mining - 0.1% |
Freeport-McMoRan Copper & Gold, Inc. | 57,800 | | 1,969,246 |
TOTAL MATERIALS | | 14,959,882 |
TELECOMMUNICATION SERVICES - 0.8% |
Wireless Telecommunication Services - 0.8% |
Vodafone Group PLC sponsored ADR | 410,900 | | 11,579,162 |
Common Stocks - continued |
| Shares | | Value |
UTILITIES - 1.2% |
Electric Utilities - 0.7% |
Duke Energy Corp. | 54,300 | | $ 1,252,158 |
FirstEnergy Corp. | 91,100 | | 4,481,209 |
NextEra Energy, Inc. | 52,800 | | 3,633,168 |
PPL Corp. | 47,030 | | 1,307,904 |
| | 10,674,439 |
Multi-Utilities - 0.5% |
National Grid PLC | 400,442 | | 4,243,895 |
PG&E Corp. | 78,200 | | 3,540,114 |
| | 7,784,009 |
TOTAL UTILITIES | | 18,458,448 |
TOTAL COMMON STOCKS (Cost $1,380,548,550) |
1,461,905,639
|
Preferred Stocks - 0.7% |
| | | |
Convertible Preferred Stocks - 0.1% |
INDUSTRIALS - 0.1% |
Aerospace & Defense - 0.1% |
United Technologies Corp. 7.50% | 30,000 | | 1,580,700 |
Nonconvertible Preferred Stocks - 0.6% |
CONSUMER DISCRETIONARY - 0.6% |
Automobiles - 0.6% |
Volkswagen AG | 54,300 | | 8,562,095 |
TOTAL PREFERRED STOCKS (Cost $10,396,129) |
10,142,795
|
Money Market Funds - 0.4% |
| Shares | | Value |
Fidelity Cash Central Fund, 0.17% (b)
(Cost $5,340,245) | 5,340,245 | | $ 5,340,245 |
TOTAL INVESTMENT PORTFOLIO - 100.0% (Cost $1,396,284,924) | | 1,477,388,679 |
NET OTHER ASSETS (LIABILITIES) - 0.0% | | (42,272) |
NET ASSETS - 100% | $ 1,477,346,407 |
Legend |
(a) Non-income producing |
(b) Affiliated fund that is available only to investment companies and other accounts managed by Fidelity Investments. The rate quoted is the annualized seven-day yield of the fund at period end. A complete unaudited listing of the fund's holdings as of its most recent quarter end is available upon request. In addition, each Fidelity Central Fund's financial statements, which are not covered by the Fund's Report of Independent Registered Public Accounting Firm, are available on the SEC's website or upon request. |
Affiliated Central Funds |
Information regarding fiscal year to date income earned by the Fund from investments in Fidelity Central Funds is as follows: |
Fund | Income earned |
Fidelity Cash Central Fund | $ 13,361 |
Fidelity Securities Lending Cash Central Fund | 147,642 |
Total | $ 161,003 |
Other Information |
The following is a summary of the inputs used, as of June 30, 2012, involving the Fund's assets and liabilities carried at fair value. The inputs or methodology used for valuing securities may not be an indication of the risk associated with investing in those securities. For more information on valuation inputs, and their aggregation into the levels used in the table below, please refer to the Security Valuation section in the accompanying Notes to Financial Statements. |
Valuation Inputs at Reporting Date: |
Description | Total | Level 1 | Level 2 | Level 3 |
Investments in Securities: | | | | |
Equities: | | | | |
Consumer Discretionary | $ 185,731,051 | $ 185,731,051 | $ - | $ - |
Consumer Staples | 165,285,983 | 165,285,983 | - | - |
Energy | 206,281,367 | 206,281,367 | - | - |
Financials | 229,157,912 | 229,157,912 | - | - |
Health Care | 192,744,242 | 192,744,242 | - | - |
Industrials | 139,600,439 | 139,600,439 | - | - |
Information Technology | 308,249,948 | 308,249,948 | - | - |
Materials | 14,959,882 | 8,965,768 | 5,994,114 | - |
Telecommunication Services | 11,579,162 | 11,579,162 | - | - |
Utilities | 18,458,448 | 14,214,553 | 4,243,895 | - |
Money Market Funds | 5,340,245 | 5,340,245 | - | - |
Total Investments in Securities: | $ 1,477,388,679 | $ 1,467,150,670 | $ 10,238,009 | $ - |
See accompanying notes which are an integral part of the financial statements.
Annual Report
Statement of Assets and Liabilities
| June 30, 2012 |
| | |
Assets | | |
Investment in securities, at value - See accompanying schedule: Unaffiliated issuers (cost $1,390,944,679) | $ 1,472,048,434 | |
Fidelity Central Funds (cost $5,340,245) | 5,340,245 | |
Total Investments (cost $1,396,284,924) | | $ 1,477,388,679 |
Receivable for investments sold | | 4,513,052 |
Receivable for fund shares sold | | 112,201,019 |
Dividends receivable | | 2,618,855 |
Distributions receivable from Fidelity Central Funds | | 600 |
Other receivables | | 15,040 |
Total assets | | 1,596,737,245 |
| | |
Liabilities | | |
Payable for investments purchased | $ 117,396,851 | |
Payable for fund shares redeemed | 1,141,354 | |
Accrued management fee | 503,966 | |
Distribution and service plan fees payable | 5,498 | |
Other affiliated payables | 292,121 | |
Other payables and accrued expenses | 51,048 | |
Total liabilities | | 119,390,838 |
| | |
Net Assets | | $ 1,477,346,407 |
Net Assets consist of: | | |
Paid in capital | | $ 1,505,792,572 |
Undistributed net investment income | | 10,984,843 |
Accumulated undistributed net realized gain (loss) on investments and foreign currency transactions | | (120,530,812) |
Net unrealized appreciation (depreciation) on investments and assets and liabilities in foreign currencies | | 81,099,804 |
Net Assets | | $ 1,477,346,407 |
See accompanying notes which are an integral part of the financial statements.
Annual Report
Statement of Assets and Liabilities - continued
| June 30, 2012 |
| | |
Calculation of Maximum Offering Price Class A:
Net Asset Value and redemption price per share ($8,527,011 ÷ 771,793 shares) | | $ 11.05 |
| | |
Maximum offering price per share (100/94.25 of $11.05) | | $ 11.72 |
Class T:
Net Asset Value and redemption price per share ($2,293,345 ÷ 207,585 shares) | | $ 11.05 |
| | |
Maximum offering price per share (100/96.50 of $11.05) | | $ 11.45 |
Class B:
Net Asset Value and offering price per share ($703,627 ÷ 64,122 shares)A | | $ 10.97 |
| | |
Class C:
Net Asset Value and offering price per share ($2,845,398 ÷ 260,413 shares)A | | $ 10.93 |
| | |
| | |
Mega Cap Stock:
Net Asset Value, offering price and redemption price per share ($1,287,144,341 ÷ 115,843,358 shares) | | $ 11.11 |
| | |
Institutional Class:
Net Asset Value, offering price and redemption price per share ($175,832,685 ÷ 15,867,859 shares) | | $ 11.08 |
A Redemption price per share is equal to net asset value less any applicable contingent deferred sales charge.
See accompanying notes which are an integral part of the financial statements.
Annual Report
Financial Statements - continued
Statement of Operations
| Year ended June 30, 2012 |
| | |
Investment Income | | |
Dividends | | $ 26,585,526 |
Interest | | 11,400 |
Income from Fidelity Central Funds | | 161,003 |
Total income | | 26,757,929 |
| | |
Expenses | | |
Management fee | $ 5,326,645 | |
Transfer agent fees | 2,841,812 | |
Distribution and service plan fees | 57,115 | |
Accounting and security lending fees | 377,501 | |
Custodian fees and expenses | 56,633 | |
Independent trustees' compensation | 7,188 | |
Registration fees | 144,593 | |
Audit | 48,095 | |
Legal | 5,010 | |
Interest | 6,291 | |
Miscellaneous | 9,521 | |
Total expenses before reductions | 8,880,404 | |
Expense reductions | (26,452) | 8,853,952 |
Net investment income (loss) | | 17,903,977 |
Realized and Unrealized Gain (Loss) Net realized gain (loss) on: | | |
Investment securities: | | |
Unaffiliated issuers | 43,339,638 | |
Foreign currency transactions | 724 | |
Futures contracts | (142,240) | |
Total net realized gain (loss) | | 43,198,122 |
Change in net unrealized appreciation (depreciation) on: Investment securities | 29,111,014 | |
Assets and liabilities in foreign currencies | (12,065) | |
Total change in net unrealized appreciation (depreciation) | | 29,098,949 |
Net gain (loss) | | 72,297,071 |
Net increase (decrease) in net assets resulting from operations | | $ 90,201,048 |
See accompanying notes which are an integral part of the financial statements.
Annual Report
Statement of Changes in Net Assets
| Year ended
June 30,
2012 | Year ended
June 30,
2011 |
Increase (Decrease) in Net Assets | | |
Operations | | |
Net investment income (loss) | $ 17,903,977 | $ 7,510,892 |
Net realized gain (loss) | 43,198,122 | 43,232,954 |
Change in net unrealized appreciation (depreciation) | 29,098,949 | 104,537,333 |
Net increase (decrease) in net assets resulting
from operations | 90,201,048 | 155,281,179 |
Distributions to shareholders from net investment income | (11,753,098) | (4,840,262) |
Share transactions - net increase (decrease) | 468,368,181 | 273,329,633 |
Total increase (decrease) in net assets | 546,816,131 | 423,770,550 |
| | |
Net Assets | | |
Beginning of period | 930,530,276 | 506,759,726 |
End of period (including undistributed net investment income of $10,984,843 and undistributed net investment income of $4,847,983, respectively) | $ 1,477,346,407 | $ 930,530,276 |
See accompanying notes which are an integral part of the financial statements.
Annual Report
Financial Highlights - Class A
Years ended June 30, | 2012 | 2011 | 2010 | 2009 | 2008 H |
Selected Per-Share Data | | | | |
Net asset value, beginning of period | $ 10.37 | $ 8.07 | $ 7.20 | $ 9.89 | $ 10.61 |
Income from Investment Operations | | | | | |
Net investment income (loss) E | .13 | .07 | .06 | .10 | .05 |
Net realized and unrealized gain (loss) | .64 | 2.28 | .92 | (2.65) | (.77) |
Total from investment operations | .77 | 2.35 | .98 | (2.55) | (.72) |
Distributions from net investment income | (.09) | (.05) | (.11) | (.12) | - |
Distributions from net realized gain | - | - | - | (.02) | - |
Total distributions | (.09) | (.05) | (.11) | (.14) | - |
Net asset value, end of period | $ 11.05 | $ 10.37 | $ 8.07 | $ 7.20 | $ 9.89 |
Total Return B, C, D | 7.57% | 29.23% | 13.65% | (25.98)% | (6.79)% |
Ratios to Average Net Assets F, I | | | | |
Expenses before reductions | 1.02% | 1.06% | 1.10% | 1.13% | 1.02% A |
Expenses net of fee waivers, if any | 1.02% | 1.06% | 1.10% | 1.13% | 1.02% A |
Expenses net of all reductions | 1.02% | 1.06% | 1.10% | 1.13% | 1.01% A |
Net investment income (loss) | 1.28% | .76% | .66% | 1.44% | 1.24% A |
Supplemental Data | | | | |
Net assets, end of period (000 omitted) | $ 8,527 | $ 4,169 | $ 2,238 | $ 806 | $ 106 |
Portfolio turnover rate G | 57% | 53% | 97% | 138% | 97% |
A Annualized
B Total returns for periods of less than one year are not annualized.
C Total returns would have been lower if certain expenses had not been reduced during the applicable periods shown.
D Total returns do not include the effect of the sales charges.
E Calculated based on average shares outstanding during the period.
F Fees and expenses of any underlying Fidelity Central Funds are not included in the Fund's expense ratio. The Fund indirectly bears its proportionate share of the expenses of any underlying Fidelity Central Funds.
G Amount does not include the portfolio activity of any underlying Fidelity Central Funds.
H For the period February 5, 2008 (commencement of sale of shares) to June 30, 2008.
I Expense ratios reflect operating expenses of the class. Expenses before reductions do not reflect amounts reimbursed by the investment adviser or reductions from brokerage service arrangements or reductions from other expense offset arrangements and do not represent the amount paid by the class during periods when reimbursements or reductions occur. Expense ratios before reductions for start-up periods may not be representative of longer-term operating periods. Expenses net of fee waivers reflect expenses after reimbursement by the investment adviser but prior to reductions from brokerage service arrangements or other expense offset arrangements. Expenses net of all reductions represent the net expenses paid by the class.
See accompanying notes which are an integral part of the financial statements.
Annual Report
Financial Highlights - Class T
Years ended June 30, | 2012 | 2011 | 2010 | 2009 | 2008 H |
Selected Per-Share Data | | | | |
Net asset value, beginning of period | $ 10.38 | $ 8.07 | $ 7.20 | $ 9.88 | $ 10.61 |
Income from Investment Operations | | | | | |
Net investment income (loss) E | .10 | .05 | .03 | .09 | .04 |
Net realized and unrealized gain (loss) | .64 | 2.29 | .93 | (2.67) | (.77) |
Total from investment operations | .74 | 2.34 | .96 | (2.58) | (.73) |
Distributions from net investment income | (.07) | (.03) | (.09) | (.08) | - |
Distributions from net realized gain | - | - | - | (.02) | - |
Total distributions | (.07) | (.03) | (.09) | (.10) | - |
Net asset value, end of period | $ 11.05 | $ 10.38 | $ 8.07 | $ 7.20 | $ 9.88 |
Total Return B, C, D | 7.19% | 29.08% | 13.32% | (26.21)% | (6.88)% |
Ratios to Average Net Assets F, I | | | | |
Expenses before reductions | 1.32% | 1.32% | 1.36% | 1.36% | 1.32% A |
Expenses net of fee waivers, if any | 1.32% | 1.32% | 1.36% | 1.36% | 1.32% A |
Expenses net of all reductions | 1.32% | 1.32% | 1.35% | 1.36% | 1.32% A |
Net investment income (loss) | .98% | .50% | .41% | 1.21% | .89% A |
Supplemental Data | | | | |
Net assets, end of period (000 omitted) | $ 2,293 | $ 1,682 | $ 1,073 | $ 446 | $ 136 |
Portfolio turnover rate G | 57% | 53% | 97% | 138% | 97% |
A Annualized
B Total returns for periods of less than one year are not annualized.
C Total returns would have been lower if certain expenses had not been reduced during the applicable periods shown.
D Total returns do not include the effect of the sales charges.
E Calculated based on average shares outstanding during the period.
F Fees and expenses of any underlying Fidelity Central Funds are not included in the Fund's expense ratio. The Fund indirectly bears its proportionate share of the expenses of any underlying Fidelity Central Funds.
G Amount does not include the portfolio activity of any underlying Fidelity Central Funds.
H For the period February 5, 2008 (commencement of sale of shares) to June 30, 2008.
I Expense ratios reflect operating expenses of the class. Expenses before reductions do not reflect amounts reimbursed by the investment adviser or reductions from brokerage service arrangements or reductions from other expense offset arrangements and do not represent the amount paid by the class during periods when reimbursements or reductions occur. Expense ratios before reductions for start-up periods may not be representative of longer-term operating periods. Expenses net of fee waivers reflect expenses after reimbursement by the investment adviser but prior to reductions from brokerage service arrangements or other expense offset arrangements. Expenses net of all reductions represent the net expenses paid by the class.
See accompanying notes which are an integral part of the financial statements.
Annual Report
Financial Highlights - Class B
Years ended June 30, | 2012 | 2011 | 2010 | 2009 | 2008 I |
Selected Per-Share Data | | | | |
Net asset value, beginning of period | $ 10.30 | $ 8.02 | $ 7.19 | $ 9.87 | $ 10.61 |
Income from Investment Operations | | | | | |
Net investment income (loss) E | .05 | - K | (.01) | .05 | .02 |
Net realized and unrealized gain (loss) | .63 | 2.28 | .92 | (2.66) | (.76) |
Total from investment operations | .68 | 2.28 | .91 | (2.61) | (.74) |
Distributions from net investment income | (.01) | - | (.08) | (.05) | - |
Distributions from net realized gain | - | - | - | (.02) | - |
Total distributions | (.01) | - | (.08) | (.07) | - |
Net asset value, end of period | $ 10.97 | $ 10.30 | $ 8.02 | $ 7.19 | $ 9.87 |
Total Return B, C, D | 6.62% | 28.43% | 12.60% | (26.56)% | (6.97)% |
Ratios to Average Net Assets F, J | | | | |
Expenses before reductions | 1.82% | 1.83% | 1.88% | 1.88% | 1.73% A |
Expenses net of fee waivers, if any | 1.82% | 1.83% | 1.88% | 1.88% | 1.73% A |
Expenses net of all reductions | 1.81% | 1.82% | 1.88% | 1.88% | 1.73% A |
Net investment income (loss) | .49% | .00% H | (.12)% | .68% | .52% A |
Supplemental Data | | | | |
Net assets, end of period (000 omitted) | $ 704 | $ 764 | $ 667 | $ 263 | $ 107 |
Portfolio turnover rate G | 57% | 53% | 97% | 138% | 97% |
A Annualized
B Total returns for periods of less than one year are not annualized.
C Total returns would have been lower if certain expenses had not been reduced during the applicable periods shown.
D Total returns do not include the effect of the contingent deferred sales charge.
E Calculated based on average shares outstanding during the period.
F Fees and expenses of any underlying Fidelity Central Funds are not included in the Fund's expense ratio. The Fund indirectly bears its proportionate share of the expenses of any underlying Fidelity Central Funds.
G Amount does not include the portfolio activity of any underlying Fidelity Central Funds.
H Amount represents less than .01%.
I For the period February 5, 2008 (commencement of sale of shares) to June 30, 2008.
J Expense ratios reflect operating expenses of the class. Expenses before reductions do not reflect amounts reimbursed by the investment adviser or reductions from brokerage service arrangements or reductions from other expense offset arrangements and do not represent the amount paid by the class during periods when reimbursements or reductions occur. Expense ratios before reductions for start-up periods may not be representative of longer-term operating periods. Expenses net of fee waivers reflect expenses after reimbursement by the investment adviser but prior to reductions from brokerage service arrangements or other expense offset arrangements. Expenses net of all reductions represent the net expenses paid by the class.
K Amount represents less than $.01 per share.
See accompanying notes which are an integral part of the financial statements.
Annual Report
Financial Highlights - Class C
Years ended June 30, | 2012 | 2011 | 2010 | 2009 | 2008 H |
Selected Per-Share Data | | | | |
Net asset value, beginning of period | $ 10.28 | $ 8.01 | $ 7.16 | $ 9.87 | $ 10.61 |
Income from Investment Operations | | | | | |
Net investment income (loss) E | .05 | - J | (.01) | .05 | .02 |
Net realized and unrealized gain (loss) | .64 | 2.27 | .92 | (2.66) | (.76) |
Total from investment operations | .69 | 2.27 | .91 | (2.61) | (.74) |
Distributions from net investment income | (.04) | - | (.06) | (.08) | - |
Distributions from net realized gain | - | - | - | (.02) | - |
Total distributions | (.04) | - | (.06) | (.10) | - |
Net asset value, end of period | $ 10.93 | $ 10.28 | $ 8.01 | $ 7.16 | $ 9.87 |
Total Return B, C, D | 6.74% | 28.34% | 12.72% | (26.56)% | (6.97)% |
Ratios to Average Net Assets F, I | | | | |
Expenses before reductions | 1.79% | 1.81% | 1.86% | 1.88% | 1.71% A |
Expenses net of fee waivers, if any | 1.79% | 1.81% | 1.86% | 1.88% | 1.71% A |
Expenses net of all reductions | 1.79% | 1.81% | 1.85% | 1.88% | 1.71% A |
Net investment income (loss) | .51% | .01% | (.10)% | .69% | .55% A |
Supplemental Data | | | | |
Net assets, end of period (000 omitted) | $ 2,845 | $ 1,913 | $ 807 | $ 470 | $ 98 |
Portfolio turnover rate G | 57% | 53% | 97% | 138% | 97% |
A Annualized
B Total returns for periods of less than one year are not annualized.
C Total returns would have been lower if certain expenses had not been reduced during the applicable periods shown.
D Total returns do not include the effect of the contingent deferred sales charge.
E Calculated based on average shares outstanding during the period.
F Fees and expenses of any underlying Fidelity Central Funds are not included in the Fund's expense ratio. The Fund indirectly bears its proportionate share of the expenses of any underlying Fidelity Central Funds.
G Amount does not include the portfolio activity of any underlying Fidelity Central Funds.
H For the period February 5, 2008 (commencement of sale of shares) to June 30, 2008.
I Expense ratios reflect operating expenses of the class. Expenses before reductions do not reflect amounts reimbursed by the investment adviser or reductions from brokerage service arrangements or reductions from other expense offset arrangements and do not represent the amount paid by the class during periods when reimbursements or reductions occur. Expense ratios before reductions for start-up periods may not be representative of longer-term operating periods. Expenses net of fee waivers reflect expenses after reimbursement by the investment adviser but prior to reductions from brokerage service arrangements or other expense offset arrangements. Expenses net of all reductions represent the net expenses paid by the class.
J Amount represents less than $.01 per share.
See accompanying notes which are an integral part of the financial statements.
Annual Report
Financial Highlights - Mega Cap Stock
Years ended June 30, | 2012 | 2011 | 2010 | 2009 | 2008 |
Selected Per-Share Data | | | | |
Net asset value, beginning of period | $ 10.43 | $ 8.11 | $ 7.23 | $ 9.91 | $ 12.06 |
Income from Investment Operations | | | | | |
Net investment income (loss) B | .16 | .10 | .08 | .13 | .14 |
Net realized and unrealized gain (loss) | .64 | 2.29 | .93 | (2.67) | (1.60) |
Total from investment operations | .80 | 2.39 | 1.01 | (2.54) | (1.46) |
Distributions from net investment income | (.12) | (.07) | (.13) | (.12) | (.07) |
Distributions from net realized gain | - | - | - | (.02) | (.62) |
Total distributions | (.12) | (.07) | (.13) | (.14) | (.69) |
Net asset value, end of period | $ 11.11 | $ 10.43 | $ 8.11 | $ 7.23 | $ 9.91 |
Total Return A | 7.83% | 29.61% | 13.93% | (25.77)% | (12.73)% |
Ratios to Average Net Assets C, E | | | | |
Expenses before reductions | .76% | .79% | .81% | .79% | .75% |
Expenses net of fee waivers, if any | .76% | .79% | .80% | .78% | .74% |
Expenses net of all reductions | .75% | .78% | .79% | .78% | .74% |
Net investment income (loss) | 1.55% | 1.04% | .96% | 1.78% | 1.28% |
Supplemental Data | | | | |
Net assets, end of period (000 omitted) | $ 1,287,144 | $ 785,233 | $ 500,407 | $ 253,164 | $ 667,542 |
Portfolio turnover rate D | 57% | 53% | 97% | 138% | 97% |
A Total returns would have been lower if certain expenses had not been reduced during the applicable periods shown.
B Calculated based on average shares outstanding during the period.
C Fees and expenses of any underlying Fidelity Central Funds are not included in the Fund's expense ratio. The Fund indirectly bears its proportionate share of the expenses of any underlying Fidelity Central Funds.
D Amount does not include the portfolio activity of any underlying Fidelity Central Funds.
E Expense ratios reflect operating expenses of the class. Expenses before reductions do not reflect amounts reimbursed by the investment adviser or reductions from brokerage service arrangements or reductions from other expense offset arrangements and do not represent the amount paid by the class during periods when reimbursements or reductions occur. Expenses net of fee waivers reflect expenses after reimbursement by the investment adviser but prior to reductions from brokerage service arrangements or other expense offset arrangements. Expenses net of all reductions represent the net expenses paid by the class.
See accompanying notes which are an integral part of the financial statements.
Annual Report
Financial Highlights - Institutional Class
Years ended June 30, | 2012 | 2011 | 2010 | 2009 | 2008 G |
Selected Per-Share Data | | | | |
Net asset value, beginning of period | $ 10.40 | $ 8.09 | $ 7.22 | $ 9.91 | $ 10.61 |
Income from Investment Operations | | | | | |
Net investment income (loss) D | .16 | .10 | .08 | .13 | .07 |
Net realized and unrealized gain (loss) | .63 | 2.30 | .92 | (2.67) | (.77) |
Total from investment operations | .79 | 2.40 | 1.00 | (2.54) | (.70) |
Distributions from net investment income | (.11) | (.09) | (.13) | (.13) | - |
Distributions from net realized gain | - | - | - | (.02) | - |
Total distributions | (.11) | (.09) | (.13) | (.15) | - |
Net asset value, end of period | $ 11.08 | $ 10.40 | $ 8.09 | $ 7.22 | $ 9.91 |
Total Return B, C | 7.77% | 29.74% | 13.89% | (25.81)% | (6.60)% |
Ratios to Average Net Assets E, H | | | | |
Expenses before reductions | .78% | .79% | .88% | .77% | .70% A |
Expenses net of fee waivers, if any | .78% | .79% | .88% | .77% | .70% A |
Expenses net of all reductions | .77% | .78% | .87% | .77% | .70% A |
Net investment income (loss) | 1.53% | 1.04% | .88% | 1.79% | 1.57% A |
Supplemental Data | | | | |
Net assets, end of period (000 omitted) | $ 175,833 | $ 136,768 | $ 1,568 | $ 515 | $ 93 |
Portfolio turnover rate F | 57% | 53% | 97% | 138% | 97% |
A Annualized
B Total returns for periods of less than one year are not annualized.
C Total returns would have been lower if certain expenses had not been reduced during the applicable periods shown.
D Calculated based on average shares outstanding during the period.
E Fees and expenses of any underlying Fidelity Central Funds are not included in the Fund's expense ratio. The Fund indirectly bears its proportionate share of the expenses of any underlying Fidelity Central Funds.
F Amount does not include the portfolio activity of any underlying Fidelity Central Funds.
G For the period February 5, 2008 (commencement of sale of shares) to June 30, 2008.
H Expense ratios reflect operating expenses of the class. Expenses before reductions do not reflect amounts reimbursed by the investment adviser or reductions from brokerage service arrangements or reductions from other expense offset arrangements and do not represent the amount paid by the class during periods when reimbursements or reductions occur. Expense ratios before reductions for start-up periods may not be representative of longer-term operating periods. Expenses net of fee waivers reflect expenses after reimbursement by the investment adviser but prior to reductions from brokerage service arrangements or other expense offset arrangements. Expenses net of all reductions represent the net expenses paid by the class.
See accompanying notes which are an integral part of the financial statements.
Annual Report
Notes to Financial Statements
For the period ended June 30, 2012
1. Organization.
Fidelity® Mega Cap Stock Fund (the Fund) is a fund of Fidelity Hastings Street Trust (the Trust) and is authorized to issue an unlimited number of shares. The Trust is registered under the Investment Company Act of 1940, as amended (the 1940 Act), as an open-end management investment company organized as a Massachusetts business trust. The Fund offers Class A, Class T, Class C, Mega Cap Stock and Institutional Class shares, each of which, along with Class B shares, has equal rights as to assets and voting privileges. Effective after the close of business on September 1, 2010, Class B shares were closed to new accounts and additional purchases, except for exchanges and reinvestments. Each class has exclusive voting rights with respect to matters that affect that class. Class B shares will automatically convert to Class A shares after a holding period of seven years from the initial date of purchase. Investment income, realized and unrealized capital gains and losses, the common expenses of the Fund, and certain fund-level expense reductions, if any, are allocated on a pro-rata basis to each class based on the relative net assets of each class to the total net assets of the Fund. Each class differs with respect to transfer agent and distribution and service plan fees incurred. Certain expense reductions may also differ by class.
2. Investments in Fidelity Central Funds.
The Fund invests in Fidelity Central Funds, which are open-end investment companies available only to other investment companies and accounts managed by Fidelity Management & Research Company (FMR) and its affiliates. The Fund's Schedule of Investments lists each of the Fidelity Central Funds held as of period end, if any, as an investment of the Fund, but does not include the underlying holdings of each Fidelity Central Fund. As an Investing Fund, the Fund indirectly bears its proportionate share of the expenses of the underlying Fidelity Central Funds.
The Money Market Central Funds seek preservation of capital and current income and are managed by Fidelity Investments Money Management, Inc. (FIMM), an affiliate of FMR.
A complete unaudited list of holdings for each Fidelity Central Fund is available upon request or at the Securities and Exchange Commission (the SEC) web site at www.sec.gov. In addition, the financial statements of the Fidelity Central Funds, which are not covered by the Fund's Report of Independent Registered Public Accounting Firm, are available on the SEC web site or upon request.
3. Significant Accounting Policies.
The financial statements have been prepared in conformity with accounting principles generally accepted in the United States of America (GAAP), which require management to make certain estimates and assumptions at the date of the financial statements.
Annual Report
Notes to Financial Statements - continued
3. Significant Accounting Policies - continued
Actual results could differ from those estimates. Subsequent events, if any, through the date that the financial statements were issued have been evaluated in the preparation of the financial statements. The following summarizes the significant accounting policies of the Fund:
Security Valuation. Investments are valued as of 4:00 p.m. Eastern time on the last calendar day of the period. In accordance with valuation policies and procedures approved by the Board of Trustees (the Board), the Fund attempts to obtain prices from one or more third party pricing vendor or broker to value its investments. When current market prices, quotations or rates are not readily available or reliable, securities will be fair valued in good faith by the FMR Fair Value Committee (the Committee), in accordance with procedures adopted by the Fund's Board. Factors used in determining fair value vary by security type and may include market or security specific events. The frequency with which these procedures are used cannot be predicted and they may be utilized to a significant extent. The Committee oversees the Fund's valuation policies and procedures and is responsible for approving and reporting to the Board all fair value determinations.
The Fund categorizes the inputs to valuation techniques used to value its investments into a disclosure hierarchy consisting of three levels as shown below:
Level 1 - quoted prices in active markets for identical investments
Level 2 - other significant observable inputs (including quoted prices for similar investments, interest rates, prepayment speeds, etc.)
Level 3 - unobservable inputs (including the Fund's own assumptions based on the best information available)
Valuation techniques used to value the Fund's investments by major category are as follows:
Equity securities, including restricted securities, for which market quotations are readily available, are valued at the last reported sale price or official closing price as reported by a third party pricing vendor on the primary market or exchange on which they are traded and are categorized as Level 1 in the hierarchy. In the event there were no sales during the day or closing prices are not available, securities are valued at the last quoted bid price or may be valued using the last available price and are generally categorized as Level 2 in the hierarchy. For foreign equity securities, when significant market or security specific events arise, comparisons to the valuation of American Depositary Receipts (ADRs), futures contracts, Exchange-Traded Funds (ETFs) and certain indexes as well as quoted prices for similar securities are used and are categorized as Level 2 in the hierarchy. Utilizing these techniques may result in transfers between Level 1 and Level 2.
Annual Report
3. Significant Accounting Policies - continued
Security Valuation - continued
For restricted equity securities and private placements where observable inputs are limited, assumptions about market activity and risk are used and these securities are categorized as Level 3 in the hierarchy.
Investments in open-end mutual funds, including the Fidelity Central Funds, are valued at their closing net asset value each business day and are categorized as Level 1 in the hierarchy.
Changes in valuation techniques may result in transfers in or out of an assigned level within the disclosure hierarchy. The aggregate value of investments by input level, as of June 30, 2012, is included at the end of the Fund's Schedule of Investments.
Foreign Currency Translation. The Fund may use foreign currency contracts to facilitate transactions in foreign-denominated securities. Gains and losses from these transactions may arise from changes in the value of the foreign currency or if the counterparties do not perform under the contracts' terms.
Foreign-denominated assets, including investment securities, and liabilities are translated into U.S. dollars at the exchange rates at period end. Purchases and sales of investment securities, income and dividends received and expenses denominated in foreign currencies are translated into U.S. dollars at the exchange rate in effect on the transaction date.
The effects of exchange rate fluctuations on investments are included with the net realized and unrealized gain (loss) on investment securities. Other foreign currency transactions resulting in realized and unrealized gain (loss) are disclosed separately.
Investment Transactions and Income. For financial reporting purposes, the Fund's investment holdings and NAV include trades executed through the end of the last business day of the period. The NAV per share for processing shareholder transactions is calculated as of the close of business of the New York Stock Exchange (NYSE), normally 4:00 p.m. Eastern time and includes trades executed through the end of the prior business day. Gains and losses on securities sold are determined on the basis of identified cost and may include proceeds received from litigation. Dividend income is recorded on the ex-dividend date, except for certain dividends from foreign securities where the ex-dividend date may have passed, which are recorded as soon as the Fund is informed of the ex-dividend date. Non-cash dividends included in dividend income, if any, are recorded at the fair market value of the securities received. Distributions received on securities that represent a return of capital or capital gain are recorded as a reduction of cost of investments and/or as a realized gain. The Fund estimates the components of distributions received that may be considered return of capital distributions or capital
Annual Report
Notes to Financial Statements - continued
3. Significant Accounting Policies - continued
Investment Transactions and Income - continued
gain distributions. Interest income and distributions from the Fidelity Central Funds are accrued as earned. Interest income includes coupon interest and amortization of premium and accretion of discount on debt securities. Investment income is recorded net of foreign taxes withheld where recovery of such taxes is uncertain.
Expenses. Expenses directly attributable to a fund are charged to that fund. Expenses attributable to more than one fund are allocated among the respective funds on the basis of relative net assets or other appropriate methods. Expense estimates are accrued in the period to which they relate and adjustments are made when actual amounts are known.
Income Tax Information and Distributions to Shareholders. Each year, the Fund intends to qualify as a regulated investment company under Subchapter M of the Internal Revenue Code, including distributing substantially all of its taxable income and realized gains. As a result, no provision for income taxes is required. As of June 30, 2012, the Fund did not have any unrecognized tax benefits in the financial statements; nor is the Fund aware of any tax positions for which it is reasonably possible that the total amounts of unrecognized tax benefits will significantly change in the next twelve months. The Fund files a U.S. federal tax return, in addition to state and local tax returns as required. A fund's federal income tax returns are subject to examination by the Internal Revenue Service (IRS) for a period of three fiscal years after they are filed. State and local tax returns may be subject to examination for an additional fiscal year depending on the jurisdiction. Foreign taxes are provided for based on the Fund's understanding of the tax rules and rates that exist in the foreign markets in which it invests.
Distributions are declared and recorded on the ex-dividend date. Income dividends and capital gain distributions are declared separately for each class. Income and capital gain distributions are determined in accordance with income tax regulations, which may differ from GAAP.
Capital accounts within the financial statements are adjusted for permanent book-tax differences. These adjustments have no impact on net assets or the results of operations. Temporary book-tax differences will reverse in a subsequent period.
Book-tax differences are primarily due to foreign currency transactions, market discount, futures transactions, equity-debt classifications, capital loss carryforwards, and losses deferred due to wash sales.
Annual Report
3. Significant Accounting Policies - continued
Income Tax Information and Distributions to Shareholders - continued
The federal tax cost of investment securities and unrealized appreciation (depreciation) as of period end were as follows:
Gross unrealized appreciation | $ 145,345,483 |
Gross unrealized depreciation | (72,327,832) |
Net unrealized appreciation (depreciation) on securities and other investments | $ 73,017,651 |
| |
Tax Cost | $ 1,404,371,028 |
The tax-based components of distributable earnings as of period end were as follows:
Undistributed ordinary income | $ 10,989,705 |
Capital loss carryforward | $ (112,444,708) |
Net unrealized appreciation (depreciation) | $ 73,013,700 |
Capital loss carryforwards are only available to offset future capital gains of the Fund to the extent provided by regulations and may be limited. Under the Regulated Investment Company Modernization Act of 2010 (the Act), the Fund is permitted to carry forward capital losses incurred in taxable years beginning after December 22, 2010 for an unlimited period and such capital losses are required to be used prior to any losses that expire. Capital loss carryforwards were as follows:
Fiscal year of expiration | |
2017 | $ (3,091,486) |
2018 | (109,353,222) |
Total capital loss carry forward | $ (112,444,708) |
The tax character of distributions paid was as follows:
| June 30, 2012 | June 30, 2011 |
Ordinary Income | $ 11,753,098 | $ 4,840,262 |
New Accounting Pronouncement. In December 2011, the Financial Accounting Standards Board issued Accounting Standard Update No. 2011-11, Disclosures about Offsetting Assets and Liabilities. The update creates new disclosure requirements requiring entities to disclose both gross and net information for derivatives and other financial instruments that are either offset in the Statement of Assets and Liabilities or
Annual Report
Notes to Financial Statements - continued
3. Significant Accounting Policies - continued
New Accounting Pronouncement - continued
subject to an enforceable master netting arrangement or similar agreement. The disclosure requirements are effective for interim and annual reporting periods beginning on or after January 1, 2013. Management is currently evaluating the impact of the update's adoption on the Fund's financial statement disclosures.
4. Derivative Instruments.
Risk Exposures and the Use of Derivative Instruments. The Fund's investment objectives allow the Fund to enter into various types of derivative contracts, including futures contracts. Derivatives are investments whose value is derived from underlying assets, indices or reference rates and may be transacted on an exchange or over-the-counter (OTC). Derivatives may involve a future commitment to buy or sell a specified instrument based on specified terms, or to exchange future cash flows at periodic intervals based on a notional principal amount. The Fund used derivatives to increase returns and to manage exposure to certain risks as defined below. The success of any strategy involving derivatives depends on analysis of numerous economic factors, and if the strategies for investment do not work as intended, the Fund may not achieve its objectives.
The Fund's use of derivatives increased or decreased its exposure to the following risk:
Equity Risk | Equity risk relates to the fluctuations in the value of financial instruments as a result of changes in market prices (other than those arising from interest rate risk or foreign exchange risk), whether caused by factors specific to an individual investment, its issuer, or all factors affecting all instruments traded in a market or market segment. |
The Fund is also exposed to additional risks from investing in derivatives, such as liquidity risk and counterparty credit risk. Liquidity risk is the risk that the Fund will be unable to close out the derivative in the open market in a timely manner. Counterparty credit risk is the risk that the counterparty will not be able to fulfill its obligation to the Fund. Counterparty credit risk related to exchange-traded futures contracts is minimal because of the protection provided by the exchange on which they trade. Investing in derivatives may involve greater risks than investing in the underlying assets directly and, to varying degrees, involves risk of loss in excess of the initial investment, if any, collateral received and amounts recognized in the Statement of Assets and Liabilities. In addition, for futures contracts, there is the risk that the change in value of the derivative contract may not correspond to the change in value of the underlying instrument.
Annual Report
4. Derivative Instruments - continued
Futures Contracts. A futures contract is an agreement between two parties to buy or sell a specified underlying instrument for a fixed price at a specified future date. The Fund used futures contracts to manage its exposure to the stock market.
Upon entering into a futures contract, a fund is required to deposit either cash or securities (initial margin) with a clearing broker in an amount equal to a certain percentage of the face value of the contract. Futures contracts are marked-to-market daily and subsequent payments are made or received by a fund depending on the daily fluctuations in the value of the futures contracts and are recorded as unrealized appreciation or (depreciation). This receivable and/or payable is included in daily variation margin on futures contracts in the Statement of Assets and Liabilities. Realized gain or (loss) is recorded upon the expiration or closing of a futures contract.
Any open futures contracts at period end are shown in the Schedule of Investments under the caption "Futures Contracts." The underlying face amount at value reflects each contract's exposure to the underlying instrument at period end.
During the period the Fund recognized net realized gain (loss) of $142,240 related to its investment in futures contracts. This amount is included in the Statement of Operations.
5. Purchases and Sales of Investments.
Purchases and sales of securities, other than short-term securities, aggregated $1,133,217,548 and $662,913,700, respectively.
6. Fees and Other Transactions with Affiliates.
Management Fee. FMR and its affiliates provide the Fund with investment management related services for which the Fund pays a monthly management fee. The management fee is the sum of an individual fund fee rate that is based on an annual rate of .20% of the Fund's average net assets and an annualized group fee rate that averaged .26% during the period. The group fee rate is based upon the average net assets of all the mutual funds advised by FMR. The group fee rate decreases as assets under management increase and increases as assets under management decrease. For the period, the total annual management fee rate was .46% of the Fund's average net assets.
Distribution and Service Plan Fees. In accordance with Rule 12b-1 of the 1940 Act, the Fund has adopted separate Distribution and Service Plans for each class of shares. Certain classes pay Fidelity Distributors Corporation (FDC), an affiliate of FMR, separate Distribution and Service Fees, each of which is based on an annual percentage of each class' average net assets. In addition, FDC may pay financial intermediaries for selling shares of the Fund and providing shareholder support services. For the period,
Annual Report
Notes to Financial Statements - continued
6. Fees and Other Transactions with Affiliates - continued
Distribution and Service Plan Fees - continued
the Distribution and Service Fee rates, total fees and amounts retained by FDC were as follows:
| Distribution
Fee | Service
Fee | Total Fees | Retained
by FDC |
Class A | -% | .25% | $ 13,476 | $ 686 |
Class T | .25% | .25% | 9,514 | 2 |
Class B | .75% | .25% | 6,768 | 5,080 |
Class C | .75% | .25% | 27,357 | 7,297 |
| | | $ 57,115 | $ 13,065 |
Sales Load. FDC may receive a front-end sales charge of up to 5.75% for selling Class A shares and 3.50% for selling Class T shares, some of which is paid to financial intermediaries for selling shares of the Fund. Depending on the holding period, FDC may receive contingent deferred sales charges levied on Class A, Class T, Class B, and Class C redemptions. The deferred sales charges range from 5.00% to 1.00% for Class B shares, 1.00% for Class C shares, 1.00% for certain purchases of Class A shares and .25% for certain purchases of Class T shares.
For the period, sales charge amounts retained by FDC were as follows:
| Retained
by FDC |
Class A | $ 8,921 |
Class T | 1,792 |
Class B* | 918 |
Class C* | 377 |
| $ 12,008 |
* When Class B and Class C shares are initially sold, FDC pays commissions from its own resources to financial intermediaries through which the sales are made.
Transfer Agent Fees. Fidelity Investments Institutional Operations Company, Inc. (FIIOC), an affiliate of FMR, is the transfer, dividend disbursing and shareholder servicing agent for each class of the Fund. FIIOC receives account fees and asset-based fees that vary according to the account size and type of account of the shareholders of the respective classes of the Fund. FIIOC pays for typesetting, printing and mailing of
Annual Report
6. Fees and Other Transactions with Affiliates - continued
Transfer Agent Fees - continued
shareholder reports, except proxy statements. For the period, transfer agent fees for each class were as follows:
| Amount | % of
Average
Net Assets |
Class A | $ 14,015 | .26 |
Class T | 5,823 | .31 |
Class B | 2,029 | .30 |
Class C | 7,486 | .27 |
Mega Cap Stock | 2,433,166 | .24 |
Institutional Class | 379,293 | .26 |
| $ 2,841,812 | |
Accounting and Security Lending Fees. Fidelity Service Company, Inc. (FSC), an affiliate of FMR, maintains the Fund's accounting records. The accounting fee is based on the level of average net assets for each month. Under a separate contract, FSC administers the security lending program. The security lending fee is based on the number and duration of lending transactions.
Brokerage Commissions. The Fund placed a portion of its portfolio transactions with brokerage firms which are affiliates of the investment adviser. The commissions paid to these affiliated firms were $29,554 for the period.
Interfund Lending Program. Pursuant to an Exemptive Order issued by the SEC, the Fund, along with other registered investment companies having management contracts with FMR, may participate in an interfund lending program. This program provides an alternative credit facility allowing the funds to borrow from, or lend money to, other participating affiliated funds. At period end, there were no interfund loans outstanding. The Fund's activity in this program during the period for which loans were outstanding was as follows:
Borrower or Lender | Average Loan
Balance | Weighted Average
Interest Rate | Interest
Expense |
Borrower | $ 38,846,643 | .41% | $ 6,238 |
7. Committed Line of Credit.
The Fund participates with other funds managed by FMR or an affiliate in a $4.25 billion credit facility (the "line of credit") to be utilized for temporary or emergency purposes to fund shareholder redemptions or for other short-term liquidity purposes. The Fund has
Annual Report
Notes to Financial Statements - continued
7. Committed Line of Credit - continued
agreed to pay commitment fees on its pro-rata portion of the line of credit, which amounted to $2,931 and is reflected in Miscellaneous expenses on the Statement of Operations. During the period, there were no borrowings on this line of credit.
8. Security Lending.
The Fund lends portfolio securities through a lending agent from time to time in order to earn additional income. For equity securities, a lending agent is used and may loan securities to certain qualified borrowers, including Fidelity Capital Markets (FCM), a broker-dealer affiliated with the Fund. On the settlement date of the loan, the Fund receives collateral (in the form of U.S. Treasury obligations, letters of credit and/or cash) against the loaned securities and maintains collateral in an amount not less than 100% of the market value of the loaned securities during the period of the loan. The market value of the loaned securities is determined at the close of business of the Fund and any additional required collateral is delivered to the Fund on the next business day. If the borrower defaults on its obligation to return the securities loaned because of insolvency or other reasons, a fund could experience delays and costs in recovering the securities loaned or in gaining access to the collateral. Any cash collateral received is invested in the Fidelity Securities Lending Cash Central Fund. At period end, there were no security loans outstanding. Security lending income represents the income earned on investing cash collateral, less rebates paid to borrowers and any lending agent fees associated with the loan, plus any premium payments received for lending certain types of securities. Security lending income is presented in the Statement of Operations as a component of income from Fidelity Central Funds. Total security lending income during the period amounted to $147,642. During the period, there were no securities loaned to FCM.
9. Bank Borrowings.
The Fund is permitted to have bank borrowings for temporary or emergency purposes to fund shareholder redemptions or for other short-term liquidity requirements. The Fund has established borrowing arrangements with certain banks. The interest rate on the borrowings is the bank's base rate, as revised from time to time. The average loan balance during the period for which loans were outstanding amounted to $3,312,000. The weighted average interest rate was .58%. The interest expense amounted to $53 under the bank borrowing program. At period end, there were no bank borrowings outstanding.
10. Expense Reductions.
Many of the brokers with whom FMR places trades on behalf of the Fund provided services to the Fund in addition to trade execution. These services included payments of certain expenses on behalf of the Fund totaling $26,452 for the period.
Annual Report
11. Distributions to Shareholders.
Distributions to shareholders of each class were as follows:
Years ended June 30, | 2012 | 2011 |
From net investment income | | |
Class A | $ 41,978 | $ 15,699 |
Class T | 11,957 | 4,295 |
Class B | 701 | - |
Class C | 10,116 | - |
Mega Cap Stock | 10,229,962 | 4,094,618 |
Institutional Class | 1,458,384 | 725,650 |
Total | $ 11,753,098 | $ 4,840,262 |
12. Share Transactions.
Transactions for each class of shares were as follows:
| Shares | Dollars |
Years ended June 30, | 2012 | 2011 | 2012 | 2011 |
Class A | | | | |
Shares sold | 486,313 | 220,973 | $ 5,118,655 | $ 2,204,584 |
Reinvestment of distributions | 3,634 | 1,526 | 35,610 | 14,210 |
Shares redeemed | (120,131) | (97,950) | (1,250,294) | (951,110) |
Net increase (decrease) | 369,816 | 124,549 | $ 3,903,971 | $ 1,267,684 |
Class T | | | | |
Shares sold | 105,560 | 70,794 | $ 1,103,327 | $ 699,083 |
Reinvestment of distributions | 1,213 | 459 | 11,925 | 4,248 |
Shares redeemed | (61,297) | (42,060) | (633,953) | (396,340) |
Net increase (decrease) | 45,476 | 29,193 | $ 481,299 | $ 306,991 |
Class B | | | | |
Shares sold | 9,865 | 19,392 | $ 101,146 | $ 183,567 |
Reinvestment of distributions | 69 | - | 689 | - |
Shares redeemed | (20,058) | (28,265) | (199,056) | (272,700) |
Net increase (decrease) | (10,124) | (8,873) | $ (97,221) | $ (89,133) |
Class C | | | | |
Shares sold | 229,191 | 96,864 | $ 2,376,452 | $ 975,147 |
Reinvestment of distributions | 856 | - | 8,451 | - |
Shares redeemed | (155,763) | (11,544) | (1,568,860) | (114,846) |
Net increase (decrease) | 74,284 | 85,320 | $ 816,043 | $ 860,301 |
Annual Report
Notes to Financial Statements - continued
12. Share Transactions - continued
| Shares | Dollars |
Years ended June 30, | 2012 | 2011 | 2012 | 2011 |
Mega Cap Stock | | | | |
Shares sold | 74,953,852 | 34,124,104 | $ 795,313,856 | $ 350,713,479 |
Reinvestment of distributions | 965,264 | 418,751 | 9,476,451 | 3,910,800 |
Shares redeemed | (35,350,283) | (20,989,740) | (369,162,567) | (199,951,600) |
Net increase (decrease) | 40,568,833 | 13,553,115 | $ 435,627,740 | $ 154,672,679 |
Institutional Class | | | | |
Shares sold | 7,943,118 | 16,010,762 | $ 80,524,837 | $ 148,274,212 |
Reinvestment of distributions | 144,898 | 75,239 | 1,415,456 | 703,651 |
Shares redeemed | (5,373,433) | (3,126,457) | (54,303,944) | (32,666,752) |
Net increase (decrease) | 2,714,583 | 12,959,544 | $ 27,636,349 | $ 116,311,111 |
13. Other.
The Fund's organizational documents provide former and current trustees and officers with a limited indemnification against liabilities arising in connection with the performance of their duties to the Fund. In the normal course of business, the Fund may also enter into contracts that provide general indemnifications. The Fund's maximum exposure under these arrangements is unknown as this would be dependent on future claims that may be made against the Fund. The risk of material loss from such claims is considered remote.
Annual Report
To the Trustees of Fidelity Hastings Street Trust and the Shareholders of Fidelity Mega Cap Stock Fund:
In our opinion, the accompanying statement of assets and liabilities, including the schedule of investments, and the related statements of operations and of changes in net assets and the financial highlights present fairly, in all material respects, the financial position of Fidelity Mega Cap Stock Fund (a fund of Fidelity Hastings Street Trust) at June 30, 2012, the results of its operations for the year then ended, the changes in its net assets for each of the two years in the period then ended and the financial highlights for each of the periods indicated, in conformity with accounting principles generally accepted in the United States of America. These financial statements and financial highlights (hereafter referred to as "financial statements") are the responsibility of the Fidelity Mega Cap Stock Fund's management. Our responsibility is to express an opinion on these financial statements based on our audits. We conducted our audits of these financial statements in accordance with the standards of the Public Company Accounting Oversight Board (United States). Those standards require that we plan and perform the audit to obtain reasonable assurance about whether the financial statements are free of material misstatement. An audit includes examining, on a test basis, evidence supporting the amounts and disclosures in the financial statements, assessing the accounting principles used and significant estimates made by management, and evaluating the overall financial statement presentation. We believe that our audits, which included confirmation of securities at June 30, 2012 by correspondence with the custodian and brokers, provide a reasonable basis for our opinion.
/s/ PricewaterhouseCoopers LLP
PricewaterhouseCoopers LLP
Boston, Massachusetts
August 10, 2012
Annual Report
The Trustees, Members of the Advisory Board, and executive officers of the trust and fund, as applicable, are listed below. The Board of Trustees governs the fund and is responsible for protecting the interests of shareholders. The Trustees are experienced executives who meet periodically throughout the year to oversee the fund's activities, review contractual arrangements with companies that provide services to the fund, oversee management of the risks associated with such activities and contractual arrangements, and review the fund's performance. Except for James C. Curvey, each of the Trustees oversees 228 funds advised by FMR or an affiliate. Mr. Curvey oversees 435 funds advised by FMR or an affiliate.
The Trustees hold office without limit in time except that (a) any Trustee may resign; (b) any Trustee may be removed by written instrument, signed by at least two-thirds of the number of Trustees prior to such removal; (c) any Trustee who requests to be retired or who has become incapacitated by illness or injury may be retired by written instrument signed by a majority of the other Trustees; and (d) any Trustee may be removed at any special meeting of shareholders by a two-thirds vote of the outstanding voting securities of the trust. Each Trustee who is not an interested person (as defined in the 1940 Act) (Independent Trustee), shall retire not later than the last day of the calendar year in which his or her 75th birthday occurs. The Independent Trustees may waive this mandatory retirement age policy with respect to individual Trustees. The executive officers and Advisory Board Members hold office without limit in time, except that any officer and Advisory Board Member may resign or may be removed by a vote of a majority of the Trustees at any regular meeting or any special meeting of the Trustees. Except as indicated, each individual has held the office shown or other offices in the same company for the past five years.
Experience, Skills, Attributes, and Qualifications of the Fund's Trustees. The Governance and Nominating Committee has adopted a statement of policy that describes the experience, qualifications, attributes, and skills that are necessary and desirable for potential Independent Trustee candidates (Statement of Policy). The Board believes that each Trustee satisfied at the time he or she was initially elected or appointed a Trustee, and continues to satisfy, the standards contemplated by the Statement of Policy. The Governance and Nominating Committee also engages professional search firms to help identify potential Independent Trustee candidates who have the experience, qualifications, attributes, and skills consistent with the Statement of Policy. From time to time, additional criteria based on the composition and skills of the current Independent Trustees, as well as experience or skills that may be appropriate in light of future changes to board composition, business conditions, and regulatory or other developments, have also been considered by the professional search firms and the Governance and Nominating Committee. In addition, the Board takes into account the Trustees' commitment and participation in Board and committee meetings, as well as their leadership of standing and ad hoc committees throughout their tenure.
In determining that a particular Trustee was and continues to be qualified to serve as a Trustee, the Board has considered a variety of criteria, none of which, in isolation, was controlling. The Board believes that, collectively, the Trustees have balanced and diverse experience, qualifications, attributes, and skills, which allow the Board to operate effectively in governing the fund and protecting the interests of shareholders. Information about the specific experience, skills, attributes, and qualifications of each Trustee, which in each case led to the Board's conclusion that the Trustee should serve (or continue to serve) as a trustee of the fund, is provided below.
Annual Report
Board Structure and Oversight Function. James C. Curvey is an interested person (as defined in the 1940 Act) and currently serves as Chairman. The Trustees have determined that an interested Chairman is appropriate and benefits shareholders because an interested Chairman has a personal and professional stake in the quality and continuity of services provided to the fund. Independent Trustees exercise their informed business judgment to appoint an individual of their choosing to serve as Chairman, regardless of whether the Trustee happens to be independent or a member of management. The Independent Trustees have determined that they can act independently and effectively without having an Independent Trustee serve as Chairman and that a key structural component for assuring that they are in a position to do so is for the Independent Trustees to constitute a substantial majority for the Board. The Independent Trustees also regularly meet in executive session. Ned C. Lautenbach serves as Chairman of the Independent Trustees and as such (i) acts as a liaison between the Independent Trustees and management with respect to matters important to the Independent Trustees and (ii) with management prepares agendas for Board meetings.
Fidelity funds are overseen by different Boards of Trustees. The fund's Board oversees Fidelity's equity and high income funds and another Board oversees Fidelity's investment-grade bond, money market, and asset allocation funds. The asset allocation funds may invest in Fidelity funds overseen by the fund's Board. The use of separate Boards, each with its own committee structure, allows the Trustees of each group of Fidelity funds to focus on the unique issues of the funds they oversee, including common research, investment, and operational issues. On occasion, the separate Boards establish joint committees to address issues of overlapping consequences for the Fidelity funds overseen by each Board.
The Trustees operate using a system of committees to facilitate the timely and efficient consideration of all matters of importance to the Trustees, the fund, and fund shareholders and to facilitate compliance with legal and regulatory requirements and oversight of the fund's activities and associated risks. The Board, acting through its committees, has charged FMR and its affiliates with (i) identifying events or circumstances the occurrence of which could have demonstrably adverse effects on the fund's business and/or reputation; (ii) implementing processes and controls to lessen the possibility that such events or circumstances occur or to mitigate the effects of such events or circumstances if they do occur; and (iii) creating and maintaining a system designed to evaluate continuously business and market conditions in order to facilitate the identification and implementation processes described in (i) and (ii) above. Because the day-to-day operations and activities of the fund are carried out by or through FMR, its affiliates and other service providers, the fund's exposure to risks is mitigated but not eliminated by the processes overseen by the Trustees. While each of the Board's committees has responsibility for overseeing different aspects of the fund's activities, oversight is exercised primarily through the Operations, Audit, and Compliance Committees. In addition, the Independent Trustees have worked with FMR to enhance the Board's oversight of investment and financial risks, legal and regulatory risks, technology risks, and operational risks, including the development of additional risk reporting to the Board. For example, a working group comprised of Independent Trustees and FMR has worked and continues to work to review the Fidelity funds' valuation-related activities, reporting and risk management. Appropriate personnel, including but not limited to the fund's Chief Compliance Officer (CCO), FMR's internal auditor, the independent accountants, the fund's Treasurer and portfolio management personnel, make periodic reports to the Board's committees, as appropriate, including an annual review of FMR's risk management program for the Fidelity funds. The responsibilities of each standing committee, including their oversight responsibilities, are described further under "Standing Committees of the Fund's Trustees."
Annual Report
Trustees and Officers - continued
The fund's Statement of Additional Information (SAI) includes more information about the Trustees. To request a free copy, call Fidelity at 1-877-208-0098.
Interested Trustees*:
Correspondence intended for each Trustee who is an interested person may be sent to Fidelity Investments, 82 Devonshire Street, Boston, Massachusetts 02109.
Name, Age; Principal Occupations and Other Relevant Experience+ |
James C. Curvey (77) |
| Year of Election or Appointment: 2007 Mr. Curvey is Trustee and Chairman of the Board of Trustees of certain Trusts. Mr. Curvey also serves as Trustee (2007-present) of other investment companies advised by FMR. Mr. Curvey is a Director of Fidelity Investments Money Management, Inc. (2009-present), Director of Fidelity Research & Analysis Co. (2009-present) and Director of FMR and FMR Co., Inc. (2007-present). Mr. Curvey is also Vice Chairman (2007-present) and Director of FMR LLC. In addition, Mr. Curvey serves as an Overseer for the Boston Symphony Orchestra and a member of the Trustees of Villanova University. Previously, Mr. Curvey was the Vice Chairman (2006-2007) and Director (2000-2007) of FMR Corp. |
Ronald P. O'Hanley (55) |
| Year of Election or Appointment: 2011 Mr. O'Hanley is Director of FMR Co., Inc. (2010-present), Director of Fidelity Investments Money Management, Inc. (2010-present), Director of Fidelity Research & Analysis Company (2010-present), President of Fidelity Asset Management and Corporate Services and a member of Fidelity's Executive Committee (2010-present). Previously, Mr. O'Hanley served as President and Chief Executive Officer of BNY Mellon Asset Management (2007-2010). Mr. O'Hanley also served as Vice Chairman of Bank New York Mellon Corp. and a member of that firm's Executive Committee. Prior to the 2007 merger of The Bank of New York and Mellon Financial Corporation, he was Vice Chairman of Mellon Financial Corporation and President and Chief Executive Officer of Mellon Asset Management. He joined Mellon in February 1997. Mr. O'Hanley currently serves as Chairman of the Boston Public Library Foundation Board of Directors and sits on the Board of Directors of Beth Israel Deaconess Medical Center, the Board of Trustees of the Marine Biological Laboratory and the Advisory Board of the Maxwell School of Citizenship and Public Administration at Syracuse University. Mr. O'Hanley also chairs the Council on Asset Management for the Financial Services Roundtable and is a member of the Board of Directors of Institutional Investor's U.S. Institute. |
* Trustees have been determined to be "Interested Trustees" by virtue of, among other things, their affiliation with the trust or various entities under common control with FMR.
+ The information above includes each Trustee's principal occupation during the last five years and other information relating to the experience, attributes, and skills relevant to each Trustee's qualifications to serve as a Trustee, which led to the conclusion that each Trustee should serve as a Trustee for the fund.
Annual Report
Trustees and Officers - continued
Independent Trustees:
Correspondence intended for each Independent Trustee (that is, the Trustees other than the Interested Trustees) may be sent to Fidelity Investments, P.O. Box 55235, Boston, Massachusetts 02205-5235.
Name, Age; Principal Occupations and Other Relevant Experience+ |
Dennis J. Dirks (64) |
| Year of Election or Appointment: 2005 Prior to his retirement in May 2003, Mr. Dirks was Chief Operating Officer and a member of the Board of The Depository Trust & Clearing Corporation (DTCC). He also served as President, Chief Operating Officer, and Board member of The Depository Trust Company (DTC) and President and Board member of the National Securities Clearing Corporation (NSCC). In addition, Mr. Dirks served as Chief Executive Officer and Board member of the Government Securities Clearing Corporation, Chief Executive Officer and Board member of the Mortgage-Backed Securities Clearing Corporation, as a Trustee and a member of the Finance Committee of Manhattan College (2005-2008), and as a Trustee and a member of the Finance Committee of AHRC of Nassau County (2006-2008). Mr. Dirks is a member of the Independent Directors Council (IDC) Governing Council (2010-present) and Board of Directors for The Brookville Center for Children's Services, Inc. (2009-present). |
Alan J. Lacy (58) |
| Year of Election or Appointment: 2008 Mr. Lacy serves as Senior Adviser (2007-present) of Oak Hill Capital Partners, L.P. (private equity). Mr. Lacy also served as Chief Executive Officer (2000-2005) and Vice Chairman (2005-2006) of Sears Holdings Corporation and Sears, Roebuck and Co. (retail). In addition, Mr. Lacy serves as a member of the Board of Directors of Dave & Buster's, Inc. (restaurant and entertainment complexes, 2010-present), The Hillman Companies, Inc. (hardware wholesalers, 2010-present), and Bristol-Myers Squibb Company (global pharmaceuticals, 2007-present). Mr. Lacy is a member of the Board of Trustees of The National Parks Conservation Association (2006-present). Previously, Mr. Lacy served as Chairman of the Board of Trustees of the National Parks Conservation Association (2008-2011) and as a member of the Board of Directors for the Western Union Company (global money transfer, 2006-2011). |
Ned C. Lautenbach (68) |
| Year of Election or Appointment: 2000 Mr. Lautenbach is Chairman of the Independent Trustees of the Equity and High Income Funds (2006-present). Mr. Lautenbach currently serves as the Lead Director of the Eaton Corporation Board of Directors (diversified industrial, 1997-present). Mr. Lautenbach is also a member of the Board of Directors of the Philharmonic Center for the Arts in Naples, Florida (1999-present); a member of the Board of Trustees of Fairfield University (2005-present); and a member of the Council on Foreign Relations (1994-present). Previously, Mr. Lautenbach was a Partner/Advisory Partner at Clayton, Dubilier & Rice, LLC (private equity investment, 1998-2010), as well as a Director of Sony Corporation (2006-2007). |
Joseph Mauriello (67) |
| Year of Election or Appointment: 2008 Prior to his retirement in January 2006, Mr. Mauriello served in numerous senior management positions including Deputy Chairman and Chief Operating Officer (2004-2005), and Vice Chairman of Financial Services (2002-2004) of KPMG LLP US (professional services, 1965-2005). Mr. Mauriello currently serves as a member of the Board of Directors of XL Group plc. (global insurance and re-insurance, 2006-present). Previously, Mr. Mauriello served as a Director of the Hamilton Funds of the Bank of New York (2006-2007) and Arcadia Resources Inc. (health care services and products, 2007-2012). |
Robert W. Selander (61) |
| Year of Election or Appointment: 2011 Previously, Mr. Selander served as a Member of the Advisory Board of Fidelity's Equity and High Income Funds (2011), Executive Vice Chairman (2010), Chief Executive Officer (2009-2010), and President and Chief Executive Officer (1997-2009) of Mastercard, Inc. |
Cornelia M. Small (67) |
| Year of Election or Appointment: 2005 Ms. Small is a member of the Board of Directors of the Teagle Foundation (2009-present). Ms. Small is also a member of the Investment Committee, and Chair (2008-present) and a member of the Board of Trustees of Smith College. In addition, Ms. Small serves on the Investment Committee of the Berkshire Taconic Community Foundation (2008-present). Previously, Ms. Small served as Chairperson of the Investment Committee (2002-2008) of Smith College. In addition, Ms. Small served as Chief Investment Officer, Director of Global Equity Investments, and a member of the Board of Directors of Scudder, Stevens & Clark and Scudder Kemper Investments. |
William S. Stavropoulos (73) |
| Year of Election or Appointment: 2001 Mr. Stavropoulos is Vice Chairman of the Independent Trustees of the Equity and High Income Funds (2006-present). Mr. Stavropoulos serves as President and Founder of the Michigan Baseball Foundation, the Great Lakes Loons (2007-present). Mr. Stavropoulos is Chairman Emeritus of the Board of Directors of The Dow Chemical Company, where he previously served in numerous senior management positions, including President, CEO (1995-2000; 2002-2004), Chairman of the Executive Committee (2000-2006), and as a member of the Board of Directors (1990-2006). Currently, Mr. Stavropoulos is Chairman of Univar (global distributor of commodity and specialty chemicals, 2010-present), a Director of Teradata Corporation (data warehousing and technology solutions, 2008-present), Chemical Financial Corporation, Maersk Inc. (industrial conglomerate), Tyco International, Inc. (multinational manufacturing and services, 2007-present), and a member of the Advisory Board for Metalmark Capital (private equity investment, 2005-present). Mr. Stavropoulos is a special advisor to Clayton, Dubilier & Rice, LLC (private equity investment). In addition, Mr. Stavropoulos is a member of the University of Notre Dame Advisory Council for the College of Science. |
David M. Thomas (63) |
| Year of Election or Appointment: 2008 Previously, Mr. Thomas served as Executive Chairman (2005-2006) and Chairman and Chief Executive Officer (2000-2005) of IMS Health, Inc. (pharmaceutical and healthcare information solutions). In addition, Mr. Thomas serves as a member of the Board of Directors of Fortune Brands, Inc. (consumer products), and Interpublic Group of Companies, Inc. (marketing communication, 2004-present). |
Michael E. Wiley (61) |
| Year of Election or Appointment: 2008 Mr. Wiley also serves as a Director of Asia Pacific Exploration Consolidated (international oil and gas exploration and production, 2008-present). Mr. Wiley serves as a Director of Tesoro Corporation (independent oil refiner and marketer, 2005-present), and a Director of Bill Barrett Corporation (exploration and production, 2005-present). In addition, Mr. Wiley also serves as a Director of Post Oak Bank (privately-held bank, 2004-present). Previously, Mr. Wiley served as a member of the Board of Trustees of the University of Tulsa (2000-2006; 2007-2010), as a Senior Energy Advisor of Katzenbach Partners, LLC (consulting, 2006-2007), as an Advisory Director of Riverstone Holdings (private investment), Chairman, President, and CEO of Baker Hughes, Inc. (oilfield services, 2000-2004), and as Director of Spinnaker Exploration Company (exploration and production, 2001-2005). |
Annual Report
+ The information above includes each Trustee's principal occupation during the last five years and other information relating to the experience, attributes, and skills relevant to each Trustee's qualifications to serve as a Trustee, which led to the conclusion that each Trustee should serve as a Trustee for the fund.
Advisory Board Members and Executive Officers:
Correspondence intended for each executive officer, Edward C. Johnson 3d, Peter S. Lynch, David A. Rosow, and Garnett A. Smith may be sent to Fidelity Investments, 82 Devonshire Street, Boston, Massachusetts 02109.
Name, Age; Principal Occupation |
Edward C. Johnson 3d (82) |
| Year of Election or Appointment: 2011 Member of the Advisory Board of Fidelity's Equity and High Income Funds. Mr. Johnson serves as Chief Executive Officer, Chairman, and a Director of FMR LLC, and also serves as Chairman and Director of FIL Limited. Previously, Mr. Johnson served as a Trustee and Chairman of the Board of certain Fidelity Trusts, Chairman and a Director of FMR, Chairman and a Director of FMR Co., Inc., and President of FMR LLC (2006-2007). |
Peter S. Lynch (68) |
| Year of Election or Appointment: 2003 Member of the Advisory Board of Fidelity's Equity and High Income Funds. Mr. Lynch is Vice Chairman and a Director of FMR and FMR Co., Inc. In addition, Mr. Lynch serves as a Trustee of Boston College and as the Chairman of the Inner-City Scholarship Fund. Previously, Mr. Lynch served on the Special Olympics International Board of Directors (1997-2006). |
David A. Rosow (69) |
| Year of Election or Appointment: 2012 Member of the Advisory Board of Fidelity's Equity and High Income Funds. Chairman and Chief Executive Officer of International Golf Group, Inc. (golf course development, 1990-present). Previously, Mr. Rosow served as Chairman and Chief Executive Officer of Rosow & Company, Inc. (private investment company, 1989-2011), a Lead Director of Hudson United Bancorp (2001-2006) and as a Director of TD Banknorth (1996-2006). In addition, Mr. Rosow is a member (2008-present) and President (2009-present) of the Town Council of Palm Beach, Florida. |
Garnett A. Smith (64) |
| Year of Election or Appointment: 2012 Member of the Advisory Board of Fidelity's Equity and High Income Funds. Prior to Mr. Smith's retirement, he served as Chairman and Chief Executive Officer of Inbrand Corp. (manufacturer of personal absorbent products, 1990-1997). He also served as President (1986-1990) of Inbrand Corp. Prior to his employment with Inbrand Corp., he was employed by a retail fabric chain and North Carolina National Bank. In addition, Mr. Smith is a board member of the Jackson Hole Land Trust (2009-present). |
Kenneth B. Robins (42) |
| Year of Election or Appointment: 2008 President and Treasurer of Fidelity's Equity and High Income Funds. Mr. Robins also serves as President and Treasurer (2010-present) and Assistant Treasurer (2009-present) of other Fidelity funds and is an employee of Fidelity Investments (2004-present). Previously, Mr. Robins served as Deputy Treasurer of the Fidelity funds (2005-2008) and Treasurer and Chief Financial Officer of The North Carolina Capital Management Trust: Cash and Term Portfolios (2006-2008). |
Bruce T. Herring (46) |
| Year of Election or Appointment: 2006 Vice President of certain Equity Funds. Mr. Herring also serves as President of Fidelity Research & Analysis Company (2010-present), Chief Investment Officer and Director of Fidelity Management & Research (U.K.) Inc. (2010-present) and Group Chief Investment Officer of FMR. Previously, Mr. Herring served as Vice President (2005-2006) and Senior Vice President (2006-2007) of Fidelity Management & Research Company, Vice President of FMR Co., Inc. (2001-2007) and as a portfolio manager for Fidelity U.S. Equity Funds. |
Brian B. Hogan (47) |
| Year of Election or Appointment: 2009 Vice President of Equity and High Income Funds. Mr. Hogan also serves as President of FMR's Equity Division (2009-present). Previously, Mr. Hogan served as Senior Vice President, Equity Research of FMR (2006-2009) and as a portfolio manager. |
Scott C. Goebel (44) |
| Year of Election or Appointment: 2008 Secretary and Chief Legal Officer (CLO) of the Fidelity funds. Mr. Goebel also serves as Secretary of Fidelity Investments Money Management, Inc. (FIMM) (2010-present) and Fidelity Research and Analysis Company (FRAC) (2010-present); Secretary and CLO of The North Carolina Capital Management Trust: Cash and Term Portfolios (2008-present); General Counsel, Secretary, and Senior Vice President of FMR (2008-present) and FMR Co., Inc. (2008-present); employed by FMR LLC or an affiliate (2001-present); Chief Legal Officer of Fidelity Management & Research (Hong Kong) Limited (2008-present) and Assistant Secretary of Fidelity Management & Research (Japan) Inc. (2008-present), and Fidelity Management & Research (U.K.) Inc. (2008-present). Previously, Mr. Goebel served as Assistant Secretary of FIMM (2008-2010), FRAC (2008-2010), and the Funds (2007-2008) and as Vice President and Secretary of Fidelity Distributors Corporation (FDC) (2005-2007). |
William C. Coffey (43) |
| Year of Election or Appointment: 2009 Assistant Secretary of Fidelity's Equity and High Income Funds. Mr. Coffey also serves as Senior Vice President and Deputy General Counsel of FMR LLC (2010-present), and is an employee of Fidelity Investments. Previously, Mr. Coffey served as Vice President and Associate General Counsel of FMR LLC (2005-2009). |
Elizabeth Paige Baumann (44) |
| Year of Election or Appointment: 2012 Anti-Money Laundering (AML) Officer of the Fidelity funds. Ms. Baumann also serves as AML Officer of The North Carolina Capital Management Trust: Cash and Term Portfolios (2012-present), Chief AML Officer of FMR LLC (2012-present), and is an employee of Fidelity Investments. Previously, Ms. Baumann served as Vice President and Deputy Anti-Money Laundering Officer (2007-2012). |
Christine Reynolds (53) |
| Year of Election or Appointment: 2008 Chief Financial Officer of the Fidelity funds. Ms. Reynolds became President of Fidelity Pricing and Cash Management Services (FPCMS) in August 2008. Ms. Reynolds served as Chief Operating Officer of FPCMS (2007-2008). Previously, Ms. Reynolds served as President, Treasurer, and Anti-Money Laundering officer of the Fidelity funds (2004-2007). |
Joseph A. Hanlon (44) |
| Year of Election or Appointment: 2012 Chief Compliance Officer of Fidelity's Equity and High Income Funds. Mr. Hanlon serves as Compliance Officer of FMR, FMR Co., Inc., Fidelity Investments Money Management, Inc. (FIMM), Fidelity Research and Analysis Company (FRAC), Fidelity Management & Research (Japan) Inc., Fidelity Management & Research (U.K.) Inc., Fidelity Management & Research (Hong Kong), and Strategic Advisers, Inc. (2009-present), as Senior Vice President of the Fidelity Asset Management Division (2009-present), and is an employee of Fidelity Investments. |
Joseph F. Zambello (55) |
| Year of Election or Appointment: 2011 Deputy Treasurer of the Fidelity funds. Mr. Zambello is an employee of Fidelity Investments. Previously, Mr. Zambello served as Vice President of FMR's Program Management Group (2009-2011) and Vice President of the Transfer Agent Oversight Group (2005-2009). |
Adrien E. Deberghes (44) |
| Year of Election or Appointment: 2008 Deputy Treasurer of Fidelity's Equity and High Income Funds. Mr. Deberghes also serves as Vice President (2011-present) and Assistant Treasurer (2010-present) of other Fidelity funds, and is an employee of Fidelity Investments (2008-present). Previously, Mr. Deberghes served as Senior Vice President of Mutual Fund Administration at State Street Corporation (2007-2008), Senior Director of Mutual Fund Administration at Investors Bank & Trust (2005-2007), and Director of Finance for Dunkin' Brands (2000-2005). |
Stephanie J. Dorsey (43) |
| Year of Election or Appointment: 2010 Assistant Treasurer of Fidelity's Equity and High Income Funds. Ms. Dorsey also serves as Deputy Treasurer of other Fidelity funds (2008-present) and is an employee of Fidelity Investments (2008-present). Previously, Ms. Dorsey served as Treasurer (2004-2008) of the JPMorgan Mutual Funds and Vice President (2004-2008) of JPMorgan Chase Bank. |
John R. Hebble (54) |
| Year of Election or Appointment: 2009 Assistant Treasurer of Fidelity's Equity and High Income Funds. Mr. Hebble also serves as President (2011-present), Treasurer, and Chief Financial Officer of The North Carolina Capital Management Trust: Cash and Term Portfolios (2008-present), President and Treasurer of other Fidelity funds (2008-present) and is an employee of Fidelity Investments. |
Gary W. Ryan (53) |
| Year of Election or Appointment: 2005 Assistant Treasurer of the Fidelity funds. Mr. Ryan is an employee of Fidelity Investments. Previously, Mr. Ryan served as Vice President of Fund Reporting in Fidelity Pricing and Cash Management Services (FPCMS) (1999-2005). |
Jonathan Davis (44) |
| Year of Election or Appointment: 2010 Assistant Treasurer of the Fidelity funds. Mr. Davis is also Assistant Treasurer of Fidelity Rutland Square Trust II and Fidelity Commonwealth Trust II. Mr. Davis is an employee of Fidelity Investments. Previously, Mr. Davis served as Vice President and Associate General Counsel of FMR LLC (2003-2010). |
Annual Report
Institutional Class designates 100% of the dividends distributed during the fiscal year as qualifying for the dividends-received deduction for corporate shareholders.
Institutional Class designates 100% of the dividends distributed during the fiscal year as amounts which may be taken into account as a dividend for the purposes of the maximum rate under section 1(h)(11) of the Internal Revenue Code.
The fund will notify shareholders in January 2013 of amounts for use in preparing 2012 income tax returns.
Annual Report
Investment Adviser
Fidelity Management & Research Company
Boston, MA
Investment Sub-Advisers
FMR Co., Inc.
Fidelity Management & Research
(U.K.) Inc.
Fidelity Management & Research
(Japan) Inc.
Fidelity Management & Research
(Hong Kong) Limited
General Distributor
Fidelity Distributors Corporation
Smithfield, RI
Transfer and Service Agents
Fidelity Investments Institutional Operations Company, Inc.
Boston, MA
Fidelity Service Company, Inc.
Boston, MA
Custodian
JPMorgan Chase Bank
New York, NY
AGIII-UANN-0812
1.855219.104
(Fidelity Investment logo)(registered trademark)
Item 2. Code of Ethics
As of the end of the period, June 30, 2012, Fidelity Hastings Street Trust (the trust) has adopted a code of ethics, as defined in Item 2 of Form N-CSR, that applies to its President and Treasurer and its Chief Financial Officer. A copy of the code of ethics is filed as an exhibit to this Form N-CSR.
Item 3. Audit Committee Financial Expert
The Board of Trustees of the trust has determined that Joseph Mauriello is an audit committee financial expert, as defined in Item 3 of Form N-CSR. Mr. Mauriello is independent for purposes of Item 3 of Form N-CSR.
Item 4. Principal Accountant Fees and Services
Fees and Services
The following table presents fees billed by PricewaterhouseCoopers LLP ("PwC") in each of the last two fiscal years for services rendered to Fidelity Fifty, Fidelity Fund, Fidelity Growth Discovery Fund, and Fidelity Mega Cap Stock Fund (the "Funds"):
Services Billed by PwC
June 30, 2012 FeesA
| Audit Fees | Audit-Related Fees | Tax Fees | All Other Fees |
Fidelity Fifty | $38,000 | $- | $3,300 | $1,800 |
Fidelity Fund | $66,000 | $- | $3,300 | $3,700 |
Fidelity Growth Discovery Fund | $42,000 | $- | $3,300 | $2,000 |
Fidelity Mega Cap Stock Fund | $40,000 | $- | $3,300 | $2,000 |
June 30, 2011 FeesA
| Audit Fees | Audit-Related Fees | Tax Fees | All Other Fees |
Fidelity Fifty | $38,000 | $- | $3,300 | $2,200 |
Fidelity Fund | $67,000 | $- | $3,300 | $4,800 |
Fidelity Growth Discovery Fund | $41,000 | $- | $3,300 | $2,300 |
Fidelity Mega Cap Stock Fund | $40,000 | $- | $3,300 | $2,200 |
A Amounts may reflect rounding.
The following table presents fees billed by PwC that were required to be approved by the Audit Committee for services that relate directly to the operations and financial reporting of the Funds and that are rendered on behalf of Fidelity Management & Research Company ("FMR") and entities controlling, controlled by, or under common control with FMR (not including any sub-adviser whose role is primarily portfolio management and is subcontracted with or overseen by another investment adviser) that provide ongoing services to the Funds ("Fund Service Providers"):
Services Billed by PwC
| June 30, 2012A | June 30, 2011A |
Audit-Related Fees | $4,255,000 | $2,200,000 |
Tax Fees | $- | $- |
All Other Fees | $- | $365,000 |
A Amounts may reflect rounding.
"Audit-Related Fees" represent fees billed for assurance and related services that are reasonably related to the performance of the fund audit or the review of the fund's financial statements and that are not reported under Audit Fees.
"Tax Fees" represent fees billed for tax compliance, tax advice or tax planning that relate directly to the operations and financial reporting of the fund.
"All Other Fees" represent fees billed for services provided to the fund or Fund Service Provider, a significant portion of which are assurance related, that relate directly to the operations and financial reporting of the fund, excluding those services that are reported under Audit Fees, Audit-Related Fees or Tax Fees.
Assurance services must be performed by an independent public accountant.
* * *
The aggregate non-audit fees billed by PwC for services rendered to the Funds, FMR (not including any sub-adviser whose role is primarily portfolio management and is subcontracted with or overseen by another investment adviser), and any Fund Service Provider for each of the last two fiscal years of the Funds are as follows:
Billed By | June 30, 2012 A | June 30, 2011 A |
PwC | $5,445,000 | $4,485,000 |
A Amounts may reflect rounding.
The trust's Audit Committee has considered non-audit services that were not pre-approved that were provided by PwC to Fund Service Providers to be compatible with maintaining the independence of PwC in its audit of the Funds, taking into account representations from PwC, in accordance with Public Company Accounting Oversight Board rules, regarding its independence from the Funds and their related entities and FMR's review of the appropriateness and permissibility under applicable law of such non-audit services prior to their provision to the Fund Service Providers.
Audit Committee Pre-Approval Policies and Procedures
The trust's Audit Committee must pre-approve all audit and non-audit services provided by a fund's independent registered public accounting firm relating to the operations or financial reporting of the fund. Prior to the commencement of any audit or non-audit services to a fund, the Audit Committee reviews the services to determine whether they are appropriate and permissible under applicable law.
The Audit Committee has adopted policies and procedures to, among other purposes, provide a framework for the Committee's consideration of non-audit services by the audit firms that audit the Fidelity funds. The policies and procedures require that any non-audit service provided by a fund audit firm to a Fidelity fund and any non-audit service provided by a fund auditor to a Fund Service Provider that relates directly to the operations and financial reporting of a Fidelity fund ("Covered Service") are subject to approval by the Audit Committee before such service is provided.
All Covered Services must be approved in advance of provision of the service either: (i) by formal resolution of the Audit Committee, or (ii) by oral or written approval of the service by the Chair of the Audit Committee (or if the Chair is unavailable, such other member of the Audit Committee as may be designated by the Chair to act in the Chair's absence). The approval contemplated by (ii) above is permitted where the Treasurer determines that action on such an engagement is necessary before the next meeting of the Audit Committee.
Non-audit services provided by a fund audit firm to a Fund Service Provider that do not relate directly to the operations and financial reporting of a Fidelity fund are reported to the Audit Committee on a periodic basis.
Non-Audit Services Approved Pursuant to Rule 2-01(c)(7)(i)(C) and (ii) of Regulation S-X ("De Minimis Exception")
There were no non-audit services approved or required to be approved by the Audit Committee pursuant to the De Minimis Exception during the Funds' last two fiscal years relating to services provided to (i) the Funds or (ii) any Fund Service Provider that relate directly to the operations and financial reporting of the Funds.
Item 5. Audit Committee of Listed Registrants
Not applicable.
Item 6. Investments
(a) Not applicable.
(b) Not applicable
Item 7. Disclosure of Proxy Voting Policies and Procedures for Closed-End Management Investment Companies
Not applicable.
Item 8. Portfolio Managers of Closed-End Management Investment Companies
Not applicable.
Item 9. Purchase of Equity Securities by Closed-End Management Investment Company and Affiliated Purchasers
Not applicable.
Item 10. Submission of Matters to a Vote of Security Holders
There were no material changes to the procedures by which shareholders may recommend nominees to the trust's Board of Trustees.
Item 11. Controls and Procedures
(a)(i) The President and Treasurer and the Chief Financial Officer have concluded that the trust's disclosure controls and procedures (as defined in Rule 30a-3(c) under the Investment Company Act) provide reasonable assurances that material information relating to the trust is made known to them by the appropriate persons, based on their evaluation of these controls and procedures as of a date within 90 days of the filing date of this report.
(a)(ii) There was no change in the trust's internal control over financial reporting (as defined in Rule 30a-3(d) under the Investment Company Act) that occurred during the second fiscal quarter of the period covered by this report that has materially affected, or is reasonably likely to materially affect, the trust's internal control over financial reporting.
Item 12. Exhibits
(a) | (1) | Code of Ethics pursuant to Item 2 of Form N-CSR is filed and attached hereto as EX-99.CODE ETH. |
(a) | (2) | Certification pursuant to Rule 30a-2(a) under the Investment Company Act of 1940 (17 CFR 270.30a-2(a)) is filed and attached hereto as Exhibit 99.CERT. |
(a) | (3) | Not applicable. |
(b) | | Certification pursuant to Rule 30a-2(b) under the Investment Company Act of 1940 (17 CFR 270.30a-2(b)) is furnished and attached hereto as Exhibit 99.906CERT. |
SIGNATURES
Pursuant to the requirements of the Securities Exchange Act of 1934 and the Investment Company Act of 1940, the registrant has duly caused this report to be signed on its behalf by the undersigned, thereunto duly authorized.
Fidelity Hastings Street Trust
By: | /s/Kenneth B. Robins |
| Kenneth B. Robins |
| President and Treasurer |
| |
Date: | August 27, 2012 |
Pursuant to the requirements of the Securities Exchange Act of 1934 and the Investment Company Act of 1940, this report has been signed below by the following persons on behalf of the registrant and in the capacities and on the dates indicated.
By: | /s/Kenneth B. Robins |
| Kenneth B. Robins |
| President and Treasurer |
| |
Date: | August 27, 2012 |
By: | /s/Christine Reynolds |
| Christine Reynolds |
| Chief Financial Officer |
| |
Date: | August 27, 2012 |