UNITED STATES
SECURITIES AND EXCHANGE COMMISSION
Washington, D.C. 20549
FORM N-CSR
CERTIFIED SHAREHOLDER REPORT OF REGISTERED
MANAGEMENT INVESTMENT COMPANIES
Investment Company Act file number 811-215
Fidelity Hastings Street Trust
(Exact name of registrant as specified in charter)
82 Devonshire St., Boston, Massachusetts 02109
(Address of principal executive offices) (Zip code)
Scott C. Goebel, Secretary
82 Devonshire St.
Boston, Massachusetts 02109
(Name and address of agent for service)
Registrant's telephone number, including area code: 617-563-7000
Date of fiscal year end: | June 30 |
|
|
Date of reporting period: | December 31, 2012 |
Item 1. Reports to Stockholders
(Fidelity Investment logo)(registered trademark)
Fidelity Advisor®
Mega Cap Stock
Fund - Class A, Class T, Class B
and Class C
Semiannual Report
December 31, 2012
(Fidelity Cover Art)
Class A, Class T, Class B,
and Class C are classes of
Fidelity® Mega Cap Stock Fund
Contents
Shareholder Expense Example | An example of shareholder expenses. | |
Investment Changes | A summary of major shifts in the fund's investments over the past six months. | |
Investments | A complete list of the fund's investments with their market values. | |
Financial Statements | Statements of assets and liabilities, operations, and changes in net assets, as well as financial highlights. | |
Notes | Notes to the financial statements. | |
Board Approval of Investment Advisory Contracts and Management Fees |
|
To view a fund's proxy voting guidelines and proxy voting record for the 12-month period ended June 30, visit http://www.fidelity.com/proxyvotingresults or visit the Securities and Exchange Commission's (SEC) web site at http://www.sec.gov. You may also call 1-877-208-0098 to request a free copy of the proxy voting guidelines.
Standard & Poor's, S&P and S&P 500 are registered service marks of The McGraw-Hill Companies, Inc. and have been licensed for use by Fidelity Distributors Corporation.
Other third party marks appearing herein are the property of their respective owners.
All other marks appearing herein are registered or unregistered trademarks or service marks of FMR LLC or an affiliated company. © 2013 FMR LLC. All rights reserved.
This report and the financial statements contained herein are submitted for the general information of the shareholders of the fund. This report is not authorized for distribution to prospective investors in the fund unless preceded or accompanied by an effective prospectus.
A fund files its complete schedule of portfolio holdings with the SEC for the first and third quarters of each fiscal year on Form N-Q. Forms N-Q are available on the SEC's web site at http://www.sec.gov. A fund's Forms N-Q may be reviewed and copied at the SEC's Public Reference Room in Washington, DC. Information regarding the operation of the SEC's Public Reference Room may be obtained by calling 1-800-SEC-0330. For a complete list of a fund's portfolio holdings, view the most recent holdings listing, semiannual report, or annual report on Fidelity's web site at http://www.fidelity.com, http://www.advisor.fidelity.com, or http://www.401k.com, as applicable.
NOT FDIC INSURED • MAY LOSE VALUE • NO BANK GUARANTEE
Neither the fund nor Fidelity Distributors Corporation is a bank.
Semiannual Report
Shareholder Expense Example
As a shareholder of the Fund, you incur two types of costs: (1) transaction costs, including sales charges (loads) on purchase payments or redemption proceeds, and (2) ongoing costs, including management fees, distribution and/or service (12b-1) fees and other Fund expenses. This Example is intended to help you understand your ongoing costs (in dollars) of investing in the Fund and to compare these costs with the ongoing costs of investing in other mutual funds.
The Example is based on an investment of $1,000 invested at the beginning of the period and held for the entire period (July 1, 2012 to December 31, 2012).
Actual Expenses
The first line of the accompanying table for each class of the Fund provides information about actual account values and actual expenses. You may use the information in this line, together with the amount you invested, to estimate the expenses that you paid over the period. Simply divide your account value by $1,000.00 (for example, an $8,600 account value divided by $1,000.00 = 8.6), then multiply the result by the number in the first line for a class of the Fund under the heading entitled "Expenses Paid During Period" to estimate the expenses you paid on your account during this period. A small balance maintenance fee of $12.00 that is charged once a year may apply for certain accounts with a value of less than $2,000. This fee is not included in the table below. If it was, the estimate of expenses you paid during the period would be higher, and your ending account value lower, by this amount. In addition, the Fund, as a shareholder in the underlying Fidelity Central Funds, will indirectly bear its pro-rata share of the fees and expenses incurred by the underlying Fidelity Central Funds. These fees and expenses are not included in the Fund's annualized expense ratio used to calculate the expense estimate in the table below.
Hypothetical Example for Comparison Purposes
The second line of the accompanying table for each class of the Fund provides information about hypothetical account values and hypothetical expenses based on a Class' actual expense ratio and an assumed rate of return of 5% per year before expenses, which is not the Class' actual return. The hypothetical account values and expenses may not be used to estimate the actual ending account balance or expenses you paid for the period. You may use this information to compare the ongoing costs of investing in the Fund and other funds. To do so, compare this 5% hypothetical example with the 5% hypothetical examples that appear in the shareholder reports of the other funds. A small balance maintenance fee of $12.00 that is charged once a year may apply for certain accounts with a value of less than $2,000. This fee is not included in the table below. If it was, the estimate of expenses you paid during the period would be higher, and your ending account value lower, by this amount. In addition, the Fund, as a shareholder in the underlying Fidelity Central Funds, will indirectly bear its pro-rata share of the fees and expenses incurred by the underlying Fidelity Central Funds. These fees and expenses are not included in the Fund's annualized expense ratio used to calculate the expense estimate in the table below.
Please note that the expenses shown in the table are meant to highlight your ongoing costs only and do not reflect any transaction costs. Therefore, the second line of the table is useful in comparing ongoing costs only, and will not help you determine the relative total costs of owning different funds. In addition, if these transactional costs were included, your costs would have been higher.
Semiannual Report
Shareholder Expense Example - continued
| Annualized | Beginning | Ending | Expenses Paid |
Class A | 1.00% |
|
|
|
Actual |
| $ 1,000.00 | $ 1,083.90 | $ 5.25 |
HypotheticalA |
| $ 1,000.00 | $ 1,020.16 | $ 5.09 |
Class T | 1.28% |
|
|
|
Actual |
| $ 1,000.00 | $ 1,081.80 | $ 6.72 |
HypotheticalA |
| $ 1,000.00 | $ 1,018.75 | $ 6.51 |
Class B | 1.80% |
|
|
|
Actual |
| $ 1,000.00 | $ 1,080.10 | $ 9.44 |
HypotheticalA |
| $ 1,000.00 | $ 1,016.13 | $ 9.15 |
Class C | 1.77% |
|
|
|
Actual |
| $ 1,000.00 | $ 1,079.50 | $ 9.28 |
HypotheticalA |
| $ 1,000.00 | $ 1,016.28 | $ 9.00 |
Mega Cap Stock | .71% |
|
|
|
Actual |
| $ 1,000.00 | $ 1,085.60 | $ 3.73 |
HypotheticalA |
| $ 1,000.00 | $ 1,021.63 | $ 3.62 |
Institutional Class | .75% |
|
|
|
Actual |
| $ 1,000.00 | $ 1,085.80 | $ 3.94 |
HypotheticalA |
| $ 1,000.00 | $ 1,021.42 | $ 3.82 |
A 5% return per year before expenses
* Expenses are equal to each Class' annualized expense ratio, multiplied by the average account value over the period, multiplied by 184/365 (to reflect the one-half year period).
Semiannual Report
Investment Changes (Unaudited)
Top Ten Stocks as of December 31, 2012 | ||
| % of fund's | % of fund's net assets |
Apple, Inc. | 5.0 | 6.1 |
JPMorgan Chase & Co. | 4.2 | 3.9 |
Wells Fargo & Co. | 3.5 | 4.2 |
General Electric Co. | 3.1 | 3.0 |
Chevron Corp. | 2.7 | 3.1 |
Google, Inc. Class A | 2.5 | 2.3 |
Exxon Mobil Corp. | 2.4 | 3.3 |
Microsoft Corp. | 2.4 | 2.7 |
Citigroup, Inc. | 2.2 | 1.5 |
Procter & Gamble Co. | 2.2 | 2.4 |
| 30.2 | |
Top Five Market Sectors as of December 31, 2012 | ||
| % of fund's | % of fund's net assets |
Information Technology | 19.4 | 20.9 |
Financials | 18.4 | 15.5 |
Health Care | 12.8 | 13.0 |
Energy | 12.6 | 14.0 |
Consumer Discretionary | 11.9 | 12.6 |
Asset Allocation (% of fund's net assets) | |||||||
As of December 31, 2012* | As of June 30, 2012** | ||||||
 | Stocks 98.9% |
| | Stocks 99.5% |
| ||
 | Convertible |
| | Convertible |
| ||
 | Short-Term |
| | Short-Term |
| ||
* Foreign investments | 8.0% |
| ** Foreign investments | 9.7% |
| ||

Semiannual Report
Investments December 31, 2012 (Unaudited)
Showing Percentage of Net Assets
Common Stocks - 98.8% | |||
Shares | Value | ||
CONSUMER DISCRETIONARY - 11.8% | |||
Auto Components - 0.5% | |||
Johnson Controls, Inc. | 340,800 | $ 10,462,560 | |
Automobiles - 0.5% | |||
Ford Motor Co. | 880,000 | 11,396,000 | |
Hotels, Restaurants & Leisure - 0.9% | |||
McDonald's Corp. | 164,500 | 14,510,545 | |
Yum! Brands, Inc. | 69,700 | 4,628,080 | |
| 19,138,625 | ||
Internet & Catalog Retail - 0.2% | |||
Priceline.com, Inc. (a) | 5,100 | 3,168,120 | |
Media - 5.8% | |||
Comcast Corp. Class A (special) (non-vtg.) | 1,269,800 | 45,649,310 | |
News Corp. Class A | 280,200 | 7,156,308 | |
The Walt Disney Co. | 272,100 | 13,547,859 | |
Thomson Reuters Corp. | 127,500 | 3,689,002 | |
Time Warner Cable, Inc. | 61,600 | 5,986,904 | |
Time Warner, Inc. | 733,400 | 35,078,522 | |
Viacom, Inc. Class B (non-vtg.) | 220,300 | 11,618,622 | |
| 122,726,527 | ||
Multiline Retail - 1.6% | |||
Target Corp. | 566,300 | 33,507,971 | |
Specialty Retail - 2.3% | |||
Home Depot, Inc. | 156,700 | 9,691,895 | |
Lowe's Companies, Inc. | 1,090,900 | 38,748,768 | |
| 48,440,663 | ||
TOTAL CONSUMER DISCRETIONARY | 248,840,466 | ||
CONSUMER STAPLES - 10.3% | |||
Beverages - 2.6% | |||
PepsiCo, Inc. | 343,000 | 23,471,490 | |
The Coca-Cola Co. | 882,800 | 32,001,500 | |
| 55,472,990 | ||
Food & Staples Retailing - 2.1% | |||
CVS Caremark Corp. | 301,400 | 14,572,690 | |
Walgreen Co. | 807,400 | 29,881,874 | |
| 44,454,564 | ||
Common Stocks - continued | |||
Shares | Value | ||
CONSUMER STAPLES - continued | |||
Food Products - 1.1% | |||
Danone SA | 111,900 | $ 7,395,384 | |
Kellogg Co. | 294,200 | 16,431,070 | |
| 23,826,454 | ||
Household Products - 3.3% | |||
Colgate-Palmolive Co. | 10,900 | 1,139,486 | |
Kimberly-Clark Corp. | 253,000 | 21,360,790 | |
Procter & Gamble Co. | 693,200 | 47,061,348 | |
| 69,561,624 | ||
Personal Products - 0.1% | |||
L'Oreal SA | 15,100 | 2,101,051 | |
Tobacco - 1.1% | |||
British American Tobacco PLC sponsored ADR | 165,000 | 16,706,250 | |
Philip Morris International, Inc. | 68,530 | 5,731,849 | |
| 22,438,099 | ||
TOTAL CONSUMER STAPLES | 217,854,782 | ||
ENERGY - 12.6% | |||
Energy Equipment & Services - 2.1% | |||
Halliburton Co. | 574,500 | 19,929,405 | |
National Oilwell Varco, Inc. | 106,600 | 7,286,110 | |
Schlumberger Ltd. | 241,900 | 16,761,251 | |
| 43,976,766 | ||
Oil, Gas & Consumable Fuels - 10.5% | |||
Apache Corp. | 174,905 | 13,730,043 | |
BG Group PLC | 156,500 | 2,610,390 | |
BP PLC sponsored ADR | 239,600 | 9,976,944 | |
Canadian Natural Resources Ltd. | 363,100 | 10,454,593 | |
Chevron Corp. | 525,100 | 56,784,314 | |
Exxon Mobil Corp. | 584,571 | 50,594,620 | |
Occidental Petroleum Corp. | 327,500 | 25,089,775 | |
Royal Dutch Shell PLC Class A sponsored ADR | 333,206 | 22,974,554 | |
Suncor Energy, Inc. | 640,900 | 21,075,539 | |
The Williams Companies, Inc. | 277,400 | 9,082,076 | |
| 222,372,848 | ||
TOTAL ENERGY | 266,349,614 | ||
Common Stocks - continued | |||
Shares | Value | ||
FINANCIALS - 18.4% | |||
Capital Markets - 3.1% | |||
BlackRock, Inc. Class A | 46,800 | $ 9,674,028 | |
Charles Schwab Corp. | 1,395,200 | 20,035,072 | |
Morgan Stanley | 1,492,400 | 28,534,688 | |
State Street Corp. | 36,100 | 1,697,061 | |
UBS AG | 253,700 | 3,970,121 | |
| 63,910,970 | ||
Commercial Banks - 5.2% | |||
PNC Financial Services Group, Inc. | 172,400 | 10,052,644 | |
Standard Chartered PLC (United Kingdom) | 257,607 | 6,666,804 | |
U.S. Bancorp | 601,100 | 19,199,134 | |
Wells Fargo & Co. | 2,164,030 | 73,966,545 | |
| 109,885,127 | ||
Diversified Financial Services - 8.2% | |||
Bank of America Corp. | 2,663,000 | 30,890,800 | |
Citigroup, Inc. | 1,193,870 | 47,229,497 | |
CME Group, Inc. | 117,500 | 5,958,425 | |
JPMorgan Chase & Co. | 2,025,300 | 89,052,441 | |
| 173,131,163 | ||
Insurance - 1.9% | |||
AFLAC, Inc. | 108,500 | 5,763,520 | |
American International Group, Inc. (a) | 158,300 | 5,587,990 | |
MetLife, Inc. | 712,300 | 23,463,162 | |
Prudential Financial, Inc. | 105,900 | 5,647,647 | |
| 40,462,319 | ||
TOTAL FINANCIALS | 387,389,579 | ||
HEALTH CARE - 12.8% | |||
Biotechnology - 0.9% | |||
Amgen, Inc. | 212,890 | 18,376,665 | |
Health Care Equipment & Supplies - 0.7% | |||
Baxter International, Inc. | 121,700 | 8,112,522 | |
Stryker Corp. | 112,200 | 6,150,804 | |
| 14,263,326 | ||
Health Care Providers & Services - 3.5% | |||
Aetna, Inc. | 309,500 | 14,329,850 | |
Cardinal Health, Inc. | 99,500 | 4,097,410 | |
McKesson Corp. | 269,900 | 26,169,504 | |
Common Stocks - continued | |||
Shares | Value | ||
HEALTH CARE - continued | |||
Health Care Providers & Services - continued | |||
UnitedHealth Group, Inc. | 149,900 | $ 8,130,576 | |
WellPoint, Inc. | 351,600 | 21,419,472 | |
| 74,146,812 | ||
Life Sciences Tools & Services - 0.4% | |||
Thermo Fisher Scientific, Inc. | 123,300 | 7,864,074 | |
Pharmaceuticals - 7.3% | |||
Abbott Laboratories | 280,200 | 18,353,100 | |
Eli Lilly & Co. | 300,900 | 14,840,388 | |
GlaxoSmithKline PLC sponsored ADR | 225,200 | 9,789,444 | |
Johnson & Johnson | 576,800 | 40,433,680 | |
Merck & Co., Inc. | 1,100,700 | 45,062,658 | |
Pfizer, Inc. | 881,300 | 22,103,004 | |
Sanofi SA | 34,424 | 3,264,423 | |
| 153,846,697 | ||
TOTAL HEALTH CARE | 268,497,574 | ||
INDUSTRIALS - 9.1% | |||
Aerospace & Defense - 2.6% | |||
Honeywell International, Inc. | 140,200 | 8,898,494 | |
Precision Castparts Corp. | 11,300 | 2,140,446 | |
Raytheon Co. | 179,000 | 10,303,240 | |
The Boeing Co. | 225,400 | 16,986,144 | |
United Technologies Corp. | 205,400 | 16,844,854 | |
| 55,173,178 | ||
Air Freight & Logistics - 1.4% | |||
United Parcel Service, Inc. Class B | 403,400 | 29,742,682 | |
Electrical Equipment - 0.3% | |||
Emerson Electric Co. | 136,200 | 7,213,152 | |
Industrial Conglomerates - 3.6% | |||
Danaher Corp. | 164,100 | 9,173,190 | |
General Electric Co. | 3,145,500 | 66,024,045 | |
| 75,197,235 | ||
Machinery - 0.6% | |||
Cummins, Inc. | 33,700 | 3,651,395 | |
Illinois Tool Works, Inc. | 139,100 | 8,458,671 | |
| 12,110,066 | ||
Common Stocks - continued | |||
Shares | Value | ||
INDUSTRIALS - continued | |||
Road & Rail - 0.6% | |||
Norfolk Southern Corp. | 54,400 | $ 3,364,096 | |
Union Pacific Corp. | 71,100 | 8,938,692 | |
| 12,302,788 | ||
TOTAL INDUSTRIALS | 191,739,101 | ||
INFORMATION TECHNOLOGY - 19.4% | |||
Communications Equipment - 2.5% | |||
Cisco Systems, Inc. | 1,782,500 | 35,026,125 | |
QUALCOMM, Inc. | 303,900 | 18,847,878 | |
| 53,874,003 | ||
Computers & Peripherals - 5.7% | |||
Apple, Inc. | 198,201 | 105,647,079 | |
Dell, Inc. | 447,300 | 4,531,149 | |
EMC Corp. (a) | 372,300 | 9,419,190 | |
| 119,597,418 | ||
Internet Software & Services - 2.5% | |||
Google, Inc. Class A (a) | 74,750 | 53,025,408 | |
IT Services - 4.2% | |||
Accenture PLC Class A | 40,500 | 2,693,250 | |
Automatic Data Processing, Inc. | 25,900 | 1,476,559 | |
Cognizant Technology Solutions Corp. Class A (a) | 242,300 | 17,942,315 | |
IBM Corp. | 89,800 | 17,201,190 | |
MasterCard, Inc. Class A | 54,900 | 26,971,272 | |
Visa, Inc. Class A | 140,800 | 21,342,464 | |
| 87,627,050 | ||
Semiconductors & Semiconductor Equipment - 0.4% | |||
Broadcom Corp. Class A | 161,200 | 5,353,452 | |
Samsung Electronics Co. Ltd. | 1,931 | 2,792,551 | |
| 8,146,003 | ||
Software - 4.1% | |||
Adobe Systems, Inc. (a) | 140,900 | 5,309,112 | |
Microsoft Corp. | 1,875,600 | 50,134,788 | |
Oracle Corp. | 563,200 | 18,765,824 | |
Common Stocks - continued | |||
Shares | Value | ||
INFORMATION TECHNOLOGY - continued | |||
Software - continued | |||
salesforce.com, Inc. (a) | 32,800 | $ 5,513,680 | |
VMware, Inc. Class A (a) | 65,700 | 6,184,998 | |
| 85,908,402 | ||
TOTAL INFORMATION TECHNOLOGY | 408,178,284 | ||
MATERIALS - 1.8% | |||
Chemicals - 1.8% | |||
Air Products & Chemicals, Inc. | 100,000 | 8,402,000 | |
E.I. du Pont de Nemours & Co. | 222,900 | 10,023,813 | |
Monsanto Co. | 28,100 | 2,659,665 | |
Syngenta AG (Switzerland) | 25,700 | 10,382,449 | |
The Dow Chemical Co. | 190,600 | 6,160,192 | |
| 37,628,119 | ||
TELECOMMUNICATION SERVICES - 1.4% | |||
Diversified Telecommunication Services - 0.8% | |||
Verizon Communications, Inc. | 407,300 | 17,623,871 | |
Wireless Telecommunication Services - 0.6% | |||
Vodafone Group PLC sponsored ADR | 493,600 | 12,433,784 | |
TOTAL TELECOMMUNICATION SERVICES | 30,057,655 | ||
UTILITIES - 1.2% | |||
Electric Utilities - 1.1% | |||
Duke Energy Corp. | 70,099 | 4,472,316 | |
FirstEnergy Corp. | 316,800 | 13,229,568 | |
NextEra Energy, Inc. | 77,300 | 5,348,387 | |
| 23,050,271 | ||
Multi-Utilities - 0.1% | |||
PG&E Corp. | 72,500 | 2,913,050 | |
TOTAL UTILITIES | 25,963,321 | ||
TOTAL COMMON STOCKS (Cost $1,895,210,670) |
| ||
Preferred Stocks - 0.2% | |||
Shares | Value | ||
Convertible Preferred Stocks - 0.1% | |||
INDUSTRIALS - 0.1% | |||
Aerospace & Defense - 0.1% | |||
United Technologies Corp. 7.50% | 32,400 | $ 1,805,004 | |
Nonconvertible Preferred Stocks - 0.1% | |||
CONSUMER DISCRETIONARY - 0.1% | |||
Automobiles - 0.1% | |||
Volkswagen AG | 14,500 | 3,327,010 | |
TOTAL PREFERRED STOCKS (Cost $4,353,318) |
| ||
Money Market Funds - 1.1% | |||
|
|
|
|
Fidelity Cash Central Fund, 0.18% (b) | 23,617,422 |
| |
TOTAL INVESTMENT PORTFOLIO - 100.1% (Cost $1,923,181,410) | 2,111,247,931 | ||
NET OTHER ASSETS (LIABILITIES) - (0.1)% | (2,800,194) | ||
NET ASSETS - 100% | $ 2,108,447,737 | ||
Legend |
(a) Non-income producing |
(b) Affiliated fund that is available only to investment companies and other accounts managed by Fidelity Investments. The rate quoted is the annualized seven-day yield of the fund at period end. A complete unaudited listing of the fund's holdings as of its most recent quarter end is available upon request. In addition, each Fidelity Central Fund's financial statements are available on the SEC's website or upon request. |
Affiliated Central Funds |
Information regarding fiscal year to date income earned by the Fund from investments in Fidelity Central Funds is as follows: |
Fund | Income earned |
Fidelity Cash Central Fund | $ 25,141 |
Fidelity Securities Lending Cash Central Fund | 10,371 |
Total | $ 35,512 |
Other Information |
The following is a summary of the inputs used, as of December 31, 2012, involving the Fund's assets and liabilities carried at fair value. The inputs or methodology used for valuing securities may not be an indication of the risk associated with investing in those securities. For more information on valuation inputs, and their aggregation into the levels used in the table below, please refer to the Investment Valuation section in the accompanying Notes to Financial Statements. |
Valuation Inputs at Reporting Date: | ||||
Description | Total | Level 1 | Level 2 | Level 3 |
Investments in Securities: | ||||
Equities: | ||||
Consumer Discretionary | $ 252,167,476 | $ 248,840,466 | $ 3,327,010 | $ - |
Consumer Staples | 217,854,782 | 208,358,347 | 9,496,435 | - |
Energy | 266,349,614 | 263,739,224 | 2,610,390 | - |
Financials | 387,389,579 | 376,752,654 | 10,636,925 | - |
Health Care | 268,497,574 | 265,233,151 | 3,264,423 | - |
Industrials | 193,544,105 | 193,544,105 | - | - |
Information Technology | 408,178,284 | 405,385,733 | 2,792,551 | - |
Materials | 37,628,119 | 27,245,670 | 10,382,449 | - |
Telecommunication Services | 30,057,655 | 30,057,655 | - | - |
Utilities | 25,963,321 | 25,963,321 | - | - |
Money Market Funds | 23,617,422 | 23,617,422 | - | - |
Total Investments in Securities: | $ 2,111,247,931 | $ 2,068,737,748 | $ 42,510,183 | $ - |
See accompanying notes which are an integral part of the financial statements.
Semiannual Report
Financial Statements
Statement of Assets and Liabilities
| December 31, 2012 (Unaudited) | |
|
|
|
Assets | ||
Investment in securities, at value - See accompanying schedule: Unaffiliated issuers (cost $1,899,563,988) | $ 2,087,630,509 |
|
Fidelity Central Funds (cost $23,617,422) | 23,617,422 |
|
Total Investments (cost $1,923,181,410) |
| $ 2,111,247,931 |
Foreign currency held at value (cost $1,033) | 1,040 | |
Receivable for investments sold | 11,827,281 | |
Receivable for fund shares sold | 6,531,288 | |
Dividends receivable | 2,785,543 | |
Distributions receivable from Fidelity Central Funds | 7,158 | |
Prepaid expenses | 6,184 | |
Other receivables | 52,213 | |
Total assets | 2,132,458,638 | |
|
|
|
Liabilities | ||
Payable for investments purchased | $ 12,657,134 | |
Payable for fund shares redeemed | 10,097,825 | |
Accrued management fee | 792,160 | |
Distribution and service plan fees payable | 8,565 | |
Other affiliated payables | 412,519 | |
Other payables and accrued expenses | 42,698 | |
Total liabilities | 24,010,901 | |
|
|
|
Net Assets | $ 2,108,447,737 | |
Net Assets consist of: |
| |
Paid in capital | $ 2,012,526,102 | |
Distributions in excess of net investment income | (413,817) | |
Accumulated undistributed net realized gain (loss) on investments and foreign currency transactions | (91,729,788) | |
Net unrealized appreciation (depreciation) on investments and assets and liabilities in foreign currencies | 188,065,240 | |
Net Assets | $ 2,108,447,737 | |
See accompanying notes which are an integral part of the financial statements.
Semiannual Report
Financial Statements - continued
Statement of Assets and Liabilities - continued
| December 31, 2012 (Unaudited) | |
|
|
|
Calculation of Maximum Offering Price Class A: | $ 11.83 | |
|
|
|
Maximum offering price per share (100/94.25 of $11.83) | $ 12.55 | |
Class T: | $ 11.84 | |
|
|
|
Maximum offering price per share (100/96.50 of $11.84) | $ 12.27 | |
Class B: | $ 11.81 | |
|
|
|
Class C: | $ 11.76 | |
|
|
|
|
|
|
Mega Cap Stock: | $ 11.89 | |
|
|
|
Institutional Class: | $ 11.86 | |
A Redemption price per share is equal to net asset value less any applicable contingent deferred sales charge.
See accompanying notes which are an integral part of the financial statements.
Semiannual Report
Statement of Operations
Six months ended December 31, 2012 (Unaudited) | ||
|
|
|
Investment Income |
|
|
Dividends |
| $ 23,024,455 |
Income from Fidelity Central Funds |
| 35,512 |
Total income |
| 23,059,967 |
|
|
|
Expenses | ||
Management fee | $ 4,398,759 | |
Transfer agent fees | 2,048,390 | |
Distribution and service plan fees | 43,985 | |
Accounting and security lending fees | 293,454 | |
Custodian fees and expenses | 32,299 | |
Independent trustees' compensation | 6,128 | |
Registration fees | 65,517 | |
Audit | 28,150 | |
Legal | 6,640 | |
Miscellaneous | 5,232 | |
Total expenses before reductions | 6,928,554 | |
Expense reductions | (45,420) | 6,883,134 |
Net investment income (loss) | 16,176,833 | |
Realized and Unrealized Gain (Loss) Net realized gain (loss) on: | ||
Investment securities: |
|
|
Unaffiliated issuers | 28,828,865 | |
Foreign currency transactions | (27,841) | |
Total net realized gain (loss) |
| 28,801,024 |
Change in net unrealized appreciation (depreciation) on: Investment securities | 106,962,766 | |
Assets and liabilities in foreign currencies | 2,670 | |
Total change in net unrealized appreciation (depreciation) |
| 106,965,436 |
Net gain (loss) | 135,766,460 | |
Net increase (decrease) in net assets resulting from operations | $ 151,943,293 | |
See accompanying notes which are an integral part of the financial statements.
Semiannual Report
Financial Statements - continued
Statement of Changes in Net Assets
| Six months ended December 31, 2012 (Unaudited) | Year ended |
Increase (Decrease) in Net Assets |
|
|
Operations |
|
|
Net investment income (loss) | $ 16,176,833 | $ 17,903,977 |
Net realized gain (loss) | 28,801,024 | 43,198,122 |
Change in net unrealized appreciation(depreciation) | 106,965,436 | 29,098,949 |
Net increase (decrease) in net assets resulting | 151,943,293 | 90,201,048 |
Distributions to shareholders from net investmentincome | (27,575,493) | (11,753,098) |
Share transactions - net increase (decrease) | 506,733,530 | 468,368,181 |
Total increase (decrease) in net assets | 631,101,330 | 546,816,131 |
|
|
|
Net Assets | ||
Beginning of period | 1,477,346,407 | 930,530,276 |
End of period (including distributions in excess of net investment income of $413,817 and undistributed net investment income of $10,984,843, respectively) | $ 2,108,447,737 | $ 1,477,346,407 |
See accompanying notes which are an integral part of the financial statements.
Semiannual Report
Financial Highlights - Class A
| Six months ended | Years ended June 30, | ||||
| (Unaudited) | 2012 | 2011 | 2010 | 2009 | 2008 H |
Selected Per-Share Data |
|
|
|
|
| |
Net asset value, beginning of period | $ 11.05 | $ 10.37 | $ 8.07 | $ 7.20 | $ 9.89 | $ 10.61 |
Income from Investment Operations |
|
|
|
|
|
|
Net investment income (loss) E | .08 | .13 | .07 | .06 | .10 | .05 |
Net realized and unrealized gain (loss) | .84 | .64 | 2.28 | .92 | (2.65) | (.77) |
Total from investment operations | .92 | .77 | 2.35 | .98 | (2.55) | (.72) |
Distributions from net investment income | (.14) | (.09) | (.05) | (.11) | (.12) | - |
Distributions from net realized gain | - | - | - | - | (.02) | - |
Total distributions | (.14) | (.09) | (.05) | (.11) | (.14) | - |
Net asset value, end of period | $ 11.83 | $ 11.05 | $ 10.37 | $ 8.07 | $ 7.20 | $ 9.89 |
Total Return B, C, D | 8.39% | 7.57% | 29.23% | 13.65% | (25.98)% | (6.79)% |
Ratios to Average Net Assets F, I |
|
|
|
|
| |
Expenses before reductions | 1.00% A | 1.02% | 1.06% | 1.10% | 1.13% | 1.02% A |
Expenses net of fee waivers, if any | 1.00% A | 1.02% | 1.06% | 1.10% | 1.13% | 1.02% A |
Expenses net of all reductions | .99% A | 1.02% | 1.06% | 1.10% | 1.13% | 1.01% A |
Net investment income (loss) | 1.41% A | 1.28% | .76% | .66% | 1.44% | 1.24% A |
Supplemental Data |
|
|
|
|
|
|
Net assets, end of period (000 omitted) | $ 13,400 | $ 8,527 | $ 4,169 | $ 2,238 | $ 806 | $ 106 |
Portfolio turnover rate G | 26% A | 57% | 53% | 97% | 138% | 97% |
A Annualized
B Total returns for periods of less than one year are not annualized.
C Total returns would have been lower if certain expenses had not been reduced during the applicable periods shown.
D Total returns do not include the effect of the sales charges.
E Calculated based on average shares outstanding during the period.
F Fees and expenses of any underlying Fidelity Central Funds are not included in the Fund's expense ratio. The Fund indirectly bears its proportionate share of the expenses of any underlying Fidelity Central Funds.
G Amount does not include the portfolio activity of any underlying Fidelity Central Funds.
H For the period February 5, 2008 (commencement of sale of shares) to June 30, 2008.
I Expense ratios reflect operating expenses of the class. Expenses before reductions do not reflect amounts reimbursed by the investment adviser or reductions from brokerage service arrangements or reductions from other expense offset arrangements and do not represent the amount paid by the class during periods when reimbursements or reductions occur. Expense ratios before reductions for start--up periods may not be representative of longer-term operating periods. Expenses net of fee waivers reflect expenses after reimbursement by the investment adviser but prior to reductions from brokerage service arrangements or other expense offset arrangements. Expenses net of all reductions represent the net expenses paid by the class.
See accompanying notes which are an integral part of the financial statements.
Semiannual Report
Financial Highlights - Class T
| Six months ended | Years ended June 30, | ||||
| (Unaudited) | 2012 | 2011 | 2010 | 2009 | 2008 H |
Selected Per-Share Data |
|
|
|
|
| |
Net asset value, beginning of period | $ 11.05 | $ 10.38 | $ 8.07 | $ 7.20 | $ 9.88 | $ 10.61 |
Income from InvestmentOperations |
|
|
|
|
| |
Net investment income (loss) E | .06 | .10 | .05 | .03 | .09 | .04 |
Net realized and unrealized gain (loss) | .84 | .64 | 2.29 | .93 | (2.67) | (.77) |
Total from investment operations | .90 | .74 | 2.34 | .96 | (2.58) | (.73) |
Distributions from net investment income | (.11) | (.07) | (.03) | (.09) | (.08) | - |
Distributions from net realized gain | - | - | - | - | (.02) | - |
Total distributions | (.11) | (.07) | (.03) | (.09) | (.10) | - |
Net asset value, end of period | $ 11.84 | $ 11.05 | $ 10.38 | $ 8.07 | $ 7.20 | $ 9.88 |
Total Return B, C, D | 8.18% | 7.19% | 29.08% | 13.32% | (26.21)% | (6.88)% |
Ratios to Average Net Assets F, I |
|
|
|
|
| |
Expenses before reductions | 1.28% A | 1.32% | 1.32% | 1.36% | 1.36% | 1.32% A |
Expenses net of fee waivers, if any | 1.28% A | 1.32% | 1.32% | 1.36% | 1.36% | 1.32% A |
Expenses net of all reductions | 1.28% A | 1.32% | 1.32% | 1.35% | 1.36% | 1.32% A |
Net investment income (loss) | 1.12% A | .98% | .50% | .41% | 1.21% | .89% A |
Supplemental Data |
|
|
|
|
|
|
Net assets, end of period (000 omitted) | $ 5,090 | $ 2,293 | $ 1,682 | $ 1,073 | $ 446 | $ 136 |
Portfolio turnover rate G | 26% A | 57% | 53% | 97% | 138% | 97% |
A Annualized
B Total returns for periods of less than one year are not annualized.
C Total returns would have been lower if certain expenses had not been reduced during the applicable periods shown.
D Total returns do not include the effect of the sales charges.
E Calculated based on average shares outstanding during the period.
F Fees and expenses of any underlying Fidelity Central Funds are not included in the Fund's expense ratio. The Fund indirectly bears its proportionate share of the expenses of any underlying Fidelity Central Funds.
G Amount does not include the portfolio activity of any underlying Fidelity Central Funds.
H For the period February 5, 2008 (commencement of sale of shares) to June 30, 2008.
I Expense ratios reflect operating expenses of the class. Expenses before reductions do not reflect amounts reimbursed by the investment adviser or reductions from brokerage service arrangements or reductions from other expense offset arrangements and do not represent the amount paid by the class during periods when reimbursements or reductions occur. Expense ratios before reductions for start-up periods may not be representative of longer-term operating periods. Expenses net of fee waivers reflect expenses after reimbursement by the investment adviser but prior to reductions from brokerage service arrangements or other expense offset arrangements. Expenses net of all reductions represent the net expenses paid by the class.
See accompanying notes which are an integral part of the financial statements.
Semiannual Report
Financial Highlights - Class B
| Six months ended | Years ended June 30, | ||||
| (Unaudited) | 2012 | 2011 | 2010 | 2009 | 2008 I |
Selected Per-Share Data |
|
|
|
|
| |
Net asset value, beginning of period | $ 10.97 | $ 10.30 | $ 8.02 | $ 7.19 | $ 9.87 | $ 10.61 |
Income from InvestmentOperations |
|
|
|
|
| |
Net investment income (loss) E | .03 | .05 | - K | (.01) | .05 | .02 |
Net realized and unrealized gain (loss) | .85 | .63 | 2.28 | .92 | (2.66) | (.76) |
Total from investment operations | .88 | .68 | 2.28 | .91 | (2.61) | (.74) |
Distributions from net investment income | (.04) | (.01) | - | (.08) | (.05) | - |
Distributions from net realized gain | - | - | - | - | (.02) | - |
Total distributions | (.04) | (.01) | - | (.08) | (.07) | - |
Net asset value, end of period | $ 11.81 | $ 10.97 | $ 10.30 | $ 8.02 | $ 7.19 | $ 9.87 |
Total Return B, C, D | 8.01% | 6.62% | 28.43% | 12.60% | (26.56)% | (6.97)% |
Ratios to Average Net Assets F, J |
|
|
|
|
| |
Expenses before reductions | 1.80% A | 1.82% | 1.83% | 1.88% | 1.88% | 1.73% A |
Expenses net of fee waivers, if any | 1.80% A | 1.82% | 1.83% | 1.88% | 1.88% | 1.73% A |
Expenses net of all reductions | 1.80% A | 1.81% | 1.82% | 1.88% | 1.88% | 1.73% A |
Net investment income (loss) | .60% A | .49% | .00%H | (.12)% | .68% | .52% A |
Supplemental Data |
|
|
|
|
|
|
Net assets, end of period (000 omitted) | $ 656 | $ 704 | $ 764 | $ 667 | $ 263 | $ 107 |
Portfolio turnover rate G | 26% A | 57% | 53% | 97% | 138% | 97% |
A Annualized
B Total returns for periods of less than one year are not annualized.
C Total returns would have been lower if certain expenses had not been reduced during the applicable periods shown.
D Total returns do not include the effect of the contingent deferred sales charge.
E Calculated based on average shares outstanding during the period.
F Fees and expenses of any underlying Fidelity Central Funds are not included in the Fund's expense ratio. The Fund indirectly bears its proportionate share of the expenses of any underlying Fidelity Central Funds.
G Amount does not include the portfolio activity of any underlying Fidelity Central Funds.
H Amount represents less than .01%.
I For the period February 5, 2008 (commencement of sale of shares) to June 30, 2008.
J Expense ratios reflect operating expenses of the class. Expenses before reductions do not reflect amounts reimbursed by the investment adviser or reductions from brokerage service arrangements or reductions from other expense offset arrangements and do not represent the amount paid by the class during periods when reimbursements or reductions occur. Expense ratios before reductions for start-up periods may not be representative of longer-term operating periods. Expenses net of fee waivers reflect expenses after reimbursement by the investment adviser but prior to reductions from brokerage service arrangements or other expense offset arrangements. Expenses net of all reductions represent the net expenses paid by the class.
K Amount represents less than $.01 per share.
See accompanying notes which are an integral part of the financial statements.
Semiannual Report
Financial Highlights - Class C
| Six months ended | Years ended June 30, | ||||
| (Unaudited) | 2012 | 2011 | 2010 | 2009 | 2008 H |
Selected Per-Share Data |
|
|
|
|
| |
Net asset value, beginning of period | $ 10.93 | $ 10.28 | $ 8.01 | $ 7.16 | $ 9.87 | $ 10.61 |
Income from Investment |
|
|
|
|
| |
Net investment income (loss) E | .04 | .05 | - J | (.01) | .05 | .02 |
Net realized and unrealized gain (loss) | .83 | .64 | 2.27 | .92 | (2.66) | (.76) |
Total from investment operations | .87 | .69 | 2.27 | .91 | (2.61) | (.74) |
Distributions from net investment income | (.04) | (.04) | - | (.06) | (.08) | - |
Distributions from net realized gain | - | - | - | - | (.02) | - |
Total distributions | (.04) | (.04) | - | (.06) | (.10) | - |
Net asset value, end of period | $ 11.76 | $ 10.93 | $ 10.28 | $ 8.01 | $ 7.16 | $ 9.87 |
Total Return B, C, D | 7.95% | 6.74% | 28.34% | 12.72% | (26.56)% | (6.97)% |
Ratios to Average Net Assets F, I |
|
|
|
|
| |
Expenses before reductions | 1.77% A | 1.79% | 1.81% | 1.86% | 1.88% | 1.71% A |
Expenses net of fee waivers, if any | 1.77% A | 1.79% | 1.81% | 1.86% | 1.88% | 1.71% A |
Expenses net of all reductions | 1.76% A | 1.79% | 1.81% | 1.85% | 1.88% | 1.71% A |
Net investment income (loss) | .63% A | .51% | .01% | (.10)% | .69% | .55% A |
Supplemental Data |
|
|
|
|
|
|
Net assets, end of period (000 omitted) | $ 4,300 | $ 2,845 | $ 1,913 | $ 807 | $ 470 | $ 98 |
Portfolio turnover rate G | 26% A | 57% | 53% | 97% | 138% | 97% |
A Annualized
B Total returns for periods of less than one year are not annualized.
C Total returns would have been lower if certain expenses had not been reduced during the applicable periods shown.
D Total returns do not include the effect of the contingent deferred sales charge.
E Calculated based on average shares outstanding during the period.
F Fees and expenses of any underlying Fidelity Central Funds are not included in the Fund's expense ratio. The Fund indirectly bears its proportionate share of the expenses of any underlying Fidelity Central Funds.
G Amount does not include the portfolio activity of any underlying Fidelity Central Funds.
H For the period February 5, 2008 (commencement of sale of shares) to June 30, 2008.
I Expense ratios reflect operating expenses of the class. Expenses before reductions do not reflect amounts reimbursed by the investment adviser or reductions from brokerage service arrangements or reductions from other expense offset arrangements and do not represent the amount paid by the class during periods when reimbursements or reductions occur. Expense ratios before reductions for start-up periods may not be representative of longer-term operating periods. Expenses net of fee waivers reflect expenses after reimbursement by the investment adviser but prior to reductions from brokerage service arrangements or other expense offset arrangements. Expenses net of all reductions represent the net expenses paid by the class.
J Amount represents less than $.01 per share.
See accompanying notes which are an integral part of the financial statements.
Semiannual Report
Financial Highlights - Mega Cap Stock
| Six months ended | Years ended June 30, | ||||
| (Unaudited) | 2012 | 2011 | 2010 | 2009 | 2008 |
Selected Per-Share Data |
|
|
|
|
| |
Net asset value, beginning of period | $ 11.11 | $ 10.43 | $ 8.11 | $ 7.23 | $ 9.91 | $ 12.06 |
Income from Investment |
|
|
|
|
| |
Net investment income (loss) D | .10 | .16 | .10 | .08 | .13 | .14 |
Net realized and unrealized gain (loss) | .85 | .64 | 2.29 | .93 | (2.67) | (1.60) |
Total from investment operations | .95 | .80 | 2.39 | 1.01 | (2.54) | (1.46) |
Distributions from net investmentincome | (.17) | (.12) | (.07) | (.13) | (.12) | (.07) |
Distributions from net realized gain | - | - | - | - | (.02) | (.62) |
Total distributions | (.17) | (.12) | (.07) | (.13) | (.14) | (.69) |
Net asset value, end of period | $ 11.89 | $ 11.11 | $ 10.43 | $ 8.11 | $ 7.23 | $ 9.91 |
Total Return B, C | 8.56% | 7.83% | 29.61% | 13.93% | (25.77)% | (12.73)% |
Ratios to Average Net Assets E, G |
|
|
|
|
| |
Expenses before reductions | .71% A | .76% | .79% | .81% | .79% | .75% |
Expenses net of fee waivers, if any | .71% A | .76% | .79% | .80% | .78% | .74% |
Expenses net of all reductions | .70% A | .75% | .78% | .79% | .78% | .74% |
Net investment income (loss) | 1.69% A | 1.55% | 1.04% | .96% | 1.78% | 1.28% |
Supplemental Data |
|
|
|
|
|
|
Net assets, end of period (000 omitted) | $ 1,775,218 | $ 1,287,144 | $ 785,233 | $ 500,407 | $ 253,164 | $ 667,542 |
Portfolio turnover rate F | 26% A | 57% | 53% | 97% | 138% | 97% |
A Annualized
B Total returns for periods of less than one year are not annualized.
C Total returns would have been lower if certain expenses had not been reduced during the applicable periods shown.
D Calculated based on average shares outstanding during the period.
E Fees and expenses of any underlying Fidelity Central Funds are not included in the Fund's expense ratio. The Fund indirectly bears its proportionate share of the expenses of any underlying Fidelity Central Funds.
F Amount does not include the portfolio activity of any underlying Fidelity Central Funds.
G Expense ratios reflect operating expenses of the class. Expenses before reductions do not reflect amounts reimbursed by the investment adviser or reductions from brokerage service arrangements or reductions from other expense offset arrangements and do not represent the amount paid by the class during periods when reimbursements or reductions occur. Expenses net of fee waivers reflect expenses after reimbursement by the investment adviser but prior to reductions from brokerage service arrangements or other expense offset arrangements. Expenses net of all reductions represent the net expenses paid by the class.
See accompanying notes which are an integral part of the financial statements.
Semiannual Report
Financial Highlights - Institutional Class
| Six months ended | Years ended June 30, | ||||
| (Unaudited) | 2012 | 2011 | 2010 | 2009 | 2008 G |
Selected Per-Share Data |
|
|
|
|
| |
Net asset value, beginning of period | $ 11.08 | $ 10.40 | $ 8.09 | $ 7.22 | $ 9.91 | $ 10.61 |
Income from Investment |
|
|
|
|
| |
Net investment income (loss) D | .10 | .16 | .10 | .08 | .13 | .07 |
Net realized and unrealized gain (loss) | .85 | .63 | 2.30 | .92 | (2.67) | (.77) |
Total from investment operations | .95 | .79 | 2.40 | 1.00 | (2.54) | (.70) |
Distributions from net investment income | (.17) | (.11) | (.09) | (.13) | (.13) | - |
Distributions from net realized gain | - | - | - | - | (.02) | - |
Total distributions | (.17) | (.11) | (.09) | (.13) | (.15) | - |
Net asset value, end of period | $ 11.86 | $ 11.08 | $ 10.40 | $ 8.09 | $ 7.22 | $ 9.91 |
Total Return B, C | 8.58% | 7.77% | 29.74% | 13.89% | (25.81)% | (6.60)% |
Ratios to Average Net Assets E,H |
|
|
|
|
| |
Expenses before reductions | .75% A | .78% | .79% | .88% | .77% | .70% A |
Expenses net of fee waivers, if any | .75% A | .78% | .79% | .88% | .77% | .70% A |
Expenses net of all reductions | .74% A | .77% | .78% | .87% | .77% | .70% A |
Net investment income (loss) | 1.65% A | 1.53% | 1.04% | .88% | 1.79% | 1.57% A |
Supplemental Data |
|
|
|
|
|
|
Net assets, end of period (000 omitted) | $ 309,785 | $ 175,833 | $ 136,768 | $ 1,568 | $ 515 | $ 93 |
Portfolio turnover rate F | 26% A | 57% | 53% | 97% | 138% | 97% |
A Annualized
B Total returns for periods of less than one year are not annualized.
C Total returns would have been lower if certain expenses had not been reduced during the applicable periods shown.
D Calculated based on average shares outstanding during the period.
E Fees and expenses of any underlying Fidelity Central Funds are not included in the Fund's expense ratio. The Fund indirectly bears its proportionate share of the expenses of any underlying Fidelity Central Funds.
F Amount does not include the portfolio activity of any underlying Fidelity Central Funds.
G For the period February 5, 2008 (commencement of sale of shares) to June 30, 2008.
H Expense ratios reflect operating expenses of the class. Expenses before reductions do not reflect amounts reimbursed by the investment adviser or reductions from brokerage service arrangements or reductions from other expense offset arrangements and do not represent the amount paid by the class during periods when reimbursements or reductions occur. Expense ratios before reductions for start-up periods may not be representative of longer-term operating periods. Expenses net of fee waivers reflect expenses after reimbursement by the investment adviser but prior to reductions from brokerage service arrangements or other expense offset arrangements. Expenses net of all reductions represent the net expenses paid by the class.
See accompanying notes which are an integral part of the financial statements.
Semiannual Report
Notes to Financial Statements
For the period ended December 31, 2012 (Unaudited)
1. Organization.
Fidelity® Mega Cap Stock Fund (the Fund) is a fund of Fidelity Hastings Street Trust (the Trust) and is authorized to issue an unlimited number of shares. The Trust is registered under the Investment Company Act of 1940, as amended (the 1940 Act), as an open-end management investment company organized as a Massachusetts business trust. The Fund offers Class A, Class T, Class C, Mega Cap Stock, and Institutional Class shares, each of which, along with Class B shares, has equal rights as to assets and voting privileges. Class B shares are closed to new accounts and additional purchases, except for exchanges and reinvestments. Each class has exclusive voting rights with respect to matters that affect that class. Class B shares will automatically convert to Class A shares after a holding period of seven years from the initial date of purchase. Investment income, realized and unrealized capital gains and losses, the common expenses of the Fund, and certain fund-level expense reductions, if any, are allocated on a pro-rata basis to each class based on the relative net assets of each class to the total net assets of the Fund. Each class differs with respect to transfer agent and distribution and service plan fees incurred. Certain expense reductions may also differ by class.
2. Investments in Fidelity Central Funds.
The Fund invests in Fidelity Central Funds, which are open-end investment companies available only to other investment companies and accounts managed by Fidelity Management & Research Company (FMR) and its affiliates. The Fund's Schedule of Investments lists each of the Fidelity Central Funds held as of period end, if any, as an investment of the Fund, but does not include the underlying holdings of each Fidelity Central Fund. As an Investing Fund, the Fund indirectly bears its proportionate share of the expenses of the underlying Fidelity Central Funds.
The Money Market Central Funds seek preservation of capital and current income and are managed by Fidelity Investments Money Management, Inc. (FIMM), an affiliate of FMR.
A complete unaudited list of holdings for each Fidelity Central Fund is available upon request or at the Securities and Exchange Commission (the SEC) website at www.sec.gov. In addition, the financial statements of the Fidelity Central Funds are available on the SEC website or upon request.
3. Significant Accounting Policies.
The financial statements have been prepared in conformity with accounting principles generally accepted in the United States of America (GAAP), which require management to make certain estimates and assumptions at the date of the financial statements. Actual results could differ from those estimates. Subsequent events, if any, through the date that the financial statements were issued have been evaluated in the preparation of
Semiannual Report
3. Significant Accounting Policies - continued
the financial statements. The following summarizes the significant accounting policies of the Fund:
Investment Valuation. Investments are valued as of 4:00 p.m. Eastern time on the last calendar day of the period. In accordance with valuation policies and procedures approved by the Board of Trustees (the Board), the Fund attempts to obtain prices from one or more third party pricing vendors or brokers to value its investments. When current market prices, quotations or rates are not readily available or reliable, investments will be fair valued in good faith by the FMR Fair Value Committee (the Committee), in accordance with procedures adopted by the Fund's Board. Factors used in determining fair value vary by investment type and may include market or investment specific events. The frequency with which these procedures are used cannot be predicted and they may be utilized to a significant extent. The Committee oversees the Fund's valuation policies and procedures and is responsible for approving and reporting to the Board all fair value determinations.
The Fund categorizes the inputs to valuation techniques used to value its investments into a disclosure hierarchy consisting of three levels as shown below:
Level 1 - quoted prices in active markets for identical investments
Level 2 - other significant observable inputs (including quoted prices for similar investments, interest rates, prepayment speeds, etc.)
Level 3 - unobservable inputs (including the Fund's own assumptions based on the best information available)
Valuation techniques used to value the Fund's investments by major category are as follows:
Equity securities, including restricted securities, for which market quotations are readily available, are valued at the last reported sale price or official closing price as reported by a third party pricing vendor on the primary market or exchange on which they are traded and are categorized as Level 1 in the hierarchy. In the event there were no sales during the day or closing prices are not available, securities are valued at the last quoted bid price or may be valued using the last available price and are generally categorized as Level 2 in the hierarchy. For foreign equity securities, when significant market or security specific events arise, comparisons to the valuation of American Depositary Receipts (ADRs), futures contracts, Exchange-Traded Funds (ETFs) and certain indexes as well as quoted prices for similar securities are used and are categorized as Level 2 in the hierarchy. Utilizing these techniques may result in transfers between Level 1 and Level 2.
Semiannual Report
Notes to Financial Statements (Unaudited) - continued
3. Significant Accounting Policies - continued
Investment Valuation - continued
Investments in open-end mutual funds, including the Fidelity Central Funds, are valued at their closing net asset value (NAV) each business day and are categorized as Level 1 in the hierarchy.
Changes in valuation techniques may result in transfers in or out of an assigned level within the disclosure hierarchy. The aggregate value of investments by input level, as of December 31, 2012, is included at the end of the Fund's Schedule of Investments.
Foreign Currency. The Fund may use foreign currency contracts to facilitate transactions in foreign-denominated securities. Gains and losses from these transactions may arise from changes in the value of the foreign currency or if the counterparties do not perform under the contracts' terms.
Foreign-denominated assets, including investment securities, and liabilities are translated into U.S. dollars at the exchange rates at period end. Purchases and sales of investment securities, income and dividends received and expenses denominated in foreign currencies are translated into U.S. dollars at the exchange rate in effect on the transaction date.
The effects of exchange rate fluctuations on investments are included with the net realized and unrealized gain (loss) on investment securities. Other foreign currency transactions resulting in realized and unrealized gain (loss) are disclosed separately.
Investment Transactions and Income. For financial reporting purposes, the Fund's investment holdings and NAV include trades executed through the end of the last business day of the period. The NAV per share for processing shareholder transactions is calculated as of the close of business of the New York Stock Exchange (NYSE), normally 4:00 p.m. Eastern time and includes trades executed through the end of the prior business day. Gains and losses on securities sold are determined on the basis of identified cost and may include proceeds received from litigation. Dividend income is recorded on the ex-dividend date, except for certain dividends from foreign securities where the ex-dividend date may have passed, which are recorded as soon as the Fund is informed of the ex-dividend date. Non-cash dividends included in dividend income, if any, are recorded at the fair market value of the securities received. Distributions received on securities that represent a return of capital or capital gain are recorded as a reduction of cost of investments and/or as a realized gain. The Fund estimates the components of distributions received that may be considered return of capital distributions or capital gain distributions. Interest income and distributions from the Fidelity Central Funds are accrued as earned. Investment income is recorded net of foreign taxes withheld where recovery of such taxes is uncertain.
Semiannual Report
3. Significant Accounting Policies - continued
Expenses. Expenses directly attributable to a fund are charged to that fund. Expenses attributable to more than one fund are allocated among the respective funds on the basis of relative net assets or other appropriate methods. Expense estimates are accrued in the period to which they relate and adjustments are made when actual amounts are known.
Income Tax Information and Distributions to Shareholders. Each year, the Fund intends to qualify as a regulated investment company under Subchapter M of the Internal Revenue Code, including distributing substantially all of its taxable income and realized gains. As a result, no provision for income taxes is required. The Fund files a U.S. federal tax return, in addition to state and local tax returns as required. A fund's federal income tax returns are subject to examination by the Internal Revenue Service (IRS) for a period of three fiscal years after they are filed. State and local tax returns may be subject to examination for an additional fiscal year depending on the jurisdiction. Foreign taxes are provided for based on the Fund's understanding of the tax rules and rates that exist in the foreign markets in which it invests.
Distributions are declared and recorded on the ex-dividend date. Income dividends and capital gain distributions are declared separately for each class. Income and capital gain distributions are determined in accordance with income tax regulations, which may differ from GAAP.
Capital accounts within the financial statements are adjusted for permanent book-tax differences. These adjustments have no impact on net assets or the results of operations. Temporary book-tax differences will reverse in a subsequent period.
Book-tax differences are primarily due to foreign currency transactions, market discount, futures transactions, equity-debt classifications, capital loss carryforwards, and losses deferred due to wash sales.
The federal tax cost of investment securities and unrealized appreciation (depreciation) as of period end were as follows:
Gross unrealized appreciation | $ 224,061,201 |
Gross unrealized depreciation | (42,793,431) |
Net unrealized appreciation (depreciation) on securities and other investments | $ 181,267,770 |
|
|
Tax cost | $ 1,929,980,161 |
Capital loss carryforwards are only available to offset future capital gains of the Fund to the extent provided by regulations and may be limited. Under the Regulated Investment Company Modernization Act of 2010 (the Act), the Fund is permitted to carry forward capital losses incurred in taxable years beginning after December 22, 2010 for an
Semiannual Report
Notes to Financial Statements (Unaudited) - continued
3. Significant Accounting Policies - continued
Income Tax Information and Distributions to Shareholders - continued
unlimited period and such capital losses are required to be used prior to any losses that expire. At June 30, 2012, capital loss carryforwards were as follows:
Fiscal year of expiration |
|
2017 | $ (3,091,486) |
2018 | (109,353,222) |
Total capital loss carryforward | $ (112,444,708) |
4. Purchases and Sales of Investments.
Purchases and sales of securities, other than short-term securities, aggregated $727,046,610 and $247,233,949, respectively.
5. Fees and Other Transactions with Affiliates.
Management Fee. FMR and its affiliates provide the Fund with investment management related services for which the Fund pays a monthly management fee. The management fee is the sum of an individual fund fee rate that is based on an annual rate of .20% of the Fund's average net assets and an annualized group fee rate that averaged .26% during the period. The group fee rate is based upon the average net assets of all the mutual funds advised by FMR. The group fee rate decreases as assets under management increase and increases as assets under management decrease. For the period, the total annualized management fee rate was .46% of the Fund's average net assets.
Distribution and Service Plan Fees. In accordance with Rule 12b-1 of the 1940 Act, the Fund has adopted separate Distribution and Service Plans for each class of shares. Certain classes pay Fidelity Distributors Corporation (FDC), an affiliate of FMR, separate Distribution and Service Fees, each of which is based on an annual percentage of each class' average net assets. In addition, FDC may pay financial intermediaries for selling shares of the Fund and providing shareholder support services. For the period, the Distribution and Service Fee rates, total fees and amounts retained by FDC were as follows:
| Distribution | Service | Total Fees | Retained |
Class A | -% | .25% | $ 13,508 | $ 272 |
Class T | .25% | .25% | 9,224 | - |
Class B | .75% | .25% | 3,554 | 2,666 |
Class C | .75% | .25% | 17,699 | 6,562 |
|
|
| $ 43,985 | $ 9,500 |
Semiannual Report
5. Fees and Other Transactions with Affiliates - continued
Sales Load. FDC may receive a front-end sales charge of up to 5.75% for selling Class A shares and 3.50% for selling Class T shares, some of which is paid to financial intermediaries for selling shares of the Fund. Depending on the holding period, FDC may receive contingent deferred sales charges levied on Class A, Class T, Class B, and Class C redemptions. The deferred sales charges range from 5.00% to 1.00% for Class B shares, 1.00% for Class C shares, 1.00% for certain purchases of Class A shares and .25% for certain purchases of Class T shares.
For the period, sales charge amounts retained by FDC were as follows:
| Retained |
Class A | $ 8,445 |
Class T | 868 |
Class B* | 218 |
Class C* | 496 |
| $ 10,027 |
* When Class B and Class C shares are initially sold, FDC pays commissions from its own resources to financial intermediaries through which the sales are made.
Transfer Agent Fees. Fidelity Investments Institutional Operations Company, Inc. (FIIOC), an affiliate of FMR, is the transfer, dividend disbursing and shareholder servicing agent for each class of the Fund. FIIOC receives account fees and asset-based fees that vary according to the account size and type of account of the shareholders of the respective classes of the Fund. FIIOC pays for typesetting, printing and mailing of shareholder reports, except proxy statements. For the period, transfer agent fees for each class were as follows:
| Amount | % of |
Class A | $ 13,124 | .24 |
Class T | 5,162 | .28 |
Class B | 1,068 | .30 |
Class C | 4,653 | .26 |
Mega Cap Stock | 1,679,362 | .21 |
Institutional Class | 345,021 | .25 |
| $ 2,048,390 |
|
* Annualized
Accounting and Security Lending Fees. Fidelity Service Company, Inc. (FSC), an affiliate of FMR, maintains the Fund's accounting records. The accounting fee is based on the level of average net assets for each month. Under a separate contract, FSC
Semiannual Report
Notes to Financial Statements (Unaudited) - continued
5. Fees and Other Transactions with Affiliates - continued
Accounting and Security Lending Fees - continued
administers the security lending program. The security lending fee is based on the number and duration of lending transactions.
Brokerage Commissions. The Fund placed a portion of its portfolio transactions with brokerage firms which are affiliates of the investment adviser. The commissions paid to these affiliated firms were $16,707 for the period.
6. Committed Line of Credit.
The Fund participates with other funds managed by FMR or an affiliate in a $4.25 billion credit facility (the "line of credit") to be utilized for temporary or emergency purposes to fund shareholder redemptions or for other short-term liquidity purposes. The Fund has agreed to pay commitment fees on its pro-rata portion of the line of credit, which amounted to $2,016 and is reflected in Miscellaneous expenses on the Statement of Operations. During the period, there were no borrowings on this line of credit.
7. Security Lending.
The Fund lends portfolio securities through a lending agent from time to time in order to earn additional income. For equity securities, a lending agent is used and may loan securities to certain qualified borrowers, including Fidelity Capital Markets (FCM), a broker-dealer affiliated with the Fund. On the settlement date of the loan, the Fund receives collateral (in the form of U.S. Treasury obligations, letters of credit and/or cash) against the loaned securities and maintains collateral in an amount not less than 100% of the market value of the loaned securities during the period of the loan. The market value of the loaned securities is determined at the close of business of the Fund and any additional required collateral is delivered to the Fund on the next business day. If the borrower defaults on its obligation to return the securities loaned because of insolvency or other reasons, a fund could experience delays and costs in recovering the securities loaned or in gaining access to the collateral. Any cash collateral received is invested in the Fidelity Securities Lending Cash Central Fund. At period end, there were no security loans outstanding. Security lending income represents the income earned on investing cash collateral, less rebates paid to borrowers and any lending agent fees associated with the loan, plus any premium payments received for lending certain types of securities. Security lending income is presented in the Statement of Operations as a component of income from Fidelity Central Funds. Total security lending income during the period amounted to $10,371. During the period, there were no securities loaned to FCM.
Semiannual Report
8. Expense Reductions.
Many of the brokers with whom FMR places trades on behalf of the Fund provided services to the Fund in addition to trade execution. These services included payments of certain expenses on behalf of the Fund totaling $45,405 for the period. In addition, through arrangements with the Fund's custodian, credits realized as a result of uninvested cash balances were used to reduce the Fund's expenses. During the period, these credits reduced the Fund's custody expenses by $15.
9. Distributions to Shareholders.
Distributions to shareholders of each class were as follows:
Six months ended | Year ended | |
From net investment income |
|
|
Class A | $ 137,534 | $ 41,978 |
Class T | 36,494 | 11,957 |
Class B | 2,304 | 701 |
Class C | 13,133 | 10,116 |
Mega Cap Stock | 23,359,423 | 10,229,962 |
Institutional Class | 4,026,605 | 1,458,384 |
Total | $ 27,575,493 | $ 11,753,098 |
10. Share Transactions.
Transactions for each class of shares were as follows:
| Shares | Dollars | ||
Six months ended December 31, | Year ended | Six months ended | Year ended | |
Class A |
|
|
|
|
Shares sold | 484,461 | 486,313 | $ 5,672,260 | $ 5,118,655 |
Reinvestment of distributions | 11,084 | 3,634 | 127,952 | 35,610 |
Shares redeemed | (134,571) | (120,131) | (1,568,852) | (1,250,294) |
Net increase (decrease) | 360,974 | 369,816 | $ 4,231,360 | $ 3,903,971 |
Class T |
|
|
|
|
Shares sold | 261,293 | 105,560 | $ 3,063,989 | $ 1,103,327 |
Reinvestment of distributions | 3,084 | 1,213 | 35,829 | 11,925 |
Shares redeemed | (42,256) | (61,297) | (497,638) | (633,953) |
Net increase (decrease) | 222,121 | 45,476 | $ 2,602,180 | $ 481,299 |
Semiannual Report
Notes to Financial Statements (Unaudited) - continued
10. Share Transactions - continued
| Shares | Dollars | ||
Six months ended December 31, | Year ended | Six months ended | Year ended | |
Class B |
|
|
|
|
Shares sold | 3,845 | 9,865 | $ 45,941 | $ 101,146 |
Reinvestment of distributions | 196 | 69 | 2,261 | 689 |
Shares redeemed | (12,616) | (20,058) | (147,406) | (199,056) |
Net increase (decrease) | (8,575) | (10,124) | $ (99,204) | $ (97,221) |
Class C |
|
|
|
|
Shares sold | 155,422 | 229,191 | $ 1,808,220 | $ 2,376,452 |
Reinvestment of distributions | 988 | 856 | 11,494 | 8,451 |
Shares redeemed | (51,188) | (155,763) | (593,856) | (1,568,860) |
Net increase (decrease) | 105,222 | 74,284 | $ 1,225,858 | $ 816,043 |
Mega Cap Stock |
|
|
|
|
Shares sold | 47,376,825 | 74,953,852 | $ 545,879,670 | $ 795,313,856 |
Reinvestment of distributions | 1,836,891 | 965,264 | 21,294,765 | 9,476,451 |
Shares redeemed | (15,762,374) | (35,350,283) | (184,312,176) | (369,162,567) |
Net increase (decrease) | 33,451,342 | 40,568,833 | $ 382,862,259 | $ 435,627,740 |
Institutional Class |
|
|
|
|
Shares sold | 10,885,901 | 7,943,118 | $ 123,237,266 | $ 80,524,837 |
Reinvestment of distributions | 338,467 | 144,898 | 3,911,623 | 1,415,456 |
Shares redeemed | (962,943) | (5,373,433) | (11,237,812) | (54,303,944) |
Net increase (decrease) | 10,261,425 | 2,714,583 | $ 115,911,077 | $ 27,636,349 |
11. Other.
The Fund's organizational documents provide former and current trustees and officers with a limited indemnification against liabilities arising in connection with the performance of their duties to the Fund. In the normal course of business, the Fund may also enter into contracts that provide general indemnifications. The Fund's maximum exposure under these arrangements is unknown as this would be dependent on future claims that may be made against the Fund. The risk of material loss from such claims is considered remote.
Semiannual Report
Board Approval of Investment Advisory Contracts and Management Fees
Fidelity Mega Cap Stock Fund
Each year, the Board of Trustees, including the Independent Trustees (together, the Board), votes on the renewal of the management contract and sub-advisory agreements (together, the Advisory Contracts) for the fund. The Board, assisted by the advice of fund counsel and Independent Trustees' counsel, requests and considers a broad range of information relevant to the renewal of the Advisory Contracts throughout the year.
The Board meets regularly and, at each of its meetings, considers factors that are relevant to its annual consideration of the renewal of the fund's Advisory Contracts, including the services and support provided to the fund and its shareholders. The Board has established various standing committees, each composed of and chaired by Independent Trustees with varying backgrounds, to which the Board has assigned specific subject matter responsibilities in order to enhance effective decision-making by the Board. The Board, acting directly and through its Committees, requests and receives information concerning the annual consideration of the renewal of the fund's Advisory Contracts. The Board also meets as needed to consider matters specifically related to the Board's annual consideration of the renewal of Advisory Contracts. Members of the Board may also meet with trustees of other Fidelity funds through ad hoc joint committees to discuss certain matters relevant to the Fidelity funds.
At its July 2012 meeting, the Board of Trustees, including the Independent Trustees, unanimously determined to renew the fund's Advisory Contracts. In reaching its determination, the Board considered all factors it believed relevant, including (i) the nature, extent, and quality of the services to be provided to the fund and its shareholders (including the investment performance of the fund); (ii) the competitiveness of the fund's management fee and total expense ratio relative to peer funds; (iii) the total costs of the services to be provided by and the profits to be realized by Fidelity from its relationship with the fund; (iv) the extent to which economies of scale exist and would be realized as the fund grows; and (v) whether fee levels reflect these economies of scale, if any, for the benefit of fund shareholders.
In considering whether to renew the Advisory Contracts for the fund, the Board reached a determination, with the assistance of fund counsel and Independent Trustees' counsel and through the exercise of its business judgment, that the renewal of the Advisory Contracts is in the best interests of the fund and its shareholders and that the compensation payable under the Advisory Contracts is fair and reasonable. The Board's decision to renew the Advisory Contracts was not based on any single factor, but rather was based on a comprehensive consideration of all the information provided to the Board at its meetings throughout the year. The Board, in reaching its determination to renew the Advisory Contracts, is aware that shareholders in the fund have a broad range of investment choices available to them, including a wide choice among mutual funds offered by Fidelity's competitors, and that the fund's shareholders, who have the opportunity to review and weigh the disclosure provided by the fund in its prospectus and other public disclosures, have chosen to invest in this fund, managed by Fidelity.
Semiannual Report
Nature, Extent, and Quality of Services Provided. The Board considered the staffing within the investment adviser, FMR, and the sub-advisers (together, the Investment Advisers), including the backgrounds of the fund's investment personnel, and also considered the fund's investment objective, strategies, and related investment philosophy. The Independent Trustees also had discussions with senior management of Fidelity's investment operations and investment groups. The Board considered the structure of the portfolio manager compensation program and whether this structure provides appropriate incentives to act in the best interests of the fund.
Resources Dedicated to Investment Management and Support Services. The Board and the Fund Oversight and Research Committees reviewed the general qualifications and capabilities of the Investment Advisers' investment staff, including its size, education, experience, and resources, as well as the Investment Advisers' approach to recruiting, training, managing, and compensating investment personnel. The Board also noted that FMR has continued to increase the resources devoted to non-U.S. offices, including expansion of Fidelity's global investment organization. The Board noted that Fidelity's analysts have extensive resources, tools and capabilities that allow them to conduct sophisticated quantitative and fundamental analysis, as well as credit analysis of issuers, counterparties and guarantors. The Board also believes that Fidelity's investment professionals have sufficient access to global information and data so as to provide competitive investment results over time, and that those professionals also have access to sophisticated tools that permit them to assess portfolio construction and risk and performance attribution characteristics continuously, as well as to transmit new information and research conclusions rapidly around the world. Additionally, in its deliberations, the Board considered the Investment Advisers' trading and risk management capabilities and resources, which are an integral part of the investment management process.
Shareholder and Administrative Services. The Board considered (i) the nature, extent, quality, and cost of advisory, administrative, and shareholder services performed by the Investment Advisers and their affiliates under the Advisory Contracts and under separate agreements covering transfer agency, pricing and bookkeeping, and securities lending services for the fund; (ii) the nature and extent of the supervision of third party service providers, principally custodians and subcustodians; and (iii) the resources devoted to, and the record of compliance with, the fund's compliance policies and procedures. The Board also reviewed the allocation of fund brokerage, including allocations to brokers affiliated with the Investment Advisers, the use of brokerage commissions to pay fund expenses, and the use of "soft" commission dollars to pay for research services.
Semiannual Report
Board Approval of Investment Advisory Contracts and
Management Fees - continued
The Board noted that the growth of fund assets over time across the complex allows Fidelity to reinvest in the development of services designed to enhance the value or convenience of the Fidelity funds as investment vehicles. These services include 24-hour access to account information and market information through telephone representatives and over the Internet, investor education materials and asset allocation tools, and the expanded availability of Fidelity Investor Centers.
Investment in a Large Fund Family. The Board considered the benefits to shareholders of investing in a Fidelity fund, including the benefits of investing in a fund that is part of a large family of funds offering a variety of investment disciplines and providing a large variety of mutual fund investor services. The Board noted that Fidelity had taken, or had made recommendations that resulted in the Fidelity funds taking, a number of actions over the previous year that benefited particular funds, including (i) continuing to dedicate additional resources to investment research and support of the senior management team that oversees asset management; (ii) persisting in efforts to enhance Fidelity's research capabilities, in particular, international research; (iii) launching new funds and making other enhancements to meet client needs for global and income-oriented solutions; (iv) continuing to launch dedicated lower cost underlying funds to meet investment management's portfolio construction needs related to expanding underlying fund options, specifically for the Freedom Fund product lines; (v) adopting a "Stock Selector" sector neutral investment approach and employing a team of portfolio managers who are sector specialists to manage certain funds; (vi) rationalizing product lines and gaining increased efficiencies through the mergers of several funds into other funds; (vii) strengthening the Spartan Index Fund product line by adding new funds and/or new low-cost institutional share classes, restructuring fund expenses to accommodate new classes, and reducing investment minimums for certain classes of shares; (viii) modifying the eligibility criteria for Institutional Class shares to increase their appeal to government entities and charitable investors; and (ix) reducing certain transfer agent fee rates.
Investment Performance. The Board considered whether the fund has operated in accordance with its investment objective, as well as its record of compliance with its investment restrictions. It also reviewed the fund's absolute investment performance for each class, as well as the fund's relative investment performance for each class measured over multiple periods against a broad-based securities market index. The Board noted that FMR believes that no meaningful peer group exists for the fund principally because most other funds in the fund's third-party peer group have different and/or broader investment mandates than the fund's more specialized strategies. The following charts considered by the Board show, over the one-, three-, and five-year periods ended December 31, 2011, as available, the cumulative total returns of the retail class and Class B of the fund and the cumulative total returns of a broad-based securities market index ("benchmark"). The returns of the retail class and Class B show the performance of the highest performing class (based on five-year performance) and the lowest performing class (based on three-year performance), respectively.
Semiannual Report
Fidelity Mega Cap Stock Fund

The Board noted that the investment performance of the retail class of the fund compared favorably to its benchmark for the three- and five-year periods, although the fund's one-year total return was lower than its benchmark. The Board considered that the variations in performance among the fund's classes reflect the variations in class expenses, which result in lower performance for higher expense classes. The Board also reviewed the fund's performance since inception as well as performance in the current year.
Based on its review, the Board concluded that the nature, extent, and quality of services provided to the fund under the Advisory Contracts should benefit the fund's shareholders.
Competitiveness of Management Fee and Total Expense Ratio. The Board considered the fund's management fee and total expense ratio compared to "mapped groups" of competitive funds and classes. Fidelity creates "mapped groups" by combining similar Lipper investment objective categories that have comparable management fee characteristics. Combining Lipper investment objective categories aids the Board's management fee and total expense ratio comparisons by broadening the competitive group used for comparison and by reducing the number of universes to which various Fidelity funds are compared.
Semiannual Report
Board Approval of Investment Advisory Contracts and
Management Fees - continued
Management Fee. The Board considered two proprietary management fee comparisons for the 12-month periods shown in the chart below. The group of Lipper funds used by the Board for management fee comparisons is referred to below as the "Total Mapped Group." The Total Mapped Group comparison focuses on a fund's standing relative to the total universe of comparable funds available to investors in terms of gross management fees before expense reimbursements or caps. "TMG %" represents the percentage of funds in the Total Mapped Group that had management fees that were lower than the fund's. For example, a TMG % of 14% means that 86% of the funds in the Total Mapped Group had higher management fees than the fund. The "Asset-Size Peer Group" (ASPG) comparison focuses on a fund's standing relative to non-Fidelity funds similar in size to the fund within the Total Mapped Group. The ASPG represents at least 15% of the funds in the Total Mapped Group with comparable asset size and management fee characteristics, subject to a minimum of 50 funds (or all funds in the Total Mapped Group if fewer than 50). Additional information, such as the ASPG quartile in which the fund's management fee ranked, is also included in the chart and considered by the Board.
Fidelity Mega Cap Stock Fund
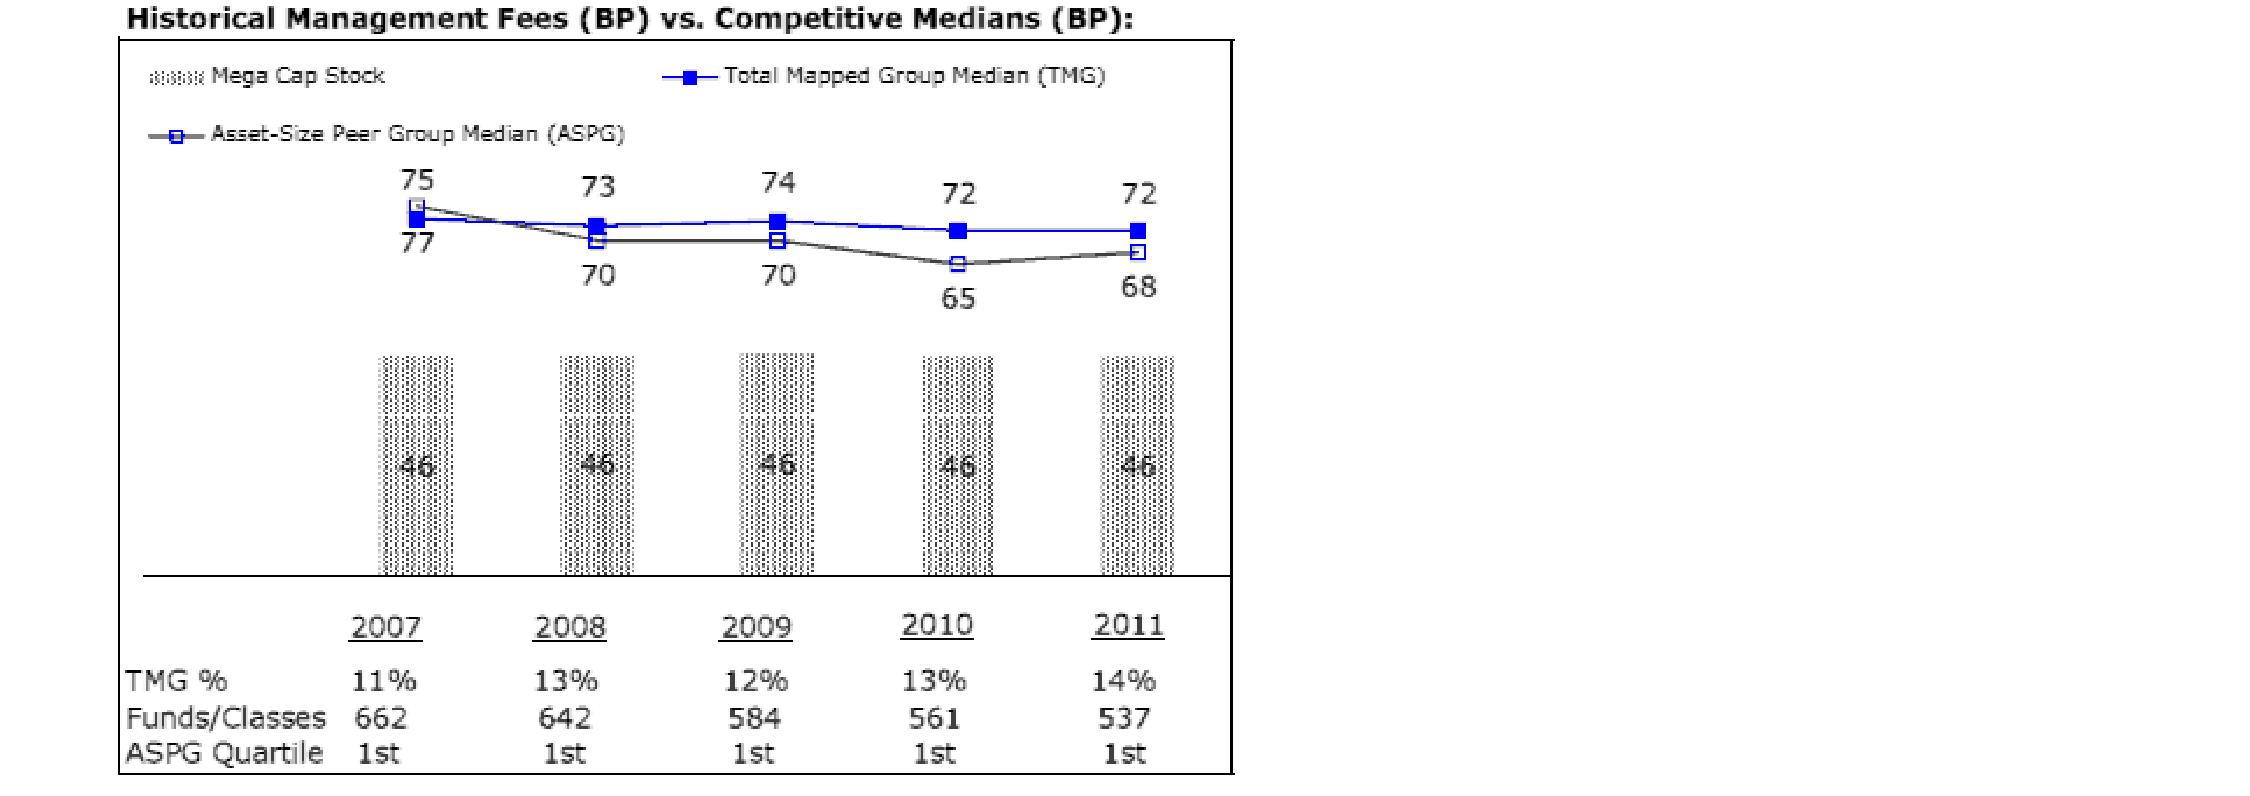
The Board noted that the fund's management fee ranked below the median of its Total Mapped Group and below the median of its ASPG for 2011.
Based on its review, the Board concluded that the fund's management fee is fair and reasonable in light of the services that the fund receives and the other factors considered.
Total Expense Ratio. In its review of each class's total expense ratio, the Board considered the fund's management fee as well as other fund or class expenses, as applicable, such as transfer agent fees, pricing and bookkeeping fees, fund-paid 12b-1 fees, and custodial, legal, and audit fees. The Board also noted the effects of any waivers and reimbursements on fees and expenses. As part of its review, the Board also considered the current and historical total expense ratios of each class of the fund compared to competitive fund median expenses. Each class of the fund is compared to those funds and classes in the Total Mapped Group (used by the Board for management fee comparisons) that have a similar sales load structure.
Semiannual Report
The Board noted that the total expense ratio of each of Class A, Class B, Class C, Institutional Class, and the retail class ranked below its competitive median for 2011 and the total expense ratio of Class T ranked above its competitive median for 2011. The Board considered that various factors, including 12b-1 fees, positive or negative performance adjustments, and relatively higher other expenses in the case of small fund size, can affect total expense ratios. The Board noted that the total expense ratio of Class T was above the competitive median primarily because of higher 12b-1 fees on Class T. Class T has a higher 12b-1 fee, but a lower front-end sales charge, than traditionally priced front-end sales charge classes. The Board considered that Class T is primarily sold load-waived in the retirement plan market where its 0.50% 12b-1 fee is comparable to competing no-load, higher 12b-1 fee classes designed specifically for retirement plans. The Board noted that the fund offers multiple classes, each of which has a different sales load and 12b-1 fee structure, and that the multiple structures are intended to offer a range of pricing options for the intermediary market. The Board also noted that the total expense ratios of the classes vary primarily by the level of their 12b-1 fees, although differences in transfer agent fees may also cause expenses to vary from class to class.
Fees Charged to Other Fidelity Clients. The Board also considered Fidelity fee structures and other information with respect to clients of FMR and its affiliates, such as other mutual funds advised or subadvised by FMR or its affiliates, pension plan clients, and other institutional clients. The Board noted the findings of the 2010 ad hoc joint committee (created with the board of other Fidelity funds), which reviewed and compared Fidelity's institutional investment advisory business with its business of providing services to the Fidelity funds, including the differences in services provided, fees charged, and costs incurred, as well as competition in their respective marketplaces.
Based on its review of total expense ratios and fees charged to other Fidelity clients, the Board concluded that the total expense ratio of each class of the fund was reasonable, although Class T was above the median of the universe presented for comparison, in light of the services that the fund and its shareholders receive and the other factors considered.
Costs of the Services and Profitability. The Board considered the revenues earned and the expenses incurred by Fidelity in conducting the business of developing, marketing, distributing, managing, administering and servicing the fund and its shareholders. The Board also considered the level of Fidelity's profits in respect of all the Fidelity funds.
Semiannual Report
Board Approval of Investment Advisory Contracts and
Management Fees - continued
On an annual basis, FMR presents to the Board Fidelity's profitability for the fund. Fidelity calculates the profitability for each fund, as well as aggregate profitability for groups of Fidelity funds and all Fidelity funds, using a series of detailed revenue and cost allocation methodologies which originate with the books and records of Fidelity on which Fidelity's audited financial statements are based. The Audit Committee of the Board reviews any significant changes from the prior year's methodologies.
PricewaterhouseCoopers LLP (PwC), independent registered public accounting firm and auditor to Fidelity and certain Fidelity funds, has been engaged annually by the Board as part of the Board's assessment of Fidelity's profitability analysis. PwC's engagement includes the review and assessment of Fidelity's methodologies used in determining the revenues and expenses attributable to Fidelity's mutual fund business, and completion of agreed-upon procedures surrounding the mathematical accuracy of fund profitability and its conformity to allocation methodologies. After considering PwC's reports issued under the engagement and information provided by Fidelity, the Board concluded that while other allocation methods may also be reasonable, Fidelity's profitability methodologies are reasonable in all material respects.
The Board also reviewed Fidelity's non-fund businesses and fall-out benefits related to the mutual fund business as well as cases where Fidelity's affiliates may benefit from or be related to the fund's business.
The Board considered the costs of the services provided by and the profits realized by Fidelity in connection with the operation of the fund and was satisfied that the profitability was not excessive in the circumstances.
Economies of Scale. The Board considered whether there have been economies of scale in respect of the management of the Fidelity funds, whether the Fidelity funds (including the fund) have appropriately benefited from any such economies of scale, and whether there is potential for realization of any further economies of scale. The Board considered the extent to which the fund will benefit from economies of scale through increased services to the fund, through waivers or reimbursements, or through fee or expense reductions. The Board also noted that in 2009, it and the board of other Fidelity funds created an ad hoc committee (the Economies of Scale Committee) to analyze whether FMR attains economies of scale in respect of the management and servicing of the Fidelity funds, whether the Fidelity funds have appropriately benefited from such economies of scale, and whether there is potential for realization of any further economies of scale.
The Board recognized that the fund's management contract incorporates a "group fee" structure, which provides for lower group fee rates as total fund assets under FMR's management increase, and for higher group fee rates as total fund assets under FMR's management decrease. FMR calculates the group fee rates based on a tiered asset "breakpoint" schedule that varies based on asset class. The Board considered that the group fee is designed to deliver the benefits of economies of scale to fund shareholders when total Fidelity fund assets increase, even if assets of any particular fund are unchanged or have declined, because some portion of Fidelity's costs are attributable to services provided to all Fidelity funds, and all funds benefit if those costs can be allocated among more assets. The Board concluded that, given the group fee structure, fund shareholders will benefit from lower management fees as assets under FMR's management increase at the fund complex level, regardless of whether Fidelity achieves any such economies of scale.
Semiannual Report
The Board concluded, taking into account the analysis of the Economies of Scale Committee, that economies of scale, if any, are being appropriately shared between fund shareholders and Fidelity.
Additional Information Requested by the Board. In order to develop fully the factual basis for consideration of the Fidelity funds' Advisory Contracts, the Board requested and received additional information on certain topics, including (i) fund performance trends, actions to be taken by FMR to improve certain funds' overall performance, and Fidelity's long-term strategies for certain funds; (ii) the potential to further rationalize the Fidelity fund lineup with the possibility of achieving savings for the funds and Fidelity; (iii) Fidelity's compensation structure for portfolio managers and other key investment personnel; (iv) the amount of the investment that each portfolio manager has made in the Fidelity fund(s) that he or she manages; (v) the realization of fall-out benefits in certain Fidelity business units; (vi) Fidelity's group fee structures, the potential impact of regulatory changes on such structures, and the rationale for the individual fee rates of certain funds; (vii) fund profitability methodology, including Fidelity's cost allocation methodology, and the impact of certain factors on fund profitability results; (viii) trends regarding industry use of performance fee structures and the possibility of implementing performance fee structures for additional funds; and (ix) the impact of net redemptions from the Fidelity funds.
Based on its evaluation of all of the conclusions noted above, and after considering all factors it believed relevant, the Board ultimately concluded that the advisory fee structures are fair and reasonable, and that the fund's Advisory Contracts should be renewed.
Semiannual Report
Investment Adviser
Fidelity Management & Research Company
Boston, MA
Investment Sub-Advisers
FMR Co., Inc.
Fidelity Management & Research
(U.K.) Inc.
Fidelity Management & Research
(Hong Kong) Limited
Fidelity Management & Research
(Japan) Inc.
General Distributor
Fidelity Distributors Corporation
Smithfield, RI
Transfer and Service Agents
Fidelity Investments Institutional Operations Company, Inc.
Boston, MA
Fidelity Service Company, Inc.
Boston, MA
Custodian
JPMorgan Chase Bank
New York, NY
(Fidelity Investment logo)(registered trademark)
AGII-USAN-0213
1.855229.105
(Fidelity Investment logo)(registered trademark)
Fidelity Advisor®
Mega Cap Stock
Fund - Institutional Class
Semiannual Report
December 31, 2012
(Fidelity Cover Art)
Institutional Class
is a class of Fidelity®
Mega Cap Stock Fund
Contents
Shareholder Expense Example | An example of shareholder expenses. | |
Investment Changes | A summary of major shifts in the fund's investments over the past six months. | |
Investments | A complete list of the fund's investments with their market values. | |
Financial Statements | Statements of assets and liabilities, operations, and changes in net assets, as well as financial highlights. | |
Notes | Notes to the financial statements. | |
Board Approval of Investment Advisory Contracts and Management Fees |
|
To view a fund's proxy voting guidelines and proxy voting record for the 12-month period ended June 30, visit http://www.fidelity.com/proxyvotingresults or visit the Securities and Exchange Commission's (SEC) web site at http://www.sec.gov. You may also call 1-877-208-0098 to request a free copy of the proxy voting guidelines.
Standard & Poor's, S&P and S&P 500 are registered service marks of The McGraw-Hill Companies, Inc. and have been licensed for use by Fidelity Distributors Corporation.
Other third party marks appearing herein are the property of their respective owners.
All other marks appearing herein are registered or unregistered trademarks or service marks of FMR LLC or an affiliated company. © 2013 FMR LLC. All rights reserved.
This report and the financial statements contained herein are submitted for the general information of the shareholders of the fund. This report is not authorized for distribution to prospective investors in the fund unless preceded or accompanied by an effective prospectus.
A fund files its complete schedule of portfolio holdings with the SEC for the first and third quarters of each fiscal year on Form N-Q. Forms N-Q are available on the SEC's web site at http://www.sec.gov. A fund's Forms N-Q may be reviewed and copied at the SEC's Public Reference Room in Washington, DC. Information regarding the operation of the SEC's Public Reference Room may be obtained by calling 1-800-SEC-0330. For a complete list of a fund's portfolio holdings, view the most recent holdings listing, semiannual report, or annual report on Fidelity's web site at http://www.fidelity.com, http://www.advisor.fidelity.com, or http://www.401k.com, as applicable.
NOT FDIC INSURED • MAY LOSE VALUE • NO BANK GUARANTEE
Neither the fund nor Fidelity Distributors Corporation is a bank.
Semiannual Report
Shareholder Expense Example
As a shareholder of the Fund, you incur two types of costs: (1) transaction costs, including sales charges (loads) on purchase payments or redemption proceeds, and (2) ongoing costs, including management fees, distribution and/or service (12b-1) fees and other Fund expenses. This Example is intended to help you understand your ongoing costs (in dollars) of investing in the Fund and to compare these costs with the ongoing costs of investing in other mutual funds.
The Example is based on an investment of $1,000 invested at the beginning of the period and held for the entire period (July 1, 2012 to December 31, 2012).
Actual Expenses
The first line of the accompanying table for each class of the Fund provides information about actual account values and actual expenses. You may use the information in this line, together with the amount you invested, to estimate the expenses that you paid over the period. Simply divide your account value by $1,000.00 (for example, an $8,600 account value divided by $1,000.00 = 8.6), then multiply the result by the number in the first line for a class of the Fund under the heading entitled "Expenses Paid During Period" to estimate the expenses you paid on your account during this period. A small balance maintenance fee of $12.00 that is charged once a year may apply for certain accounts with a value of less than $2,000. This fee is not included in the table below. If it was, the estimate of expenses you paid during the period would be higher, and your ending account value lower, by this amount. In addition, the Fund, as a shareholder in the underlying Fidelity Central Funds, will indirectly bear its pro-rata share of the fees and expenses incurred by the underlying Fidelity Central Funds. These fees and expenses are not included in the Fund's annualized expense ratio used to calculate the expense estimate in the table below.
Hypothetical Example for Comparison Purposes
The second line of the accompanying table for each class of the Fund provides information about hypothetical account values and hypothetical expenses based on a Class' actual expense ratio and an assumed rate of return of 5% per year before expenses, which is not the Class' actual return. The hypothetical account values and expenses may not be used to estimate the actual ending account balance or expenses you paid for the period. You may use this information to compare the ongoing costs of investing in the Fund and other funds. To do so, compare this 5% hypothetical example with the 5% hypothetical examples that appear in the shareholder reports of the other funds. A small balance maintenance fee of $12.00 that is charged once a year may apply for certain accounts with a value of less than $2,000. This fee is not included in the table below. If it was, the estimate of expenses you paid during the period would be higher, and your ending account value lower, by this amount. In addition, the Fund, as a shareholder in the underlying Fidelity Central Funds, will indirectly bear its pro-rata share of the fees and expenses incurred by the underlying Fidelity Central Funds. These fees and expenses are not included in the Fund's annualized expense ratio used to calculate the expense estimate in the table below.
Please note that the expenses shown in the table are meant to highlight your ongoing costs only and do not reflect any transaction costs. Therefore, the second line of the table is useful in comparing ongoing costs only, and will not help you determine the relative total costs of owning different funds. In addition, if these transactional costs were included, your costs would have been higher.
Semiannual Report
Shareholder Expense Example - continued
| Annualized | Beginning | Ending | Expenses Paid |
Class A | 1.00% |
|
|
|
Actual |
| $ 1,000.00 | $ 1,083.90 | $ 5.25 |
HypotheticalA |
| $ 1,000.00 | $ 1,020.16 | $ 5.09 |
Class T | 1.28% |
|
|
|
Actual |
| $ 1,000.00 | $ 1,081.80 | $ 6.72 |
HypotheticalA |
| $ 1,000.00 | $ 1,018.75 | $ 6.51 |
Class B | 1.80% |
|
|
|
Actual |
| $ 1,000.00 | $ 1,080.10 | $ 9.44 |
HypotheticalA |
| $ 1,000.00 | $ 1,016.13 | $ 9.15 |
Class C | 1.77% |
|
|
|
Actual |
| $ 1,000.00 | $ 1,079.50 | $ 9.28 |
HypotheticalA |
| $ 1,000.00 | $ 1,016.28 | $ 9.00 |
Mega Cap Stock | .71% |
|
|
|
Actual |
| $ 1,000.00 | $ 1,085.60 | $ 3.73 |
HypotheticalA |
| $ 1,000.00 | $ 1,021.63 | $ 3.62 |
Institutional Class | .75% |
|
|
|
Actual |
| $ 1,000.00 | $ 1,085.80 | $ 3.94 |
HypotheticalA |
| $ 1,000.00 | $ 1,021.42 | $ 3.82 |
A 5% return per year before expenses
* Expenses are equal to each Class' annualized expense ratio, multiplied by the average account value over the period, multiplied by 184/365 (to reflect the one-half year period).
Semiannual Report
Investment Changes (Unaudited)
Top Ten Stocks as of December 31, 2012 | ||
| % of fund's | % of fund's net assets |
Apple, Inc. | 5.0 | 6.1 |
JPMorgan Chase & Co. | 4.2 | 3.9 |
Wells Fargo & Co. | 3.5 | 4.2 |
General Electric Co. | 3.1 | 3.0 |
Chevron Corp. | 2.7 | 3.1 |
Google, Inc. Class A | 2.5 | 2.3 |
Exxon Mobil Corp. | 2.4 | 3.3 |
Microsoft Corp. | 2.4 | 2.7 |
Citigroup, Inc. | 2.2 | 1.5 |
Procter & Gamble Co. | 2.2 | 2.4 |
| 30.2 | |
Top Five Market Sectors as of December 31, 2012 | ||
| % of fund's | % of fund's net assets |
Information Technology | 19.4 | 20.9 |
Financials | 18.4 | 15.5 |
Health Care | 12.8 | 13.0 |
Energy | 12.6 | 14.0 |
Consumer Discretionary | 11.9 | 12.6 |
Asset Allocation (% of fund's net assets) | |||||||
As of December 31, 2012* | As of June 30, 2012** | ||||||
 | Stocks 98.9% |
| | Stocks 99.5% |
| ||
 | Convertible |
| | Convertible |
| ||
 | Short-Term |
| | Short-Term |
| ||
* Foreign investments | 8.0% |
| ** Foreign investments | 9.7% |
| ||

Semiannual Report
Investments December 31, 2012 (Unaudited)
Showing Percentage of Net Assets
Common Stocks - 98.8% | |||
Shares | Value | ||
CONSUMER DISCRETIONARY - 11.8% | |||
Auto Components - 0.5% | |||
Johnson Controls, Inc. | 340,800 | $ 10,462,560 | |
Automobiles - 0.5% | |||
Ford Motor Co. | 880,000 | 11,396,000 | |
Hotels, Restaurants & Leisure - 0.9% | |||
McDonald's Corp. | 164,500 | 14,510,545 | |
Yum! Brands, Inc. | 69,700 | 4,628,080 | |
| 19,138,625 | ||
Internet & Catalog Retail - 0.2% | |||
Priceline.com, Inc. (a) | 5,100 | 3,168,120 | |
Media - 5.8% | |||
Comcast Corp. Class A (special) (non-vtg.) | 1,269,800 | 45,649,310 | |
News Corp. Class A | 280,200 | 7,156,308 | |
The Walt Disney Co. | 272,100 | 13,547,859 | |
Thomson Reuters Corp. | 127,500 | 3,689,002 | |
Time Warner Cable, Inc. | 61,600 | 5,986,904 | |
Time Warner, Inc. | 733,400 | 35,078,522 | |
Viacom, Inc. Class B (non-vtg.) | 220,300 | 11,618,622 | |
| 122,726,527 | ||
Multiline Retail - 1.6% | |||
Target Corp. | 566,300 | 33,507,971 | |
Specialty Retail - 2.3% | |||
Home Depot, Inc. | 156,700 | 9,691,895 | |
Lowe's Companies, Inc. | 1,090,900 | 38,748,768 | |
| 48,440,663 | ||
TOTAL CONSUMER DISCRETIONARY | 248,840,466 | ||
CONSUMER STAPLES - 10.3% | |||
Beverages - 2.6% | |||
PepsiCo, Inc. | 343,000 | 23,471,490 | |
The Coca-Cola Co. | 882,800 | 32,001,500 | |
| 55,472,990 | ||
Food & Staples Retailing - 2.1% | |||
CVS Caremark Corp. | 301,400 | 14,572,690 | |
Walgreen Co. | 807,400 | 29,881,874 | |
| 44,454,564 | ||
Common Stocks - continued | |||
Shares | Value | ||
CONSUMER STAPLES - continued | |||
Food Products - 1.1% | |||
Danone SA | 111,900 | $ 7,395,384 | |
Kellogg Co. | 294,200 | 16,431,070 | |
| 23,826,454 | ||
Household Products - 3.3% | |||
Colgate-Palmolive Co. | 10,900 | 1,139,486 | |
Kimberly-Clark Corp. | 253,000 | 21,360,790 | |
Procter & Gamble Co. | 693,200 | 47,061,348 | |
| 69,561,624 | ||
Personal Products - 0.1% | |||
L'Oreal SA | 15,100 | 2,101,051 | |
Tobacco - 1.1% | |||
British American Tobacco PLC sponsored ADR | 165,000 | 16,706,250 | |
Philip Morris International, Inc. | 68,530 | 5,731,849 | |
| 22,438,099 | ||
TOTAL CONSUMER STAPLES | 217,854,782 | ||
ENERGY - 12.6% | |||
Energy Equipment & Services - 2.1% | |||
Halliburton Co. | 574,500 | 19,929,405 | |
National Oilwell Varco, Inc. | 106,600 | 7,286,110 | |
Schlumberger Ltd. | 241,900 | 16,761,251 | |
| 43,976,766 | ||
Oil, Gas & Consumable Fuels - 10.5% | |||
Apache Corp. | 174,905 | 13,730,043 | |
BG Group PLC | 156,500 | 2,610,390 | |
BP PLC sponsored ADR | 239,600 | 9,976,944 | |
Canadian Natural Resources Ltd. | 363,100 | 10,454,593 | |
Chevron Corp. | 525,100 | 56,784,314 | |
Exxon Mobil Corp. | 584,571 | 50,594,620 | |
Occidental Petroleum Corp. | 327,500 | 25,089,775 | |
Royal Dutch Shell PLC Class A sponsored ADR | 333,206 | 22,974,554 | |
Suncor Energy, Inc. | 640,900 | 21,075,539 | |
The Williams Companies, Inc. | 277,400 | 9,082,076 | |
| 222,372,848 | ||
TOTAL ENERGY | 266,349,614 | ||
Common Stocks - continued | |||
Shares | Value | ||
FINANCIALS - 18.4% | |||
Capital Markets - 3.1% | |||
BlackRock, Inc. Class A | 46,800 | $ 9,674,028 | |
Charles Schwab Corp. | 1,395,200 | 20,035,072 | |
Morgan Stanley | 1,492,400 | 28,534,688 | |
State Street Corp. | 36,100 | 1,697,061 | |
UBS AG | 253,700 | 3,970,121 | |
| 63,910,970 | ||
Commercial Banks - 5.2% | |||
PNC Financial Services Group, Inc. | 172,400 | 10,052,644 | |
Standard Chartered PLC (United Kingdom) | 257,607 | 6,666,804 | |
U.S. Bancorp | 601,100 | 19,199,134 | |
Wells Fargo & Co. | 2,164,030 | 73,966,545 | |
| 109,885,127 | ||
Diversified Financial Services - 8.2% | |||
Bank of America Corp. | 2,663,000 | 30,890,800 | |
Citigroup, Inc. | 1,193,870 | 47,229,497 | |
CME Group, Inc. | 117,500 | 5,958,425 | |
JPMorgan Chase & Co. | 2,025,300 | 89,052,441 | |
| 173,131,163 | ||
Insurance - 1.9% | |||
AFLAC, Inc. | 108,500 | 5,763,520 | |
American International Group, Inc. (a) | 158,300 | 5,587,990 | |
MetLife, Inc. | 712,300 | 23,463,162 | |
Prudential Financial, Inc. | 105,900 | 5,647,647 | |
| 40,462,319 | ||
TOTAL FINANCIALS | 387,389,579 | ||
HEALTH CARE - 12.8% | |||
Biotechnology - 0.9% | |||
Amgen, Inc. | 212,890 | 18,376,665 | |
Health Care Equipment & Supplies - 0.7% | |||
Baxter International, Inc. | 121,700 | 8,112,522 | |
Stryker Corp. | 112,200 | 6,150,804 | |
| 14,263,326 | ||
Health Care Providers & Services - 3.5% | |||
Aetna, Inc. | 309,500 | 14,329,850 | |
Cardinal Health, Inc. | 99,500 | 4,097,410 | |
McKesson Corp. | 269,900 | 26,169,504 | |
Common Stocks - continued | |||
Shares | Value | ||
HEALTH CARE - continued | |||
Health Care Providers & Services - continued | |||
UnitedHealth Group, Inc. | 149,900 | $ 8,130,576 | |
WellPoint, Inc. | 351,600 | 21,419,472 | |
| 74,146,812 | ||
Life Sciences Tools & Services - 0.4% | |||
Thermo Fisher Scientific, Inc. | 123,300 | 7,864,074 | |
Pharmaceuticals - 7.3% | |||
Abbott Laboratories | 280,200 | 18,353,100 | |
Eli Lilly & Co. | 300,900 | 14,840,388 | |
GlaxoSmithKline PLC sponsored ADR | 225,200 | 9,789,444 | |
Johnson & Johnson | 576,800 | 40,433,680 | |
Merck & Co., Inc. | 1,100,700 | 45,062,658 | |
Pfizer, Inc. | 881,300 | 22,103,004 | |
Sanofi SA | 34,424 | 3,264,423 | |
| 153,846,697 | ||
TOTAL HEALTH CARE | 268,497,574 | ||
INDUSTRIALS - 9.1% | |||
Aerospace & Defense - 2.6% | |||
Honeywell International, Inc. | 140,200 | 8,898,494 | |
Precision Castparts Corp. | 11,300 | 2,140,446 | |
Raytheon Co. | 179,000 | 10,303,240 | |
The Boeing Co. | 225,400 | 16,986,144 | |
United Technologies Corp. | 205,400 | 16,844,854 | |
| 55,173,178 | ||
Air Freight & Logistics - 1.4% | |||
United Parcel Service, Inc. Class B | 403,400 | 29,742,682 | |
Electrical Equipment - 0.3% | |||
Emerson Electric Co. | 136,200 | 7,213,152 | |
Industrial Conglomerates - 3.6% | |||
Danaher Corp. | 164,100 | 9,173,190 | |
General Electric Co. | 3,145,500 | 66,024,045 | |
| 75,197,235 | ||
Machinery - 0.6% | |||
Cummins, Inc. | 33,700 | 3,651,395 | |
Illinois Tool Works, Inc. | 139,100 | 8,458,671 | |
| 12,110,066 | ||
Common Stocks - continued | |||
Shares | Value | ||
INDUSTRIALS - continued | |||
Road & Rail - 0.6% | |||
Norfolk Southern Corp. | 54,400 | $ 3,364,096 | |
Union Pacific Corp. | 71,100 | 8,938,692 | |
| 12,302,788 | ||
TOTAL INDUSTRIALS | 191,739,101 | ||
INFORMATION TECHNOLOGY - 19.4% | |||
Communications Equipment - 2.5% | |||
Cisco Systems, Inc. | 1,782,500 | 35,026,125 | |
QUALCOMM, Inc. | 303,900 | 18,847,878 | |
| 53,874,003 | ||
Computers & Peripherals - 5.7% | |||
Apple, Inc. | 198,201 | 105,647,079 | |
Dell, Inc. | 447,300 | 4,531,149 | |
EMC Corp. (a) | 372,300 | 9,419,190 | |
| 119,597,418 | ||
Internet Software & Services - 2.5% | |||
Google, Inc. Class A (a) | 74,750 | 53,025,408 | |
IT Services - 4.2% | |||
Accenture PLC Class A | 40,500 | 2,693,250 | |
Automatic Data Processing, Inc. | 25,900 | 1,476,559 | |
Cognizant Technology Solutions Corp. Class A (a) | 242,300 | 17,942,315 | |
IBM Corp. | 89,800 | 17,201,190 | |
MasterCard, Inc. Class A | 54,900 | 26,971,272 | |
Visa, Inc. Class A | 140,800 | 21,342,464 | |
| 87,627,050 | ||
Semiconductors & Semiconductor Equipment - 0.4% | |||
Broadcom Corp. Class A | 161,200 | 5,353,452 | |
Samsung Electronics Co. Ltd. | 1,931 | 2,792,551 | |
| 8,146,003 | ||
Software - 4.1% | |||
Adobe Systems, Inc. (a) | 140,900 | 5,309,112 | |
Microsoft Corp. | 1,875,600 | 50,134,788 | |
Oracle Corp. | 563,200 | 18,765,824 | |
Common Stocks - continued | |||
Shares | Value | ||
INFORMATION TECHNOLOGY - continued | |||
Software - continued | |||
salesforce.com, Inc. (a) | 32,800 | $ 5,513,680 | |
VMware, Inc. Class A (a) | 65,700 | 6,184,998 | |
| 85,908,402 | ||
TOTAL INFORMATION TECHNOLOGY | 408,178,284 | ||
MATERIALS - 1.8% | |||
Chemicals - 1.8% | |||
Air Products & Chemicals, Inc. | 100,000 | 8,402,000 | |
E.I. du Pont de Nemours & Co. | 222,900 | 10,023,813 | |
Monsanto Co. | 28,100 | 2,659,665 | |
Syngenta AG (Switzerland) | 25,700 | 10,382,449 | |
The Dow Chemical Co. | 190,600 | 6,160,192 | |
| 37,628,119 | ||
TELECOMMUNICATION SERVICES - 1.4% | |||
Diversified Telecommunication Services - 0.8% | |||
Verizon Communications, Inc. | 407,300 | 17,623,871 | |
Wireless Telecommunication Services - 0.6% | |||
Vodafone Group PLC sponsored ADR | 493,600 | 12,433,784 | |
TOTAL TELECOMMUNICATION SERVICES | 30,057,655 | ||
UTILITIES - 1.2% | |||
Electric Utilities - 1.1% | |||
Duke Energy Corp. | 70,099 | 4,472,316 | |
FirstEnergy Corp. | 316,800 | 13,229,568 | |
NextEra Energy, Inc. | 77,300 | 5,348,387 | |
| 23,050,271 | ||
Multi-Utilities - 0.1% | |||
PG&E Corp. | 72,500 | 2,913,050 | |
TOTAL UTILITIES | 25,963,321 | ||
TOTAL COMMON STOCKS (Cost $1,895,210,670) |
| ||
Preferred Stocks - 0.2% | |||
Shares | Value | ||
Convertible Preferred Stocks - 0.1% | |||
INDUSTRIALS - 0.1% | |||
Aerospace & Defense - 0.1% | |||
United Technologies Corp. 7.50% | 32,400 | $ 1,805,004 | |
Nonconvertible Preferred Stocks - 0.1% | |||
CONSUMER DISCRETIONARY - 0.1% | |||
Automobiles - 0.1% | |||
Volkswagen AG | 14,500 | 3,327,010 | |
TOTAL PREFERRED STOCKS (Cost $4,353,318) |
| ||
Money Market Funds - 1.1% | |||
|
|
|
|
Fidelity Cash Central Fund, 0.18% (b) | 23,617,422 |
| |
TOTAL INVESTMENT PORTFOLIO - 100.1% (Cost $1,923,181,410) | 2,111,247,931 | ||
NET OTHER ASSETS (LIABILITIES) - (0.1)% | (2,800,194) | ||
NET ASSETS - 100% | $ 2,108,447,737 | ||
Legend |
(a) Non-income producing |
(b) Affiliated fund that is available only to investment companies and other accounts managed by Fidelity Investments. The rate quoted is the annualized seven-day yield of the fund at period end. A complete unaudited listing of the fund's holdings as of its most recent quarter end is available upon request. In addition, each Fidelity Central Fund's financial statements are available on the SEC's website or upon request. |
Affiliated Central Funds |
Information regarding fiscal year to date income earned by the Fund from investments in Fidelity Central Funds is as follows: |
Fund | Income earned |
Fidelity Cash Central Fund | $ 25,141 |
Fidelity Securities Lending Cash Central Fund | 10,371 |
Total | $ 35,512 |
Other Information |
The following is a summary of the inputs used, as of December 31, 2012, involving the Fund's assets and liabilities carried at fair value. The inputs or methodology used for valuing securities may not be an indication of the risk associated with investing in those securities. For more information on valuation inputs, and their aggregation into the levels used in the table below, please refer to the Investment Valuation section in the accompanying Notes to Financial Statements. |
Valuation Inputs at Reporting Date: | ||||
Description | Total | Level 1 | Level 2 | Level 3 |
Investments in Securities: | ||||
Equities: | ||||
Consumer Discretionary | $ 252,167,476 | $ 248,840,466 | $ 3,327,010 | $ - |
Consumer Staples | 217,854,782 | 208,358,347 | 9,496,435 | - |
Energy | 266,349,614 | 263,739,224 | 2,610,390 | - |
Financials | 387,389,579 | 376,752,654 | 10,636,925 | - |
Health Care | 268,497,574 | 265,233,151 | 3,264,423 | - |
Industrials | 193,544,105 | 193,544,105 | - | - |
Information Technology | 408,178,284 | 405,385,733 | 2,792,551 | - |
Materials | 37,628,119 | 27,245,670 | 10,382,449 | - |
Telecommunication Services | 30,057,655 | 30,057,655 | - | - |
Utilities | 25,963,321 | 25,963,321 | - | - |
Money Market Funds | 23,617,422 | 23,617,422 | - | - |
Total Investments in Securities: | $ 2,111,247,931 | $ 2,068,737,748 | $ 42,510,183 | $ - |
See accompanying notes which are an integral part of the financial statements.
Semiannual Report
Financial Statements
Statement of Assets and Liabilities
| December 31, 2012 (Unaudited) | |
|
|
|
Assets | ||
Investment in securities, at value - See accompanying schedule: Unaffiliated issuers (cost $1,899,563,988) | $ 2,087,630,509 |
|
Fidelity Central Funds (cost $23,617,422) | 23,617,422 |
|
Total Investments (cost $1,923,181,410) |
| $ 2,111,247,931 |
Foreign currency held at value (cost $1,033) | 1,040 | |
Receivable for investments sold | 11,827,281 | |
Receivable for fund shares sold | 6,531,288 | |
Dividends receivable | 2,785,543 | |
Distributions receivable from Fidelity Central Funds | 7,158 | |
Prepaid expenses | 6,184 | |
Other receivables | 52,213 | |
Total assets | 2,132,458,638 | |
|
|
|
Liabilities | ||
Payable for investments purchased | $ 12,657,134 | |
Payable for fund shares redeemed | 10,097,825 | |
Accrued management fee | 792,160 | |
Distribution and service plan fees payable | 8,565 | |
Other affiliated payables | 412,519 | |
Other payables and accrued expenses | 42,698 | |
Total liabilities | 24,010,901 | |
|
|
|
Net Assets | $ 2,108,447,737 | |
Net Assets consist of: |
| |
Paid in capital | $ 2,012,526,102 | |
Distributions in excess of net investment income | (413,817) | |
Accumulated undistributed net realized gain (loss) on investments and foreign currency transactions | (91,729,788) | |
Net unrealized appreciation (depreciation) on investments and assets and liabilities in foreign currencies | 188,065,240 | |
Net Assets | $ 2,108,447,737 | |
See accompanying notes which are an integral part of the financial statements.
Semiannual Report
Financial Statements - continued
Statement of Assets and Liabilities - continued
| December 31, 2012 (Unaudited) | |
|
|
|
Calculation of Maximum Offering Price Class A: | $ 11.83 | |
|
|
|
Maximum offering price per share (100/94.25 of $11.83) | $ 12.55 | |
Class T: | $ 11.84 | |
|
|
|
Maximum offering price per share (100/96.50 of $11.84) | $ 12.27 | |
Class B: | $ 11.81 | |
|
|
|
Class C: | $ 11.76 | |
|
|
|
|
|
|
Mega Cap Stock: | $ 11.89 | |
|
|
|
Institutional Class: | $ 11.86 | |
A Redemption price per share is equal to net asset value less any applicable contingent deferred sales charge.
See accompanying notes which are an integral part of the financial statements.
Semiannual Report
Statement of Operations
Six months ended December 31, 2012 (Unaudited) | ||
|
|
|
Investment Income |
|
|
Dividends |
| $ 23,024,455 |
Income from Fidelity Central Funds |
| 35,512 |
Total income |
| 23,059,967 |
|
|
|
Expenses | ||
Management fee | $ 4,398,759 | |
Transfer agent fees | 2,048,390 | |
Distribution and service plan fees | 43,985 | |
Accounting and security lending fees | 293,454 | |
Custodian fees and expenses | 32,299 | |
Independent trustees' compensation | 6,128 | |
Registration fees | 65,517 | |
Audit | 28,150 | |
Legal | 6,640 | |
Miscellaneous | 5,232 | |
Total expenses before reductions | 6,928,554 | |
Expense reductions | (45,420) | 6,883,134 |
Net investment income (loss) | 16,176,833 | |
Realized and Unrealized Gain (Loss) Net realized gain (loss) on: | ||
Investment securities: |
|
|
Unaffiliated issuers | 28,828,865 | |
Foreign currency transactions | (27,841) | |
Total net realized gain (loss) |
| 28,801,024 |
Change in net unrealized appreciation (depreciation) on: Investment securities | 106,962,766 | |
Assets and liabilities in foreign currencies | 2,670 | |
Total change in net unrealized appreciation (depreciation) |
| 106,965,436 |
Net gain (loss) | 135,766,460 | |
Net increase (decrease) in net assets resulting from operations | $ 151,943,293 | |
See accompanying notes which are an integral part of the financial statements.
Semiannual Report
Financial Statements - continued
Statement of Changes in Net Assets
| Six months ended December 31, 2012 (Unaudited) | Year ended |
Increase (Decrease) in Net Assets |
|
|
Operations |
|
|
Net investment income (loss) | $ 16,176,833 | $ 17,903,977 |
Net realized gain (loss) | 28,801,024 | 43,198,122 |
Change in net unrealized appreciation(depreciation) | 106,965,436 | 29,098,949 |
Net increase (decrease) in net assets resulting | 151,943,293 | 90,201,048 |
Distributions to shareholders from net investmentincome | (27,575,493) | (11,753,098) |
Share transactions - net increase (decrease) | 506,733,530 | 468,368,181 |
Total increase (decrease) in net assets | 631,101,330 | 546,816,131 |
|
|
|
Net Assets | ||
Beginning of period | 1,477,346,407 | 930,530,276 |
End of period (including distributions in excess of net investment income of $413,817 and undistributed net investment income of $10,984,843, respectively) | $ 2,108,447,737 | $ 1,477,346,407 |
See accompanying notes which are an integral part of the financial statements.
Semiannual Report
Financial Highlights - Class A
| Six months ended | Years ended June 30, | ||||
| (Unaudited) | 2012 | 2011 | 2010 | 2009 | 2008 H |
Selected Per-Share Data |
|
|
|
|
| |
Net asset value, beginning of period | $ 11.05 | $ 10.37 | $ 8.07 | $ 7.20 | $ 9.89 | $ 10.61 |
Income from Investment Operations |
|
|
|
|
|
|
Net investment income (loss) E | .08 | .13 | .07 | .06 | .10 | .05 |
Net realized and unrealized gain (loss) | .84 | .64 | 2.28 | .92 | (2.65) | (.77) |
Total from investment operations | .92 | .77 | 2.35 | .98 | (2.55) | (.72) |
Distributions from net investment income | (.14) | (.09) | (.05) | (.11) | (.12) | - |
Distributions from net realized gain | - | - | - | - | (.02) | - |
Total distributions | (.14) | (.09) | (.05) | (.11) | (.14) | - |
Net asset value, end of period | $ 11.83 | $ 11.05 | $ 10.37 | $ 8.07 | $ 7.20 | $ 9.89 |
Total Return B, C, D | 8.39% | 7.57% | 29.23% | 13.65% | (25.98)% | (6.79)% |
Ratios to Average Net Assets F, I |
|
|
|
|
| |
Expenses before reductions | 1.00% A | 1.02% | 1.06% | 1.10% | 1.13% | 1.02% A |
Expenses net of fee waivers, if any | 1.00% A | 1.02% | 1.06% | 1.10% | 1.13% | 1.02% A |
Expenses net of all reductions | .99% A | 1.02% | 1.06% | 1.10% | 1.13% | 1.01% A |
Net investment income (loss) | 1.41% A | 1.28% | .76% | .66% | 1.44% | 1.24% A |
Supplemental Data |
|
|
|
|
|
|
Net assets, end of period (000 omitted) | $ 13,400 | $ 8,527 | $ 4,169 | $ 2,238 | $ 806 | $ 106 |
Portfolio turnover rate G | 26% A | 57% | 53% | 97% | 138% | 97% |
A Annualized
B Total returns for periods of less than one year are not annualized.
C Total returns would have been lower if certain expenses had not been reduced during the applicable periods shown.
D Total returns do not include the effect of the sales charges.
E Calculated based on average shares outstanding during the period.
F Fees and expenses of any underlying Fidelity Central Funds are not included in the Fund's expense ratio. The Fund indirectly bears its proportionate share of the expenses of any underlying Fidelity Central Funds.
G Amount does not include the portfolio activity of any underlying Fidelity Central Funds.
H For the period February 5, 2008 (commencement of sale of shares) to June 30, 2008.
I Expense ratios reflect operating expenses of the class. Expenses before reductions do not reflect amounts reimbursed by the investment adviser or reductions from brokerage service arrangements or reductions from other expense offset arrangements and do not represent the amount paid by the class during periods when reimbursements or reductions occur. Expense ratios before reductions for start--up periods may not be representative of longer-term operating periods. Expenses net of fee waivers reflect expenses after reimbursement by the investment adviser but prior to reductions from brokerage service arrangements or other expense offset arrangements. Expenses net of all reductions represent the net expenses paid by the class.
See accompanying notes which are an integral part of the financial statements.
Semiannual Report
Financial Highlights - Class T
| Six months ended | Years ended June 30, | ||||
| (Unaudited) | 2012 | 2011 | 2010 | 2009 | 2008 H |
Selected Per-Share Data |
|
|
|
|
| |
Net asset value, beginning of period | $ 11.05 | $ 10.38 | $ 8.07 | $ 7.20 | $ 9.88 | $ 10.61 |
Income from InvestmentOperations |
|
|
|
|
| |
Net investment income (loss) E | .06 | .10 | .05 | .03 | .09 | .04 |
Net realized and unrealized gain (loss) | .84 | .64 | 2.29 | .93 | (2.67) | (.77) |
Total from investment operations | .90 | .74 | 2.34 | .96 | (2.58) | (.73) |
Distributions from net investment income | (.11) | (.07) | (.03) | (.09) | (.08) | - |
Distributions from net realized gain | - | - | - | - | (.02) | - |
Total distributions | (.11) | (.07) | (.03) | (.09) | (.10) | - |
Net asset value, end of period | $ 11.84 | $ 11.05 | $ 10.38 | $ 8.07 | $ 7.20 | $ 9.88 |
Total Return B, C, D | 8.18% | 7.19% | 29.08% | 13.32% | (26.21)% | (6.88)% |
Ratios to Average Net Assets F, I |
|
|
|
|
| |
Expenses before reductions | 1.28% A | 1.32% | 1.32% | 1.36% | 1.36% | 1.32% A |
Expenses net of fee waivers, if any | 1.28% A | 1.32% | 1.32% | 1.36% | 1.36% | 1.32% A |
Expenses net of all reductions | 1.28% A | 1.32% | 1.32% | 1.35% | 1.36% | 1.32% A |
Net investment income (loss) | 1.12% A | .98% | .50% | .41% | 1.21% | .89% A |
Supplemental Data |
|
|
|
|
|
|
Net assets, end of period (000 omitted) | $ 5,090 | $ 2,293 | $ 1,682 | $ 1,073 | $ 446 | $ 136 |
Portfolio turnover rate G | 26% A | 57% | 53% | 97% | 138% | 97% |
A Annualized
B Total returns for periods of less than one year are not annualized.
C Total returns would have been lower if certain expenses had not been reduced during the applicable periods shown.
D Total returns do not include the effect of the sales charges.
E Calculated based on average shares outstanding during the period.
F Fees and expenses of any underlying Fidelity Central Funds are not included in the Fund's expense ratio. The Fund indirectly bears its proportionate share of the expenses of any underlying Fidelity Central Funds.
G Amount does not include the portfolio activity of any underlying Fidelity Central Funds.
H For the period February 5, 2008 (commencement of sale of shares) to June 30, 2008.
I Expense ratios reflect operating expenses of the class. Expenses before reductions do not reflect amounts reimbursed by the investment adviser or reductions from brokerage service arrangements or reductions from other expense offset arrangements and do not represent the amount paid by the class during periods when reimbursements or reductions occur. Expense ratios before reductions for start-up periods may not be representative of longer-term operating periods. Expenses net of fee waivers reflect expenses after reimbursement by the investment adviser but prior to reductions from brokerage service arrangements or other expense offset arrangements. Expenses net of all reductions represent the net expenses paid by the class.
See accompanying notes which are an integral part of the financial statements.
Semiannual Report
Financial Highlights - Class B
| Six months ended | Years ended June 30, | ||||
| (Unaudited) | 2012 | 2011 | 2010 | 2009 | 2008 I |
Selected Per-Share Data |
|
|
|
|
| |
Net asset value, beginning of period | $ 10.97 | $ 10.30 | $ 8.02 | $ 7.19 | $ 9.87 | $ 10.61 |
Income from InvestmentOperations |
|
|
|
|
| |
Net investment income (loss) E | .03 | .05 | - K | (.01) | .05 | .02 |
Net realized and unrealized gain (loss) | .85 | .63 | 2.28 | .92 | (2.66) | (.76) |
Total from investment operations | .88 | .68 | 2.28 | .91 | (2.61) | (.74) |
Distributions from net investment income | (.04) | (.01) | - | (.08) | (.05) | - |
Distributions from net realized gain | - | - | - | - | (.02) | - |
Total distributions | (.04) | (.01) | - | (.08) | (.07) | - |
Net asset value, end of period | $ 11.81 | $ 10.97 | $ 10.30 | $ 8.02 | $ 7.19 | $ 9.87 |
Total Return B, C, D | 8.01% | 6.62% | 28.43% | 12.60% | (26.56)% | (6.97)% |
Ratios to Average Net Assets F, J |
|
|
|
|
| |
Expenses before reductions | 1.80% A | 1.82% | 1.83% | 1.88% | 1.88% | 1.73% A |
Expenses net of fee waivers, if any | 1.80% A | 1.82% | 1.83% | 1.88% | 1.88% | 1.73% A |
Expenses net of all reductions | 1.80% A | 1.81% | 1.82% | 1.88% | 1.88% | 1.73% A |
Net investment income (loss) | .60% A | .49% | .00%H | (.12)% | .68% | .52% A |
Supplemental Data |
|
|
|
|
|
|
Net assets, end of period (000 omitted) | $ 656 | $ 704 | $ 764 | $ 667 | $ 263 | $ 107 |
Portfolio turnover rate G | 26% A | 57% | 53% | 97% | 138% | 97% |
A Annualized
B Total returns for periods of less than one year are not annualized.
C Total returns would have been lower if certain expenses had not been reduced during the applicable periods shown.
D Total returns do not include the effect of the contingent deferred sales charge.
E Calculated based on average shares outstanding during the period.
F Fees and expenses of any underlying Fidelity Central Funds are not included in the Fund's expense ratio. The Fund indirectly bears its proportionate share of the expenses of any underlying Fidelity Central Funds.
G Amount does not include the portfolio activity of any underlying Fidelity Central Funds.
H Amount represents less than .01%.
I For the period February 5, 2008 (commencement of sale of shares) to June 30, 2008.
J Expense ratios reflect operating expenses of the class. Expenses before reductions do not reflect amounts reimbursed by the investment adviser or reductions from brokerage service arrangements or reductions from other expense offset arrangements and do not represent the amount paid by the class during periods when reimbursements or reductions occur. Expense ratios before reductions for start-up periods may not be representative of longer-term operating periods. Expenses net of fee waivers reflect expenses after reimbursement by the investment adviser but prior to reductions from brokerage service arrangements or other expense offset arrangements. Expenses net of all reductions represent the net expenses paid by the class.
K Amount represents less than $.01 per share.
See accompanying notes which are an integral part of the financial statements.
Semiannual Report
Financial Highlights - Class C
| Six months ended | Years ended June 30, | ||||
| (Unaudited) | 2012 | 2011 | 2010 | 2009 | 2008 H |
Selected Per-Share Data |
|
|
|
|
| |
Net asset value, beginning of period | $ 10.93 | $ 10.28 | $ 8.01 | $ 7.16 | $ 9.87 | $ 10.61 |
Income from Investment |
|
|
|
|
| |
Net investment income (loss) E | .04 | .05 | - J | (.01) | .05 | .02 |
Net realized and unrealized gain (loss) | .83 | .64 | 2.27 | .92 | (2.66) | (.76) |
Total from investment operations | .87 | .69 | 2.27 | .91 | (2.61) | (.74) |
Distributions from net investment income | (.04) | (.04) | - | (.06) | (.08) | - |
Distributions from net realized gain | - | - | - | - | (.02) | - |
Total distributions | (.04) | (.04) | - | (.06) | (.10) | - |
Net asset value, end of period | $ 11.76 | $ 10.93 | $ 10.28 | $ 8.01 | $ 7.16 | $ 9.87 |
Total Return B, C, D | 7.95% | 6.74% | 28.34% | 12.72% | (26.56)% | (6.97)% |
Ratios to Average Net Assets F, I |
|
|
|
|
| |
Expenses before reductions | 1.77% A | 1.79% | 1.81% | 1.86% | 1.88% | 1.71% A |
Expenses net of fee waivers, if any | 1.77% A | 1.79% | 1.81% | 1.86% | 1.88% | 1.71% A |
Expenses net of all reductions | 1.76% A | 1.79% | 1.81% | 1.85% | 1.88% | 1.71% A |
Net investment income (loss) | .63% A | .51% | .01% | (.10)% | .69% | .55% A |
Supplemental Data |
|
|
|
|
|
|
Net assets, end of period (000 omitted) | $ 4,300 | $ 2,845 | $ 1,913 | $ 807 | $ 470 | $ 98 |
Portfolio turnover rate G | 26% A | 57% | 53% | 97% | 138% | 97% |
A Annualized
B Total returns for periods of less than one year are not annualized.
C Total returns would have been lower if certain expenses had not been reduced during the applicable periods shown.
D Total returns do not include the effect of the contingent deferred sales charge.
E Calculated based on average shares outstanding during the period.
F Fees and expenses of any underlying Fidelity Central Funds are not included in the Fund's expense ratio. The Fund indirectly bears its proportionate share of the expenses of any underlying Fidelity Central Funds.
G Amount does not include the portfolio activity of any underlying Fidelity Central Funds.
H For the period February 5, 2008 (commencement of sale of shares) to June 30, 2008.
I Expense ratios reflect operating expenses of the class. Expenses before reductions do not reflect amounts reimbursed by the investment adviser or reductions from brokerage service arrangements or reductions from other expense offset arrangements and do not represent the amount paid by the class during periods when reimbursements or reductions occur. Expense ratios before reductions for start-up periods may not be representative of longer-term operating periods. Expenses net of fee waivers reflect expenses after reimbursement by the investment adviser but prior to reductions from brokerage service arrangements or other expense offset arrangements. Expenses net of all reductions represent the net expenses paid by the class.
J Amount represents less than $.01 per share.
See accompanying notes which are an integral part of the financial statements.
Semiannual Report
Financial Highlights - Mega Cap Stock
| Six months ended | Years ended June 30, | ||||
| (Unaudited) | 2012 | 2011 | 2010 | 2009 | 2008 |
Selected Per-Share Data |
|
|
|
|
| |
Net asset value, beginning of period | $ 11.11 | $ 10.43 | $ 8.11 | $ 7.23 | $ 9.91 | $ 12.06 |
Income from Investment |
|
|
|
|
| |
Net investment income (loss) D | .10 | .16 | .10 | .08 | .13 | .14 |
Net realized and unrealized gain (loss) | .85 | .64 | 2.29 | .93 | (2.67) | (1.60) |
Total from investment operations | .95 | .80 | 2.39 | 1.01 | (2.54) | (1.46) |
Distributions from net investmentincome | (.17) | (.12) | (.07) | (.13) | (.12) | (.07) |
Distributions from net realized gain | - | - | - | - | (.02) | (.62) |
Total distributions | (.17) | (.12) | (.07) | (.13) | (.14) | (.69) |
Net asset value, end of period | $ 11.89 | $ 11.11 | $ 10.43 | $ 8.11 | $ 7.23 | $ 9.91 |
Total Return B, C | 8.56% | 7.83% | 29.61% | 13.93% | (25.77)% | (12.73)% |
Ratios to Average Net Assets E, G |
|
|
|
|
| |
Expenses before reductions | .71% A | .76% | .79% | .81% | .79% | .75% |
Expenses net of fee waivers, if any | .71% A | .76% | .79% | .80% | .78% | .74% |
Expenses net of all reductions | .70% A | .75% | .78% | .79% | .78% | .74% |
Net investment income (loss) | 1.69% A | 1.55% | 1.04% | .96% | 1.78% | 1.28% |
Supplemental Data |
|
|
|
|
|
|
Net assets, end of period (000 omitted) | $ 1,775,218 | $ 1,287,144 | $ 785,233 | $ 500,407 | $ 253,164 | $ 667,542 |
Portfolio turnover rate F | 26% A | 57% | 53% | 97% | 138% | 97% |
A Annualized
B Total returns for periods of less than one year are not annualized.
C Total returns would have been lower if certain expenses had not been reduced during the applicable periods shown.
D Calculated based on average shares outstanding during the period.
E Fees and expenses of any underlying Fidelity Central Funds are not included in the Fund's expense ratio. The Fund indirectly bears its proportionate share of the expenses of any underlying Fidelity Central Funds.
F Amount does not include the portfolio activity of any underlying Fidelity Central Funds.
G Expense ratios reflect operating expenses of the class. Expenses before reductions do not reflect amounts reimbursed by the investment adviser or reductions from brokerage service arrangements or reductions from other expense offset arrangements and do not represent the amount paid by the class during periods when reimbursements or reductions occur. Expenses net of fee waivers reflect expenses after reimbursement by the investment adviser but prior to reductions from brokerage service arrangements or other expense offset arrangements. Expenses net of all reductions represent the net expenses paid by the class.
See accompanying notes which are an integral part of the financial statements.
Semiannual Report
Financial Highlights - Institutional Class
| Six months ended | Years ended June 30, | ||||
| (Unaudited) | 2012 | 2011 | 2010 | 2009 | 2008 G |
Selected Per-Share Data |
|
|
|
|
| |
Net asset value, beginning of period | $ 11.08 | $ 10.40 | $ 8.09 | $ 7.22 | $ 9.91 | $ 10.61 |
Income from Investment |
|
|
|
|
| |
Net investment income (loss) D | .10 | .16 | .10 | .08 | .13 | .07 |
Net realized and unrealized gain (loss) | .85 | .63 | 2.30 | .92 | (2.67) | (.77) |
Total from investment operations | .95 | .79 | 2.40 | 1.00 | (2.54) | (.70) |
Distributions from net investment income | (.17) | (.11) | (.09) | (.13) | (.13) | - |
Distributions from net realized gain | - | - | - | - | (.02) | - |
Total distributions | (.17) | (.11) | (.09) | (.13) | (.15) | - |
Net asset value, end of period | $ 11.86 | $ 11.08 | $ 10.40 | $ 8.09 | $ 7.22 | $ 9.91 |
Total Return B, C | 8.58% | 7.77% | 29.74% | 13.89% | (25.81)% | (6.60)% |
Ratios to Average Net Assets E,H |
|
|
|
|
| |
Expenses before reductions | .75% A | .78% | .79% | .88% | .77% | .70% A |
Expenses net of fee waivers, if any | .75% A | .78% | .79% | .88% | .77% | .70% A |
Expenses net of all reductions | .74% A | .77% | .78% | .87% | .77% | .70% A |
Net investment income (loss) | 1.65% A | 1.53% | 1.04% | .88% | 1.79% | 1.57% A |
Supplemental Data |
|
|
|
|
|
|
Net assets, end of period (000 omitted) | $ 309,785 | $ 175,833 | $ 136,768 | $ 1,568 | $ 515 | $ 93 |
Portfolio turnover rate F | 26% A | 57% | 53% | 97% | 138% | 97% |
A Annualized
B Total returns for periods of less than one year are not annualized.
C Total returns would have been lower if certain expenses had not been reduced during the applicable periods shown.
D Calculated based on average shares outstanding during the period.
E Fees and expenses of any underlying Fidelity Central Funds are not included in the Fund's expense ratio. The Fund indirectly bears its proportionate share of the expenses of any underlying Fidelity Central Funds.
F Amount does not include the portfolio activity of any underlying Fidelity Central Funds.
G For the period February 5, 2008 (commencement of sale of shares) to June 30, 2008.
H Expense ratios reflect operating expenses of the class. Expenses before reductions do not reflect amounts reimbursed by the investment adviser or reductions from brokerage service arrangements or reductions from other expense offset arrangements and do not represent the amount paid by the class during periods when reimbursements or reductions occur. Expense ratios before reductions for start-up periods may not be representative of longer-term operating periods. Expenses net of fee waivers reflect expenses after reimbursement by the investment adviser but prior to reductions from brokerage service arrangements or other expense offset arrangements. Expenses net of all reductions represent the net expenses paid by the class.
See accompanying notes which are an integral part of the financial statements.
Semiannual Report
Notes to Financial Statements
For the period ended December 31, 2012 (Unaudited)
1. Organization.
Fidelity® Mega Cap Stock Fund (the Fund) is a fund of Fidelity Hastings Street Trust (the Trust) and is authorized to issue an unlimited number of shares. The Trust is registered under the Investment Company Act of 1940, as amended (the 1940 Act), as an open-end management investment company organized as a Massachusetts business trust. The Fund offers Class A, Class T, Class C, Mega Cap Stock, and Institutional Class shares, each of which, along with Class B shares, has equal rights as to assets and voting privileges. Class B shares are closed to new accounts and additional purchases, except for exchanges and reinvestments. Each class has exclusive voting rights with respect to matters that affect that class. Class B shares will automatically convert to Class A shares after a holding period of seven years from the initial date of purchase. Investment income, realized and unrealized capital gains and losses, the common expenses of the Fund, and certain fund-level expense reductions, if any, are allocated on a pro-rata basis to each class based on the relative net assets of each class to the total net assets of the Fund. Each class differs with respect to transfer agent and distribution and service plan fees incurred. Certain expense reductions may also differ by class.
2. Investments in Fidelity Central Funds.
The Fund invests in Fidelity Central Funds, which are open-end investment companies available only to other investment companies and accounts managed by Fidelity Management & Research Company (FMR) and its affiliates. The Fund's Schedule of Investments lists each of the Fidelity Central Funds held as of period end, if any, as an investment of the Fund, but does not include the underlying holdings of each Fidelity Central Fund. As an Investing Fund, the Fund indirectly bears its proportionate share of the expenses of the underlying Fidelity Central Funds.
The Money Market Central Funds seek preservation of capital and current income and are managed by Fidelity Investments Money Management, Inc. (FIMM), an affiliate of FMR.
A complete unaudited list of holdings for each Fidelity Central Fund is available upon request or at the Securities and Exchange Commission (the SEC) website at www.sec.gov. In addition, the financial statements of the Fidelity Central Funds are available on the SEC website or upon request.
3. Significant Accounting Policies.
The financial statements have been prepared in conformity with accounting principles generally accepted in the United States of America (GAAP), which require management to make certain estimates and assumptions at the date of the financial statements. Actual results could differ from those estimates. Subsequent events, if any, through the date that the financial statements were issued have been evaluated in the preparation of
Semiannual Report
3. Significant Accounting Policies - continued
the financial statements. The following summarizes the significant accounting policies of the Fund:
Investment Valuation. Investments are valued as of 4:00 p.m. Eastern time on the last calendar day of the period. In accordance with valuation policies and procedures approved by the Board of Trustees (the Board), the Fund attempts to obtain prices from one or more third party pricing vendors or brokers to value its investments. When current market prices, quotations or rates are not readily available or reliable, investments will be fair valued in good faith by the FMR Fair Value Committee (the Committee), in accordance with procedures adopted by the Fund's Board. Factors used in determining fair value vary by investment type and may include market or investment specific events. The frequency with which these procedures are used cannot be predicted and they may be utilized to a significant extent. The Committee oversees the Fund's valuation policies and procedures and is responsible for approving and reporting to the Board all fair value determinations.
The Fund categorizes the inputs to valuation techniques used to value its investments into a disclosure hierarchy consisting of three levels as shown below:
Level 1 - quoted prices in active markets for identical investments
Level 2 - other significant observable inputs (including quoted prices for similar investments, interest rates, prepayment speeds, etc.)
Level 3 - unobservable inputs (including the Fund's own assumptions based on the best information available)
Valuation techniques used to value the Fund's investments by major category are as follows:
Equity securities, including restricted securities, for which market quotations are readily available, are valued at the last reported sale price or official closing price as reported by a third party pricing vendor on the primary market or exchange on which they are traded and are categorized as Level 1 in the hierarchy. In the event there were no sales during the day or closing prices are not available, securities are valued at the last quoted bid price or may be valued using the last available price and are generally categorized as Level 2 in the hierarchy. For foreign equity securities, when significant market or security specific events arise, comparisons to the valuation of American Depositary Receipts (ADRs), futures contracts, Exchange-Traded Funds (ETFs) and certain indexes as well as quoted prices for similar securities are used and are categorized as Level 2 in the hierarchy. Utilizing these techniques may result in transfers between Level 1 and Level 2.
Semiannual Report
Notes to Financial Statements (Unaudited) - continued
3. Significant Accounting Policies - continued
Investment Valuation - continued
Investments in open-end mutual funds, including the Fidelity Central Funds, are valued at their closing net asset value (NAV) each business day and are categorized as Level 1 in the hierarchy.
Changes in valuation techniques may result in transfers in or out of an assigned level within the disclosure hierarchy. The aggregate value of investments by input level, as of December 31, 2012, is included at the end of the Fund's Schedule of Investments.
Foreign Currency. The Fund may use foreign currency contracts to facilitate transactions in foreign-denominated securities. Gains and losses from these transactions may arise from changes in the value of the foreign currency or if the counterparties do not perform under the contracts' terms.
Foreign-denominated assets, including investment securities, and liabilities are translated into U.S. dollars at the exchange rates at period end. Purchases and sales of investment securities, income and dividends received and expenses denominated in foreign currencies are translated into U.S. dollars at the exchange rate in effect on the transaction date.
The effects of exchange rate fluctuations on investments are included with the net realized and unrealized gain (loss) on investment securities. Other foreign currency transactions resulting in realized and unrealized gain (loss) are disclosed separately.
Investment Transactions and Income. For financial reporting purposes, the Fund's investment holdings and NAV include trades executed through the end of the last business day of the period. The NAV per share for processing shareholder transactions is calculated as of the close of business of the New York Stock Exchange (NYSE), normally 4:00 p.m. Eastern time and includes trades executed through the end of the prior business day. Gains and losses on securities sold are determined on the basis of identified cost and may include proceeds received from litigation. Dividend income is recorded on the ex-dividend date, except for certain dividends from foreign securities where the ex-dividend date may have passed, which are recorded as soon as the Fund is informed of the ex-dividend date. Non-cash dividends included in dividend income, if any, are recorded at the fair market value of the securities received. Distributions received on securities that represent a return of capital or capital gain are recorded as a reduction of cost of investments and/or as a realized gain. The Fund estimates the components of distributions received that may be considered return of capital distributions or capital gain distributions. Interest income and distributions from the Fidelity Central Funds are accrued as earned. Investment income is recorded net of foreign taxes withheld where recovery of such taxes is uncertain.
Semiannual Report
3. Significant Accounting Policies - continued
Expenses. Expenses directly attributable to a fund are charged to that fund. Expenses attributable to more than one fund are allocated among the respective funds on the basis of relative net assets or other appropriate methods. Expense estimates are accrued in the period to which they relate and adjustments are made when actual amounts are known.
Income Tax Information and Distributions to Shareholders. Each year, the Fund intends to qualify as a regulated investment company under Subchapter M of the Internal Revenue Code, including distributing substantially all of its taxable income and realized gains. As a result, no provision for income taxes is required. The Fund files a U.S. federal tax return, in addition to state and local tax returns as required. A fund's federal income tax returns are subject to examination by the Internal Revenue Service (IRS) for a period of three fiscal years after they are filed. State and local tax returns may be subject to examination for an additional fiscal year depending on the jurisdiction. Foreign taxes are provided for based on the Fund's understanding of the tax rules and rates that exist in the foreign markets in which it invests.
Distributions are declared and recorded on the ex-dividend date. Income dividends and capital gain distributions are declared separately for each class. Income and capital gain distributions are determined in accordance with income tax regulations, which may differ from GAAP.
Capital accounts within the financial statements are adjusted for permanent book-tax differences. These adjustments have no impact on net assets or the results of operations. Temporary book-tax differences will reverse in a subsequent period.
Book-tax differences are primarily due to foreign currency transactions, market discount, futures transactions, equity-debt classifications, capital loss carryforwards, and losses deferred due to wash sales.
The federal tax cost of investment securities and unrealized appreciation (depreciation) as of period end were as follows:
Gross unrealized appreciation | $ 224,061,201 |
Gross unrealized depreciation | (42,793,431) |
Net unrealized appreciation (depreciation) on securities and other investments | $ 181,267,770 |
|
|
Tax cost | $ 1,929,980,161 |
Capital loss carryforwards are only available to offset future capital gains of the Fund to the extent provided by regulations and may be limited. Under the Regulated Investment Company Modernization Act of 2010 (the Act), the Fund is permitted to carry forward capital losses incurred in taxable years beginning after December 22, 2010 for an
Semiannual Report
Notes to Financial Statements (Unaudited) - continued
3. Significant Accounting Policies - continued
Income Tax Information and Distributions to Shareholders - continued
unlimited period and such capital losses are required to be used prior to any losses that expire. At June 30, 2012, capital loss carryforwards were as follows:
Fiscal year of expiration |
|
2017 | $ (3,091,486) |
2018 | (109,353,222) |
Total capital loss carryforward | $ (112,444,708) |
4. Purchases and Sales of Investments.
Purchases and sales of securities, other than short-term securities, aggregated $727,046,610 and $247,233,949, respectively.
5. Fees and Other Transactions with Affiliates.
Management Fee. FMR and its affiliates provide the Fund with investment management related services for which the Fund pays a monthly management fee. The management fee is the sum of an individual fund fee rate that is based on an annual rate of .20% of the Fund's average net assets and an annualized group fee rate that averaged .26% during the period. The group fee rate is based upon the average net assets of all the mutual funds advised by FMR. The group fee rate decreases as assets under management increase and increases as assets under management decrease. For the period, the total annualized management fee rate was .46% of the Fund's average net assets.
Distribution and Service Plan Fees. In accordance with Rule 12b-1 of the 1940 Act, the Fund has adopted separate Distribution and Service Plans for each class of shares. Certain classes pay Fidelity Distributors Corporation (FDC), an affiliate of FMR, separate Distribution and Service Fees, each of which is based on an annual percentage of each class' average net assets. In addition, FDC may pay financial intermediaries for selling shares of the Fund and providing shareholder support services. For the period, the Distribution and Service Fee rates, total fees and amounts retained by FDC were as follows:
| Distribution | Service | Total Fees | Retained |
Class A | -% | .25% | $ 13,508 | $ 272 |
Class T | .25% | .25% | 9,224 | - |
Class B | .75% | .25% | 3,554 | 2,666 |
Class C | .75% | .25% | 17,699 | 6,562 |
|
|
| $ 43,985 | $ 9,500 |
Semiannual Report
5. Fees and Other Transactions with Affiliates - continued
Sales Load. FDC may receive a front-end sales charge of up to 5.75% for selling Class A shares and 3.50% for selling Class T shares, some of which is paid to financial intermediaries for selling shares of the Fund. Depending on the holding period, FDC may receive contingent deferred sales charges levied on Class A, Class T, Class B, and Class C redemptions. The deferred sales charges range from 5.00% to 1.00% for Class B shares, 1.00% for Class C shares, 1.00% for certain purchases of Class A shares and .25% for certain purchases of Class T shares.
For the period, sales charge amounts retained by FDC were as follows:
| Retained |
Class A | $ 8,445 |
Class T | 868 |
Class B* | 218 |
Class C* | 496 |
| $ 10,027 |
* When Class B and Class C shares are initially sold, FDC pays commissions from its own resources to financial intermediaries through which the sales are made.
Transfer Agent Fees. Fidelity Investments Institutional Operations Company, Inc. (FIIOC), an affiliate of FMR, is the transfer, dividend disbursing and shareholder servicing agent for each class of the Fund. FIIOC receives account fees and asset-based fees that vary according to the account size and type of account of the shareholders of the respective classes of the Fund. FIIOC pays for typesetting, printing and mailing of shareholder reports, except proxy statements. For the period, transfer agent fees for each class were as follows:
| Amount | % of |
Class A | $ 13,124 | .24 |
Class T | 5,162 | .28 |
Class B | 1,068 | .30 |
Class C | 4,653 | .26 |
Mega Cap Stock | 1,679,362 | .21 |
Institutional Class | 345,021 | .25 |
| $ 2,048,390 |
|
* Annualized
Accounting and Security Lending Fees. Fidelity Service Company, Inc. (FSC), an affiliate of FMR, maintains the Fund's accounting records. The accounting fee is based on the level of average net assets for each month. Under a separate contract, FSC
Semiannual Report
Notes to Financial Statements (Unaudited) - continued
5. Fees and Other Transactions with Affiliates - continued
Accounting and Security Lending Fees - continued
administers the security lending program. The security lending fee is based on the number and duration of lending transactions.
Brokerage Commissions. The Fund placed a portion of its portfolio transactions with brokerage firms which are affiliates of the investment adviser. The commissions paid to these affiliated firms were $16,707 for the period.
6. Committed Line of Credit.
The Fund participates with other funds managed by FMR or an affiliate in a $4.25 billion credit facility (the "line of credit") to be utilized for temporary or emergency purposes to fund shareholder redemptions or for other short-term liquidity purposes. The Fund has agreed to pay commitment fees on its pro-rata portion of the line of credit, which amounted to $2,016 and is reflected in Miscellaneous expenses on the Statement of Operations. During the period, there were no borrowings on this line of credit.
7. Security Lending.
The Fund lends portfolio securities through a lending agent from time to time in order to earn additional income. For equity securities, a lending agent is used and may loan securities to certain qualified borrowers, including Fidelity Capital Markets (FCM), a broker-dealer affiliated with the Fund. On the settlement date of the loan, the Fund receives collateral (in the form of U.S. Treasury obligations, letters of credit and/or cash) against the loaned securities and maintains collateral in an amount not less than 100% of the market value of the loaned securities during the period of the loan. The market value of the loaned securities is determined at the close of business of the Fund and any additional required collateral is delivered to the Fund on the next business day. If the borrower defaults on its obligation to return the securities loaned because of insolvency or other reasons, a fund could experience delays and costs in recovering the securities loaned or in gaining access to the collateral. Any cash collateral received is invested in the Fidelity Securities Lending Cash Central Fund. At period end, there were no security loans outstanding. Security lending income represents the income earned on investing cash collateral, less rebates paid to borrowers and any lending agent fees associated with the loan, plus any premium payments received for lending certain types of securities. Security lending income is presented in the Statement of Operations as a component of income from Fidelity Central Funds. Total security lending income during the period amounted to $10,371. During the period, there were no securities loaned to FCM.
Semiannual Report
8. Expense Reductions.
Many of the brokers with whom FMR places trades on behalf of the Fund provided services to the Fund in addition to trade execution. These services included payments of certain expenses on behalf of the Fund totaling $45,405 for the period. In addition, through arrangements with the Fund's custodian, credits realized as a result of uninvested cash balances were used to reduce the Fund's expenses. During the period, these credits reduced the Fund's custody expenses by $15.
9. Distributions to Shareholders.
Distributions to shareholders of each class were as follows:
Six months ended | Year ended | |
From net investment income |
|
|
Class A | $ 137,534 | $ 41,978 |
Class T | 36,494 | 11,957 |
Class B | 2,304 | 701 |
Class C | 13,133 | 10,116 |
Mega Cap Stock | 23,359,423 | 10,229,962 |
Institutional Class | 4,026,605 | 1,458,384 |
Total | $ 27,575,493 | $ 11,753,098 |
10. Share Transactions.
Transactions for each class of shares were as follows:
| Shares | Dollars | ||
Six months ended December 31, | Year ended | Six months ended | Year ended | |
Class A |
|
|
|
|
Shares sold | 484,461 | 486,313 | $ 5,672,260 | $ 5,118,655 |
Reinvestment of distributions | 11,084 | 3,634 | 127,952 | 35,610 |
Shares redeemed | (134,571) | (120,131) | (1,568,852) | (1,250,294) |
Net increase (decrease) | 360,974 | 369,816 | $ 4,231,360 | $ 3,903,971 |
Class T |
|
|
|
|
Shares sold | 261,293 | 105,560 | $ 3,063,989 | $ 1,103,327 |
Reinvestment of distributions | 3,084 | 1,213 | 35,829 | 11,925 |
Shares redeemed | (42,256) | (61,297) | (497,638) | (633,953) |
Net increase (decrease) | 222,121 | 45,476 | $ 2,602,180 | $ 481,299 |
Semiannual Report
Notes to Financial Statements (Unaudited) - continued
10. Share Transactions - continued
| Shares | Dollars | ||
Six months ended December 31, | Year ended | Six months ended | Year ended | |
Class B |
|
|
|
|
Shares sold | 3,845 | 9,865 | $ 45,941 | $ 101,146 |
Reinvestment of distributions | 196 | 69 | 2,261 | 689 |
Shares redeemed | (12,616) | (20,058) | (147,406) | (199,056) |
Net increase (decrease) | (8,575) | (10,124) | $ (99,204) | $ (97,221) |
Class C |
|
|
|
|
Shares sold | 155,422 | 229,191 | $ 1,808,220 | $ 2,376,452 |
Reinvestment of distributions | 988 | 856 | 11,494 | 8,451 |
Shares redeemed | (51,188) | (155,763) | (593,856) | (1,568,860) |
Net increase (decrease) | 105,222 | 74,284 | $ 1,225,858 | $ 816,043 |
Mega Cap Stock |
|
|
|
|
Shares sold | 47,376,825 | 74,953,852 | $ 545,879,670 | $ 795,313,856 |
Reinvestment of distributions | 1,836,891 | 965,264 | 21,294,765 | 9,476,451 |
Shares redeemed | (15,762,374) | (35,350,283) | (184,312,176) | (369,162,567) |
Net increase (decrease) | 33,451,342 | 40,568,833 | $ 382,862,259 | $ 435,627,740 |
Institutional Class |
|
|
|
|
Shares sold | 10,885,901 | 7,943,118 | $ 123,237,266 | $ 80,524,837 |
Reinvestment of distributions | 338,467 | 144,898 | 3,911,623 | 1,415,456 |
Shares redeemed | (962,943) | (5,373,433) | (11,237,812) | (54,303,944) |
Net increase (decrease) | 10,261,425 | 2,714,583 | $ 115,911,077 | $ 27,636,349 |
11. Other.
The Fund's organizational documents provide former and current trustees and officers with a limited indemnification against liabilities arising in connection with the performance of their duties to the Fund. In the normal course of business, the Fund may also enter into contracts that provide general indemnifications. The Fund's maximum exposure under these arrangements is unknown as this would be dependent on future claims that may be made against the Fund. The risk of material loss from such claims is considered remote.
Semiannual Report
Board Approval of Investment Advisory Contracts and Management Fees
Fidelity Mega Cap Stock Fund
Each year, the Board of Trustees, including the Independent Trustees (together, the Board), votes on the renewal of the management contract and sub-advisory agreements (together, the Advisory Contracts) for the fund. The Board, assisted by the advice of fund counsel and Independent Trustees' counsel, requests and considers a broad range of information relevant to the renewal of the Advisory Contracts throughout the year.
The Board meets regularly and, at each of its meetings, considers factors that are relevant to its annual consideration of the renewal of the fund's Advisory Contracts, including the services and support provided to the fund and its shareholders. The Board has established various standing committees, each composed of and chaired by Independent Trustees with varying backgrounds, to which the Board has assigned specific subject matter responsibilities in order to enhance effective decision-making by the Board. The Board, acting directly and through its Committees, requests and receives information concerning the annual consideration of the renewal of the fund's Advisory Contracts. The Board also meets as needed to consider matters specifically related to the Board's annual consideration of the renewal of Advisory Contracts. Members of the Board may also meet with trustees of other Fidelity funds through ad hoc joint committees to discuss certain matters relevant to the Fidelity funds.
At its July 2012 meeting, the Board of Trustees, including the Independent Trustees, unanimously determined to renew the fund's Advisory Contracts. In reaching its determination, the Board considered all factors it believed relevant, including (i) the nature, extent, and quality of the services to be provided to the fund and its shareholders (including the investment performance of the fund); (ii) the competitiveness of the fund's management fee and total expense ratio relative to peer funds; (iii) the total costs of the services to be provided by and the profits to be realized by Fidelity from its relationship with the fund; (iv) the extent to which economies of scale exist and would be realized as the fund grows; and (v) whether fee levels reflect these economies of scale, if any, for the benefit of fund shareholders.
In considering whether to renew the Advisory Contracts for the fund, the Board reached a determination, with the assistance of fund counsel and Independent Trustees' counsel and through the exercise of its business judgment, that the renewal of the Advisory Contracts is in the best interests of the fund and its shareholders and that the compensation payable under the Advisory Contracts is fair and reasonable. The Board's decision to renew the Advisory Contracts was not based on any single factor, but rather was based on a comprehensive consideration of all the information provided to the Board at its meetings throughout the year. The Board, in reaching its determination to renew the Advisory Contracts, is aware that shareholders in the fund have a broad range of investment choices available to them, including a wide choice among mutual funds offered by Fidelity's competitors, and that the fund's shareholders, who have the opportunity to review and weigh the disclosure provided by the fund in its prospectus and other public disclosures, have chosen to invest in this fund, managed by Fidelity.
Semiannual Report
Nature, Extent, and Quality of Services Provided. The Board considered the staffing within the investment adviser, FMR, and the sub-advisers (together, the Investment Advisers), including the backgrounds of the fund's investment personnel, and also considered the fund's investment objective, strategies, and related investment philosophy. The Independent Trustees also had discussions with senior management of Fidelity's investment operations and investment groups. The Board considered the structure of the portfolio manager compensation program and whether this structure provides appropriate incentives to act in the best interests of the fund.
Resources Dedicated to Investment Management and Support Services. The Board and the Fund Oversight and Research Committees reviewed the general qualifications and capabilities of the Investment Advisers' investment staff, including its size, education, experience, and resources, as well as the Investment Advisers' approach to recruiting, training, managing, and compensating investment personnel. The Board also noted that FMR has continued to increase the resources devoted to non-U.S. offices, including expansion of Fidelity's global investment organization. The Board noted that Fidelity's analysts have extensive resources, tools and capabilities that allow them to conduct sophisticated quantitative and fundamental analysis, as well as credit analysis of issuers, counterparties and guarantors. The Board also believes that Fidelity's investment professionals have sufficient access to global information and data so as to provide competitive investment results over time, and that those professionals also have access to sophisticated tools that permit them to assess portfolio construction and risk and performance attribution characteristics continuously, as well as to transmit new information and research conclusions rapidly around the world. Additionally, in its deliberations, the Board considered the Investment Advisers' trading and risk management capabilities and resources, which are an integral part of the investment management process.
Shareholder and Administrative Services. The Board considered (i) the nature, extent, quality, and cost of advisory, administrative, and shareholder services performed by the Investment Advisers and their affiliates under the Advisory Contracts and under separate agreements covering transfer agency, pricing and bookkeeping, and securities lending services for the fund; (ii) the nature and extent of the supervision of third party service providers, principally custodians and subcustodians; and (iii) the resources devoted to, and the record of compliance with, the fund's compliance policies and procedures. The Board also reviewed the allocation of fund brokerage, including allocations to brokers affiliated with the Investment Advisers, the use of brokerage commissions to pay fund expenses, and the use of "soft" commission dollars to pay for research services.
Semiannual Report
Board Approval of Investment Advisory Contracts and
Management Fees - continued
The Board noted that the growth of fund assets over time across the complex allows Fidelity to reinvest in the development of services designed to enhance the value or convenience of the Fidelity funds as investment vehicles. These services include 24-hour access to account information and market information through telephone representatives and over the Internet, investor education materials and asset allocation tools, and the expanded availability of Fidelity Investor Centers.
Investment in a Large Fund Family. The Board considered the benefits to shareholders of investing in a Fidelity fund, including the benefits of investing in a fund that is part of a large family of funds offering a variety of investment disciplines and providing a large variety of mutual fund investor services. The Board noted that Fidelity had taken, or had made recommendations that resulted in the Fidelity funds taking, a number of actions over the previous year that benefited particular funds, including (i) continuing to dedicate additional resources to investment research and support of the senior management team that oversees asset management; (ii) persisting in efforts to enhance Fidelity's research capabilities, in particular, international research; (iii) launching new funds and making other enhancements to meet client needs for global and income-oriented solutions; (iv) continuing to launch dedicated lower cost underlying funds to meet investment management's portfolio construction needs related to expanding underlying fund options, specifically for the Freedom Fund product lines; (v) adopting a "Stock Selector" sector neutral investment approach and employing a team of portfolio managers who are sector specialists to manage certain funds; (vi) rationalizing product lines and gaining increased efficiencies through the mergers of several funds into other funds; (vii) strengthening the Spartan Index Fund product line by adding new funds and/or new low-cost institutional share classes, restructuring fund expenses to accommodate new classes, and reducing investment minimums for certain classes of shares; (viii) modifying the eligibility criteria for Institutional Class shares to increase their appeal to government entities and charitable investors; and (ix) reducing certain transfer agent fee rates.
Investment Performance. The Board considered whether the fund has operated in accordance with its investment objective, as well as its record of compliance with its investment restrictions. It also reviewed the fund's absolute investment performance for each class, as well as the fund's relative investment performance for each class measured over multiple periods against a broad-based securities market index. The Board noted that FMR believes that no meaningful peer group exists for the fund principally because most other funds in the fund's third-party peer group have different and/or broader investment mandates than the fund's more specialized strategies. The following charts considered by the Board show, over the one-, three-, and five-year periods ended December 31, 2011, as available, the cumulative total returns of the retail class and Class B of the fund and the cumulative total returns of a broad-based securities market index ("benchmark"). The returns of the retail class and Class B show the performance of the highest performing class (based on five-year performance) and the lowest performing class (based on three-year performance), respectively.
Semiannual Report
Fidelity Mega Cap Stock Fund
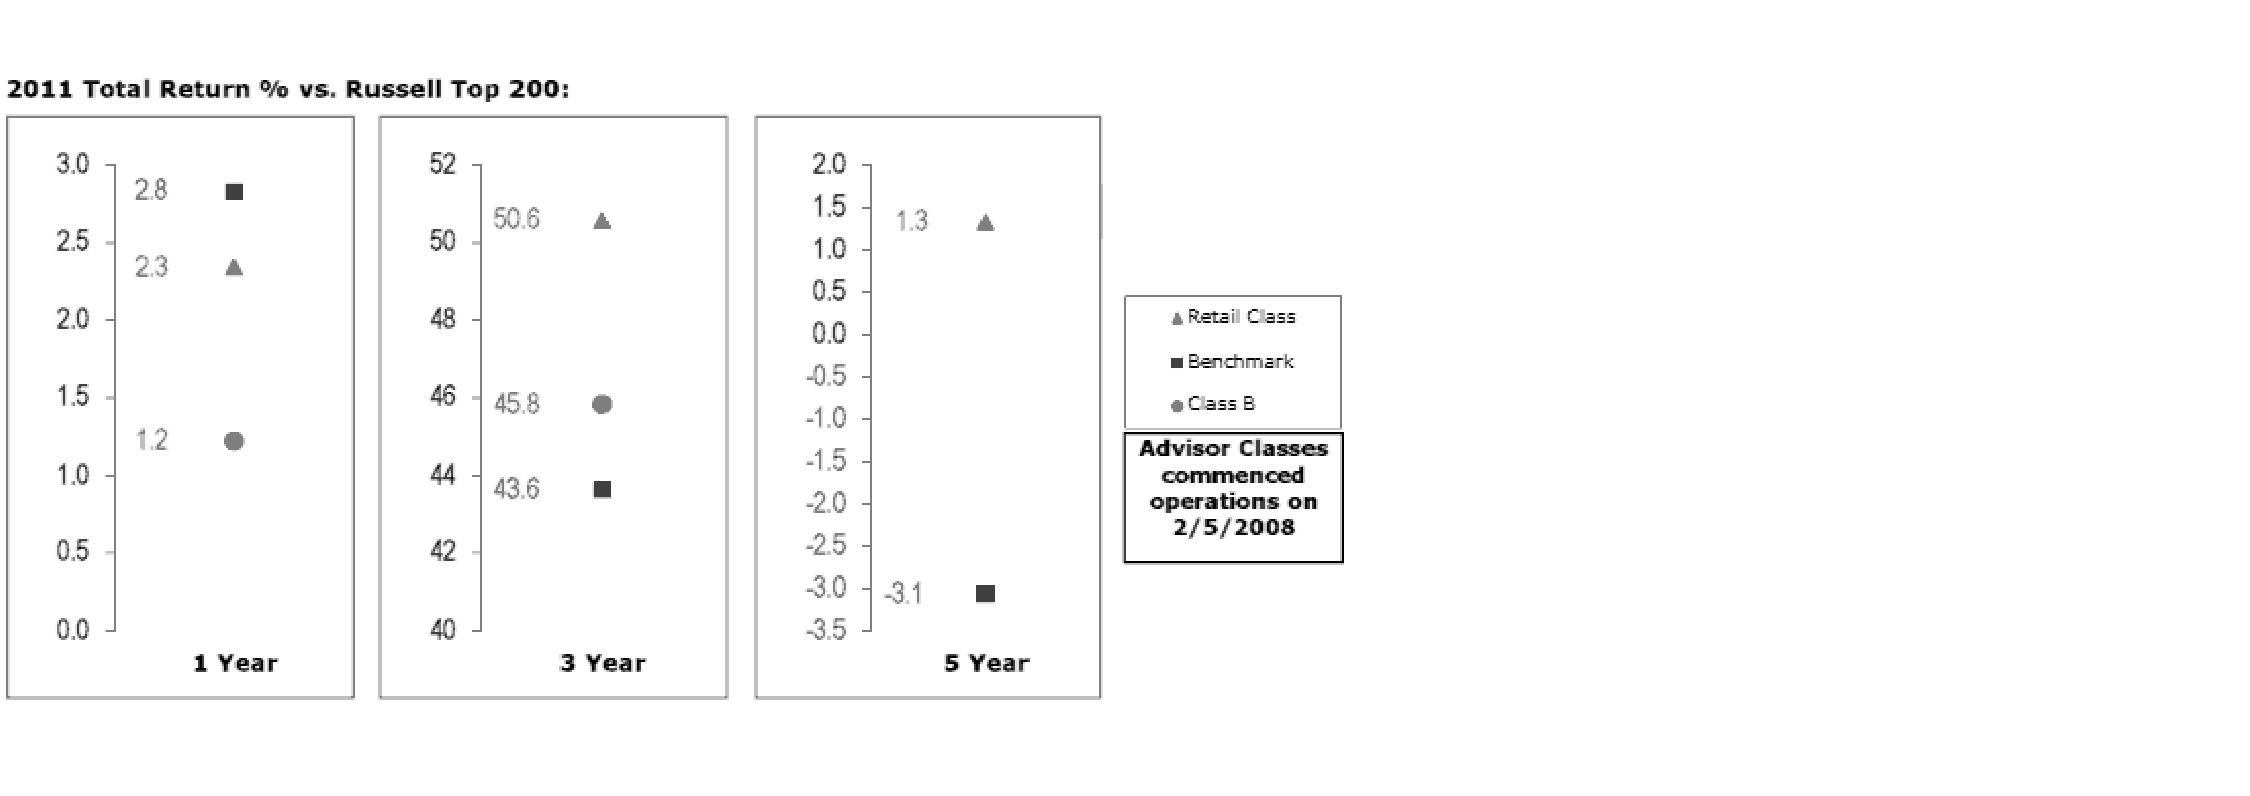
The Board noted that the investment performance of the retail class of the fund compared favorably to its benchmark for the three- and five-year periods, although the fund's one-year total return was lower than its benchmark. The Board considered that the variations in performance among the fund's classes reflect the variations in class expenses, which result in lower performance for higher expense classes. The Board also reviewed the fund's performance since inception as well as performance in the current year.
Based on its review, the Board concluded that the nature, extent, and quality of services provided to the fund under the Advisory Contracts should benefit the fund's shareholders.
Competitiveness of Management Fee and Total Expense Ratio. The Board considered the fund's management fee and total expense ratio compared to "mapped groups" of competitive funds and classes. Fidelity creates "mapped groups" by combining similar Lipper investment objective categories that have comparable management fee characteristics. Combining Lipper investment objective categories aids the Board's management fee and total expense ratio comparisons by broadening the competitive group used for comparison and by reducing the number of universes to which various Fidelity funds are compared.
Semiannual Report
Board Approval of Investment Advisory Contracts and
Management Fees - continued
Management Fee. The Board considered two proprietary management fee comparisons for the 12-month periods shown in the chart below. The group of Lipper funds used by the Board for management fee comparisons is referred to below as the "Total Mapped Group." The Total Mapped Group comparison focuses on a fund's standing relative to the total universe of comparable funds available to investors in terms of gross management fees before expense reimbursements or caps. "TMG %" represents the percentage of funds in the Total Mapped Group that had management fees that were lower than the fund's. For example, a TMG % of 14% means that 86% of the funds in the Total Mapped Group had higher management fees than the fund. The "Asset-Size Peer Group" (ASPG) comparison focuses on a fund's standing relative to non-Fidelity funds similar in size to the fund within the Total Mapped Group. The ASPG represents at least 15% of the funds in the Total Mapped Group with comparable asset size and management fee characteristics, subject to a minimum of 50 funds (or all funds in the Total Mapped Group if fewer than 50). Additional information, such as the ASPG quartile in which the fund's management fee ranked, is also included in the chart and considered by the Board.
Fidelity Mega Cap Stock Fund

The Board noted that the fund's management fee ranked below the median of its Total Mapped Group and below the median of its ASPG for 2011.
Based on its review, the Board concluded that the fund's management fee is fair and reasonable in light of the services that the fund receives and the other factors considered.
Total Expense Ratio. In its review of each class's total expense ratio, the Board considered the fund's management fee as well as other fund or class expenses, as applicable, such as transfer agent fees, pricing and bookkeeping fees, fund-paid 12b-1 fees, and custodial, legal, and audit fees. The Board also noted the effects of any waivers and reimbursements on fees and expenses. As part of its review, the Board also considered the current and historical total expense ratios of each class of the fund compared to competitive fund median expenses. Each class of the fund is compared to those funds and classes in the Total Mapped Group (used by the Board for management fee comparisons) that have a similar sales load structure.
Semiannual Report
The Board noted that the total expense ratio of each of Class A, Class B, Class C, Institutional Class, and the retail class ranked below its competitive median for 2011 and the total expense ratio of Class T ranked above its competitive median for 2011. The Board considered that various factors, including 12b-1 fees, positive or negative performance adjustments, and relatively higher other expenses in the case of small fund size, can affect total expense ratios. The Board noted that the total expense ratio of Class T was above the competitive median primarily because of higher 12b-1 fees on Class T. Class T has a higher 12b-1 fee, but a lower front-end sales charge, than traditionally priced front-end sales charge classes. The Board considered that Class T is primarily sold load-waived in the retirement plan market where its 0.50% 12b-1 fee is comparable to competing no-load, higher 12b-1 fee classes designed specifically for retirement plans. The Board noted that the fund offers multiple classes, each of which has a different sales load and 12b-1 fee structure, and that the multiple structures are intended to offer a range of pricing options for the intermediary market. The Board also noted that the total expense ratios of the classes vary primarily by the level of their 12b-1 fees, although differences in transfer agent fees may also cause expenses to vary from class to class.
Fees Charged to Other Fidelity Clients. The Board also considered Fidelity fee structures and other information with respect to clients of FMR and its affiliates, such as other mutual funds advised or subadvised by FMR or its affiliates, pension plan clients, and other institutional clients. The Board noted the findings of the 2010 ad hoc joint committee (created with the board of other Fidelity funds), which reviewed and compared Fidelity's institutional investment advisory business with its business of providing services to the Fidelity funds, including the differences in services provided, fees charged, and costs incurred, as well as competition in their respective marketplaces.
Based on its review of total expense ratios and fees charged to other Fidelity clients, the Board concluded that the total expense ratio of each class of the fund was reasonable, although Class T was above the median of the universe presented for comparison, in light of the services that the fund and its shareholders receive and the other factors considered.
Costs of the Services and Profitability. The Board considered the revenues earned and the expenses incurred by Fidelity in conducting the business of developing, marketing, distributing, managing, administering and servicing the fund and its shareholders. The Board also considered the level of Fidelity's profits in respect of all the Fidelity funds.
Semiannual Report
Board Approval of Investment Advisory Contracts and
Management Fees - continued
On an annual basis, FMR presents to the Board Fidelity's profitability for the fund. Fidelity calculates the profitability for each fund, as well as aggregate profitability for groups of Fidelity funds and all Fidelity funds, using a series of detailed revenue and cost allocation methodologies which originate with the books and records of Fidelity on which Fidelity's audited financial statements are based. The Audit Committee of the Board reviews any significant changes from the prior year's methodologies.
PricewaterhouseCoopers LLP (PwC), independent registered public accounting firm and auditor to Fidelity and certain Fidelity funds, has been engaged annually by the Board as part of the Board's assessment of Fidelity's profitability analysis. PwC's engagement includes the review and assessment of Fidelity's methodologies used in determining the revenues and expenses attributable to Fidelity's mutual fund business, and completion of agreed-upon procedures surrounding the mathematical accuracy of fund profitability and its conformity to allocation methodologies. After considering PwC's reports issued under the engagement and information provided by Fidelity, the Board concluded that while other allocation methods may also be reasonable, Fidelity's profitability methodologies are reasonable in all material respects.
The Board also reviewed Fidelity's non-fund businesses and fall-out benefits related to the mutual fund business as well as cases where Fidelity's affiliates may benefit from or be related to the fund's business.
The Board considered the costs of the services provided by and the profits realized by Fidelity in connection with the operation of the fund and was satisfied that the profitability was not excessive in the circumstances.
Economies of Scale. The Board considered whether there have been economies of scale in respect of the management of the Fidelity funds, whether the Fidelity funds (including the fund) have appropriately benefited from any such economies of scale, and whether there is potential for realization of any further economies of scale. The Board considered the extent to which the fund will benefit from economies of scale through increased services to the fund, through waivers or reimbursements, or through fee or expense reductions. The Board also noted that in 2009, it and the board of other Fidelity funds created an ad hoc committee (the Economies of Scale Committee) to analyze whether FMR attains economies of scale in respect of the management and servicing of the Fidelity funds, whether the Fidelity funds have appropriately benefited from such economies of scale, and whether there is potential for realization of any further economies of scale.
The Board recognized that the fund's management contract incorporates a "group fee" structure, which provides for lower group fee rates as total fund assets under FMR's management increase, and for higher group fee rates as total fund assets under FMR's management decrease. FMR calculates the group fee rates based on a tiered asset "breakpoint" schedule that varies based on asset class. The Board considered that the group fee is designed to deliver the benefits of economies of scale to fund shareholders when total Fidelity fund assets increase, even if assets of any particular fund are unchanged or have declined, because some portion of Fidelity's costs are attributable to services provided to all Fidelity funds, and all funds benefit if those costs can be allocated among more assets. The Board concluded that, given the group fee structure, fund shareholders will benefit from lower management fees as assets under FMR's management increase at the fund complex level, regardless of whether Fidelity achieves any such economies of scale.
Semiannual Report
The Board concluded, taking into account the analysis of the Economies of Scale Committee, that economies of scale, if any, are being appropriately shared between fund shareholders and Fidelity.
Additional Information Requested by the Board. In order to develop fully the factual basis for consideration of the Fidelity funds' Advisory Contracts, the Board requested and received additional information on certain topics, including (i) fund performance trends, actions to be taken by FMR to improve certain funds' overall performance, and Fidelity's long-term strategies for certain funds; (ii) the potential to further rationalize the Fidelity fund lineup with the possibility of achieving savings for the funds and Fidelity; (iii) Fidelity's compensation structure for portfolio managers and other key investment personnel; (iv) the amount of the investment that each portfolio manager has made in the Fidelity fund(s) that he or she manages; (v) the realization of fall-out benefits in certain Fidelity business units; (vi) Fidelity's group fee structures, the potential impact of regulatory changes on such structures, and the rationale for the individual fee rates of certain funds; (vii) fund profitability methodology, including Fidelity's cost allocation methodology, and the impact of certain factors on fund profitability results; (viii) trends regarding industry use of performance fee structures and the possibility of implementing performance fee structures for additional funds; and (ix) the impact of net redemptions from the Fidelity funds.
Based on its evaluation of all of the conclusions noted above, and after considering all factors it believed relevant, the Board ultimately concluded that the advisory fee structures are fair and reasonable, and that the fund's Advisory Contracts should be renewed.
Semiannual Report
Investment Adviser
Fidelity Management & Research Company
Boston, MA
Investment Sub-Advisers
FMR Co., Inc.
Fidelity Management & Research
(U.K.) Inc.
Fidelity Management & Research
(Japan) Inc.
Fidelity Management & Research
(Hong Kong) Limited
General Distributor
Fidelity Distributors Corporation
Smithfield, RI
Transfer and Service Agents
Fidelity Investments Institutional Operations Company, Inc.
Boston, MA
Fidelity Service Company, Inc.
Boston, MA
Custodian
JPMorgan Chase Bank
New York, NY
(Fidelity Investment logo)(registered trademark)
AGIII-USAN-0213
1.855222.105
Fidelity®
Mega Cap Stock
Fund
Semiannual Report
December 31, 2012
(Fidelity Cover Art)
Contents
Shareholder Expense Example | An example of shareholder expenses. | |
Investment Changes | A summary of major shifts in the fund's investments over the past six months. | |
Investments | A complete list of the fund's investments with their market values. | |
Financial Statements | Statements of assets and liabilities, operations, and changes in net assets, as well as financial highlights. | |
Notes | Notes to the financial statements. | |
Board Approval of Investment Advisory Contracts and Management Fees |
|
To view a fund's proxy voting guidelines and proxy voting record for the 12-month period ended June 30, visit http://www.fidelity.com/proxyvotingresults or visit the Securities and Exchange Commission's (SEC) web site at http://www.sec.gov. You may also call 1-800-544-8544 to request a free copy of the proxy voting guidelines.
Standard & Poor's, S&P and S&P 500 are registered service marks of The McGraw-Hill Companies, Inc. and have been licensed for use by Fidelity Distributors Corporation.
Other third party marks appearing herein are the property of their respective owners.
All other marks appearing herein are registered or unregistered trademarks or service marks of FMR LLC or an affiliated company. © 2013 FMR LLC. All rights reserved.
This report and the financial statements contained herein are submitted for the general information of the shareholders of the fund. This report is not authorized for distribution to prospective investors in the fund unless preceded or accompanied by an effective prospectus.
A fund files its complete schedule of portfolio holdings with the SEC for the first and third quarters of each fiscal year on Form N-Q. Forms N-Q are available on the SEC's web site at http://www.sec.gov. A fund's Forms N-Q may be reviewed and copied at the SEC's Public Reference Room in Washington, DC. Information regarding the operation of the SEC's Public Reference Room may be obtained by calling 1-800-SEC-0330. For a complete list of a fund's portfolio holdings, view the most recent holdings listing, semiannual report, or annual report on Fidelity's web site at http://www.fidelity.com, http://www.advisor.fidelity.com, or http://www.401k.com, as applicable.
NOT FDIC INSURED • MAY LOSE VALUE • NO BANK GUARANTEE
Neither the fund nor Fidelity Distributors Corporation is a bank.
Semiannual Report
Shareholder Expense Example
As a shareholder of the Fund, you incur two types of costs: (1) transaction costs, including sales charges (loads) on purchase payments or redemption proceeds, and (2) ongoing costs, including management fees, distribution and/or service (12b-1) fees and other Fund expenses. This Example is intended to help you understand your ongoing costs (in dollars) of investing in the Fund and to compare these costs with the ongoing costs of investing in other mutual funds.
The Example is based on an investment of $1,000 invested at the beginning of the period and held for the entire period (July 1, 2012 to December 31, 2012).
Actual Expenses
The first line of the accompanying table for each class of the Fund provides information about actual account values and actual expenses. You may use the information in this line, together with the amount you invested, to estimate the expenses that you paid over the period. Simply divide your account value by $1,000.00 (for example, an $8,600 account value divided by $1,000.00 = 8.6), then multiply the result by the number in the first line for a class of the Fund under the heading entitled "Expenses Paid During Period" to estimate the expenses you paid on your account during this period. A small balance maintenance fee of $12.00 that is charged once a year may apply for certain accounts with a value of less than $2,000. This fee is not included in the table below. If it was, the estimate of expenses you paid during the period would be higher, and your ending account value lower, by this amount. In addition, the Fund, as a shareholder in the underlying Fidelity Central Funds, will indirectly bear its pro-rata share of the fees and expenses incurred by the underlying Fidelity Central Funds. These fees and expenses are not included in the Fund's annualized expense ratio used to calculate the expense estimate in the table below.
Hypothetical Example for Comparison Purposes
The second line of the accompanying table for each class of the Fund provides information about hypothetical account values and hypothetical expenses based on a Class' actual expense ratio and an assumed rate of return of 5% per year before expenses, which is not the Class' actual return. The hypothetical account values and expenses may not be used to estimate the actual ending account balance or expenses you paid for the period. You may use this information to compare the ongoing costs of investing in the Fund and other funds. To do so, compare this 5% hypothetical example with the 5% hypothetical examples that appear in the shareholder reports of the other funds. A small balance maintenance fee of $12.00 that is charged once a year may apply for certain accounts with a value of less than $2,000. This fee is not included in the table below. If it was, the estimate of expenses you paid during the period would be higher, and your ending account value lower, by this amount. In addition, the Fund, as a shareholder in the underlying Fidelity Central Funds, will indirectly bear its pro-rata share of the fees and expenses incurred by the underlying Fidelity Central Funds. These fees and expenses are not included in the Fund's annualized expense ratio used to calculate the expense estimate in the table below.
Please note that the expenses shown in the table are meant to highlight your ongoing costs only and do not reflect any transaction costs. Therefore, the second line of the table is useful in comparing ongoing costs only, and will not help you determine the relative total costs of owning different funds. In addition, if these transactional costs were included, your costs would have been higher.
Semiannual Report
Shareholder Expense Example - continued
| Annualized | Beginning | Ending | Expenses Paid |
Class A | 1.00% |
|
|
|
Actual |
| $ 1,000.00 | $ 1,083.90 | $ 5.25 |
HypotheticalA |
| $ 1,000.00 | $ 1,020.16 | $ 5.09 |
Class T | 1.28% |
|
|
|
Actual |
| $ 1,000.00 | $ 1,081.80 | $ 6.72 |
HypotheticalA |
| $ 1,000.00 | $ 1,018.75 | $ 6.51 |
Class B | 1.80% |
|
|
|
Actual |
| $ 1,000.00 | $ 1,080.10 | $ 9.44 |
HypotheticalA |
| $ 1,000.00 | $ 1,016.13 | $ 9.15 |
Class C | 1.77% |
|
|
|
Actual |
| $ 1,000.00 | $ 1,079.50 | $ 9.28 |
HypotheticalA |
| $ 1,000.00 | $ 1,016.28 | $ 9.00 |
Mega Cap Stock | .71% |
|
|
|
Actual |
| $ 1,000.00 | $ 1,085.60 | $ 3.73 |
HypotheticalA |
| $ 1,000.00 | $ 1,021.63 | $ 3.62 |
Institutional Class | .75% |
|
|
|
Actual |
| $ 1,000.00 | $ 1,085.80 | $ 3.94 |
HypotheticalA |
| $ 1,000.00 | $ 1,021.42 | $ 3.82 |
A 5% return per year before expenses
* Expenses are equal to each Class' annualized expense ratio, multiplied by the average account value over the period, multiplied by 184/365 (to reflect the one-half year period).
Semiannual Report
Investment Changes (Unaudited)
Top Ten Stocks as of December 31, 2012 | ||
| % of fund's | % of fund's net assets |
Apple, Inc. | 5.0 | 6.1 |
JPMorgan Chase & Co. | 4.2 | 3.9 |
Wells Fargo & Co. | 3.5 | 4.2 |
General Electric Co. | 3.1 | 3.0 |
Chevron Corp. | 2.7 | 3.1 |
Google, Inc. Class A | 2.5 | 2.3 |
Exxon Mobil Corp. | 2.4 | 3.3 |
Microsoft Corp. | 2.4 | 2.7 |
Citigroup, Inc. | 2.2 | 1.5 |
Procter & Gamble Co. | 2.2 | 2.4 |
| 30.2 | |
Top Five Market Sectors as of December 31, 2012 | ||
| % of fund's | % of fund's net assets |
Information Technology | 19.4 | 20.9 |
Financials | 18.4 | 15.5 |
Health Care | 12.8 | 13.0 |
Energy | 12.6 | 14.0 |
Consumer Discretionary | 11.9 | 12.6 |
Asset Allocation (% of fund's net assets) | |||||||
As of December 31, 2012* | As of June 30, 2012** | ||||||
 | Stocks 98.9% |
| | Stocks 99.5% |
| ||
 | Convertible |
| | Convertible |
| ||
 | Short-Term |
| | Short-Term |
| ||
* Foreign investments | 8.0% |
| ** Foreign investments | 9.7% |
| ||

Semiannual Report
Investments December 31, 2012 (Unaudited)
Showing Percentage of Net Assets
Common Stocks - 98.8% | |||
Shares | Value | ||
CONSUMER DISCRETIONARY - 11.8% | |||
Auto Components - 0.5% | |||
Johnson Controls, Inc. | 340,800 | $ 10,462,560 | |
Automobiles - 0.5% | |||
Ford Motor Co. | 880,000 | 11,396,000 | |
Hotels, Restaurants & Leisure - 0.9% | |||
McDonald's Corp. | 164,500 | 14,510,545 | |
Yum! Brands, Inc. | 69,700 | 4,628,080 | |
| 19,138,625 | ||
Internet & Catalog Retail - 0.2% | |||
Priceline.com, Inc. (a) | 5,100 | 3,168,120 | |
Media - 5.8% | |||
Comcast Corp. Class A (special) (non-vtg.) | 1,269,800 | 45,649,310 | |
News Corp. Class A | 280,200 | 7,156,308 | |
The Walt Disney Co. | 272,100 | 13,547,859 | |
Thomson Reuters Corp. | 127,500 | 3,689,002 | |
Time Warner Cable, Inc. | 61,600 | 5,986,904 | |
Time Warner, Inc. | 733,400 | 35,078,522 | |
Viacom, Inc. Class B (non-vtg.) | 220,300 | 11,618,622 | |
| 122,726,527 | ||
Multiline Retail - 1.6% | |||
Target Corp. | 566,300 | 33,507,971 | |
Specialty Retail - 2.3% | |||
Home Depot, Inc. | 156,700 | 9,691,895 | |
Lowe's Companies, Inc. | 1,090,900 | 38,748,768 | |
| 48,440,663 | ||
TOTAL CONSUMER DISCRETIONARY | 248,840,466 | ||
CONSUMER STAPLES - 10.3% | |||
Beverages - 2.6% | |||
PepsiCo, Inc. | 343,000 | 23,471,490 | |
The Coca-Cola Co. | 882,800 | 32,001,500 | |
| 55,472,990 | ||
Food & Staples Retailing - 2.1% | |||
CVS Caremark Corp. | 301,400 | 14,572,690 | |
Walgreen Co. | 807,400 | 29,881,874 | |
| 44,454,564 | ||
Common Stocks - continued | |||
Shares | Value | ||
CONSUMER STAPLES - continued | |||
Food Products - 1.1% | |||
Danone SA | 111,900 | $ 7,395,384 | |
Kellogg Co. | 294,200 | 16,431,070 | |
| 23,826,454 | ||
Household Products - 3.3% | |||
Colgate-Palmolive Co. | 10,900 | 1,139,486 | |
Kimberly-Clark Corp. | 253,000 | 21,360,790 | |
Procter & Gamble Co. | 693,200 | 47,061,348 | |
| 69,561,624 | ||
Personal Products - 0.1% | |||
L'Oreal SA | 15,100 | 2,101,051 | |
Tobacco - 1.1% | |||
British American Tobacco PLC sponsored ADR | 165,000 | 16,706,250 | |
Philip Morris International, Inc. | 68,530 | 5,731,849 | |
| 22,438,099 | ||
TOTAL CONSUMER STAPLES | 217,854,782 | ||
ENERGY - 12.6% | |||
Energy Equipment & Services - 2.1% | |||
Halliburton Co. | 574,500 | 19,929,405 | |
National Oilwell Varco, Inc. | 106,600 | 7,286,110 | |
Schlumberger Ltd. | 241,900 | 16,761,251 | |
| 43,976,766 | ||
Oil, Gas & Consumable Fuels - 10.5% | |||
Apache Corp. | 174,905 | 13,730,043 | |
BG Group PLC | 156,500 | 2,610,390 | |
BP PLC sponsored ADR | 239,600 | 9,976,944 | |
Canadian Natural Resources Ltd. | 363,100 | 10,454,593 | |
Chevron Corp. | 525,100 | 56,784,314 | |
Exxon Mobil Corp. | 584,571 | 50,594,620 | |
Occidental Petroleum Corp. | 327,500 | 25,089,775 | |
Royal Dutch Shell PLC Class A sponsored ADR | 333,206 | 22,974,554 | |
Suncor Energy, Inc. | 640,900 | 21,075,539 | |
The Williams Companies, Inc. | 277,400 | 9,082,076 | |
| 222,372,848 | ||
TOTAL ENERGY | 266,349,614 | ||
Common Stocks - continued | |||
Shares | Value | ||
FINANCIALS - 18.4% | |||
Capital Markets - 3.1% | |||
BlackRock, Inc. Class A | 46,800 | $ 9,674,028 | |
Charles Schwab Corp. | 1,395,200 | 20,035,072 | |
Morgan Stanley | 1,492,400 | 28,534,688 | |
State Street Corp. | 36,100 | 1,697,061 | |
UBS AG | 253,700 | 3,970,121 | |
| 63,910,970 | ||
Commercial Banks - 5.2% | |||
PNC Financial Services Group, Inc. | 172,400 | 10,052,644 | |
Standard Chartered PLC (United Kingdom) | 257,607 | 6,666,804 | |
U.S. Bancorp | 601,100 | 19,199,134 | |
Wells Fargo & Co. | 2,164,030 | 73,966,545 | |
| 109,885,127 | ||
Diversified Financial Services - 8.2% | |||
Bank of America Corp. | 2,663,000 | 30,890,800 | |
Citigroup, Inc. | 1,193,870 | 47,229,497 | |
CME Group, Inc. | 117,500 | 5,958,425 | |
JPMorgan Chase & Co. | 2,025,300 | 89,052,441 | |
| 173,131,163 | ||
Insurance - 1.9% | |||
AFLAC, Inc. | 108,500 | 5,763,520 | |
American International Group, Inc. (a) | 158,300 | 5,587,990 | |
MetLife, Inc. | 712,300 | 23,463,162 | |
Prudential Financial, Inc. | 105,900 | 5,647,647 | |
| 40,462,319 | ||
TOTAL FINANCIALS | 387,389,579 | ||
HEALTH CARE - 12.8% | |||
Biotechnology - 0.9% | |||
Amgen, Inc. | 212,890 | 18,376,665 | |
Health Care Equipment & Supplies - 0.7% | |||
Baxter International, Inc. | 121,700 | 8,112,522 | |
Stryker Corp. | 112,200 | 6,150,804 | |
| 14,263,326 | ||
Health Care Providers & Services - 3.5% | |||
Aetna, Inc. | 309,500 | 14,329,850 | |
Cardinal Health, Inc. | 99,500 | 4,097,410 | |
McKesson Corp. | 269,900 | 26,169,504 | |
Common Stocks - continued | |||
Shares | Value | ||
HEALTH CARE - continued | |||
Health Care Providers & Services - continued | |||
UnitedHealth Group, Inc. | 149,900 | $ 8,130,576 | |
WellPoint, Inc. | 351,600 | 21,419,472 | |
| 74,146,812 | ||
Life Sciences Tools & Services - 0.4% | |||
Thermo Fisher Scientific, Inc. | 123,300 | 7,864,074 | |
Pharmaceuticals - 7.3% | |||
Abbott Laboratories | 280,200 | 18,353,100 | |
Eli Lilly & Co. | 300,900 | 14,840,388 | |
GlaxoSmithKline PLC sponsored ADR | 225,200 | 9,789,444 | |
Johnson & Johnson | 576,800 | 40,433,680 | |
Merck & Co., Inc. | 1,100,700 | 45,062,658 | |
Pfizer, Inc. | 881,300 | 22,103,004 | |
Sanofi SA | 34,424 | 3,264,423 | |
| 153,846,697 | ||
TOTAL HEALTH CARE | 268,497,574 | ||
INDUSTRIALS - 9.1% | |||
Aerospace & Defense - 2.6% | |||
Honeywell International, Inc. | 140,200 | 8,898,494 | |
Precision Castparts Corp. | 11,300 | 2,140,446 | |
Raytheon Co. | 179,000 | 10,303,240 | |
The Boeing Co. | 225,400 | 16,986,144 | |
United Technologies Corp. | 205,400 | 16,844,854 | |
| 55,173,178 | ||
Air Freight & Logistics - 1.4% | |||
United Parcel Service, Inc. Class B | 403,400 | 29,742,682 | |
Electrical Equipment - 0.3% | |||
Emerson Electric Co. | 136,200 | 7,213,152 | |
Industrial Conglomerates - 3.6% | |||
Danaher Corp. | 164,100 | 9,173,190 | |
General Electric Co. | 3,145,500 | 66,024,045 | |
| 75,197,235 | ||
Machinery - 0.6% | |||
Cummins, Inc. | 33,700 | 3,651,395 | |
Illinois Tool Works, Inc. | 139,100 | 8,458,671 | |
| 12,110,066 | ||
Common Stocks - continued | |||
Shares | Value | ||
INDUSTRIALS - continued | |||
Road & Rail - 0.6% | |||
Norfolk Southern Corp. | 54,400 | $ 3,364,096 | |
Union Pacific Corp. | 71,100 | 8,938,692 | |
| 12,302,788 | ||
TOTAL INDUSTRIALS | 191,739,101 | ||
INFORMATION TECHNOLOGY - 19.4% | |||
Communications Equipment - 2.5% | |||
Cisco Systems, Inc. | 1,782,500 | 35,026,125 | |
QUALCOMM, Inc. | 303,900 | 18,847,878 | |
| 53,874,003 | ||
Computers & Peripherals - 5.7% | |||
Apple, Inc. | 198,201 | 105,647,079 | |
Dell, Inc. | 447,300 | 4,531,149 | |
EMC Corp. (a) | 372,300 | 9,419,190 | |
| 119,597,418 | ||
Internet Software & Services - 2.5% | |||
Google, Inc. Class A (a) | 74,750 | 53,025,408 | |
IT Services - 4.2% | |||
Accenture PLC Class A | 40,500 | 2,693,250 | |
Automatic Data Processing, Inc. | 25,900 | 1,476,559 | |
Cognizant Technology Solutions Corp. Class A (a) | 242,300 | 17,942,315 | |
IBM Corp. | 89,800 | 17,201,190 | |
MasterCard, Inc. Class A | 54,900 | 26,971,272 | |
Visa, Inc. Class A | 140,800 | 21,342,464 | |
| 87,627,050 | ||
Semiconductors & Semiconductor Equipment - 0.4% | |||
Broadcom Corp. Class A | 161,200 | 5,353,452 | |
Samsung Electronics Co. Ltd. | 1,931 | 2,792,551 | |
| 8,146,003 | ||
Software - 4.1% | |||
Adobe Systems, Inc. (a) | 140,900 | 5,309,112 | |
Microsoft Corp. | 1,875,600 | 50,134,788 | |
Oracle Corp. | 563,200 | 18,765,824 | |
Common Stocks - continued | |||
Shares | Value | ||
INFORMATION TECHNOLOGY - continued | |||
Software - continued | |||
salesforce.com, Inc. (a) | 32,800 | $ 5,513,680 | |
VMware, Inc. Class A (a) | 65,700 | 6,184,998 | |
| 85,908,402 | ||
TOTAL INFORMATION TECHNOLOGY | 408,178,284 | ||
MATERIALS - 1.8% | |||
Chemicals - 1.8% | |||
Air Products & Chemicals, Inc. | 100,000 | 8,402,000 | |
E.I. du Pont de Nemours & Co. | 222,900 | 10,023,813 | |
Monsanto Co. | 28,100 | 2,659,665 | |
Syngenta AG (Switzerland) | 25,700 | 10,382,449 | |
The Dow Chemical Co. | 190,600 | 6,160,192 | |
| 37,628,119 | ||
TELECOMMUNICATION SERVICES - 1.4% | |||
Diversified Telecommunication Services - 0.8% | |||
Verizon Communications, Inc. | 407,300 | 17,623,871 | |
Wireless Telecommunication Services - 0.6% | |||
Vodafone Group PLC sponsored ADR | 493,600 | 12,433,784 | |
TOTAL TELECOMMUNICATION SERVICES | 30,057,655 | ||
UTILITIES - 1.2% | |||
Electric Utilities - 1.1% | |||
Duke Energy Corp. | 70,099 | 4,472,316 | |
FirstEnergy Corp. | 316,800 | 13,229,568 | |
NextEra Energy, Inc. | 77,300 | 5,348,387 | |
| 23,050,271 | ||
Multi-Utilities - 0.1% | |||
PG&E Corp. | 72,500 | 2,913,050 | |
TOTAL UTILITIES | 25,963,321 | ||
TOTAL COMMON STOCKS (Cost $1,895,210,670) |
| ||
Preferred Stocks - 0.2% | |||
Shares | Value | ||
Convertible Preferred Stocks - 0.1% | |||
INDUSTRIALS - 0.1% | |||
Aerospace & Defense - 0.1% | |||
United Technologies Corp. 7.50% | 32,400 | $ 1,805,004 | |
Nonconvertible Preferred Stocks - 0.1% | |||
CONSUMER DISCRETIONARY - 0.1% | |||
Automobiles - 0.1% | |||
Volkswagen AG | 14,500 | 3,327,010 | |
TOTAL PREFERRED STOCKS (Cost $4,353,318) |
| ||
Money Market Funds - 1.1% | |||
|
|
|
|
Fidelity Cash Central Fund, 0.18% (b) | 23,617,422 |
| |
TOTAL INVESTMENT PORTFOLIO - 100.1% (Cost $1,923,181,410) | 2,111,247,931 | ||
NET OTHER ASSETS (LIABILITIES) - (0.1)% | (2,800,194) | ||
NET ASSETS - 100% | $ 2,108,447,737 | ||
Legend |
(a) Non-income producing |
(b) Affiliated fund that is available only to investment companies and other accounts managed by Fidelity Investments. The rate quoted is the annualized seven-day yield of the fund at period end. A complete unaudited listing of the fund's holdings as of its most recent quarter end is available upon request. In addition, each Fidelity Central Fund's financial statements are available on the SEC's website or upon request. |
Affiliated Central Funds |
Information regarding fiscal year to date income earned by the Fund from investments in Fidelity Central Funds is as follows: |
Fund | Income earned |
Fidelity Cash Central Fund | $ 25,141 |
Fidelity Securities Lending Cash Central Fund | 10,371 |
Total | $ 35,512 |
Other Information |
The following is a summary of the inputs used, as of December 31, 2012, involving the Fund's assets and liabilities carried at fair value. The inputs or methodology used for valuing securities may not be an indication of the risk associated with investing in those securities. For more information on valuation inputs, and their aggregation into the levels used in the table below, please refer to the Investment Valuation section in the accompanying Notes to Financial Statements. |
Valuation Inputs at Reporting Date: | ||||
Description | Total | Level 1 | Level 2 | Level 3 |
Investments in Securities: | ||||
Equities: | ||||
Consumer Discretionary | $ 252,167,476 | $ 248,840,466 | $ 3,327,010 | $ - |
Consumer Staples | 217,854,782 | 208,358,347 | 9,496,435 | - |
Energy | 266,349,614 | 263,739,224 | 2,610,390 | - |
Financials | 387,389,579 | 376,752,654 | 10,636,925 | - |
Health Care | 268,497,574 | 265,233,151 | 3,264,423 | - |
Industrials | 193,544,105 | 193,544,105 | - | - |
Information Technology | 408,178,284 | 405,385,733 | 2,792,551 | - |
Materials | 37,628,119 | 27,245,670 | 10,382,449 | - |
Telecommunication Services | 30,057,655 | 30,057,655 | - | - |
Utilities | 25,963,321 | 25,963,321 | - | - |
Money Market Funds | 23,617,422 | 23,617,422 | - | - |
Total Investments in Securities: | $ 2,111,247,931 | $ 2,068,737,748 | $ 42,510,183 | $ - |
See accompanying notes which are an integral part of the financial statements.
Semiannual Report
Financial Statements
Statement of Assets and Liabilities
| December 31, 2012 (Unaudited) | |
|
|
|
Assets | ||
Investment in securities, at value - See accompanying schedule: Unaffiliated issuers (cost $1,899,563,988) | $ 2,087,630,509 |
|
Fidelity Central Funds (cost $23,617,422) | 23,617,422 |
|
Total Investments (cost $1,923,181,410) |
| $ 2,111,247,931 |
Foreign currency held at value (cost $1,033) | 1,040 | |
Receivable for investments sold | 11,827,281 | |
Receivable for fund shares sold | 6,531,288 | |
Dividends receivable | 2,785,543 | |
Distributions receivable from Fidelity Central Funds | 7,158 | |
Prepaid expenses | 6,184 | |
Other receivables | 52,213 | |
Total assets | 2,132,458,638 | |
|
|
|
Liabilities | ||
Payable for investments purchased | $ 12,657,134 | |
Payable for fund shares redeemed | 10,097,825 | |
Accrued management fee | 792,160 | |
Distribution and service plan fees payable | 8,565 | |
Other affiliated payables | 412,519 | |
Other payables and accrued expenses | 42,698 | |
Total liabilities | 24,010,901 | |
|
|
|
Net Assets | $ 2,108,447,737 | |
Net Assets consist of: |
| |
Paid in capital | $ 2,012,526,102 | |
Distributions in excess of net investment income | (413,817) | |
Accumulated undistributed net realized gain (loss) on investments and foreign currency transactions | (91,729,788) | |
Net unrealized appreciation (depreciation) on investments and assets and liabilities in foreign currencies | 188,065,240 | |
Net Assets | $ 2,108,447,737 | |
See accompanying notes which are an integral part of the financial statements.
Semiannual Report
Financial Statements - continued
Statement of Assets and Liabilities - continued
| December 31, 2012 (Unaudited) | |
|
|
|
Calculation of Maximum Offering Price Class A: | $ 11.83 | |
|
|
|
Maximum offering price per share (100/94.25 of $11.83) | $ 12.55 | |
Class T: | $ 11.84 | |
|
|
|
Maximum offering price per share (100/96.50 of $11.84) | $ 12.27 | |
Class B: | $ 11.81 | |
|
|
|
Class C: | $ 11.76 | |
|
|
|
|
|
|
Mega Cap Stock: | $ 11.89 | |
|
|
|
Institutional Class: | $ 11.86 | |
A Redemption price per share is equal to net asset value less any applicable contingent deferred sales charge.
See accompanying notes which are an integral part of the financial statements.
Semiannual Report
Statement of Operations
Six months ended December 31, 2012 (Unaudited) | ||
|
|
|
Investment Income |
|
|
Dividends |
| $ 23,024,455 |
Income from Fidelity Central Funds |
| 35,512 |
Total income |
| 23,059,967 |
|
|
|
Expenses | ||
Management fee | $ 4,398,759 | |
Transfer agent fees | 2,048,390 | |
Distribution and service plan fees | 43,985 | |
Accounting and security lending fees | 293,454 | |
Custodian fees and expenses | 32,299 | |
Independent trustees' compensation | 6,128 | |
Registration fees | 65,517 | |
Audit | 28,150 | |
Legal | 6,640 | |
Miscellaneous | 5,232 | |
Total expenses before reductions | 6,928,554 | |
Expense reductions | (45,420) | 6,883,134 |
Net investment income (loss) | 16,176,833 | |
Realized and Unrealized Gain (Loss) Net realized gain (loss) on: | ||
Investment securities: |
|
|
Unaffiliated issuers | 28,828,865 | |
Foreign currency transactions | (27,841) | |
Total net realized gain (loss) |
| 28,801,024 |
Change in net unrealized appreciation (depreciation) on: Investment securities | 106,962,766 | |
Assets and liabilities in foreign currencies | 2,670 | |
Total change in net unrealized appreciation (depreciation) |
| 106,965,436 |
Net gain (loss) | 135,766,460 | |
Net increase (decrease) in net assets resulting from operations | $ 151,943,293 | |
See accompanying notes which are an integral part of the financial statements.
Semiannual Report
Financial Statements - continued
Statement of Changes in Net Assets
| Six months ended December 31, 2012 (Unaudited) | Year ended |
Increase (Decrease) in Net Assets |
|
|
Operations |
|
|
Net investment income (loss) | $ 16,176,833 | $ 17,903,977 |
Net realized gain (loss) | 28,801,024 | 43,198,122 |
Change in net unrealized appreciation(depreciation) | 106,965,436 | 29,098,949 |
Net increase (decrease) in net assets resulting | 151,943,293 | 90,201,048 |
Distributions to shareholders from net investmentincome | (27,575,493) | (11,753,098) |
Share transactions - net increase (decrease) | 506,733,530 | 468,368,181 |
Total increase (decrease) in net assets | 631,101,330 | 546,816,131 |
|
|
|
Net Assets | ||
Beginning of period | 1,477,346,407 | 930,530,276 |
End of period (including distributions in excess of net investment income of $413,817 and undistributed net investment income of $10,984,843, respectively) | $ 2,108,447,737 | $ 1,477,346,407 |
See accompanying notes which are an integral part of the financial statements.
Semiannual Report
Financial Highlights - Class A
| Six months ended | Years ended June 30, | ||||
| (Unaudited) | 2012 | 2011 | 2010 | 2009 | 2008 H |
Selected Per-Share Data |
|
|
|
|
| |
Net asset value, beginning of period | $ 11.05 | $ 10.37 | $ 8.07 | $ 7.20 | $ 9.89 | $ 10.61 |
Income from Investment Operations |
|
|
|
|
|
|
Net investment income (loss) E | .08 | .13 | .07 | .06 | .10 | .05 |
Net realized and unrealized gain (loss) | .84 | .64 | 2.28 | .92 | (2.65) | (.77) |
Total from investment operations | .92 | .77 | 2.35 | .98 | (2.55) | (.72) |
Distributions from net investment income | (.14) | (.09) | (.05) | (.11) | (.12) | - |
Distributions from net realized gain | - | - | - | - | (.02) | - |
Total distributions | (.14) | (.09) | (.05) | (.11) | (.14) | - |
Net asset value, end of period | $ 11.83 | $ 11.05 | $ 10.37 | $ 8.07 | $ 7.20 | $ 9.89 |
Total Return B, C, D | 8.39% | 7.57% | 29.23% | 13.65% | (25.98)% | (6.79)% |
Ratios to Average Net Assets F, I |
|
|
|
|
| |
Expenses before reductions | 1.00% A | 1.02% | 1.06% | 1.10% | 1.13% | 1.02% A |
Expenses net of fee waivers, if any | 1.00% A | 1.02% | 1.06% | 1.10% | 1.13% | 1.02% A |
Expenses net of all reductions | .99% A | 1.02% | 1.06% | 1.10% | 1.13% | 1.01% A |
Net investment income (loss) | 1.41% A | 1.28% | .76% | .66% | 1.44% | 1.24% A |
Supplemental Data |
|
|
|
|
|
|
Net assets, end of period (000 omitted) | $ 13,400 | $ 8,527 | $ 4,169 | $ 2,238 | $ 806 | $ 106 |
Portfolio turnover rate G | 26% A | 57% | 53% | 97% | 138% | 97% |
A Annualized
B Total returns for periods of less than one year are not annualized.
C Total returns would have been lower if certain expenses had not been reduced during the applicable periods shown.
D Total returns do not include the effect of the sales charges.
E Calculated based on average shares outstanding during the period.
F Fees and expenses of any underlying Fidelity Central Funds are not included in the Fund's expense ratio. The Fund indirectly bears its proportionate share of the expenses of any underlying Fidelity Central Funds.
G Amount does not include the portfolio activity of any underlying Fidelity Central Funds.
H For the period February 5, 2008 (commencement of sale of shares) to June 30, 2008.
I Expense ratios reflect operating expenses of the class. Expenses before reductions do not reflect amounts reimbursed by the investment adviser or reductions from brokerage service arrangements or reductions from other expense offset arrangements and do not represent the amount paid by the class during periods when reimbursements or reductions occur. Expense ratios before reductions for start--up periods may not be representative of longer-term operating periods. Expenses net of fee waivers reflect expenses after reimbursement by the investment adviser but prior to reductions from brokerage service arrangements or other expense offset arrangements. Expenses net of all reductions represent the net expenses paid by the class.
See accompanying notes which are an integral part of the financial statements.
Semiannual Report
Financial Highlights - Class T
| Six months ended | Years ended June 30, | ||||
| (Unaudited) | 2012 | 2011 | 2010 | 2009 | 2008 H |
Selected Per-Share Data |
|
|
|
|
| |
Net asset value, beginning of period | $ 11.05 | $ 10.38 | $ 8.07 | $ 7.20 | $ 9.88 | $ 10.61 |
Income from InvestmentOperations |
|
|
|
|
| |
Net investment income (loss) E | .06 | .10 | .05 | .03 | .09 | .04 |
Net realized and unrealized gain (loss) | .84 | .64 | 2.29 | .93 | (2.67) | (.77) |
Total from investment operations | .90 | .74 | 2.34 | .96 | (2.58) | (.73) |
Distributions from net investment income | (.11) | (.07) | (.03) | (.09) | (.08) | - |
Distributions from net realized gain | - | - | - | - | (.02) | - |
Total distributions | (.11) | (.07) | (.03) | (.09) | (.10) | - |
Net asset value, end of period | $ 11.84 | $ 11.05 | $ 10.38 | $ 8.07 | $ 7.20 | $ 9.88 |
Total Return B, C, D | 8.18% | 7.19% | 29.08% | 13.32% | (26.21)% | (6.88)% |
Ratios to Average Net Assets F, I |
|
|
|
|
| |
Expenses before reductions | 1.28% A | 1.32% | 1.32% | 1.36% | 1.36% | 1.32% A |
Expenses net of fee waivers, if any | 1.28% A | 1.32% | 1.32% | 1.36% | 1.36% | 1.32% A |
Expenses net of all reductions | 1.28% A | 1.32% | 1.32% | 1.35% | 1.36% | 1.32% A |
Net investment income (loss) | 1.12% A | .98% | .50% | .41% | 1.21% | .89% A |
Supplemental Data |
|
|
|
|
|
|
Net assets, end of period (000 omitted) | $ 5,090 | $ 2,293 | $ 1,682 | $ 1,073 | $ 446 | $ 136 |
Portfolio turnover rate G | 26% A | 57% | 53% | 97% | 138% | 97% |
A Annualized
B Total returns for periods of less than one year are not annualized.
C Total returns would have been lower if certain expenses had not been reduced during the applicable periods shown.
D Total returns do not include the effect of the sales charges.
E Calculated based on average shares outstanding during the period.
F Fees and expenses of any underlying Fidelity Central Funds are not included in the Fund's expense ratio. The Fund indirectly bears its proportionate share of the expenses of any underlying Fidelity Central Funds.
G Amount does not include the portfolio activity of any underlying Fidelity Central Funds.
H For the period February 5, 2008 (commencement of sale of shares) to June 30, 2008.
I Expense ratios reflect operating expenses of the class. Expenses before reductions do not reflect amounts reimbursed by the investment adviser or reductions from brokerage service arrangements or reductions from other expense offset arrangements and do not represent the amount paid by the class during periods when reimbursements or reductions occur. Expense ratios before reductions for start-up periods may not be representative of longer-term operating periods. Expenses net of fee waivers reflect expenses after reimbursement by the investment adviser but prior to reductions from brokerage service arrangements or other expense offset arrangements. Expenses net of all reductions represent the net expenses paid by the class.
See accompanying notes which are an integral part of the financial statements.
Semiannual Report
Financial Highlights - Class B
| Six months ended | Years ended June 30, | ||||
| (Unaudited) | 2012 | 2011 | 2010 | 2009 | 2008 I |
Selected Per-Share Data |
|
|
|
|
| |
Net asset value, beginning of period | $ 10.97 | $ 10.30 | $ 8.02 | $ 7.19 | $ 9.87 | $ 10.61 |
Income from InvestmentOperations |
|
|
|
|
| |
Net investment income (loss) E | .03 | .05 | - K | (.01) | .05 | .02 |
Net realized and unrealized gain (loss) | .85 | .63 | 2.28 | .92 | (2.66) | (.76) |
Total from investment operations | .88 | .68 | 2.28 | .91 | (2.61) | (.74) |
Distributions from net investment income | (.04) | (.01) | - | (.08) | (.05) | - |
Distributions from net realized gain | - | - | - | - | (.02) | - |
Total distributions | (.04) | (.01) | - | (.08) | (.07) | - |
Net asset value, end of period | $ 11.81 | $ 10.97 | $ 10.30 | $ 8.02 | $ 7.19 | $ 9.87 |
Total Return B, C, D | 8.01% | 6.62% | 28.43% | 12.60% | (26.56)% | (6.97)% |
Ratios to Average Net Assets F, J |
|
|
|
|
| |
Expenses before reductions | 1.80% A | 1.82% | 1.83% | 1.88% | 1.88% | 1.73% A |
Expenses net of fee waivers, if any | 1.80% A | 1.82% | 1.83% | 1.88% | 1.88% | 1.73% A |
Expenses net of all reductions | 1.80% A | 1.81% | 1.82% | 1.88% | 1.88% | 1.73% A |
Net investment income (loss) | .60% A | .49% | .00%H | (.12)% | .68% | .52% A |
Supplemental Data |
|
|
|
|
|
|
Net assets, end of period (000 omitted) | $ 656 | $ 704 | $ 764 | $ 667 | $ 263 | $ 107 |
Portfolio turnover rate G | 26% A | 57% | 53% | 97% | 138% | 97% |
A Annualized
B Total returns for periods of less than one year are not annualized.
C Total returns would have been lower if certain expenses had not been reduced during the applicable periods shown.
D Total returns do not include the effect of the contingent deferred sales charge.
E Calculated based on average shares outstanding during the period.
F Fees and expenses of any underlying Fidelity Central Funds are not included in the Fund's expense ratio. The Fund indirectly bears its proportionate share of the expenses of any underlying Fidelity Central Funds.
G Amount does not include the portfolio activity of any underlying Fidelity Central Funds.
H Amount represents less than .01%.
I For the period February 5, 2008 (commencement of sale of shares) to June 30, 2008.
J Expense ratios reflect operating expenses of the class. Expenses before reductions do not reflect amounts reimbursed by the investment adviser or reductions from brokerage service arrangements or reductions from other expense offset arrangements and do not represent the amount paid by the class during periods when reimbursements or reductions occur. Expense ratios before reductions for start-up periods may not be representative of longer-term operating periods. Expenses net of fee waivers reflect expenses after reimbursement by the investment adviser but prior to reductions from brokerage service arrangements or other expense offset arrangements. Expenses net of all reductions represent the net expenses paid by the class.
K Amount represents less than $.01 per share.
See accompanying notes which are an integral part of the financial statements.
Semiannual Report
Financial Highlights - Class C
| Six months ended | Years ended June 30, | ||||
| (Unaudited) | 2012 | 2011 | 2010 | 2009 | 2008 H |
Selected Per-Share Data |
|
|
|
|
| |
Net asset value, beginning of period | $ 10.93 | $ 10.28 | $ 8.01 | $ 7.16 | $ 9.87 | $ 10.61 |
Income from Investment |
|
|
|
|
| |
Net investment income (loss) E | .04 | .05 | - J | (.01) | .05 | .02 |
Net realized and unrealized gain (loss) | .83 | .64 | 2.27 | .92 | (2.66) | (.76) |
Total from investment operations | .87 | .69 | 2.27 | .91 | (2.61) | (.74) |
Distributions from net investment income | (.04) | (.04) | - | (.06) | (.08) | - |
Distributions from net realized gain | - | - | - | - | (.02) | - |
Total distributions | (.04) | (.04) | - | (.06) | (.10) | - |
Net asset value, end of period | $ 11.76 | $ 10.93 | $ 10.28 | $ 8.01 | $ 7.16 | $ 9.87 |
Total Return B, C, D | 7.95% | 6.74% | 28.34% | 12.72% | (26.56)% | (6.97)% |
Ratios to Average Net Assets F, I |
|
|
|
|
| |
Expenses before reductions | 1.77% A | 1.79% | 1.81% | 1.86% | 1.88% | 1.71% A |
Expenses net of fee waivers, if any | 1.77% A | 1.79% | 1.81% | 1.86% | 1.88% | 1.71% A |
Expenses net of all reductions | 1.76% A | 1.79% | 1.81% | 1.85% | 1.88% | 1.71% A |
Net investment income (loss) | .63% A | .51% | .01% | (.10)% | .69% | .55% A |
Supplemental Data |
|
|
|
|
|
|
Net assets, end of period (000 omitted) | $ 4,300 | $ 2,845 | $ 1,913 | $ 807 | $ 470 | $ 98 |
Portfolio turnover rate G | 26% A | 57% | 53% | 97% | 138% | 97% |
A Annualized
B Total returns for periods of less than one year are not annualized.
C Total returns would have been lower if certain expenses had not been reduced during the applicable periods shown.
D Total returns do not include the effect of the contingent deferred sales charge.
E Calculated based on average shares outstanding during the period.
F Fees and expenses of any underlying Fidelity Central Funds are not included in the Fund's expense ratio. The Fund indirectly bears its proportionate share of the expenses of any underlying Fidelity Central Funds.
G Amount does not include the portfolio activity of any underlying Fidelity Central Funds.
H For the period February 5, 2008 (commencement of sale of shares) to June 30, 2008.
I Expense ratios reflect operating expenses of the class. Expenses before reductions do not reflect amounts reimbursed by the investment adviser or reductions from brokerage service arrangements or reductions from other expense offset arrangements and do not represent the amount paid by the class during periods when reimbursements or reductions occur. Expense ratios before reductions for start-up periods may not be representative of longer-term operating periods. Expenses net of fee waivers reflect expenses after reimbursement by the investment adviser but prior to reductions from brokerage service arrangements or other expense offset arrangements. Expenses net of all reductions represent the net expenses paid by the class.
J Amount represents less than $.01 per share.
See accompanying notes which are an integral part of the financial statements.
Semiannual Report
Financial Highlights - Mega Cap Stock
| Six months ended | Years ended June 30, | ||||
| (Unaudited) | 2012 | 2011 | 2010 | 2009 | 2008 |
Selected Per-Share Data |
|
|
|
|
| |
Net asset value, beginning of period | $ 11.11 | $ 10.43 | $ 8.11 | $ 7.23 | $ 9.91 | $ 12.06 |
Income from Investment |
|
|
|
|
| |
Net investment income (loss) D | .10 | .16 | .10 | .08 | .13 | .14 |
Net realized and unrealized gain (loss) | .85 | .64 | 2.29 | .93 | (2.67) | (1.60) |
Total from investment operations | .95 | .80 | 2.39 | 1.01 | (2.54) | (1.46) |
Distributions from net investmentincome | (.17) | (.12) | (.07) | (.13) | (.12) | (.07) |
Distributions from net realized gain | - | - | - | - | (.02) | (.62) |
Total distributions | (.17) | (.12) | (.07) | (.13) | (.14) | (.69) |
Net asset value, end of period | $ 11.89 | $ 11.11 | $ 10.43 | $ 8.11 | $ 7.23 | $ 9.91 |
Total Return B, C | 8.56% | 7.83% | 29.61% | 13.93% | (25.77)% | (12.73)% |
Ratios to Average Net Assets E, G |
|
|
|
|
| |
Expenses before reductions | .71% A | .76% | .79% | .81% | .79% | .75% |
Expenses net of fee waivers, if any | .71% A | .76% | .79% | .80% | .78% | .74% |
Expenses net of all reductions | .70% A | .75% | .78% | .79% | .78% | .74% |
Net investment income (loss) | 1.69% A | 1.55% | 1.04% | .96% | 1.78% | 1.28% |
Supplemental Data |
|
|
|
|
|
|
Net assets, end of period (000 omitted) | $ 1,775,218 | $ 1,287,144 | $ 785,233 | $ 500,407 | $ 253,164 | $ 667,542 |
Portfolio turnover rate F | 26% A | 57% | 53% | 97% | 138% | 97% |
A Annualized
B Total returns for periods of less than one year are not annualized.
C Total returns would have been lower if certain expenses had not been reduced during the applicable periods shown.
D Calculated based on average shares outstanding during the period.
E Fees and expenses of any underlying Fidelity Central Funds are not included in the Fund's expense ratio. The Fund indirectly bears its proportionate share of the expenses of any underlying Fidelity Central Funds.
F Amount does not include the portfolio activity of any underlying Fidelity Central Funds.
G Expense ratios reflect operating expenses of the class. Expenses before reductions do not reflect amounts reimbursed by the investment adviser or reductions from brokerage service arrangements or reductions from other expense offset arrangements and do not represent the amount paid by the class during periods when reimbursements or reductions occur. Expenses net of fee waivers reflect expenses after reimbursement by the investment adviser but prior to reductions from brokerage service arrangements or other expense offset arrangements. Expenses net of all reductions represent the net expenses paid by the class.
See accompanying notes which are an integral part of the financial statements.
Semiannual Report
Financial Highlights - Institutional Class
| Six months ended | Years ended June 30, | ||||
| (Unaudited) | 2012 | 2011 | 2010 | 2009 | 2008 G |
Selected Per-Share Data |
|
|
|
|
| |
Net asset value, beginning of period | $ 11.08 | $ 10.40 | $ 8.09 | $ 7.22 | $ 9.91 | $ 10.61 |
Income from Investment |
|
|
|
|
| |
Net investment income (loss) D | .10 | .16 | .10 | .08 | .13 | .07 |
Net realized and unrealized gain (loss) | .85 | .63 | 2.30 | .92 | (2.67) | (.77) |
Total from investment operations | .95 | .79 | 2.40 | 1.00 | (2.54) | (.70) |
Distributions from net investment income | (.17) | (.11) | (.09) | (.13) | (.13) | - |
Distributions from net realized gain | - | - | - | - | (.02) | - |
Total distributions | (.17) | (.11) | (.09) | (.13) | (.15) | - |
Net asset value, end of period | $ 11.86 | $ 11.08 | $ 10.40 | $ 8.09 | $ 7.22 | $ 9.91 |
Total Return B, C | 8.58% | 7.77% | 29.74% | 13.89% | (25.81)% | (6.60)% |
Ratios to Average Net Assets E,H |
|
|
|
|
| |
Expenses before reductions | .75% A | .78% | .79% | .88% | .77% | .70% A |
Expenses net of fee waivers, if any | .75% A | .78% | .79% | .88% | .77% | .70% A |
Expenses net of all reductions | .74% A | .77% | .78% | .87% | .77% | .70% A |
Net investment income (loss) | 1.65% A | 1.53% | 1.04% | .88% | 1.79% | 1.57% A |
Supplemental Data |
|
|
|
|
|
|
Net assets, end of period (000 omitted) | $ 309,785 | $ 175,833 | $ 136,768 | $ 1,568 | $ 515 | $ 93 |
Portfolio turnover rate F | 26% A | 57% | 53% | 97% | 138% | 97% |
A Annualized
B Total returns for periods of less than one year are not annualized.
C Total returns would have been lower if certain expenses had not been reduced during the applicable periods shown.
D Calculated based on average shares outstanding during the period.
E Fees and expenses of any underlying Fidelity Central Funds are not included in the Fund's expense ratio. The Fund indirectly bears its proportionate share of the expenses of any underlying Fidelity Central Funds.
F Amount does not include the portfolio activity of any underlying Fidelity Central Funds.
G For the period February 5, 2008 (commencement of sale of shares) to June 30, 2008.
H Expense ratios reflect operating expenses of the class. Expenses before reductions do not reflect amounts reimbursed by the investment adviser or reductions from brokerage service arrangements or reductions from other expense offset arrangements and do not represent the amount paid by the class during periods when reimbursements or reductions occur. Expense ratios before reductions for start-up periods may not be representative of longer-term operating periods. Expenses net of fee waivers reflect expenses after reimbursement by the investment adviser but prior to reductions from brokerage service arrangements or other expense offset arrangements. Expenses net of all reductions represent the net expenses paid by the class.
See accompanying notes which are an integral part of the financial statements.
Semiannual Report
Notes to Financial Statements
For the period ended December 31, 2012 (Unaudited)
1. Organization.
Fidelity® Mega Cap Stock Fund (the Fund) is a fund of Fidelity Hastings Street Trust (the Trust) and is authorized to issue an unlimited number of shares. The Trust is registered under the Investment Company Act of 1940, as amended (the 1940 Act), as an open-end management investment company organized as a Massachusetts business trust. The Fund offers Class A, Class T, Class C, Mega Cap Stock, and Institutional Class shares, each of which, along with Class B shares, has equal rights as to assets and voting privileges. Class B shares are closed to new accounts and additional purchases, except for exchanges and reinvestments. Each class has exclusive voting rights with respect to matters that affect that class. Class B shares will automatically convert to Class A shares after a holding period of seven years from the initial date of purchase. Investment income, realized and unrealized capital gains and losses, the common expenses of the Fund, and certain fund-level expense reductions, if any, are allocated on a pro-rata basis to each class based on the relative net assets of each class to the total net assets of the Fund. Each class differs with respect to transfer agent and distribution and service plan fees incurred. Certain expense reductions may also differ by class.
2. Investments in Fidelity Central Funds.
The Fund invests in Fidelity Central Funds, which are open-end investment companies available only to other investment companies and accounts managed by Fidelity Management & Research Company (FMR) and its affiliates. The Fund's Schedule of Investments lists each of the Fidelity Central Funds held as of period end, if any, as an investment of the Fund, but does not include the underlying holdings of each Fidelity Central Fund. As an Investing Fund, the Fund indirectly bears its proportionate share of the expenses of the underlying Fidelity Central Funds.
The Money Market Central Funds seek preservation of capital and current income and are managed by Fidelity Investments Money Management, Inc. (FIMM), an affiliate of FMR.
A complete unaudited list of holdings for each Fidelity Central Fund is available upon request or at the Securities and Exchange Commission (the SEC) website at www.sec.gov. In addition, the financial statements of the Fidelity Central Funds are available on the SEC website or upon request.
3. Significant Accounting Policies.
The financial statements have been prepared in conformity with accounting principles generally accepted in the United States of America (GAAP), which require management to make certain estimates and assumptions at the date of the financial statements. Actual results could differ from those estimates. Subsequent events, if any, through the date that the financial statements were issued have been evaluated in the preparation of
Semiannual Report
3. Significant Accounting Policies - continued
the financial statements. The following summarizes the significant accounting policies of the Fund:
Investment Valuation. Investments are valued as of 4:00 p.m. Eastern time on the last calendar day of the period. In accordance with valuation policies and procedures approved by the Board of Trustees (the Board), the Fund attempts to obtain prices from one or more third party pricing vendors or brokers to value its investments. When current market prices, quotations or rates are not readily available or reliable, investments will be fair valued in good faith by the FMR Fair Value Committee (the Committee), in accordance with procedures adopted by the Fund's Board. Factors used in determining fair value vary by investment type and may include market or investment specific events. The frequency with which these procedures are used cannot be predicted and they may be utilized to a significant extent. The Committee oversees the Fund's valuation policies and procedures and is responsible for approving and reporting to the Board all fair value determinations.
The Fund categorizes the inputs to valuation techniques used to value its investments into a disclosure hierarchy consisting of three levels as shown below:
Level 1 - quoted prices in active markets for identical investments
Level 2 - other significant observable inputs (including quoted prices for similar investments, interest rates, prepayment speeds, etc.)
Level 3 - unobservable inputs (including the Fund's own assumptions based on the best information available)
Valuation techniques used to value the Fund's investments by major category are as follows:
Equity securities, including restricted securities, for which market quotations are readily available, are valued at the last reported sale price or official closing price as reported by a third party pricing vendor on the primary market or exchange on which they are traded and are categorized as Level 1 in the hierarchy. In the event there were no sales during the day or closing prices are not available, securities are valued at the last quoted bid price or may be valued using the last available price and are generally categorized as Level 2 in the hierarchy. For foreign equity securities, when significant market or security specific events arise, comparisons to the valuation of American Depositary Receipts (ADRs), futures contracts, Exchange-Traded Funds (ETFs) and certain indexes as well as quoted prices for similar securities are used and are categorized as Level 2 in the hierarchy. Utilizing these techniques may result in transfers between Level 1 and Level 2.
Semiannual Report
Notes to Financial Statements (Unaudited) - continued
3. Significant Accounting Policies - continued
Investment Valuation - continued
Investments in open-end mutual funds, including the Fidelity Central Funds, are valued at their closing net asset value (NAV) each business day and are categorized as Level 1 in the hierarchy.
Changes in valuation techniques may result in transfers in or out of an assigned level within the disclosure hierarchy. The aggregate value of investments by input level, as of December 31, 2012, is included at the end of the Fund's Schedule of Investments.
Foreign Currency. The Fund may use foreign currency contracts to facilitate transactions in foreign-denominated securities. Gains and losses from these transactions may arise from changes in the value of the foreign currency or if the counterparties do not perform under the contracts' terms.
Foreign-denominated assets, including investment securities, and liabilities are translated into U.S. dollars at the exchange rates at period end. Purchases and sales of investment securities, income and dividends received and expenses denominated in foreign currencies are translated into U.S. dollars at the exchange rate in effect on the transaction date.
The effects of exchange rate fluctuations on investments are included with the net realized and unrealized gain (loss) on investment securities. Other foreign currency transactions resulting in realized and unrealized gain (loss) are disclosed separately.
Investment Transactions and Income. For financial reporting purposes, the Fund's investment holdings and NAV include trades executed through the end of the last business day of the period. The NAV per share for processing shareholder transactions is calculated as of the close of business of the New York Stock Exchange (NYSE), normally 4:00 p.m. Eastern time and includes trades executed through the end of the prior business day. Gains and losses on securities sold are determined on the basis of identified cost and may include proceeds received from litigation. Dividend income is recorded on the ex-dividend date, except for certain dividends from foreign securities where the ex-dividend date may have passed, which are recorded as soon as the Fund is informed of the ex-dividend date. Non-cash dividends included in dividend income, if any, are recorded at the fair market value of the securities received. Distributions received on securities that represent a return of capital or capital gain are recorded as a reduction of cost of investments and/or as a realized gain. The Fund estimates the components of distributions received that may be considered return of capital distributions or capital gain distributions. Interest income and distributions from the Fidelity Central Funds are accrued as earned. Investment income is recorded net of foreign taxes withheld where recovery of such taxes is uncertain.
Semiannual Report
3. Significant Accounting Policies - continued
Expenses. Expenses directly attributable to a fund are charged to that fund. Expenses attributable to more than one fund are allocated among the respective funds on the basis of relative net assets or other appropriate methods. Expense estimates are accrued in the period to which they relate and adjustments are made when actual amounts are known.
Income Tax Information and Distributions to Shareholders. Each year, the Fund intends to qualify as a regulated investment company under Subchapter M of the Internal Revenue Code, including distributing substantially all of its taxable income and realized gains. As a result, no provision for income taxes is required. The Fund files a U.S. federal tax return, in addition to state and local tax returns as required. A fund's federal income tax returns are subject to examination by the Internal Revenue Service (IRS) for a period of three fiscal years after they are filed. State and local tax returns may be subject to examination for an additional fiscal year depending on the jurisdiction. Foreign taxes are provided for based on the Fund's understanding of the tax rules and rates that exist in the foreign markets in which it invests.
Distributions are declared and recorded on the ex-dividend date. Income dividends and capital gain distributions are declared separately for each class. Income and capital gain distributions are determined in accordance with income tax regulations, which may differ from GAAP.
Capital accounts within the financial statements are adjusted for permanent book-tax differences. These adjustments have no impact on net assets or the results of operations. Temporary book-tax differences will reverse in a subsequent period.
Book-tax differences are primarily due to foreign currency transactions, market discount, futures transactions, equity-debt classifications, capital loss carryforwards, and losses deferred due to wash sales.
The federal tax cost of investment securities and unrealized appreciation (depreciation) as of period end were as follows:
Gross unrealized appreciation | $ 224,061,201 |
Gross unrealized depreciation | (42,793,431) |
Net unrealized appreciation (depreciation) on securities and other investments | $ 181,267,770 |
|
|
Tax cost | $ 1,929,980,161 |
Capital loss carryforwards are only available to offset future capital gains of the Fund to the extent provided by regulations and may be limited. Under the Regulated Investment Company Modernization Act of 2010 (the Act), the Fund is permitted to carry forward capital losses incurred in taxable years beginning after December 22, 2010 for an
Semiannual Report
Notes to Financial Statements (Unaudited) - continued
3. Significant Accounting Policies - continued
Income Tax Information and Distributions to Shareholders - continued
unlimited period and such capital losses are required to be used prior to any losses that expire. At June 30, 2012, capital loss carryforwards were as follows:
Fiscal year of expiration |
|
2017 | $ (3,091,486) |
2018 | (109,353,222) |
Total capital loss carryforward | $ (112,444,708) |
4. Purchases and Sales of Investments.
Purchases and sales of securities, other than short-term securities, aggregated $727,046,610 and $247,233,949, respectively.
5. Fees and Other Transactions with Affiliates.
Management Fee. FMR and its affiliates provide the Fund with investment management related services for which the Fund pays a monthly management fee. The management fee is the sum of an individual fund fee rate that is based on an annual rate of .20% of the Fund's average net assets and an annualized group fee rate that averaged .26% during the period. The group fee rate is based upon the average net assets of all the mutual funds advised by FMR. The group fee rate decreases as assets under management increase and increases as assets under management decrease. For the period, the total annualized management fee rate was .46% of the Fund's average net assets.
Distribution and Service Plan Fees. In accordance with Rule 12b-1 of the 1940 Act, the Fund has adopted separate Distribution and Service Plans for each class of shares. Certain classes pay Fidelity Distributors Corporation (FDC), an affiliate of FMR, separate Distribution and Service Fees, each of which is based on an annual percentage of each class' average net assets. In addition, FDC may pay financial intermediaries for selling shares of the Fund and providing shareholder support services. For the period, the Distribution and Service Fee rates, total fees and amounts retained by FDC were as follows:
| Distribution | Service | Total Fees | Retained |
Class A | -% | .25% | $ 13,508 | $ 272 |
Class T | .25% | .25% | 9,224 | - |
Class B | .75% | .25% | 3,554 | 2,666 |
Class C | .75% | .25% | 17,699 | 6,562 |
|
|
| $ 43,985 | $ 9,500 |
Semiannual Report
5. Fees and Other Transactions with Affiliates - continued
Sales Load. FDC may receive a front-end sales charge of up to 5.75% for selling Class A shares and 3.50% for selling Class T shares, some of which is paid to financial intermediaries for selling shares of the Fund. Depending on the holding period, FDC may receive contingent deferred sales charges levied on Class A, Class T, Class B, and Class C redemptions. The deferred sales charges range from 5.00% to 1.00% for Class B shares, 1.00% for Class C shares, 1.00% for certain purchases of Class A shares and .25% for certain purchases of Class T shares.
For the period, sales charge amounts retained by FDC were as follows:
| Retained |
Class A | $ 8,445 |
Class T | 868 |
Class B* | 218 |
Class C* | 496 |
| $ 10,027 |
* When Class B and Class C shares are initially sold, FDC pays commissions from its own resources to financial intermediaries through which the sales are made.
Transfer Agent Fees. Fidelity Investments Institutional Operations Company, Inc. (FIIOC), an affiliate of FMR, is the transfer, dividend disbursing and shareholder servicing agent for each class of the Fund. FIIOC receives account fees and asset-based fees that vary according to the account size and type of account of the shareholders of the respective classes of the Fund. FIIOC pays for typesetting, printing and mailing of shareholder reports, except proxy statements. For the period, transfer agent fees for each class were as follows:
| Amount | % of |
Class A | $ 13,124 | .24 |
Class T | 5,162 | .28 |
Class B | 1,068 | .30 |
Class C | 4,653 | .26 |
Mega Cap Stock | 1,679,362 | .21 |
Institutional Class | 345,021 | .25 |
| $ 2,048,390 |
|
* Annualized
Accounting and Security Lending Fees. Fidelity Service Company, Inc. (FSC), an affiliate of FMR, maintains the Fund's accounting records. The accounting fee is based on the level of average net assets for each month. Under a separate contract, FSC
Semiannual Report
Notes to Financial Statements (Unaudited) - continued
5. Fees and Other Transactions with Affiliates - continued
Accounting and Security Lending Fees - continued
administers the security lending program. The security lending fee is based on the number and duration of lending transactions.
Brokerage Commissions. The Fund placed a portion of its portfolio transactions with brokerage firms which are affiliates of the investment adviser. The commissions paid to these affiliated firms were $16,707 for the period.
6. Committed Line of Credit.
The Fund participates with other funds managed by FMR or an affiliate in a $4.25 billion credit facility (the "line of credit") to be utilized for temporary or emergency purposes to fund shareholder redemptions or for other short-term liquidity purposes. The Fund has agreed to pay commitment fees on its pro-rata portion of the line of credit, which amounted to $2,016 and is reflected in Miscellaneous expenses on the Statement of Operations. During the period, there were no borrowings on this line of credit.
7. Security Lending.
The Fund lends portfolio securities through a lending agent from time to time in order to earn additional income. For equity securities, a lending agent is used and may loan securities to certain qualified borrowers, including Fidelity Capital Markets (FCM), a broker-dealer affiliated with the Fund. On the settlement date of the loan, the Fund receives collateral (in the form of U.S. Treasury obligations, letters of credit and/or cash) against the loaned securities and maintains collateral in an amount not less than 100% of the market value of the loaned securities during the period of the loan. The market value of the loaned securities is determined at the close of business of the Fund and any additional required collateral is delivered to the Fund on the next business day. If the borrower defaults on its obligation to return the securities loaned because of insolvency or other reasons, a fund could experience delays and costs in recovering the securities loaned or in gaining access to the collateral. Any cash collateral received is invested in the Fidelity Securities Lending Cash Central Fund. At period end, there were no security loans outstanding. Security lending income represents the income earned on investing cash collateral, less rebates paid to borrowers and any lending agent fees associated with the loan, plus any premium payments received for lending certain types of securities. Security lending income is presented in the Statement of Operations as a component of income from Fidelity Central Funds. Total security lending income during the period amounted to $10,371. During the period, there were no securities loaned to FCM.
Semiannual Report
8. Expense Reductions.
Many of the brokers with whom FMR places trades on behalf of the Fund provided services to the Fund in addition to trade execution. These services included payments of certain expenses on behalf of the Fund totaling $45,405 for the period. In addition, through arrangements with the Fund's custodian, credits realized as a result of uninvested cash balances were used to reduce the Fund's expenses. During the period, these credits reduced the Fund's custody expenses by $15.
9. Distributions to Shareholders.
Distributions to shareholders of each class were as follows:
Six months ended | Year ended | |
From net investment income |
|
|
Class A | $ 137,534 | $ 41,978 |
Class T | 36,494 | 11,957 |
Class B | 2,304 | 701 |
Class C | 13,133 | 10,116 |
Mega Cap Stock | 23,359,423 | 10,229,962 |
Institutional Class | 4,026,605 | 1,458,384 |
Total | $ 27,575,493 | $ 11,753,098 |
10. Share Transactions.
Transactions for each class of shares were as follows:
| Shares | Dollars | ||
Six months ended December 31, | Year ended | Six months ended | Year ended | |
Class A |
|
|
|
|
Shares sold | 484,461 | 486,313 | $ 5,672,260 | $ 5,118,655 |
Reinvestment of distributions | 11,084 | 3,634 | 127,952 | 35,610 |
Shares redeemed | (134,571) | (120,131) | (1,568,852) | (1,250,294) |
Net increase (decrease) | 360,974 | 369,816 | $ 4,231,360 | $ 3,903,971 |
Class T |
|
|
|
|
Shares sold | 261,293 | 105,560 | $ 3,063,989 | $ 1,103,327 |
Reinvestment of distributions | 3,084 | 1,213 | 35,829 | 11,925 |
Shares redeemed | (42,256) | (61,297) | (497,638) | (633,953) |
Net increase (decrease) | 222,121 | 45,476 | $ 2,602,180 | $ 481,299 |
Semiannual Report
Notes to Financial Statements (Unaudited) - continued
10. Share Transactions - continued
| Shares | Dollars | ||
Six months ended December 31, | Year ended | Six months ended | Year ended | |
Class B |
|
|
|
|
Shares sold | 3,845 | 9,865 | $ 45,941 | $ 101,146 |
Reinvestment of distributions | 196 | 69 | 2,261 | 689 |
Shares redeemed | (12,616) | (20,058) | (147,406) | (199,056) |
Net increase (decrease) | (8,575) | (10,124) | $ (99,204) | $ (97,221) |
Class C |
|
|
|
|
Shares sold | 155,422 | 229,191 | $ 1,808,220 | $ 2,376,452 |
Reinvestment of distributions | 988 | 856 | 11,494 | 8,451 |
Shares redeemed | (51,188) | (155,763) | (593,856) | (1,568,860) |
Net increase (decrease) | 105,222 | 74,284 | $ 1,225,858 | $ 816,043 |
Mega Cap Stock |
|
|
|
|
Shares sold | 47,376,825 | 74,953,852 | $ 545,879,670 | $ 795,313,856 |
Reinvestment of distributions | 1,836,891 | 965,264 | 21,294,765 | 9,476,451 |
Shares redeemed | (15,762,374) | (35,350,283) | (184,312,176) | (369,162,567) |
Net increase (decrease) | 33,451,342 | 40,568,833 | $ 382,862,259 | $ 435,627,740 |
Institutional Class |
|
|
|
|
Shares sold | 10,885,901 | 7,943,118 | $ 123,237,266 | $ 80,524,837 |
Reinvestment of distributions | 338,467 | 144,898 | 3,911,623 | 1,415,456 |
Shares redeemed | (962,943) | (5,373,433) | (11,237,812) | (54,303,944) |
Net increase (decrease) | 10,261,425 | 2,714,583 | $ 115,911,077 | $ 27,636,349 |
11. Other.
The Fund's organizational documents provide former and current trustees and officers with a limited indemnification against liabilities arising in connection with the performance of their duties to the Fund. In the normal course of business, the Fund may also enter into contracts that provide general indemnifications. The Fund's maximum exposure under these arrangements is unknown as this would be dependent on future claims that may be made against the Fund. The risk of material loss from such claims is considered remote.
Semiannual Report
Board Approval of Investment Advisory Contracts and Management Fees
Fidelity Mega Cap Stock Fund
Each year, the Board of Trustees, including the Independent Trustees (together, the Board), votes on the renewal of the management contract and sub-advisory agreements (together, the Advisory Contracts) for the fund. The Board, assisted by the advice of fund counsel and Independent Trustees' counsel, requests and considers a broad range of information relevant to the renewal of the Advisory Contracts throughout the year.
The Board meets regularly and, at each of its meetings, considers factors that are relevant to its annual consideration of the renewal of the fund's Advisory Contracts, including the services and support provided to the fund and its shareholders. The Board has established various standing committees, each composed of and chaired by Independent Trustees with varying backgrounds, to which the Board has assigned specific subject matter responsibilities in order to enhance effective decision-making by the Board. The Board, acting directly and through its Committees, requests and receives information concerning the annual consideration of the renewal of the fund's Advisory Contracts. The Board also meets as needed to consider matters specifically related to the Board's annual consideration of the renewal of Advisory Contracts. Members of the Board may also meet with trustees of other Fidelity funds through ad hoc joint committees to discuss certain matters relevant to the Fidelity funds.
At its July 2012 meeting, the Board of Trustees, including the Independent Trustees, unanimously determined to renew the fund's Advisory Contracts. In reaching its determination, the Board considered all factors it believed relevant, including (i) the nature, extent, and quality of the services to be provided to the fund and its shareholders (including the investment performance of the fund); (ii) the competitiveness of the fund's management fee and total expense ratio relative to peer funds; (iii) the total costs of the services to be provided by and the profits to be realized by Fidelity from its relationship with the fund; (iv) the extent to which economies of scale exist and would be realized as the fund grows; and (v) whether fee levels reflect these economies of scale, if any, for the benefit of fund shareholders.
In considering whether to renew the Advisory Contracts for the fund, the Board reached a determination, with the assistance of fund counsel and Independent Trustees' counsel and through the exercise of its business judgment, that the renewal of the Advisory Contracts is in the best interests of the fund and its shareholders and that the compensation payable under the Advisory Contracts is fair and reasonable. The Board's decision to renew the Advisory Contracts was not based on any single factor, but rather was based on a comprehensive consideration of all the information provided to the Board at its meetings throughout the year. The Board, in reaching its determination to renew the Advisory Contracts, is aware that shareholders in the fund have a broad range of investment choices available to them, including a wide choice among mutual funds offered by Fidelity's competitors, and that the fund's shareholders, who have the opportunity to review and weigh the disclosure provided by the fund in its prospectus and other public disclosures, have chosen to invest in this fund, managed by Fidelity.
Semiannual Report
Nature, Extent, and Quality of Services Provided. The Board considered the staffing within the investment adviser, FMR, and the sub-advisers (together, the Investment Advisers), including the backgrounds of the fund's investment personnel, and also considered the fund's investment objective, strategies, and related investment philosophy. The Independent Trustees also had discussions with senior management of Fidelity's investment operations and investment groups. The Board considered the structure of the portfolio manager compensation program and whether this structure provides appropriate incentives to act in the best interests of the fund.
Resources Dedicated to Investment Management and Support Services. The Board and the Fund Oversight and Research Committees reviewed the general qualifications and capabilities of the Investment Advisers' investment staff, including its size, education, experience, and resources, as well as the Investment Advisers' approach to recruiting, training, managing, and compensating investment personnel. The Board also noted that FMR has continued to increase the resources devoted to non-U.S. offices, including expansion of Fidelity's global investment organization. The Board noted that Fidelity's analysts have extensive resources, tools and capabilities that allow them to conduct sophisticated quantitative and fundamental analysis, as well as credit analysis of issuers, counterparties and guarantors. The Board also believes that Fidelity's investment professionals have sufficient access to global information and data so as to provide competitive investment results over time, and that those professionals also have access to sophisticated tools that permit them to assess portfolio construction and risk and performance attribution characteristics continuously, as well as to transmit new information and research conclusions rapidly around the world. Additionally, in its deliberations, the Board considered the Investment Advisers' trading and risk management capabilities and resources, which are an integral part of the investment management process.
Shareholder and Administrative Services. The Board considered (i) the nature, extent, quality, and cost of advisory, administrative, and shareholder services performed by the Investment Advisers and their affiliates under the Advisory Contracts and under separate agreements covering transfer agency, pricing and bookkeeping, and securities lending services for the fund; (ii) the nature and extent of the supervision of third party service providers, principally custodians and subcustodians; and (iii) the resources devoted to, and the record of compliance with, the fund's compliance policies and procedures. The Board also reviewed the allocation of fund brokerage, including allocations to brokers affiliated with the Investment Advisers, the use of brokerage commissions to pay fund expenses, and the use of "soft" commission dollars to pay for research services.
Semiannual Report
Board Approval of Investment Advisory Contracts and
Management Fees - continued
The Board noted that the growth of fund assets over time across the complex allows Fidelity to reinvest in the development of services designed to enhance the value or convenience of the Fidelity funds as investment vehicles. These services include 24-hour access to account information and market information through telephone representatives and over the Internet, investor education materials and asset allocation tools, and the expanded availability of Fidelity Investor Centers.
Investment in a Large Fund Family. The Board considered the benefits to shareholders of investing in a Fidelity fund, including the benefits of investing in a fund that is part of a large family of funds offering a variety of investment disciplines and providing a large variety of mutual fund investor services. The Board noted that Fidelity had taken, or had made recommendations that resulted in the Fidelity funds taking, a number of actions over the previous year that benefited particular funds, including (i) continuing to dedicate additional resources to investment research and support of the senior management team that oversees asset management; (ii) persisting in efforts to enhance Fidelity's research capabilities, in particular, international research; (iii) launching new funds and making other enhancements to meet client needs for global and income-oriented solutions; (iv) continuing to launch dedicated lower cost underlying funds to meet investment management's portfolio construction needs related to expanding underlying fund options, specifically for the Freedom Fund product lines; (v) adopting a "Stock Selector" sector neutral investment approach and employing a team of portfolio managers who are sector specialists to manage certain funds; (vi) rationalizing product lines and gaining increased efficiencies through the mergers of several funds into other funds; (vii) strengthening the Spartan Index Fund product line by adding new funds and/or new low-cost institutional share classes, restructuring fund expenses to accommodate new classes, and reducing investment minimums for certain classes of shares; (viii) modifying the eligibility criteria for Institutional Class shares to increase their appeal to government entities and charitable investors; and (ix) reducing certain transfer agent fee rates.
Investment Performance. The Board considered whether the fund has operated in accordance with its investment objective, as well as its record of compliance with its investment restrictions. It also reviewed the fund's absolute investment performance for each class, as well as the fund's relative investment performance for each class measured over multiple periods against a broad-based securities market index. The Board noted that FMR believes that no meaningful peer group exists for the fund principally because most other funds in the fund's third-party peer group have different and/or broader investment mandates than the fund's more specialized strategies. The following charts considered by the Board show, over the one-, three-, and five-year periods ended December 31, 2011, as available, the cumulative total returns of the retail class and Class B of the fund and the cumulative total returns of a broad-based securities market index ("benchmark"). The returns of the retail class and Class B show the performance of the highest performing class (based on five-year performance) and the lowest performing class (based on three-year performance), respectively.
Semiannual Report
Fidelity Mega Cap Stock Fund

The Board noted that the investment performance of the retail class of the fund compared favorably to its benchmark for the three- and five-year periods, although the fund's one-year total return was lower than its benchmark. The Board considered that the variations in performance among the fund's classes reflect the variations in class expenses, which result in lower performance for higher expense classes. The Board also reviewed the fund's performance since inception as well as performance in the current year.
Based on its review, the Board concluded that the nature, extent, and quality of services provided to the fund under the Advisory Contracts should benefit the fund's shareholders.
Competitiveness of Management Fee and Total Expense Ratio. The Board considered the fund's management fee and total expense ratio compared to "mapped groups" of competitive funds and classes. Fidelity creates "mapped groups" by combining similar Lipper investment objective categories that have comparable management fee characteristics. Combining Lipper investment objective categories aids the Board's management fee and total expense ratio comparisons by broadening the competitive group used for comparison and by reducing the number of universes to which various Fidelity funds are compared.
Semiannual Report
Board Approval of Investment Advisory Contracts and
Management Fees - continued
Management Fee. The Board considered two proprietary management fee comparisons for the 12-month periods shown in the chart below. The group of Lipper funds used by the Board for management fee comparisons is referred to below as the "Total Mapped Group." The Total Mapped Group comparison focuses on a fund's standing relative to the total universe of comparable funds available to investors in terms of gross management fees before expense reimbursements or caps. "TMG %" represents the percentage of funds in the Total Mapped Group that had management fees that were lower than the fund's. For example, a TMG % of 14% means that 86% of the funds in the Total Mapped Group had higher management fees than the fund. The "Asset-Size Peer Group" (ASPG) comparison focuses on a fund's standing relative to non-Fidelity funds similar in size to the fund within the Total Mapped Group. The ASPG represents at least 15% of the funds in the Total Mapped Group with comparable asset size and management fee characteristics, subject to a minimum of 50 funds (or all funds in the Total Mapped Group if fewer than 50). Additional information, such as the ASPG quartile in which the fund's management fee ranked, is also included in the chart and considered by the Board.
Fidelity Mega Cap Stock Fund

The Board noted that the fund's management fee ranked below the median of its Total Mapped Group and below the median of its ASPG for 2011.
Based on its review, the Board concluded that the fund's management fee is fair and reasonable in light of the services that the fund receives and the other factors considered.
Total Expense Ratio. In its review of each class's total expense ratio, the Board considered the fund's management fee as well as other fund or class expenses, as applicable, such as transfer agent fees, pricing and bookkeeping fees, fund-paid 12b-1 fees, and custodial, legal, and audit fees. The Board also noted the effects of any waivers and reimbursements on fees and expenses. As part of its review, the Board also considered the current and historical total expense ratios of each class of the fund compared to competitive fund median expenses. Each class of the fund is compared to those funds and classes in the Total Mapped Group (used by the Board for management fee comparisons) that have a similar sales load structure.
Semiannual Report
The Board noted that the total expense ratio of each of Class A, Class B, Class C, Institutional Class, and the retail class ranked below its competitive median for 2011 and the total expense ratio of Class T ranked above its competitive median for 2011. The Board considered that various factors, including 12b-1 fees, positive or negative performance adjustments, and relatively higher other expenses in the case of small fund size, can affect total expense ratios. The Board noted that the total expense ratio of Class T was above the competitive median primarily because of higher 12b-1 fees on Class T. Class T has a higher 12b-1 fee, but a lower front-end sales charge, than traditionally priced front-end sales charge classes. The Board considered that Class T is primarily sold load-waived in the retirement plan market where its 0.50% 12b-1 fee is comparable to competing no-load, higher 12b-1 fee classes designed specifically for retirement plans. The Board noted that the fund offers multiple classes, each of which has a different sales load and 12b-1 fee structure, and that the multiple structures are intended to offer a range of pricing options for the intermediary market. The Board also noted that the total expense ratios of the classes vary primarily by the level of their 12b-1 fees, although differences in transfer agent fees may also cause expenses to vary from class to class.
Fees Charged to Other Fidelity Clients. The Board also considered Fidelity fee structures and other information with respect to clients of FMR and its affiliates, such as other mutual funds advised or subadvised by FMR or its affiliates, pension plan clients, and other institutional clients. The Board noted the findings of the 2010 ad hoc joint committee (created with the board of other Fidelity funds), which reviewed and compared Fidelity's institutional investment advisory business with its business of providing services to the Fidelity funds, including the differences in services provided, fees charged, and costs incurred, as well as competition in their respective marketplaces.
Based on its review of total expense ratios and fees charged to other Fidelity clients, the Board concluded that the total expense ratio of each class of the fund was reasonable, although Class T was above the median of the universe presented for comparison, in light of the services that the fund and its shareholders receive and the other factors considered.
Costs of the Services and Profitability. The Board considered the revenues earned and the expenses incurred by Fidelity in conducting the business of developing, marketing, distributing, managing, administering and servicing the fund and its shareholders. The Board also considered the level of Fidelity's profits in respect of all the Fidelity funds.
Semiannual Report
Board Approval of Investment Advisory Contracts and
Management Fees - continued
On an annual basis, FMR presents to the Board Fidelity's profitability for the fund. Fidelity calculates the profitability for each fund, as well as aggregate profitability for groups of Fidelity funds and all Fidelity funds, using a series of detailed revenue and cost allocation methodologies which originate with the books and records of Fidelity on which Fidelity's audited financial statements are based. The Audit Committee of the Board reviews any significant changes from the prior year's methodologies.
PricewaterhouseCoopers LLP (PwC), independent registered public accounting firm and auditor to Fidelity and certain Fidelity funds, has been engaged annually by the Board as part of the Board's assessment of Fidelity's profitability analysis. PwC's engagement includes the review and assessment of Fidelity's methodologies used in determining the revenues and expenses attributable to Fidelity's mutual fund business, and completion of agreed-upon procedures surrounding the mathematical accuracy of fund profitability and its conformity to allocation methodologies. After considering PwC's reports issued under the engagement and information provided by Fidelity, the Board concluded that while other allocation methods may also be reasonable, Fidelity's profitability methodologies are reasonable in all material respects.
The Board also reviewed Fidelity's non-fund businesses and fall-out benefits related to the mutual fund business as well as cases where Fidelity's affiliates may benefit from or be related to the fund's business.
The Board considered the costs of the services provided by and the profits realized by Fidelity in connection with the operation of the fund and was satisfied that the profitability was not excessive in the circumstances.
Economies of Scale. The Board considered whether there have been economies of scale in respect of the management of the Fidelity funds, whether the Fidelity funds (including the fund) have appropriately benefited from any such economies of scale, and whether there is potential for realization of any further economies of scale. The Board considered the extent to which the fund will benefit from economies of scale through increased services to the fund, through waivers or reimbursements, or through fee or expense reductions. The Board also noted that in 2009, it and the board of other Fidelity funds created an ad hoc committee (the Economies of Scale Committee) to analyze whether FMR attains economies of scale in respect of the management and servicing of the Fidelity funds, whether the Fidelity funds have appropriately benefited from such economies of scale, and whether there is potential for realization of any further economies of scale.
The Board recognized that the fund's management contract incorporates a "group fee" structure, which provides for lower group fee rates as total fund assets under FMR's management increase, and for higher group fee rates as total fund assets under FMR's management decrease. FMR calculates the group fee rates based on a tiered asset "breakpoint" schedule that varies based on asset class. The Board considered that the group fee is designed to deliver the benefits of economies of scale to fund shareholders when total Fidelity fund assets increase, even if assets of any particular fund are unchanged or have declined, because some portion of Fidelity's costs are attributable to services provided to all Fidelity funds, and all funds benefit if those costs can be allocated among more assets. The Board concluded that, given the group fee structure, fund shareholders will benefit from lower management fees as assets under FMR's management increase at the fund complex level, regardless of whether Fidelity achieves any such economies of scale.
Semiannual Report
The Board concluded, taking into account the analysis of the Economies of Scale Committee, that economies of scale, if any, are being appropriately shared between fund shareholders and Fidelity.
Additional Information Requested by the Board. In order to develop fully the factual basis for consideration of the Fidelity funds' Advisory Contracts, the Board requested and received additional information on certain topics, including (i) fund performance trends, actions to be taken by FMR to improve certain funds' overall performance, and Fidelity's long-term strategies for certain funds; (ii) the potential to further rationalize the Fidelity fund lineup with the possibility of achieving savings for the funds and Fidelity; (iii) Fidelity's compensation structure for portfolio managers and other key investment personnel; (iv) the amount of the investment that each portfolio manager has made in the Fidelity fund(s) that he or she manages; (v) the realization of fall-out benefits in certain Fidelity business units; (vi) Fidelity's group fee structures, the potential impact of regulatory changes on such structures, and the rationale for the individual fee rates of certain funds; (vii) fund profitability methodology, including Fidelity's cost allocation methodology, and the impact of certain factors on fund profitability results; (viii) trends regarding industry use of performance fee structures and the possibility of implementing performance fee structures for additional funds; and (ix) the impact of net redemptions from the Fidelity funds.
Based on its evaluation of all of the conclusions noted above, and after considering all factors it believed relevant, the Board ultimately concluded that the advisory fee structures are fair and reasonable, and that the fund's Advisory Contracts should be renewed.
Semiannual Report
Investment Adviser
Fidelity Management & Research Company
Boston, MA
Investment Sub-Advisers
FMR Co., Inc.
Fidelity Management & Research
(U.K.) Inc.
Fidelity Management & Research
(Hong Kong) Limited
Fidelity Management & Research
(Japan) Inc.
General Distributor
Fidelity Distributors Corporation
Smithfield, RI
Transfer and Service Agents
Fidelity Investments Institutional
Operations Company, Inc.
Boston, MA
Fidelity Service Company, Inc.
Boston, MA
Custodian
JPMorgan Chase Bank
New York, NY
The Fidelity Telephone Connection
Mutual Fund 24-Hour Service
Exchanges/Redemptions
and Account Assistance 1-800-544-6666
Product Information 1-800-544-6666
Retirement Accounts 1-800-544-4774
(8 a.m. - 9 p.m.)
TDD Service 1-800-544-0118
for the deaf and hearing impaired
(9 a.m. - 9 p.m. Eastern time)
Fidelity Automated Service
Telephone (FAST®)
1-800-544-5555
Automated line for quickest service
(Fidelity Investment logo)(registered trademark)
Corporate Headquarters
82 Devonshire St., Boston, MA 02109
www.fidelity.com
GII-USAN-0213
1.787781.110
Fidelity®
Growth Discovery
Fund -
Class K
Semiannual Report
December 31, 2012
(Fidelity Cover Art)
Contents
Shareholder Expense Example | An example of shareholder expenses. | |
Investment Changes | A summary of major shifts in the fund's investments over the past six months. | |
Investments | A complete list of the fund's investments with their market values. | |
Financial Statements | Statements of assets and liabilities, operations, and changes in net assets, as well as financial highlights. | |
Notes | Notes to the financial statements. | |
Board Approval of Investment Advisory Contracts and Management Fees |
|
To view a fund's proxy voting guidelines and proxy voting record for the 12-month period ended June 30, visit http://www.fidelity.com/proxyvotingresults or visit the Securities and Exchange Commission's (SEC) web site at http://www.sec.gov. You may also call 1-800-835-5092 to request a free copy of the proxy voting guidelines.
Standard & Poor's, S&P and S&P 500 are registered service marks of The McGraw-Hill Companies, Inc. and have been licensed for use by Fidelity Distributors Corporation.
Other third party marks appearing herein are the property of their respective owners.
All other marks appearing herein are registered or unregistered trademarks or service marks of FMR LLC or an affiliated company. © 2013 FMR LLC. All rights reserved.
This report and the financial statements contained herein are submitted for the general information of the shareholders of the fund. This report is not authorized for distribution to prospective investors in the fund unless preceded or accompanied by an effective prospectus.
A fund files its complete schedule of portfolio holdings with the SEC for the first and third quarters of each fiscal year on Form N-Q. Forms N-Q are available on the SEC's web site at http://www.sec.gov. A fund's Forms N-Q may be reviewed and copied at the SEC's Public Reference Room in Washington, DC. Information regarding the operation of the SEC's Public Reference Room may be obtained by calling 1-800-SEC-0330. For a complete list of a fund's portfolio holdings, view the most recent holdings listing, semiannual report, or annual report on Fidelity's web site at http://www.fidelity.com, http://www.advisor.fidelity.com, or http://www.401k.com, as applicable.
NOT FDIC INSURED • MAY LOSE VALUE • NO BANK GUARANTEE
Neither the fund nor Fidelity Distributors Corporation is a bank.
Semiannual Report
Shareholder Expense Example
As a shareholder of the Fund, you incur two types of costs: (1) transaction costs, and (2) ongoing costs, including management fees and other Fund expenses. This Example is intended to help you understand your ongoing costs (in dollars) of investing in the Fund and to compare these costs with the ongoing costs of investing in other mutual funds.
The Example is based on an investment of $1,000 invested at the beginning of the period and held for the entire period (July 1, 2012 to December 31, 2012).
Actual Expenses
The first line of the accompanying table for each class of the Fund provides information about actual account values and actual expenses. You may use the information in this line, together with the amount you invested, to estimate the expenses that you paid over the period. Simply divide your account value by $1,000.00 (for example, an $8,600 account value divided by $1,000.00 = 8.6), then multiply the result by the number in the first line for a class of the Fund under the heading entitled "Expenses Paid During Period" to estimate the expenses you paid on your account during this period. A small balance maintenance fee of $12.00 that is charged once a year may apply for certain accounts with a value of less than $2,000. This fee is not included in the table below. If it was, the estimate of expenses you paid during the period would be higher, and your ending account value lower, by this amount. In addition, the Fund, as a shareholder in the underlying Fidelity Central Funds, will indirectly bear its pro-rata share of the fees and expenses incurred by the underlying Fidelity Central Funds. These fees and expenses are not included in the Fund's annualized expense ratio used to calculate the expense estimate in the table below.
Hypothetical Example for Comparison Purposes
The second line of the accompanying table for each class of the Fund provides information about hypothetical account values and hypothetical expenses based on a Class' actual expense ratio and an assumed rate of return of 5% per year before expenses, which is not the Class' actual return. The hypothetical account values and expenses may not be used to estimate the actual ending account balance or expenses you paid for the period. You may use this information to compare the ongoing costs of investing in the Fund and other funds. To do so, compare this 5% hypothetical example with the 5% hypothetical examples that appear in the shareholder reports of the other funds. A small balance maintenance fee of $12.00 that is charged once a year may apply for certain accounts with a value of less than $2,000. This fee is not included in the table below. If it was, the estimate of expenses you paid during the period would be higher, and your ending account value lower, by this amount. In addition, the Fund, as a shareholder in the underlying Fidelity Central Funds, will indirectly bear its pro-rata share of the fees and expenses incurred by the underlying Fidelity Central Funds. These fees and expenses are not included in the Fund's annualized expense ratio used to calculate the expense estimate in the table below.
Please note that the expenses shown in the table are meant to highlight your ongoing costs only and do not reflect any transaction costs. Therefore, the second line of the table is useful in comparing ongoing costs only, and will not help you determine the relative total costs of owning different funds.
Semiannual Report
Shareholder Expense Example - continued
| Annualized | Beginning | Ending | Expenses Paid |
Growth Discovery | .92% |
|
|
|
Actual |
| $ 1,000.00 | $ 1,036.50 | $ 4.72 |
Hypothetical A |
| $ 1,000.00 | $ 1,020.57 | $ 4.69 |
Class K | .76% |
|
|
|
Actual |
| $ 1,000.00 | $ 1,037.50 | $ 3.90 |
Hypothetical A |
| $ 1,000.00 | $ 1,021.37 | $ 3.87 |
A 5% return per year before expenses
* Expenses are equal to each Class' annualized expense ratio, multiplied by the average account value over the period, multiplied by 184/365 (to reflect the one-half year period).
Semiannual Report
Investment Changes (Unaudited)
Top Ten Stocks as of December 31, 2012 | ||
| % of fund's | % of fund's net assets |
Apple, Inc. | 11.1 | 11.4 |
Express Scripts Holding Co. | 3.1 | 1.7 |
Visa, Inc. Class A | 2.3 | 0.5 |
Home Depot, Inc. | 2.3 | 2.0 |
Harley-Davidson, Inc. | 2.2 | 2.1 |
The Coca-Cola Co. | 2.1 | 2.0 |
Facebook, Inc. Class A | 2.1 | 0.0 |
Google, Inc. Class A | 2.0 | 1.4 |
Monsanto Co. | 1.9 | 0.6 |
salesforce.com, Inc. | 1.7 | 1.2 |
| 30.8 | |
Top Five Market Sectors as of December 31, 2012 | ||
| % of fund's | % of fund's net assets |
Information Technology | 29.3 | 31.7 |
Consumer Discretionary | 19.2 | 18.3 |
Consumer Staples | 12.5 | 11.4 |
Health Care | 12.4 | 6.1 |
Industrials | 8.2 | 14.2 |
Asset Allocation (% of fund's net assets) | |||||||
As of December 31, 2012* | As of June 30, 2012** | ||||||
 | Stocks 99.1% |
| | Stocks 94.3% |
| ||
 | Short-Term |
| | Short-Term |
| ||
* Foreign investments | 12.1% |
| ** Foreign investments | 13.1% |
| ||

Semiannual Report
Investments December 31, 2012 (Unaudited)
Showing Percentage of Net Assets
Common Stocks - 99.1% | |||
Shares | Value (000s) | ||
CONSUMER DISCRETIONARY - 19.2% | |||
Automobiles - 2.7% | |||
Harley-Davidson, Inc. | 412,761 | $ 20,159 | |
Tesla Motors, Inc. (a) | 133,392 | 4,518 | |
| 24,677 | ||
Diversified Consumer Services - 1.2% | |||
Anhanguera Educacional Participacoes SA | 312,600 | 5,341 | |
Kroton Educacional SA (a) | 252,300 | 5,767 | |
| 11,108 | ||
Hotels, Restaurants & Leisure - 4.5% | |||
Arcos Dorados Holdings, Inc. Class A (d) | 216,980 | 2,595 | |
Chipotle Mexican Grill, Inc. (a) | 23,431 | 6,970 | |
Dunkin' Brands Group, Inc. (d) | 132,569 | 4,399 | |
McDonald's Corp. | 54,070 | 4,770 | |
Panera Bread Co. Class A (a) | 30,704 | 4,877 | |
Starbucks Corp. | 227,226 | 12,184 | |
Yum! Brands, Inc. | 76,996 | 5,113 | |
| 40,908 | ||
Household Durables - 0.7% | |||
Ethan Allen Interiors, Inc. | 32,604 | 838 | |
Mohawk Industries, Inc. (a) | 64,477 | 5,833 | |
| 6,671 | ||
Internet & Catalog Retail - 1.1% | |||
Amazon.com, Inc. (a) | 40,408 | 10,148 | |
Media - 1.4% | |||
Comcast Corp. Class A (special) (non-vtg.) | 177,421 | 6,378 | |
Discovery Communications, Inc. Class C (non-vtg.) (a) | 112,550 | 6,584 | |
| 12,962 | ||
Multiline Retail - 1.2% | |||
Dollarama, Inc. | 184,190 | 10,920 | |
Specialty Retail - 5.7% | |||
GNC Holdings, Inc. | 262,791 | 8,746 | |
Haverty Furniture Companies, Inc. | 1,900 | 31 | |
Home Depot, Inc. | 338,512 | 20,937 | |
PetSmart, Inc. | 69,941 | 4,780 | |
Ross Stores, Inc. | 104,966 | 5,684 | |
TJX Companies, Inc. | 142,418 | 6,046 | |
Vitamin Shoppe, Inc. (a) | 107,093 | 6,143 | |
| 52,367 | ||
Common Stocks - continued | |||
Shares | Value (000s) | ||
CONSUMER DISCRETIONARY - continued | |||
Textiles, Apparel & Luxury Goods - 0.7% | |||
lululemon athletica, Inc. (a) | 31,400 | $ 2,394 | |
NIKE, Inc. Class B | 81,326 | 4,196 | |
| 6,590 | ||
TOTAL CONSUMER DISCRETIONARY | 176,351 | ||
CONSUMER STAPLES - 12.5% | |||
Beverages - 3.3% | |||
Anheuser-Busch InBev SA NV ADR | 60,011 | 5,246 | |
SABMiller PLC | 129,700 | 6,020 | |
The Coca-Cola Co. | 534,960 | 19,392 | |
| 30,658 | ||
Food & Staples Retailing - 1.3% | |||
Costco Wholesale Corp. | 49,800 | 4,919 | |
Whole Foods Market, Inc. | 76,865 | 7,020 | |
| 11,939 | ||
Food Products - 3.5% | |||
Green Mountain Coffee Roasters, Inc. (a)(d) | 359,172 | 14,855 | |
Mead Johnson Nutrition Co. Class A | 112,300 | 7,399 | |
The Hershey Co. | 139,777 | 10,095 | |
| 32,349 | ||
Household Products - 1.2% | |||
Colgate-Palmolive Co. | 101,003 | 10,559 | |
Personal Products - 0.8% | |||
Herbalife Ltd. | 207,929 | 6,849 | |
Tobacco - 2.4% | |||
British American Tobacco PLC sponsored ADR | 79,300 | 8,029 | |
Philip Morris International, Inc. | 169,300 | 14,160 | |
| 22,189 | ||
TOTAL CONSUMER STAPLES | 114,543 | ||
ENERGY - 7.6% | |||
Energy Equipment & Services - 2.4% | |||
Cameron International Corp. (a) | 96,800 | 5,465 | |
Dresser-Rand Group, Inc. (a) | 90,905 | 5,103 | |
National Oilwell Varco, Inc. | 85,507 | 5,844 | |
Oceaneering International, Inc. | 112,349 | 6,043 | |
| 22,455 | ||
Common Stocks - continued | |||
Shares | Value (000s) | ||
ENERGY - continued | |||
Oil, Gas & Consumable Fuels - 5.2% | |||
Atlas Pipeline Partners LP | 126,363 | $ 3,989 | |
Cobalt International Energy, Inc. (a) | 85,100 | 2,090 | |
Concho Resources, Inc. (a) | 62,021 | 4,996 | |
Kosmos Energy Ltd. (a) | 349,011 | 4,310 | |
Markwest Energy Partners LP | 56,660 | 2,890 | |
Noble Energy, Inc. | 25,300 | 2,574 | |
Phillips 66 | 246,051 | 13,065 | |
Pioneer Natural Resources Co. | 40,500 | 4,317 | |
Targa Resources Corp. | 59,651 | 3,152 | |
Valero Energy Corp. | 183,007 | 6,244 | |
| 47,627 | ||
TOTAL ENERGY | 70,082 | ||
FINANCIALS - 3.3% | |||
Capital Markets - 0.6% | |||
Apollo Global Management LLC Class A | 62,004 | 1,076 | |
GP Investments Ltd. (depositary receipt) (a) | 144,694 | 378 | |
Invesco Ltd. | 153,221 | 3,998 | |
| 5,452 | ||
Consumer Finance - 0.4% | |||
Mahindra & Mahindra Financial Services Ltd. | 75,209 | 1,511 | |
Shriram Transport Finance Co. Ltd. | 161,708 | 2,245 | |
| 3,756 | ||
Insurance - 0.2% | |||
Berkshire Hathaway, Inc. Class B (a) | 21,600 | 1,938 | |
Real Estate Investment Trusts - 1.5% | |||
American Tower Corp. | 143,328 | 11,075 | |
Public Storage | 19,730 | 2,860 | |
| 13,935 | ||
Real Estate Management & Development - 0.6% | |||
Realogy Holdings Corp. | 127,334 | 5,343 | |
TOTAL FINANCIALS | 30,424 | ||
HEALTH CARE - 12.4% | |||
Biotechnology - 5.9% | |||
Amgen, Inc. | 95,100 | 8,209 | |
AVEO Pharmaceuticals, Inc. (a)(d) | 217,061 | 1,747 | |
Biogen Idec, Inc. (a) | 78,979 | 11,584 | |
Common Stocks - continued | |||
Shares | Value (000s) | ||
HEALTH CARE - continued | |||
Biotechnology - continued | |||
BioMarin Pharmaceutical, Inc. (a) | 119,876 | $ 5,904 | |
Biovitrum AB (a) | 366,426 | 2,074 | |
Cytokinetics, Inc. | 480,700 | 317 | |
Cytokinetics, Inc. warrants 6/25/17 (a) | 288,420 | 2 | |
Elan Corp. PLC sponsored ADR (a) | 360,168 | 3,677 | |
Gilead Sciences, Inc. (a) | 166,780 | 12,250 | |
Grifols SA ADR | 50,661 | 1,314 | |
Onyx Pharmaceuticals, Inc. (a) | 30,200 | 2,281 | |
Prothena Corp. PLC (a) | 8,784 | 64 | |
Regeneron Pharmaceuticals, Inc. (a) | 12,984 | 2,221 | |
Thrombogenics NV (a) | 38,697 | 2,154 | |
| 53,798 | ||
Health Care Equipment & Supplies - 0.4% | |||
The Cooper Companies, Inc. | 38,457 | 3,557 | |
Health Care Providers & Services - 3.6% | |||
Apollo Hospitals Enterprise Ltd. | 109,622 | 1,581 | |
Express Scripts Holding Co. (a) | 535,217 | 28,902 | |
Qualicorp SA (a) | 225,700 | 2,366 | |
| 32,849 | ||
Health Care Technology - 0.4% | |||
Cerner Corp. (a) | 53,880 | 4,183 | |
Pharmaceuticals - 2.1% | |||
Novo Nordisk A/S Series B | 48,377 | 7,878 | |
Valeant Pharmaceuticals International, Inc. (Canada) (a) | 188,411 | 11,240 | |
| 19,118 | ||
TOTAL HEALTH CARE | 113,505 | ||
INDUSTRIALS - 8.2% | |||
Aerospace & Defense - 2.6% | |||
Honeywell International, Inc. | 71,144 | 4,516 | |
Precision Castparts Corp. | 27,943 | 5,293 | |
TransDigm Group, Inc. | 54,658 | 7,453 | |
United Technologies Corp. | 77,408 | 6,348 | |
| 23,610 | ||
Building Products - 0.4% | |||
USG Corp. (a)(d) | 137,100 | 3,848 | |
Electrical Equipment - 1.8% | |||
Hubbell, Inc. Class B | 62,449 | 5,285 | |
Common Stocks - continued | |||
Shares | Value (000s) | ||
INDUSTRIALS - continued | |||
Electrical Equipment - continued | |||
Regal-Beloit Corp. | 41,659 | $ 2,936 | |
Roper Industries, Inc. | 73,385 | 8,181 | |
| 16,402 | ||
Industrial Conglomerates - 0.6% | |||
Danaher Corp. | 96,892 | 5,416 | |
Machinery - 0.3% | |||
Graco, Inc. | 46,623 | 2,401 | |
Professional Services - 2.0% | |||
Equifax, Inc. | 217,903 | 11,793 | |
Verisk Analytics, Inc. (a) | 134,467 | 6,858 | |
| 18,651 | ||
Trading Companies & Distributors - 0.5% | |||
Beacon Roofing Supply, Inc. (a) | 72,500 | 2,413 | |
W.W. Grainger, Inc. | 11,239 | 2,274 | |
| 4,687 | ||
TOTAL INDUSTRIALS | 75,015 | ||
INFORMATION TECHNOLOGY - 29.3% | |||
Communications Equipment - 1.4% | |||
QUALCOMM, Inc. | 196,936 | 12,214 | |
Computers & Peripherals - 12.5% | |||
Apple, Inc. | 190,802 | 101,702 | |
SanDisk Corp. (a) | 296,778 | 12,928 | |
| 114,630 | ||
Internet Software & Services - 6.7% | |||
Bankrate, Inc. (a) | 137,185 | 1,708 | |
Blucora, Inc. (a) | 172,485 | 2,710 | |
CoStar Group, Inc. (a) | 29,550 | 2,641 | |
eBay, Inc. (a) | 176,922 | 9,027 | |
Facebook, Inc. Class A | 722,691 | 19,245 | |
Google, Inc. Class A (a) | 25,323 | 17,963 | |
MercadoLibre, Inc. (d) | 61,158 | 4,805 | |
SPS Commerce, Inc. (a) | 81,291 | 3,030 | |
| 61,129 | ||
IT Services - 2.8% | |||
Heartland Payment Systems, Inc. | 150,904 | 4,452 | |
Visa, Inc. Class A | 141,460 | 21,443 | |
| 25,895 | ||
Common Stocks - continued | |||
Shares | Value (000s) | ||
INFORMATION TECHNOLOGY - continued | |||
Semiconductors & Semiconductor Equipment - 0.5% | |||
Avago Technologies Ltd. | 151,609 | $ 4,800 | |
Software - 5.4% | |||
ANSYS, Inc. (a) | 27,412 | 1,846 | |
Citrix Systems, Inc. (a) | 146,959 | 9,663 | |
Computer Modelling Group Ltd. | 130,500 | 2,797 | |
FleetMatics Group PLC | 20,300 | 511 | |
Intuit, Inc. | 72,193 | 4,295 | |
salesforce.com, Inc. (a) | 92,766 | 15,594 | |
SolarWinds, Inc. (a) | 143,527 | 7,528 | |
VMware, Inc. Class A (a) | 68,075 | 6,409 | |
Workday, Inc. | 12,500 | 681 | |
| 49,324 | ||
TOTAL INFORMATION TECHNOLOGY | 267,992 | ||
MATERIALS - 4.6% | |||
Chemicals - 3.5% | |||
FMC Corp. | 134,346 | 7,862 | |
Monsanto Co. | 185,042 | 17,514 | |
Sherwin-Williams Co. | 42,100 | 6,476 | |
| 31,852 | ||
Construction Materials - 0.8% | |||
James Hardie Industries NV sponsored ADR | 66,400 | 3,236 | |
Vulcan Materials Co. | 87,866 | 4,573 | |
| 7,809 | ||
Paper & Forest Products - 0.3% | |||
Norbord, Inc. (a) | 86,900 | 2,637 | |
TOTAL MATERIALS | 42,298 | ||
TELECOMMUNICATION SERVICES - 1.0% | |||
Wireless Telecommunication Services - 1.0% | |||
SBA Communications Corp. Class A (a) | 125,112 | 8,885 | |
UTILITIES - 1.0% | |||
Electric Utilities - 1.0% | |||
ITC Holdings Corp. | 121,831 | 9,370 | |
TOTAL COMMON STOCKS (Cost $746,184) |
| ||
Money Market Funds - 2.9% | |||
Shares | Value (000s) | ||
Fidelity Cash Central Fund, 0.18% (b) | 12,055,853 | $ 12,056 | |
Fidelity Securities Lending Cash Central Fund, 0.18% (b)(c) | 14,281,807 | 14,282 | |
TOTAL MONEY MARKET FUNDS (Cost $26,338) |
| ||
TOTAL INVESTMENT PORTFOLIO - 102.0% (Cost $772,522) | 934,803 | ||
NET OTHER ASSETS (LIABILITIES) - (2.0)% | (18,637) | ||
NET ASSETS - 100% | $ 916,166 | ||
Legend |
(a) Non-income producing |
(b) Affiliated fund that is available only to investment companies and other accounts managed by Fidelity Investments. The rate quoted is the annualized seven-day yield of the fund at period end. A complete unaudited listing of the fund's holdings as of its most recent quarter end is available upon request. In addition, each Fidelity Central Fund's financial statements are available on the SEC's website or upon request. |
(c) Investment made with cash collateral received from securities on loan. |
(d) Security or a portion of the security is on loan at period end. |
Affiliated Central Funds |
Information regarding fiscal year to date income earned by the Fund from investments in Fidelity Central Funds is as follows: |
Fund | Income earned |
Fidelity Cash Central Fund | $ 24 |
Fidelity Securities Lending Cash Central Fund | 661 |
Total | $ 685 |
Other Information |
The following is a summary of the inputs used, as of December 31, 2012, involving the Fund's assets and liabilities carried at fair value. The inputs or methodology used for valuing securities may not be an indication of the risk associated with investing in those securities. For more information on valuation inputs, and their aggregation into the levels used in the table below, please refer to the Investment Valuation section in the accompanying Notes to Financial Statements. |
Valuation Inputs at Reporting Date: | ||||
Description | Total | Level 1 | Level 2 | Level 3 |
Investments in Securities: | ||||
Equities: | ||||
Consumer Discretionary | $ 176,351 | $ 165,243 | $ 11,108 | $ - |
Consumer Staples | 114,543 | 108,523 | 6,020 | - |
Energy | 70,082 | 70,082 | - | - |
Financials | 30,424 | 26,290 | 4,134 | - |
Health Care | 113,505 | 97,450 | 16,055 | - |
Industrials | 75,015 | 75,015 | - | - |
Information Technology | 267,992 | 267,992 | - | - |
Materials | 42,298 | 42,298 | - | - |
Telecommunication Services | 8,885 | 8,885 | - | - |
Utilities | 9,370 | 9,370 | - | - |
Money Market Funds | 26,338 | 26,338 | - | - |
Total Investments in Securities: | $ 934,803 | $ 897,486 | $ 37,317 | $ - |
Distribution of investments by country or territory of incorporation, as a percentage of total net assets, is as follows. (Unaudited) |
United States of America | 87.9% |
Canada | 3.0% |
United Kingdom | 1.5% |
Brazil | 1.5% |
Bermuda | 1.0% |
Others (Individually Less Than 1%) | 5.1% |
| 100.0% |
See accompanying notes which are an integral part of the financial statements.
Semiannual Report
Financial Statements
Statement of Assets and Liabilities
Amounts in thousands (except per-share amounts) | December 31, 2012 (Unaudited) | |
|
|
|
Assets | ||
Investment in securities, at value (including securities loaned of $14,260) - See accompanying schedule: Unaffiliated issuers (cost $746,184) | $ 908,465 |
|
Fidelity Central Funds (cost $26,338) | 26,338 |
|
Total Investments (cost $772,522) |
| $ 934,803 |
Receivable for investments sold | 247 | |
Receivable for fund shares sold | 1,138 | |
Dividends receivable | 257 | |
Distributions receivable from Fidelity Central Funds | 62 | |
Prepaid expenses | 3 | |
Other receivables | 100 | |
Total assets | 936,610 | |
|
|
|
Liabilities | ||
Payable for fund shares redeemed | $ 5,459 | |
Accrued management fee | 488 | |
Other affiliated payables | 177 | |
Other payables and accrued expenses | 38 | |
Collateral on securities loaned, at value | 14,282 | |
Total liabilities | 20,444 | |
|
|
|
Net Assets | $ 916,166 | |
Net Assets consist of: |
| |
Paid in capital | $ 1,305,646 | |
Distributions in excess of net investment income | (10) | |
Accumulated undistributed net realized gain (loss) on investments and foreign currency transactions | (551,743) | |
Net unrealized appreciation (depreciation) on investments and assets and liabilities in foreign currencies | 162,273 | |
Net Assets | $ 916,166 | |
See accompanying notes which are an integral part of the financial statements.
Semiannual Report
Financial Statements - continued
Statement of Assets and Liabilities - continued
Amounts in thousands (except per-share amounts) | December 31, 2012 (Unaudited) | |
|
|
|
Growth Discovery: | $ 15.58 | |
|
|
|
Class K: | $ 15.57 | |
See accompanying notes which are an integral part of the financial statements.
Semiannual Report
Statement of Operations
Amounts in thousands | Six months ended December 31, 2012 (Unaudited) | |
|
|
|
Investment Income |
|
|
Dividends |
| $ 6,629 |
Income from Fidelity Central Funds (including $661 from security lending) |
| 685 |
Total income |
| 7,314 |
|
|
|
Expenses | ||
Management fee | $ 2,758 | |
Performance adjustment | 484 | |
Transfer agent fees | 941 | |
Accounting and security lending fees | 168 | |
Custodian fees and expenses | 23 | |
Independent trustees' compensation | 3 | |
Registration fees | 32 | |
Audit | 32 | |
Legal | 5 | |
Miscellaneous | 4 | |
Total expenses before reductions | 4,450 | |
Expense reductions | (84) | 4,366 |
Net investment income (loss) | 2,948 | |
Realized and Unrealized Gain (Loss) Net realized gain (loss) on: | ||
Investment securities: |
|
|
Unaffiliated issuers | 22,204 | |
Foreign currency transactions | 8 | |
Total net realized gain (loss) |
| 22,212 |
Change in net unrealized appreciation (depreciation) on: Investment securities | 11,491 | |
Assets and liabilities in foreign currencies | (1) | |
Total change in net unrealized appreciation (depreciation) |
| 11,490 |
Net gain (loss) | 33,702 | |
Net increase (decrease) in net assets resulting from operations | $ 36,650 | |
See accompanying notes which are an integral part of the financial statements.
Semiannual Report
Financial Statements - continued
Statement of Changes in Net Assets
Amounts in thousands | Six months ended | Year ended |
Increase (Decrease) in Net Assets |
|
|
Operations |
|
|
Net investment income (loss) | $ 2,948 | $ 3,074 |
Net realized gain (loss) | 22,212 | 13,743 |
Change in net unrealized appreciation (depreciation) | 11,490 | (767) |
Net increase (decrease) in net assets resulting | 36,650 | 16,050 |
Distributions to shareholders from net investment income | (3,920) | (2,613) |
Distributions to shareholders from net realized gain | - | (4,056) |
Total distributions | (3,920) | (6,669) |
Share transactions - net increase (decrease) | (135,199) | (69,861) |
Total increase (decrease) in net assets | (102,469) | (60,480) |
|
|
|
Net Assets | ||
Beginning of period | 1,018,635 | 1,079,115 |
End of period (including distributions in excess of net investment income of $10 and undistributed net investment income of $962, respectively) | $ 916,166 | $ 1,018,635 |
See accompanying notes which are an integral part of the financial statements.
Semiannual Report
Financial Highlights - Growth Discovery
| Six months ended December 31, 2012 | Years ended June 30, | ||||
| (Unaudited) | 2012 | 2011 | 2010 | 2009 | 2008 |
Selected Per-Share Data |
|
|
|
|
|
|
Net asset value, beginning of period | $ 15.09 | $ 14.88 | $ 10.54 | $ 9.04 | $ 14.61 | $ 14.36 |
Income from Investment Operations |
|
|
|
|
|
|
Net investment income (loss) D | .04 | .04 | .05 | .01 | .04 | .09 |
Net realized and unrealized gain (loss) | .51 | .26 | 4.37 | 1.52 | (5.54) | .20 |
Total from investment operations | .55 | .30 | 4.42 | 1.53 | (5.50) | .29 |
Distributions from net investment income | (.06) | (.03) | (.03) | (.03) | (.07) | (.04) |
Distributions from net realized gain | - | (.06) | (.05) | (.01) | - | - |
Total distributions | (.06) | (.09) | (.08) | (.03) H | (.07) | (.04) |
Net asset value, end of period | $ 15.58 | $ 15.09 | $ 14.88 | $ 10.54 | $ 9.04 | $ 14.61 |
Total Return B,C | 3.65% | 2.07% | 42.09% | 16.96% | (37.75)% | 1.98% |
Ratios to Average Net Assets E,G | ||||||
Expenses before reductions | .92% A | .81% | .63% | .76% | .90% | .91% |
Expenses net of fee waivers, if any | .92% A | .81% | .63% | .76% | .90% | .91% |
Expenses net of all reductions | .90% A | .80% | .62% | .75% | .89% | .90% |
Net investment income (loss) | .57% A | .27% | .39% | .08% | .36% | .57% |
Supplemental Data |
|
|
|
|
|
|
Net assets, end of period (in millions) | $ 794 | $ 875 | $ 932 | $ 604 | $ 777 | $ 1,768 |
Portfolio turnover rate F | 64% A | 74% | 72% | 87% | 166% | 150% |
A Annualized
B Total returns for periods of less than one year are not annualized.
C Total returns would have been lower if certain expenses had not been reduced during the applicable periods shown.
D Calculated based on average shares outstanding during the period.
E Fees and expenses of any underlying Fidelity Central Funds are not included in the Fund's expense ratio. The Fund indirectly bears its proportionate share of the expenses of any underlying Fidelity Central Funds.
F Amount does not include the portfolio activity of any underlying Fidelity Central Funds.
G Expense ratios reflect operating expenses of the class. Expenses before reductions do not reflect amounts reimbursed by the investment adviser or reductions from brokerage service arrangements or reductions from other expense offset arrangements and do not represent the amount paid by the class during periods when reimbursements or reductions occur. Expenses net of fee waivers reflect expenses after reimbursement by the investment adviser but prior to reductions from brokerage service arrangements or other expense offset arrangements. Expenses net of all reductions represent the net expenses paid by the class.
H Total distributions of $.03 per share is comprised of distributions from net investment income of $.027 and distributions from net realized gain of $.005 per share.
See accompanying notes which are an integral part of the financial statements.
Semiannual Report
Financial Highlights - Class K
| Six months ended December 31, 2012 | Years ended June 30, | ||||
| (Unaudited) | 2012 | 2011 | 2010 | 2009 | 2008 G |
Selected Per-Share Data | ||||||
Net asset value, beginning of period | $ 15.09 | $ 14.88 | $ 10.55 | $ 9.05 | $ 14.62 | $ 14.94 |
Income from Investment Operations |
|
|
|
|
|
|
Net investment income (loss) D | .06 | .06 | .08 | .03 | .05 | .03 |
Net realized and unrealized gain (loss) | .51 | .26 | 4.36 | 1.53 | (5.53) | (.35) |
Total from investment operations | .57 | .32 | 4.44 | 1.56 | (5.48) | (.32) |
Distributions from net investment income | (.09) | (.06) | (.06) | (.05) | (.09) | - |
Distributions from net realized gain | - | (.06) | (.05) | (.01) | - | - |
Total distributions | (.09) | (.11) J | (.11) | (.06) I | (.09) | - |
Net asset value, end of period | $ 15.57 | $ 15.09 | $ 14.88 | $ 10.55 | $ 9.05 | $ 14.62 |
Total Return B,C | 3.75% | 2.27% | 42.26% | 17.25% | (37.60)% | (2.14)% |
Ratios to Average Net Assets E,H | ||||||
Expenses before reductions | .76% A | .64% | .44% | .53% | .67% | .76% A |
Expenses net of fee waivers, if any | .76% A | .64% | .44% | .53% | .67% | .76% A |
Expenses net of all reductions | .74% A | .63% | .43% | .52% | .67% | .75% A |
Net investment income (loss) | .74% A | .44% | .58% | .31% | .59% | 1.44% A |
Supplemental Data |
|
|
|
|
|
|
Net assets, end of period (000 omitted) | $ 122,222 | $ 143,956 | $ 146,740 | $ 42,570 | $ 30,939 | $ 98 |
Portfolio turnover rate F | 64% A | 74% | 72% | 87% | 166% | 150% |
A Annualized
B Total returns for periods of less than one year are not annualized.
C Total returns would have been lower if certain expenses had not been reduced during the applicable periods shown.
D Calculated based on average shares outstanding during the period.
E Fees and expenses of any underlying Fidelity Central Funds are not included in the Fund's expense ratio. The Fund indirectly bears its proportionate share of the expenses of any underlying Fidelity Central Funds.
F Amount does not include the portfolio activity of any underlying Fidelity Central Funds.
G For the period May 9, 2008 (commencement of sale of shares) to June 30, 2008.
H Expense ratios reflect operating expenses of the class. Expenses before reductions do not reflect amounts reimbursed by the investment adviser or reductions from brokerage service arrangements or reductions from other expense offset arrangements and do not represent the amount paid by the class during periods when reimbursements or reductions occur. Expense ratios before reductions for start-up periods may not be representative of longer-term operating periods. Expenses net of fee waivers reflect expenses after reimbursement by the investment adviser but prior to reductions from brokerage service arrangements or other expense offset arrangements. Expenses net of all reductions represent the net expenses paid by the class.
I Total distributions of $.06 per share is comprised of distributions from net investment income of $.054 and distributions from net realized gain of $.005 per share.
J Total distributions of $.11 per share is comprised of distributions from net investment income of $.058 and distributions from net realized gain of $.055 per share.
See accompanying notes which are an integral part of the financial statements.
Semiannual Report
Notes to Financial Statements
For the period ended December 31, 2012 (Unaudited)
(Amounts in thousands except percentages)
1. Organization.
Fidelity® Growth Discovery Fund (the Fund) is a fund of Fidelity Hastings Street Trust (the Trust) and is authorized to issue an unlimited number of shares. The Trust is registered under the Investment Company Act of 1940, as amended (the 1940 Act), as an open-end management investment company organized as a Massachusetts business trust. The Fund offers Growth Discovery and Class K shares, each of which has equal rights as to assets and voting privileges. Each class has exclusive voting rights with respect to matters that affect that class. Investment income, realized and unrealized capital gains and losses, the common expenses of the Fund, and certain fund-level expense reductions, if any, are allocated on a pro-rata basis to each class based on the relative net assets of each class to the total net assets of the Fund. Each class differs with respect to transfer agent fees incurred. Certain expense reductions may also differ by class.
2. Investments in Fidelity Central Funds.
The Fund invests in Fidelity Central Funds, which are open-end investment companies available only to other investment companies and accounts managed by Fidelity Management & Research Company (FMR) and its affiliates. The Fund's Schedule of Investments lists each of the Fidelity Central Funds held as of period end, if any, as an investment of the Fund, but does not include the underlying holdings of each Fidelity Central Fund. As an Investing Fund, the Fund indirectly bears its proportionate share of the expenses of the underlying Fidelity Central Funds.
The Money Market Central Funds seek preservation of capital and current income and are managed by Fidelity Investments Money Management, Inc. (FIMM), an affiliate of FMR.
A complete unaudited list of holdings for each Fidelity Central Fund is available upon request or at the Securities and Exchange Commission (the SEC) website at www.sec.gov. In addition, the financial statements of the Fidelity Central Funds are available on the SEC website or upon request.
3. Significant Accounting Policies.
The financial statements have been prepared in conformity with accounting principles generally accepted in the United States of America (GAAP), which require management to make certain estimates and assumptions at the date of the financial statements. Actual results could differ from those estimates. Subsequent events, if any, through the date that the financial statements were issued have been evaluated in the preparation of the financial statements. The following summarizes the significant accounting policies of the Fund:
Investment Valuation. Investments are valued as of 4:00 p.m. Eastern time on the last calendar day of the period. In accordance with valuation policies and procedures approved by the Board of Trustees (the Board), the Fund attempts to obtain prices from
Semiannual Report
3. Significant Accounting Policies - continued
Investment Valuation - continued
one or more third party pricing vendors or brokers to value its investments. When current market prices, quotations or rates are not readily available or reliable, investments will be fair valued in good faith by the FMR Fair Value Committee (the Committee), in accordance with procedures adopted by the Fund's Board. Factors used in determining fair value vary by investment type and may include market or investment specific events. The frequency with which these procedures are used cannot be predicted and they may be utilized to a significant extent. The Committee oversees the Fund's valuation policies and procedures and is responsible for approving and reporting to the Board all fair value determinations.
The Fund categorizes the inputs to valuation techniques used to value its investments into a disclosure hierarchy consisting of three levels as shown below:
Level 1 - quoted prices in active markets for identical investments
Level 2 - other significant observable inputs (including quoted prices for similar investments, interest rates, prepayment speeds, etc.)
Level 3 - unobservable inputs (including the Fund's own assumptions based on the best information available)
Valuation techniques used to value the Fund's investments by major category are as follows:
Equity securities, including restricted securities, for which market quotations are readily available, are valued at the last reported sale price or official closing price as reported by a third party pricing vendor on the primary market or exchange on which they are traded and are categorized as Level 1 in the hierarchy. In the event there were no sales during the day or closing prices are not available, securities are valued at the last quoted bid price or may be valued using the last available price and are generally categorized as Level 2 in the hierarchy. For foreign equity securities, when significant market or security specific events arise, comparisons to the valuation of American Depositary Receipts (ADRs), futures contracts, Exchange-Traded Funds (ETFs) and certain indexes as well as quoted prices for similar securities are used and are categorized as Level 2 in the hierarchy. Utilizing these techniques may result in transfers between Level 1 and Level 2.
Investments in open-end mutual funds, including the Fidelity Central Funds, are valued at their closing net asset value (NAV) each business day and are categorized as Level 1 in the hierarchy.
Semiannual Report
Notes to Financial Statements (Unaudited) - continued
(Amounts in thousands except percentages)
3. Significant Accounting Policies - continued
Investment Valuation - continued
Changes in valuation techniques may result in transfers in or out of an assigned level within the disclosure hierarchy. The aggregate value of investments by input level, as of December 31, 2012, is included at the end of the Fund's Schedule of Investments.
Foreign Currency. The Fund may use foreign currency contracts to facilitate transactions in foreign-denominated securities. Gains and losses from these transactions may arise from changes in the value of the foreign currency or if the counterparties do not perform under the contracts' terms.
Foreign-denominated assets, including investment securities, and liabilities are translated into U.S. dollars at the exchange rates at period end. Purchases and sales of investment securities, income and dividends received and expenses denominated in foreign currencies are translated into U.S. dollars at the exchange rate in effect on the transaction date.
The effects of exchange rate fluctuations on investments are included with the net realized and unrealized gain (loss) on investment securities. Other foreign currency transactions resulting in realized and unrealized gain (loss) are disclosed separately.
Investment Transactions and Income. For financial reporting purposes, the Fund's investment holdings and NAV include trades executed through the end of the last business day of the period. The NAV per share for processing shareholder transactions is calculated as of the close of business of the New York Stock Exchange (NYSE), normally 4:00 p.m. Eastern time and includes trades executed through the end of the prior business day. Gains and losses on securities sold are determined on the basis of identified cost and may include proceeds received from litigation. Dividend income is recorded on the ex-dividend date, except for certain dividends from foreign securities where the ex-dividend date may have passed, which are recorded as soon as the Fund is informed of the ex-dividend date. Non-cash dividends included in dividend income, if any, are recorded at the fair market value of the securities received. Distributions received on securities that represent a return of capital or capital gain are recorded as a reduction of cost of investments and/or as a realized gain. The Fund estimates the components of distributions received that may be considered return of capital distributions or capital gain distributions. Interest income and distributions from the Fidelity Central Funds are accrued as earned. Investment income is recorded net of foreign taxes withheld where recovery of such taxes is uncertain.
Expenses. Expenses directly attributable to a fund are charged to that fund. Expenses attributable to more than one fund are allocated among the respective funds on the basis of relative net assets or other appropriate methods. Expense estimates are accrued in the period to which they relate and adjustments are made when actual amounts are known.
Semiannual Report
3. Significant Accounting Policies - continued
Income Tax Information and Distributions to Shareholders. Each year, the Fund intends to qualify as a regulated investment company under Subchapter M of the Internal Revenue Code, including distributing substantially all of its taxable income and realized gains. As a result, no provision for income taxes is required. The Fund files a U.S. federal tax return, in addition to state and local tax returns as required. A fund's federal income tax returns are subject to examination by the Internal Revenue Service (IRS) for a period of three fiscal years after they are filed. State and local tax returns may be subject to examination for an additional fiscal year depending on the jurisdiction. Foreign taxes are provided for based on the Fund's understanding of the tax rules and rates that exist in the foreign markets in which it invests.
Distributions are declared and recorded on the ex-dividend date. Income dividends and capital gain distributions are declared separately for each class. Income and capital gain distributions are determined in accordance with income tax regulations, which may differ from GAAP.
Capital accounts within the financial statements are adjusted for permanent book-tax differences. These adjustments have no impact on net assets or the results of operations. Temporary book-tax differences will reverse in a subsequent period.
Book-tax differences are primarily due to foreign currency transactions, passive foreign investment companies (PFIC), partnerships, capital loss carryforwards and losses deferred due to wash sales and excise tax regulations.
The federal tax cost of investment securities and unrealized appreciation (depreciation) as of period end were as follows:
Gross unrealized appreciation | $ 181,917 |
Gross unrealized depreciation | (22,349) |
Net unrealized appreciation (depreciation) on securities and other investments | $ 159,568 |
|
|
Tax cost | $ 775,235 |
Capital loss carryforwards are only available to offset future capital gains of the Fund to the extent provided by regulations and may be limited. Under the Regulated Investment Company Modernization Act of 2010 (the Act), the Fund is permitted to carry forward capital losses incurred in taxable years beginning after December 22, 2010 for an unlimited period and such capital losses are required to be used prior to any losses that expire. At June 30, 2012, capital loss carryforwards were as follows:
Fiscal year of expiration |
|
2017 | $ (279,867) |
2018 | (260,431) |
Total capital loss carryforward | $ (540,298) |
Semiannual Report
Notes to Financial Statements (Unaudited) - continued
(Amounts in thousands except percentages)
3. Significant Accounting Policies - continued
Income Tax Information and Distributions to Shareholders - continued
The Fund intends to elect to defer to its fiscal year ending June 30, 2013 approximately $31,085 of capital losses recognized during the period November 1, 2011 to June 30, 2012.
4. Purchases and Sales of Investments.
Purchases and sales of securities, other than short-term securities, aggregated $306,905 and $392,897, respectively.
5. Fees and Other Transactions with Affiliates.
Management Fee. FMR and its affiliates provide the Fund with investment management related services for which the Fund pays a monthly management fee. The management fee is the sum of an individual fund fee rate that is based on an annual rate of .30% of the Fund's average net assets and an annualized group fee rate that averaged .26% during the period. The group fee rate is based upon the average net assets of all the mutual funds advised by FMR. The group fee rate decreases as assets under management increase and increases as assets under management decrease. In addition, the management fee is subject to a performance adjustment (up to a maximum of ± .20% of the Fund's average net assets over a 36 month performance period). The upward or downward adjustment to the management fee is based on the relative investment performance of Growth Discovery as compared to an appropriate benchmark index. For the period, the total annualized management fee rate, including the performance adjustment, was .65% of the Fund's average net assets.
Transfer Agent Fees. Fidelity Investments Institutional Operations Company, Inc. (FIIOC), an affiliate of FMR, is the transfer, dividend disbursing and shareholder servicing agent for each class of the Fund. FIIOC receives account fees and asset-based fees that vary according to the account size and type of account of the shareholders of Growth Discovery. FIIOC receives an asset-based fee of Class K's average net assets. FIIOC pays for typesetting, printing and mailing of shareholder reports, except proxy statements. For the period, transfer agent fees for each class were as follows:
| Amount | % of |
Growth Discovery | $ 909 | .21 |
Class K | 32 | .05 |
| $ 941 |
|
* Annualized
Semiannual Report
5. Fees and Other Transactions with Affiliates - continued
Accounting and Security Lending Fees. Fidelity Service Company, Inc. (FSC), an affiliate of FMR, maintains the Fund's accounting records. The accounting fee is based on the level of average net assets for each month. Under a separate contract, FSC administers the security lending program. The security lending fee is based on the number and duration of lending transactions.
Brokerage Commissions. The Fund placed a portion of its portfolio transactions with brokerage firms which are affiliates of the investment adviser. The commissions paid to these affiliated firms were $5 for the period.
Interfund Lending Program. Pursuant to an Exemptive Order issued by the SEC, the Fund, along with other registered investment companies having management contracts with FMR, may participate in an interfund lending program. This program provides an alternative credit facility allowing the funds to borrow from, or lend money to, other participating affiliated funds. At period end, there were no interfund loans outstanding. The Fund's activity in this program during the period for which loans were outstanding was as follows:
Borrower or Lender | Average Loan | Weighted Average Interest Rate | Interest Expense |
Borrower | $ 5,022 | .43% | $ -* |
* Amount represents two hundred ninety-nine dollars
6. Committed Line of Credit.
The Fund participates with other funds managed by FMR or an affiliate in a $4.25 billion credit facility (the "line of credit") to be utilized for temporary or emergency purposes to fund shareholder redemptions or for other short-term liquidity purposes. The Fund has agreed to pay commitment fees on its pro-rata portion of the line of credit, which amounted to $1 and is reflected in Miscellaneous expenses on the Statement of Operations. During the period, there were no borrowings on this line of credit.
7. Security Lending.
The Fund lends portfolio securities through a lending agent from time to time in order to earn additional income. For equity securities, a lending agent is used and may loan securities to certain qualified borrowers, including Fidelity Capital Markets (FCM), a broker-dealer affiliated with the Fund. On the settlement date of the loan, the Fund receives collateral (in the form of U.S. Treasury obligations, letters of credit and/or cash) against the loaned securities and maintains collateral in an amount not less than 100% of the market value of the loaned securities during the period of the loan. The market value of the loaned securities is determined at the close of business of the Fund and any
Semiannual Report
Notes to Financial Statements (Unaudited) - continued
(Amounts in thousands except percentages)
7. Security Lending - continued
additional required collateral is delivered to the Fund on the next business day. If the borrower defaults on its obligation to return the securities loaned because of insolvency or other reasons, a fund could experience delays and costs in recovering the securities loaned or in gaining access to the collateral. Any cash collateral received is invested in the Fidelity Securities Lending Cash Central Fund. The value of loaned securities and cash collateral at period end are disclosed on the Fund's Statement of Assets and Liabilities. The value of securities loaned to FCM at period end was $1,062. Security lending income represents the income earned on investing cash collateral, less rebates paid to borrowers and any lending agent fees associated with the loan, plus any premium payments received for lending certain types of securities. Security lending income is presented in the Statement of Operations as a component of income from Fidelity Central Funds, and includes $171 from securities loaned to FCM.
8. Expense Reductions.
Many of the brokers with whom FMR places trades on behalf of the Fund provided services to the Fund in addition to trade execution. These services included payments of certain expenses on behalf of the Fund totaling $84 for the period.
9. Distributions to Shareholders.
Distributions to shareholders of each class were as follows:
| Six months ended | Year ended |
From net investment income |
|
|
Growth Discovery | $ 3,196 | $ 2,023 |
Class K | 724 | 590 |
Total | $ 3,920 | $ 2,613 |
From net realized gain |
|
|
Growth Discovery | $ - | $ 3,518 |
Class K | - | 538 |
Total | $ - | $ 4,056 |
Semiannual Report
10. Share Transactions.
Transactions for each class of shares were as follows:
| Shares | Dollars | ||
| Six months ended | Year ended | Six months ended | Year ended |
Growth Discovery |
|
|
|
|
Shares sold | 3,118 | 15,041 | $ 48,600 | $ 218,798 |
Reinvestment of distributions | 198 | 395 | 3,039 | 5,284 |
Shares redeemed | (10,322) | (20,132) | (159,657) | (287,440) |
Net increase (decrease) | (7,006) | (4,696) | $ (108,018) | $ (63,358) |
Class K |
|
|
|
|
Shares sold | 1,878 | 5,792 | $ 28,901 | $ 82,594 |
Reinvestment of distributions | 47 | 84 | 724 | 1,128 |
Shares redeemed | (3,613) | (6,196) | (56,806) | (90,225) |
Net increase (decrease) | (1,688) | (320) | $ (27,181) | $ (6,503) |
11. Other.
The Fund's organizational documents provide former and current trustees and officers with a limited indemnification against liabilities arising in connection with the performance of their duties to the Fund. In the normal course of business, the Fund may also enter into contracts that provide general indemnifications. The Fund's maximum exposure under these arrangements is unknown as this would be dependent on future claims that may be made against the Fund. The risk of material loss from such claims is considered remote.
Semiannual Report
Board Approval of Investment Advisory Contracts and Management Fees
Fidelity Growth Discovery Fund
Each year, the Board of Trustees, including the Independent Trustees (together, the Board), votes on the renewal of the management contract and sub-advisory agreements (together, the Advisory Contracts) for the fund. The Board, assisted by the advice of fund counsel and Independent Trustees' counsel, requests and considers a broad range of information relevant to the renewal of the Advisory Contracts throughout the year.
The Board meets regularly and, at each of its meetings, considers factors that are relevant to its annual consideration of the renewal of the fund's Advisory Contracts, including the services and support provided to the fund and its shareholders. The Board has established various standing committees, each composed of and chaired by Independent Trustees with varying backgrounds, to which the Board has assigned specific subject matter responsibilities in order to enhance effective decision-making by the Board. The Board, acting directly and through its Committees, requests and receives information concerning the annual consideration of the renewal of the fund's Advisory Contracts. The Board also meets as needed to consider matters specifically related to the Board's annual consideration of the renewal of Advisory Contracts. Members of the Board may also meet with trustees of other Fidelity funds through ad hoc joint committees to discuss certain matters relevant to the Fidelity funds.
At its July 2012 meeting, the Board of Trustees, including the Independent Trustees, unanimously determined to renew the fund's Advisory Contracts. In reaching its determination, the Board considered all factors it believed relevant, including (i) the nature, extent, and quality of the services to be provided to the fund and its shareholders (including the investment performance of the fund); (ii) the competitiveness of the fund's management fee and total expense ratio relative to peer funds; (iii) the total costs of the services to be provided by and the profits to be realized by Fidelity from its relationship with the fund; (iv) the extent to which economies of scale exist and would be realized as the fund grows; and (v) whether fee levels reflect these economies of scale, if any, for the benefit of fund shareholders.
In considering whether to renew the Advisory Contracts for the fund, the Board reached a determination, with the assistance of fund counsel and Independent Trustees' counsel and through the exercise of its business judgment, that the renewal of the Advisory Contracts is in the best interests of the fund and its shareholders and that the compensation payable under the Advisory Contracts is fair and reasonable. The Board's decision to renew the Advisory Contracts was not based on any single factor, but rather was based on a comprehensive consideration of all the information provided to the Board at its meetings throughout the year. The Board, in reaching its determination to renew the Advisory Contracts, is aware that shareholders in the fund have a broad range of investment choices available to them, including a wide choice among mutual funds offered by Fidelity's competitors, and that the fund's shareholders, who have the opportunity to review and weigh the disclosure provided by the fund in its prospectus and other public disclosures, have chosen to invest in this fund, managed by Fidelity.
Semiannual Report
Nature, Extent, and Quality of Services Provided. The Board considered the staffing within the investment adviser, FMR, and the sub-advisers (together, the Investment Advisers), including the backgrounds of the fund's investment personnel, and also considered the fund's investment objective, strategies, and related investment philosophy. The Independent Trustees also had discussions with senior management of Fidelity's investment operations and investment groups. The Board considered the structure of the portfolio manager compensation program and whether this structure provides appropriate incentives to act in the best interests of the fund.
Resources Dedicated to Investment Management and Support Services. The Board and the Fund Oversight and Research Committees reviewed the general qualifications and capabilities of the Investment Advisers' investment staff, including its size, education, experience, and resources, as well as the Investment Advisers' approach to recruiting, training, managing, and compensating investment personnel. The Board also noted that FMR has continued to increase the resources devoted to non-U.S. offices, including expansion of Fidelity's global investment organization. The Board noted that Fidelity's analysts have extensive resources, tools and capabilities that allow them to conduct sophisticated quantitative and fundamental analysis, as well as credit analysis of issuers, counterparties and guarantors. The Board also believes that Fidelity's investment professionals have sufficient access to global information and data so as to provide competitive investment results over time, and that those professionals also have access to sophisticated tools that permit them to assess portfolio construction and risk and performance attribution characteristics continuously, as well as to transmit new information and research conclusions rapidly around the world. Additionally, in its deliberations, the Board considered the Investment Advisers' trading and risk management capabilities and resources, which are an integral part of the investment management process.
Shareholder and Administrative Services. The Board considered (i) the nature, extent, quality, and cost of advisory, administrative, and shareholder services performed by the Investment Advisers and their affiliates under the Advisory Contracts and under separate agreements covering transfer agency, pricing and bookkeeping, and securities lending services for the fund; (ii) the nature and extent of the supervision of third party service providers, principally custodians and subcustodians; and (iii) the resources devoted to, and the record of compliance with, the fund's compliance policies and procedures. The Board also reviewed the allocation of fund brokerage, including allocations to brokers affiliated with the Investment Advisers, the use of brokerage commissions to pay fund expenses, and the use of "soft" commission dollars to pay for research services.
Semiannual Report
Board Approval of Investment Advisory Contracts and
Management Fees - continued
The Board noted that the growth of fund assets over time across the complex allows Fidelity to reinvest in the development of services designed to enhance the value or convenience of the Fidelity funds as investment vehicles. These services include 24-hour access to account information and market information through telephone representatives and over the Internet, investor education materials and asset allocation tools, and the expanded availability of Fidelity Investor Centers.
Investment in a Large Fund Family. The Board considered the benefits to shareholders of investing in a Fidelity fund, including the benefits of investing in a fund that is part of a large family of funds offering a variety of investment disciplines and providing a large variety of mutual fund investor services. The Board noted that Fidelity had taken, or had made recommendations that resulted in the Fidelity funds taking, a number of actions over the previous year that benefited particular funds, including (i) continuing to dedicate additional resources to investment research and support of the senior management team that oversees asset management; (ii) persisting in efforts to enhance Fidelity's research capabilities, in particular, international research; (iii) launching new funds and making other enhancements to meet client needs for global and income-oriented solutions; (iv) continuing to launch dedicated lower cost underlying funds to meet investment management's portfolio construction needs related to expanding underlying fund options, specifically for the Freedom Fund product lines; (v) adopting a "Stock Selector" sector neutral investment approach and employing a team of portfolio managers who are sector specialists to manage certain funds; (vi) rationalizing product lines and gaining increased efficiencies through the mergers of several funds into other funds; (vii) strengthening the Spartan Index Fund product line by adding new funds and/or new low-cost institutional share classes, restructuring fund expenses to accommodate new classes, and reducing investment minimums for certain classes of shares; (viii) modifying the eligibility criteria for Institutional Class shares to increase their appeal to government entities and charitable investors; and (ix) reducing certain transfer agent fee rates.
Investment Performance. The Board considered whether the fund has operated in accordance with its investment objective, as well as its record of compliance with its investment restrictions. It also reviewed the fund's absolute investment performance for each class, as well as the fund's relative investment performance for each class measured over multiple periods against (i) a broad-based securities market index, and (ii) a custom peer group of mutual funds deemed appropriate by Fidelity and reviewed by the Board. The following charts considered by the Board show, over the one-, three-, and five-year periods ended December 31, 2011, as available, the cumulative total returns of Class K and the retail class of the fund, the cumulative total returns of a broad-based securities market index ("benchmark"), and a range of cumulative total returns of a custom peer group of mutual funds defined by FMR based on categories assigned by Morningstar, Inc. The box within each chart shows the 25th percentile return (top of box) and the 75th percentile return (bottom of box) of the peer group. Returns shown above the box are in the first quartile and returns shown below the box are in the fourth quartile. The percentage beaten numbers noted below each chart correspond to the percentile box and represent the percentage of funds in the peer group whose performance was equal to or lower than that of the class indicated. The fund's custom peer group, defined by FMR, is a peer group that FMR believes provides a more meaningful performance comparison than the peer group assigned by Morningstar, Inc., which assigns mutual funds to categories based on their investment styles as measured by their underlying portfolio holdings.
Semiannual Report
Fidelity Growth Discovery Fund
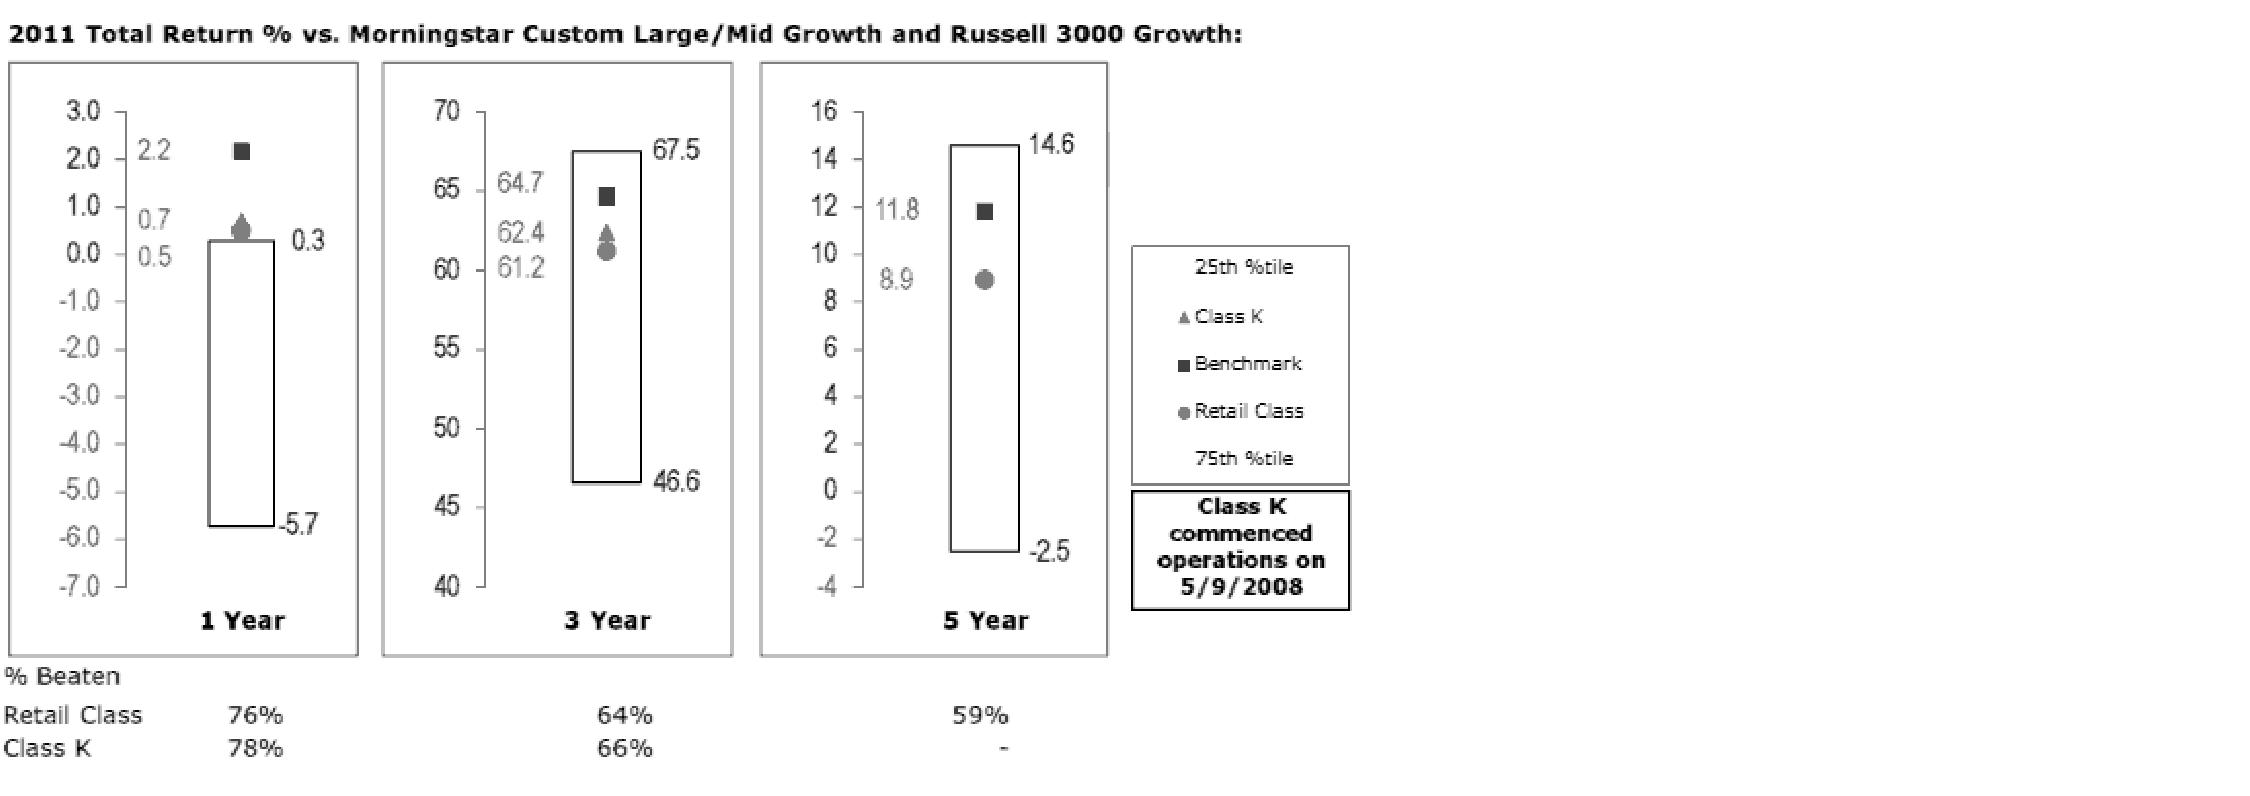
The Board reviewed the fund's relative investment performance against its peer group and noted that the performance of the retail class of the fund (the class with the longer performance record) was in the first quartile for the one-year period and the second quartile for the three- and five-year periods. The Board also noted that the investment performance of the fund was lower than its benchmark for all the periods shown. The Board considered that the variations in performance between the fund's classes reflect the variations in class expenses, which result in lower performance for the higher expense class. The Board discussed with FMR the fact that the fund underperformed its benchmark for each period measured. The Board also reviewed the fund's performance since inception as well as performance in the current year. The Board will continue to closely monitor performance of the fund in the coming year and discuss with FMR if other actions to address performance are appropriate.
Semiannual Report
Board Approval of Investment Advisory Contracts and
Management Fees - continued
The Board also considered that the fund's management fee is subject to upward or downward adjustment depending upon whether, and to what extent, the fund's investment performance for the performance period exceeds, or is exceeded by, the record (over the same period) of a Board-approved performance adjustment index. The Board noted that the performance adjustment provides FMR with a strong economic incentive to seek to achieve superior performance for the fund's shareholders and helps to more closely align the interests of FMR and the fund's shareholders.
Based on its review, the Board concluded that the nature, extent, and quality of services provided to the fund under the Advisory Contracts should benefit the fund's shareholders.
Competitiveness of Management Fee and Total Expense Ratio. The Board considered the fund's management fee and total expense ratio compared to "mapped groups" of competitive funds and classes. Fidelity creates "mapped groups" by combining similar Lipper investment objective categories that have comparable management fee characteristics. Combining Lipper investment objective categories aids the Board's management fee and total expense ratio comparisons by broadening the competitive group used for comparison and by reducing the number of universes to which various Fidelity funds are compared.
Management Fee. The Board considered two proprietary management fee comparisons for the 12-month periods shown in the chart below. The group of Lipper funds used by the Board for management fee comparisons is referred to below as the "Total Mapped Group." The Total Mapped Group comparison focuses on a fund's standing relative to the total universe of comparable funds available to investors in terms of gross management fees before expense reimbursements or caps, and without giving effect to the fund's performance adjustment. "TMG %" represents the percentage of funds in the Total Mapped Group that had management fees that were lower than the fund's. For example, a TMG % of 10% means that 90% of the funds in the Total Mapped Group had higher management fees than the fund. The "Asset-Size Peer Group" (ASPG) comparison focuses on a fund's standing relative to non-Fidelity funds similar in size to the fund within the Total Mapped Group. The ASPG represents at least 15% of the funds in the Total Mapped Group with comparable asset size and management fee characteristics, subject to a minimum of 50 funds (or all funds in the Total Mapped Group if fewer than 50). Additional information, such as the ASPG quartile in which the fund's management fee ranked and the impact of the fund's performance adjustment, is also included in the chart and considered by the Board.
Semiannual Report
Fidelity Growth Discovery Fund

The Board noted that the fund's management fee ranked below the median of its Total Mapped Group and below the median of its ASPG for 2011. The Board also noted the effect of the fund's negative performance adjustment on the fund's management fee ranking. The Board noted that the performance adjustment for each year represents calculations for performance periods that differ from the periods shown in the performance charts above.
Furthermore, the Board considered that shareholders approved a prospective change in the index used to calculate the fund's performance adjustment, beginning February 1, 2007. The Board also considered that, because the performance adjustment is based on a rolling 36-month measurement period, during a transition period the fund's performance is compared to a blended index return that reflects the performance of the former index for the portion of the measurement period prior to February 1, 2007 and the performance of the current index for the remainder of the measurement period. The Board noted that the fund's performance adjustments for 2007 through 2010 shown in the chart above reflect the effect of using the blended index return to calculate the fund's performance adjustment.
Based on its review, the Board concluded that the fund's management fee is fair and reasonable in light of the services that the fund receives and the other factors considered.
Total Expense Ratio. In its review of each class's total expense ratio, the Board considered the fund's management fee as well as other fund or class expenses, as applicable, such as transfer agent fees, pricing and bookkeeping fees, and custodial, legal, and audit fees. The Board also noted the effects of any waivers and reimbursements on fees and expenses, as well as the impact of the fund's performance adjustment. As part of its review, the Board also considered the current and historical total expense ratios of each class of the fund compared to competitive fund median expenses. Each class of the fund is compared to those funds and classes in the Total Mapped Group (used by the Board for management fee comparisons) that have a similar sales load structure.
Semiannual Report
Board Approval of Investment Advisory Contracts and
Management Fees - continued
The Board noted that the total expense ratio of each class ranked below its competitive median for 2011.
Fees Charged to Other Fidelity Clients. The Board also considered Fidelity fee structures and other information with respect to clients of FMR and its affiliates, such as other mutual funds advised or subadvised by FMR or its affiliates, pension plan clients, and other institutional clients. The Board noted the findings of the 2010 ad hoc joint committee (created with the board of other Fidelity funds), which reviewed and compared Fidelity's institutional investment advisory business with its business of providing services to the Fidelity funds, including the differences in services provided, fees charged, and costs incurred, as well as competition in their respective marketplaces.
Based on its review of total expense ratios and fees charged to other Fidelity clients, the Board concluded that the total expense ratio of each class of the fund was reasonable in light of the services that the fund and its shareholders receive and the other factors considered.
Costs of the Services and Profitability. The Board considered the revenues earned and the expenses incurred by Fidelity in conducting the business of developing, marketing, distributing, managing, administering and servicing the fund and its shareholders. The Board also considered the level of Fidelity's profits in respect of all the Fidelity funds.
On an annual basis, FMR presents to the Board Fidelity's profitability for the fund. Fidelity calculates the profitability for each fund, as well as aggregate profitability for groups of Fidelity funds and all Fidelity funds, using a series of detailed revenue and cost allocation methodologies which originate with the books and records of Fidelity on which Fidelity's audited financial statements are based. The Audit Committee of the Board reviews any significant changes from the prior year's methodologies.
PricewaterhouseCoopers LLP (PwC), independent registered public accounting firm and auditor to Fidelity and certain Fidelity funds, has been engaged annually by the Board as part of the Board's assessment of Fidelity's profitability analysis. PwC's engagement includes the review and assessment of Fidelity's methodologies used in determining the revenues and expenses attributable to Fidelity's mutual fund business, and completion of agreed-upon procedures surrounding the mathematical accuracy of fund profitability and its conformity to allocation methodologies. After considering PwC's reports issued under the engagement and information provided by Fidelity, the Board concluded that while other allocation methods may also be reasonable, Fidelity's profitability methodologies are reasonable in all material respects.
Semiannual Report
The Board also reviewed Fidelity's non-fund businesses and fall-out benefits related to the mutual fund business as well as cases where Fidelity's affiliates may benefit from or be related to the fund's business.
The Board considered the costs of the services provided by and the profits realized by Fidelity in connection with the operation of the fund and was satisfied that the profitability was not excessive in the circumstances.
Economies of Scale. The Board considered whether there have been economies of scale in respect of the management of the Fidelity funds, whether the Fidelity funds (including the fund) have appropriately benefited from any such economies of scale, and whether there is potential for realization of any further economies of scale. The Board considered the extent to which the fund will benefit from economies of scale through increased services to the fund, through waivers or reimbursements, or through fee or expense reductions. The Board also noted that in 2009, it and the board of other Fidelity funds created an ad hoc committee (the Economies of Scale Committee) to analyze whether FMR attains economies of scale in respect of the management and servicing of the Fidelity funds, whether the Fidelity funds have appropriately benefited from such economies of scale, and whether there is potential for realization of any further economies of scale.
The Board recognized that the fund's management contract incorporates a "group fee" structure, which provides for lower group fee rates as total fund assets under FMR's management increase, and for higher group fee rates as total fund assets under FMR's management decrease. FMR calculates the group fee rates based on a tiered asset "breakpoint" schedule that varies based on asset class. The Board considered that the group fee is designed to deliver the benefits of economies of scale to fund shareholders when total Fidelity fund assets increase, even if assets of any particular fund are unchanged or have declined, because some portion of Fidelity's costs are attributable to services provided to all Fidelity funds, and all funds benefit if those costs can be allocated among more assets. The Board concluded that, given the group fee structure, fund shareholders will benefit from lower management fees as assets under FMR's management increase at the fund complex level, regardless of whether Fidelity achieves any such economies of scale.
The Board concluded, taking into account the analysis of the Economies of Scale Committee, that economies of scale, if any, are being appropriately shared between fund shareholders and Fidelity.
Semiannual Report
Board Approval of Investment Advisory Contracts and
Management Fees - continued
Additional Information Requested by the Board. In order to develop fully the factual basis for consideration of the Fidelity funds' Advisory Contracts, the Board requested and received additional information on certain topics, including (i) fund performance trends, actions to be taken by FMR to improve certain funds' overall performance, and Fidelity's long-term strategies for certain funds; (ii) the potential to further rationalize the Fidelity fund lineup with the possibility of achieving savings for the funds and Fidelity; (iii) Fidelity's compensation structure for portfolio managers and other key investment personnel; (iv) the amount of the investment that each portfolio manager has made in the Fidelity fund(s) that he or she manages; (v) the realization of fall-out benefits in certain Fidelity business units; (vi) Fidelity's group fee structures, the potential impact of regulatory changes on such structures, and the rationale for the individual fee rates of certain funds; (vii) fund profitability methodology, including Fidelity's cost allocation methodology, and the impact of certain factors on fund profitability results; (viii) trends regarding industry use of performance fee structures and the possibility of implementing performance fee structures for additional funds; and (ix) the impact of net redemptions from the Fidelity funds.
Based on its evaluation of all of the conclusions noted above, and after considering all factors it believed relevant, the Board ultimately concluded that the advisory fee structures are fair and reasonable, and that the fund's Advisory Contracts should be renewed.
Semiannual Report
Investment Adviser
Fidelity Management &
Research Company
Boston, MA
Investment Sub-Advisers
FMR Co., Inc.
Fidelity Management & Research
(U.K.) Inc.
Fidelity Management & Research
(Japan) Inc.
Fidelity Management & Research
(Hong Kong) Limited
General Distributor
Fidelity Distributors Corporation
Smithfield, RI
Transfer and Service Agents
Fidelity Investments Institutional
Operations Company, Inc.
Boston, MA
Fidelity Service Company, Inc.
Boston, MA
Custodian
Brown Brothers Harriman & Co.
Boston, MA
(Fidelity Investment logo)(registered trademark)
Corporate Headquarters
82 Devonshire St., Boston, MA 02109
www.fidelity.com
CII-K-USAN-0213
1.863273.104
Fidelity®
Growth Discovery Fund
Semiannual Report
December 31, 2012
(Fidelity Cover Art)
Contents
Shareholder Expense Example | An example of shareholder expenses. | |
Investment Changes | A summary of major shifts in the fund's investments over the past six months. | |
Investments | A complete list of the fund's investments with their market values. | |
Financial Statements | Statements of assets and liabilities, operations, and changes in net assets, as well as financial highlights. | |
Notes | Notes to the financial statements. | |
Board Approval of Investment Advisory Contracts and Management Fees |
|
To view a fund's proxy voting guidelines and proxy voting record for the 12-month period ended June 30, visit http://www.fidelity.com/proxyvotingresults or visit the Securities and Exchange Commission's (SEC) web site at http://www.sec.gov. You may also call 1-800-544-8544 to request a free copy of the proxy voting guidelines.
Standard & Poor's, S&P and S&P 500 are registered service marks of The McGraw-Hill Companies, Inc. and have been licensed for use by Fidelity Distributors Corporation.
Other third party marks appearing herein are the property of their respective owners.
All other marks appearing herein are registered or unregistered trademarks or service marks of FMR LLC or an affiliated company. © 2013 FMR LLC. All rights reserved.
This report and the financial statements contained herein are submitted for the general information of the shareholders of the fund. This report is not authorized for distribution to prospective investors in the fund unless preceded or accompanied by an effective prospectus.
A fund files its complete schedule of portfolio holdings with the SEC for the first and third quarters of each fiscal year on Form N-Q. Forms N-Q are available on the SEC's web site at http://www.sec.gov. A fund's Forms N-Q may be reviewed and copied at the SEC's Public Reference Room in Washington, DC. Information regarding the operation of the SEC's Public Reference Room may be obtained by calling 1-800-SEC-0330. For a complete list of a fund's portfolio holdings, view the most recent holdings listing, semiannual report, or annual report on Fidelity's web site at http://www.fidelity.com, http://www.advisor.fidelity.com, or http://www.401k.com, as applicable.
NOT FDIC INSURED • MAY LOSE VALUE • NO BANK GUARANTEE
Neither the fund nor Fidelity Distributors Corporation is a bank.
Semiannual Report
Shareholder Expense Example
As a shareholder of the Fund, you incur two types of costs: (1) transaction costs, and (2) ongoing costs, including management fees and other Fund expenses. This Example is intended to help you understand your ongoing costs (in dollars) of investing in the Fund and to compare these costs with the ongoing costs of investing in other mutual funds.
The Example is based on an investment of $1,000 invested at the beginning of the period and held for the entire period (July 1, 2012 to December 31, 2012).
Actual Expenses
The first line of the accompanying table for each class of the Fund provides information about actual account values and actual expenses. You may use the information in this line, together with the amount you invested, to estimate the expenses that you paid over the period. Simply divide your account value by $1,000.00 (for example, an $8,600 account value divided by $1,000.00 = 8.6), then multiply the result by the number in the first line for a class of the Fund under the heading entitled "Expenses Paid During Period" to estimate the expenses you paid on your account during this period. A small balance maintenance fee of $12.00 that is charged once a year may apply for certain accounts with a value of less than $2,000. This fee is not included in the table below. If it was, the estimate of expenses you paid during the period would be higher, and your ending account value lower, by this amount. In addition, the Fund, as a shareholder in the underlying Fidelity Central Funds, will indirectly bear its pro-rata share of the fees and expenses incurred by the underlying Fidelity Central Funds. These fees and expenses are not included in the Fund's annualized expense ratio used to calculate the expense estimate in the table below.
Hypothetical Example for Comparison Purposes
The second line of the accompanying table for each class of the Fund provides information about hypothetical account values and hypothetical expenses based on a Class' actual expense ratio and an assumed rate of return of 5% per year before expenses, which is not the Class' actual return. The hypothetical account values and expenses may not be used to estimate the actual ending account balance or expenses you paid for the period. You may use this information to compare the ongoing costs of investing in the Fund and other funds. To do so, compare this 5% hypothetical example with the 5% hypothetical examples that appear in the shareholder reports of the other funds. A small balance maintenance fee of $12.00 that is charged once a year may apply for certain accounts with a value of less than $2,000. This fee is not included in the table below. If it was, the estimate of expenses you paid during the period would be higher, and your ending account value lower, by this amount. In addition, the Fund, as a shareholder in the underlying Fidelity Central Funds, will indirectly bear its pro-rata share of the fees and expenses incurred by the underlying Fidelity Central Funds. These fees and expenses are not included in the Fund's annualized expense ratio used to calculate the expense estimate in the table below.
Please note that the expenses shown in the table are meant to highlight your ongoing costs only and do not reflect any transaction costs. Therefore, the second line of the table is useful in comparing ongoing costs only, and will not help you determine the relative total costs of owning different funds.
Semiannual Report
Shareholder Expense Example - continued
| Annualized | Beginning | Ending | Expenses Paid |
Growth Discovery | .92% |
|
|
|
Actual |
| $ 1,000.00 | $ 1,036.50 | $ 4.72 |
Hypothetical A |
| $ 1,000.00 | $ 1,020.57 | $ 4.69 |
Class K | .76% |
|
|
|
Actual |
| $ 1,000.00 | $ 1,037.50 | $ 3.90 |
Hypothetical A |
| $ 1,000.00 | $ 1,021.37 | $ 3.87 |
A 5% return per year before expenses
* Expenses are equal to each Class' annualized expense ratio, multiplied by the average account value over the period, multiplied by 184/365 (to reflect the one-half year period).
Semiannual Report
Investment Changes (Unaudited)
Top Ten Stocks as of December 31, 2012 | ||
| % of fund's | % of fund's net assets |
Apple, Inc. | 11.1 | 11.4 |
Express Scripts Holding Co. | 3.1 | 1.7 |
Visa, Inc. Class A | 2.3 | 0.5 |
Home Depot, Inc. | 2.3 | 2.0 |
Harley-Davidson, Inc. | 2.2 | 2.1 |
The Coca-Cola Co. | 2.1 | 2.0 |
Facebook, Inc. Class A | 2.1 | 0.0 |
Google, Inc. Class A | 2.0 | 1.4 |
Monsanto Co. | 1.9 | 0.6 |
salesforce.com, Inc. | 1.7 | 1.2 |
| 30.8 | |
Top Five Market Sectors as of December 31, 2012 | ||
| % of fund's | % of fund's net assets |
Information Technology | 29.3 | 31.7 |
Consumer Discretionary | 19.2 | 18.3 |
Consumer Staples | 12.5 | 11.4 |
Health Care | 12.4 | 6.1 |
Industrials | 8.2 | 14.2 |
Asset Allocation (% of fund's net assets) | |||||||
As of December 31, 2012* | As of June 30, 2012** | ||||||
 | Stocks 99.1% |
| | Stocks 94.3% |
| ||
 | Short-Term |
| | Short-Term |
| ||
* Foreign investments | 12.1% |
| ** Foreign investments | 13.1% |
| ||

Semiannual Report
Investments December 31, 2012 (Unaudited)
Showing Percentage of Net Assets
Common Stocks - 99.1% | |||
Shares | Value (000s) | ||
CONSUMER DISCRETIONARY - 19.2% | |||
Automobiles - 2.7% | |||
Harley-Davidson, Inc. | 412,761 | $ 20,159 | |
Tesla Motors, Inc. (a) | 133,392 | 4,518 | |
| 24,677 | ||
Diversified Consumer Services - 1.2% | |||
Anhanguera Educacional Participacoes SA | 312,600 | 5,341 | |
Kroton Educacional SA (a) | 252,300 | 5,767 | |
| 11,108 | ||
Hotels, Restaurants & Leisure - 4.5% | |||
Arcos Dorados Holdings, Inc. Class A (d) | 216,980 | 2,595 | |
Chipotle Mexican Grill, Inc. (a) | 23,431 | 6,970 | |
Dunkin' Brands Group, Inc. (d) | 132,569 | 4,399 | |
McDonald's Corp. | 54,070 | 4,770 | |
Panera Bread Co. Class A (a) | 30,704 | 4,877 | |
Starbucks Corp. | 227,226 | 12,184 | |
Yum! Brands, Inc. | 76,996 | 5,113 | |
| 40,908 | ||
Household Durables - 0.7% | |||
Ethan Allen Interiors, Inc. | 32,604 | 838 | |
Mohawk Industries, Inc. (a) | 64,477 | 5,833 | |
| 6,671 | ||
Internet & Catalog Retail - 1.1% | |||
Amazon.com, Inc. (a) | 40,408 | 10,148 | |
Media - 1.4% | |||
Comcast Corp. Class A (special) (non-vtg.) | 177,421 | 6,378 | |
Discovery Communications, Inc. Class C (non-vtg.) (a) | 112,550 | 6,584 | |
| 12,962 | ||
Multiline Retail - 1.2% | |||
Dollarama, Inc. | 184,190 | 10,920 | |
Specialty Retail - 5.7% | |||
GNC Holdings, Inc. | 262,791 | 8,746 | |
Haverty Furniture Companies, Inc. | 1,900 | 31 | |
Home Depot, Inc. | 338,512 | 20,937 | |
PetSmart, Inc. | 69,941 | 4,780 | |
Ross Stores, Inc. | 104,966 | 5,684 | |
TJX Companies, Inc. | 142,418 | 6,046 | |
Vitamin Shoppe, Inc. (a) | 107,093 | 6,143 | |
| 52,367 | ||
Common Stocks - continued | |||
Shares | Value (000s) | ||
CONSUMER DISCRETIONARY - continued | |||
Textiles, Apparel & Luxury Goods - 0.7% | |||
lululemon athletica, Inc. (a) | 31,400 | $ 2,394 | |
NIKE, Inc. Class B | 81,326 | 4,196 | |
| 6,590 | ||
TOTAL CONSUMER DISCRETIONARY | 176,351 | ||
CONSUMER STAPLES - 12.5% | |||
Beverages - 3.3% | |||
Anheuser-Busch InBev SA NV ADR | 60,011 | 5,246 | |
SABMiller PLC | 129,700 | 6,020 | |
The Coca-Cola Co. | 534,960 | 19,392 | |
| 30,658 | ||
Food & Staples Retailing - 1.3% | |||
Costco Wholesale Corp. | 49,800 | 4,919 | |
Whole Foods Market, Inc. | 76,865 | 7,020 | |
| 11,939 | ||
Food Products - 3.5% | |||
Green Mountain Coffee Roasters, Inc. (a)(d) | 359,172 | 14,855 | |
Mead Johnson Nutrition Co. Class A | 112,300 | 7,399 | |
The Hershey Co. | 139,777 | 10,095 | |
| 32,349 | ||
Household Products - 1.2% | |||
Colgate-Palmolive Co. | 101,003 | 10,559 | |
Personal Products - 0.8% | |||
Herbalife Ltd. | 207,929 | 6,849 | |
Tobacco - 2.4% | |||
British American Tobacco PLC sponsored ADR | 79,300 | 8,029 | |
Philip Morris International, Inc. | 169,300 | 14,160 | |
| 22,189 | ||
TOTAL CONSUMER STAPLES | 114,543 | ||
ENERGY - 7.6% | |||
Energy Equipment & Services - 2.4% | |||
Cameron International Corp. (a) | 96,800 | 5,465 | |
Dresser-Rand Group, Inc. (a) | 90,905 | 5,103 | |
National Oilwell Varco, Inc. | 85,507 | 5,844 | |
Oceaneering International, Inc. | 112,349 | 6,043 | |
| 22,455 | ||
Common Stocks - continued | |||
Shares | Value (000s) | ||
ENERGY - continued | |||
Oil, Gas & Consumable Fuels - 5.2% | |||
Atlas Pipeline Partners LP | 126,363 | $ 3,989 | |
Cobalt International Energy, Inc. (a) | 85,100 | 2,090 | |
Concho Resources, Inc. (a) | 62,021 | 4,996 | |
Kosmos Energy Ltd. (a) | 349,011 | 4,310 | |
Markwest Energy Partners LP | 56,660 | 2,890 | |
Noble Energy, Inc. | 25,300 | 2,574 | |
Phillips 66 | 246,051 | 13,065 | |
Pioneer Natural Resources Co. | 40,500 | 4,317 | |
Targa Resources Corp. | 59,651 | 3,152 | |
Valero Energy Corp. | 183,007 | 6,244 | |
| 47,627 | ||
TOTAL ENERGY | 70,082 | ||
FINANCIALS - 3.3% | |||
Capital Markets - 0.6% | |||
Apollo Global Management LLC Class A | 62,004 | 1,076 | |
GP Investments Ltd. (depositary receipt) (a) | 144,694 | 378 | |
Invesco Ltd. | 153,221 | 3,998 | |
| 5,452 | ||
Consumer Finance - 0.4% | |||
Mahindra & Mahindra Financial Services Ltd. | 75,209 | 1,511 | |
Shriram Transport Finance Co. Ltd. | 161,708 | 2,245 | |
| 3,756 | ||
Insurance - 0.2% | |||
Berkshire Hathaway, Inc. Class B (a) | 21,600 | 1,938 | |
Real Estate Investment Trusts - 1.5% | |||
American Tower Corp. | 143,328 | 11,075 | |
Public Storage | 19,730 | 2,860 | |
| 13,935 | ||
Real Estate Management & Development - 0.6% | |||
Realogy Holdings Corp. | 127,334 | 5,343 | |
TOTAL FINANCIALS | 30,424 | ||
HEALTH CARE - 12.4% | |||
Biotechnology - 5.9% | |||
Amgen, Inc. | 95,100 | 8,209 | |
AVEO Pharmaceuticals, Inc. (a)(d) | 217,061 | 1,747 | |
Biogen Idec, Inc. (a) | 78,979 | 11,584 | |
Common Stocks - continued | |||
Shares | Value (000s) | ||
HEALTH CARE - continued | |||
Biotechnology - continued | |||
BioMarin Pharmaceutical, Inc. (a) | 119,876 | $ 5,904 | |
Biovitrum AB (a) | 366,426 | 2,074 | |
Cytokinetics, Inc. | 480,700 | 317 | |
Cytokinetics, Inc. warrants 6/25/17 (a) | 288,420 | 2 | |
Elan Corp. PLC sponsored ADR (a) | 360,168 | 3,677 | |
Gilead Sciences, Inc. (a) | 166,780 | 12,250 | |
Grifols SA ADR | 50,661 | 1,314 | |
Onyx Pharmaceuticals, Inc. (a) | 30,200 | 2,281 | |
Prothena Corp. PLC (a) | 8,784 | 64 | |
Regeneron Pharmaceuticals, Inc. (a) | 12,984 | 2,221 | |
Thrombogenics NV (a) | 38,697 | 2,154 | |
| 53,798 | ||
Health Care Equipment & Supplies - 0.4% | |||
The Cooper Companies, Inc. | 38,457 | 3,557 | |
Health Care Providers & Services - 3.6% | |||
Apollo Hospitals Enterprise Ltd. | 109,622 | 1,581 | |
Express Scripts Holding Co. (a) | 535,217 | 28,902 | |
Qualicorp SA (a) | 225,700 | 2,366 | |
| 32,849 | ||
Health Care Technology - 0.4% | |||
Cerner Corp. (a) | 53,880 | 4,183 | |
Pharmaceuticals - 2.1% | |||
Novo Nordisk A/S Series B | 48,377 | 7,878 | |
Valeant Pharmaceuticals International, Inc. (Canada) (a) | 188,411 | 11,240 | |
| 19,118 | ||
TOTAL HEALTH CARE | 113,505 | ||
INDUSTRIALS - 8.2% | |||
Aerospace & Defense - 2.6% | |||
Honeywell International, Inc. | 71,144 | 4,516 | |
Precision Castparts Corp. | 27,943 | 5,293 | |
TransDigm Group, Inc. | 54,658 | 7,453 | |
United Technologies Corp. | 77,408 | 6,348 | |
| 23,610 | ||
Building Products - 0.4% | |||
USG Corp. (a)(d) | 137,100 | 3,848 | |
Electrical Equipment - 1.8% | |||
Hubbell, Inc. Class B | 62,449 | 5,285 | |
Common Stocks - continued | |||
Shares | Value (000s) | ||
INDUSTRIALS - continued | |||
Electrical Equipment - continued | |||
Regal-Beloit Corp. | 41,659 | $ 2,936 | |
Roper Industries, Inc. | 73,385 | 8,181 | |
| 16,402 | ||
Industrial Conglomerates - 0.6% | |||
Danaher Corp. | 96,892 | 5,416 | |
Machinery - 0.3% | |||
Graco, Inc. | 46,623 | 2,401 | |
Professional Services - 2.0% | |||
Equifax, Inc. | 217,903 | 11,793 | |
Verisk Analytics, Inc. (a) | 134,467 | 6,858 | |
| 18,651 | ||
Trading Companies & Distributors - 0.5% | |||
Beacon Roofing Supply, Inc. (a) | 72,500 | 2,413 | |
W.W. Grainger, Inc. | 11,239 | 2,274 | |
| 4,687 | ||
TOTAL INDUSTRIALS | 75,015 | ||
INFORMATION TECHNOLOGY - 29.3% | |||
Communications Equipment - 1.4% | |||
QUALCOMM, Inc. | 196,936 | 12,214 | |
Computers & Peripherals - 12.5% | |||
Apple, Inc. | 190,802 | 101,702 | |
SanDisk Corp. (a) | 296,778 | 12,928 | |
| 114,630 | ||
Internet Software & Services - 6.7% | |||
Bankrate, Inc. (a) | 137,185 | 1,708 | |
Blucora, Inc. (a) | 172,485 | 2,710 | |
CoStar Group, Inc. (a) | 29,550 | 2,641 | |
eBay, Inc. (a) | 176,922 | 9,027 | |
Facebook, Inc. Class A | 722,691 | 19,245 | |
Google, Inc. Class A (a) | 25,323 | 17,963 | |
MercadoLibre, Inc. (d) | 61,158 | 4,805 | |
SPS Commerce, Inc. (a) | 81,291 | 3,030 | |
| 61,129 | ||
IT Services - 2.8% | |||
Heartland Payment Systems, Inc. | 150,904 | 4,452 | |
Visa, Inc. Class A | 141,460 | 21,443 | |
| 25,895 | ||
Common Stocks - continued | |||
Shares | Value (000s) | ||
INFORMATION TECHNOLOGY - continued | |||
Semiconductors & Semiconductor Equipment - 0.5% | |||
Avago Technologies Ltd. | 151,609 | $ 4,800 | |
Software - 5.4% | |||
ANSYS, Inc. (a) | 27,412 | 1,846 | |
Citrix Systems, Inc. (a) | 146,959 | 9,663 | |
Computer Modelling Group Ltd. | 130,500 | 2,797 | |
FleetMatics Group PLC | 20,300 | 511 | |
Intuit, Inc. | 72,193 | 4,295 | |
salesforce.com, Inc. (a) | 92,766 | 15,594 | |
SolarWinds, Inc. (a) | 143,527 | 7,528 | |
VMware, Inc. Class A (a) | 68,075 | 6,409 | |
Workday, Inc. | 12,500 | 681 | |
| 49,324 | ||
TOTAL INFORMATION TECHNOLOGY | 267,992 | ||
MATERIALS - 4.6% | |||
Chemicals - 3.5% | |||
FMC Corp. | 134,346 | 7,862 | |
Monsanto Co. | 185,042 | 17,514 | |
Sherwin-Williams Co. | 42,100 | 6,476 | |
| 31,852 | ||
Construction Materials - 0.8% | |||
James Hardie Industries NV sponsored ADR | 66,400 | 3,236 | |
Vulcan Materials Co. | 87,866 | 4,573 | |
| 7,809 | ||
Paper & Forest Products - 0.3% | |||
Norbord, Inc. (a) | 86,900 | 2,637 | |
TOTAL MATERIALS | 42,298 | ||
TELECOMMUNICATION SERVICES - 1.0% | |||
Wireless Telecommunication Services - 1.0% | |||
SBA Communications Corp. Class A (a) | 125,112 | 8,885 | |
UTILITIES - 1.0% | |||
Electric Utilities - 1.0% | |||
ITC Holdings Corp. | 121,831 | 9,370 | |
TOTAL COMMON STOCKS (Cost $746,184) |
| ||
Money Market Funds - 2.9% | |||
Shares | Value (000s) | ||
Fidelity Cash Central Fund, 0.18% (b) | 12,055,853 | $ 12,056 | |
Fidelity Securities Lending Cash Central Fund, 0.18% (b)(c) | 14,281,807 | 14,282 | |
TOTAL MONEY MARKET FUNDS (Cost $26,338) |
| ||
TOTAL INVESTMENT PORTFOLIO - 102.0% (Cost $772,522) | 934,803 | ||
NET OTHER ASSETS (LIABILITIES) - (2.0)% | (18,637) | ||
NET ASSETS - 100% | $ 916,166 | ||
Legend |
(a) Non-income producing |
(b) Affiliated fund that is available only to investment companies and other accounts managed by Fidelity Investments. The rate quoted is the annualized seven-day yield of the fund at period end. A complete unaudited listing of the fund's holdings as of its most recent quarter end is available upon request. In addition, each Fidelity Central Fund's financial statements are available on the SEC's website or upon request. |
(c) Investment made with cash collateral received from securities on loan. |
(d) Security or a portion of the security is on loan at period end. |
Affiliated Central Funds |
Information regarding fiscal year to date income earned by the Fund from investments in Fidelity Central Funds is as follows: |
Fund | Income earned |
Fidelity Cash Central Fund | $ 24 |
Fidelity Securities Lending Cash Central Fund | 661 |
Total | $ 685 |
Other Information |
The following is a summary of the inputs used, as of December 31, 2012, involving the Fund's assets and liabilities carried at fair value. The inputs or methodology used for valuing securities may not be an indication of the risk associated with investing in those securities. For more information on valuation inputs, and their aggregation into the levels used in the table below, please refer to the Investment Valuation section in the accompanying Notes to Financial Statements. |
Valuation Inputs at Reporting Date: | ||||
Description | Total | Level 1 | Level 2 | Level 3 |
Investments in Securities: | ||||
Equities: | ||||
Consumer Discretionary | $ 176,351 | $ 165,243 | $ 11,108 | $ - |
Consumer Staples | 114,543 | 108,523 | 6,020 | - |
Energy | 70,082 | 70,082 | - | - |
Financials | 30,424 | 26,290 | 4,134 | - |
Health Care | 113,505 | 97,450 | 16,055 | - |
Industrials | 75,015 | 75,015 | - | - |
Information Technology | 267,992 | 267,992 | - | - |
Materials | 42,298 | 42,298 | - | - |
Telecommunication Services | 8,885 | 8,885 | - | - |
Utilities | 9,370 | 9,370 | - | - |
Money Market Funds | 26,338 | 26,338 | - | - |
Total Investments in Securities: | $ 934,803 | $ 897,486 | $ 37,317 | $ - |
Distribution of investments by country or territory of incorporation, as a percentage of total net assets, is as follows. (Unaudited) |
United States of America | 87.9% |
Canada | 3.0% |
United Kingdom | 1.5% |
Brazil | 1.5% |
Bermuda | 1.0% |
Others (Individually Less Than 1%) | 5.1% |
| 100.0% |
See accompanying notes which are an integral part of the financial statements.
Semiannual Report
Financial Statements
Statement of Assets and Liabilities
Amounts in thousands (except per-share amounts) | December 31, 2012 (Unaudited) | |
|
|
|
Assets | ||
Investment in securities, at value (including securities loaned of $14,260) - See accompanying schedule: Unaffiliated issuers (cost $746,184) | $ 908,465 |
|
Fidelity Central Funds (cost $26,338) | 26,338 |
|
Total Investments (cost $772,522) |
| $ 934,803 |
Receivable for investments sold | 247 | |
Receivable for fund shares sold | 1,138 | |
Dividends receivable | 257 | |
Distributions receivable from Fidelity Central Funds | 62 | |
Prepaid expenses | 3 | |
Other receivables | 100 | |
Total assets | 936,610 | |
|
|
|
Liabilities | ||
Payable for fund shares redeemed | $ 5,459 | |
Accrued management fee | 488 | |
Other affiliated payables | 177 | |
Other payables and accrued expenses | 38 | |
Collateral on securities loaned, at value | 14,282 | |
Total liabilities | 20,444 | |
|
|
|
Net Assets | $ 916,166 | |
Net Assets consist of: |
| |
Paid in capital | $ 1,305,646 | |
Distributions in excess of net investment income | (10) | |
Accumulated undistributed net realized gain (loss) on investments and foreign currency transactions | (551,743) | |
Net unrealized appreciation (depreciation) on investments and assets and liabilities in foreign currencies | 162,273 | |
Net Assets | $ 916,166 | |
See accompanying notes which are an integral part of the financial statements.
Semiannual Report
Financial Statements - continued
Statement of Assets and Liabilities - continued
Amounts in thousands (except per-share amounts) | December 31, 2012 (Unaudited) | |
|
|
|
Growth Discovery: | $ 15.58 | |
|
|
|
Class K: | $ 15.57 | |
See accompanying notes which are an integral part of the financial statements.
Semiannual Report
Statement of Operations
Amounts in thousands | Six months ended December 31, 2012 (Unaudited) | |
|
|
|
Investment Income |
|
|
Dividends |
| $ 6,629 |
Income from Fidelity Central Funds (including $661 from security lending) |
| 685 |
Total income |
| 7,314 |
|
|
|
Expenses | ||
Management fee | $ 2,758 | |
Performance adjustment | 484 | |
Transfer agent fees | 941 | |
Accounting and security lending fees | 168 | |
Custodian fees and expenses | 23 | |
Independent trustees' compensation | 3 | |
Registration fees | 32 | |
Audit | 32 | |
Legal | 5 | |
Miscellaneous | 4 | |
Total expenses before reductions | 4,450 | |
Expense reductions | (84) | 4,366 |
Net investment income (loss) | 2,948 | |
Realized and Unrealized Gain (Loss) Net realized gain (loss) on: | ||
Investment securities: |
|
|
Unaffiliated issuers | 22,204 | |
Foreign currency transactions | 8 | |
Total net realized gain (loss) |
| 22,212 |
Change in net unrealized appreciation (depreciation) on: Investment securities | 11,491 | |
Assets and liabilities in foreign currencies | (1) | |
Total change in net unrealized appreciation (depreciation) |
| 11,490 |
Net gain (loss) | 33,702 | |
Net increase (decrease) in net assets resulting from operations | $ 36,650 | |
See accompanying notes which are an integral part of the financial statements.
Semiannual Report
Financial Statements - continued
Statement of Changes in Net Assets
Amounts in thousands | Six months ended | Year ended |
Increase (Decrease) in Net Assets |
|
|
Operations |
|
|
Net investment income (loss) | $ 2,948 | $ 3,074 |
Net realized gain (loss) | 22,212 | 13,743 |
Change in net unrealized appreciation (depreciation) | 11,490 | (767) |
Net increase (decrease) in net assets resulting | 36,650 | 16,050 |
Distributions to shareholders from net investment income | (3,920) | (2,613) |
Distributions to shareholders from net realized gain | - | (4,056) |
Total distributions | (3,920) | (6,669) |
Share transactions - net increase (decrease) | (135,199) | (69,861) |
Total increase (decrease) in net assets | (102,469) | (60,480) |
|
|
|
Net Assets | ||
Beginning of period | 1,018,635 | 1,079,115 |
End of period (including distributions in excess of net investment income of $10 and undistributed net investment income of $962, respectively) | $ 916,166 | $ 1,018,635 |
See accompanying notes which are an integral part of the financial statements.
Semiannual Report
Financial Highlights - Growth Discovery
| Six months ended December 31, 2012 | Years ended June 30, | ||||
| (Unaudited) | 2012 | 2011 | 2010 | 2009 | 2008 |
Selected Per-Share Data |
|
|
|
|
|
|
Net asset value, beginning of period | $ 15.09 | $ 14.88 | $ 10.54 | $ 9.04 | $ 14.61 | $ 14.36 |
Income from Investment Operations |
|
|
|
|
|
|
Net investment income (loss) D | .04 | .04 | .05 | .01 | .04 | .09 |
Net realized and unrealized gain (loss) | .51 | .26 | 4.37 | 1.52 | (5.54) | .20 |
Total from investment operations | .55 | .30 | 4.42 | 1.53 | (5.50) | .29 |
Distributions from net investment income | (.06) | (.03) | (.03) | (.03) | (.07) | (.04) |
Distributions from net realized gain | - | (.06) | (.05) | (.01) | - | - |
Total distributions | (.06) | (.09) | (.08) | (.03) H | (.07) | (.04) |
Net asset value, end of period | $ 15.58 | $ 15.09 | $ 14.88 | $ 10.54 | $ 9.04 | $ 14.61 |
Total Return B,C | 3.65% | 2.07% | 42.09% | 16.96% | (37.75)% | 1.98% |
Ratios to Average Net Assets E,G | ||||||
Expenses before reductions | .92% A | .81% | .63% | .76% | .90% | .91% |
Expenses net of fee waivers, if any | .92% A | .81% | .63% | .76% | .90% | .91% |
Expenses net of all reductions | .90% A | .80% | .62% | .75% | .89% | .90% |
Net investment income (loss) | .57% A | .27% | .39% | .08% | .36% | .57% |
Supplemental Data |
|
|
|
|
|
|
Net assets, end of period (in millions) | $ 794 | $ 875 | $ 932 | $ 604 | $ 777 | $ 1,768 |
Portfolio turnover rate F | 64% A | 74% | 72% | 87% | 166% | 150% |
A Annualized
B Total returns for periods of less than one year are not annualized.
C Total returns would have been lower if certain expenses had not been reduced during the applicable periods shown.
D Calculated based on average shares outstanding during the period.
E Fees and expenses of any underlying Fidelity Central Funds are not included in the Fund's expense ratio. The Fund indirectly bears its proportionate share of the expenses of any underlying Fidelity Central Funds.
F Amount does not include the portfolio activity of any underlying Fidelity Central Funds.
G Expense ratios reflect operating expenses of the class. Expenses before reductions do not reflect amounts reimbursed by the investment adviser or reductions from brokerage service arrangements or reductions from other expense offset arrangements and do not represent the amount paid by the class during periods when reimbursements or reductions occur. Expenses net of fee waivers reflect expenses after reimbursement by the investment adviser but prior to reductions from brokerage service arrangements or other expense offset arrangements. Expenses net of all reductions represent the net expenses paid by the class.
H Total distributions of $.03 per share is comprised of distributions from net investment income of $.027 and distributions from net realized gain of $.005 per share.
See accompanying notes which are an integral part of the financial statements.
Semiannual Report
Financial Highlights - Class K
| Six months ended December 31, 2012 | Years ended June 30, | ||||
| (Unaudited) | 2012 | 2011 | 2010 | 2009 | 2008 G |
Selected Per-Share Data | ||||||
Net asset value, beginning of period | $ 15.09 | $ 14.88 | $ 10.55 | $ 9.05 | $ 14.62 | $ 14.94 |
Income from Investment Operations |
|
|
|
|
|
|
Net investment income (loss) D | .06 | .06 | .08 | .03 | .05 | .03 |
Net realized and unrealized gain (loss) | .51 | .26 | 4.36 | 1.53 | (5.53) | (.35) |
Total from investment operations | .57 | .32 | 4.44 | 1.56 | (5.48) | (.32) |
Distributions from net investment income | (.09) | (.06) | (.06) | (.05) | (.09) | - |
Distributions from net realized gain | - | (.06) | (.05) | (.01) | - | - |
Total distributions | (.09) | (.11) J | (.11) | (.06) I | (.09) | - |
Net asset value, end of period | $ 15.57 | $ 15.09 | $ 14.88 | $ 10.55 | $ 9.05 | $ 14.62 |
Total Return B,C | 3.75% | 2.27% | 42.26% | 17.25% | (37.60)% | (2.14)% |
Ratios to Average Net Assets E,H | ||||||
Expenses before reductions | .76% A | .64% | .44% | .53% | .67% | .76% A |
Expenses net of fee waivers, if any | .76% A | .64% | .44% | .53% | .67% | .76% A |
Expenses net of all reductions | .74% A | .63% | .43% | .52% | .67% | .75% A |
Net investment income (loss) | .74% A | .44% | .58% | .31% | .59% | 1.44% A |
Supplemental Data |
|
|
|
|
|
|
Net assets, end of period (000 omitted) | $ 122,222 | $ 143,956 | $ 146,740 | $ 42,570 | $ 30,939 | $ 98 |
Portfolio turnover rate F | 64% A | 74% | 72% | 87% | 166% | 150% |
A Annualized
B Total returns for periods of less than one year are not annualized.
C Total returns would have been lower if certain expenses had not been reduced during the applicable periods shown.
D Calculated based on average shares outstanding during the period.
E Fees and expenses of any underlying Fidelity Central Funds are not included in the Fund's expense ratio. The Fund indirectly bears its proportionate share of the expenses of any underlying Fidelity Central Funds.
F Amount does not include the portfolio activity of any underlying Fidelity Central Funds.
G For the period May 9, 2008 (commencement of sale of shares) to June 30, 2008.
H Expense ratios reflect operating expenses of the class. Expenses before reductions do not reflect amounts reimbursed by the investment adviser or reductions from brokerage service arrangements or reductions from other expense offset arrangements and do not represent the amount paid by the class during periods when reimbursements or reductions occur. Expense ratios before reductions for start-up periods may not be representative of longer-term operating periods. Expenses net of fee waivers reflect expenses after reimbursement by the investment adviser but prior to reductions from brokerage service arrangements or other expense offset arrangements. Expenses net of all reductions represent the net expenses paid by the class.
I Total distributions of $.06 per share is comprised of distributions from net investment income of $.054 and distributions from net realized gain of $.005 per share.
J Total distributions of $.11 per share is comprised of distributions from net investment income of $.058 and distributions from net realized gain of $.055 per share.
See accompanying notes which are an integral part of the financial statements.
Semiannual Report
Notes to Financial Statements
For the period ended December 31, 2012 (Unaudited)
(Amounts in thousands except percentages)
1. Organization.
Fidelity® Growth Discovery Fund (the Fund) is a fund of Fidelity Hastings Street Trust (the Trust) and is authorized to issue an unlimited number of shares. The Trust is registered under the Investment Company Act of 1940, as amended (the 1940 Act), as an open-end management investment company organized as a Massachusetts business trust. The Fund offers Growth Discovery and Class K shares, each of which has equal rights as to assets and voting privileges. Each class has exclusive voting rights with respect to matters that affect that class. Investment income, realized and unrealized capital gains and losses, the common expenses of the Fund, and certain fund-level expense reductions, if any, are allocated on a pro-rata basis to each class based on the relative net assets of each class to the total net assets of the Fund. Each class differs with respect to transfer agent fees incurred. Certain expense reductions may also differ by class.
2. Investments in Fidelity Central Funds.
The Fund invests in Fidelity Central Funds, which are open-end investment companies available only to other investment companies and accounts managed by Fidelity Management & Research Company (FMR) and its affiliates. The Fund's Schedule of Investments lists each of the Fidelity Central Funds held as of period end, if any, as an investment of the Fund, but does not include the underlying holdings of each Fidelity Central Fund. As an Investing Fund, the Fund indirectly bears its proportionate share of the expenses of the underlying Fidelity Central Funds.
The Money Market Central Funds seek preservation of capital and current income and are managed by Fidelity Investments Money Management, Inc. (FIMM), an affiliate of FMR.
A complete unaudited list of holdings for each Fidelity Central Fund is available upon request or at the Securities and Exchange Commission (the SEC) website at www.sec.gov. In addition, the financial statements of the Fidelity Central Funds are available on the SEC website or upon request.
3. Significant Accounting Policies.
The financial statements have been prepared in conformity with accounting principles generally accepted in the United States of America (GAAP), which require management to make certain estimates and assumptions at the date of the financial statements. Actual results could differ from those estimates. Subsequent events, if any, through the date that the financial statements were issued have been evaluated in the preparation of the financial statements. The following summarizes the significant accounting policies of the Fund:
Investment Valuation. Investments are valued as of 4:00 p.m. Eastern time on the last calendar day of the period. In accordance with valuation policies and procedures approved by the Board of Trustees (the Board), the Fund attempts to obtain prices from
Semiannual Report
3. Significant Accounting Policies - continued
Investment Valuation - continued
one or more third party pricing vendors or brokers to value its investments. When current market prices, quotations or rates are not readily available or reliable, investments will be fair valued in good faith by the FMR Fair Value Committee (the Committee), in accordance with procedures adopted by the Fund's Board. Factors used in determining fair value vary by investment type and may include market or investment specific events. The frequency with which these procedures are used cannot be predicted and they may be utilized to a significant extent. The Committee oversees the Fund's valuation policies and procedures and is responsible for approving and reporting to the Board all fair value determinations.
The Fund categorizes the inputs to valuation techniques used to value its investments into a disclosure hierarchy consisting of three levels as shown below:
Level 1 - quoted prices in active markets for identical investments
Level 2 - other significant observable inputs (including quoted prices for similar investments, interest rates, prepayment speeds, etc.)
Level 3 - unobservable inputs (including the Fund's own assumptions based on the best information available)
Valuation techniques used to value the Fund's investments by major category are as follows:
Equity securities, including restricted securities, for which market quotations are readily available, are valued at the last reported sale price or official closing price as reported by a third party pricing vendor on the primary market or exchange on which they are traded and are categorized as Level 1 in the hierarchy. In the event there were no sales during the day or closing prices are not available, securities are valued at the last quoted bid price or may be valued using the last available price and are generally categorized as Level 2 in the hierarchy. For foreign equity securities, when significant market or security specific events arise, comparisons to the valuation of American Depositary Receipts (ADRs), futures contracts, Exchange-Traded Funds (ETFs) and certain indexes as well as quoted prices for similar securities are used and are categorized as Level 2 in the hierarchy. Utilizing these techniques may result in transfers between Level 1 and Level 2.
Investments in open-end mutual funds, including the Fidelity Central Funds, are valued at their closing net asset value (NAV) each business day and are categorized as Level 1 in the hierarchy.
Semiannual Report
Notes to Financial Statements (Unaudited) - continued
(Amounts in thousands except percentages)
3. Significant Accounting Policies - continued
Investment Valuation - continued
Changes in valuation techniques may result in transfers in or out of an assigned level within the disclosure hierarchy. The aggregate value of investments by input level, as of December 31, 2012, is included at the end of the Fund's Schedule of Investments.
Foreign Currency. The Fund may use foreign currency contracts to facilitate transactions in foreign-denominated securities. Gains and losses from these transactions may arise from changes in the value of the foreign currency or if the counterparties do not perform under the contracts' terms.
Foreign-denominated assets, including investment securities, and liabilities are translated into U.S. dollars at the exchange rates at period end. Purchases and sales of investment securities, income and dividends received and expenses denominated in foreign currencies are translated into U.S. dollars at the exchange rate in effect on the transaction date.
The effects of exchange rate fluctuations on investments are included with the net realized and unrealized gain (loss) on investment securities. Other foreign currency transactions resulting in realized and unrealized gain (loss) are disclosed separately.
Investment Transactions and Income. For financial reporting purposes, the Fund's investment holdings and NAV include trades executed through the end of the last business day of the period. The NAV per share for processing shareholder transactions is calculated as of the close of business of the New York Stock Exchange (NYSE), normally 4:00 p.m. Eastern time and includes trades executed through the end of the prior business day. Gains and losses on securities sold are determined on the basis of identified cost and may include proceeds received from litigation. Dividend income is recorded on the ex-dividend date, except for certain dividends from foreign securities where the ex-dividend date may have passed, which are recorded as soon as the Fund is informed of the ex-dividend date. Non-cash dividends included in dividend income, if any, are recorded at the fair market value of the securities received. Distributions received on securities that represent a return of capital or capital gain are recorded as a reduction of cost of investments and/or as a realized gain. The Fund estimates the components of distributions received that may be considered return of capital distributions or capital gain distributions. Interest income and distributions from the Fidelity Central Funds are accrued as earned. Investment income is recorded net of foreign taxes withheld where recovery of such taxes is uncertain.
Expenses. Expenses directly attributable to a fund are charged to that fund. Expenses attributable to more than one fund are allocated among the respective funds on the basis of relative net assets or other appropriate methods. Expense estimates are accrued in the period to which they relate and adjustments are made when actual amounts are known.
Semiannual Report
3. Significant Accounting Policies - continued
Income Tax Information and Distributions to Shareholders. Each year, the Fund intends to qualify as a regulated investment company under Subchapter M of the Internal Revenue Code, including distributing substantially all of its taxable income and realized gains. As a result, no provision for income taxes is required. The Fund files a U.S. federal tax return, in addition to state and local tax returns as required. A fund's federal income tax returns are subject to examination by the Internal Revenue Service (IRS) for a period of three fiscal years after they are filed. State and local tax returns may be subject to examination for an additional fiscal year depending on the jurisdiction. Foreign taxes are provided for based on the Fund's understanding of the tax rules and rates that exist in the foreign markets in which it invests.
Distributions are declared and recorded on the ex-dividend date. Income dividends and capital gain distributions are declared separately for each class. Income and capital gain distributions are determined in accordance with income tax regulations, which may differ from GAAP.
Capital accounts within the financial statements are adjusted for permanent book-tax differences. These adjustments have no impact on net assets or the results of operations. Temporary book-tax differences will reverse in a subsequent period.
Book-tax differences are primarily due to foreign currency transactions, passive foreign investment companies (PFIC), partnerships, capital loss carryforwards and losses deferred due to wash sales and excise tax regulations.
The federal tax cost of investment securities and unrealized appreciation (depreciation) as of period end were as follows:
Gross unrealized appreciation | $ 181,917 |
Gross unrealized depreciation | (22,349) |
Net unrealized appreciation (depreciation) on securities and other investments | $ 159,568 |
|
|
Tax cost | $ 775,235 |
Capital loss carryforwards are only available to offset future capital gains of the Fund to the extent provided by regulations and may be limited. Under the Regulated Investment Company Modernization Act of 2010 (the Act), the Fund is permitted to carry forward capital losses incurred in taxable years beginning after December 22, 2010 for an unlimited period and such capital losses are required to be used prior to any losses that expire. At June 30, 2012, capital loss carryforwards were as follows:
Fiscal year of expiration |
|
2017 | $ (279,867) |
2018 | (260,431) |
Total capital loss carryforward | $ (540,298) |
Semiannual Report
Notes to Financial Statements (Unaudited) - continued
(Amounts in thousands except percentages)
3. Significant Accounting Policies - continued
Income Tax Information and Distributions to Shareholders - continued
The Fund intends to elect to defer to its fiscal year ending June 30, 2013 approximately $31,085 of capital losses recognized during the period November 1, 2011 to June 30, 2012.
4. Purchases and Sales of Investments.
Purchases and sales of securities, other than short-term securities, aggregated $306,905 and $392,897, respectively.
5. Fees and Other Transactions with Affiliates.
Management Fee. FMR and its affiliates provide the Fund with investment management related services for which the Fund pays a monthly management fee. The management fee is the sum of an individual fund fee rate that is based on an annual rate of .30% of the Fund's average net assets and an annualized group fee rate that averaged .26% during the period. The group fee rate is based upon the average net assets of all the mutual funds advised by FMR. The group fee rate decreases as assets under management increase and increases as assets under management decrease. In addition, the management fee is subject to a performance adjustment (up to a maximum of ± .20% of the Fund's average net assets over a 36 month performance period). The upward or downward adjustment to the management fee is based on the relative investment performance of Growth Discovery as compared to an appropriate benchmark index. For the period, the total annualized management fee rate, including the performance adjustment, was .65% of the Fund's average net assets.
Transfer Agent Fees. Fidelity Investments Institutional Operations Company, Inc. (FIIOC), an affiliate of FMR, is the transfer, dividend disbursing and shareholder servicing agent for each class of the Fund. FIIOC receives account fees and asset-based fees that vary according to the account size and type of account of the shareholders of Growth Discovery. FIIOC receives an asset-based fee of Class K's average net assets. FIIOC pays for typesetting, printing and mailing of shareholder reports, except proxy statements. For the period, transfer agent fees for each class were as follows:
| Amount | % of |
Growth Discovery | $ 909 | .21 |
Class K | 32 | .05 |
| $ 941 |
|
* Annualized
Semiannual Report
5. Fees and Other Transactions with Affiliates - continued
Accounting and Security Lending Fees. Fidelity Service Company, Inc. (FSC), an affiliate of FMR, maintains the Fund's accounting records. The accounting fee is based on the level of average net assets for each month. Under a separate contract, FSC administers the security lending program. The security lending fee is based on the number and duration of lending transactions.
Brokerage Commissions. The Fund placed a portion of its portfolio transactions with brokerage firms which are affiliates of the investment adviser. The commissions paid to these affiliated firms were $5 for the period.
Interfund Lending Program. Pursuant to an Exemptive Order issued by the SEC, the Fund, along with other registered investment companies having management contracts with FMR, may participate in an interfund lending program. This program provides an alternative credit facility allowing the funds to borrow from, or lend money to, other participating affiliated funds. At period end, there were no interfund loans outstanding. The Fund's activity in this program during the period for which loans were outstanding was as follows:
Borrower or Lender | Average Loan | Weighted Average Interest Rate | Interest Expense |
Borrower | $ 5,022 | .43% | $ -* |
* Amount represents two hundred ninety-nine dollars
6. Committed Line of Credit.
The Fund participates with other funds managed by FMR or an affiliate in a $4.25 billion credit facility (the "line of credit") to be utilized for temporary or emergency purposes to fund shareholder redemptions or for other short-term liquidity purposes. The Fund has agreed to pay commitment fees on its pro-rata portion of the line of credit, which amounted to $1 and is reflected in Miscellaneous expenses on the Statement of Operations. During the period, there were no borrowings on this line of credit.
7. Security Lending.
The Fund lends portfolio securities through a lending agent from time to time in order to earn additional income. For equity securities, a lending agent is used and may loan securities to certain qualified borrowers, including Fidelity Capital Markets (FCM), a broker-dealer affiliated with the Fund. On the settlement date of the loan, the Fund receives collateral (in the form of U.S. Treasury obligations, letters of credit and/or cash) against the loaned securities and maintains collateral in an amount not less than 100% of the market value of the loaned securities during the period of the loan. The market value of the loaned securities is determined at the close of business of the Fund and any
Semiannual Report
Notes to Financial Statements (Unaudited) - continued
(Amounts in thousands except percentages)
7. Security Lending - continued
additional required collateral is delivered to the Fund on the next business day. If the borrower defaults on its obligation to return the securities loaned because of insolvency or other reasons, a fund could experience delays and costs in recovering the securities loaned or in gaining access to the collateral. Any cash collateral received is invested in the Fidelity Securities Lending Cash Central Fund. The value of loaned securities and cash collateral at period end are disclosed on the Fund's Statement of Assets and Liabilities. The value of securities loaned to FCM at period end was $1,062. Security lending income represents the income earned on investing cash collateral, less rebates paid to borrowers and any lending agent fees associated with the loan, plus any premium payments received for lending certain types of securities. Security lending income is presented in the Statement of Operations as a component of income from Fidelity Central Funds, and includes $171 from securities loaned to FCM.
8. Expense Reductions.
Many of the brokers with whom FMR places trades on behalf of the Fund provided services to the Fund in addition to trade execution. These services included payments of certain expenses on behalf of the Fund totaling $84 for the period.
9. Distributions to Shareholders.
Distributions to shareholders of each class were as follows:
| Six months ended | Year ended |
From net investment income |
|
|
Growth Discovery | $ 3,196 | $ 2,023 |
Class K | 724 | 590 |
Total | $ 3,920 | $ 2,613 |
From net realized gain |
|
|
Growth Discovery | $ - | $ 3,518 |
Class K | - | 538 |
Total | $ - | $ 4,056 |
Semiannual Report
10. Share Transactions.
Transactions for each class of shares were as follows:
| Shares | Dollars | ||
| Six months ended | Year ended | Six months ended | Year ended |
Growth Discovery |
|
|
|
|
Shares sold | 3,118 | 15,041 | $ 48,600 | $ 218,798 |
Reinvestment of distributions | 198 | 395 | 3,039 | 5,284 |
Shares redeemed | (10,322) | (20,132) | (159,657) | (287,440) |
Net increase (decrease) | (7,006) | (4,696) | $ (108,018) | $ (63,358) |
Class K |
|
|
|
|
Shares sold | 1,878 | 5,792 | $ 28,901 | $ 82,594 |
Reinvestment of distributions | 47 | 84 | 724 | 1,128 |
Shares redeemed | (3,613) | (6,196) | (56,806) | (90,225) |
Net increase (decrease) | (1,688) | (320) | $ (27,181) | $ (6,503) |
11. Other.
The Fund's organizational documents provide former and current trustees and officers with a limited indemnification against liabilities arising in connection with the performance of their duties to the Fund. In the normal course of business, the Fund may also enter into contracts that provide general indemnifications. The Fund's maximum exposure under these arrangements is unknown as this would be dependent on future claims that may be made against the Fund. The risk of material loss from such claims is considered remote.
Semiannual Report
Board Approval of Investment Advisory Contracts and Management Fees
Fidelity Growth Discovery Fund
Each year, the Board of Trustees, including the Independent Trustees (together, the Board), votes on the renewal of the management contract and sub-advisory agreements (together, the Advisory Contracts) for the fund. The Board, assisted by the advice of fund counsel and Independent Trustees' counsel, requests and considers a broad range of information relevant to the renewal of the Advisory Contracts throughout the year.
The Board meets regularly and, at each of its meetings, considers factors that are relevant to its annual consideration of the renewal of the fund's Advisory Contracts, including the services and support provided to the fund and its shareholders. The Board has established various standing committees, each composed of and chaired by Independent Trustees with varying backgrounds, to which the Board has assigned specific subject matter responsibilities in order to enhance effective decision-making by the Board. The Board, acting directly and through its Committees, requests and receives information concerning the annual consideration of the renewal of the fund's Advisory Contracts. The Board also meets as needed to consider matters specifically related to the Board's annual consideration of the renewal of Advisory Contracts. Members of the Board may also meet with trustees of other Fidelity funds through ad hoc joint committees to discuss certain matters relevant to the Fidelity funds.
At its July 2012 meeting, the Board of Trustees, including the Independent Trustees, unanimously determined to renew the fund's Advisory Contracts. In reaching its determination, the Board considered all factors it believed relevant, including (i) the nature, extent, and quality of the services to be provided to the fund and its shareholders (including the investment performance of the fund); (ii) the competitiveness of the fund's management fee and total expense ratio relative to peer funds; (iii) the total costs of the services to be provided by and the profits to be realized by Fidelity from its relationship with the fund; (iv) the extent to which economies of scale exist and would be realized as the fund grows; and (v) whether fee levels reflect these economies of scale, if any, for the benefit of fund shareholders.
In considering whether to renew the Advisory Contracts for the fund, the Board reached a determination, with the assistance of fund counsel and Independent Trustees' counsel and through the exercise of its business judgment, that the renewal of the Advisory Contracts is in the best interests of the fund and its shareholders and that the compensation payable under the Advisory Contracts is fair and reasonable. The Board's decision to renew the Advisory Contracts was not based on any single factor, but rather was based on a comprehensive consideration of all the information provided to the Board at its meetings throughout the year. The Board, in reaching its determination to renew the Advisory Contracts, is aware that shareholders in the fund have a broad range of investment choices available to them, including a wide choice among mutual funds offered by Fidelity's competitors, and that the fund's shareholders, who have the opportunity to review and weigh the disclosure provided by the fund in its prospectus and other public disclosures, have chosen to invest in this fund, managed by Fidelity.
Semiannual Report
Nature, Extent, and Quality of Services Provided. The Board considered the staffing within the investment adviser, FMR, and the sub-advisers (together, the Investment Advisers), including the backgrounds of the fund's investment personnel, and also considered the fund's investment objective, strategies, and related investment philosophy. The Independent Trustees also had discussions with senior management of Fidelity's investment operations and investment groups. The Board considered the structure of the portfolio manager compensation program and whether this structure provides appropriate incentives to act in the best interests of the fund.
Resources Dedicated to Investment Management and Support Services. The Board and the Fund Oversight and Research Committees reviewed the general qualifications and capabilities of the Investment Advisers' investment staff, including its size, education, experience, and resources, as well as the Investment Advisers' approach to recruiting, training, managing, and compensating investment personnel. The Board also noted that FMR has continued to increase the resources devoted to non-U.S. offices, including expansion of Fidelity's global investment organization. The Board noted that Fidelity's analysts have extensive resources, tools and capabilities that allow them to conduct sophisticated quantitative and fundamental analysis, as well as credit analysis of issuers, counterparties and guarantors. The Board also believes that Fidelity's investment professionals have sufficient access to global information and data so as to provide competitive investment results over time, and that those professionals also have access to sophisticated tools that permit them to assess portfolio construction and risk and performance attribution characteristics continuously, as well as to transmit new information and research conclusions rapidly around the world. Additionally, in its deliberations, the Board considered the Investment Advisers' trading and risk management capabilities and resources, which are an integral part of the investment management process.
Shareholder and Administrative Services. The Board considered (i) the nature, extent, quality, and cost of advisory, administrative, and shareholder services performed by the Investment Advisers and their affiliates under the Advisory Contracts and under separate agreements covering transfer agency, pricing and bookkeeping, and securities lending services for the fund; (ii) the nature and extent of the supervision of third party service providers, principally custodians and subcustodians; and (iii) the resources devoted to, and the record of compliance with, the fund's compliance policies and procedures. The Board also reviewed the allocation of fund brokerage, including allocations to brokers affiliated with the Investment Advisers, the use of brokerage commissions to pay fund expenses, and the use of "soft" commission dollars to pay for research services.
Semiannual Report
Board Approval of Investment Advisory Contracts and
Management Fees - continued
The Board noted that the growth of fund assets over time across the complex allows Fidelity to reinvest in the development of services designed to enhance the value or convenience of the Fidelity funds as investment vehicles. These services include 24-hour access to account information and market information through telephone representatives and over the Internet, investor education materials and asset allocation tools, and the expanded availability of Fidelity Investor Centers.
Investment in a Large Fund Family. The Board considered the benefits to shareholders of investing in a Fidelity fund, including the benefits of investing in a fund that is part of a large family of funds offering a variety of investment disciplines and providing a large variety of mutual fund investor services. The Board noted that Fidelity had taken, or had made recommendations that resulted in the Fidelity funds taking, a number of actions over the previous year that benefited particular funds, including (i) continuing to dedicate additional resources to investment research and support of the senior management team that oversees asset management; (ii) persisting in efforts to enhance Fidelity's research capabilities, in particular, international research; (iii) launching new funds and making other enhancements to meet client needs for global and income-oriented solutions; (iv) continuing to launch dedicated lower cost underlying funds to meet investment management's portfolio construction needs related to expanding underlying fund options, specifically for the Freedom Fund product lines; (v) adopting a "Stock Selector" sector neutral investment approach and employing a team of portfolio managers who are sector specialists to manage certain funds; (vi) rationalizing product lines and gaining increased efficiencies through the mergers of several funds into other funds; (vii) strengthening the Spartan Index Fund product line by adding new funds and/or new low-cost institutional share classes, restructuring fund expenses to accommodate new classes, and reducing investment minimums for certain classes of shares; (viii) modifying the eligibility criteria for Institutional Class shares to increase their appeal to government entities and charitable investors; and (ix) reducing certain transfer agent fee rates.
Investment Performance. The Board considered whether the fund has operated in accordance with its investment objective, as well as its record of compliance with its investment restrictions. It also reviewed the fund's absolute investment performance for each class, as well as the fund's relative investment performance for each class measured over multiple periods against (i) a broad-based securities market index, and (ii) a custom peer group of mutual funds deemed appropriate by Fidelity and reviewed by the Board. The following charts considered by the Board show, over the one-, three-, and five-year periods ended December 31, 2011, as available, the cumulative total returns of Class K and the retail class of the fund, the cumulative total returns of a broad-based securities market index ("benchmark"), and a range of cumulative total returns of a custom peer group of mutual funds defined by FMR based on categories assigned by Morningstar, Inc. The box within each chart shows the 25th percentile return (top of box) and the 75th percentile return (bottom of box) of the peer group. Returns shown above the box are in the first quartile and returns shown below the box are in the fourth quartile. The percentage beaten numbers noted below each chart correspond to the percentile box and represent the percentage of funds in the peer group whose performance was equal to or lower than that of the class indicated. The fund's custom peer group, defined by FMR, is a peer group that FMR believes provides a more meaningful performance comparison than the peer group assigned by Morningstar, Inc., which assigns mutual funds to categories based on their investment styles as measured by their underlying portfolio holdings.
Semiannual Report
Fidelity Growth Discovery Fund

The Board reviewed the fund's relative investment performance against its peer group and noted that the performance of the retail class of the fund (the class with the longer performance record) was in the first quartile for the one-year period and the second quartile for the three- and five-year periods. The Board also noted that the investment performance of the fund was lower than its benchmark for all the periods shown. The Board considered that the variations in performance between the fund's classes reflect the variations in class expenses, which result in lower performance for the higher expense class. The Board discussed with FMR the fact that the fund underperformed its benchmark for each period measured. The Board also reviewed the fund's performance since inception as well as performance in the current year. The Board will continue to closely monitor performance of the fund in the coming year and discuss with FMR if other actions to address performance are appropriate.
Semiannual Report
Board Approval of Investment Advisory Contracts and
Management Fees - continued
The Board also considered that the fund's management fee is subject to upward or downward adjustment depending upon whether, and to what extent, the fund's investment performance for the performance period exceeds, or is exceeded by, the record (over the same period) of a Board-approved performance adjustment index. The Board noted that the performance adjustment provides FMR with a strong economic incentive to seek to achieve superior performance for the fund's shareholders and helps to more closely align the interests of FMR and the fund's shareholders.
Based on its review, the Board concluded that the nature, extent, and quality of services provided to the fund under the Advisory Contracts should benefit the fund's shareholders.
Competitiveness of Management Fee and Total Expense Ratio. The Board considered the fund's management fee and total expense ratio compared to "mapped groups" of competitive funds and classes. Fidelity creates "mapped groups" by combining similar Lipper investment objective categories that have comparable management fee characteristics. Combining Lipper investment objective categories aids the Board's management fee and total expense ratio comparisons by broadening the competitive group used for comparison and by reducing the number of universes to which various Fidelity funds are compared.
Management Fee. The Board considered two proprietary management fee comparisons for the 12-month periods shown in the chart below. The group of Lipper funds used by the Board for management fee comparisons is referred to below as the "Total Mapped Group." The Total Mapped Group comparison focuses on a fund's standing relative to the total universe of comparable funds available to investors in terms of gross management fees before expense reimbursements or caps, and without giving effect to the fund's performance adjustment. "TMG %" represents the percentage of funds in the Total Mapped Group that had management fees that were lower than the fund's. For example, a TMG % of 10% means that 90% of the funds in the Total Mapped Group had higher management fees than the fund. The "Asset-Size Peer Group" (ASPG) comparison focuses on a fund's standing relative to non-Fidelity funds similar in size to the fund within the Total Mapped Group. The ASPG represents at least 15% of the funds in the Total Mapped Group with comparable asset size and management fee characteristics, subject to a minimum of 50 funds (or all funds in the Total Mapped Group if fewer than 50). Additional information, such as the ASPG quartile in which the fund's management fee ranked and the impact of the fund's performance adjustment, is also included in the chart and considered by the Board.
Semiannual Report
Fidelity Growth Discovery Fund
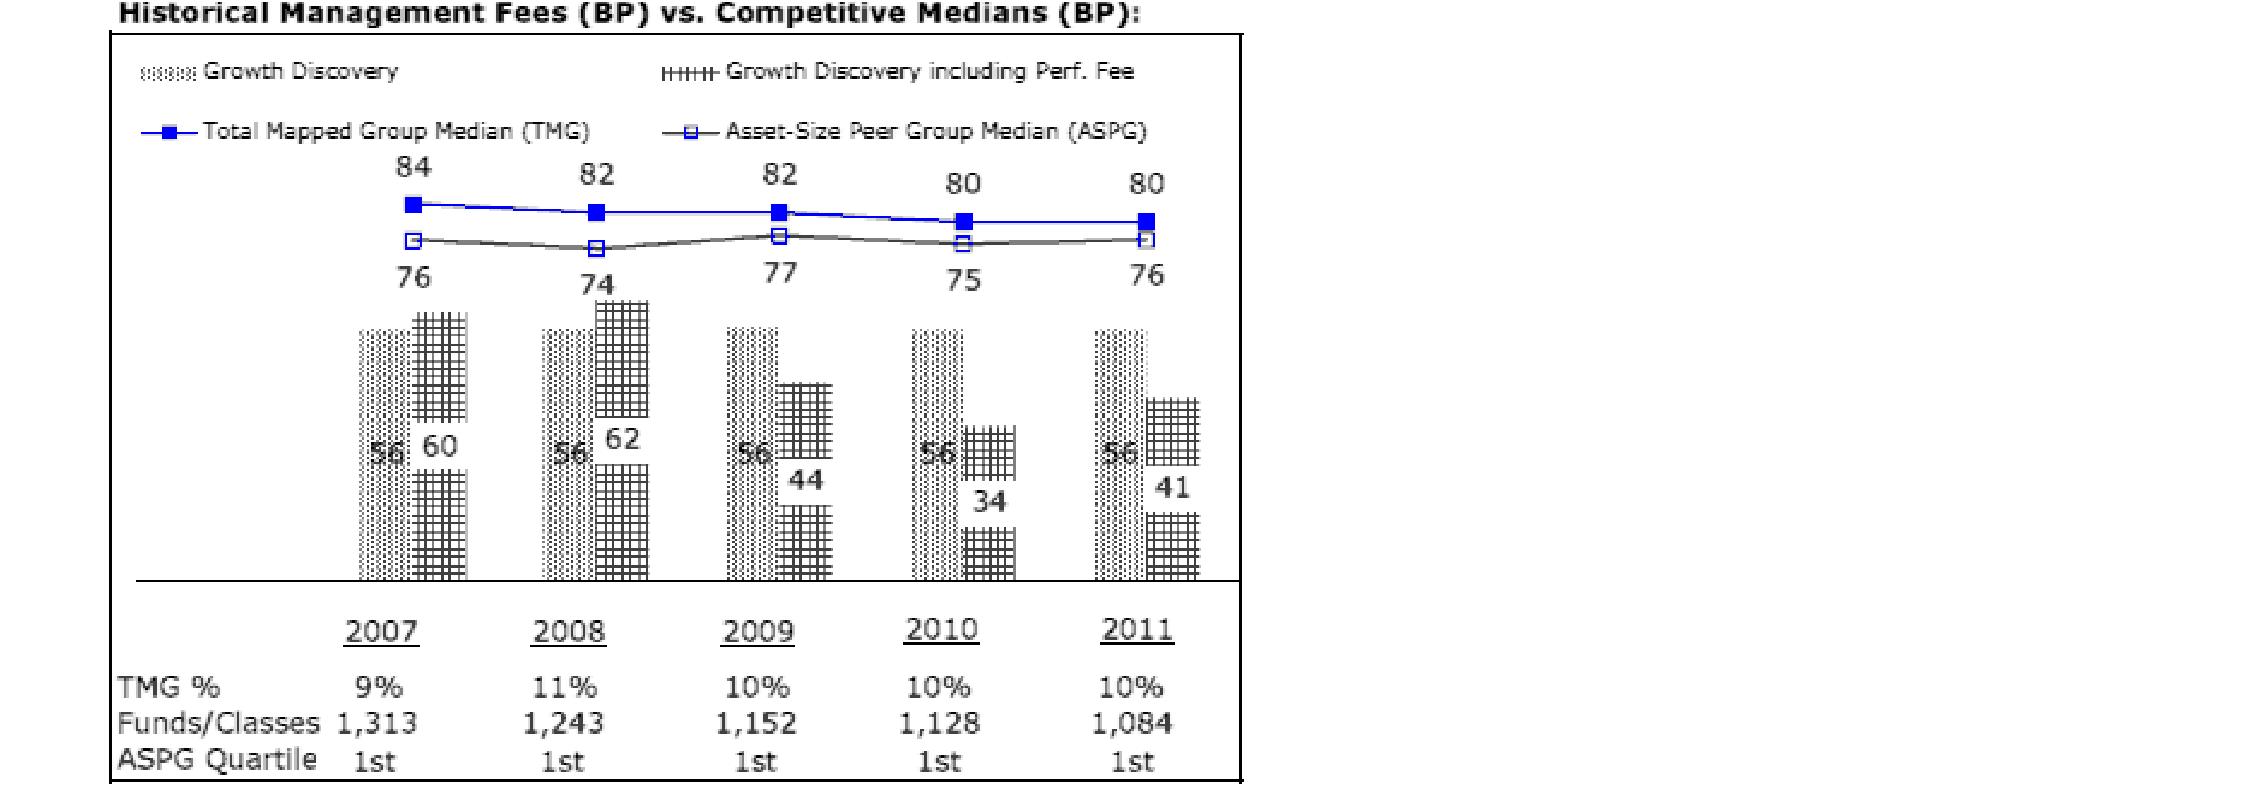
The Board noted that the fund's management fee ranked below the median of its Total Mapped Group and below the median of its ASPG for 2011. The Board also noted the effect of the fund's negative performance adjustment on the fund's management fee ranking. The Board noted that the performance adjustment for each year represents calculations for performance periods that differ from the periods shown in the performance charts above.
Furthermore, the Board considered that shareholders approved a prospective change in the index used to calculate the fund's performance adjustment, beginning February 1, 2007. The Board also considered that, because the performance adjustment is based on a rolling 36-month measurement period, during a transition period the fund's performance is compared to a blended index return that reflects the performance of the former index for the portion of the measurement period prior to February 1, 2007 and the performance of the current index for the remainder of the measurement period. The Board noted that the fund's performance adjustments for 2007 through 2010 shown in the chart above reflect the effect of using the blended index return to calculate the fund's performance adjustment.
Based on its review, the Board concluded that the fund's management fee is fair and reasonable in light of the services that the fund receives and the other factors considered.
Total Expense Ratio. In its review of each class's total expense ratio, the Board considered the fund's management fee as well as other fund or class expenses, as applicable, such as transfer agent fees, pricing and bookkeeping fees, and custodial, legal, and audit fees. The Board also noted the effects of any waivers and reimbursements on fees and expenses, as well as the impact of the fund's performance adjustment. As part of its review, the Board also considered the current and historical total expense ratios of each class of the fund compared to competitive fund median expenses. Each class of the fund is compared to those funds and classes in the Total Mapped Group (used by the Board for management fee comparisons) that have a similar sales load structure.
Semiannual Report
Board Approval of Investment Advisory Contracts and
Management Fees - continued
The Board noted that the total expense ratio of each class ranked below its competitive median for 2011.
Fees Charged to Other Fidelity Clients. The Board also considered Fidelity fee structures and other information with respect to clients of FMR and its affiliates, such as other mutual funds advised or subadvised by FMR or its affiliates, pension plan clients, and other institutional clients. The Board noted the findings of the 2010 ad hoc joint committee (created with the board of other Fidelity funds), which reviewed and compared Fidelity's institutional investment advisory business with its business of providing services to the Fidelity funds, including the differences in services provided, fees charged, and costs incurred, as well as competition in their respective marketplaces.
Based on its review of total expense ratios and fees charged to other Fidelity clients, the Board concluded that the total expense ratio of each class of the fund was reasonable in light of the services that the fund and its shareholders receive and the other factors considered.
Costs of the Services and Profitability. The Board considered the revenues earned and the expenses incurred by Fidelity in conducting the business of developing, marketing, distributing, managing, administering and servicing the fund and its shareholders. The Board also considered the level of Fidelity's profits in respect of all the Fidelity funds.
On an annual basis, FMR presents to the Board Fidelity's profitability for the fund. Fidelity calculates the profitability for each fund, as well as aggregate profitability for groups of Fidelity funds and all Fidelity funds, using a series of detailed revenue and cost allocation methodologies which originate with the books and records of Fidelity on which Fidelity's audited financial statements are based. The Audit Committee of the Board reviews any significant changes from the prior year's methodologies.
PricewaterhouseCoopers LLP (PwC), independent registered public accounting firm and auditor to Fidelity and certain Fidelity funds, has been engaged annually by the Board as part of the Board's assessment of Fidelity's profitability analysis. PwC's engagement includes the review and assessment of Fidelity's methodologies used in determining the revenues and expenses attributable to Fidelity's mutual fund business, and completion of agreed-upon procedures surrounding the mathematical accuracy of fund profitability and its conformity to allocation methodologies. After considering PwC's reports issued under the engagement and information provided by Fidelity, the Board concluded that while other allocation methods may also be reasonable, Fidelity's profitability methodologies are reasonable in all material respects.
Semiannual Report
The Board also reviewed Fidelity's non-fund businesses and fall-out benefits related to the mutual fund business as well as cases where Fidelity's affiliates may benefit from or be related to the fund's business.
The Board considered the costs of the services provided by and the profits realized by Fidelity in connection with the operation of the fund and was satisfied that the profitability was not excessive in the circumstances.
Economies of Scale. The Board considered whether there have been economies of scale in respect of the management of the Fidelity funds, whether the Fidelity funds (including the fund) have appropriately benefited from any such economies of scale, and whether there is potential for realization of any further economies of scale. The Board considered the extent to which the fund will benefit from economies of scale through increased services to the fund, through waivers or reimbursements, or through fee or expense reductions. The Board also noted that in 2009, it and the board of other Fidelity funds created an ad hoc committee (the Economies of Scale Committee) to analyze whether FMR attains economies of scale in respect of the management and servicing of the Fidelity funds, whether the Fidelity funds have appropriately benefited from such economies of scale, and whether there is potential for realization of any further economies of scale.
The Board recognized that the fund's management contract incorporates a "group fee" structure, which provides for lower group fee rates as total fund assets under FMR's management increase, and for higher group fee rates as total fund assets under FMR's management decrease. FMR calculates the group fee rates based on a tiered asset "breakpoint" schedule that varies based on asset class. The Board considered that the group fee is designed to deliver the benefits of economies of scale to fund shareholders when total Fidelity fund assets increase, even if assets of any particular fund are unchanged or have declined, because some portion of Fidelity's costs are attributable to services provided to all Fidelity funds, and all funds benefit if those costs can be allocated among more assets. The Board concluded that, given the group fee structure, fund shareholders will benefit from lower management fees as assets under FMR's management increase at the fund complex level, regardless of whether Fidelity achieves any such economies of scale.
The Board concluded, taking into account the analysis of the Economies of Scale Committee, that economies of scale, if any, are being appropriately shared between fund shareholders and Fidelity.
Semiannual Report
Board Approval of Investment Advisory Contracts and
Management Fees - continued
Additional Information Requested by the Board. In order to develop fully the factual basis for consideration of the Fidelity funds' Advisory Contracts, the Board requested and received additional information on certain topics, including (i) fund performance trends, actions to be taken by FMR to improve certain funds' overall performance, and Fidelity's long-term strategies for certain funds; (ii) the potential to further rationalize the Fidelity fund lineup with the possibility of achieving savings for the funds and Fidelity; (iii) Fidelity's compensation structure for portfolio managers and other key investment personnel; (iv) the amount of the investment that each portfolio manager has made in the Fidelity fund(s) that he or she manages; (v) the realization of fall-out benefits in certain Fidelity business units; (vi) Fidelity's group fee structures, the potential impact of regulatory changes on such structures, and the rationale for the individual fee rates of certain funds; (vii) fund profitability methodology, including Fidelity's cost allocation methodology, and the impact of certain factors on fund profitability results; (viii) trends regarding industry use of performance fee structures and the possibility of implementing performance fee structures for additional funds; and (ix) the impact of net redemptions from the Fidelity funds.
Based on its evaluation of all of the conclusions noted above, and after considering all factors it believed relevant, the Board ultimately concluded that the advisory fee structures are fair and reasonable, and that the fund's Advisory Contracts should be renewed.
Semiannual Report
Investment Adviser
Fidelity Management &
Research Company
Boston, MA
Investment Sub-Advisers
FMR Co., Inc.
Fidelity Management & Research
(U.K.) Inc.
Fidelity Management & Research
(Japan) Inc.
Fidelity Management & Research
(Hong Kong) Limited
General Distributor
Fidelity Distributors Corporation
Smithfield, RI
Transfer and Service Agents
Fidelity Investments Institutional
Operations Company, Inc.
Boston, MA
Fidelity Service Company, Inc.
Boston, MA
Custodian
Brown Brothers Harriman & Co.
Boston, MA
The Fidelity Telephone Connection
Mutual Fund 24-Hour Service
Exchanges/Redemptions
and Account Assistance 1-800-544-6666
Product Information 1-800-544-6666
Retirement Accounts 1-800-544-4774
(8 a.m. - 9 p.m.)
TDD Service 1-800-544-0118
for the deaf and hearing impaired
(9 a.m. - 9 p.m. Eastern time)
Fidelity Automated Service
Telephone (FAST ®)
1-800-544-5555
Automated line for quickest service
(Fidelity Investment logo)(registered trademark)
Corporate Headquarters
82 Devonshire St., Boston, MA 02109
www.fidelity.com
CII-USAN-0213
1.787778.109
Fidelity®
Fund -
Class K
Semiannual Report
December 31, 2012
(Fidelity Cover Art)
Contents
Shareholder Expense Example | An example of shareholder expenses. | |
Investment Changes | A summary of major shifts in the fund's investments over the past six months. | |
Investments | A complete list of the fund's investments with their market values. | |
Financial Statements | Statements of assets and liabilities, operations, and changes in net assets, as well as financial highlights. | |
Notes | Notes to the financial statements. | |
Board Approval of Investment Advisory Contracts and Management Fees |
|
To view a fund's proxy voting guidelines and proxy voting record for the 12-month period ended June 30, visit http://www.fidelity.com/proxyvotingresults or visit the Securities and Exchange Commission's (SEC) web site at http://www.sec.gov. You may also call 1-800-835-5092 to request a free copy of the proxy voting guidelines.
Standard & Poor's, S&P and S&P 500 are registered service marks of The McGraw-Hill Companies, Inc. and have been licensed for use by Fidelity Distributors Corporation.
Other third party marks appearing herein are the property of their respective owners.
All other marks appearing herein are registered or unregistered trademarks or service marks of FMR LLC or an affiliated company. © 2013 FMR LLC. All rights reserved.
This report and the financial statements contained herein are submitted for the general information of the shareholders of the fund. This report is not authorized for distribution to prospective investors in the fund unless preceded or accompanied by an effective prospectus.
A fund files its complete schedule of portfolio holdings with the SEC for the first and third quarters of each fiscal year on Form N-Q. Forms N-Q are available on the SEC's web site at http://www.sec.gov. A fund's Forms N-Q may be reviewed and copied at the SEC's Public Reference Room in Washington, DC. Information regarding the operation of the SEC's Public Reference Room may be obtained by calling 1-800-SEC-0330. For a complete list of a fund's portfolio holdings, view the most recent holdings listing, semiannual report, or annual report on Fidelity's web site at http://www.fidelity.com, http://www.advisor.fidelity.com, or http://www.401k.com, as applicable.
NOT FDIC INSURED • MAY LOSE VALUE • NO BANK GUARANTEE
Neither the fund nor Fidelity Distributors Corporation is a bank.
Semiannual Report
Shareholder Expense Example
As a shareholder of the Fund, you incur two types of costs: (1) transaction costs, and (2) ongoing costs, including management fees and other Fund expenses. This Example is intended to help you understand your ongoing costs (in dollars) of investing in the Fund and to compare these costs with the ongoing costs of investing in other mutual funds.
The Example is based on an investment of $1,000 invested at the beginning of the period and held for the entire period (July 1, 2012 to December 31, 2012).
Actual Expenses
The first line of the accompanying table for each class of the Fund provides information about actual account values and actual expenses. You may use the information in this line, together with the amount you invested, to estimate the expenses that you paid over the period. Simply divide your account value by $1,000.00 (for example, an $8,600 account value divided by $1,000.00 = 8.6), then multiply the result by the number in the first line for a class of the Fund under the heading entitled "Expenses Paid During Period" to estimate the expenses you paid on your account during this period. A small balance maintenance fee of $12.00 that is charged once a year may apply for certain accounts with a value of less than $2,000. This fee is not included in the table below. If it was, the estimate of expenses you paid during the period would be higher, and your ending account value lower, by this amount. In addition, the Fund, as a shareholder in the underlying Fidelity Central Funds, will indirectly bear its pro-rata share of the fees and expenses incurred by the underlying Fidelity Central Funds. These fees and expenses are not included in the Fund's annualized expense ratio used to calculate the expense estimate in the table below.
Hypothetical Example for Comparison Purposes
The second line of the accompanying table for each class of the Fund provides information about hypothetical account values and hypothetical expenses based on a Class' actual expense ratio and an assumed rate of return of 5% per year before expenses, which is not the Class' actual return. The hypothetical account values and expenses may not be used to estimate the actual ending account balance or expenses you paid for the period. You may use this information to compare the ongoing costs of investing in the Fund and other funds. To do so, compare this 5% hypothetical example with the 5% hypothetical examples that appear in the shareholder reports of the other funds. A small balance maintenance fee of $12.00 that is charged once a year may apply for certain accounts with a value of less than $2,000. This fee is not included in the table below. If it was, the estimate of expenses you paid during the period would be higher, and your ending account value lower, by this amount. In addition, the Fund, as a shareholder in the underlying Fidelity Central Funds, will indirectly bear its pro-rata share of the fees and expenses incurred by the underlying Fidelity Central Funds. These fees and expenses are not included in the Fund's annualized expense ratio used to calculate the expense estimate in the table below.
Please note that the expenses shown in the table are meant to highlight your ongoing costs only and do not reflect any transaction costs. Therefore, the second line of the table is useful in comparing ongoing costs only, and will not help you determine the relative total costs of owning different funds.
Semiannual Report
Shareholder Expense Example - continued
| Annualized | Beginning | Ending | Expenses Paid |
Fidelity Fund | .57% |
|
|
|
Actual |
| $ 1,000.00 | $ 1,052.20 | $ 2.95 |
HypotheticalA |
| $ 1,000.00 | $ 1,022.33 | $ 2.91 |
Class K | .43% |
|
|
|
Actual |
| $ 1,000.00 | $ 1,052.90 | $ 2.23 |
HypotheticalA |
| $ 1,000.00 | $ 1,023.04 | $ 2.19 |
A 5% return per year before expenses
* Expenses are equal to each Class' annualized expense ratio, multiplied by the average account value over the period, multiplied by 184/365 (to reflect the one-half year period).
Semiannual Report
Investment Changes (Unaudited)
Top Ten Stocks as of December 31, 2012 | ||
| % of fund's | % of fund's net assets |
Apple, Inc. | 4.0 | 6.8 |
Google, Inc. Class A | 2.9 | 1.4 |
General Electric Co. | 2.8 | 0.0 |
Pfizer, Inc. | 2.3 | 1.8 |
Chevron Corp. | 2.0 | 2.6 |
Wells Fargo & Co. | 2.0 | 2.8 |
Citigroup, Inc. | 2.0 | 0.7 |
Amgen, Inc. | 2.0 | 1.8 |
The Coca-Cola Co. | 1.9 | 2.1 |
JPMorgan Chase & Co. | 1.9 | 1.1 |
| 23.8 | |
Top Five Market Sectors as of December 31, 2012 | ||
| % of fund's | % of fund's net assets |
Information Technology | 18.3 | 20.3 |
Financials | 16.5 | 12.4 |
Health Care | 14.1 | 14.9 |
Consumer Discretionary | 11.5 | 10.8 |
Consumer Staples | 9.0 | 13.0 |
Asset Allocation (% of fund's net assets) | |||||||
As of December 31, 2012* | As of June 30, 2012** | ||||||
 | Stocks 99.1% |
| | Stocks 95.8% |
| ||
 | Convertible Securities 0.1% |
| | Convertible Securities 0.1% |
| ||
 | Short-Term |
| | Short-Term |
| ||
* Foreign investments | 10.5% |
| ** Foreign investments | 9.2% |
| ||

Semiannual Report
Investments December 31, 2012 (Unaudited)
Showing Percentage of Net Assets
Common Stocks - 98.4% | |||
Shares | Value (000s) | ||
CONSUMER DISCRETIONARY - 10.8% | |||
Hotels, Restaurants & Leisure - 1.9% | |||
McDonald's Corp. | 302,300 | $ 26,666 | |
Starbucks Corp. | 770,098 | 41,293 | |
Yum! Brands, Inc. | 461,900 | 30,670 | |
| 98,629 | ||
Household Durables - 2.2% | |||
D.R. Horton, Inc. | 2,190,600 | 43,330 | |
PulteGroup, Inc. (a) | 796,100 | 14,457 | |
Ryland Group, Inc. | 651,000 | 23,762 | |
Whirlpool Corp. | 294,100 | 29,925 | |
| 111,474 | ||
Internet & Catalog Retail - 0.7% | |||
Amazon.com, Inc. (a) | 149,500 | 37,545 | |
Media - 3.0% | |||
Comcast Corp. Class A | 1,807,000 | 67,546 | |
The Walt Disney Co. | 1,023,800 | 50,975 | |
Virgin Media, Inc. (d) | 999,000 | 36,713 | |
| 155,234 | ||
Multiline Retail - 0.4% | |||
Next PLC | 314,600 | 19,097 | |
Specialty Retail - 2.2% | |||
Home Depot, Inc. | 1,344,800 | 83,176 | |
TJX Companies, Inc. | 718,900 | 30,517 | |
| 113,693 | ||
Textiles, Apparel & Luxury Goods - 0.4% | |||
Ralph Lauren Corp. | 143,873 | 21,569 | |
TOTAL CONSUMER DISCRETIONARY | 557,241 | ||
CONSUMER STAPLES - 9.0% | |||
Beverages - 3.1% | |||
Beam, Inc. | 169,300 | 10,343 | |
Diageo PLC | 455,779 | 13,275 | |
Dr. Pepper Snapple Group, Inc. | 351,600 | 15,534 | |
Grupo Modelo SAB de CV Series C | 2,373,700 | 21,305 | |
The Coca-Cola Co. | 2,756,000 | 99,905 | |
| 160,362 | ||
Common Stocks - continued | |||
Shares | Value (000s) | ||
CONSUMER STAPLES - continued | |||
Food & Staples Retailing - 1.4% | |||
CVS Caremark Corp. | 1,001,700 | $ 48,432 | |
Wal-Mart Stores, Inc. | 323,600 | 22,079 | |
| 70,511 | ||
Food Products - 1.6% | |||
Bunge Ltd. | 435,000 | 31,620 | |
Kraft Foods Group, Inc. | 441,133 | 20,058 | |
Mondelez International, Inc. | 1,323,400 | 33,707 | |
| 85,385 | ||
Household Products - 0.7% | |||
Colgate-Palmolive Co. | 230,400 | 24,086 | |
Kimberly-Clark Corp. | 120,000 | 10,132 | |
| 34,218 | ||
Tobacco - 2.2% | |||
British American Tobacco PLC (United Kingdom) | 403,900 | 20,532 | |
Japan Tobacco, Inc. | 774,000 | 21,865 | |
Lorillard, Inc. | 66,000 | 7,700 | |
Philip Morris International, Inc. | 772,900 | 64,645 | |
| 114,742 | ||
TOTAL CONSUMER STAPLES | 465,218 | ||
ENERGY - 8.8% | |||
Energy Equipment & Services - 0.4% | |||
Ensco PLC Class A | 100,000 | 5,928 | |
Ocean Rig UDW, Inc. (United States) (a) | 663,410 | 9,931 | |
Seadrill Partners LLC | 216,200 | 5,546 | |
| 21,405 | ||
Oil, Gas & Consumable Fuels - 8.4% | |||
Anadarko Petroleum Corp. | 435,700 | 32,377 | |
Cheniere Energy, Inc. (a) | 439,100 | 8,246 | |
Chevron Corp. | 951,200 | 102,863 | |
EV Energy Partners LP | 259,500 | 14,677 | |
Exxon Mobil Corp. | 899,700 | 77,869 | |
Hess Corp. | 221,800 | 11,747 | |
HollyFrontier Corp. | 298,400 | 13,891 | |
InterOil Corp. (a)(d) | 205,800 | 11,428 | |
Marathon Oil Corp. | 350,000 | 10,731 | |
Marathon Petroleum Corp. | 673,800 | 42,449 | |
Occidental Petroleum Corp. | 170,700 | 13,077 | |
Common Stocks - continued | |||
Shares | Value (000s) | ||
ENERGY - continued | |||
Oil, Gas & Consumable Fuels - continued | |||
Phillips 66 | 257,000 | $ 13,647 | |
The Williams Companies, Inc. | 1,197,000 | 39,190 | |
Valero Energy Corp. | 789,800 | 26,948 | |
WPX Energy, Inc. | 755,300 | 11,239 | |
| 430,379 | ||
TOTAL ENERGY | 451,784 | ||
FINANCIALS - 16.5% | |||
Capital Markets - 2.0% | |||
Goldman Sachs Group, Inc. | 257,700 | 32,872 | |
Morgan Stanley | 1,573,700 | 30,089 | |
T. Rowe Price Group, Inc. | 280,200 | 18,249 | |
UBS AG (NY Shares) | 1,441,000 | 22,681 | |
| 103,891 | ||
Commercial Banks - 4.2% | |||
M&T Bank Corp. | 314,300 | 30,949 | |
SunTrust Banks, Inc. | 1,414,900 | 40,112 | |
U.S. Bancorp | 1,033,000 | 32,994 | |
Wells Fargo & Co. | 2,969,167 | 101,486 | |
Zions Bancorporation | 601,351 | 12,869 | |
| 218,410 | ||
Consumer Finance - 1.6% | |||
American Express Co. | 567,092 | 32,596 | |
Discover Financial Services | 1,323,400 | 51,017 | |
| 83,613 | ||
Diversified Financial Services - 5.0% | |||
Bank of America Corp. | 4,914,400 | 57,007 | |
Citigroup, Inc. | 2,549,910 | 100,874 | |
JPMorgan Chase & Co. | 2,207,000 | 97,042 | |
| 254,923 | ||
Insurance - 1.6% | |||
American International Group, Inc. (a) | 825,000 | 29,123 | |
Berkshire Hathaway, Inc. Class B (a) | 592,400 | 53,138 | |
| 82,261 | ||
Real Estate Investment Trusts - 2.1% | |||
American Tower Corp. | 871,300 | 67,325 | |
AvalonBay Communities, Inc. | 140,000 | 18,983 | |
Common Stocks - continued | |||
Shares | Value (000s) | ||
FINANCIALS - continued | |||
Real Estate Investment Trusts - continued | |||
Public Storage | 87,900 | $ 12,742 | |
Weyerhaeuser Co. | 300,000 | 8,346 | |
| 107,396 | ||
TOTAL FINANCIALS | 850,494 | ||
HEALTH CARE - 14.1% | |||
Biotechnology - 5.3% | |||
Acorda Therapeutics, Inc. (a) | 551,237 | 13,704 | |
Amgen, Inc. | 1,164,700 | 100,537 | |
Biogen Idec, Inc. (a) | 334,600 | 49,076 | |
BioMarin Pharmaceutical, Inc. (a) | 356,400 | 17,553 | |
Elan Corp. PLC sponsored ADR (a) | 1,648,296 | 16,829 | |
Gilead Sciences, Inc. (a) | 557,400 | 40,941 | |
Grifols SA ADR | 332,535 | 8,623 | |
Prothena Corp. PLC (a) | 40,202 | 295 | |
Seattle Genetics, Inc. (a)(d) | 264,300 | 6,132 | |
Theravance, Inc. (a) | 710,200 | 15,816 | |
| 269,506 | ||
Health Care Equipment & Supplies - 0.5% | |||
Covidien PLC | 446,500 | 25,781 | |
Health Care Providers & Services - 1.0% | |||
Brookdale Senior Living, Inc. (a) | 838,400 | 21,228 | |
Henry Schein, Inc. (a) | 351,300 | 28,266 | |
Qualicorp SA (a) | 281,000 | 2,946 | |
| 52,440 | ||
Pharmaceuticals - 7.3% | |||
Allergan, Inc. | 545,200 | 50,011 | |
AVANIR Pharmaceuticals Class A (a)(d) | 1,337,500 | 3,518 | |
Eli Lilly & Co. | 1,084,300 | 53,478 | |
Johnson & Johnson | 1,050,000 | 73,605 | |
Merck & Co., Inc. | 1,941,100 | 79,469 | |
Pfizer, Inc. | 4,679,400 | 117,359 | |
| 377,440 | ||
TOTAL HEALTH CARE | 725,167 | ||
INDUSTRIALS - 8.8% | |||
Aerospace & Defense - 1.3% | |||
Honeywell International, Inc. | 425,000 | 26,975 | |
Common Stocks - continued | |||
Shares | Value (000s) | ||
INDUSTRIALS - continued | |||
Aerospace & Defense - continued | |||
Raytheon Co. | 125,000 | $ 7,195 | |
Textron, Inc. | 1,385,800 | 34,354 | |
| 68,524 | ||
Building Products - 1.5% | |||
Armstrong World Industries, Inc. | 973,400 | 49,381 | |
ASSA ABLOY AB (B Shares) | 678,600 | 25,544 | |
| 74,925 | ||
Industrial Conglomerates - 3.3% | |||
Danaher Corp. | 443,800 | 24,808 | |
General Electric Co. | 6,908,400 | 145,007 | |
| 169,815 | ||
Machinery - 1.0% | |||
Cummins, Inc. | 499,400 | 54,110 | |
Road & Rail - 1.6% | |||
Union Pacific Corp. | 643,300 | 80,876 | |
Trading Companies & Distributors - 0.1% | |||
Beacon Roofing Supply, Inc. (a) | 150,000 | 4,992 | |
TOTAL INDUSTRIALS | 453,242 | ||
INFORMATION TECHNOLOGY - 18.3% | |||
Communications Equipment - 2.6% | |||
Motorola Solutions, Inc. | 1,274,300 | 70,953 | |
QUALCOMM, Inc. | 1,030,800 | 63,930 | |
| 134,883 | ||
Computers & Peripherals - 4.0% | |||
Apple, Inc. | 383,500 | 204,415 | |
Electronic Equipment & Components - 1.3% | |||
Amphenol Corp. Class A | 972,738 | 62,936 | |
InvenSense, Inc. (a)(d) | 627,800 | 6,975 | |
| 69,911 | ||
Internet Software & Services - 4.9% | |||
eBay, Inc. (a) | 1,581,900 | 80,709 | |
Facebook, Inc. Class A | 260,071 | 6,926 | |
Google, Inc. Class A (a) | 211,800 | 150,245 | |
LinkedIn Corp. (a) | 115,700 | 13,285 | |
| 251,165 | ||
Common Stocks - continued | |||
Shares | Value (000s) | ||
INFORMATION TECHNOLOGY - continued | |||
IT Services - 1.7% | |||
Cognizant Technology Solutions Corp. Class A (a) | 323,100 | $ 23,926 | |
Fidelity National Information Services, Inc. | 360,700 | 12,556 | |
Visa, Inc. Class A | 352,600 | 53,447 | |
| 89,929 | ||
Semiconductors & Semiconductor Equipment - 2.2% | |||
Altera Corp. | 637,300 | 21,949 | |
ASML Holding NV | 527,427 | 33,972 | |
NXP Semiconductors NV (a) | 663,500 | 17,496 | |
Samsung Electronics Co. Ltd. | 25,968 | 37,554 | |
Skyworks Solutions, Inc. (a) | 50,000 | 1,015 | |
| 111,986 | ||
Software - 1.6% | |||
Citrix Systems, Inc. (a) | 189,900 | 12,486 | |
Oracle Corp. | 2,046,500 | 68,189 | |
| 80,675 | ||
TOTAL INFORMATION TECHNOLOGY | 942,964 | ||
MATERIALS - 6.9% | |||
Chemicals - 4.1% | |||
Arkema SA | 246,400 | 25,872 | |
Eastman Chemical Co. | 541,100 | 36,822 | |
Ecolab, Inc. | 150,000 | 10,785 | |
LyondellBasell Industries NV Class A | 200,105 | 11,424 | |
Mexichem SAB de CV | 1,451,700 | 8,098 | |
Monsanto Co. | 724,900 | 68,612 | |
Sherwin-Williams Co. | 120,600 | 18,551 | |
W.R. Grace & Co. (a) | 448,100 | 30,126 | |
| 210,290 | ||
Construction Materials - 2.1% | |||
HeidelbergCement Finance AG | 243,500 | 14,900 | |
Lafarge SA (Bearer) | 297,300 | 19,197 | |
Martin Marietta Materials, Inc. | 410,000 | 38,655 | |
Vulcan Materials Co. | 712,100 | 37,065 | |
| 109,817 | ||
Common Stocks - continued | |||
Shares | Value (000s) | ||
MATERIALS - continued | |||
Metals & Mining - 0.7% | |||
Rio Tinto PLC sponsored ADR | 300,000 | $ 17,427 | |
Vale SA (PN-A) sponsored ADR | 800,000 | 16,240 | |
| 33,667 | ||
TOTAL MATERIALS | 353,774 | ||
TELECOMMUNICATION SERVICES - 2.6% | |||
Diversified Telecommunication Services - 1.9% | |||
CenturyLink, Inc. | 601,300 | 23,523 | |
Iliad SA | 120,165 | 20,772 | |
Verizon Communications, Inc. | 1,228,800 | 53,170 | |
| 97,465 | ||
Wireless Telecommunication Services - 0.7% | |||
Sprint Nextel Corp. (a) | 4,593,200 | 26,043 | |
Vodafone Group PLC sponsored ADR | 426,300 | 10,738 | |
| 36,781 | ||
TOTAL TELECOMMUNICATION SERVICES | 134,246 | ||
UTILITIES - 2.6% | |||
Electric Utilities - 1.6% | |||
Edison International | 671,400 | 30,341 | |
NextEra Energy, Inc. | 478,700 | 33,121 | |
PPL Corp. | 597,000 | 17,092 | |
| 80,554 | ||
Gas Utilities - 0.5% | |||
ONEOK, Inc. | 603,300 | 25,791 | |
Multi-Utilities - 0.5% | |||
Sempra Energy | 393,200 | 27,894 | |
TOTAL UTILITIES | 134,239 | ||
TOTAL COMMON STOCKS (Cost $4,466,009) |
| ||
Preferred Stocks - 0.8% | |||
Shares | Value (000s) | ||
Convertible Preferred Stocks - 0.1% | |||
INDUSTRIALS - 0.1% | |||
Aerospace & Defense - 0.1% | |||
United Technologies Corp. 7.50% | 105,600 | $ 5,883 | |
Nonconvertible Preferred Stocks - 0.7% | |||
CONSUMER DISCRETIONARY - 0.7% | |||
Automobiles - 0.7% | |||
Volkswagen AG | 145,100 | 33,293 | |
TOTAL PREFERRED STOCKS (Cost $34,867) |
| ||
Money Market Funds - 1.8% | |||
|
|
|
|
Fidelity Cash Central Fund, 0.18% (b) | 71,383,888 | 71,384 | |
Fidelity Securities Lending Cash Central Fund, 0.18% (b)(c) | 23,854,800 | 23,855 | |
TOTAL MONEY MARKET FUNDS (Cost $95,239) |
| ||
TOTAL INVESTMENT PORTFOLIO - 101.0% (Cost $4,596,115) | 5,202,784 | ||
NET OTHER ASSETS (LIABILITIES) - (1.0)% | (51,684) | ||
NET ASSETS - 100% | $ 5,151,100 | ||
Legend |
(a) Non-income producing |
(b) Affiliated fund that is available only to investment companies and other accounts managed by Fidelity Investments. The rate quoted is the annualized seven-day yield of the fund at period end. A complete unaudited listing of the fund's holdings as of its most recent quarter end is available upon request. In addition, each Fidelity Central Fund's financial statements are available on the SEC's website or upon request. |
(c) Investment made with cash collateral received from securities on loan. |
(d) Security or a portion of the security is on loan at period end. |
Affiliated Central Funds |
Information regarding fiscal year to date income earned by the Fund from investments in Fidelity Central Funds is as follows: |
Fund | Income earned |
Fidelity Cash Central Fund | $ 115 |
Fidelity Securities Lending Cash Central Fund | 305 |
Total | $ 420 |
Other Information |
The following is a summary of the inputs used, as of December 31, 2012, involving the Fund's assets and liabilities carried at fair value. The inputs or methodology used for valuing securities may not be an indication of the risk associated with investing in those securities. For more information on valuation inputs, and their aggregation into the levels used in the table below, please refer to the Investment Valuation section in the accompanying Notes to Financial Statements. |
Valuation Inputs at Reporting Date: | ||||
Description | Total | Level 1 | Level 2 | Level 3 |
Investments in Securities: | ||||
Equities: | ||||
Consumer Discretionary | $ 590,534 | $ 538,144 | $ 52,390 | $ - |
Consumer Staples | 465,218 | 409,546 | 55,672 | - |
Energy | 451,784 | 451,784 | - | - |
Financials | 850,494 | 850,494 | - | - |
Health Care | 725,167 | 722,221 | 2,946 | - |
Industrials | 459,125 | 433,581 | 25,544 | - |
Information Technology | 942,964 | 905,410 | 37,554 | - |
Materials | 353,774 | 293,805 | 59,969 | - |
Telecommunication Services | 134,246 | 113,474 | 20,772 | - |
Utilities | 134,239 | 134,239 | - | - |
Money Market Funds | 95,239 | 95,239 | - | - |
Total Investments in Securities: | $ 5,202,784 | $ 4,947,937 | $ 254,847 | $ - |
Distribution of investments by country or territory of incorporation, as a percentage of total net assets, is as follows. (Unaudited) |
United States of America | 89.5% |
United Kingdom | 1.8% |
France | 1.3% |
Netherlands | 1.3% |
Germany | 1.0% |
Others (Individually Less Than 1%) | 5.1% |
| 100.0% |
See accompanying notes which are an integral part of the financial statements.
Semiannual Report
Financial Statements
Statement of Assets and Liabilities
Amounts in thousands (except per-share amounts) | December 31, 2012 (Unaudited) | |
|
|
|
Assets | ||
Investment in securities, at value (including securities loaned of $23,471) - See accompanying schedule: Unaffiliated issuers (cost $4,500,876) | $ 5,107,545 |
|
Fidelity Central Funds (cost $95,239) | 95,239 |
|
Total Investments (cost $4,596,115) |
| $ 5,202,784 |
Cash |
| 1 |
Receivable for investments sold | 2,075 | |
Receivable for fund shares sold | 1,715 | |
Dividends receivable | 6,408 | |
Distributions receivable from Fidelity Central Funds | 36 | |
Prepaid expenses | 14 | |
Other receivables | 1,075 | |
Total assets | 5,214,108 | |
|
|
|
Liabilities | ||
Payable for fund shares redeemed | 36,587 | |
Accrued management fee | 1,497 | |
Other affiliated payables | 830 | |
Other payables and accrued expenses | 239 | |
Collateral on securities loaned, at value | 23,855 | |
Total liabilities | 63,008 | |
|
|
|
Net Assets | $ 5,151,100 | |
Net Assets consist of: |
| |
Paid in capital | $ 4,535,198 | |
Distributions in excess of net investment income | (2,551) | |
Accumulated undistributed net realized gain (loss) on investments and foreign currency transactions | 11,781 | |
Net unrealized appreciation (depreciation) on investments and assets and liabilities in foreign currencies | 606,672 | |
Net Assets | $ 5,151,100 | |
See accompanying notes which are an integral part of the financial statements.
Semiannual Report
Financial Statements - continued
Statement of Assets and Liabilities - continued
Amounts in thousands (except per-share amounts) | December 31, 2012 (Unaudited) | |
|
|
|
Fidelity Fund: | $ 35.81 | |
|
|
|
Class K: | $ 35.79 | |
See accompanying notes which are an integral part of the financial statements.
Semiannual Report
Statement of Operations
Amounts in thousands Six months ended December 31, 2012 (Unaudited) | ||
|
|
|
Investment Income |
|
|
Dividends |
| $ 52,582 |
Income from Fidelity Central Funds |
| 420 |
Total income |
| 53,002 |
|
|
|
Expenses | ||
Management fee | $ 9,095 | |
Transfer agent fees | 4,471 | |
Accounting and security lending fees | 548 | |
Custodian fees and expenses | 59 | |
Independent trustees' compensation | 19 | |
Registration fees | 49 | |
Audit | 42 | |
Legal | 25 | |
Miscellaneous | 22 | |
Total expenses before reductions | 14,330 | |
Expense reductions | (476) | 13,854 |
Net investment income (loss) | 39,148 | |
Realized and Unrealized Gain (Loss) Net realized gain (loss) on: | ||
Investment securities: |
|
|
Unaffiliated issuers | 262,762 | |
Foreign currency transactions | (148) | |
Total net realized gain (loss) |
| 262,614 |
Change in net unrealized appreciation (depreciation) on: Investment securities | (35,645) | |
Assets and liabilities in foreign currencies | (3) | |
Total change in net unrealized appreciation (depreciation) |
| (35,648) |
Net gain (loss) | 226,966 | |
Net increase (decrease) in net assets resulting from operations | $ 266,114 | |
See accompanying notes which are an integral part of the financial statements.
Semiannual Report
Financial Statements - continued
Statement of Changes in Net Assets
Amounts in thousands | Six months ended December 31, 2012 | Year ended |
Increase (Decrease) in Net Assets |
|
|
Operations |
|
|
Net investment income (loss) | $ 39,148 | $ 59,563 |
Net realized gain (loss) | 262,614 | 142,752 |
Change in net unrealized appreciation (depreciation) | (35,648) | (169,796) |
Net increase (decrease) in net assets resulting | 266,114 | 32,519 |
Distributions to shareholders from net investment income | (73,239) | (36,948) |
Share transactions - net increase (decrease) | (220,266) | (552,271) |
Total increase (decrease) in net assets | (27,391) | (556,700) |
|
|
|
Net Assets | ||
Beginning of period | 5,178,491 | 5,735,191 |
End of period (including distributions in excess of net investment income of $2,551 and undistributed net investment income of $31,540, respectively) | $ 5,151,100 | $ 5,178,491 |
See accompanying notes which are an integral part of the financial statements.
Semiannual Report
Financial Highlights - Fidelity Fund
| Six months ended | Years ended June 30, | ||||
| (Unaudited) | 2012 | 2011 | 2010 | 2009 | 2008 |
Selected Per-Share Data |
|
|
|
|
|
|
Net asset value, beginning of period | $ 34.51 | $ 34.35 | $ 26.08 | $ 23.95 | $ 35.69 | $ 38.98 |
Income from Investment Operations |
|
|
|
|
|
|
Net investment income (loss) D | .26 | .37 | .27 G | .23 | .44 | .37 |
Net realized and unrealized gain (loss) | 1.53 | .02 H | 8.27 | 2.25 | (10.77) | (1.65) |
Total from investment operations | 1.79 | .39 | 8.54 | 2.48 | (10.33) | (1.28) |
Distributions from net investment income | (.49) | (.23) | (.27) | (.35) | (.42) | (.38) |
Distributions from net realized gain | - | - | - | - | (.99) | (1.63) |
Total distributions | (.49) | (.23) | (.27) | (.35) | (1.41) | (2.01) |
Net asset value, end of period | $ 35.81 | $ 34.51 | $ 34.35 | $ 26.08 | $ 23.95 | $ 35.69 |
Total Return B, C | 5.22% | 1.21% | 32.89% | 10.40% | (29.74)% | (3.73)% |
Ratios to Average Net Assets E, I |
|
|
|
|
| |
Expenses before reductions | .57% A | .58% | .59% | .61% | .64% | .56% |
Expenses net of fee waivers, if any | .57% A | .58% | .59% | .61% | .64% | .56% |
Expenses net of all reductions | .55% A | .58% | .58% | .60% | .64% | .55% |
Net investment income (loss) | 1.47% A | 1.13% | .86% G | .82% | 1.73% | .98% |
Supplemental Data |
|
|
|
|
|
|
Net assets, end of period (in millions) | $ 4,270 | $ 4,364 | $ 5,072 | $ 4,412 | $ 4,442 | $ 7,174 |
Portfolio turnover rate F | 106% A | 102% | 88% | 77% | 91% | 80% |
A Annualized
B Total returns for periods of less than one year are not annualized.
C Total returns would have been lower if certain expenses had not been reduced during the applicable periods shown.
D Calculated based on average shares outstanding during the period.
E Fees and expenses of any underlying Fidelity Central Funds are not included in the Fund's expense ratio. The Fund indirectly bears its proportionate share of the expenses of any underlying Fidelity Central Funds.
F Amount does not include the portfolio activity of any underlying Fidelity Central Funds.
G Investment income per share reflects a large, non-recurring dividend which amounted to $.08 per share. Excluding this non-recurring dividend, the ratio of net investment income (loss) to average net assets would have been .60%.
H The amount shown for a share outstanding does not correspond with the aggregate net gain (loss) on investments for the period due to the timing of sales and repurchases of shares in relation to fluctuating market values of the investments of the Fund.
I Expense ratios reflect operating expenses of the class. Expenses before reductions do not reflect amounts reimbursed by the investment adviser or reductions from brokerage service arrangements or reductions from other expense offset arrangements and do not represent the amount paid by the class during periods when reimbursements or reductions occur. Expenses net of fee waivers reflect expenses after reimbursement by the investment adviser but prior to reductions from brokerage service arrangements or other expense offset arrangements. Expenses net of all reductions represent the net expenses paid by the class.
See accompanying notes which are an integral part of the financial statements.
Semiannual Report
Financial Highlights - Class K
| Six months ended | Years ended June 30, | ||||
| (Unaudited) | 2012 | 2011 | 2010 | 2009 | 2008 I |
Selected Per-Share Data |
|
|
|
|
|
|
Net asset value, beginning of period | $ 34.52 | $ 34.35 | $ 26.08 | $ 23.96 | $ 35.70 | $ 37.54 |
Income from Investment Operations |
|
|
|
|
|
|
Net investment income (loss) D | .29 | .42 | .32 G | .28 | .42 | .05 |
Net realized and unrealized gain (loss) | 1.52 | .02 H | 8.27 | 2.24 | (10.70) | (1.89) |
Total from investment operations | 1.81 | .44 | 8.59 | 2.52 | (10.28) | (1.84) |
Distributions from net investment income | (.54) | (.27) | (.32) | (.40) | (.47) | - |
Distributions from net realized gain | - | - | - | - | (.99) | - |
Total distributions | (.54) | (.27) | (.32) | (.40) | (1.46) | - |
Net asset value, end of period | $ 35.79 | $ 34.52 | $ 34.35 | $ 26.08 | $ 23.96 | $ 35.70 |
Total Return B, C | 5.29% | 1.37% | 33.10% | 10.54% | (29.59)% | (4.90)% |
Ratios to Average Net Assets E, J |
|
|
|
|
| |
Expenses before reductions | .43% A | .43% | .43% | .44% | .45% | .43% A |
Expenses net of fee waivers, if any | .43% A | .43% | .43% | .44% | .45% | .43% A |
Expenses net of all reductions | .41% A | .42% | .42% | .43% | .45% | .43% A |
Net investment income (loss) | 1.61% A | 1.29% | 1.02% G | .99% | 1.92% | 1.00% A |
Supplemental Data |
|
|
|
|
|
|
Net assets, end of period (000 omitted) | $ 881,314 | $ 814,219 | $ 662,929 | $ 425,831 | $ 274,168 | $ 95 |
Portfolio turnover rate F | 106% A | 102% | 88% | 77% | 91% | 80% |
A Annualized
B Total returns for periods of less than one year are not annualized.
C Total returns would have been lower if certain expenses had not been reduced during the applicable periods shown.
D Calculated based on average shares outstanding during the period.
E Fees and expenses of any underlying Fidelity Central Funds are not included in the Fund's expense ratio. The Fund indirectly bears its proportionate share of the expenses of any underlying Fidelity Central Funds.
F Amount does not include the portfolio activity of any underlying Fidelity Central Funds.
G Investment income per share reflects a large, non-recurring dividend which amounted to $.08 per share. Excluding this non-recurring dividend, the ratio of net investment income (loss) to average net assets would have been .76%.
H The amount shown for a share outstanding does not correspond with the aggregate net gain (loss) on investments for the period due to the timing of sales and repurchases of shares in relation to fluctuating market values of the investments of the Fund.
I For the period May 9, 2008 (commencement of sale of shares) to June 30, 2008.
J Expense ratios reflect operating expenses of the class. Expenses before reductions do not reflect amounts reimbursed by the investment adviser or reductions from brokerage service arrangements or reductions from other expense offset arrangements and do not represent the amount paid by the class during periods when reimbursements or reductions occur. Expense ratios before reductions for start-up periods may not be representative of longer-term operating periods. Expenses net of fee waivers reflect expenses after reimbursement by the investment adviser but prior to reductions from brokerage service arrangements or other expense offset arrangements. Expenses net of all reductions represent the net expenses paid by the class.
See accompanying notes which are an integral part of the financial statements.
Semiannual Report
Notes to Financial Statements
For the period ended December 31, 2012 (Unaudited)
(Amounts in thousands except percentages)
1. Organization.
Fidelity Fund (the Fund) is a fund of Fidelity Hastings Street Trust (the Trust) and is authorized to issue an unlimited number of shares. The Trust is registered under the Investment Company Act of 1940, as amended (the 1940 Act), as an open-end management investment company organized as a Massachusetts business trust. The Fund offers Fidelity Fund and Class K shares, each of which has equal rights as to assets and voting privileges. Each class has exclusive voting rights with respect to matters that affect that class. Investment income, realized and unrealized capital gains and losses, the common expenses of the Fund, and certain fund-level expense reductions, if any, are allocated on a pro-rata basis to each class based on the relative net assets of each class to the total net assets of the Fund. Each class differs with respect to transfer agent fees incurred. Certain expense reductions may also differ by class.
2. Investments in Fidelity Central Funds.
The Fund invests in Fidelity Central Funds, which are open-end investment companies available only to other investment companies and accounts managed by Fidelity Management & Research Company (FMR) and its affiliates. The Fund's Schedule of Investments lists each of the Fidelity Central Funds held as of period end, if any, as an investment of the Fund, but does not include the underlying holdings of each Fidelity Central Fund. As an Investing Fund, the Fund indirectly bears its proportionate share of the expenses of the underlying Fidelity Central Funds.
The Money Market Central Funds seek preservation of capital and current income and are managed by Fidelity Investments Money Management, Inc. (FIMM), an affiliate of FMR.
A complete unaudited list of holdings for each Fidelity Central Fund is available upon request or at the Securities and Exchange Commission (the SEC) website at www.sec.gov. In addition, the financial statements of the Fidelity Central Funds are available on the SEC website or upon request.
3. Significant Accounting Policies.
The financial statements have been prepared in conformity with accounting principles generally accepted in the United States of America (GAAP), which require management to make certain estimates and assumptions at the date of the financial statements. Actual results could differ from those estimates. Subsequent events, if any, through the date that the financial statements were issued have been evaluated in the preparation of the financial statements. The following summarizes the significant accounting policies of the Fund:
Semiannual Report
Notes to Financial Statements (Unaudited) - continued
(Amounts in thousands except percentages)
3. Significant Accounting Policies - continued
Investment Valuation. Investments are valued as of 4:00 p.m. Eastern time on the last calendar day of the period. In accordance with valuation policies and procedures approved by the Board of Trustees (the Board), the Fund attempts to obtain prices from one or more third party pricing vendors or brokers to value its investments. When current market prices, quotations or rates are not readily available or reliable, investments will be fair valued in good faith by the FMR Fair Value Committee (the Committee), in accordance with procedures adopted by the Fund's Board. Factors used in determining fair value vary by investment type and may include market or investment specific events. The frequency with which these procedures are used cannot be predicted and they may be utilized to a significant extent. The Committee oversees the Fund's valuation policies and procedures and is responsible for approving and reporting to the Board all fair value determinations.
The Fund categorizes the inputs to valuation techniques used to value its investments into a disclosure hierarchy consisting of three levels as shown below:
Level 1 - quoted prices in active markets for identical investments
Level 2 - other significant observable inputs (including quoted prices for similar investments, interest rates, prepayment speeds, etc.)
Level 3 - unobservable inputs (including the Fund's own assumptions based on the best information available)
Valuation techniques used to value the Fund's investments by major category are as follows:
Equity securities, including restricted securities, for which market quotations are readily available, are valued at the last reported sale price or official closing price as reported by a third party pricing vendor on the primary market or exchange on which they are traded and are categorized as Level 1 in the hierarchy. In the event there were no sales during the day or closing prices are not available, securities are valued at the last quoted bid price or may be valued using the last available price and are generally categorized as Level 2 in the hierarchy. For foreign equity securities, when significant market or security specific events arise, comparisons to the valuation of American Depositary Receipts (ADRs), futures contracts, Exchange-Traded Funds (ETFs) and certain indexes as well as quoted prices for similar securities are used and are categorized as Level 2 in the hierarchy. Utilizing these techniques may result in transfers between Level 1 and Level 2.
Investments in open-end mutual funds, including the Fidelity Central Funds, are valued at their closing net asset value (NAV) each business day and are categorized as Level 1 in the hierarchy.
Semiannual Report
3. Significant Accounting Policies - continued
Investment Valuation - continued
Changes in valuation techniques may result in transfers in or out of an assigned level within the disclosure hierarchy. The aggregate value of investments by input level, as of December 31, 2012, is included at the end of the Fund's Schedule of Investments.
Foreign Currency. The Fund may use foreign currency contracts to facilitate transactions in foreign-denominated securities. Gains and losses from these transactions may arise from changes in the value of the foreign currency or if the counterparties do not perform under the contracts' terms.
Foreign-denominated assets, including investment securities, and liabilities are translated into U.S. dollars at the exchange rates at period end. Purchases and sales of investment securities, income and dividends received and expenses denominated in foreign currencies are translated into U.S. dollars at the exchange rate in effect on the transaction date.
The effects of exchange rate fluctuations on investments are included with the net realized and unrealized gain (loss) on investment securities. Other foreign currency transactions resulting in realized and unrealized gain (loss) are disclosed separately.
Investment Transactions and Income. For financial reporting purposes, the Fund's investment holdings and NAV include trades executed through the end of the last business day of the period. The NAV per share for processing shareholder transactions is calculated as of the close of business of the New York Stock Exchange (NYSE), normally 4:00 p.m. Eastern time and includes trades executed through the end of the prior business day. Gains and losses on securities sold are determined on the basis of identified cost and may include proceeds received from litigation. Dividend income is recorded on the ex-dividend date. Non-cash dividends included in dividend income, if any, are recorded at the fair market value of the securities received. Distributions received on securities that represent a return of capital or capital gain are recorded as a reduction of cost of investments and/or as a realized gain. The Fund estimates the components of distributions received that may be considered return of capital distributions or capital gain distributions. Interest income and distributions from the Fidelity Central Funds are accrued as earned. Interest income includes coupon interest and amortization of premium and accretion of discount on debt securities. Investment income is recorded net of foreign taxes withheld where recovery of such taxes is uncertain.
Expenses. Expenses directly attributable to a fund are charged to that fund. Expenses attributable to more than one fund are allocated among the respective funds on the basis of relative net assets or other appropriate methods. Expense estimates are accrued in the period to which they relate and adjustments are made when actual amounts are known.
Semiannual Report
Notes to Financial Statements (Unaudited) - continued
(Amounts in thousands except percentages)
3. Significant Accounting Policies - continued
Deferred Trustee Compensation. Under a Deferred Compensation Plan (the Plan), independent Trustees may elect to defer receipt of a portion of their annual compensation. Deferred amounts are invested in a cross-section of Fidelity funds, are marked-to-market and remain in the Fund until distributed in accordance with the Plan. The investment of deferred amounts and the offsetting payable to the Trustees are included in the accompanying Statement of Assets and Liabilities.
Income Tax Information and Distributions to Shareholders. Each year, the Fund intends to qualify as a regulated investment company under Subchapter M of the Internal Revenue Code, including distributing substantially all of its taxable income and realized gains. As a result, no provision for income taxes is required. The Fund files a U.S. federal tax return, in addition to state and local tax returns as required. A fund's federal income tax returns are subject to examination by the Internal Revenue Service (IRS) for a period of three fiscal years after they are filed. State and local tax returns may be subject to examination for an additional fiscal year depending on the jurisdiction. Foreign taxes are provided for based on the Fund's understanding of the tax rules and rates that exist in the foreign markets in which it invests.
Distributions are declared and recorded on the ex-dividend date. Income dividends and capital gain distributions are declared separately for each class. Income and capital gain distributions are determined in accordance with income tax regulations, which may differ from GAAP.
Capital accounts within the financial statements are adjusted for permanent book-tax differences. These adjustments have no impact on net assets or the results of operations. Temporary book-tax differences will reverse in a subsequent period.
Book-tax differences are primarily due to foreign currency transactions, equity-debt classifications, deferred trustees compensation, partnerships, capital loss carryforwards, losses deferred due to wash sales and excise tax regulations.
The federal tax cost of investment securities and unrealized appreciation (depreciation) as of period end were as follows:
Gross unrealized appreciation | $ 659,247 |
Gross unrealized depreciation | (83,997) |
Net unrealized appreciation (depreciation) on securities and other investments | $ 575,250 |
|
|
Tax cost | $ 4,627,534 |
Semiannual Report
3. Significant Accounting Policies - continued
Income Tax Information and Distributions to Shareholders - continued
Capital loss carryforwards are only available to offset future capital gains of the Fund to the extent provided by regulations and may be limited. Under the Regulated Investment Company Modernization Act of 2010 (the Act), the Fund is permitted to carry forward capital losses incurred in taxable years beginning after December 22, 2010 for an unlimited period and such capital losses are required to be used prior to any losses that expire. At June 30, 2012 capital loss carryforwards were as follows:
Fiscal year of expiration |
|
2018 | $ (185,683) |
4. Purchases and Sales of Investments.
Purchases and sales of securities, other than short-term securities, aggregated $2,690,590 and $2,777,611, respectively.
5. Fees and Other Transactions with Affiliates.
Management Fee. FMR and its affiliates provide the Fund with investment management related services for which the Fund pays a monthly management fee. The management fee is the sum of an individual fund fee rate that is based on an annual rate of .09% of the Fund's average net assets and an annualized group fee rate that averaged .26% during the period. The group fee rate is based upon the average net assets of all the mutual funds advised by FMR. The group fee rate decreases as assets under management increase and increases as assets under management decrease. For the period, the total annualized management fee rate was .35% of the Fund's average net assets.
Transfer Agent Fees. Fidelity Investments Institutional Operations Company, Inc. (FIIOC), an affiliate of FMR, is the transfer, dividend disbursing and shareholder servicing agent for each class of the Fund. FIIOC receives account fees and asset-based fees that vary according to the account size and type of account of the shareholders of Fidelity Fund. FIIOC receives an asset-based fee of Class K's average net assets. FIIOC pays for typesetting, printing and mailing of shareholder reports, except proxy statements. For the period, transfer agent fees for each class were as follows:
| Amount | % of |
Fidelity Fund | $ 4,254 | .19 |
Class K | 217 | .05 |
| $ 4,471 |
|
* Annualized
Semiannual Report
Notes to Financial Statements (Unaudited) - continued
(Amounts in thousands except percentages)
5. Fees and Other Transactions with Affiliates - continued
Accounting and Security Lending Fees. Fidelity Service Company, Inc. (FSC), an affiliate of FMR, maintains the Fund's accounting records. The accounting fee is based on the level of average net assets for each month. Under a separate contract, FSC administers the security lending program. The security lending fee is based on the number and duration of lending transactions.
Brokerage Commissions. The Fund placed a portion of its portfolio transactions with brokerage firms which are affiliates of the investment adviser. The commissions paid to these affiliated firms were $56 for the period.
6. Committed Line of Credit.
The Fund participates with other funds managed by FMR or an affiliate in a $4.25 billion credit facility (the "line of credit") to be utilized for temporary or emergency purposes to fund shareholder redemptions or for other short-term liquidity purposes. The Fund has agreed to pay commitment fees on its pro-rata portion of the line of credit, which amounted to $7 and is reflected in Miscellaneous expenses on the Statement of Operations. During the period, there were no borrowings on this line of credit.
7. Security Lending.
The Fund lends portfolio securities through a lending agent from time to time in order to earn additional income. For equity securities, a lending agent is used and may loan securities to certain qualified borrowers, including Fidelity Capital Markets (FCM), a broker-dealer affiliated with the Fund. On the settlement date of the loan, the Fund receives collateral (in the form of U.S. Treasury obligations, letters of credit and/or cash) against the loaned securities and maintains collateral in an amount not less than 100% of the market value of the loaned securities during the period of the loan. The market value of the loaned securities is determined at the close of business of the Fund and any additional required collateral is delivered to the Fund on the next business day. If the borrower defaults on its obligation to return the securities loaned because of insolvency or other reasons, a fund could experience delays and costs in recovering the securities loaned or in gaining access to the collateral. Any cash collateral received is invested in the Fidelity Securities Lending Cash Central Fund. The value of loaned securities and cash collateral at period end are disclosed on the Fund's Statement of Assets and Liabilities. The value of securities loaned to FCM at period end was $2,488. Security lending income represents the income earned on investing cash collateral, less rebates paid to borrowers and any lending agent fees associated with the loan, plus any premium payments received for lending certain types of securities. Security lending income is presented in the Statement of Operations as a component of income from Fidelity Central Funds. Total security lending income during the period amounted to $305, including $7 from securities loaned to FCM.
Semiannual Report
8. Expense Reductions.
Many of the brokers with whom FMR places trades on behalf of the Fund provided services to the Fund in addition to trade execution. These services included payments of certain expenses on behalf of the Fund totaling $476 for the period.
9. Distributions to Shareholders.
Distributions to shareholders of each class were as follows:
Six months ended December 31, 2012 | Year ended | |
From net investment income |
|
|
Fidelity Fund | $ 59,871 | $ 31,576 |
Class K | 13,368 | 5,372 |
Total | $ 73,239 | $ 36,948 |
10. Share Transactions.
Transactions for each class of shares were as follows:
| Shares | Dollars | ||
Six months ended December 31, 2012 | Year ended | Six months ended December 31, 2012 | Year ended | |
Fidelity Fund |
|
|
|
|
Shares sold | 3,198 | 9,192 | $ 113,482 | $ 299,999 |
Reinvestment of distributions | 1,584 | 967 | 55,780 | 29,465 |
Shares redeemed | (12,001) | (31,358) | (426,015) | (1,019,919) |
Net increase (decrease) | (7,219) | (21,199) | $ (256,753) | $ (690,455) |
Class K |
|
|
|
|
Shares sold | 3,409 | 9,901 | $ 121,123 | $ 323,105 |
Reinvestment of distributions | 380 | 176 | 13,368 | 5,372 |
Shares redeemed | (2,751) | (5,788) | (98,004) | (190,293) |
Net increase (decrease) | 1,038 | 4,289 | $ 36,487 | $ 138,184 |
11. Other.
The Fund's organizational documents provide former and current trustees and officers with a limited indemnification against liabilities arising in connection with the performance of their duties to the Fund. In the normal course of business, the Fund may also enter into contracts that provide general indemnifications. The Fund's maximum exposure under these arrangements is unknown as this would be dependent on future claims that may be made against the Fund. The risk of material loss from such claims is considered remote.
Semiannual Report
Board Approval of Investment Advisory Contracts and Management Fees
Fidelity Fund
Each year, the Board of Trustees, including the Independent Trustees (together, the Board), votes on the renewal of the management contract and sub-advisory agreements (together, the Advisory Contracts) for the fund. The Board, assisted by the advice of fund counsel and Independent Trustees' counsel, requests and considers a broad range of information relevant to the renewal of the Advisory Contracts throughout the year.
The Board meets regularly and, at each of its meetings, considers factors that are relevant to its annual consideration of the renewal of the fund's Advisory Contracts, including the services and support provided to the fund and its shareholders. The Board has established various standing committees, each composed of and chaired by Independent Trustees with varying backgrounds, to which the Board has assigned specific subject matter responsibilities in order to enhance effective decision-making by the Board. The Board, acting directly and through its Committees, requests and receives information concerning the annual consideration of the renewal of the fund's Advisory Contracts. The Board also meets as needed to consider matters specifically related to the Board's annual consideration of the renewal of Advisory Contracts. Members of the Board may also meet with trustees of other Fidelity funds through ad hoc joint committees to discuss certain matters relevant to the Fidelity funds.
At its July 2012 meeting, the Board of Trustees, including the Independent Trustees, unanimously determined to renew the fund's Advisory Contracts. In reaching its determination, the Board considered all factors it believed relevant, including (i) the nature, extent, and quality of the services to be provided to the fund and its shareholders (including the investment performance of the fund); (ii) the competitiveness of the fund's management fee and total expense ratio relative to peer funds; (iii) the total costs of the services to be provided by and the profits to be realized by Fidelity from its relationship with the fund; (iv) the extent to which economies of scale exist and would be realized as the fund grows; and (v) whether fee levels reflect these economies of scale, if any, for the benefit of fund shareholders.
In considering whether to renew the Advisory Contracts for the fund, the Board reached a determination, with the assistance of fund counsel and Independent Trustees' counsel and through the exercise of its business judgment, that the renewal of the Advisory Contracts is in the best interests of the fund and its shareholders and that the compensation payable under the Advisory Contracts is fair and reasonable. The Board's decision to renew the Advisory Contracts was not based on any single factor, but rather was based on a comprehensive consideration of all the information provided to the Board at its meetings throughout the year. The Board, in reaching its determination to renew the Advisory Contracts, is aware that shareholders in the fund have a broad range of investment choices available to them, including a wide choice among mutual funds offered by Fidelity's competitors, and that the fund's shareholders, who have the opportunity to review and weigh the disclosure provided by the fund in its prospectus and other public disclosures, have chosen to invest in this fund, managed by Fidelity.
Semiannual Report
Nature, Extent, and Quality of Services Provided. The Board considered the staffing within the investment adviser, FMR, and the sub-advisers (together, the Investment Advisers), including the backgrounds of the fund's investment personnel, and also considered the fund's investment objective, strategies, and related investment philosophy. The Independent Trustees also had discussions with senior management of Fidelity's investment operations and investment groups. The Board considered the structure of the portfolio manager compensation program and whether this structure provides appropriate incentives to act in the best interests of the fund.
Resources Dedicated to Investment Management and Support Services. The Board and the Fund Oversight and Research Committees reviewed the general qualifications and capabilities of the Investment Advisers' investment staff, including its size, education, experience, and resources, as well as the Investment Advisers' approach to recruiting, training, managing, and compensating investment personnel. The Board also noted that FMR has continued to increase the resources devoted to non-U.S. offices, including expansion of Fidelity's global investment organization. The Board noted that Fidelity's analysts have extensive resources, tools and capabilities that allow them to conduct sophisticated quantitative and fundamental analysis, as well as credit analysis of issuers, counterparties and guarantors. The Board also believes that Fidelity's investment professionals have sufficient access to global information and data so as to provide competitive investment results over time, and that those professionals also have access to sophisticated tools that permit them to assess portfolio construction and risk and performance attribution characteristics continuously, as well as to transmit new information and research conclusions rapidly around the world. Additionally, in its deliberations, the Board considered the Investment Advisers' trading and risk management capabilities and resources, which are an integral part of the investment management process.
Shareholder and Administrative Services. The Board considered (i) the nature, extent, quality, and cost of advisory, administrative, and shareholder services performed by the Investment Advisers and their affiliates under the Advisory Contracts and under separate agreements covering transfer agency, pricing and bookkeeping, and securities lending services for the fund; (ii) the nature and extent of the supervision of third party service providers, principally custodians and subcustodians; and (iii) the resources devoted to, and the record of compliance with, the fund's compliance policies and procedures. The Board also reviewed the allocation of fund brokerage, including allocations to brokers affiliated with the Investment Advisers, the use of brokerage commissions to pay fund expenses, and the use of "soft" commission dollars to pay for research services.
Semiannual Report
Board Approval of Investment Advisory Contracts and
Management Fees - continued
The Board noted that the growth of fund assets over time across the complex allows Fidelity to reinvest in the development of services designed to enhance the value or convenience of the Fidelity funds as investment vehicles. These services include 24-hour access to account information and market information through telephone representatives and over the Internet, investor education materials and asset allocation tools, and the expanded availability of Fidelity Investor Centers.
Investment in a Large Fund Family. The Board considered the benefits to shareholders of investing in a Fidelity fund, including the benefits of investing in a fund that is part of a large family of funds offering a variety of investment disciplines and providing a large variety of mutual fund investor services. The Board noted that Fidelity had taken, or had made recommendations that resulted in the Fidelity funds taking, a number of actions over the previous year that benefited particular funds, including (i) continuing to dedicate additional resources to investment research and support of the senior management team that oversees asset management; (ii) persisting in efforts to enhance Fidelity's research capabilities, in particular, international research; (iii) launching new funds and making other enhancements to meet client needs for global and income-oriented solutions; (iv) continuing to launch dedicated lower cost underlying funds to meet investment management's portfolio construction needs related to expanding underlying fund options, specifically for the Freedom Fund product lines; (v) adopting a "Stock Selector" sector neutral investment approach and employing a team of portfolio managers who are sector specialists to manage certain funds; (vi) rationalizing product lines and gaining increased efficiencies through the mergers of several funds into other funds; (vii) strengthening the Spartan Index Fund product line by adding new funds and/or new low-cost institutional share classes, restructuring fund expenses to accommodate new classes, and reducing investment minimums for certain classes of shares; (viii) modifying the eligibility criteria for Institutional Class shares to increase their appeal to government entities and charitable investors; and (ix) reducing certain transfer agent fee rates.
Investment Performance. The Board considered whether the fund has operated in accordance with its investment objective, as well as its record of compliance with its investment restrictions. It also reviewed the fund's absolute investment performance for each class, as well as the fund's relative investment performance for each class measured over multiple periods against (i) a broad-based securities market index, and (ii) a peer group of mutual funds deemed appropriate by Fidelity and reviewed by the Board. The following charts considered by the Board show, over the one-, three-, and five-year periods ended December 31, 2011, as available, the cumulative total returns of Class K and the retail class of the fund, the cumulative total returns of a broad-based securities market index ("benchmark"), and a range of cumulative total returns of a peer group of mutual funds identified by Morningstar, Inc. as having an investment style similar to that of the fund based on underlying portfolio holdings. The box within each chart shows the 25th percentile return (top of box) and the 75th percentile return (bottom of box) of the peer group. Returns shown above the box are in the first quartile and returns shown below the box are in the fourth quartile. The percentage beaten numbers noted below each chart correspond to the percentile box and represent the percentage of funds in the peer group whose performance was equal to or lower than that of the class indicated.
Semiannual Report
Fidelity Fund
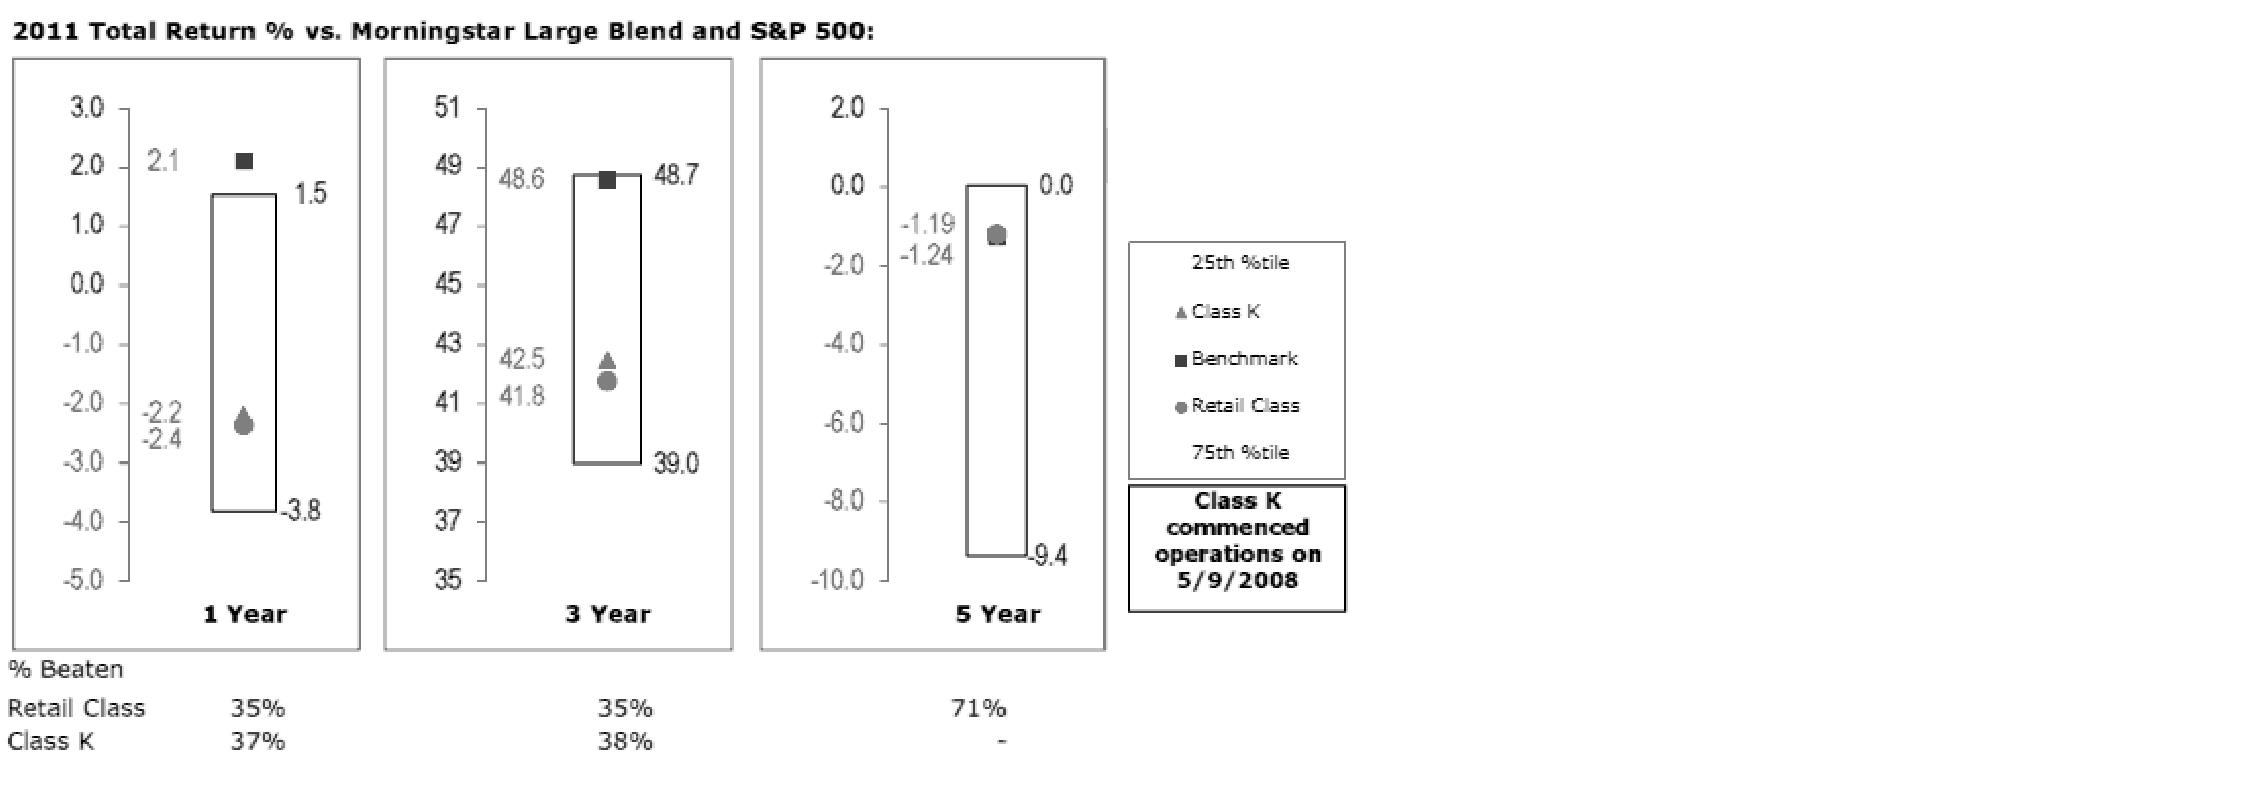
The Board reviewed the fund's relative investment performance against its peer group and noted that the performance of the retail class of the fund (the class with the longer performance record) was in the third quartile for the one- and three-year periods and the second quartile for the five-year period. The Board also noted that the investment performance of the fund was lower than its benchmark for the one- and three-year periods, although the five-year cumulative total return of the retail class was comparable to its benchmark. The Board considered that the variations in performance between the fund's classes reflect the variations in class expenses, which result in lower performance for the higher expense class. The Board discussed with FMR actions to improve the fund's disappointing performance relative to its peer group and benchmark. The Board also reviewed the fund's performance since inception as well as performance in the current year. The Board will continue to closely monitor the performance of the fund in the coming year and discuss with FMR other appropriate actions to address the performance of the fund.
Based on its review, the Board concluded that the nature, extent, and quality of services provided to the fund under the Advisory Contracts should benefit the fund's shareholders.
Semiannual Report
Board Approval of Investment Advisory Contracts and
Management Fees - continued
Competitiveness of Management Fee and Total Expense Ratio. The Board considered the fund's management fee and total expense ratio compared to "mapped groups" of competitive funds and classes. Fidelity creates "mapped groups" by combining similar Lipper investment objective categories that have comparable management fee characteristics. Combining Lipper investment objective categories aids the Board's management fee and total expense ratio comparisons by broadening the competitive group used for comparison and by reducing the number of universes to which various Fidelity funds are compared.
Management Fee. The Board considered two proprietary management fee comparisons for the 12-month periods shown in the chart below. The group of Lipper funds used by the Board for management fee comparisons is referred to below as the "Total Mapped Group." The Total Mapped Group comparison focuses on a fund's standing relative to the total universe of comparable funds available to investors in terms of gross management fees before expense reimbursements or caps. "TMG %" represents the percentage of funds in the Total Mapped Group that had management fees that were lower than the fund's. For example, a TMG % of 6% means that 94% of the funds in the Total Mapped Group had higher management fees than the fund. The "Asset-Size Peer Group" (ASPG) comparison focuses on a fund's standing relative to non-Fidelity funds similar in size to the fund within the Total Mapped Group. The ASPG represents at least 15% of the funds in the Total Mapped Group with comparable asset size and management fee characteristics, subject to a minimum of 50 funds (or all funds in the Total Mapped Group if fewer than 50). Additional information, such as the ASPG quartile in which the fund's management fee ranked, is also included in the chart and considered by the Board.
Fidelity Fund
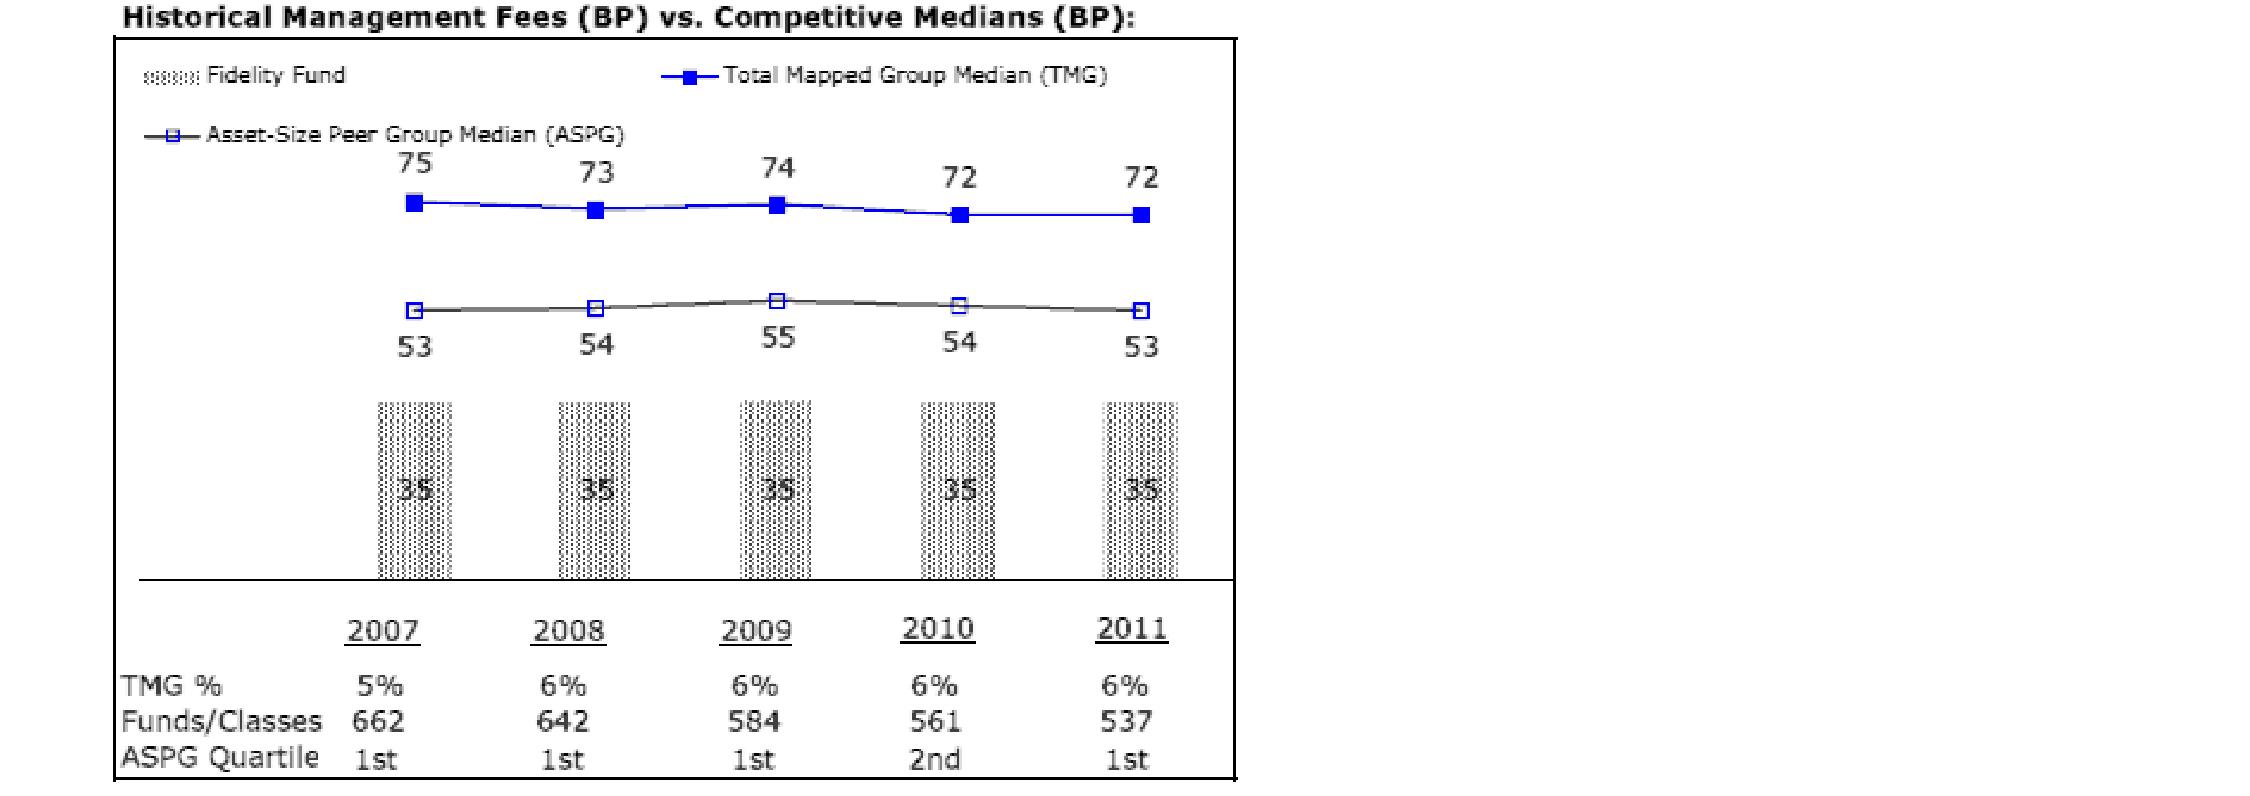
Semiannual Report
The Board noted that the fund's management fee ranked below the median of its Total Mapped Group and below the median of its ASPG for 2011.
Furthermore, the Board considered that in 2011 shareholders failed to approve a proposal to adopt the standard domestic equity management fee rate with a performance adjustment.
Based on its review, the Board concluded that the fund's management fee is fair and reasonable in light of the services that the fund receives and the other factors considered.
Total Expense Ratio. In its review of each class's total expense ratio, the Board considered the fund's management fee as well as other fund or class expenses, as applicable, such as transfer agent fees, pricing and bookkeeping fees, and custodial, legal, and audit fees. The Board also noted the effects of any waivers and reimbursements on fees and expenses. As part of its review, the Board also considered the current and historical total expense ratios of each class of the fund compared to competitive fund median expenses. Each class of the fund is compared to those funds and classes in the Total Mapped Group (used by the Board for management fee comparisons) that have a similar sales load structure.
The Board noted that the total expense ratio of each class ranked below its competitive median for 2011.
Fees Charged to Other Fidelity Clients. The Board also considered Fidelity fee structures and other information with respect to clients of FMR and its affiliates, such as other mutual funds advised or subadvised by FMR or its affiliates, pension plan clients, and other institutional clients. The Board noted the findings of the 2010 ad hoc joint committee (created with the board of other Fidelity funds), which reviewed and compared Fidelity's institutional investment advisory business with its business of providing services to the Fidelity funds, including the differences in services provided, fees charged, and costs incurred, as well as competition in their respective marketplaces.
Based on its review of total expense ratios and fees charged to other Fidelity clients, the Board concluded that the total expense ratio of each class of the fund was reasonable in light of the services that the fund and its shareholders receive and the other factors considered.
Costs of the Services and Profitability. The Board considered the revenues earned and the expenses incurred by Fidelity in conducting the business of developing, marketing, distributing, managing, administering and servicing the fund and its shareholders. The Board also considered the level of Fidelity's profits in respect of all the Fidelity funds.
On an annual basis, FMR presents to the Board Fidelity's profitability for the fund. Fidelity calculates the profitability for each fund, as well as aggregate profitability for groups of Fidelity funds and all Fidelity funds, using a series of detailed revenue and cost allocation methodologies which originate with the books and records of Fidelity on which Fidelity's audited financial statements are based. The Audit Committee of the Board reviews any significant changes from the prior year's methodologies.
Semiannual Report
Board Approval of Investment Advisory Contracts and
Management Fees - continued
PricewaterhouseCoopers LLP (PwC), independent registered public accounting firm and auditor to Fidelity and certain Fidelity funds, has been engaged annually by the Board as part of the Board's assessment of Fidelity's profitability analysis. PwC's engagement includes the review and assessment of Fidelity's methodologies used in determining the revenues and expenses attributable to Fidelity's mutual fund business, and completion of agreed-upon procedures surrounding the mathematical accuracy of fund profitability and its conformity to allocation methodologies. After considering PwC's reports issued under the engagement and information provided by Fidelity, the Board concluded that while other allocation methods may also be reasonable, Fidelity's profitability methodologies are reasonable in all material respects.
The Board also reviewed Fidelity's non-fund businesses and fall-out benefits related to the mutual fund business as well as cases where Fidelity's affiliates may benefit from or be related to the fund's business.
The Board considered the costs of the services provided by and the profits realized by Fidelity in connection with the operation of the fund and was satisfied that the profitability was not excessive in the circumstances.
Economies of Scale. The Board considered whether there have been economies of scale in respect of the management of the Fidelity funds, whether the Fidelity funds (including the fund) have appropriately benefited from any such economies of scale, and whether there is potential for realization of any further economies of scale. The Board considered the extent to which the fund will benefit from economies of scale through increased services to the fund, through waivers or reimbursements, or through fee or expense reductions. The Board also noted that in 2009, it and the board of other Fidelity funds created an ad hoc committee (the Economies of Scale Committee) to analyze whether FMR attains economies of scale in respect of the management and servicing of the Fidelity funds, whether the Fidelity funds have appropriately benefited from such economies of scale, and whether there is potential for realization of any further economies of scale.
The Board recognized that the fund's management contract incorporates a "group fee" structure, which provides for lower group fee rates as total fund assets under FMR's management increase, and for higher group fee rates as total fund assets under FMR's management decrease. FMR calculates the group fee rates based on a tiered asset "breakpoint" schedule that varies based on asset class. The Board considered that the group fee is designed to deliver the benefits of economies of scale to fund shareholders when total Fidelity fund assets increase, even if assets of any particular fund are unchanged or have declined, because some portion of Fidelity's costs are attributable to services provided to all Fidelity funds, and all funds benefit if those costs can be allocated among more assets. The Board concluded that, given the group fee structure, fund shareholders will benefit from lower management fees as assets under FMR's management increase at the fund complex level, regardless of whether Fidelity achieves any such economies of scale.
Semiannual Report
The Board concluded, taking into account the analysis of the Economies of Scale Committee, that economies of scale, if any, are being appropriately shared between fund shareholders and Fidelity.
Additional Information Requested by the Board. In order to develop fully the factual basis for consideration of the Fidelity funds' Advisory Contracts, the Board requested and received additional information on certain topics, including (i) fund performance trends, actions to be taken by FMR to improve certain funds' overall performance, and Fidelity's long-term strategies for certain funds; (ii) the potential to further rationalize the Fidelity fund lineup with the possibility of achieving savings for the funds and Fidelity; (iii) Fidelity's compensation structure for portfolio managers and other key investment personnel; (iv) the amount of the investment that each portfolio manager has made in the Fidelity fund(s) that he or she manages; (v) the realization of fall-out benefits in certain Fidelity business units; (vi) Fidelity's group fee structures, the potential impact of regulatory changes on such structures, and the rationale for the individual fee rates of certain funds; (vii) fund profitability methodology, including Fidelity's cost allocation methodology, and the impact of certain factors on fund profitability results; (viii) trends regarding industry use of performance fee structures and the possibility of implementing performance fee structures for additional funds; and (ix) the impact of net redemptions from the Fidelity funds.
Based on its evaluation of all of the conclusions noted above, and after considering all factors it believed relevant, the Board ultimately concluded that the advisory fee structures are fair and reasonable, and that the fund's Advisory Contracts should be renewed.
Semiannual Report
Investment Adviser
Fidelity Management &
Research Company
Boston, MA
Investment Sub-Advisers
FMR Co., Inc.
Fidelity Management & Research
(U.K.) Inc.
Fidelity Management & Research
(Hong Kong) Limited
Fidelity Management & Research
(Japan) Inc.
General Distributor
Fidelity Distributors Corporation
Smithfield, RI
Transfer and Service Agents
Fidelity Investments Institutional
Operations Company, Inc.
Boston, MA
Fidelity Service Company, Inc.
Boston, MA
Custodian
The Northern Trust Company
Chicago, IL
(Fidelity Investment logo)(registered trademark)
Corporate Headquarters
82 Devonshire St., Boston, MA 02109
www.fidelity.com
FID-K-USAN-0213
1.863257.104
Fidelity®
Fund
Semiannual Report
December 31, 2012
(Fidelity Cover Art)
Contents
Shareholder Expense Example | An example of shareholder expenses. | |
Investment Changes | A summary of major shifts in the fund's investments over the past six months. | |
Investments | A complete list of the fund's investments with their market values. | |
Financial Statements | Statements of assets and liabilities, operations, and changes in net assets, as well as financial highlights. | |
Notes | Notes to the financial statements. | |
Board Approval of Investment Advisory Contracts and Management Fees |
|
To view a fund's proxy voting guidelines and proxy voting record for the 12-month period ended June 30, visit http://www.fidelity.com/proxyvotingresults or visit the Securities and Exchange Commission's (SEC) web site at http://www.sec.gov. You may also call 1-800-544-8544 to request a free copy of the proxy voting guidelines.
Standard & Poor's, S&P and S&P 500 are registered service marks of The McGraw-Hill Companies, Inc. and have been licensed for use by Fidelity Distributors Corporation.
Other third party marks appearing herein are the property of their respective owners.
All other marks appearing herein are registered or unregistered trademarks or service marks of FMR LLC or an affiliated company. © 2013 FMR LLC. All rights reserved.
This report and the financial statements contained herein are submitted for the general information of the shareholders of the fund. This report is not authorized for distribution to prospective investors in the fund unless preceded or accompanied by an effective prospectus.
A fund files its complete schedule of portfolio holdings with the SEC for the first and third quarters of each fiscal year on Form N-Q. Forms N-Q are available on the SEC's web site at http://www.sec.gov. A fund's Forms N-Q may be reviewed and copied at the SEC's Public Reference Room in Washington, DC. Information regarding the operation of the SEC's Public Reference Room may be obtained by calling 1-800-SEC-0330. For a complete list of a fund's portfolio holdings, view the most recent holdings listing, semiannual report, or annual report on Fidelity's web site at http://www.fidelity.com, http://www.advisor.fidelity.com, or http://www.401k.com, as applicable.
NOT FDIC INSURED • MAY LOSE VALUE • NO BANK GUARANTEE
Neither the fund nor Fidelity Distributors Corporation is a bank.
Semiannual Report
Shareholder Expense Example
As a shareholder of the Fund, you incur two types of costs: (1) transaction costs, and (2) ongoing costs, including management fees and other Fund expenses. This Example is intended to help you understand your ongoing costs (in dollars) of investing in the Fund and to compare these costs with the ongoing costs of investing in other mutual funds.
The Example is based on an investment of $1,000 invested at the beginning of the period and held for the entire period (July 1, 2012 to December 31, 2012).
Actual Expenses
The first line of the accompanying table for each class of the Fund provides information about actual account values and actual expenses. You may use the information in this line, together with the amount you invested, to estimate the expenses that you paid over the period. Simply divide your account value by $1,000.00 (for example, an $8,600 account value divided by $1,000.00 = 8.6), then multiply the result by the number in the first line for a class of the Fund under the heading entitled "Expenses Paid During Period" to estimate the expenses you paid on your account during this period. A small balance maintenance fee of $12.00 that is charged once a year may apply for certain accounts with a value of less than $2,000. This fee is not included in the table below. If it was, the estimate of expenses you paid during the period would be higher, and your ending account value lower, by this amount. In addition, the Fund, as a shareholder in the underlying Fidelity Central Funds, will indirectly bear its pro-rata share of the fees and expenses incurred by the underlying Fidelity Central Funds. These fees and expenses are not included in the Fund's annualized expense ratio used to calculate the expense estimate in the table below.
Hypothetical Example for Comparison Purposes
The second line of the accompanying table for each class of the Fund provides information about hypothetical account values and hypothetical expenses based on a Class' actual expense ratio and an assumed rate of return of 5% per year before expenses, which is not the Class' actual return. The hypothetical account values and expenses may not be used to estimate the actual ending account balance or expenses you paid for the period. You may use this information to compare the ongoing costs of investing in the Fund and other funds. To do so, compare this 5% hypothetical example with the 5% hypothetical examples that appear in the shareholder reports of the other funds. A small balance maintenance fee of $12.00 that is charged once a year may apply for certain accounts with a value of less than $2,000. This fee is not included in the table below. If it was, the estimate of expenses you paid during the period would be higher, and your ending account value lower, by this amount. In addition, the Fund, as a shareholder in the underlying Fidelity Central Funds, will indirectly bear its pro-rata share of the fees and expenses incurred by the underlying Fidelity Central Funds. These fees and expenses are not included in the Fund's annualized expense ratio used to calculate the expense estimate in the table below.
Please note that the expenses shown in the table are meant to highlight your ongoing costs only and do not reflect any transaction costs. Therefore, the second line of the table is useful in comparing ongoing costs only, and will not help you determine the relative total costs of owning different funds.
Semiannual Report
Shareholder Expense Example - continued
| Annualized | Beginning | Ending | Expenses Paid |
Fidelity Fund | .57% |
|
|
|
Actual |
| $ 1,000.00 | $ 1,052.20 | $ 2.95 |
HypotheticalA |
| $ 1,000.00 | $ 1,022.33 | $ 2.91 |
Class K | .43% |
|
|
|
Actual |
| $ 1,000.00 | $ 1,052.90 | $ 2.23 |
HypotheticalA |
| $ 1,000.00 | $ 1,023.04 | $ 2.19 |
A 5% return per year before expenses
* Expenses are equal to each Class' annualized expense ratio, multiplied by the average account value over the period, multiplied by 184/365 (to reflect the one-half year period).
Semiannual Report
Investment Changes (Unaudited)
Top Ten Stocks as of December 31, 2012 | ||
| % of fund's | % of fund's net assets |
Apple, Inc. | 4.0 | 6.8 |
Google, Inc. Class A | 2.9 | 1.4 |
General Electric Co. | 2.8 | 0.0 |
Pfizer, Inc. | 2.3 | 1.8 |
Chevron Corp. | 2.0 | 2.6 |
Wells Fargo & Co. | 2.0 | 2.8 |
Citigroup, Inc. | 2.0 | 0.7 |
Amgen, Inc. | 2.0 | 1.8 |
The Coca-Cola Co. | 1.9 | 2.1 |
JPMorgan Chase & Co. | 1.9 | 1.1 |
| 23.8 | |
Top Five Market Sectors as of December 31, 2012 | ||
| % of fund's | % of fund's net assets |
Information Technology | 18.3 | 20.3 |
Financials | 16.5 | 12.4 |
Health Care | 14.1 | 14.9 |
Consumer Discretionary | 11.5 | 10.8 |
Consumer Staples | 9.0 | 13.0 |
Asset Allocation (% of fund's net assets) | |||||||
As of December 31, 2012* | As of June 30, 2012** | ||||||
 | Stocks 99.1% |
| | Stocks 95.8% |
| ||
 | Convertible Securities 0.1% |
| | Convertible Securities 0.1% |
| ||
 | Short-Term |
| | Short-Term |
| ||
* Foreign investments | 10.5% |
| ** Foreign investments | 9.2% |
| ||

Semiannual Report
Investments December 31, 2012 (Unaudited)
Showing Percentage of Net Assets
Common Stocks - 98.4% | |||
Shares | Value (000s) | ||
CONSUMER DISCRETIONARY - 10.8% | |||
Hotels, Restaurants & Leisure - 1.9% | |||
McDonald's Corp. | 302,300 | $ 26,666 | |
Starbucks Corp. | 770,098 | 41,293 | |
Yum! Brands, Inc. | 461,900 | 30,670 | |
| 98,629 | ||
Household Durables - 2.2% | |||
D.R. Horton, Inc. | 2,190,600 | 43,330 | |
PulteGroup, Inc. (a) | 796,100 | 14,457 | |
Ryland Group, Inc. | 651,000 | 23,762 | |
Whirlpool Corp. | 294,100 | 29,925 | |
| 111,474 | ||
Internet & Catalog Retail - 0.7% | |||
Amazon.com, Inc. (a) | 149,500 | 37,545 | |
Media - 3.0% | |||
Comcast Corp. Class A | 1,807,000 | 67,546 | |
The Walt Disney Co. | 1,023,800 | 50,975 | |
Virgin Media, Inc. (d) | 999,000 | 36,713 | |
| 155,234 | ||
Multiline Retail - 0.4% | |||
Next PLC | 314,600 | 19,097 | |
Specialty Retail - 2.2% | |||
Home Depot, Inc. | 1,344,800 | 83,176 | |
TJX Companies, Inc. | 718,900 | 30,517 | |
| 113,693 | ||
Textiles, Apparel & Luxury Goods - 0.4% | |||
Ralph Lauren Corp. | 143,873 | 21,569 | |
TOTAL CONSUMER DISCRETIONARY | 557,241 | ||
CONSUMER STAPLES - 9.0% | |||
Beverages - 3.1% | |||
Beam, Inc. | 169,300 | 10,343 | |
Diageo PLC | 455,779 | 13,275 | |
Dr. Pepper Snapple Group, Inc. | 351,600 | 15,534 | |
Grupo Modelo SAB de CV Series C | 2,373,700 | 21,305 | |
The Coca-Cola Co. | 2,756,000 | 99,905 | |
| 160,362 | ||
Common Stocks - continued | |||
Shares | Value (000s) | ||
CONSUMER STAPLES - continued | |||
Food & Staples Retailing - 1.4% | |||
CVS Caremark Corp. | 1,001,700 | $ 48,432 | |
Wal-Mart Stores, Inc. | 323,600 | 22,079 | |
| 70,511 | ||
Food Products - 1.6% | |||
Bunge Ltd. | 435,000 | 31,620 | |
Kraft Foods Group, Inc. | 441,133 | 20,058 | |
Mondelez International, Inc. | 1,323,400 | 33,707 | |
| 85,385 | ||
Household Products - 0.7% | |||
Colgate-Palmolive Co. | 230,400 | 24,086 | |
Kimberly-Clark Corp. | 120,000 | 10,132 | |
| 34,218 | ||
Tobacco - 2.2% | |||
British American Tobacco PLC (United Kingdom) | 403,900 | 20,532 | |
Japan Tobacco, Inc. | 774,000 | 21,865 | |
Lorillard, Inc. | 66,000 | 7,700 | |
Philip Morris International, Inc. | 772,900 | 64,645 | |
| 114,742 | ||
TOTAL CONSUMER STAPLES | 465,218 | ||
ENERGY - 8.8% | |||
Energy Equipment & Services - 0.4% | |||
Ensco PLC Class A | 100,000 | 5,928 | |
Ocean Rig UDW, Inc. (United States) (a) | 663,410 | 9,931 | |
Seadrill Partners LLC | 216,200 | 5,546 | |
| 21,405 | ||
Oil, Gas & Consumable Fuels - 8.4% | |||
Anadarko Petroleum Corp. | 435,700 | 32,377 | |
Cheniere Energy, Inc. (a) | 439,100 | 8,246 | |
Chevron Corp. | 951,200 | 102,863 | |
EV Energy Partners LP | 259,500 | 14,677 | |
Exxon Mobil Corp. | 899,700 | 77,869 | |
Hess Corp. | 221,800 | 11,747 | |
HollyFrontier Corp. | 298,400 | 13,891 | |
InterOil Corp. (a)(d) | 205,800 | 11,428 | |
Marathon Oil Corp. | 350,000 | 10,731 | |
Marathon Petroleum Corp. | 673,800 | 42,449 | |
Occidental Petroleum Corp. | 170,700 | 13,077 | |
Common Stocks - continued | |||
Shares | Value (000s) | ||
ENERGY - continued | |||
Oil, Gas & Consumable Fuels - continued | |||
Phillips 66 | 257,000 | $ 13,647 | |
The Williams Companies, Inc. | 1,197,000 | 39,190 | |
Valero Energy Corp. | 789,800 | 26,948 | |
WPX Energy, Inc. | 755,300 | 11,239 | |
| 430,379 | ||
TOTAL ENERGY | 451,784 | ||
FINANCIALS - 16.5% | |||
Capital Markets - 2.0% | |||
Goldman Sachs Group, Inc. | 257,700 | 32,872 | |
Morgan Stanley | 1,573,700 | 30,089 | |
T. Rowe Price Group, Inc. | 280,200 | 18,249 | |
UBS AG (NY Shares) | 1,441,000 | 22,681 | |
| 103,891 | ||
Commercial Banks - 4.2% | |||
M&T Bank Corp. | 314,300 | 30,949 | |
SunTrust Banks, Inc. | 1,414,900 | 40,112 | |
U.S. Bancorp | 1,033,000 | 32,994 | |
Wells Fargo & Co. | 2,969,167 | 101,486 | |
Zions Bancorporation | 601,351 | 12,869 | |
| 218,410 | ||
Consumer Finance - 1.6% | |||
American Express Co. | 567,092 | 32,596 | |
Discover Financial Services | 1,323,400 | 51,017 | |
| 83,613 | ||
Diversified Financial Services - 5.0% | |||
Bank of America Corp. | 4,914,400 | 57,007 | |
Citigroup, Inc. | 2,549,910 | 100,874 | |
JPMorgan Chase & Co. | 2,207,000 | 97,042 | |
| 254,923 | ||
Insurance - 1.6% | |||
American International Group, Inc. (a) | 825,000 | 29,123 | |
Berkshire Hathaway, Inc. Class B (a) | 592,400 | 53,138 | |
| 82,261 | ||
Real Estate Investment Trusts - 2.1% | |||
American Tower Corp. | 871,300 | 67,325 | |
AvalonBay Communities, Inc. | 140,000 | 18,983 | |
Common Stocks - continued | |||
Shares | Value (000s) | ||
FINANCIALS - continued | |||
Real Estate Investment Trusts - continued | |||
Public Storage | 87,900 | $ 12,742 | |
Weyerhaeuser Co. | 300,000 | 8,346 | |
| 107,396 | ||
TOTAL FINANCIALS | 850,494 | ||
HEALTH CARE - 14.1% | |||
Biotechnology - 5.3% | |||
Acorda Therapeutics, Inc. (a) | 551,237 | 13,704 | |
Amgen, Inc. | 1,164,700 | 100,537 | |
Biogen Idec, Inc. (a) | 334,600 | 49,076 | |
BioMarin Pharmaceutical, Inc. (a) | 356,400 | 17,553 | |
Elan Corp. PLC sponsored ADR (a) | 1,648,296 | 16,829 | |
Gilead Sciences, Inc. (a) | 557,400 | 40,941 | |
Grifols SA ADR | 332,535 | 8,623 | |
Prothena Corp. PLC (a) | 40,202 | 295 | |
Seattle Genetics, Inc. (a)(d) | 264,300 | 6,132 | |
Theravance, Inc. (a) | 710,200 | 15,816 | |
| 269,506 | ||
Health Care Equipment & Supplies - 0.5% | |||
Covidien PLC | 446,500 | 25,781 | |
Health Care Providers & Services - 1.0% | |||
Brookdale Senior Living, Inc. (a) | 838,400 | 21,228 | |
Henry Schein, Inc. (a) | 351,300 | 28,266 | |
Qualicorp SA (a) | 281,000 | 2,946 | |
| 52,440 | ||
Pharmaceuticals - 7.3% | |||
Allergan, Inc. | 545,200 | 50,011 | |
AVANIR Pharmaceuticals Class A (a)(d) | 1,337,500 | 3,518 | |
Eli Lilly & Co. | 1,084,300 | 53,478 | |
Johnson & Johnson | 1,050,000 | 73,605 | |
Merck & Co., Inc. | 1,941,100 | 79,469 | |
Pfizer, Inc. | 4,679,400 | 117,359 | |
| 377,440 | ||
TOTAL HEALTH CARE | 725,167 | ||
INDUSTRIALS - 8.8% | |||
Aerospace & Defense - 1.3% | |||
Honeywell International, Inc. | 425,000 | 26,975 | |
Common Stocks - continued | |||
Shares | Value (000s) | ||
INDUSTRIALS - continued | |||
Aerospace & Defense - continued | |||
Raytheon Co. | 125,000 | $ 7,195 | |
Textron, Inc. | 1,385,800 | 34,354 | |
| 68,524 | ||
Building Products - 1.5% | |||
Armstrong World Industries, Inc. | 973,400 | 49,381 | |
ASSA ABLOY AB (B Shares) | 678,600 | 25,544 | |
| 74,925 | ||
Industrial Conglomerates - 3.3% | |||
Danaher Corp. | 443,800 | 24,808 | |
General Electric Co. | 6,908,400 | 145,007 | |
| 169,815 | ||
Machinery - 1.0% | |||
Cummins, Inc. | 499,400 | 54,110 | |
Road & Rail - 1.6% | |||
Union Pacific Corp. | 643,300 | 80,876 | |
Trading Companies & Distributors - 0.1% | |||
Beacon Roofing Supply, Inc. (a) | 150,000 | 4,992 | |
TOTAL INDUSTRIALS | 453,242 | ||
INFORMATION TECHNOLOGY - 18.3% | |||
Communications Equipment - 2.6% | |||
Motorola Solutions, Inc. | 1,274,300 | 70,953 | |
QUALCOMM, Inc. | 1,030,800 | 63,930 | |
| 134,883 | ||
Computers & Peripherals - 4.0% | |||
Apple, Inc. | 383,500 | 204,415 | |
Electronic Equipment & Components - 1.3% | |||
Amphenol Corp. Class A | 972,738 | 62,936 | |
InvenSense, Inc. (a)(d) | 627,800 | 6,975 | |
| 69,911 | ||
Internet Software & Services - 4.9% | |||
eBay, Inc. (a) | 1,581,900 | 80,709 | |
Facebook, Inc. Class A | 260,071 | 6,926 | |
Google, Inc. Class A (a) | 211,800 | 150,245 | |
LinkedIn Corp. (a) | 115,700 | 13,285 | |
| 251,165 | ||
Common Stocks - continued | |||
Shares | Value (000s) | ||
INFORMATION TECHNOLOGY - continued | |||
IT Services - 1.7% | |||
Cognizant Technology Solutions Corp. Class A (a) | 323,100 | $ 23,926 | |
Fidelity National Information Services, Inc. | 360,700 | 12,556 | |
Visa, Inc. Class A | 352,600 | 53,447 | |
| 89,929 | ||
Semiconductors & Semiconductor Equipment - 2.2% | |||
Altera Corp. | 637,300 | 21,949 | |
ASML Holding NV | 527,427 | 33,972 | |
NXP Semiconductors NV (a) | 663,500 | 17,496 | |
Samsung Electronics Co. Ltd. | 25,968 | 37,554 | |
Skyworks Solutions, Inc. (a) | 50,000 | 1,015 | |
| 111,986 | ||
Software - 1.6% | |||
Citrix Systems, Inc. (a) | 189,900 | 12,486 | |
Oracle Corp. | 2,046,500 | 68,189 | |
| 80,675 | ||
TOTAL INFORMATION TECHNOLOGY | 942,964 | ||
MATERIALS - 6.9% | |||
Chemicals - 4.1% | |||
Arkema SA | 246,400 | 25,872 | |
Eastman Chemical Co. | 541,100 | 36,822 | |
Ecolab, Inc. | 150,000 | 10,785 | |
LyondellBasell Industries NV Class A | 200,105 | 11,424 | |
Mexichem SAB de CV | 1,451,700 | 8,098 | |
Monsanto Co. | 724,900 | 68,612 | |
Sherwin-Williams Co. | 120,600 | 18,551 | |
W.R. Grace & Co. (a) | 448,100 | 30,126 | |
| 210,290 | ||
Construction Materials - 2.1% | |||
HeidelbergCement Finance AG | 243,500 | 14,900 | |
Lafarge SA (Bearer) | 297,300 | 19,197 | |
Martin Marietta Materials, Inc. | 410,000 | 38,655 | |
Vulcan Materials Co. | 712,100 | 37,065 | |
| 109,817 | ||
Common Stocks - continued | |||
Shares | Value (000s) | ||
MATERIALS - continued | |||
Metals & Mining - 0.7% | |||
Rio Tinto PLC sponsored ADR | 300,000 | $ 17,427 | |
Vale SA (PN-A) sponsored ADR | 800,000 | 16,240 | |
| 33,667 | ||
TOTAL MATERIALS | 353,774 | ||
TELECOMMUNICATION SERVICES - 2.6% | |||
Diversified Telecommunication Services - 1.9% | |||
CenturyLink, Inc. | 601,300 | 23,523 | |
Iliad SA | 120,165 | 20,772 | |
Verizon Communications, Inc. | 1,228,800 | 53,170 | |
| 97,465 | ||
Wireless Telecommunication Services - 0.7% | |||
Sprint Nextel Corp. (a) | 4,593,200 | 26,043 | |
Vodafone Group PLC sponsored ADR | 426,300 | 10,738 | |
| 36,781 | ||
TOTAL TELECOMMUNICATION SERVICES | 134,246 | ||
UTILITIES - 2.6% | |||
Electric Utilities - 1.6% | |||
Edison International | 671,400 | 30,341 | |
NextEra Energy, Inc. | 478,700 | 33,121 | |
PPL Corp. | 597,000 | 17,092 | |
| 80,554 | ||
Gas Utilities - 0.5% | |||
ONEOK, Inc. | 603,300 | 25,791 | |
Multi-Utilities - 0.5% | |||
Sempra Energy | 393,200 | 27,894 | |
TOTAL UTILITIES | 134,239 | ||
TOTAL COMMON STOCKS (Cost $4,466,009) |
| ||
Preferred Stocks - 0.8% | |||
Shares | Value (000s) | ||
Convertible Preferred Stocks - 0.1% | |||
INDUSTRIALS - 0.1% | |||
Aerospace & Defense - 0.1% | |||
United Technologies Corp. 7.50% | 105,600 | $ 5,883 | |
Nonconvertible Preferred Stocks - 0.7% | |||
CONSUMER DISCRETIONARY - 0.7% | |||
Automobiles - 0.7% | |||
Volkswagen AG | 145,100 | 33,293 | |
TOTAL PREFERRED STOCKS (Cost $34,867) |
| ||
Money Market Funds - 1.8% | |||
|
|
|
|
Fidelity Cash Central Fund, 0.18% (b) | 71,383,888 | 71,384 | |
Fidelity Securities Lending Cash Central Fund, 0.18% (b)(c) | 23,854,800 | 23,855 | |
TOTAL MONEY MARKET FUNDS (Cost $95,239) |
| ||
TOTAL INVESTMENT PORTFOLIO - 101.0% (Cost $4,596,115) | 5,202,784 | ||
NET OTHER ASSETS (LIABILITIES) - (1.0)% | (51,684) | ||
NET ASSETS - 100% | $ 5,151,100 | ||
Legend |
(a) Non-income producing |
(b) Affiliated fund that is available only to investment companies and other accounts managed by Fidelity Investments. The rate quoted is the annualized seven-day yield of the fund at period end. A complete unaudited listing of the fund's holdings as of its most recent quarter end is available upon request. In addition, each Fidelity Central Fund's financial statements are available on the SEC's website or upon request. |
(c) Investment made with cash collateral received from securities on loan. |
(d) Security or a portion of the security is on loan at period end. |
Affiliated Central Funds |
Information regarding fiscal year to date income earned by the Fund from investments in Fidelity Central Funds is as follows: |
Fund | Income earned |
Fidelity Cash Central Fund | $ 115 |
Fidelity Securities Lending Cash Central Fund | 305 |
Total | $ 420 |
Other Information |
The following is a summary of the inputs used, as of December 31, 2012, involving the Fund's assets and liabilities carried at fair value. The inputs or methodology used for valuing securities may not be an indication of the risk associated with investing in those securities. For more information on valuation inputs, and their aggregation into the levels used in the table below, please refer to the Investment Valuation section in the accompanying Notes to Financial Statements. |
Valuation Inputs at Reporting Date: | ||||
Description | Total | Level 1 | Level 2 | Level 3 |
Investments in Securities: | ||||
Equities: | ||||
Consumer Discretionary | $ 590,534 | $ 538,144 | $ 52,390 | $ - |
Consumer Staples | 465,218 | 409,546 | 55,672 | - |
Energy | 451,784 | 451,784 | - | - |
Financials | 850,494 | 850,494 | - | - |
Health Care | 725,167 | 722,221 | 2,946 | - |
Industrials | 459,125 | 433,581 | 25,544 | - |
Information Technology | 942,964 | 905,410 | 37,554 | - |
Materials | 353,774 | 293,805 | 59,969 | - |
Telecommunication Services | 134,246 | 113,474 | 20,772 | - |
Utilities | 134,239 | 134,239 | - | - |
Money Market Funds | 95,239 | 95,239 | - | - |
Total Investments in Securities: | $ 5,202,784 | $ 4,947,937 | $ 254,847 | $ - |
Distribution of investments by country or territory of incorporation, as a percentage of total net assets, is as follows. (Unaudited) |
United States of America | 89.5% |
United Kingdom | 1.8% |
France | 1.3% |
Netherlands | 1.3% |
Germany | 1.0% |
Others (Individually Less Than 1%) | 5.1% |
| 100.0% |
See accompanying notes which are an integral part of the financial statements.
Semiannual Report
Financial Statements
Statement of Assets and Liabilities
Amounts in thousands (except per-share amounts) | December 31, 2012 (Unaudited) | |
|
|
|
Assets | ||
Investment in securities, at value (including securities loaned of $23,471) - See accompanying schedule: Unaffiliated issuers (cost $4,500,876) | $ 5,107,545 |
|
Fidelity Central Funds (cost $95,239) | 95,239 |
|
Total Investments (cost $4,596,115) |
| $ 5,202,784 |
Cash |
| 1 |
Receivable for investments sold | 2,075 | |
Receivable for fund shares sold | 1,715 | |
Dividends receivable | 6,408 | |
Distributions receivable from Fidelity Central Funds | 36 | |
Prepaid expenses | 14 | |
Other receivables | 1,075 | |
Total assets | 5,214,108 | |
|
|
|
Liabilities | ||
Payable for fund shares redeemed | 36,587 | |
Accrued management fee | 1,497 | |
Other affiliated payables | 830 | |
Other payables and accrued expenses | 239 | |
Collateral on securities loaned, at value | 23,855 | |
Total liabilities | 63,008 | |
|
|
|
Net Assets | $ 5,151,100 | |
Net Assets consist of: |
| |
Paid in capital | $ 4,535,198 | |
Distributions in excess of net investment income | (2,551) | |
Accumulated undistributed net realized gain (loss) on investments and foreign currency transactions | 11,781 | |
Net unrealized appreciation (depreciation) on investments and assets and liabilities in foreign currencies | 606,672 | |
Net Assets | $ 5,151,100 | |
See accompanying notes which are an integral part of the financial statements.
Semiannual Report
Financial Statements - continued
Statement of Assets and Liabilities - continued
Amounts in thousands (except per-share amounts) | December 31, 2012 (Unaudited) | |
|
|
|
Fidelity Fund: | $ 35.81 | |
|
|
|
Class K: | $ 35.79 | |
See accompanying notes which are an integral part of the financial statements.
Semiannual Report
Statement of Operations
Amounts in thousands Six months ended December 31, 2012 (Unaudited) | ||
|
|
|
Investment Income |
|
|
Dividends |
| $ 52,582 |
Income from Fidelity Central Funds |
| 420 |
Total income |
| 53,002 |
|
|
|
Expenses | ||
Management fee | $ 9,095 | |
Transfer agent fees | 4,471 | |
Accounting and security lending fees | 548 | |
Custodian fees and expenses | 59 | |
Independent trustees' compensation | 19 | |
Registration fees | 49 | |
Audit | 42 | |
Legal | 25 | |
Miscellaneous | 22 | |
Total expenses before reductions | 14,330 | |
Expense reductions | (476) | 13,854 |
Net investment income (loss) | 39,148 | |
Realized and Unrealized Gain (Loss) Net realized gain (loss) on: | ||
Investment securities: |
|
|
Unaffiliated issuers | 262,762 | |
Foreign currency transactions | (148) | |
Total net realized gain (loss) |
| 262,614 |
Change in net unrealized appreciation (depreciation) on: Investment securities | (35,645) | |
Assets and liabilities in foreign currencies | (3) | |
Total change in net unrealized appreciation (depreciation) |
| (35,648) |
Net gain (loss) | 226,966 | |
Net increase (decrease) in net assets resulting from operations | $ 266,114 | |
See accompanying notes which are an integral part of the financial statements.
Semiannual Report
Financial Statements - continued
Statement of Changes in Net Assets
Amounts in thousands | Six months ended December 31, 2012 | Year ended |
Increase (Decrease) in Net Assets |
|
|
Operations |
|
|
Net investment income (loss) | $ 39,148 | $ 59,563 |
Net realized gain (loss) | 262,614 | 142,752 |
Change in net unrealized appreciation (depreciation) | (35,648) | (169,796) |
Net increase (decrease) in net assets resulting | 266,114 | 32,519 |
Distributions to shareholders from net investment income | (73,239) | (36,948) |
Share transactions - net increase (decrease) | (220,266) | (552,271) |
Total increase (decrease) in net assets | (27,391) | (556,700) |
|
|
|
Net Assets | ||
Beginning of period | 5,178,491 | 5,735,191 |
End of period (including distributions in excess of net investment income of $2,551 and undistributed net investment income of $31,540, respectively) | $ 5,151,100 | $ 5,178,491 |
See accompanying notes which are an integral part of the financial statements.
Semiannual Report
Financial Highlights - Fidelity Fund
| Six months ended | Years ended June 30, | ||||
| (Unaudited) | 2012 | 2011 | 2010 | 2009 | 2008 |
Selected Per-Share Data |
|
|
|
|
|
|
Net asset value, beginning of period | $ 34.51 | $ 34.35 | $ 26.08 | $ 23.95 | $ 35.69 | $ 38.98 |
Income from Investment Operations |
|
|
|
|
|
|
Net investment income (loss) D | .26 | .37 | .27 G | .23 | .44 | .37 |
Net realized and unrealized gain (loss) | 1.53 | .02 H | 8.27 | 2.25 | (10.77) | (1.65) |
Total from investment operations | 1.79 | .39 | 8.54 | 2.48 | (10.33) | (1.28) |
Distributions from net investment income | (.49) | (.23) | (.27) | (.35) | (.42) | (.38) |
Distributions from net realized gain | - | - | - | - | (.99) | (1.63) |
Total distributions | (.49) | (.23) | (.27) | (.35) | (1.41) | (2.01) |
Net asset value, end of period | $ 35.81 | $ 34.51 | $ 34.35 | $ 26.08 | $ 23.95 | $ 35.69 |
Total Return B, C | 5.22% | 1.21% | 32.89% | 10.40% | (29.74)% | (3.73)% |
Ratios to Average Net Assets E, I |
|
|
|
|
| |
Expenses before reductions | .57% A | .58% | .59% | .61% | .64% | .56% |
Expenses net of fee waivers, if any | .57% A | .58% | .59% | .61% | .64% | .56% |
Expenses net of all reductions | .55% A | .58% | .58% | .60% | .64% | .55% |
Net investment income (loss) | 1.47% A | 1.13% | .86% G | .82% | 1.73% | .98% |
Supplemental Data |
|
|
|
|
|
|
Net assets, end of period (in millions) | $ 4,270 | $ 4,364 | $ 5,072 | $ 4,412 | $ 4,442 | $ 7,174 |
Portfolio turnover rate F | 106% A | 102% | 88% | 77% | 91% | 80% |
A Annualized
B Total returns for periods of less than one year are not annualized.
C Total returns would have been lower if certain expenses had not been reduced during the applicable periods shown.
D Calculated based on average shares outstanding during the period.
E Fees and expenses of any underlying Fidelity Central Funds are not included in the Fund's expense ratio. The Fund indirectly bears its proportionate share of the expenses of any underlying Fidelity Central Funds.
F Amount does not include the portfolio activity of any underlying Fidelity Central Funds.
G Investment income per share reflects a large, non-recurring dividend which amounted to $.08 per share. Excluding this non-recurring dividend, the ratio of net investment income (loss) to average net assets would have been .60%.
H The amount shown for a share outstanding does not correspond with the aggregate net gain (loss) on investments for the period due to the timing of sales and repurchases of shares in relation to fluctuating market values of the investments of the Fund.
I Expense ratios reflect operating expenses of the class. Expenses before reductions do not reflect amounts reimbursed by the investment adviser or reductions from brokerage service arrangements or reductions from other expense offset arrangements and do not represent the amount paid by the class during periods when reimbursements or reductions occur. Expenses net of fee waivers reflect expenses after reimbursement by the investment adviser but prior to reductions from brokerage service arrangements or other expense offset arrangements. Expenses net of all reductions represent the net expenses paid by the class.
See accompanying notes which are an integral part of the financial statements.
Semiannual Report
Financial Highlights - Class K
| Six months ended | Years ended June 30, | ||||
| (Unaudited) | 2012 | 2011 | 2010 | 2009 | 2008 I |
Selected Per-Share Data |
|
|
|
|
|
|
Net asset value, beginning of period | $ 34.52 | $ 34.35 | $ 26.08 | $ 23.96 | $ 35.70 | $ 37.54 |
Income from Investment Operations |
|
|
|
|
|
|
Net investment income (loss) D | .29 | .42 | .32 G | .28 | .42 | .05 |
Net realized and unrealized gain (loss) | 1.52 | .02 H | 8.27 | 2.24 | (10.70) | (1.89) |
Total from investment operations | 1.81 | .44 | 8.59 | 2.52 | (10.28) | (1.84) |
Distributions from net investment income | (.54) | (.27) | (.32) | (.40) | (.47) | - |
Distributions from net realized gain | - | - | - | - | (.99) | - |
Total distributions | (.54) | (.27) | (.32) | (.40) | (1.46) | - |
Net asset value, end of period | $ 35.79 | $ 34.52 | $ 34.35 | $ 26.08 | $ 23.96 | $ 35.70 |
Total Return B, C | 5.29% | 1.37% | 33.10% | 10.54% | (29.59)% | (4.90)% |
Ratios to Average Net Assets E, J |
|
|
|
|
| |
Expenses before reductions | .43% A | .43% | .43% | .44% | .45% | .43% A |
Expenses net of fee waivers, if any | .43% A | .43% | .43% | .44% | .45% | .43% A |
Expenses net of all reductions | .41% A | .42% | .42% | .43% | .45% | .43% A |
Net investment income (loss) | 1.61% A | 1.29% | 1.02% G | .99% | 1.92% | 1.00% A |
Supplemental Data |
|
|
|
|
|
|
Net assets, end of period (000 omitted) | $ 881,314 | $ 814,219 | $ 662,929 | $ 425,831 | $ 274,168 | $ 95 |
Portfolio turnover rate F | 106% A | 102% | 88% | 77% | 91% | 80% |
A Annualized
B Total returns for periods of less than one year are not annualized.
C Total returns would have been lower if certain expenses had not been reduced during the applicable periods shown.
D Calculated based on average shares outstanding during the period.
E Fees and expenses of any underlying Fidelity Central Funds are not included in the Fund's expense ratio. The Fund indirectly bears its proportionate share of the expenses of any underlying Fidelity Central Funds.
F Amount does not include the portfolio activity of any underlying Fidelity Central Funds.
G Investment income per share reflects a large, non-recurring dividend which amounted to $.08 per share. Excluding this non-recurring dividend, the ratio of net investment income (loss) to average net assets would have been .76%.
H The amount shown for a share outstanding does not correspond with the aggregate net gain (loss) on investments for the period due to the timing of sales and repurchases of shares in relation to fluctuating market values of the investments of the Fund.
I For the period May 9, 2008 (commencement of sale of shares) to June 30, 2008.
J Expense ratios reflect operating expenses of the class. Expenses before reductions do not reflect amounts reimbursed by the investment adviser or reductions from brokerage service arrangements or reductions from other expense offset arrangements and do not represent the amount paid by the class during periods when reimbursements or reductions occur. Expense ratios before reductions for start-up periods may not be representative of longer-term operating periods. Expenses net of fee waivers reflect expenses after reimbursement by the investment adviser but prior to reductions from brokerage service arrangements or other expense offset arrangements. Expenses net of all reductions represent the net expenses paid by the class.
See accompanying notes which are an integral part of the financial statements.
Semiannual Report
Notes to Financial Statements
For the period ended December 31, 2012 (Unaudited)
(Amounts in thousands except percentages)
1. Organization.
Fidelity Fund (the Fund) is a fund of Fidelity Hastings Street Trust (the Trust) and is authorized to issue an unlimited number of shares. The Trust is registered under the Investment Company Act of 1940, as amended (the 1940 Act), as an open-end management investment company organized as a Massachusetts business trust. The Fund offers Fidelity Fund and Class K shares, each of which has equal rights as to assets and voting privileges. Each class has exclusive voting rights with respect to matters that affect that class. Investment income, realized and unrealized capital gains and losses, the common expenses of the Fund, and certain fund-level expense reductions, if any, are allocated on a pro-rata basis to each class based on the relative net assets of each class to the total net assets of the Fund. Each class differs with respect to transfer agent fees incurred. Certain expense reductions may also differ by class.
2. Investments in Fidelity Central Funds.
The Fund invests in Fidelity Central Funds, which are open-end investment companies available only to other investment companies and accounts managed by Fidelity Management & Research Company (FMR) and its affiliates. The Fund's Schedule of Investments lists each of the Fidelity Central Funds held as of period end, if any, as an investment of the Fund, but does not include the underlying holdings of each Fidelity Central Fund. As an Investing Fund, the Fund indirectly bears its proportionate share of the expenses of the underlying Fidelity Central Funds.
The Money Market Central Funds seek preservation of capital and current income and are managed by Fidelity Investments Money Management, Inc. (FIMM), an affiliate of FMR.
A complete unaudited list of holdings for each Fidelity Central Fund is available upon request or at the Securities and Exchange Commission (the SEC) website at www.sec.gov. In addition, the financial statements of the Fidelity Central Funds are available on the SEC website or upon request.
3. Significant Accounting Policies.
The financial statements have been prepared in conformity with accounting principles generally accepted in the United States of America (GAAP), which require management to make certain estimates and assumptions at the date of the financial statements. Actual results could differ from those estimates. Subsequent events, if any, through the date that the financial statements were issued have been evaluated in the preparation of the financial statements. The following summarizes the significant accounting policies of the Fund:
Semiannual Report
Notes to Financial Statements (Unaudited) - continued
(Amounts in thousands except percentages)
3. Significant Accounting Policies - continued
Investment Valuation. Investments are valued as of 4:00 p.m. Eastern time on the last calendar day of the period. In accordance with valuation policies and procedures approved by the Board of Trustees (the Board), the Fund attempts to obtain prices from one or more third party pricing vendors or brokers to value its investments. When current market prices, quotations or rates are not readily available or reliable, investments will be fair valued in good faith by the FMR Fair Value Committee (the Committee), in accordance with procedures adopted by the Fund's Board. Factors used in determining fair value vary by investment type and may include market or investment specific events. The frequency with which these procedures are used cannot be predicted and they may be utilized to a significant extent. The Committee oversees the Fund's valuation policies and procedures and is responsible for approving and reporting to the Board all fair value determinations.
The Fund categorizes the inputs to valuation techniques used to value its investments into a disclosure hierarchy consisting of three levels as shown below:
Level 1 - quoted prices in active markets for identical investments
Level 2 - other significant observable inputs (including quoted prices for similar investments, interest rates, prepayment speeds, etc.)
Level 3 - unobservable inputs (including the Fund's own assumptions based on the best information available)
Valuation techniques used to value the Fund's investments by major category are as follows:
Equity securities, including restricted securities, for which market quotations are readily available, are valued at the last reported sale price or official closing price as reported by a third party pricing vendor on the primary market or exchange on which they are traded and are categorized as Level 1 in the hierarchy. In the event there were no sales during the day or closing prices are not available, securities are valued at the last quoted bid price or may be valued using the last available price and are generally categorized as Level 2 in the hierarchy. For foreign equity securities, when significant market or security specific events arise, comparisons to the valuation of American Depositary Receipts (ADRs), futures contracts, Exchange-Traded Funds (ETFs) and certain indexes as well as quoted prices for similar securities are used and are categorized as Level 2 in the hierarchy. Utilizing these techniques may result in transfers between Level 1 and Level 2.
Investments in open-end mutual funds, including the Fidelity Central Funds, are valued at their closing net asset value (NAV) each business day and are categorized as Level 1 in the hierarchy.
Semiannual Report
3. Significant Accounting Policies - continued
Investment Valuation - continued
Changes in valuation techniques may result in transfers in or out of an assigned level within the disclosure hierarchy. The aggregate value of investments by input level, as of December 31, 2012, is included at the end of the Fund's Schedule of Investments.
Foreign Currency. The Fund may use foreign currency contracts to facilitate transactions in foreign-denominated securities. Gains and losses from these transactions may arise from changes in the value of the foreign currency or if the counterparties do not perform under the contracts' terms.
Foreign-denominated assets, including investment securities, and liabilities are translated into U.S. dollars at the exchange rates at period end. Purchases and sales of investment securities, income and dividends received and expenses denominated in foreign currencies are translated into U.S. dollars at the exchange rate in effect on the transaction date.
The effects of exchange rate fluctuations on investments are included with the net realized and unrealized gain (loss) on investment securities. Other foreign currency transactions resulting in realized and unrealized gain (loss) are disclosed separately.
Investment Transactions and Income. For financial reporting purposes, the Fund's investment holdings and NAV include trades executed through the end of the last business day of the period. The NAV per share for processing shareholder transactions is calculated as of the close of business of the New York Stock Exchange (NYSE), normally 4:00 p.m. Eastern time and includes trades executed through the end of the prior business day. Gains and losses on securities sold are determined on the basis of identified cost and may include proceeds received from litigation. Dividend income is recorded on the ex-dividend date. Non-cash dividends included in dividend income, if any, are recorded at the fair market value of the securities received. Distributions received on securities that represent a return of capital or capital gain are recorded as a reduction of cost of investments and/or as a realized gain. The Fund estimates the components of distributions received that may be considered return of capital distributions or capital gain distributions. Interest income and distributions from the Fidelity Central Funds are accrued as earned. Interest income includes coupon interest and amortization of premium and accretion of discount on debt securities. Investment income is recorded net of foreign taxes withheld where recovery of such taxes is uncertain.
Expenses. Expenses directly attributable to a fund are charged to that fund. Expenses attributable to more than one fund are allocated among the respective funds on the basis of relative net assets or other appropriate methods. Expense estimates are accrued in the period to which they relate and adjustments are made when actual amounts are known.
Semiannual Report
Notes to Financial Statements (Unaudited) - continued
(Amounts in thousands except percentages)
3. Significant Accounting Policies - continued
Deferred Trustee Compensation. Under a Deferred Compensation Plan (the Plan), independent Trustees may elect to defer receipt of a portion of their annual compensation. Deferred amounts are invested in a cross-section of Fidelity funds, are marked-to-market and remain in the Fund until distributed in accordance with the Plan. The investment of deferred amounts and the offsetting payable to the Trustees are included in the accompanying Statement of Assets and Liabilities.
Income Tax Information and Distributions to Shareholders. Each year, the Fund intends to qualify as a regulated investment company under Subchapter M of the Internal Revenue Code, including distributing substantially all of its taxable income and realized gains. As a result, no provision for income taxes is required. The Fund files a U.S. federal tax return, in addition to state and local tax returns as required. A fund's federal income tax returns are subject to examination by the Internal Revenue Service (IRS) for a period of three fiscal years after they are filed. State and local tax returns may be subject to examination for an additional fiscal year depending on the jurisdiction. Foreign taxes are provided for based on the Fund's understanding of the tax rules and rates that exist in the foreign markets in which it invests.
Distributions are declared and recorded on the ex-dividend date. Income dividends and capital gain distributions are declared separately for each class. Income and capital gain distributions are determined in accordance with income tax regulations, which may differ from GAAP.
Capital accounts within the financial statements are adjusted for permanent book-tax differences. These adjustments have no impact on net assets or the results of operations. Temporary book-tax differences will reverse in a subsequent period.
Book-tax differences are primarily due to foreign currency transactions, equity-debt classifications, deferred trustees compensation, partnerships, capital loss carryforwards, losses deferred due to wash sales and excise tax regulations.
The federal tax cost of investment securities and unrealized appreciation (depreciation) as of period end were as follows:
Gross unrealized appreciation | $ 659,247 |
Gross unrealized depreciation | (83,997) |
Net unrealized appreciation (depreciation) on securities and other investments | $ 575,250 |
|
|
Tax cost | $ 4,627,534 |
Semiannual Report
3. Significant Accounting Policies - continued
Income Tax Information and Distributions to Shareholders - continued
Capital loss carryforwards are only available to offset future capital gains of the Fund to the extent provided by regulations and may be limited. Under the Regulated Investment Company Modernization Act of 2010 (the Act), the Fund is permitted to carry forward capital losses incurred in taxable years beginning after December 22, 2010 for an unlimited period and such capital losses are required to be used prior to any losses that expire. At June 30, 2012 capital loss carryforwards were as follows:
Fiscal year of expiration |
|
2018 | $ (185,683) |
4. Purchases and Sales of Investments.
Purchases and sales of securities, other than short-term securities, aggregated $2,690,590 and $2,777,611, respectively.
5. Fees and Other Transactions with Affiliates.
Management Fee. FMR and its affiliates provide the Fund with investment management related services for which the Fund pays a monthly management fee. The management fee is the sum of an individual fund fee rate that is based on an annual rate of .09% of the Fund's average net assets and an annualized group fee rate that averaged .26% during the period. The group fee rate is based upon the average net assets of all the mutual funds advised by FMR. The group fee rate decreases as assets under management increase and increases as assets under management decrease. For the period, the total annualized management fee rate was .35% of the Fund's average net assets.
Transfer Agent Fees. Fidelity Investments Institutional Operations Company, Inc. (FIIOC), an affiliate of FMR, is the transfer, dividend disbursing and shareholder servicing agent for each class of the Fund. FIIOC receives account fees and asset-based fees that vary according to the account size and type of account of the shareholders of Fidelity Fund. FIIOC receives an asset-based fee of Class K's average net assets. FIIOC pays for typesetting, printing and mailing of shareholder reports, except proxy statements. For the period, transfer agent fees for each class were as follows:
| Amount | % of |
Fidelity Fund | $ 4,254 | .19 |
Class K | 217 | .05 |
| $ 4,471 |
|
* Annualized
Semiannual Report
Notes to Financial Statements (Unaudited) - continued
(Amounts in thousands except percentages)
5. Fees and Other Transactions with Affiliates - continued
Accounting and Security Lending Fees. Fidelity Service Company, Inc. (FSC), an affiliate of FMR, maintains the Fund's accounting records. The accounting fee is based on the level of average net assets for each month. Under a separate contract, FSC administers the security lending program. The security lending fee is based on the number and duration of lending transactions.
Brokerage Commissions. The Fund placed a portion of its portfolio transactions with brokerage firms which are affiliates of the investment adviser. The commissions paid to these affiliated firms were $56 for the period.
6. Committed Line of Credit.
The Fund participates with other funds managed by FMR or an affiliate in a $4.25 billion credit facility (the "line of credit") to be utilized for temporary or emergency purposes to fund shareholder redemptions or for other short-term liquidity purposes. The Fund has agreed to pay commitment fees on its pro-rata portion of the line of credit, which amounted to $7 and is reflected in Miscellaneous expenses on the Statement of Operations. During the period, there were no borrowings on this line of credit.
7. Security Lending.
The Fund lends portfolio securities through a lending agent from time to time in order to earn additional income. For equity securities, a lending agent is used and may loan securities to certain qualified borrowers, including Fidelity Capital Markets (FCM), a broker-dealer affiliated with the Fund. On the settlement date of the loan, the Fund receives collateral (in the form of U.S. Treasury obligations, letters of credit and/or cash) against the loaned securities and maintains collateral in an amount not less than 100% of the market value of the loaned securities during the period of the loan. The market value of the loaned securities is determined at the close of business of the Fund and any additional required collateral is delivered to the Fund on the next business day. If the borrower defaults on its obligation to return the securities loaned because of insolvency or other reasons, a fund could experience delays and costs in recovering the securities loaned or in gaining access to the collateral. Any cash collateral received is invested in the Fidelity Securities Lending Cash Central Fund. The value of loaned securities and cash collateral at period end are disclosed on the Fund's Statement of Assets and Liabilities. The value of securities loaned to FCM at period end was $2,488. Security lending income represents the income earned on investing cash collateral, less rebates paid to borrowers and any lending agent fees associated with the loan, plus any premium payments received for lending certain types of securities. Security lending income is presented in the Statement of Operations as a component of income from Fidelity Central Funds. Total security lending income during the period amounted to $305, including $7 from securities loaned to FCM.
Semiannual Report
8. Expense Reductions.
Many of the brokers with whom FMR places trades on behalf of the Fund provided services to the Fund in addition to trade execution. These services included payments of certain expenses on behalf of the Fund totaling $476 for the period.
9. Distributions to Shareholders.
Distributions to shareholders of each class were as follows:
Six months ended December 31, 2012 | Year ended | |
From net investment income |
|
|
Fidelity Fund | $ 59,871 | $ 31,576 |
Class K | 13,368 | 5,372 |
Total | $ 73,239 | $ 36,948 |
10. Share Transactions.
Transactions for each class of shares were as follows:
| Shares | Dollars | ||
Six months ended December 31, 2012 | Year ended | Six months ended December 31, 2012 | Year ended | |
Fidelity Fund |
|
|
|
|
Shares sold | 3,198 | 9,192 | $ 113,482 | $ 299,999 |
Reinvestment of distributions | 1,584 | 967 | 55,780 | 29,465 |
Shares redeemed | (12,001) | (31,358) | (426,015) | (1,019,919) |
Net increase (decrease) | (7,219) | (21,199) | $ (256,753) | $ (690,455) |
Class K |
|
|
|
|
Shares sold | 3,409 | 9,901 | $ 121,123 | $ 323,105 |
Reinvestment of distributions | 380 | 176 | 13,368 | 5,372 |
Shares redeemed | (2,751) | (5,788) | (98,004) | (190,293) |
Net increase (decrease) | 1,038 | 4,289 | $ 36,487 | $ 138,184 |
11. Other.
The Fund's organizational documents provide former and current trustees and officers with a limited indemnification against liabilities arising in connection with the performance of their duties to the Fund. In the normal course of business, the Fund may also enter into contracts that provide general indemnifications. The Fund's maximum exposure under these arrangements is unknown as this would be dependent on future claims that may be made against the Fund. The risk of material loss from such claims is considered remote.
Semiannual Report
Board Approval of Investment Advisory Contracts and Management Fees
Fidelity Fund
Each year, the Board of Trustees, including the Independent Trustees (together, the Board), votes on the renewal of the management contract and sub-advisory agreements (together, the Advisory Contracts) for the fund. The Board, assisted by the advice of fund counsel and Independent Trustees' counsel, requests and considers a broad range of information relevant to the renewal of the Advisory Contracts throughout the year.
The Board meets regularly and, at each of its meetings, considers factors that are relevant to its annual consideration of the renewal of the fund's Advisory Contracts, including the services and support provided to the fund and its shareholders. The Board has established various standing committees, each composed of and chaired by Independent Trustees with varying backgrounds, to which the Board has assigned specific subject matter responsibilities in order to enhance effective decision-making by the Board. The Board, acting directly and through its Committees, requests and receives information concerning the annual consideration of the renewal of the fund's Advisory Contracts. The Board also meets as needed to consider matters specifically related to the Board's annual consideration of the renewal of Advisory Contracts. Members of the Board may also meet with trustees of other Fidelity funds through ad hoc joint committees to discuss certain matters relevant to the Fidelity funds.
At its July 2012 meeting, the Board of Trustees, including the Independent Trustees, unanimously determined to renew the fund's Advisory Contracts. In reaching its determination, the Board considered all factors it believed relevant, including (i) the nature, extent, and quality of the services to be provided to the fund and its shareholders (including the investment performance of the fund); (ii) the competitiveness of the fund's management fee and total expense ratio relative to peer funds; (iii) the total costs of the services to be provided by and the profits to be realized by Fidelity from its relationship with the fund; (iv) the extent to which economies of scale exist and would be realized as the fund grows; and (v) whether fee levels reflect these economies of scale, if any, for the benefit of fund shareholders.
In considering whether to renew the Advisory Contracts for the fund, the Board reached a determination, with the assistance of fund counsel and Independent Trustees' counsel and through the exercise of its business judgment, that the renewal of the Advisory Contracts is in the best interests of the fund and its shareholders and that the compensation payable under the Advisory Contracts is fair and reasonable. The Board's decision to renew the Advisory Contracts was not based on any single factor, but rather was based on a comprehensive consideration of all the information provided to the Board at its meetings throughout the year. The Board, in reaching its determination to renew the Advisory Contracts, is aware that shareholders in the fund have a broad range of investment choices available to them, including a wide choice among mutual funds offered by Fidelity's competitors, and that the fund's shareholders, who have the opportunity to review and weigh the disclosure provided by the fund in its prospectus and other public disclosures, have chosen to invest in this fund, managed by Fidelity.
Semiannual Report
Nature, Extent, and Quality of Services Provided. The Board considered the staffing within the investment adviser, FMR, and the sub-advisers (together, the Investment Advisers), including the backgrounds of the fund's investment personnel, and also considered the fund's investment objective, strategies, and related investment philosophy. The Independent Trustees also had discussions with senior management of Fidelity's investment operations and investment groups. The Board considered the structure of the portfolio manager compensation program and whether this structure provides appropriate incentives to act in the best interests of the fund.
Resources Dedicated to Investment Management and Support Services. The Board and the Fund Oversight and Research Committees reviewed the general qualifications and capabilities of the Investment Advisers' investment staff, including its size, education, experience, and resources, as well as the Investment Advisers' approach to recruiting, training, managing, and compensating investment personnel. The Board also noted that FMR has continued to increase the resources devoted to non-U.S. offices, including expansion of Fidelity's global investment organization. The Board noted that Fidelity's analysts have extensive resources, tools and capabilities that allow them to conduct sophisticated quantitative and fundamental analysis, as well as credit analysis of issuers, counterparties and guarantors. The Board also believes that Fidelity's investment professionals have sufficient access to global information and data so as to provide competitive investment results over time, and that those professionals also have access to sophisticated tools that permit them to assess portfolio construction and risk and performance attribution characteristics continuously, as well as to transmit new information and research conclusions rapidly around the world. Additionally, in its deliberations, the Board considered the Investment Advisers' trading and risk management capabilities and resources, which are an integral part of the investment management process.
Shareholder and Administrative Services. The Board considered (i) the nature, extent, quality, and cost of advisory, administrative, and shareholder services performed by the Investment Advisers and their affiliates under the Advisory Contracts and under separate agreements covering transfer agency, pricing and bookkeeping, and securities lending services for the fund; (ii) the nature and extent of the supervision of third party service providers, principally custodians and subcustodians; and (iii) the resources devoted to, and the record of compliance with, the fund's compliance policies and procedures. The Board also reviewed the allocation of fund brokerage, including allocations to brokers affiliated with the Investment Advisers, the use of brokerage commissions to pay fund expenses, and the use of "soft" commission dollars to pay for research services.
Semiannual Report
Board Approval of Investment Advisory Contracts and
Management Fees - continued
The Board noted that the growth of fund assets over time across the complex allows Fidelity to reinvest in the development of services designed to enhance the value or convenience of the Fidelity funds as investment vehicles. These services include 24-hour access to account information and market information through telephone representatives and over the Internet, investor education materials and asset allocation tools, and the expanded availability of Fidelity Investor Centers.
Investment in a Large Fund Family. The Board considered the benefits to shareholders of investing in a Fidelity fund, including the benefits of investing in a fund that is part of a large family of funds offering a variety of investment disciplines and providing a large variety of mutual fund investor services. The Board noted that Fidelity had taken, or had made recommendations that resulted in the Fidelity funds taking, a number of actions over the previous year that benefited particular funds, including (i) continuing to dedicate additional resources to investment research and support of the senior management team that oversees asset management; (ii) persisting in efforts to enhance Fidelity's research capabilities, in particular, international research; (iii) launching new funds and making other enhancements to meet client needs for global and income-oriented solutions; (iv) continuing to launch dedicated lower cost underlying funds to meet investment management's portfolio construction needs related to expanding underlying fund options, specifically for the Freedom Fund product lines; (v) adopting a "Stock Selector" sector neutral investment approach and employing a team of portfolio managers who are sector specialists to manage certain funds; (vi) rationalizing product lines and gaining increased efficiencies through the mergers of several funds into other funds; (vii) strengthening the Spartan Index Fund product line by adding new funds and/or new low-cost institutional share classes, restructuring fund expenses to accommodate new classes, and reducing investment minimums for certain classes of shares; (viii) modifying the eligibility criteria for Institutional Class shares to increase their appeal to government entities and charitable investors; and (ix) reducing certain transfer agent fee rates.
Investment Performance. The Board considered whether the fund has operated in accordance with its investment objective, as well as its record of compliance with its investment restrictions. It also reviewed the fund's absolute investment performance for each class, as well as the fund's relative investment performance for each class measured over multiple periods against (i) a broad-based securities market index, and (ii) a peer group of mutual funds deemed appropriate by Fidelity and reviewed by the Board. The following charts considered by the Board show, over the one-, three-, and five-year periods ended December 31, 2011, as available, the cumulative total returns of Class K and the retail class of the fund, the cumulative total returns of a broad-based securities market index ("benchmark"), and a range of cumulative total returns of a peer group of mutual funds identified by Morningstar, Inc. as having an investment style similar to that of the fund based on underlying portfolio holdings. The box within each chart shows the 25th percentile return (top of box) and the 75th percentile return (bottom of box) of the peer group. Returns shown above the box are in the first quartile and returns shown below the box are in the fourth quartile. The percentage beaten numbers noted below each chart correspond to the percentile box and represent the percentage of funds in the peer group whose performance was equal to or lower than that of the class indicated.
Semiannual Report
Fidelity Fund

The Board reviewed the fund's relative investment performance against its peer group and noted that the performance of the retail class of the fund (the class with the longer performance record) was in the third quartile for the one- and three-year periods and the second quartile for the five-year period. The Board also noted that the investment performance of the fund was lower than its benchmark for the one- and three-year periods, although the five-year cumulative total return of the retail class was comparable to its benchmark. The Board considered that the variations in performance between the fund's classes reflect the variations in class expenses, which result in lower performance for the higher expense class. The Board discussed with FMR actions to improve the fund's disappointing performance relative to its peer group and benchmark. The Board also reviewed the fund's performance since inception as well as performance in the current year. The Board will continue to closely monitor the performance of the fund in the coming year and discuss with FMR other appropriate actions to address the performance of the fund.
Based on its review, the Board concluded that the nature, extent, and quality of services provided to the fund under the Advisory Contracts should benefit the fund's shareholders.
Semiannual Report
Board Approval of Investment Advisory Contracts and
Management Fees - continued
Competitiveness of Management Fee and Total Expense Ratio. The Board considered the fund's management fee and total expense ratio compared to "mapped groups" of competitive funds and classes. Fidelity creates "mapped groups" by combining similar Lipper investment objective categories that have comparable management fee characteristics. Combining Lipper investment objective categories aids the Board's management fee and total expense ratio comparisons by broadening the competitive group used for comparison and by reducing the number of universes to which various Fidelity funds are compared.
Management Fee. The Board considered two proprietary management fee comparisons for the 12-month periods shown in the chart below. The group of Lipper funds used by the Board for management fee comparisons is referred to below as the "Total Mapped Group." The Total Mapped Group comparison focuses on a fund's standing relative to the total universe of comparable funds available to investors in terms of gross management fees before expense reimbursements or caps. "TMG %" represents the percentage of funds in the Total Mapped Group that had management fees that were lower than the fund's. For example, a TMG % of 6% means that 94% of the funds in the Total Mapped Group had higher management fees than the fund. The "Asset-Size Peer Group" (ASPG) comparison focuses on a fund's standing relative to non-Fidelity funds similar in size to the fund within the Total Mapped Group. The ASPG represents at least 15% of the funds in the Total Mapped Group with comparable asset size and management fee characteristics, subject to a minimum of 50 funds (or all funds in the Total Mapped Group if fewer than 50). Additional information, such as the ASPG quartile in which the fund's management fee ranked, is also included in the chart and considered by the Board.
Fidelity Fund

Semiannual Report
The Board noted that the fund's management fee ranked below the median of its Total Mapped Group and below the median of its ASPG for 2011.
Furthermore, the Board considered that in 2011 shareholders failed to approve a proposal to adopt the standard domestic equity management fee rate with a performance adjustment.
Based on its review, the Board concluded that the fund's management fee is fair and reasonable in light of the services that the fund receives and the other factors considered.
Total Expense Ratio. In its review of each class's total expense ratio, the Board considered the fund's management fee as well as other fund or class expenses, as applicable, such as transfer agent fees, pricing and bookkeeping fees, and custodial, legal, and audit fees. The Board also noted the effects of any waivers and reimbursements on fees and expenses. As part of its review, the Board also considered the current and historical total expense ratios of each class of the fund compared to competitive fund median expenses. Each class of the fund is compared to those funds and classes in the Total Mapped Group (used by the Board for management fee comparisons) that have a similar sales load structure.
The Board noted that the total expense ratio of each class ranked below its competitive median for 2011.
Fees Charged to Other Fidelity Clients. The Board also considered Fidelity fee structures and other information with respect to clients of FMR and its affiliates, such as other mutual funds advised or subadvised by FMR or its affiliates, pension plan clients, and other institutional clients. The Board noted the findings of the 2010 ad hoc joint committee (created with the board of other Fidelity funds), which reviewed and compared Fidelity's institutional investment advisory business with its business of providing services to the Fidelity funds, including the differences in services provided, fees charged, and costs incurred, as well as competition in their respective marketplaces.
Based on its review of total expense ratios and fees charged to other Fidelity clients, the Board concluded that the total expense ratio of each class of the fund was reasonable in light of the services that the fund and its shareholders receive and the other factors considered.
Costs of the Services and Profitability. The Board considered the revenues earned and the expenses incurred by Fidelity in conducting the business of developing, marketing, distributing, managing, administering and servicing the fund and its shareholders. The Board also considered the level of Fidelity's profits in respect of all the Fidelity funds.
On an annual basis, FMR presents to the Board Fidelity's profitability for the fund. Fidelity calculates the profitability for each fund, as well as aggregate profitability for groups of Fidelity funds and all Fidelity funds, using a series of detailed revenue and cost allocation methodologies which originate with the books and records of Fidelity on which Fidelity's audited financial statements are based. The Audit Committee of the Board reviews any significant changes from the prior year's methodologies.
Semiannual Report
Board Approval of Investment Advisory Contracts and
Management Fees - continued
PricewaterhouseCoopers LLP (PwC), independent registered public accounting firm and auditor to Fidelity and certain Fidelity funds, has been engaged annually by the Board as part of the Board's assessment of Fidelity's profitability analysis. PwC's engagement includes the review and assessment of Fidelity's methodologies used in determining the revenues and expenses attributable to Fidelity's mutual fund business, and completion of agreed-upon procedures surrounding the mathematical accuracy of fund profitability and its conformity to allocation methodologies. After considering PwC's reports issued under the engagement and information provided by Fidelity, the Board concluded that while other allocation methods may also be reasonable, Fidelity's profitability methodologies are reasonable in all material respects.
The Board also reviewed Fidelity's non-fund businesses and fall-out benefits related to the mutual fund business as well as cases where Fidelity's affiliates may benefit from or be related to the fund's business.
The Board considered the costs of the services provided by and the profits realized by Fidelity in connection with the operation of the fund and was satisfied that the profitability was not excessive in the circumstances.
Economies of Scale. The Board considered whether there have been economies of scale in respect of the management of the Fidelity funds, whether the Fidelity funds (including the fund) have appropriately benefited from any such economies of scale, and whether there is potential for realization of any further economies of scale. The Board considered the extent to which the fund will benefit from economies of scale through increased services to the fund, through waivers or reimbursements, or through fee or expense reductions. The Board also noted that in 2009, it and the board of other Fidelity funds created an ad hoc committee (the Economies of Scale Committee) to analyze whether FMR attains economies of scale in respect of the management and servicing of the Fidelity funds, whether the Fidelity funds have appropriately benefited from such economies of scale, and whether there is potential for realization of any further economies of scale.
The Board recognized that the fund's management contract incorporates a "group fee" structure, which provides for lower group fee rates as total fund assets under FMR's management increase, and for higher group fee rates as total fund assets under FMR's management decrease. FMR calculates the group fee rates based on a tiered asset "breakpoint" schedule that varies based on asset class. The Board considered that the group fee is designed to deliver the benefits of economies of scale to fund shareholders when total Fidelity fund assets increase, even if assets of any particular fund are unchanged or have declined, because some portion of Fidelity's costs are attributable to services provided to all Fidelity funds, and all funds benefit if those costs can be allocated among more assets. The Board concluded that, given the group fee structure, fund shareholders will benefit from lower management fees as assets under FMR's management increase at the fund complex level, regardless of whether Fidelity achieves any such economies of scale.
Semiannual Report
The Board concluded, taking into account the analysis of the Economies of Scale Committee, that economies of scale, if any, are being appropriately shared between fund shareholders and Fidelity.
Additional Information Requested by the Board. In order to develop fully the factual basis for consideration of the Fidelity funds' Advisory Contracts, the Board requested and received additional information on certain topics, including (i) fund performance trends, actions to be taken by FMR to improve certain funds' overall performance, and Fidelity's long-term strategies for certain funds; (ii) the potential to further rationalize the Fidelity fund lineup with the possibility of achieving savings for the funds and Fidelity; (iii) Fidelity's compensation structure for portfolio managers and other key investment personnel; (iv) the amount of the investment that each portfolio manager has made in the Fidelity fund(s) that he or she manages; (v) the realization of fall-out benefits in certain Fidelity business units; (vi) Fidelity's group fee structures, the potential impact of regulatory changes on such structures, and the rationale for the individual fee rates of certain funds; (vii) fund profitability methodology, including Fidelity's cost allocation methodology, and the impact of certain factors on fund profitability results; (viii) trends regarding industry use of performance fee structures and the possibility of implementing performance fee structures for additional funds; and (ix) the impact of net redemptions from the Fidelity funds.
Based on its evaluation of all of the conclusions noted above, and after considering all factors it believed relevant, the Board ultimately concluded that the advisory fee structures are fair and reasonable, and that the fund's Advisory Contracts should be renewed.
Semiannual Report
Investment Adviser
Fidelity Management &
Research Company
Boston, MA
Investment Sub-Advisers
FMR Co., Inc.
Fidelity Management & Research
(U.K.) Inc.
Fidelity Management & Research
(Hong Kong) Limited
Fidelity Management & Research
(Japan) Inc.
General Distributor
Fidelity Distributors Corporation
Smithfield, RI
Transfer and Service Agents
Fidelity Investments Institutional
Operations Company, Inc.
Boston, MA
Fidelity Service Company, Inc.
Boston, MA
Custodian
The Northern Trust Company
Chicago, IL
The Fidelity Telephone Connection
Mutual Fund 24-Hour Service
Exchanges/Redemptions
and Account Assistance 1-800-544-6666
Product Information 1-800-544-6666
Retirement Accounts 1-800-544-4774
(8 a.m. - 9 p.m.)
TDD Service 1-800-544-0118
for the deaf and hearing impaired
(9 a.m. - 9 p.m. Eastern time)
Fidelity Automated Service
Telephone (FAST®)
1-800-544-5555
Automated line for quickest service
(Fidelity Investment logo)(registered trademark)
Corporate Headquarters
82 Devonshire St., Boston, MA 02109
www.fidelity.com
FID-USAN-0213
1.787780.109
Fidelity Fifty®
Semiannual Report
December 31, 2012
(Fidelity Cover Art)
Contents
Shareholder Expense Example | An example of shareholder expenses. | |
Investment Changes | A summary of major shifts in the fund's investments over the past six months. | |
Investments | A complete list of the fund's investments with their market values. | |
Financial Statements | Statements of assets and liabilities, operations, and changes in net assets, as well as financial highlights. | |
Notes | Notes to the financial statements. | |
Board Approval of Investment Advisory Contracts and Management Fees |
|
To view a fund's proxy voting guidelines and proxy voting record for the 12-month period ended June 30, visit http://www.fidelity.com/proxyvotingresults or visit the Securities and Exchange Commission's (SEC) web site at http://www.sec.gov. You may also call 1-800-544-8544 to request a free copy of the proxy voting guidelines.
Standard & Poor's, S&P and S&P 500 are registered service marks of The McGraw-Hill Companies, Inc. and have been licensed for use by Fidelity Distributors Corporation.
Other third party marks appearing herein are the property of their respective owners.
All other marks appearing herein are registered or unregistered trademarks or service marks of FMR LLC or an affiliated company. © 2013 FMR LLC. All rights reserved.
This report and the financial statements contained herein are submitted for the general information of the shareholders of the fund. This report is not authorized for distribution to prospective investors in the fund unless preceded or accompanied by an effective prospectus.
A fund files its complete schedule of portfolio holdings with the SEC for the first and third quarters of each fiscal year on Form N-Q. Forms N-Q are available on the SEC's web site at http://www.sec.gov. A fund's Forms N-Q may be reviewed and copied at the SEC's Public Reference Room in Washington, DC. Information regarding the operation of the SEC's Public Reference Room may be obtained by calling 1-800-SEC-0330. For a complete list of a fund's portfolio holdings, view the most recent holdings listing, semiannual report, or annual report on Fidelity's web site at http://www.fidelity.com, http://www.advisor.fidelity.com, or http://www.401k.com, as applicable.
NOT FDIC INSURED • MAY LOSE VALUE • NO BANK GUARANTEE
Neither the fund nor Fidelity Distributors Corporation is a bank.
Semiannual Report
Shareholder Expense Example
As a shareholder of the Fund, you incur two types of costs: (1) transaction costs, and (2) ongoing costs, including management fees and other Fund expenses. This Example is intended to help you understand your ongoing costs (in dollars) of investing in the Fund and to compare these costs with the ongoing costs of investing in other mutual funds.
The Example is based on an investment of $1,000 invested at the beginning of the period and held for the entire period (July 1, 2012 to December 31, 2012).
Actual Expenses
The first line of the accompanying table provides information about actual account values and actual expenses. You may use the information in this line, together with the amount you invested, to estimate the expenses that you paid over the period. Simply divide your account value by $1,000.00 (for example, an $8,600 account value divided by $1,000.00 = 8.6), then multiply the result by the number in the first line under the heading entitled "Expenses Paid During Period" to estimate the expenses you paid on your account during this period. A small balance maintenance fee of $12.00 that is charged once a year may apply for certain accounts with a value of less than $2,000. This fee is not included in the table below. If it was, the estimate of expenses you paid during the period would be higher, and your ending account value lower, by this amount. In addition, the Fund, as a shareholder in the underlying Fidelity Central Funds, will indirectly bear its pro-rata share of the fees and expenses incurred by the underlying Fidelity Central Funds. These fees and expenses are not included in the Fund's annualized expense ratio used to calculate the expense estimate in the table below.
Hypothetical Example for Comparison Purposes
The second line of the accompanying table provides information about hypothetical account values and hypothetical expenses based on the Fund's actual expense ratio and an assumed rate of return of 5% per year before expenses, which is not the Fund's actual return. The hypothetical account values and expenses may not be used to estimate the actual ending account balance or expenses you paid for the period. You may use this information to compare the ongoing costs of investing in the Fund and other funds. To do so, compare this 5% hypothetical example with the 5% hypothetical examples that appear in the shareholder reports of the other funds. A small balance maintenance fee of $12.00 that is charged once a year may apply for certain accounts with a value of less than $2,000. This fee is not included in the table below. If it was, the estimate of expenses you paid during the period would be higher, and your ending account value lower, by this amount. In addition, the Fund, as a shareholder in the underlying Fidelity Central Funds, will indirectly bear its pro-rata share of the fees and expenses incurred by the underlying Fidelity Central Funds. These fees and expenses are not included in the Fund's annualized expense ratio used to calculate the expense estimate in the table below.
Please note that the expenses shown in the table are meant to highlight your ongoing costs only and do not reflect any transaction costs. Therefore, the second line of the table is useful in comparing ongoing costs only, and will not help you determine the relative total costs of owning different funds.
Semiannual Report
Shareholder Expense Example - continued
| Annualized Expense Ratio | Beginning | Ending | Expenses Paid |
Actual | .84% | $ 1,000.00 | $ 1,061.20 | $ 4.36 |
Hypothetical (5% return per year before expenses) |
| $ 1,000.00 | $ 1,020.97 | $ 4.28 |
* Expenses are equal to the Fund's annualized expense ratio, multiplied by the average account value over the period, multiplied by 184/365 (to reflect the one-half year period).
Semiannual Report
Investment Changes (Unaudited)
Top Ten Stocks as of December 31, 2012 | ||
| % of fund's | % of fund's net assets |
MasterCard, Inc. Class A | 5.4 | 7.6 |
Gilead Sciences, Inc. | 4.6 | 1.6 |
American Tower Corp. | 4.3 | 3.0 |
Phillips 66 | 4.1 | 0.0 |
Amgen, Inc. | 4.0 | 2.3 |
Citigroup, Inc. | 3.7 | 0.0 |
Google, Inc. Class A | 3.6 | 0.0 |
Canadian Pacific | 3.5 | 0.0 |
Discovery Communications, Inc. | 3.4 | 1.4 |
eBay, Inc. | 3.2 | 1.5 |
| 39.8 | |
Top Five Market Sectors as of December 31, 2012 | ||
| % of fund's | % of fund's net assets |
Financials | 18.6 | 11.0 |
Information Technology | 18.3 | 25.5 |
Consumer Discretionary | 15.5 | 14.5 |
Health Care | 14.4 | 15.8 |
Energy | 13.7 | 3.8 |
Asset Allocation (% of fund's net assets) | |||||||
As of December 31, 2012* | As of June 30, 2012** | ||||||
 | Stocks 99.0% |
| | Stocks 99.7% |
| ||
 | Short-Term |
| | Short-Term |
| ||
* Foreign investments | 6.4% |
| ** Foreign investments | 2.0% |
| ||

Semiannual Report
Investments December 31, 2012 (Unaudited)
Showing Percentage of Net Assets
Common Stocks - 99.0% | |||
Shares | Value | ||
CONSUMER DISCRETIONARY - 15.5% | |||
Household Durables - 1.8% | |||
PulteGroup, Inc. (a) | 655,000 | $ 11,894,800 | |
Media - 6.6% | |||
Comcast Corp. Class A | 555,900 | 20,779,542 | |
Discovery Communications, Inc. (a) | 347,000 | 22,027,560 | |
| 42,807,102 | ||
Specialty Retail - 4.0% | |||
Cabela's, Inc. Class A (a) | 169,800 | 7,089,150 | |
Home Depot, Inc. | 176,000 | 10,885,600 | |
TJX Companies, Inc. | 197,600 | 8,388,120 | |
| 26,362,870 | ||
Textiles, Apparel & Luxury Goods - 3.1% | |||
PVH Corp. | 126,000 | 13,987,260 | |
Under Armour, Inc. Class A (sub. vtg.) (a)(d) | 130,100 | 6,313,753 | |
| 20,301,013 | ||
TOTAL CONSUMER DISCRETIONARY | 101,365,785 | ||
CONSUMER STAPLES - 2.5% | |||
Beverages - 0.8% | |||
Anheuser-Busch InBev SA NV | 60,000 | 5,225,073 | |
Food & Staples Retailing - 0.8% | |||
Wal-Mart Stores, Inc. | 75,000 | 5,117,250 | |
Personal Products - 0.9% | |||
Estee Lauder Companies, Inc. Class A | 101,200 | 6,057,832 | |
TOTAL CONSUMER STAPLES | 16,400,155 | ||
ENERGY - 13.7% | |||
Oil, Gas & Consumable Fuels - 13.7% | |||
Cabot Oil & Gas Corp. | 250,000 | 12,435,000 | |
Marathon Petroleum Corp. | 160,000 | 10,080,000 | |
Noble Energy, Inc. | 155,899 | 15,861,164 | |
Peabody Energy Corp. | 427,000 | 11,362,470 | |
Phillips 66 | 501,000 | 26,603,100 | |
Pioneer Natural Resources Co. | 80,500 | 8,580,495 | |
Western Gas Equity Partners LP | 157,900 | 4,729,105 | |
| 89,651,334 | ||
Common Stocks - continued | |||
Shares | Value | ||
FINANCIALS - 18.6% | |||
Capital Markets - 1.2% | |||
UBS AG (NY Shares) | 506,000 | $ 7,964,440 | |
Commercial Banks - 1.5% | |||
M&T Bank Corp. | 98,000 | 9,650,060 | |
Consumer Finance - 1.7% | |||
Capital One Financial Corp. | 197,000 | 11,412,210 | |
Diversified Financial Services - 5.4% | |||
Bank of America Corp. | 980,000 | 11,368,000 | |
Citigroup, Inc. | 609,000 | 24,092,040 | |
| 35,460,040 | ||
Insurance - 3.4% | |||
Berkshire Hathaway, Inc. Class B (a) | 96,000 | 8,611,200 | |
The Travelers Companies, Inc. | 185,000 | 13,286,700 | |
| 21,897,900 | ||
Real Estate Investment Trusts - 4.3% | |||
American Tower Corp. | 361,000 | 27,894,470 | |
Real Estate Management & Development - 1.1% | |||
Realogy Holdings Corp. | 169,500 | 7,112,220 | |
TOTAL FINANCIALS | 121,391,340 | ||
HEALTH CARE - 14.4% | |||
Biotechnology - 10.9% | |||
Amgen, Inc. | 305,000 | 26,327,600 | |
Gilead Sciences, Inc. (a) | 409,000 | 30,041,050 | |
Onyx Pharmaceuticals, Inc. (a) | 197,937 | 14,950,182 | |
| 71,318,832 | ||
Health Care Equipment & Supplies - 1.8% | |||
The Cooper Companies, Inc. | 124,067 | 11,473,716 | |
Pharmaceuticals - 1.7% | |||
Pfizer, Inc. | 447,000 | 11,210,760 | |
TOTAL HEALTH CARE | 94,003,308 | ||
INDUSTRIALS - 9.2% | |||
Industrial Conglomerates - 1.8% | |||
General Electric Co. | 550,000 | 11,544,500 | |
Road & Rail - 5.9% | |||
Canadian Pacific | 223,000 | 22,620,589 | |
Common Stocks - continued | |||
Shares | Value | ||
INDUSTRIALS - continued | |||
Road & Rail - continued | |||
J.B. Hunt Transport Services, Inc. | 219,200 | $ 13,088,432 | |
Union Pacific Corp. | 21,000 | 2,640,120 | |
| 38,349,141 | ||
Trading Companies & Distributors - 1.5% | |||
United Rentals, Inc. (a) | 215,000 | 9,786,800 | |
TOTAL INDUSTRIALS | 59,680,441 | ||
INFORMATION TECHNOLOGY - 18.3% | |||
Computers & Peripherals - 0.9% | |||
Stratasys Ltd. (a) | 78,000 | 6,251,700 | |
Internet Software & Services - 7.7% | |||
eBay, Inc. (a) | 412,700 | 21,055,954 | |
Facebook, Inc. Class A | 219,000 | 5,831,970 | |
Google, Inc. Class A (a) | 33,000 | 23,409,210 | |
| 50,297,134 | ||
IT Services - 7.6% | |||
Cognizant Technology Solutions Corp. Class A (a) | 195,000 | 14,439,750 | |
MasterCard, Inc. Class A | 71,500 | 35,126,521 | |
| 49,566,271 | ||
Software - 2.1% | |||
salesforce.com, Inc. (a) | 77,600 | 13,044,560 | |
Workday, Inc. | 10,000 | 545,000 | |
| 13,589,560 | ||
TOTAL INFORMATION TECHNOLOGY | 119,704,665 | ||
MATERIALS - 5.9% | |||
Chemicals - 4.9% | |||
Eastman Chemical Co. | 302,000 | 20,551,100 | |
FMC Corp. | 87,000 | 5,091,240 | |
Monsanto Co. | 68,000 | 6,436,200 | |
| 32,078,540 | ||
Paper & Forest Products - 1.0% | |||
International Paper Co. | 154,000 | 6,135,360 | |
TOTAL MATERIALS | 38,213,900 | ||
Common Stocks - continued | |||
Shares | Value | ||
TELECOMMUNICATION SERVICES - 0.9% | |||
Wireless Telecommunication Services - 0.9% | |||
SBA Communications Corp. Class A (a) | 80,000 | $ 5,681,600 | |
TOTAL COMMON STOCKS (Cost $603,755,966) |
| ||
Money Market Funds - 1.6% | |||
|
|
|
|
Fidelity Cash Central Fund, 0.18% (b) | 5,783,153 | 5,783,153 | |
Fidelity Securities Lending Cash Central Fund, 0.18% (b)(c) | 4,670,550 | 4,670,550 | |
TOTAL MONEY MARKET FUNDS (Cost $10,453,703) |
| ||
TOTAL INVESTMENT PORTFOLIO - 100.6% (Cost $614,209,669) | 656,546,231 | ||
NET OTHER ASSETS (LIABILITIES) - (0.6)% | (3,653,930) | ||
NET ASSETS - 100% | $ 652,892,301 | ||
Legend |
(a) Non-income producing |
(b) Affiliated fund that is available only to investment companies and other accounts managed by Fidelity Investments. The rate quoted is the annualized seven-day yield of the fund at period end. A complete unaudited listing of the fund's holdings as of its most recent quarter end is available upon request. In addition, each Fidelity Central Fund's financial statements are available on the SEC's website or upon request. |
(c) Investment made with cash collateral received from securities on loan. |
(d) Security or a portion of the security is on loan at period end. |
Affiliated Central Funds |
Information regarding fiscal year to date income earned by the Fund from investments in Fidelity Central Funds is as follows: |
Fund | Income earned |
Fidelity Cash Central Fund | $ 7,611 |
Fidelity Securities Lending Cash Central Fund | 44,606 |
Total | $ 52,217 |
Other Information |
The following is a summary of the inputs used, as of December 31, 2012, involving the Fund's assets and liabilities carried at fair value. The inputs or methodology used for valuing securities may not be an indication of the risk associated with investing in those securities. For more information on valuation inputs, and their aggregation into the levels used in the table below, please refer to the Investment Valuation section in the accompanying Notes to Financial Statements. |
Valuation Inputs at Reporting Date: | ||||
Description | Total | Level 1 | Level 2 | Level 3 |
Investments in Securities: | ||||
Equities: | ||||
Consumer Discretionary | $ 101,365,785 | $ 101,365,785 | $ - | $ - |
Consumer Staples | 16,400,155 | 11,175,082 | 5,225,073 | - |
Energy | 89,651,334 | 89,651,334 | - | - |
Financials | 121,391,340 | 121,391,340 | - | - |
Health Care | 94,003,308 | 94,003,308 | - | - |
Industrials | 59,680,441 | 59,680,441 | - | - |
Information Technology | 119,704,665 | 119,704,665 | - | - |
Materials | 38,213,900 | 38,213,900 | - | - |
Telecommunication Services | 5,681,600 | 5,681,600 | - | - |
Money Market Funds | 10,453,703 | 10,453,703 | - | - |
Total Investments in Securities: | $ 656,546,231 | $ 651,321,158 | $ 5,225,073 | $ - |
See accompanying notes which are an integral part of the financial statements.
Semiannual Report
Financial Statements
Statement of Assets and Liabilities
| December 31, 2012 (Unaudited) | |
|
|
|
Assets | ||
Investment in securities, at value (including securities loaned of $4,673,439) - See accompanying schedule: Unaffiliated issuers (cost $603,755,966) | $ 646,092,528 |
|
Fidelity Central Funds (cost $10,453,703) | 10,453,703 |
|
Total Investments (cost $614,209,669) |
| $ 656,546,231 |
Cash |
| 116,912 |
Receivable for investments sold | 2,742,611 | |
Receivable for fund shares sold | 537,586 | |
Dividends receivable | 488,264 | |
Distributions receivable from Fidelity Central Funds | 5,974 | |
Prepaid expenses | 1,663 | |
Other receivables | 162,579 | |
Total assets | 660,601,820 | |
|
|
|
Liabilities | ||
Payable for investments purchased | $ 116,912 | |
Payable for fund shares redeemed | 2,439,055 | |
Distributions payable | 48 | |
Accrued management fee | 292,957 | |
Other affiliated payables | 160,981 | |
Other payables and accrued expenses | 29,016 | |
Collateral on securities loaned, at value | 4,670,550 | |
Total liabilities | 7,709,519 | |
|
|
|
Net Assets | $ 652,892,301 | |
Net Assets consist of: |
| |
Paid in capital | $ 881,789,274 | |
Distributions in excess of net investment income | (14,319) | |
Accumulated undistributed net realized gain (loss) on investments and foreign currency transactions | (271,218,543) | |
Net unrealized appreciation (depreciation) on investments and assets and liabilities in foreign currencies | 42,335,889 | |
Net Assets, for 32,330,221 shares outstanding | $ 652,892,301 | |
Net Asset Value, offering price and redemption price per share ($652,892,301 ÷ 32,330,221 shares) | $ 20.19 | |
See accompanying notes which are an integral part of the financial statements.
Semiannual Report
Statement of Operations
Six months ended December 31, 2012 (Unaudited) | ||
|
|
|
Investment Income |
|
|
Dividends |
| $ 4,066,808 |
Income from Fidelity Central Funds |
| 52,217 |
Total income |
| 4,119,025 |
|
|
|
Expenses | ||
Management fee | $ 1,859,525 | |
Performance adjustment | (107,537) | |
Transfer agent fees | 859,050 | |
Accounting and security lending fees | 120,747 | |
Custodian fees and expenses | 27,904 | |
Independent trustees' compensation | 2,338 | |
Registration fees | 13,053 | |
Audit | 25,065 | |
Legal | 3,273 | |
Miscellaneous | 3,073 | |
Total expenses before reductions | 2,806,491 | |
Expense reductions | (165,838) | 2,640,653 |
Net investment income (loss) | 1,478,372 | |
Realized and Unrealized Gain (Loss) Net realized gain (loss) on: | ||
Investment securities: |
|
|
Unaffiliated issuers | 46,597,654 | |
Foreign currency transactions | 3,679 | |
Total net realized gain (loss) |
| 46,601,333 |
Change in net unrealized appreciation (depreciation) on: Investment securities | (8,052,556) | |
Assets and liabilities in foreign currencies | (9) | |
Total change in net unrealized appreciation (depreciation) |
| (8,052,565) |
Net gain (loss) | 38,548,768 | |
Net increase (decrease) in net assets resulting from operations | $ 40,027,140 | |
See accompanying notes which are an integral part of the financial statements.
Semiannual Report
Financial Statements - continued
Statement of Changes in Net Assets
| Six months ended December 31, 2012 | Year ended |
Increase (Decrease) in Net Assets |
|
|
Operations |
|
|
Net investment income (loss) | $ 1,478,372 | $ 1,811,350 |
Net realized gain (loss) | 46,601,333 | (6,901,148) |
Change in net unrealized appreciation (depreciation) | (8,052,565) | (1,651,886) |
Net increase (decrease) in net assets resulting | 40,027,140 | (6,741,684) |
Distributions to shareholders from net investment income | (2,203,476) | (2,053,471) |
Share transactions | 21,431,180 | 68,737,170 |
Reinvestment of distributions | 2,146,958 | 2,000,531 |
Cost of shares redeemed | (80,343,828) | (215,475,338) |
Net increase (decrease) in net assets resulting from share transactions | (56,765,690) | (144,737,637) |
Total increase (decrease) in net assets | (18,942,026) | (153,532,792) |
|
|
|
Net Assets | ||
Beginning of period | 671,834,327 | 825,367,119 |
End of period (including distributions in excess of net investment income of $14,319 and undistributed net investment income of $710,785, respectively) | $ 652,892,301 | $ 671,834,327 |
Other Information Shares | ||
Sold | 1,085,611 | 3,783,341 |
Issued in reinvestment of distributions | 108,835 | 116,157 |
Redeemed | (4,058,092) | (12,219,872) |
Net increase (decrease) | (2,863,646) | (8,320,374) |
See accompanying notes which are an integral part of the financial statements.
Semiannual Report
Financial Highlights
| Six months ended December 31, 2012 | Years ended June 30, | ||||
| (Unaudited) | 2012 | 2011 | 2010 | 2009 | 2008 |
Selected Per-Share Data |
|
|
|
|
|
|
Net asset value, beginning of period | $ 19.09 | $ 18.97 | $ 13.95 | $ 12.59 | $ 19.95 | $ 26.09 |
Income from Investment Operations |
|
|
|
|
|
|
Net investment income (loss) D | .04 | .05 | .06 | .07 | .09 | (.02) |
Net realized and unrealized gain (loss) | 1.13 | .12 G | 5.05 | 1.35 | (7.36) | (1.85) |
Total from investment operations | 1.17 | .17 | 5.11 | 1.42 | (7.27) | (1.87) |
Distributions from net investment income | (.07) | (.05) | (.09) | (.05) | (.05) | (.02) |
Distributions from net realized gain | - | - | - | (.02) | (.04) | (4.25) |
Total distributions | (.07) | (.05) | (.09) | (.06) I | (.09) | (4.27) |
Net asset value, end of period | $ 20.19 | $ 19.09 | $ 18.97 | $ 13.95 | $ 12.59 | $ 19.95 |
Total Return B,C | 6.12% | .93% | 36.71% | 11.26% | (36.47)% | (8.50)% |
Ratios to Average Net Assets E,H |
|
|
|
|
|
|
Expenses before reductions | .84% A | .94% | .71% | .73% | .71% | .99% |
Expenses net of fee waivers, if any | .84% A | .94% | .71% | .73% | .71% | .99% |
Expenses net of all reductions | .79% A | .92% | .69% | .69% | .70% | .98% |
Net investment income (loss) | .44% A | .26% | .36% | .50% | .67% | (.08) % |
Supplemental Data |
|
|
|
|
|
|
Net assets, end of period (000 omitted) | $ 652,892 | $ 671,834 | $ 825,367 | $ 646,032 | $ 691,141 | $ 1,302,477 |
Portfolio turnover rate F | 253% A | 277% | 257% | 246% | 424% | 173% |
AAnnualized BTotal returns for periods of less than one year are not annualized. CTotal returns would have been lower if certain expenses had not been reduced during the applicable periods shown. DCalculated based on average shares outstanding during the period. EFees and expenses of any underlying Fidelity Central Funds are not included in the Fund's expense ratio. The Fund indirectly bears its proportionate share of the expenses of any underlying Fidelity Central Funds. FAmount does not include the portfolio activity of any underlying Fidelity Central Funds. GThe amount shown for a share outstanding does not correspond with the aggregate net gain (loss) on investments for the period due to the timing of sales and repurchases of shares in relation to fluctuating market values of the investments of the Fund. HExpense ratios reflect operating expenses of the Fund. Expenses before reductions do not reflect amounts reimbursed by the investment adviser or reductions from brokerage service arrangements or reductions from other expense offset arrangements and do not represent the amount paid by the Fund during periods when reimbursements or reductions occur. Expenses net of fee waivers reflect expenses after reimbursement by the investment adviser but prior to reductions from brokerage service arrangements or other expense offset arrangements. Expenses net of all reductions represent the net expenses paid by the Fund. ITotal distributions of $.06 per share is comprised of distributions from net investment income of $.045 and distributions from net realized gain of $.015 per share. | ||||||
Semiannual Report
See accompanying notes which are an integral part of the financial statements.
Notes to Financial Statements
For the period ended December 31, 2012 (Unaudited)
1. Organization.
Fidelity Fifty® (the Fund) is a non-diversified fund of Fidelity Hastings Street Trust (the Trust) and is authorized to issue an unlimited number of shares. The Trust is registered under the Investment Company Act of 1940, as amended (the 1940 Act), as an open-end management investment company organized as a Massachusetts business trust. Effective after the close of business on October 12, 2012, the Fund was closed to new accounts with certain exceptions.
2. Investments in Fidelity Central Funds.
The Fund invests in Fidelity Central Funds, which are open-end investment companies available only to other investment companies and accounts managed by Fidelity Management & Research Company (FMR) and its affiliates. The Fund's Schedule of Investments lists each of the Fidelity Central Funds held as of period end, if any, as an investment of the Fund, but does not include the underlying holdings of each Fidelity Central Fund. As an Investing Fund, the Fund indirectly bears its proportionate share of the expenses of the underlying Fidelity Central Funds.
The Money Market Central Funds seek preservation of capital and current income and are managed by Fidelity Investments Money Management, Inc. (FIMM), an affiliate of FMR.
A complete unaudited list of holdings for each Fidelity Central Fund is available upon request or at the Securities and Exchange Commission (the SEC) website at www.sec.gov. In addition, the financial statements of the Fidelity Central Funds are available on the SEC website or upon request.
3. Significant Accounting Policies.
The financial statements have been prepared in conformity with accounting principles generally accepted in the United States of America (GAAP), which require management to make certain estimates and assumptions at the date of the financial statements. Actual results could differ from those estimates. Subsequent events, if any, through the date that the financial statements were issued have been evaluated in the preparation of the financial statements. The following summarizes the significant accounting policies of the Fund:
Investment Valuation. Investments are valued as of 4:00 p.m. Eastern time on the last calendar day of the period. In accordance with valuation policies and procedures approved by the Board of Trustees (the Board), the Fund attempts to obtain prices from one or more third party pricing vendors or brokers to value its investments. When current market prices, quotations or rates are not readily available or reliable,
Semiannual Report
3. Significant Accounting Policies - continued
Investment Valuation - continued
investments will be fair valued in good faith by the FMR Fair Value Committee (the Committee), in accordance with procedures adopted by the Fund's Board. Factors used in determining fair value vary by investment type and may include market or investment specific events. The frequency with which these procedures are used cannot be predicted and they may be utilized to a significant extent. The Committee oversees the Fund's valuation policies and procedures and is responsible for approving and reporting to the Board all fair value determinations.
The Fund categorizes the inputs to valuation techniques used to value its investments into a disclosure hierarchy consisting of three levels as shown below:
Level 1 - quoted prices in active markets for identical investments
Level 2 - other significant observable inputs (including quoted prices for similar investments, interest rates, prepayment speeds, etc.)
Level 3 - unobservable inputs (including the Fund's own assumptions based on the best information available)
Valuation techniques used to value the Fund's investments by major category are as follows:
Equity securities, including restricted securities, for which market quotations are readily available, are valued at the last reported sale price or official closing price as reported by a third party pricing vendor on the primary market or exchange on which they are traded and are categorized as Level 1 in the hierarchy. In the event there were no sales during the day or closing prices are not available, securities are valued at the last quoted bid price or may be valued using the last available price and are generally categorized as Level 2 in the hierarchy. For foreign equity securities, when significant market or security specific events arise, comparisons to the valuation of American Depositary Receipts (ADRs), futures contracts, Exchange-Traded Funds (ETFs) and certain indexes as well as quoted prices for similar securities are used and are categorized as Level 2 in the hierarchy. Utilizing these techniques may result in transfers between Level 1 and Level 2.
Investments in open-end mutual funds, including the Fidelity Central Funds, are valued at their closing net asset value (NAV) each business day and are categorized as Level 1 in the hierarchy.
Changes in valuation techniques may result in transfers in or out of an assigned level within the disclosure hierarchy. The aggregate value of investments by input level, as of December 31, 2012, is included at the end of the Fund's Schedule of Investments.
Semiannual Report
Notes to Financial Statements (Unaudited) - continued
3. Significant Accounting Policies - continued
Foreign Currency. The Fund may use foreign currency contracts to facilitate transactions in foreign-denominated securities. Gains and losses from these transactions may arise from changes in the value of the foreign currency or if the counterparties do not perform under the contracts' terms.
Foreign-denominated assets, including investment securities, and liabilities are translated into U.S. dollars at the exchange rates at period end. Purchases and sales of investment securities, income and dividends received and expenses denominated in foreign currencies are translated into U.S. dollars at the exchange rate in effect on the transaction date.
The effects of exchange rate fluctuations on investments are included with the net realized and unrealized gain (loss) on investment securities. Other foreign currency transactions resulting in realized and unrealized gain (loss) are disclosed separately.
Investment Transactions and Income. For financial reporting purposes, the Fund's investment holdings and NAV include trades executed through the end of the last business day of the period. The NAV per share for processing shareholder transactions is calculated as of the close of business of the New York Stock Exchange (NYSE), normally 4:00 p.m. Eastern time and includes trades executed through the end of the prior business day. Gains and losses on securities sold are determined on the basis of identified cost and may include proceeds received from litigation. Dividend income is recorded on the ex-dividend date, except for certain dividends from foreign securities where the ex-dividend date may have passed, which are recorded as soon as the Fund is informed of the ex-dividend date. Non-cash dividends included in dividend income, if any, are recorded at the fair market value of the securities received. Interest income and distributions from the Fidelity Central Funds are accrued as earned. Investment income is recorded net of foreign taxes withheld where recovery of such taxes is uncertain.
Expenses. Expenses directly attributable to a fund are charged to that fund. Expenses attributable to more than one fund are allocated among the respective funds on the basis of relative net assets or other appropriate methods. Expense estimates are accrued in the period to which they relate and adjustments are made when actual amounts are known.
Income Tax Information and Distributions to Shareholders. Each year, the Fund intends to qualify as a regulated investment company under Subchapter M of the Internal Revenue Code, including distributing substantially all of its taxable income and realized gains. As a result, no provision for income taxes is required. The Fund files a U.S. federal tax return, in addition to state and local tax returns as required. A fund's federal income tax returns are subject to examination by the Internal Revenue Service (IRS) for a period of three fiscal years after they are filed. State and local tax returns may be subject to examination for an additional fiscal year depending on the jurisdiction.
Semiannual Report
3. Significant Accounting Policies - continued
Income Tax Information and Distributions to Shareholders - continued
Foreign taxes are provided for based on the Fund's understanding of the tax rules and rates that exist in the foreign markets in which it invests.
Distributions are declared and recorded on the ex-dividend date. Income and capital gain distributions are determined in accordance with income tax regulations, which may differ from GAAP.
Capital accounts within the financial statements are adjusted for permanent book-tax differences. These adjustments have no impact on net assets or the results of operations. Temporary book-tax differences will reverse in a subsequent period.
Book-tax differences are primarily due to foreign currency transactions, deferred trustees compensation, capital loss carryforwards and losses deferred due to wash sales.
The federal tax cost of investment securities and unrealized appreciation (depreciation) as of period end were as follows:
Gross unrealized appreciation | $ 49,895,888 |
Gross unrealized depreciation | (9,992,748) |
Net unrealized appreciation (depreciation) on securities and other investments | $ 39,903,140 |
|
|
Tax cost | $ 616,643,091 |
Capital loss carryforwards are only available to offset future capital gains of the Fund to the extent provided by regulations and may be limited. Under the Regulated Investment Company Modernization Act of 2010 (the Act), the Fund is permitted to carry forward capital losses incurred in taxable years beginning after December 22, 2010 for an unlimited period and such capital losses are required to be used prior to any losses that expire. At June 30, 2012, capital loss carryforwards were as follows:
Fiscal year of expiration |
|
2017 | $ (309,884,990) |
No expiration Short-term | (3,295,065) |
Total capital loss carryforward | $ (313,180,055) |
4. Purchases and Sales of Investments.
Purchases and sales of securities, other than short-term securities, aggregated $833,357,741 and $896,011,625, respectively.
Semiannual Report
Notes to Financial Statements (Unaudited) - continued
5. Fees and Other Transactions with Affiliates.
Management Fee. FMR and its affiliates provide the Fund with investment management related services for which the Fund pays a monthly management fee. The management fee is the sum of an individual fund fee rate that is based on an annual rate of .30% of the Fund's average net assets and an annualized group fee rate that averaged .26% during the period. The group fee rate is based upon the average net assets of all the mutual funds advised by FMR. The group fee rate decreases as assets under management increase and increases as assets under management decrease. In addition, the management fee is subject to a performance adjustment (up to a maximum of ± .20% of the Fund's average net assets over a 36 month performance period). The upward or downward adjustment to the management fee is based on the Fund's relative investment performance as compared to an appropriate benchmark index. For the period, the total annualized management fee rate, including the performance adjustment, was .52% of the Fund's average net assets.
Transfer Agent Fees. Fidelity Investments Institutional Operations Company, Inc. (FIIOC), an affiliate of FMR, is the Fund's transfer, dividend disbursing and shareholder servicing agent. FIIOC receives account fees and asset-based fees that vary according to account size and type of account. FIIOC pays for typesetting, printing and mailing of shareholder reports, except proxy statements. For the period, the transfer agent fees were equivalent to an annualized rate of .26% of average net assets.
Accounting and Security Lending Fees. Fidelity Service Company, Inc. (FSC), an affiliate of FMR, maintains the Fund's accounting records. The accounting fee is based on the level of average net assets for each month. Under a separate contract, FSC administers the security lending program. The security lending fee is based on the number and duration of lending transactions.
Brokerage Commissions. The Fund placed a portion of its portfolio transactions with brokerage firms which are affiliates of the investment adviser. The commissions paid to these affiliated firms were $19,981 for the period.
6. Committed Line of Credit.
The Fund participates with other funds managed by FMR or an affiliate in a $4.25 billion credit facility (the "line of credit") to be utilized for temporary or emergency purposes to fund shareholder redemptions or for other short-term liquidity purposes. The Fund has agreed to pay commitment fees on its pro-rata portion of the line of credit, which amounted to $847 and is reflected in Miscellaneous expenses on the Statement of Operations. During the period, there were no borrowings on this line of credit.
Semiannual Report
7. Security Lending.
The Fund lends portfolio securities through a lending agent from time to time in order to earn additional income. For equity securities, a lending agent is used and may loan securities to certain qualified borrowers, including Fidelity Capital Markets (FCM), a broker-dealer affiliated with the Fund. On the settlement date of the loan, the Fund receives collateral (in the form of U.S. Treasury obligations, letters of credit and/or cash) against the loaned securities and maintains collateral in an amount not less than 100% of the market value of the loaned securities during the period of the loan. The market value of the loaned securities is determined at the close of business of the Fund and any additional required collateral is delivered to the Fund on the next business day. If the borrower defaults on its obligation to return the securities loaned because of insolvency or other reasons, a fund could experience delays and costs in recovering the securities loaned or in gaining access to the collateral. Any cash collateral received is invested in the Fidelity Securities Lending Cash Central Fund. The value of loaned securities and cash collateral at period end are disclosed on the Fund's Statement of Assets and Liabilities. At period end, there were no security loans outstanding with FCM. Security lending income represents the income earned on investing cash collateral, less rebates paid to borrowers and any lending agent fees associated with the loan, plus any premium payments received for lending certain types of securities. Security lending income is presented in the Statement of Operations as a component of income from Fidelity Central Funds. Total security lending income during the period amounted to $44,606, including $402 from securities loaned to FCM.
8. Expense Reductions.
Many of the brokers with whom FMR places trades on behalf of the Fund provided services to the Fund in addition to trade execution. These services included payments of certain expenses on behalf of the Fund totaling $165,826 for the period. In addition, through arrangements with the Fund's custodian, credits realized as a result of uninvested cash balances were used to reduce the Fund's expenses. During the period, these credits reduced the Fund's custody expenses by $12.
9. Other.
The Fund's organizational documents provide former and current trustees and officers with a limited indemnification against liabilities arising in connection with the performance of their duties to the Fund. In the normal course of business, the Fund may also enter into contracts that provide general indemnifications. The Fund's maximum exposure under these arrangements is unknown as this would be dependent on future claims that may be made against the Fund. The risk of material loss from such claims is considered remote.
Semiannual Report
Board Approval of Investment Advisory Contracts and Management Fees
Fidelity Fifty
Each year, the Board of Trustees, including the Independent Trustees (together, the Board), votes on the renewal of the management contract and sub-advisory agreements (together, the Advisory Contracts) for the fund. The Board, assisted by the advice of fund counsel and Independent Trustees' counsel, requests and considers a broad range of information relevant to the renewal of the Advisory Contracts throughout the year.
The Board meets regularly and, at each of its meetings, considers factors that are relevant to its annual consideration of the renewal of the fund's Advisory Contracts, including the services and support provided to the fund and its shareholders. The Board has established various standing committees, each composed of and chaired by Independent Trustees with varying backgrounds, to which the Board has assigned specific subject matter responsibilities in order to enhance effective decision-making by the Board. The Board, acting directly and through its Committees, requests and receives information concerning the annual consideration of the renewal of the fund's Advisory Contracts. The Board also meets as needed to consider matters specifically related to the Board's annual consideration of the renewal of Advisory Contracts. Members of the Board may also meet with trustees of other Fidelity funds through ad hoc joint committees to discuss certain matters relevant to the Fidelity funds.
At its July 2012 meeting, the Board of Trustees, including the Independent Trustees, unanimously determined to renew the fund's Advisory Contracts. In reaching its determination, the Board considered all factors it believed relevant, including (i) the nature, extent, and quality of the services to be provided to the fund and its shareholders (including the investment performance of the fund); (ii) the competitiveness of the fund's management fee and total expense ratio relative to peer funds; (iii) the total costs of the services to be provided by and the profits to be realized by Fidelity from its relationship with the fund; (iv) the extent to which economies of scale exist and would be realized as the fund grows; and (v) whether fee levels reflect these economies of scale, if any, for the benefit of fund shareholders.
In considering whether to renew the Advisory Contracts for the fund, the Board reached a determination, with the assistance of fund counsel and Independent Trustees' counsel and through the exercise of its business judgment, that the renewal of the Advisory Contracts is in the best interests of the fund and its shareholders and that the compensation payable under the Advisory Contracts is fair and reasonable. The Board's decision to renew the Advisory Contracts was not based on any single factor, but rather was based on a comprehensive consideration of all the information provided to the Board at its meetings throughout the year. The Board, in reaching its determination to renew the Advisory Contracts, is aware that shareholders in the fund have a broad range of investment choices available to them, including a wide choice among mutual funds offered by Fidelity's competitors, and that the fund's shareholders, who have the opportunity to review and weigh the disclosure provided by the fund in its prospectus and other public disclosures, have chosen to invest in this fund, managed by Fidelity.
Semiannual Report
Board Approval of Investment Advisory Contracts and
Management Fees - continued
Nature, Extent, and Quality of Services Provided. The Board considered the staffing within the investment adviser, FMR, and the sub-advisers (together, the Investment Advisers), including the backgrounds of the fund's investment personnel, and also considered the fund's investment objective, strategies, and related investment philosophy. The Independent Trustees also had discussions with senior management of Fidelity's investment operations and investment groups. The Board considered the structure of the portfolio manager compensation program and whether this structure provides appropriate incentives to act in the best interests of the fund.
Resources Dedicated to Investment Management and Support Services. The Board and the Fund Oversight and Research Committees reviewed the general qualifications and capabilities of the Investment Advisers' investment staff, including its size, education, experience, and resources, as well as the Investment Advisers' approach to recruiting, training, managing, and compensating investment personnel. The Board also noted that FMR has continued to increase the resources devoted to non-U.S. offices, including expansion of Fidelity's global investment organization. The Board noted that Fidelity's analysts have extensive resources, tools and capabilities that allow them to conduct sophisticated quantitative and fundamental analysis, as well as credit analysis of issuers, counterparties and guarantors. The Board also believes that Fidelity's investment professionals have sufficient access to global information and data so as to provide competitive investment results over time, and that those professionals also have access to sophisticated tools that permit them to assess portfolio construction and risk and performance attribution characteristics continuously, as well as to transmit new information and research conclusions rapidly around the world. Additionally, in its deliberations, the Board considered the Investment Advisers' trading and risk management capabilities and resources, which are an integral part of the investment management process.
Shareholder and Administrative Services. The Board considered (i) the nature, extent, quality, and cost of advisory, administrative, and shareholder services performed by the Investment Advisers and their affiliates under the Advisory Contracts and under separate agreements covering transfer agency, pricing and bookkeeping, and securities lending services for the fund; (ii) the nature and extent of the supervision of third party service providers, principally custodians and subcustodians; and (iii) the resources devoted to, and the record of compliance with, the fund's compliance policies and procedures. The Board also reviewed the allocation of fund brokerage, including allocations to brokers affiliated with the Investment Advisers, the use of brokerage commissions to pay fund expenses, and the use of "soft" commission dollars to pay for research services.
Semiannual Report
The Board noted that the growth of fund assets over time across the complex allows Fidelity to reinvest in the development of services designed to enhance the value or convenience of the Fidelity funds as investment vehicles. These services include 24-hour access to account information and market information through telephone representatives and over the Internet, investor education materials and asset allocation tools, and the expanded availability of Fidelity Investor Centers.
Investment in a Large Fund Family. The Board considered the benefits to shareholders of investing in a Fidelity fund, including the benefits of investing in a fund that is part of a large family of funds offering a variety of investment disciplines and providing a large variety of mutual fund investor services. The Board noted that Fidelity had taken, or had made recommendations that resulted in the Fidelity funds taking, a number of actions over the previous year that benefited particular funds, including (i) continuing to dedicate additional resources to investment research and support of the senior management team that oversees asset management; (ii) persisting in efforts to enhance Fidelity's research capabilities, in particular, international research; (iii) launching new funds and making other enhancements to meet client needs for global and income-oriented solutions; (iv) continuing to launch dedicated lower cost underlying funds to meet investment management's portfolio construction needs related to expanding underlying fund options, specifically for the Freedom Fund product lines; (v) adopting a "Stock Selector" sector neutral investment approach and employing a team of portfolio managers who are sector specialists to manage certain funds; (vi) rationalizing product lines and gaining increased efficiencies through the mergers of several funds into other funds; (vii) strengthening the Spartan Index Fund product line by adding new funds and/or new low-cost institutional share classes, restructuring fund expenses to accommodate new classes, and reducing investment minimums for certain classes of shares; (viii) modifying the eligibility criteria for Institutional Class shares to increase their appeal to government entities and charitable investors; and (ix) reducing certain transfer agent fee rates.
Investment Performance. The Board considered whether the fund has operated in accordance with its investment objective, as well as its record of compliance with its investment restrictions. It also reviewed the fund's absolute investment performance, as well as the fund's relative investment performance measured over multiple periods against (i) a broad-based securities market index, and (ii) a custom peer group of mutual funds deemed appropriate by Fidelity and reviewed by the Board. The following charts considered by the Board show, over the one-, three-, and five-year periods ended December 31, 2011, the fund's cumulative total returns, the cumulative total returns of a broad-based securities market index ("benchmark"), and a range of cumulative total returns of a custom peer group of mutual funds defined by FMR based on categories assigned by Morningstar, Inc. The box within each chart shows the 25th percentile return (top of box) and the 75th percentile return (bottom of box) of the peer group. Returns shown above the box are in the first quartile and returns shown below the box are in the fourth quartile. The percentage beaten number noted below each chart corresponds to the percentile box and represents the percentage of funds in the peer group whose performance was equal to or lower than that of the fund. The fund's custom peer group, defined by FMR, is a peer group that FMR believes provides a more meaningful performance comparison than the peer group assigned by Morningstar, Inc., which assigns mutual funds to categories based on their investment styles as measured by their underlying portfolio holdings.
Semiannual Report
Board Approval of Investment Advisory Contracts and
Management Fees - continued
Fidelity Fifty
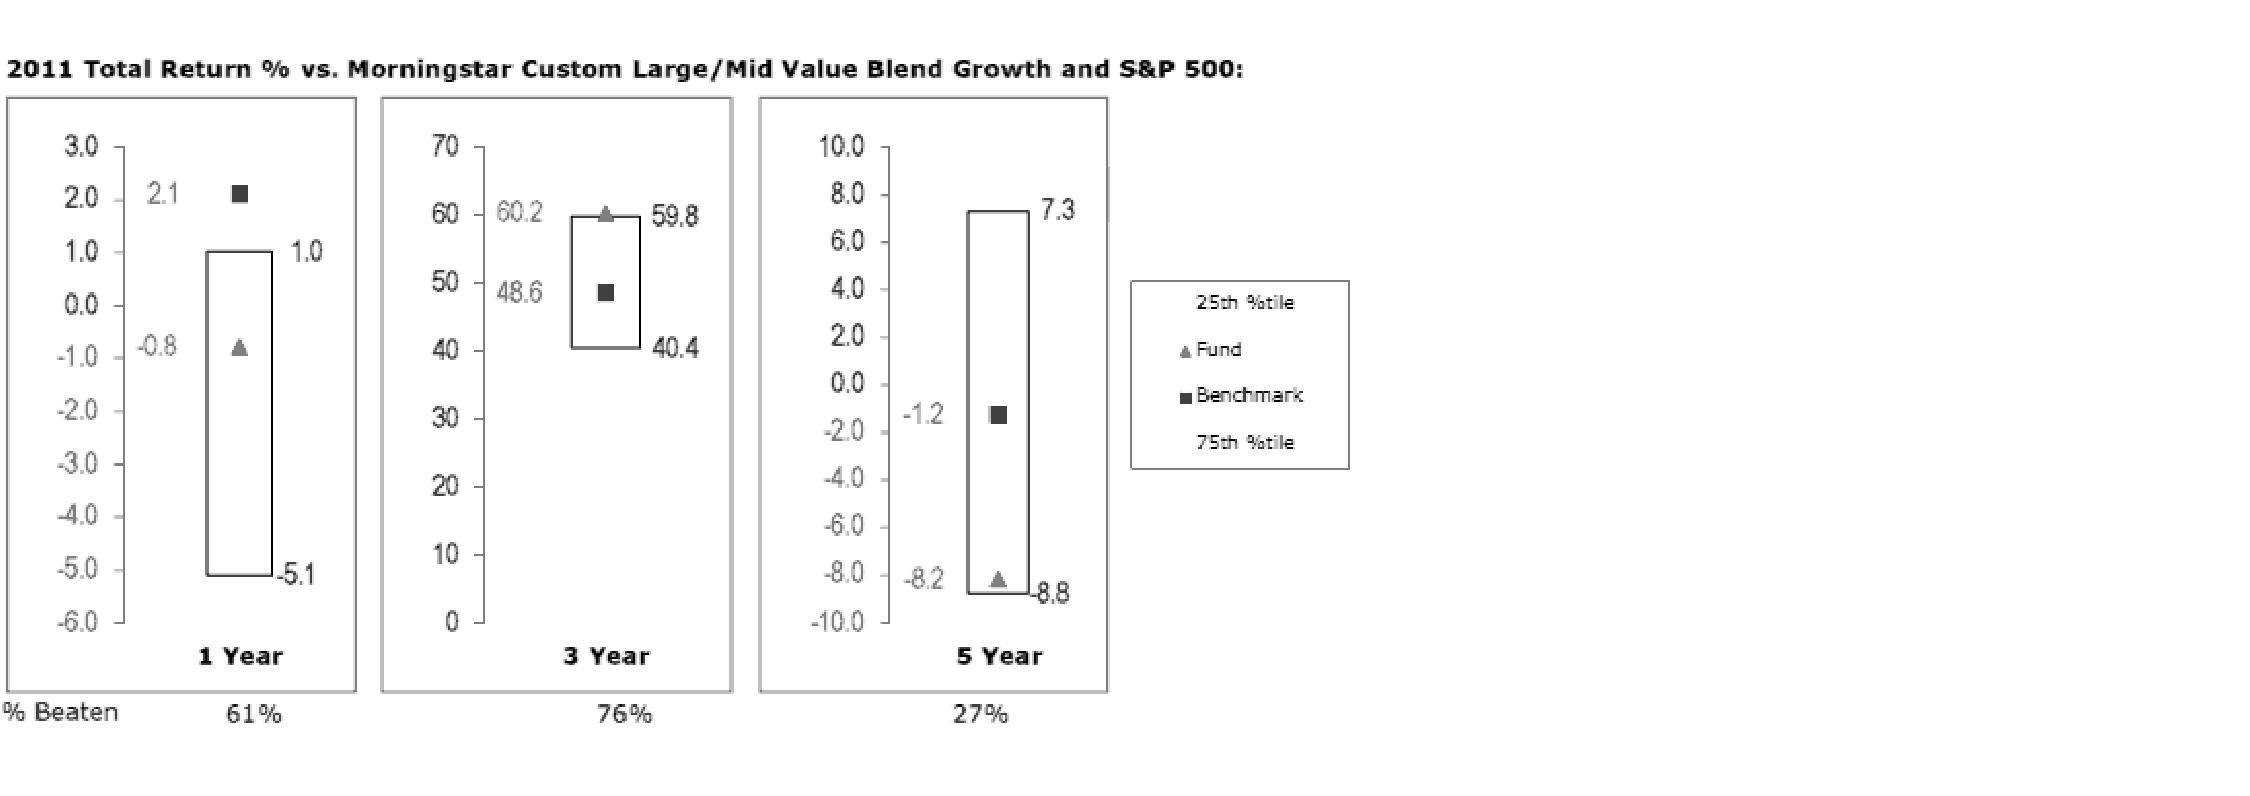
The Board reviewed the fund's relative investment performance against its peer group and noted that the performance of the fund was in the second quartile for the one-year period, the first quartile for the three-year period, and the third quartile for the five-year period. The Board also noted that the investment performance of the fund was lower than its benchmark for the one- and five-year periods, although the fund's three-year cumulative total return compared favorably to its benchmark. The Board also reviewed the fund's performance since inception as well as performance in the current year.
The Board also considered that the fund's management fee is subject to upward or downward adjustment depending upon whether, and to what extent, the fund's investment performance for the performance period exceeds, or is exceeded by, the record (over the same period) of a Board-approved performance adjustment index. The Board noted that the performance adjustment provides FMR with a strong economic incentive to seek to achieve superior performance for the fund's shareholders and helps to more closely align the interests of FMR and the fund's shareholders.
Semiannual Report
Based on its review, the Board concluded that the nature, extent, and quality of services provided to the fund under the Advisory Contracts should benefit the fund's shareholders.
Competitiveness of Management Fee and Total Expense Ratio. The Board considered the fund's management fee and total expense ratio compared to "mapped groups" of competitive funds and classes. Fidelity creates "mapped groups" by combining similar Lipper investment objective categories that have comparable management fee characteristics. Combining Lipper investment objective categories aids the Board's management fee and total expense ratio comparisons by broadening the competitive group used for comparison and by reducing the number of universes to which various Fidelity funds are compared.
Management Fee. The Board considered two proprietary management fee comparisons for the 12-month periods shown in the chart below. The group of Lipper funds used by the Board for management fee comparisons is referred to below as the "Total Mapped Group." The Total Mapped Group comparison focuses on a fund's standing relative to the total universe of comparable funds available to investors in terms of gross management fees before expense reimbursements or caps, and without giving effect to the fund's performance adjustment. "TMG %" represents the percentage of funds in the Total Mapped Group that had management fees that were lower than the fund's. For example, a TMG % of 10% means that 90% of the funds in the Total Mapped Group had higher management fees than the fund. The "Asset-Size Peer Group" (ASPG) comparison focuses on a fund's standing relative to non-Fidelity funds similar in size to the fund within the Total Mapped Group. The ASPG represents at least 15% of the funds in the Total Mapped Group with comparable asset size and management fee characteristics, subject to a minimum of 50 funds (or all funds in the Total Mapped Group if fewer than 50). Additional information, such as the ASPG quartile in which the fund's management fee ranked and the impact of the fund's performance adjustment, is also included in the chart and considered by the Board.
Semiannual Report
Board Approval of Investment Advisory Contracts and
Management Fees - continued
Fidelity Fifty

The Board noted that the fund's management fee ranked below the median of its Total Mapped Group and below the median of its ASPG for 2011. The Board also noted the effect of the fund's negative performance adjustment on the fund's management fee ranking. The Board noted that the performance adjustment for each year represents calculations for performance periods that differ from the periods shown in the performance charts above.
Based on its review, the Board concluded that the fund's management fee is fair and reasonable in light of the services that the fund receives and the other factors considered.
Total Expense Ratio. In its review of the fund's total expense ratio, the Board considered the fund's management fee as well as other fund expenses, such as transfer agent fees, pricing and bookkeeping fees, and custodial, legal, and audit fees. The Board also noted the effects of any waivers and reimbursements on fees and expenses, as well as the impact of the fund's performance adjustment. As part of its review, the Board also considered the current and historical total expense ratios of the fund compared to competitive fund median expenses. The fund is compared to those funds and classes in the Total Mapped Group (used by the Board for management fee comparisons) that have a similar sales load structure.
The Board noted that the fund's total expense ratio ranked below its competitive median for 2011.
Semiannual Report
Fees Charged to Other Fidelity Clients. The Board also considered Fidelity fee structures and other information with respect to clients of FMR and its affiliates, such as other mutual funds advised or subadvised by FMR or its affiliates, pension plan clients, and other institutional clients. The Board noted the findings of the 2010 ad hoc joint committee (created with the board of other Fidelity funds), which reviewed and compared Fidelity's institutional investment advisory business with its business of providing services to the Fidelity funds, including the differences in services provided, fees charged, and costs incurred, as well as competition in their respective marketplaces.
Based on its review of total expense ratios and fees charged to other Fidelity clients, the Board concluded that the fund's total expense ratio was reasonable in light of the services that the fund and its shareholders receive and the other factors considered.
Costs of the Services and Profitability. The Board considered the revenues earned and the expenses incurred by Fidelity in conducting the business of developing, marketing, distributing, managing, administering and servicing the fund and its shareholders. The Board also considered the level of Fidelity's profits in respect of all the Fidelity funds.
On an annual basis, FMR presents to the Board Fidelity's profitability for the fund. Fidelity calculates the profitability for each fund, as well as aggregate profitability for groups of Fidelity funds and all Fidelity funds, using a series of detailed revenue and cost allocation methodologies which originate with the books and records of Fidelity on which Fidelity's audited financial statements are based. The Audit Committee of the Board reviews any significant changes from the prior year's methodologies.
PricewaterhouseCoopers LLP (PwC), independent registered public accounting firm and auditor to Fidelity and certain Fidelity funds, has been engaged annually by the Board as part of the Board's assessment of Fidelity's profitability analysis. PwC's engagement includes the review and assessment of Fidelity's methodologies used in determining the revenues and expenses attributable to Fidelity's mutual fund business, and completion of agreed-upon procedures surrounding the mathematical accuracy of fund profitability and its conformity to allocation methodologies. After considering PwC's reports issued under the engagement and information provided by Fidelity, the Board concluded that while other allocation methods may also be reasonable, Fidelity's profitability methodologies are reasonable in all material respects.
The Board also reviewed Fidelity's non-fund businesses and fall-out benefits related to the mutual fund business as well as cases where Fidelity's affiliates may benefit from or be related to the fund's business.
The Board considered the costs of the services provided by and the profits realized by Fidelity in connection with the operation of the fund and was satisfied that the profitability was not excessive in the circumstances.
Semiannual Report
Board Approval of Investment Advisory Contracts and
Management Fees - continued
Economies of Scale. The Board considered whether there have been economies of scale in respect of the management of the Fidelity funds, whether the Fidelity funds (including the fund) have appropriately benefited from any such economies of scale, and whether there is potential for realization of any further economies of scale. The Board considered the extent to which the fund will benefit from economies of scale through increased services to the fund, through waivers or reimbursements, or through fee or expense reductions. The Board also noted that in 2009, it and the board of other Fidelity funds created an ad hoc committee (the Economies of Scale Committee) to analyze whether FMR attains economies of scale in respect of the management and servicing of the Fidelity funds, whether the Fidelity funds have appropriately benefited from such economies of scale, and whether there is potential for realization of any further economies of scale.
The Board recognized that the fund's management contract incorporates a "group fee" structure, which provides for lower group fee rates as total fund assets under FMR's management increase, and for higher group fee rates as total fund assets under FMR's management decrease. FMR calculates the group fee rates based on a tiered asset "breakpoint" schedule that varies based on asset class. The Board considered that the group fee is designed to deliver the benefits of economies of scale to fund shareholders when total Fidelity fund assets increase, even if assets of any particular fund are unchanged or have declined, because some portion of Fidelity's costs are attributable to services provided to all Fidelity funds, and all funds benefit if those costs can be allocated among more assets. The Board concluded that, given the group fee structure, fund shareholders will benefit from lower management fees as assets under FMR's management increase at the fund complex level, regardless of whether Fidelity achieves any such economies of scale.
The Board concluded, taking into account the analysis of the Economies of Scale Committee, that economies of scale, if any, are being appropriately shared between fund shareholders and Fidelity.
Additional Information Requested by the Board. In order to develop fully the factual basis for consideration of the Fidelity funds' Advisory Contracts, the Board requested and received additional information on certain topics, including (i) fund performance trends, actions to be taken by FMR to improve certain funds' overall performance, and Fidelity's long-term strategies for certain funds; (ii) the potential to further rationalize the Fidelity fund lineup with the possibility of achieving savings for the funds and Fidelity; (iii) Fidelity's compensation structure for portfolio managers and other key investment personnel; (iv) the amount of the investment that each portfolio manager has made in the Fidelity fund(s) that he or she manages; (v) the realization of fall-out benefits in certain Fidelity business units; (vi) Fidelity's group fee structures, the potential impact of regulatory changes on such structures, and the rationale for the individual fee rates of certain funds; (vii) fund profitability methodology, including Fidelity's cost allocation methodology, and the impact of certain factors on fund profitability results; (viii) trends regarding industry use of performance fee structures and the possibility of implementing performance fee structures for additional funds; and (ix) the impact of net redemptions from the Fidelity funds.
Semiannual Report
Based on its evaluation of all of the conclusions noted above, and after considering all factors it believed relevant, the Board ultimately concluded that the advisory fee structures are fair and reasonable, and that the fund's Advisory Contracts should be renewed.
Semiannual Report
Investment Adviser
Fidelity Management & Research Company
Boston, MA
Investment Sub-Advisers
Fidelity Management & Research
(Hong Kong) Limited
Fidelity Management & Research
(Japan) Inc.
FMR Co., Inc.
Fidelity Management & Research
(U.K.) Inc.
General Distributor
Fidelity Distributors Corporation
Smithfield, RI
Transfer and Service Agents
Fidelity Investments Institutional
Operations Company, Inc.
Boston, MA
Fidelity Service Company, Inc.
Boston, MA
Custodian
Citibank, N.A.
New York, NY
The Fidelity Telephone Connection
Mutual Fund 24-Hour Service
Exchanges/Redemptions
and Account Assistance 1-800-544-6666
Product Information 1-800-544-6666
Retirement Accounts 1-800-544-4774
(8 a.m. - 9 p.m.)
TDD Service 1-800-544-0118
for the deaf and hearing impaired
(9 a.m. - 9 p.m. Eastern time)
Fidelity Automated Service
Telephone (FAST®)
1-800-544-5555
Automated line for quickest service
(Fidelity Investment logo)(registered trademark)
Corporate Headquarters
82 Devonshire St., Boston, MA 02109
www.fidelity.com
FIF-USAN-0213
1.787779.109
Fidelity Advisor®
Series Mega Cap
Fund
Semiannual Report
December 31, 2012
(Fidelity Cover Art)
Contents
Shareholder Expense Example | An example of shareholder expenses. | |
Investment Summary | A summary of the fund's holdings. | |
Investments | A complete list of the fund's investments with their market values. | |
Financial Statements | Statements of assets and liabilities, operations, and changes in net assets, as well as financial highlights. | |
Notes | Notes to the financial statements. | |
Board Approval of Investment Advisory Contracts and Management Fees |
|
To view a fund's proxy voting guidelines and proxy voting record for the 12-month period ended June 30, visit http://www.fidelity.com/proxyvotingresults or visit the Securities and Exchange Commission's (SEC) web site at http://www.sec.gov. You may also call 1-877-208-0098 to request a free copy of the proxy voting guidelines.
Standard & Poor's, S&P and S&P 500 are registered service marks of The McGraw-Hill Companies, Inc. and have been licensed for use by Fidelity Distributors Corporation.
Other third party marks appearing herein are the property of their respective owners.
All other marks appearing herein are registered or unregistered trademarks or service marks of FMR LLC or an affiliated company. © 2013 FMR LLC. All rights reserved.
This report and the financial statements contained herein are submitted for the general information of the shareholders of the fund. This report is not authorized for distribution to prospective investors in the fund unless preceded or accompanied by an effective prospectus.
A fund files its complete schedule of portfolio holdings with the SEC for the first and third quarters of each fiscal year on Form N-Q. Forms N-Q are available on the SEC's web site at http://www.sec.gov. A fund's Forms N-Q may be reviewed and copied at the SEC's Public Reference Room in Washington, DC. Information regarding the operation of the SEC's Public Reference Room may be obtained by calling 1-800-SEC-0330. For a complete list of a fund's portfolio holdings, view the most recent holdings listing, semiannual report, or annual report on Fidelity's web site at http://www.fidelity.com, http://www.advisor.fidelity.com, or http://www.401k.com, as applicable.
NOT FDIC INSURED • MAY LOSE VALUE • NO BANK GUARANTEE
Neither the fund nor Fidelity Distributors Corporation is a bank.
Semiannual Report
Shareholder Expense Example
As a shareholder of the Fund, you incur two types of costs: (1) transaction costs and (2) ongoing costs, including management fees and other Fund expenses. This Example is intended to help you understand your ongoing costs (in dollars) of investing in the Fund and to compare these costs with the ongoing costs of investing in other mutual funds.
The actual expense Example is based on an investment of $1,000 invested at the beginning of the period and held for the entire period (December 6, 2012 to December 31, 2012). The hypothetical expense Example is based on an investment of $1,000 invested for the one-half year period (July 1, 2012 to December 31, 2012).
Actual Expenses
The first line of the accompanying table provides information about actual account values and actual expenses. You may use the information in this line, together with the amount you invested, to estimate the expenses that you paid over the period. Simply divide your account value by $1,000.00 (for example, an $8,600 account value divided by $1,000.00 = 8.6), then multiply the result by the number in the first line under the heading entitled "Expenses Paid During Period" to estimate the expenses you paid on your account during this period. In addition, the Fund, as a shareholder in the underlying Fidelity Central Funds, will indirectly bear its pro-rata share of the fees and expenses incurred by the underlying Fidelity Central Funds. These fees and expenses are not included in the Fund's annualized expense ratio used to calculate the expense estimate in the table below.
Hypothetical Example for Comparison Purposes
The second line of the accompanying table provides information about hypothetical account values and hypothetical expenses based on the Fund's actual expense ratio and an assumed rate of return of 5% per year before expenses, which is not the Fund's actual return. The hypothetical account values and expenses may not be used to estimate the actual ending account balance or expenses you paid for the period. You may use this information to compare the ongoing costs of investing in the Fund and other funds. To do so, compare this 5% hypothetical example with the 5% hypothetical examples that appear in the shareholder reports of the other funds. In addition, the Fund, as a shareholder in the underlying Fidelity Central Funds, will indirectly bear its pro-rata share of the fees and expenses incurred by the underlying Fidelity Central Funds. These fees and expenses are not included in the Fund's annualized expense ratio used to calculate the expense estimate in the table below.
Please note that the expenses shown in the table are meant to highlight your ongoing costs only and do not reflect any transaction costs. Therefore, the second line of the table is useful in comparing ongoing costs only, and will not help you determine the relative total costs of owning different funds.
Semiannual Report
Shareholder Expense Example - continued
| Annualized Expense Ratio | Beginning | Ending | Expenses Paid |
Actual | .90% | $ 1,000.00 | $ 1,007.90 | $ .64 A |
Hypothetical (5% return per year before expenses) |
| $ 1,000.00 | $ 1,020.67 | $ 4.58 B |
A Actual expenses are equal to the Fund's annualized expense ratio, multiplied by the average account value over the period, multiplied by 26/365 (to reflect the period December 6, 2012 to December 31, 2012).
B Hypothetical expenses are equal to the Fund's annualized expense ratio, multiplied by the average account value over the period, multiplied by 184/365 (to reflect the one-half year period).
Semiannual Report
Investment Summary (Unaudited)
Top Ten Stocks as of December 31, 2012 |
| % of fund's |
Apple, Inc. | 5.3 |
JPMorgan Chase & Co. | 4.2 |
Exxon Mobil Corp. | 3.9 |
Wells Fargo & Co. | 3.7 |
Chevron Corp. | 3.3 |
General Electric Co. | 3.2 |
Google, Inc. Class A | 2.6 |
Procter & Gamble Co. | 2.4 |
Microsoft Corp. | 2.4 |
Merck & Co., Inc. | 2.3 |
| 33.3 |
Top Five Market Sectors as of December 31, 2012 |
| % of fund's |
Information Technology | 19.8 |
Financials | 18.5 |
Health Care | 12.7 |
Energy | 12.4 |
Consumer Discretionary | 11.9 |
Asset Allocation (% of fund's net assets) |
As of December 31, 2012 * | |||
 | Stocks 99.6% |
| |
 | Convertible |
| |
 | Short-Term |
| |
* Foreign investments | 1.1% |
| |

Semiannual Report
Investments December 31, 2012 (Unaudited)
Showing Percentage of Net Assets
Common Stocks - 99.6% | |||
Shares | Value | ||
CONSUMER DISCRETIONARY - 11.9% | |||
Auto Components - 0.5% | |||
Johnson Controls, Inc. | 24,600 | $ 755,220 | |
Automobiles - 0.5% | |||
Ford Motor Co. | 64,700 | 837,865 | |
Hotels, Restaurants & Leisure - 0.9% | |||
McDonald's Corp. | 11,800 | 1,040,878 | |
Yum! Brands, Inc. | 5,200 | 345,280 | |
| 1,386,158 | ||
Internet & Catalog Retail - 0.2% | |||
priceline.com, Inc. (a) | 376 | 233,571 | |
Media - 5.9% | |||
Comcast Corp. Class A (special) (non-vtg.) | 93,300 | 3,354,135 | |
News Corp. Class A | 19,700 | 503,138 | |
The Walt Disney Co. | 21,100 | 1,050,569 | |
Thomson Reuters Corp. | 8,800 | 254,613 | |
Time Warner Cable, Inc. | 4,820 | 468,456 | |
Time Warner, Inc. | 50,800 | 2,429,764 | |
Viacom, Inc. Class B (non-vtg.) | 15,700 | 828,018 | |
| 8,888,693 | ||
Multiline Retail - 1.6% | |||
Target Corp. | 41,600 | 2,461,472 | |
Specialty Retail - 2.3% | |||
Home Depot, Inc. | 11,405 | 705,399 | |
Lowe's Companies, Inc. | 77,500 | 2,752,800 | |
| 3,458,199 | ||
TOTAL CONSUMER DISCRETIONARY | 18,021,178 | ||
CONSUMER STAPLES - 10.6% | |||
Beverages - 3.1% | |||
PepsiCo, Inc. | 26,300 | 1,799,709 | |
The Coca-Cola Co. | 79,300 | 2,874,625 | |
| 4,674,334 | ||
Food & Staples Retailing - 2.3% | |||
CVS Caremark Corp. | 22,800 | 1,102,380 | |
Kroger Co. | 10,700 | 278,414 | |
Walgreen Co. | 57,900 | 2,142,879 | |
| 3,523,673 | ||
Food Products - 0.7% | |||
Kellogg Co. | 19,640 | 1,096,894 | |
Common Stocks - continued | |||
Shares | Value | ||
CONSUMER STAPLES - continued | |||
Household Products - 3.7% | |||
Colgate-Palmolive Co. | 2,400 | $ 250,896 | |
Kimberly-Clark Corp. | 18,900 | 1,595,727 | |
Procter & Gamble Co. | 54,700 | 3,713,583 | |
| 5,560,206 | ||
Tobacco - 0.8% | |||
Altria Group, Inc. | 7,200 | 226,224 | |
Lorillard, Inc. | 3,600 | 420,012 | |
Philip Morris International, Inc. | 6,100 | 510,204 | |
| 1,156,440 | ||
TOTAL CONSUMER STAPLES | 16,011,547 | ||
ENERGY - 12.4% | |||
Energy Equipment & Services - 2.2% | |||
Halliburton Co. | 43,700 | 1,515,953 | |
National Oilwell Varco, Inc. | 8,600 | 587,810 | |
Schlumberger Ltd. | 18,600 | 1,288,794 | |
| 3,392,557 | ||
Oil, Gas & Consumable Fuels - 10.2% | |||
Apache Corp. | 18,200 | 1,428,700 | |
Chevron Corp. | 46,200 | 4,996,068 | |
Exxon Mobil Corp. | 67,700 | 5,859,435 | |
Occidental Petroleum Corp. | 31,200 | 2,390,232 | |
The Williams Companies, Inc. | 21,200 | 694,088 | |
| 15,368,523 | ||
TOTAL ENERGY | 18,761,080 | ||
FINANCIALS - 18.5% | |||
Capital Markets - 2.8% | |||
BlackRock, Inc. Class A | 3,000 | 620,130 | |
Charles Schwab Corp. | 103,300 | 1,483,388 | |
Morgan Stanley | 108,900 | 2,082,168 | |
State Street Corp. | 1,600 | 75,216 | |
| 4,260,902 | ||
Commercial Banks - 5.5% | |||
BB&T Corp. | 10,000 | 291,100 | |
PNC Financial Services Group, Inc. | 16,400 | 956,284 | |
Common Stocks - continued | |||
Shares | Value | ||
FINANCIALS - continued | |||
Commercial Banks - continued | |||
U.S. Bancorp | 47,000 | $ 1,501,180 | |
Wells Fargo & Co. | 161,000 | 5,502,980 | |
| 8,251,544 | ||
Diversified Financial Services - 8.3% | |||
Bank of America Corp. | 192,200 | 2,229,520 | |
Citigroup, Inc. | 85,792 | 3,393,932 | |
CME Group, Inc. | 9,900 | 502,029 | |
JPMorgan Chase & Co. | 145,900 | 6,415,223 | |
| 12,540,704 | ||
Insurance - 1.9% | |||
AFLAC, Inc. | 7,050 | 374,496 | |
American International Group, Inc. (a) | 11,300 | 398,890 | |
MetLife, Inc. | 52,400 | 1,726,056 | |
Prudential Financial, Inc. | 7,600 | 405,308 | |
| 2,904,750 | ||
TOTAL FINANCIALS | 27,957,900 | ||
HEALTH CARE - 12.7% | |||
Biotechnology - 0.9% | |||
Amgen, Inc. | 16,100 | 1,389,752 | |
Health Care Equipment & Supplies - 0.9% | |||
Baxter International, Inc. | 9,000 | 599,940 | |
Stryker Corp. | 12,700 | 696,214 | |
| 1,296,154 | ||
Health Care Providers & Services - 3.5% | |||
Aetna, Inc. | 21,200 | 981,560 | |
Cardinal Health, Inc. | 10,400 | 428,272 | |
McKesson Corp. | 19,600 | 1,900,416 | |
UnitedHealth Group, Inc. | 9,600 | 520,704 | |
WellPoint, Inc. | 24,900 | 1,516,908 | |
| 5,347,860 | ||
Life Sciences Tools & Services - 0.4% | |||
Thermo Fisher Scientific, Inc. | 8,700 | 554,886 | |
Pharmaceuticals - 7.0% | |||
Abbott Laboratories | 21,600 | 1,414,800 | |
Eli Lilly & Co. | 22,200 | 1,094,904 | |
Johnson & Johnson | 42,000 | 2,944,200 | |
Common Stocks - continued | |||
Shares | Value | ||
HEALTH CARE - continued | |||
Pharmaceuticals - continued | |||
Merck & Co., Inc. | 83,900 | $ 3,434,866 | |
Pfizer, Inc. | 68,200 | 1,710,456 | |
| 10,599,226 | ||
TOTAL HEALTH CARE | 19,187,878 | ||
INDUSTRIALS - 9.1% | |||
Aerospace & Defense - 2.6% | |||
Honeywell International, Inc. | 10,000 | 634,700 | |
Precision Castparts Corp. | 400 | 75,768 | |
Raytheon Co. | 12,900 | 742,524 | |
The Boeing Co. | 16,507 | 1,243,968 | |
United Technologies Corp. | 14,900 | 1,221,949 | |
| 3,918,909 | ||
Air Freight & Logistics - 1.4% | |||
United Parcel Service, Inc. Class B | 29,800 | 2,197,154 | |
Electrical Equipment - 0.3% | |||
Emerson Electric Co. | 9,500 | 503,120 | |
Industrial Conglomerates - 3.6% | |||
Danaher Corp. | 11,700 | 654,030 | |
General Electric Co. | 226,200 | 4,747,938 | |
| 5,401,968 | ||
Machinery - 0.6% | |||
Cummins, Inc. | 2,400 | 260,040 | |
Illinois Tool Works, Inc. | 10,500 | 638,505 | |
| 898,545 | ||
Road & Rail - 0.6% | |||
Norfolk Southern Corp. | 3,290 | 203,454 | |
Union Pacific Corp. | 5,300 | 666,316 | |
| 869,770 | ||
TOTAL INDUSTRIALS | 13,789,466 | ||
INFORMATION TECHNOLOGY - 19.8% | |||
Communications Equipment - 2.6% | |||
Cisco Systems, Inc. | 128,900 | 2,532,885 | |
QUALCOMM, Inc. | 21,500 | 1,333,430 | |
| 3,866,315 | ||
Common Stocks - continued | |||
Shares | Value | ||
INFORMATION TECHNOLOGY - continued | |||
Computers & Peripherals - 5.9% | |||
Apple, Inc. | 14,937 | $ 7,961,869 | |
Dell, Inc. | 34,400 | 348,472 | |
EMC Corp. (a) | 26,700 | 675,510 | |
| 8,985,851 | ||
Internet Software & Services - 2.6% | |||
Google, Inc. Class A (a) | 5,533 | 3,924,944 | |
IT Services - 4.2% | |||
Accenture PLC Class A | 2,700 | 179,550 | |
Automatic Data Processing, Inc. | 1,828 | 104,214 | |
Cognizant Technology Solutions Corp. Class A (a) | 17,300 | 1,281,065 | |
IBM Corp. | 6,900 | 1,321,695 | |
MasterCard, Inc. Class A | 3,936 | 1,933,678 | |
Visa, Inc. Class A | 10,200 | 1,546,116 | |
| 6,366,318 | ||
Semiconductors & Semiconductor Equipment - 0.3% | |||
Broadcom Corp. Class A | 13,600 | 451,656 | |
Software - 4.2% | |||
Adobe Systems, Inc. (a) | 12,300 | 463,464 | |
Microsoft Corp. | 135,200 | 3,613,896 | |
Oracle Corp. | 40,300 | 1,342,796 | |
salesforce.com, Inc. (a) | 3,500 | 588,350 | |
VMware, Inc. Class A (a) | 4,500 | 423,630 | |
| 6,432,136 | ||
TOTAL INFORMATION TECHNOLOGY | 30,027,220 | ||
MATERIALS - 1.7% | |||
Chemicals - 1.7% | |||
Air Products & Chemicals, Inc. | 8,400 | 705,768 | |
E.I. du Pont de Nemours & Co. | 20,600 | 926,382 | |
Monsanto Co. | 4,500 | 425,925 | |
The Dow Chemical Co. | 16,900 | 546,208 | |
| 2,604,283 | ||
TELECOMMUNICATION SERVICES - 1.5% | |||
Diversified Telecommunication Services - 1.5% | |||
Verizon Communications, Inc. | 50,600 | 2,189,462 | |
Common Stocks - continued | |||
Shares | Value | ||
UTILITIES - 1.4% | |||
Electric Utilities - 1.3% | |||
Duke Energy Corp. | 9,100 | $ 580,580 | |
FirstEnergy Corp. | 24,000 | 1,002,240 | |
NextEra Energy, Inc. | 5,000 | 345,950 | |
| 1,928,770 | ||
Multi-Utilities - 0.1% | |||
PG&E Corp. | 5,100 | 204,918 | |
TOTAL UTILITIES | 2,133,688 | ||
TOTAL COMMON STOCKS (Cost $149,686,834) |
| ||
Convertible Preferred Stocks - 0.1% | |||
|
|
|
|
INDUSTRIALS - 0.1% | |||
Aerospace & Defense - 0.1% | |||
United Technologies Corp. 7.50% (Cost $138,150) | 2,500 |
| |
Money Market Funds - 0.4% | |||
|
|
|
|
Fidelity Cash Central Fund, 0.18% (b) | 617,530 |
| |
TOTAL INVESTMENT PORTFOLIO - 100.1% (Cost $150,442,514) | 151,440,507 | ||
NET OTHER ASSETS (LIABILITIES) - (0.1)% | (123,231) | ||
NET ASSETS - 100% | $ 151,317,276 | ||
Legend |
(a) Non-income producing |
(b) Affiliated fund that is available only to investment companies and other accounts managed by Fidelity Investments. The rate quoted is the annualized seven-day yield of the fund at period end. A complete unaudited listing of the fund's holdings as of its most recent quarter end is available upon request. In addition, each Fidelity Central Fund's financial statements are available on the SEC's website or upon request. |
Affiliated Central Funds |
Information regarding fiscal year to date income earned by the Fund from investments in Fidelity Central Funds is as follows: |
Fund | Income earned |
Fidelity Cash Central Fund | $ 239 |
Other Information |
All investments are categorized as Level 1 under the Fair Value Hierarchy. The inputs or methodology used for valuing securities may not be an indication of the risk associated with investing in those securities. For more information on valuation inputs, please refer to the Investment Valuation section in the accompanying Notes to Financial Statements. |
See accompanying notes which are an integral part of the financial statements.
Semiannual Report
Financial Statements
Statement of Assets and Liabilities
| December 31, 2012 (Unaudited) | |
|
|
|
Assets | ||
Investment in securities, at value - See accompanying schedule: Unaffiliated issuers (cost $149,824,984) | $ 150,822,977 |
|
Fidelity Central Funds (cost $617,530) | 617,530 |
|
Total Investments (cost $150,442,514) |
| $ 151,440,507 |
Cash |
| 250 |
Foreign currency held at value (cost $211) | 210 | |
Receivable for investments sold | 2,337,549 | |
Receivable for fund shares sold | 3,311 | |
Dividends receivable | 135,694 | |
Distributions receivable from Fidelity Central Funds | 239 | |
Receivable from investment adviser for expense reductions | 16,938 | |
Other receivables | 102 | |
Total assets | 153,934,800 | |
|
|
|
Liabilities | ||
Payable to custodian bank | $ 37,512 | |
Payable for investments purchased | 1,492,592 | |
Payable for fund shares redeemed | 990,230 | |
Accrued management fee | 52,902 | |
Other affiliated payables | 22,513 | |
Other payables and accrued expenses | 21,775 | |
Total liabilities | 2,617,524 | |
|
|
|
Net Assets | $ 151,317,276 | |
Net Assets consist of: |
| |
Paid in capital | $ 150,293,913 | |
Distributions in excess of net investment income | (39,397) | |
Accumulated undistributed net realized gain (loss) on investments and foreign currency transactions | 64,768 | |
Net unrealized appreciation (depreciation) on investments and assets and liabilities in foreign currencies | 997,992 | |
Net Assets, for 15,029,942 shares outstanding | $ 151,317,276 | |
Net Asset Value, offering price and redemption price per share ($151,317,276 ÷ 15,029,942 shares) | $ 10.07 | |
See accompanying notes which are an integral part of the financial statements.
Semiannual Report
Statement of Operations
| For the period December 6, 2012 | |
|
|
|
Investment Income |
|
|
Dividends |
| $ 176,542 |
Income from Fidelity Central Funds |
| 239 |
Total income |
| 176,781 |
|
|
|
Expenses | ||
Management fee | $ 52,902 | |
Transfer agent fees | 18,811 | |
Accounting fees and expenses | 3,702 | |
Custodian fees and expenses | 7,946 | |
Audit | 13,827 | |
Total expenses before reductions | 97,188 | |
Expense reductions | (17,040) | 80,148 |
Net investment income (loss) | 96,633 | |
Realized and Unrealized Gain (Loss) Net realized gain (loss) on: | ||
Investment securities: |
|
|
Unaffiliated issuers | 64,302 | |
Foreign currency transactions | 466 | |
Total net realized gain (loss) |
| 64,768 |
Change in net unrealized appreciation (depreciation) on: Investment securities | 997,993 | |
Assets and liabilities in foreign currencies | (1) | |
Total change in net unrealized appreciation (depreciation) |
| 997,992 |
Net gain (loss) | 1,062,760 | |
Net increase (decrease) in net assets resulting from operations | $ 1,159,393 | |
See accompanying notes which are an integral part of the financial statements.
Semiannual Report
Financial Statements - continued
Statement of Changes in Net Assets
For the period December 6, 2012 | |
Increase (Decrease) in Net Assets |
|
Operations |
|
Net investment income (loss) | $ 96,633 |
Net realized gain (loss) | 64,768 |
Change in net unrealized appreciation (depreciation) | 997,992 |
Net increase (decrease) in net assets resulting from operations | 1,159,393 |
Distributions to shareholders from net investment income | (136,030) |
Share transactions | 151,148,113 |
Reinvestment of distributions | 136,030 |
Cost of shares redeemed | (990,230) |
Net increase (decrease) in net assets resulting from share transactions | 150,293,913 |
Total increase (decrease) in net assets | 151,317,276 |
|
|
Net Assets | |
Beginning of period | - |
End of period (including distributions in excess of net investment income of $39,397) | $ 151,317,276 |
Other Information Shares | |
Sold | 15,114,809 |
Issued in reinvestment of distributions | 13,468 |
Redeemed | (98,335) |
Net increase (decrease) | 15,029,942 |
See accompanying notes which are an integral part of the financial statements.
Semiannual Report
Financial Highlights
Period ended | |
Selected Per-Share Data |
|
Net asset value, beginning of period | $ 10.00 |
Income from Investment Operations |
|
Net investment income (loss) D | .01 |
Net realized and unrealized gain (loss) | .07 |
Total from investment operations | .08 |
Distributions from net investment income | (.01) |
Net asset value, end of period | $ 10.07 |
Total Return B,C | .79% |
Ratios to Average Net Assets E,H |
|
Expenses before reductions | 1.09% A |
Expenses net of fee waivers, if any | .90% A |
Expenses net of all reductions | .90% A |
Net investment income (loss) | 1.09% A |
Supplemental Data |
|
Net assets, end of period (000 omitted) | $ 151,317 |
Portfolio turnover rate F | 11% I |
A Annualized
B Total returns for periods of less than one year are not annualized.
C Total returns would have been lower if certain expenses had not been reduced during the applicable periods shown.
D Calculated based on average shares outstanding during the period.
E Fees and expenses of any underlying Fidelity Central Funds are not included in the Fund's expense ratio. The Fund indirectly bears its proportionate share of the expenses of any underlying Fidelity Central Funds.
F Amount does not include the portfolio activity of any underlying Fidelity Central Funds.
G For the period December 6, 2012 (commencement of operations) to December 31, 2012.
H Expense ratios reflect operating expenses of the Fund. Expenses before reductions do not reflect amounts reimbursed by the investment adviser or reductions from brokerage service arrangements or reductions from other expense offset arrangements and do not represent the amount paid by the Fund during periods when reimbursements or reductions occur. Expense ratios before reductions for start-up periods may not be representative of longer term operating periods. Expenses net of fee waivers reflect expenses after reimbursement by the investment adviser but prior to reductions from brokerage service arrangements or other expense offset arrangements. Expenses net of all reductions represent the net expenses paid by the Fund.
I Amount not annualized.
See accompanying notes which are an integral part of the financial statements.
Semiannual Report
Notes to Financial Statements
For the period ended December 31, 2012 (Unaudited)
1. Organization.
Fidelity Advisor® Series Mega Cap Fund (the Fund) is a fund of Fidelity Hastings Street Trust (the Trust) and is authorized to issue an unlimited number of shares. Shares of the Fund are only available for purchase by mutual funds for which Fidelity Management & Research Company (FMR) or an affiliate serves as an investment manager. The Trust is registered under the Investment Company Act of 1940, as amended (the 1940 Act), as an open-end management investment company organized as a Massachusetts business trust.
2. Investments in Fidelity Central Funds.
The Fund invests in Fidelity Central Funds, which are open-end investment companies available only to other investment companies and accounts managed by FMR and its affiliates. The Fund's Schedule of Investments lists each of the Fidelity Central Funds held as of period end, if any, as an investment of the Fund, but does not include the underlying holdings of each Fidelity Central Fund. As an Investing Fund, the Fund indirectly bears its proportionate share of the expenses of the underlying Fidelity Central Funds.
The Money Market Central Funds seek preservation of capital and current income and are managed by Fidelity Investments Money Management, Inc. (FIMM), an affiliate of FMR.
A complete unaudited list of holdings for each Fidelity Central Fund is available upon request or at the Securities and Exchange Commission (the SEC) website at www.sec.gov. In addition, the financial statements of the Fidelity Central Funds are available on the SEC website or upon request.
3. Significant Accounting Policies.
The financial statements have been prepared in conformity with accounting principles generally accepted in the United States of America (GAAP), which require management to make certain estimates and assumptions at the date of the financial statements. Actual results could differ from those estimates. Subsequent events, if any, through the date that the financial statements were issued have been evaluated in the preparation of the financial statements. The following summarizes the significant accounting policies of the Fund:
Semiannual Report
Notes to Financial Statements (Unaudited) - continued
3. Significant Accounting Policies - continued
Investment Valuation. Investments are valued as of 4:00 p.m. Eastern time on the last calendar day of the period. In accordance with valuation policies and procedures approved by the Board of Trustees (the Board), the Fund attempts to obtain prices from one or more third party pricing vendors or brokers to value its investments. When current market prices, quotations or rates are not readily available or reliable, investments will be fair valued in good faith by the FMR Fair Value Committee (the Committee), in accordance with procedures adopted by the Fund's Board. Factors used in determining fair value vary by investment type and may include market or investment specific events. The frequency with which these procedures are used cannot be predicted and they may be utilized to a significant extent. The Committee oversees the Fund's valuation policies and procedures and is responsible for approving and reporting to the Board all fair value determinations.
The Fund categorizes the inputs to valuation techniques used to value its investments into a disclosure hierarchy consisting of three levels as shown below:
Level 1 - quoted prices in active markets for identical investments
Level 2 - other significant observable inputs (including quoted prices for similar investments, interest rates, prepayment speeds, etc.)
Level 3 - unobservable inputs (including the Fund's own assumptions based on the best information available)
Valuation techniques used to value the Fund's investments by major category are as follows:
Equity securities, including restricted securities, for which market quotations are readily available, are valued at the last reported sale price or official closing price as reported by a third party pricing vendor on the primary market or exchange on which they are traded and are categorized as Level 1 in the hierarchy. In the event there were no sales during the day or closing prices are not available, securities are valued at the last quoted bid price or may be valued using the last available price and are generally categorized as Level 2 in the hierarchy. For foreign equity securities, when significant market or security specific events arise, comparisons to the valuation of American Depositary Receipts (ADRs), futures contracts, Exchange-Traded Funds (ETFs) and certain indexes as well as quoted prices for similar securities are used and are categorized as Level 2 in the hierarchy. Utilizing these techniques may result in transfers between Level 1 and Level 2.
Investments in open-end mutual funds, including the Fidelity Central Funds, are valued at their closing net asset value (NAV) each business day and are categorized as Level 1 in the hierarchy.
Changes in valuation techniques may result in transfers in or out of an assigned level within the disclosure hierarchy.
Semiannual Report
3. Significant Accounting Policies - continued
Foreign Currency. The Fund may use foreign currency contracts to facilitate transactions in foreign-denominated securities. Gains and losses from these transactions may arise from changes in the value of the foreign currency or if the counterparties do not perform under the contracts' terms.
Foreign-denominated assets, including investment securities, and liabilities are translated into U.S. dollars at the exchange rates at period end. Purchases and sales of investment securities, income and dividends received and expenses denominated in foreign currencies are translated into U.S. dollars at the exchange rate in effect on the transaction date.
The effects of exchange rate fluctuations on investments are included with the net realized and unrealized gain (loss) on investment securities. Other foreign currency transactions resulting in realized and unrealized gain (loss) are disclosed separately.
Investment Transactions and Income. For financial reporting purposes, the Fund's investment holdings and NAV include trades executed through the end of the last business day of the period. The NAV per share for processing shareholder transactions is calculated as of the close of business of the New York Stock Exchange (NYSE), normally 4:00 p.m. Eastern time and includes trades executed through the end of the prior business day. Gains and losses on securities sold are determined on the basis of identified cost. Dividend income is recorded on the ex-dividend date, except for certain dividends from foreign securities where the ex-dividend date may have passed, which are recorded as soon as the Fund is informed of the ex-dividend date. Non-cash dividends included in dividend income, if any, are recorded at the fair market value of the securities received. Distributions received on securities that represent a return of capital or capital gain are recorded as a reduction of cost of investments and/or as a realized gain. The Fund estimates the components of distributions received that may be considered return of capital distributions or capital gain distributions. Interest income and distributions from the Fidelity Central Funds are accrued as earned. Investment income is recorded net of foreign taxes withheld where recovery of such taxes is uncertain.
Expenses. Expenses directly attributable to a fund are charged to that fund. Expenses attributable to more than one fund are allocated among the respective funds on the basis of relative net assets or other appropriate methods. Expense estimates are accrued in the period to which they relate and adjustments are made when actual amounts are known.
Income Tax Information and Distributions to Shareholders. Each year, the Fund intends to qualify as a regulated investment company under Subchapter M of the Internal Revenue Code, including distributing substantially all of its taxable income and realized gains. As a result, no provision for income taxes is required. The Fund files a U.S. federal tax return, in addition to state and local tax returns as required. A fund's federal
Semiannual Report
Notes to Financial Statements (Unaudited) - continued
3. Significant Accounting Policies - continued
Income Tax Information and Distributions to Shareholders - continued
income tax returns are subject to examination by the Internal Revenue Service (IRS) for a period of three fiscal years after they are filed. State and local tax returns may be subject to examination for an additional fiscal year depending on the jurisdiction. Foreign taxes are provided for based on the Fund's understanding of the tax rules and rates that exist in the foreign markets in which it invests.
Distributions are declared and recorded on the ex-dividend date. Income and capital gain distributions are determined in accordance with income tax regulations, which may differ from GAAP.
Capital accounts within the financial statements are adjusted for permanent book-tax differences. These adjustments have no impact on net assets or the results of operations. Temporary book-tax differences will reverse in a subsequent period.
The federal tax cost of investment securities and unrealized appreciation (depreciation) as of period end were as follows:
Gross unrealized appreciation | $ 2,485,111 |
Gross unrealized depreciation | (1,509,396) |
Net unrealized appreciation (depreciation) on securities and other investments | $ 975,715 |
|
|
Tax cost | $ 150,464,792 |
4. Purchases and Sales of Investments.
Purchases and sales of securities, other than short-term securities, aggregated $165,803,283 and $16,042,325, respectively.
5. Fees and Other Transactions with Affiliates.
Management Fee. FMR and its affiliates provide the Fund with investment management related services for which the Fund pays a monthly management fee. The management fee is the sum of an individual fund fee rate that is based on an annual rate of .30% of the Fund's average net assets and an annualized group fee rate that averaged .26% during the period. The group fee rate is based upon the average net assets of all the mutual funds advised by FMR. The group fee rate decreases as assets under management increase and increases as assets under management decrease. In addition, the management fee is subject to a performance adjustment (up to a maximum of ± .20% of the
Semiannual Report
5. Fees and Other Transactions with Affiliates - continued
Management Fee - continued
Fund's average net assets over a 36 month performance period). The upward or downward adjustment to the management fee is based on the Fund's relative investment performance as compared to an appropriate benchmark index. The Fund's performance adjustment will not take effect until December 1, 2013. Subsequent months will be added until the performance period includes 36 months. For the period, the total annualized management fee rate was .56% of the Fund's average net assets.
Transfer Agent Fees. Fidelity Investments Institutional Operations Company, Inc. (FIIOC), an affiliate of FMR, is the Fund's transfer, dividend disbursing and shareholder servicing agent. FIIOC receives account fees and asset-based fees that vary according to account size and type of account. FIIOC pays for typesetting, printing and mailing of shareholder reports, except proxy statements. For the period, the transfer agent fees were equivalent to an annualized rate of .21% of average net assets.
Accounting Fees. Fidelity Service Company, Inc.(FSC), an affiliate of FMR, maintains the Fund's accounting records. The fee is based on the level of average net assets for each month.
Brokerage Commissions. The Fund placed a portion of its portfolio transactions with brokerage firms which are affiliates of the investment adviser. The commissions paid to these affiliated firms were $263 for the period.
Exchanges In-Kind. During the period, certain investment companies managed by FMR or its affiliates (Investing Funds) completed exchanges in-kind with the Fund. The Investing Funds delivered cash and securities valued at $151,144,783 in exchange for 15,114,478 shares of the Fund. The amount of in-kind exchanges is included in share transactions in the accompanying Statement of Changes in Net Assets. The Fund recognized no gain or loss for federal income tax purposes.
6. Expense Reductions.
FMR contractually agreed to reimburse the Fund to the extent annual operating expenses exceeded .90% of average net assets. This reimbursement will remain in place through February 28, 2014. Some expenses, for example interest expense, are excluded from this reimbursement. During the period this reimbursement reduced the Fund's expenses by $16,938.
Many of the brokers with whom FMR places trades on behalf of the Fund provided services to the Fund in addition to trade execution. These services included payments of certain expenses on behalf of the Fund totaling $102 for the period.
Semiannual Report
Notes to Financial Statements (Unaudited) - continued
7. Other.
The Fund's organizational documents provide former and current trustees and officers with a limited indemnification against liabilities arising in connection with the performance of their duties to the Fund. In the normal course of business, the Fund may also enter into contracts that provide general indemnifications. The Fund's maximum exposure under these arrangements is unknown as this would be dependent on future claims that may be made against the Fund. The risk of material loss from such claims is considered remote.
At the end of the period, mutual funds managed by FMR or an FMR affiliate were the owners of record of all of the outstanding shares of the Fund.
Semiannual Report
Board Approval of Investment Advisory Contracts and Management Fees
Fidelity Advisor Series Mega Cap Fund
On September 19, 2012, the Board of Trustees, including the Independent Trustees (together, the Board), voted to approve the management contract and sub-advisory agreements (together, the Advisory Contracts) for the fund. The Board, assisted by the advice of fund counsel and Independent Trustees' counsel, considered a broad range of information.
Nature, Extent, and Quality of Services Provided. The Board considered the staffing within the investment adviser, FMR, and the sub-advisers (together, the Investment Advisers), including the backgrounds of the fund's investment personnel, and also considered the fund's investment objective, strategies, and related investment philosophy. The Board considered the structure of the portfolio manager compensation program and whether this structure provides appropriate incentives to act in the best interests of the fund.
Resources Dedicated to Investment Management and Support Services. The Board and the Fund Oversight and Research Committees reviewed the general qualifications and capabilities of the Investment Advisers' investment staff, including its size, education, experience, and resources, as well as the Investment Advisers' approach to recruiting, training, managing, and compensating investment personnel. The Board also noted that FMR has continued to increase the resources devoted to non-U.S. offices, including expansion of Fidelity's global investment organization. The Board noted that Fidelity's analysts have extensive resources, tools and capabilities that allow them to conduct sophisticated quantitative and fundamental analysis, as well as credit analysis of issuers, counterparties and guarantors. The Board also believes that Fidelity's investment professionals have sufficient access to global information and data so as to provide competitive investment results over time, and that those professionals also have access to sophisticated tools that permit them to assess portfolio construction and risk and performance attribution characteristics continuously, as well as to transmit new information and research conclusions rapidly around the world. Additionally, in its deliberations, the Board considered the Investment Advisers' trading and risk management capabilities and resources, which are an integral part of the investment management process.
Shareholder and Administrative Services. The Board considered the nature, extent, quality, and cost of advisory, administrative, and shareholder services to be performed by the Investment Advisers and their affiliates under the Advisory Contracts and under separate agreements covering transfer agency, pricing and bookkeeping, and securities lending services for the fund. The Board also considered the nature and extent of the supervision of third party service providers, principally custodians and subcustodians.
The Board noted that the growth of fund assets over time across the complex allows Fidelity to reinvest in the development of services designed to enhance the value or convenience of the Fidelity funds as investment vehicles. These services include 24-hour access to account information and market information through telephone representatives and over the Internet, investor education materials and asset allocation tools, and the expanded availability of Fidelity Investor Centers.
Semiannual Report
Investment Performance. The fund is a new fund and therefore had no historical performance for the Board to review at the time it approved the fund's Advisory Contracts. The Board considered the Investment Advisers' strength in fundamental, research-driven Growth & Capital Appreciation selection, which the Board is familiar with through its supervision of other Fidelity funds that invest in such securities.
Based on its review, the Board concluded that the nature, extent, and quality of services to be provided to the fund under the Advisory Contracts should benefit the fund's shareholders.
Competitiveness of Management Fee and Total Expense Ratio. The Board considered the fund's proposed management fee and the projected total expense ratio of the fund in reviewing the Advisory Contracts. The Board noted that the fund's proposed management fee rate is lower than the median fee rate of funds with similar Lipper investment objective categories and comparable management fee characteristics. The Board also considered that the projected total expense ratios are comparable to those of similar classes and funds that Fidelity offers to shareholders.
The Board also noted that FMR had contractually agreed to reimburse Fidelity Advisor Series Mega Cap Fund to the extent total operating expenses (excluding interest, taxes, securities lending costs, brokerage commissions, extraordinary expenses, and acquired fund fees and expenses, if any), as a percentage of its average net assets exceed a certain limit.
Based on its review, the Board concluded that the fund's management fee and projected total expense ratio were reasonable in light of the services that the fund and its shareholders will receive and the other factors considered.
Costs of the Services and Profitability. The fund is a new fund and therefore no revenue, cost, or profitability data was available for the Board to review in respect of the fund at the time it approved the Advisory Contracts. In connection with its future renewal of the fund's Advisory Contracts, the Board will consider the revenues earned and the expenses incurred by Fidelity in conducting the business of developing, marketing, distributing, managing, administering and servicing the fund and its shareholders.
Economies of Scale. The Board will consider economies of scale when there is operating experience to permit assessment thereof. It noted that, notwithstanding the entrepreneurial risk associated with a new fund, the management fee was at a level normally associated, by comparison with competitors, with very high fund net assets, and Fidelity asserted to the Board that the level of the fee anticipated economies of scale at lower asset levels even before, if ever, economies of scale are achieved. The Board also noted that the fund and its shareholders would have access to the very considerable number and variety of services available through Fidelity and its affiliates.
Semiannual Report
Board Approval of Investment Advisory Contracts and
Management Fees - continued
Based on its evaluation of all of the conclusions noted above, and after considering all factors it believed relevant, the Board ultimately concluded that the advisory fee structures are fair and reasonable, and that the fund's Advisory Contracts should be approved.
Semiannual Report
Investment Adviser
Fidelity Management & Research Company
Boston, MA
Investment Sub-Advisers
FMR Co., Inc.
Fidelity Management & Research
(U.K.) Inc.
Fidelity Management & Research
(Japan), Inc.
Fidelity Management & Research
(Hong Kong) Limited
General Distributor
Fidelity Distributors Corporation
Smithfield, RI
Transfer and Service Agents
Fidelity Investments Institutional Operations Company, Inc.
Boston, MA
Fidelity Service Company, Inc.
Boston, MA
Custodian
The Northern Trust Company
Chicago, IL
(Fidelity Investment logo)(registered trademark)
AMHTI-SANN-0213
1.950944.100
Fidelity®
Series Mega Cap
Fund
Fidelity Series Mega Cap Fund
Class F
Semiannual Report
December 31, 2012
(Fidelity Cover Art)
Contents
Shareholder Expense Example | An example of shareholder expenses. | |
Investment Summary | A summary of the fund's holdings. | |
Investments | A complete list of the fund's investments with their market values. | |
Financial Statements | Statements of assets and liabilities, operations, and changes in net assets, as well as financial highlights. | |
Notes | Notes to the financial statements. | |
Board Approval of Investment Advisory Contracts and Management Fees |
|
To view a fund's proxy voting guidelines and proxy voting record for the 12-month period ended June 30, visit http://www.fidelity.com/proxyvotingresults or visit the Securities and Exchange Commission's (SEC) web site at http://www.sec.gov. You may also call 1-800-544-8544 for Fidelity Series Mega Cap Fund or 1-800-835-5092 for Class F of the fund to request a free copy of the proxy voting guidelines.
Standard & Poor's, S&P and S&P 500 are registered service marks of The McGraw-Hill Companies, Inc. and have been licensed for use by Fidelity Distributors Corporation.
Other third party marks appearing herein are the property of their respective owners.
All other marks appearing herein are registered or unregistered trademarks or service marks of FMR LLC or an affiliated company. © 2013 FMR LLC. All rights reserved.
This report and the financial statements contained herein are submitted for the general information of the shareholders of the fund. This report is not authorized for distribution to prospective investors in the fund unless preceded or accompanied by an effective prospectus.
A fund files its complete schedule of portfolio holdings with the SEC for the first and third quarters of each fiscal year on Form N-Q. Forms N-Q are available on the SEC's web site at http://www.sec.gov. A fund's Forms N-Q may be reviewed and copied at the SEC's Public Reference Room in Washington, DC. Information regarding the operation of the SEC's Public Reference Room may be obtained by calling 1-800-SEC-0330. For a complete list of a fund's portfolio holdings, view the most recent holdings listing, semiannual report, or annual report on Fidelity's web site at http://www.fidelity.com, http://www.advisor.fidelity.com, or http://www.401k.com, as applicable.
NOT FDIC INSURED • MAY LOSE VALUE • NO BANK GUARANTEE
Neither the fund nor Fidelity Distributors Corporation is a bank.
Semiannual Report
Shareholder Expense Example
As a shareholder of the Fund, you incur two types of costs: (1) transaction costs and (2) ongoing costs, including management fees and other Fund expenses. This Example is intended to help you understand your ongoing costs (in dollars) of investing in the Fund and to compare these costs with the ongoing costs of investing in other mutual funds.
The actual expense Example is based on an investment of $1,000 invested at the beginning of the period and held for the entire period (December 6, 2012 to December 31, 2012). The hypothetical expense Example is based on an investment of $1,000 invested for the one-half year period (July 1, 2012 to December 31, 2012).
Actual Expenses
The first line of the accompanying table for each class of the Fund provides information about actual account values and actual expenses. You may use the information in this line, together with the amount you invested, to estimate the expenses that you paid over the period. Simply divide your account value by $1,000.00 (for example, an $8,600 account value divided by $1,000.00 = 8.6), then multiply the result by the number in the first line for a class of the Fund under the heading entitled "Expenses Paid During Period" to estimate the expenses you paid on your account during this period. In addition, the Fund, as a shareholder in the underlying Fidelity Central Funds, will indirectly bear its pro-rata share of the fees and expenses incurred by the underlying Fidelity Central Funds. These fees and expenses are not included in the Fund's annualized expense ratio used to calculate the expense estimate in the table below.
Hypothetical Example for Comparison Purposes
The second line of the accompanying table for each class of the Fund provides information about hypothetical account values and hypothetical expenses based on a Class' actual expense ratio and an assumed rate of return of 5% per year before expenses, which is not the Class' actual return. The hypothetical account values and expenses may not be used to estimate the actual ending account balance or expenses you paid for the period. You may use this information to compare the ongoing costs of investing in the Fund and other funds. To do so, compare this 5% hypothetical example with the 5% hypothetical examples that appear in the shareholder reports of the other funds. In addition, the Fund, as a shareholder in the underlying Fidelity Central Funds, will indirectly bear its pro-rata share of the fees and expenses incurred by the underlying Fidelity Central Funds. These fees and expenses are not included in the Fund's annualized expense ratio used to calculate the expense estimate in the table below.
Please note that the expenses shown in the table are meant to highlight your ongoing costs only and do not reflect any transaction costs. Therefore, the second line of the table is useful in comparing ongoing costs only, and will not help you determine the relative total costs of owning different funds.
Semiannual Report
Shareholder Expense Example - continued
| Annualized | Beginning | Ending | Expenses Paid |
Series Mega Cap | .82% |
|
|
|
Actual |
| $ 1,000.00 | $ 1,004.00 | $ .59 B |
HypotheticalA |
| $ 1,000.00 | $ 1,021.07 | $ 4.18 C |
Class F | .62% |
|
|
|
Actual |
| $ 1,000.00 | $ 1,004.10 | $ .44 B |
HypotheticalA |
| $ 1,000.00 | $ 1,022.08 | $ 3.16 C |
A 5% return per year before expenses
B Actual expenses are equal to each Class' annualized expense ratio, multiplied by the average account value over the period, multiplied by 26/365 (to reflect the period December 6, 2012 to December 31, 2012).
C Hypothetical expenses are equal to each Class' annualized expense ratio, multiplied by the average account value over the period, multiplied by 184/365 (to reflect the one-half year period).
Semiannual Report
Investment Summary (Unaudited)
Top Ten Stocks as of December 31, 2012 | |
| % of fund's |
Apple, Inc. | 5.3 |
JPMorgan Chase & Co. | 4.2 |
Exxon Mobil Corp. | 3.9 |
Wells Fargo & Co. | 3.7 |
Chevron Corp. | 3.3 |
General Electric Co. | 3.2 |
Google, Inc. Class A | 2.6 |
Procter & Gamble Co. | 2.5 |
Microsoft Corp. | 2.4 |
Merck & Co., Inc. | 2.3 |
| 33.4 |
Top Five Market Sectors as of December 31, 2012 | |
| % of fund's |
Information Technology | 19.9 |
Financials | 18.5 |
Health Care | 12.7 |
Energy | 12.4 |
Consumer Discretionary | 11.9 |
Asset Allocation (% of fund's net assets) | |||||||
As of December 31, 2012* |
| ||||||
 | Stocks 99.7% |
|  |
|
| ||
 | Convertible |
| |
|
| ||
 | Short-Term Investments and Net Other Assets (Liabilities) 0.2% |
| |
|
| ||
* Foreign investments | 1.1% |
|
|
|
| ||

Semiannual Report
Investments December 31, 2012 (Unaudited)
Showing Percentage of Net Assets
Common Stocks - 99.7% | |||
Shares | Value | ||
CONSUMER DISCRETIONARY - 11.9% | |||
Auto Components - 0.5% | |||
Johnson Controls, Inc. | 302,600 | $ 9,289,820 | |
Automobiles - 0.6% | |||
Ford Motor Co. | 794,600 | 10,290,070 | |
Hotels, Restaurants & Leisure - 0.9% | |||
McDonald's Corp. | 145,100 | 12,799,271 | |
Yum! Brands, Inc. | 63,400 | 4,209,760 | |
| 17,009,031 | ||
Internet & Catalog Retail - 0.1% | |||
priceline.com, Inc. (a) | 4,400 | 2,733,280 | |
Media - 5.9% | |||
Comcast Corp. Class A (special) (non-vtg.) | 1,146,300 | 41,209,485 | |
News Corp. Class A | 246,100 | 6,285,394 | |
The Walt Disney Co. | 259,500 | 12,920,505 | |
Thomson Reuters Corp. | 113,000 | 3,269,468 | |
Time Warner Cable, Inc. | 59,680 | 5,800,299 | |
Time Warner, Inc. | 623,500 | 29,822,005 | |
Viacom, Inc. Class B (non-vtg.) | 193,300 | 10,194,642 | |
| 109,501,798 | ||
Multiline Retail - 1.6% | |||
Target Corp. | 510,700 | 30,218,119 | |
Specialty Retail - 2.3% | |||
Home Depot, Inc. | 140,495 | 8,689,616 | |
Lowe's Companies, Inc. | 951,900 | 33,811,488 | |
| 42,501,104 | ||
TOTAL CONSUMER DISCRETIONARY | 221,543,222 | ||
CONSUMER STAPLES - 10.6% | |||
Beverages - 3.1% | |||
PepsiCo, Inc. | 323,100 | 22,109,733 | |
The Coca-Cola Co. | 974,100 | 35,311,125 | |
| 57,420,858 | ||
Food & Staples Retailing - 2.3% | |||
CVS Caremark Corp. | 280,600 | 13,567,010 | |
Kroger Co. | 136,100 | 3,541,322 | |
Walgreen Co. | 711,000 | 26,314,110 | |
| 43,422,442 | ||
Food Products - 0.7% | |||
Kellogg Co. | 241,260 | 13,474,371 | |
Common Stocks - continued | |||
Shares | Value | ||
CONSUMER STAPLES - continued | |||
Household Products - 3.7% | |||
Colgate-Palmolive Co. | 30,200 | $ 3,157,108 | |
Kimberly-Clark Corp. | 230,700 | 19,478,001 | |
Procter & Gamble Co. | 672,400 | 45,649,236 | |
| 68,284,345 | ||
Tobacco - 0.8% | |||
Altria Group, Inc. | 92,700 | 2,912,634 | |
Lorillard, Inc. | 45,100 | 5,261,817 | |
Philip Morris International, Inc. | 75,400 | 6,306,456 | |
| 14,480,907 | ||
TOTAL CONSUMER STAPLES | 197,082,923 | ||
ENERGY - 12.4% | |||
Energy Equipment & Services - 2.2% | |||
Halliburton Co. | 535,700 | 18,583,433 | |
National Oilwell Varco, Inc. | 107,000 | 7,313,450 | |
Schlumberger Ltd. | 228,700 | 15,846,623 | |
| 41,743,506 | ||
Oil, Gas & Consumable Fuels - 10.2% | |||
Apache Corp. | 222,000 | 17,427,000 | |
Chevron Corp. | 567,800 | 61,401,892 | |
Exxon Mobil Corp. | 831,400 | 71,957,670 | |
Occidental Petroleum Corp. | 382,200 | 29,280,342 | |
The Williams Companies, Inc. | 263,700 | 8,633,538 | |
| 188,700,442 | ||
TOTAL ENERGY | 230,443,948 | ||
FINANCIALS - 18.5% | |||
Capital Markets - 2.8% | |||
BlackRock, Inc. Class A | 36,600 | 7,565,586 | |
Charles Schwab Corp. | 1,268,500 | 18,215,660 | |
Morgan Stanley | 1,337,300 | 25,569,176 | |
State Street Corp. | 20,100 | 944,901 | |
| 52,295,323 | ||
Commercial Banks - 5.5% | |||
BB&T Corp. | 128,400 | 3,737,724 | |
PNC Financial Services Group, Inc. | 201,800 | 11,766,958 | |
Common Stocks - continued | |||
Shares | Value | ||
FINANCIALS - continued | |||
Commercial Banks - continued | |||
U.S. Bancorp | 576,600 | $ 18,416,604 | |
Wells Fargo & Co. | 1,978,100 | 67,611,458 | |
| 101,532,744 | ||
Diversified Financial Services - 8.3% | |||
Bank of America Corp. | 2,360,600 | 27,382,960 | |
Citigroup, Inc. | 1,053,408 | 41,672,820 | |
CME Group, Inc. | 122,600 | 6,217,046 | |
JPMorgan Chase & Co. | 1,791,800 | 78,785,446 | |
| 154,058,272 | ||
Insurance - 1.9% | |||
AFLAC, Inc. | 88,650 | 4,709,088 | |
American International Group, Inc. (a) | 139,200 | 4,913,760 | |
MetLife, Inc. | 644,100 | 21,216,654 | |
Prudential Financial, Inc. | 93,300 | 4,975,689 | |
| 35,815,191 | ||
TOTAL FINANCIALS | 343,701,530 | ||
HEALTH CARE - 12.7% | |||
Biotechnology - 0.9% | |||
Amgen, Inc. | 196,400 | 16,953,248 | |
Health Care Equipment & Supplies - 0.9% | |||
Baxter International, Inc. | 112,200 | 7,479,252 | |
Stryker Corp. | 157,200 | 8,617,704 | |
| 16,096,956 | ||
Health Care Providers & Services - 3.5% | |||
Aetna, Inc. | 261,300 | 12,098,190 | |
Cardinal Health, Inc. | 129,400 | 5,328,692 | |
McKesson Corp. | 240,600 | 23,328,576 | |
UnitedHealth Group, Inc. | 118,600 | 6,432,864 | |
WellPoint, Inc. | 305,400 | 18,604,968 | |
| 65,793,290 | ||
Life Sciences Tools & Services - 0.4% | |||
Thermo Fisher Scientific, Inc. | 108,200 | 6,900,996 | |
Pharmaceuticals - 7.0% | |||
Abbott Laboratories | 264,900 | 17,350,950 | |
Eli Lilly & Co. | 273,600 | 13,493,952 | |
Johnson & Johnson | 516,000 | 36,171,600 | |
Common Stocks - continued | |||
Shares | Value | ||
HEALTH CARE - continued | |||
Pharmaceuticals - continued | |||
Merck & Co., Inc. | 1,030,000 | $ 42,168,200 | |
Pfizer, Inc. | 837,400 | 21,001,992 | |
| 130,186,694 | ||
TOTAL HEALTH CARE | 235,931,184 | ||
INDUSTRIALS - 9.1% | |||
Aerospace & Defense - 2.6% | |||
Honeywell International, Inc. | 124,000 | 7,870,280 | |
Precision Castparts Corp. | 4,900 | 928,158 | |
Raytheon Co. | 158,800 | 9,140,528 | |
The Boeing Co. | 203,093 | 15,305,088 | |
United Technologies Corp. | 182,500 | 14,966,825 | |
| 48,210,879 | ||
Air Freight & Logistics - 1.4% | |||
United Parcel Service, Inc. Class B | 365,900 | 26,977,807 | |
Electrical Equipment - 0.3% | |||
Emerson Electric Co. | 118,400 | 6,270,464 | |
Industrial Conglomerates - 3.6% | |||
Danaher Corp. | 144,700 | 8,088,730 | |
General Electric Co. | 2,777,200 | 58,293,428 | |
| 66,382,158 | ||
Machinery - 0.6% | |||
Cummins, Inc. | 30,000 | 3,250,500 | |
Illinois Tool Works, Inc. | 129,700 | 7,887,057 | |
| 11,137,557 | ||
Road & Rail - 0.6% | |||
Norfolk Southern Corp. | 40,810 | 2,523,690 | |
Union Pacific Corp. | 65,500 | 8,234,660 | |
| 10,758,350 | ||
TOTAL INDUSTRIALS | 169,737,215 | ||
INFORMATION TECHNOLOGY - 19.9% | |||
Communications Equipment - 2.6% | |||
Cisco Systems, Inc. | 1,582,700 | 31,100,055 | |
QUALCOMM, Inc. | 263,500 | 16,342,270 | |
| 47,442,325 | ||
Common Stocks - continued | |||
Shares | Value | ||
INFORMATION TECHNOLOGY - continued | |||
Computers & Peripherals - 5.9% | |||
Apple, Inc. | 183,281 | $ 97,694,273 | |
Dell, Inc. | 436,300 | 4,419,719 | |
EMC Corp. (a) | 329,900 | 8,346,470 | |
| 110,460,462 | ||
Internet Software & Services - 2.6% | |||
Google, Inc. Class A (a) | 68,700 | 48,733,719 | |
IT Services - 4.2% | |||
Accenture PLC Class A | 35,700 | 2,374,050 | |
Automatic Data Processing, Inc. | 22,572 | 1,286,830 | |
Cognizant Technology Solutions Corp. Class A (a) | 212,600 | 15,743,030 | |
IBM Corp. | 83,700 | 16,032,735 | |
MasterCard, Inc. Class A | 48,700 | 23,925,336 | |
Visa, Inc. Class A | 125,200 | 18,977,816 | |
| 78,339,797 | ||
Semiconductors & Semiconductor Equipment - 0.3% | |||
Broadcom Corp. Class A | 170,100 | 5,649,021 | |
Software - 4.3% | |||
Adobe Systems, Inc. (a) | 154,600 | 5,825,328 | |
Microsoft Corp. | 1,660,800 | 44,393,184 | |
Oracle Corp. | 494,300 | 16,470,076 | |
salesforce.com, Inc. (a) | 43,100 | 7,245,110 | |
VMware, Inc. Class A (a) | 55,700 | 5,243,598 | |
| 79,177,296 | ||
TOTAL INFORMATION TECHNOLOGY | 369,802,620 | ||
MATERIALS - 1.7% | |||
Chemicals - 1.7% | |||
Air Products & Chemicals, Inc. | 103,300 | 8,679,266 | |
E.I. du Pont de Nemours & Co. | 253,600 | 11,404,392 | |
Monsanto Co. | 56,200 | 5,319,330 | |
The Dow Chemical Co. | 210,900 | 6,816,288 | |
| 32,219,276 | ||
TELECOMMUNICATION SERVICES - 1.5% | |||
Diversified Telecommunication Services - 1.5% | |||
Verizon Communications, Inc. | 621,400 | 26,887,978 | |
Common Stocks - continued | |||
Shares | Value | ||
UTILITIES - 1.4% | |||
Electric Utilities - 1.3% | |||
Duke Energy Corp. | 113,300 | $ 7,228,540 | |
FirstEnergy Corp. | 295,000 | 12,319,200 | |
NextEra Energy, Inc. | 63,300 | 4,379,727 | |
| 23,927,467 | ||
Multi-Utilities - 0.1% | |||
PG&E Corp. | 65,500 | 2,631,790 | |
TOTAL UTILITIES | 26,559,257 | ||
TOTAL COMMON STOCKS (Cost $1,849,645,589) | 1,853,909,153 | ||
Convertible Preferred Stocks - 0.1% | |||
|
|
|
|
INDUSTRIALS - 0.1% | |||
Aerospace & Defense - 0.1% | |||
United Technologies Corp. 7.50% (Cost $1,828,186) | 33,000 | 1,838,430 | |
Money Market Funds - 0.3% | |||
|
|
|
|
Fidelity Cash Central Fund, 0.18% (b) | 4,713,149 | 4,713,149 | |
TOTAL INVESTMENT PORTFOLIO - 100.1% (Cost $1,856,186,924) | 1,860,460,732 | ||
NET OTHER ASSETS (LIABILITIES) - (0.1)% | (1,850,223) | ||
NET ASSETS - 100% | $ 1,858,610,509 | ||
Legend |
(a) Non-income producing |
(b) Affiliated fund that is available only to investment companies and other accounts managed by Fidelity Investments. The rate quoted is the annualized seven-day yield of the fund at period end. A complete unaudited listing of the fund's holdings as of its most recent quarter end is available upon request. In addition, each Fidelity Central Fund's financial statements are available on the SEC's website or upon request. |
Affiliated Central Funds |
Information regarding fiscal year to date income earned by the Fund from investments in Fidelity Central Funds is as follows: |
Fund | Income earned |
Fidelity Cash Central Fund | $ 3,043 |
Other Information |
All investments are categorized as Level 1 under the Fair Value Hierarchy. The inputs or methodology used for valuing securities may not be an indication of the risk associated with investing in those securities. For more information on valuation inputs, please refer to the Investment Valuation section in the accompanying Notes to Financial Statements. |
See accompanying notes which are an integral part of the financial statements.
Semiannual Report
Financial Statements
Statement of Assets and Liabilities
| December 31, 2012 (Unaudited) | |
|
|
|
Assets | ||
Investment in securities, at value - See accompanying schedule: Unaffiliated issuers (cost $1,851,473,775) | $ 1,855,747,583 |
|
Fidelity Central Funds (cost $4,713,149) | 4,713,149 |
|
Total Investments (cost $1,856,186,924) |
| $ 1,860,460,732 |
Cash |
| 21,201 |
Foreign currency held at value (cost $17,845) | 17,790 | |
Receivable for investments sold | 27,529,212 | |
Receivable for fund shares sold | 60,455 | |
Dividends receivable | 1,678,043 | |
Distributions receivable from Fidelity Central Funds | 3,043 | |
Other receivables | 448 | |
Total assets | 1,889,770,924 | |
|
|
|
Liabilities | ||
Payable to custodian bank | $ 492,211 | |
Payable for investments purchased | 18,106,242 | |
Payable for fund shares redeemed | 11,721,791 | |
Accrued management fee | 650,543 | |
Other affiliated payables | 150,866 | |
Other payables and accrued expenses | 38,762 | |
Total liabilities | 31,160,415 | |
|
|
|
Net Assets | $ 1,858,610,509 | |
Net Assets consist of: |
| |
Paid in capital | $ 1,853,074,936 | |
Distributions in excess of net investment income | (326,950) | |
Accumulated undistributed net realized gain (loss) on investments and foreign currency transactions | 1,588,770 | |
Net unrealized appreciation (depreciation) on investments and assets and liabilities in foreign currencies | 4,273,753 | |
Net Assets | $ 1,858,610,509 | |
|
|
|
Series Mega Cap: | $ 10.03 | |
|
|
|
Class F: | $ 10.03 | |
See accompanying notes which are an integral part of the financial statements.
Semiannual Report
Statement of Operations
| For the period December 6, 2012 | |
|
|
|
Investment Income |
|
|
Dividends |
| $ 2,469,634 |
Interest |
| 60 |
Income from Fidelity Central Funds |
| 3,043 |
Total income |
| 2,472,737 |
|
|
|
Expenses | ||
Management fee | $ 650,543 | |
Transfer agent fees | 114,646 | |
Accounting fees and expenses | 36,220 | |
Custodian fees and expenses | 23,735 | |
Audit | 15,027 | |
Total expenses before reductions | 840,171 | |
Expense reductions | (448) | 839,723 |
Net investment income (loss) | 1,633,014 | |
Realized and Unrealized Gain (Loss) Net realized gain (loss) on: | ||
Investment securities: |
|
|
Unaffiliated issuers | 1,581,759 | |
Foreign currency transactions | 7,011 | |
Total net realized gain (loss) |
| 1,588,770 |
Change in net unrealized appreciation (depreciation) on: Investment securities | 4,273,808 | |
Assets and liabilities in foreign currencies | (55) | |
Total change in net unrealized appreciation (depreciation) |
| 4,273,753 |
Net gain (loss) | 5,862,523 | |
Net increase (decrease) in net assets resulting from operations | $ 7,495,537 | |
See accompanying notes which are an integral part of the financial statements.
Semiannual Report
Financial Statements - continued
Statement of Changes in Net Assets
| For the period |
Increase (Decrease) in Net Assets |
|
Operations |
|
Net investment income (loss) | $ 1,633,014 |
Net realized gain (loss) | 1,588,770 |
Change in net unrealized appreciation (depreciation) | 4,273,753 |
Net increase (decrease) in net assets resulting | 7,495,537 |
Distributions to shareholders from net investment income | (1,959,964) |
Share transactions - net increase (decrease) | 1,853,074,936 |
Total increase (decrease) in net assets | 1,858,610,509 |
|
|
Net Assets | |
Beginning of period | - |
End of period (including distributions in excess of net investment income of $326,950) | $ 1,858,610,509 |
See accompanying notes which are an integral part of the financial statements.
Semiannual Report
Financial Highlights - Series Mega Cap
| Period ended |
Selected Per-Share Data |
|
Net asset value, beginning of period | $ 10.00 |
Income from Investment Operations |
|
Net investment income (loss) D | .01 |
Net realized and unrealized gain (loss) | .03 |
Total from investment operations | .04 |
Distributions from net investment income | (.01) |
Net asset value, end of period | $ 10.03 |
Total Return B, C | .40% |
Ratios to Average Net Assets E, H |
|
Expenses before reductions | .82% A |
Expenses net of fee waivers, if any | .82% A |
Expenses net of all reductions | .82% A |
Net investment income (loss) | 1.29% A |
Supplemental Data |
|
Net assets, end of period (000 omitted) | $ 905,380 |
Portfolio turnover rate F | 32% I |
A Annualized
B Total returns for periods of less than one year are not annualized.
C Total returns would have been lower if certain expenses had not been reduced during the applicable periods shown.
D Calculated based on average shares outstanding during the period.
E Fees and expenses of any underlying Fidelity Central Funds are not included in the Fund's expense ratio. The Fund indirectly bears its proportionate share of the expenses of any underlying Fidelity Central Funds.
F Amount does not include the portfolio activity of any underlying Fidelity Central Funds.
G For the period December 6, 2012 (commencement of operations) to December 31, 2012.
H Expense ratios reflect operating expenses of the class. Expenses before reductions do not reflect amounts reimbursed by the investment adviser or reductions from brokerage service arrangements or reductions from other expense offset arrangements and do not represent the amount paid by the class during periods when reimbursements or reductions occur. Expense ratios before reductions for start-up periods may not be representative of longer-term operating periods. Expenses net of fee waivers reflect expenses after reimbursement by the investment adviser but prior to reductions from brokerage service arrangements or other expense offset arrangements. Expenses net of all reductions represent the net expenses paid by the class.
I Amount not annualized.
See accompanying notes which are an integral part of the financial statements.
Semiannual Report
Financial Highlights - Class F
| Period ended |
Selected Per-Share Data |
|
Net asset value, beginning of period | $ 10.00 |
Income from Investment Operations |
|
Net investment income (loss) D | .01 |
Net realized and unrealized gain (loss) | .03 |
Total from investment operations | .04 |
Distributions from net investment income | (.01) |
Net asset value, end of period | $ 10.03 |
Total Return B, C | .41% |
Ratios to Average Net Assets E, H |
|
Expenses before reductions | .62% A |
Expenses net of fee waivers, if any | .62% A |
Expenses net of all reductions | .62% A |
Net investment income (loss) | 1.49% A |
Supplemental Data |
|
Net assets, end of period (000 omitted) | $ 953,231 |
Portfolio turnover rate F | 32% I |
A Annualized
B Total returns for periods of less than one year are not annualized.
C Total returns would have been lower if certain expenses had not been reduced during the applicable periods shown.
D Calculated based on average shares outstanding during the period.
E Fees and expenses of any underlying Fidelity Central Funds are not included in the Fund's expense ratio. The Fund indirectly bears its proportionate share of the expenses of any underlying Fidelity Central Funds.
F Amount does not include the portfolio activity of any underlying Fidelity Central Funds.
G For the period December 6, 2012 (commencement of operations) to December 31, 2012.
H Expense ratios reflect operating expenses of the class. Expenses before reductions do not reflect amounts reimbursed by the investment adviser or reductions from brokerage service arrangements or reductions from other expense offset arrangements and do not represent the amount paid by the class during periods when reimbursements or reductions occur. Expense ratios before reductions for start-up periods may not be representative of longer-term operating periods. Expenses net of fee waivers reflect expenses after reimbursement by the investment adviser but prior to reductions from brokerage service arrangements or other expense offset arrangements. Expenses net of all reductions represent the net expenses paid by the class.
I Amount not annualized.
See accompanying notes which are an integral part of the financial statements.
Semiannual Report
Notes to Financial Statements
For the period ended December 31, 2012 (Unaudited)
1. Organization.
Fidelity® Series Mega Cap Fund (the Fund) is a fund of Fidelity Hastings Street Trust (the Trust) and is authorized to issue an unlimited number of shares. Shares of the Fund are only available for purchase by mutual funds for which Fidelity Management & Research Company (FMR) or an affiliate serves as an investment manager. The Trust is registered under the Investment Company Act of 1940, as amended (the 1940 Act), as an open-end management investment company organized as a Massachusetts business trust. The Fund offers Series Mega Cap and Class F shares, each of which has equal rights as to assets and voting privileges. Each class has exclusive voting rights with respect to matters that affect that class. Investment income, realized and unrealized capital gains and losses, the common expenses of the Fund, and certain fund-level expense reductions, if any, are allocated on a pro-rata basis to each class based on the relative net assets of each class to the total net assets of the Fund. Each class differs with respect to transfer agent fees incurred. Certain expense reductions may also differ by class.
2. Investments in Fidelity Central Funds.
The Fund invests in Fidelity Central Funds, which are open-end investment companies available only to other investment companies and accounts managed by FMR and its affiliates. The Fund's Schedule of Investments lists each of the Fidelity Central Funds held as of period end, if any, as an investment of the Fund, but does not include the underlying holdings of each Fidelity Central Fund. As an Investing Fund, the Fund indirectly bears its proportionate share of the expenses of the underlying Fidelity Central Funds.
The Money Market Central Funds seek preservation of capital and current income and are managed by Fidelity Investments Money Management, Inc. (FIMM), an affiliate of FMR.
A complete unaudited list of holdings for each Fidelity Central Fund is available upon request or at the Securities and Exchange Commission (the SEC) website at www.sec.gov. In addition, the financial statements of the Fidelity Central Funds are available on the SEC website or upon request.
3. Significant Accounting Policies.
The financial statements have been prepared in conformity with accounting principles generally accepted in the United States of America (GAAP), which require management to make certain estimates and assumptions at the date of the financial statements. Actual results could differ from those estimates. Subsequent events, if any, through the date that the financial statements were issued have been evaluated in the preparation of the financial statements. The following summarizes the significant accounting policies of the Fund:
Semiannual Report
3. Significant Accounting Policies - continued
Investment Valuation. Investments are valued as of 4:00 p.m. Eastern time on the last calendar day of the period. In accordance with valuation policies and procedures approved by the Board of Trustees (the Board), the Fund attempts to obtain prices from one or more third party pricing vendors or brokers to value its investments. When current market prices, quotations or rates are not readily available or reliable, investments will be fair valued in good faith by the FMR Fair Value Committee (the Committee), in accordance with procedures adopted by the Fund's Board. Factors used in determining fair value vary by investment type and may include market or investment specific events. The frequency with which these procedures are used cannot be predicted and they may be utilized to a significant extent. The Committee oversees the Fund's valuation policies and procedures and is responsible for approving and reporting to the Board all fair value determinations.
The Fund categorizes the inputs to valuation techniques used to value its investments into a disclosure hierarchy consisting of three levels as shown below:
Level 1 - quoted prices in active markets for identical investments
Level 2 - other significant observable inputs (including quoted prices for similar investments, interest rates, prepayment speeds, etc.)
Level 3 - unobservable inputs (including the Fund's own assumptions based on the best information available)
Valuation techniques used to value the Fund's investments by major category are as follows:
Equity securities, including restricted securities, for which market quotations are readily available, are valued at the last reported sale price or official closing price as reported by a third party pricing vendor on the primary market or exchange on which they are traded and are categorized as Level 1 in the hierarchy. In the event there were no sales during the day or closing prices are not available, securities are valued at the last quoted bid price or may be valued using the last available price and are generally categorized as Level 2 in the hierarchy. For foreign equity securities, when significant market or security specific events arise, comparisons to the valuation of American Depositary Receipts (ADRs), futures contracts, Exchange-Traded Funds (ETFs) and certain indexes as well as quoted prices for similar securities are used and are categorized as Level 2 in the hierarchy. Utilizing these techniques may result in transfers between Level 1 and Level 2.
Investments in open-end mutual funds, including the Fidelity Central Funds, are valued at their closing net asset value (NAV) each business day and are categorized as Level 1 in the hierarchy.
Changes in valuation techniques may result in transfers in or out of an assigned level within the disclosure hierarchy.
Semiannual Report
Notes to Financial Statements (Unaudited) - continued
3. Significant Accounting Policies - continued
Foreign Currency. The Fund may use foreign currency contracts to facilitate transactions in foreign-denominated securities. Gains and losses from these transactions may arise from changes in the value of the foreign currency or if the counterparties do not perform under the contracts' terms.
Foreign-denominated assets, including investment securities, and liabilities are translated into U.S. dollars at the exchange rates at period end. Purchases and sales of investment securities, income and dividends received and expenses denominated in foreign currencies are translated into U.S. dollars at the exchange rate in effect on the transaction date.
The effects of exchange rate fluctuations on investments are included with the net realized and unrealized gain (loss) on investment securities. Other foreign currency transactions resulting in realized and unrealized gain (loss) are disclosed separately.
Investment Transactions and Income. For financial reporting purposes, the Fund's investment holdings and NAV include trades executed through the end of the last business day of the period. The NAV per share for processing shareholder transactions is calculated as of the close of business of the New York Stock Exchange (NYSE), normally 4:00 p.m. Eastern time and includes trades executed through the end of the prior business day. Gains and losses on securities sold are determined on the basis of identified cost. Dividend income is recorded on the ex-dividend date, except for certain dividends from foreign securities where the ex-dividend date may have passed, which are recorded as soon as the Fund is informed of the ex-dividend date. Non-cash dividends included in dividend income, if any, are recorded at the fair market value of the securities received. Distributions received on securities that represent a return of capital or capital gain are recorded as a reduction of cost of investments and/or as a realized gain. The Fund estimates the components of distributions received that may be considered return of capital distributions or capital gain distributions. Interest income and distributions from the Fidelity Central Funds are accrued as earned. Interest income includes coupon interest and amortization of premium and accretion of discount on debt securities. Investment income is recorded net of foreign taxes withheld where recovery of such taxes is uncertain.
Expenses. Expenses directly attributable to a fund are charged to that fund. Expenses attributable to more than one fund are allocated among the respective funds on the basis of relative net assets or other appropriate methods. Expense estimates are accrued in the period to which they relate and adjustments are made when actual amounts are known.
Semiannual Report
3. Significant Accounting Policies - continued
Income Tax Information and Distributions to Shareholders. Each year, the Fund intends to qualify as a regulated investment company under Subchapter M of the Internal Revenue Code, including distributing substantially all of its taxable income and realized gains. As a result, no provision for income taxes is required. The Fund files a U.S. federal tax return, in addition to state and local tax returns as required. A fund's federal income tax returns are subject to examination by the Internal Revenue Service (IRS) for a period of three fiscal years after they are filed. State and local tax returns may be subject to examination for an additional fiscal year depending on the jurisdiction. Foreign taxes are provided for based on the Fund's understanding of the tax rules and rates that exist in the foreign markets in which it invests.
Distributions are declared and recorded on the ex-dividend date. Income dividends and capital gain distributions are declared separately for each class. Income and capital gain distributions are determined in accordance with income tax regulations, which may differ from GAAP.
Capital accounts within the financial statements are adjusted for permanent book-tax differences. These adjustments have no impact on net assets or the results of operations. Temporary book-tax differences will reverse in a subsequent period.
The federal tax cost of investment securities and unrealized appreciation (depreciation) as of period end were as follows:
Gross unrealized appreciation | $ 23,719,237 |
Gross unrealized depreciation | (19,843,356) |
Net unrealized appreciation (depreciation) on securities and other investments | $ 3,875,881 |
|
|
Tax cost | $ 1,856,584,851 |
4. Purchases and Sales of Investments.
Purchases and sales of securities, other than short-term securities, aggregated $2,446,480,496 and $596,577,493, respectively.
Semiannual Report
Notes to Financial Statements (Unaudited) - continued
5. Fees and Other Transactions with Affiliates.
Management Fee. FMR and its affiliates provide the Fund with investment management related services for which the Fund pays a monthly management fee. The management fee is the sum of an individual fund fee rate that is based on an annual rate of .30% of the Fund's average net assets and an annualized group fee rate that averaged .26% during the period. The group fee rate is based upon the average net assets of all the mutual funds advised by FMR. The group fee rate decreases as assets under management increase and increases as assets under management decrease. In addition, the management fee is subject to a performance adjustment (up to a maximum of ± .20% of the Fund's average net assets over a 36 month performance period). The upward or downward adjustment to the management fee is based on the relative investment performance of Series Mega Cap as compared to an appropriate benchmark index. The Fund's performance adjustment will not take effect until December 1, 2013. Subsequent months will be added until the performance period includes 36 months. For the period, the total annualized management fee rate was .56% of the Fund's average net assets.
Transfer Agent Fees. Fidelity Investments Institutional Operations Company, Inc. (FIIOC), an affiliate of FMR, is the transfer, dividend disbursing and shareholder servicing agent for each class of the Fund. FIIOC receives account fees and asset-based fees that vary according to the account size and type of account of the shareholders of Series Mega Cap. FIIOC receives no fees for providing transfer agency services to Class F. FIIOC pays for typesetting, printing and mailing of shareholder reports, except proxy statements. For the period, transfer agent fees for each applicable class were as follows:
| Amount | % of |
Series Mega Cap | $ 114,646 | .20 |
* Annualized
Accounting Fees. Fidelity Service Company, Inc.(FSC), an affiliate of FMR, maintains the Fund's accounting records. The fee is based on the level of average net assets for each month.
Brokerage Commissions. The Fund placed a portion of its portfolio transactions with brokerage firms which are affiliates of the investment adviser. The commissions paid to these affiliated firms were $12,723 for the period.
Semiannual Report
5. Fees and Other Transactions with Affiliates - continued
Exchanges In-Kind. During the period, certain investment companies managed by FMR or its affiliates (Investing Funds) completed exchanges in-kind with the Fund. The Investing Funds delivered cash and securities valued at $1,864,134,700 in exchange for 186,413,470 shares of the Fund. The amount of in-kind exchanges is included in share transactions in the accompanying Statement of Changes in Net Assets as well as Note 8: Share Transactions. The Fund recognized no gain or loss for federal income tax purposes.
6. Expense Reductions.
Many of the brokers with whom FMR places trades on behalf of the Fund provided services to the Fund in addition to trade execution. These services included payments of certain expenses on behalf of the Fund totaling $448 for the period.
7. Distributions to Shareholders.
Distributions to shareholders of each class were as follows:
Period ended | |
From net investment income |
|
Series Mega Cap | $ 905,843 |
Class F | 1,054,121 |
Total | $ 1,959,964 |
A For the period December 6, 2012 (commencement of operations) to December 31, 2012.
8. Share Transactions.
Transactions for each class of shares were as follows:
| Shares | Dollars |
Period ended December 31, 2012 A | Period ended December 31, 2012 A | |
Series Mega Cap |
|
|
Shares sold | 90,588,624 B | $ 905,886,264 B |
Reinvestment of distributions | 90,044 | 905,843 |
Shares redeemed | (408,706) | (4,092,049) |
Net increase (decrease) | 90,269,962 | $ 902,700,058 |
Class F |
|
|
Shares sold | 95,850,459 B | $ 958,504,353 B |
Reinvestment of distributions | 104,783 | 1,054,121 |
Shares redeemed | (915,669) | (9,183,596) |
Net increase (decrease) | 95,039,573 | $ 950,374,878 |
A For the period December 6, 2012 (commencement of operations) to December 31, 2012.
B Amount includes in-kind exchanges (see Note 5: Exchanges In-Kind).
Semiannual Report
Notes to Financial Statements (Unaudited) - continued
9. Other.
The Fund's organizational documents provide former and current trustees and officers with a limited indemnification against liabilities arising in connection with the performance of their duties to the Fund. In the normal course of business, the Fund may also enter into contracts that provide general indemnifications. The Fund's maximum exposure under these arrangements is unknown as this would be dependent on future claims that may be made against the Fund. The risk of material loss from such claims is considered remote.
At the end of the period, mutual funds managed by FMR or an FMR affiliate were the owners of record of all of the outstanding shares of the Fund.
Semiannual Report
Board Approval of Investment Advisory Contracts and Management Fees
Fidelity Series Mega Cap Fund
On September 19, 2012, the Board of Trustees, including the Independent Trustees (together, the Board), voted to approve the management contract and sub-advisory agreements (together, the Advisory Contracts) for the fund. The Board, assisted by the advice of fund counsel and Independent Trustees' counsel, considered a broad range of information.
Nature, Extent, and Quality of Services Provided. The Board considered the staffing within the investment adviser, FMR, and the sub-advisers (together, the Investment Advisers), including the backgrounds of the fund's investment personnel, and also considered the fund's investment objective, strategies, and related investment philosophy. The Board considered the structure of the portfolio manager compensation program and whether this structure provides appropriate incentives to act in the best interests of the fund.
Resources Dedicated to Investment Management and Support Services. The Board and the Fund Oversight and Research Committees reviewed the general qualifications and capabilities of the Investment Advisers' investment staff, including its size, education, experience, and resources, as well as the Investment Advisers' approach to recruiting, training, managing, and compensating investment personnel. The Board also noted that FMR has continued to increase the resources devoted to non-U.S. offices, including expansion of Fidelity's global investment organization. The Board noted that Fidelity's analysts have extensive resources, tools and capabilities that allow them to conduct sophisticated quantitative and fundamental analysis, as well as credit analysis of issuers, counterparties and guarantors. The Board also believes that Fidelity's investment professionals have sufficient access to global information and data so as to provide competitive investment results over time, and that those professionals also have access to sophisticated tools that permit them to assess portfolio construction and risk and performance attribution characteristics continuously, as well as to transmit new information and research conclusions rapidly around the world. Additionally, in its deliberations, the Board considered the Investment Advisers' trading and risk management capabilities and resources, which are an integral part of the investment management process.
Shareholder and Administrative Services. The Board considered the nature, extent, quality, and cost of advisory, administrative, and shareholder services to be performed by the Investment Advisers and their affiliates under the Advisory Contracts and under separate agreements covering transfer agency, pricing and bookkeeping, and securities lending services for the fund. The Board also considered the nature and extent of the supervision of third party service providers, principally custodians and subcustodians.
The Board noted that the growth of fund assets over time across the complex allows Fidelity to reinvest in the development of services designed to enhance the value or convenience of the Fidelity funds as investment vehicles. These services include 24-hour access to account information and market information through telephone representatives and over the Internet, investor education materials and asset allocation tools, and the expanded availability of Fidelity Investor Centers.
Semiannual Report
Board Approval of Investment Advisory Contracts and
Management Fees - continued
Investment Performance. The fund is a new fund and therefore had no historical performance for the Board to review at the time it approved the fund's Advisory Contracts. The Board considered the Investment Advisers' strength in fundamental, research-driven Growth & Capital Appreciation selection, which the Board is familiar with through its supervision of other Fidelity funds that invest in such securities.
Based on its review, the Board concluded that the nature, extent, and quality of services to be provided to the fund under the Advisory Contracts should benefit the fund's shareholders.
Competitiveness of Management Fee and Total Expense Ratio. The Board considered the fund's proposed management fee and the projected total expense ratio of each class of the fund in reviewing the Advisory Contracts. The Board noted that the fund's proposed management fee rate is lower than the median fee rate of funds with similar Lipper investment objective categories and comparable management fee characteristics. The Board also considered that the projected total expense ratios are comparable to those of similar classes and funds that Fidelity offers to shareholders.
Based on its review, the Board concluded that the management fee and the projected total expense ratio of each class of the fund were reasonable in light of the services that the fund and its shareholders will receive and the other factors considered.
Costs of the Services and Profitability. The fund is a new fund and therefore no revenue, cost, or profitability data was available for the Board to review in respect of the fund at the time it approved the Advisory Contracts. In connection with its future renewal of the fund's Advisory Contracts, the Board will consider the revenues earned and the expenses incurred by Fidelity in conducting the business of developing, marketing, distributing, managing, administering and servicing the fund and its shareholders.
Economies of Scale. The Board will consider economies of scale when there is operating experience to permit assessment thereof. It noted that, notwithstanding the entrepreneurial risk associated with a new fund, the management fee was at a level normally associated, by comparison with competitors, with very high fund net assets, and Fidelity asserted to the Board that the level of the fee anticipated economies of scale at lower asset levels even before, if ever, economies of scale are achieved. The Board also noted that the fund and its shareholders would have access to the very considerable number and variety of services available through Fidelity and its affiliates.
Based on its evaluation of all of the conclusions noted above, and after considering all factors it believed relevant, the Board ultimately concluded that the advisory fee structures are fair and reasonable, and that the fund's Advisory Contracts should be approved.
Semiannual Report
Investment Adviser
Fidelity Management & Research Company
Boston, MA
Investment Sub-Advisers
FMR Co., Inc.
Fidelity Management & Research (U.K.) Inc.
Fidelity Management & Research
(Hong Kong) Limited
Fidelity Management & Research
(Japan) Inc.
General Distributor
Fidelity Distributors Corporation
Smithfield, RI
Transfer and Service Agents
Fidelity Investments Institutional Operations Company, Inc.
Boston, MA
Fidelity Service Company, Inc.
Boston, MA
Custodian
The Northern Trust Company
Chicago, IL
(Fidelity Investment logo)(registered trademark)
Corporate Headquarters
82 Devonshire St., Boston, MA 02109
www.fidelity.com
MHT-SANN-0213
1.951032.100
Item 2. Code of Ethics
Not applicable.
Item 3. Audit Committee Financial Expert
Not applicable.
Item 4. Principal Accountant Fees and Services
Not applicable.
Item 5. Audit Committee of Listed Registrants
Not applicable.
Item 6. Investments
(a) Not applicable.
(b) Not applicable
Item 7. Disclosure of Proxy Voting Policies and Procedures for Closed-End Management Investment Companies
Not applicable.
Item 8. Portfolio Managers of Closed-End Management Investment Companies
Not applicable.
Item 9. Purchase of Equity Securities by Closed-End Management Investment Company and Affiliated Purchasers
Not applicable.
Item 10. Submission of Matters to a Vote of Security Holders
There were no material changes to the procedures by which shareholders may recommend nominees to the Fidelity Hastings Street Trust's Board of Trustees.
Item 11. Controls and Procedures
(a)(i) The President and Treasurer and the Chief Financial Officer have concluded that the Fidelity Hastings Street Trust's (the "Trust") disclosure controls and procedures (as defined in Rule 30a-3(c) under the Investment Company Act) provide reasonable assurances that material information relating to the Trust is made known to them by the appropriate persons, based on their evaluation of these controls and procedures as of a date within 90 days of the filing date of this report.
(a)(ii) There was no change in the Trust's internal control over financial reporting (as defined in Rule 30a-3(d) under the Investment Company Act) that occurred during the second fiscal quarter of the period covered by this report that has materially affected, or is reasonably likely to materially affect, the Trust's internal control over financial reporting.
Item 12. Exhibits
(a) | (1) | Not applicable. |
(a) | (2) | Certification pursuant to Rule 30a-2(a) under the Investment Company Act of 1940 (17 CFR 270.30a-2(a)) is filed and attached hereto as Exhibit 99.CERT. |
(a) | (3) | Not applicable. |
(b) |
| Certification pursuant to Rule 30a-2(b) under the Investment Company Act of 1940 (17 CFR 270.30a-2(b)) is furnished and attached hereto as Exhibit 99.906CERT. |
SIGNATURES
Pursuant to the requirements of the Securities Exchange Act of 1934 and the Investment Company Act of 1940, the registrant has duly caused this report to be signed on its behalf by the undersigned, thereunto duly authorized.
Fidelity Hastings Street Trust
By: | /s/Kenneth B. Robins |
| Kenneth B. Robins |
| President and Treasurer |
|
|
Date: | February 21, 2013 |
Pursuant to the requirements of the Securities Exchange Act of 1934 and the Investment Company Act of 1940, this report has been signed below by the following persons on behalf of the registrant and in the capacities and on the dates indicated.
By: | /s/Kenneth B. Robins |
| Kenneth B. Robins |
| President and Treasurer |
|
|
Date: | February 21, 2013 |
By: | /s/Christine Reynolds |
| Christine Reynolds |
| Chief Financial Officer |
|
|
Date: | February 21, 2013 |