UNITED STATES
SECURITIES AND EXCHANGE COMMISSION
Washington, D.C. 20549
FORM N-CSR
CERTIFIED SHAREHOLDER REPORT OF REGISTERED
MANAGEMENT INVESTMENT COMPANIES
Investment Company Act file number 811-215
Fidelity Hastings Street Trust
(Exact name of registrant as specified in charter)
245 Summer St., Boston, Massachusetts 02210
(Address of principal executive offices) (Zip code)
Scott C. Goebel, Secretary
245 Summer St.
Boston, Massachusetts 02210
(Name and address of agent for service)
Registrant's telephone number, including area code: 617-563-7000
Date of fiscal year end: | June 30 |
| |
Date of reporting period: | June 30, 2014 |
Item 1. Reports to Stockholders
Fidelity®
Growth Discovery Fund
Annual Report
June 30, 2014
(Fidelity Cover Art)
Contents
Performance | (Click Here) | How the fund has done over time. |
Management's Discussion of Fund Performance | (Click Here) | The Portfolio Manager's review of fund performance and strategy. |
Shareholder Expense Example | (Click Here) | An example of shareholder expenses. |
Investment Changes | (Click Here) | A summary of major shifts in the fund's investments over the past six months. |
Investments | (Click Here) | A complete list of the fund's investments with their market values. |
Financial Statements | (Click Here) | Statements of assets and liabilities, operations, and changes in net assets, as well as financial highlights. |
Notes | (Click Here) | Notes to the financial statements. |
Report of Independent Registered Public Accounting Firm | (Click Here) | |
Trustees and Officers | (Click Here) | |
Distributions | (Click Here) | |
To view a fund's proxy voting guidelines and proxy voting record for the 12-month period ended June 30, visit http://www.fidelity.com/proxyvotingresults or visit the Securities and Exchange Commission's (SEC) web site at http://www.sec.gov. You may also call 1-800-544-8544 to request a free copy of the proxy voting guidelines.
Standard & Poor's, S&P and S&P 500 are registered service marks of The McGraw-Hill Companies, Inc. and have been licensed for use by Fidelity Distributors Corporation.
Other third-party marks appearing herein are the property of their respective owners.
All other marks appearing herein are registered or unregistered trademarks or service marks of FMR LLC or an affiliated company. © 2014 FMR LLC. All rights reserved.
Annual Report
This report and the financial statements contained herein are submitted for the general information of the shareholders of the fund. This report is not authorized for distribution to prospective investors in the fund unless preceded or accompanied by an effective prospectus.
A fund files its complete schedule of portfolio holdings with the SEC for the first and third quarters of each fiscal year on Form N-Q. Forms N-Q are available on the SEC's web site at http://www.sec.gov. A fund's Forms N-Q may be reviewed and copied at the SEC's Public Reference Room in Washington, DC. Information regarding the operation of the SEC's Public Reference Room may be obtained by calling 1-800-SEC-0330. For a complete list of a fund's portfolio holdings, view the most recent holdings listing, semiannual report, or annual report on Fidelity's web site at http://www.fidelity.com, http://www.advisor.fidelity.com, or http://www.401k.com, as applicable.
NOT FDIC INSURED • MAY LOSE VALUE • NO BANK GUARANTEE
Neither the fund nor Fidelity Distributors Corporation is a bank.
Annual Report
Average annual total return reflects the change in the value of an investment, assuming reinvestment of the class' distributions from dividend income and capital gains (the profits earned upon the sale of securities that have grown in value, if any) and assuming a constant rate of performance each year. The $10,000 table and the fund's returns do not reflect the deduction of taxes that a shareholder would pay on fund distributions or the redemption of fund shares. During periods of reimbursement by Fidelity, a fund's total return will be greater than it would be had the reimbursement not occurred. How a fund did yesterday is no guarantee of how it will do tomorrow.
Average Annual Total Returns
Periods ended June 30, 2014 | Past 1
year | Past 5
years | Past 10
years |
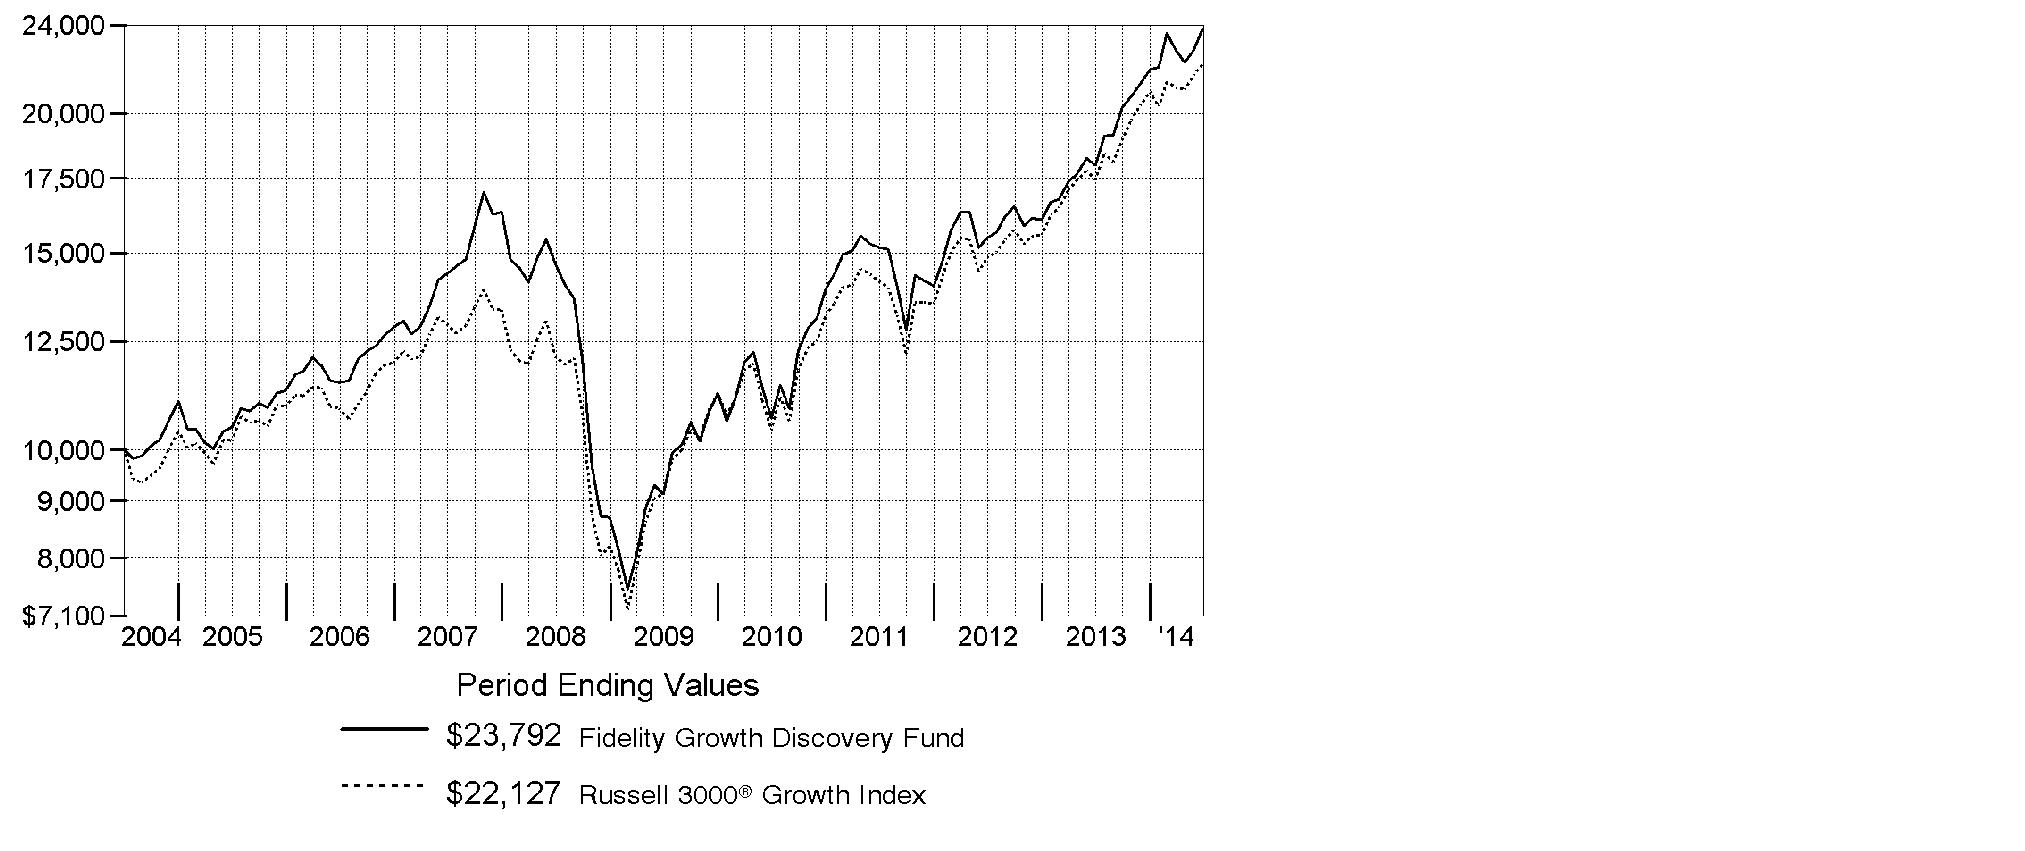
Fidelity® Growth Discovery FundA | 32.40% | 21.13% | 9.05% |
A Prior to February 1, 2007, Fidelity® Growth Discovery Fund operated under certain different investment policies and compared its performance to a different index. The fund's historical performance may not represent its current investment policies.
$10,000 Over 10 Years
Let's say hypothetically that $10,000 was invested in Fidelity Growth Discovery Fund, a class of the fund, on June 30, 2004. The chart shows how the value of your investment would have changed, and also shows how the Russell 3000® Growth Index performed over the same period.
Annual Report
Market Recap: Despite intermittent volatility driven by geopolitical concerns, stocks posted a series of new highs during the 12 months ending June 30, 2014, amid a decidedly favorable environment for riskier assets. The S&P 500® Index rose 24.61% for the year, helped by a rise in consumer spending and the lowest unemployment rate since 2008. The U.S. Federal Reserve balanced stimulus reductions with continued low interest rates, aiding a broad advance. All 10 S&P 500® market sectors gained, seven by more than 20%. Materials (+33%) was tops, as investors seemed to anticipate sustained economic improvement and renewed infrastructure build-outs. Information technology (+32%) benefited from large cash balances, rising dividends and stock buybacks, and a bevy of innovations. Health care (+30%) was aided by new drugs and predictable reimbursements. Conversely, the biggest laggard, telecommunication services (+5%), battled slow growth and stiff pricing competition. Across size and style segments: overall, investors showed some preference for large-cap stocks over small-caps and growth stocks over value, although market leadership rotated during the year. With the "risk-on" trade alive and well, the growth-oriented Nasdaq Composite Index® flourished, advancing 31.17%, while the blue-chip Dow Jones Industrial AverageSM delivered a more subdued 15.56% return.
Comments from Jason Weiner, Portfolio Manager of Fidelity® Growth Discovery Fund: For the year, the fund's Retail Class shares advanced 32.40%, outpacing the 26.75% gain of the Russell 3000® Growth Index. Versus the Russell index, the software & services segment was a plus. Here, Facebook was the fund's biggest relative contributor by far and easily its largest holding. The social network giant reached an all-time high after posting a 63% increase in revenue for the fourth quarter of 2013, fueled by strong mobile advertising. Investors flocked to the stock as the surge in mobile Internet ad revenue eased concerns about Facebook's ability to evolve into a "mobile first" company. By contrast, an overweighting in Broadcom, on average, was the biggest relative detractor. The firm produces baseband chips that provide Internet connectivity to Apple's iPhone® smartphones and iPad® tablets, as well as some of Samsung Electronics' GalaxyTM mobile devices. Earlier in the period, I was optimistic the business would ride the coattails of the popular products it supports, along with its innovations in Internet connectivity. But the stock lagged, as the firm faced intensifying competition and setbacks in releasing new chips. Shares plummeted last summer after the company issued a lower-than-expected revenue forecast amid slowing smartphone sales. I sold Broadcom prior to period end.
The views expressed above reflect those of the portfolio manager(s) only through the end of the period as stated on the cover of this report and do not necessarily represent the views of Fidelity or any other person in the Fidelity organization. Any such views are subject to change at any time based upon market or other conditions and Fidelity disclaims any responsibility to update such views. These views may not be relied on as investment advice and, because investment decisions for a Fidelity fund are based on numerous factors, may not be relied on as an indication of trading intent on behalf of any Fidelity fund.
Annual Report
Shareholder Expense Example
As a shareholder of the Fund, you incur two types of costs: (1) transaction costs, and (2) ongoing costs, including management fees and other Fund expenses. This Example is intended to help you understand your ongoing costs (in dollars) of investing in the Fund and to compare these costs with the ongoing costs of investing in other mutual funds.
The Example is based on an investment of $1,000 invested at the beginning of the period and held for the entire period (January 1, 2014 to June 30, 2014).
Actual Expenses
The first line of the accompanying table for each class of the Fund provides information about actual account values and actual expenses. You may use the information in this line, together with the amount you invested, to estimate the expenses that you paid over the period. Simply divide your account value by $1,000.00 (for example, an $8,600 account value divided by $1,000.00 = 8.6), then multiply the result by the number in the first line for a class of the Fund under the heading entitled "Expenses Paid During Period" to estimate the expenses you paid on your account during this period. A small balance maintenance fee of $12.00 that is charged once a year may apply for certain accounts with a value of less than $2,000. This fee is not included in the table below. If it was, the estimate of expenses you paid during the period would be higher, and your ending account value lower, by this amount. In addition, the Fund, as a shareholder in the underlying Fidelity Central Funds, will indirectly bear its pro-rata share of the fees and expenses incurred by the underlying Fidelity Central Funds. These fees and expenses are not included in the Fund's annualized expense ratio used to calculate the expense estimate in the table below.
Hypothetical Example for Comparison Purposes
The second line of the accompanying table for each class of the Fund provides information about hypothetical account values and hypothetical expenses based on a Class' actual expense ratio and an assumed rate of return of 5% per year before expenses, which is not the Class' actual return. The hypothetical account values and expenses may not be used to estimate the actual ending account balance or expenses you paid for the period. You may use this information to compare the ongoing costs of investing in the Fund and other funds. To do so, compare this 5% hypothetical example with the 5% hypothetical examples that appear in the shareholder reports of the other funds. A small balance maintenance fee of $12.00 that is charged once a year may apply for certain accounts with a value of less than $2,000. This fee is not included in the table below. If it was, the estimate of expenses you paid during the period would be higher, and your ending account value lower, by this amount. In addition, the Fund, as a shareholder in the underlying Fidelity Central Funds, will indirectly bear its pro-rata share of the fees and expenses incurred by the underlying Fidelity Central Funds. These fees and expenses are not included in the Fund's annualized expense ratio used to calculate the expense estimate in the table below.
Please note that the expenses shown in the table are meant to highlight your ongoing costs only and do not reflect any transaction costs. Therefore, the second line of the table is useful in comparing ongoing costs only, and will not help you determine the relative total costs of owning different funds.
Annual Report
| Annualized
Expense RatioB | Beginning
Account Value
January 1, 2014 | Ending
Account Value
June 30, 2014 | Expenses Paid
During Period*
January 1, 2014 to June 30, 2014 |
Growth Discovery | .80% | | | |
Actual | | $ 1,000.00 | $ 1,086.70 | $ 4.14 |
HypotheticalA | | $ 1,000.00 | $ 1,020.83 | $ 4.01 |
Class K | .66% | | | |
Actual | | $ 1,000.00 | $ 1,087.10 | $ 3.42 |
HypotheticalA | | $ 1,000.00 | $ 1,021.52 | $ 3.31 |
A 5% return per year before expenses
B Annualized expense ratio reflects expenses net of applicable fee waivers.
* Expenses are equal to each Class' annualized expense ratio, multiplied by the average account value over the period, multiplied by 181/365 (to reflect the one-half year period).
Annual Report
Investment Changes (Unaudited)
Top Ten Stocks as of June 30, 2014 |
| % of fund's
net assets | % of fund's net assets
6 months ago |
Facebook, Inc. Class A | 7.4 | 6.6 |
Gilead Sciences, Inc. | 4.2 | 1.6 |
Keurig Green Mountain, Inc. | 3.0 | 2.5 |
Harley-Davidson, Inc. | 3.0 | 3.0 |
Google, Inc. Class A | 2.4 | 4.3 |
Google, Inc. Class C | 2.4 | 0.0 |
Apple, Inc. | 2.3 | 2.5 |
Actavis PLC | 1.9 | 1.1 |
The Blackstone Group LP | 1.9 | 0.9 |
Danaher Corp. | 1.9 | 1.5 |
| 30.4 | |
Top Five Market Sectors as of June 30, 2014 |
| % of fund's
net assets | % of fund's net assets
6 months ago |
Information Technology | 28.0 | 29.1 |
Consumer Discretionary | 15.2 | 19.5 |
Health Care | 14.5 | 16.9 |
Industrials | 10.5 | 7.8 |
Consumer Staples | 8.7 | 9.3 |
Asset Allocation (% of fund's net assets) |
As of June 30, 2014 * | As of December 31, 2013 ** |
 | Stocks and
Equity Futures 99.4% | | | Stocks 98.9% | |
 | Convertible
Securities 0.3% | | | Convertible
Securities 0.1% | |
 | Short-Term
Investments and
Net Other Assets (Liabilities) 0.3% | | | Short-Term
Investments and
Net Other Assets (Liabilities) 1.0% | |
* Foreign investments | 11.0% | | ** Foreign investments | 12.6% | |

Annual Report
Investments June 30, 2014
Showing Percentage of Net Assets
Common Stocks - 98.1% |
| Shares | | Value (000s) |
CONSUMER DISCRETIONARY - 15.1% |
Automobiles - 4.0% |
Harley-Davidson, Inc. | 540,194 | | $ 37,733 |
Tesla Motors, Inc. (a)(d) | 51,610 | | 12,389 |
| | 50,122 |
Distributors - 0.2% |
LKQ Corp. (a) | 109,400 | | 2,920 |
Diversified Consumer Services - 0.5% |
Bright Horizons Family Solutions, Inc. (a) | 61,200 | | 2,628 |
H&R Block, Inc. | 94,188 | | 3,157 |
| | 5,785 |
Hotels, Restaurants & Leisure - 3.4% |
Chipotle Mexican Grill, Inc. (a) | 8,521 | | 5,049 |
Domino's Pizza, Inc. | 10,233 | | 748 |
Dunkin' Brands Group, Inc. | 133,069 | | 6,096 |
Las Vegas Sands Corp. | 31,700 | | 2,416 |
Starbucks Corp. | 213,226 | | 16,499 |
Yum! Brands, Inc. | 143,037 | | 11,615 |
| | 42,423 |
Household Durables - 0.3% |
Mohawk Industries, Inc. (a) | 26,929 | | 3,725 |
Internet & Catalog Retail - 1.0% |
Amazon.com, Inc. (a) | 19,024 | | 6,179 |
TripAdvisor, Inc. (a) | 58,383 | | 6,344 |
| | 12,523 |
Leisure Products - 0.1% |
NJOY, Inc. (f) | 56,145 | | 950 |
Media - 0.7% |
Comcast Corp. Class A (special) (non-vtg.) | 176,643 | | 9,420 |
Specialty Retail - 3.3% |
CarMax, Inc. (a) | 37,952 | | 1,974 |
Five Below, Inc. (a) | 40,900 | | 1,632 |
Home Depot, Inc. | 281,724 | | 22,808 |
Ulta Salon, Cosmetics & Fragrance, Inc. (a) | 88,104 | | 8,054 |
Urban Outfitters, Inc. (a) | 233,757 | | 7,915 |
| | 42,383 |
Textiles, Apparel & Luxury Goods - 1.6% |
ECLAT Textile Co. Ltd. | 332,900 | | 4,034 |
Common Stocks - continued |
| Shares | | Value (000s) |
CONSUMER DISCRETIONARY - continued |
Textiles, Apparel & Luxury Goods - continued |
Michael Kors Holdings Ltd. (a) | 67,300 | | $ 5,966 |
NIKE, Inc. Class B | 134,967 | | 10,467 |
| | 20,467 |
TOTAL CONSUMER DISCRETIONARY | | 190,718 |
CONSUMER STAPLES - 8.7% |
Beverages - 1.2% |
Monster Beverage Corp. (a) | 34,353 | | 2,440 |
SABMiller PLC | 120,224 | | 6,971 |
The Coca-Cola Co. | 136,336 | | 5,775 |
| | 15,186 |
Food & Staples Retailing - 0.9% |
Costco Wholesale Corp. | 53,700 | | 6,184 |
Sprouts Farmers Market LLC | 15,090 | | 494 |
Whole Foods Market, Inc. | 105,351 | | 4,070 |
| | 10,748 |
Food Products - 4.2% |
Keurig Green Mountain, Inc. | 305,872 | | 38,115 |
Mead Johnson Nutrition Co. Class A | 84,329 | | 7,857 |
The Hershey Co. | 77,697 | | 7,565 |
| | 53,537 |
Household Products - 1.6% |
Procter & Gamble Co. | 256,686 | | 20,173 |
Personal Products - 0.8% |
Estee Lauder Companies, Inc. Class A | 25,500 | | 1,894 |
Herbalife Ltd. | 135,333 | | 8,734 |
| | 10,628 |
TOTAL CONSUMER STAPLES | | 110,272 |
ENERGY - 8.7% |
Energy Equipment & Services - 3.4% |
Dril-Quip, Inc. (a) | 42,458 | | 4,638 |
Halliburton Co. | 291,500 | | 20,699 |
Oceaneering International, Inc. | 104,756 | | 8,185 |
Pason Systems, Inc. | 134,806 | | 3,790 |
RigNet, Inc. (a) | 104,061 | | 5,601 |
| | 42,913 |
Common Stocks - continued |
| Shares | | Value (000s) |
ENERGY - continued |
Oil, Gas & Consumable Fuels - 5.3% |
Cheniere Energy, Inc. (a) | 106,700 | | $ 7,650 |
Continental Resources, Inc. (a)(d) | 68,126 | | 10,767 |
EOG Resources, Inc. | 73,500 | | 8,589 |
EQT Midstream Partners LP | 38,200 | | 3,695 |
Golar LNG Ltd. | 161,461 | | 9,704 |
Markwest Energy Partners LP | 46,800 | | 3,350 |
Noble Energy, Inc. | 50,600 | | 3,919 |
Phillips 66 Partners LP | 103,504 | | 7,821 |
Pioneer Natural Resources Co. | 26,700 | | 6,136 |
Targa Resources Corp. | 36,439 | | 5,086 |
| | 66,717 |
TOTAL ENERGY | | 109,630 |
FINANCIALS - 7.6% |
Banks - 0.9% |
HDFC Bank Ltd. sponsored ADR | 259,155 | | 12,134 |
Capital Markets - 5.0% |
BlackRock, Inc. Class A | 23,394 | | 7,477 |
E*TRADE Financial Corp. (a) | 395,759 | | 8,414 |
Fortress Investment Group LLC | 166,100 | | 1,236 |
Harvest Capital Credit Corp. (d) | 26,130 | | 388 |
Invesco Ltd. | 337,384 | | 12,736 |
KKR & Co. LP | 146,609 | | 3,567 |
Legg Mason, Inc. | 98,300 | | 5,044 |
The Blackstone Group LP | 718,619 | | 24,031 |
| | 62,893 |
Consumer Finance - 0.7% |
American Express Co. | 70,084 | | 6,649 |
Shriram Transport Finance Co. Ltd. | 118,502 | | 1,786 |
| | 8,435 |
Diversified Financial Services - 0.8% |
Berkshire Hathaway, Inc. Class B (a) | 23,600 | | 2,987 |
McGraw Hill Financial, Inc. | 87,612 | | 7,274 |
| | 10,261 |
Common Stocks - continued |
| Shares | | Value (000s) |
FINANCIALS - continued |
Real Estate Management & Development - 0.2% |
Leopalace21 Corp. (a) | 73,800 | | $ 381 |
Realogy Holdings Corp. (a) | 47,381 | | 1,787 |
| | 2,168 |
TOTAL FINANCIALS | | 95,891 |
HEALTH CARE - 14.5% |
Biotechnology - 9.5% |
Acceleron Pharma, Inc. | 48,400 | | 1,644 |
Actelion Ltd. | 17,384 | | 2,199 |
Alexion Pharmaceuticals, Inc. (a) | 52,594 | | 8,218 |
Biogen Idec, Inc. (a) | 71,579 | | 22,570 |
BioMarin Pharmaceutical, Inc. (a) | 89,996 | | 5,599 |
Cytokinetics, Inc. warrants 6/25/17 (a) | 288,420 | | 6 |
Enanta Pharmaceuticals, Inc. (a)(d) | 105,984 | | 4,565 |
Gilead Sciences, Inc. (a) | 641,363 | | 53,175 |
Insmed, Inc. (a) | 295,678 | | 5,908 |
Kamada (a) | 45,784 | | 326 |
Ophthotech Corp. | 48,445 | | 2,050 |
uniQure B.V. | 33,635 | | 457 |
Vanda Pharmaceuticals, Inc. (a) | 209,048 | | 3,382 |
Vertex Pharmaceuticals, Inc. (a) | 101,400 | | 9,601 |
| | 119,700 |
Health Care Equipment & Supplies - 0.5% |
AxoGen, Inc. (a) | 27,515 | | 76 |
GI Dynamics, Inc. CDI (a) | 161,679 | | 88 |
The Cooper Companies, Inc. | 45,107 | | 6,113 |
| | 6,277 |
Health Care Providers & Services - 0.4% |
Apollo Hospitals Enterprise Ltd. | 119,708 | | 1,983 |
Qualicorp SA (a) | 246,000 | | 2,906 |
| | 4,889 |
Health Care Technology - 0.1% |
Cerner Corp. (a) | 35,913 | | 1,852 |
Life Sciences Tools & Services - 0.8% |
Illumina, Inc. (a) | 57,526 | | 10,271 |
Pharmaceuticals - 3.2% |
AbbVie, Inc. | 152,602 | | 8,613 |
Actavis PLC (a) | 108,377 | | 24,173 |
Common Stocks - continued |
| Shares | | Value (000s) |
HEALTH CARE - continued |
Pharmaceuticals - continued |
AVANIR Pharmaceuticals Class A (a) | 260,300 | | $ 1,468 |
Perrigo Co. PLC | 40,432 | | 5,893 |
| | 40,147 |
TOTAL HEALTH CARE | | 183,136 |
INDUSTRIALS - 10.5% |
Aerospace & Defense - 2.4% |
TransDigm Group, Inc. | 54,527 | | 9,120 |
United Technologies Corp. | 186,612 | | 21,544 |
| | 30,664 |
Airlines - 0.2% |
Ryanair Holdings PLC sponsored ADR (a) | 36,953 | | 2,062 |
Building Products - 0.4% |
A.O. Smith Corp. | 102,544 | | 5,084 |
Commercial Services & Supplies - 0.5% |
KAR Auction Services, Inc. | 219,398 | | 6,992 |
Construction & Engineering - 0.5% |
Jacobs Engineering Group, Inc. (a) | 99,891 | | 5,322 |
MasTec, Inc. (a) | 18,300 | | 564 |
| | 5,886 |
Electrical Equipment - 0.6% |
AMETEK, Inc. | 88,945 | | 4,650 |
Power Solutions International, Inc. (a) | 34,221 | | 2,463 |
| | 7,113 |
Industrial Conglomerates - 2.4% |
Danaher Corp. | 300,255 | | 23,639 |
Roper Industries, Inc. | 43,614 | | 6,368 |
| | 30,007 |
Machinery - 2.4% |
Allison Transmission Holdings, Inc. | 161,000 | | 5,007 |
Caterpillar, Inc. | 89,034 | | 9,675 |
Manitowoc Co., Inc. | 365,847 | | 12,022 |
Sarine Technologies Ltd. | 564,000 | | 1,162 |
Sun Hydraulics Corp. | 14,500 | | 589 |
Weg SA | 115,960 | | 1,485 |
| | 29,940 |
Common Stocks - continued |
| Shares | | Value (000s) |
INDUSTRIALS - continued |
Professional Services - 0.6% |
Verisk Analytics, Inc. (a) | 103,867 | | $ 6,234 |
WageWorks, Inc. (a) | 28,855 | | 1,391 |
| | 7,625 |
Road & Rail - 0.5% |
J.B. Hunt Transport Services, Inc. | 92,600 | | 6,832 |
TOTAL INDUSTRIALS | | 132,205 |
INFORMATION TECHNOLOGY - 27.8% |
Communications Equipment - 0.5% |
QUALCOMM, Inc. | 74,600 | | 5,908 |
Electronic Equipment & Components - 0.7% |
TE Connectivity Ltd. | 138,863 | | 8,587 |
Internet Software & Services - 15.5% |
Cornerstone OnDemand, Inc. (a) | 63,903 | | 2,941 |
CoStar Group, Inc. (a) | 9,900 | | 1,566 |
Cvent, Inc. (d) | 151,731 | | 4,414 |
Demandware, Inc. (a) | 48,000 | | 3,330 |
Facebook, Inc. Class A (a) | 1,395,991 | | 93,936 |
Google, Inc.: | | | |
Class A (a) | 51,752 | | 30,258 |
Class C (a) | 51,752 | | 29,772 |
Naver Corp. | 11,346 | | 9,362 |
SPS Commerce, Inc. (a) | 62,372 | | 3,941 |
Textura Corp. (d) | 286,739 | | 6,779 |
Xoom Corp. (a) | 16,800 | | 443 |
Yahoo!, Inc. (a) | 246,759 | | 8,669 |
| | 195,411 |
IT Services - 2.1% |
Gartner, Inc. Class A (a) | 97,798 | | 6,897 |
Visa, Inc. Class A | 96,724 | | 20,381 |
| | 27,278 |
Semiconductors & Semiconductor Equipment - 0.3% |
M/A-COM Technology Solutions, Inc. (a) | 23,100 | | 519 |
MediaTek, Inc. | 175,000 | | 2,958 |
| | 3,477 |
Software - 6.2% |
Activision Blizzard, Inc. | 97,687 | | 2,178 |
ANSYS, Inc. (a) | 1,222 | | 93 |
Common Stocks - continued |
| Shares | | Value (000s) |
INFORMATION TECHNOLOGY - continued |
Software - continued |
Computer Modelling Group Ltd. | 138,200 | | $ 3,836 |
Electronic Arts, Inc. (a) | 322,634 | | 11,573 |
Fleetmatics Group PLC (a) | 40,850 | | 1,321 |
Microsoft Corp. | 535,100 | | 22,314 |
salesforce.com, Inc. (a) | 363,864 | | 21,133 |
ServiceNow, Inc. (a) | 27,200 | | 1,685 |
SolarWinds, Inc. (a) | 75,481 | | 2,918 |
Solera Holdings, Inc. | 20,000 | | 1,343 |
SS&C Technologies Holdings, Inc. (a) | 192,320 | | 8,504 |
The Rubicon Project, Inc. | 70,546 | | 906 |
| | 77,804 |
Technology Hardware, Storage & Peripherals - 2.5% |
Apple, Inc. | 307,146 | | 28,543 |
Nimble Storage, Inc. (d) | 104,300 | | 3,204 |
| | 31,747 |
TOTAL INFORMATION TECHNOLOGY | | 350,212 |
MATERIALS - 4.8% |
Chemicals - 2.3% |
FMC Corp. | 94,042 | | 6,695 |
Monsanto Co. | 69,788 | | 8,705 |
Sherwin-Williams Co. | 47,095 | | 9,744 |
Westlake Chemical Corp. | 46,050 | | 3,857 |
| | 29,001 |
Construction Materials - 2.5% |
CaesarStone Sdot-Yam Ltd. | 13,200 | | 648 |
Eagle Materials, Inc. | 194,598 | | 18,347 |
James Hardie Industries PLC sponsored ADR | 52,527 | | 3,434 |
Vulcan Materials Co. | 151,624 | | 9,666 |
| | 32,095 |
TOTAL MATERIALS | | 61,096 |
TELECOMMUNICATION SERVICES - 0.1% |
Diversified Telecommunication Services - 0.1% |
8x8, Inc. (a) | 178,860 | | 1,445 |
Common Stocks - continued |
| Shares | | Value (000s) |
UTILITIES - 0.3% |
Electric Utilities - 0.3% |
ITC Holdings Corp. | 102,774 | | $ 3,749 |
TOTAL COMMON STOCKS (Cost $942,590) |
1,238,354
|
Convertible Preferred Stocks - 0.3% |
| | | |
CONSUMER DISCRETIONARY - 0.1% |
Household Durables - 0.1% |
Blu Homes, Inc. Series A, 5.00% (f) | 239,736 | | 1,108 |
INFORMATION TECHNOLOGY - 0.2% |
Internet Software & Services - 0.2% |
Uber Technologies, Inc. 8.00% (f) | 40,643 | | 2,522 |
TOTAL CONVERTIBLE PREFERRED STOCKS (Cost $3,630) |
3,630
|
U.S. Treasury Obligations - 0.1% |
| Principal Amount (000s) | | |
U.S. Treasury Bills, yield at date of purchase 0.02% 7/31/14 (e)
(Cost $990) | | $ 990 | |
990
|
Money Market Funds - 4.0% |
| Shares | | |
Fidelity Cash Central Fund, 0.11% (b) | 21,110,428 | | 21,110 |
Fidelity Securities Lending Cash Central Fund, 0.10% (b)(c) | 29,500,646 | | 29,501 |
TOTAL MONEY MARKET FUNDS (Cost $50,611) |
50,611
|
TOTAL INVESTMENT PORTFOLIO - 102.5% (Cost $997,821) | 1,293,585 |
NET OTHER ASSETS (LIABILITIES) - (2.5)% | (31,147) |
NET ASSETS - 100% | $ 1,262,438 |
Futures Contracts |
| Expiration Date | | Underlying Face Amount at Value (000s) | | Unrealized Appreciation/
(Depreciation) (000s) |
Purchased |
Equity Index Contracts |
168 ICE Russell 1000 Growth Index Contracts | Sept. 2014 | | $ 15,253 | | $ 249 |
12 ICE Russell 2000 Index Contracts | Sept. 2014 | | 1,428 | | 42 |
TOTAL EQUITY INDEX CONTRACTS | | $ 16,681 | | $ 291 |
|
The face value of futures purchased as a percentage of net assets is 1.3% |
Legend |
(a) Non-income producing |
(b) Affiliated fund that is generally available only to investment companies and other accounts managed by Fidelity Investments. The rate quoted is the annualized seven-day yield of the fund at period end. A complete unaudited listing of the fund's holdings as of its most recent quarter end is available upon request. In addition, each Fidelity Central Fund's financial statements, which are not covered by the Fund's Report of Independent Registered Public Accounting Firm, are available on the SEC's website or upon request. |
(c) Investment made with cash collateral received from securities on loan. |
(d) Security or a portion of the security is on loan at period end. |
(e) Security or a portion of the security was pledged to cover margin requirements for futures contracts. At period end, the value of securities pledged amounted to $450,000. |
(f) Restricted securities - Investment in securities not registered under the Securities Act of 1933 (excluding 144A issues). At the end of the period, the value of restricted securities (excluding 144A issues) amounted to $4,580,000 or 0.4% of net assets. |
Additional information on each restricted holding is as follows: |
Security | Acquisition Date | Acquisition Cost (000s) |
Blu Homes, Inc. Series A, 5.00% | 6/21/13 | $ 1,108 |
NJOY, Inc. | 9/11/13 | $ 454 |
Uber Technologies, Inc. 8.00% | 6/6/14 | $ 2,522 |
Affiliated Central Funds |
Information regarding fiscal year to date income earned by the Fund from investments in Fidelity Central Funds is as follows: |
Fund | Income earned
(Amounts in thousands) |
Fidelity Cash Central Fund | $ 38 |
Fidelity Securities Lending Cash Central Fund | 257 |
Total | $ 295 |
Other Information |
The following is a summary of the inputs used, as of June 30, 2014, involving the Fund's assets and liabilities carried at fair value. The inputs or methodology used for valuing securities may not be an indication of the risk associated with investing in those securities. For more information on valuation inputs, and their aggregation into the levels used in the table below, please refer to the Investment Valuation section in the accompanying Notes to Financial Statements. |
Valuation Inputs at Reporting Date: |
Description
(Amounts in thousands) | Total | Level 1 | Level 2 | Level 3 |
Investments in Securities: | | | | |
Equities: | | | | |
Consumer Discretionary | $ 191,826 | $ 189,768 | $ - | $ 2,058 |
Consumer Staples | 110,272 | 110,272 | - | - |
Energy | 109,630 | 109,630 | - | - |
Financials | 95,891 | 95,510 | 381 | - |
Health Care | 183,136 | 183,130 | 6 | - |
Industrials | 132,205 | 132,205 | - | - |
Information Technology | 352,734 | 350,212 | - | 2,522 |
Materials | 61,096 | 61,096 | - | - |
Telecommunication Services | 1,445 | 1,445 | - | - |
Utilities | 3,749 | 3,749 | - | - |
U.S. Government and Government Agency Obligations | 990 | - | 990 | - |
Money Market Funds | 50,611 | 50,611 | - | - |
Total Investments in Securities: | $ 1,293,585 | $ 1,287,628 | $ 1,377 | $ 4,580 |
Derivative Instruments: | | | | |
Assets | | | | |
Futures Contracts | $ 291 | $ 291 | $ - | $ - |
Value of Derivative Instruments |
The following table is a summary of the Fund's value of derivative instruments by primary risk exposure as of June 30, 2014. For additional information on derivative instruments, please refer to the Derivative Instruments section in the accompanying Notes to Financial Statements. |
Primary Risk Exposure /
Derivative Type | Value
(Amount in thousands) |
| Asset | Liability |
Equity Risk | | |
Futures Contracts (a) | $ 291 | $ - |
Total Value of Derivatives | $ 291 | $ - |
(a) Reflects gross cumulative appreciation (depreciation) on futures contracts as presented in the Schedule of Investments. Only the period end receivable or payable for daily variation margin and net unrealized appreciation (depreciation) are presented in the Statement of Assets and Liabilities. |
Distribution of investments by country or territory of incorporation, as a percentage of total net assets, is as follows (Unaudited): |
United States of America | 89.0% |
Ireland | 3.0% |
Bermuda | 1.8% |
India | 1.3% |
Others (Individually Less Than 1%) | 4.9% |
| 100.0% |
See accompanying notes which are an integral part of the financial statements.
Annual Report
Statement of Assets and Liabilities
Amounts in thousands (except per-share amounts) | June 30, 2014 |
| | |
Assets | | |
Investment in securities, at value (including securities loaned of $28,932) - See accompanying schedule: Unaffiliated issuers (cost $947,210) | $ 1,242,974 | |
Fidelity Central Funds (cost $50,611) | 50,611 | |
Total Investments (cost $997,821) | | $ 1,293,585 |
Receivable for investments sold | | 5,110 |
Receivable for fund shares sold | | 2,712 |
Dividends receivable | | 559 |
Distributions receivable from Fidelity Central Funds | | 22 |
Receivable for daily variation margin for derivative instruments | | 27 |
Other receivables | | 28 |
Total assets | | 1,302,043 |
| | |
Liabilities | | |
Payable for investments purchased | $ 8,331 | |
Payable for fund shares redeemed | 945 | |
Accrued management fee | 573 | |
Other affiliated payables | 194 | |
Other payables and accrued expenses | 61 | |
Collateral on securities loaned, at value | 29,501 | |
Total liabilities | | 39,605 |
| | |
Net Assets | | $ 1,262,438 |
Net Assets consist of: | | |
Paid in capital | | $ 1,253,738 |
Undistributed net investment income | | 717 |
Accumulated undistributed net realized gain (loss) on investments and foreign currency transactions | | (288,062) |
Net unrealized appreciation (depreciation) on investments and assets and liabilities in foreign currencies | | 296,045 |
Net Assets | | $ 1,262,438 |
See accompanying notes which are an integral part of the financial statements.
Annual Report
Financial Statements - continued
Statement of Assets and Liabilities - continued
Amounts in thousands (except per-share amounts) | June 30, 2014 |
| | |
Growth Discovery:
Net Asset Value, offering price and redemption price per share ($1,072,065 ÷ 46,465 shares) | | $ 23.07 |
| | |
Class K:
Net Asset Value, offering price and redemption price per share ($190,373 ÷ 8,244 shares) | | $ 23.09 |
See accompanying notes which are an integral part of the financial statements.
Annual Report
Statement of Operations
Amounts in thousands | Year ended June 30, 2014 |
| | |
Investment Income | | |
Dividends | | $ 9,764 |
Income from Fidelity Central Funds | | 295 |
Total income | | 10,059 |
| | |
Expenses | | |
Management fee
Basic fee | $ 6,098 | |
Performance adjustment | 289 | |
Transfer agent fees | 1,805 | |
Accounting and security lending fees | 370 | |
Custodian fees and expenses | 68 | |
Independent trustees' compensation | 5 | |
Registration fees | 58 | |
Audit | 57 | |
Legal | 6 | |
Miscellaneous | 9 | |
Total expenses before reductions | 8,765 | |
Expense reductions | (39) | 8,726 |
Net investment income (loss) | | 1,333 |
Realized and Unrealized Gain (Loss) Net realized gain (loss) on: | | |
Investment securities: | | |
Unaffiliated issuers | 168,737 | |
Foreign currency transactions | (31) | |
Futures contracts | 1,344 | |
Total net realized gain (loss) | | 170,050 |
Change in net unrealized appreciation (depreciation) on: Investment securities | 124,386 | |
Futures contracts | 291 | |
Total change in net unrealized appreciation (depreciation) | | 124,677 |
Net gain (loss) | | 294,727 |
Net increase (decrease) in net assets resulting from operations | | $ 296,060 |
See accompanying notes which are an integral part of the financial statements.
Annual Report
Financial Statements - continued
Statement of Changes in Net Assets
Amounts in thousands | Year ended
June 30,
2014 | Year ended
June 30,
2013 |
Increase (Decrease) in Net Assets | | |
Operations | | |
Net investment income (loss) | $ 1,333 | $ 4,187 |
Net realized gain (loss) | 170,050 | 115,817 |
Change in net unrealized appreciation (depreciation) | 124,677 | 20,585 |
Net increase (decrease) in net assets resulting
from operations | 296,060 | 140,589 |
Distributions to shareholders from net investment income | (1,240) | (3,920) |
Distributions to shareholders from net realized gain | (308) | - |
Total distributions | (1,548) | (3,920) |
Share transactions - net increase (decrease) | 64,284 | (251,662) |
Total increase (decrease) in net assets | 358,796 | (114,993) |
| | |
Net Assets | | |
Beginning of period | 903,642 | 1,018,635 |
End of period (including undistributed net investment income of $717 and undistributed net investment income of $1,230, respectively) | $ 1,262,438 | $ 903,642 |
See accompanying notes which are an integral part of the financial statements.
Annual Report
Financial Highlights - Growth Discovery
Years ended June 30, | 2014 | 2013 | 2012 | 2011 | 2010 |
Selected Per-Share Data | | | | | |
Net asset value, beginning of period | $ 17.45 | $ 15.09 | $ 14.88 | $ 10.54 | $ 9.04 |
Income from Investment Operations | | | | | |
Net investment income (loss) B | .02 | .07 | .04 | .05 | .01 |
Net realized and unrealized gain (loss) | 5.63 | 2.35 | .26 | 4.37 | 1.52 |
Total from investment operations | 5.65 | 2.42 | .30 | 4.42 | 1.53 |
Distributions from net investment income | (.02) | (.06) | (.03) | (.03) | (.03) |
Distributions from net realized gain | (.01) | - | (.06) | (.05) | (.01) |
Total distributions | (.03) | (.06) | (.09) | (.08) | (.03)F |
Net asset value, end of period | $ 23.07 | $ 17.45 | $ 15.09 | $ 14.88 | $ 10.54 |
Total ReturnA | 32.40% | 16.09% | 2.07% | 42.09% | 16.96% |
Ratios to Average Net Assets C, E | | | | | |
Expenses before reductions | .81% | .88% | .81% | .63% | .76% |
Expenses net of fee waivers, if any | .81% | .88% | .81% | .63% | .76% |
Expenses net of all reductions | .81% | .87% | .80% | .62% | .75% |
Net investment income (loss) | .10% | .42% | .27% | .39% | .08% |
Supplemental Data | | | | | |
Net assets, end of period (in millions) | $ 1,072 | $ 767 | $ 875 | $ 932 | $ 604 |
Portfolio turnover rateD | 70% | 62% | 74% | 72% | 87% |
A Total returns would have been lower if certain expenses had not been reduced during the applicable periods shown.
B Calculated based on average shares outstanding during the period.
C Fees and expenses of any underlying Fidelity Central Funds are not included in the Fund's expense ratio. The Fund indirectly bears its proportionate share of the expenses of any underlying Fidelity Central Funds.
D Amount does not include the portfolio activity of any underlying Fidelity Central Funds.
E Expense ratios reflect operating expenses of the class. Expenses before reductions do not reflect amounts reimbursed by the investment adviser or reductions from brokerage service arrangements or reductions from other expense offset arrangements and do not represent the amount paid by the class during periods when reimbursements or reductions occur. Expenses net of fee waivers reflect expenses after reimbursement by the investment adviser but prior to reductions from brokerage service arrangements or other expense offset arrangements. Expenses net of all reductions represent the net expenses paid by the class.
F Total distributions of $.03 per share is comprised of distributions from net investment income of $.027 and distributions from net realized gain of $.005 per share.
See accompanying notes which are an integral part of the financial statements.
Annual Report
Financial Highlights - Class K
Years ended June 30, | 2014 | 2013 | 2012 | 2011 | 2010 |
Selected Per-Share Data | | | | | |
Net asset value, beginning of period | $ 17.45 | $ 15.09 | $ 14.88 | $ 10.55 | $ 9.05 |
Income from Investment Operations | | | | | |
Net investment income (loss) B | .05 | .09 | .06 | .08 | .03 |
Net realized and unrealized gain (loss) | 5.63 | 2.36 | .26 | 4.36 | 1.53 |
Total from investment operations | 5.68 | 2.45 | .32 | 4.44 | 1.56 |
Distributions from net investment income | (.04) | (.09) | (.06) | (.06) | (.05) |
Distributions from net realized gain | (.01) | - | (.06) | (.05) | (.01) |
Total distributions | (.04)H | (.09) | (.11)G | (.11) | (.06)F |
Net asset value, end of period | $ 23.09 | $ 17.45 | $ 15.09 | $ 14.88 | $ 10.55 |
Total ReturnA | 32.62% | 16.28% | 2.27% | 42.26% | 17.25% |
Ratios to Average Net Assets C, E | | | | | |
Expenses before reductions | .68% | .72% | .64% | .44% | .53% |
Expenses net of fee waivers, if any | .68% | .72% | .64% | .44% | .53% |
Expenses net of all reductions | .67% | .71% | .63% | .43% | .52% |
Net investment income (loss) | .24% | .58% | .44% | .58% | .31% |
Supplemental Data | | | | | |
Net assets, end of period (in millions) | $ 190 | $ 137 | $ 144 | $ 147 | $ 43 |
Portfolio turnover rateD | 70% | 62% | 74% | 72% | 87% |
A Total returns would have been lower if certain expenses had not been reduced during the applicable periods shown.
B Calculated based on average shares outstanding during the period.
C Fees and expenses of any underlying Fidelity Central Funds are not included in the Fund's expense ratio. The Fund indirectly bears its proportionate share of the expenses of any underlying Fidelity Central Funds.
D Amount does not include the portfolio activity of any underlying Fidelity Central Funds.
E Expense ratios reflect operating expenses of the class. Expenses before reductions do not reflect amounts reimbursed by the investment adviser or reductions from brokerage service arrangements or reductions from other expense offset arrangements and do not represent the amount paid by the class during periods when reimbursements or reductions occur. Expenses net of fee waivers reflect expenses after reimbursement by the investment adviser but prior to reductions from brokerage service arrangements or other expense offset arrangements. Expenses net of all reductions represent the net expenses paid by the class.
F Total distributions of $.06 per share is comprised of distributions from net investment income of $.054 and distributions from net realized gain of $.005 per share.
G Total distributions of $.11 per share is comprised of distributions from net investment income of $.058 and distributions from net realized gain of $.055 per share.
H Total distributions of $.04 per share is comprised of distributions from net investment income of $.036 and distributions from net realized gain of $.006 per share.
See accompanying notes which are an integral part of the financial statements.
Annual Report
Notes to Financial Statements
For the period ended June 30, 2014
(Amounts in thousands except percentages)
1. Organization.
Fidelity Growth Discovery Fund (the Fund) is a fund of Fidelity Hastings Street Trust (the Trust) and is authorized to issue an unlimited number of shares. The Trust is registered under the Investment Company Act of 1940, as amended (the 1940 Act), as an open-end management investment company organized as a Massachusetts business trust. The Fund offers Growth Discovery and Class K shares, each of which has equal rights as to assets and voting privileges. Each class has exclusive voting rights with respect to matters that affect that class.
2. Investments in Fidelity Central Funds.
The Fund invests in Fidelity Central Funds, which are open-end investment companies generally available only to other investment companies and accounts managed by the investment adviser and its affiliates. The Fund's Schedule of Investments lists each of the Fidelity Central Funds held as of period end, if any, as an investment of the Fund, but does not include the underlying holdings of each Fidelity Central Fund. As an Investing Fund, the Fund indirectly bears its proportionate share of the expenses of the underlying Fidelity Central Funds.
The Money Market Central Funds seek preservation of capital and current income and are managed by Fidelity Investments Money Management, Inc. (FIMM), an affiliate of the investment adviser. Annualized expenses of the Money Market Central Funds as of their most recent shareholder report date are less than .01%.
A complete unaudited list of holdings for each Fidelity Central Fund is available upon request or at the Securities and Exchange Commission (the SEC) website at www.sec.gov. In addition, the financial statements of the Fidelity Central Funds which contain the significant accounting policies (including investment valuation policies) of those funds, which are not covered by the Fund's Report of Independent Registered Public Accounting Firm, are available on the SEC website or upon request.
3. Significant Accounting Policies.
The financial statements have been prepared in conformity with accounting principles generally accepted in the United States of America (GAAP), which require management to make certain estimates and assumptions at the date of the financial statements. Actual results could differ from those estimates. Subsequent events, if any, through the date that the financial statements were issued have been evaluated in the preparation of
Annual Report
3. Significant Accounting Policies - continued
the financial statements. The following summarizes the significant accounting policies of the Fund:
Investment Valuation. Investments are valued as of 4:00 p.m. Eastern time on the last calendar day of the period. In accordance with valuation policies and procedures approved by the Board of Trustees (the Board), the Fund attempts to obtain prices from one or more third party pricing vendors or brokers to value its investments. When current market prices, quotations or currency exchange rates are not readily available or reliable, investments will be fair valued in good faith by the Fidelity Management & Research Company (FMR) Fair Value Committee (the Committee), in accordance with procedures adopted by the Board. Factors used in determining fair value vary by investment type and may include market or investment specific events, changes in interest rates and credit quality. The frequency with which these procedures are used cannot be predicted and they may be utilized to a significant extent. The Committee oversees the Fund's valuation policies and procedures and is responsible for approving and reporting to the Board all fair value determinations.
The Fund categorizes the inputs to valuation techniques used to value its investments into a disclosure hierarchy consisting of three levels as shown below:
Level 1 - quoted prices in active markets for identical investments
Level 2 - other significant observable inputs (including quoted prices for similar investments, interest rates, prepayment speeds, etc.)
Level 3 - unobservable inputs (including the Fund's own assumptions based on the best information available)
Valuation techniques used to value the Fund's investments by major category are as follows:
Equity securities, including restricted securities, for which market quotations are readily available, are valued at the last reported sale price or official closing price as reported by a third party pricing vendor on the primary market or exchange on which they are traded and are categorized as Level 1 in the hierarchy. In the event there were no sales during the day or closing prices are not available, securities are valued at the last quoted bid price or may be valued using the last available price and are generally categorized as Level 2 in the hierarchy. For foreign equity securities, when market or security specific events arise, comparisons to the valuation of American Depositary Receipts (ADRs), futures contracts, Exchange-Traded Funds (ETFs) and certain indexes as well as quoted prices for similar securities may be used and would be categorized as Level 2 in the hierarchy. Utilizing these techniques may result in transfers between Level 1 and Level 2. For equity securities, including restricted securities, where observable inputs are limited, assumptions about market activity and risk are used and these securities may be categorized as Level 3 in the hierarchy.
Annual Report
Notes to Financial Statements - continued
(Amounts in thousands except percentages)
3. Significant Accounting Policies - continued
Investment Valuation - continued
Debt securities, including restricted securities, are valued based on evaluated prices received from third party pricing vendors or from brokers who make markets in such securities. U.S. government and government agency obligations are valued by pricing vendors who utilize matrix pricing which considers yield or price of bonds of comparable quality, coupon, maturity and type or by broker-supplied prices. When independent prices are unavailable or unreliable, debt securities may be valued utilizing pricing methodologies which consider similar factors that would be used by third party pricing vendors. Debt securities are generally categorized as Level 2 in the hierarchy but may be Level 3 depending on the circumstances.
Futures contracts are valued at the settlement price established each day by the board of trade or exchange on which they are traded and are categorized as Level 1 in the hierarchy. Investments in open-end mutual funds, including Fidelity Central Funds, are valued at their closing net asset value (NAV) each business day and are categorized as Level 1 in the hierarchy.
Changes in valuation techniques may result in transfers in or out of an assigned level within the disclosure hierarchy. The aggregate value of investments by input level, as of June 30, 2014, is included at the end of the Fund's Schedule of Investments.
Foreign Currency. The Fund may use foreign currency contracts to facilitate transactions in foreign-denominated securities. Gains and losses from these transactions may arise from changes in the value of the foreign currency or if the counterparties do not perform under the contracts' terms.
Foreign-denominated assets, including investment securities, and liabilities are translated into U.S. dollars at the exchange rates at period end. Purchases and sales of investment securities, income and dividends received and expenses denominated in foreign currencies are translated into U.S. dollars at the exchange rate in effect on the transaction date.
The effects of exchange rate fluctuations on investments are included with the net realized and unrealized gain (loss) on investment securities. Other foreign currency transactions resulting in realized and unrealized gain (loss) are disclosed separately.
Investment Transactions and Income. For financial reporting purposes, the Fund's investment holdings and NAV include trades executed through the end of the last business day of the period. The NAV per share for processing shareholder transactions is calculated as of the close of business of the New York Stock Exchange (NYSE), normally 4:00 p.m. Eastern time and includes trades executed through the end of the prior business day. Gains and losses on securities sold are determined on the basis of identified
Annual Report
3. Significant Accounting Policies - continued
Investment Transactions and Income - continued
cost and may include proceeds received from litigation. Dividend income is recorded on the ex-dividend date, except for certain dividends from foreign securities where the ex-dividend date may have passed, which are recorded as soon as the Fund is informed of the ex-dividend date. Non-cash dividends included in dividend income, if any, are recorded at the fair market value of the securities received. Income and capital gain distributions from Fidelity Central Funds, if any, are recorded on the ex-dividend date. Distributions received on securities that represent a return of capital or capital gain are recorded as a reduction of cost of investments and/or as a realized gain. Subsequent to ex-dividend date the Fund determines the components of these distributions, based upon receipt of tax filings or other correspondence relating to the underlying investment. Interest income is accrued as earned and includes coupon interest and amortization of premium and accretion of discount on debt securities as applicable. Investment income is recorded net of foreign taxes withheld where recovery of such taxes is uncertain.
Class Allocations and Expenses. Investment income, realized and unrealized capital gains and losses, common expenses of the Fund, and certain fund-level expense reductions, if any, are allocated daily on a pro-rata basis to each class based on the relative net assets of each class to the total net assets of the Fund. Each class differs with respect to transfer agent fees incurred. Certain expense reductions may also differ by class. For the reporting period, the allocated portion of income and expenses to each class as a percent of its average net assets may vary due to the timing of recording these transactions in relation to fluctuating net assets of the classes. Expenses directly attributable to a fund are charged to that fund. Expenses attributable to more than one fund are allocated among the respective funds on the basis of relative net assets or other appropriate methods. Expense estimates are accrued in the period to which they relate and adjustments are made when actual amounts are known.
Income Tax Information and Distributions to Shareholders. Each year, the Fund intends to qualify as a regulated investment company under Subchapter M of the Internal Revenue Code, including distributing substantially all of its taxable income and realized gains. As a result, no provision for U.S. Federal income taxes is required. As of June 30, 2014, the Fund did not have any unrecognized tax benefits in the financial statements; nor is the Fund aware of any tax positions for which it is reasonably possible that the total amounts of unrecognized tax benefits will significantly change in the next twelve months. The Fund files a U.S. federal tax return, in addition to state and local tax returns as required. The Fund's federal income tax returns are subject to examination by the Internal Revenue Service (IRS) for a period of three fiscal years after they are filed. State and local tax returns may be subject to examination for an additional fiscal year depending on the jurisdiction. Foreign taxes are provided for based on the Fund's understanding of the tax rules and rates that exist in the foreign markets in which it invests.
Annual Report
Notes to Financial Statements - continued
(Amounts in thousands except percentages)
3. Significant Accounting Policies - continued
Income Tax Information and Distributions to Shareholders - continued
Distributions are declared and recorded on the ex-dividend date. Income dividends and capital gain distributions are declared separately for each class. Income and capital gain distributions are determined in accordance with income tax regulations, which may differ from GAAP.
Capital accounts within the financial statements are adjusted for permanent book-tax differences. These adjustments have no impact on net assets or the results of operations. Capital accounts are not adjusted for temporary book-tax differences which will reverse in a subsequent period.
Book-tax differences are primarily due to futures contracts, foreign currency transactions, partnerships, capital loss carryforwards and losses deferred due to wash sales.
The federal tax cost of investment securities and unrealized appreciation (depreciation) as of period end were as follows:
Gross unrealized appreciation | $ 305,020 |
Gross unrealized depreciation | (11,882) |
Net unrealized appreciation (depreciation) on securities and other investments | $ 293,138 |
| |
Tax Cost | $ 1,000,447 |
The tax-based components of distributable earnings as of period end were as follows:
Undistributed ordinary income | $ 717 |
Capital loss carryforward | $ (285,145) |
Net unrealized appreciation (depreciation) | $ 293,128 |
Capital loss carryforwards are only available to offset future capital gains of the Fund to the extent provided by regulations and may be limited. Under the Regulated Investment Company Modernization Act of 2010 (the Act), the Fund is permitted to carry forward capital losses incurred in taxable years beginning after December 22, 2010 for an unlimited period and such capital losses are required to be used prior to any losses that expire. The capital loss carryforward information presented below, including any applicable limitation, is estimated as of fiscal period end and is subject to adjustment.
Annual Report
3. Significant Accounting Policies - continued
Income Tax Information and Distributions to Shareholders - continued
Fiscal year of expiration | |
2017 | $ (24,714) |
2018 | (260,431) |
Total capital loss carryforward | $ (285,145) |
The tax character of distributions paid was as follows:
| June 30, 2014 | June 30, 2013 |
Ordinary Income | $ 1,548 | $ 3,920 |
Restricted Securities. The Fund may invest in securities that are subject to legal or contractual restrictions on resale. These securities generally may be resold in transactions exempt from registration or to the public if the securities are registered. Disposal of these securities may involve time-consuming negotiations and expense, and prompt sale at an acceptable price may be difficult. Information regarding restricted securities is included at the end of the Fund's Schedule of Investments.
4. Derivative Instruments.
Risk Exposures and the Use of Derivative Instruments. The Fund's investment objective allows the Fund to enter into various types of derivative contracts, including futures contracts. Derivatives are investments whose value is primarily derived from underlying assets, indices or reference rates and may be transacted on an exchange or over-the-counter (OTC). Derivatives may involve a future commitment to buy or sell a specified asset based on specified terms, to exchange future cash flows at periodic intervals based on a notional principal amount, or for one party to make one or more payments upon the occurrence of specified events in exchange for periodic payments from the other party.
The Fund used derivatives to increase returns and to manage exposure to certain risks as defined below. The success of any strategy involving derivatives depends on analysis of numerous economic factors, and if the strategies for investment do not work as intended, the Fund may not achieve its objectives.
The Fund's use of derivatives increased or decreased its exposure to the following risk:
Equity Risk | Equity risk relates to the fluctuations in the value of financial instruments as a result of changes in market prices (other than those arising from interest rate risk or foreign exchange risk), whether caused by factors specific to an individual investment, its issuer, or all factors affecting all instruments traded in a market or market segment. |
Annual Report
Notes to Financial Statements - continued
(Amounts in thousands except percentages)
4. Derivative Instruments - continued
Risk Exposures and the Use of Derivative Instruments - continued
The Fund is also exposed to additional risks from investing in derivatives, such as liquidity risk and counterparty credit risk. Liquidity risk is the risk that the Fund will be unable to close out the derivative in the open market in a timely manner. Counterparty credit risk is the risk that the counterparty will not be able to fulfill its obligation to the Fund. Counterparty credit risk related to exchange-traded futures contracts may be mitigated by the protection provided by the exchange on which they trade.
Investing in derivatives may involve greater risks than investing in the underlying assets directly and, to varying degrees, may involve risk of loss in excess of any initial investment and collateral received and amounts recognized in the Statement of Assets and Liabilities. In addition, there may be the risk that the change in value of the derivative contract does not correspond to the change in value of the underlying instrument.
Futures Contracts. A futures contract is an agreement between two parties to buy or sell a specified underlying instrument for a fixed price at a specified future date. The Fund used futures contracts to manage its exposure to the stock market.
Upon entering into a futures contract, a fund is required to deposit either cash or securities (initial margin) with a clearing broker in an amount equal to a certain percentage of the face value of the contract. Futures contracts are marked-to-market daily and subsequent daily payments (variation margin) are made or received by a fund depending on the daily fluctuations in the value of the futures contracts and are recorded as unrealized appreciation or (depreciation). This receivable and/or payable, if any, is included in daily variation margin for derivative instruments in the Statement of Assets and Liabilities. Realized gain or (loss) is recorded upon the expiration or closing of a futures contract.
Any open futures contracts at period end are presented in the Schedule of Investments under the caption "Futures Contracts." The underlying face amount at value reflects each contract's exposure to the underlying instrument or index at period end and is representative of volume of activity during the period. Securities deposited to meet initial margin requirements are identified in the Schedule of Investments.
During the period the Fund recognized net realized gain (loss) of $1,344 and a change in net unrealized appreciation (depreciation) of $291 related to its investment in futures contracts. These amounts are included in the Statement of Operations.
5. Purchases and Sales of Investments.
Purchases and sales of securities, other than short-term securities, aggregated $805,090 and $750,433, respectively.
Annual Report
6. Fees and Other Transactions with Affiliates.
Management Fee. Fidelity Management & Research Company (the investment adviser) and its affiliates provide the Fund with investment management related services for which the Fund pays a monthly management fee. The management fee is the sum of an individual fund fee rate that is based on an annual rate of .30% of the Fund's average net assets and an annualized group fee rate that averaged .25% during the period. The group fee rate is based upon the average net assets of all the mutual funds advised by the investment adviser, including any mutual funds previously advised by the investment adviser that are currently advised by Fidelity SelectCo, LLC, an affiliate of the investment adviser. The group fee rate decreases as assets under management increase and increases as assets under management decrease. In addition, the management fee is subject to a performance adjustment (up to a maximum of ± .20% of the Fund's average net assets over a 36 month performance period). The upward or downward adjustment to the management fee is based on the relative investment performance of Growth Discovery as compared to its benchmark index, the Russell 3000 Growth Index, over the same 36 month performance period. For the reporting period, the total annual management fee rate, including the performance adjustment, was .58% of the Fund's average net assets. The performance adjustment included in the management fee rate may be higher or lower than the maximum performance adjustment rate due to the difference between the average net assets for the reporting and performance periods.
Transfer Agent Fees. Fidelity Investments Institutional Operations Company, Inc., (FIIOC), an affiliate of the investment adviser, is the transfer, dividend disbursing and shareholder servicing agent for each class of the Fund. FIIOC receives account fees and asset-based fees that vary according to the account size and type of account of the shareholders of Growth Discovery. FIIOC receives an asset-based fee of Class K's average net assets. FIIOC pays for typesetting, printing and mailing of shareholder reports, except proxy statements.
For the period, transfer agent fees for each class were as follows:
| Amount | % of
Average
Net Assets |
Growth Discovery | $ 1,728 | .18 |
Class K | 77 | .05 |
| $ 1,805 | |
Accounting and Security Lending Fees. Fidelity Service Company, Inc. (FSC), an affiliate of the investment adviser, maintains the Fund's accounting records. The accounting fee is based on the level of average net assets for each month. Under a separate contract, FSC administers the security lending program. The security lending fee is based on the number and duration of lending transactions.
Annual Report
Notes to Financial Statements - continued
(Amounts in thousands except percentages)
6. Fees and Other Transactions with Affiliates - continued
Brokerage Commissions. The Fund placed a portion of its portfolio transactions with brokerage firms which are affiliates of the investment adviser or Sub-adviser. Brokerage commissions are included in net realized gain (loss) and change in net unrealized appreciation (depreciation) in the Statement of Operations. The commissions paid to these affiliated firms were $11 for the period.
7. Committed Line of Credit.
The Fund participates with other funds managed by the investment adviser or an affiliate in a $4.25 billion credit facility (the "line of credit") to be utilized for temporary or emergency purposes to fund shareholder redemptions or for other short-term liquidity purposes. The Fund has agreed to pay commitment fees on its pro-rata portion of the line of credit, which amounted to $2 and is reflected in Miscellaneous expenses on the Statement of Operations. During the period, the Fund did not borrow on this line of credit.
8. Security Lending.
The Fund lends portfolio securities through a lending agent from time to time in order to earn additional income. For equity securities, a lending agent is used and may loan securities to certain qualified borrowers, including Fidelity Capital Markets (FCM), a broker-dealer affiliated with the Fund. On the settlement date of the loan, the Fund receives collateral (in the form of U.S. Treasury obligations, letters of credit and/or cash) against the loaned securities and maintains collateral in an amount not less than 100% of the market value of the loaned securities during the period of the loan. The market value of the loaned securities is determined at the close of business of the Fund and any additional required collateral is delivered to the Fund on the next business day. If the borrower defaults on its obligation to return the securities loaned because of insolvency or other reasons, the Fund may apply collateral received from the borrower against the obligation. The Fund may experience delays and costs in recovering the securities loaned. Any cash collateral received is invested in the Fidelity Securities Lending Cash Central Fund. The value of loaned securities and cash collateral at period end are disclosed on the Fund's Statement of Assets and Liabilities. At period end, there were no security loans outstanding with FCM. Security lending income represents the income earned on investing cash collateral, less rebates paid to borrowers and any lending agent fees associated with the loan, plus any premium payments received for lending certain types of securities. Security lending income is presented in the Statement of Operations as a component of income from Fidelity Central Funds. Total security lending income during the period amounted to $257, including $2 from securities loaned to FCM.
Annual Report
9. Expense Reductions.
Commissions paid to certain brokers with whom the investment adviser, or its affiliates, places trades on behalf of the Fund include an amount in addition to trade execution, which may be rebated back to the Fund to offset certain expenses. This amount totaled $28 for the period.
In addition, the investment adviser reimbursed a portion of the Fund's operating expenses during the period in the amount of $11.
10. Distributions to Shareholders.
Distributions to shareholders of each class were as follows:
Years ended June 30, | 2014 | 2013 |
From net investment income | | |
Growth Discovery | $ 959 | $ 3,196 |
Class K | 281 | 724 |
Total | $ 1,240 | $ 3,920 |
From net realized gain | | |
Growth Discovery | $ 261 | $ - |
Class K | 47 | - |
Total | $ 308 | $ - |
11. Share Transactions.
Transactions for each class of shares were as follows:
| Shares | Dollars |
Years ended June 30, | 2014 | 2013 | 2014 | 2013 |
Growth Discovery | | | | |
Shares sold | 11,432 | 5,161 | $ 240,406 | $ 82,537 |
Reinvestment of distributions | 61 | 198 | 1,152 | 3,039 |
Shares redeemed | (8,980) | (19,383) | (186,625) | (309,727) |
Net increase (decrease) | 2,513 | (14,024) | $ 54,933 | $ (224,151) |
Class K | | | | |
Shares sold | 2,259 | 3,128 | $ 47,861 | $ 49,663 |
Reinvestment of distributions | 17 | 47 | 328 | 724 |
Shares redeemed | (1,868) | (4,878) | (38,838) | (77,898) |
Net increase (decrease) | 408 | (1,703) | $ 9,351 | $ (27,511) |
Annual Report
Notes to Financial Statements - continued
(Amounts in thousands except percentages)
12. Other.
The Fund's organizational documents provide former and current trustees and officers with a limited indemnification against liabilities arising in connection with the performance of their duties to the Fund. In the normal course of business, the Fund may also enter into contracts that provide general indemnifications. The Fund's maximum exposure under these arrangements is unknown as this would be dependent on future claims that may be made against the Fund. The risk of material loss from such claims is considered remote.
Annual Report
To the Trustees of Fidelity Hastings Street Trust and the Shareholders of Fidelity Growth Discovery Fund:
In our opinion, the accompanying statement of assets and liabilities, including the schedule of investments, and the related statements of operations and of changes in net assets and the financial highlights present fairly, in all material respects, the financial position of Fidelity Growth Discovery Fund (a fund of Fidelity Hastings Street Trust) at June 30, 2014, the results of its operations for the year then ended, the changes in its net assets for each of the two years in the period then ended and the financial highlights for each of the five years in the period then ended, in conformity with accounting principles generally accepted in the United States of America. These financial statements and financial highlights (hereafter referred to as "financial statements") are the responsibility of the Fidelity Growth Discovery Fund's management. Our responsibility is to express an opinion on these financial statements based on our audits. We conducted our audits of these financial statements in accordance with the standards of the Public Company Accounting Oversight Board (United States). Those standards require that we plan and perform the audit to obtain reasonable assurance about whether the financial statements are free of material misstatement. An audit includes examining, on a test basis, evidence supporting the amounts and disclosures in the financial statements, assessing the accounting principles used and significant estimates made by management, and evaluating the overall financial statement presentation. We believe that our audits, which included confirmation of securities at June 30, 2014 by correspondence with the custodian and brokers, provide a reasonable basis for our opinion.
PricewaterhouseCoopers LLP
Boston, Massachusetts
August 11, 2014
Annual Report
The Trustees, Member of the Advisory Board, and officers of the trust and fund, as applicable, are listed below. The Board of Trustees governs the fund and is responsible for protecting the interests of shareholders. The Trustees are experienced executives who meet periodically throughout the year to oversee the fund's activities, review contractual arrangements with companies that provide services to the fund, oversee management of the risks associated with such activities and contractual arrangements, and review the fund's performance. Except for James C. Curvey, each of the Trustees oversees 173 funds. Mr. Curvey oversees 397 funds.
The Trustees hold office without limit in time except that (a) any Trustee may resign; (b) any Trustee may be removed by written instrument, signed by at least two-thirds of the number of Trustees prior to such removal; (c) any Trustee who requests to be retired or who has become incapacitated by illness or injury may be retired by written instrument signed by a majority of the other Trustees; and (d) any Trustee may be removed at any special meeting of shareholders by a two-thirds vote of the outstanding voting securities of the trust. Each Trustee who is not an interested person (as defined in the 1940 Act) of the trust and the fund (Independent Trustee), shall retire not later than the last day of the calendar year in which his or her 75th birthday occurs. The Independent Trustees may waive this mandatory retirement age policy with respect to individual Trustees. The officers and Advisory Board Member hold office without limit in time, except that any officer and Advisory Board Member may resign or may be removed by a vote of a majority of the Trustees at any regular meeting or any special meeting of the Trustees. Except as indicated, each individual has held the office shown or other offices in the same company for the past five years.
Experience, Skills, Attributes, and Qualifications of the Fund's Trustees. The Governance and Nominating Committee has adopted a statement of policy that describes the experience, qualifications, attributes, and skills that are necessary and desirable for potential Independent Trustee candidates (Statement of Policy). The Board believes that each Trustee satisfied at the time he or she was initially elected or appointed a Trustee, and continues to satisfy, the standards contemplated by the Statement of Policy. The Governance and Nominating Committee also engages professional search firms to help identify potential Independent Trustee candidates who have the experience, qualifications, attributes, and skills consistent with the Statement of Policy. From time to time, additional criteria based on the composition and skills of the current Independent Trustees, as well as experience or skills that may be appropriate in light of future changes to board composition, business conditions, and regulatory or other developments, have also been considered by the professional search firms and the Governance and Nominating Committee. In addition, the Board takes into account the Trustees' commitment and participation in Board and committee meetings, as well as their leadership of standing and ad hoc committees throughout their tenure.
In determining that a particular Trustee was and continues to be qualified to serve as a Trustee, the Board has considered a variety of criteria, none of which, in isolation, was controlling. The Board believes that, collectively, the Trustees have balanced and diverse experience, qualifications, attributes, and skills, which allow the Board to operate effectively in governing the fund and protecting the interests of shareholders. Information about the specific experience, skills, attributes, and qualifications of each Trustee, which in each case led to the Board's conclusion that the Trustee should serve (or continue to serve) as a trustee of the fund, is provided below.
Annual Report
Board Structure and Oversight Function. James C. Curvey is an interested person (as defined in the 1940 Act) and currently serves as Chairman. The Trustees have determined that an interested Chairman is appropriate and benefits shareholders because an interested Chairman has a personal and professional stake in the quality and continuity of services provided to the fund. Independent Trustees exercise their informed business judgment to appoint an individual of their choosing to serve as Chairman, regardless of whether the Trustee happens to be independent or a member of management. The Independent Trustees have determined that they can act independently and effectively without having an Independent Trustee serve as Chairman and that a key structural component for assuring that they are in a position to do so is for the Independent Trustees to constitute a substantial majority for the Board. The Independent Trustees also regularly meet in executive session. Ned C. Lautenbach serves as Chairman of the Independent Trustees and as such (i) acts as a liaison between the Independent Trustees and management with respect to matters important to the Independent Trustees and (ii) with management prepares agendas for Board meetings.
Fidelity funds are overseen by different Boards of Trustees. The fund's Board oversees Fidelity's equity and high income funds and another Board oversees Fidelity's investment-grade bond, money market, and asset allocation funds. The asset allocation funds may invest in Fidelity funds overseen by the fund's Board. The use of separate Boards, each with its own committee structure, allows the Trustees of each group of Fidelity funds to focus on the unique issues of the funds they oversee, including common research, investment, and operational issues. On occasion, the separate Boards establish joint committees to address issues of overlapping consequences for the Fidelity funds overseen by each Board.
The Trustees operate using a system of committees to facilitate the timely and efficient consideration of all matters of importance to the Trustees, the fund, and fund shareholders and to facilitate compliance with legal and regulatory requirements and oversight of the fund's activities and associated risks. The Board, acting through its committees, has charged FMR and its affiliates with (i) identifying events or circumstances the occurrence of which could have demonstrably adverse effects on the fund's business and/or reputation; (ii) implementing processes and controls to lessen the possibility that such events or circumstances occur or to mitigate the effects of such events or circumstances if they do occur; and (iii) creating and maintaining a system designed to evaluate continuously business and market conditions in order to facilitate the identification and implementation processes described in (i) and (ii) above. Because the day-to-day operations and activities of the fund are carried out by or through FMR, its affiliates and other service providers, the fund's exposure to risks is mitigated but not eliminated by the processes overseen by the Trustees. While each of the Board's committees has responsibility for overseeing different aspects of the fund's activities, oversight is exercised primarily through the Operations, Audit, and Compliance Committees. In addition, the Independent Trustees have worked with FMR to enhance the Board's oversight of investment and financial risks, legal and regulatory risks, technology risks, and operational risks, including the development of additional risk reporting to the Board. For example, a working group comprised of Independent Trustees and FMR has worked and continues to work to review the Fidelity funds' valuation-related activities, reporting and risk management. Appropriate personnel, including but not limited to the fund's Chief Compliance Officer (CCO), FMR's internal auditor, the independent accountants, the fund's Treasurer and portfolio management personnel, make periodic reports to the Board's committees, as appropriate, including an annual review of FMR's risk management program for the Fidelity funds. The responsibilities of each standing committee, including their oversight responsibilities, are described further under "Standing Committees of the Fund's Trustees."
Annual Report
Trustees and Officers - continued
The fund's Statements of Additional Information (SAI) includes more information about the Trustees. To request a free copy, call Fidelity at 1-800-544-8544.
Interested Trustees*:
Correspondence intended for each Trustee who is an interested person may be sent to Fidelity Investments, 245 Summer Street, Boston, Massachusetts 02210.
Name, Year of Birth; Principal Occupations and Other Relevant Experience+ |
James C. Curvey (1935) |
Year of Election or Appointment: 2007 Trustee Chairman of the Board of Trustees |
| Mr. Curvey also serves as Trustee of other Fidelity funds. Mr. Curvey is a Director of Fidelity Research & Analysis Co. (2009-present), and Vice Chairman (2007-present) and Director of FMR LLC. In addition, Mr. Curvey serves as an Overseer for the Boston Symphony Orchestra and a member of the Trustees of Villanova University. Previously, Mr. Curvey served as a Director of Fidelity Investments Money Management, Inc. (2009-2014), a Director of FMR (2007-2014), a Director of FMR Co., Inc. (2007-2014) and was the Vice Chairman (2006-2007) and Director (2000-2007) of FMR Corp. |
Charles S. Morrison (1960) |
Year of Election or Appointment: 2014 Trustee |
| Mr. Morrison also serves as Trustee of other funds. He serves as President, Asset Management (2014-present) and is an employee of Fidelity Investments. Previously, Mr. Morrison served as Vice President of Fidelity's Fixed Income and Asset Allocation Funds (2012-2014), President, Fixed Income (2011-2014), Vice President of Fidelity's Money Market Funds (2005-2009), President, Money Market Group Leader of FMR (2009), and Senior Vice President, Money Market Group of FMR (2004-2009). Mr. Morrison also served as Vice President of Fidelity's Bond Funds (2002-2005), certain Balanced Funds (2002-2005), and certain Asset Allocation Funds (2002-2007), and as Senior Vice President (2002-2005) of Fidelity's Bond Division. |
* Trustees have been determined to be "Interested Trustees" by virtue of, among other things, their affiliation with the trust or various entities under common control with FMR.
+ The information above includes each Trustee's principal occupation during the last five years and other information relating to the experience, attributes, and skills relevant to each Trustee's qualifications to serve as a Trustee, which led to the conclusion that each Trustee should serve as a Trustee for the fund.
Annual Report
Trustees and Officers - continued
Independent Trustees:
Correspondence intended for each Independent Trustee (that is, the Trustees other than the Interested Trustees) may be sent to Fidelity Investments, P.O. Box 55235, Boston, Massachusetts 02205-5235.
Name, Year of Birth; Principal Occupations and Other Relevant Experience+ |
Dennis J. Dirks (1948) |
Year of Election or Appointment: 2005 Trustee |
| Mr. Dirks also serves as Trustee of other Fidelity funds. Prior to his retirement in May 2003, Mr. Dirks was Chief Operating Officer and a member of the Board of The Depository Trust & Clearing Corporation (DTCC). He also served as President, Chief Operating Officer, and Board member of The Depository Trust Company (DTC) and President and Board member of the National Securities Clearing Corporation (NSCC). In addition, Mr. Dirks served as Chief Executive Officer and Board member of the Government Securities Clearing Corporation, Chief Executive Officer and Board member of the Mortgage-Backed Securities Clearing Corporation, as a Trustee and a member of the Finance Committee of Manhattan College (2005-2008), and as a Trustee and a member of the Finance Committee of AHRC of Nassau County (2006-2008). Mr. Dirks is a member of the Independent Directors Council (IDC) Governing Council (2010-present) and Board of Directors for The Brookville Center for Children's Services, Inc. (2009-present). |
Alan J. Lacy (1953) |
Year of Election or Appointment: 2008 Trustee |
| Mr. Lacy also serves as Trustee of other Fidelity funds. Mr. Lacy serves as Senior Adviser (2007-present) of Oak Hill Capital Partners, L.P. (private equity). Mr. Lacy also served as Chief Executive Officer (2000-2005) and Vice Chairman (2005-2006) of Sears Holdings Corporation and Sears, Roebuck and Co. (retail). In addition, Mr. Lacy serves as a member of the Board of Directors of Dave & Buster's Entertainment, Inc. (restaurant and entertainment complexes, 2010-present), Earth Fare, Inc. (retail grocery, 2012-present), The Hillman Companies, Inc. (hardware wholesalers, 2010-present), and Bristol-Myers Squibb Company (global pharmaceuticals, 2008-present). Mr. Lacy is a member of the Board of Trustees of The National Parks Conservation Association (2006-present). Previously, Mr. Lacy served as Chairman of the Board of Trustees of the National Parks Conservation Association (2008-2011) and as a member of the Board of Directors for the Western Union Company (global money transfer, 2006-2011). |
Ned C. Lautenbach (1944) |
Year of Election or Appointment: 2000 Trustee Chairman of the Independent Trustees |
| Mr. Lautenbach also serves as Trustee of other Fidelity funds. Mr. Lautenbach currently serves as the Lead Director of the Eaton Corporation Board of Directors (diversified industrial, 1997-present). Mr. Lautenbach is Chairman of the Board of Directors of the Philharmonic Center for the Arts in Naples, Florida (2012-present) and a member of the Council on Foreign Relations (1994-present). Previously, Mr. Lautenbach was a Partner/Advisory Partner at Clayton, Dubilier & Rice, LLC (private equity investment, 1998-2010), as well as a Director of Sony Corporation (2006-2007). |
Joseph Mauriello (1944) |
Year of Election or Appointment: 2008 Trustee |
| Mr. Mauriello also serves as Trustee of other Fidelity funds. Prior to his retirement in January 2006, Mr. Mauriello served in numerous senior management positions including Deputy Chairman and Chief Operating Officer (2004-2005), and Vice Chairman of Financial Services (2002-2004) of KPMG LLP US (professional services, 1965-2005). Mr. Mauriello currently serves as a member of the Board of Directors of XL Group plc. (global insurance and re-insurance, 2006-present). Previously, Mr. Mauriello served as a Director of the Hamilton Funds of the Bank of New York (2006-2007) and of Arcadia Resources Inc. (health care services and products, 2007-2012). |
Robert W. Selander (1950) |
Year of Election or Appointment: 2011 Trustee |
| Mr. Selander also serves as Trustee of other Fidelity funds. Previously, Mr. Selander served as a Member of the Advisory Board of other Fidelity funds (2011), and Executive Vice Chairman (2010), Chief Executive Officer (2009-2010), and President and Chief Executive Officer (1997-2009) of Mastercard, Inc. |
Cornelia M. Small (1944) |
Year of Election or Appointment: 2005 Trustee |
| Ms. Small also serves as Trustee of other Fidelity funds. Ms. Small is a member of the Board of Directors (2009-present) and Chair of the Investment Committee (2010-present) of the Teagle Foundation. Ms. Small also serves on the Investment Committee of the Berkshire Taconic Community Foundation (2008-present). Previously, Ms. Small served as Chairperson (2002-2008) and a member of the Investment Committee and Chairperson (2008-2012) and a member of the Board of Trustees of Smith College. In addition, Ms. Small served as Chief Investment Officer, Director of Global Equity Investments, and a member of the Board of Directors of Scudder, Stevens & Clark and Scudder Kemper Investments. |
William S. Stavropoulos (1939) |
Year of Election or Appointment: 2001 Trustee Vice Chairman of the Independent Trustees |
| Mr. Stavropoulos also serves as Trustee of other Fidelity funds. Mr. Stavropoulos serves as President and Founder of the Michigan Baseball Foundation, the Great Lakes Loons (2007-present). Mr. Stavropoulos is Chairman Emeritus of the Board of Directors of The Dow Chemical Company, where he previously served in numerous senior management positions, including President, CEO (1995-2000; 2002-2004), Chairman of the Executive Committee (2000-2006), and as a member of the Board of Directors (1990-2006). Currently, Mr. Stavropoulos is Chairman of the Board of Directors of Univar Inc. (global distributor of commodity and specialty chemicals), a Director of Teradata Corporation (data warehousing and technology solutions), and Maersk Inc. (industrial conglomerate), and a member of the Advisory Board for Metalmark Capital LLC (private equity investment, 2005-present). Mr. Stavropoulos is an operating advisor to Clayton, Dubilier & Rice, LLC (private equity investment). In addition, Mr. Stavropoulos is a member of the University of Notre Dame Advisory Council for the College of Science, a Trustee of the Rollin L. Gerstacker Foundation, and a Director of the Naples Philharmonic Center for the Arts. Previously, Mr. Stavropoulos served as a Director of Chemical Financial Corporation (bank holding company, 1993-2012) and Tyco International, Ltd. (multinational manufacturing and services, 2007-2012). |
David M. Thomas (1949) |
Year of Election or Appointment: 2008 Trustee |
| Mr. Thomas also serves as Trustee of other Fidelity funds. Mr. Thomas serves as Non-Executive Chairman of the Board of Directors of Fortune Brands Home and Security (home and security products, 2011-present), and as a member of the Board of Directors of Interpublic Group of Companies, Inc. (marketing communication, 2004-present). Previously, Mr. Thomas served as Executive Chairman (2005-2006) and Chairman and Chief Executive Officer (2000-2005) of IMS Health, Inc. (pharmaceutical and healthcare information solutions), and a Director of Fortune Brands, Inc. (consumer products, 2000-2011). |
+ The information above includes each Trustee's principal occupation during the last five years and other information relating to the experience, attributes, and skills relevant to each Trustee's qualifications to serve as a Trustee, which led to the conclusion that each Trustee should serve as a Trustee for the fund.
Advisory Board Member and Officers:
Correspondence intended for each officer and Peter S. Lynch may be sent to Fidelity Investments, 245 Summer Street, Boston, Massachusetts 02210. Officers appear below in alphabetical order.
Name, Year of Birth; Principal Occupation |
Peter S. Lynch (1944) |
Year of Election or Appointment: 2003 Member of the Advisory Board |
| Mr. Lynch also serves as Member of the Advisory Board of other Fidelity funds. Mr. Lynch is Vice Chairman and a Director of FMR and FMR Co., Inc. In addition, Mr. Lynch serves as a Trustee of Boston College and as the Chairman of the Inner-City Scholarship Fund. Previously, Mr. Lynch served on the Special Olympics International Board of Directors (1997-2006). |
Elizabeth Paige Baumann (1968) |
Year of Election or Appointment: 2012 Anti-Money Laundering (AML) Officer |
| Ms. Baumann also serves as AML Officer of other funds. She is Chief AML Officer of FMR LLC (2012-present) and is an employee of Fidelity Investments. Previously, Ms. Baumann served as Vice President and Deputy Anti-Money Laundering Officer (2007-2012). |
William C. Coffey (1969) |
Year of Election or Appointment: 2009 Assistant Secretary |
| Mr. Coffey also serves as Assistant Secretary of other funds. He is Senior Vice President and Deputy General Counsel of FMR LLC (2010-present), and is an employee of Fidelity Investments. Previously, Mr. Coffey served as Vice President and Associate General Counsel of FMR LLC (2005-2009). |
Jonathan Davis (1968) |
Year of Election or Appointment: 2010 Assistant Treasurer |
| Mr. Davis also serves as Assistant Treasurer of other funds. Mr. Davis is an employee of Fidelity Investments. Previously, Mr. Davis served as Vice President and Associate General Counsel of FMR LLC (2003-2010). |
Adrien E. Deberghes (1967) |
Year of Election or Appointment: 2008 Deputy Treasurer |
| Mr. Deberghes also serves as an officer of other funds. He is an employee of Fidelity Investments (2008-present). Prior to joining Fidelity Investments, Mr. Deberghes was Senior Vice President of Mutual Fund Administration at State Street Corporation (2007-2008), Senior Director of Mutual Fund Administration at Investors Bank & Trust (2005-2007), and Director of Finance for Dunkin' Brands (2000-2005). |
Stephanie J. Dorsey (1969) |
Year of Election or Appointment: 2010 Assistant Treasurer |
| Ms. Dorsey also serves as an officer of other funds. She is an employee of Fidelity Investments (2008-present) and has served in other fund officer roles. Prior to joining Fidelity Investments, Ms. Dorsey served as Treasurer (2004-2008) of the JPMorgan Mutual Funds and Vice President (2004-2008) of JPMorgan Chase Bank. |
Howard J. Galligan III (1966) |
Year of Election or Appointment: 2014 Chief Financial Officer |
| Mr. Galligan also serves as Chief Financial Officer of other funds. Mr. Galligan serves as President of Fidelity Pricing and Cash Management Services (FPCMS) (2014-present) and as a Director of Strategic Advisers, Inc. (2008-present). Previously, Mr. Galligan served as Chief Administrative Officer of Asset Management (2011-2014) and Chief Operating Officer and Senior Vice President of Investment Support for Strategic Advisers, Inc. (2003-2011). |
Scott C. Goebel (1968) |
Year of Election or Appointment: 2008 Secretary and Chief Legal Officer (CLO) |
| Mr. Goebel serves as Secretary and CLO of other funds. Mr. Goebel also serves as Secretary of Fidelity SelectCo, LLC (2013-present), Fidelity Investments Money Management, Inc. (FIMM) (2010-present) and Fidelity Research and Analysis Company (FRAC) (2010-present); General Counsel, Secretary, and Senior Vice President of FMR (2008-present) and FMR Co., Inc. (2008-present); Chief Legal Officer of Fidelity Management & Research (Hong Kong) Limited (2008-present); and Assistant Secretary of Fidelity Management & Research (Japan) Inc. (2008-present) and Fidelity Management & Research (U.K.) Inc. (2008-present). Previously, Mr. Goebel served as Secretary and CLO of other Fidelity funds (2008-2013), Assistant Secretary of FIMM (2008-2010), FRAC (2008-2010), and certain funds (2007-2008); and as Vice President and Secretary of Fidelity Distributors Corporation (FDC) (2005-2007). Mr. Goebel has been employed by FMR LLC or an affiliate since 2001. |
Brian B. Hogan (1964) |
Year of Election or Appointment: 2009 Vice President |
| Mr. Hogan also serves as Trustee or Vice President of other funds. Mr. Hogan serves as President of FMR's Equity Division (2009-present). Previously, Mr. Hogan served as Senior Vice President, Equity Research of FMR (2006-2009) and as a portfolio manager. |
Chris Maher (1972) |
Year of Election or Appointment: 2013 Assistant Treasurer |
| Mr. Maher serves as Assistant Treasurer of other funds. Mr. Maher is Vice President of Valuation Oversight and is an employee of Fidelity Investments. Previously, Mr. Maher served as Vice President of Asset Management Compliance (2013), Vice President of FMR's Program Management Group (2010-2013), and Vice President of Valuation Oversight (2008-2010). |
Melissa M. Reilly (1971) |
Year of Election or Appointment: 2014 Vice President of certain Equity Funds |
| Ms. Reilly also serves as Vice President of other funds. Ms. Reilly is an employee of Fidelity Investments (2004-present). |
Kenneth B. Robins (1969) |
Year of Election or Appointment: 2008 President and Treasurer |
| Mr. Robins also serves as an officer of other funds. Mr. Robins serves as Executive Vice President of Fidelity Investments Money Management, Inc. (FIMM) (2013-present) and is an employee of Fidelity Investments (2004-present). Previously, Mr. Robins served in other fund officer roles. |
Stephen Sadoski (1971) |
Year of Election or Appointment: 2012 Deputy Treasurer |
| Mr. Sadoski also serves as Deputy Treasurer of other funds. He is an employee of Fidelity Investments (2012-present) and has served in another fund officer role. Prior to joining Fidelity Investments, Mr. Sadoski served as an assistant chief accountant in the Division of Investment Management of the Securities and Exchange Commission (SEC) (2009-2012) and as a senior manager at Deloitte & Touche LLP (1997-2009). |
Stacie M. Smith (1974) |
Year of Election or Appointment: 2013 Deputy Treasurer |
| Ms. Smith also serves as an officer of other funds. She is an employee of Fidelity Investments (2009-present) and has served in other fund officer roles. Prior to joining Fidelity Investments, Ms. Smith served as Senior Audit Manager of Ernst & Young LLP (1996-2009). |
Renee Stagnone (1975) |
Year of Election or Appointment: 2013 Deputy Treasurer |
| Ms. Stagnone also serves as Deputy Treasurer of other funds. Ms. Stagnone is an employee of Fidelity Investments. |
Linda J. Wondrack (1964) |
Year of Election or Appointment: 2014 Chief Compliance Officer |
| Ms. Wondrack also serves as Chief Compliance Officer of other funds. Ms. Wondrack is Executive Vice President and head of the Ethics Office and Asset Management Compliance for Fidelity Investments (2012-present). Ms. Wondrack also serves as Chief Compliance Officer of Fidelity SelectCo, LLC (2014-present); Chief Compliance Officer of Impresa Management LLC (2013-present); and Chief Compliance Officer of FMR Co., Inc., Fidelity Investments Money Management, Inc., Fidelity Management & Research (Japan) Inc., Fidelity Management & Research (U.K.) Inc., Fidelity Management & Research (Hong Kong), Fidelity Management & Research Company, Pyramis Global Advisors, LLC, and Strategic Advisers, Inc., Ballyrock Investment Advisors LLC, and Northern Neck Investors LLC (2012-present). Previously, Ms. Wondrack served as Senior Vice President and Chief Compliance Officer for Columbia Management Investment Advisers, LLC (2005-2012); Chief Compliance Officer for certain funds within the Columbia Family of Funds (2007-2012); and Senior Vice President of Compliance Risk Management at Bank of America (2005-2010). |
Joseph F. Zambello (1957) |
Year of Election or Appointment: 2011 Deputy Treasurer |
| Mr. Zambello also serves as Deputy Treasurer of other funds. Mr. Zambello is an employee of Fidelity Investments. Previously, Mr. Zambello served as Vice President of FMR's Program Management Group (2009-2011) and Vice President of the Transfer Agent Oversight Group (2005-2009). |
Annual Report
Growth Discovery designates 100% of the dividend distributed during the fiscal year as qualifying for the dividends-received deduction for corporate shareholders.
Growth Discovery designates 100% of the dividend distributed during the fiscal year as amounts which may be taken into account as a dividend for purposes of the maximum rate under section 1(h)(11) of the Internal Revenue Code.
The fund will notify shareholders in January 2015 of amounts for use in preparing 2014 income tax returns.
Annual Report
Investment Adviser
Fidelity Management &
Research Company
Boston, MA
Investment Sub-Advisers
FMR Co., Inc.
Fidelity Management & Research
(U.K.) Inc.
Fidelity Management & Research
(Japan) Inc.
Fidelity Management & Research
(Hong Kong) Limited
General Distributor
Fidelity Distributors Corporation
Smithfield, RI
Transfer and Service Agents
Fidelity Investments Institutional
Operations Company, Inc.
Boston, MA
Fidelity Service Company, Inc.
Boston, MA
Custodian
Brown Brothers Harriman & Co.
Boston, MA
The Fidelity Telephone Connection
Mutual Fund 24-Hour Service
Exchanges/Redemptions
and Account Assistance 1-800-544-6666
Product Information 1-800-544-6666
Retirement Accounts 1-800-544-4774
(8 a.m. - 9 p.m.)
TDD Service 1-800-544-0118
for the deaf and hearing impaired
(9 a.m. - 9 p.m. Eastern time)
Fidelity Automated Service
Telephone (FAST ®)
1-800-544-5555
Automated line for quickest service
(Fidelity Investment logo)(registered trademark)
Corporate Headquarters
245 Summer St., Boston, MA 02210
www.fidelity.com
CII-UANN-0814
1.787730.111
Fidelity®
Growth Discovery
Fund -
Class K
Annual Report
June 30, 2014
(Fidelity Cover Art)
Contents
Performance | (Click Here) | How the fund has done over time. |
Management's Discussion of Fund Performance | (Click Here) | The Portfolio Manager's review of fund performance and strategy. |
Shareholder Expense Example | (Click Here) | An example of shareholder expenses. |
Investment Changes | (Click Here) | A summary of major shifts in the fund's investments over the past six months. |
Investments | (Click Here) | A complete list of the fund's investments with their market values. |
Financial Statements | (Click Here) | Statements of assets and liabilities, operations, and changes in net assets, as well as financial highlights. |
Notes | (Click Here) | Notes to the financial statements. |
Report of Independent Registered Public Accounting Firm | (Click Here) | |
Trustees and Officers | (Click Here) | |
Distributions | (Click Here) | |
To view a fund's proxy voting guidelines and proxy voting record for the 12-month period ended June 30, visit http://www.fidelity.com/proxyvotingresults or visit the Securities and Exchange Commission's (SEC) web site at http://www.sec.gov. You may also call 1-800-835-5092 to request a free copy of the proxy voting guidelines.
Standard & Poor's, S&P and S&P 500 are registered service marks of The McGraw-Hill Companies, Inc. and have been licensed for use by Fidelity Distributors Corporation.
Other third-party marks appearing herein are the property of their respective owners.
All other marks appearing herein are registered or unregistered trademarks or service marks of FMR LLC or an affiliated company. © 2014 FMR LLC. All rights reserved.
Annual Report
This report and the financial statements contained herein are submitted for the general information of the shareholders of the fund. This report is not authorized for distribution to prospective investors in the fund unless preceded or accompanied by an effective prospectus.
A fund files its complete schedule of portfolio holdings with the SEC for the first and third quarters of each fiscal year on Form N-Q. Forms N-Q are available on the SEC's web site at http://www.sec.gov. A fund's Forms N-Q may be reviewed and copied at the SEC's Public Reference Room in Washington, DC. Information regarding the operation of the SEC's Public Reference Room may be obtained by calling 1-800-SEC-0330. For a complete list of a fund's portfolio holdings, view the most recent holdings listing, semiannual report, or annual report on Fidelity's web site at http://www.fidelity.com, http://www.advisor.fidelity.com, or http://www.401k.com, as applicable.
NOT FDIC INSURED • MAY LOSE VALUE • NO BANK GUARANTEE
Neither the fund nor Fidelity Distributors Corporation is a bank.
Annual Report
Average annual total return reflects the change in the value of an investment, assuming reinvestment of the class' distributions from dividend income and capital gains (the profits earned upon the sale of securities that have grown in value, if any) and assuming a constant rate of performance each year. The $10,000 table and the fund's returns do not reflect the deduction of taxes that a shareholder would pay on fund distributions or the redemption of fund shares. During periods of reimbursement by Fidelity, a fund's total return will be greater than it would be had the reimbursement not occurred. How a fund did yesterday is no guarantee of how it will do tomorrow.
Average Annual Total Returns
Periods ended June 30, 2014 | Past 1
year | Past 5
years | Past 10
years |
Class K A, B | 32.62% | 21.34% | 9.18% |
A The initial offering of Class K shares took place on May 9, 2008. Returns prior to May 9, 2008, are those of Fidelity® Growth Discovery Fund, the original class of the fund.
B Prior to February 1, 2007, the fund operated under certain different investment policies and compared its performance to a different index. The fund's historical performance may not represent its current investment policies.
$10,000 Over 10 Years
Let's say hypothetically that $10,000 was invested in Fidelity® Growth Discovery Fund - Class K on June 30, 2004. The chart shows how the value of your investment would have changed, and also shows how the Russell 3000® Growth Index performed over the same period. See footnote A above for additional information regarding the performance of Class K.
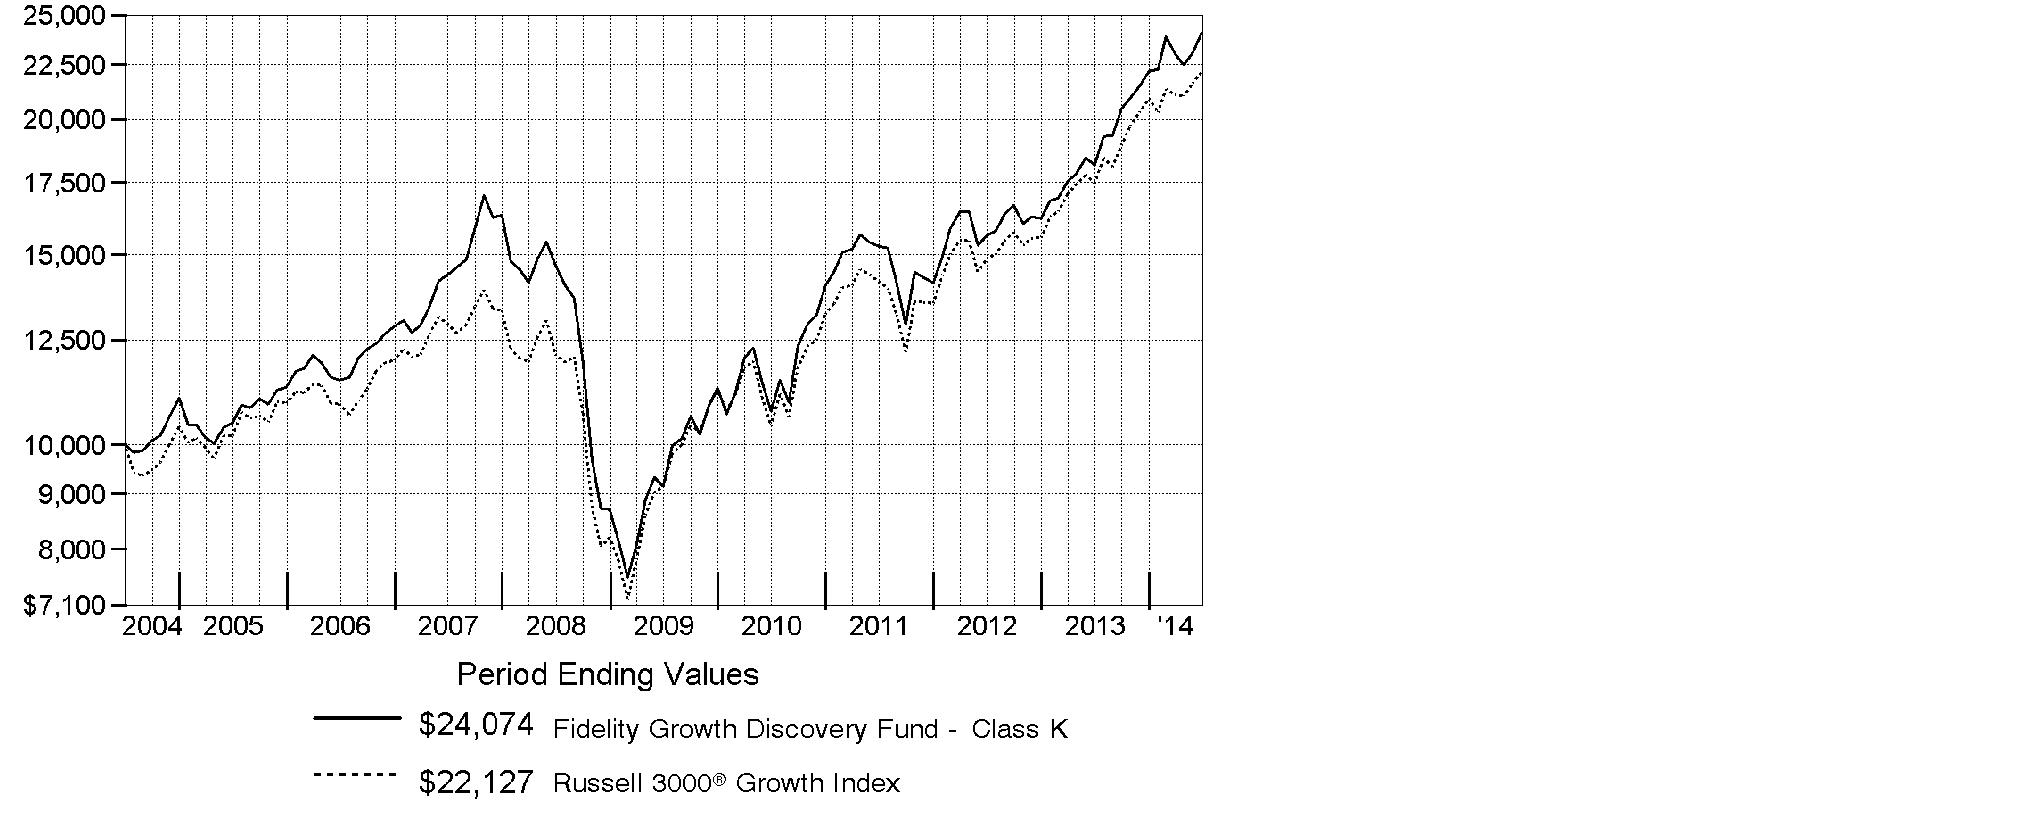
Annual Report
Market Recap: Despite intermittent volatility driven by geopolitical concerns, stocks posted a series of new highs during the 12 months ending June 30, 2014, amid a decidedly favorable environment for riskier assets. The S&P 500® Index rose 24.61% for the year, helped by a rise in consumer spending and the lowest unemployment rate since 2008. The U.S. Federal Reserve balanced stimulus reductions with continued low interest rates, aiding a broad advance. All 10 S&P 500® market sectors gained, seven by more than 20%. Materials (+33%) was tops, as investors seemed to anticipate sustained economic improvement and renewed infrastructure build-outs. Information technology (+32%) benefited from large cash balances, rising dividends and stock buybacks, and a bevy of innovations. Health care (+30%) was aided by new drugs and predictable reimbursements. Conversely, the biggest laggard, telecommunication services (+5%), battled slow growth and stiff pricing competition. Across size and style segments: overall, investors showed some preference for large-cap stocks over small-caps and growth stocks over value, although market leadership rotated during the year. With the "risk-on" trade alive and well, the growth-oriented Nasdaq Composite Index® flourished, advancing 31.17%, while the blue-chip Dow Jones Industrial AverageSM delivered a more subdued 15.56% return.
Comments from Jason Weiner, Portfolio Manager of Fidelity® Growth Discovery Fund: For the year, the fund's Class K shares advanced 32.62%, outpacing the 26.75% gain of the Russell 3000® Growth Index. Versus the Russell index, the software & services segment was a plus. Here, Facebook was the fund's biggest relative contributor by far and easily its largest holding. The social network giant reached an all-time high after posting a 63% increase in revenue for the fourth quarter of 2013, fueled by strong mobile advertising. Investors flocked to the stock as the surge in mobile Internet ad revenue eased concerns about Facebook's ability to evolve into a "mobile first" company. By contrast, an overweighting in Broadcom, on average, was the biggest relative detractor. The firm produces baseband chips that provide Internet connectivity to Apple's iPhone® smartphones and iPad® tablets, as well as some of Samsung Electronics' GalaxyTM mobile devices. Earlier in the period, I was optimistic the business would ride the coattails of the popular products it supports, along with its innovations in Internet connectivity. But the stock lagged, as the firm faced intensifying competition and setbacks in releasing new chips. Shares plummeted last summer after the company issued a lower-than-expected revenue forecast amid slowing smartphone sales. I sold Broadcom prior to period end.
The views expressed above reflect those of the portfolio manager(s) only through the end of the period as stated on the cover of this report and do not necessarily represent the views of Fidelity or any other person in the Fidelity organization. Any such views are subject to change at any time based upon market or other conditions and Fidelity disclaims any responsibility to update such views. These views may not be relied on as investment advice and, because investment decisions for a Fidelity fund are based on numerous factors, may not be relied on as an indication of trading intent on behalf of any Fidelity fund.
Annual Report
Shareholder Expense Example
As a shareholder of the Fund, you incur two types of costs: (1) transaction costs, and (2) ongoing costs, including management fees and other Fund expenses. This Example is intended to help you understand your ongoing costs (in dollars) of investing in the Fund and to compare these costs with the ongoing costs of investing in other mutual funds.
The Example is based on an investment of $1,000 invested at the beginning of the period and held for the entire period (January 1, 2014 to June 30, 2014).
Actual Expenses
The first line of the accompanying table for each class of the Fund provides information about actual account values and actual expenses. You may use the information in this line, together with the amount you invested, to estimate the expenses that you paid over the period. Simply divide your account value by $1,000.00 (for example, an $8,600 account value divided by $1,000.00 = 8.6), then multiply the result by the number in the first line for a class of the Fund under the heading entitled "Expenses Paid During Period" to estimate the expenses you paid on your account during this period. A small balance maintenance fee of $12.00 that is charged once a year may apply for certain accounts with a value of less than $2,000. This fee is not included in the table below. If it was, the estimate of expenses you paid during the period would be higher, and your ending account value lower, by this amount. In addition, the Fund, as a shareholder in the underlying Fidelity Central Funds, will indirectly bear its pro-rata share of the fees and expenses incurred by the underlying Fidelity Central Funds. These fees and expenses are not included in the Fund's annualized expense ratio used to calculate the expense estimate in the table below.
Hypothetical Example for Comparison Purposes
The second line of the accompanying table for each class of the Fund provides information about hypothetical account values and hypothetical expenses based on a Class' actual expense ratio and an assumed rate of return of 5% per year before expenses, which is not the Class' actual return. The hypothetical account values and expenses may not be used to estimate the actual ending account balance or expenses you paid for the period. You may use this information to compare the ongoing costs of investing in the Fund and other funds. To do so, compare this 5% hypothetical example with the 5% hypothetical examples that appear in the shareholder reports of the other funds. A small balance maintenance fee of $12.00 that is charged once a year may apply for certain accounts with a value of less than $2,000. This fee is not included in the table below. If it was, the estimate of expenses you paid during the period would be higher, and your ending account value lower, by this amount. In addition, the Fund, as a shareholder in the underlying Fidelity Central Funds, will indirectly bear its pro-rata share of the fees and expenses incurred by the underlying Fidelity Central Funds. These fees and expenses are not included in the Fund's annualized expense ratio used to calculate the expense estimate in the table below.
Please note that the expenses shown in the table are meant to highlight your ongoing costs only and do not reflect any transaction costs. Therefore, the second line of the table is useful in comparing ongoing costs only, and will not help you determine the relative total costs of owning different funds.
Annual Report
| Annualized
Expense RatioB | Beginning
Account Value
January 1, 2014 | Ending
Account Value
June 30, 2014 | Expenses Paid
During Period*
January 1, 2014 to June 30, 2014 |
Growth Discovery | .80% | | | |
Actual | | $ 1,000.00 | $ 1,086.70 | $ 4.14 |
HypotheticalA | | $ 1,000.00 | $ 1,020.83 | $ 4.01 |
Class K | .66% | | | |
Actual | | $ 1,000.00 | $ 1,087.10 | $ 3.42 |
HypotheticalA | | $ 1,000.00 | $ 1,021.52 | $ 3.31 |
A 5% return per year before expenses
B Annualized expense ratio reflects expenses net of applicable fee waivers.
* Expenses are equal to each Class' annualized expense ratio, multiplied by the average account value over the period, multiplied by 181/365 (to reflect the one-half year period).
Annual Report
Investment Changes (Unaudited)
Top Ten Stocks as of June 30, 2014 |
| % of fund's
net assets | % of fund's net assets
6 months ago |
Facebook, Inc. Class A | 7.4 | 6.6 |
Gilead Sciences, Inc. | 4.2 | 1.6 |
Keurig Green Mountain, Inc. | 3.0 | 2.5 |
Harley-Davidson, Inc. | 3.0 | 3.0 |
Google, Inc. Class A | 2.4 | 4.3 |
Google, Inc. Class C | 2.4 | 0.0 |
Apple, Inc. | 2.3 | 2.5 |
Actavis PLC | 1.9 | 1.1 |
The Blackstone Group LP | 1.9 | 0.9 |
Danaher Corp. | 1.9 | 1.5 |
| 30.4 | |
Top Five Market Sectors as of June 30, 2014 |
| % of fund's
net assets | % of fund's net assets
6 months ago |
Information Technology | 28.0 | 29.1 |
Consumer Discretionary | 15.2 | 19.5 |
Health Care | 14.5 | 16.9 |
Industrials | 10.5 | 7.8 |
Consumer Staples | 8.7 | 9.3 |
Asset Allocation (% of fund's net assets) |
As of June 30, 2014 * | As of December 31, 2013 ** |
| Stocks and
Equity Futures 99.4% | | | Stocks 98.9% | |
| Convertible
Securities 0.3% | | | Convertible
Securities 0.1% | |
| Short-Term
Investments and
Net Other Assets (Liabilities) 0.3% | | | Short-Term
Investments and
Net Other Assets (Liabilities) 1.0% | |
* Foreign investments | 11.0% | | ** Foreign investments | 12.6% | |

Annual Report
Investments June 30, 2014
Showing Percentage of Net Assets
Common Stocks - 98.1% |
| Shares | | Value (000s) |
CONSUMER DISCRETIONARY - 15.1% |
Automobiles - 4.0% |
Harley-Davidson, Inc. | 540,194 | | $ 37,733 |
Tesla Motors, Inc. (a)(d) | 51,610 | | 12,389 |
| | 50,122 |
Distributors - 0.2% |
LKQ Corp. (a) | 109,400 | | 2,920 |
Diversified Consumer Services - 0.5% |
Bright Horizons Family Solutions, Inc. (a) | 61,200 | | 2,628 |
H&R Block, Inc. | 94,188 | | 3,157 |
| | 5,785 |
Hotels, Restaurants & Leisure - 3.4% |
Chipotle Mexican Grill, Inc. (a) | 8,521 | | 5,049 |
Domino's Pizza, Inc. | 10,233 | | 748 |
Dunkin' Brands Group, Inc. | 133,069 | | 6,096 |
Las Vegas Sands Corp. | 31,700 | | 2,416 |
Starbucks Corp. | 213,226 | | 16,499 |
Yum! Brands, Inc. | 143,037 | | 11,615 |
| | 42,423 |
Household Durables - 0.3% |
Mohawk Industries, Inc. (a) | 26,929 | | 3,725 |
Internet & Catalog Retail - 1.0% |
Amazon.com, Inc. (a) | 19,024 | | 6,179 |
TripAdvisor, Inc. (a) | 58,383 | | 6,344 |
| | 12,523 |
Leisure Products - 0.1% |
NJOY, Inc. (f) | 56,145 | | 950 |
Media - 0.7% |
Comcast Corp. Class A (special) (non-vtg.) | 176,643 | | 9,420 |
Specialty Retail - 3.3% |
CarMax, Inc. (a) | 37,952 | | 1,974 |
Five Below, Inc. (a) | 40,900 | | 1,632 |
Home Depot, Inc. | 281,724 | | 22,808 |
Ulta Salon, Cosmetics & Fragrance, Inc. (a) | 88,104 | | 8,054 |
Urban Outfitters, Inc. (a) | 233,757 | | 7,915 |
| | 42,383 |
Textiles, Apparel & Luxury Goods - 1.6% |
ECLAT Textile Co. Ltd. | 332,900 | | 4,034 |
Common Stocks - continued |
| Shares | | Value (000s) |
CONSUMER DISCRETIONARY - continued |
Textiles, Apparel & Luxury Goods - continued |
Michael Kors Holdings Ltd. (a) | 67,300 | | $ 5,966 |
NIKE, Inc. Class B | 134,967 | | 10,467 |
| | 20,467 |
TOTAL CONSUMER DISCRETIONARY | | 190,718 |
CONSUMER STAPLES - 8.7% |
Beverages - 1.2% |
Monster Beverage Corp. (a) | 34,353 | | 2,440 |
SABMiller PLC | 120,224 | | 6,971 |
The Coca-Cola Co. | 136,336 | | 5,775 |
| | 15,186 |
Food & Staples Retailing - 0.9% |
Costco Wholesale Corp. | 53,700 | | 6,184 |
Sprouts Farmers Market LLC | 15,090 | | 494 |
Whole Foods Market, Inc. | 105,351 | | 4,070 |
| | 10,748 |
Food Products - 4.2% |
Keurig Green Mountain, Inc. | 305,872 | | 38,115 |
Mead Johnson Nutrition Co. Class A | 84,329 | | 7,857 |
The Hershey Co. | 77,697 | | 7,565 |
| | 53,537 |
Household Products - 1.6% |
Procter & Gamble Co. | 256,686 | | 20,173 |
Personal Products - 0.8% |
Estee Lauder Companies, Inc. Class A | 25,500 | | 1,894 |
Herbalife Ltd. | 135,333 | | 8,734 |
| | 10,628 |
TOTAL CONSUMER STAPLES | | 110,272 |
ENERGY - 8.7% |
Energy Equipment & Services - 3.4% |
Dril-Quip, Inc. (a) | 42,458 | | 4,638 |
Halliburton Co. | 291,500 | | 20,699 |
Oceaneering International, Inc. | 104,756 | | 8,185 |
Pason Systems, Inc. | 134,806 | | 3,790 |
RigNet, Inc. (a) | 104,061 | | 5,601 |
| | 42,913 |
Common Stocks - continued |
| Shares | | Value (000s) |
ENERGY - continued |
Oil, Gas & Consumable Fuels - 5.3% |
Cheniere Energy, Inc. (a) | 106,700 | | $ 7,650 |
Continental Resources, Inc. (a)(d) | 68,126 | | 10,767 |
EOG Resources, Inc. | 73,500 | | 8,589 |
EQT Midstream Partners LP | 38,200 | | 3,695 |
Golar LNG Ltd. | 161,461 | | 9,704 |
Markwest Energy Partners LP | 46,800 | | 3,350 |
Noble Energy, Inc. | 50,600 | | 3,919 |
Phillips 66 Partners LP | 103,504 | | 7,821 |
Pioneer Natural Resources Co. | 26,700 | | 6,136 |
Targa Resources Corp. | 36,439 | | 5,086 |
| | 66,717 |
TOTAL ENERGY | | 109,630 |
FINANCIALS - 7.6% |
Banks - 0.9% |
HDFC Bank Ltd. sponsored ADR | 259,155 | | 12,134 |
Capital Markets - 5.0% |
BlackRock, Inc. Class A | 23,394 | | 7,477 |
E*TRADE Financial Corp. (a) | 395,759 | | 8,414 |
Fortress Investment Group LLC | 166,100 | | 1,236 |
Harvest Capital Credit Corp. (d) | 26,130 | | 388 |
Invesco Ltd. | 337,384 | | 12,736 |
KKR & Co. LP | 146,609 | | 3,567 |
Legg Mason, Inc. | 98,300 | | 5,044 |
The Blackstone Group LP | 718,619 | | 24,031 |
| | 62,893 |
Consumer Finance - 0.7% |
American Express Co. | 70,084 | | 6,649 |
Shriram Transport Finance Co. Ltd. | 118,502 | | 1,786 |
| | 8,435 |
Diversified Financial Services - 0.8% |
Berkshire Hathaway, Inc. Class B (a) | 23,600 | | 2,987 |
McGraw Hill Financial, Inc. | 87,612 | | 7,274 |
| | 10,261 |
Common Stocks - continued |
| Shares | | Value (000s) |
FINANCIALS - continued |
Real Estate Management & Development - 0.2% |
Leopalace21 Corp. (a) | 73,800 | | $ 381 |
Realogy Holdings Corp. (a) | 47,381 | | 1,787 |
| | 2,168 |
TOTAL FINANCIALS | | 95,891 |
HEALTH CARE - 14.5% |
Biotechnology - 9.5% |
Acceleron Pharma, Inc. | 48,400 | | 1,644 |
Actelion Ltd. | 17,384 | | 2,199 |
Alexion Pharmaceuticals, Inc. (a) | 52,594 | | 8,218 |
Biogen Idec, Inc. (a) | 71,579 | | 22,570 |
BioMarin Pharmaceutical, Inc. (a) | 89,996 | | 5,599 |
Cytokinetics, Inc. warrants 6/25/17 (a) | 288,420 | | 6 |
Enanta Pharmaceuticals, Inc. (a)(d) | 105,984 | | 4,565 |
Gilead Sciences, Inc. (a) | 641,363 | | 53,175 |
Insmed, Inc. (a) | 295,678 | | 5,908 |
Kamada (a) | 45,784 | | 326 |
Ophthotech Corp. | 48,445 | | 2,050 |
uniQure B.V. | 33,635 | | 457 |
Vanda Pharmaceuticals, Inc. (a) | 209,048 | | 3,382 |
Vertex Pharmaceuticals, Inc. (a) | 101,400 | | 9,601 |
| | 119,700 |
Health Care Equipment & Supplies - 0.5% |
AxoGen, Inc. (a) | 27,515 | | 76 |
GI Dynamics, Inc. CDI (a) | 161,679 | | 88 |
The Cooper Companies, Inc. | 45,107 | | 6,113 |
| | 6,277 |
Health Care Providers & Services - 0.4% |
Apollo Hospitals Enterprise Ltd. | 119,708 | | 1,983 |
Qualicorp SA (a) | 246,000 | | 2,906 |
| | 4,889 |
Health Care Technology - 0.1% |
Cerner Corp. (a) | 35,913 | | 1,852 |
Life Sciences Tools & Services - 0.8% |
Illumina, Inc. (a) | 57,526 | | 10,271 |
Pharmaceuticals - 3.2% |
AbbVie, Inc. | 152,602 | | 8,613 |
Actavis PLC (a) | 108,377 | | 24,173 |
Common Stocks - continued |
| Shares | | Value (000s) |
HEALTH CARE - continued |
Pharmaceuticals - continued |
AVANIR Pharmaceuticals Class A (a) | 260,300 | | $ 1,468 |
Perrigo Co. PLC | 40,432 | | 5,893 |
| | 40,147 |
TOTAL HEALTH CARE | | 183,136 |
INDUSTRIALS - 10.5% |
Aerospace & Defense - 2.4% |
TransDigm Group, Inc. | 54,527 | | 9,120 |
United Technologies Corp. | 186,612 | | 21,544 |
| | 30,664 |
Airlines - 0.2% |
Ryanair Holdings PLC sponsored ADR (a) | 36,953 | | 2,062 |
Building Products - 0.4% |
A.O. Smith Corp. | 102,544 | | 5,084 |
Commercial Services & Supplies - 0.5% |
KAR Auction Services, Inc. | 219,398 | | 6,992 |
Construction & Engineering - 0.5% |
Jacobs Engineering Group, Inc. (a) | 99,891 | | 5,322 |
MasTec, Inc. (a) | 18,300 | | 564 |
| | 5,886 |
Electrical Equipment - 0.6% |
AMETEK, Inc. | 88,945 | | 4,650 |
Power Solutions International, Inc. (a) | 34,221 | | 2,463 |
| | 7,113 |
Industrial Conglomerates - 2.4% |
Danaher Corp. | 300,255 | | 23,639 |
Roper Industries, Inc. | 43,614 | | 6,368 |
| | 30,007 |
Machinery - 2.4% |
Allison Transmission Holdings, Inc. | 161,000 | | 5,007 |
Caterpillar, Inc. | 89,034 | | 9,675 |
Manitowoc Co., Inc. | 365,847 | | 12,022 |
Sarine Technologies Ltd. | 564,000 | | 1,162 |
Sun Hydraulics Corp. | 14,500 | | 589 |
Weg SA | 115,960 | | 1,485 |
| | 29,940 |
Common Stocks - continued |
| Shares | | Value (000s) |
INDUSTRIALS - continued |
Professional Services - 0.6% |
Verisk Analytics, Inc. (a) | 103,867 | | $ 6,234 |
WageWorks, Inc. (a) | 28,855 | | 1,391 |
| | 7,625 |
Road & Rail - 0.5% |
J.B. Hunt Transport Services, Inc. | 92,600 | | 6,832 |
TOTAL INDUSTRIALS | | 132,205 |
INFORMATION TECHNOLOGY - 27.8% |
Communications Equipment - 0.5% |
QUALCOMM, Inc. | 74,600 | | 5,908 |
Electronic Equipment & Components - 0.7% |
TE Connectivity Ltd. | 138,863 | | 8,587 |
Internet Software & Services - 15.5% |
Cornerstone OnDemand, Inc. (a) | 63,903 | | 2,941 |
CoStar Group, Inc. (a) | 9,900 | | 1,566 |
Cvent, Inc. (d) | 151,731 | | 4,414 |
Demandware, Inc. (a) | 48,000 | | 3,330 |
Facebook, Inc. Class A (a) | 1,395,991 | | 93,936 |
Google, Inc.: | | | |
Class A (a) | 51,752 | | 30,258 |
Class C (a) | 51,752 | | 29,772 |
Naver Corp. | 11,346 | | 9,362 |
SPS Commerce, Inc. (a) | 62,372 | | 3,941 |
Textura Corp. (d) | 286,739 | | 6,779 |
Xoom Corp. (a) | 16,800 | | 443 |
Yahoo!, Inc. (a) | 246,759 | | 8,669 |
| | 195,411 |
IT Services - 2.1% |
Gartner, Inc. Class A (a) | 97,798 | | 6,897 |
Visa, Inc. Class A | 96,724 | | 20,381 |
| | 27,278 |
Semiconductors & Semiconductor Equipment - 0.3% |
M/A-COM Technology Solutions, Inc. (a) | 23,100 | | 519 |
MediaTek, Inc. | 175,000 | | 2,958 |
| | 3,477 |
Software - 6.2% |
Activision Blizzard, Inc. | 97,687 | | 2,178 |
ANSYS, Inc. (a) | 1,222 | | 93 |
Common Stocks - continued |
| Shares | | Value (000s) |
INFORMATION TECHNOLOGY - continued |
Software - continued |
Computer Modelling Group Ltd. | 138,200 | | $ 3,836 |
Electronic Arts, Inc. (a) | 322,634 | | 11,573 |
Fleetmatics Group PLC (a) | 40,850 | | 1,321 |
Microsoft Corp. | 535,100 | | 22,314 |
salesforce.com, Inc. (a) | 363,864 | | 21,133 |
ServiceNow, Inc. (a) | 27,200 | | 1,685 |
SolarWinds, Inc. (a) | 75,481 | | 2,918 |
Solera Holdings, Inc. | 20,000 | | 1,343 |
SS&C Technologies Holdings, Inc. (a) | 192,320 | | 8,504 |
The Rubicon Project, Inc. | 70,546 | | 906 |
| | 77,804 |
Technology Hardware, Storage & Peripherals - 2.5% |
Apple, Inc. | 307,146 | | 28,543 |
Nimble Storage, Inc. (d) | 104,300 | | 3,204 |
| | 31,747 |
TOTAL INFORMATION TECHNOLOGY | | 350,212 |
MATERIALS - 4.8% |
Chemicals - 2.3% |
FMC Corp. | 94,042 | | 6,695 |
Monsanto Co. | 69,788 | | 8,705 |
Sherwin-Williams Co. | 47,095 | | 9,744 |
Westlake Chemical Corp. | 46,050 | | 3,857 |
| | 29,001 |
Construction Materials - 2.5% |
CaesarStone Sdot-Yam Ltd. | 13,200 | | 648 |
Eagle Materials, Inc. | 194,598 | | 18,347 |
James Hardie Industries PLC sponsored ADR | 52,527 | | 3,434 |
Vulcan Materials Co. | 151,624 | | 9,666 |
| | 32,095 |
TOTAL MATERIALS | | 61,096 |
TELECOMMUNICATION SERVICES - 0.1% |
Diversified Telecommunication Services - 0.1% |
8x8, Inc. (a) | 178,860 | | 1,445 |
Common Stocks - continued |
| Shares | | Value (000s) |
UTILITIES - 0.3% |
Electric Utilities - 0.3% |
ITC Holdings Corp. | 102,774 | | $ 3,749 |
TOTAL COMMON STOCKS (Cost $942,590) |
1,238,354
|
Convertible Preferred Stocks - 0.3% |
| | | |
CONSUMER DISCRETIONARY - 0.1% |
Household Durables - 0.1% |
Blu Homes, Inc. Series A, 5.00% (f) | 239,736 | | 1,108 |
INFORMATION TECHNOLOGY - 0.2% |
Internet Software & Services - 0.2% |
Uber Technologies, Inc. 8.00% (f) | 40,643 | | 2,522 |
TOTAL CONVERTIBLE PREFERRED STOCKS (Cost $3,630) |
3,630
|
U.S. Treasury Obligations - 0.1% |
| Principal Amount (000s) | | |
U.S. Treasury Bills, yield at date of purchase 0.02% 7/31/14 (e)
(Cost $990) | | $ 990 | |
990
|
Money Market Funds - 4.0% |
| Shares | | |
Fidelity Cash Central Fund, 0.11% (b) | 21,110,428 | | 21,110 |
Fidelity Securities Lending Cash Central Fund, 0.10% (b)(c) | 29,500,646 | | 29,501 |
TOTAL MONEY MARKET FUNDS (Cost $50,611) |
50,611
|
TOTAL INVESTMENT PORTFOLIO - 102.5% (Cost $997,821) | 1,293,585 |
NET OTHER ASSETS (LIABILITIES) - (2.5)% | (31,147) |
NET ASSETS - 100% | $ 1,262,438 |
Futures Contracts |
| Expiration Date | | Underlying Face Amount at Value (000s) | | Unrealized Appreciation/
(Depreciation) (000s) |
Purchased |
Equity Index Contracts |
168 ICE Russell 1000 Growth Index Contracts | Sept. 2014 | | $ 15,253 | | $ 249 |
12 ICE Russell 2000 Index Contracts | Sept. 2014 | | 1,428 | | 42 |
TOTAL EQUITY INDEX CONTRACTS | | $ 16,681 | | $ 291 |
|
The face value of futures purchased as a percentage of net assets is 1.3% |
Legend |
(a) Non-income producing |
(b) Affiliated fund that is generally available only to investment companies and other accounts managed by Fidelity Investments. The rate quoted is the annualized seven-day yield of the fund at period end. A complete unaudited listing of the fund's holdings as of its most recent quarter end is available upon request. In addition, each Fidelity Central Fund's financial statements, which are not covered by the Fund's Report of Independent Registered Public Accounting Firm, are available on the SEC's website or upon request. |
(c) Investment made with cash collateral received from securities on loan. |
(d) Security or a portion of the security is on loan at period end. |
(e) Security or a portion of the security was pledged to cover margin requirements for futures contracts. At period end, the value of securities pledged amounted to $450,000. |
(f) Restricted securities - Investment in securities not registered under the Securities Act of 1933 (excluding 144A issues). At the end of the period, the value of restricted securities (excluding 144A issues) amounted to $4,580,000 or 0.4% of net assets. |
Additional information on each restricted holding is as follows: |
Security | Acquisition Date | Acquisition Cost (000s) |
Blu Homes, Inc. Series A, 5.00% | 6/21/13 | $ 1,108 |
NJOY, Inc. | 9/11/13 | $ 454 |
Uber Technologies, Inc. 8.00% | 6/6/14 | $ 2,522 |
Affiliated Central Funds |
Information regarding fiscal year to date income earned by the Fund from investments in Fidelity Central Funds is as follows: |
Fund | Income earned
(Amounts in thousands) |
Fidelity Cash Central Fund | $ 38 |
Fidelity Securities Lending Cash Central Fund | 257 |
Total | $ 295 |
Other Information |
The following is a summary of the inputs used, as of June 30, 2014, involving the Fund's assets and liabilities carried at fair value. The inputs or methodology used for valuing securities may not be an indication of the risk associated with investing in those securities. For more information on valuation inputs, and their aggregation into the levels used in the table below, please refer to the Investment Valuation section in the accompanying Notes to Financial Statements. |
Valuation Inputs at Reporting Date: |
Description
(Amounts in thousands) | Total | Level 1 | Level 2 | Level 3 |
Investments in Securities: | | | | |
Equities: | | | | |
Consumer Discretionary | $ 191,826 | $ 189,768 | $ - | $ 2,058 |
Consumer Staples | 110,272 | 110,272 | - | - |
Energy | 109,630 | 109,630 | - | - |
Financials | 95,891 | 95,510 | 381 | - |
Health Care | 183,136 | 183,130 | 6 | - |
Industrials | 132,205 | 132,205 | - | - |
Information Technology | 352,734 | 350,212 | - | 2,522 |
Materials | 61,096 | 61,096 | - | - |
Telecommunication Services | 1,445 | 1,445 | - | - |
Utilities | 3,749 | 3,749 | - | - |
U.S. Government and Government Agency Obligations | 990 | - | 990 | - |
Money Market Funds | 50,611 | 50,611 | - | - |
Total Investments in Securities: | $ 1,293,585 | $ 1,287,628 | $ 1,377 | $ 4,580 |
Derivative Instruments: | | | | |
Assets | | | | |
Futures Contracts | $ 291 | $ 291 | $ - | $ - |
Value of Derivative Instruments |
The following table is a summary of the Fund's value of derivative instruments by primary risk exposure as of June 30, 2014. For additional information on derivative instruments, please refer to the Derivative Instruments section in the accompanying Notes to Financial Statements. |
Primary Risk Exposure /
Derivative Type | Value
(Amount in thousands) |
| Asset | Liability |
Equity Risk | | |
Futures Contracts (a) | $ 291 | $ - |
Total Value of Derivatives | $ 291 | $ - |
(a) Reflects gross cumulative appreciation (depreciation) on futures contracts as presented in the Schedule of Investments. Only the period end receivable or payable for daily variation margin and net unrealized appreciation (depreciation) are presented in the Statement of Assets and Liabilities. |
Distribution of investments by country or territory of incorporation, as a percentage of total net assets, is as follows (Unaudited): |
United States of America | 89.0% |
Ireland | 3.0% |
Bermuda | 1.8% |
India | 1.3% |
Others (Individually Less Than 1%) | 4.9% |
| 100.0% |
See accompanying notes which are an integral part of the financial statements.
Annual Report
Statement of Assets and Liabilities
Amounts in thousands (except per-share amounts) | June 30, 2014 |
| | |
Assets | | |
Investment in securities, at value (including securities loaned of $28,932) - See accompanying schedule: Unaffiliated issuers (cost $947,210) | $ 1,242,974 | |
Fidelity Central Funds (cost $50,611) | 50,611 | |
Total Investments (cost $997,821) | | $ 1,293,585 |
Receivable for investments sold | | 5,110 |
Receivable for fund shares sold | | 2,712 |
Dividends receivable | | 559 |
Distributions receivable from Fidelity Central Funds | | 22 |
Receivable for daily variation margin for derivative instruments | | 27 |
Other receivables | | 28 |
Total assets | | 1,302,043 |
| | |
Liabilities | | |
Payable for investments purchased | $ 8,331 | |
Payable for fund shares redeemed | 945 | |
Accrued management fee | 573 | |
Other affiliated payables | 194 | |
Other payables and accrued expenses | 61 | |
Collateral on securities loaned, at value | 29,501 | |
Total liabilities | | 39,605 |
| | |
Net Assets | | $ 1,262,438 |
Net Assets consist of: | | |
Paid in capital | | $ 1,253,738 |
Undistributed net investment income | | 717 |
Accumulated undistributed net realized gain (loss) on investments and foreign currency transactions | | (288,062) |
Net unrealized appreciation (depreciation) on investments and assets and liabilities in foreign currencies | | 296,045 |
Net Assets | | $ 1,262,438 |
See accompanying notes which are an integral part of the financial statements.
Annual Report
Financial Statements - continued
Statement of Assets and Liabilities - continued
Amounts in thousands (except per-share amounts) | June 30, 2014 |
| | |
Growth Discovery:
Net Asset Value, offering price and redemption price per share ($1,072,065 ÷ 46,465 shares) | | $ 23.07 |
| | |
Class K:
Net Asset Value, offering price and redemption price per share ($190,373 ÷ 8,244 shares) | | $ 23.09 |
See accompanying notes which are an integral part of the financial statements.
Annual Report
Statement of Operations
Amounts in thousands | Year ended June 30, 2014 |
| | |
Investment Income | | |
Dividends | | $ 9,764 |
Income from Fidelity Central Funds | | 295 |
Total income | | 10,059 |
| | |
Expenses | | |
Management fee
Basic fee | $ 6,098 | |
Performance adjustment | 289 | |
Transfer agent fees | 1,805 | |
Accounting and security lending fees | 370 | |
Custodian fees and expenses | 68 | |
Independent trustees' compensation | 5 | |
Registration fees | 58 | |
Audit | 57 | |
Legal | 6 | |
Miscellaneous | 9 | |
Total expenses before reductions | 8,765 | |
Expense reductions | (39) | 8,726 |
Net investment income (loss) | | 1,333 |
Realized and Unrealized Gain (Loss) Net realized gain (loss) on: | | |
Investment securities: | | |
Unaffiliated issuers | 168,737 | |
Foreign currency transactions | (31) | |
Futures contracts | 1,344 | |
Total net realized gain (loss) | | 170,050 |
Change in net unrealized appreciation (depreciation) on: Investment securities | 124,386 | |
Futures contracts | 291 | |
Total change in net unrealized appreciation (depreciation) | | 124,677 |
Net gain (loss) | | 294,727 |
Net increase (decrease) in net assets resulting from operations | | $ 296,060 |
See accompanying notes which are an integral part of the financial statements.
Annual Report
Financial Statements - continued
Statement of Changes in Net Assets
Amounts in thousands | Year ended
June 30,
2014 | Year ended
June 30,
2013 |
Increase (Decrease) in Net Assets | | |
Operations | | |
Net investment income (loss) | $ 1,333 | $ 4,187 |
Net realized gain (loss) | 170,050 | 115,817 |
Change in net unrealized appreciation (depreciation) | 124,677 | 20,585 |
Net increase (decrease) in net assets resulting
from operations | 296,060 | 140,589 |
Distributions to shareholders from net investment income | (1,240) | (3,920) |
Distributions to shareholders from net realized gain | (308) | - |
Total distributions | (1,548) | (3,920) |
Share transactions - net increase (decrease) | 64,284 | (251,662) |
Total increase (decrease) in net assets | 358,796 | (114,993) |
| | |
Net Assets | | |
Beginning of period | 903,642 | 1,018,635 |
End of period (including undistributed net investment income of $717 and undistributed net investment income of $1,230, respectively) | $ 1,262,438 | $ 903,642 |
See accompanying notes which are an integral part of the financial statements.
Annual Report
Financial Highlights - Growth Discovery
Years ended June 30, | 2014 | 2013 | 2012 | 2011 | 2010 |
Selected Per-Share Data | | | | | |
Net asset value, beginning of period | $ 17.45 | $ 15.09 | $ 14.88 | $ 10.54 | $ 9.04 |
Income from Investment Operations | | | | | |
Net investment income (loss) B | .02 | .07 | .04 | .05 | .01 |
Net realized and unrealized gain (loss) | 5.63 | 2.35 | .26 | 4.37 | 1.52 |
Total from investment operations | 5.65 | 2.42 | .30 | 4.42 | 1.53 |
Distributions from net investment income | (.02) | (.06) | (.03) | (.03) | (.03) |
Distributions from net realized gain | (.01) | - | (.06) | (.05) | (.01) |
Total distributions | (.03) | (.06) | (.09) | (.08) | (.03)F |
Net asset value, end of period | $ 23.07 | $ 17.45 | $ 15.09 | $ 14.88 | $ 10.54 |
Total ReturnA | 32.40% | 16.09% | 2.07% | 42.09% | 16.96% |
Ratios to Average Net Assets C, E | | | | | |
Expenses before reductions | .81% | .88% | .81% | .63% | .76% |
Expenses net of fee waivers, if any | .81% | .88% | .81% | .63% | .76% |
Expenses net of all reductions | .81% | .87% | .80% | .62% | .75% |
Net investment income (loss) | .10% | .42% | .27% | .39% | .08% |
Supplemental Data | | | | | |
Net assets, end of period (in millions) | $ 1,072 | $ 767 | $ 875 | $ 932 | $ 604 |
Portfolio turnover rateD | 70% | 62% | 74% | 72% | 87% |
A Total returns would have been lower if certain expenses had not been reduced during the applicable periods shown.
B Calculated based on average shares outstanding during the period.
C Fees and expenses of any underlying Fidelity Central Funds are not included in the Fund's expense ratio. The Fund indirectly bears its proportionate share of the expenses of any underlying Fidelity Central Funds.
D Amount does not include the portfolio activity of any underlying Fidelity Central Funds.
E Expense ratios reflect operating expenses of the class. Expenses before reductions do not reflect amounts reimbursed by the investment adviser or reductions from brokerage service arrangements or reductions from other expense offset arrangements and do not represent the amount paid by the class during periods when reimbursements or reductions occur. Expenses net of fee waivers reflect expenses after reimbursement by the investment adviser but prior to reductions from brokerage service arrangements or other expense offset arrangements. Expenses net of all reductions represent the net expenses paid by the class.
F Total distributions of $.03 per share is comprised of distributions from net investment income of $.027 and distributions from net realized gain of $.005 per share.
See accompanying notes which are an integral part of the financial statements.
Annual Report
Financial Highlights - Class K
Years ended June 30, | 2014 | 2013 | 2012 | 2011 | 2010 |
Selected Per-Share Data | | | | | |
Net asset value, beginning of period | $ 17.45 | $ 15.09 | $ 14.88 | $ 10.55 | $ 9.05 |
Income from Investment Operations | | | | | |
Net investment income (loss) B | .05 | .09 | .06 | .08 | .03 |
Net realized and unrealized gain (loss) | 5.63 | 2.36 | .26 | 4.36 | 1.53 |
Total from investment operations | 5.68 | 2.45 | .32 | 4.44 | 1.56 |
Distributions from net investment income | (.04) | (.09) | (.06) | (.06) | (.05) |
Distributions from net realized gain | (.01) | - | (.06) | (.05) | (.01) |
Total distributions | (.04)H | (.09) | (.11)G | (.11) | (.06)F |
Net asset value, end of period | $ 23.09 | $ 17.45 | $ 15.09 | $ 14.88 | $ 10.55 |
Total ReturnA | 32.62% | 16.28% | 2.27% | 42.26% | 17.25% |
Ratios to Average Net Assets C, E | | | | | |
Expenses before reductions | .68% | .72% | .64% | .44% | .53% |
Expenses net of fee waivers, if any | .68% | .72% | .64% | .44% | .53% |
Expenses net of all reductions | .67% | .71% | .63% | .43% | .52% |
Net investment income (loss) | .24% | .58% | .44% | .58% | .31% |
Supplemental Data | | | | | |
Net assets, end of period (in millions) | $ 190 | $ 137 | $ 144 | $ 147 | $ 43 |
Portfolio turnover rateD | 70% | 62% | 74% | 72% | 87% |
A Total returns would have been lower if certain expenses had not been reduced during the applicable periods shown.
B Calculated based on average shares outstanding during the period.
C Fees and expenses of any underlying Fidelity Central Funds are not included in the Fund's expense ratio. The Fund indirectly bears its proportionate share of the expenses of any underlying Fidelity Central Funds.
D Amount does not include the portfolio activity of any underlying Fidelity Central Funds.
E Expense ratios reflect operating expenses of the class. Expenses before reductions do not reflect amounts reimbursed by the investment adviser or reductions from brokerage service arrangements or reductions from other expense offset arrangements and do not represent the amount paid by the class during periods when reimbursements or reductions occur. Expenses net of fee waivers reflect expenses after reimbursement by the investment adviser but prior to reductions from brokerage service arrangements or other expense offset arrangements. Expenses net of all reductions represent the net expenses paid by the class.
F Total distributions of $.06 per share is comprised of distributions from net investment income of $.054 and distributions from net realized gain of $.005 per share.
G Total distributions of $.11 per share is comprised of distributions from net investment income of $.058 and distributions from net realized gain of $.055 per share.
H Total distributions of $.04 per share is comprised of distributions from net investment income of $.036 and distributions from net realized gain of $.006 per share.
See accompanying notes which are an integral part of the financial statements.
Annual Report
Notes to Financial Statements
For the period ended June 30, 2014
(Amounts in thousands except percentages)
1. Organization.
Fidelity Growth Discovery Fund (the Fund) is a fund of Fidelity Hastings Street Trust (the Trust) and is authorized to issue an unlimited number of shares. The Trust is registered under the Investment Company Act of 1940, as amended (the 1940 Act), as an open-end management investment company organized as a Massachusetts business trust. The Fund offers Growth Discovery and Class K shares, each of which has equal rights as to assets and voting privileges. Each class has exclusive voting rights with respect to matters that affect that class.
2. Investments in Fidelity Central Funds.
The Fund invests in Fidelity Central Funds, which are open-end investment companies generally available only to other investment companies and accounts managed by the investment adviser and its affiliates. The Fund's Schedule of Investments lists each of the Fidelity Central Funds held as of period end, if any, as an investment of the Fund, but does not include the underlying holdings of each Fidelity Central Fund. As an Investing Fund, the Fund indirectly bears its proportionate share of the expenses of the underlying Fidelity Central Funds.
The Money Market Central Funds seek preservation of capital and current income and are managed by Fidelity Investments Money Management, Inc. (FIMM), an affiliate of the investment adviser. Annualized expenses of the Money Market Central Funds as of their most recent shareholder report date are less than .01%.
A complete unaudited list of holdings for each Fidelity Central Fund is available upon request or at the Securities and Exchange Commission (the SEC) website at www.sec.gov. In addition, the financial statements of the Fidelity Central Funds which contain the significant accounting policies (including investment valuation policies) of those funds, which are not covered by the Fund's Report of Independent Registered Public Accounting Firm, are available on the SEC website or upon request.
3. Significant Accounting Policies.
The financial statements have been prepared in conformity with accounting principles generally accepted in the United States of America (GAAP), which require management to make certain estimates and assumptions at the date of the financial statements. Actual results could differ from those estimates. Subsequent events, if any, through the date that the financial statements were issued have been evaluated in the preparation of
Annual Report
3. Significant Accounting Policies - continued
the financial statements. The following summarizes the significant accounting policies of the Fund:
Investment Valuation. Investments are valued as of 4:00 p.m. Eastern time on the last calendar day of the period. In accordance with valuation policies and procedures approved by the Board of Trustees (the Board), the Fund attempts to obtain prices from one or more third party pricing vendors or brokers to value its investments. When current market prices, quotations or currency exchange rates are not readily available or reliable, investments will be fair valued in good faith by the Fidelity Management & Research Company (FMR) Fair Value Committee (the Committee), in accordance with procedures adopted by the Board. Factors used in determining fair value vary by investment type and may include market or investment specific events, changes in interest rates and credit quality. The frequency with which these procedures are used cannot be predicted and they may be utilized to a significant extent. The Committee oversees the Fund's valuation policies and procedures and is responsible for approving and reporting to the Board all fair value determinations.
The Fund categorizes the inputs to valuation techniques used to value its investments into a disclosure hierarchy consisting of three levels as shown below:
Level 1 - quoted prices in active markets for identical investments
Level 2 - other significant observable inputs (including quoted prices for similar investments, interest rates, prepayment speeds, etc.)
Level 3 - unobservable inputs (including the Fund's own assumptions based on the best information available)
Valuation techniques used to value the Fund's investments by major category are as follows:
Equity securities, including restricted securities, for which market quotations are readily available, are valued at the last reported sale price or official closing price as reported by a third party pricing vendor on the primary market or exchange on which they are traded and are categorized as Level 1 in the hierarchy. In the event there were no sales during the day or closing prices are not available, securities are valued at the last quoted bid price or may be valued using the last available price and are generally categorized as Level 2 in the hierarchy. For foreign equity securities, when market or security specific events arise, comparisons to the valuation of American Depositary Receipts (ADRs), futures contracts, Exchange-Traded Funds (ETFs) and certain indexes as well as quoted prices for similar securities may be used and would be categorized as Level 2 in the hierarchy. Utilizing these techniques may result in transfers between Level 1 and Level 2. For equity securities, including restricted securities, where observable inputs are limited, assumptions about market activity and risk are used and these securities may be categorized as Level 3 in the hierarchy.
Annual Report
Notes to Financial Statements - continued
(Amounts in thousands except percentages)
3. Significant Accounting Policies - continued
Investment Valuation - continued
Debt securities, including restricted securities, are valued based on evaluated prices received from third party pricing vendors or from brokers who make markets in such securities. U.S. government and government agency obligations are valued by pricing vendors who utilize matrix pricing which considers yield or price of bonds of comparable quality, coupon, maturity and type or by broker-supplied prices. When independent prices are unavailable or unreliable, debt securities may be valued utilizing pricing methodologies which consider similar factors that would be used by third party pricing vendors. Debt securities are generally categorized as Level 2 in the hierarchy but may be Level 3 depending on the circumstances.
Futures contracts are valued at the settlement price established each day by the board of trade or exchange on which they are traded and are categorized as Level 1 in the hierarchy. Investments in open-end mutual funds, including Fidelity Central Funds, are valued at their closing net asset value (NAV) each business day and are categorized as Level 1 in the hierarchy.
Changes in valuation techniques may result in transfers in or out of an assigned level within the disclosure hierarchy. The aggregate value of investments by input level, as of June 30, 2014, is included at the end of the Fund's Schedule of Investments.
Foreign Currency. The Fund may use foreign currency contracts to facilitate transactions in foreign-denominated securities. Gains and losses from these transactions may arise from changes in the value of the foreign currency or if the counterparties do not perform under the contracts' terms.
Foreign-denominated assets, including investment securities, and liabilities are translated into U.S. dollars at the exchange rates at period end. Purchases and sales of investment securities, income and dividends received and expenses denominated in foreign currencies are translated into U.S. dollars at the exchange rate in effect on the transaction date.
The effects of exchange rate fluctuations on investments are included with the net realized and unrealized gain (loss) on investment securities. Other foreign currency transactions resulting in realized and unrealized gain (loss) are disclosed separately.
Investment Transactions and Income. For financial reporting purposes, the Fund's investment holdings and NAV include trades executed through the end of the last business day of the period. The NAV per share for processing shareholder transactions is calculated as of the close of business of the New York Stock Exchange (NYSE), normally 4:00 p.m. Eastern time and includes trades executed through the end of the prior business day. Gains and losses on securities sold are determined on the basis of identified
Annual Report
3. Significant Accounting Policies - continued
Investment Transactions and Income - continued
cost and may include proceeds received from litigation. Dividend income is recorded on the ex-dividend date, except for certain dividends from foreign securities where the ex-dividend date may have passed, which are recorded as soon as the Fund is informed of the ex-dividend date. Non-cash dividends included in dividend income, if any, are recorded at the fair market value of the securities received. Income and capital gain distributions from Fidelity Central Funds, if any, are recorded on the ex-dividend date. Distributions received on securities that represent a return of capital or capital gain are recorded as a reduction of cost of investments and/or as a realized gain. Subsequent to ex-dividend date the Fund determines the components of these distributions, based upon receipt of tax filings or other correspondence relating to the underlying investment. Interest income is accrued as earned and includes coupon interest and amortization of premium and accretion of discount on debt securities as applicable. Investment income is recorded net of foreign taxes withheld where recovery of such taxes is uncertain.
Class Allocations and Expenses. Investment income, realized and unrealized capital gains and losses, common expenses of the Fund, and certain fund-level expense reductions, if any, are allocated daily on a pro-rata basis to each class based on the relative net assets of each class to the total net assets of the Fund. Each class differs with respect to transfer agent fees incurred. Certain expense reductions may also differ by class. For the reporting period, the allocated portion of income and expenses to each class as a percent of its average net assets may vary due to the timing of recording these transactions in relation to fluctuating net assets of the classes. Expenses directly attributable to a fund are charged to that fund. Expenses attributable to more than one fund are allocated among the respective funds on the basis of relative net assets or other appropriate methods. Expense estimates are accrued in the period to which they relate and adjustments are made when actual amounts are known.
Income Tax Information and Distributions to Shareholders. Each year, the Fund intends to qualify as a regulated investment company under Subchapter M of the Internal Revenue Code, including distributing substantially all of its taxable income and realized gains. As a result, no provision for U.S. Federal income taxes is required. As of June 30, 2014, the Fund did not have any unrecognized tax benefits in the financial statements; nor is the Fund aware of any tax positions for which it is reasonably possible that the total amounts of unrecognized tax benefits will significantly change in the next twelve months. The Fund files a U.S. federal tax return, in addition to state and local tax returns as required. The Fund's federal income tax returns are subject to examination by the Internal Revenue Service (IRS) for a period of three fiscal years after they are filed. State and local tax returns may be subject to examination for an additional fiscal year depending on the jurisdiction. Foreign taxes are provided for based on the Fund's understanding of the tax rules and rates that exist in the foreign markets in which it invests.
Annual Report
Notes to Financial Statements - continued
(Amounts in thousands except percentages)
3. Significant Accounting Policies - continued
Income Tax Information and Distributions to Shareholders - continued
Distributions are declared and recorded on the ex-dividend date. Income dividends and capital gain distributions are declared separately for each class. Income and capital gain distributions are determined in accordance with income tax regulations, which may differ from GAAP.
Capital accounts within the financial statements are adjusted for permanent book-tax differences. These adjustments have no impact on net assets or the results of operations. Capital accounts are not adjusted for temporary book-tax differences which will reverse in a subsequent period.
Book-tax differences are primarily due to futures contracts, foreign currency transactions, partnerships, capital loss carryforwards and losses deferred due to wash sales.
The federal tax cost of investment securities and unrealized appreciation (depreciation) as of period end were as follows:
Gross unrealized appreciation | $ 305,020 |
Gross unrealized depreciation | (11,882) |
Net unrealized appreciation (depreciation) on securities and other investments | $ 293,138 |
| |
Tax Cost | $ 1,000,447 |
The tax-based components of distributable earnings as of period end were as follows:
Undistributed ordinary income | $ 717 |
Capital loss carryforward | $ (285,145) |
Net unrealized appreciation (depreciation) | $ 293,128 |
Capital loss carryforwards are only available to offset future capital gains of the Fund to the extent provided by regulations and may be limited. Under the Regulated Investment Company Modernization Act of 2010 (the Act), the Fund is permitted to carry forward capital losses incurred in taxable years beginning after December 22, 2010 for an unlimited period and such capital losses are required to be used prior to any losses that expire. The capital loss carryforward information presented below, including any applicable limitation, is estimated as of fiscal period end and is subject to adjustment.
Annual Report
3. Significant Accounting Policies - continued
Income Tax Information and Distributions to Shareholders - continued
Fiscal year of expiration | |
2017 | $ (24,714) |
2018 | (260,431) |
Total capital loss carryforward | $ (285,145) |
The tax character of distributions paid was as follows:
| June 30, 2014 | June 30, 2013 |
Ordinary Income | $ 1,548 | $ 3,920 |
Restricted Securities. The Fund may invest in securities that are subject to legal or contractual restrictions on resale. These securities generally may be resold in transactions exempt from registration or to the public if the securities are registered. Disposal of these securities may involve time-consuming negotiations and expense, and prompt sale at an acceptable price may be difficult. Information regarding restricted securities is included at the end of the Fund's Schedule of Investments.
4. Derivative Instruments.
Risk Exposures and the Use of Derivative Instruments. The Fund's investment objective allows the Fund to enter into various types of derivative contracts, including futures contracts. Derivatives are investments whose value is primarily derived from underlying assets, indices or reference rates and may be transacted on an exchange or over-the-counter (OTC). Derivatives may involve a future commitment to buy or sell a specified asset based on specified terms, to exchange future cash flows at periodic intervals based on a notional principal amount, or for one party to make one or more payments upon the occurrence of specified events in exchange for periodic payments from the other party.
The Fund used derivatives to increase returns and to manage exposure to certain risks as defined below. The success of any strategy involving derivatives depends on analysis of numerous economic factors, and if the strategies for investment do not work as intended, the Fund may not achieve its objectives.
The Fund's use of derivatives increased or decreased its exposure to the following risk:
Equity Risk | Equity risk relates to the fluctuations in the value of financial instruments as a result of changes in market prices (other than those arising from interest rate risk or foreign exchange risk), whether caused by factors specific to an individual investment, its issuer, or all factors affecting all instruments traded in a market or market segment. |
Annual Report
Notes to Financial Statements - continued
(Amounts in thousands except percentages)
4. Derivative Instruments - continued
Risk Exposures and the Use of Derivative Instruments - continued
The Fund is also exposed to additional risks from investing in derivatives, such as liquidity risk and counterparty credit risk. Liquidity risk is the risk that the Fund will be unable to close out the derivative in the open market in a timely manner. Counterparty credit risk is the risk that the counterparty will not be able to fulfill its obligation to the Fund. Counterparty credit risk related to exchange-traded futures contracts may be mitigated by the protection provided by the exchange on which they trade.
Investing in derivatives may involve greater risks than investing in the underlying assets directly and, to varying degrees, may involve risk of loss in excess of any initial investment and collateral received and amounts recognized in the Statement of Assets and Liabilities. In addition, there may be the risk that the change in value of the derivative contract does not correspond to the change in value of the underlying instrument.
Futures Contracts. A futures contract is an agreement between two parties to buy or sell a specified underlying instrument for a fixed price at a specified future date. The Fund used futures contracts to manage its exposure to the stock market.
Upon entering into a futures contract, a fund is required to deposit either cash or securities (initial margin) with a clearing broker in an amount equal to a certain percentage of the face value of the contract. Futures contracts are marked-to-market daily and subsequent daily payments (variation margin) are made or received by a fund depending on the daily fluctuations in the value of the futures contracts and are recorded as unrealized appreciation or (depreciation). This receivable and/or payable, if any, is included in daily variation margin for derivative instruments in the Statement of Assets and Liabilities. Realized gain or (loss) is recorded upon the expiration or closing of a futures contract.
Any open futures contracts at period end are presented in the Schedule of Investments under the caption "Futures Contracts." The underlying face amount at value reflects each contract's exposure to the underlying instrument or index at period end and is representative of volume of activity during the period. Securities deposited to meet initial margin requirements are identified in the Schedule of Investments.
During the period the Fund recognized net realized gain (loss) of $1,344 and a change in net unrealized appreciation (depreciation) of $291 related to its investment in futures contracts. These amounts are included in the Statement of Operations.
5. Purchases and Sales of Investments.
Purchases and sales of securities, other than short-term securities, aggregated $805,090 and $750,433, respectively.
Annual Report
6. Fees and Other Transactions with Affiliates.
Management Fee. Fidelity Management & Research Company (the investment adviser) and its affiliates provide the Fund with investment management related services for which the Fund pays a monthly management fee. The management fee is the sum of an individual fund fee rate that is based on an annual rate of .30% of the Fund's average net assets and an annualized group fee rate that averaged .25% during the period. The group fee rate is based upon the average net assets of all the mutual funds advised by the investment adviser, including any mutual funds previously advised by the investment adviser that are currently advised by Fidelity SelectCo, LLC, an affiliate of the investment adviser. The group fee rate decreases as assets under management increase and increases as assets under management decrease. In addition, the management fee is subject to a performance adjustment (up to a maximum of ± .20% of the Fund's average net assets over a 36 month performance period). The upward or downward adjustment to the management fee is based on the relative investment performance of Growth Discovery as compared to its benchmark index, the Russell 3000 Growth Index, over the same 36 month performance period. For the reporting period, the total annual management fee rate, including the performance adjustment, was .58% of the Fund's average net assets. The performance adjustment included in the management fee rate may be higher or lower than the maximum performance adjustment rate due to the difference between the average net assets for the reporting and performance periods.
Transfer Agent Fees. Fidelity Investments Institutional Operations Company, Inc., (FIIOC), an affiliate of the investment adviser, is the transfer, dividend disbursing and shareholder servicing agent for each class of the Fund. FIIOC receives account fees and asset-based fees that vary according to the account size and type of account of the shareholders of Growth Discovery. FIIOC receives an asset-based fee of Class K's average net assets. FIIOC pays for typesetting, printing and mailing of shareholder reports, except proxy statements.
For the period, transfer agent fees for each class were as follows:
| Amount | % of
Average
Net Assets |
Growth Discovery | $ 1,728 | .18 |
Class K | 77 | .05 |
| $ 1,805 | |
Accounting and Security Lending Fees. Fidelity Service Company, Inc. (FSC), an affiliate of the investment adviser, maintains the Fund's accounting records. The accounting fee is based on the level of average net assets for each month. Under a separate contract, FSC administers the security lending program. The security lending fee is based on the number and duration of lending transactions.
Annual Report
Notes to Financial Statements - continued
(Amounts in thousands except percentages)
6. Fees and Other Transactions with Affiliates - continued
Brokerage Commissions. The Fund placed a portion of its portfolio transactions with brokerage firms which are affiliates of the investment adviser or Sub-adviser. Brokerage commissions are included in net realized gain (loss) and change in net unrealized appreciation (depreciation) in the Statement of Operations. The commissions paid to these affiliated firms were $11 for the period.
7. Committed Line of Credit.
The Fund participates with other funds managed by the investment adviser or an affiliate in a $4.25 billion credit facility (the "line of credit") to be utilized for temporary or emergency purposes to fund shareholder redemptions or for other short-term liquidity purposes. The Fund has agreed to pay commitment fees on its pro-rata portion of the line of credit, which amounted to $2 and is reflected in Miscellaneous expenses on the Statement of Operations. During the period, the Fund did not borrow on this line of credit.
8. Security Lending.
The Fund lends portfolio securities through a lending agent from time to time in order to earn additional income. For equity securities, a lending agent is used and may loan securities to certain qualified borrowers, including Fidelity Capital Markets (FCM), a broker-dealer affiliated with the Fund. On the settlement date of the loan, the Fund receives collateral (in the form of U.S. Treasury obligations, letters of credit and/or cash) against the loaned securities and maintains collateral in an amount not less than 100% of the market value of the loaned securities during the period of the loan. The market value of the loaned securities is determined at the close of business of the Fund and any additional required collateral is delivered to the Fund on the next business day. If the borrower defaults on its obligation to return the securities loaned because of insolvency or other reasons, the Fund may apply collateral received from the borrower against the obligation. The Fund may experience delays and costs in recovering the securities loaned. Any cash collateral received is invested in the Fidelity Securities Lending Cash Central Fund. The value of loaned securities and cash collateral at period end are disclosed on the Fund's Statement of Assets and Liabilities. At period end, there were no security loans outstanding with FCM. Security lending income represents the income earned on investing cash collateral, less rebates paid to borrowers and any lending agent fees associated with the loan, plus any premium payments received for lending certain types of securities. Security lending income is presented in the Statement of Operations as a component of income from Fidelity Central Funds. Total security lending income during the period amounted to $257, including $2 from securities loaned to FCM.
Annual Report
9. Expense Reductions.
Commissions paid to certain brokers with whom the investment adviser, or its affiliates, places trades on behalf of the Fund include an amount in addition to trade execution, which may be rebated back to the Fund to offset certain expenses. This amount totaled $28 for the period.
In addition, the investment adviser reimbursed a portion of the Fund's operating expenses during the period in the amount of $11.
10. Distributions to Shareholders.
Distributions to shareholders of each class were as follows:
Years ended June 30, | 2014 | 2013 |
From net investment income | | |
Growth Discovery | $ 959 | $ 3,196 |
Class K | 281 | 724 |
Total | $ 1,240 | $ 3,920 |
From net realized gain | | |
Growth Discovery | $ 261 | $ - |
Class K | 47 | - |
Total | $ 308 | $ - |
11. Share Transactions.
Transactions for each class of shares were as follows:
| Shares | Dollars |
Years ended June 30, | 2014 | 2013 | 2014 | 2013 |
Growth Discovery | | | | |
Shares sold | 11,432 | 5,161 | $ 240,406 | $ 82,537 |
Reinvestment of distributions | 61 | 198 | 1,152 | 3,039 |
Shares redeemed | (8,980) | (19,383) | (186,625) | (309,727) |
Net increase (decrease) | 2,513 | (14,024) | $ 54,933 | $ (224,151) |
Class K | | | | |
Shares sold | 2,259 | 3,128 | $ 47,861 | $ 49,663 |
Reinvestment of distributions | 17 | 47 | 328 | 724 |
Shares redeemed | (1,868) | (4,878) | (38,838) | (77,898) |
Net increase (decrease) | 408 | (1,703) | $ 9,351 | $ (27,511) |
Annual Report
Notes to Financial Statements - continued
(Amounts in thousands except percentages)
12. Other.
The Fund's organizational documents provide former and current trustees and officers with a limited indemnification against liabilities arising in connection with the performance of their duties to the Fund. In the normal course of business, the Fund may also enter into contracts that provide general indemnifications. The Fund's maximum exposure under these arrangements is unknown as this would be dependent on future claims that may be made against the Fund. The risk of material loss from such claims is considered remote.
Annual Report
To the Trustees of Fidelity Hastings Street Trust and the Shareholders of Fidelity Growth Discovery Fund:
In our opinion, the accompanying statement of assets and liabilities, including the schedule of investments, and the related statements of operations and of changes in net assets and the financial highlights present fairly, in all material respects, the financial position of Fidelity Growth Discovery Fund (a fund of Fidelity Hastings Street Trust) at June 30, 2014, the results of its operations for the year then ended, the changes in its net assets for each of the two years in the period then ended and the financial highlights for each of the five years in the period then ended, in conformity with accounting principles generally accepted in the United States of America. These financial statements and financial highlights (hereafter referred to as "financial statements") are the responsibility of the Fidelity Growth Discovery Fund's management. Our responsibility is to express an opinion on these financial statements based on our audits. We conducted our audits of these financial statements in accordance with the standards of the Public Company Accounting Oversight Board (United States). Those standards require that we plan and perform the audit to obtain reasonable assurance about whether the financial statements are free of material misstatement. An audit includes examining, on a test basis, evidence supporting the amounts and disclosures in the financial statements, assessing the accounting principles used and significant estimates made by management, and evaluating the overall financial statement presentation. We believe that our audits, which included confirmation of securities at June 30, 2014 by correspondence with the custodian and brokers, provide a reasonable basis for our opinion.
PricewaterhouseCoopers LLP
Boston, Massachusetts
August 11, 2014
Annual Report
The Trustees, Member of the Advisory Board, and officers of the trust and fund, as applicable, are listed below. The Board of Trustees governs the fund and is responsible for protecting the interests of shareholders. The Trustees are experienced executives who meet periodically throughout the year to oversee the fund's activities, review contractual arrangements with companies that provide services to the fund, oversee management of the risks associated with such activities and contractual arrangements, and review the fund's performance. Except for James C. Curvey, each of the Trustees oversees 173 funds. Mr. Curvey oversees 397 funds.
The Trustees hold office without limit in time except that (a) any Trustee may resign; (b) any Trustee may be removed by written instrument, signed by at least two-thirds of the number of Trustees prior to such removal; (c) any Trustee who requests to be retired or who has become incapacitated by illness or injury may be retired by written instrument signed by a majority of the other Trustees; and (d) any Trustee may be removed at any special meeting of shareholders by a two-thirds vote of the outstanding voting securities of the trust. Each Trustee who is not an interested person (as defined in the 1940 Act) of the trust and the fund (Independent Trustee), shall retire not later than the last day of the calendar year in which his or her 75th birthday occurs. The Independent Trustees may waive this mandatory retirement age policy with respect to individual Trustees. The officers and Advisory Board Member hold office without limit in time, except that any officer and Advisory Board Member may resign or may be removed by a vote of a majority of the Trustees at any regular meeting or any special meeting of the Trustees. Except as indicated, each individual has held the office shown or other offices in the same company for the past five years.
Experience, Skills, Attributes, and Qualifications of the Fund's Trustees. The Governance and Nominating Committee has adopted a statement of policy that describes the experience, qualifications, attributes, and skills that are necessary and desirable for potential Independent Trustee candidates (Statement of Policy). The Board believes that each Trustee satisfied at the time he or she was initially elected or appointed a Trustee, and continues to satisfy, the standards contemplated by the Statement of Policy. The Governance and Nominating Committee also engages professional search firms to help identify potential Independent Trustee candidates who have the experience, qualifications, attributes, and skills consistent with the Statement of Policy. From time to time, additional criteria based on the composition and skills of the current Independent Trustees, as well as experience or skills that may be appropriate in light of future changes to board composition, business conditions, and regulatory or other developments, have also been considered by the professional search firms and the Governance and Nominating Committee. In addition, the Board takes into account the Trustees' commitment and participation in Board and committee meetings, as well as their leadership of standing and ad hoc committees throughout their tenure.
In determining that a particular Trustee was and continues to be qualified to serve as a Trustee, the Board has considered a variety of criteria, none of which, in isolation, was controlling. The Board believes that, collectively, the Trustees have balanced and diverse experience, qualifications, attributes, and skills, which allow the Board to operate effectively in governing the fund and protecting the interests of shareholders. Information about the specific experience, skills, attributes, and qualifications of each Trustee, which in each case led to the Board's conclusion that the Trustee should serve (or continue to serve) as a trustee of the fund, is provided below.
Annual Report
Board Structure and Oversight Function. James C. Curvey is an interested person (as defined in the 1940 Act) and currently serves as Chairman. The Trustees have determined that an interested Chairman is appropriate and benefits shareholders because an interested Chairman has a personal and professional stake in the quality and continuity of services provided to the fund. Independent Trustees exercise their informed business judgment to appoint an individual of their choosing to serve as Chairman, regardless of whether the Trustee happens to be independent or a member of management. The Independent Trustees have determined that they can act independently and effectively without having an Independent Trustee serve as Chairman and that a key structural component for assuring that they are in a position to do so is for the Independent Trustees to constitute a substantial majority for the Board. The Independent Trustees also regularly meet in executive session. Ned C. Lautenbach serves as Chairman of the Independent Trustees and as such (i) acts as a liaison between the Independent Trustees and management with respect to matters important to the Independent Trustees and (ii) with management prepares agendas for Board meetings.
Fidelity funds are overseen by different Boards of Trustees. The fund's Board oversees Fidelity's equity and high income funds and another Board oversees Fidelity's investment-grade bond, money market, and asset allocation funds. The asset allocation funds may invest in Fidelity funds overseen by the fund's Board. The use of separate Boards, each with its own committee structure, allows the Trustees of each group of Fidelity funds to focus on the unique issues of the funds they oversee, including common research, investment, and operational issues. On occasion, the separate Boards establish joint committees to address issues of overlapping consequences for the Fidelity funds overseen by each Board.
The Trustees operate using a system of committees to facilitate the timely and efficient consideration of all matters of importance to the Trustees, the fund, and fund shareholders and to facilitate compliance with legal and regulatory requirements and oversight of the fund's activities and associated risks. The Board, acting through its committees, has charged FMR and its affiliates with (i) identifying events or circumstances the occurrence of which could have demonstrably adverse effects on the fund's business and/or reputation; (ii) implementing processes and controls to lessen the possibility that such events or circumstances occur or to mitigate the effects of such events or circumstances if they do occur; and (iii) creating and maintaining a system designed to evaluate continuously business and market conditions in order to facilitate the identification and implementation processes described in (i) and (ii) above. Because the day-to-day operations and activities of the fund are carried out by or through FMR, its affiliates and other service providers, the fund's exposure to risks is mitigated but not eliminated by the processes overseen by the Trustees. While each of the Board's committees has responsibility for overseeing different aspects of the fund's activities, oversight is exercised primarily through the Operations, Audit, and Compliance Committees. In addition, the Independent Trustees have worked with FMR to enhance the Board's oversight of investment and financial risks, legal and regulatory risks, technology risks, and operational risks, including the development of additional risk reporting to the Board. For example, a working group comprised of Independent Trustees and FMR has worked and continues to work to review the Fidelity funds' valuation-related activities, reporting and risk management. Appropriate personnel, including but not limited to the fund's Chief Compliance Officer (CCO), FMR's internal auditor, the independent accountants, the fund's Treasurer and portfolio management personnel, make periodic reports to the Board's committees, as appropriate, including an annual review of FMR's risk management program for the Fidelity funds. The responsibilities of each standing committee, including their oversight responsibilities, are described further under "Standing Committees of the Fund's Trustees."
Annual Report
Trustees and Officers - continued
The fund's Statements of Additional Information (SAI) includes more information about the Trustees. To request a free copy, call Fidelity at 1-800-835-5092.
Interested Trustees*:
Correspondence intended for each Trustee who is an interested person may be sent to Fidelity Investments, 245 Summer Street, Boston, Massachusetts 02210.
Name, Year of Birth; Principal Occupations and Other Relevant Experience+ |
James C. Curvey (1935) |
Year of Election or Appointment: 2007 Trustee Chairman of the Board of Trustees |
| Mr. Curvey also serves as Trustee of other Fidelity funds. Mr. Curvey is a Director of Fidelity Research & Analysis Co. (2009-present), and Vice Chairman (2007-present) and Director of FMR LLC. In addition, Mr. Curvey serves as an Overseer for the Boston Symphony Orchestra and a member of the Trustees of Villanova University. Previously, Mr. Curvey served as a Director of Fidelity Investments Money Management, Inc. (2009-2014), a Director of FMR (2007-2014), a Director of FMR Co., Inc. (2007-2014) and was the Vice Chairman (2006-2007) and Director (2000-2007) of FMR Corp. |
Charles S. Morrison (1960) |
Year of Election or Appointment: 2014 Trustee |
| Mr. Morrison also serves as Trustee of other funds. He serves as President, Asset Management (2014-present) and is an employee of Fidelity Investments. Previously, Mr. Morrison served as Vice President of Fidelity's Fixed Income and Asset Allocation Funds (2012-2014), President, Fixed Income (2011-2014), Vice President of Fidelity's Money Market Funds (2005-2009), President, Money Market Group Leader of FMR (2009), and Senior Vice President, Money Market Group of FMR (2004-2009). Mr. Morrison also served as Vice President of Fidelity's Bond Funds (2002-2005), certain Balanced Funds (2002-2005), and certain Asset Allocation Funds (2002-2007), and as Senior Vice President (2002-2005) of Fidelity's Bond Division. |
* Trustees have been determined to be "Interested Trustees" by virtue of, among other things, their affiliation with the trust or various entities under common control with FMR.
+ The information above includes each Trustee's principal occupation during the last five years and other information relating to the experience, attributes, and skills relevant to each Trustee's qualifications to serve as a Trustee, which led to the conclusion that each Trustee should serve as a Trustee for the fund.
Annual Report
Trustees and Officers - continued
Independent Trustees:
Correspondence intended for each Independent Trustee (that is, the Trustees other than the Interested Trustees) may be sent to Fidelity Investments, P.O. Box 55235, Boston, Massachusetts 02205-5235.
Name, Year of Birth; Principal Occupations and Other Relevant Experience+ |
Dennis J. Dirks (1948) |
Year of Election or Appointment: 2005 Trustee |
| Mr. Dirks also serves as Trustee of other Fidelity funds. Prior to his retirement in May 2003, Mr. Dirks was Chief Operating Officer and a member of the Board of The Depository Trust & Clearing Corporation (DTCC). He also served as President, Chief Operating Officer, and Board member of The Depository Trust Company (DTC) and President and Board member of the National Securities Clearing Corporation (NSCC). In addition, Mr. Dirks served as Chief Executive Officer and Board member of the Government Securities Clearing Corporation, Chief Executive Officer and Board member of the Mortgage-Backed Securities Clearing Corporation, as a Trustee and a member of the Finance Committee of Manhattan College (2005-2008), and as a Trustee and a member of the Finance Committee of AHRC of Nassau County (2006-2008). Mr. Dirks is a member of the Independent Directors Council (IDC) Governing Council (2010-present) and Board of Directors for The Brookville Center for Children's Services, Inc. (2009-present). |
Alan J. Lacy (1953) |
Year of Election or Appointment: 2008 Trustee |
| Mr. Lacy also serves as Trustee of other Fidelity funds. Mr. Lacy serves as Senior Adviser (2007-present) of Oak Hill Capital Partners, L.P. (private equity). Mr. Lacy also served as Chief Executive Officer (2000-2005) and Vice Chairman (2005-2006) of Sears Holdings Corporation and Sears, Roebuck and Co. (retail). In addition, Mr. Lacy serves as a member of the Board of Directors of Dave & Buster's Entertainment, Inc. (restaurant and entertainment complexes, 2010-present), Earth Fare, Inc. (retail grocery, 2012-present), The Hillman Companies, Inc. (hardware wholesalers, 2010-present), and Bristol-Myers Squibb Company (global pharmaceuticals, 2008-present). Mr. Lacy is a member of the Board of Trustees of The National Parks Conservation Association (2006-present). Previously, Mr. Lacy served as Chairman of the Board of Trustees of the National Parks Conservation Association (2008-2011) and as a member of the Board of Directors for the Western Union Company (global money transfer, 2006-2011). |
Ned C. Lautenbach (1944) |
Year of Election or Appointment: 2000 Trustee Chairman of the Independent Trustees |
| Mr. Lautenbach also serves as Trustee of other Fidelity funds. Mr. Lautenbach currently serves as the Lead Director of the Eaton Corporation Board of Directors (diversified industrial, 1997-present). Mr. Lautenbach is Chairman of the Board of Directors of the Philharmonic Center for the Arts in Naples, Florida (2012-present) and a member of the Council on Foreign Relations (1994-present). Previously, Mr. Lautenbach was a Partner/Advisory Partner at Clayton, Dubilier & Rice, LLC (private equity investment, 1998-2010), as well as a Director of Sony Corporation (2006-2007). |
Joseph Mauriello (1944) |
Year of Election or Appointment: 2008 Trustee |
| Mr. Mauriello also serves as Trustee of other Fidelity funds. Prior to his retirement in January 2006, Mr. Mauriello served in numerous senior management positions including Deputy Chairman and Chief Operating Officer (2004-2005), and Vice Chairman of Financial Services (2002-2004) of KPMG LLP US (professional services, 1965-2005). Mr. Mauriello currently serves as a member of the Board of Directors of XL Group plc. (global insurance and re-insurance, 2006-present). Previously, Mr. Mauriello served as a Director of the Hamilton Funds of the Bank of New York (2006-2007) and of Arcadia Resources Inc. (health care services and products, 2007-2012). |
Robert W. Selander (1950) |
Year of Election or Appointment: 2011 Trustee |
| Mr. Selander also serves as Trustee of other Fidelity funds. Previously, Mr. Selander served as a Member of the Advisory Board of other Fidelity funds (2011), and Executive Vice Chairman (2010), Chief Executive Officer (2009-2010), and President and Chief Executive Officer (1997-2009) of Mastercard, Inc. |
Cornelia M. Small (1944) |
Year of Election or Appointment: 2005 Trustee |
| Ms. Small also serves as Trustee of other Fidelity funds. Ms. Small is a member of the Board of Directors (2009-present) and Chair of the Investment Committee (2010-present) of the Teagle Foundation. Ms. Small also serves on the Investment Committee of the Berkshire Taconic Community Foundation (2008-present). Previously, Ms. Small served as Chairperson (2002-2008) and a member of the Investment Committee and Chairperson (2008-2012) and a member of the Board of Trustees of Smith College. In addition, Ms. Small served as Chief Investment Officer, Director of Global Equity Investments, and a member of the Board of Directors of Scudder, Stevens & Clark and Scudder Kemper Investments. |
William S. Stavropoulos (1939) |
Year of Election or Appointment: 2001 Trustee Vice Chairman of the Independent Trustees |
| Mr. Stavropoulos also serves as Trustee of other Fidelity funds. Mr. Stavropoulos serves as President and Founder of the Michigan Baseball Foundation, the Great Lakes Loons (2007-present). Mr. Stavropoulos is Chairman Emeritus of the Board of Directors of The Dow Chemical Company, where he previously served in numerous senior management positions, including President, CEO (1995-2000; 2002-2004), Chairman of the Executive Committee (2000-2006), and as a member of the Board of Directors (1990-2006). Currently, Mr. Stavropoulos is Chairman of the Board of Directors of Univar Inc. (global distributor of commodity and specialty chemicals), a Director of Teradata Corporation (data warehousing and technology solutions), and Maersk Inc. (industrial conglomerate), and a member of the Advisory Board for Metalmark Capital LLC (private equity investment, 2005-present). Mr. Stavropoulos is an operating advisor to Clayton, Dubilier & Rice, LLC (private equity investment). In addition, Mr. Stavropoulos is a member of the University of Notre Dame Advisory Council for the College of Science, a Trustee of the Rollin L. Gerstacker Foundation, and a Director of the Naples Philharmonic Center for the Arts. Previously, Mr. Stavropoulos served as a Director of Chemical Financial Corporation (bank holding company, 1993-2012) and Tyco International, Ltd. (multinational manufacturing and services, 2007-2012). |
David M. Thomas (1949) |
Year of Election or Appointment: 2008 Trustee |
| Mr. Thomas also serves as Trustee of other Fidelity funds. Mr. Thomas serves as Non-Executive Chairman of the Board of Directors of Fortune Brands Home and Security (home and security products, 2011-present), and as a member of the Board of Directors of Interpublic Group of Companies, Inc. (marketing communication, 2004-present). Previously, Mr. Thomas served as Executive Chairman (2005-2006) and Chairman and Chief Executive Officer (2000-2005) of IMS Health, Inc. (pharmaceutical and healthcare information solutions), and a Director of Fortune Brands, Inc. (consumer products, 2000-2011). |
+ The information above includes each Trustee's principal occupation during the last five years and other information relating to the experience, attributes, and skills relevant to each Trustee's qualifications to serve as a Trustee, which led to the conclusion that each Trustee should serve as a Trustee for the fund.
Advisory Board Member and Officers:
Correspondence intended for each officer and Peter S. Lynch may be sent to Fidelity Investments, 245 Summer Street, Boston, Massachusetts 02210. Officers appear below in alphabetical order.
Name, Year of Birth; Principal Occupation |
Peter S. Lynch (1944) |
Year of Election or Appointment: 2003 Member of the Advisory Board |
| Mr. Lynch also serves as Member of the Advisory Board of other Fidelity funds. Mr. Lynch is Vice Chairman and a Director of FMR and FMR Co., Inc. In addition, Mr. Lynch serves as a Trustee of Boston College and as the Chairman of the Inner-City Scholarship Fund. Previously, Mr. Lynch served on the Special Olympics International Board of Directors (1997-2006). |
Elizabeth Paige Baumann (1968) |
Year of Election or Appointment: 2012 Anti-Money Laundering (AML) Officer |
| Ms. Baumann also serves as AML Officer of other funds. She is Chief AML Officer of FMR LLC (2012-present) and is an employee of Fidelity Investments. Previously, Ms. Baumann served as Vice President and Deputy Anti-Money Laundering Officer (2007-2012). |
William C. Coffey (1969) |
Year of Election or Appointment: 2009 Assistant Secretary |
| Mr. Coffey also serves as Assistant Secretary of other funds. He is Senior Vice President and Deputy General Counsel of FMR LLC (2010-present), and is an employee of Fidelity Investments. Previously, Mr. Coffey served as Vice President and Associate General Counsel of FMR LLC (2005-2009). |
Jonathan Davis (1968) |
Year of Election or Appointment: 2010 Assistant Treasurer |
| Mr. Davis also serves as Assistant Treasurer of other funds. Mr. Davis is an employee of Fidelity Investments. Previously, Mr. Davis served as Vice President and Associate General Counsel of FMR LLC (2003-2010). |
Adrien E. Deberghes (1967) |
Year of Election or Appointment: 2008 Deputy Treasurer |
| Mr. Deberghes also serves as an officer of other funds. He is an employee of Fidelity Investments (2008-present). Prior to joining Fidelity Investments, Mr. Deberghes was Senior Vice President of Mutual Fund Administration at State Street Corporation (2007-2008), Senior Director of Mutual Fund Administration at Investors Bank & Trust (2005-2007), and Director of Finance for Dunkin' Brands (2000-2005). |
Stephanie J. Dorsey (1969) |
Year of Election or Appointment: 2010 Assistant Treasurer |
| Ms. Dorsey also serves as an officer of other funds. She is an employee of Fidelity Investments (2008-present) and has served in other fund officer roles. Prior to joining Fidelity Investments, Ms. Dorsey served as Treasurer (2004-2008) of the JPMorgan Mutual Funds and Vice President (2004-2008) of JPMorgan Chase Bank. |
Howard J. Galligan III (1966) |
Year of Election or Appointment: 2014 Chief Financial Officer |
| Mr. Galligan also serves as Chief Financial Officer of other funds. Mr. Galligan serves as President of Fidelity Pricing and Cash Management Services (FPCMS) (2014-present) and as a Director of Strategic Advisers, Inc. (2008-present). Previously, Mr. Galligan served as Chief Administrative Officer of Asset Management (2011-2014) and Chief Operating Officer and Senior Vice President of Investment Support for Strategic Advisers, Inc. (2003-2011). |
Scott C. Goebel (1968) |
Year of Election or Appointment: 2008 Secretary and Chief Legal Officer (CLO) |
| Mr. Goebel serves as Secretary and CLO of other funds. Mr. Goebel also serves as Secretary of Fidelity SelectCo, LLC (2013-present), Fidelity Investments Money Management, Inc. (FIMM) (2010-present) and Fidelity Research and Analysis Company (FRAC) (2010-present); General Counsel, Secretary, and Senior Vice President of FMR (2008-present) and FMR Co., Inc. (2008-present); Chief Legal Officer of Fidelity Management & Research (Hong Kong) Limited (2008-present); and Assistant Secretary of Fidelity Management & Research (Japan) Inc. (2008-present) and Fidelity Management & Research (U.K.) Inc. (2008-present). Previously, Mr. Goebel served as Secretary and CLO of other Fidelity funds (2008-2013), Assistant Secretary of FIMM (2008-2010), FRAC (2008-2010), and certain funds (2007-2008); and as Vice President and Secretary of Fidelity Distributors Corporation (FDC) (2005-2007). Mr. Goebel has been employed by FMR LLC or an affiliate since 2001. |
Brian B. Hogan (1964) |
Year of Election or Appointment: 2009 Vice President |
| Mr. Hogan also serves as Trustee or Vice President of other funds. Mr. Hogan serves as President of FMR's Equity Division (2009-present). Previously, Mr. Hogan served as Senior Vice President, Equity Research of FMR (2006-2009) and as a portfolio manager. |
Chris Maher (1972) |
Year of Election or Appointment: 2013 Assistant Treasurer |
| Mr. Maher serves as Assistant Treasurer of other funds. Mr. Maher is Vice President of Valuation Oversight and is an employee of Fidelity Investments. Previously, Mr. Maher served as Vice President of Asset Management Compliance (2013), Vice President of FMR's Program Management Group (2010-2013), and Vice President of Valuation Oversight (2008-2010). |
Melissa M. Reilly (1971) |
Year of Election or Appointment: 2014 Vice President of certain Equity Funds |
| Ms. Reilly also serves as Vice President of other funds. Ms. Reilly is an employee of Fidelity Investments (2004-present). |
Kenneth B. Robins (1969) |
Year of Election or Appointment: 2008 President and Treasurer |
| Mr. Robins also serves as an officer of other funds. Mr. Robins serves as Executive Vice President of Fidelity Investments Money Management, Inc. (FIMM) (2013-present) and is an employee of Fidelity Investments (2004-present). Previously, Mr. Robins served in other fund officer roles. |
Stephen Sadoski (1971) |
Year of Election or Appointment: 2012 Deputy Treasurer |
| Mr. Sadoski also serves as Deputy Treasurer of other funds. He is an employee of Fidelity Investments (2012-present) and has served in another fund officer role. Prior to joining Fidelity Investments, Mr. Sadoski served as an assistant chief accountant in the Division of Investment Management of the Securities and Exchange Commission (SEC) (2009-2012) and as a senior manager at Deloitte & Touche LLP (1997-2009). |
Stacie M. Smith (1974) |
Year of Election or Appointment: 2013 Deputy Treasurer |
| Ms. Smith also serves as an officer of other funds. She is an employee of Fidelity Investments (2009-present) and has served in other fund officer roles. Prior to joining Fidelity Investments, Ms. Smith served as Senior Audit Manager of Ernst & Young LLP (1996-2009). |
Renee Stagnone (1975) |
Year of Election or Appointment: 2013 Deputy Treasurer |
| Ms. Stagnone also serves as Deputy Treasurer of other funds. Ms. Stagnone is an employee of Fidelity Investments. |
Linda J. Wondrack (1964) |
Year of Election or Appointment: 2014 Chief Compliance Officer |
| Ms. Wondrack also serves as Chief Compliance Officer of other funds. Ms. Wondrack is Executive Vice President and head of the Ethics Office and Asset Management Compliance for Fidelity Investments (2012-present). Ms. Wondrack also serves as Chief Compliance Officer of Fidelity SelectCo, LLC (2014-present); Chief Compliance Officer of Impresa Management LLC (2013-present); and Chief Compliance Officer of FMR Co., Inc., Fidelity Investments Money Management, Inc., Fidelity Management & Research (Japan) Inc., Fidelity Management & Research (U.K.) Inc., Fidelity Management & Research (Hong Kong), Fidelity Management & Research Company, Pyramis Global Advisors, LLC, and Strategic Advisers, Inc., Ballyrock Investment Advisors LLC, and Northern Neck Investors LLC (2012-present). Previously, Ms. Wondrack served as Senior Vice President and Chief Compliance Officer for Columbia Management Investment Advisers, LLC (2005-2012); Chief Compliance Officer for certain funds within the Columbia Family of Funds (2007-2012); and Senior Vice President of Compliance Risk Management at Bank of America (2005-2010). |
Joseph F. Zambello (1957) |
Year of Election or Appointment: 2011 Deputy Treasurer |
| Mr. Zambello also serves as Deputy Treasurer of other funds. Mr. Zambello is an employee of Fidelity Investments. Previously, Mr. Zambello served as Vice President of FMR's Program Management Group (2009-2011) and Vice President of the Transfer Agent Oversight Group (2005-2009). |
Annual Report
Class K designates 100% of the dividend distributed during the fiscal year as qualifying for the dividends-received deduction for corporate shareholders.
Class K designates 100% of the dividend distributed during the fiscal year as amounts which may be taken into account as a dividend for the purposes of the maximum rate under section 1(h)(11) of the Internal Revenue Code.
The fund will notify shareholders in January 2015 of amounts for use in preparing 2014 income tax returns.
Annual Report
Investment Adviser
Fidelity Management &
Research Company
Boston, MA
Investment Sub-Advisers
FMR Co., Inc.
Fidelity Management & Research
(U.K.) Inc.
Fidelity Management & Research
(Japan) Inc.
Fidelity Management & Research
(Hong Kong) Limited
General Distributor
Fidelity Distributors Corporation
Smithfield, RI
Transfer and Service Agents
Fidelity Investments Institutional
Operations Company, Inc.
Boston, MA
Fidelity Service Company, Inc.
Boston, MA
Custodian
Brown Brothers Harriman & Co.
Boston, MA
(Fidelity Investment logo)(registered trademark)
Corporate Headquarters
245 Summer St., Boston, MA 02210
www.fidelity.com
CII-K-UANN-0814
1.863270.105
Fidelity®
Mega Cap Stock
Fund
Annual Report
June 30, 2014
(Fidelity Cover Art)
Contents
Performance | (Click Here) | How the fund has done over time. |
Management's Discussion of Fund Performance | (Click Here) | The Portfolio Manager's review of fund performance and strategy. |
Shareholder Expense Example | (Click Here) | An example of shareholder expenses. |
Investment Changes | (Click Here) | A summary of major shifts in the fund's investments over the past six months. |
Investments | (Click Here) | A complete list of the fund's investments with their market values. |
Financial Statements | (Click Here) | Statements of assets and liabilities, operations, and changes in net assets, as well as financial highlights. |
Notes | (Click Here) | Notes to the financial statements. |
Report of Independent Registered Public Accounting Firm | (Click Here) | |
Trustees and Officers | (Click Here) | |
Distributions | (Click Here) | |
To view a fund's proxy voting guidelines and proxy voting record for the 12-month period ended June 30, visit http://www.fidelity.com/proxyvotingresults or visit the Securities and Exchange Commission's (SEC) web site at http://www.sec.gov. You may also call 1-800-544-8544 to request a free copy of the proxy voting guidelines.
Standard & Poor's, S&P and S&P 500 are registered service marks of The McGraw-Hill Companies, Inc. and have been licensed for use by Fidelity Distributors Corporation.
Other third-party marks appearing herein are the property of their respective owners.
All other marks appearing herein are registered or unregistered trademarks or service marks of FMR LLC or an affiliated company. © 2014 FMR LLC. All rights reserved.
This report and the financial statements contained herein are submitted for the general information of the shareholders of the fund. This report is not authorized for distribution to prospective investors in the fund unless preceded or accompanied by an effective prospectus.
A fund files its complete schedule of portfolio holdings with the SEC for the first and third quarters of each fiscal year on Form N-Q. Forms N-Q are available on the SEC's web site at http://www.sec.gov. A fund's Forms N-Q may be reviewed and copied at the SEC's Public Reference Room in Washington, DC. Information regarding the operation of the SEC's Public Reference Room may be obtained by calling 1-800-SEC-0330. For a complete list of a fund's portfolio holdings, view the most recent holdings listing, semiannual report, or annual report on Fidelity's web site at http://www.fidelity.com, http://www.advisor.fidelity.com, or http://www.401k.com, as applicable.
NOT FDIC INSURED • MAY LOSE VALUE • NO BANK GUARANTEE
Neither the fund nor Fidelity Distributors Corporation is a bank.
Annual Report
Average annual total return reflects the change in the value of an investment, assuming reinvestment of the class' distributions from dividend income and capital gains (the profits earned upon the sale of securities that have grown in value, if any) and assuming a constant rate of performance each year. The $10,000 table and the fund's returns do not reflect the deduction of taxes that a shareholder would pay on fund distributions or the redemption of fund shares. During periods of reimbursement by Fidelity, a fund's total return will be greater than it would be had the reimbursement not occurred. How a fund did yesterday is no guarantee of how it will do tomorrow.
Average Annual Total Returns
Periods ended June 30, 2014 | Past 1
year | Past 5
years | Past 10
years |
Fidelity® Mega Cap Stock Fund A | 24.18% | 19.68% | 8.24% |
A Prior to December 1, 2007, Fidelity Mega Cap Stock Fund operated under certain different investment policies. The fund's historical performance may not represent its current investment policies.
$10,000 Over 10 Years
Let's say hypothetically that $10,000 was invested in Fidelity® Mega Cap Stock Fund, a class of the fund, on June 30, 2004. The chart shows how the value of your investment would have changed, and also shows how the S&P 500® Index performed over the same period.
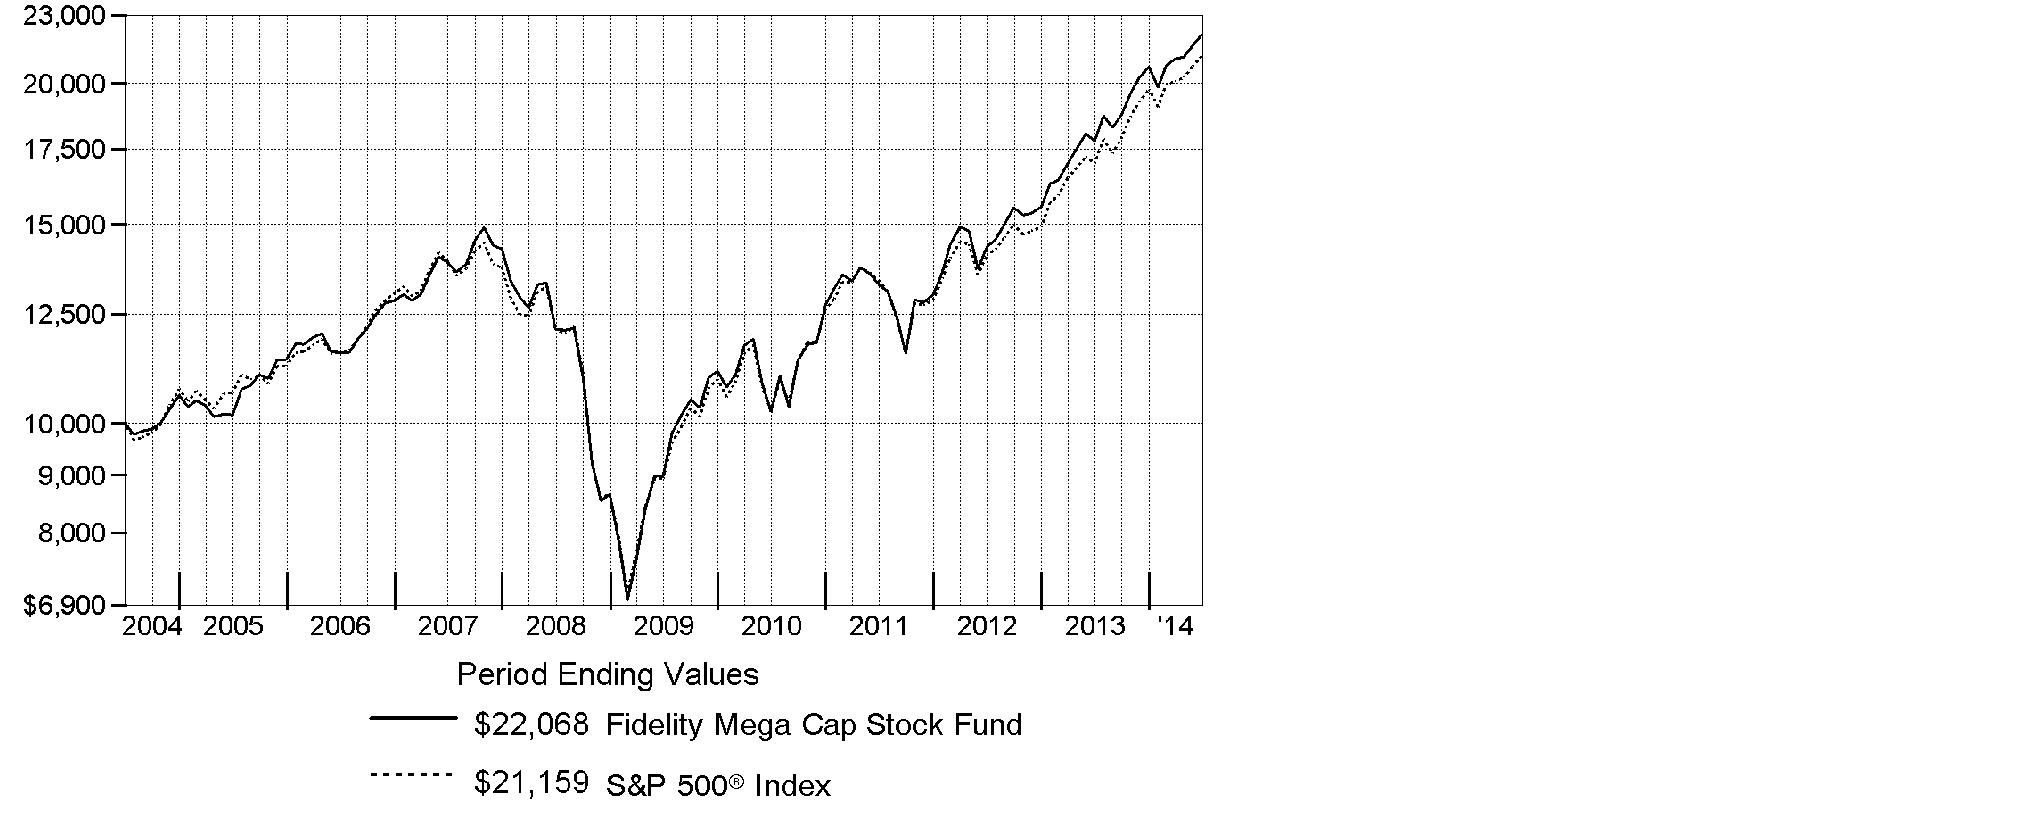
Annual Report
Market Recap: Despite intermittent volatility driven by geopolitical concerns, stocks posted a series of new highs during the 12 months ending June 30, 2014, amid a decidedly favorable environment for riskier assets. The S&P 500® Index rose 24.61% for the year, helped by a rise in consumer spending and the lowest unemployment rate since 2008. The U.S. Federal Reserve balanced stimulus reductions with continued low interest rates, aiding a broad advance. All 10 S&P 500® market sectors gained, seven by more than 20%. Materials (+33%) was tops, as investors seemed to anticipate sustained economic improvement and renewed infrastructure build-outs. Information technology (+32%) benefited from large cash balances, rising dividends and stock buybacks, and a bevy of innovations. Health care (+30%) was aided by new drugs and predictable reimbursements. Conversely, the biggest laggard, telecommunication services (+5%), battled slow growth and stiff pricing competition. Across size and style segments: overall, investors showed some preference for large-cap stocks over small-caps and growth stocks over value, although market leadership rotated during the year. With the "risk-on" trade alive and well, the growth-oriented Nasdaq Composite Index® flourished, advancing 31.17%, while the blue-chip Dow Jones Industrial AverageSM delivered a more subdued 15.56% return.
Comments from Matthew Fruhan, Portfolio Manager of Fidelity® Mega Cap Stock Fund: For the year, the fund's Retail Class shares gained 24.18%. For comparison, the mega-cap proxy Russell Top 200® Index returned 24.69% and the S&P 500® Index advanced 24.61%. Relative to the Russell index, it hurt the most to overweight big-box retailer Target, which was among the fund's biggest holdings. The lingering effects of the firm's troubled expansion into Canada and a holiday-season credit breach continued to weigh on the stock, but this weak stretch allowed me to add notable exposure at a valuation I liked. In January, I established an underweight stake in Facebook, which detracted as shares of the social-media giant outperformed. Stock selection and an overweight in financials detracted, including investment banks JPMorgan Chase and Citigroup, both of which were among the fund's largest holdings. Stock selection in consumer staples helped, including drugstore chain Walgreen, while an underweight in the underperforming shares of IBM added value.
The views expressed above reflect those of the portfolio manager(s) only through the end of the period as stated on the cover of this report and do not necessarily represent the views of Fidelity or any other person in the Fidelity organization. Any such views are subject to change at any time based upon market or other conditions and Fidelity disclaims any responsibility to update such views. These views may not be relied on as investment advice and, because investment decisions for a Fidelity fund are based on numerous factors, may not be relied on as an indication of trading intent on behalf of any Fidelity fund.
Annual Report
Shareholder Expense Example
As a shareholder of the Fund, you incur two types of costs: (1) transaction costs, including sales charges (loads) on purchase payments or redemption proceeds, and (2) ongoing costs, including management fees, distribution and/or service (12b-1) fees and other Fund expenses. This Example is intended to help you understand your ongoing costs (in dollars) of investing in the Fund and to compare these costs with the ongoing costs of investing in other mutual funds.
The Example is based on an investment of $1,000 invested at the beginning of the period and held for the entire period (January 1, 2014 to June 30, 2014).
Actual Expenses
The first line of the accompanying table for each class of the Fund provides information about actual account values and actual expenses. You may use the information in this line, together with the amount you invested, to estimate the expenses that you paid over the period. Simply divide your account value by $1,000.00 (for example, an $8,600 account value divided by $1,000.00 = 8.6), then multiply the result by the number in the first line for a class of the Fund under the heading entitled "Expenses Paid During Period" to estimate the expenses you paid on your account during this period. A small balance maintenance fee of $12.00 that is charged once a year may apply for certain accounts with a value of less than $2,000. This fee is not included in the table below. If it was, the estimate of expenses you paid during the period would be higher, and your ending account value lower, by this amount. In addition, the Fund, as a shareholder in the underlying Fidelity Central Funds, will indirectly bear its pro-rata share of the fees and expenses incurred by the underlying Fidelity Central Funds. These fees and expenses are not included in the Fund's annualized expense ratio used to calculate the expense estimate in the table below.
Hypothetical Example for Comparison Purposes
The second line of the accompanying table for each class of the Fund provides information about hypothetical account values and hypothetical expenses based on a Class' actual expense ratio and an assumed rate of return of 5% per year before expenses, which is not the Class' actual return. The hypothetical account values and expenses may not be used to estimate the actual ending account balance or expenses you paid for the period. You may use this information to compare the ongoing costs of investing in the Fund and other funds. To do so, compare this 5% hypothetical example with the 5% hypothetical examples that appear in the shareholder reports of the other funds. A small balance maintenance fee of $12.00 that is charged once a year may apply for certain accounts with a value of less than $2,000. This fee is not included in the table below. If it was, the estimate of expenses you paid during the period would be higher, and your ending account value lower, by this amount. In addition, the Fund, as a shareholder in the underlying Fidelity Central Funds, will indirectly bear its pro-rata share of the fees and expenses incurred by the underlying Fidelity Central Funds. These fees and expenses are not included in the Fund's annualized expense ratio used to calculate the expense estimate in the table below.
Please note that the expenses shown in the table are meant to highlight your ongoing costs only and do not reflect any transaction costs. Therefore, the second line of the table is useful in comparing ongoing costs only, and will not help you determine the relative total costs of owning different funds. In addition, if these transactional costs were included, your costs would have been higher.
Annual Report
| Annualized
Expense Ratio B | Beginning
Account Value
January 1, 2014 | Ending
Account Value
June 30, 2014 | Expenses Paid
During Period*
January 1, 2014
to June 30, 2014 |
Class A | .95% | | | |
Actual | | $ 1,000.00 | $ 1,064.60 | $ 4.86 |
Hypothetical A | | $ 1,000.00 | $ 1,020.08 | $ 4.76 |
Class T | 1.21% | | | |
Actual | | $ 1,000.00 | $ 1,063.20 | $ 6.19 |
Hypothetical A | | $ 1,000.00 | $ 1,018.79 | $ 6.06 |
Class B | 1.75% | | | |
Actual | | $ 1,000.00 | $ 1,060.20 | $ 8.94 |
Hypothetical A | | $ 1,000.00 | $ 1,016.12 | $ 8.75 |
Class C | 1.70% | | | |
Actual | | $ 1,000.00 | $ 1,060.50 | $ 8.69 |
Hypothetical A | | $ 1,000.00 | $ 1,016.36 | $ 8.50 |
Mega Cap Stock | .68% | | | |
Actual | | $ 1,000.00 | $ 1,066.10 | $ 3.48 |
Hypothetical A | | $ 1,000.00 | $ 1,021.42 | $ 3.41 |
Institutional Class | .71% | | | |
Actual | | $ 1,000.00 | $ 1,065.70 | $ 3.64 |
Hypothetical A | | $ 1,000.00 | $ 1,021.27 | $ 3.56 |
Class Z | .53% | | | |
Actual | | $ 1,000.00 | $ 1,066.30 | $ 2.72 |
Hypothetical A | | $ 1,000.00 | $ 1,022.17 | $ 2.66 |
A 5% return per year before expenses
B Annualized expense ratio reflects expenses net of applicable fee waivers.
* Expenses are equal to each Class' annualized expense ratio, multiplied by the average account value over the period, multiplied by 181/365 (to reflect the one-half year period).
Annual Report
Investment Changes (Unaudited)
Top Ten Stocks as of June 30, 2014 |
| % of fund's
net assets | % of fund's net assets
6 months ago |
Apple, Inc. | 4.6 | 4.6 |
JPMorgan Chase & Co. | 4.2 | 4.3 |
Microsoft Corp. | 3.5 | 3.3 |
General Electric Co. | 3.1 | 3.3 |
Chevron Corp. | 2.6 | 2.2 |
Comcast Corp. Class A (special) (non-vtg.) | 2.5 | 2.0 |
Verizon Communications, Inc. | 2.3 | 1.2 |
Citigroup, Inc. | 2.3 | 2.6 |
Bank of America Corp. | 2.1 | 2.1 |
Target Corp. | 2.0 | 1.9 |
| 29.2 | |
Top Five Market Sectors as of June 30, 2014 |
| % of fund's
net assets | % of fund's net assets
6 months ago |
Information Technology | 23.4 | 22.6 |
Financials | 18.3 | 19.2 |
Energy | 12.0 | 12.3 |
Consumer Staples | 10.9 | 11.0 |
Health Care | 9.9 | 11.1 |
Asset Allocation (% of fund's net assets) |
As of June 30, 2014* | As of December 31, 2013** |
| Stocks 98.2% | | | Stocks 98.8% | |
 | Convertible Securities 0.0% | | | Convertible Securities 0.1% | |
| Short-Term Investments
and Net Other Assets (Liabilities) 1.8% | | | Short-Term Investments
and Net Other Assets (Liabilities) 1.1% | |
* Foreign investments | 10.7% | | ** Foreign investments | 10.7% | |

Annual Report
Investments June 30, 2014
Showing Percentage of Net Assets
Common Stocks - 98.2% |
| Shares | | Value |
CONSUMER DISCRETIONARY - 9.3% |
Hotels, Restaurants & Leisure - 1.2% |
McDonald's Corp. | 152,600 | | $ 15,372,924 |
Yum! Brands, Inc. | 357,600 | | 29,037,120 |
| | 44,410,044 |
Media - 4.6% |
Comcast Corp. Class A (special) (non-vtg.) (d) | 1,674,100 | | 89,279,753 |
The Walt Disney Co. | 169,000 | | 14,490,060 |
Time Warner, Inc. | 784,900 | | 55,139,225 |
Twenty-First Century Fox, Inc. Class A | 193,500 | | 6,801,525 |
| | 165,710,563 |
Multiline Retail - 2.0% |
Target Corp. | 1,261,300 | | 73,092,335 |
Specialty Retail - 1.5% |
Lowe's Companies, Inc. | 1,149,600 | | 55,169,304 |
TOTAL CONSUMER DISCRETIONARY | | 338,382,246 |
CONSUMER STAPLES - 10.9% |
Beverages - 3.7% |
Diageo PLC | 500,803 | | 15,950,125 |
PepsiCo, Inc. | 432,905 | | 38,675,733 |
SABMiller PLC | 312,289 | | 18,107,213 |
The Coca-Cola Co. | 1,476,100 | | 62,527,596 |
| | 135,260,667 |
Food & Staples Retailing - 1.8% |
CVS Caremark Corp. | 389,100 | | 29,326,467 |
Walgreen Co. | 511,897 | | 37,946,925 |
| | 67,273,392 |
Food Products - 0.4% |
Kellogg Co. | 216,400 | | 14,217,480 |
Household Products - 1.8% |
Procter & Gamble Co. | 818,700 | | 64,341,633 |
Tobacco - 3.2% |
British American Tobacco PLC sponsored ADR | 519,400 | | 61,850,152 |
Philip Morris International, Inc. | 490,530 | | 41,356,584 |
Reynolds American, Inc. | 197,600 | | 11,925,160 |
| | 115,131,896 |
TOTAL CONSUMER STAPLES | | 396,225,068 |
Common Stocks - continued |
| Shares | | Value |
ENERGY - 12.0% |
Energy Equipment & Services - 1.4% |
National Oilwell Varco, Inc. | 124,100 | | $ 10,219,635 |
Schlumberger Ltd. | 344,800 | | 40,669,160 |
| | 50,888,795 |
Oil, Gas & Consumable Fuels - 10.6% |
Anadarko Petroleum Corp. | 76,400 | | 8,363,508 |
Apache Corp. | 412,505 | | 41,506,253 |
BG Group PLC | 1,699,000 | | 35,909,707 |
Canadian Natural Resources Ltd. | 568,600 | | 26,126,665 |
Chevron Corp. | 715,700 | | 93,434,635 |
Exxon Mobil Corp. | 358,271 | | 36,070,724 |
Imperial Oil Ltd. | 373,900 | | 19,703,291 |
Occidental Petroleum Corp. | 521,300 | | 53,501,019 |
Suncor Energy, Inc. | 948,700 | | 40,453,446 |
The Williams Companies, Inc. | 510,200 | | 29,698,742 |
| | 384,767,990 |
TOTAL ENERGY | | 435,656,785 |
FINANCIALS - 18.3% |
Banks - 12.5% |
Bank of America Corp. | 5,029,700 | | 77,306,489 |
Citigroup, Inc. | 1,809,370 | | 85,221,327 |
JPMorgan Chase & Co. | 2,701,500 | | 155,660,430 |
PNC Financial Services Group, Inc. | 239,800 | | 21,354,190 |
Standard Chartered PLC (United Kingdom) | 1,566,208 | | 32,004,076 |
U.S. Bancorp | 732,800 | | 31,744,896 |
Wells Fargo & Co. | 1,022,730 | | 53,754,689 |
| | 457,046,097 |
Capital Markets - 3.1% |
BlackRock, Inc. Class A | 19,000 | | 6,072,400 |
Charles Schwab Corp. | 982,100 | | 26,447,953 |
Goldman Sachs Group, Inc. | 22,700 | | 3,800,888 |
Morgan Stanley, Inc. | 1,186,000 | | 38,343,380 |
State Street Corp. | 568,900 | | 38,264,214 |
| | 112,928,835 |
Diversified Financial Services - 0.1% |
IntercontinentalExchange Group, Inc. | 10,500 | | 1,983,450 |
Insurance - 2.6% |
AIA Group Ltd. | 92,200 | | 463,355 |
Common Stocks - continued |
| Shares | | Value |
FINANCIALS - continued |
Insurance - continued |
American International Group, Inc. | 637,100 | | $ 34,772,918 |
Marsh & McLennan Companies, Inc. | 213,580 | | 11,067,716 |
MetLife, Inc. | 849,095 | | 47,175,718 |
Ping An Insurance (Group) Co. of China Ltd. (H Shares) | 101,500 | | 785,766 |
| | 94,265,473 |
TOTAL FINANCIALS | | 666,223,855 |
HEALTH CARE - 9.9% |
Biotechnology - 1.3% |
Amgen, Inc. | 318,690 | | 37,723,335 |
Biogen Idec, Inc. (a) | 34,200 | | 10,783,602 |
| | 48,506,937 |
Health Care Equipment & Supplies - 0.8% |
Abbott Laboratories | 465,100 | | 19,022,590 |
Stryker Corp. | 96,100 | | 8,103,152 |
| | 27,125,742 |
Health Care Providers & Services - 2.5% |
Express Scripts Holding Co. (a) | 318,907 | | 22,109,822 |
McKesson Corp. | 202,400 | | 37,688,904 |
UnitedHealth Group, Inc. | 400,048 | | 32,703,924 |
| | 92,502,650 |
Life Sciences Tools & Services - 0.3% |
Thermo Fisher Scientific, Inc. | 94,500 | | 11,151,000 |
Pharmaceuticals - 5.0% |
AbbVie, Inc. | 243,900 | | 13,765,716 |
GlaxoSmithKline PLC sponsored ADR | 619,000 | | 33,104,120 |
Johnson & Johnson | 565,900 | | 59,204,458 |
Merck & Co., Inc. | 477,300 | | 27,611,805 |
Novartis AG sponsored ADR | 170,400 | | 15,426,312 |
Sanofi SA | 80,024 | | 8,505,715 |
Teva Pharmaceutical Industries Ltd. sponsored ADR | 487,200 | | 25,539,024 |
| | 183,157,150 |
TOTAL HEALTH CARE | | 362,443,479 |
INDUSTRIALS - 9.4% |
Aerospace & Defense - 1.9% |
Honeywell International, Inc. | 118,700 | | 11,033,165 |
Common Stocks - continued |
| Shares | | Value |
INDUSTRIALS - continued |
Aerospace & Defense - continued |
The Boeing Co. | 309,000 | | $ 39,314,070 |
United Technologies Corp. | 176,200 | | 20,342,290 |
| | 70,689,525 |
Air Freight & Logistics - 1.8% |
FedEx Corp. | 117,800 | | 17,832,564 |
United Parcel Service, Inc. Class B | 475,000 | | 48,763,500 |
| | 66,596,064 |
Industrial Conglomerates - 3.4% |
Danaher Corp. | 146,570 | | 11,539,456 |
General Electric Co. | 4,323,800 | | 113,629,464 |
| | 125,168,920 |
Machinery - 0.3% |
Caterpillar, Inc. | 86,500 | | 9,399,955 |
Road & Rail - 2.0% |
CSX Corp. | 1,160,700 | | 35,761,167 |
Norfolk Southern Corp. | 207,800 | | 21,409,634 |
Union Pacific Corp. | 148,190 | | 14,781,953 |
| | 71,952,754 |
TOTAL INDUSTRIALS | | 343,807,218 |
INFORMATION TECHNOLOGY - 23.4% |
Communications Equipment - 3.1% |
Cisco Systems, Inc. | 2,773,400 | | 68,918,990 |
QUALCOMM, Inc. | 531,900 | | 42,126,480 |
| | 111,045,470 |
Internet Software & Services - 4.2% |
Facebook, Inc. Class A (a) | 103,597 | | 6,971,042 |
Google, Inc.: | | | |
Class A (a) | 109,350 | | 63,933,665 |
Class C (a) | 95,750 | | 55,083,060 |
Yahoo!, Inc. (a) | 781,639 | | 27,458,978 |
| | 153,446,745 |
IT Services - 3.8% |
Accenture PLC Class A | 69,100 | | 5,586,044 |
Cognizant Technology Solutions Corp. Class A (a) | 523,400 | | 25,599,494 |
IBM Corp. | 156,000 | | 28,278,120 |
Common Stocks - continued |
| Shares | | Value |
INFORMATION TECHNOLOGY - continued |
IT Services - continued |
MasterCard, Inc. Class A | 555,900 | | $ 40,841,973 |
Visa, Inc. Class A | 187,100 | | 39,423,841 |
| | 139,729,472 |
Semiconductors & Semiconductor Equipment - 1.4% |
Applied Materials, Inc. | 699,625 | | 15,776,544 |
Broadcom Corp. Class A | 973,036 | | 36,119,096 |
| | 51,895,640 |
Software - 5.3% |
Adobe Systems, Inc. (a) | 253,200 | | 18,321,552 |
Microsoft Corp. | 3,024,500 | | 126,121,650 |
Oracle Corp. | 899,900 | | 36,472,947 |
salesforce.com, Inc. (a) | 199,200 | | 11,569,536 |
| | 192,485,685 |
Technology Hardware, Storage & Peripherals - 5.6% |
Apple, Inc. | 1,808,507 | | 168,064,558 |
EMC Corp. | 1,051,000 | | 27,683,340 |
First Data Holdings, Inc. Class B (e) | 2,429,231 | | 9,716,924 |
| | 205,464,822 |
TOTAL INFORMATION TECHNOLOGY | | 854,067,834 |
MATERIALS - 2.7% |
Chemicals - 2.1% |
E.I. du Pont de Nemours & Co. | 333,900 | | 21,850,416 |
Monsanto Co. | 315,310 | | 39,331,769 |
Syngenta AG (Switzerland) | 43,089 | | 15,919,199 |
| | 77,101,384 |
Metals & Mining - 0.6% |
Freeport-McMoRan Copper & Gold, Inc. | 538,000 | | 19,637,000 |
TOTAL MATERIALS | | 96,738,384 |
TELECOMMUNICATION SERVICES - 2.3% |
Diversified Telecommunication Services - 2.3% |
Verizon Communications, Inc. | 1,743,725 | | 85,320,464 |
TOTAL COMMON STOCKS (Cost $2,718,899,411) |
3,578,865,333
|
Money Market Funds - 2.6% |
| Shares | | Value |
Fidelity Cash Central Fund, 0.11% (b) | 74,761,932 | | $ 74,761,932 |
Fidelity Securities Lending Cash Central Fund, 0.10% (b)(c) | 22,517,000 | | 22,517,000 |
TOTAL MONEY MARKET FUNDS (Cost $97,278,932) |
97,278,932
|
TOTAL INVESTMENT PORTFOLIO - 100.8% (Cost $2,816,178,343) | | 3,676,144,265 |
NET OTHER ASSETS (LIABILITIES) - (0.8)% | | (30,832,045) |
NET ASSETS - 100% | $ 3,645,312,220 |
Legend |
(a) Non-income producing |
(b) Affiliated fund that is generally available only to investment companies and other accounts managed by Fidelity Investments. The rate quoted is the annualized seven-day yield of the fund at period end. A complete unaudited listing of the fund's holdings as of its most recent quarter end is available upon request. In addition, each Fidelity Central Fund's financial statements, which are not covered by the Fund's Report of Independent Registered Public Accounting Firm, are available on the SEC's website or upon request. |
(c) Investment made with cash collateral received from securities on loan. |
(d) Security or a portion of the security is on loan at period end. |
(e) Restricted securities - Investment in securities not registered under the Securities Act of 1933 (excluding 144A issues). At the end of the period, the value of restricted securities (excluding 144A issues) amounted to $9,716,924 or 0.3% of net assets. |
Additional information on each restricted holding is as follows: |
Security | Acquisition Date | Acquisition Cost |
First Data Holdings, Inc. Class B | 6/26/14 | $ 9,716,924 |
Affiliated Central Funds |
Information regarding fiscal year to date income earned by the Fund from investments in Fidelity Central Funds is as follows: |
Fund | Income earned |
Fidelity Cash Central Fund | $ 27,717 |
Fidelity Securities Lending Cash Central Fund | 89,556 |
Total | $ 117,273 |
Other Information |
The following is a summary of the inputs used, as of June 30, 2014, involving the Fund's assets and liabilities carried at fair value. The inputs or methodology used for valuing securities may not be an indication of the risk associated with investing in those securities. For more information on valuation inputs, and their aggregation into the levels used in the table below, please refer to the Investment Valuation section in the accompanying Notes to Financial Statements. |
Valuation Inputs at Reporting Date: |
Description | Total | Level 1 | Level 2 | Level 3 |
Investments in Securities: | | | | |
Equities: | | | | |
Consumer Discretionary | $ 338,382,246 | $ 338,382,246 | $ - | $ - |
Consumer Staples | 396,225,068 | 380,274,943 | 15,950,125 | - |
Energy | 435,656,785 | 435,656,785 | - | - |
Financials | 666,223,855 | 666,223,855 | - | - |
Health Care | 362,443,479 | 353,937,764 | 8,505,715 | - |
Industrials | 343,807,218 | 343,807,218 | - | - |
Information Technology | 854,067,834 | 844,350,910 | - | 9,716,924 |
Materials | 96,738,384 | 80,819,185 | 15,919,199 | - |
Telecommunication Services | 85,320,464 | 85,320,464 | - | - |
Money Market Funds | 97,278,932 | 97,278,932 | - | - |
Total Investments in Securities: | $ 3,676,144,265 | $ 3,626,052,302 | $ 40,375,039 | $ 9,716,924 |
Distribution of investments by country or territory of incorporation, as a percentage of total net assets, is as follows (Unaudited): |
United States of America | 89.3% |
United Kingdom | 5.4% |
Canada | 2.4% |
Curacao | 1.1% |
Others (Individually Less Than 1%) | 1.8% |
| 100.0% |
See accompanying notes which are an integral part of the financial statements.
Annual Report
Statement of Assets and Liabilities
| June 30, 2014 |
| | |
Assets | | |
Investment in securities, at value (including securities loaned of $21,833,302) - See accompanying schedule: Unaffiliated issuers (cost $2,718,899,411) | $ 3,578,865,333 | |
Fidelity Central Funds (cost $97,278,932) | 97,278,932 | |
Total Investments (cost $2,816,178,343) | | $ 3,676,144,265 |
Receivable for investments sold | | 6,265,877 |
Receivable for fund shares sold | | 5,281,399 |
Dividends receivable | | 4,490,136 |
Distributions receivable from Fidelity Central Funds | | 19,236 |
Receivable from investment adviser for expense reductions | | 386 |
Other receivables | | 124,808 |
Total assets | | 3,692,326,107 |
| | |
Liabilities | | |
Payable for investments purchased | $ 19,178,333 | |
Payable for fund shares redeemed | 3,159,924 | |
Accrued management fee | 1,355,067 | |
Distribution and service plan fees payable | 36,521 | |
Other affiliated payables | 644,371 | |
Other payables and accrued expenses | 122,671 | |
Collateral on securities loaned, at value | 22,517,000 | |
Total liabilities | | 47,013,887 |
| | |
Net Assets | | $ 3,645,312,220 |
Net Assets consist of: | | |
Paid in capital | | $ 2,686,009,603 |
Undistributed net investment income | | 25,146,366 |
Accumulated undistributed net realized gain (loss) on investments and foreign currency transactions | | 74,183,358 |
Net unrealized appreciation (depreciation) on investments and assets and liabilities in foreign currencies | | 859,972,893 |
Net Assets | | $ 3,645,312,220 |
See accompanying notes which are an integral part of the financial statements.
Annual Report
Financial Statements - continued
Statement of Assets and Liabilities - continued
| June 30, 2014 |
| | |
Calculation of Maximum Offering Price Class A:
Net Asset Value and redemption price per share ($77,335,409 ÷ 4,739,947 shares) | | $ 16.32 |
| | |
Maximum offering price per share (100/94.25 of $16.32) | | $ 17.32 |
Class T:
Net Asset Value and redemption price per share ($15,728,415 ÷ 964,584 shares) | | $ 16.31 |
| | |
Maximum offering price per share (100/96.50 of $16.31) | | $ 16.90 |
Class B:
Net Asset Value and offering price per share ($918,549 ÷ 56,656 shares)A | | $ 16.21 |
| | |
Class C:
Net Asset Value and offering price per share ($16,599,716 ÷ 1,029,726 shares)A | | $ 16.12 |
| | |
Mega Cap Stock:
Net Asset Value, offering price and redemption price per share ($2,860,197,294 ÷ 173,984,386 shares) | | $ 16.44 |
| | |
Institutional Class:
Net Asset Value, offering price and redemption price per share ($674,415,747 ÷ 41,154,574 shares) | | $ 16.39 |
| | |
Class Z:
Net Asset Value, offering price and redemption price per share ($117,090 ÷ 7,138 shares) | | $ 16.40 |
A Redemption price per share is equal to net asset value less any applicable contingent deferred sales charge.
See accompanying notes which are an integral part of the financial statements.
Annual Report
Statement of Operations
| Year ended June 30, 2014 |
| | |
Investment Income | | |
Dividends | | $ 64,598,075 |
Interest | | 3 |
Income from Fidelity Central Funds | | 117,273 |
Total income | | 64,715,351 |
| | |
Expenses | | |
Management fee | $ 13,636,133 | |
Transfer agent fees | 5,746,426 | |
Distribution and service plan fees | 284,809 | |
Accounting and security lending fees | 887,108 | |
Custodian fees and expenses | 71,971 | |
Independent trustees' compensation | 12,515 | |
Registration fees | 231,217 | |
Audit | 55,093 | |
Legal | 11,095 | |
Interest | 2,824 | |
Miscellaneous | 22,803 | |
Total expenses before reductions | 20,961,994 | |
Expense reductions | (36,926) | 20,925,068 |
Net investment income (loss) | | 43,790,283 |
Realized and Unrealized Gain (Loss) Net realized gain (loss) on: | | |
Investment securities: | | |
Unaffiliated issuers | 143,561,768 | |
Foreign currency transactions | (8,194) | |
Total net realized gain (loss) | | 143,553,574 |
Change in net unrealized appreciation (depreciation) on: Investment securities | 457,006,470 | |
Assets and liabilities in foreign currencies | 12,169 | |
Total change in net unrealized appreciation (depreciation) | | 457,018,639 |
Net gain (loss) | | 600,572,213 |
Net increase (decrease) in net assets resulting from operations | | $ 644,362,496 |
See accompanying notes which are an integral part of the financial statements.
Annual Report
Financial Statements - continued
Statement of Changes in Net Assets
| Year ended
June 30,
2014 | Year ended
June 30,
2013 |
Increase (Decrease) in Net Assets | | |
Operations | | |
Net investment income (loss) | $ 43,790,283 | $ 35,288,813 |
Net realized gain (loss) | 143,553,574 | 104,876,418 |
Change in net unrealized appreciation (depreciation) | 457,018,639 | 321,854,450 |
Net increase (decrease) in net assets resulting
from operations | 644,362,496 | 462,019,681 |
Distributions to shareholders from net investment income | (35,705,336) | (27,575,489) |
Distributions to shareholders from net realized gain | (41,770,691) | - |
Total distributions | (77,476,027) | (27,575,489) |
Share transactions - net increase (decrease) | 513,653,074 | 652,982,078 |
Total increase (decrease) in net assets | 1,080,539,543 | 1,087,426,270 |
| | |
Net Assets | | |
Beginning of period | 2,564,772,677 | 1,477,346,407 |
End of period (including undistributed net investment income of $25,146,366 and undistributed net investment income of $17,061,419, respectively) | $ 3,645,312,220 | $ 2,564,772,677 |
See accompanying notes which are an integral part of the financial statements.
Annual Report
Financial Highlights - Class A
Years ended June 30, | 2014 | 2013 | 2012 | 2011 | 2010 |
Selected Per-Share Data | | | | | |
Net asset value, beginning of period | $ 13.51 | $ 11.05 | $ 10.37 | $ 8.07 | $ 7.20 |
Income from Investment Operations | | | | | |
Net investment income (loss) C | .18 | .17 | .13 | .07 | .06 |
Net realized and unrealized gain (loss) | 3.00 | 2.43 | .64 | 2.28 | .92 |
Total from investment operations | 3.18 | 2.60 | .77 | 2.35 | .98 |
Distributions from net investment income | (.16) | (.14) | (.09) | (.05) | (.11) |
Distributions from net realized gain | (.21) | - | - | - | - |
Total distributions | (.37) | (.14) | (.09) | (.05) | (.11) |
Net asset value, end of period | $ 16.32 | $ 13.51 | $ 11.05 | $ 10.37 | $ 8.07 |
Total ReturnA, B | 23.88% | 23.78% | 7.57% | 29.23% | 13.65% |
Ratios to Average Net Assets D, F | | | | | |
Expenses before reductions | .96% | .98% | 1.02% | 1.06% | 1.10% |
Expenses net of fee waivers, if any | .96% | .98% | 1.02% | 1.06% | 1.10% |
Expenses net of all reductions | .96% | .98% | 1.02% | 1.06% | 1.10% |
Net investment income (loss) | 1.19% | 1.37% | 1.28% | .76% | .66% |
Supplemental Data | | | | | |
Net assets, end of period (000 omitted) | $ 77,335 | $ 20,336 | $ 8,527 | $ 4,169 | $ 2,238 |
Portfolio turnover rateE | 28% | 29% | 57% | 53% | 97% |
A Total returns would have been lower if certain expenses had not been reduced during the applicable periods shown.
B Total returns do not include the effect of the sales charges.
C Calculated based on average shares outstanding during the period.
D Fees and expenses of any underlying Fidelity Central Funds are not included in the Fund's expense ratio. The Fund indirectly bears its proportionate share of the expenses of any underlying Fidelity Central Funds.
E Amount does not include the portfolio activity of any underlying Fidelity Central Funds.
F Expense ratios reflect operating expenses of the class. Expenses before reductions do not reflect amounts reimbursed by the investment adviser or reductions from brokerage service arrangements or reductions from other expense offset arrangements and do not represent the amount paid by the class during periods when reimbursements or reductions occur. Expenses net of fee waivers reflect expenses after reimbursement by the investment adviser but prior to reductions from brokerage service arrangements or other expense offset arrangements. Expenses net of all reductions represent the net expenses paid by the class.
See accompanying notes which are an integral part of the financial statements.
Annual Report
Financial Highlights - Class T
Years ended June 30, | 2014 | 2013 | 2012 | 2011 | 2010 |
Selected Per-Share Data | | | | | |
Net asset value, beginning of period | $ 13.51 | $ 11.05 | $ 10.38 | $ 8.07 | $ 7.20 |
Income from Investment Operations | | | | | |
Net investment income (loss) C | .14 | .14 | .10 | .05 | .03 |
Net realized and unrealized gain (loss) | 3.00 | 2.43 | .64 | 2.29 | .93 |
Total from investment operations | 3.14 | 2.57 | .74 | 2.34 | .96 |
Distributions from net investment income | (.13) | (.11) | (.07) | (.03) | (.09) |
Distributions from net realized gain | (.21) | - | - | - | - |
Total distributions | (.34) | (.11) | (.07) | (.03) | (.09) |
Net asset value, end of period | $ 16.31 | $ 13.51 | $ 11.05 | $ 10.38 | $ 8.07 |
Total ReturnA, B | 23.54% | 23.44% | 7.19% | 29.08% | 13.32% |
Ratios to Average Net Assets D, F | | | | | |
Expenses before reductions | 1.22% | 1.26% | 1.32% | 1.32% | 1.36% |
Expenses net of fee waivers, if any | 1.22% | 1.26% | 1.32% | 1.32% | 1.36% |
Expenses net of all reductions | 1.22% | 1.26% | 1.32% | 1.32% | 1.35% |
Net investment income (loss) | .92% | 1.09% | .98% | .50% | .41% |
Supplemental Data | | | | | |
Net assets, end of period (000 omitted) | $ 15,728 | $ 8,377 | $ 2,293 | $ 1,682 | $ 1,073 |
Portfolio turnover rateE | 28% | 29% | 57% | 53% | 97% |
A Total returns would have been lower if certain expenses had not been reduced during the applicable periods shown.
B Total returns do not include the effect of the sales charges.
C Calculated based on average shares outstanding during the period.
D Fees and expenses of any underlying Fidelity Central Funds are not included in the Fund's expense ratio. The Fund indirectly bears its proportionate share of the expenses of any underlying Fidelity Central Funds.
E Amount does not include the portfolio activity of any underlying Fidelity Central Funds.
F Expense ratios reflect operating expenses of the class. Expenses before reductions do not reflect amounts reimbursed by the investment adviser or reductions from brokerage service arrangements or reductions from other expense offset arrangements and do not represent the amount paid by the class during periods when reimbursements or reductions occur. Expenses net of fee waivers reflect expenses after reimbursement by the investment adviser but prior to reductions from brokerage service arrangements or other expense offset arrangements. Expenses net of all reductions represent the net expenses paid by the class.
See accompanying notes which are an integral part of the financial statements.
Annual Report
Financial Highlights - Class B
Years ended June 30, | 2014 | 2013 | 2012 | 2011 | 2010 |
Selected Per-Share Data | | | | | |
Net asset value, beginning of period | $ 13.43 | $ 10.97 | $ 10.30 | $ 8.02 | $ 7.19 |
Income from Investment Operations | | | | | |
Net investment income (loss) C | .06 | .07 | .05 | - H | (.01) |
Net realized and unrealized gain (loss) | 2.98 | 2.43 | .63 | 2.28 | .92 |
Total from investment operations | 3.04 | 2.50 | .68 | 2.28 | .91 |
Distributions from net investment income | (.04) | (.04) | (.01) | - | (.08) |
Distributions from net realized gain | (.21) | - | - | - | - |
Total distributions | (.26) I | (.04) | (.01) | - | (.08) |
Net asset value, end of period | $ 16.21 | $ 13.43 | $ 10.97 | $ 10.30 | $ 8.02 |
Total ReturnA, B | 22.82% | 22.83% | 6.62% | 28.43% | 12.60% |
Ratios to Average Net Assets D, G | | | | | |
Expenses before reductions | 1.78% | 1.80% | 1.82% | 1.83% | 1.88% |
Expenses net of fee waivers, if any | 1.78% | 1.80% | 1.82% | 1.83% | 1.88% |
Expenses net of all reductions | 1.78% | 1.80% | 1.81% | 1.82% | 1.88% |
Net investment income (loss) | .37% | .55% | .49% | .00% F | (.12)% |
Supplemental Data | | | | | |
Net assets, end of period (000 omitted) | $ 919 | $ 716 | $ 704 | $ 764 | $ 667 |
Portfolio turnover rateE | 28% | 29% | 57% | 53% | 97% |
A Total returns would have been lower if certain expenses had not been reduced during the applicable periods shown.
B Total returns do not include the effect of the contingent deferred sales charge.
C Calculated based on average shares outstanding during the period.
D Fees and expenses of any underlying Fidelity Central Funds are not included in the Fund's expense ratio. The Fund indirectly bears its proportionate share of the expenses of any underlying Fidelity Central Funds.
E Amount does not include the portfolio activity of any underlying Fidelity Central Funds.
F Amount represents less than .01%.
G Expense ratios reflect operating expenses of the class. Expenses before reductions do not reflect amounts reimbursed by the investment adviser or reductions from brokerage service arrangements or reductions from other expense offset arrangements and do not represent the amount paid by the class during periods when reimbursements or reductions occur. Expenses net of fee waivers reflect expenses after reimbursement by the investment adviser but prior to reductions from brokerage service arrangements or other expense offset arrangements. Expenses net of all reductions represent the net expenses paid by the class.
H Amount represents less than $.01 per share.
I Total distributions of $.26 per share is comprised of distributions from net investment income of $.044 and distributions from net realized gain of $.213 per share.
See accompanying notes which are an integral part of the financial statements.
Annual Report
Financial Highlights - Class C
Years ended June 30, | 2014 | 2013 | 2012 | 2011 | 2010 |
Selected Per-Share Data | | | | | |
Net asset value, beginning of period | $ 13.38 | $ 10.93 | $ 10.28 | $ 8.01 | $ 7.16 |
Income from Investment Operations | | | | | |
Net investment income (loss) C | .06 | .07 | .05 | - G | (.01) |
Net realized and unrealized gain (loss) | 2.97 | 2.42 | .64 | 2.27 | .92 |
Total from investment operations | 3.03 | 2.49 | .69 | 2.27 | .91 |
Distributions from net investment income | (.08) | (.04) | (.04) | - | (.06) |
Distributions from net realized gain | (.21) | - | - | - | - |
Total distributions | (.29) | (.04) | (.04) | - | (.06) |
Net asset value, end of period | $ 16.12 | $ 13.38 | $ 10.93 | $ 10.28 | $ 8.01 |
Total ReturnA, B | 22.90% | 22.83% | 6.74% | 28.34% | 12.72% |
Ratios to Average Net Assets D, F | | | | | |
Expenses before reductions | 1.71% | 1.75% | 1.79% | 1.81% | 1.86% |
Expenses net of fee waivers, if any | 1.71% | 1.75% | 1.79% | 1.81% | 1.86% |
Expenses net of all reductions | 1.71% | 1.75% | 1.79% | 1.81% | 1.85% |
Net investment income (loss) | .43% | .59% | .51% | .01% | (.10)% |
Supplemental Data | | | | | |
Net assets, end of period (000 omitted) | $ 16,600 | $ 7,938 | $ 2,845 | $ 1,913 | $ 807 |
Portfolio turnover rateE | 28% | 29% | 57% | 53% | 97% |
A Total returns would have been lower if certain expenses had not been reduced during the applicable periods shown.
B Total returns do not include the effect of the contingent deferred sales charge.
C Calculated based on average shares outstanding during the period.
D Fees and expenses of any underlying Fidelity Central Funds are not included in the Fund's expense ratio. The Fund indirectly bears its proportionate share of the expenses of any underlying Fidelity Central Funds.
E Amount does not include the portfolio activity of any underlying Fidelity Central Funds.
F Expense ratios reflect operating expenses of the class. Expenses before reductions do not reflect amounts reimbursed by the investment adviser or reductions from brokerage service arrangements or reductions from other expense offset arrangements and do not represent the amount paid by the class during periods when reimbursements or reductions occur. Expenses net of fee waivers reflect expenses after reimbursement by the investment adviser but prior to reductions from brokerage service arrangements or other expense offset arrangements. Expenses net of all reductions represent the net expenses paid by the class.
G Amount represents less than $.01 per share.
See accompanying notes which are an integral part of the financial statements.
Annual Report
Financial Highlights - Mega Cap Stock
Years ended June 30, | 2014 | 2013 | 2012 | 2011 | 2010 |
Selected Per-Share Data | | | | | |
Net asset value, beginning of period | $ 13.60 | $ 11.11 | $ 10.43 | $ 8.11 | $ 7.23 |
Income from Investment Operations | | | | | |
Net investment income (loss) B | .22 | .20 | .16 | .10 | .08 |
Net realized and unrealized gain (loss) | 3.02 | 2.46 | .64 | 2.29 | .93 |
Total from investment operations | 3.24 | 2.66 | .80 | 2.39 | 1.01 |
Distributions from net investment income | (.19) | (.17) | (.12) | (.07) | (.13) |
Distributions from net realized gain | (.21) | - | - | - | - |
Total distributions | (.40) | (.17) | (.12) | (.07) | (.13) |
Net asset value, end of period | $ 16.44 | $ 13.60 | $ 11.11 | $ 10.43 | $ 8.11 |
Total ReturnA | 24.18% | 24.17% | 7.83% | 29.61% | 13.93% |
Ratios to Average Net Assets C, E | | | | | |
Expenses before reductions | .68% | .70% | .76% | .79% | .81% |
Expenses net of fee waivers, if any | .68% | .70% | .76% | .79% | .80% |
Expenses net of all reductions | .68% | .70% | .75% | .78% | .79% |
Net investment income (loss) | 1.47% | 1.64% | 1.55% | 1.04% | .96% |
Supplemental Data | | | | | |
Net assets, end of period (000 omitted) | $ 2,860,197 | $ 2,214,592 | $ 1,287,144 | $ 785,233 | $ 500,407 |
Portfolio turnover rateD | 28% | 29% | 57% | 53% | 97% |
A Total returns would have been lower if certain expenses had not been reduced during the applicable periods shown.
B Calculated based on average shares outstanding during the period.
C Fees and expenses of any underlying Fidelity Central Funds are not included in the Fund's expense ratio. The Fund indirectly bears its proportionate share of the expenses of any underlying Fidelity Central Funds.
D Amount does not include the portfolio activity of any underlying Fidelity Central Funds.
E Expense ratios reflect operating expenses of the class. Expenses before reductions do not reflect amounts reimbursed by the investment adviser or reductions from brokerage service arrangements or reductions from other expense offset arrangements and do not represent the amount paid by the class during periods when reimbursements or reductions occur. Expenses net of fee waivers reflect expenses after reimbursement by the investment adviser but prior to reductions from brokerage service arrangements or other expense offset arrangements. Expenses net of all reductions represent the net expenses paid by the class.
See accompanying notes which are an integral part of the financial statements.
Annual Report
Financial Highlights - Institutional Class
Years ended June 30, | 2014 | 2013 | 2012 | 2011 | 2010 |
Selected Per-Share Data | | | | | |
Net asset value, beginning of period | $ 13.55 | $ 11.08 | $ 10.40 | $ 8.09 | $ 7.22 |
Income from Investment Operations | | | | | |
Net investment income (loss) B | .22 | .20 | .16 | .10 | .08 |
Net realized and unrealized gain (loss) | 3.02 | 2.44 | .63 | 2.30 | .92 |
Total from investment operations | 3.24 | 2.64 | .79 | 2.40 | 1.00 |
Distributions from net investment income | (.18) | (.17) | (.11) | (.09) | (.13) |
Distributions from net realized gain | (.21) | - | - | - | - |
Total distributions | (.40) F | (.17) | (.11) | (.09) | (.13) |
Net asset value, end of period | $ 16.39 | $ 13.55 | $ 11.08 | $ 10.40 | $ 8.09 |
Total ReturnA | 24.23% | 24.06% | 7.77% | 29.74% | 13.89% |
Ratios to Average Net Assets C, E | | | | | |
Expenses before reductions | .71% | .74% | .78% | .79% | .88% |
Expenses net of fee waivers, if any | .71% | .74% | .78% | .79% | .88% |
Expenses net of all reductions | .71% | .74% | .77% | .78% | .87% |
Net investment income (loss) | 1.43% | 1.61% | 1.53% | 1.04% | .88% |
Supplemental Data | | | | | |
Net assets, end of period (000 omitted) | $ 674,416 | $ 312,814 | $ 175,833 | $ 136,768 | $ 1,568 |
Portfolio turnover rateD | 28% | 29% | 57% | 53% | 97% |
A Total returns would have been lower if certain expenses had not been reduced during the applicable periods shown.
B Calculated based on average shares outstanding during the period.
C Fees and expenses of any underlying Fidelity Central Funds are not included in the Fund's expense ratio. The Fund indirectly bears its proportionate share of the expenses of any underlying Fidelity Central Funds.
D Amount does not include the portfolio activity of any underlying Fidelity Central Funds.
E Expense ratios reflect operating expenses of the class. Expenses before reductions do not reflect amounts reimbursed by the investment adviser or reductions from brokerage service arrangements or reductions from other expense offset arrangements and do not represent the amount paid by the class during periods when reimbursements or reductions occur. Expenses net of fee waivers reflect expenses after reimbursement by the investment adviser but prior to reductions from brokerage service arrangements or other expense offset arrangements. Expenses net of all reductions represent the net expenses paid by the class.
F Total distributions of $.40 per share is comprised of distributions from net investment income of $.182 and distributions from net realized gain of $.213 per share.
See accompanying notes which are an integral part of the financial statements.
Annual Report
Financial Highlights - Class Z
Year ended June 30, | 2014 G |
Selected Per-Share Data | |
Net asset value, beginning of period | $ 14.31 |
Income from Investment Operations | |
Net investment income (loss) D | .21 |
Net realized and unrealized gain (loss) | 2.20 |
Total from investment operations | 2.41 |
Distributions from net investment income | (.10) |
Distributions from net realized gain | (.21) |
Total distributions | (.32) I |
Net asset value, end of period | $ 16.40 |
Total ReturnB, C | 17.06% |
Ratios to Average Net Assets E, H | |
Expenses before reductions | .54%A |
Expenses net of fee waivers, if any | .54%A |
Expenses net of all reductions | .54%A |
Net investment income (loss) | 1.59% A |
Supplemental Data | |
Net assets, end of period (000 omitted) | $ 117 |
Portfolio turnover rateF | 28% A |
A Annualized
B Total returns for periods of less than one year are not annualized.
C Total returns would have been lower if certain expenses had not been reduced during the applicable periods shown.
D Calculated based on average shares outstanding during the period.
E Fees and expenses of any underlying Fidelity Central Funds are not included in the Fund's expense ratio. The Fund indirectly bears its proportionate share of the expenses of any underlying Fidelity Central Funds.
F Amount does not include the portfolio activity of any underlying Fidelity Central Funds.
G For the period August 13, 2013 (commencement of sale of shares) to June 30, 2014.
H Expense ratios reflect operating expenses of the class. Expenses before reductions do not reflect amounts reimbursed by the investment adviser or reductions from brokerage service arrangements or reductions from other expense offset arrangements and do not represent the amount paid by the class during periods when reimbursements or reductions occur. Expense ratios before reductions for start-up periods may not be representative of longer-term operation periods. Expenses net of fee waivers reflect expenses after reimbursement by the investment adviser but prior to reductions from brokerage service arrangements or other expense offset arrangements. Expenses net of all reductions represent the net expenses paid by the class.
I Total distributions of $.32 per share is comprised of distributions from net investment income of $.104 and distributions from net realized gain of $.213 per share.
See accompanying notes which are an integral part of the financial statements.
Annual Report
Notes to Financial Statements
For the period ended June 30, 2014
1. Organization.
Fidelity Mega Cap Stock Fund (the Fund) is a fund of Fidelity Hastings Street Trust (the Trust) and is authorized to issue an unlimited number of shares. The Trust is registered under the Investment Company Act of 1940, as amended (the 1940 Act), as an open-end management investment company organized as a Massachusetts business trust. The Fund commenced sale of Class Z shares on August 13, 2013. The Fund offers Class A, Class T, Class C, Mega Cap Stock, Institutional Class and Class Z shares, each of which, along with Class B shares, has equal rights as to assets and voting privileges. Class B shares are closed to new accounts and additional purchases, except for exchanges and reinvestments. Each class has exclusive voting rights with respect to matters that affect that class. Class B shares will automatically convert to Class A shares after a holding period of seven years from the initial date of purchase.
2. Investments in Fidelity Central Funds.
The Fund invests in Fidelity Central Funds, which are open-end investment companies generally available only to other investment companies and accounts managed by the investment adviser and its affiliates. The Fund's Schedule of Investments lists each of the Fidelity Central Funds held as of period end, if any, as an investment of the Fund, but does not include the underlying holdings of each Fidelity Central Fund. As an Investing Fund, the Fund indirectly bears its proportionate share of the expenses of the underlying Fidelity Central Funds.
The Money Market Central Funds seek preservation of capital and current income and are managed by Fidelity Investments Money Management, Inc. (FIMM), an affiliate of the investment adviser. Annualized expenses of the Money Market Central Funds as of their most recent shareholder report date are less than .01%.
A complete unaudited list of holdings for each Fidelity Central Fund is available upon request or at the Securities and Exchange Commission (the SEC) website at www.sec.gov. In addition, the financial statements of the Fidelity Central Funds, which are not covered by the Fund's Report of Independent Registered Public Accounting Firm, are available on the SEC website or upon request.
3. Significant Accounting Policies.
The financial statements have been prepared in conformity with accounting principles generally accepted in the United States of America (GAAP), which require management to make certain estimates and assumptions at the date of the financial statements. Actual results could differ from those estimates. Subsequent events, if any, through the date that the financial statements were issued have been evaluated in the preparation of the financial statements. The following summarizes the significant accounting policies of the Fund:
Annual Report
Notes to Financial Statements - continued
3. Significant Accounting Policies - continued
Investment Valuation. Investments are valued as of 4:00 p.m. Eastern time on the last calendar day of the period. In accordance with valuation policies and procedures approved by the Board of Trustees (the Board), the Fund attempts to obtain prices from one or more third party pricing vendors or brokers to value its investments. When current market prices, quotations or currency exchange rates are not readily available or reliable, investments will be fair valued in good faith by the Fidelity Management & Research Company (FMR) Fair Value Committee (the Committee), in accordance with procedures adopted by the Board. Factors used in determining fair value vary by investment type and may include market or investment specific events. The frequency with which these procedures are used cannot be predicted and they may be utilized to a significant extent. The Committee oversees the Fund's valuation policies and procedures and is responsible for approving and reporting to the Board all fair value determinations.
The Fund categorizes the inputs to valuation techniques used to value its investments into a disclosure hierarchy consisting of three levels as shown below:
Level 1 - quoted prices in active markets for identical investments
Level 2 - other significant observable inputs (including quoted prices for similar investments, interest rates, prepayment speeds, etc.)
Level 3 - unobservable inputs (including the Fund's own assumptions based on the best information available)
Valuation techniques used to value the Fund's investments by major category are as follows:
Equity securities, including restricted securities, for which market quotations are readily available, are valued at the last reported sale price or official closing price as reported by a third party pricing vendor on the primary market or exchange on which they are traded and are categorized as Level 1 in the hierarchy. In the event there were no sales during the day or closing prices are not available, securities are valued at the last quoted bid price or may be valued using the last available price and are generally categorized as Level 2 in the hierarchy. For foreign equity securities, when market or security specific events arise, comparisons to the valuation of American Depositary Receipts (ADRs), futures contracts, Exchange-Traded Funds (ETFs) and certain indexes as well as quoted prices for similar securities may be used and would be categorized as Level 2 in the hierarchy. Utilizing these techniques may result in transfers between Level 1 and Level 2. For equity securities, including restricted securities, where observable inputs are limited, assumptions about market activity and risk are used and these securities may be categorized as Level 3 in the hierarchy.
Annual Report
3. Significant Accounting Policies - continued
Investment Valuation - continued
Investments in open-end mutual funds, including the Fidelity Central Funds, are valued at their closing net asset value (NAV) each business day and are categorized as Level 1 in the hierarchy.
Changes in valuation techniques may result in transfers in or out of an assigned level within the disclosure hierarchy. The aggregate value of investments by input level, as of June 30, 2014 is included at the end of the Fund's Schedule of Investments.
Foreign Currency. The Fund may use foreign currency contracts to facilitate transactions in foreign-denominated securities. Gains and losses from these transactions may arise from changes in the value of the foreign currency or if the counterparties do not perform under the contracts' terms.
Foreign-denominated assets, including investment securities, and liabilities are translated into U.S. dollars at the exchange rates at period end. Purchases and sales of investment securities, income and dividends received and expenses denominated in foreign currencies are translated into U.S. dollars at the exchange rate in effect on the transaction date.
The effects of exchange rate fluctuations on investments are included with the net realized and unrealized gain (loss) on investment securities. Other foreign currency transactions resulting in realized and unrealized gain (loss) are disclosed separately.
Investment Transactions and Income. For financial reporting purposes, the Fund's investment holdings and NAV include trades executed through the end of the last business day of the period. The NAV per share for processing shareholder transactions is calculated as of the close of business of the New York Stock Exchange (NYSE), normally 4:00 p.m. Eastern time and includes trades executed through the end of the prior business day. Gains and losses on securities sold are determined on the basis of identified cost and may include proceeds received from litigation. Dividend income is recorded on the ex-dividend date, except for certain dividends from foreign securities where the ex-dividend date may have passed, which are recorded as soon as the Fund is informed of the ex-dividend date. Non-cash dividends included in dividend income, if any, are recorded at the fair market value of the securities received. Income and capital gain distributions from Fidelity Central Funds, if any, are recorded on the ex-dividend date. Distributions received on securities that represent a return of capital or capital gain are recorded as a reduction of cost of investments and/or as a realized gain. Subsequent to ex-dividend date the Fund determines the components of these distributions, based upon receipt of tax filings or other correspondence relating to the underlying investment. Interest income is accrued as earned and includes coupon interest and amortization of premium and accretion of discount on debt securities as applicable. Investment income is recorded net of foreign taxes withheld where recovery of such taxes is uncertain.
Annual Report
Notes to Financial Statements - continued
3. Significant Accounting Policies - continued
Class Allocations and Expenses. Investment income, realized and unrealized capital gains and losses, common expenses of the Fund, and certain fund-level expense reductions, if any, are allocated daily on a pro-rata basis to each class based on the relative net assets of each class to the total net assets of the Fund. Each class differs with respect to transfer agent and distribution and service plan fees incurred. Certain expense reductions may also differ by class. For the reporting period, the allocated portion of income and expenses to each class as a percent of its average net assets may vary due to the timing of recording these transactions in relation to fluctuating net assets of the classes. Expenses directly attributable to a fund are charged to that fund. Expenses attributable to more than one fund are allocated among the respective funds on the basis of relative net assets or other appropriate methods. Expense estimates are accrued in the period to which they relate and adjustments are made when actual amounts are known.
Income Tax Information and Distributions to Shareholders. Each year, the Fund intends to qualify as a regulated investment company under Subchapter M of the Internal Revenue Code, including distributing substantially all of its taxable income and realized gains. As a result, no provision for U.S. Federal income taxes is required. As of June 30, 2014, the Fund did not have any unrecognized tax benefits in the financial statements; nor is the Fund aware of any tax positions for which it is reasonably possible that the total amounts of unrecognized tax benefits will significantly change in the next twelve months. The Fund files a U.S. federal tax return, in addition to state and local tax returns as required. The Fund's federal income tax returns are subject to examination by the Internal Revenue Service (IRS) for a period of three fiscal years after they are filed. State and local tax returns may be subject to examination for an additional fiscal year depending on the jurisdiction. Foreign taxes are provided for based on the Fund's understanding of the tax rules and rates that exist in the foreign markets in which it invests.
Distributions are declared and recorded on the ex-dividend date. Income dividends and capital gain distributions are declared separately for each class. Income and capital gain distributions are determined in accordance with income tax regulations, which may differ from GAAP. In addition, the Fund claimed a portion of the payment made to redeeming shareholders as a distribution for income tax purposes.
Capital accounts within the financial statements are adjusted for permanent book-tax differences. These adjustments have no impact on net assets or the results of operations. Capital accounts are not adjusted for temporary book-tax differences which will reverse in a subsequent period.
Book-tax differences are primarily due to foreign currency transactions, equity-debt classifications, capital loss carryforwards, and losses deferred due to wash sales.
Annual Report
3. Significant Accounting Policies - continued
Income Tax Information and Distributions to Shareholders - continued
The federal tax cost of investment securities and unrealized appreciation (depreciation) as of period end were as follows:
Gross unrealized appreciation | $ 868,594,923 |
Gross unrealized depreciation | (16,059,631) |
Net unrealized appreciation (depreciation) on securities and other investments | $ 852,535,292 |
| |
Tax Cost | $ 2,823,608,973 |
The tax-based components of distributable earnings as of period end were as follows:
Undistributed ordinary income | $ 28,109,862 |
Undistributed long-term capital gain | $ 78,650,493 |
Net unrealized appreciation (depreciation) | $ 852,542,261 |
The tax character of distributions paid was as follows:
| June 30, 2014 | June 30, 2013 |
Ordinary Income | $ 36,293,656 | $ 27,575,489 |
Long-term Capital Gains | 41,182,371 |
|
Total | $ 77,476,027 | $ 27,575,489 |
Restricted Securities. The Fund may invest in securities that are subject to legal or contractual restrictions on resale. These securities generally may be resold in transactions exempt from registration or to the public if the securities are registered. Disposal of these securities may involve time-consuming negotiations and expense, and prompt sale at an acceptable price may be difficult. Information regarding restricted securities is included at the end of the Fund's Schedule of Investments.
4. Purchases and Sales of Investments.
Purchases and sales of securities, other than short-term securities, aggregated $1,277,032,508 and $853,056,484, respectively.
5. Fees and Other Transactions with Affiliates.
Management Fee. Fidelity Management & Research Company (the investment adviser) and its affiliates provide the Fund with investment management related services for which the Fund pays a monthly management fee. The management fee is the sum of an individual fund fee rate that is based on an annual rate of .20% of the Fund's
Annual Report
Notes to Financial Statements - continued
5. Fees and Other Transactions with Affiliates - continued
Management Fee - continued
average net assets and an annualized group fee rate that averaged .25% during the period. The group fee rate is based upon the average net assets of all the mutual funds advised by the investment adviser, including any mutual funds previously advised by the investment adviser that are currently advised by Fidelity SelectCo, LLC, an affiliate of the investment adviser. The group fee rate decreases as assets under management increase and increases as assets under management decrease. For the reporting period, the total annual management fee rate was .45% of the Fund's average net assets.
Distribution and Service Plan Fees. In accordance with Rule 12b-1 of the 1940 Act, the Fund has adopted separate Distribution and Service Plans for each class of shares. Certain classes pay Fidelity Distributors Corporation (FDC), an affiliate of the investment adviser, separate Distribution and Service Fees, each of which is based on an annual percentage of each class' average net assets. In addition, FDC may pay financial intermediaries for selling shares of the Fund and providing shareholder support services. For the period, the Distribution and Service Fee rates, total fees and amounts retained by FDC were as follows:
| Distribution
Fee | Service
Fee | Total Fees | Retained
by FDC |
Class A | -% | .25% | $ 87,546 | $ 3,362 |
Class T | .25% | .25% | 63,304 | 232 |
Class B | .75% | .25% | 9,175 | 6,896 |
Class C | .75% | .25% | 124,784 | 55,523 |
| | | $ 284,809 | $ 66,013 |
Sales Load. FDC may receive a front-end sales charge of up to 5.75% for selling Class A shares and 3.50% for selling Class T shares, some of which is paid to financial intermediaries for selling shares of the Fund. Depending on the holding period, FDC may receive contingent deferred sales charges levied on Class A, Class T, Class B, and Class C redemptions. The deferred sales charges range from 5.00% to 1.00% for Class B shares, 1.00% for Class C shares, 1.00% for certain purchases of Class A shares and .25% for certain purchases of Class T shares.
Annual Report
5. Fees and Other Transactions with Affiliates - continued
Sales Load - continued
For the period, sales charge amounts retained by FDC were as follows:
| Retained
by FDC |
Class A | $ 20,530 |
Class T | 3,915 |
Class B* | 699 |
Class C* | 897 |
| $ 26,041 |
* When Class B and Class C shares are initially sold, FDC pays commissions from its own resources to financial intermediaries through which the sales are made.
Transfer Agent Fees. Fidelity Investments Institutional Operations Company, Inc., (FIIOC), an affiliate of the investment adviser, is the transfer, dividend disbursing and shareholder servicing agent for each class of the Fund. FIIOC receives account fees and asset-based fees that vary according to the account size and type of account of the shareholders of the respective classes of the Fund, except for Class Z. FIIOC receives an asset-based fee of Class Z's average net assets. FIIOC pays for typesetting, printing and mailing of shareholder reports, except proxy statements.
For the period, transfer agent fees for each class were as follows:
| Amount | % of
Average
Net Assets |
Class A | $ 74,123 | .21 |
Class T | 28,367 | .22 |
Class B | 2,566 | .28 |
Class C | 26,868 | .22 |
Mega Cap Stock | 4,669,765 | .18 |
Institutional Class | 944,693 | .22 |
Class Z | 44 | .05* |
| $ 5,746,426 | |
* Annualized
Accounting and Security Lending Fees. Fidelity Service Company, Inc. (FSC), an affiliate of the investment adviser, maintains the Fund's accounting records. The accounting fee is based on the level of average net assets for each month. Under a separate contract, FSC administers the security lending program. The security lending fee is based on the number and duration of lending transactions.
Annual Report
Notes to Financial Statements - continued
5. Fees and Other Transactions with Affiliates - continued
Brokerage Commissions. The Fund placed a portion of its portfolio transactions with brokerage firms which are affiliates of the investment adviser. Brokerage commissions are included in net realized gain (loss) and change in net unrealized appreciation (depreciation) in the Statement of Operations. The commissions paid to these affiliated firms were $17,995 for the period.
Interfund Lending Program. Pursuant to an Exemptive Order issued by the SEC, the Fund, along with other registered investment companies having management contracts with FMR or other affiliated entities of FMR, may participate in an interfund lending program. This program provides an alternative credit facility allowing the funds to borrow from, or lend money to, other participating affiliated funds. At period end, there were no interfund loans outstanding. The Fund's activity in this program during the period for which loans were outstanding was as follows:
Borrower or Lender | Average Loan
Balance | Weighted Average Interest Rate | Interest
Expense |
Borrower | $ 9,205,303 | .30% | $ 2,541 |
6. Committed Line of Credit.
The Fund participates with other funds managed by the investment adviser FMR or an affiliate in a $4.25 billion credit facility (the "line of credit") to be utilized for temporary or emergency purposes to fund shareholder redemptions or for other short-term liquidity purposes. The Fund has agreed to pay commitment fees on its pro-rata portion of the line of credit, which amounted to $5,038 and is reflected in Miscellaneous expenses on the Statement of Operations. During the period, the Fund did not borrow on this line of credit.
7. Security Lending.
The Fund lends portfolio securities through a lending agent from time to time in order to earn additional income. For equity securities, a lending agent is used and may loan securities to certain qualified borrowers, including Fidelity Capital Markets (FCM), a broker-dealer affiliated with the Fund. On the settlement date of the loan, the Fund receives collateral (in the form of U.S. Treasury obligations, letters of credit and/or cash) against the loaned securities and maintains collateral in an amount not less than 100% of the market value of the loaned securities during the period of the loan. The market value of the loaned securities is determined at the close of business of the Fund and any additional required collateral is delivered to the Fund on the next business day. If the borrower defaults on its obligation to return the securities loaned because of insolvency or other reasons, the Fund may apply collateral received from the borrower against the obligation. The Fund may experience delays and costs in recovering the securities
Annual Report
7. Security Lending - continued
loaned. Any cash collateral received is invested in the Fidelity Securities Lending Cash Central Fund. The value of loaned securities and cash collateral at period end are disclosed on the Fund's Statement of Assets and Liabilities. Security lending income represents the income earned on investing cash collateral, less rebates paid to borrowers and any lending agent fees associated with the loan, plus any premium payments received for lending certain types of securities. Security lending income is presented in the Statement of Operations as a component of income from Fidelity Central Funds. Total security lending income during the period amounted to $89,556. During the period, there were no securities loaned to FCM.
8. Bank Borrowings.
The Fund is permitted to have bank borrowings for temporary or emergency purposes to fund shareholder redemptions or for other short-term liquidity requirements. The Fund has established borrowing arrangements with certain banks. The interest rate on the borrowings is the bank's base rate, as revised from time to time. The average loan balance during the period for which loans were outstanding amounted to $8,939,500. The weighted average interest rate was .57%. The interest expense amounted to $283 under the bank borrowing program. At period end, there were no bank borrowings outstanding.
9. Expense Reductions.
The investment adviser voluntarily agreed to reimburse each class to the extent annual operating expenses exceeded certain levels of average net assets as noted in the table below. Some expenses, for example interest expense, including commitment fees, are excluded from this reimbursement.
The following classes were in reimbursement during the period:
| Reimbursement |
Class A | $ 125 |
Class T | 56 |
Class B | 4 |
Class C | 50 |
Mega Cap Stock | 11,993 |
Institutional Class | 1,697 |
| $ 13,925 |
In addition, the investment adviser reimbursed a portion of the Fund's operating expenses during the period in the amount of $6,711.
Commissions paid to certain brokers with whom the investment adviser, or its affiliates, places trades on behalf of the Fund include an amount in addition to trade execution, which may be rebated back to the Fund to offset certain expenses. This amount totaled $16,290 for the period.
Annual Report
Notes to Financial Statements - continued
10. Distributions to Shareholders.
Distributions to shareholders of each class were as follows:
Years ended June 30, | 2014 A | 2013 |
From net investment income | | |
Class A | $ 295,572 | $ 137,534 |
Class T | 98,011 | 36,492 |
Class B | 2,617 | 2,304 |
Class C | 56,227 | 13,133 |
Mega Cap Stock | 30,989,923 | 23,359,421 |
Institutional Class | 4,262,259 | 4,026,605 |
Class Z | 727 | - |
Total | $ 35,705,336 | $ 27,575,489 |
From net realized gain | | |
Class A | $ 453,140 | $ - |
Class T | 181,208 | - |
Class B | 13,697 | - |
Class C | 173,595 | - |
Mega Cap Stock | 35,870,113 | - |
Institutional Class | 5,077,450 | - |
Class Z | 1,488 | - |
Total | $ 41,770,691 | $ - |
A Distributions for Class Z are for the period August 13, 2013 (commencement of sale of shares) to June 30, 2014.
11. Share Transactions.
Transactions for each class of shares were as follows:
| Shares | Dollars |
Years ended June 30, | 2014 A | 2013 | 2014 A | 2013 |
Class A | | | | |
Shares sold | 3,913,806 | 1,001,677 | $ 60,286,671 | $ 12,394,211 |
Reinvestment of distributions | 45,968 | 11,084 | 673,798 | 127,952 |
Shares redeemed | (725,328) | (279,053) | (11,077,893) | (3,495,724) |
Net increase (decrease) | 3,234,446 | 733,708 | $ 49,882,576 | $ 9,026,439 |
Class T | | | | |
Shares sold | 595,712 | 517,456 | $ 8,877,747 | $ 6,404,547 |
Reinvestment of distributions | 18,863 | 3,084 | 276,847 | 35,826 |
Shares redeemed | (270,157) | (107,959) | (4,055,631) | (1,368,248) |
Net increase (decrease) | 344,418 | 412,581 | $ 5,098,963 | $ 5,072,125 |
Annual Report
11. Share Transactions - continued
| Shares | Dollars |
Years ended June 30, | 2014 A | 2013 | 2014 A | 2013 |
Class B | | | | |
Shares sold | 27,198 | 9,952 | $ 400,691 | $ 125,476 |
Reinvestment of distributions | 1,081 | 196 | 15,861 | 2,261 |
Shares redeemed | (24,976) | (20,917) | (377,365) | (255,293) |
Net increase (decrease) | 3,303 | (10,769) | $ 39,187 | $ (127,556) |
Class C | | | | |
Shares sold | 504,584 | 448,373 | $ 7,460,222 | $ 5,664,292 |
Reinvestment of distributions | 15,230 | 988 | 221,741 | 11,494 |
Shares redeemed | (83,515) | (116,347) | (1,262,211) | (1,448,415) |
Net increase (decrease) | 436,299 | 333,014 | $ 6,419,752 | $ 4,227,371 |
Mega Cap Stock | | | | |
Shares sold | 53,817,396 | 84,998,537 | $ 817,611,772 | $ 1,035,668,817 |
Reinvestment of distributions | 4,142,626 | 1,836,891 | 61,008,516 | 21,294,763 |
Shares redeemed | (46,852,676) | (39,801,746) | (705,756,204) | (498,490,773) |
Net increase (decrease) | 11,107,346 | 47,033,682 | $ 172,864,084 | $ 558,472,807 |
Institutional Class | | | | |
Shares sold | 19,497,644 | 11,389,839 | $ 301,200,514 | $ 129,734,591 |
Reinvestment of distributions | 626,527 | 338,467 | 9,201,440 | 3,911,623 |
Shares redeemed | (2,047,800) | (4,517,962) | (31,155,657) | (57,335,322) |
Net increase (decrease) | 18,076,371 | 7,210,344 | $ 279,246,297 | $ 76,310,892 |
Class Z | | | | |
Shares sold | 6,988 | - | $ 100,000 | $ - |
Reinvestment of distributions | 150 | - | 2,215 | - |
Net increase (decrease) | 7,138 | - | $ 102,215 | $ - |
A Share transactions for Class Z are for the period August 13, 2013 (commencement of sale of shares) to June 30, 2014.
12. Other.
The Fund's organizational documents provide former and current trustees and officers with a limited indemnification against liabilities arising in connection with the performance of their duties to the Fund. In the normal course of business, the Fund may also enter into contracts that provide general indemnifications. The Fund's maximum exposure under these arrangements is unknown as this would be dependent on future claims that may be made against the Fund. The risk of material loss from such claims is considered remote.
At the end of the period, Strategic Advisers U.S. Opportunity Fund was the owner of record of approximately 11% of the total outstanding shares of the Fund.
Annual Report
To the Trustees of Fidelity Hastings Street Trust and the Shareholders of Fidelity Mega Cap Stock Fund:
In our opinion, the accompanying statement of assets and liabilities, including the schedule of investments, and the related statements of operations and of changes in net assets and the financial highlights present fairly, in all material respects, the financial position of Fidelity Mega Cap Stock Fund (a fund of Fidelity Hastings Street Trust) at June 30, 2014, the results of its operations for the year then ended, the changes in its net assets for each of the two years in the period then ended and the financial highlights for each of the periods indicated, in conformity with accounting principles generally accepted in the United States of America. These financial statements and financial highlights (hereafter referred to as "financial statements") are the responsibility of the Fidelity Mega Cap Stock Fund's management. Our responsibility is to express an opinion on these financial statements based on our audits. We conducted our audits of these financial statements in accordance with the standards of the Public Company Accounting Oversight Board (United States). Those standards require that we plan and perform the audit to obtain reasonable assurance about whether the financial statements are free of material misstatement. An audit includes examining, on a test basis, evidence supporting the amounts and disclosures in the financial statements, assessing the accounting principles used and significant estimates made by management, and evaluating the overall financial statement presentation. We believe that our audits, which included confirmation of securities at June 30, 2014 by correspondence with the custodian and brokers, provide a reasonable basis for our opinion.
PricewaterhouseCoopers LLP
Boston, Massachusetts
August 12, 2014
Annual Report
The Trustees, Member of the Advisory Board, and officers of the trust and fund, as applicable, are listed below. The Board of Trustees governs the fund and is responsible for protecting the interests of shareholders. The Trustees are experienced executives who meet periodically throughout the year to oversee the fund's activities, review contractual arrangements with companies that provide services to the fund, oversee management of the risks associated with such activities and contractual arrangements, and review the fund's performance. Except for James C. Curvey, each of the Trustees oversees 173 funds. Mr. Curvey oversees 397 funds.
The Trustees hold office without limit in time except that (a) any Trustee may resign; (b) any Trustee may be removed by written instrument, signed by at least two-thirds of the number of Trustees prior to such removal; (c) any Trustee who requests to be retired or who has become incapacitated by illness or injury may be retired by written instrument signed by a majority of the other Trustees; and (d) any Trustee may be removed at any special meeting of shareholders by a two-thirds vote of the outstanding voting securities of the trust. Each Trustee who is not an interested person (as defined in the 1940 Act) of the trust and the fund (Independent Trustee), shall retire not later than the last day of the calendar year in which his or her 75th birthday occurs. The Independent Trustees may waive this mandatory retirement age policy with respect to individual Trustees. The officers and Advisory Board Member hold office without limit in time, except that any officer and Advisory Board Member may resign or may be removed by a vote of a majority of the Trustees at any regular meeting or any special meeting of the Trustees. Except as indicated, each individual has held the office shown or other offices in the same company for the past five years.
Experience, Skills, Attributes, and Qualifications of the Fund's Trustees. The Governance and Nominating Committee has adopted a statement of policy that describes the experience, qualifications, attributes, and skills that are necessary and desirable for potential Independent Trustee candidates (Statement of Policy). The Board believes that each Trustee satisfied at the time he or she was initially elected or appointed a Trustee, and continues to satisfy, the standards contemplated by the Statement of Policy. The Governance and Nominating Committee also engages professional search firms to help identify potential Independent Trustee candidates who have the experience, qualifications, attributes, and skills consistent with the Statement of Policy. From time to time, additional criteria based on the composition and skills of the current Independent Trustees, as well as experience or skills that may be appropriate in light of future changes to board composition, business conditions, and regulatory or other developments, have also been considered by the professional search firms and the Governance and Nominating Committee. In addition, the Board takes into account the Trustees' commitment and participation in Board and committee meetings, as well as their leadership of standing and ad hoc committees throughout their tenure.
In determining that a particular Trustee was and continues to be qualified to serve as a Trustee, the Board has considered a variety of criteria, none of which, in isolation, was controlling. The Board believes that, collectively, the Trustees have balanced and diverse experience, qualifications, attributes, and skills, which allow the Board to operate effectively in governing the fund and protecting the interests of shareholders. Information about the specific experience, skills, attributes, and qualifications of each Trustee, which in each case led to the Board's conclusion that the Trustee should serve (or continue to serve) as a trustee of the fund, is provided below.
Annual Report
Board Structure and Oversight Function. James C. Curvey is an interested person (as defined in the 1940 Act) and currently serves as Chairman. The Trustees have determined that an interested Chairman is appropriate and benefits shareholders because an interested Chairman has a personal and professional stake in the quality and continuity of services provided to the fund. Independent Trustees exercise their informed business judgment to appoint an individual of their choosing to serve as Chairman, regardless of whether the Trustee happens to be independent or a member of management. The Independent Trustees have determined that they can act independently and effectively without having an Independent Trustee serve as Chairman and that a key structural component for assuring that they are in a position to do so is for the Independent Trustees to constitute a substantial majority for the Board. The Independent Trustees also regularly meet in executive session. Ned C. Lautenbach serves as Chairman of the Independent Trustees and as such (i) acts as a liaison between the Independent Trustees and management with respect to matters important to the Independent Trustees and (ii) with management prepares agendas for Board meetings.
Fidelity funds are overseen by different Boards of Trustees. The fund's Board oversees Fidelity's equity and high income funds and another Board oversees Fidelity's investment-grade bond, money market, and asset allocation funds. The asset allocation funds may invest in Fidelity funds overseen by the fund's Board. The use of separate Boards, each with its own committee structure, allows the Trustees of each group of Fidelity funds to focus on the unique issues of the funds they oversee, including common research, investment, and operational issues. On occasion, the separate Boards establish joint committees to address issues of overlapping consequences for the Fidelity funds overseen by each Board.
The Trustees operate using a system of committees to facilitate the timely and efficient consideration of all matters of importance to the Trustees, the fund, and fund shareholders and to facilitate compliance with legal and regulatory requirements and oversight of the fund's activities and associated risks. The Board, acting through its committees, has charged FMR and its affiliates with (i) identifying events or circumstances the occurrence of which could have demonstrably adverse effects on the fund's business and/or reputation; (ii) implementing processes and controls to lessen the possibility that such events or circumstances occur or to mitigate the effects of such events or circumstances if they do occur; and (iii) creating and maintaining a system designed to evaluate continuously business and market conditions in order to facilitate the identification and implementation processes described in (i) and (ii) above. Because the day-to-day operations and activities of the fund are carried out by or through FMR, its affiliates and other service providers, the fund's exposure to risks is mitigated but not eliminated by the processes overseen by the Trustees. While each of the Board's committees has responsibility for overseeing different aspects of the fund's activities, oversight is exercised primarily through the Operations, Audit, and Compliance Committees. In addition, the Independent Trustees have worked with FMR to enhance the Board's oversight of investment and financial risks, legal and regulatory risks, technology risks, and operational risks, including the development of additional risk reporting to the Board. For example, a working group comprised of Independent Trustees and FMR has worked and continues to work to review the Fidelity funds' valuation-related activities, reporting and risk management. Appropriate personnel, including but not limited to the fund's Chief Compliance Officer (CCO), FMR's internal auditor, the independent accountants, the fund's Treasurer and portfolio management personnel, make periodic reports to the Board's committees, as appropriate, including an annual review of FMR's risk management program for the Fidelity funds. The responsibilities of each standing committee, including their oversight responsibilities, are described further under "Standing Committees of the Fund's Trustees."
Annual Report
Trustees and Officers - continued
The fund's Statement of Additional Information (SAI) includes more information about the Trustees. To request a free copy, call Fidelity at 1-800-544-8544.
Interested Trustees*:
Correspondence intended for each Trustee who is an interested person may be sent to Fidelity Investments, 245 Summer Street, Boston, Massachusetts 02210.
Name, Year of Birth; Principal Occupations and Other Relevant Experience+ |
James C. Curvey (1935) |
Year of Election or Appointment: 2007 Trustee Chairman of the Board of Trustees |
| Mr. Curvey also serves as Trustee of other Fidelity funds. Mr. Curvey is a Director of Fidelity Research & Analysis Co. (2009-present), and Vice Chairman (2007-present) and Director of FMR LLC. In addition, Mr. Curvey serves as an Overseer for the Boston Symphony Orchestra and a member of the Trustees of Villanova University. Previously, Mr. Curvey served as a Director of Fidelity Investments Money Management, Inc. (2009-2014), a Director of FMR (2007-2014), a Director of FMR Co., Inc. (2007-2014) and was the Vice Chairman (2006-2007) and Director (2000-2007) of FMR Corp. |
Charles S. Morrison (1960) |
Year of Election or Appointment: 2014 Trustee |
| Mr. Morrison also serves as Trustee of other funds. He serves as President, Asset Management (2014-present) and is an employee of Fidelity Investments. Previously, Mr. Morrison served as Vice President of Fidelity's Fixed Income and Asset Allocation Funds (2012-2014), President, Fixed Income (2011-2014), Vice President of Fidelity's Money Market Funds (2005-2009), President, Money Market Group Leader of FMR (2009), and Senior Vice President, Money Market Group of FMR (2004-2009). Mr. Morrison also served as Vice President of Fidelity's Bond Funds (2002-2005), certain Balanced Funds (2002-2005), and certain Asset Allocation Funds (2002-2007), and as Senior Vice President (2002-2005) of Fidelity's Bond Division. |
* Trustees have been determined to be "Interested Trustees" by virtue of, among other things, their affiliation with the trust or various entities under common control with FMR.
+ The information above includes each Trustee's principal occupation during the last five years and other information relating to the experience, attributes, and skills relevant to each Trustee's qualifications to serve as a Trustee, which led to the conclusion that each Trustee should serve as a Trustee for the fund.
Annual Report
Trustees and Officers - continued
Independent Trustees:
Correspondence intended for each Independent Trustee (that is, the Trustees other than the Interested Trustees) may be sent to Fidelity Investments, P.O. Box 55235, Boston, Massachusetts 02205-5235.
Dennis J. Dirks (1948) |
Year of Election or Appointment: 2005 Trustee |
| Mr. Dirks also serves as Trustee of other Fidelity funds. Prior to his retirement in May 2003, Mr. Dirks was Chief Operating Officer and a member of the Board of The Depository Trust & Clearing Corporation (DTCC). He also served as President, Chief Operating Officer, and Board member of The Depository Trust Company (DTC) and President and Board member of the National Securities Clearing Corporation (NSCC). In addition, Mr. Dirks served as Chief Executive Officer and Board member of the Government Securities Clearing Corporation, Chief Executive Officer and Board member of the Mortgage-Backed Securities Clearing Corporation, as a Trustee and a member of the Finance Committee of Manhattan College (2005-2008), and as a Trustee and a member of the Finance Committee of AHRC of Nassau County (2006-2008). Mr. Dirks is a member of the Independent Directors Council (IDC) Governing Council (2010-present) and Board of Directors for The Brookville Center for Children's Services, Inc. (2009-present). |
Alan J. Lacy (1953) |
Year of Election or Appointment: 2008 Trustee |
| Mr. Lacy also serves as Trustee of other Fidelity funds. Mr. Lacy serves as Senior Adviser (2007-present) of Oak Hill Capital Partners, L.P. (private equity). Mr. Lacy also served as Chief Executive Officer (2000-2005) and Vice Chairman (2005-2006) of Sears Holdings Corporation and Sears, Roebuck and Co. (retail). In addition, Mr. Lacy serves as a member of the Board of Directors of Dave & Buster's Entertainment, Inc. (restaurant and entertainment complexes, 2010-present), Earth Fare, Inc. (retail grocery, 2012-present), The Hillman Companies, Inc. (hardware wholesalers, 2010-present), and Bristol-Myers Squibb Company (global pharmaceuticals, 2008-present). Mr. Lacy is a member of the Board of Trustees of The National Parks Conservation Association (2006-present). Previously, Mr. Lacy served as Chairman of the Board of Trustees of the National Parks Conservation Association (2008-2011) and as a member of the Board of Directors for the Western Union Company (global money transfer, 2006-2011). |
Name, Year of Birth; Principal Occupations and Other Relevant Experience+ |
Ned C. Lautenbach (1944) |
Year of Election or Appointment: 2000 Trustee Chairman of the Independent Trustees |
| Mr. Lautenbach also serves as Trustee of other Fidelity funds. Mr. Lautenbach currently serves as the Lead Director of the Eaton Corporation Board of Directors (diversified industrial, 1997-present). Mr. Lautenbach is Chairman of the Board of Directors of the Philharmonic Center for the Arts in Naples, Florida (2012-present) and a member of the Council on Foreign Relations (1994-present). Previously, Mr. Lautenbach was a Partner/Advisory Partner at Clayton, Dubilier & Rice, LLC (private equity investment, 1998-2010), as well as a Director of Sony Corporation (2006-2007). |
Joseph Mauriello (1944) |
Year of Election or Appointment: 2008 Trustee |
| Mr. Mauriello also serves as Trustee of other Fidelity funds. Prior to his retirement in January 2006, Mr. Mauriello served in numerous senior management positions including Deputy Chairman and Chief Operating Officer (2004-2005), and Vice Chairman of Financial Services (2002-2004) of KPMG LLP US (professional services, 1965-2005). Mr. Mauriello currently serves as a member of the Board of Directors of XL Group plc. (global insurance and re-insurance, 2006-present). Previously, Mr. Mauriello served as a Director of the Hamilton Funds of the Bank of New York (2006-2007) and of Arcadia Resources Inc. (health care services and products, 2007-2012). |
Robert W. Selander (1950) |
Year of Election or Appointment: 2011 Trustee |
| Mr. Selander also serves as Trustee of other Fidelity funds. Previously, Mr. Selander served as a Member of the Advisory Board of other Fidelity funds (2011), and Executive Vice Chairman (2010), Chief Executive Officer (2009-2010), and President and Chief Executive Officer (1997-2009) of Mastercard, Inc. |
Cornelia M. Small (1944) |
Year of Election or Appointment: 2005 Trustee |
| Ms. Small also serves as Trustee of other Fidelity funds. Ms. Small is a member of the Board of Directors (2009-present) and Chair of the Investment Committee (2010-present) of the Teagle Foundation. Ms. Small also serves on the Investment Committee of the Berkshire Taconic Community Foundation (2008-present). Previously, Ms. Small served as Chairperson (2002-2008) and a member of the Investment Committee and Chairperson (2008-2012) and a member of the Board of Trustees of Smith College. In addition, Ms. Small served as Chief Investment Officer, Director of Global Equity Investments, and a member of the Board of Directors of Scudder, Stevens & Clark and Scudder Kemper Investments. |
William S. Stavropoulos (1939) |
Year of Election or Appointment: 2001 Trustee Vice Chairman of the Independent Trustees |
| Mr. Stavropoulos also serves as Trustee of other Fidelity funds. Mr. Stavropoulos serves as President and Founder of the Michigan Baseball Foundation, the Great Lakes Loons (2007-present). Mr. Stavropoulos is Chairman Emeritus of the Board of Directors of The Dow Chemical Company, where he previously served in numerous senior management positions, including President, CEO (1995-2000; 2002-2004), Chairman of the Executive Committee (2000-2006), and as a member of the Board of Directors (1990-2006). Currently, Mr. Stavropoulos is Chairman of the Board of Directors of Univar Inc. (global distributor of commodity and specialty chemicals), a Director of Teradata Corporation (data warehousing and technology solutions), and Maersk Inc. (industrial conglomerate), and a member of the Advisory Board for Metalmark Capital LLC (private equity investment, 2005-present). Mr. Stavropoulos is an operating advisor to Clayton, Dubilier & Rice, LLC (private equity investment). In addition, Mr. Stavropoulos is a member of the University of Notre Dame Advisory Council for the College of Science, a Trustee of the Rollin L. Gerstacker Foundation, and a Director of the Naples Philharmonic Center for the Arts. Previously, Mr. Stavropoulos served as a Director of Chemical Financial Corporation (bank holding company, 1993-2012) and Tyco International, Ltd. (multinational manufacturing and services, 2007-2012). |
David M. Thomas (1949) |
Year of Election or Appointment: 2008 Trustee |
| Mr. Thomas also serves as Trustee of other Fidelity funds. Mr. Thomas serves as Non-Executive Chairman of the Board of Directors of Fortune Brands Home and Security (home and security products, 2011-present), and as a member of the Board of Directors of Interpublic Group of Companies, Inc. (marketing communication, 2004-present). Previously, Mr. Thomas served as Executive Chairman (2005-2006) and Chairman and Chief Executive Officer (2000-2005) of IMS Health, Inc. (pharmaceutical and healthcare information solutions), and a Director of Fortune Brands, Inc. (consumer products, 2000-2011). |
+ The information above includes each Trustee's principal occupation during the last five years and other information relating to the experience, attributes, and skills relevant to each Trustee's qualifications to serve as a Trustee, which led to the conclusion that each Trustee should serve as a Trustee for the fund.
Advisory Board Member and Officers:
Correspondence intended for each officer and Peter S. Lynch may be sent to Fidelity Investments, 245 Summer Street, Boston, Massachusetts 02210. Officers appear below in alphabetical order.
Name, Year of Birth; Principal Occupation |
Peter S. Lynch (1944) |
Year of Election or Appointment: 2003 Member of the Advisory Board |
| Mr. Lynch also serves as Member of the Advisory Board of other Fidelity funds. Mr. Lynch is Vice Chairman and a Director of FMR and FMR Co., Inc. In addition, Mr. Lynch serves as a Trustee of Boston College and as the Chairman of the Inner-City Scholarship Fund. Previously, Mr. Lynch served on the Special Olympics International Board of Directors (1997-2006). |
Elizabeth Paige Baumann (1968) |
Year of Election or Appointment: 2012 Anti-Money Laundering (AML) Officer |
| Ms. Baumann also serves as AML Officer of other funds. She is Chief AML Officer of FMR LLC (2012-present) and is an employee of Fidelity Investments. Previously, Ms. Baumann served as Vice President and Deputy Anti-Money Laundering Officer (2007-2012). |
William C. Coffey (1969) |
Year of Election or Appointment: 2009 Assistant Secretary |
| Mr. Coffey also serves as Assistant Secretary of other funds. He is Senior Vice President and Deputy General Counsel of FMR LLC (2010-present), and is an employee of Fidelity Investments. Previously, Mr. Coffey served as Vice President and Associate General Counsel of FMR LLC (2005-2009). |
Jonathan Davis (1968) |
Year of Election or Appointment: 2010 Assistant Treasurer |
| Mr. Davis also serves as Assistant Treasurer of other funds. Mr. Davis is an employee of Fidelity Investments. Previously, Mr. Davis served as Vice President and Associate General Counsel of FMR LLC (2003-2010). |
Adrien E. Deberghes (1967) |
Year of Election or Appointment: 2008 Deputy Treasurer |
| Mr. Deberghes also serves as an officer of other funds. He is an employee of Fidelity Investments (2008-present). Prior to joining Fidelity Investments, Mr. Deberghes was Senior Vice President of Mutual Fund Administration at State Street Corporation (2007-2008), Senior Director of Mutual Fund Administration at Investors Bank & Trust (2005-2007), and Director of Finance for Dunkin' Brands (2000-2005). |
Stephanie J. Dorsey (1969) |
Year of Election or Appointment: 2010 Assistant Treasurer |
| Ms. Dorsey also serves as an officer of other funds. She is an employee of Fidelity Investments (2008-present) and has served in other fund officer roles. Prior to joining Fidelity Investments, Ms. Dorsey served as Treasurer (2004-2008) of the JPMorgan Mutual Funds and Vice President (2004-2008) of JPMorgan Chase Bank. |
Howard J. Galligan III (1966) |
Year of Election or Appointment: 2014 Chief Financial Officer |
| Mr. Galligan also serves as Chief Financial Officer of other funds. Mr. Galligan serves as President of Fidelity Pricing and Cash Management Services (FPCMS) (2014-present) and as a Director of Strategic Advisers, Inc. (2008-present). Previously, Mr. Galligan served as Chief Administrative Officer of Asset Management (2011-2014) and Chief Operating Officer and Senior Vice President of Investment Support for Strategic Advisers, Inc. (2003-2011). |
Scott C. Goebel (1968) |
Year of Election or Appointment: 2008 Secretary and Chief Legal Officer (CLO) |
| Mr. Goebel serves as Secretary and CLO of other funds. Mr. Goebel also serves as Secretary of Fidelity SelectCo, LLC (2013-present), Fidelity Investments Money Management, Inc. (FIMM) (2010-present) and Fidelity Research and Analysis Company (FRAC) (2010-present); General Counsel, Secretary, and Senior Vice President of FMR (2008-present) and FMR Co., Inc. (2008-present); Chief Legal Officer of Fidelity Management & Research (Hong Kong) Limited (2008-present); and Assistant Secretary of Fidelity Management & Research (Japan) Inc. (2008-present) and Fidelity Management & Research (U.K.) Inc. (2008-present). Previously, Mr. Goebel served as Secretary and CLO of other Fidelity funds (2008-2013), Assistant Secretary of FIMM (2008-2010), FRAC (2008-2010), and certain funds (2007-2008); and as Vice President and Secretary of Fidelity Distributors Corporation (FDC) (2005-2007). Mr. Goebel has been employed by FMR LLC or an affiliate since 2001. |
Brian B. Hogan (1964) |
Year of Election or Appointment: 2009 Vice President |
| Mr. Hogan also serves as Trustee or Vice President of other funds. Mr. Hogan serves as President of FMR's Equity Division (2009-present). Previously, Mr. Hogan served as Senior Vice President, Equity Research of FMR (2006-2009) and as a portfolio manager. |
Chris Maher (1972) |
Year of Election or Appointment: 2013 Assistant Treasurer |
| Mr. Maher serves as Assistant Treasurer of other funds. Mr. Maher is Vice President of Valuation Oversight and is an employee of Fidelity Investments. Previously, Mr. Maher served as Vice President of Asset Management Compliance (2013), Vice President of FMR's Program Management Group (2010-2013), and Vice President of Valuation Oversight (2008-2010). |
Melissa M. Reilly (1971) |
Year of Election or Appointment: 2014 Vice President of certain Equity Funds |
| Ms. Reilly also serves as Vice President of other funds. Ms. Reilly is an employee of Fidelity Investments (2004-present). |
Kenneth B. Robins (1969) |
Year of Election or Appointment: 2008 President and Treasurer |
| Mr. Robins also serves as an officer of other funds. Mr. Robins serves as Executive Vice President of Fidelity Investments Money Management, Inc. (FIMM) (2013-present) and is an employee of Fidelity Investments (2004-present). Previously, Mr. Robins served in other fund officer roles. |
Stephen Sadoski (1971) |
Year of Election or Appointment: 2012 Deputy Treasurer |
| Mr. Sadoski also serves as Deputy Treasurer of other funds. He is an employee of Fidelity Investments (2012-present) and has served in another fund officer role. Prior to joining Fidelity Investments, Mr. Sadoski served as an assistant chief accountant in the Division of Investment Management of the Securities and Exchange Commission (SEC) (2009-2012) and as a senior manager at Deloitte & Touche LLP (1997-2009). |
Stacie M. Smith (1974) |
Year of Election or Appointment: 2013 Deputy Treasurer |
| Ms. Smith also serves as an officer of other funds. She is an employee of Fidelity Investments (2009-present) and has served in other fund officer roles. Prior to joining Fidelity Investments, Ms. Smith served as Senior Audit Manager of Ernst & Young LLP (1996-2009). |
Renee Stagnone (1975) |
Year of Election or Appointment: 2013 Deputy Treasurer |
| Ms. Stagnone also serves as Deputy Treasurer of other funds. Ms. Stagnone is an employee of Fidelity Investments. |
Linda J. Wondrack (1964) |
Year of Election or Appointment: 2014 Chief Compliance Officer |
| Ms. Wondrack also serves as Chief Compliance Officer of other funds. Ms. Wondrack is Executive Vice President and head of the Ethics Office and Asset Management Compliance for Fidelity Investments (2012-present). Ms. Wondrack also serves as Chief Compliance Officer of Fidelity SelectCo, LLC (2014-present); Chief Compliance Officer of Impresa Management LLC (2013-present); and Chief Compliance Officer of FMR Co., Inc., Fidelity Investments Money Management, Inc., Fidelity Management & Research (Japan) Inc., Fidelity Management & Research (U.K.) Inc., Fidelity Management & Research (Hong Kong), Fidelity Management & Research Company, Pyramis Global Advisors, LLC, and Strategic Advisers, Inc., Ballyrock Investment Advisors LLC, and Northern Neck Investors LLC (2012-present). Previously, Ms. Wondrack served as Senior Vice President and Chief Compliance Officer for Columbia Management Investment Advisers, LLC (2005-2012); Chief Compliance Officer for certain funds within the Columbia Family of Funds (2007-2012); and Senior Vice President of Compliance Risk Management at Bank of America (2005-2010). |
Joseph F. Zambello (1957) |
Year of Election or Appointment: 2011 Deputy Treasurer |
| Mr. Zambello also serves as Deputy Treasurer of other funds. Mr. Zambello is an employee of Fidelity Investments. Previously, Mr. Zambello served as Vice President of FMR's Program Management Group (2009-2011) and Vice President of the Transfer Agent Oversight Group (2005-2009). |
Annual Report
The Board of Trustees of Fidelity Mega Cap Stock Fund voted to pay to shareholders of record at the opening of business on record date, the following distributions per share derived from capital gains realized from sales of portfolio securities, and dividends derived from net investment income:
| Pay Date | Record Date | Dividends | Capital Gains |
Mega Cap Stock | 08/11/14 | 08/08/14 | $0.107 | $0.341 |
The fund hereby designates as a capital gain dividend with respect to the taxable year ended June 30, 2014, $119,836,862, or, if subsequently determined to be different, the net capital gain of such year.
Mega Cap Stock designates 100% of the dividends distributed during the fiscal year as qualifying for the dividends-received deduction for corporate shareholders.
Mega Cap Stock designates 100% of the dividends distributed during the fiscal year as amounts which may be taken into account as a dividend for purposes of the maximum rate under Section 1(h)(11) of the Internal Revenue Code.
The fund will notify shareholders in January 2015 of amounts for use in preparing 2014 income tax returns.
Annual Report
Investment Adviser
Fidelity Management & Research Company
Boston, MA
Investment Sub-Advisers
FMR Co., Inc.
Fidelity Management & Research
(U.K.) Inc.
Fidelity Management & Research
(Hong Kong) Limited
Fidelity Management & Research
(Japan) Inc.
General Distributor
Fidelity Distributors Corporation
Smithfield, RI
Transfer and Service Agents
Fidelity Investments Institutional
Operations Company, Inc.
Boston, MA
Fidelity Service Company, Inc.
Boston, MA
Custodian
JPMorgan Chase Bank
New York, NY
(Fidelity Investment logo)(registered trademark)
Corporate Headquarters
245 Summer St., Boston, MA 02210
www.fidelity.com
The Fidelity Telephone Connection
Mutual Fund 24-Hour Service
Exchanges/Redemptions
and Account Assistance 1-800-544-6666
Product Information 1-800-544-6666
Retirement Accounts 1-800-544-4774
(8 a.m. - 9 p.m.)
TDD Service 1-800-544-0118
for the deaf and hearing impaired
(9 a.m. - 9 p.m. Eastern time)
Fidelity Automated Service
Telephone (FAST®)
1-800-544-5555
Automated line for quickest service
GII-UANN-0814
1.787733.111
(Fidelity Investment logo)(registered trademark)
Fidelity Advisor®
Mega Cap Stock
Fund - Class A, Class T, Class B
and Class C
Annual Report
June 30, 2014
(Fidelity Cover Art)
Class A, Class T, Class B,
and Class C are classes of
Fidelity® Mega Cap Stock Fund
Contents
Performance | (Click Here) | How the fund has done over time. |
Management's Discussion of Fund Performance | (Click Here) | The Portfolio Manager's review of fund performance and strategy. |
Shareholder Expense Example | (Click Here) | An example of shareholder expenses. |
Investment Changes | (Click Here) | A summary of major shifts in the fund's investments over the past six months. |
Investments | (Click Here) | A complete list of the fund's investments with their market values. |
Financial Statements | (Click Here) | Statements of assets and liabilities, operations, and changes in net assets, as well as financial highlights. |
Notes | (Click Here) | Notes to the financial statements. |
Report of Independent Registered Public Accounting Firm | (Click Here) | |
Trustees and Officers | (Click Here) | |
Distributions | (Click Here) | |
To view a fund's proxy voting guidelines and proxy voting record for the 12-month period ended June 30, visit http://www.fidelity.com/proxyvotingresults or visit the Securities and Exchange Commission's (SEC) web site at http://www.sec.gov. You may also call 1-877-208-0098 to request a free copy of the proxy voting guidelines.
Standard & Poor's, S&P and S&P 500 are registered service marks of The McGraw-Hill Companies, Inc. and have been licensed for use by Fidelity Distributors Corporation.
Other third-party marks appearing herein are the property of their respective owners.
All other marks appearing herein are registered or unregistered trademarks or service marks of FMR LLC or an affiliated company. © 2014 FMR LLC. All rights reserved.
This report and the financial statements contained herein are submitted for the general information of the shareholders of the fund. This report is not authorized for distribution to prospective investors in the fund unless preceded or accompanied by an effective prospectus.
A fund files its complete schedule of portfolio holdings with the SEC for the first and third quarters of each fiscal year on Form N-Q. Forms N-Q are available on the SEC's web site at http://www.sec.gov. A fund's Forms N-Q may be reviewed and copied at the SEC's Public Reference Room in Washington, DC. Information regarding the operation of the SEC's Public Reference Room may be obtained by calling 1-800-SEC-0330. For a complete list of a fund's portfolio holdings, view the most recent holdings listing, semiannual report, or annual report on Fidelity's web site at http://www.fidelity.com, http://www.advisor.fidelity.com, or http://www.401k.com, as applicable.
NOT FDIC INSURED • MAY LOSE VALUE • NO BANK GUARANTEE
Neither the fund nor Fidelity Distributors Corporation is a bank.
Annual Report
Average annual total return reflects the change in the value of an investment, assuming reinvestment of the class' distributions from dividend income and capital gains (the profits earned upon the sale of securities that have grown in value, if any) and assuming a constant rate of performance each year. The $10,000 table and the fund's returns do not reflect the deduction of taxes that a shareholder would pay on fund distributions or the redemption of fund shares. During periods of reimbursement by Fidelity, a fund's total return will be greater than it would be had the reimbursement not occurred. How a fund did yesterday is no guarantee of how it will do tomorrow. Returns reflect the conversion of Class B shares to Class A shares after a maximum of seven years.
Average Annual Total Returns
Periods ended June 30, 2014 | Past 1
year | Past 5
years | Past 10
years |
Class A (incl. 5.75% sales charge) A, E | 16.76% | 17.96% | 7.40% |
Class T (incl. 3.50% sales charge) B, E | 19.22% | 18.20% | 7.47% |
Class B (incl. contingent deferred sales charge) C, E | 17.82% | 18.19% | 7.49% |
Class C (incl. contingent deferred sales charge) D, E | 21.90% | 18.44% | 7.52% |
A Class A shares bear a 0.25% 12b-1 fee. The initial offering of Class A shares took place on February 5, 2008. Returns prior to February 5, 2008, are those of Fidelity® Mega Cap Stock Fund, the original class of the fund, which has no 12b-1 fee. Had Class A's 12b-1 fee been reflected, returns prior to February 5, 2008, would have been lower.
B Class T shares bear a 0.50% 12b-1 fee. The initial offering of Class T shares took place on February 5, 2008. Returns prior to February 5, 2008, are those of Fidelity® Mega Cap Stock Fund, the original class of the fund, which has no 12b-1 fee. Had Class T's 12b-1 fee been reflected, returns prior to February 5, 2008, would have been lower.
C Class B shares bear a 1.00% 12b-1 fee. The initial offering of Class B shares took place on February 5, 2008. Returns prior to February 5, 2008, are those of Fidelity Mega Cap Stock Fund, the original class of the fund, which has no 12b-1 fee. Had Class B's 12b-1 fee been reflected, returns prior to February 5, 2008, would have been lower. Class B shares' contingent deferred sales charges included in the past one year, past five years, and past ten years total return figures are 5%, 2%, and 0%, respectively.
D Class C shares bear a 1.00% 12b-1 fee. The initial offering of Class C shares took place on February 5, 2008. Returns prior to February 5, 2008, are those of Fidelity Mega Cap Stock Fund, the original class of the fund, which has no 12b-1 fee. Had Class C's 12b-1 fee been reflected, returns prior to February 5, 2008, would have been lower. Class C shares' contingent deferred sales charges included in the past one year, past five years, and past ten years total return figures are 1%, 0%, and 0%, respectively.
E Prior to December 1, 2007, the fund operated under certain different investment policies. The fund's historical performance may not represent its current investment policies.
Annual Report
$10,000 Over 10 Years
Let's say hypothetically that $10,000 was invested in Fidelity Advisor® Mega Cap Stock Fund - Class A on June 30, 2004, and the current 5.75% sales charge was paid. The chart shows how the value of your investment would have changed, and also shows how the S&P 500® Index performed over the same period. See footnote A on the previous page for additional information regarding the performance of Class A.
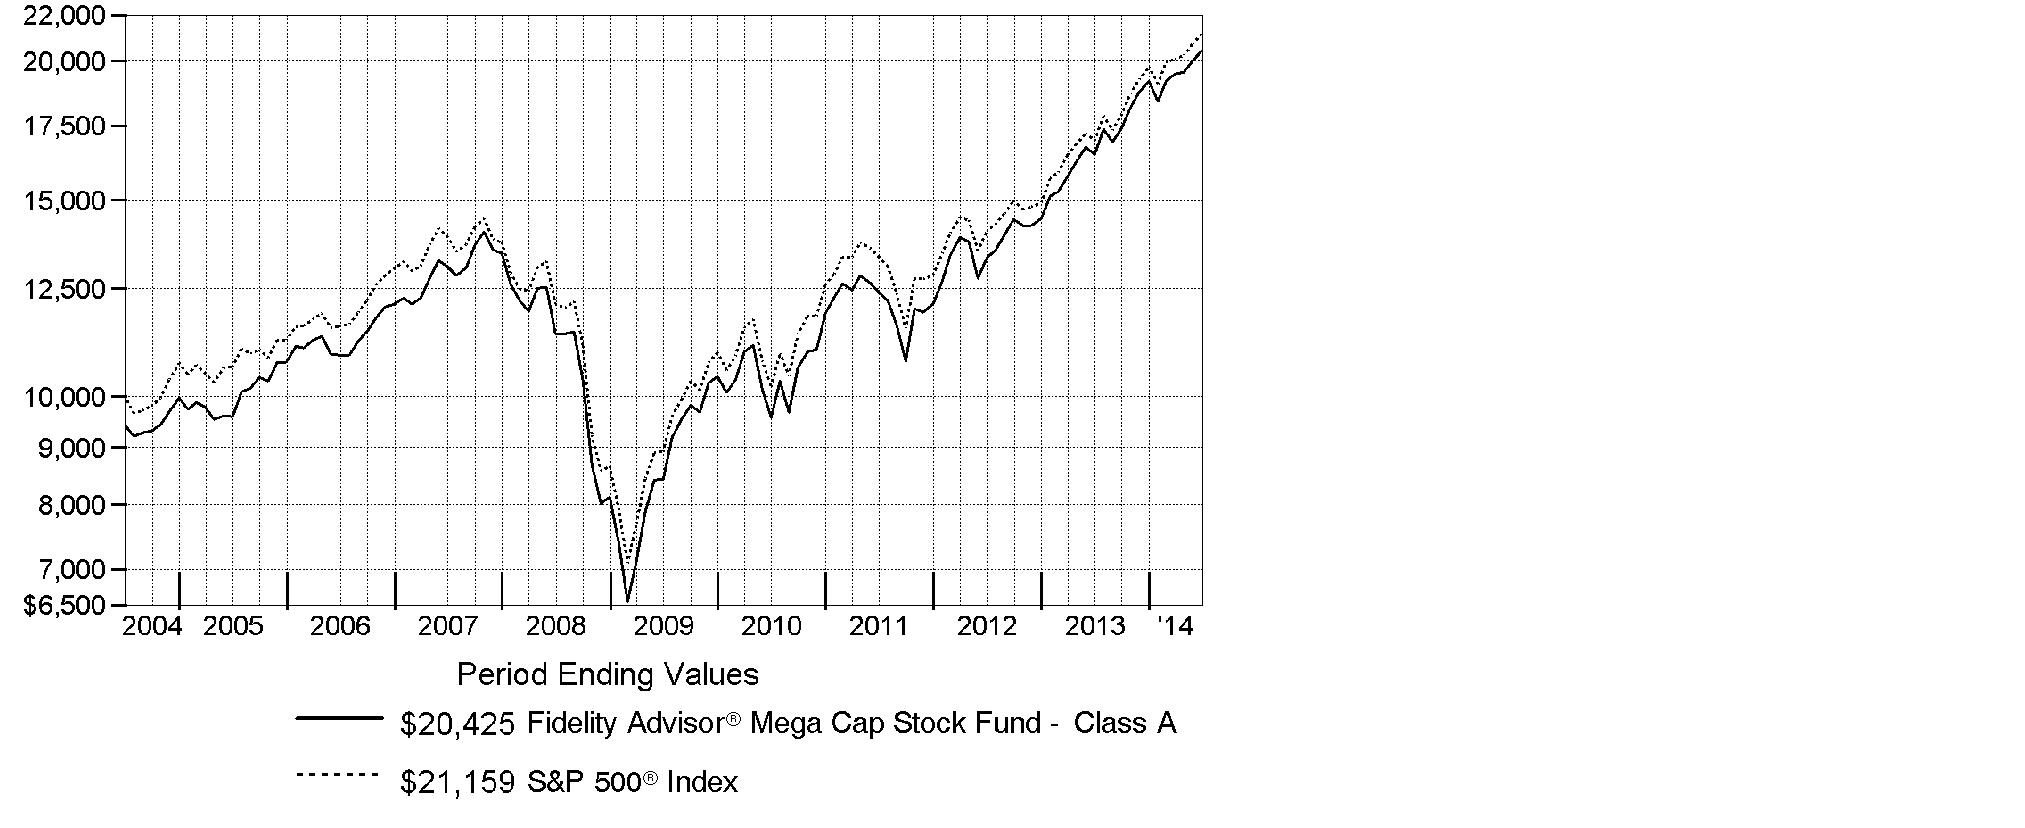
Annual Report
Market Recap: Despite intermittent volatility driven by geopolitical concerns, stocks posted a series of new highs during the 12 months ending June 30, 2014, amid a decidedly favorable environment for riskier assets. The S&P 500® Index rose 24.61% for the year, helped by a rise in consumer spending and the lowest unemployment rate since 2008. The U.S. Federal Reserve balanced stimulus reductions with continued low interest rates, aiding a broad advance. All 10 S&P 500® market sectors gained, seven by more than 20%. Materials (+33%) was tops, as investors seemed to anticipate sustained economic improvement and renewed infrastructure build-outs. Information technology (+32%) benefited from large cash balances, rising dividends and stock buybacks, and a bevy of innovations. Health care (+30%) was aided by new drugs and predictable reimbursements. Conversely, the biggest laggard, telecommunication services (+5%), battled slow growth and stiff pricing competition. Across size and style segments: overall, investors showed some preference for large-cap stocks over small-caps and growth stocks over value, although market leadership rotated during the year. With the "risk-on" trade alive and well, the growth-oriented Nasdaq Composite Index® flourished, advancing 31.17%, while the blue-chip Dow Jones Industrial AverageSM delivered a more subdued 15.56% return.
Comments from Matthew Fruhan, Portfolio Manager of Fidelity Advisor® Mega Cap Stock Fund: For the year, the fund's Class A, Class T, Class B and Class C shares gained 23.88%, 23.54%, 22.82% and 22.90%, respectively (excluding sales charges). For comparison, the mega-cap proxy Russell Top 200® Index returned 24.69% and the S&P 500® Index advanced 24.61%. Relative to the Russell index, it hurt the most to overweight big-box retailer Target, which was among the fund's biggest holdings. The lingering effects of the firm's troubled expansion into Canada and a holiday-season credit breach continued to weigh on the stock, but this weak stretch allowed me to add notable exposure at a valuation I liked. In January, I established an underweight stake in Facebook, which detracted as shares of the social-media giant outperformed. Stock selection and an overweight in financials detracted, including investment banks JPMorgan Chase and Citigroup, both of which were among the fund's largest holdings. Stock selection in consumer staples helped, including drugstore chain Walgreen, while an underweight in the underperforming shares of IBM added value.
Comments from Matthew Fruhan, Portfolio Manager of Fidelity Advisor® Mega Cap Stock Fund: For the year, the fund's Institutional Class shares gained 24.23%. By comparison, the mega-cap proxy Russell Top 200® Index returned 24.69% and the S&P 500® Index advanced 24.61%. Relative to the Russell index, it hurt the most to overweight big-box retailer Target, which was among the fund's biggest holdings. The lingering effects of the firm's troubled expansion into Canada and a holiday-season credit breach continued to weigh on the stock, but this weak stretch allowed me to add notable exposure at a valuation I liked. In January, I established an underweight stake in Facebook, which detracted as shares of the social-media giant outperformed. Stock selection and an overweight in financials detracted, including investment banks JPMorgan Chase and Citigroup, both of which were among the fund's largest holdings. Stock selection in consumer staples also helped, including drugstore chain Walgreen, while an underweight in the underperforming shares of IBM added value.
Annual Report
The views expressed above reflect those of the portfolio manager(s) only through the end of the period as stated on the cover of this report and do not necessarily represent the views of Fidelity or any other person in the Fidelity organization. Any such views are subject to change at any time based upon market or other conditions and Fidelity disclaims any responsibility to update such views. These views may not be relied on as investment advice and, because investment decisions for a Fidelity fund are based on numerous factors, may not be relied on as an indication of trading intent on behalf of any Fidelity fund.
Annual Report
Shareholder Expense Example
As a shareholder of the Fund, you incur two types of costs: (1) transaction costs, including sales charges (loads) on purchase payments or redemption proceeds, and (2) ongoing costs, including management fees, distribution and/or service (12b-1) fees and other Fund expenses. This Example is intended to help you understand your ongoing costs (in dollars) of investing in the Fund and to compare these costs with the ongoing costs of investing in other mutual funds.
The Example is based on an investment of $1,000 invested at the beginning of the period and held for the entire period (January 1, 2014 to June 30, 2014).
Actual Expenses
The first line of the accompanying table for each class of the Fund provides information about actual account values and actual expenses. You may use the information in this line, together with the amount you invested, to estimate the expenses that you paid over the period. Simply divide your account value by $1,000.00 (for example, an $8,600 account value divided by $1,000.00 = 8.6), then multiply the result by the number in the first line for a class of the Fund under the heading entitled "Expenses Paid During Period" to estimate the expenses you paid on your account during this period. A small balance maintenance fee of $12.00 that is charged once a year may apply for certain accounts with a value of less than $2,000. This fee is not included in the table below. If it was, the estimate of expenses you paid during the period would be higher, and your ending account value lower, by this amount. In addition, the Fund, as a shareholder in the underlying Fidelity Central Funds, will indirectly bear its pro-rata share of the fees and expenses incurred by the underlying Fidelity Central Funds. These fees and expenses are not included in the Fund's annualized expense ratio used to calculate the expense estimate in the table below.
Hypothetical Example for Comparison Purposes
The second line of the accompanying table for each class of the Fund provides information about hypothetical account values and hypothetical expenses based on a Class' actual expense ratio and an assumed rate of return of 5% per year before expenses, which is not the Class' actual return. The hypothetical account values and expenses may not be used to estimate the actual ending account balance or expenses you paid for the period. You may use this information to compare the ongoing costs of investing in the Fund and other funds. To do so, compare this 5% hypothetical example with the 5% hypothetical examples that appear in the shareholder reports of the other funds. A small balance maintenance fee of $12.00 that is charged once a year may apply for certain accounts with a value of less than $2,000. This fee is not included in the table below. If it was, the estimate of expenses you paid during the period would be higher, and your ending account value lower, by this amount. In addition, the Fund, as a shareholder in the underlying Fidelity Central Funds, will indirectly bear its pro-rata share of the fees and expenses incurred by the underlying Fidelity Central Funds. These fees and expenses are not included in the Fund's annualized expense ratio used to calculate the expense estimate in the table below.
Please note that the expenses shown in the table are meant to highlight your ongoing costs only and do not reflect any transaction costs. Therefore, the second line of the table is useful in comparing ongoing costs only, and will not help you determine the relative total costs of owning different funds. In addition, if these transactional costs were included, your costs would have been higher.
Annual Report
| Annualized
Expense Ratio B | Beginning
Account Value
January 1, 2014 | Ending
Account Value
June 30, 2014 | Expenses Paid
During Period*
January 1, 2014
to June 30, 2014 |
Class A | .95% | | | |
Actual | | $ 1,000.00 | $ 1,064.60 | $ 4.86 |
Hypothetical A | | $ 1,000.00 | $ 1,020.08 | $ 4.76 |
Class T | 1.21% | | | |
Actual | | $ 1,000.00 | $ 1,063.20 | $ 6.19 |
Hypothetical A | | $ 1,000.00 | $ 1,018.79 | $ 6.06 |
Class B | 1.75% | | | |
Actual | | $ 1,000.00 | $ 1,060.20 | $ 8.94 |
Hypothetical A | | $ 1,000.00 | $ 1,016.12 | $ 8.75 |
Class C | 1.70% | | | |
Actual | | $ 1,000.00 | $ 1,060.50 | $ 8.69 |
Hypothetical A | | $ 1,000.00 | $ 1,016.36 | $ 8.50 |
Mega Cap Stock | .68% | | | |
Actual | | $ 1,000.00 | $ 1,066.10 | $ 3.48 |
Hypothetical A | | $ 1,000.00 | $ 1,021.42 | $ 3.41 |
Institutional Class | .71% | | | |
Actual | | $ 1,000.00 | $ 1,065.70 | $ 3.64 |
Hypothetical A | | $ 1,000.00 | $ 1,021.27 | $ 3.56 |
Class Z | .53% | | | |
Actual | | $ 1,000.00 | $ 1,066.30 | $ 2.72 |
Hypothetical A | | $ 1,000.00 | $ 1,022.17 | $ 2.66 |
A 5% return per year before expenses
B Annualized expense ratio reflects expenses net of applicable fee waivers.
* Expenses are equal to each Class' annualized expense ratio, multiplied by the average account value over the period, multiplied by 181/365 (to reflect the one-half year period).
Annual Report
Investment Changes (Unaudited)
Top Ten Stocks as of June 30, 2014 |
| % of fund's
net assets | % of fund's net assets
6 months ago |
Apple, Inc. | 4.6 | 4.6 |
JPMorgan Chase & Co. | 4.2 | 4.3 |
Microsoft Corp. | 3.5 | 3.3 |
General Electric Co. | 3.1 | 3.3 |
Chevron Corp. | 2.6 | 2.2 |
Comcast Corp. Class A (special) (non-vtg.) | 2.5 | 2.0 |
Verizon Communications, Inc. | 2.3 | 1.2 |
Citigroup, Inc. | 2.3 | 2.6 |
Bank of America Corp. | 2.1 | 2.1 |
Target Corp. | 2.0 | 1.9 |
| 29.2 | |
Top Five Market Sectors as of June 30, 2014 |
| % of fund's
net assets | % of fund's net assets
6 months ago |
Information Technology | 23.4 | 22.6 |
Financials | 18.3 | 19.2 |
Energy | 12.0 | 12.3 |
Consumer Staples | 10.9 | 11.0 |
Health Care | 9.9 | 11.1 |
Asset Allocation (% of fund's net assets) |
As of June 30, 2014* | As of December 31, 2013** |
| Stocks 98.2% | | | Stocks 98.8% | |
| Convertible Securities 0.0% | | | Convertible Securities 0.1% | |
| Short-Term Investments
and Net Other Assets (Liabilities) 1.8% | | | Short-Term Investments
and Net Other Assets (Liabilities) 1.1% | |
* Foreign investments | 10.7% | | ** Foreign investments | 10.7% | |

Annual Report
Investments June 30, 2014
Showing Percentage of Net Assets
Common Stocks - 98.2% |
| Shares | | Value |
CONSUMER DISCRETIONARY - 9.3% |
Hotels, Restaurants & Leisure - 1.2% |
McDonald's Corp. | 152,600 | | $ 15,372,924 |
Yum! Brands, Inc. | 357,600 | | 29,037,120 |
| | 44,410,044 |
Media - 4.6% |
Comcast Corp. Class A (special) (non-vtg.) (d) | 1,674,100 | | 89,279,753 |
The Walt Disney Co. | 169,000 | | 14,490,060 |
Time Warner, Inc. | 784,900 | | 55,139,225 |
Twenty-First Century Fox, Inc. Class A | 193,500 | | 6,801,525 |
| | 165,710,563 |
Multiline Retail - 2.0% |
Target Corp. | 1,261,300 | | 73,092,335 |
Specialty Retail - 1.5% |
Lowe's Companies, Inc. | 1,149,600 | | 55,169,304 |
TOTAL CONSUMER DISCRETIONARY | | 338,382,246 |
CONSUMER STAPLES - 10.9% |
Beverages - 3.7% |
Diageo PLC | 500,803 | | 15,950,125 |
PepsiCo, Inc. | 432,905 | | 38,675,733 |
SABMiller PLC | 312,289 | | 18,107,213 |
The Coca-Cola Co. | 1,476,100 | | 62,527,596 |
| | 135,260,667 |
Food & Staples Retailing - 1.8% |
CVS Caremark Corp. | 389,100 | | 29,326,467 |
Walgreen Co. | 511,897 | | 37,946,925 |
| | 67,273,392 |
Food Products - 0.4% |
Kellogg Co. | 216,400 | | 14,217,480 |
Household Products - 1.8% |
Procter & Gamble Co. | 818,700 | | 64,341,633 |
Tobacco - 3.2% |
British American Tobacco PLC sponsored ADR | 519,400 | | 61,850,152 |
Philip Morris International, Inc. | 490,530 | | 41,356,584 |
Reynolds American, Inc. | 197,600 | | 11,925,160 |
| | 115,131,896 |
TOTAL CONSUMER STAPLES | | 396,225,068 |
Common Stocks - continued |
| Shares | | Value |
ENERGY - 12.0% |
Energy Equipment & Services - 1.4% |
National Oilwell Varco, Inc. | 124,100 | | $ 10,219,635 |
Schlumberger Ltd. | 344,800 | | 40,669,160 |
| | 50,888,795 |
Oil, Gas & Consumable Fuels - 10.6% |
Anadarko Petroleum Corp. | 76,400 | | 8,363,508 |
Apache Corp. | 412,505 | | 41,506,253 |
BG Group PLC | 1,699,000 | | 35,909,707 |
Canadian Natural Resources Ltd. | 568,600 | | 26,126,665 |
Chevron Corp. | 715,700 | | 93,434,635 |
Exxon Mobil Corp. | 358,271 | | 36,070,724 |
Imperial Oil Ltd. | 373,900 | | 19,703,291 |
Occidental Petroleum Corp. | 521,300 | | 53,501,019 |
Suncor Energy, Inc. | 948,700 | | 40,453,446 |
The Williams Companies, Inc. | 510,200 | | 29,698,742 |
| | 384,767,990 |
TOTAL ENERGY | | 435,656,785 |
FINANCIALS - 18.3% |
Banks - 12.5% |
Bank of America Corp. | 5,029,700 | | 77,306,489 |
Citigroup, Inc. | 1,809,370 | | 85,221,327 |
JPMorgan Chase & Co. | 2,701,500 | | 155,660,430 |
PNC Financial Services Group, Inc. | 239,800 | | 21,354,190 |
Standard Chartered PLC (United Kingdom) | 1,566,208 | | 32,004,076 |
U.S. Bancorp | 732,800 | | 31,744,896 |
Wells Fargo & Co. | 1,022,730 | | 53,754,689 |
| | 457,046,097 |
Capital Markets - 3.1% |
BlackRock, Inc. Class A | 19,000 | | 6,072,400 |
Charles Schwab Corp. | 982,100 | | 26,447,953 |
Goldman Sachs Group, Inc. | 22,700 | | 3,800,888 |
Morgan Stanley, Inc. | 1,186,000 | | 38,343,380 |
State Street Corp. | 568,900 | | 38,264,214 |
| | 112,928,835 |
Diversified Financial Services - 0.1% |
IntercontinentalExchange Group, Inc. | 10,500 | | 1,983,450 |
Insurance - 2.6% |
AIA Group Ltd. | 92,200 | | 463,355 |
Common Stocks - continued |
| Shares | | Value |
FINANCIALS - continued |
Insurance - continued |
American International Group, Inc. | 637,100 | | $ 34,772,918 |
Marsh & McLennan Companies, Inc. | 213,580 | | 11,067,716 |
MetLife, Inc. | 849,095 | | 47,175,718 |
Ping An Insurance (Group) Co. of China Ltd. (H Shares) | 101,500 | | 785,766 |
| | 94,265,473 |
TOTAL FINANCIALS | | 666,223,855 |
HEALTH CARE - 9.9% |
Biotechnology - 1.3% |
Amgen, Inc. | 318,690 | | 37,723,335 |
Biogen Idec, Inc. (a) | 34,200 | | 10,783,602 |
| | 48,506,937 |
Health Care Equipment & Supplies - 0.8% |
Abbott Laboratories | 465,100 | | 19,022,590 |
Stryker Corp. | 96,100 | | 8,103,152 |
| | 27,125,742 |
Health Care Providers & Services - 2.5% |
Express Scripts Holding Co. (a) | 318,907 | | 22,109,822 |
McKesson Corp. | 202,400 | | 37,688,904 |
UnitedHealth Group, Inc. | 400,048 | | 32,703,924 |
| | 92,502,650 |
Life Sciences Tools & Services - 0.3% |
Thermo Fisher Scientific, Inc. | 94,500 | | 11,151,000 |
Pharmaceuticals - 5.0% |
AbbVie, Inc. | 243,900 | | 13,765,716 |
GlaxoSmithKline PLC sponsored ADR | 619,000 | | 33,104,120 |
Johnson & Johnson | 565,900 | | 59,204,458 |
Merck & Co., Inc. | 477,300 | | 27,611,805 |
Novartis AG sponsored ADR | 170,400 | | 15,426,312 |
Sanofi SA | 80,024 | | 8,505,715 |
Teva Pharmaceutical Industries Ltd. sponsored ADR | 487,200 | | 25,539,024 |
| | 183,157,150 |
TOTAL HEALTH CARE | | 362,443,479 |
INDUSTRIALS - 9.4% |
Aerospace & Defense - 1.9% |
Honeywell International, Inc. | 118,700 | | 11,033,165 |
Common Stocks - continued |
| Shares | | Value |
INDUSTRIALS - continued |
Aerospace & Defense - continued |
The Boeing Co. | 309,000 | | $ 39,314,070 |
United Technologies Corp. | 176,200 | | 20,342,290 |
| | 70,689,525 |
Air Freight & Logistics - 1.8% |
FedEx Corp. | 117,800 | | 17,832,564 |
United Parcel Service, Inc. Class B | 475,000 | | 48,763,500 |
| | 66,596,064 |
Industrial Conglomerates - 3.4% |
Danaher Corp. | 146,570 | | 11,539,456 |
General Electric Co. | 4,323,800 | | 113,629,464 |
| | 125,168,920 |
Machinery - 0.3% |
Caterpillar, Inc. | 86,500 | | 9,399,955 |
Road & Rail - 2.0% |
CSX Corp. | 1,160,700 | | 35,761,167 |
Norfolk Southern Corp. | 207,800 | | 21,409,634 |
Union Pacific Corp. | 148,190 | | 14,781,953 |
| | 71,952,754 |
TOTAL INDUSTRIALS | | 343,807,218 |
INFORMATION TECHNOLOGY - 23.4% |
Communications Equipment - 3.1% |
Cisco Systems, Inc. | 2,773,400 | | 68,918,990 |
QUALCOMM, Inc. | 531,900 | | 42,126,480 |
| | 111,045,470 |
Internet Software & Services - 4.2% |
Facebook, Inc. Class A (a) | 103,597 | | 6,971,042 |
Google, Inc.: | | | |
Class A (a) | 109,350 | | 63,933,665 |
Class C (a) | 95,750 | | 55,083,060 |
Yahoo!, Inc. (a) | 781,639 | | 27,458,978 |
| | 153,446,745 |
IT Services - 3.8% |
Accenture PLC Class A | 69,100 | | 5,586,044 |
Cognizant Technology Solutions Corp. Class A (a) | 523,400 | | 25,599,494 |
IBM Corp. | 156,000 | | 28,278,120 |
Common Stocks - continued |
| Shares | | Value |
INFORMATION TECHNOLOGY - continued |
IT Services - continued |
MasterCard, Inc. Class A | 555,900 | | $ 40,841,973 |
Visa, Inc. Class A | 187,100 | | 39,423,841 |
| | 139,729,472 |
Semiconductors & Semiconductor Equipment - 1.4% |
Applied Materials, Inc. | 699,625 | | 15,776,544 |
Broadcom Corp. Class A | 973,036 | | 36,119,096 |
| | 51,895,640 |
Software - 5.3% |
Adobe Systems, Inc. (a) | 253,200 | | 18,321,552 |
Microsoft Corp. | 3,024,500 | | 126,121,650 |
Oracle Corp. | 899,900 | | 36,472,947 |
salesforce.com, Inc. (a) | 199,200 | | 11,569,536 |
| | 192,485,685 |
Technology Hardware, Storage & Peripherals - 5.6% |
Apple, Inc. | 1,808,507 | | 168,064,558 |
EMC Corp. | 1,051,000 | | 27,683,340 |
First Data Holdings, Inc. Class B (e) | 2,429,231 | | 9,716,924 |
| | 205,464,822 |
TOTAL INFORMATION TECHNOLOGY | | 854,067,834 |
MATERIALS - 2.7% |
Chemicals - 2.1% |
E.I. du Pont de Nemours & Co. | 333,900 | | 21,850,416 |
Monsanto Co. | 315,310 | | 39,331,769 |
Syngenta AG (Switzerland) | 43,089 | | 15,919,199 |
| | 77,101,384 |
Metals & Mining - 0.6% |
Freeport-McMoRan Copper & Gold, Inc. | 538,000 | | 19,637,000 |
TOTAL MATERIALS | | 96,738,384 |
TELECOMMUNICATION SERVICES - 2.3% |
Diversified Telecommunication Services - 2.3% |
Verizon Communications, Inc. | 1,743,725 | | 85,320,464 |
TOTAL COMMON STOCKS (Cost $2,718,899,411) |
3,578,865,333
|
Money Market Funds - 2.6% |
| Shares | | Value |
Fidelity Cash Central Fund, 0.11% (b) | 74,761,932 | | $ 74,761,932 |
Fidelity Securities Lending Cash Central Fund, 0.10% (b)(c) | 22,517,000 | | 22,517,000 |
TOTAL MONEY MARKET FUNDS (Cost $97,278,932) |
97,278,932
|
TOTAL INVESTMENT PORTFOLIO - 100.8% (Cost $2,816,178,343) | | 3,676,144,265 |
NET OTHER ASSETS (LIABILITIES) - (0.8)% | | (30,832,045) |
NET ASSETS - 100% | $ 3,645,312,220 |
Legend |
(a) Non-income producing |
(b) Affiliated fund that is generally available only to investment companies and other accounts managed by Fidelity Investments. The rate quoted is the annualized seven-day yield of the fund at period end. A complete unaudited listing of the fund's holdings as of its most recent quarter end is available upon request. In addition, each Fidelity Central Fund's financial statements, which are not covered by the Fund's Report of Independent Registered Public Accounting Firm, are available on the SEC's website or upon request. |
(c) Investment made with cash collateral received from securities on loan. |
(d) Security or a portion of the security is on loan at period end. |
(e) Restricted securities - Investment in securities not registered under the Securities Act of 1933 (excluding 144A issues). At the end of the period, the value of restricted securities (excluding 144A issues) amounted to $9,716,924 or 0.3% of net assets. |
Additional information on each restricted holding is as follows: |
Security | Acquisition Date | Acquisition Cost |
First Data Holdings, Inc. Class B | 6/26/14 | $ 9,716,924 |
Affiliated Central Funds |
Information regarding fiscal year to date income earned by the Fund from investments in Fidelity Central Funds is as follows: |
Fund | Income earned |
Fidelity Cash Central Fund | $ 27,717 |
Fidelity Securities Lending Cash Central Fund | 89,556 |
Total | $ 117,273 |
Other Information |
The following is a summary of the inputs used, as of June 30, 2014, involving the Fund's assets and liabilities carried at fair value. The inputs or methodology used for valuing securities may not be an indication of the risk associated with investing in those securities. For more information on valuation inputs, and their aggregation into the levels used in the table below, please refer to the Investment Valuation section in the accompanying Notes to Financial Statements. |
Valuation Inputs at Reporting Date: |
Description | Total | Level 1 | Level 2 | Level 3 |
Investments in Securities: | | | | |
Equities: | | | | |
Consumer Discretionary | $ 338,382,246 | $ 338,382,246 | $ - | $ - |
Consumer Staples | 396,225,068 | 380,274,943 | 15,950,125 | - |
Energy | 435,656,785 | 435,656,785 | - | - |
Financials | 666,223,855 | 666,223,855 | - | - |
Health Care | 362,443,479 | 353,937,764 | 8,505,715 | - |
Industrials | 343,807,218 | 343,807,218 | - | - |
Information Technology | 854,067,834 | 844,350,910 | - | 9,716,924 |
Materials | 96,738,384 | 80,819,185 | 15,919,199 | - |
Telecommunication Services | 85,320,464 | 85,320,464 | - | - |
Money Market Funds | 97,278,932 | 97,278,932 | - | - |
Total Investments in Securities: | $ 3,676,144,265 | $ 3,626,052,302 | $ 40,375,039 | $ 9,716,924 |
Distribution of investments by country or territory of incorporation, as a percentage of total net assets, is as follows (Unaudited): |
United States of America | 89.3% |
United Kingdom | 5.4% |
Canada | 2.4% |
Curacao | 1.1% |
Others (Individually Less Than 1%) | 1.8% |
| 100.0% |
See accompanying notes which are an integral part of the financial statements.
Annual Report
Statement of Assets and Liabilities
| June 30, 2014 |
| | |
Assets | | |
Investment in securities, at value (including securities loaned of $21,833,302) - See accompanying schedule: Unaffiliated issuers (cost $2,718,899,411) | $ 3,578,865,333 | |
Fidelity Central Funds (cost $97,278,932) | 97,278,932 | |
Total Investments (cost $2,816,178,343) | | $ 3,676,144,265 |
Receivable for investments sold | | 6,265,877 |
Receivable for fund shares sold | | 5,281,399 |
Dividends receivable | | 4,490,136 |
Distributions receivable from Fidelity Central Funds | | 19,236 |
Receivable from investment adviser for expense reductions | | 386 |
Other receivables | | 124,808 |
Total assets | | 3,692,326,107 |
| | |
Liabilities | | |
Payable for investments purchased | $ 19,178,333 | |
Payable for fund shares redeemed | 3,159,924 | |
Accrued management fee | 1,355,067 | |
Distribution and service plan fees payable | 36,521 | |
Other affiliated payables | 644,371 | |
Other payables and accrued expenses | 122,671 | |
Collateral on securities loaned, at value | 22,517,000 | |
Total liabilities | | 47,013,887 |
| | |
Net Assets | | $ 3,645,312,220 |
Net Assets consist of: | | |
Paid in capital | | $ 2,686,009,603 |
Undistributed net investment income | | 25,146,366 |
Accumulated undistributed net realized gain (loss) on investments and foreign currency transactions | | 74,183,358 |
Net unrealized appreciation (depreciation) on investments and assets and liabilities in foreign currencies | | 859,972,893 |
Net Assets | | $ 3,645,312,220 |
See accompanying notes which are an integral part of the financial statements.
Annual Report
Financial Statements - continued
Statement of Assets and Liabilities - continued
| June 30, 2014 |
| | |
Calculation of Maximum Offering Price Class A:
Net Asset Value and redemption price per share ($77,335,409 ÷ 4,739,947 shares) | | $ 16.32 |
| | |
Maximum offering price per share (100/94.25 of $16.32) | | $ 17.32 |
Class T:
Net Asset Value and redemption price per share ($15,728,415 ÷ 964,584 shares) | | $ 16.31 |
| | |
Maximum offering price per share (100/96.50 of $16.31) | | $ 16.90 |
Class B:
Net Asset Value and offering price per share ($918,549 ÷ 56,656 shares)A | | $ 16.21 |
| | |
Class C:
Net Asset Value and offering price per share ($16,599,716 ÷ 1,029,726 shares)A | | $ 16.12 |
| | |
Mega Cap Stock:
Net Asset Value, offering price and redemption price per share ($2,860,197,294 ÷ 173,984,386 shares) | | $ 16.44 |
| | |
Institutional Class:
Net Asset Value, offering price and redemption price per share ($674,415,747 ÷ 41,154,574 shares) | | $ 16.39 |
| | |
Class Z:
Net Asset Value, offering price and redemption price per share ($117,090 ÷ 7,138 shares) | | $ 16.40 |
A Redemption price per share is equal to net asset value less any applicable contingent deferred sales charge.
See accompanying notes which are an integral part of the financial statements.
Annual Report
Statement of Operations
| Year ended June 30, 2014 |
| | |
Investment Income | | |
Dividends | | $ 64,598,075 |
Interest | | 3 |
Income from Fidelity Central Funds | | 117,273 |
Total income | | 64,715,351 |
| | |
Expenses | | |
Management fee | $ 13,636,133 | |
Transfer agent fees | 5,746,426 | |
Distribution and service plan fees | 284,809 | |
Accounting and security lending fees | 887,108 | |
Custodian fees and expenses | 71,971 | |
Independent trustees' compensation | 12,515 | |
Registration fees | 231,217 | |
Audit | 55,093 | |
Legal | 11,095 | |
Interest | 2,824 | |
Miscellaneous | 22,803 | |
Total expenses before reductions | 20,961,994 | |
Expense reductions | (36,926) | 20,925,068 |
Net investment income (loss) | | 43,790,283 |
Realized and Unrealized Gain (Loss) Net realized gain (loss) on: | | |
Investment securities: | | |
Unaffiliated issuers | 143,561,768 | |
Foreign currency transactions | (8,194) | |
Total net realized gain (loss) | | 143,553,574 |
Change in net unrealized appreciation (depreciation) on: Investment securities | 457,006,470 | |
Assets and liabilities in foreign currencies | 12,169 | |
Total change in net unrealized appreciation (depreciation) | | 457,018,639 |
Net gain (loss) | | 600,572,213 |
Net increase (decrease) in net assets resulting from operations | | $ 644,362,496 |
See accompanying notes which are an integral part of the financial statements.
Annual Report
Financial Statements - continued
Statement of Changes in Net Assets
| Year ended
June 30,
2014 | Year ended
June 30,
2013 |
Increase (Decrease) in Net Assets | | |
Operations | | |
Net investment income (loss) | $ 43,790,283 | $ 35,288,813 |
Net realized gain (loss) | 143,553,574 | 104,876,418 |
Change in net unrealized appreciation (depreciation) | 457,018,639 | 321,854,450 |
Net increase (decrease) in net assets resulting
from operations | 644,362,496 | 462,019,681 |
Distributions to shareholders from net investment income | (35,705,336) | (27,575,489) |
Distributions to shareholders from net realized gain | (41,770,691) | - |
Total distributions | (77,476,027) | (27,575,489) |
Share transactions - net increase (decrease) | 513,653,074 | 652,982,078 |
Total increase (decrease) in net assets | 1,080,539,543 | 1,087,426,270 |
| | |
Net Assets | | |
Beginning of period | 2,564,772,677 | 1,477,346,407 |
End of period (including undistributed net investment income of $25,146,366 and undistributed net investment income of $17,061,419, respectively) | $ 3,645,312,220 | $ 2,564,772,677 |
See accompanying notes which are an integral part of the financial statements.
Annual Report
Financial Highlights - Class A
Years ended June 30, | 2014 | 2013 | 2012 | 2011 | 2010 |
Selected Per-Share Data | | | | | |
Net asset value, beginning of period | $ 13.51 | $ 11.05 | $ 10.37 | $ 8.07 | $ 7.20 |
Income from Investment Operations | | | | | |
Net investment income (loss) C | .18 | .17 | .13 | .07 | .06 |
Net realized and unrealized gain (loss) | 3.00 | 2.43 | .64 | 2.28 | .92 |
Total from investment operations | 3.18 | 2.60 | .77 | 2.35 | .98 |
Distributions from net investment income | (.16) | (.14) | (.09) | (.05) | (.11) |
Distributions from net realized gain | (.21) | - | - | - | - |
Total distributions | (.37) | (.14) | (.09) | (.05) | (.11) |
Net asset value, end of period | $ 16.32 | $ 13.51 | $ 11.05 | $ 10.37 | $ 8.07 |
Total ReturnA, B | 23.88% | 23.78% | 7.57% | 29.23% | 13.65% |
Ratios to Average Net Assets D, F | | | | | |
Expenses before reductions | .96% | .98% | 1.02% | 1.06% | 1.10% |
Expenses net of fee waivers, if any | .96% | .98% | 1.02% | 1.06% | 1.10% |
Expenses net of all reductions | .96% | .98% | 1.02% | 1.06% | 1.10% |
Net investment income (loss) | 1.19% | 1.37% | 1.28% | .76% | .66% |
Supplemental Data | | | | | |
Net assets, end of period (000 omitted) | $ 77,335 | $ 20,336 | $ 8,527 | $ 4,169 | $ 2,238 |
Portfolio turnover rateE | 28% | 29% | 57% | 53% | 97% |
A Total returns would have been lower if certain expenses had not been reduced during the applicable periods shown.
B Total returns do not include the effect of the sales charges.
C Calculated based on average shares outstanding during the period.
D Fees and expenses of any underlying Fidelity Central Funds are not included in the Fund's expense ratio. The Fund indirectly bears its proportionate share of the expenses of any underlying Fidelity Central Funds.
E Amount does not include the portfolio activity of any underlying Fidelity Central Funds.
F Expense ratios reflect operating expenses of the class. Expenses before reductions do not reflect amounts reimbursed by the investment adviser or reductions from brokerage service arrangements or reductions from other expense offset arrangements and do not represent the amount paid by the class during periods when reimbursements or reductions occur. Expenses net of fee waivers reflect expenses after reimbursement by the investment adviser but prior to reductions from brokerage service arrangements or other expense offset arrangements. Expenses net of all reductions represent the net expenses paid by the class.
See accompanying notes which are an integral part of the financial statements.
Annual Report
Financial Highlights - Class T
Years ended June 30, | 2014 | 2013 | 2012 | 2011 | 2010 |
Selected Per-Share Data | | | | | |
Net asset value, beginning of period | $ 13.51 | $ 11.05 | $ 10.38 | $ 8.07 | $ 7.20 |
Income from Investment Operations | | | | | |
Net investment income (loss) C | .14 | .14 | .10 | .05 | .03 |
Net realized and unrealized gain (loss) | 3.00 | 2.43 | .64 | 2.29 | .93 |
Total from investment operations | 3.14 | 2.57 | .74 | 2.34 | .96 |
Distributions from net investment income | (.13) | (.11) | (.07) | (.03) | (.09) |
Distributions from net realized gain | (.21) | - | - | - | - |
Total distributions | (.34) | (.11) | (.07) | (.03) | (.09) |
Net asset value, end of period | $ 16.31 | $ 13.51 | $ 11.05 | $ 10.38 | $ 8.07 |
Total ReturnA, B | 23.54% | 23.44% | 7.19% | 29.08% | 13.32% |
Ratios to Average Net Assets D, F | | | | | |
Expenses before reductions | 1.22% | 1.26% | 1.32% | 1.32% | 1.36% |
Expenses net of fee waivers, if any | 1.22% | 1.26% | 1.32% | 1.32% | 1.36% |
Expenses net of all reductions | 1.22% | 1.26% | 1.32% | 1.32% | 1.35% |
Net investment income (loss) | .92% | 1.09% | .98% | .50% | .41% |
Supplemental Data | | | | | |
Net assets, end of period (000 omitted) | $ 15,728 | $ 8,377 | $ 2,293 | $ 1,682 | $ 1,073 |
Portfolio turnover rateE | 28% | 29% | 57% | 53% | 97% |
A Total returns would have been lower if certain expenses had not been reduced during the applicable periods shown.
B Total returns do not include the effect of the sales charges.
C Calculated based on average shares outstanding during the period.
D Fees and expenses of any underlying Fidelity Central Funds are not included in the Fund's expense ratio. The Fund indirectly bears its proportionate share of the expenses of any underlying Fidelity Central Funds.
E Amount does not include the portfolio activity of any underlying Fidelity Central Funds.
F Expense ratios reflect operating expenses of the class. Expenses before reductions do not reflect amounts reimbursed by the investment adviser or reductions from brokerage service arrangements or reductions from other expense offset arrangements and do not represent the amount paid by the class during periods when reimbursements or reductions occur. Expenses net of fee waivers reflect expenses after reimbursement by the investment adviser but prior to reductions from brokerage service arrangements or other expense offset arrangements. Expenses net of all reductions represent the net expenses paid by the class.
See accompanying notes which are an integral part of the financial statements.
Annual Report
Financial Highlights - Class B
Years ended June 30, | 2014 | 2013 | 2012 | 2011 | 2010 |
Selected Per-Share Data | | | | | |
Net asset value, beginning of period | $ 13.43 | $ 10.97 | $ 10.30 | $ 8.02 | $ 7.19 |
Income from Investment Operations | | | | | |
Net investment income (loss) C | .06 | .07 | .05 | - H | (.01) |
Net realized and unrealized gain (loss) | 2.98 | 2.43 | .63 | 2.28 | .92 |
Total from investment operations | 3.04 | 2.50 | .68 | 2.28 | .91 |
Distributions from net investment income | (.04) | (.04) | (.01) | - | (.08) |
Distributions from net realized gain | (.21) | - | - | - | - |
Total distributions | (.26) I | (.04) | (.01) | - | (.08) |
Net asset value, end of period | $ 16.21 | $ 13.43 | $ 10.97 | $ 10.30 | $ 8.02 |
Total ReturnA, B | 22.82% | 22.83% | 6.62% | 28.43% | 12.60% |
Ratios to Average Net Assets D, G | | | | | |
Expenses before reductions | 1.78% | 1.80% | 1.82% | 1.83% | 1.88% |
Expenses net of fee waivers, if any | 1.78% | 1.80% | 1.82% | 1.83% | 1.88% |
Expenses net of all reductions | 1.78% | 1.80% | 1.81% | 1.82% | 1.88% |
Net investment income (loss) | .37% | .55% | .49% | .00% F | (.12)% |
Supplemental Data | | | | | |
Net assets, end of period (000 omitted) | $ 919 | $ 716 | $ 704 | $ 764 | $ 667 |
Portfolio turnover rateE | 28% | 29% | 57% | 53% | 97% |
A Total returns would have been lower if certain expenses had not been reduced during the applicable periods shown.
B Total returns do not include the effect of the contingent deferred sales charge.
C Calculated based on average shares outstanding during the period.
D Fees and expenses of any underlying Fidelity Central Funds are not included in the Fund's expense ratio. The Fund indirectly bears its proportionate share of the expenses of any underlying Fidelity Central Funds.
E Amount does not include the portfolio activity of any underlying Fidelity Central Funds.
F Amount represents less than .01%.
G Expense ratios reflect operating expenses of the class. Expenses before reductions do not reflect amounts reimbursed by the investment adviser or reductions from brokerage service arrangements or reductions from other expense offset arrangements and do not represent the amount paid by the class during periods when reimbursements or reductions occur. Expenses net of fee waivers reflect expenses after reimbursement by the investment adviser but prior to reductions from brokerage service arrangements or other expense offset arrangements. Expenses net of all reductions represent the net expenses paid by the class.
H Amount represents less than $.01 per share.
I Total distributions of $.26 per share is comprised of distributions from net investment income of $.044 and distributions from net realized gain of $.213 per share.
See accompanying notes which are an integral part of the financial statements.
Annual Report
Financial Highlights - Class C
Years ended June 30, | 2014 | 2013 | 2012 | 2011 | 2010 |
Selected Per-Share Data | | | | | |
Net asset value, beginning of period | $ 13.38 | $ 10.93 | $ 10.28 | $ 8.01 | $ 7.16 |
Income from Investment Operations | | | | | |
Net investment income (loss) C | .06 | .07 | .05 | - G | (.01) |
Net realized and unrealized gain (loss) | 2.97 | 2.42 | .64 | 2.27 | .92 |
Total from investment operations | 3.03 | 2.49 | .69 | 2.27 | .91 |
Distributions from net investment income | (.08) | (.04) | (.04) | - | (.06) |
Distributions from net realized gain | (.21) | - | - | - | - |
Total distributions | (.29) | (.04) | (.04) | - | (.06) |
Net asset value, end of period | $ 16.12 | $ 13.38 | $ 10.93 | $ 10.28 | $ 8.01 |
Total ReturnA, B | 22.90% | 22.83% | 6.74% | 28.34% | 12.72% |
Ratios to Average Net Assets D, F | | | | | |
Expenses before reductions | 1.71% | 1.75% | 1.79% | 1.81% | 1.86% |
Expenses net of fee waivers, if any | 1.71% | 1.75% | 1.79% | 1.81% | 1.86% |
Expenses net of all reductions | 1.71% | 1.75% | 1.79% | 1.81% | 1.85% |
Net investment income (loss) | .43% | .59% | .51% | .01% | (.10)% |
Supplemental Data | | | | | |
Net assets, end of period (000 omitted) | $ 16,600 | $ 7,938 | $ 2,845 | $ 1,913 | $ 807 |
Portfolio turnover rateE | 28% | 29% | 57% | 53% | 97% |
A Total returns would have been lower if certain expenses had not been reduced during the applicable periods shown.
B Total returns do not include the effect of the contingent deferred sales charge.
C Calculated based on average shares outstanding during the period.
D Fees and expenses of any underlying Fidelity Central Funds are not included in the Fund's expense ratio. The Fund indirectly bears its proportionate share of the expenses of any underlying Fidelity Central Funds.
E Amount does not include the portfolio activity of any underlying Fidelity Central Funds.
F Expense ratios reflect operating expenses of the class. Expenses before reductions do not reflect amounts reimbursed by the investment adviser or reductions from brokerage service arrangements or reductions from other expense offset arrangements and do not represent the amount paid by the class during periods when reimbursements or reductions occur. Expenses net of fee waivers reflect expenses after reimbursement by the investment adviser but prior to reductions from brokerage service arrangements or other expense offset arrangements. Expenses net of all reductions represent the net expenses paid by the class.
G Amount represents less than $.01 per share.
See accompanying notes which are an integral part of the financial statements.
Annual Report
Financial Highlights - Mega Cap Stock
Years ended June 30, | 2014 | 2013 | 2012 | 2011 | 2010 |
Selected Per-Share Data | | | | | |
Net asset value, beginning of period | $ 13.60 | $ 11.11 | $ 10.43 | $ 8.11 | $ 7.23 |
Income from Investment Operations | | | | | |
Net investment income (loss) B | .22 | .20 | .16 | .10 | .08 |
Net realized and unrealized gain (loss) | 3.02 | 2.46 | .64 | 2.29 | .93 |
Total from investment operations | 3.24 | 2.66 | .80 | 2.39 | 1.01 |
Distributions from net investment income | (.19) | (.17) | (.12) | (.07) | (.13) |
Distributions from net realized gain | (.21) | - | - | - | - |
Total distributions | (.40) | (.17) | (.12) | (.07) | (.13) |
Net asset value, end of period | $ 16.44 | $ 13.60 | $ 11.11 | $ 10.43 | $ 8.11 |
Total ReturnA | 24.18% | 24.17% | 7.83% | 29.61% | 13.93% |
Ratios to Average Net Assets C, E | | | | | |
Expenses before reductions | .68% | .70% | .76% | .79% | .81% |
Expenses net of fee waivers, if any | .68% | .70% | .76% | .79% | .80% |
Expenses net of all reductions | .68% | .70% | .75% | .78% | .79% |
Net investment income (loss) | 1.47% | 1.64% | 1.55% | 1.04% | .96% |
Supplemental Data | | | | | |
Net assets, end of period (000 omitted) | $ 2,860,197 | $ 2,214,592 | $ 1,287,144 | $ 785,233 | $ 500,407 |
Portfolio turnover rateD | 28% | 29% | 57% | 53% | 97% |
A Total returns would have been lower if certain expenses had not been reduced during the applicable periods shown.
B Calculated based on average shares outstanding during the period.
C Fees and expenses of any underlying Fidelity Central Funds are not included in the Fund's expense ratio. The Fund indirectly bears its proportionate share of the expenses of any underlying Fidelity Central Funds.
D Amount does not include the portfolio activity of any underlying Fidelity Central Funds.
E Expense ratios reflect operating expenses of the class. Expenses before reductions do not reflect amounts reimbursed by the investment adviser or reductions from brokerage service arrangements or reductions from other expense offset arrangements and do not represent the amount paid by the class during periods when reimbursements or reductions occur. Expenses net of fee waivers reflect expenses after reimbursement by the investment adviser but prior to reductions from brokerage service arrangements or other expense offset arrangements. Expenses net of all reductions represent the net expenses paid by the class.
See accompanying notes which are an integral part of the financial statements.
Annual Report
Financial Highlights - Institutional Class
Years ended June 30, | 2014 | 2013 | 2012 | 2011 | 2010 |
Selected Per-Share Data | | | | | |
Net asset value, beginning of period | $ 13.55 | $ 11.08 | $ 10.40 | $ 8.09 | $ 7.22 |
Income from Investment Operations | | | | | |
Net investment income (loss) B | .22 | .20 | .16 | .10 | .08 |
Net realized and unrealized gain (loss) | 3.02 | 2.44 | .63 | 2.30 | .92 |
Total from investment operations | 3.24 | 2.64 | .79 | 2.40 | 1.00 |
Distributions from net investment income | (.18) | (.17) | (.11) | (.09) | (.13) |
Distributions from net realized gain | (.21) | - | - | - | - |
Total distributions | (.40) F | (.17) | (.11) | (.09) | (.13) |
Net asset value, end of period | $ 16.39 | $ 13.55 | $ 11.08 | $ 10.40 | $ 8.09 |
Total ReturnA | 24.23% | 24.06% | 7.77% | 29.74% | 13.89% |
Ratios to Average Net Assets C, E | | | | | |
Expenses before reductions | .71% | .74% | .78% | .79% | .88% |
Expenses net of fee waivers, if any | .71% | .74% | .78% | .79% | .88% |
Expenses net of all reductions | .71% | .74% | .77% | .78% | .87% |
Net investment income (loss) | 1.43% | 1.61% | 1.53% | 1.04% | .88% |
Supplemental Data | | | | | |
Net assets, end of period (000 omitted) | $ 674,416 | $ 312,814 | $ 175,833 | $ 136,768 | $ 1,568 |
Portfolio turnover rateD | 28% | 29% | 57% | 53% | 97% |
A Total returns would have been lower if certain expenses had not been reduced during the applicable periods shown.
B Calculated based on average shares outstanding during the period.
C Fees and expenses of any underlying Fidelity Central Funds are not included in the Fund's expense ratio. The Fund indirectly bears its proportionate share of the expenses of any underlying Fidelity Central Funds.
D Amount does not include the portfolio activity of any underlying Fidelity Central Funds.
E Expense ratios reflect operating expenses of the class. Expenses before reductions do not reflect amounts reimbursed by the investment adviser or reductions from brokerage service arrangements or reductions from other expense offset arrangements and do not represent the amount paid by the class during periods when reimbursements or reductions occur. Expenses net of fee waivers reflect expenses after reimbursement by the investment adviser but prior to reductions from brokerage service arrangements or other expense offset arrangements. Expenses net of all reductions represent the net expenses paid by the class.
F Total distributions of $.40 per share is comprised of distributions from net investment income of $.182 and distributions from net realized gain of $.213 per share.
See accompanying notes which are an integral part of the financial statements.
Annual Report
Financial Highlights - Class Z
Year ended June 30, | 2014 G |
Selected Per-Share Data | |
Net asset value, beginning of period | $ 14.31 |
Income from Investment Operations | |
Net investment income (loss) D | .21 |
Net realized and unrealized gain (loss) | 2.20 |
Total from investment operations | 2.41 |
Distributions from net investment income | (.10) |
Distributions from net realized gain | (.21) |
Total distributions | (.32) I |
Net asset value, end of period | $ 16.40 |
Total ReturnB, C | 17.06% |
Ratios to Average Net Assets E, H | |
Expenses before reductions | .54%A |
Expenses net of fee waivers, if any | .54%A |
Expenses net of all reductions | .54%A |
Net investment income (loss) | 1.59% A |
Supplemental Data | |
Net assets, end of period (000 omitted) | $ 117 |
Portfolio turnover rateF | 28% A |
A Annualized
B Total returns for periods of less than one year are not annualized.
C Total returns would have been lower if certain expenses had not been reduced during the applicable periods shown.
D Calculated based on average shares outstanding during the period.
E Fees and expenses of any underlying Fidelity Central Funds are not included in the Fund's expense ratio. The Fund indirectly bears its proportionate share of the expenses of any underlying Fidelity Central Funds.
F Amount does not include the portfolio activity of any underlying Fidelity Central Funds.
G For the period August 13, 2013 (commencement of sale of shares) to June 30, 2014.
H Expense ratios reflect operating expenses of the class. Expenses before reductions do not reflect amounts reimbursed by the investment adviser or reductions from brokerage service arrangements or reductions from other expense offset arrangements and do not represent the amount paid by the class during periods when reimbursements or reductions occur. Expense ratios before reductions for start-up periods may not be representative of longer-term operation periods. Expenses net of fee waivers reflect expenses after reimbursement by the investment adviser but prior to reductions from brokerage service arrangements or other expense offset arrangements. Expenses net of all reductions represent the net expenses paid by the class.
I Total distributions of $.32 per share is comprised of distributions from net investment income of $.104 and distributions from net realized gain of $.213 per share.
See accompanying notes which are an integral part of the financial statements.
Annual Report
Notes to Financial Statements
For the period ended June 30, 2014
1. Organization.
Fidelity Mega Cap Stock Fund (the Fund) is a fund of Fidelity Hastings Street Trust (the Trust) and is authorized to issue an unlimited number of shares. The Trust is registered under the Investment Company Act of 1940, as amended (the 1940 Act), as an open-end management investment company organized as a Massachusetts business trust. The Fund commenced sale of Class Z shares on August 13, 2013. The Fund offers Class A, Class T, Class C, Mega Cap Stock, Institutional Class and Class Z shares, each of which, along with Class B shares, has equal rights as to assets and voting privileges. Class B shares are closed to new accounts and additional purchases, except for exchanges and reinvestments. Each class has exclusive voting rights with respect to matters that affect that class. Class B shares will automatically convert to Class A shares after a holding period of seven years from the initial date of purchase.
2. Investments in Fidelity Central Funds.
The Fund invests in Fidelity Central Funds, which are open-end investment companies generally available only to other investment companies and accounts managed by the investment adviser and its affiliates. The Fund's Schedule of Investments lists each of the Fidelity Central Funds held as of period end, if any, as an investment of the Fund, but does not include the underlying holdings of each Fidelity Central Fund. As an Investing Fund, the Fund indirectly bears its proportionate share of the expenses of the underlying Fidelity Central Funds.
The Money Market Central Funds seek preservation of capital and current income and are managed by Fidelity Investments Money Management, Inc. (FIMM), an affiliate of the investment adviser. Annualized expenses of the Money Market Central Funds as of their most recent shareholder report date are less than .01%.
A complete unaudited list of holdings for each Fidelity Central Fund is available upon request or at the Securities and Exchange Commission (the SEC) website at www.sec.gov. In addition, the financial statements of the Fidelity Central Funds, which are not covered by the Fund's Report of Independent Registered Public Accounting Firm, are available on the SEC website or upon request.
3. Significant Accounting Policies.
The financial statements have been prepared in conformity with accounting principles generally accepted in the United States of America (GAAP), which require management to make certain estimates and assumptions at the date of the financial statements. Actual results could differ from those estimates. Subsequent events, if any, through the date that the financial statements were issued have been evaluated in the preparation of the financial statements. The following summarizes the significant accounting policies of the Fund:
Annual Report
Notes to Financial Statements - continued
3. Significant Accounting Policies - continued
Investment Valuation. Investments are valued as of 4:00 p.m. Eastern time on the last calendar day of the period. In accordance with valuation policies and procedures approved by the Board of Trustees (the Board), the Fund attempts to obtain prices from one or more third party pricing vendors or brokers to value its investments. When current market prices, quotations or currency exchange rates are not readily available or reliable, investments will be fair valued in good faith by the Fidelity Management & Research Company (FMR) Fair Value Committee (the Committee), in accordance with procedures adopted by the Board. Factors used in determining fair value vary by investment type and may include market or investment specific events. The frequency with which these procedures are used cannot be predicted and they may be utilized to a significant extent. The Committee oversees the Fund's valuation policies and procedures and is responsible for approving and reporting to the Board all fair value determinations.
The Fund categorizes the inputs to valuation techniques used to value its investments into a disclosure hierarchy consisting of three levels as shown below:
Level 1 - quoted prices in active markets for identical investments
Level 2 - other significant observable inputs (including quoted prices for similar investments, interest rates, prepayment speeds, etc.)
Level 3 - unobservable inputs (including the Fund's own assumptions based on the best information available)
Valuation techniques used to value the Fund's investments by major category are as follows:
Equity securities, including restricted securities, for which market quotations are readily available, are valued at the last reported sale price or official closing price as reported by a third party pricing vendor on the primary market or exchange on which they are traded and are categorized as Level 1 in the hierarchy. In the event there were no sales during the day or closing prices are not available, securities are valued at the last quoted bid price or may be valued using the last available price and are generally categorized as Level 2 in the hierarchy. For foreign equity securities, when market or security specific events arise, comparisons to the valuation of American Depositary Receipts (ADRs), futures contracts, Exchange-Traded Funds (ETFs) and certain indexes as well as quoted prices for similar securities may be used and would be categorized as Level 2 in the hierarchy. Utilizing these techniques may result in transfers between Level 1 and Level 2. For equity securities, including restricted securities, where observable inputs are limited, assumptions about market activity and risk are used and these securities may be categorized as Level 3 in the hierarchy.
Annual Report
3. Significant Accounting Policies - continued
Investment Valuation - continued
Investments in open-end mutual funds, including the Fidelity Central Funds, are valued at their closing net asset value (NAV) each business day and are categorized as Level 1 in the hierarchy.
Changes in valuation techniques may result in transfers in or out of an assigned level within the disclosure hierarchy. The aggregate value of investments by input level, as of June 30, 2014 is included at the end of the Fund's Schedule of Investments.
Foreign Currency. The Fund may use foreign currency contracts to facilitate transactions in foreign-denominated securities. Gains and losses from these transactions may arise from changes in the value of the foreign currency or if the counterparties do not perform under the contracts' terms.
Foreign-denominated assets, including investment securities, and liabilities are translated into U.S. dollars at the exchange rates at period end. Purchases and sales of investment securities, income and dividends received and expenses denominated in foreign currencies are translated into U.S. dollars at the exchange rate in effect on the transaction date.
The effects of exchange rate fluctuations on investments are included with the net realized and unrealized gain (loss) on investment securities. Other foreign currency transactions resulting in realized and unrealized gain (loss) are disclosed separately.
Investment Transactions and Income. For financial reporting purposes, the Fund's investment holdings and NAV include trades executed through the end of the last business day of the period. The NAV per share for processing shareholder transactions is calculated as of the close of business of the New York Stock Exchange (NYSE), normally 4:00 p.m. Eastern time and includes trades executed through the end of the prior business day. Gains and losses on securities sold are determined on the basis of identified cost and may include proceeds received from litigation. Dividend income is recorded on the ex-dividend date, except for certain dividends from foreign securities where the ex-dividend date may have passed, which are recorded as soon as the Fund is informed of the ex-dividend date. Non-cash dividends included in dividend income, if any, are recorded at the fair market value of the securities received. Income and capital gain distributions from Fidelity Central Funds, if any, are recorded on the ex-dividend date. Distributions received on securities that represent a return of capital or capital gain are recorded as a reduction of cost of investments and/or as a realized gain. Subsequent to ex-dividend date the Fund determines the components of these distributions, based upon receipt of tax filings or other correspondence relating to the underlying investment. Interest income is accrued as earned and includes coupon interest and amortization of premium and accretion of discount on debt securities as applicable. Investment income is recorded net of foreign taxes withheld where recovery of such taxes is uncertain.
Annual Report
Notes to Financial Statements - continued
3. Significant Accounting Policies - continued
Class Allocations and Expenses. Investment income, realized and unrealized capital gains and losses, common expenses of the Fund, and certain fund-level expense reductions, if any, are allocated daily on a pro-rata basis to each class based on the relative net assets of each class to the total net assets of the Fund. Each class differs with respect to transfer agent and distribution and service plan fees incurred. Certain expense reductions may also differ by class. For the reporting period, the allocated portion of income and expenses to each class as a percent of its average net assets may vary due to the timing of recording these transactions in relation to fluctuating net assets of the classes. Expenses directly attributable to a fund are charged to that fund. Expenses attributable to more than one fund are allocated among the respective funds on the basis of relative net assets or other appropriate methods. Expense estimates are accrued in the period to which they relate and adjustments are made when actual amounts are known.
Income Tax Information and Distributions to Shareholders. Each year, the Fund intends to qualify as a regulated investment company under Subchapter M of the Internal Revenue Code, including distributing substantially all of its taxable income and realized gains. As a result, no provision for U.S. Federal income taxes is required. As of June 30, 2014, the Fund did not have any unrecognized tax benefits in the financial statements; nor is the Fund aware of any tax positions for which it is reasonably possible that the total amounts of unrecognized tax benefits will significantly change in the next twelve months. The Fund files a U.S. federal tax return, in addition to state and local tax returns as required. The Fund's federal income tax returns are subject to examination by the Internal Revenue Service (IRS) for a period of three fiscal years after they are filed. State and local tax returns may be subject to examination for an additional fiscal year depending on the jurisdiction. Foreign taxes are provided for based on the Fund's understanding of the tax rules and rates that exist in the foreign markets in which it invests.
Distributions are declared and recorded on the ex-dividend date. Income dividends and capital gain distributions are declared separately for each class. Income and capital gain distributions are determined in accordance with income tax regulations, which may differ from GAAP. In addition, the Fund claimed a portion of the payment made to redeeming shareholders as a distribution for income tax purposes.
Capital accounts within the financial statements are adjusted for permanent book-tax differences. These adjustments have no impact on net assets or the results of operations. Capital accounts are not adjusted for temporary book-tax differences which will reverse in a subsequent period.
Book-tax differences are primarily due to foreign currency transactions, equity-debt classifications, capital loss carryforwards, and losses deferred due to wash sales.
Annual Report
3. Significant Accounting Policies - continued
Income Tax Information and Distributions to Shareholders - continued
The federal tax cost of investment securities and unrealized appreciation (depreciation) as of period end were as follows:
Gross unrealized appreciation | $ 868,594,923 |
Gross unrealized depreciation | (16,059,631) |
Net unrealized appreciation (depreciation) on securities and other investments | $ 852,535,292 |
| |
Tax Cost | $ 2,823,608,973 |
The tax-based components of distributable earnings as of period end were as follows:
Undistributed ordinary income | $ 28,109,862 |
Undistributed long-term capital gain | $ 78,650,493 |
Net unrealized appreciation (depreciation) | $ 852,542,261 |
The tax character of distributions paid was as follows:
| June 30, 2014 | June 30, 2013 |
Ordinary Income | $ 36,293,656 | $ 27,575,489 |
Long-term Capital Gains | 41,182,371 |
|
Total | $ 77,476,027 | $ 27,575,489 |
Restricted Securities. The Fund may invest in securities that are subject to legal or contractual restrictions on resale. These securities generally may be resold in transactions exempt from registration or to the public if the securities are registered. Disposal of these securities may involve time-consuming negotiations and expense, and prompt sale at an acceptable price may be difficult. Information regarding restricted securities is included at the end of the Fund's Schedule of Investments.
4. Purchases and Sales of Investments.
Purchases and sales of securities, other than short-term securities, aggregated $1,277,032,508 and $853,056,484, respectively.
5. Fees and Other Transactions with Affiliates.
Management Fee. Fidelity Management & Research Company (the investment adviser) and its affiliates provide the Fund with investment management related services for which the Fund pays a monthly management fee. The management fee is the sum of an individual fund fee rate that is based on an annual rate of .20% of the Fund's
Annual Report
Notes to Financial Statements - continued
5. Fees and Other Transactions with Affiliates - continued
Management Fee - continued
average net assets and an annualized group fee rate that averaged .25% during the period. The group fee rate is based upon the average net assets of all the mutual funds advised by the investment adviser, including any mutual funds previously advised by the investment adviser that are currently advised by Fidelity SelectCo, LLC, an affiliate of the investment adviser. The group fee rate decreases as assets under management increase and increases as assets under management decrease. For the reporting period, the total annual management fee rate was .45% of the Fund's average net assets.
Distribution and Service Plan Fees. In accordance with Rule 12b-1 of the 1940 Act, the Fund has adopted separate Distribution and Service Plans for each class of shares. Certain classes pay Fidelity Distributors Corporation (FDC), an affiliate of the investment adviser, separate Distribution and Service Fees, each of which is based on an annual percentage of each class' average net assets. In addition, FDC may pay financial intermediaries for selling shares of the Fund and providing shareholder support services. For the period, the Distribution and Service Fee rates, total fees and amounts retained by FDC were as follows:
| Distribution
Fee | Service
Fee | Total Fees | Retained
by FDC |
Class A | -% | .25% | $ 87,546 | $ 3,362 |
Class T | .25% | .25% | 63,304 | 232 |
Class B | .75% | .25% | 9,175 | 6,896 |
Class C | .75% | .25% | 124,784 | 55,523 |
| | | $ 284,809 | $ 66,013 |
Sales Load. FDC may receive a front-end sales charge of up to 5.75% for selling Class A shares and 3.50% for selling Class T shares, some of which is paid to financial intermediaries for selling shares of the Fund. Depending on the holding period, FDC may receive contingent deferred sales charges levied on Class A, Class T, Class B, and Class C redemptions. The deferred sales charges range from 5.00% to 1.00% for Class B shares, 1.00% for Class C shares, 1.00% for certain purchases of Class A shares and .25% for certain purchases of Class T shares.
Annual Report
5. Fees and Other Transactions with Affiliates - continued
Sales Load - continued
For the period, sales charge amounts retained by FDC were as follows:
| Retained
by FDC |
Class A | $ 20,530 |
Class T | 3,915 |
Class B* | 699 |
Class C* | 897 |
| $ 26,041 |
* When Class B and Class C shares are initially sold, FDC pays commissions from its own resources to financial intermediaries through which the sales are made.
Transfer Agent Fees. Fidelity Investments Institutional Operations Company, Inc., (FIIOC), an affiliate of the investment adviser, is the transfer, dividend disbursing and shareholder servicing agent for each class of the Fund. FIIOC receives account fees and asset-based fees that vary according to the account size and type of account of the shareholders of the respective classes of the Fund, except for Class Z. FIIOC receives an asset-based fee of Class Z's average net assets. FIIOC pays for typesetting, printing and mailing of shareholder reports, except proxy statements.
For the period, transfer agent fees for each class were as follows:
| Amount | % of
Average
Net Assets |
Class A | $ 74,123 | .21 |
Class T | 28,367 | .22 |
Class B | 2,566 | .28 |
Class C | 26,868 | .22 |
Mega Cap Stock | 4,669,765 | .18 |
Institutional Class | 944,693 | .22 |
Class Z | 44 | .05* |
| $ 5,746,426 | |
* Annualized
Accounting and Security Lending Fees. Fidelity Service Company, Inc. (FSC), an affiliate of the investment adviser, maintains the Fund's accounting records. The accounting fee is based on the level of average net assets for each month. Under a separate contract, FSC administers the security lending program. The security lending fee is based on the number and duration of lending transactions.
Annual Report
Notes to Financial Statements - continued
5. Fees and Other Transactions with Affiliates - continued
Brokerage Commissions. The Fund placed a portion of its portfolio transactions with brokerage firms which are affiliates of the investment adviser. Brokerage commissions are included in net realized gain (loss) and change in net unrealized appreciation (depreciation) in the Statement of Operations. The commissions paid to these affiliated firms were $17,995 for the period.
Interfund Lending Program. Pursuant to an Exemptive Order issued by the SEC, the Fund, along with other registered investment companies having management contracts with FMR or other affiliated entities of FMR, may participate in an interfund lending program. This program provides an alternative credit facility allowing the funds to borrow from, or lend money to, other participating affiliated funds. At period end, there were no interfund loans outstanding. The Fund's activity in this program during the period for which loans were outstanding was as follows:
Borrower or Lender | Average Loan
Balance | Weighted Average Interest Rate | Interest
Expense |
Borrower | $ 9,205,303 | .30% | $ 2,541 |
6. Committed Line of Credit.
The Fund participates with other funds managed by the investment adviser FMR or an affiliate in a $4.25 billion credit facility (the "line of credit") to be utilized for temporary or emergency purposes to fund shareholder redemptions or for other short-term liquidity purposes. The Fund has agreed to pay commitment fees on its pro-rata portion of the line of credit, which amounted to $5,038 and is reflected in Miscellaneous expenses on the Statement of Operations. During the period, the Fund did not borrow on this line of credit.
7. Security Lending.
The Fund lends portfolio securities through a lending agent from time to time in order to earn additional income. For equity securities, a lending agent is used and may loan securities to certain qualified borrowers, including Fidelity Capital Markets (FCM), a broker-dealer affiliated with the Fund. On the settlement date of the loan, the Fund receives collateral (in the form of U.S. Treasury obligations, letters of credit and/or cash) against the loaned securities and maintains collateral in an amount not less than 100% of the market value of the loaned securities during the period of the loan. The market value of the loaned securities is determined at the close of business of the Fund and any additional required collateral is delivered to the Fund on the next business day. If the borrower defaults on its obligation to return the securities loaned because of insolvency or other reasons, the Fund may apply collateral received from the borrower against the obligation. The Fund may experience delays and costs in recovering the securities
Annual Report
7. Security Lending - continued
loaned. Any cash collateral received is invested in the Fidelity Securities Lending Cash Central Fund. The value of loaned securities and cash collateral at period end are disclosed on the Fund's Statement of Assets and Liabilities. Security lending income represents the income earned on investing cash collateral, less rebates paid to borrowers and any lending agent fees associated with the loan, plus any premium payments received for lending certain types of securities. Security lending income is presented in the Statement of Operations as a component of income from Fidelity Central Funds. Total security lending income during the period amounted to $89,556. During the period, there were no securities loaned to FCM.
8. Bank Borrowings.
The Fund is permitted to have bank borrowings for temporary or emergency purposes to fund shareholder redemptions or for other short-term liquidity requirements. The Fund has established borrowing arrangements with certain banks. The interest rate on the borrowings is the bank's base rate, as revised from time to time. The average loan balance during the period for which loans were outstanding amounted to $8,939,500. The weighted average interest rate was .57%. The interest expense amounted to $283 under the bank borrowing program. At period end, there were no bank borrowings outstanding.
9. Expense Reductions.
The investment adviser voluntarily agreed to reimburse each class to the extent annual operating expenses exceeded certain levels of average net assets as noted in the table below. Some expenses, for example interest expense, including commitment fees, are excluded from this reimbursement.
The following classes were in reimbursement during the period:
| Reimbursement |
Class A | $ 125 |
Class T | 56 |
Class B | 4 |
Class C | 50 |
Mega Cap Stock | 11,993 |
Institutional Class | 1,697 |
| $ 13,925 |
In addition, the investment adviser reimbursed a portion of the Fund's operating expenses during the period in the amount of $6,711.
Commissions paid to certain brokers with whom the investment adviser, or its affiliates, places trades on behalf of the Fund include an amount in addition to trade execution, which may be rebated back to the Fund to offset certain expenses. This amount totaled $16,290 for the period.
Annual Report
Notes to Financial Statements - continued
10. Distributions to Shareholders.
Distributions to shareholders of each class were as follows:
Years ended June 30, | 2014 A | 2013 |
From net investment income | | |
Class A | $ 295,572 | $ 137,534 |
Class T | 98,011 | 36,492 |
Class B | 2,617 | 2,304 |
Class C | 56,227 | 13,133 |
Mega Cap Stock | 30,989,923 | 23,359,421 |
Institutional Class | 4,262,259 | 4,026,605 |
Class Z | 727 | - |
Total | $ 35,705,336 | $ 27,575,489 |
From net realized gain | | |
Class A | $ 453,140 | $ - |
Class T | 181,208 | - |
Class B | 13,697 | - |
Class C | 173,595 | - |
Mega Cap Stock | 35,870,113 | - |
Institutional Class | 5,077,450 | - |
Class Z | 1,488 | - |
Total | $ 41,770,691 | $ - |
A Distributions for Class Z are for the period August 13, 2013 (commencement of sale of shares) to June 30, 2014.
11. Share Transactions.
Transactions for each class of shares were as follows:
| Shares | Dollars |
Years ended June 30, | 2014 A | 2013 | 2014 A | 2013 |
Class A | | | | |
Shares sold | 3,913,806 | 1,001,677 | $ 60,286,671 | $ 12,394,211 |
Reinvestment of distributions | 45,968 | 11,084 | 673,798 | 127,952 |
Shares redeemed | (725,328) | (279,053) | (11,077,893) | (3,495,724) |
Net increase (decrease) | 3,234,446 | 733,708 | $ 49,882,576 | $ 9,026,439 |
Class T | | | | |
Shares sold | 595,712 | 517,456 | $ 8,877,747 | $ 6,404,547 |
Reinvestment of distributions | 18,863 | 3,084 | 276,847 | 35,826 |
Shares redeemed | (270,157) | (107,959) | (4,055,631) | (1,368,248) |
Net increase (decrease) | 344,418 | 412,581 | $ 5,098,963 | $ 5,072,125 |
Annual Report
11. Share Transactions - continued
| Shares | Dollars |
Years ended June 30, | 2014 A | 2013 | 2014 A | 2013 |
Class B | | | | |
Shares sold | 27,198 | 9,952 | $ 400,691 | $ 125,476 |
Reinvestment of distributions | 1,081 | 196 | 15,861 | 2,261 |
Shares redeemed | (24,976) | (20,917) | (377,365) | (255,293) |
Net increase (decrease) | 3,303 | (10,769) | $ 39,187 | $ (127,556) |
Class C | | | | |
Shares sold | 504,584 | 448,373 | $ 7,460,222 | $ 5,664,292 |
Reinvestment of distributions | 15,230 | 988 | 221,741 | 11,494 |
Shares redeemed | (83,515) | (116,347) | (1,262,211) | (1,448,415) |
Net increase (decrease) | 436,299 | 333,014 | $ 6,419,752 | $ 4,227,371 |
Mega Cap Stock | | | | |
Shares sold | 53,817,396 | 84,998,537 | $ 817,611,772 | $ 1,035,668,817 |
Reinvestment of distributions | 4,142,626 | 1,836,891 | 61,008,516 | 21,294,763 |
Shares redeemed | (46,852,676) | (39,801,746) | (705,756,204) | (498,490,773) |
Net increase (decrease) | 11,107,346 | 47,033,682 | $ 172,864,084 | $ 558,472,807 |
Institutional Class | | | | |
Shares sold | 19,497,644 | 11,389,839 | $ 301,200,514 | $ 129,734,591 |
Reinvestment of distributions | 626,527 | 338,467 | 9,201,440 | 3,911,623 |
Shares redeemed | (2,047,800) | (4,517,962) | (31,155,657) | (57,335,322) |
Net increase (decrease) | 18,076,371 | 7,210,344 | $ 279,246,297 | $ 76,310,892 |
Class Z | | | | |
Shares sold | 6,988 | - | $ 100,000 | $ - |
Reinvestment of distributions | 150 | - | 2,215 | - |
Net increase (decrease) | 7,138 | - | $ 102,215 | $ - |
A Share transactions for Class Z are for the period August 13, 2013 (commencement of sale of shares) to June 30, 2014.
12. Other.
The Fund's organizational documents provide former and current trustees and officers with a limited indemnification against liabilities arising in connection with the performance of their duties to the Fund. In the normal course of business, the Fund may also enter into contracts that provide general indemnifications. The Fund's maximum exposure under these arrangements is unknown as this would be dependent on future claims that may be made against the Fund. The risk of material loss from such claims is considered remote.
At the end of the period, Strategic Advisers U.S. Opportunity Fund was the owner of record of approximately 11% of the total outstanding shares of the Fund.
Annual Report
To the Trustees of Fidelity Hastings Street Trust and the Shareholders of Fidelity Mega Cap Stock Fund:
In our opinion, the accompanying statement of assets and liabilities, including the schedule of investments, and the related statements of operations and of changes in net assets and the financial highlights present fairly, in all material respects, the financial position of Fidelity Mega Cap Stock Fund (a fund of Fidelity Hastings Street Trust) at June 30, 2014, the results of its operations for the year then ended, the changes in its net assets for each of the two years in the period then ended and the financial highlights for each of the periods indicated, in conformity with accounting principles generally accepted in the United States of America. These financial statements and financial highlights (hereafter referred to as "financial statements") are the responsibility of the Fidelity Mega Cap Stock Fund's management. Our responsibility is to express an opinion on these financial statements based on our audits. We conducted our audits of these financial statements in accordance with the standards of the Public Company Accounting Oversight Board (United States). Those standards require that we plan and perform the audit to obtain reasonable assurance about whether the financial statements are free of material misstatement. An audit includes examining, on a test basis, evidence supporting the amounts and disclosures in the financial statements, assessing the accounting principles used and significant estimates made by management, and evaluating the overall financial statement presentation. We believe that our audits, which included confirmation of securities at June 30, 2014 by correspondence with the custodian and brokers, provide a reasonable basis for our opinion.
PricewaterhouseCoopers LLP
Boston, Massachusetts
August 12, 2014
Annual Report
The Trustees, Member of the Advisory Board, and officers of the trust and fund, as applicable, are listed below. The Board of Trustees governs the fund and is responsible for protecting the interests of shareholders. The Trustees are experienced executives who meet periodically throughout the year to oversee the fund's activities, review contractual arrangements with companies that provide services to the fund, oversee management of the risks associated with such activities and contractual arrangements, and review the fund's performance. Except for James C. Curvey, each of the Trustees oversees 173 funds. Mr. Curvey oversees 397 funds.
The Trustees hold office without limit in time except that (a) any Trustee may resign; (b) any Trustee may be removed by written instrument, signed by at least two-thirds of the number of Trustees prior to such removal; (c) any Trustee who requests to be retired or who has become incapacitated by illness or injury may be retired by written instrument signed by a majority of the other Trustees; and (d) any Trustee may be removed at any special meeting of shareholders by a two-thirds vote of the outstanding voting securities of the trust. Each Trustee who is not an interested person (as defined in the 1940 Act) of the trust and the fund (Independent Trustee), shall retire not later than the last day of the calendar year in which his or her 75th birthday occurs. The Independent Trustees may waive this mandatory retirement age policy with respect to individual Trustees. The officers and Advisory Board Member hold office without limit in time, except that any officer and Advisory Board Member may resign or may be removed by a vote of a majority of the Trustees at any regular meeting or any special meeting of the Trustees. Except as indicated, each individual has held the office shown or other offices in the same company for the past five years.
Experience, Skills, Attributes, and Qualifications of the Fund's Trustees. The Governance and Nominating Committee has adopted a statement of policy that describes the experience, qualifications, attributes, and skills that are necessary and desirable for potential Independent Trustee candidates (Statement of Policy). The Board believes that each Trustee satisfied at the time he or she was initially elected or appointed a Trustee, and continues to satisfy, the standards contemplated by the Statement of Policy. The Governance and Nominating Committee also engages professional search firms to help identify potential Independent Trustee candidates who have the experience, qualifications, attributes, and skills consistent with the Statement of Policy. From time to time, additional criteria based on the composition and skills of the current Independent Trustees, as well as experience or skills that may be appropriate in light of future changes to board composition, business conditions, and regulatory or other developments, have also been considered by the professional search firms and the Governance and Nominating Committee. In addition, the Board takes into account the Trustees' commitment and participation in Board and committee meetings, as well as their leadership of standing and ad hoc committees throughout their tenure.
In determining that a particular Trustee was and continues to be qualified to serve as a Trustee, the Board has considered a variety of criteria, none of which, in isolation, was controlling. The Board believes that, collectively, the Trustees have balanced and diverse experience, qualifications, attributes, and skills, which allow the Board to operate effectively in governing the fund and protecting the interests of shareholders. Information about the specific experience, skills, attributes, and qualifications of each Trustee, which in each case led to the Board's conclusion that the Trustee should serve (or continue to serve) as a trustee of the fund, is provided below.
Annual Report
Board Structure and Oversight Function. James C. Curvey is an interested person (as defined in the 1940 Act) and currently serves as Chairman. The Trustees have determined that an interested Chairman is appropriate and benefits shareholders because an interested Chairman has a personal and professional stake in the quality and continuity of services provided to the fund. Independent Trustees exercise their informed business judgment to appoint an individual of their choosing to serve as Chairman, regardless of whether the Trustee happens to be independent or a member of management. The Independent Trustees have determined that they can act independently and effectively without having an Independent Trustee serve as Chairman and that a key structural component for assuring that they are in a position to do so is for the Independent Trustees to constitute a substantial majority for the Board. The Independent Trustees also regularly meet in executive session. Ned C. Lautenbach serves as Chairman of the Independent Trustees and as such (i) acts as a liaison between the Independent Trustees and management with respect to matters important to the Independent Trustees and (ii) with management prepares agendas for Board meetings.
Fidelity funds are overseen by different Boards of Trustees. The fund's Board oversees Fidelity's equity and high income funds and another Board oversees Fidelity's investment-grade bond, money market, and asset allocation funds. The asset allocation funds may invest in Fidelity funds overseen by the fund's Board. The use of separate Boards, each with its own committee structure, allows the Trustees of each group of Fidelity funds to focus on the unique issues of the funds they oversee, including common research, investment, and operational issues. On occasion, the separate Boards establish joint committees to address issues of overlapping consequences for the Fidelity funds overseen by each Board.
The Trustees operate using a system of committees to facilitate the timely and efficient consideration of all matters of importance to the Trustees, the fund, and fund shareholders and to facilitate compliance with legal and regulatory requirements and oversight of the fund's activities and associated risks. The Board, acting through its committees, has charged FMR and its affiliates with (i) identifying events or circumstances the occurrence of which could have demonstrably adverse effects on the fund's business and/or reputation; (ii) implementing processes and controls to lessen the possibility that such events or circumstances occur or to mitigate the effects of such events or circumstances if they do occur; and (iii) creating and maintaining a system designed to evaluate continuously business and market conditions in order to facilitate the identification and implementation processes described in (i) and (ii) above. Because the day-to-day operations and activities of the fund are carried out by or through FMR, its affiliates and other service providers, the fund's exposure to risks is mitigated but not eliminated by the processes overseen by the Trustees. While each of the Board's committees has responsibility for overseeing different aspects of the fund's activities, oversight is exercised primarily through the Operations, Audit, and Compliance Committees. In addition, the Independent Trustees have worked with FMR to enhance the Board's oversight of investment and financial risks, legal and regulatory risks, technology risks, and operational risks, including the development of additional risk reporting to the Board. For example, a working group comprised of Independent Trustees and FMR has worked and continues to work to review the Fidelity funds' valuation-related activities, reporting and risk management. Appropriate personnel, including but not limited to the fund's Chief Compliance Officer (CCO), FMR's internal auditor, the independent accountants, the fund's Treasurer and portfolio management personnel, make periodic reports to the Board's committees, as appropriate, including an annual review of FMR's risk management program for the Fidelity funds. The responsibilities of each standing committee, including their oversight responsibilities, are described further under "Standing Committees of the Fund's Trustees."
Annual Report
Trustees and Officers - continued
The fund's Statement of Additional Information (SAI) includes more information about the Trustees. To request a free copy, call Fidelity at 1-877-208-0098.
Interested Trustees*:
Correspondence intended for each Trustee who is an interested person may be sent to Fidelity Investments, 245 Summer Street, Boston, Massachusetts 02210.
Name, Year of Birth; Principal Occupations and Other Relevant Experience+ |
James C. Curvey (1935) |
Year of Election or Appointment: 2007 Trustee Chairman of the Board of Trustees |
| Mr. Curvey also serves as Trustee of other Fidelity funds. Mr. Curvey is a Director of Fidelity Research & Analysis Co. (2009-present), and Vice Chairman (2007-present) and Director of FMR LLC. In addition, Mr. Curvey serves as an Overseer for the Boston Symphony Orchestra and a member of the Trustees of Villanova University. Previously, Mr. Curvey served as a Director of Fidelity Investments Money Management, Inc. (2009-2014), a Director of FMR (2007-2014), a Director of FMR Co., Inc. (2007-2014) and was the Vice Chairman (2006-2007) and Director (2000-2007) of FMR Corp. |
Charles S. Morrison (1960) |
Year of Election or Appointment: 2014 Trustee |
| Mr. Morrison also serves as Trustee of other funds. He serves as President, Asset Management (2014-present) and is an employee of Fidelity Investments. Previously, Mr. Morrison served as Vice President of Fidelity's Fixed Income and Asset Allocation Funds (2012-2014), President, Fixed Income (2011-2014), Vice President of Fidelity's Money Market Funds (2005-2009), President, Money Market Group Leader of FMR (2009), and Senior Vice President, Money Market Group of FMR (2004-2009). Mr. Morrison also served as Vice President of Fidelity's Bond Funds (2002-2005), certain Balanced Funds (2002-2005), and certain Asset Allocation Funds (2002-2007), and as Senior Vice President (2002-2005) of Fidelity's Bond Division. |
* Trustees have been determined to be "Interested Trustees" by virtue of, among other things, their affiliation with the trust or various entities under common control with FMR.
+ The information above includes each Trustee's principal occupation during the last five years and other information relating to the experience, attributes, and skills relevant to each Trustee's qualifications to serve as a Trustee, which led to the conclusion that each Trustee should serve as a Trustee for the fund.
Annual Report
Trustees and Officers - continued
Independent Trustees:
Correspondence intended for each Independent Trustee (that is, the Trustees other than the Interested Trustees) may be sent to Fidelity Investments, P.O. Box 55235, Boston, Massachusetts 02205-5235.
Name, Year of Birth; Principal Occupations and Other Relevant Experience+ |
Dennis J. Dirks (1948) |
Year of Election or Appointment: 2005 Trustee |
| Mr. Dirks also serves as Trustee of other Fidelity funds. Prior to his retirement in May 2003, Mr. Dirks was Chief Operating Officer and a member of the Board of The Depository Trust & Clearing Corporation (DTCC). He also served as President, Chief Operating Officer, and Board member of The Depository Trust Company (DTC) and President and Board member of the National Securities Clearing Corporation (NSCC). In addition, Mr. Dirks served as Chief Executive Officer and Board member of the Government Securities Clearing Corporation, Chief Executive Officer and Board member of the Mortgage-Backed Securities Clearing Corporation, as a Trustee and a member of the Finance Committee of Manhattan College (2005-2008), and as a Trustee and a member of the Finance Committee of AHRC of Nassau County (2006-2008). Mr. Dirks is a member of the Independent Directors Council (IDC) Governing Council (2010-present) and Board of Directors for The Brookville Center for Children's Services, Inc. (2009-present). |
Alan J. Lacy (1953) |
Year of Election or Appointment: 2008 Trustee |
| Mr. Lacy also serves as Trustee of other Fidelity funds. Mr. Lacy serves as Senior Adviser (2007-present) of Oak Hill Capital Partners, L.P. (private equity). Mr. Lacy also served as Chief Executive Officer (2000-2005) and Vice Chairman (2005-2006) of Sears Holdings Corporation and Sears, Roebuck and Co. (retail). In addition, Mr. Lacy serves as a member of the Board of Directors of Dave & Buster's Entertainment, Inc. (restaurant and entertainment complexes, 2010-present), Earth Fare, Inc. (retail grocery, 2012-present), The Hillman Companies, Inc. (hardware wholesalers, 2010-present), and Bristol-Myers Squibb Company (global pharmaceuticals, 2008-present). Mr. Lacy is a member of the Board of Trustees of The National Parks Conservation Association (2006-present). Previously, Mr. Lacy served as Chairman of the Board of Trustees of the National Parks Conservation Association (2008-2011) and as a member of the Board of Directors for the Western Union Company (global money transfer, 2006-2011). |
Ned C. Lautenbach (1944) |
Year of Election or Appointment: 2000 Trustee Chairman of the Independent Trustees |
| Mr. Lautenbach also serves as Trustee of other Fidelity funds. Mr. Lautenbach currently serves as the Lead Director of the Eaton Corporation Board of Directors (diversified industrial, 1997-present). Mr. Lautenbach is Chairman of the Board of Directors of the Philharmonic Center for the Arts in Naples, Florida (2012-present) and a member of the Council on Foreign Relations (1994-present). Previously, Mr. Lautenbach was a Partner/Advisory Partner at Clayton, Dubilier & Rice, LLC (private equity investment, 1998-2010), as well as a Director of Sony Corporation (2006-2007). |
Joseph Mauriello (1944) |
Year of Election or Appointment: 2008 Trustee |
| Mr. Mauriello also serves as Trustee of other Fidelity funds. Prior to his retirement in January 2006, Mr. Mauriello served in numerous senior management positions including Deputy Chairman and Chief Operating Officer (2004-2005), and Vice Chairman of Financial Services (2002-2004) of KPMG LLP US (professional services, 1965-2005). Mr. Mauriello currently serves as a member of the Board of Directors of XL Group plc. (global insurance and re-insurance, 2006-present). Previously, Mr. Mauriello served as a Director of the Hamilton Funds of the Bank of New York (2006-2007) and of Arcadia Resources Inc. (health care services and products, 2007-2012). |
Robert W. Selander (1950) |
Year of Election or Appointment: 2011 Trustee |
| Mr. Selander also serves as Trustee of other Fidelity funds. Previously, Mr. Selander served as a Member of the Advisory Board of other Fidelity funds (2011), and Executive Vice Chairman (2010), Chief Executive Officer (2009-2010), and President and Chief Executive Officer (1997-2009) of Mastercard, Inc. |
Cornelia M. Small (1944) |
Year of Election or Appointment: 2005 Trustee |
| Ms. Small also serves as Trustee of other Fidelity funds. Ms. Small is a member of the Board of Directors (2009-present) and Chair of the Investment Committee (2010-present) of the Teagle Foundation. Ms. Small also serves on the Investment Committee of the Berkshire Taconic Community Foundation (2008-present). Previously, Ms. Small served as Chairperson (2002-2008) and a member of the Investment Committee and Chairperson (2008-2012) and a member of the Board of Trustees of Smith College. In addition, Ms. Small served as Chief Investment Officer, Director of Global Equity Investments, and a member of the Board of Directors of Scudder, Stevens & Clark and Scudder Kemper Investments. |
William S. Stavropoulos (1939) |
Year of Election or Appointment: 2001 Trustee Vice Chairman of the Independent Trustees |
| Mr. Stavropoulos also serves as Trustee of other Fidelity funds. Mr. Stavropoulos serves as President and Founder of the Michigan Baseball Foundation, the Great Lakes Loons (2007-present). Mr. Stavropoulos is Chairman Emeritus of the Board of Directors of The Dow Chemical Company, where he previously served in numerous senior management positions, including President, CEO (1995-2000; 2002-2004), Chairman of the Executive Committee (2000-2006), and as a member of the Board of Directors (1990-2006). Currently, Mr. Stavropoulos is Chairman of the Board of Directors of Univar Inc. (global distributor of commodity and specialty chemicals), a Director of Teradata Corporation (data warehousing and technology solutions), and Maersk Inc. (industrial conglomerate), and a member of the Advisory Board for Metalmark Capital LLC (private equity investment, 2005-present). Mr. Stavropoulos is an operating advisor to Clayton, Dubilier & Rice, LLC (private equity investment). In addition, Mr. Stavropoulos is a member of the University of Notre Dame Advisory Council for the College of Science, a Trustee of the Rollin L. Gerstacker Foundation, and a Director of the Naples Philharmonic Center for the Arts. Previously, Mr. Stavropoulos served as a Director of Chemical Financial Corporation (bank holding company, 1993-2012) and Tyco International, Ltd. (multinational manufacturing and services, 2007-2012). |
David M. Thomas (1949) |
Year of Election or Appointment: 2008 Trustee |
| Mr. Thomas also serves as Trustee of other Fidelity funds. Mr. Thomas serves as Non-Executive Chairman of the Board of Directors of Fortune Brands Home and Security (home and security products, 2011-present), and as a member of the Board of Directors of Interpublic Group of Companies, Inc. (marketing communication, 2004-present). Previously, Mr. Thomas served as Executive Chairman (2005-2006) and Chairman and Chief Executive Officer (2000-2005) of IMS Health, Inc. (pharmaceutical and healthcare information solutions), and a Director of Fortune Brands, Inc. (consumer products, 2000-2011). |
+ The information above includes each Trustee's principal occupation during the last five years and other information relating to the experience, attributes, and skills relevant to each Trustee's qualifications to serve as a Trustee, which led to the conclusion that each Trustee should serve as a Trustee for the fund.
Advisory Board Member and Officers:
Correspondence intended for each officer and Peter S. Lynch may be sent to Fidelity Investments, 245 Summer Street, Boston, Massachusetts 02210. Officers appear below in alphabetical order.
Name, Year of Birth; Principal Occupation |
Peter S. Lynch (1944) |
Year of Election or Appointment: 2003 Member of the Advisory Board |
| Mr. Lynch also serves as Member of the Advisory Board of other Fidelity funds. Mr. Lynch is Vice Chairman and a Director of FMR and FMR Co., Inc. In addition, Mr. Lynch serves as a Trustee of Boston College and as the Chairman of the Inner-City Scholarship Fund. Previously, Mr. Lynch served on the Special Olympics International Board of Directors (1997-2006). |
Elizabeth Paige Baumann (1968) |
Year of Election or Appointment: 2012 Anti-Money Laundering (AML) Officer |
| Ms. Baumann also serves as AML Officer of other funds. She is Chief AML Officer of FMR LLC (2012-present) and is an employee of Fidelity Investments. Previously, Ms. Baumann served as Vice President and Deputy Anti-Money Laundering Officer (2007-2012). |
William C. Coffey (1969) |
Year of Election or Appointment: 2009 Assistant Secretary |
| Mr. Coffey also serves as Assistant Secretary of other funds. He is Senior Vice President and Deputy General Counsel of FMR LLC (2010-present), and is an employee of Fidelity Investments. Previously, Mr. Coffey served as Vice President and Associate General Counsel of FMR LLC (2005-2009). |
Jonathan Davis (1968) |
Year of Election or Appointment: 2010 Assistant Treasurer |
| Mr. Davis also serves as Assistant Treasurer of other funds. Mr. Davis is an employee of Fidelity Investments. Previously, Mr. Davis served as Vice President and Associate General Counsel of FMR LLC (2003-2010). |
Adrien E. Deberghes (1967) |
Year of Election or Appointment: 2008 Deputy Treasurer |
| Mr. Deberghes also serves as an officer of other funds. He is an employee of Fidelity Investments (2008-present). Prior to joining Fidelity Investments, Mr. Deberghes was Senior Vice President of Mutual Fund Administration at State Street Corporation (2007-2008), Senior Director of Mutual Fund Administration at Investors Bank & Trust (2005-2007), and Director of Finance for Dunkin' Brands (2000-2005). |
Stephanie J. Dorsey (1969) |
Year of Election or Appointment: 2010 Assistant Treasurer |
| Ms. Dorsey also serves as an officer of other funds. She is an employee of Fidelity Investments (2008-present) and has served in other fund officer roles. Prior to joining Fidelity Investments, Ms. Dorsey served as Treasurer (2004-2008) of the JPMorgan Mutual Funds and Vice President (2004-2008) of JPMorgan Chase Bank. |
Howard J. Galligan III (1966) |
Year of Election or Appointment: 2014 Chief Financial Officer |
| Mr. Galligan also serves as Chief Financial Officer of other funds. Mr. Galligan serves as President of Fidelity Pricing and Cash Management Services (FPCMS) (2014-present) and as a Director of Strategic Advisers, Inc. (2008-present). Previously, Mr. Galligan served as Chief Administrative Officer of Asset Management (2011-2014) and Chief Operating Officer and Senior Vice President of Investment Support for Strategic Advisers, Inc. (2003-2011). |
Scott C. Goebel (1968) |
Year of Election or Appointment: 2008 Secretary and Chief Legal Officer (CLO) |
| Mr. Goebel serves as Secretary and CLO of other funds. Mr. Goebel also serves as Secretary of Fidelity SelectCo, LLC (2013-present), Fidelity Investments Money Management, Inc. (FIMM) (2010-present) and Fidelity Research and Analysis Company (FRAC) (2010-present); General Counsel, Secretary, and Senior Vice President of FMR (2008-present) and FMR Co., Inc. (2008-present); Chief Legal Officer of Fidelity Management & Research (Hong Kong) Limited (2008-present); and Assistant Secretary of Fidelity Management & Research (Japan) Inc. (2008-present) and Fidelity Management & Research (U.K.) Inc. (2008-present). Previously, Mr. Goebel served as Secretary and CLO of other Fidelity funds (2008-2013), Assistant Secretary of FIMM (2008-2010), FRAC (2008-2010), and certain funds (2007-2008); and as Vice President and Secretary of Fidelity Distributors Corporation (FDC) (2005-2007). Mr. Goebel has been employed by FMR LLC or an affiliate since 2001. |
Brian B. Hogan (1964) |
Year of Election or Appointment: 2009 Vice President |
| Mr. Hogan also serves as Trustee or Vice President of other funds. Mr. Hogan serves as President of FMR's Equity Division (2009-present). Previously, Mr. Hogan served as Senior Vice President, Equity Research of FMR (2006-2009) and as a portfolio manager. |
Chris Maher (1972) |
Year of Election or Appointment: 2013 Assistant Treasurer |
| Mr. Maher serves as Assistant Treasurer of other funds. Mr. Maher is Vice President of Valuation Oversight and is an employee of Fidelity Investments. Previously, Mr. Maher served as Vice President of Asset Management Compliance (2013), Vice President of FMR's Program Management Group (2010-2013), and Vice President of Valuation Oversight (2008-2010). |
Melissa M. Reilly (1971) |
Year of Election or Appointment: 2014 Vice President of certain Equity Funds |
| Ms. Reilly also serves as Vice President of other funds. Ms. Reilly is an employee of Fidelity Investments (2004-present). |
Kenneth B. Robins (1969) |
Year of Election or Appointment: 2008 President and Treasurer |
| Mr. Robins also serves as an officer of other funds. Mr. Robins serves as Executive Vice President of Fidelity Investments Money Management, Inc. (FIMM) (2013-present) and is an employee of Fidelity Investments (2004-present). Previously, Mr. Robins served in other fund officer roles. |
Stephen Sadoski (1971) |
Year of Election or Appointment: 2012 Deputy Treasurer |
| Mr. Sadoski also serves as Deputy Treasurer of other funds. He is an employee of Fidelity Investments (2012-present) and has served in another fund officer role. Prior to joining Fidelity Investments, Mr. Sadoski served as an assistant chief accountant in the Division of Investment Management of the Securities and Exchange Commission (SEC) (2009-2012) and as a senior manager at Deloitte & Touche LLP (1997-2009). |
Stacie M. Smith (1974) |
Year of Election or Appointment: 2013 Deputy Treasurer |
| Ms. Smith also serves as an officer of other funds. She is an employee of Fidelity Investments (2009-present) and has served in other fund officer roles. Prior to joining Fidelity Investments, Ms. Smith served as Senior Audit Manager of Ernst & Young LLP (1996-2009). |
Renee Stagnone (1975) |
Year of Election or Appointment: 2013 Deputy Treasurer |
| Ms. Stagnone also serves as Deputy Treasurer of other funds. Ms. Stagnone is an employee of Fidelity Investments. |
Linda J. Wondrack (1964) |
Year of Election or Appointment: 2014 Chief Compliance Officer |
| Ms. Wondrack also serves as Chief Compliance Officer of other funds. Ms. Wondrack is Executive Vice President and head of the Ethics Office and Asset Management Compliance for Fidelity Investments (2012-present). Ms. Wondrack also serves as Chief Compliance Officer of Fidelity SelectCo, LLC (2014-present); Chief Compliance Officer of Impresa Management LLC (2013-present); and Chief Compliance Officer of FMR Co., Inc., Fidelity Investments Money Management, Inc., Fidelity Management & Research (Japan) Inc., Fidelity Management & Research (U.K.) Inc., Fidelity Management & Research (Hong Kong), Fidelity Management & Research Company, Pyramis Global Advisors, LLC, and Strategic Advisers, Inc., Ballyrock Investment Advisors LLC, and Northern Neck Investors LLC (2012-present). Previously, Ms. Wondrack served as Senior Vice President and Chief Compliance Officer for Columbia Management Investment Advisers, LLC (2005-2012); Chief Compliance Officer for certain funds within the Columbia Family of Funds (2007-2012); and Senior Vice President of Compliance Risk Management at Bank of America (2005-2010). |
Joseph F. Zambello (1957) |
Year of Election or Appointment: 2011 Deputy Treasurer |
| Mr. Zambello also serves as Deputy Treasurer of other funds. Mr. Zambello is an employee of Fidelity Investments. Previously, Mr. Zambello served as Vice President of FMR's Program Management Group (2009-2011) and Vice President of the Transfer Agent Oversight Group (2005-2009). |
Annual Report
The Board of Trustees of Fidelity Mega Cap Stock Fund voted to pay to shareholders of record at the opening of business on record date, the following distributions per share derived from capital gains realized from sales of portfolio securities, and dividends derived from net investment income:
| Pay Date | Record Date | Dividends | Capital Gains |
Class A | 08/11/14 | 08/08/14 | $0.098 | $0.341 |
Class T | 08/11/14 | 08/08/14 | $0.065 | $0.341 |
Class B | 08/11/14 | 08/08/14 | $0.000 | $0.337 |
Class C | 08/11/14 | 08/08/14 | $0.035 | $0.341 |
The fund hereby designates as a capital gain dividend with respect to the taxable year ended June 30, 2014, $119,836,862, or, if subsequently determined to be different, the net capital gain of such year.
Class A, Class T, Class B and Class C designate 100% of the dividends distributed during the fiscal year as qualifying for the dividends-received deduction for corporate shareholders.
Class A, Class T, Class B and Class C designate 100% of the dividends distributed during the fiscal year as amounts which may be taken into account as a dividend for purposes of the maximum rate under Section 1(h)(11) of the Internal Revenue Code.
The fund will notify shareholders in January 2015 of amounts for use in preparing 2014 income tax returns.
Annual Report
Investment Adviser
Fidelity Management & Research Company
Boston, MA
Investment Sub-Advisers
FMR Co., Inc.
Fidelity Management & Research
(U.K.) Inc.
Fidelity Management & Research
(Hong Kong) Limited
Fidelity Management & Research
(Japan) Inc.
General Distributor
Fidelity Distributors Corporation
Smithfield, RI
Transfer and Service Agents
Fidelity Investments Institutional Operations Company, Inc.
Boston, MA
Fidelity Service Company, Inc.
Boston, MA
Custodian
JPMorgan Chase Bank
New York, NY
(Fidelity Investment logo)(registered trademark)
AGII-UANN-0814
1.855226.106
(Fidelity Investment logo)(registered trademark)
Fidelity Advisor®
Mega Cap Stock
Fund - Institutional Class
Annual Report
June 30, 2014
(Fidelity Cover Art)
Institutional Class
is a class of Fidelity®
Mega Cap Stock Fund
Contents
Performance | (Click Here) | How the fund has done over time. |
Management's Discussion of Fund Performance | (Click Here) | The Portfolio Manager's review of fund performance and strategy. |
Shareholder Expense Example | (Click Here) | An example of shareholder expenses. |
Investment Changes | (Click Here) | A summary of major shifts in the fund's investments over the past six months. |
Investments | (Click Here) | A complete list of the fund's investments with their market values. |
Financial Statements | (Click Here) | Statements of assets and liabilities, operations, and changes in net assets, as well as financial highlights. |
Notes | (Click Here) | Notes to the financial statements. |
Report of Independent Registered Public Accounting Firm | (Click Here) | |
Trustees and Officers | (Click Here) | |
Distributions | (Click Here) | |
To view a fund's proxy voting guidelines and proxy voting record for the 12-month period ended June 30, visit http://www.fidelity.com/proxyvotingresults or visit the Securities and Exchange Commission's (SEC) web site at http://www.sec.gov. You may also call 1-877-208-0098 to request a free copy of the proxy voting guidelines.
Standard & Poor's, S&P and S&P 500 are registered service marks of The McGraw-Hill Companies, Inc. and have been licensed for use by Fidelity Distributors Corporation.
Other third-party marks appearing herein are the property of their respective owners.
All other marks appearing herein are registered or unregistered trademarks or service marks of FMR LLC or an affiliated company. © 2014 FMR LLC. All rights reserved.
This report and the financial statements contained herein are submitted for the general information of the shareholders of the fund. This report is not authorized for distribution to prospective investors in the fund unless preceded or accompanied by an effective prospectus.
A fund files its complete schedule of portfolio holdings with the SEC for the first and third quarters of each fiscal year on Form N-Q. Forms N-Q are available on the SEC's web site at http://www.sec.gov. A fund's Forms N-Q may be reviewed and copied at the SEC's Public Reference Room in Washington, DC. Information regarding the operation of the SEC's Public Reference Room may be obtained by calling 1-800-SEC-0330. For a complete list of a fund's portfolio holdings, view the most recent holdings listing, semiannual report, or annual report on Fidelity's web site at http://www.fidelity.com, http://www.advisor.fidelity.com, or http://www.401k.com, as applicable.
NOT FDIC INSURED • MAY LOSE VALUE • NO BANK GUARANTEE
Neither the fund nor Fidelity Distributors Corporation is a bank.
Annual Report
Average annual total return reflects the change in the value of an investment, assuming reinvestment of the class' distributions from dividend income and capital gains (the profits earned upon the sale of securities that have grown in value, if any) and assuming a constant rate of performance each year. The $10,000 table and the fund's returns do not reflect the deduction of taxes that a shareholder would pay on fund distributions or the redemption of fund shares. During periods of reimbursement by Fidelity, a fund's total return will be greater than it would be had the reimbursement not occurred. How a fund did yesterday is no guarantee of how it will do tomorrow.
Average Annual Total Returns
Periods ended June 30, 2014 | Past 1
year | Past 5
years | Past 10
Years |
Institutional Class A, B | 24.23% | 19.67% | 8.23% |
A The initial offering of Institutional Class shares took place on February 5, 2008. Returns prior to February 5, 2008, are those of Fidelity® Mega Cap Stock Fund, the original class of the fund.
B Prior to December 1, 2007, the fund operated under certain different investment policies. The fund's historical performance may not represent its current investment policies.
$10,000 Over 10 Years
Let's say hypothetically that $10,000 was invested in Fidelity Advisor® Mega Cap Stock Fund - Institutional Class on June 30, 2004. The chart shows how the value of your investment would have changed, and also shows how the S&P 500® Index performed over the same period. See footnote A above for additional information regarding the performance of Institutional Class.

Annual Report
Market Recap: Despite intermittent volatility driven by geopolitical concerns, stocks posted a series of new highs during the 12 months ending June 30, 2014, amid a decidedly favorable environment for riskier assets. The S&P 500® Index rose 24.61% for the year, helped by a rise in consumer spending and the lowest unemployment rate since 2008. The U.S. Federal Reserve balanced stimulus reductions with continued low interest rates, aiding a broad advance. All 10 S&P 500® market sectors gained, seven by more than 20%. Materials (+33%) was tops, as investors seemed to anticipate sustained economic improvement and renewed infrastructure build-outs. Information technology (+32%) benefited from large cash balances, rising dividends and stock buybacks, and a bevy of innovations. Health care (+30%) was aided by new drugs and predictable reimbursements. Conversely, the biggest laggard, telecommunication services (+5%), battled slow growth and stiff pricing competition. Across size and style segments: overall, investors showed some preference for large-cap stocks over small-caps and growth stocks over value, although market leadership rotated during the year. With the "risk-on" trade alive and well, the growth-oriented Nasdaq Composite Index® flourished, advancing 31.17%, while the blue-chip Dow Jones Industrial AverageSM delivered a more subdued 15.56% return.
Comments from Matthew Fruhan, Portfolio Manager of Fidelity Advisor® Mega Cap Stock Fund: For the year, the fund's Class A, Class T, Class B and Class C shares gained 23.88%, 23.54%, 22.82% and 22.90%, respectively (excluding sales charges). For comparison, the mega-cap proxy Russell Top 200® Index returned 24.69% and the S&P 500® Index advanced 24.61%. Relative to the Russell index, it hurt the most to overweight big-box retailer Target, which was among the fund's biggest holdings. The lingering effects of the firm's troubled expansion into Canada and a holiday-season credit breach continued to weigh on the stock, but this weak stretch allowed me to add notable exposure at a valuation I liked. In January, I established an underweight stake in Facebook, which detracted as shares of the social-media giant outperformed. Stock selection and an overweight in financials detracted, including investment banks JPMorgan Chase and Citigroup, both of which were among the fund's largest holdings. Stock selection in consumer staples helped, including drugstore chain Walgreen, while an underweight in the underperforming shares of IBM added value.
Comments from Matthew Fruhan, Portfolio Manager of Fidelity Advisor® Mega Cap Stock Fund: For the year, the fund's Institutional Class shares gained 24.23%. By comparison, the mega-cap proxy Russell Top 200® Index returned 24.69% and the S&P 500® Index advanced 24.61%. Relative to the Russell index, it hurt the most to overweight big-box retailer Target, which was among the fund's biggest holdings. The lingering effects of the firm's troubled expansion into Canada and a holiday-season credit breach continued to weigh on the stock, but this weak stretch allowed me to add notable exposure at a valuation I liked. In January, I established an underweight stake in Facebook, which detracted as shares of the social-media giant outperformed. Stock selection and an overweight in financials detracted, including investment banks JPMorgan Chase and Citigroup, both of which were among the fund's largest holdings. Stock selection in consumer staples also helped, including drugstore chain Walgreen, while an underweight in the underperforming shares of IBM added value.
Annual Report
The views expressed above reflect those of the portfolio manager(s) only through the end of the period as stated on the cover of this report and do not necessarily represent the views of Fidelity or any other person in the Fidelity organization. Any such views are subject to change at any time based upon market or other conditions and Fidelity disclaims any responsibility to update such views. These views may not be relied on as investment advice and, because investment decisions for a Fidelity fund are based on numerous factors, may not be relied on as an indication of trading intent on behalf of any Fidelity fund.
Annual Report
Shareholder Expense Example
As a shareholder of the Fund, you incur two types of costs: (1) transaction costs, including sales charges (loads) on purchase payments or redemption proceeds, and (2) ongoing costs, including management fees, distribution and/or service (12b-1) fees and other Fund expenses. This Example is intended to help you understand your ongoing costs (in dollars) of investing in the Fund and to compare these costs with the ongoing costs of investing in other mutual funds.
The Example is based on an investment of $1,000 invested at the beginning of the period and held for the entire period (January 1, 2014 to June 30, 2014).
Actual Expenses
The first line of the accompanying table for each class of the Fund provides information about actual account values and actual expenses. You may use the information in this line, together with the amount you invested, to estimate the expenses that you paid over the period. Simply divide your account value by $1,000.00 (for example, an $8,600 account value divided by $1,000.00 = 8.6), then multiply the result by the number in the first line for a class of the Fund under the heading entitled "Expenses Paid During Period" to estimate the expenses you paid on your account during this period. A small balance maintenance fee of $12.00 that is charged once a year may apply for certain accounts with a value of less than $2,000. This fee is not included in the table below. If it was, the estimate of expenses you paid during the period would be higher, and your ending account value lower, by this amount. In addition, the Fund, as a shareholder in the underlying Fidelity Central Funds, will indirectly bear its pro-rata share of the fees and expenses incurred by the underlying Fidelity Central Funds. These fees and expenses are not included in the Fund's annualized expense ratio used to calculate the expense estimate in the table below.
Hypothetical Example for Comparison Purposes
The second line of the accompanying table for each class of the Fund provides information about hypothetical account values and hypothetical expenses based on a Class' actual expense ratio and an assumed rate of return of 5% per year before expenses, which is not the Class' actual return. The hypothetical account values and expenses may not be used to estimate the actual ending account balance or expenses you paid for the period. You may use this information to compare the ongoing costs of investing in the Fund and other funds. To do so, compare this 5% hypothetical example with the 5% hypothetical examples that appear in the shareholder reports of the other funds. A small balance maintenance fee of $12.00 that is charged once a year may apply for certain accounts with a value of less than $2,000. This fee is not included in the table below. If it was, the estimate of expenses you paid during the period would be higher, and your ending account value lower, by this amount. In addition, the Fund, as a shareholder in the underlying Fidelity Central Funds, will indirectly bear its pro-rata share of the fees and expenses incurred by the underlying Fidelity Central Funds. These fees and expenses are not included in the Fund's annualized expense ratio used to calculate the expense estimate in the table below.
Please note that the expenses shown in the table are meant to highlight your ongoing costs only and do not reflect any transaction costs. Therefore, the second line of the table is useful in comparing ongoing costs only, and will not help you determine the relative total costs of owning different funds. In addition, if these transactional costs were included, your costs would have been higher.
Annual Report
| Annualized
Expense Ratio B | Beginning
Account Value
January 1, 2014 | Ending
Account Value
June 30, 2014 | Expenses Paid
During Period*
January 1, 2014
to June 30, 2014 |
Class A | .95% | | | |
Actual | | $ 1,000.00 | $ 1,064.60 | $ 4.86 |
Hypothetical A | | $ 1,000.00 | $ 1,020.08 | $ 4.76 |
Class T | 1.21% | | | |
Actual | | $ 1,000.00 | $ 1,063.20 | $ 6.19 |
Hypothetical A | | $ 1,000.00 | $ 1,018.79 | $ 6.06 |
Class B | 1.75% | | | |
Actual | | $ 1,000.00 | $ 1,060.20 | $ 8.94 |
Hypothetical A | | $ 1,000.00 | $ 1,016.12 | $ 8.75 |
Class C | 1.70% | | | |
Actual | | $ 1,000.00 | $ 1,060.50 | $ 8.69 |
Hypothetical A | | $ 1,000.00 | $ 1,016.36 | $ 8.50 |
Mega Cap Stock | .68% | | | |
Actual | | $ 1,000.00 | $ 1,066.10 | $ 3.48 |
Hypothetical A | | $ 1,000.00 | $ 1,021.42 | $ 3.41 |
Institutional Class | .71% | | | |
Actual | | $ 1,000.00 | $ 1,065.70 | $ 3.64 |
Hypothetical A | | $ 1,000.00 | $ 1,021.27 | $ 3.56 |
Class Z | .53% | | | |
Actual | | $ 1,000.00 | $ 1,066.30 | $ 2.72 |
Hypothetical A | | $ 1,000.00 | $ 1,022.17 | $ 2.66 |
A 5% return per year before expenses
B Annualized expense ratio reflects expenses net of applicable fee waivers.
* Expenses are equal to each Class' annualized expense ratio, multiplied by the average account value over the period, multiplied by 181/365 (to reflect the one-half year period).
Annual Report
Investment Changes (Unaudited)
Top Ten Stocks as of June 30, 2014 |
| % of fund's
net assets | % of fund's net assets
6 months ago |
Apple, Inc. | 4.6 | 4.6 |
JPMorgan Chase & Co. | 4.2 | 4.3 |
Microsoft Corp. | 3.5 | 3.3 |
General Electric Co. | 3.1 | 3.3 |
Chevron Corp. | 2.6 | 2.2 |
Comcast Corp. Class A (special) (non-vtg.) | 2.5 | 2.0 |
Verizon Communications, Inc. | 2.3 | 1.2 |
Citigroup, Inc. | 2.3 | 2.6 |
Bank of America Corp. | 2.1 | 2.1 |
Target Corp. | 2.0 | 1.9 |
| 29.2 | |
Top Five Market Sectors as of June 30, 2014 |
| % of fund's
net assets | % of fund's net assets
6 months ago |
Information Technology | 23.4 | 22.6 |
Financials | 18.3 | 19.2 |
Energy | 12.0 | 12.3 |
Consumer Staples | 10.9 | 11.0 |
Health Care | 9.9 | 11.1 |
Asset Allocation (% of fund's net assets) |
As of June 30, 2014* | As of December 31, 2013** |
| Stocks 98.2% | | | Stocks 98.8% | |
| Convertible Securities 0.0% | | | Convertible Securities 0.1% | |
| Short-Term Investments
and Net Other Assets (Liabilities) 1.8% | | | Short-Term Investments
and Net Other Assets (Liabilities) 1.1% | |
* Foreign investments | 10.7% | | ** Foreign investments | 10.7% | |

Annual Report
Investments June 30, 2014
Showing Percentage of Net Assets
Common Stocks - 98.2% |
| Shares | | Value |
CONSUMER DISCRETIONARY - 9.3% |
Hotels, Restaurants & Leisure - 1.2% |
McDonald's Corp. | 152,600 | | $ 15,372,924 |
Yum! Brands, Inc. | 357,600 | | 29,037,120 |
| | 44,410,044 |
Media - 4.6% |
Comcast Corp. Class A (special) (non-vtg.) (d) | 1,674,100 | | 89,279,753 |
The Walt Disney Co. | 169,000 | | 14,490,060 |
Time Warner, Inc. | 784,900 | | 55,139,225 |
Twenty-First Century Fox, Inc. Class A | 193,500 | | 6,801,525 |
| | 165,710,563 |
Multiline Retail - 2.0% |
Target Corp. | 1,261,300 | | 73,092,335 |
Specialty Retail - 1.5% |
Lowe's Companies, Inc. | 1,149,600 | | 55,169,304 |
TOTAL CONSUMER DISCRETIONARY | | 338,382,246 |
CONSUMER STAPLES - 10.9% |
Beverages - 3.7% |
Diageo PLC | 500,803 | | 15,950,125 |
PepsiCo, Inc. | 432,905 | | 38,675,733 |
SABMiller PLC | 312,289 | | 18,107,213 |
The Coca-Cola Co. | 1,476,100 | | 62,527,596 |
| | 135,260,667 |
Food & Staples Retailing - 1.8% |
CVS Caremark Corp. | 389,100 | | 29,326,467 |
Walgreen Co. | 511,897 | | 37,946,925 |
| | 67,273,392 |
Food Products - 0.4% |
Kellogg Co. | 216,400 | | 14,217,480 |
Household Products - 1.8% |
Procter & Gamble Co. | 818,700 | | 64,341,633 |
Tobacco - 3.2% |
British American Tobacco PLC sponsored ADR | 519,400 | | 61,850,152 |
Philip Morris International, Inc. | 490,530 | | 41,356,584 |
Reynolds American, Inc. | 197,600 | | 11,925,160 |
| | 115,131,896 |
TOTAL CONSUMER STAPLES | | 396,225,068 |
Common Stocks - continued |
| Shares | | Value |
ENERGY - 12.0% |
Energy Equipment & Services - 1.4% |
National Oilwell Varco, Inc. | 124,100 | | $ 10,219,635 |
Schlumberger Ltd. | 344,800 | | 40,669,160 |
| | 50,888,795 |
Oil, Gas & Consumable Fuels - 10.6% |
Anadarko Petroleum Corp. | 76,400 | | 8,363,508 |
Apache Corp. | 412,505 | | 41,506,253 |
BG Group PLC | 1,699,000 | | 35,909,707 |
Canadian Natural Resources Ltd. | 568,600 | | 26,126,665 |
Chevron Corp. | 715,700 | | 93,434,635 |
Exxon Mobil Corp. | 358,271 | | 36,070,724 |
Imperial Oil Ltd. | 373,900 | | 19,703,291 |
Occidental Petroleum Corp. | 521,300 | | 53,501,019 |
Suncor Energy, Inc. | 948,700 | | 40,453,446 |
The Williams Companies, Inc. | 510,200 | | 29,698,742 |
| | 384,767,990 |
TOTAL ENERGY | | 435,656,785 |
FINANCIALS - 18.3% |
Banks - 12.5% |
Bank of America Corp. | 5,029,700 | | 77,306,489 |
Citigroup, Inc. | 1,809,370 | | 85,221,327 |
JPMorgan Chase & Co. | 2,701,500 | | 155,660,430 |
PNC Financial Services Group, Inc. | 239,800 | | 21,354,190 |
Standard Chartered PLC (United Kingdom) | 1,566,208 | | 32,004,076 |
U.S. Bancorp | 732,800 | | 31,744,896 |
Wells Fargo & Co. | 1,022,730 | | 53,754,689 |
| | 457,046,097 |
Capital Markets - 3.1% |
BlackRock, Inc. Class A | 19,000 | | 6,072,400 |
Charles Schwab Corp. | 982,100 | | 26,447,953 |
Goldman Sachs Group, Inc. | 22,700 | | 3,800,888 |
Morgan Stanley, Inc. | 1,186,000 | | 38,343,380 |
State Street Corp. | 568,900 | | 38,264,214 |
| | 112,928,835 |
Diversified Financial Services - 0.1% |
IntercontinentalExchange Group, Inc. | 10,500 | | 1,983,450 |
Insurance - 2.6% |
AIA Group Ltd. | 92,200 | | 463,355 |
Common Stocks - continued |
| Shares | | Value |
FINANCIALS - continued |
Insurance - continued |
American International Group, Inc. | 637,100 | | $ 34,772,918 |
Marsh & McLennan Companies, Inc. | 213,580 | | 11,067,716 |
MetLife, Inc. | 849,095 | | 47,175,718 |
Ping An Insurance (Group) Co. of China Ltd. (H Shares) | 101,500 | | 785,766 |
| | 94,265,473 |
TOTAL FINANCIALS | | 666,223,855 |
HEALTH CARE - 9.9% |
Biotechnology - 1.3% |
Amgen, Inc. | 318,690 | | 37,723,335 |
Biogen Idec, Inc. (a) | 34,200 | | 10,783,602 |
| | 48,506,937 |
Health Care Equipment & Supplies - 0.8% |
Abbott Laboratories | 465,100 | | 19,022,590 |
Stryker Corp. | 96,100 | | 8,103,152 |
| | 27,125,742 |
Health Care Providers & Services - 2.5% |
Express Scripts Holding Co. (a) | 318,907 | | 22,109,822 |
McKesson Corp. | 202,400 | | 37,688,904 |
UnitedHealth Group, Inc. | 400,048 | | 32,703,924 |
| | 92,502,650 |
Life Sciences Tools & Services - 0.3% |
Thermo Fisher Scientific, Inc. | 94,500 | | 11,151,000 |
Pharmaceuticals - 5.0% |
AbbVie, Inc. | 243,900 | | 13,765,716 |
GlaxoSmithKline PLC sponsored ADR | 619,000 | | 33,104,120 |
Johnson & Johnson | 565,900 | | 59,204,458 |
Merck & Co., Inc. | 477,300 | | 27,611,805 |
Novartis AG sponsored ADR | 170,400 | | 15,426,312 |
Sanofi SA | 80,024 | | 8,505,715 |
Teva Pharmaceutical Industries Ltd. sponsored ADR | 487,200 | | 25,539,024 |
| | 183,157,150 |
TOTAL HEALTH CARE | | 362,443,479 |
INDUSTRIALS - 9.4% |
Aerospace & Defense - 1.9% |
Honeywell International, Inc. | 118,700 | | 11,033,165 |
Common Stocks - continued |
| Shares | | Value |
INDUSTRIALS - continued |
Aerospace & Defense - continued |
The Boeing Co. | 309,000 | | $ 39,314,070 |
United Technologies Corp. | 176,200 | | 20,342,290 |
| | 70,689,525 |
Air Freight & Logistics - 1.8% |
FedEx Corp. | 117,800 | | 17,832,564 |
United Parcel Service, Inc. Class B | 475,000 | | 48,763,500 |
| | 66,596,064 |
Industrial Conglomerates - 3.4% |
Danaher Corp. | 146,570 | | 11,539,456 |
General Electric Co. | 4,323,800 | | 113,629,464 |
| | 125,168,920 |
Machinery - 0.3% |
Caterpillar, Inc. | 86,500 | | 9,399,955 |
Road & Rail - 2.0% |
CSX Corp. | 1,160,700 | | 35,761,167 |
Norfolk Southern Corp. | 207,800 | | 21,409,634 |
Union Pacific Corp. | 148,190 | | 14,781,953 |
| | 71,952,754 |
TOTAL INDUSTRIALS | | 343,807,218 |
INFORMATION TECHNOLOGY - 23.4% |
Communications Equipment - 3.1% |
Cisco Systems, Inc. | 2,773,400 | | 68,918,990 |
QUALCOMM, Inc. | 531,900 | | 42,126,480 |
| | 111,045,470 |
Internet Software & Services - 4.2% |
Facebook, Inc. Class A (a) | 103,597 | | 6,971,042 |
Google, Inc.: | | | |
Class A (a) | 109,350 | | 63,933,665 |
Class C (a) | 95,750 | | 55,083,060 |
Yahoo!, Inc. (a) | 781,639 | | 27,458,978 |
| | 153,446,745 |
IT Services - 3.8% |
Accenture PLC Class A | 69,100 | | 5,586,044 |
Cognizant Technology Solutions Corp. Class A (a) | 523,400 | | 25,599,494 |
IBM Corp. | 156,000 | | 28,278,120 |
Common Stocks - continued |
| Shares | | Value |
INFORMATION TECHNOLOGY - continued |
IT Services - continued |
MasterCard, Inc. Class A | 555,900 | | $ 40,841,973 |
Visa, Inc. Class A | 187,100 | | 39,423,841 |
| | 139,729,472 |
Semiconductors & Semiconductor Equipment - 1.4% |
Applied Materials, Inc. | 699,625 | | 15,776,544 |
Broadcom Corp. Class A | 973,036 | | 36,119,096 |
| | 51,895,640 |
Software - 5.3% |
Adobe Systems, Inc. (a) | 253,200 | | 18,321,552 |
Microsoft Corp. | 3,024,500 | | 126,121,650 |
Oracle Corp. | 899,900 | | 36,472,947 |
salesforce.com, Inc. (a) | 199,200 | | 11,569,536 |
| | 192,485,685 |
Technology Hardware, Storage & Peripherals - 5.6% |
Apple, Inc. | 1,808,507 | | 168,064,558 |
EMC Corp. | 1,051,000 | | 27,683,340 |
First Data Holdings, Inc. Class B (e) | 2,429,231 | | 9,716,924 |
| | 205,464,822 |
TOTAL INFORMATION TECHNOLOGY | | 854,067,834 |
MATERIALS - 2.7% |
Chemicals - 2.1% |
E.I. du Pont de Nemours & Co. | 333,900 | | 21,850,416 |
Monsanto Co. | 315,310 | | 39,331,769 |
Syngenta AG (Switzerland) | 43,089 | | 15,919,199 |
| | 77,101,384 |
Metals & Mining - 0.6% |
Freeport-McMoRan Copper & Gold, Inc. | 538,000 | | 19,637,000 |
TOTAL MATERIALS | | 96,738,384 |
TELECOMMUNICATION SERVICES - 2.3% |
Diversified Telecommunication Services - 2.3% |
Verizon Communications, Inc. | 1,743,725 | | 85,320,464 |
TOTAL COMMON STOCKS (Cost $2,718,899,411) |
3,578,865,333
|
Money Market Funds - 2.6% |
| Shares | | Value |
Fidelity Cash Central Fund, 0.11% (b) | 74,761,932 | | $ 74,761,932 |
Fidelity Securities Lending Cash Central Fund, 0.10% (b)(c) | 22,517,000 | | 22,517,000 |
TOTAL MONEY MARKET FUNDS (Cost $97,278,932) |
97,278,932
|
TOTAL INVESTMENT PORTFOLIO - 100.8% (Cost $2,816,178,343) | | 3,676,144,265 |
NET OTHER ASSETS (LIABILITIES) - (0.8)% | | (30,832,045) |
NET ASSETS - 100% | $ 3,645,312,220 |
Legend |
(a) Non-income producing |
(b) Affiliated fund that is generally available only to investment companies and other accounts managed by Fidelity Investments. The rate quoted is the annualized seven-day yield of the fund at period end. A complete unaudited listing of the fund's holdings as of its most recent quarter end is available upon request. In addition, each Fidelity Central Fund's financial statements, which are not covered by the Fund's Report of Independent Registered Public Accounting Firm, are available on the SEC's website or upon request. |
(c) Investment made with cash collateral received from securities on loan. |
(d) Security or a portion of the security is on loan at period end. |
(e) Restricted securities - Investment in securities not registered under the Securities Act of 1933 (excluding 144A issues). At the end of the period, the value of restricted securities (excluding 144A issues) amounted to $9,716,924 or 0.3% of net assets. |
Additional information on each restricted holding is as follows: |
Security | Acquisition Date | Acquisition Cost |
First Data Holdings, Inc. Class B | 6/26/14 | $ 9,716,924 |
Affiliated Central Funds |
Information regarding fiscal year to date income earned by the Fund from investments in Fidelity Central Funds is as follows: |
Fund | Income earned |
Fidelity Cash Central Fund | $ 27,717 |
Fidelity Securities Lending Cash Central Fund | 89,556 |
Total | $ 117,273 |
Other Information |
The following is a summary of the inputs used, as of June 30, 2014, involving the Fund's assets and liabilities carried at fair value. The inputs or methodology used for valuing securities may not be an indication of the risk associated with investing in those securities. For more information on valuation inputs, and their aggregation into the levels used in the table below, please refer to the Investment Valuation section in the accompanying Notes to Financial Statements. |
Valuation Inputs at Reporting Date: |
Description | Total | Level 1 | Level 2 | Level 3 |
Investments in Securities: | | | | |
Equities: | | | | |
Consumer Discretionary | $ 338,382,246 | $ 338,382,246 | $ - | $ - |
Consumer Staples | 396,225,068 | 380,274,943 | 15,950,125 | - |
Energy | 435,656,785 | 435,656,785 | - | - |
Financials | 666,223,855 | 666,223,855 | - | - |
Health Care | 362,443,479 | 353,937,764 | 8,505,715 | - |
Industrials | 343,807,218 | 343,807,218 | - | - |
Information Technology | 854,067,834 | 844,350,910 | - | 9,716,924 |
Materials | 96,738,384 | 80,819,185 | 15,919,199 | - |
Telecommunication Services | 85,320,464 | 85,320,464 | - | - |
Money Market Funds | 97,278,932 | 97,278,932 | - | - |
Total Investments in Securities: | $ 3,676,144,265 | $ 3,626,052,302 | $ 40,375,039 | $ 9,716,924 |
Distribution of investments by country or territory of incorporation, as a percentage of total net assets, is as follows (Unaudited): |
United States of America | 89.3% |
United Kingdom | 5.4% |
Canada | 2.4% |
Curacao | 1.1% |
Others (Individually Less Than 1%) | 1.8% |
| 100.0% |
See accompanying notes which are an integral part of the financial statements.
Annual Report
Statement of Assets and Liabilities
| June 30, 2014 |
| | |
Assets | | |
Investment in securities, at value (including securities loaned of $21,833,302) - See accompanying schedule: Unaffiliated issuers (cost $2,718,899,411) | $ 3,578,865,333 | |
Fidelity Central Funds (cost $97,278,932) | 97,278,932 | |
Total Investments (cost $2,816,178,343) | | $ 3,676,144,265 |
Receivable for investments sold | | 6,265,877 |
Receivable for fund shares sold | | 5,281,399 |
Dividends receivable | | 4,490,136 |
Distributions receivable from Fidelity Central Funds | | 19,236 |
Receivable from investment adviser for expense reductions | | 386 |
Other receivables | | 124,808 |
Total assets | | 3,692,326,107 |
| | |
Liabilities | | |
Payable for investments purchased | $ 19,178,333 | |
Payable for fund shares redeemed | 3,159,924 | |
Accrued management fee | 1,355,067 | |
Distribution and service plan fees payable | 36,521 | |
Other affiliated payables | 644,371 | |
Other payables and accrued expenses | 122,671 | |
Collateral on securities loaned, at value | 22,517,000 | |
Total liabilities | | 47,013,887 |
| | |
Net Assets | | $ 3,645,312,220 |
Net Assets consist of: | | |
Paid in capital | | $ 2,686,009,603 |
Undistributed net investment income | | 25,146,366 |
Accumulated undistributed net realized gain (loss) on investments and foreign currency transactions | | 74,183,358 |
Net unrealized appreciation (depreciation) on investments and assets and liabilities in foreign currencies | | 859,972,893 |
Net Assets | | $ 3,645,312,220 |
See accompanying notes which are an integral part of the financial statements.
Annual Report
Financial Statements - continued
Statement of Assets and Liabilities - continued
| June 30, 2014 |
| | |
Calculation of Maximum Offering Price Class A:
Net Asset Value and redemption price per share ($77,335,409 ÷ 4,739,947 shares) | | $ 16.32 |
| | |
Maximum offering price per share (100/94.25 of $16.32) | | $ 17.32 |
Class T:
Net Asset Value and redemption price per share ($15,728,415 ÷ 964,584 shares) | | $ 16.31 |
| | |
Maximum offering price per share (100/96.50 of $16.31) | | $ 16.90 |
Class B:
Net Asset Value and offering price per share ($918,549 ÷ 56,656 shares)A | | $ 16.21 |
| | |
Class C:
Net Asset Value and offering price per share ($16,599,716 ÷ 1,029,726 shares)A | | $ 16.12 |
| | |
Mega Cap Stock:
Net Asset Value, offering price and redemption price per share ($2,860,197,294 ÷ 173,984,386 shares) | | $ 16.44 |
| | |
Institutional Class:
Net Asset Value, offering price and redemption price per share ($674,415,747 ÷ 41,154,574 shares) | | $ 16.39 |
| | |
Class Z:
Net Asset Value, offering price and redemption price per share ($117,090 ÷ 7,138 shares) | | $ 16.40 |
A Redemption price per share is equal to net asset value less any applicable contingent deferred sales charge.
See accompanying notes which are an integral part of the financial statements.
Annual Report
Statement of Operations
| Year ended June 30, 2014 |
| | |
Investment Income | | |
Dividends | | $ 64,598,075 |
Interest | | 3 |
Income from Fidelity Central Funds | | 117,273 |
Total income | | 64,715,351 |
| | |
Expenses | | |
Management fee | $ 13,636,133 | |
Transfer agent fees | 5,746,426 | |
Distribution and service plan fees | 284,809 | |
Accounting and security lending fees | 887,108 | |
Custodian fees and expenses | 71,971 | |
Independent trustees' compensation | 12,515 | |
Registration fees | 231,217 | |
Audit | 55,093 | |
Legal | 11,095 | |
Interest | 2,824 | |
Miscellaneous | 22,803 | |
Total expenses before reductions | 20,961,994 | |
Expense reductions | (36,926) | 20,925,068 |
Net investment income (loss) | | 43,790,283 |
Realized and Unrealized Gain (Loss) Net realized gain (loss) on: | | |
Investment securities: | | |
Unaffiliated issuers | 143,561,768 | |
Foreign currency transactions | (8,194) | |
Total net realized gain (loss) | | 143,553,574 |
Change in net unrealized appreciation (depreciation) on: Investment securities | 457,006,470 | |
Assets and liabilities in foreign currencies | 12,169 | |
Total change in net unrealized appreciation (depreciation) | | 457,018,639 |
Net gain (loss) | | 600,572,213 |
Net increase (decrease) in net assets resulting from operations | | $ 644,362,496 |
See accompanying notes which are an integral part of the financial statements.
Annual Report
Financial Statements - continued
Statement of Changes in Net Assets
| Year ended
June 30,
2014 | Year ended
June 30,
2013 |
Increase (Decrease) in Net Assets | | |
Operations | | |
Net investment income (loss) | $ 43,790,283 | $ 35,288,813 |
Net realized gain (loss) | 143,553,574 | 104,876,418 |
Change in net unrealized appreciation (depreciation) | 457,018,639 | 321,854,450 |
Net increase (decrease) in net assets resulting
from operations | 644,362,496 | 462,019,681 |
Distributions to shareholders from net investment income | (35,705,336) | (27,575,489) |
Distributions to shareholders from net realized gain | (41,770,691) | - |
Total distributions | (77,476,027) | (27,575,489) |
Share transactions - net increase (decrease) | 513,653,074 | 652,982,078 |
Total increase (decrease) in net assets | 1,080,539,543 | 1,087,426,270 |
| | |
Net Assets | | |
Beginning of period | 2,564,772,677 | 1,477,346,407 |
End of period (including undistributed net investment income of $25,146,366 and undistributed net investment income of $17,061,419, respectively) | $ 3,645,312,220 | $ 2,564,772,677 |
See accompanying notes which are an integral part of the financial statements.
Annual Report
Financial Highlights - Class A
Years ended June 30, | 2014 | 2013 | 2012 | 2011 | 2010 |
Selected Per-Share Data | | | | | |
Net asset value, beginning of period | $ 13.51 | $ 11.05 | $ 10.37 | $ 8.07 | $ 7.20 |
Income from Investment Operations | | | | | |
Net investment income (loss) C | .18 | .17 | .13 | .07 | .06 |
Net realized and unrealized gain (loss) | 3.00 | 2.43 | .64 | 2.28 | .92 |
Total from investment operations | 3.18 | 2.60 | .77 | 2.35 | .98 |
Distributions from net investment income | (.16) | (.14) | (.09) | (.05) | (.11) |
Distributions from net realized gain | (.21) | - | - | - | - |
Total distributions | (.37) | (.14) | (.09) | (.05) | (.11) |
Net asset value, end of period | $ 16.32 | $ 13.51 | $ 11.05 | $ 10.37 | $ 8.07 |
Total ReturnA, B | 23.88% | 23.78% | 7.57% | 29.23% | 13.65% |
Ratios to Average Net Assets D, F | | | | | |
Expenses before reductions | .96% | .98% | 1.02% | 1.06% | 1.10% |
Expenses net of fee waivers, if any | .96% | .98% | 1.02% | 1.06% | 1.10% |
Expenses net of all reductions | .96% | .98% | 1.02% | 1.06% | 1.10% |
Net investment income (loss) | 1.19% | 1.37% | 1.28% | .76% | .66% |
Supplemental Data | | | | | |
Net assets, end of period (000 omitted) | $ 77,335 | $ 20,336 | $ 8,527 | $ 4,169 | $ 2,238 |
Portfolio turnover rateE | 28% | 29% | 57% | 53% | 97% |
A Total returns would have been lower if certain expenses had not been reduced during the applicable periods shown.
B Total returns do not include the effect of the sales charges.
C Calculated based on average shares outstanding during the period.
D Fees and expenses of any underlying Fidelity Central Funds are not included in the Fund's expense ratio. The Fund indirectly bears its proportionate share of the expenses of any underlying Fidelity Central Funds.
E Amount does not include the portfolio activity of any underlying Fidelity Central Funds.
F Expense ratios reflect operating expenses of the class. Expenses before reductions do not reflect amounts reimbursed by the investment adviser or reductions from brokerage service arrangements or reductions from other expense offset arrangements and do not represent the amount paid by the class during periods when reimbursements or reductions occur. Expenses net of fee waivers reflect expenses after reimbursement by the investment adviser but prior to reductions from brokerage service arrangements or other expense offset arrangements. Expenses net of all reductions represent the net expenses paid by the class.
See accompanying notes which are an integral part of the financial statements.
Annual Report
Financial Highlights - Class T
Years ended June 30, | 2014 | 2013 | 2012 | 2011 | 2010 |
Selected Per-Share Data | | | | | |
Net asset value, beginning of period | $ 13.51 | $ 11.05 | $ 10.38 | $ 8.07 | $ 7.20 |
Income from Investment Operations | | | | | |
Net investment income (loss) C | .14 | .14 | .10 | .05 | .03 |
Net realized and unrealized gain (loss) | 3.00 | 2.43 | .64 | 2.29 | .93 |
Total from investment operations | 3.14 | 2.57 | .74 | 2.34 | .96 |
Distributions from net investment income | (.13) | (.11) | (.07) | (.03) | (.09) |
Distributions from net realized gain | (.21) | - | - | - | - |
Total distributions | (.34) | (.11) | (.07) | (.03) | (.09) |
Net asset value, end of period | $ 16.31 | $ 13.51 | $ 11.05 | $ 10.38 | $ 8.07 |
Total ReturnA, B | 23.54% | 23.44% | 7.19% | 29.08% | 13.32% |
Ratios to Average Net Assets D, F | | | | | |
Expenses before reductions | 1.22% | 1.26% | 1.32% | 1.32% | 1.36% |
Expenses net of fee waivers, if any | 1.22% | 1.26% | 1.32% | 1.32% | 1.36% |
Expenses net of all reductions | 1.22% | 1.26% | 1.32% | 1.32% | 1.35% |
Net investment income (loss) | .92% | 1.09% | .98% | .50% | .41% |
Supplemental Data | | | | | |
Net assets, end of period (000 omitted) | $ 15,728 | $ 8,377 | $ 2,293 | $ 1,682 | $ 1,073 |
Portfolio turnover rateE | 28% | 29% | 57% | 53% | 97% |
A Total returns would have been lower if certain expenses had not been reduced during the applicable periods shown.
B Total returns do not include the effect of the sales charges.
C Calculated based on average shares outstanding during the period.
D Fees and expenses of any underlying Fidelity Central Funds are not included in the Fund's expense ratio. The Fund indirectly bears its proportionate share of the expenses of any underlying Fidelity Central Funds.
E Amount does not include the portfolio activity of any underlying Fidelity Central Funds.
F Expense ratios reflect operating expenses of the class. Expenses before reductions do not reflect amounts reimbursed by the investment adviser or reductions from brokerage service arrangements or reductions from other expense offset arrangements and do not represent the amount paid by the class during periods when reimbursements or reductions occur. Expenses net of fee waivers reflect expenses after reimbursement by the investment adviser but prior to reductions from brokerage service arrangements or other expense offset arrangements. Expenses net of all reductions represent the net expenses paid by the class.
See accompanying notes which are an integral part of the financial statements.
Annual Report
Financial Highlights - Class B
Years ended June 30, | 2014 | 2013 | 2012 | 2011 | 2010 |
Selected Per-Share Data | | | | | |
Net asset value, beginning of period | $ 13.43 | $ 10.97 | $ 10.30 | $ 8.02 | $ 7.19 |
Income from Investment Operations | | | | | |
Net investment income (loss) C | .06 | .07 | .05 | - H | (.01) |
Net realized and unrealized gain (loss) | 2.98 | 2.43 | .63 | 2.28 | .92 |
Total from investment operations | 3.04 | 2.50 | .68 | 2.28 | .91 |
Distributions from net investment income | (.04) | (.04) | (.01) | - | (.08) |
Distributions from net realized gain | (.21) | - | - | - | - |
Total distributions | (.26) I | (.04) | (.01) | - | (.08) |
Net asset value, end of period | $ 16.21 | $ 13.43 | $ 10.97 | $ 10.30 | $ 8.02 |
Total ReturnA, B | 22.82% | 22.83% | 6.62% | 28.43% | 12.60% |
Ratios to Average Net Assets D, G | | | | | |
Expenses before reductions | 1.78% | 1.80% | 1.82% | 1.83% | 1.88% |
Expenses net of fee waivers, if any | 1.78% | 1.80% | 1.82% | 1.83% | 1.88% |
Expenses net of all reductions | 1.78% | 1.80% | 1.81% | 1.82% | 1.88% |
Net investment income (loss) | .37% | .55% | .49% | .00% F | (.12)% |
Supplemental Data | | | | | |
Net assets, end of period (000 omitted) | $ 919 | $ 716 | $ 704 | $ 764 | $ 667 |
Portfolio turnover rateE | 28% | 29% | 57% | 53% | 97% |
A Total returns would have been lower if certain expenses had not been reduced during the applicable periods shown.
B Total returns do not include the effect of the contingent deferred sales charge.
C Calculated based on average shares outstanding during the period.
D Fees and expenses of any underlying Fidelity Central Funds are not included in the Fund's expense ratio. The Fund indirectly bears its proportionate share of the expenses of any underlying Fidelity Central Funds.
E Amount does not include the portfolio activity of any underlying Fidelity Central Funds.
F Amount represents less than .01%.
G Expense ratios reflect operating expenses of the class. Expenses before reductions do not reflect amounts reimbursed by the investment adviser or reductions from brokerage service arrangements or reductions from other expense offset arrangements and do not represent the amount paid by the class during periods when reimbursements or reductions occur. Expenses net of fee waivers reflect expenses after reimbursement by the investment adviser but prior to reductions from brokerage service arrangements or other expense offset arrangements. Expenses net of all reductions represent the net expenses paid by the class.
H Amount represents less than $.01 per share.
I Total distributions of $.26 per share is comprised of distributions from net investment income of $.044 and distributions from net realized gain of $.213 per share.
See accompanying notes which are an integral part of the financial statements.
Annual Report
Financial Highlights - Class C
Years ended June 30, | 2014 | 2013 | 2012 | 2011 | 2010 |
Selected Per-Share Data | | | | | |
Net asset value, beginning of period | $ 13.38 | $ 10.93 | $ 10.28 | $ 8.01 | $ 7.16 |
Income from Investment Operations | | | | | |
Net investment income (loss) C | .06 | .07 | .05 | - G | (.01) |
Net realized and unrealized gain (loss) | 2.97 | 2.42 | .64 | 2.27 | .92 |
Total from investment operations | 3.03 | 2.49 | .69 | 2.27 | .91 |
Distributions from net investment income | (.08) | (.04) | (.04) | - | (.06) |
Distributions from net realized gain | (.21) | - | - | - | - |
Total distributions | (.29) | (.04) | (.04) | - | (.06) |
Net asset value, end of period | $ 16.12 | $ 13.38 | $ 10.93 | $ 10.28 | $ 8.01 |
Total ReturnA, B | 22.90% | 22.83% | 6.74% | 28.34% | 12.72% |
Ratios to Average Net Assets D, F | | | | | |
Expenses before reductions | 1.71% | 1.75% | 1.79% | 1.81% | 1.86% |
Expenses net of fee waivers, if any | 1.71% | 1.75% | 1.79% | 1.81% | 1.86% |
Expenses net of all reductions | 1.71% | 1.75% | 1.79% | 1.81% | 1.85% |
Net investment income (loss) | .43% | .59% | .51% | .01% | (.10)% |
Supplemental Data | | | | | |
Net assets, end of period (000 omitted) | $ 16,600 | $ 7,938 | $ 2,845 | $ 1,913 | $ 807 |
Portfolio turnover rateE | 28% | 29% | 57% | 53% | 97% |
A Total returns would have been lower if certain expenses had not been reduced during the applicable periods shown.
B Total returns do not include the effect of the contingent deferred sales charge.
C Calculated based on average shares outstanding during the period.
D Fees and expenses of any underlying Fidelity Central Funds are not included in the Fund's expense ratio. The Fund indirectly bears its proportionate share of the expenses of any underlying Fidelity Central Funds.
E Amount does not include the portfolio activity of any underlying Fidelity Central Funds.
F Expense ratios reflect operating expenses of the class. Expenses before reductions do not reflect amounts reimbursed by the investment adviser or reductions from brokerage service arrangements or reductions from other expense offset arrangements and do not represent the amount paid by the class during periods when reimbursements or reductions occur. Expenses net of fee waivers reflect expenses after reimbursement by the investment adviser but prior to reductions from brokerage service arrangements or other expense offset arrangements. Expenses net of all reductions represent the net expenses paid by the class.
G Amount represents less than $.01 per share.
See accompanying notes which are an integral part of the financial statements.
Annual Report
Financial Highlights - Mega Cap Stock
Years ended June 30, | 2014 | 2013 | 2012 | 2011 | 2010 |
Selected Per-Share Data | | | | | |
Net asset value, beginning of period | $ 13.60 | $ 11.11 | $ 10.43 | $ 8.11 | $ 7.23 |
Income from Investment Operations | | | | | |
Net investment income (loss) B | .22 | .20 | .16 | .10 | .08 |
Net realized and unrealized gain (loss) | 3.02 | 2.46 | .64 | 2.29 | .93 |
Total from investment operations | 3.24 | 2.66 | .80 | 2.39 | 1.01 |
Distributions from net investment income | (.19) | (.17) | (.12) | (.07) | (.13) |
Distributions from net realized gain | (.21) | - | - | - | - |
Total distributions | (.40) | (.17) | (.12) | (.07) | (.13) |
Net asset value, end of period | $ 16.44 | $ 13.60 | $ 11.11 | $ 10.43 | $ 8.11 |
Total ReturnA | 24.18% | 24.17% | 7.83% | 29.61% | 13.93% |
Ratios to Average Net Assets C, E | | | | | |
Expenses before reductions | .68% | .70% | .76% | .79% | .81% |
Expenses net of fee waivers, if any | .68% | .70% | .76% | .79% | .80% |
Expenses net of all reductions | .68% | .70% | .75% | .78% | .79% |
Net investment income (loss) | 1.47% | 1.64% | 1.55% | 1.04% | .96% |
Supplemental Data | | | | | |
Net assets, end of period (000 omitted) | $ 2,860,197 | $ 2,214,592 | $ 1,287,144 | $ 785,233 | $ 500,407 |
Portfolio turnover rateD | 28% | 29% | 57% | 53% | 97% |
A Total returns would have been lower if certain expenses had not been reduced during the applicable periods shown.
B Calculated based on average shares outstanding during the period.
C Fees and expenses of any underlying Fidelity Central Funds are not included in the Fund's expense ratio. The Fund indirectly bears its proportionate share of the expenses of any underlying Fidelity Central Funds.
D Amount does not include the portfolio activity of any underlying Fidelity Central Funds.
E Expense ratios reflect operating expenses of the class. Expenses before reductions do not reflect amounts reimbursed by the investment adviser or reductions from brokerage service arrangements or reductions from other expense offset arrangements and do not represent the amount paid by the class during periods when reimbursements or reductions occur. Expenses net of fee waivers reflect expenses after reimbursement by the investment adviser but prior to reductions from brokerage service arrangements or other expense offset arrangements. Expenses net of all reductions represent the net expenses paid by the class.
See accompanying notes which are an integral part of the financial statements.
Annual Report
Financial Highlights - Institutional Class
Years ended June 30, | 2014 | 2013 | 2012 | 2011 | 2010 |
Selected Per-Share Data | | | | | |
Net asset value, beginning of period | $ 13.55 | $ 11.08 | $ 10.40 | $ 8.09 | $ 7.22 |
Income from Investment Operations | | | | | |
Net investment income (loss) B | .22 | .20 | .16 | .10 | .08 |
Net realized and unrealized gain (loss) | 3.02 | 2.44 | .63 | 2.30 | .92 |
Total from investment operations | 3.24 | 2.64 | .79 | 2.40 | 1.00 |
Distributions from net investment income | (.18) | (.17) | (.11) | (.09) | (.13) |
Distributions from net realized gain | (.21) | - | - | - | - |
Total distributions | (.40) F | (.17) | (.11) | (.09) | (.13) |
Net asset value, end of period | $ 16.39 | $ 13.55 | $ 11.08 | $ 10.40 | $ 8.09 |
Total ReturnA | 24.23% | 24.06% | 7.77% | 29.74% | 13.89% |
Ratios to Average Net Assets C, E | | | | | |
Expenses before reductions | .71% | .74% | .78% | .79% | .88% |
Expenses net of fee waivers, if any | .71% | .74% | .78% | .79% | .88% |
Expenses net of all reductions | .71% | .74% | .77% | .78% | .87% |
Net investment income (loss) | 1.43% | 1.61% | 1.53% | 1.04% | .88% |
Supplemental Data | | | | | |
Net assets, end of period (000 omitted) | $ 674,416 | $ 312,814 | $ 175,833 | $ 136,768 | $ 1,568 |
Portfolio turnover rateD | 28% | 29% | 57% | 53% | 97% |
A Total returns would have been lower if certain expenses had not been reduced during the applicable periods shown.
B Calculated based on average shares outstanding during the period.
C Fees and expenses of any underlying Fidelity Central Funds are not included in the Fund's expense ratio. The Fund indirectly bears its proportionate share of the expenses of any underlying Fidelity Central Funds.
D Amount does not include the portfolio activity of any underlying Fidelity Central Funds.
E Expense ratios reflect operating expenses of the class. Expenses before reductions do not reflect amounts reimbursed by the investment adviser or reductions from brokerage service arrangements or reductions from other expense offset arrangements and do not represent the amount paid by the class during periods when reimbursements or reductions occur. Expenses net of fee waivers reflect expenses after reimbursement by the investment adviser but prior to reductions from brokerage service arrangements or other expense offset arrangements. Expenses net of all reductions represent the net expenses paid by the class.
F Total distributions of $.40 per share is comprised of distributions from net investment income of $.182 and distributions from net realized gain of $.213 per share.
See accompanying notes which are an integral part of the financial statements.
Annual Report
Financial Highlights - Class Z
Year ended June 30, | 2014 G |
Selected Per-Share Data | |
Net asset value, beginning of period | $ 14.31 |
Income from Investment Operations | |
Net investment income (loss) D | .21 |
Net realized and unrealized gain (loss) | 2.20 |
Total from investment operations | 2.41 |
Distributions from net investment income | (.10) |
Distributions from net realized gain | (.21) |
Total distributions | (.32) I |
Net asset value, end of period | $ 16.40 |
Total ReturnB, C | 17.06% |
Ratios to Average Net Assets E, H | |
Expenses before reductions | .54%A |
Expenses net of fee waivers, if any | .54%A |
Expenses net of all reductions | .54%A |
Net investment income (loss) | 1.59% A |
Supplemental Data | |
Net assets, end of period (000 omitted) | $ 117 |
Portfolio turnover rateF | 28% A |
A Annualized
B Total returns for periods of less than one year are not annualized.
C Total returns would have been lower if certain expenses had not been reduced during the applicable periods shown.
D Calculated based on average shares outstanding during the period.
E Fees and expenses of any underlying Fidelity Central Funds are not included in the Fund's expense ratio. The Fund indirectly bears its proportionate share of the expenses of any underlying Fidelity Central Funds.
F Amount does not include the portfolio activity of any underlying Fidelity Central Funds.
G For the period August 13, 2013 (commencement of sale of shares) to June 30, 2014.
H Expense ratios reflect operating expenses of the class. Expenses before reductions do not reflect amounts reimbursed by the investment adviser or reductions from brokerage service arrangements or reductions from other expense offset arrangements and do not represent the amount paid by the class during periods when reimbursements or reductions occur. Expense ratios before reductions for start-up periods may not be representative of longer-term operation periods. Expenses net of fee waivers reflect expenses after reimbursement by the investment adviser but prior to reductions from brokerage service arrangements or other expense offset arrangements. Expenses net of all reductions represent the net expenses paid by the class.
I Total distributions of $.32 per share is comprised of distributions from net investment income of $.104 and distributions from net realized gain of $.213 per share.
See accompanying notes which are an integral part of the financial statements.
Annual Report
Notes to Financial Statements
For the period ended June 30, 2014
1. Organization.
Fidelity Mega Cap Stock Fund (the Fund) is a fund of Fidelity Hastings Street Trust (the Trust) and is authorized to issue an unlimited number of shares. The Trust is registered under the Investment Company Act of 1940, as amended (the 1940 Act), as an open-end management investment company organized as a Massachusetts business trust. The Fund commenced sale of Class Z shares on August 13, 2013. The Fund offers Class A, Class T, Class C, Mega Cap Stock, Institutional Class and Class Z shares, each of which, along with Class B shares, has equal rights as to assets and voting privileges. Class B shares are closed to new accounts and additional purchases, except for exchanges and reinvestments. Each class has exclusive voting rights with respect to matters that affect that class. Class B shares will automatically convert to Class A shares after a holding period of seven years from the initial date of purchase.
2. Investments in Fidelity Central Funds.
The Fund invests in Fidelity Central Funds, which are open-end investment companies generally available only to other investment companies and accounts managed by the investment adviser and its affiliates. The Fund's Schedule of Investments lists each of the Fidelity Central Funds held as of period end, if any, as an investment of the Fund, but does not include the underlying holdings of each Fidelity Central Fund. As an Investing Fund, the Fund indirectly bears its proportionate share of the expenses of the underlying Fidelity Central Funds.
The Money Market Central Funds seek preservation of capital and current income and are managed by Fidelity Investments Money Management, Inc. (FIMM), an affiliate of the investment adviser. Annualized expenses of the Money Market Central Funds as of their most recent shareholder report date are less than .01%.
A complete unaudited list of holdings for each Fidelity Central Fund is available upon request or at the Securities and Exchange Commission (the SEC) website at www.sec.gov. In addition, the financial statements of the Fidelity Central Funds, which are not covered by the Fund's Report of Independent Registered Public Accounting Firm, are available on the SEC website or upon request.
3. Significant Accounting Policies.
The financial statements have been prepared in conformity with accounting principles generally accepted in the United States of America (GAAP), which require management to make certain estimates and assumptions at the date of the financial statements. Actual results could differ from those estimates. Subsequent events, if any, through the date that the financial statements were issued have been evaluated in the preparation of the financial statements. The following summarizes the significant accounting policies of the Fund:
Annual Report
Notes to Financial Statements - continued
3. Significant Accounting Policies - continued
Investment Valuation. Investments are valued as of 4:00 p.m. Eastern time on the last calendar day of the period. In accordance with valuation policies and procedures approved by the Board of Trustees (the Board), the Fund attempts to obtain prices from one or more third party pricing vendors or brokers to value its investments. When current market prices, quotations or currency exchange rates are not readily available or reliable, investments will be fair valued in good faith by the Fidelity Management & Research Company (FMR) Fair Value Committee (the Committee), in accordance with procedures adopted by the Board. Factors used in determining fair value vary by investment type and may include market or investment specific events. The frequency with which these procedures are used cannot be predicted and they may be utilized to a significant extent. The Committee oversees the Fund's valuation policies and procedures and is responsible for approving and reporting to the Board all fair value determinations.
The Fund categorizes the inputs to valuation techniques used to value its investments into a disclosure hierarchy consisting of three levels as shown below:
Level 1 - quoted prices in active markets for identical investments
Level 2 - other significant observable inputs (including quoted prices for similar investments, interest rates, prepayment speeds, etc.)
Level 3 - unobservable inputs (including the Fund's own assumptions based on the best information available)
Valuation techniques used to value the Fund's investments by major category are as follows:
Equity securities, including restricted securities, for which market quotations are readily available, are valued at the last reported sale price or official closing price as reported by a third party pricing vendor on the primary market or exchange on which they are traded and are categorized as Level 1 in the hierarchy. In the event there were no sales during the day or closing prices are not available, securities are valued at the last quoted bid price or may be valued using the last available price and are generally categorized as Level 2 in the hierarchy. For foreign equity securities, when market or security specific events arise, comparisons to the valuation of American Depositary Receipts (ADRs), futures contracts, Exchange-Traded Funds (ETFs) and certain indexes as well as quoted prices for similar securities may be used and would be categorized as Level 2 in the hierarchy. Utilizing these techniques may result in transfers between Level 1 and Level 2. For equity securities, including restricted securities, where observable inputs are limited, assumptions about market activity and risk are used and these securities may be categorized as Level 3 in the hierarchy.
Annual Report
3. Significant Accounting Policies - continued
Investment Valuation - continued
Investments in open-end mutual funds, including the Fidelity Central Funds, are valued at their closing net asset value (NAV) each business day and are categorized as Level 1 in the hierarchy.
Changes in valuation techniques may result in transfers in or out of an assigned level within the disclosure hierarchy. The aggregate value of investments by input level, as of June 30, 2014 is included at the end of the Fund's Schedule of Investments.
Foreign Currency. The Fund may use foreign currency contracts to facilitate transactions in foreign-denominated securities. Gains and losses from these transactions may arise from changes in the value of the foreign currency or if the counterparties do not perform under the contracts' terms.
Foreign-denominated assets, including investment securities, and liabilities are translated into U.S. dollars at the exchange rates at period end. Purchases and sales of investment securities, income and dividends received and expenses denominated in foreign currencies are translated into U.S. dollars at the exchange rate in effect on the transaction date.
The effects of exchange rate fluctuations on investments are included with the net realized and unrealized gain (loss) on investment securities. Other foreign currency transactions resulting in realized and unrealized gain (loss) are disclosed separately.
Investment Transactions and Income. For financial reporting purposes, the Fund's investment holdings and NAV include trades executed through the end of the last business day of the period. The NAV per share for processing shareholder transactions is calculated as of the close of business of the New York Stock Exchange (NYSE), normally 4:00 p.m. Eastern time and includes trades executed through the end of the prior business day. Gains and losses on securities sold are determined on the basis of identified cost and may include proceeds received from litigation. Dividend income is recorded on the ex-dividend date, except for certain dividends from foreign securities where the ex-dividend date may have passed, which are recorded as soon as the Fund is informed of the ex-dividend date. Non-cash dividends included in dividend income, if any, are recorded at the fair market value of the securities received. Income and capital gain distributions from Fidelity Central Funds, if any, are recorded on the ex-dividend date. Distributions received on securities that represent a return of capital or capital gain are recorded as a reduction of cost of investments and/or as a realized gain. Subsequent to ex-dividend date the Fund determines the components of these distributions, based upon receipt of tax filings or other correspondence relating to the underlying investment. Interest income is accrued as earned and includes coupon interest and amortization of premium and accretion of discount on debt securities as applicable. Investment income is recorded net of foreign taxes withheld where recovery of such taxes is uncertain.
Annual Report
Notes to Financial Statements - continued
3. Significant Accounting Policies - continued
Class Allocations and Expenses. Investment income, realized and unrealized capital gains and losses, common expenses of the Fund, and certain fund-level expense reductions, if any, are allocated daily on a pro-rata basis to each class based on the relative net assets of each class to the total net assets of the Fund. Each class differs with respect to transfer agent and distribution and service plan fees incurred. Certain expense reductions may also differ by class. For the reporting period, the allocated portion of income and expenses to each class as a percent of its average net assets may vary due to the timing of recording these transactions in relation to fluctuating net assets of the classes. Expenses directly attributable to a fund are charged to that fund. Expenses attributable to more than one fund are allocated among the respective funds on the basis of relative net assets or other appropriate methods. Expense estimates are accrued in the period to which they relate and adjustments are made when actual amounts are known.
Income Tax Information and Distributions to Shareholders. Each year, the Fund intends to qualify as a regulated investment company under Subchapter M of the Internal Revenue Code, including distributing substantially all of its taxable income and realized gains. As a result, no provision for U.S. Federal income taxes is required. As of June 30, 2014, the Fund did not have any unrecognized tax benefits in the financial statements; nor is the Fund aware of any tax positions for which it is reasonably possible that the total amounts of unrecognized tax benefits will significantly change in the next twelve months. The Fund files a U.S. federal tax return, in addition to state and local tax returns as required. The Fund's federal income tax returns are subject to examination by the Internal Revenue Service (IRS) for a period of three fiscal years after they are filed. State and local tax returns may be subject to examination for an additional fiscal year depending on the jurisdiction. Foreign taxes are provided for based on the Fund's understanding of the tax rules and rates that exist in the foreign markets in which it invests.
Distributions are declared and recorded on the ex-dividend date. Income dividends and capital gain distributions are declared separately for each class. Income and capital gain distributions are determined in accordance with income tax regulations, which may differ from GAAP. In addition, the Fund claimed a portion of the payment made to redeeming shareholders as a distribution for income tax purposes.
Capital accounts within the financial statements are adjusted for permanent book-tax differences. These adjustments have no impact on net assets or the results of operations. Capital accounts are not adjusted for temporary book-tax differences which will reverse in a subsequent period.
Book-tax differences are primarily due to foreign currency transactions, equity-debt classifications, capital loss carryforwards, and losses deferred due to wash sales.
Annual Report
3. Significant Accounting Policies - continued
Income Tax Information and Distributions to Shareholders - continued
The federal tax cost of investment securities and unrealized appreciation (depreciation) as of period end were as follows:
Gross unrealized appreciation | $ 868,594,923 |
Gross unrealized depreciation | (16,059,631) |
Net unrealized appreciation (depreciation) on securities and other investments | $ 852,535,292 |
| |
Tax Cost | $ 2,823,608,973 |
The tax-based components of distributable earnings as of period end were as follows:
Undistributed ordinary income | $ 28,109,862 |
Undistributed long-term capital gain | $ 78,650,493 |
Net unrealized appreciation (depreciation) | $ 852,542,261 |
The tax character of distributions paid was as follows:
| June 30, 2014 | June 30, 2013 |
Ordinary Income | $ 36,293,656 | $ 27,575,489 |
Long-term Capital Gains | 41,182,371 |
|
Total | $ 77,476,027 | $ 27,575,489 |
Restricted Securities. The Fund may invest in securities that are subject to legal or contractual restrictions on resale. These securities generally may be resold in transactions exempt from registration or to the public if the securities are registered. Disposal of these securities may involve time-consuming negotiations and expense, and prompt sale at an acceptable price may be difficult. Information regarding restricted securities is included at the end of the Fund's Schedule of Investments.
4. Purchases and Sales of Investments.
Purchases and sales of securities, other than short-term securities, aggregated $1,277,032,508 and $853,056,484, respectively.
5. Fees and Other Transactions with Affiliates.
Management Fee. Fidelity Management & Research Company (the investment adviser) and its affiliates provide the Fund with investment management related services for which the Fund pays a monthly management fee. The management fee is the sum of an individual fund fee rate that is based on an annual rate of .20% of the Fund's
Annual Report
Notes to Financial Statements - continued
5. Fees and Other Transactions with Affiliates - continued
Management Fee - continued
average net assets and an annualized group fee rate that averaged .25% during the period. The group fee rate is based upon the average net assets of all the mutual funds advised by the investment adviser, including any mutual funds previously advised by the investment adviser that are currently advised by Fidelity SelectCo, LLC, an affiliate of the investment adviser. The group fee rate decreases as assets under management increase and increases as assets under management decrease. For the reporting period, the total annual management fee rate was .45% of the Fund's average net assets.
Distribution and Service Plan Fees. In accordance with Rule 12b-1 of the 1940 Act, the Fund has adopted separate Distribution and Service Plans for each class of shares. Certain classes pay Fidelity Distributors Corporation (FDC), an affiliate of the investment adviser, separate Distribution and Service Fees, each of which is based on an annual percentage of each class' average net assets. In addition, FDC may pay financial intermediaries for selling shares of the Fund and providing shareholder support services. For the period, the Distribution and Service Fee rates, total fees and amounts retained by FDC were as follows:
| Distribution
Fee | Service
Fee | Total Fees | Retained
by FDC |
Class A | -% | .25% | $ 87,546 | $ 3,362 |
Class T | .25% | .25% | 63,304 | 232 |
Class B | .75% | .25% | 9,175 | 6,896 |
Class C | .75% | .25% | 124,784 | 55,523 |
| | | $ 284,809 | $ 66,013 |
Sales Load. FDC may receive a front-end sales charge of up to 5.75% for selling Class A shares and 3.50% for selling Class T shares, some of which is paid to financial intermediaries for selling shares of the Fund. Depending on the holding period, FDC may receive contingent deferred sales charges levied on Class A, Class T, Class B, and Class C redemptions. The deferred sales charges range from 5.00% to 1.00% for Class B shares, 1.00% for Class C shares, 1.00% for certain purchases of Class A shares and .25% for certain purchases of Class T shares.
Annual Report
5. Fees and Other Transactions with Affiliates - continued
Sales Load - continued
For the period, sales charge amounts retained by FDC were as follows:
| Retained
by FDC |
Class A | $ 20,530 |
Class T | 3,915 |
Class B* | 699 |
Class C* | 897 |
| $ 26,041 |
* When Class B and Class C shares are initially sold, FDC pays commissions from its own resources to financial intermediaries through which the sales are made.
Transfer Agent Fees. Fidelity Investments Institutional Operations Company, Inc., (FIIOC), an affiliate of the investment adviser, is the transfer, dividend disbursing and shareholder servicing agent for each class of the Fund. FIIOC receives account fees and asset-based fees that vary according to the account size and type of account of the shareholders of the respective classes of the Fund, except for Class Z. FIIOC receives an asset-based fee of Class Z's average net assets. FIIOC pays for typesetting, printing and mailing of shareholder reports, except proxy statements.
For the period, transfer agent fees for each class were as follows:
| Amount | % of
Average
Net Assets |
Class A | $ 74,123 | .21 |
Class T | 28,367 | .22 |
Class B | 2,566 | .28 |
Class C | 26,868 | .22 |
Mega Cap Stock | 4,669,765 | .18 |
Institutional Class | 944,693 | .22 |
Class Z | 44 | .05* |
| $ 5,746,426 | |
* Annualized
Accounting and Security Lending Fees. Fidelity Service Company, Inc. (FSC), an affiliate of the investment adviser, maintains the Fund's accounting records. The accounting fee is based on the level of average net assets for each month. Under a separate contract, FSC administers the security lending program. The security lending fee is based on the number and duration of lending transactions.
Annual Report
Notes to Financial Statements - continued
5. Fees and Other Transactions with Affiliates - continued
Brokerage Commissions. The Fund placed a portion of its portfolio transactions with brokerage firms which are affiliates of the investment adviser. Brokerage commissions are included in net realized gain (loss) and change in net unrealized appreciation (depreciation) in the Statement of Operations. The commissions paid to these affiliated firms were $17,995 for the period.
Interfund Lending Program. Pursuant to an Exemptive Order issued by the SEC, the Fund, along with other registered investment companies having management contracts with FMR or other affiliated entities of FMR, may participate in an interfund lending program. This program provides an alternative credit facility allowing the funds to borrow from, or lend money to, other participating affiliated funds. At period end, there were no interfund loans outstanding. The Fund's activity in this program during the period for which loans were outstanding was as follows:
Borrower or Lender | Average Loan
Balance | Weighted Average Interest Rate | Interest
Expense |
Borrower | $ 9,205,303 | .30% | $ 2,541 |
6. Committed Line of Credit.
The Fund participates with other funds managed by the investment adviser FMR or an affiliate in a $4.25 billion credit facility (the "line of credit") to be utilized for temporary or emergency purposes to fund shareholder redemptions or for other short-term liquidity purposes. The Fund has agreed to pay commitment fees on its pro-rata portion of the line of credit, which amounted to $5,038 and is reflected in Miscellaneous expenses on the Statement of Operations. During the period, the Fund did not borrow on this line of credit.
7. Security Lending.
The Fund lends portfolio securities through a lending agent from time to time in order to earn additional income. For equity securities, a lending agent is used and may loan securities to certain qualified borrowers, including Fidelity Capital Markets (FCM), a broker-dealer affiliated with the Fund. On the settlement date of the loan, the Fund receives collateral (in the form of U.S. Treasury obligations, letters of credit and/or cash) against the loaned securities and maintains collateral in an amount not less than 100% of the market value of the loaned securities during the period of the loan. The market value of the loaned securities is determined at the close of business of the Fund and any additional required collateral is delivered to the Fund on the next business day. If the borrower defaults on its obligation to return the securities loaned because of insolvency or other reasons, the Fund may apply collateral received from the borrower against the obligation. The Fund may experience delays and costs in recovering the securities
Annual Report
7. Security Lending - continued
loaned. Any cash collateral received is invested in the Fidelity Securities Lending Cash Central Fund. The value of loaned securities and cash collateral at period end are disclosed on the Fund's Statement of Assets and Liabilities. Security lending income represents the income earned on investing cash collateral, less rebates paid to borrowers and any lending agent fees associated with the loan, plus any premium payments received for lending certain types of securities. Security lending income is presented in the Statement of Operations as a component of income from Fidelity Central Funds. Total security lending income during the period amounted to $89,556. During the period, there were no securities loaned to FCM.
8. Bank Borrowings.
The Fund is permitted to have bank borrowings for temporary or emergency purposes to fund shareholder redemptions or for other short-term liquidity requirements. The Fund has established borrowing arrangements with certain banks. The interest rate on the borrowings is the bank's base rate, as revised from time to time. The average loan balance during the period for which loans were outstanding amounted to $8,939,500. The weighted average interest rate was .57%. The interest expense amounted to $283 under the bank borrowing program. At period end, there were no bank borrowings outstanding.
9. Expense Reductions.
The investment adviser voluntarily agreed to reimburse each class to the extent annual operating expenses exceeded certain levels of average net assets as noted in the table below. Some expenses, for example interest expense, including commitment fees, are excluded from this reimbursement.
The following classes were in reimbursement during the period:
| Reimbursement |
Class A | $ 125 |
Class T | 56 |
Class B | 4 |
Class C | 50 |
Mega Cap Stock | 11,993 |
Institutional Class | 1,697 |
| $ 13,925 |
In addition, the investment adviser reimbursed a portion of the Fund's operating expenses during the period in the amount of $6,711.
Commissions paid to certain brokers with whom the investment adviser, or its affiliates, places trades on behalf of the Fund include an amount in addition to trade execution, which may be rebated back to the Fund to offset certain expenses. This amount totaled $16,290 for the period.
Annual Report
Notes to Financial Statements - continued
10. Distributions to Shareholders.
Distributions to shareholders of each class were as follows:
Years ended June 30, | 2014 A | 2013 |
From net investment income | | |
Class A | $ 295,572 | $ 137,534 |
Class T | 98,011 | 36,492 |
Class B | 2,617 | 2,304 |
Class C | 56,227 | 13,133 |
Mega Cap Stock | 30,989,923 | 23,359,421 |
Institutional Class | 4,262,259 | 4,026,605 |
Class Z | 727 | - |
Total | $ 35,705,336 | $ 27,575,489 |
From net realized gain | | |
Class A | $ 453,140 | $ - |
Class T | 181,208 | - |
Class B | 13,697 | - |
Class C | 173,595 | - |
Mega Cap Stock | 35,870,113 | - |
Institutional Class | 5,077,450 | - |
Class Z | 1,488 | - |
Total | $ 41,770,691 | $ - |
A Distributions for Class Z are for the period August 13, 2013 (commencement of sale of shares) to June 30, 2014.
11. Share Transactions.
Transactions for each class of shares were as follows:
| Shares | Dollars |
Years ended June 30, | 2014 A | 2013 | 2014 A | 2013 |
Class A | | | | |
Shares sold | 3,913,806 | 1,001,677 | $ 60,286,671 | $ 12,394,211 |
Reinvestment of distributions | 45,968 | 11,084 | 673,798 | 127,952 |
Shares redeemed | (725,328) | (279,053) | (11,077,893) | (3,495,724) |
Net increase (decrease) | 3,234,446 | 733,708 | $ 49,882,576 | $ 9,026,439 |
Class T | | | | |
Shares sold | 595,712 | 517,456 | $ 8,877,747 | $ 6,404,547 |
Reinvestment of distributions | 18,863 | 3,084 | 276,847 | 35,826 |
Shares redeemed | (270,157) | (107,959) | (4,055,631) | (1,368,248) |
Net increase (decrease) | 344,418 | 412,581 | $ 5,098,963 | $ 5,072,125 |
Annual Report
11. Share Transactions - continued
| Shares | Dollars |
Years ended June 30, | 2014 A | 2013 | 2014 A | 2013 |
Class B | | | | |
Shares sold | 27,198 | 9,952 | $ 400,691 | $ 125,476 |
Reinvestment of distributions | 1,081 | 196 | 15,861 | 2,261 |
Shares redeemed | (24,976) | (20,917) | (377,365) | (255,293) |
Net increase (decrease) | 3,303 | (10,769) | $ 39,187 | $ (127,556) |
Class C | | | | |
Shares sold | 504,584 | 448,373 | $ 7,460,222 | $ 5,664,292 |
Reinvestment of distributions | 15,230 | 988 | 221,741 | 11,494 |
Shares redeemed | (83,515) | (116,347) | (1,262,211) | (1,448,415) |
Net increase (decrease) | 436,299 | 333,014 | $ 6,419,752 | $ 4,227,371 |
Mega Cap Stock | | | | |
Shares sold | 53,817,396 | 84,998,537 | $ 817,611,772 | $ 1,035,668,817 |
Reinvestment of distributions | 4,142,626 | 1,836,891 | 61,008,516 | 21,294,763 |
Shares redeemed | (46,852,676) | (39,801,746) | (705,756,204) | (498,490,773) |
Net increase (decrease) | 11,107,346 | 47,033,682 | $ 172,864,084 | $ 558,472,807 |
Institutional Class | | | | |
Shares sold | 19,497,644 | 11,389,839 | $ 301,200,514 | $ 129,734,591 |
Reinvestment of distributions | 626,527 | 338,467 | 9,201,440 | 3,911,623 |
Shares redeemed | (2,047,800) | (4,517,962) | (31,155,657) | (57,335,322) |
Net increase (decrease) | 18,076,371 | 7,210,344 | $ 279,246,297 | $ 76,310,892 |
Class Z | | | | |
Shares sold | 6,988 | - | $ 100,000 | $ - |
Reinvestment of distributions | 150 | - | 2,215 | - |
Net increase (decrease) | 7,138 | - | $ 102,215 | $ - |
A Share transactions for Class Z are for the period August 13, 2013 (commencement of sale of shares) to June 30, 2014.
12. Other.
The Fund's organizational documents provide former and current trustees and officers with a limited indemnification against liabilities arising in connection with the performance of their duties to the Fund. In the normal course of business, the Fund may also enter into contracts that provide general indemnifications. The Fund's maximum exposure under these arrangements is unknown as this would be dependent on future claims that may be made against the Fund. The risk of material loss from such claims is considered remote.
At the end of the period, Strategic Advisers U.S. Opportunity Fund was the owner of record of approximately 11% of the total outstanding shares of the Fund.
Annual Report
To the Trustees of Fidelity Hastings Street Trust and the Shareholders of Fidelity Mega Cap Stock Fund:
In our opinion, the accompanying statement of assets and liabilities, including the schedule of investments, and the related statements of operations and of changes in net assets and the financial highlights present fairly, in all material respects, the financial position of Fidelity Mega Cap Stock Fund (a fund of Fidelity Hastings Street Trust) at June 30, 2014, the results of its operations for the year then ended, the changes in its net assets for each of the two years in the period then ended and the financial highlights for each of the periods indicated, in conformity with accounting principles generally accepted in the United States of America. These financial statements and financial highlights (hereafter referred to as "financial statements") are the responsibility of the Fidelity Mega Cap Stock Fund's management. Our responsibility is to express an opinion on these financial statements based on our audits. We conducted our audits of these financial statements in accordance with the standards of the Public Company Accounting Oversight Board (United States). Those standards require that we plan and perform the audit to obtain reasonable assurance about whether the financial statements are free of material misstatement. An audit includes examining, on a test basis, evidence supporting the amounts and disclosures in the financial statements, assessing the accounting principles used and significant estimates made by management, and evaluating the overall financial statement presentation. We believe that our audits, which included confirmation of securities at June 30, 2014 by correspondence with the custodian and brokers, provide a reasonable basis for our opinion.
PricewaterhouseCoopers LLP
Boston, Massachusetts
August 12, 2014
Annual Report
The Trustees, Member of the Advisory Board, and officers of the trust and fund, as applicable, are listed below. The Board of Trustees governs the fund and is responsible for protecting the interests of shareholders. The Trustees are experienced executives who meet periodically throughout the year to oversee the fund's activities, review contractual arrangements with companies that provide services to the fund, oversee management of the risks associated with such activities and contractual arrangements, and review the fund's performance. Except for James C. Curvey, each of the Trustees oversees 173 funds. Mr. Curvey oversees 397 funds.
The Trustees hold office without limit in time except that (a) any Trustee may resign; (b) any Trustee may be removed by written instrument, signed by at least two-thirds of the number of Trustees prior to such removal; (c) any Trustee who requests to be retired or who has become incapacitated by illness or injury may be retired by written instrument signed by a majority of the other Trustees; and (d) any Trustee may be removed at any special meeting of shareholders by a two-thirds vote of the outstanding voting securities of the trust. Each Trustee who is not an interested person (as defined in the 1940 Act) of the trust and the fund (Independent Trustee), shall retire not later than the last day of the calendar year in which his or her 75th birthday occurs. The Independent Trustees may waive this mandatory retirement age policy with respect to individual Trustees. The officers and Advisory Board Member hold office without limit in time, except that any officer and Advisory Board Member may resign or may be removed by a vote of a majority of the Trustees at any regular meeting or any special meeting of the Trustees. Except as indicated, each individual has held the office shown or other offices in the same company for the past five years.
Experience, Skills, Attributes, and Qualifications of the Fund's Trustees. The Governance and Nominating Committee has adopted a statement of policy that describes the experience, qualifications, attributes, and skills that are necessary and desirable for potential Independent Trustee candidates (Statement of Policy). The Board believes that each Trustee satisfied at the time he or she was initially elected or appointed a Trustee, and continues to satisfy, the standards contemplated by the Statement of Policy. The Governance and Nominating Committee also engages professional search firms to help identify potential Independent Trustee candidates who have the experience, qualifications, attributes, and skills consistent with the Statement of Policy. From time to time, additional criteria based on the composition and skills of the current Independent Trustees, as well as experience or skills that may be appropriate in light of future changes to board composition, business conditions, and regulatory or other developments, have also been considered by the professional search firms and the Governance and Nominating Committee. In addition, the Board takes into account the Trustees' commitment and participation in Board and committee meetings, as well as their leadership of standing and ad hoc committees throughout their tenure.
In determining that a particular Trustee was and continues to be qualified to serve as a Trustee, the Board has considered a variety of criteria, none of which, in isolation, was controlling. The Board believes that, collectively, the Trustees have balanced and diverse experience, qualifications, attributes, and skills, which allow the Board to operate effectively in governing the fund and protecting the interests of shareholders. Information about the specific experience, skills, attributes, and qualifications of each Trustee, which in each case led to the Board's conclusion that the Trustee should serve (or continue to serve) as a trustee of the fund, is provided below.
Annual Report
Board Structure and Oversight Function. James C. Curvey is an interested person (as defined in the 1940 Act) and currently serves as Chairman. The Trustees have determined that an interested Chairman is appropriate and benefits shareholders because an interested Chairman has a personal and professional stake in the quality and continuity of services provided to the fund. Independent Trustees exercise their informed business judgment to appoint an individual of their choosing to serve as Chairman, regardless of whether the Trustee happens to be independent or a member of management. The Independent Trustees have determined that they can act independently and effectively without having an Independent Trustee serve as Chairman and that a key structural component for assuring that they are in a position to do so is for the Independent Trustees to constitute a substantial majority for the Board. The Independent Trustees also regularly meet in executive session. Ned C. Lautenbach serves as Chairman of the Independent Trustees and as such (i) acts as a liaison between the Independent Trustees and management with respect to matters important to the Independent Trustees and (ii) with management prepares agendas for Board meetings.
Fidelity funds are overseen by different Boards of Trustees. The fund's Board oversees Fidelity's equity and high income funds and another Board oversees Fidelity's investment-grade bond, money market, and asset allocation funds. The asset allocation funds may invest in Fidelity funds overseen by the fund's Board. The use of separate Boards, each with its own committee structure, allows the Trustees of each group of Fidelity funds to focus on the unique issues of the funds they oversee, including common research, investment, and operational issues. On occasion, the separate Boards establish joint committees to address issues of overlapping consequences for the Fidelity funds overseen by each Board.
The Trustees operate using a system of committees to facilitate the timely and efficient consideration of all matters of importance to the Trustees, the fund, and fund shareholders and to facilitate compliance with legal and regulatory requirements and oversight of the fund's activities and associated risks. The Board, acting through its committees, has charged FMR and its affiliates with (i) identifying events or circumstances the occurrence of which could have demonstrably adverse effects on the fund's business and/or reputation; (ii) implementing processes and controls to lessen the possibility that such events or circumstances occur or to mitigate the effects of such events or circumstances if they do occur; and (iii) creating and maintaining a system designed to evaluate continuously business and market conditions in order to facilitate the identification and implementation processes described in (i) and (ii) above. Because the day-to-day operations and activities of the fund are carried out by or through FMR, its affiliates and other service providers, the fund's exposure to risks is mitigated but not eliminated by the processes overseen by the Trustees. While each of the Board's committees has responsibility for overseeing different aspects of the fund's activities, oversight is exercised primarily through the Operations, Audit, and Compliance Committees. In addition, the Independent Trustees have worked with FMR to enhance the Board's oversight of investment and financial risks, legal and regulatory risks, technology risks, and operational risks, including the development of additional risk reporting to the Board. For example, a working group comprised of Independent Trustees and FMR has worked and continues to work to review the Fidelity funds' valuation-related activities, reporting and risk management. Appropriate personnel, including but not limited to the fund's Chief Compliance Officer (CCO), FMR's internal auditor, the independent accountants, the fund's Treasurer and portfolio management personnel, make periodic reports to the Board's committees, as appropriate, including an annual review of FMR's risk management program for the Fidelity funds. The responsibilities of each standing committee, including their oversight responsibilities, are described further under "Standing Committees of the Fund's Trustees."
Annual Report
Trustees and Officers - continued
The fund's Statement of Additional Information (SAI) includes more information about the Trustees. To request a free copy, call Fidelity at 1-877-208-0098.
Interested Trustees*:
Correspondence intended for each Trustee who is an interested person may be sent to Fidelity Investments, 245 Summer Street, Boston, Massachusetts 02210.
Name, Year of Birth; Principal Occupations and Other Relevant Experience+ |
James C. Curvey (1935) |
Year of Election or Appointment: 2007 Trustee Chairman of the Board of Trustees |
| Mr. Curvey also serves as Trustee of other Fidelity funds. Mr. Curvey is a Director of Fidelity Research & Analysis Co. (2009-present), and Vice Chairman (2007-present) and Director of FMR LLC. In addition, Mr. Curvey serves as an Overseer for the Boston Symphony Orchestra and a member of the Trustees of Villanova University. Previously, Mr. Curvey served as a Director of Fidelity Investments Money Management, Inc. (2009-2014), a Director of FMR (2007-2014), a Director of FMR Co., Inc. (2007-2014) and was the Vice Chairman (2006-2007) and Director (2000-2007) of FMR Corp. |
Charles S. Morrison (1960) |
Year of Election or Appointment: 2014 Trustee |
| Mr. Morrison also serves as Trustee of other funds. He serves as President, Asset Management (2014-present) and is an employee of Fidelity Investments. Previously, Mr. Morrison served as Vice President of Fidelity's Fixed Income and Asset Allocation Funds (2012-2014), President, Fixed Income (2011-2014), Vice President of Fidelity's Money Market Funds (2005-2009), President, Money Market Group Leader of FMR (2009), and Senior Vice President, Money Market Group of FMR (2004-2009). Mr. Morrison also served as Vice President of Fidelity's Bond Funds (2002-2005), certain Balanced Funds (2002-2005), and certain Asset Allocation Funds (2002-2007), and as Senior Vice President (2002-2005) of Fidelity's Bond Division. |
* Trustees have been determined to be "Interested Trustees" by virtue of, among other things, their affiliation with the trust or various entities under common control with FMR.
+ The information above includes each Trustee's principal occupation during the last five years and other information relating to the experience, attributes, and skills relevant to each Trustee's qualifications to serve as a Trustee, which led to the conclusion that each Trustee should serve as a Trustee for the fund.
Annual Report
Trustees and Officers - continued
Independent Trustees:
Correspondence intended for each Independent Trustee (that is, the Trustees other than the Interested Trustees) may be sent to Fidelity Investments, P.O. Box 55235, Boston, Massachusetts 02205-5235.
Name, Year of Birth; Principal Occupations and Other Relevant Experience+ |
Dennis J. Dirks (1948) |
Year of Election or Appointment: 2005 Trustee |
| Mr. Dirks also serves as Trustee of other Fidelity funds. Prior to his retirement in May 2003, Mr. Dirks was Chief Operating Officer and a member of the Board of The Depository Trust & Clearing Corporation (DTCC). He also served as President, Chief Operating Officer, and Board member of The Depository Trust Company (DTC) and President and Board member of the National Securities Clearing Corporation (NSCC). In addition, Mr. Dirks served as Chief Executive Officer and Board member of the Government Securities Clearing Corporation, Chief Executive Officer and Board member of the Mortgage-Backed Securities Clearing Corporation, as a Trustee and a member of the Finance Committee of Manhattan College (2005-2008), and as a Trustee and a member of the Finance Committee of AHRC of Nassau County (2006-2008). Mr. Dirks is a member of the Independent Directors Council (IDC) Governing Council (2010-present) and Board of Directors for The Brookville Center for Children's Services, Inc. (2009-present). |
Alan J. Lacy (1953) |
Year of Election or Appointment: 2008 Trustee |
| Mr. Lacy also serves as Trustee of other Fidelity funds. Mr. Lacy serves as Senior Adviser (2007-present) of Oak Hill Capital Partners, L.P. (private equity). Mr. Lacy also served as Chief Executive Officer (2000-2005) and Vice Chairman (2005-2006) of Sears Holdings Corporation and Sears, Roebuck and Co. (retail). In addition, Mr. Lacy serves as a member of the Board of Directors of Dave & Buster's Entertainment, Inc. (restaurant and entertainment complexes, 2010-present), Earth Fare, Inc. (retail grocery, 2012-present), The Hillman Companies, Inc. (hardware wholesalers, 2010-present), and Bristol-Myers Squibb Company (global pharmaceuticals, 2008-present). Mr. Lacy is a member of the Board of Trustees of The National Parks Conservation Association (2006-present). Previously, Mr. Lacy served as Chairman of the Board of Trustees of the National Parks Conservation Association (2008-2011) and as a member of the Board of Directors for the Western Union Company (global money transfer, 2006-2011). |
Ned C. Lautenbach (1944) |
Year of Election or Appointment: 2000 Trustee Chairman of the Independent Trustees |
| Mr. Lautenbach also serves as Trustee of other Fidelity funds. Mr. Lautenbach currently serves as the Lead Director of the Eaton Corporation Board of Directors (diversified industrial, 1997-present). Mr. Lautenbach is Chairman of the Board of Directors of the Philharmonic Center for the Arts in Naples, Florida (2012-present) and a member of the Council on Foreign Relations (1994-present). Previously, Mr. Lautenbach was a Partner/Advisory Partner at Clayton, Dubilier & Rice, LLC (private equity investment, 1998-2010), as well as a Director of Sony Corporation (2006-2007). |
Joseph Mauriello (1944) |
Year of Election or Appointment: 2008 Trustee |
| Mr. Mauriello also serves as Trustee of other Fidelity funds. Prior to his retirement in January 2006, Mr. Mauriello served in numerous senior management positions including Deputy Chairman and Chief Operating Officer (2004-2005), and Vice Chairman of Financial Services (2002-2004) of KPMG LLP US (professional services, 1965-2005). Mr. Mauriello currently serves as a member of the Board of Directors of XL Group plc. (global insurance and re-insurance, 2006-present). Previously, Mr. Mauriello served as a Director of the Hamilton Funds of the Bank of New York (2006-2007) and of Arcadia Resources Inc. (health care services and products, 2007-2012). |
Robert W. Selander (1950) |
Year of Election or Appointment: 2011 Trustee |
| Mr. Selander also serves as Trustee of other Fidelity funds. Previously, Mr. Selander served as a Member of the Advisory Board of other Fidelity funds (2011), and Executive Vice Chairman (2010), Chief Executive Officer (2009-2010), and President and Chief Executive Officer (1997-2009) of Mastercard, Inc. |
Cornelia M. Small (1944) |
Year of Election or Appointment: 2005 Trustee |
| Ms. Small also serves as Trustee of other Fidelity funds. Ms. Small is a member of the Board of Directors (2009-present) and Chair of the Investment Committee (2010-present) of the Teagle Foundation. Ms. Small also serves on the Investment Committee of the Berkshire Taconic Community Foundation (2008-present). Previously, Ms. Small served as Chairperson (2002-2008) and a member of the Investment Committee and Chairperson (2008-2012) and a member of the Board of Trustees of Smith College. In addition, Ms. Small served as Chief Investment Officer, Director of Global Equity Investments, and a member of the Board of Directors of Scudder, Stevens & Clark and Scudder Kemper Investments. |
William S. Stavropoulos (1939) |
Year of Election or Appointment: 2001 Trustee Vice Chairman of the Independent Trustees |
| Mr. Stavropoulos also serves as Trustee of other Fidelity funds. Mr. Stavropoulos serves as President and Founder of the Michigan Baseball Foundation, the Great Lakes Loons (2007-present). Mr. Stavropoulos is Chairman Emeritus of the Board of Directors of The Dow Chemical Company, where he previously served in numerous senior management positions, including President, CEO (1995-2000; 2002-2004), Chairman of the Executive Committee (2000-2006), and as a member of the Board of Directors (1990-2006). Currently, Mr. Stavropoulos is Chairman of the Board of Directors of Univar Inc. (global distributor of commodity and specialty chemicals), a Director of Teradata Corporation (data warehousing and technology solutions), and Maersk Inc. (industrial conglomerate), and a member of the Advisory Board for Metalmark Capital LLC (private equity investment, 2005-present). Mr. Stavropoulos is an operating advisor to Clayton, Dubilier & Rice, LLC (private equity investment). In addition, Mr. Stavropoulos is a member of the University of Notre Dame Advisory Council for the College of Science, a Trustee of the Rollin L. Gerstacker Foundation, and a Director of the Naples Philharmonic Center for the Arts. Previously, Mr. Stavropoulos served as a Director of Chemical Financial Corporation (bank holding company, 1993-2012) and Tyco International, Ltd. (multinational manufacturing and services, 2007-2012). |
David M. Thomas (1949) |
Year of Election or Appointment: 2008 Trustee |
| Mr. Thomas also serves as Trustee of other Fidelity funds. Mr. Thomas serves as Non-Executive Chairman of the Board of Directors of Fortune Brands Home and Security (home and security products, 2011-present), and as a member of the Board of Directors of Interpublic Group of Companies, Inc. (marketing communication, 2004-present). Previously, Mr. Thomas served as Executive Chairman (2005-2006) and Chairman and Chief Executive Officer (2000-2005) of IMS Health, Inc. (pharmaceutical and healthcare information solutions), and a Director of Fortune Brands, Inc. (consumer products, 2000-2011). |
+ The information above includes each Trustee's principal occupation during the last five years and other information relating to the experience, attributes, and skills relevant to each Trustee's qualifications to serve as a Trustee, which led to the conclusion that each Trustee should serve as a Trustee for the fund.
Advisory Board Member and Officers:
Correspondence intended for each officer and Peter S. Lynch may be sent to Fidelity Investments, 245 Summer Street, Boston, Massachusetts 02210. Officers appear below in alphabetical order.
Name, Year of Birth; Principal Occupation |
Peter S. Lynch (1944) |
Year of Election or Appointment: 2003 Member of the Advisory Board |
| Mr. Lynch also serves as Member of the Advisory Board of other Fidelity funds. Mr. Lynch is Vice Chairman and a Director of FMR and FMR Co., Inc. In addition, Mr. Lynch serves as a Trustee of Boston College and as the Chairman of the Inner-City Scholarship Fund. Previously, Mr. Lynch served on the Special Olympics International Board of Directors (1997-2006). |
Elizabeth Paige Baumann (1968) |
Year of Election or Appointment: 2012 Anti-Money Laundering (AML) Officer |
| Ms. Baumann also serves as AML Officer of other funds. She is Chief AML Officer of FMR LLC (2012-present) and is an employee of Fidelity Investments. Previously, Ms. Baumann served as Vice President and Deputy Anti-Money Laundering Officer (2007-2012). |
William C. Coffey (1969) |
Year of Election or Appointment: 2009 Assistant Secretary |
| Mr. Coffey also serves as Assistant Secretary of other funds. He is Senior Vice President and Deputy General Counsel of FMR LLC (2010-present), and is an employee of Fidelity Investments. Previously, Mr. Coffey served as Vice President and Associate General Counsel of FMR LLC (2005-2009). |
Jonathan Davis (1968) |
Year of Election or Appointment: 2010 Assistant Treasurer |
| Mr. Davis also serves as Assistant Treasurer of other funds. Mr. Davis is an employee of Fidelity Investments. Previously, Mr. Davis served as Vice President and Associate General Counsel of FMR LLC (2003-2010). |
Adrien E. Deberghes (1967) |
Year of Election or Appointment: 2008 Deputy Treasurer |
| Mr. Deberghes also serves as an officer of other funds. He is an employee of Fidelity Investments (2008-present). Prior to joining Fidelity Investments, Mr. Deberghes was Senior Vice President of Mutual Fund Administration at State Street Corporation (2007-2008), Senior Director of Mutual Fund Administration at Investors Bank & Trust (2005-2007), and Director of Finance for Dunkin' Brands (2000-2005). |
Stephanie J. Dorsey (1969) |
Year of Election or Appointment: 2010 Assistant Treasurer |
| Ms. Dorsey also serves as an officer of other funds. She is an employee of Fidelity Investments (2008-present) and has served in other fund officer roles. Prior to joining Fidelity Investments, Ms. Dorsey served as Treasurer (2004-2008) of the JPMorgan Mutual Funds and Vice President (2004-2008) of JPMorgan Chase Bank. |
Howard J. Galligan III (1966) |
Year of Election or Appointment: 2014 Chief Financial Officer |
| Mr. Galligan also serves as Chief Financial Officer of other funds. Mr. Galligan serves as President of Fidelity Pricing and Cash Management Services (FPCMS) (2014-present) and as a Director of Strategic Advisers, Inc. (2008-present). Previously, Mr. Galligan served as Chief Administrative Officer of Asset Management (2011-2014) and Chief Operating Officer and Senior Vice President of Investment Support for Strategic Advisers, Inc. (2003-2011). |
Scott C. Goebel (1968) |
Year of Election or Appointment: 2008 Secretary and Chief Legal Officer (CLO) |
| Mr. Goebel serves as Secretary and CLO of other funds. Mr. Goebel also serves as Secretary of Fidelity SelectCo, LLC (2013-present), Fidelity Investments Money Management, Inc. (FIMM) (2010-present) and Fidelity Research and Analysis Company (FRAC) (2010-present); General Counsel, Secretary, and Senior Vice President of FMR (2008-present) and FMR Co., Inc. (2008-present); Chief Legal Officer of Fidelity Management & Research (Hong Kong) Limited (2008-present); and Assistant Secretary of Fidelity Management & Research (Japan) Inc. (2008-present) and Fidelity Management & Research (U.K.) Inc. (2008-present). Previously, Mr. Goebel served as Secretary and CLO of other Fidelity funds (2008-2013), Assistant Secretary of FIMM (2008-2010), FRAC (2008-2010), and certain funds (2007-2008); and as Vice President and Secretary of Fidelity Distributors Corporation (FDC) (2005-2007). Mr. Goebel has been employed by FMR LLC or an affiliate since 2001. |
Brian B. Hogan (1964) |
Year of Election or Appointment: 2009 Vice President |
| Mr. Hogan also serves as Trustee or Vice President of other funds. Mr. Hogan serves as President of FMR's Equity Division (2009-present). Previously, Mr. Hogan served as Senior Vice President, Equity Research of FMR (2006-2009) and as a portfolio manager. |
Chris Maher (1972) |
Year of Election or Appointment: 2013 Assistant Treasurer |
| Mr. Maher serves as Assistant Treasurer of other funds. Mr. Maher is Vice President of Valuation Oversight and is an employee of Fidelity Investments. Previously, Mr. Maher served as Vice President of Asset Management Compliance (2013), Vice President of FMR's Program Management Group (2010-2013), and Vice President of Valuation Oversight (2008-2010). |
Melissa M. Reilly (1971) |
Year of Election or Appointment: 2014 Vice President of certain Equity Funds |
| Ms. Reilly also serves as Vice President of other funds. Ms. Reilly is an employee of Fidelity Investments (2004-present). |
Kenneth B. Robins (1969) |
Year of Election or Appointment: 2008 President and Treasurer |
| Mr. Robins also serves as an officer of other funds. Mr. Robins serves as Executive Vice President of Fidelity Investments Money Management, Inc. (FIMM) (2013-present) and is an employee of Fidelity Investments (2004-present). Previously, Mr. Robins served in other fund officer roles. |
Stephen Sadoski (1971) |
Year of Election or Appointment: 2012 Deputy Treasurer |
| Mr. Sadoski also serves as Deputy Treasurer of other funds. He is an employee of Fidelity Investments (2012-present) and has served in another fund officer role. Prior to joining Fidelity Investments, Mr. Sadoski served as an assistant chief accountant in the Division of Investment Management of the Securities and Exchange Commission (SEC) (2009-2012) and as a senior manager at Deloitte & Touche LLP (1997-2009). |
Stacie M. Smith (1974) |
Year of Election or Appointment: 2013 Deputy Treasurer |
| Ms. Smith also serves as an officer of other funds. She is an employee of Fidelity Investments (2009-present) and has served in other fund officer roles. Prior to joining Fidelity Investments, Ms. Smith served as Senior Audit Manager of Ernst & Young LLP (1996-2009). |
Renee Stagnone (1975) |
Year of Election or Appointment: 2013 Deputy Treasurer |
| Ms. Stagnone also serves as Deputy Treasurer of other funds. Ms. Stagnone is an employee of Fidelity Investments. |
Linda J. Wondrack (1964) |
Year of Election or Appointment: 2014 Chief Compliance Officer |
| Ms. Wondrack also serves as Chief Compliance Officer of other funds. Ms. Wondrack is Executive Vice President and head of the Ethics Office and Asset Management Compliance for Fidelity Investments (2012-present). Ms. Wondrack also serves as Chief Compliance Officer of Fidelity SelectCo, LLC (2014-present); Chief Compliance Officer of Impresa Management LLC (2013-present); and Chief Compliance Officer of FMR Co., Inc., Fidelity Investments Money Management, Inc., Fidelity Management & Research (Japan) Inc., Fidelity Management & Research (U.K.) Inc., Fidelity Management & Research (Hong Kong), Fidelity Management & Research Company, Pyramis Global Advisors, LLC, and Strategic Advisers, Inc., Ballyrock Investment Advisors LLC, and Northern Neck Investors LLC (2012-present). Previously, Ms. Wondrack served as Senior Vice President and Chief Compliance Officer for Columbia Management Investment Advisers, LLC (2005-2012); Chief Compliance Officer for certain funds within the Columbia Family of Funds (2007-2012); and Senior Vice President of Compliance Risk Management at Bank of America (2005-2010). |
Joseph F. Zambello (1957) |
Year of Election or Appointment: 2011 Deputy Treasurer |
| Mr. Zambello also serves as Deputy Treasurer of other funds. Mr. Zambello is an employee of Fidelity Investments. Previously, Mr. Zambello served as Vice President of FMR's Program Management Group (2009-2011) and Vice President of the Transfer Agent Oversight Group (2005-2009). |
Annual Report
The Board of Trustees of Fidelity Mega Cap Stock Fund voted to pay to shareholders of record at the opening of business on record date, the following distributions per share derived from capital gains realized from sales of portfolio securities, and dividends derived from net investment income:
| Pay Date | Record Date | Dividends | Capital Gains |
Institutional Class | 08/11/14 | 08/08/14 | $0.056 | $0.341 |
The fund hereby designates as a capital gain dividend with respect to the taxable year ended June 30, 2014, $119,836,862, or, if subsequently determined to be different, the net capital gain of such year.
Institutional Class designates 100% of the dividends distributed during the fiscal year as qualifying for the dividends-received deduction for corporate shareholders.
Institutional Class designates 100% of the dividends distributed during the fiscal year as amounts which may be taken into account as a dividend for purposes of the maximum rate under Section 1(h)(11) of the Internal Revenue Code.
The fund will notify shareholders in January 2015 of amounts for use in preparing 2014 income tax returns.
Annual Report
Investment Adviser
Fidelity Management & Research Company
Boston, MA
Investment Sub-Advisers
FMR Co., Inc.
Fidelity Management & Research
(U.K.) Inc.
Fidelity Management & Research
(Japan) Inc.
Fidelity Management & Research
(Hong Kong) Limited
General Distributor
Fidelity Distributors Corporation
Smithfield, RI
Transfer and Service Agents
Fidelity Investments Institutional Operations Company, Inc.
Boston, MA
Fidelity Service Company, Inc.
Boston, MA
Custodian
JPMorgan Chase Bank
New York, NY
(Fidelity Investment logo)(registered trademark)
AGIII-UANN-0814
1.855219.106
(Fidelity Investment logo)(registered trademark)
Fidelity Advisor®
Mega Cap Stock
Fund - Class Z
Annual Report
June 30, 2014
(Fidelity Cover Art)
Class Z
is a class of Fidelity®
Mega Cap Stock Fund
Contents
Performance | (Click Here) | How the fund has done over time. |
Management's Discussion of Fund Performance | (Click Here) | The Portfolio Manager's review of fund performance and strategy. |
Shareholder Expense Example | (Click Here) | An example of shareholder expenses. |
Investment Changes | (Click Here) | A summary of major shifts in the fund's investments over the past six months. |
Investments | (Click Here) | A complete list of the fund's investments with their market values. |
Financial Statements | (Click Here) | Statements of assets and liabilities, operations, and changes in net assets, as well as financial highlights. |
Notes | (Click Here) | Notes to the financial statements. |
Report of Independent Registered Public Accounting Firm | (Click Here) | |
Trustees and Officers | (Click Here) | |
Distributions | (Click Here) | |
To view a fund's proxy voting guidelines and proxy voting record for the 12-month period ended June 30, visit http://www.fidelity.com/proxyvotingresults or visit the Securities and Exchange Commission's (SEC) web site at http://www.sec.gov. You may also call 1-877-208-0098 to request a free copy of the proxy voting guidelines.
Standard & Poor's, S&P and S&P 500 are registered service marks of The McGraw-Hill Companies, Inc. and have been licensed for use by Fidelity Distributors Corporation.
Other third-party marks appearing herein are the property of their respective owners.
All other marks appearing herein are registered or unregistered trademarks or service marks of FMR LLC or an affiliated company. © 2014 FMR LLC. All rights reserved.
This report and the financial statements contained herein are submitted for the general information of the shareholders of the fund. This report is not authorized for distribution to prospective investors in the fund unless preceded or accompanied by an effective prospectus.
A fund files its complete schedule of portfolio holdings with the SEC for the first and third quarters of each fiscal year on Form N-Q. Forms N-Q are available on the SEC's web site at http://www.sec.gov. A fund's Forms N-Q may be reviewed and copied at the SEC's Public Reference Room in Washington, DC. Information regarding the operation of the SEC's Public Reference Room may be obtained by calling 1-800-SEC-0330. For a complete list of a fund's portfolio holdings, view the most recent holdings listing, semiannual report, or annual report on Fidelity's web site at http://www.fidelity.com, http://www.advisor.fidelity.com, or http://www.401k.com, as applicable.
NOT FDIC INSURED • MAY LOSE VALUE • NO BANK GUARANTEE
Neither the fund nor Fidelity Distributors Corporation is a bank.
Annual Report
Average annual total return reflects the change in the value of an investment, assuming reinvestment of the class' distributions from dividend income and capital gains (the profits earned upon the sale of securities that have grown in value, if any) and assuming a constant rate of performance each year. The $10,000 table and the fund's returns do not reflect the deduction of taxes that a shareholder would pay on fund distributions or the redemption of fund shares. During periods of reimbursement by Fidelity, a fund's total return will be greater than it would be had the reimbursement not occurred. How a fund did yesterday is no guarantee of how it will do tomorrow.
Average Annual Total Returns
Periods ended June 30, 2014 | Past 1
year | Past 5
years | Past 10
Years |
Class Z A, B | 24.40% | 19.70% | 8.24% |
A The initial offering of Class Z shares took place on August 13, 2013. Returns between February 5, 2008 and August 13, 2013 are those of Institutional Class. Returns prior to February 5, 2008, are those of Fidelity® Mega Cap Stock Fund, the original class of the fund.
B Prior to December 1, 2007, the fund operated under certain different investment policies. The fund's historical performance may not represent its current investment policies.
$10,000 Over 10 Years
Let's say hypothetically that $10,000 was invested in Fidelity Advisor® Mega Cap Stock Fund - Class Z on June 30, 2004. The chart shows how the value of your investment would have changed, and also shows how the S&P 500® Index performed over the same period. See footnote A above for additional information regarding the performance of Class Z.
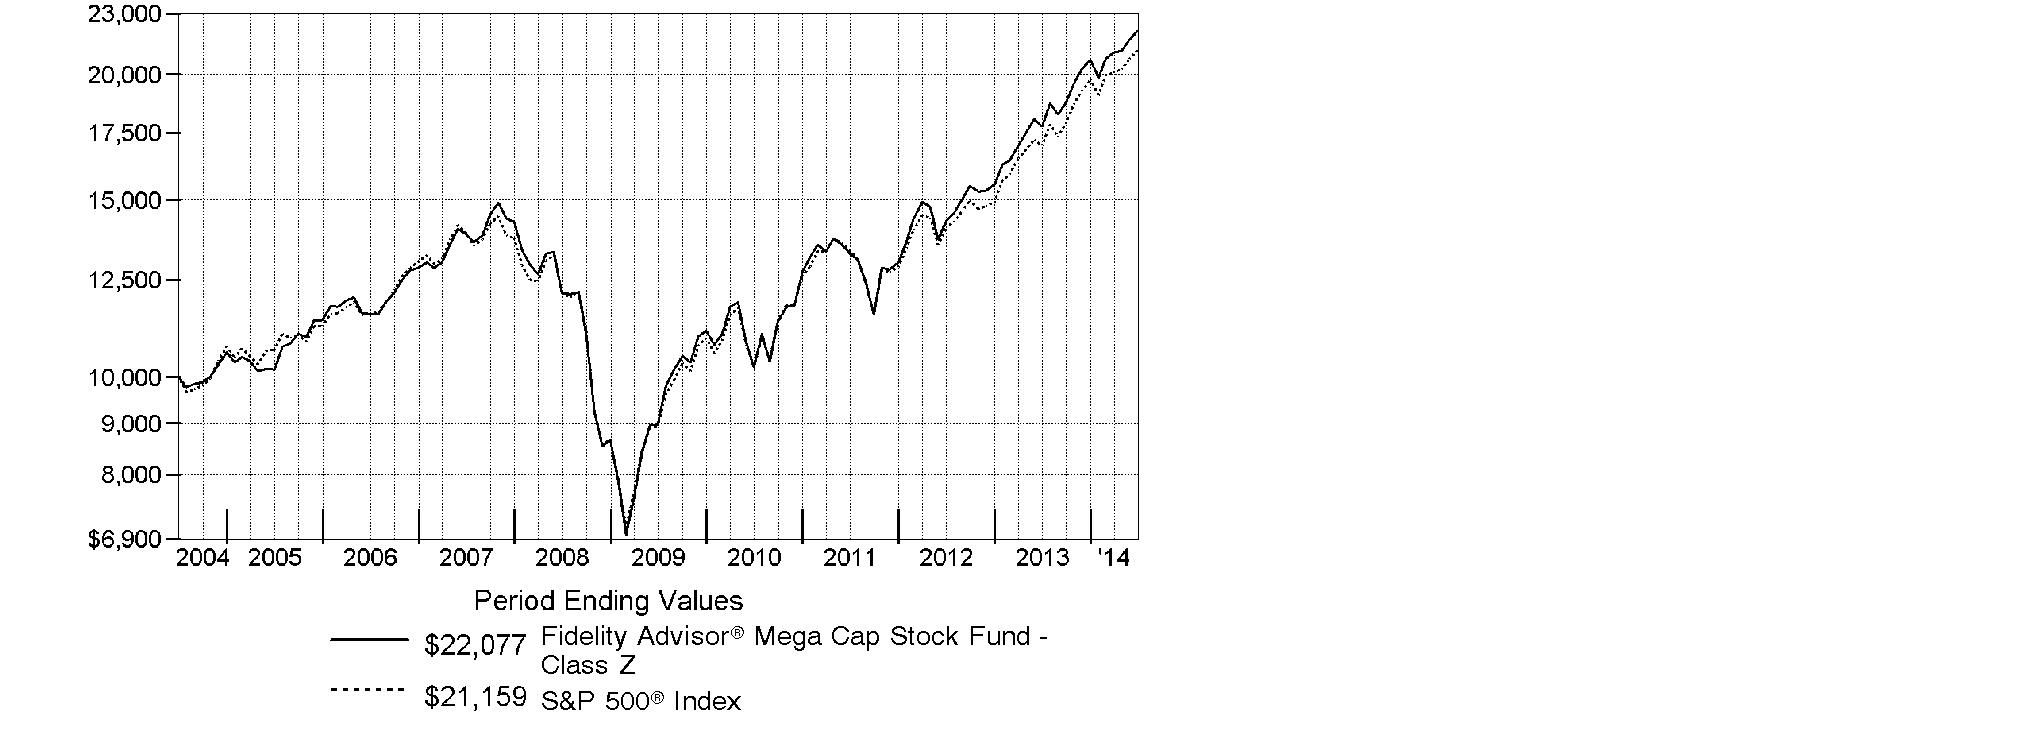
Annual Report
Market Recap: Despite intermittent volatility driven by geopolitical concerns, stocks posted a series of new highs during the 12 months ending June 30, 2014, amid a decidedly favorable environment for riskier assets. The S&P 500® Index rose 24.61% for the year, helped by a rise in consumer spending and the lowest unemployment rate since 2008. The U.S. Federal Reserve balanced stimulus reductions with continued low interest rates, aiding a broad advance. All 10 S&P 500® market sectors gained, seven by more than 20%. Materials (+33%) was tops, as investors seemed to anticipate sustained economic improvement and renewed infrastructure build-outs. Information technology (+32%) benefited from large cash balances, rising dividends and stock buybacks, and a bevy of innovations. Health care (+30%) was aided by new drugs and predictable reimbursements. Conversely, the biggest laggard, telecommunication services (+5%), battled slow growth and stiff pricing competition. Across size and style segments: overall, investors showed some preference for large-cap stocks over small-caps and growth stocks over value, although market leadership rotated during the year. With the "risk-on" trade alive and well, the growth-oriented Nasdaq Composite Index® flourished, advancing 31.17%, while the blue-chip Dow Jones Industrial AverageSM delivered a more subdued 15.56% return.
Comments from Matthew Fruhan, Portfolio Manager of Fidelity Advisor® Mega Cap Stock Fund: For the year, the fund's Class Z shares performed in line with the 24.69% and 24.61% returns of the mega-cap proxy Russell Top 200® Index and S&P 500® Index, respectively. (For specific class-level results, please refer to the performance section of this report.) Relative to the Russell index, it hurt the most to overweight big-box retailer Target, which was among the fund's biggest holdings. The lingering effects of the firm's troubled expansion into Canada and a holiday-season credit breach continued to weigh on the stock, but this weak stretch allowed me to add notable exposure at a valuation I liked. In January, I established an underweight stake in Facebook, which detracted as shares of the social-media giant outperformed. Stock selection and an overweight in financials detracted, including investment banks JPMorgan Chase and Citigroup, both of which were among the fund's largest holdings. Stock selection in consumer staples helped, including drugstore chain Walgreen, while an underweight in the underperforming shares of IBM added value.
The views expressed above reflect those of the portfolio manager(s) only through the end of the period as stated on the cover of this report and do not necessarily represent the views of Fidelity or any other person in the Fidelity organization. Any such views are subject to change at any time based upon market or other conditions and Fidelity disclaims any responsibility to update such views. These views may not be relied on as investment advice and, because investment decisions for a Fidelity fund are based on numerous factors, may not be relied on as an indication of trading intent on behalf of any Fidelity fund.
Annual Report
Shareholder Expense Example
As a shareholder of the Fund, you incur two types of costs: (1) transaction costs, including sales charges (loads) on purchase payments or redemption proceeds, and (2) ongoing costs, including management fees, distribution and/or service (12b-1) fees and other Fund expenses. This Example is intended to help you understand your ongoing costs (in dollars) of investing in the Fund and to compare these costs with the ongoing costs of investing in other mutual funds.
The Example is based on an investment of $1,000 invested at the beginning of the period and held for the entire period (January 1, 2014 to June 30, 2014).
Actual Expenses
The first line of the accompanying table for each class of the Fund provides information about actual account values and actual expenses. You may use the information in this line, together with the amount you invested, to estimate the expenses that you paid over the period. Simply divide your account value by $1,000.00 (for example, an $8,600 account value divided by $1,000.00 = 8.6), then multiply the result by the number in the first line for a class of the Fund under the heading entitled "Expenses Paid During Period" to estimate the expenses you paid on your account during this period. A small balance maintenance fee of $12.00 that is charged once a year may apply for certain accounts with a value of less than $2,000. This fee is not included in the table below. If it was, the estimate of expenses you paid during the period would be higher, and your ending account value lower, by this amount. In addition, the Fund, as a shareholder in the underlying Fidelity Central Funds, will indirectly bear its pro-rata share of the fees and expenses incurred by the underlying Fidelity Central Funds. These fees and expenses are not included in the Fund's annualized expense ratio used to calculate the expense estimate in the table below.
Hypothetical Example for Comparison Purposes
The second line of the accompanying table for each class of the Fund provides information about hypothetical account values and hypothetical expenses based on a Class' actual expense ratio and an assumed rate of return of 5% per year before expenses, which is not the Class' actual return. The hypothetical account values and expenses may not be used to estimate the actual ending account balance or expenses you paid for the period. You may use this information to compare the ongoing costs of investing in the Fund and other funds. To do so, compare this 5% hypothetical example with the 5% hypothetical examples that appear in the shareholder reports of the other funds. A small balance maintenance fee of $12.00 that is charged once a year may apply for certain accounts with a value of less than $2,000. This fee is not included in the table below. If it was, the estimate of expenses you paid during the period would be higher, and your ending account value lower, by this amount. In addition, the Fund, as a shareholder in the underlying Fidelity Central Funds, will indirectly bear its pro-rata share of the fees and expenses incurred by the underlying Fidelity Central Funds. These fees and expenses are not included in the Fund's annualized expense ratio used to calculate the expense estimate in the table below.
Please note that the expenses shown in the table are meant to highlight your ongoing costs only and do not reflect any transaction costs. Therefore, the second line of the table is useful in comparing ongoing costs only, and will not help you determine the relative total costs of owning different funds. In addition, if these transactional costs were included, your costs would have been higher.
Annual Report
| Annualized
Expense Ratio B | Beginning
Account Value
January 1, 2014 | Ending
Account Value
June 30, 2014 | Expenses Paid
During Period*
January 1, 2014
to June 30, 2014 |
Class A | .95% | | | |
Actual | | $ 1,000.00 | $ 1,064.60 | $ 4.86 |
Hypothetical A | | $ 1,000.00 | $ 1,020.08 | $ 4.76 |
Class T | 1.21% | | | |
Actual | | $ 1,000.00 | $ 1,063.20 | $ 6.19 |
Hypothetical A | | $ 1,000.00 | $ 1,018.79 | $ 6.06 |
Class B | 1.75% | | | |
Actual | | $ 1,000.00 | $ 1,060.20 | $ 8.94 |
Hypothetical A | | $ 1,000.00 | $ 1,016.12 | $ 8.75 |
Class C | 1.70% | | | |
Actual | | $ 1,000.00 | $ 1,060.50 | $ 8.69 |
Hypothetical A | | $ 1,000.00 | $ 1,016.36 | $ 8.50 |
Mega Cap Stock | .68% | | | |
Actual | | $ 1,000.00 | $ 1,066.10 | $ 3.48 |
Hypothetical A | | $ 1,000.00 | $ 1,021.42 | $ 3.41 |
Institutional Class | .71% | | | |
Actual | | $ 1,000.00 | $ 1,065.70 | $ 3.64 |
Hypothetical A | | $ 1,000.00 | $ 1,021.27 | $ 3.56 |
Class Z | .53% | | | |
Actual | | $ 1,000.00 | $ 1,066.30 | $ 2.72 |
Hypothetical A | | $ 1,000.00 | $ 1,022.17 | $ 2.66 |
A 5% return per year before expenses
B Annualized expense ratio reflects expenses net of applicable fee waivers.
* Expenses are equal to each Class' annualized expense ratio, multiplied by the average account value over the period, multiplied by 181/365 (to reflect the one-half year period).
Annual Report
Investment Changes (Unaudited)
Top Ten Stocks as of June 30, 2014 |
| % of fund's
net assets | % of fund's net assets
6 months ago |
Apple, Inc. | 4.6 | 4.6 |
JPMorgan Chase & Co. | 4.2 | 4.3 |
Microsoft Corp. | 3.5 | 3.3 |
General Electric Co. | 3.1 | 3.3 |
Chevron Corp. | 2.6 | 2.2 |
Comcast Corp. Class A (special) (non-vtg.) | 2.5 | 2.0 |
Verizon Communications, Inc. | 2.3 | 1.2 |
Citigroup, Inc. | 2.3 | 2.6 |
Bank of America Corp. | 2.1 | 2.1 |
Target Corp. | 2.0 | 1.9 |
| 29.2 | |
Top Five Market Sectors as of June 30, 2014 |
| % of fund's
net assets | % of fund's net assets
6 months ago |
Information Technology | 23.4 | 22.6 |
Financials | 18.3 | 19.2 |
Energy | 12.0 | 12.3 |
Consumer Staples | 10.9 | 11.0 |
Health Care | 9.9 | 11.1 |
Asset Allocation (% of fund's net assets) |
As of June 30, 2014* | As of December 31, 2013** |
| Stocks 98.2% | | | Stocks 98.8% | |
| Convertible Securities 0.0% | | | Convertible Securities 0.1% | |
| Short-Term Investments
and Net Other Assets (Liabilities) 1.8% | | | Short-Term Investments
and Net Other Assets (Liabilities) 1.1% | |
* Foreign investments | 10.7% | | ** Foreign investments | 10.7% | |

Annual Report
Investments June 30, 2014
Showing Percentage of Net Assets
Common Stocks - 98.2% |
| Shares | | Value |
CONSUMER DISCRETIONARY - 9.3% |
Hotels, Restaurants & Leisure - 1.2% |
McDonald's Corp. | 152,600 | | $ 15,372,924 |
Yum! Brands, Inc. | 357,600 | | 29,037,120 |
| | 44,410,044 |
Media - 4.6% |
Comcast Corp. Class A (special) (non-vtg.) (d) | 1,674,100 | | 89,279,753 |
The Walt Disney Co. | 169,000 | | 14,490,060 |
Time Warner, Inc. | 784,900 | | 55,139,225 |
Twenty-First Century Fox, Inc. Class A | 193,500 | | 6,801,525 |
| | 165,710,563 |
Multiline Retail - 2.0% |
Target Corp. | 1,261,300 | | 73,092,335 |
Specialty Retail - 1.5% |
Lowe's Companies, Inc. | 1,149,600 | | 55,169,304 |
TOTAL CONSUMER DISCRETIONARY | | 338,382,246 |
CONSUMER STAPLES - 10.9% |
Beverages - 3.7% |
Diageo PLC | 500,803 | | 15,950,125 |
PepsiCo, Inc. | 432,905 | | 38,675,733 |
SABMiller PLC | 312,289 | | 18,107,213 |
The Coca-Cola Co. | 1,476,100 | | 62,527,596 |
| | 135,260,667 |
Food & Staples Retailing - 1.8% |
CVS Caremark Corp. | 389,100 | | 29,326,467 |
Walgreen Co. | 511,897 | | 37,946,925 |
| | 67,273,392 |
Food Products - 0.4% |
Kellogg Co. | 216,400 | | 14,217,480 |
Household Products - 1.8% |
Procter & Gamble Co. | 818,700 | | 64,341,633 |
Tobacco - 3.2% |
British American Tobacco PLC sponsored ADR | 519,400 | | 61,850,152 |
Philip Morris International, Inc. | 490,530 | | 41,356,584 |
Reynolds American, Inc. | 197,600 | | 11,925,160 |
| | 115,131,896 |
TOTAL CONSUMER STAPLES | | 396,225,068 |
Common Stocks - continued |
| Shares | | Value |
ENERGY - 12.0% |
Energy Equipment & Services - 1.4% |
National Oilwell Varco, Inc. | 124,100 | | $ 10,219,635 |
Schlumberger Ltd. | 344,800 | | 40,669,160 |
| | 50,888,795 |
Oil, Gas & Consumable Fuels - 10.6% |
Anadarko Petroleum Corp. | 76,400 | | 8,363,508 |
Apache Corp. | 412,505 | | 41,506,253 |
BG Group PLC | 1,699,000 | | 35,909,707 |
Canadian Natural Resources Ltd. | 568,600 | | 26,126,665 |
Chevron Corp. | 715,700 | | 93,434,635 |
Exxon Mobil Corp. | 358,271 | | 36,070,724 |
Imperial Oil Ltd. | 373,900 | | 19,703,291 |
Occidental Petroleum Corp. | 521,300 | | 53,501,019 |
Suncor Energy, Inc. | 948,700 | | 40,453,446 |
The Williams Companies, Inc. | 510,200 | | 29,698,742 |
| | 384,767,990 |
TOTAL ENERGY | | 435,656,785 |
FINANCIALS - 18.3% |
Banks - 12.5% |
Bank of America Corp. | 5,029,700 | | 77,306,489 |
Citigroup, Inc. | 1,809,370 | | 85,221,327 |
JPMorgan Chase & Co. | 2,701,500 | | 155,660,430 |
PNC Financial Services Group, Inc. | 239,800 | | 21,354,190 |
Standard Chartered PLC (United Kingdom) | 1,566,208 | | 32,004,076 |
U.S. Bancorp | 732,800 | | 31,744,896 |
Wells Fargo & Co. | 1,022,730 | | 53,754,689 |
| | 457,046,097 |
Capital Markets - 3.1% |
BlackRock, Inc. Class A | 19,000 | | 6,072,400 |
Charles Schwab Corp. | 982,100 | | 26,447,953 |
Goldman Sachs Group, Inc. | 22,700 | | 3,800,888 |
Morgan Stanley, Inc. | 1,186,000 | | 38,343,380 |
State Street Corp. | 568,900 | | 38,264,214 |
| | 112,928,835 |
Diversified Financial Services - 0.1% |
IntercontinentalExchange Group, Inc. | 10,500 | | 1,983,450 |
Insurance - 2.6% |
AIA Group Ltd. | 92,200 | | 463,355 |
Common Stocks - continued |
| Shares | | Value |
FINANCIALS - continued |
Insurance - continued |
American International Group, Inc. | 637,100 | | $ 34,772,918 |
Marsh & McLennan Companies, Inc. | 213,580 | | 11,067,716 |
MetLife, Inc. | 849,095 | | 47,175,718 |
Ping An Insurance (Group) Co. of China Ltd. (H Shares) | 101,500 | | 785,766 |
| | 94,265,473 |
TOTAL FINANCIALS | | 666,223,855 |
HEALTH CARE - 9.9% |
Biotechnology - 1.3% |
Amgen, Inc. | 318,690 | | 37,723,335 |
Biogen Idec, Inc. (a) | 34,200 | | 10,783,602 |
| | 48,506,937 |
Health Care Equipment & Supplies - 0.8% |
Abbott Laboratories | 465,100 | | 19,022,590 |
Stryker Corp. | 96,100 | | 8,103,152 |
| | 27,125,742 |
Health Care Providers & Services - 2.5% |
Express Scripts Holding Co. (a) | 318,907 | | 22,109,822 |
McKesson Corp. | 202,400 | | 37,688,904 |
UnitedHealth Group, Inc. | 400,048 | | 32,703,924 |
| | 92,502,650 |
Life Sciences Tools & Services - 0.3% |
Thermo Fisher Scientific, Inc. | 94,500 | | 11,151,000 |
Pharmaceuticals - 5.0% |
AbbVie, Inc. | 243,900 | | 13,765,716 |
GlaxoSmithKline PLC sponsored ADR | 619,000 | | 33,104,120 |
Johnson & Johnson | 565,900 | | 59,204,458 |
Merck & Co., Inc. | 477,300 | | 27,611,805 |
Novartis AG sponsored ADR | 170,400 | | 15,426,312 |
Sanofi SA | 80,024 | | 8,505,715 |
Teva Pharmaceutical Industries Ltd. sponsored ADR | 487,200 | | 25,539,024 |
| | 183,157,150 |
TOTAL HEALTH CARE | | 362,443,479 |
INDUSTRIALS - 9.4% |
Aerospace & Defense - 1.9% |
Honeywell International, Inc. | 118,700 | | 11,033,165 |
Common Stocks - continued |
| Shares | | Value |
INDUSTRIALS - continued |
Aerospace & Defense - continued |
The Boeing Co. | 309,000 | | $ 39,314,070 |
United Technologies Corp. | 176,200 | | 20,342,290 |
| | 70,689,525 |
Air Freight & Logistics - 1.8% |
FedEx Corp. | 117,800 | | 17,832,564 |
United Parcel Service, Inc. Class B | 475,000 | | 48,763,500 |
| | 66,596,064 |
Industrial Conglomerates - 3.4% |
Danaher Corp. | 146,570 | | 11,539,456 |
General Electric Co. | 4,323,800 | | 113,629,464 |
| | 125,168,920 |
Machinery - 0.3% |
Caterpillar, Inc. | 86,500 | | 9,399,955 |
Road & Rail - 2.0% |
CSX Corp. | 1,160,700 | | 35,761,167 |
Norfolk Southern Corp. | 207,800 | | 21,409,634 |
Union Pacific Corp. | 148,190 | | 14,781,953 |
| | 71,952,754 |
TOTAL INDUSTRIALS | | 343,807,218 |
INFORMATION TECHNOLOGY - 23.4% |
Communications Equipment - 3.1% |
Cisco Systems, Inc. | 2,773,400 | | 68,918,990 |
QUALCOMM, Inc. | 531,900 | | 42,126,480 |
| | 111,045,470 |
Internet Software & Services - 4.2% |
Facebook, Inc. Class A (a) | 103,597 | | 6,971,042 |
Google, Inc.: | | | |
Class A (a) | 109,350 | | 63,933,665 |
Class C (a) | 95,750 | | 55,083,060 |
Yahoo!, Inc. (a) | 781,639 | | 27,458,978 |
| | 153,446,745 |
IT Services - 3.8% |
Accenture PLC Class A | 69,100 | | 5,586,044 |
Cognizant Technology Solutions Corp. Class A (a) | 523,400 | | 25,599,494 |
IBM Corp. | 156,000 | | 28,278,120 |
Common Stocks - continued |
| Shares | | Value |
INFORMATION TECHNOLOGY - continued |
IT Services - continued |
MasterCard, Inc. Class A | 555,900 | | $ 40,841,973 |
Visa, Inc. Class A | 187,100 | | 39,423,841 |
| | 139,729,472 |
Semiconductors & Semiconductor Equipment - 1.4% |
Applied Materials, Inc. | 699,625 | | 15,776,544 |
Broadcom Corp. Class A | 973,036 | | 36,119,096 |
| | 51,895,640 |
Software - 5.3% |
Adobe Systems, Inc. (a) | 253,200 | | 18,321,552 |
Microsoft Corp. | 3,024,500 | | 126,121,650 |
Oracle Corp. | 899,900 | | 36,472,947 |
salesforce.com, Inc. (a) | 199,200 | | 11,569,536 |
| | 192,485,685 |
Technology Hardware, Storage & Peripherals - 5.6% |
Apple, Inc. | 1,808,507 | | 168,064,558 |
EMC Corp. | 1,051,000 | | 27,683,340 |
First Data Holdings, Inc. Class B (e) | 2,429,231 | | 9,716,924 |
| | 205,464,822 |
TOTAL INFORMATION TECHNOLOGY | | 854,067,834 |
MATERIALS - 2.7% |
Chemicals - 2.1% |
E.I. du Pont de Nemours & Co. | 333,900 | | 21,850,416 |
Monsanto Co. | 315,310 | | 39,331,769 |
Syngenta AG (Switzerland) | 43,089 | | 15,919,199 |
| | 77,101,384 |
Metals & Mining - 0.6% |
Freeport-McMoRan Copper & Gold, Inc. | 538,000 | | 19,637,000 |
TOTAL MATERIALS | | 96,738,384 |
TELECOMMUNICATION SERVICES - 2.3% |
Diversified Telecommunication Services - 2.3% |
Verizon Communications, Inc. | 1,743,725 | | 85,320,464 |
TOTAL COMMON STOCKS (Cost $2,718,899,411) |
3,578,865,333
|
Money Market Funds - 2.6% |
| Shares | | Value |
Fidelity Cash Central Fund, 0.11% (b) | 74,761,932 | | $ 74,761,932 |
Fidelity Securities Lending Cash Central Fund, 0.10% (b)(c) | 22,517,000 | | 22,517,000 |
TOTAL MONEY MARKET FUNDS (Cost $97,278,932) |
97,278,932
|
TOTAL INVESTMENT PORTFOLIO - 100.8% (Cost $2,816,178,343) | | 3,676,144,265 |
NET OTHER ASSETS (LIABILITIES) - (0.8)% | | (30,832,045) |
NET ASSETS - 100% | $ 3,645,312,220 |
Legend |
(a) Non-income producing |
(b) Affiliated fund that is generally available only to investment companies and other accounts managed by Fidelity Investments. The rate quoted is the annualized seven-day yield of the fund at period end. A complete unaudited listing of the fund's holdings as of its most recent quarter end is available upon request. In addition, each Fidelity Central Fund's financial statements, which are not covered by the Fund's Report of Independent Registered Public Accounting Firm, are available on the SEC's website or upon request. |
(c) Investment made with cash collateral received from securities on loan. |
(d) Security or a portion of the security is on loan at period end. |
(e) Restricted securities - Investment in securities not registered under the Securities Act of 1933 (excluding 144A issues). At the end of the period, the value of restricted securities (excluding 144A issues) amounted to $9,716,924 or 0.3% of net assets. |
Additional information on each restricted holding is as follows: |
Security | Acquisition Date | Acquisition Cost |
First Data Holdings, Inc. Class B | 6/26/14 | $ 9,716,924 |
Affiliated Central Funds |
Information regarding fiscal year to date income earned by the Fund from investments in Fidelity Central Funds is as follows: |
Fund | Income earned |
Fidelity Cash Central Fund | $ 27,717 |
Fidelity Securities Lending Cash Central Fund | 89,556 |
Total | $ 117,273 |
Other Information |
The following is a summary of the inputs used, as of June 30, 2014, involving the Fund's assets and liabilities carried at fair value. The inputs or methodology used for valuing securities may not be an indication of the risk associated with investing in those securities. For more information on valuation inputs, and their aggregation into the levels used in the table below, please refer to the Investment Valuation section in the accompanying Notes to Financial Statements. |
Valuation Inputs at Reporting Date: |
Description | Total | Level 1 | Level 2 | Level 3 |
Investments in Securities: | | | | |
Equities: | | | | |
Consumer Discretionary | $ 338,382,246 | $ 338,382,246 | $ - | $ - |
Consumer Staples | 396,225,068 | 380,274,943 | 15,950,125 | - |
Energy | 435,656,785 | 435,656,785 | - | - |
Financials | 666,223,855 | 666,223,855 | - | - |
Health Care | 362,443,479 | 353,937,764 | 8,505,715 | - |
Industrials | 343,807,218 | 343,807,218 | - | - |
Information Technology | 854,067,834 | 844,350,910 | - | 9,716,924 |
Materials | 96,738,384 | 80,819,185 | 15,919,199 | - |
Telecommunication Services | 85,320,464 | 85,320,464 | - | - |
Money Market Funds | 97,278,932 | 97,278,932 | - | - |
Total Investments in Securities: | $ 3,676,144,265 | $ 3,626,052,302 | $ 40,375,039 | $ 9,716,924 |
Distribution of investments by country or territory of incorporation, as a percentage of total net assets, is as follows (Unaudited): |
United States of America | 89.3% |
United Kingdom | 5.4% |
Canada | 2.4% |
Curacao | 1.1% |
Others (Individually Less Than 1%) | 1.8% |
| 100.0% |
See accompanying notes which are an integral part of the financial statements.
Annual Report
Statement of Assets and Liabilities
| June 30, 2014 |
| | |
Assets | | |
Investment in securities, at value (including securities loaned of $21,833,302) - See accompanying schedule: Unaffiliated issuers (cost $2,718,899,411) | $ 3,578,865,333 | |
Fidelity Central Funds (cost $97,278,932) | 97,278,932 | |
Total Investments (cost $2,816,178,343) | | $ 3,676,144,265 |
Receivable for investments sold | | 6,265,877 |
Receivable for fund shares sold | | 5,281,399 |
Dividends receivable | | 4,490,136 |
Distributions receivable from Fidelity Central Funds | | 19,236 |
Receivable from investment adviser for expense reductions | | 386 |
Other receivables | | 124,808 |
Total assets | | 3,692,326,107 |
| | |
Liabilities | | |
Payable for investments purchased | $ 19,178,333 | |
Payable for fund shares redeemed | 3,159,924 | |
Accrued management fee | 1,355,067 | |
Distribution and service plan fees payable | 36,521 | |
Other affiliated payables | 644,371 | |
Other payables and accrued expenses | 122,671 | |
Collateral on securities loaned, at value | 22,517,000 | |
Total liabilities | | 47,013,887 |
| | |
Net Assets | | $ 3,645,312,220 |
Net Assets consist of: | | |
Paid in capital | | $ 2,686,009,603 |
Undistributed net investment income | | 25,146,366 |
Accumulated undistributed net realized gain (loss) on investments and foreign currency transactions | | 74,183,358 |
Net unrealized appreciation (depreciation) on investments and assets and liabilities in foreign currencies | | 859,972,893 |
Net Assets | | $ 3,645,312,220 |
See accompanying notes which are an integral part of the financial statements.
Annual Report
Financial Statements - continued
Statement of Assets and Liabilities - continued
| June 30, 2014 |
| | |
Calculation of Maximum Offering Price Class A:
Net Asset Value and redemption price per share ($77,335,409 ÷ 4,739,947 shares) | | $ 16.32 |
| | |
Maximum offering price per share (100/94.25 of $16.32) | | $ 17.32 |
Class T:
Net Asset Value and redemption price per share ($15,728,415 ÷ 964,584 shares) | | $ 16.31 |
| | |
Maximum offering price per share (100/96.50 of $16.31) | | $ 16.90 |
Class B:
Net Asset Value and offering price per share ($918,549 ÷ 56,656 shares)A | | $ 16.21 |
| | |
Class C:
Net Asset Value and offering price per share ($16,599,716 ÷ 1,029,726 shares)A | | $ 16.12 |
| | |
Mega Cap Stock:
Net Asset Value, offering price and redemption price per share ($2,860,197,294 ÷ 173,984,386 shares) | | $ 16.44 |
| | |
Institutional Class:
Net Asset Value, offering price and redemption price per share ($674,415,747 ÷ 41,154,574 shares) | | $ 16.39 |
| | |
Class Z:
Net Asset Value, offering price and redemption price per share ($117,090 ÷ 7,138 shares) | | $ 16.40 |
A Redemption price per share is equal to net asset value less any applicable contingent deferred sales charge.
See accompanying notes which are an integral part of the financial statements.
Annual Report
Statement of Operations
| Year ended June 30, 2014 |
| | |
Investment Income | | |
Dividends | | $ 64,598,075 |
Interest | | 3 |
Income from Fidelity Central Funds | | 117,273 |
Total income | | 64,715,351 |
| | |
Expenses | | |
Management fee | $ 13,636,133 | |
Transfer agent fees | 5,746,426 | |
Distribution and service plan fees | 284,809 | |
Accounting and security lending fees | 887,108 | |
Custodian fees and expenses | 71,971 | |
Independent trustees' compensation | 12,515 | |
Registration fees | 231,217 | |
Audit | 55,093 | |
Legal | 11,095 | |
Interest | 2,824 | |
Miscellaneous | 22,803 | |
Total expenses before reductions | 20,961,994 | |
Expense reductions | (36,926) | 20,925,068 |
Net investment income (loss) | | 43,790,283 |
Realized and Unrealized Gain (Loss) Net realized gain (loss) on: | | |
Investment securities: | | |
Unaffiliated issuers | 143,561,768 | |
Foreign currency transactions | (8,194) | |
Total net realized gain (loss) | | 143,553,574 |
Change in net unrealized appreciation (depreciation) on: Investment securities | 457,006,470 | |
Assets and liabilities in foreign currencies | 12,169 | |
Total change in net unrealized appreciation (depreciation) | | 457,018,639 |
Net gain (loss) | | 600,572,213 |
Net increase (decrease) in net assets resulting from operations | | $ 644,362,496 |
See accompanying notes which are an integral part of the financial statements.
Annual Report
Financial Statements - continued
Statement of Changes in Net Assets
| Year ended
June 30,
2014 | Year ended
June 30,
2013 |
Increase (Decrease) in Net Assets | | |
Operations | | |
Net investment income (loss) | $ 43,790,283 | $ 35,288,813 |
Net realized gain (loss) | 143,553,574 | 104,876,418 |
Change in net unrealized appreciation (depreciation) | 457,018,639 | 321,854,450 |
Net increase (decrease) in net assets resulting
from operations | 644,362,496 | 462,019,681 |
Distributions to shareholders from net investment income | (35,705,336) | (27,575,489) |
Distributions to shareholders from net realized gain | (41,770,691) | - |
Total distributions | (77,476,027) | (27,575,489) |
Share transactions - net increase (decrease) | 513,653,074 | 652,982,078 |
Total increase (decrease) in net assets | 1,080,539,543 | 1,087,426,270 |
| | |
Net Assets | | |
Beginning of period | 2,564,772,677 | 1,477,346,407 |
End of period (including undistributed net investment income of $25,146,366 and undistributed net investment income of $17,061,419, respectively) | $ 3,645,312,220 | $ 2,564,772,677 |
See accompanying notes which are an integral part of the financial statements.
Annual Report
Financial Highlights - Class A
Years ended June 30, | 2014 | 2013 | 2012 | 2011 | 2010 |
Selected Per-Share Data | | | | | |
Net asset value, beginning of period | $ 13.51 | $ 11.05 | $ 10.37 | $ 8.07 | $ 7.20 |
Income from Investment Operations | | | | | |
Net investment income (loss) C | .18 | .17 | .13 | .07 | .06 |
Net realized and unrealized gain (loss) | 3.00 | 2.43 | .64 | 2.28 | .92 |
Total from investment operations | 3.18 | 2.60 | .77 | 2.35 | .98 |
Distributions from net investment income | (.16) | (.14) | (.09) | (.05) | (.11) |
Distributions from net realized gain | (.21) | - | - | - | - |
Total distributions | (.37) | (.14) | (.09) | (.05) | (.11) |
Net asset value, end of period | $ 16.32 | $ 13.51 | $ 11.05 | $ 10.37 | $ 8.07 |
Total ReturnA, B | 23.88% | 23.78% | 7.57% | 29.23% | 13.65% |
Ratios to Average Net Assets D, F | | | | | |
Expenses before reductions | .96% | .98% | 1.02% | 1.06% | 1.10% |
Expenses net of fee waivers, if any | .96% | .98% | 1.02% | 1.06% | 1.10% |
Expenses net of all reductions | .96% | .98% | 1.02% | 1.06% | 1.10% |
Net investment income (loss) | 1.19% | 1.37% | 1.28% | .76% | .66% |
Supplemental Data | | | | | |
Net assets, end of period (000 omitted) | $ 77,335 | $ 20,336 | $ 8,527 | $ 4,169 | $ 2,238 |
Portfolio turnover rateE | 28% | 29% | 57% | 53% | 97% |
A Total returns would have been lower if certain expenses had not been reduced during the applicable periods shown.
B Total returns do not include the effect of the sales charges.
C Calculated based on average shares outstanding during the period.
D Fees and expenses of any underlying Fidelity Central Funds are not included in the Fund's expense ratio. The Fund indirectly bears its proportionate share of the expenses of any underlying Fidelity Central Funds.
E Amount does not include the portfolio activity of any underlying Fidelity Central Funds.
F Expense ratios reflect operating expenses of the class. Expenses before reductions do not reflect amounts reimbursed by the investment adviser or reductions from brokerage service arrangements or reductions from other expense offset arrangements and do not represent the amount paid by the class during periods when reimbursements or reductions occur. Expenses net of fee waivers reflect expenses after reimbursement by the investment adviser but prior to reductions from brokerage service arrangements or other expense offset arrangements. Expenses net of all reductions represent the net expenses paid by the class.
See accompanying notes which are an integral part of the financial statements.
Annual Report
Financial Highlights - Class T
Years ended June 30, | 2014 | 2013 | 2012 | 2011 | 2010 |
Selected Per-Share Data | | | | | |
Net asset value, beginning of period | $ 13.51 | $ 11.05 | $ 10.38 | $ 8.07 | $ 7.20 |
Income from Investment Operations | | | | | |
Net investment income (loss) C | .14 | .14 | .10 | .05 | .03 |
Net realized and unrealized gain (loss) | 3.00 | 2.43 | .64 | 2.29 | .93 |
Total from investment operations | 3.14 | 2.57 | .74 | 2.34 | .96 |
Distributions from net investment income | (.13) | (.11) | (.07) | (.03) | (.09) |
Distributions from net realized gain | (.21) | - | - | - | - |
Total distributions | (.34) | (.11) | (.07) | (.03) | (.09) |
Net asset value, end of period | $ 16.31 | $ 13.51 | $ 11.05 | $ 10.38 | $ 8.07 |
Total ReturnA, B | 23.54% | 23.44% | 7.19% | 29.08% | 13.32% |
Ratios to Average Net Assets D, F | | | | | |
Expenses before reductions | 1.22% | 1.26% | 1.32% | 1.32% | 1.36% |
Expenses net of fee waivers, if any | 1.22% | 1.26% | 1.32% | 1.32% | 1.36% |
Expenses net of all reductions | 1.22% | 1.26% | 1.32% | 1.32% | 1.35% |
Net investment income (loss) | .92% | 1.09% | .98% | .50% | .41% |
Supplemental Data | | | | | |
Net assets, end of period (000 omitted) | $ 15,728 | $ 8,377 | $ 2,293 | $ 1,682 | $ 1,073 |
Portfolio turnover rateE | 28% | 29% | 57% | 53% | 97% |
A Total returns would have been lower if certain expenses had not been reduced during the applicable periods shown.
B Total returns do not include the effect of the sales charges.
C Calculated based on average shares outstanding during the period.
D Fees and expenses of any underlying Fidelity Central Funds are not included in the Fund's expense ratio. The Fund indirectly bears its proportionate share of the expenses of any underlying Fidelity Central Funds.
E Amount does not include the portfolio activity of any underlying Fidelity Central Funds.
F Expense ratios reflect operating expenses of the class. Expenses before reductions do not reflect amounts reimbursed by the investment adviser or reductions from brokerage service arrangements or reductions from other expense offset arrangements and do not represent the amount paid by the class during periods when reimbursements or reductions occur. Expenses net of fee waivers reflect expenses after reimbursement by the investment adviser but prior to reductions from brokerage service arrangements or other expense offset arrangements. Expenses net of all reductions represent the net expenses paid by the class.
See accompanying notes which are an integral part of the financial statements.
Annual Report
Financial Highlights - Class B
Years ended June 30, | 2014 | 2013 | 2012 | 2011 | 2010 |
Selected Per-Share Data | | | | | |
Net asset value, beginning of period | $ 13.43 | $ 10.97 | $ 10.30 | $ 8.02 | $ 7.19 |
Income from Investment Operations | | | | | |
Net investment income (loss) C | .06 | .07 | .05 | - H | (.01) |
Net realized and unrealized gain (loss) | 2.98 | 2.43 | .63 | 2.28 | .92 |
Total from investment operations | 3.04 | 2.50 | .68 | 2.28 | .91 |
Distributions from net investment income | (.04) | (.04) | (.01) | - | (.08) |
Distributions from net realized gain | (.21) | - | - | - | - |
Total distributions | (.26) I | (.04) | (.01) | - | (.08) |
Net asset value, end of period | $ 16.21 | $ 13.43 | $ 10.97 | $ 10.30 | $ 8.02 |
Total ReturnA, B | 22.82% | 22.83% | 6.62% | 28.43% | 12.60% |
Ratios to Average Net Assets D, G | | | | | |
Expenses before reductions | 1.78% | 1.80% | 1.82% | 1.83% | 1.88% |
Expenses net of fee waivers, if any | 1.78% | 1.80% | 1.82% | 1.83% | 1.88% |
Expenses net of all reductions | 1.78% | 1.80% | 1.81% | 1.82% | 1.88% |
Net investment income (loss) | .37% | .55% | .49% | .00% F | (.12)% |
Supplemental Data | | | | | |
Net assets, end of period (000 omitted) | $ 919 | $ 716 | $ 704 | $ 764 | $ 667 |
Portfolio turnover rateE | 28% | 29% | 57% | 53% | 97% |
A Total returns would have been lower if certain expenses had not been reduced during the applicable periods shown.
B Total returns do not include the effect of the contingent deferred sales charge.
C Calculated based on average shares outstanding during the period.
D Fees and expenses of any underlying Fidelity Central Funds are not included in the Fund's expense ratio. The Fund indirectly bears its proportionate share of the expenses of any underlying Fidelity Central Funds.
E Amount does not include the portfolio activity of any underlying Fidelity Central Funds.
F Amount represents less than .01%.
G Expense ratios reflect operating expenses of the class. Expenses before reductions do not reflect amounts reimbursed by the investment adviser or reductions from brokerage service arrangements or reductions from other expense offset arrangements and do not represent the amount paid by the class during periods when reimbursements or reductions occur. Expenses net of fee waivers reflect expenses after reimbursement by the investment adviser but prior to reductions from brokerage service arrangements or other expense offset arrangements. Expenses net of all reductions represent the net expenses paid by the class.
H Amount represents less than $.01 per share.
I Total distributions of $.26 per share is comprised of distributions from net investment income of $.044 and distributions from net realized gain of $.213 per share.
See accompanying notes which are an integral part of the financial statements.
Annual Report
Financial Highlights - Class C
Years ended June 30, | 2014 | 2013 | 2012 | 2011 | 2010 |
Selected Per-Share Data | | | | | |
Net asset value, beginning of period | $ 13.38 | $ 10.93 | $ 10.28 | $ 8.01 | $ 7.16 |
Income from Investment Operations | | | | | |
Net investment income (loss) C | .06 | .07 | .05 | - G | (.01) |
Net realized and unrealized gain (loss) | 2.97 | 2.42 | .64 | 2.27 | .92 |
Total from investment operations | 3.03 | 2.49 | .69 | 2.27 | .91 |
Distributions from net investment income | (.08) | (.04) | (.04) | - | (.06) |
Distributions from net realized gain | (.21) | - | - | - | - |
Total distributions | (.29) | (.04) | (.04) | - | (.06) |
Net asset value, end of period | $ 16.12 | $ 13.38 | $ 10.93 | $ 10.28 | $ 8.01 |
Total ReturnA, B | 22.90% | 22.83% | 6.74% | 28.34% | 12.72% |
Ratios to Average Net Assets D, F | | | | | |
Expenses before reductions | 1.71% | 1.75% | 1.79% | 1.81% | 1.86% |
Expenses net of fee waivers, if any | 1.71% | 1.75% | 1.79% | 1.81% | 1.86% |
Expenses net of all reductions | 1.71% | 1.75% | 1.79% | 1.81% | 1.85% |
Net investment income (loss) | .43% | .59% | .51% | .01% | (.10)% |
Supplemental Data | | | | | |
Net assets, end of period (000 omitted) | $ 16,600 | $ 7,938 | $ 2,845 | $ 1,913 | $ 807 |
Portfolio turnover rateE | 28% | 29% | 57% | 53% | 97% |
A Total returns would have been lower if certain expenses had not been reduced during the applicable periods shown.
B Total returns do not include the effect of the contingent deferred sales charge.
C Calculated based on average shares outstanding during the period.
D Fees and expenses of any underlying Fidelity Central Funds are not included in the Fund's expense ratio. The Fund indirectly bears its proportionate share of the expenses of any underlying Fidelity Central Funds.
E Amount does not include the portfolio activity of any underlying Fidelity Central Funds.
F Expense ratios reflect operating expenses of the class. Expenses before reductions do not reflect amounts reimbursed by the investment adviser or reductions from brokerage service arrangements or reductions from other expense offset arrangements and do not represent the amount paid by the class during periods when reimbursements or reductions occur. Expenses net of fee waivers reflect expenses after reimbursement by the investment adviser but prior to reductions from brokerage service arrangements or other expense offset arrangements. Expenses net of all reductions represent the net expenses paid by the class.
G Amount represents less than $.01 per share.
See accompanying notes which are an integral part of the financial statements.
Annual Report
Financial Highlights - Mega Cap Stock
Years ended June 30, | 2014 | 2013 | 2012 | 2011 | 2010 |
Selected Per-Share Data | | | | | |
Net asset value, beginning of period | $ 13.60 | $ 11.11 | $ 10.43 | $ 8.11 | $ 7.23 |
Income from Investment Operations | | | | | |
Net investment income (loss) B | .22 | .20 | .16 | .10 | .08 |
Net realized and unrealized gain (loss) | 3.02 | 2.46 | .64 | 2.29 | .93 |
Total from investment operations | 3.24 | 2.66 | .80 | 2.39 | 1.01 |
Distributions from net investment income | (.19) | (.17) | (.12) | (.07) | (.13) |
Distributions from net realized gain | (.21) | - | - | - | - |
Total distributions | (.40) | (.17) | (.12) | (.07) | (.13) |
Net asset value, end of period | $ 16.44 | $ 13.60 | $ 11.11 | $ 10.43 | $ 8.11 |
Total ReturnA | 24.18% | 24.17% | 7.83% | 29.61% | 13.93% |
Ratios to Average Net Assets C, E | | | | | |
Expenses before reductions | .68% | .70% | .76% | .79% | .81% |
Expenses net of fee waivers, if any | .68% | .70% | .76% | .79% | .80% |
Expenses net of all reductions | .68% | .70% | .75% | .78% | .79% |
Net investment income (loss) | 1.47% | 1.64% | 1.55% | 1.04% | .96% |
Supplemental Data | | | | | |
Net assets, end of period (000 omitted) | $ 2,860,197 | $ 2,214,592 | $ 1,287,144 | $ 785,233 | $ 500,407 |
Portfolio turnover rateD | 28% | 29% | 57% | 53% | 97% |
A Total returns would have been lower if certain expenses had not been reduced during the applicable periods shown.
B Calculated based on average shares outstanding during the period.
C Fees and expenses of any underlying Fidelity Central Funds are not included in the Fund's expense ratio. The Fund indirectly bears its proportionate share of the expenses of any underlying Fidelity Central Funds.
D Amount does not include the portfolio activity of any underlying Fidelity Central Funds.
E Expense ratios reflect operating expenses of the class. Expenses before reductions do not reflect amounts reimbursed by the investment adviser or reductions from brokerage service arrangements or reductions from other expense offset arrangements and do not represent the amount paid by the class during periods when reimbursements or reductions occur. Expenses net of fee waivers reflect expenses after reimbursement by the investment adviser but prior to reductions from brokerage service arrangements or other expense offset arrangements. Expenses net of all reductions represent the net expenses paid by the class.
See accompanying notes which are an integral part of the financial statements.
Annual Report
Financial Highlights - Institutional Class
Years ended June 30, | 2014 | 2013 | 2012 | 2011 | 2010 |
Selected Per-Share Data | | | | | |
Net asset value, beginning of period | $ 13.55 | $ 11.08 | $ 10.40 | $ 8.09 | $ 7.22 |
Income from Investment Operations | | | | | |
Net investment income (loss) B | .22 | .20 | .16 | .10 | .08 |
Net realized and unrealized gain (loss) | 3.02 | 2.44 | .63 | 2.30 | .92 |
Total from investment operations | 3.24 | 2.64 | .79 | 2.40 | 1.00 |
Distributions from net investment income | (.18) | (.17) | (.11) | (.09) | (.13) |
Distributions from net realized gain | (.21) | - | - | - | - |
Total distributions | (.40) F | (.17) | (.11) | (.09) | (.13) |
Net asset value, end of period | $ 16.39 | $ 13.55 | $ 11.08 | $ 10.40 | $ 8.09 |
Total ReturnA | 24.23% | 24.06% | 7.77% | 29.74% | 13.89% |
Ratios to Average Net Assets C, E | | | | | |
Expenses before reductions | .71% | .74% | .78% | .79% | .88% |
Expenses net of fee waivers, if any | .71% | .74% | .78% | .79% | .88% |
Expenses net of all reductions | .71% | .74% | .77% | .78% | .87% |
Net investment income (loss) | 1.43% | 1.61% | 1.53% | 1.04% | .88% |
Supplemental Data | | | | | |
Net assets, end of period (000 omitted) | $ 674,416 | $ 312,814 | $ 175,833 | $ 136,768 | $ 1,568 |
Portfolio turnover rateD | 28% | 29% | 57% | 53% | 97% |
A Total returns would have been lower if certain expenses had not been reduced during the applicable periods shown.
B Calculated based on average shares outstanding during the period.
C Fees and expenses of any underlying Fidelity Central Funds are not included in the Fund's expense ratio. The Fund indirectly bears its proportionate share of the expenses of any underlying Fidelity Central Funds.
D Amount does not include the portfolio activity of any underlying Fidelity Central Funds.
E Expense ratios reflect operating expenses of the class. Expenses before reductions do not reflect amounts reimbursed by the investment adviser or reductions from brokerage service arrangements or reductions from other expense offset arrangements and do not represent the amount paid by the class during periods when reimbursements or reductions occur. Expenses net of fee waivers reflect expenses after reimbursement by the investment adviser but prior to reductions from brokerage service arrangements or other expense offset arrangements. Expenses net of all reductions represent the net expenses paid by the class.
F Total distributions of $.40 per share is comprised of distributions from net investment income of $.182 and distributions from net realized gain of $.213 per share.
See accompanying notes which are an integral part of the financial statements.
Annual Report
Financial Highlights - Class Z
Year ended June 30, | 2014 G |
Selected Per-Share Data | |
Net asset value, beginning of period | $ 14.31 |
Income from Investment Operations | |
Net investment income (loss) D | .21 |
Net realized and unrealized gain (loss) | 2.20 |
Total from investment operations | 2.41 |
Distributions from net investment income | (.10) |
Distributions from net realized gain | (.21) |
Total distributions | (.32) I |
Net asset value, end of period | $ 16.40 |
Total ReturnB, C | 17.06% |
Ratios to Average Net Assets E, H | |
Expenses before reductions | .54%A |
Expenses net of fee waivers, if any | .54%A |
Expenses net of all reductions | .54%A |
Net investment income (loss) | 1.59% A |
Supplemental Data | |
Net assets, end of period (000 omitted) | $ 117 |
Portfolio turnover rateF | 28% A |
A Annualized
B Total returns for periods of less than one year are not annualized.
C Total returns would have been lower if certain expenses had not been reduced during the applicable periods shown.
D Calculated based on average shares outstanding during the period.
E Fees and expenses of any underlying Fidelity Central Funds are not included in the Fund's expense ratio. The Fund indirectly bears its proportionate share of the expenses of any underlying Fidelity Central Funds.
F Amount does not include the portfolio activity of any underlying Fidelity Central Funds.
G For the period August 13, 2013 (commencement of sale of shares) to June 30, 2014.
H Expense ratios reflect operating expenses of the class. Expenses before reductions do not reflect amounts reimbursed by the investment adviser or reductions from brokerage service arrangements or reductions from other expense offset arrangements and do not represent the amount paid by the class during periods when reimbursements or reductions occur. Expense ratios before reductions for start-up periods may not be representative of longer-term operation periods. Expenses net of fee waivers reflect expenses after reimbursement by the investment adviser but prior to reductions from brokerage service arrangements or other expense offset arrangements. Expenses net of all reductions represent the net expenses paid by the class.
I Total distributions of $.32 per share is comprised of distributions from net investment income of $.104 and distributions from net realized gain of $.213 per share.
See accompanying notes which are an integral part of the financial statements.
Annual Report
Notes to Financial Statements
For the period ended June 30, 2014
1. Organization.
Fidelity Mega Cap Stock Fund (the Fund) is a fund of Fidelity Hastings Street Trust (the Trust) and is authorized to issue an unlimited number of shares. The Trust is registered under the Investment Company Act of 1940, as amended (the 1940 Act), as an open-end management investment company organized as a Massachusetts business trust. The Fund commenced sale of Class Z shares on August 13, 2013. The Fund offers Class A, Class T, Class C, Mega Cap Stock, Institutional Class and Class Z shares, each of which, along with Class B shares, has equal rights as to assets and voting privileges. Class B shares are closed to new accounts and additional purchases, except for exchanges and reinvestments. Each class has exclusive voting rights with respect to matters that affect that class. Class B shares will automatically convert to Class A shares after a holding period of seven years from the initial date of purchase.
2. Investments in Fidelity Central Funds.
The Fund invests in Fidelity Central Funds, which are open-end investment companies generally available only to other investment companies and accounts managed by the investment adviser and its affiliates. The Fund's Schedule of Investments lists each of the Fidelity Central Funds held as of period end, if any, as an investment of the Fund, but does not include the underlying holdings of each Fidelity Central Fund. As an Investing Fund, the Fund indirectly bears its proportionate share of the expenses of the underlying Fidelity Central Funds.
The Money Market Central Funds seek preservation of capital and current income and are managed by Fidelity Investments Money Management, Inc. (FIMM), an affiliate of the investment adviser. Annualized expenses of the Money Market Central Funds as of their most recent shareholder report date are less than .01%.
A complete unaudited list of holdings for each Fidelity Central Fund is available upon request or at the Securities and Exchange Commission (the SEC) website at www.sec.gov. In addition, the financial statements of the Fidelity Central Funds, which are not covered by the Fund's Report of Independent Registered Public Accounting Firm, are available on the SEC website or upon request.
3. Significant Accounting Policies.
The financial statements have been prepared in conformity with accounting principles generally accepted in the United States of America (GAAP), which require management to make certain estimates and assumptions at the date of the financial statements. Actual results could differ from those estimates. Subsequent events, if any, through the date that the financial statements were issued have been evaluated in the preparation of the financial statements. The following summarizes the significant accounting policies of the Fund:
Annual Report
Notes to Financial Statements - continued
3. Significant Accounting Policies - continued
Investment Valuation. Investments are valued as of 4:00 p.m. Eastern time on the last calendar day of the period. In accordance with valuation policies and procedures approved by the Board of Trustees (the Board), the Fund attempts to obtain prices from one or more third party pricing vendors or brokers to value its investments. When current market prices, quotations or currency exchange rates are not readily available or reliable, investments will be fair valued in good faith by the Fidelity Management & Research Company (FMR) Fair Value Committee (the Committee), in accordance with procedures adopted by the Board. Factors used in determining fair value vary by investment type and may include market or investment specific events. The frequency with which these procedures are used cannot be predicted and they may be utilized to a significant extent. The Committee oversees the Fund's valuation policies and procedures and is responsible for approving and reporting to the Board all fair value determinations.
The Fund categorizes the inputs to valuation techniques used to value its investments into a disclosure hierarchy consisting of three levels as shown below:
Level 1 - quoted prices in active markets for identical investments
Level 2 - other significant observable inputs (including quoted prices for similar investments, interest rates, prepayment speeds, etc.)
Level 3 - unobservable inputs (including the Fund's own assumptions based on the best information available)
Valuation techniques used to value the Fund's investments by major category are as follows:
Equity securities, including restricted securities, for which market quotations are readily available, are valued at the last reported sale price or official closing price as reported by a third party pricing vendor on the primary market or exchange on which they are traded and are categorized as Level 1 in the hierarchy. In the event there were no sales during the day or closing prices are not available, securities are valued at the last quoted bid price or may be valued using the last available price and are generally categorized as Level 2 in the hierarchy. For foreign equity securities, when market or security specific events arise, comparisons to the valuation of American Depositary Receipts (ADRs), futures contracts, Exchange-Traded Funds (ETFs) and certain indexes as well as quoted prices for similar securities may be used and would be categorized as Level 2 in the hierarchy. Utilizing these techniques may result in transfers between Level 1 and Level 2. For equity securities, including restricted securities, where observable inputs are limited, assumptions about market activity and risk are used and these securities may be categorized as Level 3 in the hierarchy.
Annual Report
3. Significant Accounting Policies - continued
Investment Valuation - continued
Investments in open-end mutual funds, including the Fidelity Central Funds, are valued at their closing net asset value (NAV) each business day and are categorized as Level 1 in the hierarchy.
Changes in valuation techniques may result in transfers in or out of an assigned level within the disclosure hierarchy. The aggregate value of investments by input level, as of June 30, 2014 is included at the end of the Fund's Schedule of Investments.
Foreign Currency. The Fund may use foreign currency contracts to facilitate transactions in foreign-denominated securities. Gains and losses from these transactions may arise from changes in the value of the foreign currency or if the counterparties do not perform under the contracts' terms.
Foreign-denominated assets, including investment securities, and liabilities are translated into U.S. dollars at the exchange rates at period end. Purchases and sales of investment securities, income and dividends received and expenses denominated in foreign currencies are translated into U.S. dollars at the exchange rate in effect on the transaction date.
The effects of exchange rate fluctuations on investments are included with the net realized and unrealized gain (loss) on investment securities. Other foreign currency transactions resulting in realized and unrealized gain (loss) are disclosed separately.
Investment Transactions and Income. For financial reporting purposes, the Fund's investment holdings and NAV include trades executed through the end of the last business day of the period. The NAV per share for processing shareholder transactions is calculated as of the close of business of the New York Stock Exchange (NYSE), normally 4:00 p.m. Eastern time and includes trades executed through the end of the prior business day. Gains and losses on securities sold are determined on the basis of identified cost and may include proceeds received from litigation. Dividend income is recorded on the ex-dividend date, except for certain dividends from foreign securities where the ex-dividend date may have passed, which are recorded as soon as the Fund is informed of the ex-dividend date. Non-cash dividends included in dividend income, if any, are recorded at the fair market value of the securities received. Income and capital gain distributions from Fidelity Central Funds, if any, are recorded on the ex-dividend date. Distributions received on securities that represent a return of capital or capital gain are recorded as a reduction of cost of investments and/or as a realized gain. Subsequent to ex-dividend date the Fund determines the components of these distributions, based upon receipt of tax filings or other correspondence relating to the underlying investment. Interest income is accrued as earned and includes coupon interest and amortization of premium and accretion of discount on debt securities as applicable. Investment income is recorded net of foreign taxes withheld where recovery of such taxes is uncertain.
Annual Report
Notes to Financial Statements - continued
3. Significant Accounting Policies - continued
Class Allocations and Expenses. Investment income, realized and unrealized capital gains and losses, common expenses of the Fund, and certain fund-level expense reductions, if any, are allocated daily on a pro-rata basis to each class based on the relative net assets of each class to the total net assets of the Fund. Each class differs with respect to transfer agent and distribution and service plan fees incurred. Certain expense reductions may also differ by class. For the reporting period, the allocated portion of income and expenses to each class as a percent of its average net assets may vary due to the timing of recording these transactions in relation to fluctuating net assets of the classes. Expenses directly attributable to a fund are charged to that fund. Expenses attributable to more than one fund are allocated among the respective funds on the basis of relative net assets or other appropriate methods. Expense estimates are accrued in the period to which they relate and adjustments are made when actual amounts are known.
Income Tax Information and Distributions to Shareholders. Each year, the Fund intends to qualify as a regulated investment company under Subchapter M of the Internal Revenue Code, including distributing substantially all of its taxable income and realized gains. As a result, no provision for U.S. Federal income taxes is required. As of June 30, 2014, the Fund did not have any unrecognized tax benefits in the financial statements; nor is the Fund aware of any tax positions for which it is reasonably possible that the total amounts of unrecognized tax benefits will significantly change in the next twelve months. The Fund files a U.S. federal tax return, in addition to state and local tax returns as required. The Fund's federal income tax returns are subject to examination by the Internal Revenue Service (IRS) for a period of three fiscal years after they are filed. State and local tax returns may be subject to examination for an additional fiscal year depending on the jurisdiction. Foreign taxes are provided for based on the Fund's understanding of the tax rules and rates that exist in the foreign markets in which it invests.
Distributions are declared and recorded on the ex-dividend date. Income dividends and capital gain distributions are declared separately for each class. Income and capital gain distributions are determined in accordance with income tax regulations, which may differ from GAAP. In addition, the Fund claimed a portion of the payment made to redeeming shareholders as a distribution for income tax purposes.
Capital accounts within the financial statements are adjusted for permanent book-tax differences. These adjustments have no impact on net assets or the results of operations. Capital accounts are not adjusted for temporary book-tax differences which will reverse in a subsequent period.
Book-tax differences are primarily due to foreign currency transactions, equity-debt classifications, capital loss carryforwards, and losses deferred due to wash sales.
Annual Report
3. Significant Accounting Policies - continued
Income Tax Information and Distributions to Shareholders - continued
The federal tax cost of investment securities and unrealized appreciation (depreciation) as of period end were as follows:
Gross unrealized appreciation | $ 868,594,923 |
Gross unrealized depreciation | (16,059,631) |
Net unrealized appreciation (depreciation) on securities and other investments | $ 852,535,292 |
| |
Tax Cost | $ 2,823,608,973 |
The tax-based components of distributable earnings as of period end were as follows:
Undistributed ordinary income | $ 28,109,862 |
Undistributed long-term capital gain | $ 78,650,493 |
Net unrealized appreciation (depreciation) | $ 852,542,261 |
The tax character of distributions paid was as follows:
| June 30, 2014 | June 30, 2013 |
Ordinary Income | $ 36,293,656 | $ 27,575,489 |
Long-term Capital Gains | 41,182,371 |
|
Total | $ 77,476,027 | $ 27,575,489 |
Restricted Securities. The Fund may invest in securities that are subject to legal or contractual restrictions on resale. These securities generally may be resold in transactions exempt from registration or to the public if the securities are registered. Disposal of these securities may involve time-consuming negotiations and expense, and prompt sale at an acceptable price may be difficult. Information regarding restricted securities is included at the end of the Fund's Schedule of Investments.
4. Purchases and Sales of Investments.
Purchases and sales of securities, other than short-term securities, aggregated $1,277,032,508 and $853,056,484, respectively.
5. Fees and Other Transactions with Affiliates.
Management Fee. Fidelity Management & Research Company (the investment adviser) and its affiliates provide the Fund with investment management related services for which the Fund pays a monthly management fee. The management fee is the sum of an individual fund fee rate that is based on an annual rate of .20% of the Fund's
Annual Report
Notes to Financial Statements - continued
5. Fees and Other Transactions with Affiliates - continued
Management Fee - continued
average net assets and an annualized group fee rate that averaged .25% during the period. The group fee rate is based upon the average net assets of all the mutual funds advised by the investment adviser, including any mutual funds previously advised by the investment adviser that are currently advised by Fidelity SelectCo, LLC, an affiliate of the investment adviser. The group fee rate decreases as assets under management increase and increases as assets under management decrease. For the reporting period, the total annual management fee rate was .45% of the Fund's average net assets.
Distribution and Service Plan Fees. In accordance with Rule 12b-1 of the 1940 Act, the Fund has adopted separate Distribution and Service Plans for each class of shares. Certain classes pay Fidelity Distributors Corporation (FDC), an affiliate of the investment adviser, separate Distribution and Service Fees, each of which is based on an annual percentage of each class' average net assets. In addition, FDC may pay financial intermediaries for selling shares of the Fund and providing shareholder support services. For the period, the Distribution and Service Fee rates, total fees and amounts retained by FDC were as follows:
| Distribution
Fee | Service
Fee | Total Fees | Retained
by FDC |
Class A | -% | .25% | $ 87,546 | $ 3,362 |
Class T | .25% | .25% | 63,304 | 232 |
Class B | .75% | .25% | 9,175 | 6,896 |
Class C | .75% | .25% | 124,784 | 55,523 |
| | | $ 284,809 | $ 66,013 |
Sales Load. FDC may receive a front-end sales charge of up to 5.75% for selling Class A shares and 3.50% for selling Class T shares, some of which is paid to financial intermediaries for selling shares of the Fund. Depending on the holding period, FDC may receive contingent deferred sales charges levied on Class A, Class T, Class B, and Class C redemptions. The deferred sales charges range from 5.00% to 1.00% for Class B shares, 1.00% for Class C shares, 1.00% for certain purchases of Class A shares and .25% for certain purchases of Class T shares.
Annual Report
5. Fees and Other Transactions with Affiliates - continued
Sales Load - continued
For the period, sales charge amounts retained by FDC were as follows:
| Retained
by FDC |
Class A | $ 20,530 |
Class T | 3,915 |
Class B* | 699 |
Class C* | 897 |
| $ 26,041 |
* When Class B and Class C shares are initially sold, FDC pays commissions from its own resources to financial intermediaries through which the sales are made.
Transfer Agent Fees. Fidelity Investments Institutional Operations Company, Inc., (FIIOC), an affiliate of the investment adviser, is the transfer, dividend disbursing and shareholder servicing agent for each class of the Fund. FIIOC receives account fees and asset-based fees that vary according to the account size and type of account of the shareholders of the respective classes of the Fund, except for Class Z. FIIOC receives an asset-based fee of Class Z's average net assets. FIIOC pays for typesetting, printing and mailing of shareholder reports, except proxy statements.
For the period, transfer agent fees for each class were as follows:
| Amount | % of
Average
Net Assets |
Class A | $ 74,123 | .21 |
Class T | 28,367 | .22 |
Class B | 2,566 | .28 |
Class C | 26,868 | .22 |
Mega Cap Stock | 4,669,765 | .18 |
Institutional Class | 944,693 | .22 |
Class Z | 44 | .05* |
| $ 5,746,426 | |
* Annualized
Accounting and Security Lending Fees. Fidelity Service Company, Inc. (FSC), an affiliate of the investment adviser, maintains the Fund's accounting records. The accounting fee is based on the level of average net assets for each month. Under a separate contract, FSC administers the security lending program. The security lending fee is based on the number and duration of lending transactions.
Annual Report
Notes to Financial Statements - continued
5. Fees and Other Transactions with Affiliates - continued
Brokerage Commissions. The Fund placed a portion of its portfolio transactions with brokerage firms which are affiliates of the investment adviser. Brokerage commissions are included in net realized gain (loss) and change in net unrealized appreciation (depreciation) in the Statement of Operations. The commissions paid to these affiliated firms were $17,995 for the period.
Interfund Lending Program. Pursuant to an Exemptive Order issued by the SEC, the Fund, along with other registered investment companies having management contracts with FMR or other affiliated entities of FMR, may participate in an interfund lending program. This program provides an alternative credit facility allowing the funds to borrow from, or lend money to, other participating affiliated funds. At period end, there were no interfund loans outstanding. The Fund's activity in this program during the period for which loans were outstanding was as follows:
Borrower or Lender | Average Loan
Balance | Weighted Average Interest Rate | Interest
Expense |
Borrower | $ 9,205,303 | .30% | $ 2,541 |
6. Committed Line of Credit.
The Fund participates with other funds managed by the investment adviser FMR or an affiliate in a $4.25 billion credit facility (the "line of credit") to be utilized for temporary or emergency purposes to fund shareholder redemptions or for other short-term liquidity purposes. The Fund has agreed to pay commitment fees on its pro-rata portion of the line of credit, which amounted to $5,038 and is reflected in Miscellaneous expenses on the Statement of Operations. During the period, the Fund did not borrow on this line of credit.
7. Security Lending.
The Fund lends portfolio securities through a lending agent from time to time in order to earn additional income. For equity securities, a lending agent is used and may loan securities to certain qualified borrowers, including Fidelity Capital Markets (FCM), a broker-dealer affiliated with the Fund. On the settlement date of the loan, the Fund receives collateral (in the form of U.S. Treasury obligations, letters of credit and/or cash) against the loaned securities and maintains collateral in an amount not less than 100% of the market value of the loaned securities during the period of the loan. The market value of the loaned securities is determined at the close of business of the Fund and any additional required collateral is delivered to the Fund on the next business day. If the borrower defaults on its obligation to return the securities loaned because of insolvency or other reasons, the Fund may apply collateral received from the borrower against the obligation. The Fund may experience delays and costs in recovering the securities
Annual Report
7. Security Lending - continued
loaned. Any cash collateral received is invested in the Fidelity Securities Lending Cash Central Fund. The value of loaned securities and cash collateral at period end are disclosed on the Fund's Statement of Assets and Liabilities. Security lending income represents the income earned on investing cash collateral, less rebates paid to borrowers and any lending agent fees associated with the loan, plus any premium payments received for lending certain types of securities. Security lending income is presented in the Statement of Operations as a component of income from Fidelity Central Funds. Total security lending income during the period amounted to $89,556. During the period, there were no securities loaned to FCM.
8. Bank Borrowings.
The Fund is permitted to have bank borrowings for temporary or emergency purposes to fund shareholder redemptions or for other short-term liquidity requirements. The Fund has established borrowing arrangements with certain banks. The interest rate on the borrowings is the bank's base rate, as revised from time to time. The average loan balance during the period for which loans were outstanding amounted to $8,939,500. The weighted average interest rate was .57%. The interest expense amounted to $283 under the bank borrowing program. At period end, there were no bank borrowings outstanding.
9. Expense Reductions.
The investment adviser voluntarily agreed to reimburse each class to the extent annual operating expenses exceeded certain levels of average net assets as noted in the table below. Some expenses, for example interest expense, including commitment fees, are excluded from this reimbursement.
The following classes were in reimbursement during the period:
| Reimbursement |
Class A | $ 125 |
Class T | 56 |
Class B | 4 |
Class C | 50 |
Mega Cap Stock | 11,993 |
Institutional Class | 1,697 |
| $ 13,925 |
In addition, the investment adviser reimbursed a portion of the Fund's operating expenses during the period in the amount of $6,711.
Commissions paid to certain brokers with whom the investment adviser, or its affiliates, places trades on behalf of the Fund include an amount in addition to trade execution, which may be rebated back to the Fund to offset certain expenses. This amount totaled $16,290 for the period.
Annual Report
Notes to Financial Statements - continued
10. Distributions to Shareholders.
Distributions to shareholders of each class were as follows:
Years ended June 30, | 2014 A | 2013 |
From net investment income | | |
Class A | $ 295,572 | $ 137,534 |
Class T | 98,011 | 36,492 |
Class B | 2,617 | 2,304 |
Class C | 56,227 | 13,133 |
Mega Cap Stock | 30,989,923 | 23,359,421 |
Institutional Class | 4,262,259 | 4,026,605 |
Class Z | 727 | - |
Total | $ 35,705,336 | $ 27,575,489 |
From net realized gain | | |
Class A | $ 453,140 | $ - |
Class T | 181,208 | - |
Class B | 13,697 | - |
Class C | 173,595 | - |
Mega Cap Stock | 35,870,113 | - |
Institutional Class | 5,077,450 | - |
Class Z | 1,488 | - |
Total | $ 41,770,691 | $ - |
A Distributions for Class Z are for the period August 13, 2013 (commencement of sale of shares) to June 30, 2014.
11. Share Transactions.
Transactions for each class of shares were as follows:
| Shares | Dollars |
Years ended June 30, | 2014 A | 2013 | 2014 A | 2013 |
Class A | | | | |
Shares sold | 3,913,806 | 1,001,677 | $ 60,286,671 | $ 12,394,211 |
Reinvestment of distributions | 45,968 | 11,084 | 673,798 | 127,952 |
Shares redeemed | (725,328) | (279,053) | (11,077,893) | (3,495,724) |
Net increase (decrease) | 3,234,446 | 733,708 | $ 49,882,576 | $ 9,026,439 |
Class T | | | | |
Shares sold | 595,712 | 517,456 | $ 8,877,747 | $ 6,404,547 |
Reinvestment of distributions | 18,863 | 3,084 | 276,847 | 35,826 |
Shares redeemed | (270,157) | (107,959) | (4,055,631) | (1,368,248) |
Net increase (decrease) | 344,418 | 412,581 | $ 5,098,963 | $ 5,072,125 |
Annual Report
11. Share Transactions - continued
| Shares | Dollars |
Years ended June 30, | 2014 A | 2013 | 2014 A | 2013 |
Class B | | | | |
Shares sold | 27,198 | 9,952 | $ 400,691 | $ 125,476 |
Reinvestment of distributions | 1,081 | 196 | 15,861 | 2,261 |
Shares redeemed | (24,976) | (20,917) | (377,365) | (255,293) |
Net increase (decrease) | 3,303 | (10,769) | $ 39,187 | $ (127,556) |
Class C | | | | |
Shares sold | 504,584 | 448,373 | $ 7,460,222 | $ 5,664,292 |
Reinvestment of distributions | 15,230 | 988 | 221,741 | 11,494 |
Shares redeemed | (83,515) | (116,347) | (1,262,211) | (1,448,415) |
Net increase (decrease) | 436,299 | 333,014 | $ 6,419,752 | $ 4,227,371 |
Mega Cap Stock | | | | |
Shares sold | 53,817,396 | 84,998,537 | $ 817,611,772 | $ 1,035,668,817 |
Reinvestment of distributions | 4,142,626 | 1,836,891 | 61,008,516 | 21,294,763 |
Shares redeemed | (46,852,676) | (39,801,746) | (705,756,204) | (498,490,773) |
Net increase (decrease) | 11,107,346 | 47,033,682 | $ 172,864,084 | $ 558,472,807 |
Institutional Class | | | | |
Shares sold | 19,497,644 | 11,389,839 | $ 301,200,514 | $ 129,734,591 |
Reinvestment of distributions | 626,527 | 338,467 | 9,201,440 | 3,911,623 |
Shares redeemed | (2,047,800) | (4,517,962) | (31,155,657) | (57,335,322) |
Net increase (decrease) | 18,076,371 | 7,210,344 | $ 279,246,297 | $ 76,310,892 |
Class Z | | | | |
Shares sold | 6,988 | - | $ 100,000 | $ - |
Reinvestment of distributions | 150 | - | 2,215 | - |
Net increase (decrease) | 7,138 | - | $ 102,215 | $ - |
A Share transactions for Class Z are for the period August 13, 2013 (commencement of sale of shares) to June 30, 2014.
12. Other.
The Fund's organizational documents provide former and current trustees and officers with a limited indemnification against liabilities arising in connection with the performance of their duties to the Fund. In the normal course of business, the Fund may also enter into contracts that provide general indemnifications. The Fund's maximum exposure under these arrangements is unknown as this would be dependent on future claims that may be made against the Fund. The risk of material loss from such claims is considered remote.
At the end of the period, Strategic Advisers U.S. Opportunity Fund was the owner of record of approximately 11% of the total outstanding shares of the Fund.
Annual Report
To the Trustees of Fidelity Hastings Street Trust and the Shareholders of Fidelity Mega Cap Stock Fund:
In our opinion, the accompanying statement of assets and liabilities, including the schedule of investments, and the related statements of operations and of changes in net assets and the financial highlights present fairly, in all material respects, the financial position of Fidelity Mega Cap Stock Fund (a fund of Fidelity Hastings Street Trust) at June 30, 2014, the results of its operations for the year then ended, the changes in its net assets for each of the two years in the period then ended and the financial highlights for each of the periods indicated, in conformity with accounting principles generally accepted in the United States of America. These financial statements and financial highlights (hereafter referred to as "financial statements") are the responsibility of the Fidelity Mega Cap Stock Fund's management. Our responsibility is to express an opinion on these financial statements based on our audits. We conducted our audits of these financial statements in accordance with the standards of the Public Company Accounting Oversight Board (United States). Those standards require that we plan and perform the audit to obtain reasonable assurance about whether the financial statements are free of material misstatement. An audit includes examining, on a test basis, evidence supporting the amounts and disclosures in the financial statements, assessing the accounting principles used and significant estimates made by management, and evaluating the overall financial statement presentation. We believe that our audits, which included confirmation of securities at June 30, 2014 by correspondence with the custodian and brokers, provide a reasonable basis for our opinion.
PricewaterhouseCoopers LLP
Boston, Massachusetts
August 12, 2014
Annual Report
The Trustees, Member of the Advisory Board, and officers of the trust and fund, as applicable, are listed below. The Board of Trustees governs the fund and is responsible for protecting the interests of shareholders. The Trustees are experienced executives who meet periodically throughout the year to oversee the fund's activities, review contractual arrangements with companies that provide services to the fund, oversee management of the risks associated with such activities and contractual arrangements, and review the fund's performance. Except for James C. Curvey, each of the Trustees oversees 173 funds. Mr. Curvey oversees 397 funds.
The Trustees hold office without limit in time except that (a) any Trustee may resign; (b) any Trustee may be removed by written instrument, signed by at least two-thirds of the number of Trustees prior to such removal; (c) any Trustee who requests to be retired or who has become incapacitated by illness or injury may be retired by written instrument signed by a majority of the other Trustees; and (d) any Trustee may be removed at any special meeting of shareholders by a two-thirds vote of the outstanding voting securities of the trust. Each Trustee who is not an interested person (as defined in the 1940 Act) of the trust and the fund (Independent Trustee), shall retire not later than the last day of the calendar year in which his or her 75th birthday occurs. The Independent Trustees may waive this mandatory retirement age policy with respect to individual Trustees. The officers and Advisory Board Member hold office without limit in time, except that any officer and Advisory Board Member may resign or may be removed by a vote of a majority of the Trustees at any regular meeting or any special meeting of the Trustees. Except as indicated, each individual has held the office shown or other offices in the same company for the past five years.
Experience, Skills, Attributes, and Qualifications of the Fund's Trustees. The Governance and Nominating Committee has adopted a statement of policy that describes the experience, qualifications, attributes, and skills that are necessary and desirable for potential Independent Trustee candidates (Statement of Policy). The Board believes that each Trustee satisfied at the time he or she was initially elected or appointed a Trustee, and continues to satisfy, the standards contemplated by the Statement of Policy. The Governance and Nominating Committee also engages professional search firms to help identify potential Independent Trustee candidates who have the experience, qualifications, attributes, and skills consistent with the Statement of Policy. From time to time, additional criteria based on the composition and skills of the current Independent Trustees, as well as experience or skills that may be appropriate in light of future changes to board composition, business conditions, and regulatory or other developments, have also been considered by the professional search firms and the Governance and Nominating Committee. In addition, the Board takes into account the Trustees' commitment and participation in Board and committee meetings, as well as their leadership of standing and ad hoc committees throughout their tenure.
In determining that a particular Trustee was and continues to be qualified to serve as a Trustee, the Board has considered a variety of criteria, none of which, in isolation, was controlling. The Board believes that, collectively, the Trustees have balanced and diverse experience, qualifications, attributes, and skills, which allow the Board to operate effectively in governing the fund and protecting the interests of shareholders. Information about the specific experience, skills, attributes, and qualifications of each Trustee, which in each case led to the Board's conclusion that the Trustee should serve (or continue to serve) as a trustee of the fund, is provided below.
Annual Report
Board Structure and Oversight Function. James C. Curvey is an interested person (as defined in the 1940 Act) and currently serves as Chairman. The Trustees have determined that an interested Chairman is appropriate and benefits shareholders because an interested Chairman has a personal and professional stake in the quality and continuity of services provided to the fund. Independent Trustees exercise their informed business judgment to appoint an individual of their choosing to serve as Chairman, regardless of whether the Trustee happens to be independent or a member of management. The Independent Trustees have determined that they can act independently and effectively without having an Independent Trustee serve as Chairman and that a key structural component for assuring that they are in a position to do so is for the Independent Trustees to constitute a substantial majority for the Board. The Independent Trustees also regularly meet in executive session. Ned C. Lautenbach serves as Chairman of the Independent Trustees and as such (i) acts as a liaison between the Independent Trustees and management with respect to matters important to the Independent Trustees and (ii) with management prepares agendas for Board meetings.
Fidelity funds are overseen by different Boards of Trustees. The fund's Board oversees Fidelity's equity and high income funds and another Board oversees Fidelity's investment-grade bond, money market, and asset allocation funds. The asset allocation funds may invest in Fidelity funds overseen by the fund's Board. The use of separate Boards, each with its own committee structure, allows the Trustees of each group of Fidelity funds to focus on the unique issues of the funds they oversee, including common research, investment, and operational issues. On occasion, the separate Boards establish joint committees to address issues of overlapping consequences for the Fidelity funds overseen by each Board.
The Trustees operate using a system of committees to facilitate the timely and efficient consideration of all matters of importance to the Trustees, the fund, and fund shareholders and to facilitate compliance with legal and regulatory requirements and oversight of the fund's activities and associated risks. The Board, acting through its committees, has charged FMR and its affiliates with (i) identifying events or circumstances the occurrence of which could have demonstrably adverse effects on the fund's business and/or reputation; (ii) implementing processes and controls to lessen the possibility that such events or circumstances occur or to mitigate the effects of such events or circumstances if they do occur; and (iii) creating and maintaining a system designed to evaluate continuously business and market conditions in order to facilitate the identification and implementation processes described in (i) and (ii) above. Because the day-to-day operations and activities of the fund are carried out by or through FMR, its affiliates and other service providers, the fund's exposure to risks is mitigated but not eliminated by the processes overseen by the Trustees. While each of the Board's committees has responsibility for overseeing different aspects of the fund's activities, oversight is exercised primarily through the Operations, Audit, and Compliance Committees. In addition, the Independent Trustees have worked with FMR to enhance the Board's oversight of investment and financial risks, legal and regulatory risks, technology risks, and operational risks, including the development of additional risk reporting to the Board. For example, a working group comprised of Independent Trustees and FMR has worked and continues to work to review the Fidelity funds' valuation-related activities, reporting and risk management. Appropriate personnel, including but not limited to the fund's Chief Compliance Officer (CCO), FMR's internal auditor, the independent accountants, the fund's Treasurer and portfolio management personnel, make periodic reports to the Board's committees, as appropriate, including an annual review of FMR's risk management program for the Fidelity funds. The responsibilities of each standing committee, including their oversight responsibilities, are described further under "Standing Committees of the Fund's Trustees."
Annual Report
Trustees and Officers - continued
The fund's Statement of Additional Information (SAI) includes more information about the Trustees. To request a free copy, call Fidelity at 1-877-208-0098.
Interested Trustees*:
Correspondence intended for each Trustee who is an interested person may be sent to Fidelity Investments, 245 Summer Street, Boston, Massachusetts 02210.
Name, Year of Birth; Principal Occupations and Other Relevant Experience+ |
James C. Curvey (1935) |
Year of Election or Appointment: 2007 Trustee Chairman of the Board of Trustees |
| Mr. Curvey also serves as Trustee of other Fidelity funds. Mr. Curvey is a Director of Fidelity Research & Analysis Co. (2009-present), and Vice Chairman (2007-present) and Director of FMR LLC. In addition, Mr. Curvey serves as an Overseer for the Boston Symphony Orchestra and a member of the Trustees of Villanova University. Previously, Mr. Curvey served as a Director of Fidelity Investments Money Management, Inc. (2009-2014), a Director of FMR (2007-2014), a Director of FMR Co., Inc. (2007-2014) and was the Vice Chairman (2006-2007) and Director (2000-2007) of FMR Corp. |
Charles S. Morrison (1960) |
Year of Election or Appointment: 2014 Trustee |
| Mr. Morrison also serves as Trustee of other funds. He serves as President, Asset Management (2014-present) and is an employee of Fidelity Investments. Previously, Mr. Morrison served as Vice President of Fidelity's Fixed Income and Asset Allocation Funds (2012-2014), President, Fixed Income (2011-2014), Vice President of Fidelity's Money Market Funds (2005-2009), President, Money Market Group Leader of FMR (2009), and Senior Vice President, Money Market Group of FMR (2004-2009). Mr. Morrison also served as Vice President of Fidelity's Bond Funds (2002-2005), certain Balanced Funds (2002-2005), and certain Asset Allocation Funds (2002-2007), and as Senior Vice President (2002-2005) of Fidelity's Bond Division. |
* Trustees have been determined to be "Interested Trustees" by virtue of, among other things, their affiliation with the trust or various entities under common control with FMR.
+ The information above includes each Trustee's principal occupation during the last five years and other information relating to the experience, attributes, and skills relevant to each Trustee's qualifications to serve as a Trustee, which led to the conclusion that each Trustee should serve as a Trustee for the fund.
Annual Report
Trustees and Officers - continued
Independent Trustees:
Correspondence intended for each Independent Trustee (that is, the Trustees other than the Interested Trustees) may be sent to Fidelity Investments, P.O. Box 55235, Boston, Massachusetts 02205-5235.
Name, Year of Birth; Principal Occupations and Other Relevant Experience+ |
Dennis J. Dirks (1948) |
Year of Election or Appointment: 2005 Trustee |
| Mr. Dirks also serves as Trustee of other Fidelity funds. Prior to his retirement in May 2003, Mr. Dirks was Chief Operating Officer and a member of the Board of The Depository Trust & Clearing Corporation (DTCC). He also served as President, Chief Operating Officer, and Board member of The Depository Trust Company (DTC) and President and Board member of the National Securities Clearing Corporation (NSCC). In addition, Mr. Dirks served as Chief Executive Officer and Board member of the Government Securities Clearing Corporation, Chief Executive Officer and Board member of the Mortgage-Backed Securities Clearing Corporation, as a Trustee and a member of the Finance Committee of Manhattan College (2005-2008), and as a Trustee and a member of the Finance Committee of AHRC of Nassau County (2006-2008). Mr. Dirks is a member of the Independent Directors Council (IDC) Governing Council (2010-present) and Board of Directors for The Brookville Center for Children's Services, Inc. (2009-present). |
Alan J. Lacy (1953) |
Year of Election or Appointment: 2008 Trustee |
| Mr. Lacy also serves as Trustee of other Fidelity funds. Mr. Lacy serves as Senior Adviser (2007-present) of Oak Hill Capital Partners, L.P. (private equity). Mr. Lacy also served as Chief Executive Officer (2000-2005) and Vice Chairman (2005-2006) of Sears Holdings Corporation and Sears, Roebuck and Co. (retail). In addition, Mr. Lacy serves as a member of the Board of Directors of Dave & Buster's Entertainment, Inc. (restaurant and entertainment complexes, 2010-present), Earth Fare, Inc. (retail grocery, 2012-present), The Hillman Companies, Inc. (hardware wholesalers, 2010-present), and Bristol-Myers Squibb Company (global pharmaceuticals, 2008-present). Mr. Lacy is a member of the Board of Trustees of The National Parks Conservation Association (2006-present). Previously, Mr. Lacy served as Chairman of the Board of Trustees of the National Parks Conservation Association (2008-2011) and as a member of the Board of Directors for the Western Union Company (global money transfer, 2006-2011). |
Ned C. Lautenbach (1944) |
Year of Election or Appointment: 2000 Trustee Chairman of the Independent Trustees |
| Mr. Lautenbach also serves as Trustee of other Fidelity funds. Mr. Lautenbach currently serves as the Lead Director of the Eaton Corporation Board of Directors (diversified industrial, 1997-present). Mr. Lautenbach is Chairman of the Board of Directors of the Philharmonic Center for the Arts in Naples, Florida (2012-present) and a member of the Council on Foreign Relations (1994-present). Previously, Mr. Lautenbach was a Partner/Advisory Partner at Clayton, Dubilier & Rice, LLC (private equity investment, 1998-2010), as well as a Director of Sony Corporation (2006-2007). |
Joseph Mauriello (1944) |
Year of Election or Appointment: 2008 Trustee |
| Mr. Mauriello also serves as Trustee of other Fidelity funds. Prior to his retirement in January 2006, Mr. Mauriello served in numerous senior management positions including Deputy Chairman and Chief Operating Officer (2004-2005), and Vice Chairman of Financial Services (2002-2004) of KPMG LLP US (professional services, 1965-2005). Mr. Mauriello currently serves as a member of the Board of Directors of XL Group plc. (global insurance and re-insurance, 2006-present). Previously, Mr. Mauriello served as a Director of the Hamilton Funds of the Bank of New York (2006-2007) and of Arcadia Resources Inc. (health care services and products, 2007-2012). |
Robert W. Selander (1950) |
Year of Election or Appointment: 2011 Trustee |
| Mr. Selander also serves as Trustee of other Fidelity funds. Previously, Mr. Selander served as a Member of the Advisory Board of other Fidelity funds (2011), and Executive Vice Chairman (2010), Chief Executive Officer (2009-2010), and President and Chief Executive Officer (1997-2009) of Mastercard, Inc. |
Cornelia M. Small (1944) |
Year of Election or Appointment: 2005 Trustee |
| Ms. Small also serves as Trustee of other Fidelity funds. Ms. Small is a member of the Board of Directors (2009-present) and Chair of the Investment Committee (2010-present) of the Teagle Foundation. Ms. Small also serves on the Investment Committee of the Berkshire Taconic Community Foundation (2008-present). Previously, Ms. Small served as Chairperson (2002-2008) and a member of the Investment Committee and Chairperson (2008-2012) and a member of the Board of Trustees of Smith College. In addition, Ms. Small served as Chief Investment Officer, Director of Global Equity Investments, and a member of the Board of Directors of Scudder, Stevens & Clark and Scudder Kemper Investments. |
William S. Stavropoulos (1939) |
Year of Election or Appointment: 2001 Trustee Vice Chairman of the Independent Trustees |
| Mr. Stavropoulos also serves as Trustee of other Fidelity funds. Mr. Stavropoulos serves as President and Founder of the Michigan Baseball Foundation, the Great Lakes Loons (2007-present). Mr. Stavropoulos is Chairman Emeritus of the Board of Directors of The Dow Chemical Company, where he previously served in numerous senior management positions, including President, CEO (1995-2000; 2002-2004), Chairman of the Executive Committee (2000-2006), and as a member of the Board of Directors (1990-2006). Currently, Mr. Stavropoulos is Chairman of the Board of Directors of Univar Inc. (global distributor of commodity and specialty chemicals), a Director of Teradata Corporation (data warehousing and technology solutions), and Maersk Inc. (industrial conglomerate), and a member of the Advisory Board for Metalmark Capital LLC (private equity investment, 2005-present). Mr. Stavropoulos is an operating advisor to Clayton, Dubilier & Rice, LLC (private equity investment). In addition, Mr. Stavropoulos is a member of the University of Notre Dame Advisory Council for the College of Science, a Trustee of the Rollin L. Gerstacker Foundation, and a Director of the Naples Philharmonic Center for the Arts. Previously, Mr. Stavropoulos served as a Director of Chemical Financial Corporation (bank holding company, 1993-2012) and Tyco International, Ltd. (multinational manufacturing and services, 2007-2012). |
David M. Thomas (1949) |
Year of Election or Appointment: 2008 Trustee |
| Mr. Thomas also serves as Trustee of other Fidelity funds. Mr. Thomas serves as Non-Executive Chairman of the Board of Directors of Fortune Brands Home and Security (home and security products, 2011-present), and as a member of the Board of Directors of Interpublic Group of Companies, Inc. (marketing communication, 2004-present). Previously, Mr. Thomas served as Executive Chairman (2005-2006) and Chairman and Chief Executive Officer (2000-2005) of IMS Health, Inc. (pharmaceutical and healthcare information solutions), and a Director of Fortune Brands, Inc. (consumer products, 2000-2011). |
+ The information above includes each Trustee's principal occupation during the last five years and other information relating to the experience, attributes, and skills relevant to each Trustee's qualifications to serve as a Trustee, which led to the conclusion that each Trustee should serve as a Trustee for the fund.
Advisory Board Member and Officers:
Correspondence intended for each officer and Peter S. Lynch may be sent to Fidelity Investments, 245 Summer Street, Boston, Massachusetts 02210. Officers appear below in alphabetical order.
Name, Year of Birth; Principal Occupation |
Peter S. Lynch (1944) |
Year of Election or Appointment: 2003 Member of the Advisory Board |
| Mr. Lynch also serves as Member of the Advisory Board of other Fidelity funds. Mr. Lynch is Vice Chairman and a Director of FMR and FMR Co., Inc. In addition, Mr. Lynch serves as a Trustee of Boston College and as the Chairman of the Inner-City Scholarship Fund. Previously, Mr. Lynch served on the Special Olympics International Board of Directors (1997-2006). |
Elizabeth Paige Baumann (1968) |
Year of Election or Appointment: 2012 Anti-Money Laundering (AML) Officer |
| Ms. Baumann also serves as AML Officer of other funds. She is Chief AML Officer of FMR LLC (2012-present) and is an employee of Fidelity Investments. Previously, Ms. Baumann served as Vice President and Deputy Anti-Money Laundering Officer (2007-2012). |
William C. Coffey (1969) |
Year of Election or Appointment: 2009 Assistant Secretary |
| Mr. Coffey also serves as Assistant Secretary of other funds. He is Senior Vice President and Deputy General Counsel of FMR LLC (2010-present), and is an employee of Fidelity Investments. Previously, Mr. Coffey served as Vice President and Associate General Counsel of FMR LLC (2005-2009). |
Jonathan Davis (1968) |
Year of Election or Appointment: 2010 Assistant Treasurer |
| Mr. Davis also serves as Assistant Treasurer of other funds. Mr. Davis is an employee of Fidelity Investments. Previously, Mr. Davis served as Vice President and Associate General Counsel of FMR LLC (2003-2010). |
Adrien E. Deberghes (1967) |
Year of Election or Appointment: 2008 Deputy Treasurer |
| Mr. Deberghes also serves as an officer of other funds. He is an employee of Fidelity Investments (2008-present). Prior to joining Fidelity Investments, Mr. Deberghes was Senior Vice President of Mutual Fund Administration at State Street Corporation (2007-2008), Senior Director of Mutual Fund Administration at Investors Bank & Trust (2005-2007), and Director of Finance for Dunkin' Brands (2000-2005). |
Stephanie J. Dorsey (1969) |
Year of Election or Appointment: 2010 Assistant Treasurer |
| Ms. Dorsey also serves as an officer of other funds. She is an employee of Fidelity Investments (2008-present) and has served in other fund officer roles. Prior to joining Fidelity Investments, Ms. Dorsey served as Treasurer (2004-2008) of the JPMorgan Mutual Funds and Vice President (2004-2008) of JPMorgan Chase Bank. |
Howard J. Galligan III (1966) |
Year of Election or Appointment: 2014 Chief Financial Officer |
| Mr. Galligan also serves as Chief Financial Officer of other funds. Mr. Galligan serves as President of Fidelity Pricing and Cash Management Services (FPCMS) (2014-present) and as a Director of Strategic Advisers, Inc. (2008-present). Previously, Mr. Galligan served as Chief Administrative Officer of Asset Management (2011-2014) and Chief Operating Officer and Senior Vice President of Investment Support for Strategic Advisers, Inc. (2003-2011). |
Scott C. Goebel (1968) |
Year of Election or Appointment: 2008 Secretary and Chief Legal Officer (CLO) |
| Mr. Goebel serves as Secretary and CLO of other funds. Mr. Goebel also serves as Secretary of Fidelity SelectCo, LLC (2013-present), Fidelity Investments Money Management, Inc. (FIMM) (2010-present) and Fidelity Research and Analysis Company (FRAC) (2010-present); General Counsel, Secretary, and Senior Vice President of FMR (2008-present) and FMR Co., Inc. (2008-present); Chief Legal Officer of Fidelity Management & Research (Hong Kong) Limited (2008-present); and Assistant Secretary of Fidelity Management & Research (Japan) Inc. (2008-present) and Fidelity Management & Research (U.K.) Inc. (2008-present). Previously, Mr. Goebel served as Secretary and CLO of other Fidelity funds (2008-2013), Assistant Secretary of FIMM (2008-2010), FRAC (2008-2010), and certain funds (2007-2008); and as Vice President and Secretary of Fidelity Distributors Corporation (FDC) (2005-2007). Mr. Goebel has been employed by FMR LLC or an affiliate since 2001. |
Brian B. Hogan (1964) |
Year of Election or Appointment: 2009 Vice President |
| Mr. Hogan also serves as Trustee or Vice President of other funds. Mr. Hogan serves as President of FMR's Equity Division (2009-present). Previously, Mr. Hogan served as Senior Vice President, Equity Research of FMR (2006-2009) and as a portfolio manager. |
Chris Maher (1972) |
Year of Election or Appointment: 2013 Assistant Treasurer |
| Mr. Maher serves as Assistant Treasurer of other funds. Mr. Maher is Vice President of Valuation Oversight and is an employee of Fidelity Investments. Previously, Mr. Maher served as Vice President of Asset Management Compliance (2013), Vice President of FMR's Program Management Group (2010-2013), and Vice President of Valuation Oversight (2008-2010). |
Melissa M. Reilly (1971) |
Year of Election or Appointment: 2014 Vice President of certain Equity Funds |
| Ms. Reilly also serves as Vice President of other funds. Ms. Reilly is an employee of Fidelity Investments (2004-present). |
Kenneth B. Robins (1969) |
Year of Election or Appointment: 2008 President and Treasurer |
| Mr. Robins also serves as an officer of other funds. Mr. Robins serves as Executive Vice President of Fidelity Investments Money Management, Inc. (FIMM) (2013-present) and is an employee of Fidelity Investments (2004-present). Previously, Mr. Robins served in other fund officer roles. |
Stephen Sadoski (1971) |
Year of Election or Appointment: 2012 Deputy Treasurer |
| Mr. Sadoski also serves as Deputy Treasurer of other funds. He is an employee of Fidelity Investments (2012-present) and has served in another fund officer role. Prior to joining Fidelity Investments, Mr. Sadoski served as an assistant chief accountant in the Division of Investment Management of the Securities and Exchange Commission (SEC) (2009-2012) and as a senior manager at Deloitte & Touche LLP (1997-2009). |
Stacie M. Smith (1974) |
Year of Election or Appointment: 2013 Deputy Treasurer |
| Ms. Smith also serves as an officer of other funds. She is an employee of Fidelity Investments (2009-present) and has served in other fund officer roles. Prior to joining Fidelity Investments, Ms. Smith served as Senior Audit Manager of Ernst & Young LLP (1996-2009). |
Renee Stagnone (1975) |
Year of Election or Appointment: 2013 Deputy Treasurer |
| Ms. Stagnone also serves as Deputy Treasurer of other funds. Ms. Stagnone is an employee of Fidelity Investments. |
Linda J. Wondrack (1964) |
Year of Election or Appointment: 2014 Chief Compliance Officer |
| Ms. Wondrack also serves as Chief Compliance Officer of other funds. Ms. Wondrack is Executive Vice President and head of the Ethics Office and Asset Management Compliance for Fidelity Investments (2012-present). Ms. Wondrack also serves as Chief Compliance Officer of Fidelity SelectCo, LLC (2014-present); Chief Compliance Officer of Impresa Management LLC (2013-present); and Chief Compliance Officer of FMR Co., Inc., Fidelity Investments Money Management, Inc., Fidelity Management & Research (Japan) Inc., Fidelity Management & Research (U.K.) Inc., Fidelity Management & Research (Hong Kong), Fidelity Management & Research Company, Pyramis Global Advisors, LLC, and Strategic Advisers, Inc., Ballyrock Investment Advisors LLC, and Northern Neck Investors LLC (2012-present). Previously, Ms. Wondrack served as Senior Vice President and Chief Compliance Officer for Columbia Management Investment Advisers, LLC (2005-2012); Chief Compliance Officer for certain funds within the Columbia Family of Funds (2007-2012); and Senior Vice President of Compliance Risk Management at Bank of America (2005-2010). |
Joseph F. Zambello (1957) |
Year of Election or Appointment: 2011 Deputy Treasurer |
| Mr. Zambello also serves as Deputy Treasurer of other funds. Mr. Zambello is an employee of Fidelity Investments. Previously, Mr. Zambello served as Vice President of FMR's Program Management Group (2009-2011) and Vice President of the Transfer Agent Oversight Group (2005-2009). |
Annual Report
The Board of Trustees of Fidelity Mega Cap Stock Fund voted to pay to shareholders of record at the opening of business on record date, the following distributions per share derived from capital gains realized from sales of portfolio securities, and dividends derived from net investment income:
| Pay Date | Record Date | Dividends | Capital Gains |
Class Z | 08/11/14 | 08/08/14 | $0.115 | $0.341 |
The fund hereby designates as a capital gain dividend with respect to the taxable year ended June 30, 2014, $119,836,862, or, if subsequently determined to be different, the net capital gain of such year.
Class Z designates 100% of the dividends distributed during the fiscal year as qualifying for the dividends-received deduction for corporate shareholders.
Class Z designates 100% of the dividends distributed during the fiscal year as amounts which may be taken into account as a dividend for purposes of the maximum rate under Section 1(h)(11) of the Internal Revenue Code.
The fund will notify shareholders in January 2015 of amounts for use in preparing 2014 income tax returns.
Annual Report
Investment Adviser
Fidelity Management & Research Company
Boston, MA
Investment Sub-Advisers
FMR Co., Inc.
Fidelity Management & Research
(U.K.) Inc.
Fidelity Management & Research
(Japan) Inc.
Fidelity Management & Research
(Hong Kong) Limited
General Distributor
Fidelity Distributors Corporation
Smithfield, RI
Transfer and Service Agents
Fidelity Investments Institutional Operations Company, Inc.
Boston, MA
Fidelity Service Company, Inc.
Boston, MA
Custodian
JPMorgan Chase Bank
New York, NY
(Fidelity Investment logo)(registered trademark)
AGIIZ-UANN-0814
1.9585879.100
Fidelity®
Fund
Annual Report
June 30, 2014
(Fidelity Cover Art)
Contents
Performance | (Click Here) | How the fund has done over time. |
Management's Discussion of Fund Performance | (Click Here) | The Portfolio Manager's review of fund performance and strategy. |
Shareholder Expense Example | (Click Here) | An example of shareholder expenses. |
Investment Changes | (Click Here) | A summary of major shifts in the fund's investments over the past six months. |
Investments | (Click Here) | A complete list of the fund's investments with their market values. |
Financial Statements | (Click Here) | Statements of assets and liabilities, operations, and changes in net assets, as well as financial highlights. |
Notes | (Click Here) | Notes to the financial statements. |
Report of Independent Registered Public Accounting Firm | (Click Here) | |
Trustees and Officers | (Click Here) | |
Distributions | (Click Here) | |
To view a fund's proxy voting guidelines and proxy voting record for the 12-month period ended June 30, visit http://www.fidelity.com/proxyvotingresults or visit the Securities and Exchange Commission's (SEC) web site at http://www.sec.gov. You may also call 1-800-544-8544 to request a free copy of the proxy voting guidelines.
Standard & Poor's, S&P and S&P 500 are registered service marks of The McGraw-Hill Companies, Inc. and have been licensed for use by Fidelity Distributors Corporation.
Other third-party marks appearing herein are the property of their respective owners.
All other marks appearing herein are registered or unregistered trademarks or service marks of FMR LLC or an affiliated company. © 2014 FMR LLC. All rights reserved.
Annual Report
This report and the financial statements contained herein are submitted for the general information of the shareholders of the fund. This report is not authorized for distribution to prospective investors in the fund unless preceded or accompanied by an effective prospectus.
A fund files its complete schedule of portfolio holdings with the SEC for the first and third quarters of each fiscal year on Form N-Q. Forms N-Q are available on the SEC's web site at http://www.sec.gov. A fund's Forms N-Q may be reviewed and copied at the SEC's Public Reference Room in Washington, DC. Information regarding the operation of the SEC's Public Reference Room may be obtained by calling 1-800-SEC-0330. For a complete list of a fund's portfolio holdings, view the most recent holdings listing, semiannual report, or annual report on Fidelity's web site at http://www.fidelity.com, http://www.advisor.fidelity.com, or http://www.401k.com, as applicable.
NOT FDIC INSURED • MAY LOSE VALUE • NO BANK GUARANTEE
Neither the fund nor Fidelity Distributors Corporation is a bank.
Annual Report
Average annual total return reflects the change in the value of an investment, assuming reinvestment of the class' distributions from dividend income and capital gains (the profits earned upon the sale of securities that have grown in value, if any) and assuming a constant rate of performance each year. The $10,000 table and the fund's returns do not reflect the deduction of taxes that a shareholder would pay on fund distributions or the redemption of fund shares. During periods of reimbursement by Fidelity, a fund's total return will be greater than it would be had the reimbursement not occurred. How a fund did yesterday is no guarantee of how it will do tomorrow.
Average Annual Total Returns
Periods ended June 30, 2014 | Past 1
year | Past 5
years | Past 10
years |
Fidelity® Fund | 23.70% | 16.50% | 7.31% |
$10,000 Over 10 Years
Let's say hypothetically that $10,000 was invested in Fidelity® Fund, a class of the fund, on June 30, 2004. The chart shows how the value of your investment would have changed, and also shows how the S&P 500® Index performed over the same period.

Annual Report
Market Recap: Despite intermittent volatility driven by geopolitical concerns, stocks posted a series of new highs during the 12 months ending June 30, 2014, amid a decidedly favorable environment for riskier assets. The S&P 500® Index rose 24.61% for the year, helped by a rise in consumer spending and the lowest unemployment rate since 2008. The U.S. Federal Reserve balanced stimulus reductions with continued low interest rates, aiding a broad advance. All 10 S&P 500® market sectors gained, seven by more than 20%. Materials (+33%) was tops, as investors seemed to anticipate sustained economic improvement and renewed infrastructure build-outs. Information technology (+32%) benefited from large cash balances, rising dividends and stock buybacks, and a bevy of innovations. Health care (+30%) was aided by new drugs and predictable reimbursements. Conversely, the biggest laggard, telecommunication services (+5%), battled slow growth and stiff pricing competition. Across size and style segments: overall, investors showed some preference for large-cap stocks over small-caps and growth stocks over value, although market leadership rotated during the year. With the "risk-on" trade alive and well, the growth-oriented Nasdaq Composite Index® flourished, advancing 31.17%, while the blue-chip Dow Jones Industrial AverageSM delivered a more subdued 15.56% return.
Comments from John Avery, Portfolio Manager of Fidelity® Fund: For the year, the fund's Retail Class shares returned 23.70%, trailing the S&P 500®. Versus the index, software giant Microsoft was the fund's biggest detractor. This was mainly due to bad timing on my part, as I lightened up on our holdings or didn't own this index stock when it was gaining ground, although the fund had a slight overweighting here at period end. I sold our stake in index component and relative detractor Citigroup after the stock pulled back following the U.S. Federal Reserve's rejection of the bank's plan for boosting dividends and share buybacks. I also sold two other index stocks that were noteworthy detractors - networking equipment manufacturer Cisco Systems and homebuilder D.R. Horton - because I thought their prospects deteriorated, causing the fund to miss their subsequent rallies. Conversely, a non-index position in Netherlands-based NXP Semiconductors was the fund's top relative contributor. Increased demand for the company's chips helped its stock price more than double during the period. Other contributors included energy services provider Williams Companies, which benefited from the boom in shale oil and gas exploration and production, and social network provider Facebook.
The views expressed above reflect those of the portfolio manager(s) only through the end of the period as stated on the cover of this report and do not necessarily represent the views of Fidelity or any other person in the Fidelity organization. Any such views are subject to change at any time based upon market or other conditions and Fidelity disclaims any responsibility to update such views. These views may not be relied on as investment advice and, because investment decisions for a Fidelity fund are based on numerous factors, may not be relied on as an indication of trading intent on behalf of any Fidelity fund.
Annual Report
Shareholder Expense Example
As a shareholder of the Fund, you incur two types of costs: (1) transaction costs, and (2) ongoing costs, including management fees and other Fund expenses. This Example is intended to help you understand your ongoing costs (in dollars) of investing in the Fund and to compare these costs with the ongoing costs of investing in other mutual funds.
The Example is based on an investment of $1,000 invested at the beginning of the period and held for the entire period (January 1, 2014 to June 30, 2014).
Actual Expenses
The first line of the accompanying table for each class of the Fund provides information about actual account values and actual expenses. You may use the information in this line, together with the amount you invested, to estimate the expenses that you paid over the period. Simply divide your account value by $1,000.00 (for example, an $8,600 account value divided by $1,000.00 = 8.6), then multiply the result by the number in the first line for a class of the Fund under the heading entitled "Expenses Paid During Period" to estimate the expenses you paid on your account during this period. A small balance maintenance fee of $12.00 that is charged once a year may apply for certain accounts with a value of less than $2,000. This fee is not included in the table below. If it was, the estimate of expenses you paid during the period would be higher, and your ending account value lower, by this amount. In addition, the Fund, as a shareholder in the underlying Fidelity Central Funds, will indirectly bear its pro-rata share of the fees and expenses incurred by the underlying Fidelity Central Funds. These fees and expenses are not included in the Fund's annualized expense ratio used to calculate the expense estimate in the table below.
Hypothetical Example for Comparison Purposes
The second line of the accompanying table for each class of the Fund provides information about hypothetical account values and hypothetical expenses based on a Class' actual expense ratio and an assumed rate of return of 5% per year before expenses, which is not the Class' actual return. The hypothetical account values and expenses may not be used to estimate the actual ending account balance or expenses you paid for the period. You may use this information to compare the ongoing costs of investing in the Fund and other funds. To do so, compare this 5% hypothetical example with the 5% hypothetical examples that appear in the shareholder reports of the other funds. A small balance maintenance fee of $12.00 that is charged once a year may apply for certain accounts with a value of less than $2,000. This fee is not included in the table below. If it was, the estimate of expenses you paid during the period would be higher, and your ending account value lower, by this amount. In addition, the Fund, as a shareholder in the underlying Fidelity Central Funds, will indirectly bear its pro-rata share of the fees and expenses incurred by the underlying Fidelity Central Funds. These fees and expenses are not included in the Fund's annualized expense ratio used to calculate the expense estimate in the table below.
Please note that the expenses shown in the table are meant to highlight your ongoing costs only and do not reflect any transaction costs. Therefore, the second line of the table is useful in comparing ongoing costs only, and will not help you determine the relative total costs of owning different funds.
Annual Report
Shareholder Expense Example - continued
| Annualized
Expense RatioB | Beginning
Account Value
January 1, 2014 | Ending
Account Value
June 30, 2014 | Expenses Paid
During Period*
January 1, 2014 to June 30, 2014 |
Fidelity Fund | .53% | | | |
Actual | | $ 1,000.00 | $ 1,064.90 | $ 2.71 |
HypotheticalA | | $ 1,000.00 | $ 1,022.17 | $ 2.66 |
Class K | .41% | | | |
Actual | | $ 1,000.00 | $ 1,065.40 | $ 2.10 |
HypotheticalA | | $ 1,000.00 | $ 1,022.76 | $ 2.06 |
A 5% return per year before expenses
B Annualized expense ratio reflects expenses net of applicable fee waivers.
* Expenses are equal to each Class' annualized expense ratio, multiplied by the average account value over the period, multiplied by 181/365 (to reflect the one-half year period).
Annual Report
Investment Changes (Unaudited)
Top Ten Stocks as of June 30, 2014 |
| % of fund's
net assets | % of fund's net assets
6 months ago |
Apple, Inc. | 4.4 | 3.7 |
Wells Fargo & Co. | 2.7 | 2.0 |
Microsoft Corp. | 2.1 | 1.9 |
Johnson & Johnson | 2.0 | 0.0 |
Monsanto Co. | 2.0 | 2.0 |
The Walt Disney Co. | 2.0 | 1.0 |
Google, Inc. Class A | 2.0 | 3.8 |
Google, Inc. Class C | 1.9 | 0.0 |
Amphenol Corp. Class A | 1.9 | 1.8 |
Facebook, Inc. Class A | 1.9 | 0.9 |
| 22.9 | |
Top Five Market Sectors as of June 30, 2014 |
| % of fund's
net assets | % of fund's net assets
6 months ago |
Information Technology | 20.2 | 18.2 |
Financials | 15.8 | 18.5 |
Health Care | 15.4 | 12.8 |
Industrials | 13.9 | 13.7 |
Energy | 12.0 | 6.6 |
Asset Allocation (% of fund's net assets) |
As of June 30, 2014 * | As of December 31, 2013 ** |
| Stocks and
Equity Futures 98.2% | | | Stocks 99.5% | |
| Short-Term
Investments and
Net Other Assets (Liabilities) 1.8% | | | Short-Term
Investments and
Net Other Assets (Liabilities) 0.5% | |
* Foreign investments | 8.5% | | ** Foreign investments | 7.6% | |

Annual Report
Investments June 30, 2014
Showing Percentage of Net Assets
Common Stocks - 96.4% |
| Shares | | Value (000s) |
CONSUMER DISCRETIONARY - 6.3% |
Hotels, Restaurants & Leisure - 1.5% |
Starbucks Corp. | 1,145,098 | | $ 88,608 |
Media - 3.4% |
Comcast Corp. Class A | 1,607,000 | | 86,264 |
The Walt Disney Co. | 1,373,800 | | 117,790 |
| | 204,054 |
Specialty Retail - 0.6% |
TJX Companies, Inc. | 623,600 | | 33,144 |
Textiles, Apparel & Luxury Goods - 0.8% |
VF Corp. | 800,000 | | 50,400 |
TOTAL CONSUMER DISCRETIONARY | | 376,206 |
CONSUMER STAPLES - 5.9% |
Beverages - 1.4% |
The Coca-Cola Co. | 2,000,000 | | 84,720 |
Food & Staples Retailing - 1.8% |
CVS Caremark Corp. | 1,421,700 | | 107,154 |
Food Products - 1.6% |
Bunge Ltd. | 588,800 | | 44,537 |
Mondelez International, Inc. | 1,375,000 | | 51,714 |
| | 96,251 |
Household Products - 0.8% |
Procter & Gamble Co. | 300,000 | | 23,577 |
Svenska Cellulosa AB (SCA) (B Shares) | 800,000 | | 20,845 |
| | 44,422 |
Tobacco - 0.3% |
Lorillard, Inc. | 300,000 | | 18,291 |
TOTAL CONSUMER STAPLES | | 350,838 |
ENERGY - 12.0% |
Energy Equipment & Services - 3.1% |
Halliburton Co. | 1,175,000 | | 83,437 |
Schlumberger Ltd. | 850,000 | | 100,258 |
| | 183,695 |
Oil, Gas & Consumable Fuels - 8.9% |
Anadarko Petroleum Corp. | 778,350 | | 85,206 |
Cheniere Energy Partners LP | 1,000,000 | | 33,040 |
Chevron Corp. | 500,000 | | 65,275 |
Common Stocks - continued |
| Shares | | Value (000s) |
ENERGY - continued |
Oil, Gas & Consumable Fuels - continued |
EOG Resources, Inc. | 940,000 | | $ 109,848 |
EQT Midstream Partners LP | 550,000 | | 53,207 |
MPLX LP | 600,000 | | 38,700 |
Phillips 66 Co. | 850,000 | | 68,366 |
The Williams Companies, Inc. | 1,247,000 | | 72,588 |
| | 526,230 |
TOTAL ENERGY | | 709,925 |
FINANCIALS - 15.8% |
Banks - 7.4% |
Bank of America Corp. | 6,877,200 | | 105,703 |
JPMorgan Chase & Co. | 1,857,000 | | 107,000 |
SunTrust Banks, Inc. | 1,664,900 | | 66,696 |
Wells Fargo & Co. | 2,969,167 | | 156,059 |
| | 435,458 |
Capital Markets - 2.2% |
E*TRADE Financial Corp. (a) | 1,481,700 | | 31,501 |
Invesco Ltd. | 1,200,000 | | 45,300 |
Morgan Stanley, Inc. | 1,698,700 | | 54,919 |
| | 131,720 |
Consumer Finance - 2.5% |
American Express Co. | 967,092 | | 91,748 |
Discover Financial Services | 923,400 | | 57,232 |
| | 148,980 |
Diversified Financial Services - 2.5% |
Berkshire Hathaway, Inc. Class B (a) | 600,000 | | 75,936 |
McGraw Hill Financial, Inc. | 835,625 | | 69,382 |
| | 145,318 |
Insurance - 0.8% |
American International Group, Inc. | 900,000 | | 49,122 |
Real Estate Investment Trusts - 0.4% |
Altisource Residential Corp. Class B | 896,600 | | 23,338 |
TOTAL FINANCIALS | | 933,936 |
HEALTH CARE - 15.4% |
Biotechnology - 6.8% |
Actelion Ltd. | 175,000 | | 22,141 |
Common Stocks - continued |
| Shares | | Value (000s) |
HEALTH CARE - continued |
Biotechnology - continued |
Alexion Pharmaceuticals, Inc. (a) | 250,000 | | $ 39,063 |
Amgen, Inc. | 719,900 | | 85,215 |
Biogen Idec, Inc. (a) | 319,600 | | 100,773 |
Cubist Pharmaceuticals, Inc. | 608,900 | | 42,513 |
Genmab A/S (a) | 470,000 | | 20,061 |
Gilead Sciences, Inc. (a) | 964,800 | | 79,992 |
Seattle Genetics, Inc. (a) | 314,300 | | 12,022 |
| | 401,780 |
Health Care Equipment & Supplies - 0.7% |
Boston Scientific Corp. (a) | 3,200,000 | | 40,864 |
Health Care Providers & Services - 2.1% |
HCA Holdings, Inc. (a) | 450,000 | | 25,371 |
Henry Schein, Inc. (a) | 351,300 | | 41,689 |
McKesson Corp. | 300,000 | | 55,863 |
| | 122,923 |
Life Sciences Tools & Services - 1.6% |
Illumina, Inc. (a) | 251,864 | | 44,968 |
Thermo Fisher Scientific, Inc. | 450,000 | | 53,100 |
| | 98,068 |
Pharmaceuticals - 4.2% |
Actavis PLC (a) | 375,000 | | 83,644 |
Johnson & Johnson | 1,150,000 | | 120,313 |
Teva Pharmaceutical Industries Ltd. sponsored ADR | 500,000 | | 26,210 |
Theravance, Inc. (a)(d) | 746,233 | | 22,223 |
| | 252,390 |
TOTAL HEALTH CARE | | 916,025 |
INDUSTRIALS - 13.9% |
Aerospace & Defense - 3.8% |
Honeywell International, Inc. | 704,200 | | 65,455 |
Huntington Ingalls Industries, Inc. | 350,000 | | 33,107 |
Textron, Inc. | 1,658,600 | | 63,508 |
The Boeing Co. | 515,000 | | 65,523 |
| | 227,593 |
Airlines - 0.7% |
American Airlines Group, Inc. | 1,000,000 | | 42,960 |
Electrical Equipment - 0.5% |
Generac Holdings, Inc. | 579,965 | | 28,267 |
Common Stocks - continued |
| Shares | | Value (000s) |
INDUSTRIALS - continued |
Industrial Conglomerates - 3.1% |
3M Co. | 775,000 | | $ 111,011 |
Danaher Corp. | 891,900 | | 70,219 |
| | 181,230 |
Machinery - 4.0% |
Caterpillar, Inc. | 950,000 | | 103,237 |
Cummins, Inc. | 589,000 | | 90,877 |
Manitowoc Co., Inc. | 1,350,000 | | 44,361 |
| | 238,475 |
Road & Rail - 1.8% |
Union Pacific Corp. | 1,061,600 | | 105,895 |
TOTAL INDUSTRIALS | | 824,420 |
INFORMATION TECHNOLOGY - 20.2% |
Electronic Equipment & Components - 1.9% |
Amphenol Corp. Class A | 1,172,738 | | 112,982 |
Internet Software & Services - 6.4% |
Facebook, Inc. Class A (a) | 1,650,000 | | 111,029 |
Google, Inc.: | | | |
Class A (a) | 199,800 | | 116,817 |
Class C (a) | 199,800 | | 114,941 |
Yahoo!, Inc. (a) | 1,010,000 | | 35,481 |
| | 378,268 |
IT Services - 1.3% |
Fidelity National Information Services, Inc. | 760,700 | | 41,641 |
Visa, Inc. Class A | 180,600 | | 38,054 |
| | 79,695 |
Semiconductors & Semiconductor Equipment - 2.3% |
Applied Materials, Inc. | 1,850,000 | | 41,718 |
Freescale Semiconductor, Inc. (a)(d) | 1,209,485 | | 28,423 |
NXP Semiconductors NV (a) | 1,038,500 | | 68,728 |
| | 138,869 |
Software - 3.9% |
Adobe Systems, Inc. (a) | 1,175,000 | | 85,023 |
Microsoft Corp. | 3,000,000 | | 125,100 |
salesforce.com, Inc. (a) | 325,000 | | 18,876 |
| | 228,999 |
Common Stocks - continued |
| Shares | | Value (000s) |
INFORMATION TECHNOLOGY - continued |
Technology Hardware, Storage & Peripherals - 4.4% |
Apple, Inc. | 2,790,200 | | $ 259,289 |
TOTAL INFORMATION TECHNOLOGY | | 1,198,102 |
MATERIALS - 6.9% |
Chemicals - 4.0% |
Airgas, Inc. | 275,000 | | 29,950 |
Celanese Corp. Class A | 725,000 | | 46,603 |
Methanex Corp. | 112,800 | | 6,974 |
Monsanto Co. | 959,900 | | 119,738 |
W.R. Grace & Co. (a) | 348,100 | | 32,906 |
| | 236,171 |
Construction Materials - 2.1% |
Martin Marietta Materials, Inc. (d) | 502,000 | | 66,289 |
Vulcan Materials Co. | 902,954 | | 57,563 |
| | 123,852 |
Metals & Mining - 0.8% |
Alcoa, Inc. | 1,800,000 | | 26,802 |
Freeport-McMoRan Copper & Gold, Inc. | 600,000 | | 21,900 |
| | 48,702 |
TOTAL MATERIALS | | 408,725 |
TOTAL COMMON STOCKS (Cost $4,219,319) |
5,718,177
|
Nonconvertible Preferred Stocks - 0.7% |
| | | |
CONSUMER DISCRETIONARY - 0.7% |
Automobiles - 0.7% |
Porsche Automobil Holding SE (Germany) | 425,000 | | 44,281 |
TOTAL NONCONVERTIBLE PREFERRED STOCKS (Cost $42,597) |
44,281
|
U.S. Treasury Obligations - 0.1% |
| Principal Amount (000s) | | |
U.S. Treasury Bills, yield at date of purchase 0.03% to 0.03% 8/21/14 (e)
(Cost $3,770) | | $ 3,770 | |
3,770
|
Money Market Funds - 3.7% |
| Shares | | Value (000s) |
Fidelity Cash Central Fund, 0.11% (b) | 146,713,048 | | $ 146,713 |
Fidelity Securities Lending Cash Central Fund, 0.10% (b)(c) | 70,731,000 | | 70,731 |
TOTAL MONEY MARKET FUNDS (Cost $217,444) |
217,444
|
TOTAL INVESTMENT PORTFOLIO - 100.9% (Cost $4,483,130) | 5,983,672 |
NET OTHER ASSETS (LIABILITIES) - (0.9)% | (53,826) |
NET ASSETS - 100% | $ 5,929,846 |
Futures Contracts |
| Expiration Date | | Underlying Face Amount at Value (000s) | | Unrealized Appreciation/
(Depreciation) (000s) |
Purchased |
Equity Index Contracts |
696 CME E-mini S&P 500 Index Contracts | Sept. 2014 | | $ 67,944 | | $ 453 |
|
The face value of futures purchased as a percentage of net assets is 1.1% |
Legend |
(a) Non-income producing |
(b) Affiliated fund that is generally available only to investment companies and other accounts managed by Fidelity Investments. The rate quoted is the annualized seven-day yield of the fund at period end. A complete unaudited listing of the fund's holdings as of its most recent quarter end is available upon request. In addition, each Fidelity Central Fund's financial statements, which are not covered by the Fund's Report of Independent Registered Public Accounting Firm, are available on the SEC's website or upon request. |
(c) Investment made with cash collateral received from securities on loan. |
(d) Security or a portion of the security is on loan at period end. |
(e) Security or a portion of the security was pledged to cover margin requirements for futures contracts. At period end, the value of securities pledged amounted to $2,870,000. |
Affiliated Central Funds |
Information regarding fiscal year to date income earned by the Fund from investments in Fidelity Central Funds is as follows: |
Fund | Income earned
(Amounts in thousands) |
Fidelity Cash Central Fund | $ 98 |
Fidelity Securities Lending Cash Central Fund | 599 |
Total | $ 697 |
Other Information |
The following is a summary of the inputs used, as of June 30, 2014, involving the Fund's assets and liabilities carried at fair value. The inputs or methodology used for valuing securities may not be an indication of the risk associated with investing in those securities. For more information on valuation inputs, and their aggregation into the levels used in the table below, please refer to the Investment Valuation section in the accompanying Notes to Financial Statements. |
Valuation Inputs at Reporting Date: |
Description
(Amounts in thousands) | Total | Level 1 | Level 2 | Level 3 |
Investments in Securities: | | | | |
Equities: | | | | |
Consumer Discretionary | $ 420,487 | $ 420,487 | $ - | $ - |
Consumer Staples | 350,838 | 350,838 | - | - |
Energy | 709,925 | 709,925 | - | - |
Financials | 933,936 | 933,936 | - | - |
Health Care | 916,025 | 916,025 | - | - |
Industrials | 824,420 | 824,420 | - | - |
Information Technology | 1,198,102 | 1,198,102 | - | - |
Materials | 408,725 | 408,725 | - | - |
U.S. Government and Government Agency Obligations | 3,770 | - | 3,770 | - |
Money Market Funds | 217,444 | 217,444 | - | - |
Total Investments in Securities: | $ 5,983,672 | $ 5,979,902 | $ 3,770 | $ - |
Derivative Instruments: | | | | |
Assets | | | | |
Futures Contracts | $ 453 | $ 453 | $ - | $ - |
Value of Derivative Instruments |
The following table is a summary of the Fund's value of derivative instruments by primary risk exposure as of June 30, 2014. For additional information on derivative instruments, please refer to the Derivative Instruments section in the accompanying Notes to Financial Statements. |
Primary Risk Exposure /
Derivative Type
(Amounts in thousands) | Value |
| Asset | Liability |
Equity Risk | | |
Futures Contracts (a) | $ 453 | $ - |
Total Value of Derivatives | $ 453 | $ - |
(a) Reflects gross cumulative appreciation (depreciation) on futures contracts as presented in the Schedule of Investments. Only the period end receivable or payable for daily variation margin and net unrealized appreciation (depreciation) are presented in the Statement of Assets and Liabilities. |
See accompanying notes which are an integral part of the financial statements.
Annual Report
Statement of Assets and Liabilities
Amounts in thousands (except per-share amounts) | June 30, 2014 |
| | |
Assets | | |
Investment in securities, at value (including securities loaned of $68,968) - See accompanying schedule: Unaffiliated issuers (cost $4,265,686) | $ 5,766,228 | |
Fidelity Central Funds (cost $217,444) | 217,444 | |
Total Investments (cost $4,483,130) | | $ 5,983,672 |
Cash | | 1 |
Receivable for investments sold | | 39,762 |
Receivable for fund shares sold | | 1,375 |
Dividends receivable | | 2,626 |
Distributions receivable from Fidelity Central Funds | | 151 |
Receivable for daily variation margin for derivative instruments | | 13 |
Receivable from investment adviser for expense reductions | | 2 |
Other receivables | | 293 |
Total assets | | 6,027,895 |
| | |
Liabilities | | |
Payable for investments purchased | $ 21,510 | |
Payable for fund shares redeemed | 3,088 | |
Accrued management fee | 1,672 | |
Other affiliated payables | 775 | |
Other payables and accrued expenses | 273 | |
Collateral on securities loaned, at value | 70,731 | |
Total liabilities | | 98,049 |
| | |
Net Assets | | $ 5,929,846 |
Net Assets consist of: | | |
Paid in capital | | $ 4,042,380 |
Undistributed net investment income | | 20,644 |
Accumulated undistributed net realized gain (loss) on investments and foreign currency transactions | | 365,812 |
Net unrealized appreciation (depreciation) on investments and assets and liabilities in foreign currencies | | 1,501,010 |
Net Assets | | $ 5,929,846 |
See accompanying notes which are an integral part of the financial statements.
Annual Report
Financial Statements - continued
Statement of Assets and Liabilities - continued
Amounts in thousands (except per-share amounts) | June 30, 2014 |
| | |
Fidelity Fund:
Net Asset Value, offering price and redemption price per share ($4,811,282 ÷ 105,934 shares) | | $ 45.42 |
| | |
Class K:
Net Asset Value, offering price and redemption price per share ($1,118,564 ÷ 24,625 shares) | | $ 45.42 |
See accompanying notes which are an integral part of the financial statements.
Annual Report
Statement of Operations
Amounts in thousands | Year ended June 30, 2014 |
| | |
Investment Income | | |
Dividends | | $ 77,194 |
Income from Fidelity Central Funds | | 697 |
Total income | | 77,891 |
| | |
Expenses | | |
Management fee | $ 19,712 | |
Transfer agent fees | 8,235 | |
Accounting and security lending fees | 1,119 | |
Custodian fees and expenses | 103 | |
Independent trustees' compensation | 25 | |
Appreciation in deferred trustee compensation account | 1 | |
Registration fees | 66 | |
Audit | 76 | |
Legal | 32 | |
Interest | 2 | |
Miscellaneous | 49 | |
Total expenses before reductions | 29,420 | |
Expense reductions | (213) | 29,207 |
Net investment income (loss) | | 48,684 |
Realized and Unrealized Gain (Loss) Net realized gain (loss) on: | | |
Investment securities: | | |
Unaffiliated issuers | 555,116 | |
Foreign currency transactions | 44 | |
Futures contracts | 4,011 | |
Total net realized gain (loss) | | 559,171 |
Change in net unrealized appreciation (depreciation) on: Investment securities | 617,457 | |
Assets and liabilities in foreign currencies | 26 | |
Futures contracts | 453 | |
Total change in net unrealized appreciation (depreciation) | | 617,936 |
Net gain (loss) | | 1,177,107 |
Net increase (decrease) in net assets resulting from operations | | $ 1,225,791 |
See accompanying notes which are an integral part of the financial statements.
Annual Report
Financial Statements - continued
Statement of Changes in Net Assets
Amounts in thousands | Year ended
June 30,
2014 | Year ended
June 30,
2013 |
Increase (Decrease) in Net Assets | | |
Operations | | |
Net investment income (loss) | $ 48,684 | $ 64,671 |
Net realized gain (loss) | 559,171 | 526,204 |
Change in net unrealized appreciation (depreciation) | 617,936 | 240,754 |
Net increase (decrease) in net assets resulting
from operations | 1,225,791 | 831,629 |
Distributions to shareholders from net investment income | (45,770) | (73,239) |
Distributions to shareholders from net realized gain | (408,221) | - |
Total distributions | (453,991) | (73,239) |
Share transactions - net increase (decrease) | (286,775) | (492,060) |
Total increase (decrease) in net assets | 485,025 | 266,330 |
| | |
Net Assets | | |
Beginning of period | 5,444,821 | 5,178,491 |
End of period (including undistributed net investment income of $20,644 and undistributed net investment income of $20,378, respectively) | $ 5,929,846 | $ 5,444,821 |
See accompanying notes which are an integral part of the financial statements.
Annual Report
Financial Highlights - Fidelity Fund
Years ended June 30, | 2014 | 2013 | 2012 | 2011 | 2010 |
Selected Per-Share Data | | | | | |
Net asset value, beginning of period | $ 39.77 | $ 34.51 | $ 34.35 | $ 26.08 | $ 23.95 |
Income from Investment Operations | | | | | |
Net investment income (loss) B | .35 | .44 | .37 | .27E | .23 |
Net realized and unrealized gain (loss) | 8.61 | 5.31 | .02 | 8.27 | 2.25 |
Total from investment operations | 8.96 | 5.75 | .39 | 8.54 | 2.48 |
Distributions from net investment income | (.32) | (.49) | (.23) | (.27) | (.35) |
Distributions from net realized gain | (2.98) | - | - | - | - |
Total distributions | (3.31) G | (.49) | (.23) | (.27) | (.35) |
Net asset value, end of period | $ 45.42 | $ 39.77 | $ 34.51 | $ 34.35 | $ 26.08 |
Total ReturnA | 23.70% | 16.85% | 1.21% | 32.89% | 10.40% |
Ratios to Average Net Assets C, F | | | | | |
Expenses before reductions | .53% | .56% | .58% | .59% | .61% |
Expenses net of fee waivers, if any | .53% | .56% | .58% | .59% | .61% |
Expenses net of all reductions | .53% | .55% | .58% | .58% | .60% |
Net investment income (loss) | .82% | 1.18% | 1.13% | .86% E | .82% |
Supplemental Data | | | | | |
Net assets, end of period (in millions) | $ 4,811 | $ 4,451 | $ 4,364 | $ 5,072 | $ 4,412 |
Portfolio turnover rateD | 93% | 113% | 102% | 88% | 77% |
A Total returns would have been lower if certain expenses had not been reduced during the applicable periods shown.
B Calculated based on average shares outstanding during the period.
C Fees and expenses of any underlying Fidelity Central Funds are not included in the Fund's expense ratio. The Fund indirectly bears its proportionate share of the expenses of any underlying Fidelity Central Funds.
D Amount does not include the portfolio activity of any underlying Fidelity Central Funds.
E Investment income per share reflects a large, non-recurring dividend which amounted to $.08 per share. Excluding this non-recurring dividend, the ratio of net investment income (loss) to average net assets would have been .60%.
F Expense ratios reflect operating expenses of the class. Expenses before reductions do not reflect amounts reimbursed by the investment adviser or reductions from brokerage service arrangements or reductions from other expense offset arrangements and do not represent the amount paid by the class during periods when reimbursements or reductions occur. Expenses net of fee waivers reflect expenses after reimbursement by the investment adviser but prior to reductions from brokerage service arrangements or other expense offset arrangements. Expenses net of all reductions represent the net expenses paid by the class.
G Total distributions of $3.31 per share is comprised of distributions from net investment income of $.324 and distributions from net realized gain of $2.984 per share.
See accompanying notes which are an integral part of the financial statements.
Annual Report
Financial Highlights - Class K
Years ended June 30, | 2014 | 2013 | 2012 | 2011 | 2010 |
Selected Per-Share Data | | | | | |
Net asset value, beginning of period | $ 39.78 | $ 34.52 | $ 34.35 | $ 26.08 | $ 23.96 |
Income from Investment Operations | | | | | |
Net investment income (loss) B | .40 | .49 | .42 | .32 E | .28 |
Net realized and unrealized gain (loss) | 8.60 | 5.31 | .02 | 8.27 | 2.24 |
Total from investment operations | 9.00 | 5.80 | .44 | 8.59 | 2.52 |
Distributions from net investment income | (.38) | (.54) | (.27) | (.32) | (.40) |
Distributions from net realized gain | (2.98) | - | - | - | - |
Total distributions | (3.36) | (.54) | (.27) | (.32) | (.40) |
Net asset value, end of period | $ 45.42 | $ 39.78 | $ 34.52 | $ 34.35 | $ 26.08 |
Total ReturnA | 23.83% | 17.03% | 1.37% | 33.10% | 10.54% |
Ratios to Average Net Assets C, F | | | | | |
Expenses before reductions | .41% | .42% | .43% | .43% | .44% |
Expenses net of fee waivers, if any | .41% | .42% | .43% | .43% | .44% |
Expenses net of all reductions | .41% | .41% | .42% | .42% | .43% |
Net investment income (loss) | .94% | 1.32% | 1.29% | 1.02%E | .99% |
Supplemental Data | | | | | |
Net assets, end of period (in millions) | $ 1,119 | $ 994 | $ 814 | $ 663 | $ 426 |
Portfolio turnover rateD | 93% | 113% | 102% | 88% | 77% |
A Total returns would have been lower if certain expenses had not been reduced during the applicable periods shown.
B Calculated based on average shares outstanding during the period.
C Fees and expenses of any underlying Fidelity Central Funds are not included in the Fund's expense ratio. The Fund indirectly bears its proportionate share of the expenses of any underlying Fidelity Central Funds.
D Amount does not include the portfolio activity of any underlying Fidelity Central Funds.
E Investment income per share reflects a large, non-recurring dividend which amounted to $.08 per share. Excluding this non-recurring dividend, the ratio of net investment income (loss) to average net assets would have been .76%.
F Expense ratios reflect operating expenses of the class. Expenses before reductions do not reflect amounts reimbursed by the investment adviser or reductions from brokerage service arrangements or reductions from other expense offset arrangements and do not represent the amount paid by the class during periods when reimbursements or reductions occur. Expenses net of fee waivers reflect expenses after reimbursement by the investment adviser but prior to reductions from brokerage service arrangements or other expense offset arrangements. Expenses net of all reductions represent the net expenses paid by the class.
See accompanying notes which are an integral part of the financial statements.
Annual Report
Notes to Financial Statements
For the period ended June 30, 2014
(Amounts in thousands except percentages)
1. Organization.
Fidelity Fund (the Fund) is a fund of Fidelity Hastings Street Trust (the Trust) and is authorized to issue an unlimited number of shares. The Trust is registered under the Investment Company Act of 1940, as amended (the 1940 Act), as an open-end management investment company organized as a Massachusetts business trust. The Fund offers Fidelity Fund and Class K shares, each of which has equal rights as to assets and voting privileges. Each class has exclusive voting rights with respect to matters that affect that class.
2. Investments in Fidelity Central Funds.
The Fund invests in Fidelity Central Funds, which are open-end investment companies generally available only to other investment companies and accounts managed by the investment adviser and its affiliates. The Fund's Schedule of Investments lists each of the Fidelity Central Funds held as of period end, if any, as an investment of the Fund, but does not include the underlying holdings of each Fidelity Central Fund. As an Investing Fund, the Fund indirectly bears its proportionate share of the expenses of the underlying Fidelity Central Funds.
The Money Market Central Funds seek preservation of capital and current income and are managed by Fidelity Investments Money Management, Inc. (FIMM), an affiliate of the investment adviser. Annualized expenses of the Money Market Central Funds as of their most recent shareholder report date are less than .01%.
A complete unaudited list of holdings for each Fidelity Central Fund is available upon request or at the Securities and Exchange Commission (the SEC) website at www.sec.gov. In addition, the financial statements of the Fidelity Central Funds, which are not covered by the Fund's Report of Independent Registered Public Accounting Firm, are available on the SEC website or upon request.
3. Significant Accounting Policies.
The financial statements have been prepared in conformity with accounting principles generally accepted in the United States of America (GAAP), which require management to make certain estimates and assumptions at the date of the financial statements. Actual results could differ from those estimates. Subsequent events, if any, through the date that the financial statements were issued have been evaluated in the preparation of the financial statements. The following summarizes the significant accounting policies of the Fund:
Annual Report
Notes to Financial Statements - continued
(Amounts in thousands except percentages)
3. Significant Accounting Policies - continued
Investment Valuation. Investments are valued as of 4:00 p.m. Eastern time on the last calendar day of the period. In accordance with valuation policies and procedures approved by the Board of Trustees (the Board), the Fund attempts to obtain prices from one or more third party pricing vendors or brokers to value its investments. When current market prices, quotations or currency exchange rates are not readily available or reliable, investments will be fair valued in good faith by the Fidelity Management & Research Company (FMR) Fair Value Committee (the Committee), in accordance with procedures adopted by the Board. Factors used in determining fair value vary by investment type and may include market or investment specific events, changes in interest rates and credit quality. The frequency with which these procedures are used cannot be predicted and they may be utilized to a significant extent. The Committee oversees the Fund's valuation policies and procedures and is responsible for approving and reporting to the Board all fair value determinations.
The Fund categorizes the inputs to valuation techniques used to value its investments into a disclosure hierarchy consisting of three levels as shown below:
Level 1 - quoted prices in active markets for identical investments
Level 2 - other significant observable inputs (including quoted prices for similar investments, interest rates, prepayment speeds, etc.)
Level 3 - unobservable inputs (including the Fund's own assumptions based on the best information available)
Valuation techniques used to value the Fund's investments by major category are as follows:
Equity securities, including restricted securities, for which market quotations are readily available, are valued at the last reported sale price or official closing price as reported by a third party pricing vendor on the primary market or exchange on which they are traded and are categorized as Level 1 in the hierarchy. In the event there were no sales during the day or closing prices are not available, securities are valued at the last quoted bid price or may be valued using the last available price and are generally categorized as Level 2 in the hierarchy. For foreign equity securities, when market or security specific events arise, comparisons to the valuation of American Depositary Receipts (ADRs), futures contracts, Exchange-Traded Funds (ETFs) and certain indexes as well as quoted prices for similar securities may be used and would be categorized as Level 2 in the hierarchy. Utilizing these techniques may result in transfers between Level 1 and Level 2. For equity securities, including restricted securities, where observable inputs are limited, assumptions about market activity and risk are used and these securities may be categorized as Level 3 in the hierarchy.
Annual Report
3. Significant Accounting Policies - continued
Investment Valuation - continued
Debt securities, including restricted securities, are valued based on evaluated prices received from third party pricing vendors or from brokers who make markets in such securities. U.S. government and government agency obligations are valued by pricing vendors who utilize matrix pricing which considers yield or price of bonds of comparable quality, coupon, maturity and type or by broker-supplied prices. When independent prices are unavailable or unreliable, debt securities may be valued utilizing pricing methodologies which consider similar factors that would be used by third party pricing vendors. Debt securities are generally categorized as Level 2 in the hierarchy but may be Level 3 depending on the circumstances.
Futures contracts are valued at the settlement price established each day by the board of trade or exchange on which they are traded and are categorized as Level 1 in the hierarchy. Investments in open-end mutual funds, including the Fidelity Central Funds, are valued at their closing net asset value (NAV) each business day and are categorized as Level 1 in the hierarchy.
Changes in valuation techniques may result in transfers in or out of an assigned level within the disclosure hierarchy. The aggregate value of investments by input level, as of June 30, 2014, is included at the end of the Fund's Schedule of Investments.
Foreign Currency. The Fund may use foreign currency contracts to facilitate transactions in foreign-denominated securities. Gains and losses from these transactions may arise from changes in the value of the foreign currency or if the counterparties do not perform under the contracts' terms.
Foreign-denominated assets, including investment securities, and liabilities are translated into U.S. dollars at the exchange rates at period end. Purchases and sales of investment securities, income and dividends received and expenses denominated in foreign currencies are translated into U.S. dollars at the exchange rate in effect on the transaction date.
The effects of exchange rate fluctuations on investments are included with the net realized and unrealized gain (loss) on investment securities. Other foreign currency transactions resulting in realized and unrealized gain (loss) are disclosed separately.
Investment Transactions and Income. For financial reporting purposes, the Fund's investment holdings and NAV include trades executed through the end of the last business day of the period. The NAV per share for processing shareholder transactions is calculated as of the close of business of the New York Stock Exchange (NYSE),
Annual Report
Notes to Financial Statements - continued
(Amounts in thousands except percentages)
3. Significant Accounting Policies - continued
Investment Transactions and Income - continued
normally 4:00 p.m. Eastern time and includes trades executed through the end of the prior business day. Gains and losses on securities sold are determined on the basis of identified cost and may include proceeds received from litigation. Dividend income is recorded on the ex-dividend date, except for certain dividends from foreign securities where the ex-dividend date may have passed, which are recorded as soon as the Fund is informed of the ex-dividend date. Non-cash dividends included in dividend income, if any, are recorded at the fair market value of the securities received. Income and capital gain distributions from Fidelity Central Funds, if any, are recorded on the ex-dividend date. Distributions received on securities that represent a return of capital or capital gain are recorded as a reduction of cost of investments and/or as a realized gain. Subsequent to ex-dividend date the Fund determines the components of these distributions, based upon receipt of tax filings or other correspondence relating to the underlying investment. Investment income is recorded net of foreign taxes withheld where recovery of such taxes is uncertain.
Class Allocations and Expenses. Investment income, realized and unrealized capital gains and losses, common expenses of the Fund, and certain fund-level expense reductions, if any, are allocated daily on a pro-rata basis to each class based on the relative net assets of each class to the total net assets of the Fund. Each class differs with respect to transfer agent fees incurred. Certain expense reductions may also differ by class. For the reporting period, the allocated portion of income and expenses to each class as a percent of its average net assets may vary due to the timing of recording these transactions in relation to fluctuating net assets of the classes. Expenses directly attributable to a fund are charged to that fund. Expenses attributable to more than one fund are allocated among the respective funds on the basis of relative net assets or other appropriate methods. Expense estimates are accrued in the period to which they relate and adjustments are made when actual amounts are known.
Deferred Trustee Compensation. Under a Deferred Compensation Plan (the Plan), independent Trustees may elect to defer receipt of a portion of their annual compensation. Deferred amounts are invested in a cross-section of Fidelity funds, are marked-to-market and remain in the Fund until distributed in accordance with the Plan. The investment of deferred amounts and the offsetting payable to the Trustees are included in the accompanying Statement of Assets and Liabilities.
Annual Report
3. Significant Accounting Policies - continued
Income Tax Information and Distributions to Shareholders. Each year, the Fund intends to qualify as a regulated investment company under Subchapter M of the Internal Revenue Code, including distributing substantially all of its taxable income and realized gains. As a result, no provision for U.S. Federal income taxes is required. As of June 30, 2014, the Fund did not have any unrecognized tax benefits in the financial statements; nor is the Fund aware of any tax positions for which it is reasonably possible that the total amounts of unrecognized tax benefits will significantly change in the next twelve months. The Fund files a U.S. federal tax return, in addition to state and local tax returns as required. The Fund's federal income tax returns are subject to examination by the Internal Revenue Service (IRS) for a period of three fiscal years after they are filed. State and local tax returns may be subject to examination for an additional fiscal year depending on the jurisdiction. Foreign taxes are provided for based on the Fund's understanding of the tax rules and rates that exist in the foreign markets in which it invests.
Distributions are declared and recorded on the ex-dividend date. Income dividends and capital gain distributions are declared separately for each class. Income and capital gain distributions are determined in accordance with income tax regulations, which may differ from GAAP. In addition, the Fund claimed a portion of the payment made to redeeming shareholders as a distribution for income tax purposes.
Capital accounts within the financial statements are adjusted for permanent book-tax differences. These adjustments have no impact on net assets or the results of operations. Capital accounts are not adjusted for temporary book-tax differences which will reverse in a subsequent period.
Book-tax differences are primarily due to futures contracts, foreign currency transactions, partnerships, deferred trustees compensation and losses deferred due to wash sales.
The federal tax cost of investment securities and unrealized appreciation (depreciation) as of period end were as follows:
Gross unrealized appreciation | $ 1,509,416 |
Gross unrealized depreciation | (17,610) |
Net unrealized appreciation (depreciation) on securities and other investments | $ 1,491,806 |
| |
Tax Cost | $ 4,491,866 |
Annual Report
Notes to Financial Statements - continued
(Amounts in thousands except percentages)
3. Significant Accounting Policies - continued
Income Tax Information and Distributions to Shareholders - continued
The tax-based components of distributable earnings as of period end were as follows:
Undistributed ordinary income | $ 79,833 |
Undistributed long-term capital gain | $ 315,999 |
Net unrealized appreciation (depreciation) | $ 1,491,821 |
The tax character of distributions paid was as follows:
| June 30, 2014 | June 30, 2013 |
Ordinary Income | $ 71,607 | $ 73,239 |
Long-term Capital Gains | 382,384 | - |
Total | $ 453,991 | $ 73,239 |
4. Derivative Instruments.
Risk Exposures and the Use of Derivative Instruments. The Fund's investment objective allows the Fund to enter into various types of derivative contracts, including futures contracts. Derivatives are investments whose value is primarily derived from underlying assets, indices or reference rates and may be transacted on an exchange or over-the-counter (OTC). Derivatives may involve a future commitment to buy or sell a specified asset based on specified terms, to exchange future cash flows at periodic intervals based on a notional principal amount, or for one party to make one or more payments upon the occurrence of specified events in exchange for periodic payments from the other party.
The Fund used derivatives to increase returns and to manage exposure to certain risks as defined below. The success of any strategy involving derivatives depends on analysis of numerous economic factors, and if the strategies for investment do not work as intended, the Fund may not achieve its objectives.
The Fund's use of derivatives increased or decreased its exposure to the following risk:
Equity Risk | Equity risk relates to the fluctuations in the value of financial instruments as a result of changes in market prices (other than those arising from interest rate risk or foreign exchange risk), whether caused by factors specific to an individual investment, its issuer, or all factors affecting all instruments traded in a market or market segment. |
Annual Report
4. Derivative Instruments - continued
Risk Exposures and the Use of Derivative Instruments - continued
The Fund is also exposed to additional risks from investing in derivatives, such as liquidity risk and counterparty credit risk. Liquidity risk is the risk that the Fund will be unable to close out the derivative in the open market in a timely manner. Counterparty credit risk is the risk that the counterparty will not be able to fulfill its obligation to the Fund. Counterparty credit risk related to exchange-traded futures contracts may be mitigated by the protection provided by the exchange on which they trade.
Investing in derivatives may involve greater risks than investing in the underlying assets directly and, to varying degrees, may involve risk of loss in excess of any initial investment and collateral received and amounts recognized in the Statement of Assets and Liabilities. In addition, there may be the risk that the change in value of the derivative contract does not correspond to the change in value of the underlying instrument.
Futures Contracts. A futures contract is an agreement between two parties to buy or sell a specified underlying instrument for a fixed price at a specified future date. The Fund used futures contracts to manage its exposure to the stock market.
Upon entering into a futures contract, a fund is required to deposit either cash or securities (initial margin) with a clearing broker in an amount equal to a certain percentage of the face value of the contract. Futures contracts are marked-to-market daily and subsequent daily payments (variation margin) are made or received by a fund depending on the daily fluctuations in the value of the futures contracts and are recorded as unrealized appreciation or (depreciation). This receivable and/or payable, if any, is included in daily variation margin for derivative instruments in the Statement of Assets and Liabilities. Realized gain or (loss) is recorded upon the expiration or closing of a futures contract.
Any open futures contracts at period end are presented in the Schedule of Investments under the caption "Futures Contracts". The underlying face amount at value reflects each contract's exposure to the underlying instrument or index at period end and is representative of volume of activity during the period. Securities deposited to meet initial margin requirements are identified in the Schedule of Investments.
During the period the Fund recognized net realized gain (loss) of $4,011 and a change in net unrealized appreciation (depreciation) of $453 related to its investment in futures contracts. These amounts are included in the Statement of Operations.
5. Purchases and Sales of Investments.
Purchases and sales of securities, other than short-term securities, aggregated $5,249,903 and $5,975,882, respectively.
Annual Report
Notes to Financial Statements - continued
(Amounts in thousands except percentages)
6. Fees and Other Transactions with Affiliates.
Management Fee. Fidelity Management & Research Company (the investment adviser) and its affiliates provide the Fund with investment management related services for which the Fund pays a monthly management fee. The management fee is the sum of an individual fund fee rate that is based on an annual rate of .09% of the Fund's average net assets and an annualized group fee rate that averaged .25% during the period. The group fee rate is based upon the average net assets of all the mutual funds advised by the investment adviser, including any mutual funds previously advised by the investment adviser that are currently advised by Fidelity SelectCo, LLC, an affiliate of the investment adviser. The group fee rate decreases as assets under management increase and increases as assets under management decrease. For the reporting period, the total annual management fee rate was .34% of the Fund's average net assets.
Transfer Agent Fees. Fidelity Investments Institutional Operations Company, Inc., (FIIOC), an affiliate of the investment adviser, is the transfer, dividend disbursing and shareholder servicing agent for each class of the Fund. FIIOC receives account fees and asset-based fees that vary according to the account size and type of account of the shareholders of Fidelity Fund. FIIOC receives an asset-based fee of Class K's average net assets. FIIOC pays for typesetting, printing and mailing of shareholder reports, except proxy statements.
For the period, transfer agent fees for each class were as follows:
| Amount | % of
Average
Net Assets |
Fidelity Fund | $ 7,738 | .16 |
Class K | 497 | .05 |
| $ 8,235 | |
Accounting and Security Lending Fees. Fidelity Service Company, Inc. (FSC), an affiliate of the investment adviser, maintains the Fund's accounting records. The accounting fee is based on the level of average net assets for each month. Under a separate contract, FSC administers the security lending program. The security lending fee is based on the number and duration of lending transactions.
Brokerage Commissions. The Fund placed a portion of its portfolio transactions with brokerage firms which are affiliates of the investment adviser. Brokerage commissions are included in net realized gain (loss) and change in net unrealized appreciation (depreciation) in the Statement of Operations. The commissions paid to these affiliated firms were $120 for the period.
Annual Report
6. Fees and Other Transactions with Affiliates - continued
Interfund Lending Program. Pursuant to an Exemptive Order issued by the SEC, the Fund, along with other registered investment companies having management contracts with FMR or other affiliated entities of FMR, may participate in an interfund lending program. This program provides an alternative credit facility allowing the funds to borrow from, or lend money to, other participating affiliated funds. At period end, there were no interfund loans outstanding. The Fund's activity in this program during the period for which loans were outstanding was as follows:
Borrower or Lender | Average Loan
Balance | Weighted Average Interest Rate | Interest Expense |
Borrower | $ 44,379 | .32% | $ 2 |
7. Committed Line of Credit.
The Fund participates with other funds managed by the investment adviser or an affiliate in a $4.25 billion credit facility (the "line of credit") to be utilized for temporary or emergency purposes to fund shareholder redemptions or for other short-term liquidity purposes. The Fund has agreed to pay commitment fees on its pro-rata portion of the line of credit, which amounted to $10 and is reflected in Miscellaneous expenses on the Statement of Operations. During the period, the Fund did not borrow on this line of credit.
8. Security Lending.
The Fund lends portfolio securities through a lending agent from time to time in order to earn additional income. For equity securities, a lending agent is used and may loan securities to certain qualified borrowers, including Fidelity Capital Markets (FCM), a broker-dealer affiliated with the Fund. On the settlement date of the loan, the Fund receives collateral (in the form of U.S. Treasury obligations, letters of credit and/or cash) against the loaned securities and maintains collateral in an amount not less than 100% of the market value of the loaned securities during the period of the loan. The market value of the loaned securities is determined at the close of business of the Fund and any additional required collateral is delivered to the Fund on the next business day. If the borrower defaults on its obligation to return the securities loaned because of insolvency or other reasons, the Fund may apply collateral received from the borrower against the obligation. The Fund may experience delays and costs in recovering the securities loaned. Any cash collateral received is invested in the Fidelity Securities Lending Cash Central Fund. The value of loaned securities and cash collateral at period end are disclosed on the Fund's Statement of Assets and Liabilities. At period end, there were no security loans outstanding with FCM. Security lending income represents the income earned on investing cash collateral, less rebates paid to borrowers and any lending agent
Annual Report
Notes to Financial Statements - continued
(Amounts in thousands except percentages)
8. Security Lending - continued
fees associated with the loan, plus any premium payments received for lending certain types of securities. Security lending income is presented in the Statement of Operations as a component of income from Fidelity Central Funds. Total security lending income during the period amounted to $599, including $1 from securities loaned to FCM.
9. Expense Reductions.
Commissions paid to certain brokers with whom the investment adviser, or its affiliates, places trades on behalf of the Fund include an amount in addition to trade execution, which may be rebated back to the Fund to offset certain expenses. This amount totaled $185 for the period.
In addition, the investment adviser reimbursed a portion of the Fund's operating expenses during the period in the amount of $28.
10. Distributions to Shareholders.
Distributions to shareholders of each class were as follows:
Years ended June 30, | 2014 | 2013 |
From net investment income | | |
Fidelity Fund | $ 36,308 | $ 59,871 |
Class K | 9,462 | 13,368 |
Total | $ 45,770 | $ 73,239 |
From net realized gain | | |
Fidelity Fund | $ 333,629 | $ - |
Class K | 74,592 | - |
Total | $ 408,221 | $ - |
Annual Report
11. Share Transactions.
Transactions for each class of shares were as follows:
| Shares | Dollars |
Years ended June 30, | 2014 | 2013 | 2014 | 2013 |
Fidelity Fund | | | | |
Shares sold | 4,764 | 6,586 | $ 199,883 | $ 245,372 |
Reinvestment of distributions | 8,565 | 1,584 | 347,036 | 55,780 |
Shares redeemed | (19,322) | (22,706) | (815,615) | (844,733) |
Net increase (decrease) | (5,993) | (14,536) | $ (268,696) | $ (543,581) |
Class K | | | | |
Shares sold | 3,722 | 6,352 | $ 157,689 | $ 236,538 |
Reinvestment of distributions | 2,075 | 380 | 84,054 | 13,368 |
Shares redeemed | (6,150) | (5,340) | (259,822) | (198,385) |
Net increase (decrease) | (353) | 1,392 | $ (18,079) | $ 51,521 |
12. Other.
The Fund's organizational documents provide former and current trustees and officers with a limited indemnification against liabilities arising in connection with the performance of their duties to the Fund. In the normal course of business, the Fund may also enter into contracts that provide general indemnifications. The Fund's maximum exposure under these arrangements is unknown as this would be dependent on future claims that may be made against the Fund. The risk of material loss from such claims is considered remote.
Annual Report
To the Trustees of Fidelity Hastings Street Trust and the Shareholders of Fidelity Fund:
In our opinion, the accompanying statement of assets and liabilities, including the schedule of investments, and the related statements of operations and of changes in net assets and the financial highlights present fairly, in all material respects, the financial position of Fidelity Fund (a fund of Fidelity Hastings Street Trust) at June 30, 2014, the results of its operations for the year then ended, the changes in its net assets for each of the two years in the period then ended and the financial highlights for each of the five years in the period then ended, in conformity with accounting principles generally accepted in the United States of America. These financial statements and financial highlights (hereafter referred to as "financial statements") are the responsibility of the Fidelity Fund's management. Our responsibility is to express an opinion on these financial statements based on our audits. We conducted our audits of these financial statements in accordance with the standards of the Public Company Accounting Oversight Board (United States). Those standards require that we plan and perform the audit to obtain reasonable assurance about whether the financial statements are free of material misstatement. An audit includes examining, on a test basis, evidence supporting the amounts and disclosures in the financial statements, assessing the accounting principles used and significant estimates made by management, and evaluating the overall financial statement presentation. We believe that our audits, which included confirmation of securities at June 30, 2014 by correspondence with the custodian and brokers, provide a reasonable basis for our opinion.
PricewaterhouseCoopers LLP
Boston, Massachusetts
August 11, 2014
Annual Report
The Trustees, Member of the Advisory Board, and officers of the trust and fund, as applicable, are listed below. The Board of Trustees governs the fund and is responsible for protecting the interests of shareholders. The Trustees are experienced executives who meet periodically throughout the year to oversee the fund's activities, review contractual arrangements with companies that provide services to the fund, oversee management of the risks associated with such activities and contractual arrangements, and review the fund's performance. Except for James C. Curvey, each of the Trustees oversees 173 funds. Mr. Curvey oversees 397 funds.
The Trustees hold office without limit in time except that (a) any Trustee may resign; (b) any Trustee may be removed by written instrument, signed by at least two-thirds of the number of Trustees prior to such removal; (c) any Trustee who requests to be retired or who has become incapacitated by illness or injury may be retired by written instrument signed by a majority of the other Trustees; and (d) any Trustee may be removed at any special meeting of shareholders by a two-thirds vote of the outstanding voting securities of the trust. Each Trustee who is not an interested person (as defined in the 1940 Act) of the trust and the fund (Independent Trustee), shall retire not later than the last day of the calendar year in which his or her 75th birthday occurs. The Independent Trustees may waive this mandatory retirement age policy with respect to individual Trustees. The officers and Advisory Board Member hold office without limit in time, except that any officer and Advisory Board Member may resign or may be removed by a vote of a majority of the Trustees at any regular meeting or any special meeting of the Trustees. Except as indicated, each individual has held the office shown or other offices in the same company for the past five years.
Experience, Skills, Attributes, and Qualifications of the Fund's Trustees. The Governance and Nominating Committee has adopted a statement of policy that describes the experience, qualifications, attributes, and skills that are necessary and desirable for potential Independent Trustee candidates (Statement of Policy). The Board believes that each Trustee satisfied at the time he or she was initially elected or appointed a Trustee, and continues to satisfy, the standards contemplated by the Statement of Policy. The Governance and Nominating Committee also engages professional search firms to help identify potential Independent Trustee candidates who have the experience, qualifications, attributes, and skills consistent with the Statement of Policy. From time to time, additional criteria based on the composition and skills of the current Independent Trustees, as well as experience or skills that may be appropriate in light of future changes to board composition, business conditions, and regulatory or other developments, have also been considered by the professional search firms and the Governance and Nominating Committee. In addition, the Board takes into account the Trustees' commitment and participation in Board and committee meetings, as well as their leadership of standing and ad hoc committees throughout their tenure.
In determining that a particular Trustee was and continues to be qualified to serve as a Trustee, the Board has considered a variety of criteria, none of which, in isolation, was controlling. The Board believes that, collectively, the Trustees have balanced and diverse experience, qualifications, attributes, and skills, which allow the Board to operate effectively in governing the fund and protecting the interests of shareholders. Information about the specific experience, skills, attributes, and qualifications of each Trustee, which in each case led to the Board's conclusion that the Trustee should serve (or continue to serve) as a trustee of the fund, is provided below.
Annual Report
Board Structure and Oversight Function. James C. Curvey is an interested person (as defined in the 1940 Act) and currently serves as Chairman. The Trustees have determined that an interested Chairman is appropriate and benefits shareholders because an interested Chairman has a personal and professional stake in the quality and continuity of services provided to the fund. Independent Trustees exercise their informed business judgment to appoint an individual of their choosing to serve as Chairman, regardless of whether the Trustee happens to be independent or a member of management. The Independent Trustees have determined that they can act independently and effectively without having an Independent Trustee serve as Chairman and that a key structural component for assuring that they are in a position to do so is for the Independent Trustees to constitute a substantial majority for the Board. The Independent Trustees also regularly meet in executive session. Ned C. Lautenbach serves as Chairman of the Independent Trustees and as such (i) acts as a liaison between the Independent Trustees and management with respect to matters important to the Independent Trustees and (ii) with management prepares agendas for Board meetings.
Fidelity funds are overseen by different Boards of Trustees. The fund's Board oversees Fidelity's equity and high income funds and another Board oversees Fidelity's investment-grade bond, money market, and asset allocation funds. The asset allocation funds may invest in Fidelity funds overseen by the fund's Board. The use of separate Boards, each with its own committee structure, allows the Trustees of each group of Fidelity funds to focus on the unique issues of the funds they oversee, including common research, investment, and operational issues. On occasion, the separate Boards establish joint committees to address issues of overlapping consequences for the Fidelity funds overseen by each Board.
The Trustees operate using a system of committees to facilitate the timely and efficient consideration of all matters of importance to the Trustees, the fund, and fund shareholders and to facilitate compliance with legal and regulatory requirements and oversight of the fund's activities and associated risks. The Board, acting through its committees, has charged FMR and its affiliates with (i) identifying events or circumstances the occurrence of which could have demonstrably adverse effects on the fund's business and/or reputation; (ii) implementing processes and controls to lessen the possibility that such events or circumstances occur or to mitigate the effects of such events or circumstances if they do occur; and (iii) creating and maintaining a system designed to evaluate continuously business and market conditions in order to facilitate the identification and implementation processes described in (i) and (ii) above. Because the day-to-day operations and activities of the fund are carried out by or through FMR, its affiliates and other service providers, the fund's exposure to risks is mitigated but not eliminated by the processes overseen by the Trustees. While each of the Board's committees has responsibility for overseeing different aspects of the fund's activities, oversight is exercised primarily through the Operations, Audit, and Compliance Committees. In addition, the Independent Trustees have worked with FMR to enhance the Board's oversight of investment and financial risks, legal and regulatory risks, technology risks, and operational risks, including the development of additional risk reporting to the Board. For example, a working group comprised of Independent Trustees and FMR has worked and continues to work to review the Fidelity funds' valuation-related activities, reporting and risk management. Appropriate personnel, including but not limited to the fund's Chief Compliance Officer (CCO), FMR's internal auditor, the independent accountants, the fund's Treasurer and portfolio management personnel, make periodic reports to the Board's committees, as appropriate, including an annual review of FMR's risk management program for the Fidelity funds. The responsibilities of each standing committee, including their oversight responsibilities, are described further under "Standing Committees of the Fund's Trustees."
Annual Report
Trustees and Officers - continued
The fund's Statement of Additional Information (SAI) includes more information about the Trustees. To request a free copy, call Fidelity at 1-800-544-8544.
Interested Trustees*:
Correspondence intended for each Trustee who is an interested person may be sent to Fidelity Investments, 245 Summer Street, Boston, Massachusetts 02210.
Name, Year of Birth; Principal Occupations and Other Relevant Experience+ |
James C. Curvey (1935) |
Year of Election or Appointment: 2007 Trustee Chairman of the Board of Trustees |
| Mr. Curvey also serves as Trustee of other Fidelity funds. Mr. Curvey is a Director of Fidelity Research & Analysis Co. (2009-present), and Vice Chairman (2007-present) and Director of FMR LLC. In addition, Mr. Curvey serves as an Overseer for the Boston Symphony Orchestra and a member of the Trustees of Villanova University. Previously, Mr. Curvey served as a Director of Fidelity Investments Money Management, Inc. (2009-2014), a Director of FMR (2007-2014), a Director of FMR Co., Inc. (2007-2014) and was the Vice Chairman (2006-2007) and Director (2000-2007) of FMR Corp. |
Charles S. Morrison (1960) |
Year of Election or Appointment: 2014 Trustee |
| Mr. Morrison also serves as Trustee of other funds. He serves as President, Asset Management (2014-present) and is an employee of Fidelity Investments. Previously, Mr. Morrison served as Vice President of Fidelity's Fixed Income and Asset Allocation Funds (2012-2014), President, Fixed Income (2011-2014), Vice President of Fidelity's Money Market Funds (2005-2009), President, Money Market Group Leader of FMR (2009), and Senior Vice President, Money Market Group of FMR (2004-2009). Mr. Morrison also served as Vice President of Fidelity's Bond Funds (2002-2005), certain Balanced Funds (2002-2005), and certain Asset Allocation Funds (2002-2007), and as Senior Vice President (2002-2005) of Fidelity's Bond Division. |
* Trustees have been determined to be "Interested Trustees" by virtue of, among other things, their affiliation with the trust or various entities under common control with FMR.
+ The information above includes each Trustee's principal occupation during the last five years and other information relating to the experience, attributes, and skills relevant to each Trustee's qualifications to serve as a Trustee, which led to the conclusion that each Trustee should serve as a Trustee for each fund.
Annual Report
Trustees and Officers - continued
Independent Trustees:
Correspondence intended for each Independent Trustee (that is, the Trustees other than the Interested Trustees) may be sent to Fidelity Investments, P.O. Box 55235, Boston, Massachusetts 02205-5235.
Name, Year of Birth; Principal Occupations and Other Relevant Experience+ |
Dennis J. Dirks (1948) |
Year of Election or Appointment: 2005 Trustee |
| Mr. Dirks also serves as Trustee of other Fidelity funds. Prior to his retirement in May 2003, Mr. Dirks was Chief Operating Officer and a member of the Board of The Depository Trust & Clearing Corporation (DTCC). He also served as President, Chief Operating Officer, and Board member of The Depository Trust Company (DTC) and President and Board member of the National Securities Clearing Corporation (NSCC). In addition, Mr. Dirks served as Chief Executive Officer and Board member of the Government Securities Clearing Corporation, Chief Executive Officer and Board member of the Mortgage-Backed Securities Clearing Corporation, as a Trustee and a member of the Finance Committee of Manhattan College (2005-2008), and as a Trustee and a member of the Finance Committee of AHRC of Nassau County (2006-2008). Mr. Dirks is a member of the Independent Directors Council (IDC) Governing Council (2010-present) and Board of Directors for The Brookville Center for Children's Services, Inc. (2009-present). |
Alan J. Lacy (1953) |
Year of Election or Appointment: 2008 Trustee |
| Mr. Lacy also serves as Trustee of other Fidelity funds. Mr. Lacy serves as Senior Adviser (2007-present) of Oak Hill Capital Partners, L.P. (private equity). Mr. Lacy also served as Chief Executive Officer (2000-2005) and Vice Chairman (2005-2006) of Sears Holdings Corporation and Sears, Roebuck and Co. (retail). In addition, Mr. Lacy serves as a member of the Board of Directors of Dave & Buster's Entertainment, Inc. (restaurant and entertainment complexes, 2010-present), Earth Fare, Inc. (retail grocery, 2012-present), The Hillman Companies, Inc. (hardware wholesalers, 2010-present), and Bristol-Myers Squibb Company (global pharmaceuticals, 2008-present). Mr. Lacy is a member of the Board of Trustees of The National Parks Conservation Association (2006-present). Previously, Mr. Lacy served as Chairman of the Board of Trustees of the National Parks Conservation Association (2008-2011) and as a member of the Board of Directors for the Western Union Company (global money transfer, 2006-2011). |
Ned C. Lautenbach (1944) |
Year of Election or Appointment: 2000 Trustee Chairman of the Independent Trustees |
| Mr. Lautenbach also serves as Trustee of other Fidelity funds. Mr. Lautenbach currently serves as the Lead Director of the Eaton Corporation Board of Directors (diversified industrial, 1997-present). Mr. Lautenbach is Chairman of the Board of Directors of the Philharmonic Center for the Arts in Naples, Florida (2012-present) and a member of the Council on Foreign Relations (1994-present). Previously, Mr. Lautenbach was a Partner/Advisory Partner at Clayton, Dubilier & Rice, LLC (private equity investment, 1998-2010), as well as a Director of Sony Corporation (2006-2007). |
Joseph Mauriello (1944) |
Year of Election or Appointment: 2008 Trustee |
| Mr. Mauriello also serves as Trustee of other Fidelity funds. Prior to his retirement in January 2006, Mr. Mauriello served in numerous senior management positions including Deputy Chairman and Chief Operating Officer (2004-2005), and Vice Chairman of Financial Services (2002-2004) of KPMG LLP US (professional services, 1965-2005). Mr. Mauriello currently serves as a member of the Board of Directors of XL Group plc. (global insurance and re-insurance, 2006-present). Previously, Mr. Mauriello served as a Director of the Hamilton Funds of the Bank of New York (2006-2007) and of Arcadia Resources Inc. (health care services and products, 2007-2012). |
Robert W. Selander (1950) |
Year of Election or Appointment: 2011 Trustee |
| Mr. Selander also serves as Trustee of other Fidelity funds. Previously, Mr. Selander served as a Member of the Advisory Board of other Fidelity funds (2011), and Executive Vice Chairman (2010), Chief Executive Officer (2009-2010), and President and Chief Executive Officer (1997-2009) of Mastercard, Inc. |
Cornelia M. Small (1944) |
Year of Election or Appointment: 2005 Trustee |
| Ms. Small also serves as Trustee of other Fidelity funds. Ms. Small is a member of the Board of Directors (2009-present) and Chair of the Investment Committee (2010-present) of the Teagle Foundation. Ms. Small also serves on the Investment Committee of the Berkshire Taconic Community Foundation (2008-present). Previously, Ms. Small served as Chairperson (2002-2008) and a member of the Investment Committee and Chairperson (2008-2012) and a member of the Board of Trustees of Smith College. In addition, Ms. Small served as Chief Investment Officer, Director of Global Equity Investments, and a member of the Board of Directors of Scudder, Stevens & Clark and Scudder Kemper Investments. |
William S. Stavropoulos (1939) |
Year of Election or Appointment: 2001 Trustee Vice Chairman of the Independent Trustees |
| Mr. Stavropoulos also serves as Trustee of other Fidelity funds. Mr. Stavropoulos serves as President and Founder of the Michigan Baseball Foundation, the Great Lakes Loons (2007-present). Mr. Stavropoulos is Chairman Emeritus of the Board of Directors of The Dow Chemical Company, where he previously served in numerous senior management positions, including President, CEO (1995-2000; 2002-2004), Chairman of the Executive Committee (2000-2006), and as a member of the Board of Directors (1990-2006). Currently, Mr. Stavropoulos is Chairman of the Board of Directors of Univar Inc. (global distributor of commodity and specialty chemicals), a Director of Teradata Corporation (data warehousing and technology solutions), and Maersk Inc. (industrial conglomerate), and a member of the Advisory Board for Metalmark Capital LLC (private equity investment, 2005-present). Mr. Stavropoulos is an operating advisor to Clayton, Dubilier & Rice, LLC (private equity investment). In addition, Mr. Stavropoulos is a member of the University of Notre Dame Advisory Council for the College of Science, a Trustee of the Rollin L. Gerstacker Foundation, and a Director of the Naples Philharmonic Center for the Arts. Previously, Mr. Stavropoulos served as a Director of Chemical Financial Corporation (bank holding company, 1993-2012) and Tyco International, Ltd. (multinational manufacturing and services, 2007-2012). |
David M. Thomas (1949) |
Year of Election or Appointment: 2008 Trustee |
| Mr. Thomas also serves as Trustee of other Fidelity funds. Mr. Thomas serves as Non-Executive Chairman of the Board of Directors of Fortune Brands Home and Security (home and security products, 2011-present), and as a member of the Board of Directors of Interpublic Group of Companies, Inc. (marketing communication, 2004-present). Previously, Mr. Thomas served as Executive Chairman (2005-2006) and Chairman and Chief Executive Officer (2000-2005) of IMS Health, Inc. (pharmaceutical and healthcare information solutions), and a Director of Fortune Brands, Inc. (consumer products, 2000-2011). |
+ The information above includes each Trustee's principal occupation during the last five years and other information relating to the experience, attributes, and skills relevant to each Trustee's qualifications to serve as a Trustee, which led to the conclusion that each Trustee should serve as a Trustee for each fund.
Advisory Board Member and Officers:
Correspondence intended for each officer and Peter S. Lynch may be sent to Fidelity Investments, 245 Summer Street, Boston, Massachusetts 02210. Officers appear below in alphabetical order.
Name, Year of Birth; Principal Occupation |
Peter S. Lynch (1944) |
Year of Election or Appointment: 2003 Member of the Advisory Board |
| Mr. Lynch also serves as Member of the Advisory Board of other Fidelity funds. Mr. Lynch is Vice Chairman and a Director of FMR and FMR Co., Inc. In addition, Mr. Lynch serves as a Trustee of Boston College and as the Chairman of the Inner-City Scholarship Fund. Previously, Mr. Lynch served on the Special Olympics International Board of Directors (1997-2006). |
Elizabeth Paige Baumann (1968) |
Year of Election or Appointment: 2012 Anti-Money Laundering (AML) Officer |
| Ms. Baumann also serves as AML Officer of other funds. She is Chief AML Officer of FMR LLC (2012-present) and is an employee of Fidelity Investments. Previously, Ms. Baumann served as Vice President and Deputy Anti-Money Laundering Officer (2007-2012). |
William C. Coffey (1969) |
Year of Election or Appointment: 2009 Assistant Secretary |
| Mr. Coffey also serves as Assistant Secretary of other funds. He is Senior Vice President and Deputy General Counsel of FMR LLC (2010-present), and is an employee of Fidelity Investments. Previously, Mr. Coffey served as Vice President and Associate General Counsel of FMR LLC (2005-2009). |
Jonathan Davis (1968) |
Year of Election or Appointment: 2010 Assistant Treasurer |
| Mr. Davis also serves as Assistant Treasurer of other funds. Mr. Davis is an employee of Fidelity Investments. Previously, Mr. Davis served as Vice President and Associate General Counsel of FMR LLC (2003-2010). |
Adrien E. Deberghes (1967) |
Year of Election or Appointment: 2008 Deputy Treasurer |
| Mr. Deberghes also serves as an officer of other funds. He is an employee of Fidelity Investments (2008-present). Prior to joining Fidelity Investments, Mr. Deberghes was Senior Vice President of Mutual Fund Administration at State Street Corporation (2007-2008), Senior Director of Mutual Fund Administration at Investors Bank & Trust (2005-2007), and Director of Finance for Dunkin' Brands (2000-2005). |
Stephanie J. Dorsey (1969) |
Year of Election or Appointment: 2010 Assistant Treasurer |
| Ms. Dorsey also serves as an officer of other funds. She is an employee of Fidelity Investments (2008-present) and has served in other fund officer roles. Prior to joining Fidelity Investments, Ms. Dorsey served as Treasurer (2004-2008) of the JPMorgan Mutual Funds and Vice President (2004-2008) of JPMorgan Chase Bank. |
Howard J. Galligan III (1966) |
Year of Election or Appointment: 2014 Chief Financial Officer |
| Mr. Galligan also serves as Chief Financial Officer of other funds. Mr. Galligan serves as President of Fidelity Pricing and Cash Management Services (FPCMS) (2014-present) and as a Director of Strategic Advisers, Inc. (2008-present). Previously, Mr. Galligan served as Chief Administrative Officer of Asset Management (2011-2014) and Chief Operating Officer and Senior Vice President of Investment Support for Strategic Advisers, Inc. (2003-2011). |
Scott C. Goebel (1968) |
Year of Election or Appointment: 2008 Secretary and Chief Legal Officer (CLO) |
| Mr. Goebel serves as Secretary and CLO of other funds. Mr. Goebel also serves as Secretary of Fidelity SelectCo, LLC (2013-present), Fidelity Investments Money Management, Inc. (FIMM) (2010-present) and Fidelity Research and Analysis Company (FRAC) (2010-present); General Counsel, Secretary, and Senior Vice President of FMR (2008-present) and FMR Co., Inc. (2008-present); Chief Legal Officer of Fidelity Management & Research (Hong Kong) Limited (2008-present); and Assistant Secretary of Fidelity Management & Research (Japan) Inc. (2008-present) and Fidelity Management & Research (U.K.) Inc. (2008-present). Previously, Mr. Goebel served as Secretary and CLO of other Fidelity funds (2008-2013), Assistant Secretary of FIMM (2008-2010), FRAC (2008-2010), and certain funds (2007-2008); and as Vice President and Secretary of Fidelity Distributors Corporation (FDC) (2005-2007). Mr. Goebel has been employed by FMR LLC or an affiliate since 2001. |
Brian B. Hogan (1964) |
Year of Election or Appointment: 2009 Vice President |
| Mr. Hogan also serves as Trustee or Vice President of other funds. Mr. Hogan serves as President of FMR's Equity Division (2009-present). Previously, Mr. Hogan served as Senior Vice President, Equity Research of FMR (2006-2009) and as a portfolio manager. |
Chris Maher (1972) |
Year of Election or Appointment: 2013 Assistant Treasurer |
| Mr. Maher serves as Assistant Treasurer of other funds. Mr. Maher is Vice President of Valuation Oversight and is an employee of Fidelity Investments. Previously, Mr. Maher served as Vice President of Asset Management Compliance (2013), Vice President of FMR's Program Management Group (2010-2013), and Vice President of Valuation Oversight (2008-2010). |
Melissa M. Reilly (1971) |
Year of Election or Appointment: 2014 Vice President of certain Equity Funds |
| Ms. Reilly also serves as Vice President of other funds. Ms. Reilly is an employee of Fidelity Investments (2004-present). |
Kenneth B. Robins (1969) |
Year of Election or Appointment: 2008 President and Treasurer |
| Mr. Robins also serves as an officer of other funds. Mr. Robins serves as Executive Vice President of Fidelity Investments Money Management, Inc. (FIMM) (2013-present) and is an employee of Fidelity Investments (2004-present). Previously, Mr. Robins served in other fund officer roles. |
Stephen Sadoski (1971) |
Year of Election or Appointment: 2012 Deputy Treasurer |
| Mr. Sadoski also serves as Deputy Treasurer of other funds. He is an employee of Fidelity Investments (2012-present) and has served in another fund officer role. Prior to joining Fidelity Investments, Mr. Sadoski served as an assistant chief accountant in the Division of Investment Management of the Securities and Exchange Commission (SEC) (2009-2012) and as a senior manager at Deloitte & Touche LLP (1997-2009). |
Stacie M. Smith (1974) |
Year of Election or Appointment: 2013 Deputy Treasurer |
| Ms. Smith also serves as an officer of other funds. She is an employee of Fidelity Investments (2009-present) and has served in other fund officer roles. Prior to joining Fidelity Investments, Ms. Smith served as Senior Audit Manager of Ernst & Young LLP (1996-2009). |
Renee Stagnone (1975) |
Year of Election or Appointment: 2013 Deputy Treasurer |
| Ms. Stagnone also serves as Deputy Treasurer of other funds. Ms. Stagnone is an employee of Fidelity Investments. |
Linda J. Wondrack (1964) |
Year of Election or Appointment: 2014 Chief Compliance Officer |
| Ms. Wondrack also serves as Chief Compliance Officer of other funds. Ms. Wondrack is Executive Vice President and head of the Ethics Office and Asset Management Compliance for Fidelity Investments (2012-present). Ms. Wondrack also serves as Chief Compliance Officer of Fidelity SelectCo, LLC (2014-present); Chief Compliance Officer of Impresa Management LLC (2013-present); and Chief Compliance Officer of FMR Co., Inc., Fidelity Investments Money Management, Inc., Fidelity Management & Research (Japan) Inc., Fidelity Management & Research (U.K.) Inc., Fidelity Management & Research (Hong Kong), Fidelity Management & Research Company, Pyramis Global Advisors, LLC, and Strategic Advisers, Inc., Ballyrock Investment Advisors LLC, and Northern Neck Investors LLC (2012-present). Previously, Ms. Wondrack served as Senior Vice President and Chief Compliance Officer for Columbia Management Investment Advisers, LLC (2005-2012); Chief Compliance Officer for certain funds within the Columbia Family of Funds (2007-2012); and Senior Vice President of Compliance Risk Management at Bank of America (2005-2010). |
Joseph F. Zambello (1957) |
Year of Election or Appointment: 2011 Deputy Treasurer |
| Mr. Zambello also serves as Deputy Treasurer of other funds. Mr. Zambello is an employee of Fidelity Investments. Previously, Mr. Zambello served as Vice President of FMR's Program Management Group (2009-2011) and Vice President of the Transfer Agent Oversight Group (2005-2009). |
Annual Report
The Board of Trustees of Fidelity Fund voted to pay to shareholders of record at the opening of business on record date, the following distributions per share derived from capital gains realized from sales of portfolio securities, and dividends derived from net investment income:
| Pay Date | Record Date | Dividends | Capital Gains |
Fidelity Fund | 08/11/14 | 08/08/14 | $0.158 | $2.934 |
The fund hereby designates as a capital gain dividend with respect to the taxable year ended June 30, 2014, $426,561,852, or, if subsequently determined to be different, the net capital gain of such year.
Fidelity Fund designates 100% and 70% of the dividends distributed in August and December, respectively during the fiscal year as qualifying for the dividends-received deduction for corporate shareholders.
Fidelity Fund designates 100% and 79% of the dividends distributed in August and December, respectively during the fiscal year as amounts which may be taken into account as a dividend for purposes of the maximum rate under section 1(h)(11) of the Internal Revenue Code.
The fund will notify shareholders in January 2015 of amounts for use in preparing 2014 income tax returns.
Annual Report
Investment Adviser
Fidelity Management &
Research Company
Boston, MA
Investment Sub-Advisers
FMR Co., Inc.
Fidelity Management & Research
(U.K.) Inc.
Fidelity Management & Research
(Hong Kong) Limited
Fidelity Management & Research
(Japan) Inc.
General Distributor
Fidelity Distributors Corporation
Smithfield, RI
Transfer and Service Agents
Fidelity Investments Institutional
Operations Company, Inc.
Boston, MA
Fidelity Service Company, Inc.
Boston, MA
Custodian
The Northern Trust Company
Chicago, IL
The Fidelity Telephone Connection
Mutual Fund 24-Hour Service
Exchanges/Redemptions
and Account Assistance 1-800-544-6666
Product Information 1-800-544-6666
Retirement Accounts 1-800-544-4774
(8 a.m. - 9 p.m.)
TDD Service 1-800-544-0118
for the deaf and hearing impaired
(9 a.m. - 9 p.m. Eastern time)
Fidelity Automated Service
Telephone (FAST®)
1-800-544-5555
Automated line for quickest service
(Fidelity Investment logo)(registered trademark)
Corporate Headquarters
245 Summer St., Boston, MA 02210
www.fidelity.com
FID-UANN-0814
1.787731.111
Fidelity®
Fund -
Class K
Annual Report
June 30, 2014
(Fidelity Cover Art)
Contents
Performance | (Click Here) | How the fund has done over time. |
Management's Discussion of Fund Performance | (Click Here) | The Portfolio Manager's review of fund performance and strategy. |
Shareholder Expense Example | (Click Here) | An example of shareholder expenses. |
Investment Changes | (Click Here) | A summary of major shifts in the fund's investments over the past six months. |
Investments | (Click Here) | A complete list of the fund's investments with their market values. |
Financial Statements | (Click Here) | Statements of assets and liabilities, operations, and changes in net assets, as well as financial highlights. |
Notes | (Click Here) | Notes to the financial statements. |
Report of Independent Registered Public Accounting Firm | (Click Here) | |
Trustees and Officers | (Click Here) | |
Distributions | (Click Here) | |
To view a fund's proxy voting guidelines and proxy voting record for the 12-month period ended June 30, visit http://www.fidelity.com/proxyvotingresults or visit the Securities and Exchange Commission's (SEC) web site at http://www.sec.gov. You may also call 1-800-835-5092 to request a free copy of the proxy voting guidelines.
Standard & Poor's, S&P and S&P 500 are registered service marks of The McGraw-Hill Companies, Inc. and have been licensed for use by Fidelity Distributors Corporation.
Other third-party marks appearing herein are the property of their respective owners.
All other marks appearing herein are registered or unregistered trademarks or service marks of FMR LLC or an affiliated company. © 2014 FMR LLC. All rights reserved.
Annual Report
This report and the financial statements contained herein are submitted for the general information of the shareholders of the fund. This report is not authorized for distribution to prospective investors in the fund unless preceded or accompanied by an effective prospectus.
A fund files its complete schedule of portfolio holdings with the SEC for the first and third quarters of each fiscal year on Form N-Q. Forms N-Q are available on the SEC's web site at http://www.sec.gov. A fund's Forms N-Q may be reviewed and copied at the SEC's Public Reference Room in Washington, DC. Information regarding the operation of the SEC's Public Reference Room may be obtained by calling 1-800-SEC-0330. For a complete list of a fund's portfolio holdings, view the most recent holdings listing, semiannual report, or annual report on Fidelity's web site at http://www.fidelity.com, http://www.advisor.fidelity.com, or http://www.401k.com, as applicable.
NOT FDIC INSURED • MAY LOSE VALUE • NO BANK GUARANTEE
Neither the fund nor Fidelity Distributors Corporation is a bank.
Annual Report
Average annual total return reflects the change in the value of an investment, assuming reinvestment of the class' distributions from dividend income and capital gains (the profits earned upon the sale of securities that have grown in value, if any) and assuming a constant rate of performance each year. The $10,000 table and the fund's returns do not reflect the deduction of taxes that a shareholder would pay on fund distributions or the redemption of fund shares. During periods of reimbursement by Fidelity, a fund's total return will be greater than it would be had the reimbursement not occurred. How a fund did yesterday is no guarantee of how it will do tomorrow.
Average Annual Total Returns
Periods ended June 30, 2014 | Past 1
year | Past 5
years | Past 10
years |
Class K A | 23.83% | 16.67% | 7.42% |
A The initial offering of Class K shares took place on May 9, 2008. Returns prior to May 9, 2008 are those of Fidelity® Fund, the original class of the fund.
$10,000 Over 10 Years
Let's say hypothetically that $10,000 was invested in Fidelity® Fund - Class K on June 30, 2004. The chart shows how the value of your investment would have changed, and also shows how the S&P 500® Index performed over the same period. The initial offering of Class K took place on May 9, 2008. See above for additional information regarding the performance of Class K.
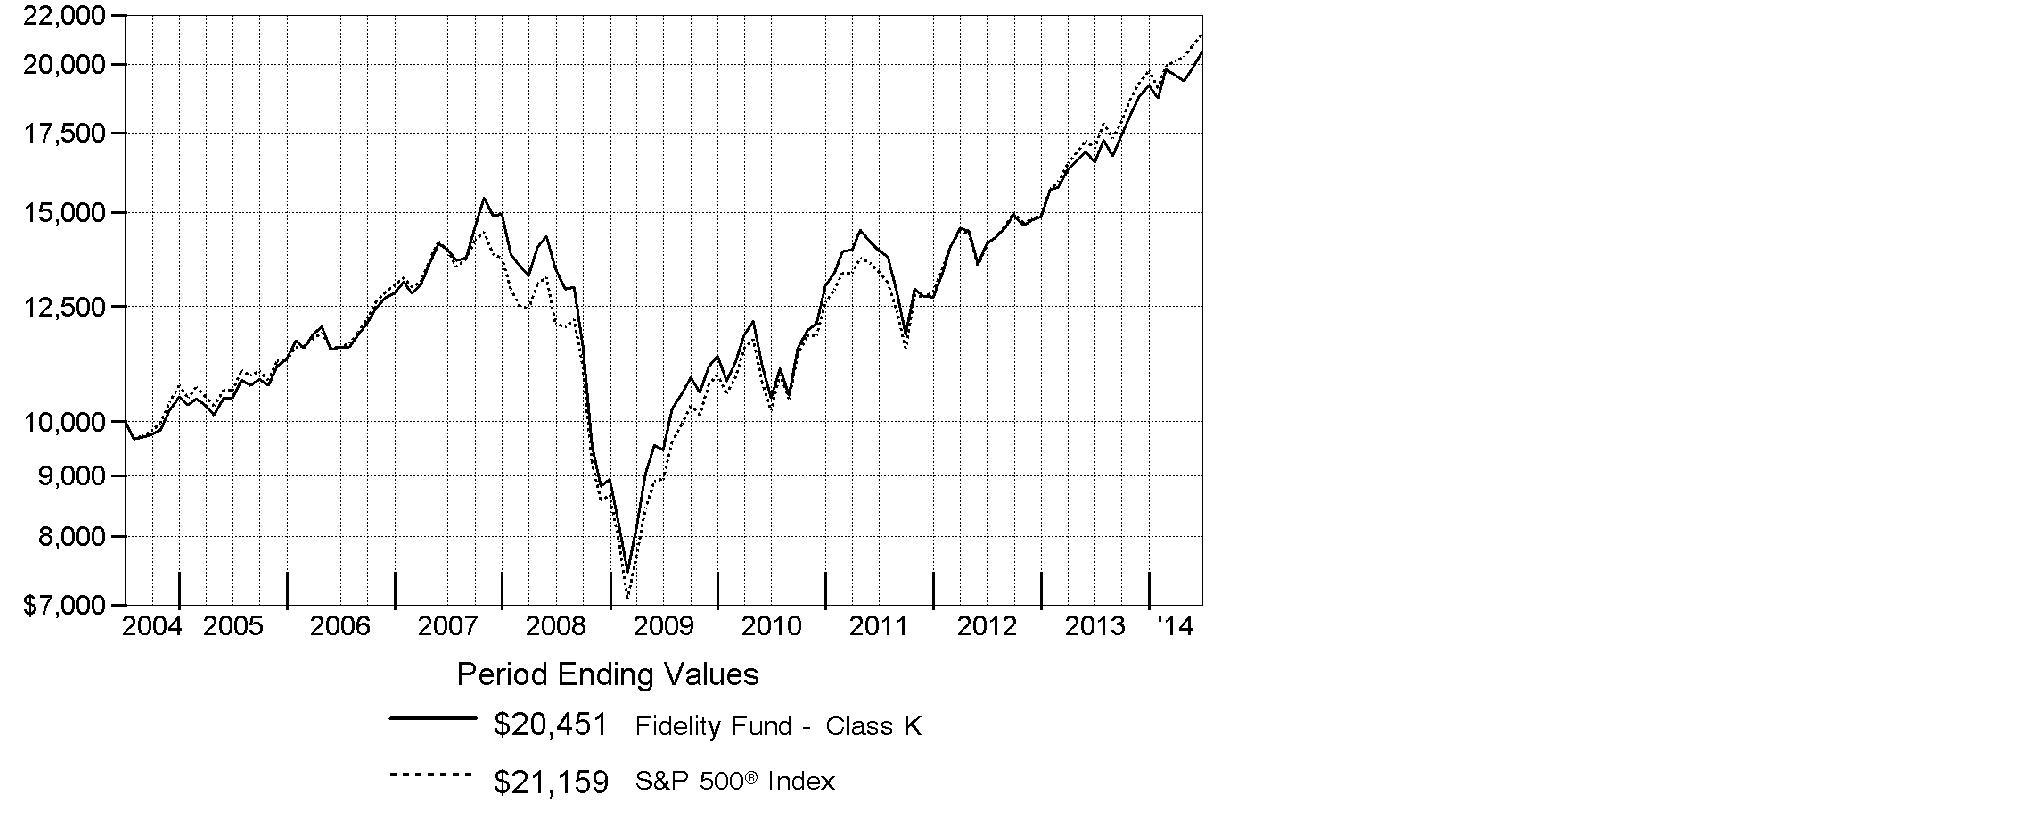
Annual Report
Market Recap: Despite intermittent volatility driven by geopolitical concerns, stocks posted a series of new highs during the 12 months ending June 30, 2014, amid a decidedly favorable environment for riskier assets. The S&P 500® Index rose 24.61% for the year, helped by a rise in consumer spending and the lowest unemployment rate since 2008. The U.S. Federal Reserve balanced stimulus reductions with continued low interest rates, aiding a broad advance. All 10 S&P 500® market sectors gained, seven by more than 20%. Materials (+33%) was tops, as investors seemed to anticipate sustained economic improvement and renewed infrastructure build-outs. Information technology (+32%) benefited from large cash balances, rising dividends and stock buybacks, and a bevy of innovations. Health care (+30%) was aided by new drugs and predictable reimbursements. Conversely, the biggest laggard, telecommunication services (+5%), battled slow growth and stiff pricing competition. Across size and style segments: overall, investors showed some preference for large-cap stocks over small-caps and growth stocks over value, although market leadership rotated during the year. With the "risk-on" trade alive and well, the growth-oriented Nasdaq Composite Index® flourished, advancing 31.17%, while the blue-chip Dow Jones Industrial AverageSM delivered a more subdued 15.56% return.
Comments from John Avery, Portfolio Manager of Fidelity® Fund: For the year, the fund's Class K shares returned 23.83%, trailing the S&P 500®. Versus the index, software giant Microsoft was the fund's biggest detractor. This was mainly due to bad timing on my part, as I lightened up on our holdings or didn't own this index stock when it was gaining ground, although the fund had a slight overweighting here at period end. I sold our stake in index component and relative detractor Citigroup after the stock pulled back following the U.S. Federal Reserve's rejection of the bank's plan for boosting dividends and share buybacks. I also sold two other index stocks that were noteworthy detractors - networking equipment manufacturer Cisco Systems and homebuilder D.R. Horton - because I thought their prospects deteriorated, causing the fund to miss their subsequent rallies. Conversely, a non-index position in Netherlands-based NXP Semiconductors was the fund's top relative contributor. Increased demand for the company's chips helped its stock price more than double during the period. Other contributors included energy services provider Williams Companies, which benefited from the boom in shale oil and gas exploration and production, and social network provider Facebook.
The views expressed above reflect those of the portfolio manager(s) only through the end of the period as stated on the cover of this report and do not necessarily represent the views of Fidelity or any other person in the Fidelity organization. Any such views are subject to change at any time based upon market or other conditions and Fidelity disclaims any responsibility to update such views. These views may not be relied on as investment advice and, because investment decisions for a Fidelity fund are based on numerous factors, may not be relied on as an indication of trading intent on behalf of any Fidelity fund.
Annual Report
Shareholder Expense Example
As a shareholder of the Fund, you incur two types of costs: (1) transaction costs, and (2) ongoing costs, including management fees and other Fund expenses. This Example is intended to help you understand your ongoing costs (in dollars) of investing in the Fund and to compare these costs with the ongoing costs of investing in other mutual funds.
The Example is based on an investment of $1,000 invested at the beginning of the period and held for the entire period (January 1, 2014 to June 30, 2014).
Actual Expenses
The first line of the accompanying table for each class of the Fund provides information about actual account values and actual expenses. You may use the information in this line, together with the amount you invested, to estimate the expenses that you paid over the period. Simply divide your account value by $1,000.00 (for example, an $8,600 account value divided by $1,000.00 = 8.6), then multiply the result by the number in the first line for a class of the Fund under the heading entitled "Expenses Paid During Period" to estimate the expenses you paid on your account during this period. A small balance maintenance fee of $12.00 that is charged once a year may apply for certain accounts with a value of less than $2,000. This fee is not included in the table below. If it was, the estimate of expenses you paid during the period would be higher, and your ending account value lower, by this amount. In addition, the Fund, as a shareholder in the underlying Fidelity Central Funds, will indirectly bear its pro-rata share of the fees and expenses incurred by the underlying Fidelity Central Funds. These fees and expenses are not included in the Fund's annualized expense ratio used to calculate the expense estimate in the table below.
Hypothetical Example for Comparison Purposes
The second line of the accompanying table for each class of the Fund provides information about hypothetical account values and hypothetical expenses based on a Class' actual expense ratio and an assumed rate of return of 5% per year before expenses, which is not the Class' actual return. The hypothetical account values and expenses may not be used to estimate the actual ending account balance or expenses you paid for the period. You may use this information to compare the ongoing costs of investing in the Fund and other funds. To do so, compare this 5% hypothetical example with the 5% hypothetical examples that appear in the shareholder reports of the other funds. A small balance maintenance fee of $12.00 that is charged once a year may apply for certain accounts with a value of less than $2,000. This fee is not included in the table below. If it was, the estimate of expenses you paid during the period would be higher, and your ending account value lower, by this amount. In addition, the Fund, as a shareholder in the underlying Fidelity Central Funds, will indirectly bear its pro-rata share of the fees and expenses incurred by the underlying Fidelity Central Funds. These fees and expenses are not included in the Fund's annualized expense ratio used to calculate the expense estimate in the table below.
Please note that the expenses shown in the table are meant to highlight your ongoing costs only and do not reflect any transaction costs. Therefore, the second line of the table is useful in comparing ongoing costs only, and will not help you determine the relative total costs of owning different funds.
Annual Report
| Annualized
Expense RatioB | Beginning
Account Value
January 1, 2014 | Ending
Account Value
June 30, 2014 | Expenses Paid
During Period*
January 1, 2014 to June 30, 2014 |
Fidelity Fund | .53% | | | |
Actual | | $ 1,000.00 | $ 1,064.90 | $ 2.71 |
HypotheticalA | | $ 1,000.00 | $ 1,022.17 | $ 2.66 |
Class K | .41% | | | |
Actual | | $ 1,000.00 | $ 1,065.40 | $ 2.10 |
HypotheticalA | | $ 1,000.00 | $ 1,022.76 | $ 2.06 |
A 5% return per year before expenses
B Annualized expense ratio reflects expenses net of applicable fee waivers.
* Expenses are equal to each Class' annualized expense ratio, multiplied by the average account value over the period, multiplied by 181/365 (to reflect the one-half year period).
Annual Report
Investment Changes (Unaudited)
Top Ten Stocks as of June 30, 2014 |
| % of fund's
net assets | % of fund's net assets
6 months ago |
Apple, Inc. | 4.4 | 3.7 |
Wells Fargo & Co. | 2.7 | 2.0 |
Microsoft Corp. | 2.1 | 1.9 |
Johnson & Johnson | 2.0 | 0.0 |
Monsanto Co. | 2.0 | 2.0 |
The Walt Disney Co. | 2.0 | 1.0 |
Google, Inc. Class A | 2.0 | 3.8 |
Google, Inc. Class C | 1.9 | 0.0 |
Amphenol Corp. Class A | 1.9 | 1.8 |
Facebook, Inc. Class A | 1.9 | 0.9 |
| 22.9 | |
Top Five Market Sectors as of June 30, 2014 |
| % of fund's
net assets | % of fund's net assets
6 months ago |
Information Technology | 20.2 | 18.2 |
Financials | 15.8 | 18.5 |
Health Care | 15.4 | 12.8 |
Industrials | 13.9 | 13.7 |
Energy | 12.0 | 6.6 |
Asset Allocation (% of fund's net assets) |
As of June 30, 2014 * | As of December 31, 2013 ** |
| Stocks and
Equity Futures 98.2% | | | Stocks 99.5% | |
| Short-Term
Investments and
Net Other Assets (Liabilities) 1.8% | | | Short-Term
Investments and
Net Other Assets (Liabilities) 0.5% | |
* Foreign investments | 8.5% | | ** Foreign investments | 7.6% | |

Annual Report
Investments June 30, 2014
Showing Percentage of Net Assets
Common Stocks - 96.4% |
| Shares | | Value (000s) |
CONSUMER DISCRETIONARY - 6.3% |
Hotels, Restaurants & Leisure - 1.5% |
Starbucks Corp. | 1,145,098 | | $ 88,608 |
Media - 3.4% |
Comcast Corp. Class A | 1,607,000 | | 86,264 |
The Walt Disney Co. | 1,373,800 | | 117,790 |
| | 204,054 |
Specialty Retail - 0.6% |
TJX Companies, Inc. | 623,600 | | 33,144 |
Textiles, Apparel & Luxury Goods - 0.8% |
VF Corp. | 800,000 | | 50,400 |
TOTAL CONSUMER DISCRETIONARY | | 376,206 |
CONSUMER STAPLES - 5.9% |
Beverages - 1.4% |
The Coca-Cola Co. | 2,000,000 | | 84,720 |
Food & Staples Retailing - 1.8% |
CVS Caremark Corp. | 1,421,700 | | 107,154 |
Food Products - 1.6% |
Bunge Ltd. | 588,800 | | 44,537 |
Mondelez International, Inc. | 1,375,000 | | 51,714 |
| | 96,251 |
Household Products - 0.8% |
Procter & Gamble Co. | 300,000 | | 23,577 |
Svenska Cellulosa AB (SCA) (B Shares) | 800,000 | | 20,845 |
| | 44,422 |
Tobacco - 0.3% |
Lorillard, Inc. | 300,000 | | 18,291 |
TOTAL CONSUMER STAPLES | | 350,838 |
ENERGY - 12.0% |
Energy Equipment & Services - 3.1% |
Halliburton Co. | 1,175,000 | | 83,437 |
Schlumberger Ltd. | 850,000 | | 100,258 |
| | 183,695 |
Oil, Gas & Consumable Fuels - 8.9% |
Anadarko Petroleum Corp. | 778,350 | | 85,206 |
Cheniere Energy Partners LP | 1,000,000 | | 33,040 |
Chevron Corp. | 500,000 | | 65,275 |
Common Stocks - continued |
| Shares | | Value (000s) |
ENERGY - continued |
Oil, Gas & Consumable Fuels - continued |
EOG Resources, Inc. | 940,000 | | $ 109,848 |
EQT Midstream Partners LP | 550,000 | | 53,207 |
MPLX LP | 600,000 | | 38,700 |
Phillips 66 Co. | 850,000 | | 68,366 |
The Williams Companies, Inc. | 1,247,000 | | 72,588 |
| | 526,230 |
TOTAL ENERGY | | 709,925 |
FINANCIALS - 15.8% |
Banks - 7.4% |
Bank of America Corp. | 6,877,200 | | 105,703 |
JPMorgan Chase & Co. | 1,857,000 | | 107,000 |
SunTrust Banks, Inc. | 1,664,900 | | 66,696 |
Wells Fargo & Co. | 2,969,167 | | 156,059 |
| | 435,458 |
Capital Markets - 2.2% |
E*TRADE Financial Corp. (a) | 1,481,700 | | 31,501 |
Invesco Ltd. | 1,200,000 | | 45,300 |
Morgan Stanley, Inc. | 1,698,700 | | 54,919 |
| | 131,720 |
Consumer Finance - 2.5% |
American Express Co. | 967,092 | | 91,748 |
Discover Financial Services | 923,400 | | 57,232 |
| | 148,980 |
Diversified Financial Services - 2.5% |
Berkshire Hathaway, Inc. Class B (a) | 600,000 | | 75,936 |
McGraw Hill Financial, Inc. | 835,625 | | 69,382 |
| | 145,318 |
Insurance - 0.8% |
American International Group, Inc. | 900,000 | | 49,122 |
Real Estate Investment Trusts - 0.4% |
Altisource Residential Corp. Class B | 896,600 | | 23,338 |
TOTAL FINANCIALS | | 933,936 |
HEALTH CARE - 15.4% |
Biotechnology - 6.8% |
Actelion Ltd. | 175,000 | | 22,141 |
Common Stocks - continued |
| Shares | | Value (000s) |
HEALTH CARE - continued |
Biotechnology - continued |
Alexion Pharmaceuticals, Inc. (a) | 250,000 | | $ 39,063 |
Amgen, Inc. | 719,900 | | 85,215 |
Biogen Idec, Inc. (a) | 319,600 | | 100,773 |
Cubist Pharmaceuticals, Inc. | 608,900 | | 42,513 |
Genmab A/S (a) | 470,000 | | 20,061 |
Gilead Sciences, Inc. (a) | 964,800 | | 79,992 |
Seattle Genetics, Inc. (a) | 314,300 | | 12,022 |
| | 401,780 |
Health Care Equipment & Supplies - 0.7% |
Boston Scientific Corp. (a) | 3,200,000 | | 40,864 |
Health Care Providers & Services - 2.1% |
HCA Holdings, Inc. (a) | 450,000 | | 25,371 |
Henry Schein, Inc. (a) | 351,300 | | 41,689 |
McKesson Corp. | 300,000 | | 55,863 |
| | 122,923 |
Life Sciences Tools & Services - 1.6% |
Illumina, Inc. (a) | 251,864 | | 44,968 |
Thermo Fisher Scientific, Inc. | 450,000 | | 53,100 |
| | 98,068 |
Pharmaceuticals - 4.2% |
Actavis PLC (a) | 375,000 | | 83,644 |
Johnson & Johnson | 1,150,000 | | 120,313 |
Teva Pharmaceutical Industries Ltd. sponsored ADR | 500,000 | | 26,210 |
Theravance, Inc. (a)(d) | 746,233 | | 22,223 |
| | 252,390 |
TOTAL HEALTH CARE | | 916,025 |
INDUSTRIALS - 13.9% |
Aerospace & Defense - 3.8% |
Honeywell International, Inc. | 704,200 | | 65,455 |
Huntington Ingalls Industries, Inc. | 350,000 | | 33,107 |
Textron, Inc. | 1,658,600 | | 63,508 |
The Boeing Co. | 515,000 | | 65,523 |
| | 227,593 |
Airlines - 0.7% |
American Airlines Group, Inc. | 1,000,000 | | 42,960 |
Electrical Equipment - 0.5% |
Generac Holdings, Inc. | 579,965 | | 28,267 |
Common Stocks - continued |
| Shares | | Value (000s) |
INDUSTRIALS - continued |
Industrial Conglomerates - 3.1% |
3M Co. | 775,000 | | $ 111,011 |
Danaher Corp. | 891,900 | | 70,219 |
| | 181,230 |
Machinery - 4.0% |
Caterpillar, Inc. | 950,000 | | 103,237 |
Cummins, Inc. | 589,000 | | 90,877 |
Manitowoc Co., Inc. | 1,350,000 | | 44,361 |
| | 238,475 |
Road & Rail - 1.8% |
Union Pacific Corp. | 1,061,600 | | 105,895 |
TOTAL INDUSTRIALS | | 824,420 |
INFORMATION TECHNOLOGY - 20.2% |
Electronic Equipment & Components - 1.9% |
Amphenol Corp. Class A | 1,172,738 | | 112,982 |
Internet Software & Services - 6.4% |
Facebook, Inc. Class A (a) | 1,650,000 | | 111,029 |
Google, Inc.: | | | |
Class A (a) | 199,800 | | 116,817 |
Class C (a) | 199,800 | | 114,941 |
Yahoo!, Inc. (a) | 1,010,000 | | 35,481 |
| | 378,268 |
IT Services - 1.3% |
Fidelity National Information Services, Inc. | 760,700 | | 41,641 |
Visa, Inc. Class A | 180,600 | | 38,054 |
| | 79,695 |
Semiconductors & Semiconductor Equipment - 2.3% |
Applied Materials, Inc. | 1,850,000 | | 41,718 |
Freescale Semiconductor, Inc. (a)(d) | 1,209,485 | | 28,423 |
NXP Semiconductors NV (a) | 1,038,500 | | 68,728 |
| | 138,869 |
Software - 3.9% |
Adobe Systems, Inc. (a) | 1,175,000 | | 85,023 |
Microsoft Corp. | 3,000,000 | | 125,100 |
salesforce.com, Inc. (a) | 325,000 | | 18,876 |
| | 228,999 |
Common Stocks - continued |
| Shares | | Value (000s) |
INFORMATION TECHNOLOGY - continued |
Technology Hardware, Storage & Peripherals - 4.4% |
Apple, Inc. | 2,790,200 | | $ 259,289 |
TOTAL INFORMATION TECHNOLOGY | | 1,198,102 |
MATERIALS - 6.9% |
Chemicals - 4.0% |
Airgas, Inc. | 275,000 | | 29,950 |
Celanese Corp. Class A | 725,000 | | 46,603 |
Methanex Corp. | 112,800 | | 6,974 |
Monsanto Co. | 959,900 | | 119,738 |
W.R. Grace & Co. (a) | 348,100 | | 32,906 |
| | 236,171 |
Construction Materials - 2.1% |
Martin Marietta Materials, Inc. (d) | 502,000 | | 66,289 |
Vulcan Materials Co. | 902,954 | | 57,563 |
| | 123,852 |
Metals & Mining - 0.8% |
Alcoa, Inc. | 1,800,000 | | 26,802 |
Freeport-McMoRan Copper & Gold, Inc. | 600,000 | | 21,900 |
| | 48,702 |
TOTAL MATERIALS | | 408,725 |
TOTAL COMMON STOCKS (Cost $4,219,319) |
5,718,177
|
Nonconvertible Preferred Stocks - 0.7% |
| | | |
CONSUMER DISCRETIONARY - 0.7% |
Automobiles - 0.7% |
Porsche Automobil Holding SE (Germany) | 425,000 | | 44,281 |
TOTAL NONCONVERTIBLE PREFERRED STOCKS (Cost $42,597) |
44,281
|
U.S. Treasury Obligations - 0.1% |
| Principal Amount (000s) | | |
U.S. Treasury Bills, yield at date of purchase 0.03% to 0.03% 8/21/14 (e)
(Cost $3,770) | | $ 3,770 | |
3,770
|
Money Market Funds - 3.7% |
| Shares | | Value (000s) |
Fidelity Cash Central Fund, 0.11% (b) | 146,713,048 | | $ 146,713 |
Fidelity Securities Lending Cash Central Fund, 0.10% (b)(c) | 70,731,000 | | 70,731 |
TOTAL MONEY MARKET FUNDS (Cost $217,444) |
217,444
|
TOTAL INVESTMENT PORTFOLIO - 100.9% (Cost $4,483,130) | 5,983,672 |
NET OTHER ASSETS (LIABILITIES) - (0.9)% | (53,826) |
NET ASSETS - 100% | $ 5,929,846 |
Futures Contracts |
| Expiration Date | | Underlying Face Amount at Value (000s) | | Unrealized Appreciation/
(Depreciation) (000s) |
Purchased |
Equity Index Contracts |
696 CME E-mini S&P 500 Index Contracts | Sept. 2014 | | $ 67,944 | | $ 453 |
|
The face value of futures purchased as a percentage of net assets is 1.1% |
Legend |
(a) Non-income producing |
(b) Affiliated fund that is generally available only to investment companies and other accounts managed by Fidelity Investments. The rate quoted is the annualized seven-day yield of the fund at period end. A complete unaudited listing of the fund's holdings as of its most recent quarter end is available upon request. In addition, each Fidelity Central Fund's financial statements, which are not covered by the Fund's Report of Independent Registered Public Accounting Firm, are available on the SEC's website or upon request. |
(c) Investment made with cash collateral received from securities on loan. |
(d) Security or a portion of the security is on loan at period end. |
(e) Security or a portion of the security was pledged to cover margin requirements for futures contracts. At period end, the value of securities pledged amounted to $2,870,000. |
Affiliated Central Funds |
Information regarding fiscal year to date income earned by the Fund from investments in Fidelity Central Funds is as follows: |
Fund | Income earned
(Amounts in thousands) |
Fidelity Cash Central Fund | $ 98 |
Fidelity Securities Lending Cash Central Fund | 599 |
Total | $ 697 |
Other Information |
The following is a summary of the inputs used, as of June 30, 2014, involving the Fund's assets and liabilities carried at fair value. The inputs or methodology used for valuing securities may not be an indication of the risk associated with investing in those securities. For more information on valuation inputs, and their aggregation into the levels used in the table below, please refer to the Investment Valuation section in the accompanying Notes to Financial Statements. |
Valuation Inputs at Reporting Date: |
Description
(Amounts in thousands) | Total | Level 1 | Level 2 | Level 3 |
Investments in Securities: | | | | |
Equities: | | | | |
Consumer Discretionary | $ 420,487 | $ 420,487 | $ - | $ - |
Consumer Staples | 350,838 | 350,838 | - | - |
Energy | 709,925 | 709,925 | - | - |
Financials | 933,936 | 933,936 | - | - |
Health Care | 916,025 | 916,025 | - | - |
Industrials | 824,420 | 824,420 | - | - |
Information Technology | 1,198,102 | 1,198,102 | - | - |
Materials | 408,725 | 408,725 | - | - |
U.S. Government and Government Agency Obligations | 3,770 | - | 3,770 | - |
Money Market Funds | 217,444 | 217,444 | - | - |
Total Investments in Securities: | $ 5,983,672 | $ 5,979,902 | $ 3,770 | $ - |
Derivative Instruments: | | | | |
Assets | | | | |
Futures Contracts | $ 453 | $ 453 | $ - | $ - |
Value of Derivative Instruments |
The following table is a summary of the Fund's value of derivative instruments by primary risk exposure as of June 30, 2014. For additional information on derivative instruments, please refer to the Derivative Instruments section in the accompanying Notes to Financial Statements. |
Primary Risk Exposure /
Derivative Type
(Amounts in thousands) | Value |
| Asset | Liability |
Equity Risk | | |
Futures Contracts (a) | $ 453 | $ - |
Total Value of Derivatives | $ 453 | $ - |
(a) Reflects gross cumulative appreciation (depreciation) on futures contracts as presented in the Schedule of Investments. Only the period end receivable or payable for daily variation margin and net unrealized appreciation (depreciation) are presented in the Statement of Assets and Liabilities. |
See accompanying notes which are an integral part of the financial statements.
Annual Report
Statement of Assets and Liabilities
Amounts in thousands (except per-share amounts) | June 30, 2014 |
| | |
Assets | | |
Investment in securities, at value (including securities loaned of $68,968) - See accompanying schedule: Unaffiliated issuers (cost $4,265,686) | $ 5,766,228 | |
Fidelity Central Funds (cost $217,444) | 217,444 | |
Total Investments (cost $4,483,130) | | $ 5,983,672 |
Cash | | 1 |
Receivable for investments sold | | 39,762 |
Receivable for fund shares sold | | 1,375 |
Dividends receivable | | 2,626 |
Distributions receivable from Fidelity Central Funds | | 151 |
Receivable for daily variation margin for derivative instruments | | 13 |
Receivable from investment adviser for expense reductions | | 2 |
Other receivables | | 293 |
Total assets | | 6,027,895 |
| | |
Liabilities | | |
Payable for investments purchased | $ 21,510 | |
Payable for fund shares redeemed | 3,088 | |
Accrued management fee | 1,672 | |
Other affiliated payables | 775 | |
Other payables and accrued expenses | 273 | |
Collateral on securities loaned, at value | 70,731 | |
Total liabilities | | 98,049 |
| | |
Net Assets | | $ 5,929,846 |
Net Assets consist of: | | |
Paid in capital | | $ 4,042,380 |
Undistributed net investment income | | 20,644 |
Accumulated undistributed net realized gain (loss) on investments and foreign currency transactions | | 365,812 |
Net unrealized appreciation (depreciation) on investments and assets and liabilities in foreign currencies | | 1,501,010 |
Net Assets | | $ 5,929,846 |
See accompanying notes which are an integral part of the financial statements.
Annual Report
Statement of Assets and Liabilities - continued
Amounts in thousands (except per-share amounts) | June 30, 2014 |
| | |
Fidelity Fund:
Net Asset Value, offering price and redemption price per share ($4,811,282 ÷ 105,934 shares) | | $ 45.42 |
| | |
Class K:
Net Asset Value, offering price and redemption price per share ($1,118,564 ÷ 24,625 shares) | | $ 45.42 |
See accompanying notes which are an integral part of the financial statements.
Annual Report
Financial Statements - continued
Statement of Operations
Amounts in thousands | Year ended June 30, 2014 |
| | |
Investment Income | | |
Dividends | | $ 77,194 |
Income from Fidelity Central Funds | | 697 |
Total income | | 77,891 |
| | |
Expenses | | |
Management fee | $ 19,712 | |
Transfer agent fees | 8,235 | |
Accounting and security lending fees | 1,119 | |
Custodian fees and expenses | 103 | |
Independent trustees' compensation | 25 | |
Appreciation in deferred trustee compensation account | 1 | |
Registration fees | 66 | |
Audit | 76 | |
Legal | 32 | |
Interest | 2 | |
Miscellaneous | 49 | |
Total expenses before reductions | 29,420 | |
Expense reductions | (213) | 29,207 |
Net investment income (loss) | | 48,684 |
Realized and Unrealized Gain (Loss) Net realized gain (loss) on: | | |
Investment securities: | | |
Unaffiliated issuers | 555,116 | |
Foreign currency transactions | 44 | |
Futures contracts | 4,011 | |
Total net realized gain (loss) | | 559,171 |
Change in net unrealized appreciation (depreciation) on: Investment securities | 617,457 | |
Assets and liabilities in foreign currencies | 26 | |
Futures contracts | 453 | |
Total change in net unrealized appreciation (depreciation) | | 617,936 |
Net gain (loss) | | 1,177,107 |
Net increase (decrease) in net assets resulting from operations | | $ 1,225,791 |
See accompanying notes which are an integral part of the financial statements.
Annual Report
Statement of Changes in Net Assets
Amounts in thousands | Year ended
June 30,
2014 | Year ended
June 30,
2013 |
Increase (Decrease) in Net Assets | | |
Operations | | |
Net investment income (loss) | $ 48,684 | $ 64,671 |
Net realized gain (loss) | 559,171 | 526,204 |
Change in net unrealized appreciation (depreciation) | 617,936 | 240,754 |
Net increase (decrease) in net assets resulting
from operations | 1,225,791 | 831,629 |
Distributions to shareholders from net investment income | (45,770) | (73,239) |
Distributions to shareholders from net realized gain | (408,221) | - |
Total distributions | (453,991) | (73,239) |
Share transactions - net increase (decrease) | (286,775) | (492,060) |
Total increase (decrease) in net assets | 485,025 | 266,330 |
| | |
Net Assets | | |
Beginning of period | 5,444,821 | 5,178,491 |
End of period (including undistributed net investment income of $20,644 and undistributed net investment income of $20,378, respectively) | $ 5,929,846 | $ 5,444,821 |
See accompanying notes which are an integral part of the financial statements.
Annual Report
Financial Highlights - Fidelity Fund
Years ended June 30, | 2014 | 2013 | 2012 | 2011 | 2010 |
Selected Per-Share Data | | | | | |
Net asset value, beginning of period | $ 39.77 | $ 34.51 | $ 34.35 | $ 26.08 | $ 23.95 |
Income from Investment Operations | | | | | |
Net investment income (loss) B | .35 | .44 | .37 | .27E | .23 |
Net realized and unrealized gain (loss) | 8.61 | 5.31 | .02 | 8.27 | 2.25 |
Total from investment operations | 8.96 | 5.75 | .39 | 8.54 | 2.48 |
Distributions from net investment income | (.32) | (.49) | (.23) | (.27) | (.35) |
Distributions from net realized gain | (2.98) | - | - | - | - |
Total distributions | (3.31) G | (.49) | (.23) | (.27) | (.35) |
Net asset value, end of period | $ 45.42 | $ 39.77 | $ 34.51 | $ 34.35 | $ 26.08 |
Total ReturnA | 23.70% | 16.85% | 1.21% | 32.89% | 10.40% |
Ratios to Average Net Assets C, F | | | | | |
Expenses before reductions | .53% | .56% | .58% | .59% | .61% |
Expenses net of fee waivers, if any | .53% | .56% | .58% | .59% | .61% |
Expenses net of all reductions | .53% | .55% | .58% | .58% | .60% |
Net investment income (loss) | .82% | 1.18% | 1.13% | .86% E | .82% |
Supplemental Data | | | | | |
Net assets, end of period (in millions) | $ 4,811 | $ 4,451 | $ 4,364 | $ 5,072 | $ 4,412 |
Portfolio turnover rateD | 93% | 113% | 102% | 88% | 77% |
A Total returns would have been lower if certain expenses had not been reduced during the applicable periods shown.
B Calculated based on average shares outstanding during the period.
C Fees and expenses of any underlying Fidelity Central Funds are not included in the Fund's expense ratio. The Fund indirectly bears its proportionate share of the expenses of any underlying Fidelity Central Funds.
D Amount does not include the portfolio activity of any underlying Fidelity Central Funds.
E Investment income per share reflects a large, non-recurring dividend which amounted to $.08 per share. Excluding this non-recurring dividend, the ratio of net investment income (loss) to average net assets would have been .60%.
F Expense ratios reflect operating expenses of the class. Expenses before reductions do not reflect amounts reimbursed by the investment adviser or reductions from brokerage service arrangements or reductions from other expense offset arrangements and do not represent the amount paid by the class during periods when reimbursements or reductions occur. Expenses net of fee waivers reflect expenses after reimbursement by the investment adviser but prior to reductions from brokerage service arrangements or other expense offset arrangements. Expenses net of all reductions represent the net expenses paid by the class.
G Total distributions of $3.31 per share is comprised of distributions from net investment income of $.324 and distributions from net realized gain of $2.984 per share.
See accompanying notes which are an integral part of the financial statements.
Annual Report
Financial Highlights - Class K
Years ended June 30, | 2014 | 2013 | 2012 | 2011 | 2010 |
Selected Per-Share Data | | | | | |
Net asset value, beginning of period | $ 39.78 | $ 34.52 | $ 34.35 | $ 26.08 | $ 23.96 |
Income from Investment Operations | | | | | |
Net investment income (loss) B | .40 | .49 | .42 | .32 E | .28 |
Net realized and unrealized gain (loss) | 8.60 | 5.31 | .02 | 8.27 | 2.24 |
Total from investment operations | 9.00 | 5.80 | .44 | 8.59 | 2.52 |
Distributions from net investment income | (.38) | (.54) | (.27) | (.32) | (.40) |
Distributions from net realized gain | (2.98) | - | - | - | - |
Total distributions | (3.36) | (.54) | (.27) | (.32) | (.40) |
Net asset value, end of period | $ 45.42 | $ 39.78 | $ 34.52 | $ 34.35 | $ 26.08 |
Total ReturnA | 23.83% | 17.03% | 1.37% | 33.10% | 10.54% |
Ratios to Average Net Assets C, F | | | | | |
Expenses before reductions | .41% | .42% | .43% | .43% | .44% |
Expenses net of fee waivers, if any | .41% | .42% | .43% | .43% | .44% |
Expenses net of all reductions | .41% | .41% | .42% | .42% | .43% |
Net investment income (loss) | .94% | 1.32% | 1.29% | 1.02%E | .99% |
Supplemental Data | | | | | |
Net assets, end of period (in millions) | $ 1,119 | $ 994 | $ 814 | $ 663 | $ 426 |
Portfolio turnover rateD | 93% | 113% | 102% | 88% | 77% |
A Total returns would have been lower if certain expenses had not been reduced during the applicable periods shown.
B Calculated based on average shares outstanding during the period.
C Fees and expenses of any underlying Fidelity Central Funds are not included in the Fund's expense ratio. The Fund indirectly bears its proportionate share of the expenses of any underlying Fidelity Central Funds.
D Amount does not include the portfolio activity of any underlying Fidelity Central Funds.
E Investment income per share reflects a large, non-recurring dividend which amounted to $.08 per share. Excluding this non-recurring dividend, the ratio of net investment income (loss) to average net assets would have been .76%.
F Expense ratios reflect operating expenses of the class. Expenses before reductions do not reflect amounts reimbursed by the investment adviser or reductions from brokerage service arrangements or reductions from other expense offset arrangements and do not represent the amount paid by the class during periods when reimbursements or reductions occur. Expenses net of fee waivers reflect expenses after reimbursement by the investment adviser but prior to reductions from brokerage service arrangements or other expense offset arrangements. Expenses net of all reductions represent the net expenses paid by the class.
See accompanying notes which are an integral part of the financial statements.
Annual Report
Notes to Financial Statements
For the period ended June 30, 2014
(Amounts in thousands except percentages)
1. Organization.
Fidelity Fund (the Fund) is a fund of Fidelity Hastings Street Trust (the Trust) and is authorized to issue an unlimited number of shares. The Trust is registered under the Investment Company Act of 1940, as amended (the 1940 Act), as an open-end management investment company organized as a Massachusetts business trust. The Fund offers Fidelity Fund and Class K shares, each of which has equal rights as to assets and voting privileges. Each class has exclusive voting rights with respect to matters that affect that class.
2. Investments in Fidelity Central Funds.
The Fund invests in Fidelity Central Funds, which are open-end investment companies generally available only to other investment companies and accounts managed by the investment adviser and its affiliates. The Fund's Schedule of Investments lists each of the Fidelity Central Funds held as of period end, if any, as an investment of the Fund, but does not include the underlying holdings of each Fidelity Central Fund. As an Investing Fund, the Fund indirectly bears its proportionate share of the expenses of the underlying Fidelity Central Funds.
The Money Market Central Funds seek preservation of capital and current income and are managed by Fidelity Investments Money Management, Inc. (FIMM), an affiliate of the investment adviser. Annualized expenses of the Money Market Central Funds as of their most recent shareholder report date are less than .01%.
A complete unaudited list of holdings for each Fidelity Central Fund is available upon request or at the Securities and Exchange Commission (the SEC) website at www.sec.gov. In addition, the financial statements of the Fidelity Central Funds, which are not covered by the Fund's Report of Independent Registered Public Accounting Firm, are available on the SEC website or upon request.
3. Significant Accounting Policies.
The financial statements have been prepared in conformity with accounting principles generally accepted in the United States of America (GAAP), which require management to make certain estimates and assumptions at the date of the financial statements. Actual results could differ from those estimates. Subsequent events, if any, through the date that the financial statements were issued have been evaluated in the preparation of the financial statements. The following summarizes the significant accounting policies of the Fund:
Annual Report
Notes to Financial Statements - continued
(Amounts in thousands except percentages)
3. Significant Accounting Policies - continued
Investment Valuation. Investments are valued as of 4:00 p.m. Eastern time on the last calendar day of the period. In accordance with valuation policies and procedures approved by the Board of Trustees (the Board), the Fund attempts to obtain prices from one or more third party pricing vendors or brokers to value its investments. When current market prices, quotations or currency exchange rates are not readily available or reliable, investments will be fair valued in good faith by the Fidelity Management & Research Company (FMR) Fair Value Committee (the Committee), in accordance with procedures adopted by the Board. Factors used in determining fair value vary by investment type and may include market or investment specific events, changes in interest rates and credit quality. The frequency with which these procedures are used cannot be predicted and they may be utilized to a significant extent. The Committee oversees the Fund's valuation policies and procedures and is responsible for approving and reporting to the Board all fair value determinations.
The Fund categorizes the inputs to valuation techniques used to value its investments into a disclosure hierarchy consisting of three levels as shown below:
Level 1 - quoted prices in active markets for identical investments
Level 2 - other significant observable inputs (including quoted prices for similar investments, interest rates, prepayment speeds, etc.)
Level 3 - unobservable inputs (including the Fund's own assumptions based on the best information available)
Valuation techniques used to value the Fund's investments by major category are as follows:
Equity securities, including restricted securities, for which market quotations are readily available, are valued at the last reported sale price or official closing price as reported by a third party pricing vendor on the primary market or exchange on which they are traded and are categorized as Level 1 in the hierarchy. In the event there were no sales during the day or closing prices are not available, securities are valued at the last quoted bid price or may be valued using the last available price and are generally categorized as Level 2 in the hierarchy. For foreign equity securities, when market or security specific events arise, comparisons to the valuation of American Depositary Receipts (ADRs), futures contracts, Exchange-Traded Funds (ETFs) and certain indexes as well as quoted prices for similar securities may be used and would be categorized as Level 2 in the hierarchy. Utilizing these techniques may result in transfers between Level 1 and Level 2. For equity securities, including restricted securities, where observable inputs are limited, assumptions about market activity and risk are used and these securities may be categorized as Level 3 in the hierarchy.
Annual Report
3. Significant Accounting Policies - continued
Investment Valuation - continued
Debt securities, including restricted securities, are valued based on evaluated prices received from third party pricing vendors or from brokers who make markets in such securities. U.S. government and government agency obligations are valued by pricing vendors who utilize matrix pricing which considers yield or price of bonds of comparable quality, coupon, maturity and type or by broker-supplied prices. When independent prices are unavailable or unreliable, debt securities may be valued utilizing pricing methodologies which consider similar factors that would be used by third party pricing vendors. Debt securities are generally categorized as Level 2 in the hierarchy but may be Level 3 depending on the circumstances.
Futures contracts are valued at the settlement price established each day by the board of trade or exchange on which they are traded and are categorized as Level 1 in the hierarchy. Investments in open-end mutual funds, including the Fidelity Central Funds, are valued at their closing net asset value (NAV) each business day and are categorized as Level 1 in the hierarchy.
Changes in valuation techniques may result in transfers in or out of an assigned level within the disclosure hierarchy. The aggregate value of investments by input level, as of June 30, 2014, is included at the end of the Fund's Schedule of Investments.
Foreign Currency. The Fund may use foreign currency contracts to facilitate transactions in foreign-denominated securities. Gains and losses from these transactions may arise from changes in the value of the foreign currency or if the counterparties do not perform under the contracts' terms.
Foreign-denominated assets, including investment securities, and liabilities are translated into U.S. dollars at the exchange rates at period end. Purchases and sales of investment securities, income and dividends received and expenses denominated in foreign currencies are translated into U.S. dollars at the exchange rate in effect on the transaction date.
The effects of exchange rate fluctuations on investments are included with the net realized and unrealized gain (loss) on investment securities. Other foreign currency transactions resulting in realized and unrealized gain (loss) are disclosed separately.
Investment Transactions and Income. For financial reporting purposes, the Fund's investment holdings and NAV include trades executed through the end of the last business day of the period. The NAV per share for processing shareholder transactions is calculated as of the close of business of the New York Stock Exchange (NYSE),
Annual Report
Notes to Financial Statements - continued
(Amounts in thousands except percentages)
3. Significant Accounting Policies - continued
Investment Transactions and Income - continued
normally 4:00 p.m. Eastern time and includes trades executed through the end of the prior business day. Gains and losses on securities sold are determined on the basis of identified cost and may include proceeds received from litigation. Dividend income is recorded on the ex-dividend date, except for certain dividends from foreign securities where the ex-dividend date may have passed, which are recorded as soon as the Fund is informed of the ex-dividend date. Non-cash dividends included in dividend income, if any, are recorded at the fair market value of the securities received. Income and capital gain distributions from Fidelity Central Funds, if any, are recorded on the ex-dividend date. Distributions received on securities that represent a return of capital or capital gain are recorded as a reduction of cost of investments and/or as a realized gain. Subsequent to ex-dividend date the Fund determines the components of these distributions, based upon receipt of tax filings or other correspondence relating to the underlying investment. Investment income is recorded net of foreign taxes withheld where recovery of such taxes is uncertain.
Class Allocations and Expenses. Investment income, realized and unrealized capital gains and losses, common expenses of the Fund, and certain fund-level expense reductions, if any, are allocated daily on a pro-rata basis to each class based on the relative net assets of each class to the total net assets of the Fund. Each class differs with respect to transfer agent fees incurred. Certain expense reductions may also differ by class. For the reporting period, the allocated portion of income and expenses to each class as a percent of its average net assets may vary due to the timing of recording these transactions in relation to fluctuating net assets of the classes. Expenses directly attributable to a fund are charged to that fund. Expenses attributable to more than one fund are allocated among the respective funds on the basis of relative net assets or other appropriate methods. Expense estimates are accrued in the period to which they relate and adjustments are made when actual amounts are known.
Deferred Trustee Compensation. Under a Deferred Compensation Plan (the Plan), independent Trustees may elect to defer receipt of a portion of their annual compensation. Deferred amounts are invested in a cross-section of Fidelity funds, are marked-to-market and remain in the Fund until distributed in accordance with the Plan. The investment of deferred amounts and the offsetting payable to the Trustees are included in the accompanying Statement of Assets and Liabilities.
Annual Report
3. Significant Accounting Policies - continued
Income Tax Information and Distributions to Shareholders. Each year, the Fund intends to qualify as a regulated investment company under Subchapter M of the Internal Revenue Code, including distributing substantially all of its taxable income and realized gains. As a result, no provision for U.S. Federal income taxes is required. As of June 30, 2014, the Fund did not have any unrecognized tax benefits in the financial statements; nor is the Fund aware of any tax positions for which it is reasonably possible that the total amounts of unrecognized tax benefits will significantly change in the next twelve months. The Fund files a U.S. federal tax return, in addition to state and local tax returns as required. The Fund's federal income tax returns are subject to examination by the Internal Revenue Service (IRS) for a period of three fiscal years after they are filed. State and local tax returns may be subject to examination for an additional fiscal year depending on the jurisdiction. Foreign taxes are provided for based on the Fund's understanding of the tax rules and rates that exist in the foreign markets in which it invests.
Distributions are declared and recorded on the ex-dividend date. Income dividends and capital gain distributions are declared separately for each class. Income and capital gain distributions are determined in accordance with income tax regulations, which may differ from GAAP. In addition, the Fund claimed a portion of the payment made to redeeming shareholders as a distribution for income tax purposes.
Capital accounts within the financial statements are adjusted for permanent book-tax differences. These adjustments have no impact on net assets or the results of operations. Capital accounts are not adjusted for temporary book-tax differences which will reverse in a subsequent period.
Book-tax differences are primarily due to futures contracts, foreign currency transactions, partnerships, deferred trustees compensation and losses deferred due to wash sales.
The federal tax cost of investment securities and unrealized appreciation (depreciation) as of period end were as follows:
Gross unrealized appreciation | $ 1,509,416 |
Gross unrealized depreciation | (17,610) |
Net unrealized appreciation (depreciation) on securities and other investments | $ 1,491,806 |
| |
Tax Cost | $ 4,491,866 |
Annual Report
Notes to Financial Statements - continued
(Amounts in thousands except percentages)
3. Significant Accounting Policies - continued
Income Tax Information and Distributions to Shareholders - continued
The tax-based components of distributable earnings as of period end were as follows:
Undistributed ordinary income | $ 79,833 |
Undistributed long-term capital gain | $ 315,999 |
Net unrealized appreciation (depreciation) | $ 1,491,821 |
The tax character of distributions paid was as follows:
| June 30, 2014 | June 30, 2013 |
Ordinary Income | $ 71,607 | $ 73,239 |
Long-term Capital Gains | 382,384 | - |
Total | $ 453,991 | $ 73,239 |
4. Derivative Instruments.
Risk Exposures and the Use of Derivative Instruments. The Fund's investment objective allows the Fund to enter into various types of derivative contracts, including futures contracts. Derivatives are investments whose value is primarily derived from underlying assets, indices or reference rates and may be transacted on an exchange or over-the-counter (OTC). Derivatives may involve a future commitment to buy or sell a specified asset based on specified terms, to exchange future cash flows at periodic intervals based on a notional principal amount, or for one party to make one or more payments upon the occurrence of specified events in exchange for periodic payments from the other party.
The Fund used derivatives to increase returns and to manage exposure to certain risks as defined below. The success of any strategy involving derivatives depends on analysis of numerous economic factors, and if the strategies for investment do not work as intended, the Fund may not achieve its objectives.
The Fund's use of derivatives increased or decreased its exposure to the following risk:
Equity Risk | Equity risk relates to the fluctuations in the value of financial instruments as a result of changes in market prices (other than those arising from interest rate risk or foreign exchange risk), whether caused by factors specific to an individual investment, its issuer, or all factors affecting all instruments traded in a market or market segment. |
Annual Report
4. Derivative Instruments - continued
Risk Exposures and the Use of Derivative Instruments - continued
The Fund is also exposed to additional risks from investing in derivatives, such as liquidity risk and counterparty credit risk. Liquidity risk is the risk that the Fund will be unable to close out the derivative in the open market in a timely manner. Counterparty credit risk is the risk that the counterparty will not be able to fulfill its obligation to the Fund. Counterparty credit risk related to exchange-traded futures contracts may be mitigated by the protection provided by the exchange on which they trade.
Investing in derivatives may involve greater risks than investing in the underlying assets directly and, to varying degrees, may involve risk of loss in excess of any initial investment and collateral received and amounts recognized in the Statement of Assets and Liabilities. In addition, there may be the risk that the change in value of the derivative contract does not correspond to the change in value of the underlying instrument.
Futures Contracts. A futures contract is an agreement between two parties to buy or sell a specified underlying instrument for a fixed price at a specified future date. The Fund used futures contracts to manage its exposure to the stock market.
Upon entering into a futures contract, a fund is required to deposit either cash or securities (initial margin) with a clearing broker in an amount equal to a certain percentage of the face value of the contract. Futures contracts are marked-to-market daily and subsequent daily payments (variation margin) are made or received by a fund depending on the daily fluctuations in the value of the futures contracts and are recorded as unrealized appreciation or (depreciation). This receivable and/or payable, if any, is included in daily variation margin for derivative instruments in the Statement of Assets and Liabilities. Realized gain or (loss) is recorded upon the expiration or closing of a futures contract.
Any open futures contracts at period end are presented in the Schedule of Investments under the caption "Futures Contracts". The underlying face amount at value reflects each contract's exposure to the underlying instrument or index at period end and is representative of volume of activity during the period. Securities deposited to meet initial margin requirements are identified in the Schedule of Investments.
During the period the Fund recognized net realized gain (loss) of $4,011 and a change in net unrealized appreciation (depreciation) of $453 related to its investment in futures contracts. These amounts are included in the Statement of Operations.
5. Purchases and Sales of Investments.
Purchases and sales of securities, other than short-term securities, aggregated $5,249,903 and $5,975,882, respectively.
Annual Report
Notes to Financial Statements - continued
(Amounts in thousands except percentages)
6. Fees and Other Transactions with Affiliates.
Management Fee. Fidelity Management & Research Company (the investment adviser) and its affiliates provide the Fund with investment management related services for which the Fund pays a monthly management fee. The management fee is the sum of an individual fund fee rate that is based on an annual rate of .09% of the Fund's average net assets and an annualized group fee rate that averaged .25% during the period. The group fee rate is based upon the average net assets of all the mutual funds advised by the investment adviser, including any mutual funds previously advised by the investment adviser that are currently advised by Fidelity SelectCo, LLC, an affiliate of the investment adviser. The group fee rate decreases as assets under management increase and increases as assets under management decrease. For the reporting period, the total annual management fee rate was .34% of the Fund's average net assets.
Transfer Agent Fees. Fidelity Investments Institutional Operations Company, Inc., (FIIOC), an affiliate of the investment adviser, is the transfer, dividend disbursing and shareholder servicing agent for each class of the Fund. FIIOC receives account fees and asset-based fees that vary according to the account size and type of account of the shareholders of Fidelity Fund. FIIOC receives an asset-based fee of Class K's average net assets. FIIOC pays for typesetting, printing and mailing of shareholder reports, except proxy statements.
For the period, transfer agent fees for each class were as follows:
| Amount | % of
Average
Net Assets |
Fidelity Fund | $ 7,738 | .16 |
Class K | 497 | .05 |
| $ 8,235 | |
Accounting and Security Lending Fees. Fidelity Service Company, Inc. (FSC), an affiliate of the investment adviser, maintains the Fund's accounting records. The accounting fee is based on the level of average net assets for each month. Under a separate contract, FSC administers the security lending program. The security lending fee is based on the number and duration of lending transactions.
Brokerage Commissions. The Fund placed a portion of its portfolio transactions with brokerage firms which are affiliates of the investment adviser. Brokerage commissions are included in net realized gain (loss) and change in net unrealized appreciation (depreciation) in the Statement of Operations. The commissions paid to these affiliated firms were $120 for the period.
Annual Report
6. Fees and Other Transactions with Affiliates - continued
Interfund Lending Program. Pursuant to an Exemptive Order issued by the SEC, the Fund, along with other registered investment companies having management contracts with FMR or other affiliated entities of FMR, may participate in an interfund lending program. This program provides an alternative credit facility allowing the funds to borrow from, or lend money to, other participating affiliated funds. At period end, there were no interfund loans outstanding. The Fund's activity in this program during the period for which loans were outstanding was as follows:
Borrower or Lender | Average Loan
Balance | Weighted Average Interest Rate | Interest Expense |
Borrower | $ 44,379 | .32% | $ 2 |
7. Committed Line of Credit.
The Fund participates with other funds managed by the investment adviser or an affiliate in a $4.25 billion credit facility (the "line of credit") to be utilized for temporary or emergency purposes to fund shareholder redemptions or for other short-term liquidity purposes. The Fund has agreed to pay commitment fees on its pro-rata portion of the line of credit, which amounted to $10 and is reflected in Miscellaneous expenses on the Statement of Operations. During the period, the Fund did not borrow on this line of credit.
8. Security Lending.
The Fund lends portfolio securities through a lending agent from time to time in order to earn additional income. For equity securities, a lending agent is used and may loan securities to certain qualified borrowers, including Fidelity Capital Markets (FCM), a broker-dealer affiliated with the Fund. On the settlement date of the loan, the Fund receives collateral (in the form of U.S. Treasury obligations, letters of credit and/or cash) against the loaned securities and maintains collateral in an amount not less than 100% of the market value of the loaned securities during the period of the loan. The market value of the loaned securities is determined at the close of business of the Fund and any additional required collateral is delivered to the Fund on the next business day. If the borrower defaults on its obligation to return the securities loaned because of insolvency or other reasons, the Fund may apply collateral received from the borrower against the obligation. The Fund may experience delays and costs in recovering the securities loaned. Any cash collateral received is invested in the Fidelity Securities Lending Cash Central Fund. The value of loaned securities and cash collateral at period end are disclosed on the Fund's Statement of Assets and Liabilities. At period end, there were no security loans outstanding with FCM. Security lending income represents the income earned on investing cash collateral, less rebates paid to borrowers and any lending agent
Annual Report
Notes to Financial Statements - continued
(Amounts in thousands except percentages)
8. Security Lending - continued
fees associated with the loan, plus any premium payments received for lending certain types of securities. Security lending income is presented in the Statement of Operations as a component of income from Fidelity Central Funds. Total security lending income during the period amounted to $599, including $1 from securities loaned to FCM.
9. Expense Reductions.
Commissions paid to certain brokers with whom the investment adviser, or its affiliates, places trades on behalf of the Fund include an amount in addition to trade execution, which may be rebated back to the Fund to offset certain expenses. This amount totaled $185 for the period.
In addition, the investment adviser reimbursed a portion of the Fund's operating expenses during the period in the amount of $28.
10. Distributions to Shareholders.
Distributions to shareholders of each class were as follows:
Years ended June 30, | 2014 | 2013 |
From net investment income | | |
Fidelity Fund | $ 36,308 | $ 59,871 |
Class K | 9,462 | 13,368 |
Total | $ 45,770 | $ 73,239 |
From net realized gain | | |
Fidelity Fund | $ 333,629 | $ - |
Class K | 74,592 | - |
Total | $ 408,221 | $ - |
Annual Report
11. Share Transactions.
Transactions for each class of shares were as follows:
| Shares | Dollars |
Years ended June 30, | 2014 | 2013 | 2014 | 2013 |
Fidelity Fund | | | | |
Shares sold | 4,764 | 6,586 | $ 199,883 | $ 245,372 |
Reinvestment of distributions | 8,565 | 1,584 | 347,036 | 55,780 |
Shares redeemed | (19,322) | (22,706) | (815,615) | (844,733) |
Net increase (decrease) | (5,993) | (14,536) | $ (268,696) | $ (543,581) |
Class K | | | | |
Shares sold | 3,722 | 6,352 | $ 157,689 | $ 236,538 |
Reinvestment of distributions | 2,075 | 380 | 84,054 | 13,368 |
Shares redeemed | (6,150) | (5,340) | (259,822) | (198,385) |
Net increase (decrease) | (353) | 1,392 | $ (18,079) | $ 51,521 |
12. Other.
The Fund's organizational documents provide former and current trustees and officers with a limited indemnification against liabilities arising in connection with the performance of their duties to the Fund. In the normal course of business, the Fund may also enter into contracts that provide general indemnifications. The Fund's maximum exposure under these arrangements is unknown as this would be dependent on future claims that may be made against the Fund. The risk of material loss from such claims is considered remote.
Annual Report
To the Trustees of Fidelity Hastings Street Trust and the Shareholders of Fidelity Fund:
In our opinion, the accompanying statement of assets and liabilities, including the schedule of investments, and the related statements of operations and of changes in net assets and the financial highlights present fairly, in all material respects, the financial position of Fidelity Fund (a fund of Fidelity Hastings Street Trust) at June 30, 2014, the results of its operations for the year then ended, the changes in its net assets for each of the two years in the period then ended and the financial highlights for each of the five years in the period then ended, in conformity with accounting principles generally accepted in the United States of America. These financial statements and financial highlights (hereafter referred to as "financial statements") are the responsibility of the Fidelity Fund's management. Our responsibility is to express an opinion on these financial statements based on our audits. We conducted our audits of these financial statements in accordance with the standards of the Public Company Accounting Oversight Board (United States). Those standards require that we plan and perform the audit to obtain reasonable assurance about whether the financial statements are free of material misstatement. An audit includes examining, on a test basis, evidence supporting the amounts and disclosures in the financial statements, assessing the accounting principles used and significant estimates made by management, and evaluating the overall financial statement presentation. We believe that our audits, which included confirmation of securities at June 30, 2014 by correspondence with the custodian and brokers, provide a reasonable basis for our opinion.
PricewaterhouseCoopers LLP
Boston, Massachusetts
August 11, 2014
Annual Report
The Trustees, Member of the Advisory Board, and officers of the trust and fund, as applicable, are listed below. The Board of Trustees governs the fund and is responsible for protecting the interests of shareholders. The Trustees are experienced executives who meet periodically throughout the year to oversee the fund's activities, review contractual arrangements with companies that provide services to the fund, oversee management of the risks associated with such activities and contractual arrangements, and review the fund's performance. Except for James C. Curvey, each of the Trustees oversees 173 funds. Mr. Curvey oversees 397 funds.
The Trustees hold office without limit in time except that (a) any Trustee may resign; (b) any Trustee may be removed by written instrument, signed by at least two-thirds of the number of Trustees prior to such removal; (c) any Trustee who requests to be retired or who has become incapacitated by illness or injury may be retired by written instrument signed by a majority of the other Trustees; and (d) any Trustee may be removed at any special meeting of shareholders by a two-thirds vote of the outstanding voting securities of the trust. Each Trustee who is not an interested person (as defined in the 1940 Act) of the trust and the fund (Independent Trustee), shall retire not later than the last day of the calendar year in which his or her 75th birthday occurs. The Independent Trustees may waive this mandatory retirement age policy with respect to individual Trustees. The officers and Advisory Board Member hold office without limit in time, except that any officer and Advisory Board Member may resign or may be removed by a vote of a majority of the Trustees at any regular meeting or any special meeting of the Trustees. Except as indicated, each individual has held the office shown or other offices in the same company for the past five years.
Experience, Skills, Attributes, and Qualifications of the Fund's Trustees. The Governance and Nominating Committee has adopted a statement of policy that describes the experience, qualifications, attributes, and skills that are necessary and desirable for potential Independent Trustee candidates (Statement of Policy). The Board believes that each Trustee satisfied at the time he or she was initially elected or appointed a Trustee, and continues to satisfy, the standards contemplated by the Statement of Policy. The Governance and Nominating Committee also engages professional search firms to help identify potential Independent Trustee candidates who have the experience, qualifications, attributes, and skills consistent with the Statement of Policy. From time to time, additional criteria based on the composition and skills of the current Independent Trustees, as well as experience or skills that may be appropriate in light of future changes to board composition, business conditions, and regulatory or other developments, have also been considered by the professional search firms and the Governance and Nominating Committee. In addition, the Board takes into account the Trustees' commitment and participation in Board and committee meetings, as well as their leadership of standing and ad hoc committees throughout their tenure.
In determining that a particular Trustee was and continues to be qualified to serve as a Trustee, the Board has considered a variety of criteria, none of which, in isolation, was controlling. The Board believes that, collectively, the Trustees have balanced and diverse experience, qualifications, attributes, and skills, which allow the Board to operate effectively in governing the fund and protecting the interests of shareholders. Information about the specific experience, skills, attributes, and qualifications of each Trustee, which in each case led to the Board's conclusion that the Trustee should serve (or continue to serve) as a trustee of the fund, is provided below.
Annual Report
Board Structure and Oversight Function. James C. Curvey is an interested person (as defined in the 1940 Act) and currently serves as Chairman. The Trustees have determined that an interested Chairman is appropriate and benefits shareholders because an interested Chairman has a personal and professional stake in the quality and continuity of services provided to the fund. Independent Trustees exercise their informed business judgment to appoint an individual of their choosing to serve as Chairman, regardless of whether the Trustee happens to be independent or a member of management. The Independent Trustees have determined that they can act independently and effectively without having an Independent Trustee serve as Chairman and that a key structural component for assuring that they are in a position to do so is for the Independent Trustees to constitute a substantial majority for the Board. The Independent Trustees also regularly meet in executive session. Ned C. Lautenbach serves as Chairman of the Independent Trustees and as such (i) acts as a liaison between the Independent Trustees and management with respect to matters important to the Independent Trustees and (ii) with management prepares agendas for Board meetings.
Fidelity funds are overseen by different Boards of Trustees. The fund's Board oversees Fidelity's equity and high income funds and another Board oversees Fidelity's investment-grade bond, money market, and asset allocation funds. The asset allocation funds may invest in Fidelity funds overseen by the fund's Board. The use of separate Boards, each with its own committee structure, allows the Trustees of each group of Fidelity funds to focus on the unique issues of the funds they oversee, including common research, investment, and operational issues. On occasion, the separate Boards establish joint committees to address issues of overlapping consequences for the Fidelity funds overseen by each Board.
The Trustees operate using a system of committees to facilitate the timely and efficient consideration of all matters of importance to the Trustees, the fund, and fund shareholders and to facilitate compliance with legal and regulatory requirements and oversight of the fund's activities and associated risks. The Board, acting through its committees, has charged FMR and its affiliates with (i) identifying events or circumstances the occurrence of which could have demonstrably adverse effects on the fund's business and/or reputation; (ii) implementing processes and controls to lessen the possibility that such events or circumstances occur or to mitigate the effects of such events or circumstances if they do occur; and (iii) creating and maintaining a system designed to evaluate continuously business and market conditions in order to facilitate the identification and implementation processes described in (i) and (ii) above. Because the day-to-day operations and activities of the fund are carried out by or through FMR, its affiliates and other service providers, the fund's exposure to risks is mitigated but not eliminated by the processes overseen by the Trustees. While each of the Board's committees has responsibility for overseeing different aspects of the fund's activities, oversight is exercised primarily through the Operations, Audit, and Compliance Committees. In addition, the Independent Trustees have worked with FMR to enhance the Board's oversight of investment and financial risks, legal and regulatory risks, technology risks, and operational risks, including the development of additional risk reporting to the Board. For example, a working group comprised of Independent Trustees and FMR has worked and continues to work to review the Fidelity funds' valuation-related activities, reporting and risk management. Appropriate personnel, including but not limited to the fund's Chief Compliance Officer (CCO), FMR's internal auditor, the independent accountants, the fund's Treasurer and portfolio management personnel, make periodic reports to the Board's committees, as appropriate, including an annual review of FMR's risk management program for the Fidelity funds. The responsibilities of each standing committee, including their oversight responsibilities, are described further under "Standing Committees of the Fund's Trustees."
Annual Report
Trustees and Officers - continued
The fund's Statement of Additional Information (SAI) includes more information about the Trustees. To request a free copy, call Fidelity at 1-800-835-5092.
Interested Trustees*:
Correspondence intended for each Trustee who is an interested person may be sent to Fidelity Investments, 245 Summer Street, Boston, Massachusetts 02210.
Name, Year of Birth; Principal Occupations and Other Relevant Experience+ |
James C. Curvey (1935) |
Year of Election or Appointment: 2007 Trustee Chairman of the Board of Trustees |
| Mr. Curvey also serves as Trustee of other Fidelity funds. Mr. Curvey is a Director of Fidelity Research & Analysis Co. (2009-present), and Vice Chairman (2007-present) and Director of FMR LLC. In addition, Mr. Curvey serves as an Overseer for the Boston Symphony Orchestra and a member of the Trustees of Villanova University. Previously, Mr. Curvey served as a Director of Fidelity Investments Money Management, Inc. (2009-2014), a Director of FMR (2007-2014), a Director of FMR Co., Inc. (2007-2014) and was the Vice Chairman (2006-2007) and Director (2000-2007) of FMR Corp. |
Charles S. Morrison (1960) |
Year of Election or Appointment: 2014 Trustee |
| Mr. Morrison also serves as Trustee of other funds. He serves as President, Asset Management (2014-present) and is an employee of Fidelity Investments. Previously, Mr. Morrison served as Vice President of Fidelity's Fixed Income and Asset Allocation Funds (2012-2014), President, Fixed Income (2011-2014), Vice President of Fidelity's Money Market Funds (2005-2009), President, Money Market Group Leader of FMR (2009), and Senior Vice President, Money Market Group of FMR (2004-2009). Mr. Morrison also served as Vice President of Fidelity's Bond Funds (2002-2005), certain Balanced Funds (2002-2005), and certain Asset Allocation Funds (2002-2007), and as Senior Vice President (2002-2005) of Fidelity's Bond Division. |
* Trustees have been determined to be "Interested Trustees" by virtue of, among other things, their affiliation with the trust or various entities under common control with FMR.
+ The information above includes each Trustee's principal occupation during the last five years and other information relating to the experience, attributes, and skills relevant to each Trustee's qualifications to serve as a Trustee, which led to the conclusion that each Trustee should serve as a Trustee for each fund.
Annual Report
Trustees and Officers - continued
Independent Trustees:
Correspondence intended for each Independent Trustee (that is, the Trustees other than the Interested Trustees) may be sent to Fidelity Investments, P.O. Box 55235, Boston, Massachusetts 02205-5235.
Name, Year of Birth; Principal Occupations and Other Relevant Experience+ |
Dennis J. Dirks (1948) |
Year of Election or Appointment: 2005 Trustee |
| Mr. Dirks also serves as Trustee of other Fidelity funds. Prior to his retirement in May 2003, Mr. Dirks was Chief Operating Officer and a member of the Board of The Depository Trust & Clearing Corporation (DTCC). He also served as President, Chief Operating Officer, and Board member of The Depository Trust Company (DTC) and President and Board member of the National Securities Clearing Corporation (NSCC). In addition, Mr. Dirks served as Chief Executive Officer and Board member of the Government Securities Clearing Corporation, Chief Executive Officer and Board member of the Mortgage-Backed Securities Clearing Corporation, as a Trustee and a member of the Finance Committee of Manhattan College (2005-2008), and as a Trustee and a member of the Finance Committee of AHRC of Nassau County (2006-2008). Mr. Dirks is a member of the Independent Directors Council (IDC) Governing Council (2010-present) and Board of Directors for The Brookville Center for Children's Services, Inc. (2009-present). |
Alan J. Lacy (1953) |
Year of Election or Appointment: 2008 Trustee |
| Mr. Lacy also serves as Trustee of other Fidelity funds. Mr. Lacy serves as Senior Adviser (2007-present) of Oak Hill Capital Partners, L.P. (private equity). Mr. Lacy also served as Chief Executive Officer (2000-2005) and Vice Chairman (2005-2006) of Sears Holdings Corporation and Sears, Roebuck and Co. (retail). In addition, Mr. Lacy serves as a member of the Board of Directors of Dave & Buster's Entertainment, Inc. (restaurant and entertainment complexes, 2010-present), Earth Fare, Inc. (retail grocery, 2012-present), The Hillman Companies, Inc. (hardware wholesalers, 2010-present), and Bristol-Myers Squibb Company (global pharmaceuticals, 2008-present). Mr. Lacy is a member of the Board of Trustees of The National Parks Conservation Association (2006-present). Previously, Mr. Lacy served as Chairman of the Board of Trustees of the National Parks Conservation Association (2008-2011) and as a member of the Board of Directors for the Western Union Company (global money transfer, 2006-2011). |
Ned C. Lautenbach (1944) |
Year of Election or Appointment: 2000 Trustee Chairman of the Independent Trustees |
| Mr. Lautenbach also serves as Trustee of other Fidelity funds. Mr. Lautenbach currently serves as the Lead Director of the Eaton Corporation Board of Directors (diversified industrial, 1997-present). Mr. Lautenbach is Chairman of the Board of Directors of the Philharmonic Center for the Arts in Naples, Florida (2012-present) and a member of the Council on Foreign Relations (1994-present). Previously, Mr. Lautenbach was a Partner/Advisory Partner at Clayton, Dubilier & Rice, LLC (private equity investment, 1998-2010), as well as a Director of Sony Corporation (2006-2007). |
Joseph Mauriello (1944) |
Year of Election or Appointment: 2008 Trustee |
| Mr. Mauriello also serves as Trustee of other Fidelity funds. Prior to his retirement in January 2006, Mr. Mauriello served in numerous senior management positions including Deputy Chairman and Chief Operating Officer (2004-2005), and Vice Chairman of Financial Services (2002-2004) of KPMG LLP US (professional services, 1965-2005). Mr. Mauriello currently serves as a member of the Board of Directors of XL Group plc. (global insurance and re-insurance, 2006-present). Previously, Mr. Mauriello served as a Director of the Hamilton Funds of the Bank of New York (2006-2007) and of Arcadia Resources Inc. (health care services and products, 2007-2012). |
Robert W. Selander (1950) |
Year of Election or Appointment: 2011 Trustee |
| Mr. Selander also serves as Trustee of other Fidelity funds. Previously, Mr. Selander served as a Member of the Advisory Board of other Fidelity funds (2011), and Executive Vice Chairman (2010), Chief Executive Officer (2009-2010), and President and Chief Executive Officer (1997-2009) of Mastercard, Inc. |
Cornelia M. Small (1944) |
Year of Election or Appointment: 2005 Trustee |
| Ms. Small also serves as Trustee of other Fidelity funds. Ms. Small is a member of the Board of Directors (2009-present) and Chair of the Investment Committee (2010-present) of the Teagle Foundation. Ms. Small also serves on the Investment Committee of the Berkshire Taconic Community Foundation (2008-present). Previously, Ms. Small served as Chairperson (2002-2008) and a member of the Investment Committee and Chairperson (2008-2012) and a member of the Board of Trustees of Smith College. In addition, Ms. Small served as Chief Investment Officer, Director of Global Equity Investments, and a member of the Board of Directors of Scudder, Stevens & Clark and Scudder Kemper Investments. |
William S. Stavropoulos (1939) |
Year of Election or Appointment: 2001 Trustee Vice Chairman of the Independent Trustees |
| Mr. Stavropoulos also serves as Trustee of other Fidelity funds. Mr. Stavropoulos serves as President and Founder of the Michigan Baseball Foundation, the Great Lakes Loons (2007-present). Mr. Stavropoulos is Chairman Emeritus of the Board of Directors of The Dow Chemical Company, where he previously served in numerous senior management positions, including President, CEO (1995-2000; 2002-2004), Chairman of the Executive Committee (2000-2006), and as a member of the Board of Directors (1990-2006). Currently, Mr. Stavropoulos is Chairman of the Board of Directors of Univar Inc. (global distributor of commodity and specialty chemicals), a Director of Teradata Corporation (data warehousing and technology solutions), and Maersk Inc. (industrial conglomerate), and a member of the Advisory Board for Metalmark Capital LLC (private equity investment, 2005-present). Mr. Stavropoulos is an operating advisor to Clayton, Dubilier & Rice, LLC (private equity investment). In addition, Mr. Stavropoulos is a member of the University of Notre Dame Advisory Council for the College of Science, a Trustee of the Rollin L. Gerstacker Foundation, and a Director of the Naples Philharmonic Center for the Arts. Previously, Mr. Stavropoulos served as a Director of Chemical Financial Corporation (bank holding company, 1993-2012) and Tyco International, Ltd. (multinational manufacturing and services, 2007-2012). |
David M. Thomas (1949) |
Year of Election or Appointment: 2008 Trustee |
| Mr. Thomas also serves as Trustee of other Fidelity funds. Mr. Thomas serves as Non-Executive Chairman of the Board of Directors of Fortune Brands Home and Security (home and security products, 2011-present), and as a member of the Board of Directors of Interpublic Group of Companies, Inc. (marketing communication, 2004-present). Previously, Mr. Thomas served as Executive Chairman (2005-2006) and Chairman and Chief Executive Officer (2000-2005) of IMS Health, Inc. (pharmaceutical and healthcare information solutions), and a Director of Fortune Brands, Inc. (consumer products, 2000-2011). |
+ The information above includes each Trustee's principal occupation during the last five years and other information relating to the experience, attributes, and skills relevant to each Trustee's qualifications to serve as a Trustee, which led to the conclusion that each Trustee should serve as a Trustee for each fund.
Advisory Board Member and Officers:
Correspondence intended for each officer and Peter S. Lynch may be sent to Fidelity Investments, 245 Summer Street, Boston, Massachusetts 02210. Officers appear below in alphabetical order.
Name, Year of Birth; Principal Occupation |
Peter S. Lynch (1944) |
Year of Election or Appointment: 2003 Member of the Advisory Board |
| Mr. Lynch also serves as Member of the Advisory Board of other Fidelity funds. Mr. Lynch is Vice Chairman and a Director of FMR and FMR Co., Inc. In addition, Mr. Lynch serves as a Trustee of Boston College and as the Chairman of the Inner-City Scholarship Fund. Previously, Mr. Lynch served on the Special Olympics International Board of Directors (1997-2006). |
Elizabeth Paige Baumann (1968) |
Year of Election or Appointment: 2012 Anti-Money Laundering (AML) Officer |
| Ms. Baumann also serves as AML Officer of other funds. She is Chief AML Officer of FMR LLC (2012-present) and is an employee of Fidelity Investments. Previously, Ms. Baumann served as Vice President and Deputy Anti-Money Laundering Officer (2007-2012). |
William C. Coffey (1969) |
Year of Election or Appointment: 2009 Assistant Secretary |
| Mr. Coffey also serves as Assistant Secretary of other funds. He is Senior Vice President and Deputy General Counsel of FMR LLC (2010-present), and is an employee of Fidelity Investments. Previously, Mr. Coffey served as Vice President and Associate General Counsel of FMR LLC (2005-2009). |
Jonathan Davis (1968) |
Year of Election or Appointment: 2010 Assistant Treasurer |
| Mr. Davis also serves as Assistant Treasurer of other funds. Mr. Davis is an employee of Fidelity Investments. Previously, Mr. Davis served as Vice President and Associate General Counsel of FMR LLC (2003-2010). |
Adrien E. Deberghes (1967) |
Year of Election or Appointment: 2008 Deputy Treasurer |
| Mr. Deberghes also serves as an officer of other funds. He is an employee of Fidelity Investments (2008-present). Prior to joining Fidelity Investments, Mr. Deberghes was Senior Vice President of Mutual Fund Administration at State Street Corporation (2007-2008), Senior Director of Mutual Fund Administration at Investors Bank & Trust (2005-2007), and Director of Finance for Dunkin' Brands (2000-2005). |
Stephanie J. Dorsey (1969) |
Year of Election or Appointment: 2010 Assistant Treasurer |
| Ms. Dorsey also serves as an officer of other funds. She is an employee of Fidelity Investments (2008-present) and has served in other fund officer roles. Prior to joining Fidelity Investments, Ms. Dorsey served as Treasurer (2004-2008) of the JPMorgan Mutual Funds and Vice President (2004-2008) of JPMorgan Chase Bank. |
Howard J. Galligan III (1966) |
Year of Election or Appointment: 2014 Chief Financial Officer |
| Mr. Galligan also serves as Chief Financial Officer of other funds. Mr. Galligan serves as President of Fidelity Pricing and Cash Management Services (FPCMS) (2014-present) and as a Director of Strategic Advisers, Inc. (2008-present). Previously, Mr. Galligan served as Chief Administrative Officer of Asset Management (2011-2014) and Chief Operating Officer and Senior Vice President of Investment Support for Strategic Advisers, Inc. (2003-2011). |
Scott C. Goebel (1968) |
Year of Election or Appointment: 2008 Secretary and Chief Legal Officer (CLO) |
| Mr. Goebel serves as Secretary and CLO of other funds. Mr. Goebel also serves as Secretary of Fidelity SelectCo, LLC (2013-present), Fidelity Investments Money Management, Inc. (FIMM) (2010-present) and Fidelity Research and Analysis Company (FRAC) (2010-present); General Counsel, Secretary, and Senior Vice President of FMR (2008-present) and FMR Co., Inc. (2008-present); Chief Legal Officer of Fidelity Management & Research (Hong Kong) Limited (2008-present); and Assistant Secretary of Fidelity Management & Research (Japan) Inc. (2008-present) and Fidelity Management & Research (U.K.) Inc. (2008-present). Previously, Mr. Goebel served as Secretary and CLO of other Fidelity funds (2008-2013), Assistant Secretary of FIMM (2008-2010), FRAC (2008-2010), and certain funds (2007-2008); and as Vice President and Secretary of Fidelity Distributors Corporation (FDC) (2005-2007). Mr. Goebel has been employed by FMR LLC or an affiliate since 2001. |
Brian B. Hogan (1964) |
Year of Election or Appointment: 2009 Vice President |
| Mr. Hogan also serves as Trustee or Vice President of other funds. Mr. Hogan serves as President of FMR's Equity Division (2009-present). Previously, Mr. Hogan served as Senior Vice President, Equity Research of FMR (2006-2009) and as a portfolio manager. |
Chris Maher (1972) |
Year of Election or Appointment: 2013 Assistant Treasurer |
| Mr. Maher serves as Assistant Treasurer of other funds. Mr. Maher is Vice President of Valuation Oversight and is an employee of Fidelity Investments. Previously, Mr. Maher served as Vice President of Asset Management Compliance (2013), Vice President of FMR's Program Management Group (2010-2013), and Vice President of Valuation Oversight (2008-2010). |
Melissa M. Reilly (1971) |
Year of Election or Appointment: 2014 Vice President of certain Equity Funds |
| Ms. Reilly also serves as Vice President of other funds. Ms. Reilly is an employee of Fidelity Investments (2004-present). |
Kenneth B. Robins (1969) |
Year of Election or Appointment: 2008 President and Treasurer |
| Mr. Robins also serves as an officer of other funds. Mr. Robins serves as Executive Vice President of Fidelity Investments Money Management, Inc. (FIMM) (2013-present) and is an employee of Fidelity Investments (2004-present). Previously, Mr. Robins served in other fund officer roles. |
Stephen Sadoski (1971) |
Year of Election or Appointment: 2012 Deputy Treasurer |
| Mr. Sadoski also serves as Deputy Treasurer of other funds. He is an employee of Fidelity Investments (2012-present) and has served in another fund officer role. Prior to joining Fidelity Investments, Mr. Sadoski served as an assistant chief accountant in the Division of Investment Management of the Securities and Exchange Commission (SEC) (2009-2012) and as a senior manager at Deloitte & Touche LLP (1997-2009). |
Stacie M. Smith (1974) |
Year of Election or Appointment: 2013 Deputy Treasurer |
| Ms. Smith also serves as an officer of other funds. She is an employee of Fidelity Investments (2009-present) and has served in other fund officer roles. Prior to joining Fidelity Investments, Ms. Smith served as Senior Audit Manager of Ernst & Young LLP (1996-2009). |
Renee Stagnone (1975) |
Year of Election or Appointment: 2013 Deputy Treasurer |
| Ms. Stagnone also serves as Deputy Treasurer of other funds. Ms. Stagnone is an employee of Fidelity Investments. |
Linda J. Wondrack (1964) |
Year of Election or Appointment: 2014 Chief Compliance Officer |
| Ms. Wondrack also serves as Chief Compliance Officer of other funds. Ms. Wondrack is Executive Vice President and head of the Ethics Office and Asset Management Compliance for Fidelity Investments (2012-present). Ms. Wondrack also serves as Chief Compliance Officer of Fidelity SelectCo, LLC (2014-present); Chief Compliance Officer of Impresa Management LLC (2013-present); and Chief Compliance Officer of FMR Co., Inc., Fidelity Investments Money Management, Inc., Fidelity Management & Research (Japan) Inc., Fidelity Management & Research (U.K.) Inc., Fidelity Management & Research (Hong Kong), Fidelity Management & Research Company, Pyramis Global Advisors, LLC, and Strategic Advisers, Inc., Ballyrock Investment Advisors LLC, and Northern Neck Investors LLC (2012-present). Previously, Ms. Wondrack served as Senior Vice President and Chief Compliance Officer for Columbia Management Investment Advisers, LLC (2005-2012); Chief Compliance Officer for certain funds within the Columbia Family of Funds (2007-2012); and Senior Vice President of Compliance Risk Management at Bank of America (2005-2010). |
Joseph F. Zambello (1957) |
Year of Election or Appointment: 2011 Deputy Treasurer |
| Mr. Zambello also serves as Deputy Treasurer of other funds. Mr. Zambello is an employee of Fidelity Investments. Previously, Mr. Zambello served as Vice President of FMR's Program Management Group (2009-2011) and Vice President of the Transfer Agent Oversight Group (2005-2009). |
Annual Report
The Board of Trustees of Fidelity Fund voted to pay to shareholders of record at the opening of business on record date, the following distributions per share derived from capital gains realized from sales of portfolio securities, and dividends derived from net investment income:
| Pay Date | Record Date | Dividends | Capital Gains |
Class K | 08/11/14 | 08/08/14 | $0.184 | $2.934 |
The fund hereby designates as a capital gain dividend with respect to the taxable year ended June 30, 2014, $426,561,852, or, if subsequently determined to be different, the net capital gain of such year.
Class K designates 98% and 66% of the dividends distributed in August and December, respectively during the fiscal year as qualifying for the dividends-received deduction for corporate shareholders.
Class K designates 99% and 74% of the dividends distributed in August and December, respectively during the fiscal year as amounts which may be taken into account as a dividend for purposes of the maximum rate under section 1(h)(11) of the Internal Revenue Code.
The fund will notify shareholders in January 2015 of amounts for use in preparing 2014 income tax returns.
Annual Report
Investment Adviser
Fidelity Management &
Research Company
Boston, MA
Investment Sub-Advisers
FMR Co., Inc.
Fidelity Management & Research
(U.K.) Inc.
Fidelity Management & Research
(Hong Kong) Limited
Fidelity Management & Research
(Japan) Inc.
General Distributor
Fidelity Distributors Corporation
Smithfield, RI
Transfer and Service Agents
Fidelity Investments Institutional
Operations Company, Inc.
Boston, MA
Fidelity Service Company, Inc.
Boston, MA
Custodian
The Northern Trust Company
Chicago, IL
(Fidelity Investment logo)(registered trademark)
Corporate Headquarters
245 Summer St., Boston, MA 02210
www.fidelity.com
FID-K-UANN-0814
1.863249.105
Fidelity Fifty®
Annual Report
June 30, 2014
(Fidelity Cover Art)
Contents
Performance | (Click Here) | How the fund has done over time. |
Management's Discussion of Fund Performance | (Click Here) | The Portfolio Manager's review of fund performance and strategy. |
Shareholder Expense Example | (Click Here) | An example of shareholder expenses. |
Investment Changes | (Click Here) | A summary of major shifts in the fund's investments over the past six months. |
Investments | (Click Here) | A complete list of the fund's investments with their market values. |
Financial Statements | (Click Here) | Statements of assets and liabilities, operations, and changes in net assets, as well as financial highlights. |
Notes | (Click Here) | Notes to the financial statements. |
Report of Independent Registered Public Accounting Firm | (Click Here) | |
Trustees and Officers | (Click Here) | |
To view a fund's proxy voting guidelines and proxy voting record for the 12-month period ended June 30, visit http://www.fidelity.com/proxyvotingresults or visit the Securities and Exchange Commission's (SEC) web site at http://www.sec.gov. You may also call 1-800-544-8544 to request a free copy of the proxy voting guidelines.
Standard & Poor's, S&P and S&P 500 are registered service marks of The McGraw-Hill Companies, Inc. and have been licensed for use by Fidelity Distributors Corporation.
Other third-party marks appearing herein are the property of their respective owners.
All other marks appearing herein are registered or unregistered trademarks or service marks of FMR LLC or an affiliated company. © 2014 FMR LLC. All rights reserved.
Annual Report
This report and the financial statements contained herein are submitted for the general information of the shareholders of the fund. This report is not authorized for distribution to prospective investors in the fund unless preceded or accompanied by an effective prospectus.
A fund files its complete schedule of portfolio holdings with the SEC for the first and third quarters of each fiscal year on Form N-Q. Forms N-Q are available on the SEC's web site at http://www.sec.gov. A fund's Forms N-Q may be reviewed and copied at the SEC's Public Reference Room in Washington, DC. Information regarding the operation of the SEC's Public Reference Room may be obtained by calling 1-800-SEC-0330. For a complete list of a fund's portfolio holdings, view the most recent holdings listing, semiannual report, or annual report on Fidelity's web site at http://www.fidelity.com, http://www.advisor.fidelity.com, or http://www.401k.com, as applicable.
NOT FDIC INSURED • MAY LOSE VALUE • NO BANK GUARANTEE
Neither the fund nor Fidelity Distributors Corporation is a bank.
Annual Report
Average annual total return reflects the change in the value of an investment, assuming reinvestment of the fund's distributions from dividend income and capital gains (the profits earned upon the sale of securities that have grown in value, if any) and assuming a constant rate of performance each year. The $10,000 table and the fund's returns do not reflect the deduction of taxes that a shareholder would pay on fund distributions or the redemption of fund shares. During periods of reimbursement by Fidelity, a fund's total return will be greater than it would be had the reimbursement not occurred. How a fund did yesterday is no guarantee of how it will do tomorrow.
Average Annual Total Returns
Periods ended June 30, 2014 | Past 1
year | Past 5
years | Past 10
years |
Fidelity Fifty® | 27.96% | 18.88% | 7.33% |
$10,000 Over 10 Years
Let's say hypothetically that $10,000 was invested in Fidelity Fifty® on June 30, 2004. The chart shows how the value of your investment would have changed, and also shows how the S&P 500® Index performed over the same period.
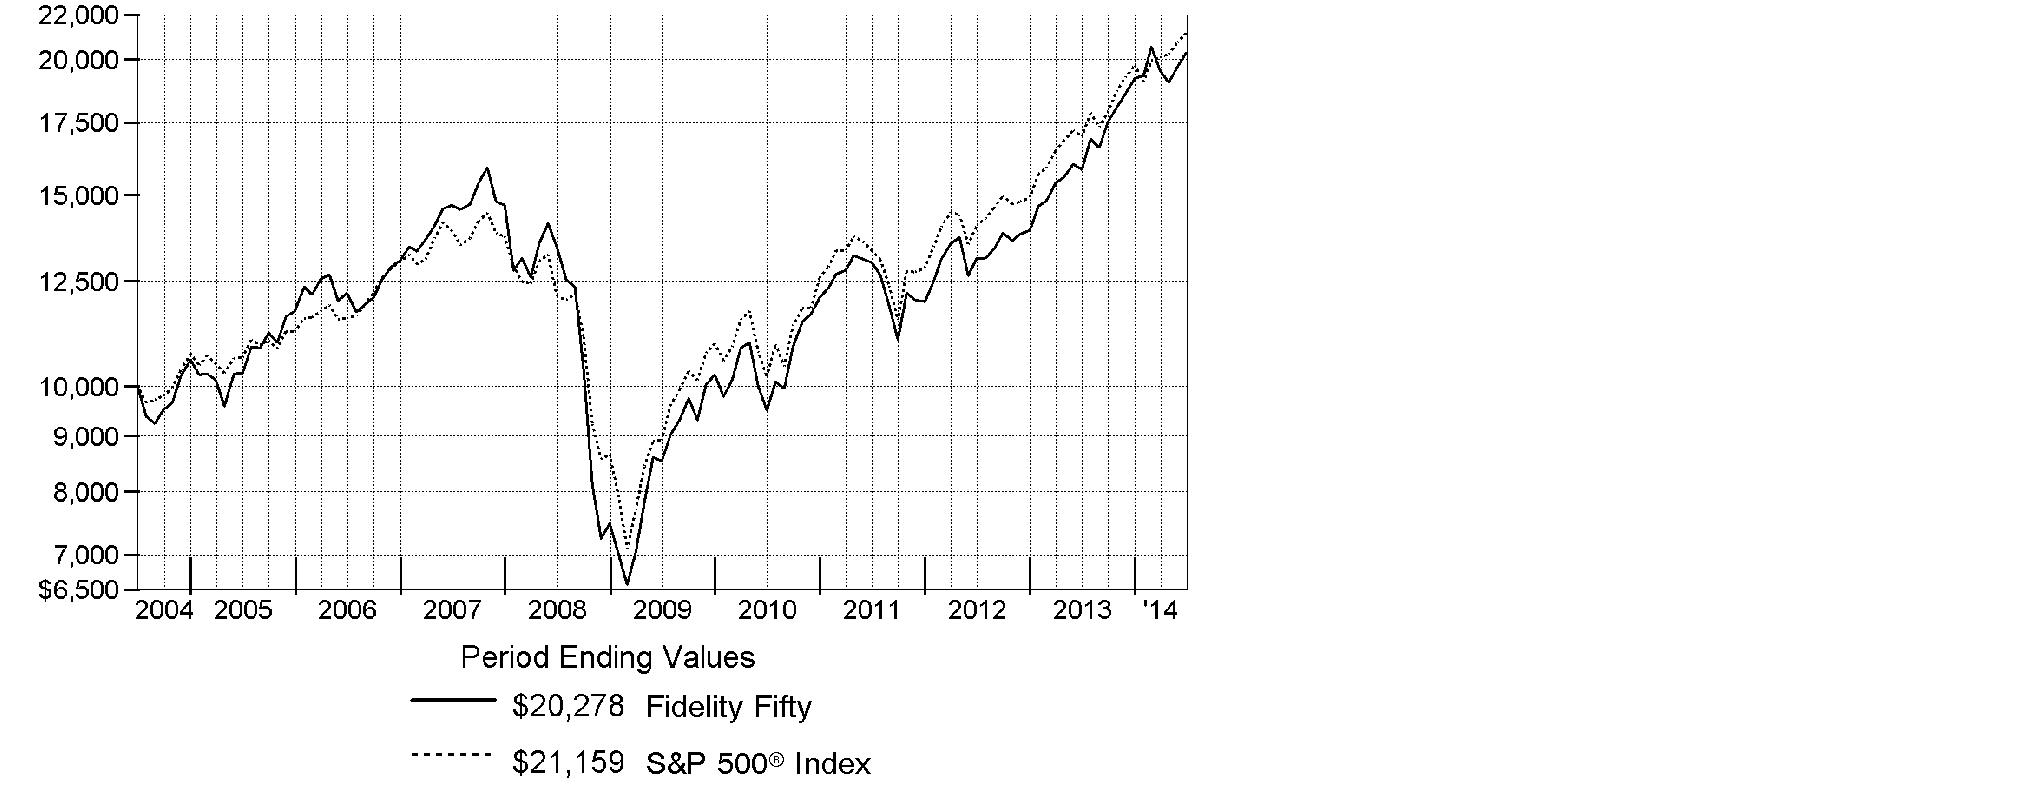
Annual Report
Market Recap: Despite a rough patch early in 2014, stocks posted a series of highs in a risk-taking environment. The S&P 500® Index returned 24.61% for the 12 months ending June 30, 2014, helped by a rise in consumer spending and the lowest unemployment rate since 2008. The U.S. Federal Reserve balanced stimulus reductions with continued low interest rates, aiding a broad advance: All 10 S&P 500® market sectors gained, seven by more than 20%. Materials (+33%) was tops, as investors seemed to anticipate continued economic improvement and renewed infrastructure build-outs. Information technology (+32%) benefited from large cash balances, rising dividends and stock buybacks, and innovative new products. Health care (+30%) was aided by new drugs and predictable reimbursements. Conversely, biggest laggard telecommunication services (+5%) battled slow growth and stiff pricing competition. Volatility remained low for much of the period, despite some spikes on geopolitical concerns over Russia and China. Examining stock returns across size and style segments: overall, investors showed some preference for large-cap stocks over small-caps and growth-oriented stocks over value. Lastly and for reference, the blue-chip Dow Jones Industrial AverageSM lagged the S&P 500® with a 15.56% return, while the growth-oriented Nasdaq Composite Index® advanced 31.17%.
Comments from Stephen DuFour, Portfolio Manager of Fidelity Fifty®: For the year, the fund returned 27.96%, outpacing the S&P 500®. The fund benefited from strong security selection in the health care, financials, information technology and industrials sectors. Top individual contributors included Illumina, which makes gene-sequencing tools, and Onyx Pharmaceuticals, a cancer drug company. Illumina's share price rose from about $75 to $179 during the period, buoyed by the company's leadership in the fast-growing gene-sequencing market. Onyx benefited from receiving a buyout offer at a premium price, and was no longer held at period end. In industrials, airline operator American Airlines Group saw its stock rise on improved industry pricing and faster-than-expected cost savings synergies from its merger with US Airways Group. None of these stocks was in the index. The fund lost ground in energy, mostly from a sizable overweighting in exploration-and-production company Cabot Oil & Gas. Its stock was pressured as pipeline capacity lagged production capacity in the Marcellus Shale. Not owning consumer technology leader and index component Apple also hurt results, as strong iPhone® sales, better-than-expected earnings and a huge stock buyback drove the stock sharply higher.
The views expressed above reflect those of the portfolio manager(s) only through the end of the period as stated on the cover of this report and do not necessarily represent the views of Fidelity or any other person in the Fidelity organization. Any such views are subject to change at any time based upon market or other conditions and Fidelity disclaims any responsibility to update such views. These views may not be relied on as investment advice and, because investment decisions for a Fidelity fund are based on numerous factors, may not be relied on as an indication of trading intent on behalf of any Fidelity fund.
Annual Report
Shareholder Expense Example
As a shareholder of the Fund, you incur two types of costs: (1) transaction costs, and (2) ongoing costs, including management fees and other Fund expenses. This Example is intended to help you understand your ongoing costs (in dollars) of investing in the Fund and to compare these costs with the ongoing costs of investing in other mutual funds.
The Example is based on an investment of $1,000 invested at the beginning of the period and held for the entire period (January 1, 2014 to June 30, 2014).
Actual Expenses
The first line of the accompanying table provides information about actual account values and actual expenses. You may use the information in this line, together with the amount you invested, to estimate the expenses that you paid over the period. Simply divide your account value by $1,000.00 (for example, an $8,600 account value divided by $1,000.00 = 8.6), then multiply the result by the number in the first line under the heading entitled "Expenses Paid During Period" to estimate the expenses you paid on your account during this period. A small balance maintenance fee of $12.00 that is charged once a year may apply for certain accounts with a value of less than $2,000. This fee is not included in the table below. If it was, the estimate of expenses you paid during the period would be higher, and your ending account value lower, by this amount. In addition, the Fund, as a shareholder in the underlying Fidelity Central Funds, will indirectly bear its pro-rata share of the fees and expenses incurred by the underlying Fidelity Central Funds. These fees and expenses are not included in the Fund's annualized expense ratio used to calculate the expense estimate in the table below.
Hypothetical Example for Comparison Purposes
The second line of the accompanying table provides information about hypothetical account values and hypothetical expenses based on the Fund's actual expense ratio and an assumed rate of return of 5% per year before expenses, which is not the Fund's actual return. The hypothetical account values and expenses may not be used to estimate the actual ending account balance or expenses you paid for the period. You may use this information to compare the ongoing costs of investing in the Fund and other funds. To do so, compare this 5% hypothetical example with the 5% hypothetical examples that appear in the shareholder reports of the other funds. A small balance maintenance fee of $12.00 that is charged once a year may apply for certain accounts with a value of less than $2,000. This fee is not included in the table below. If it was, the estimate of expenses you paid during the period would be higher, and your ending account value lower, by this amount. In addition, the Fund, as a shareholder in the underlying Fidelity Central Funds, will indirectly bear its pro-rata share of the fees and expenses incurred by the underlying Fidelity Central Funds. These fees and expenses are not included in the Fund's annualized expense ratio used to calculate the expense estimate in the table below.
Please note that the expenses shown in the table are meant to highlight your ongoing costs only and do not reflect any transaction costs. Therefore, the second line of the table is useful in comparing ongoing costs only, and will not help you determine the relative total costs of owning different funds.
Annual Report
Shareholder Expense Example - continued
| Annualized
Expense RatioB | Beginning
Account Value
January 1, 2014 | Ending
Account Value
June 30, 2014 | Expenses Paid
During Period*
January 1, 2014
to June 30, 2014 |
Actual | .84% | $ 1,000.00 | $ 1,056.00 | $ 4.28 |
HypotheticalA | | $ 1,000.00 | $ 1,020.63 | $ 4.21 |
A 5% return per year before expenses
B Annualized expense ratio reflects expenses net of applicable fee waivers.
* Expenses are equal to the Fund's annualized expense ratio, multiplied by the average account value over the period, multiplied by 181/365 (to reflect the one-half year period).
Annual Report
Investment Changes (Unaudited)
Top Ten Stocks as of June 30, 2014 |
| % of fund's
net assets | % of fund's net assets
6 months ago |
Adobe Systems, Inc. | 5.4 | 3.1 |
Ameriprise Financial, Inc. | 5.1 | 3.3 |
McGraw Hill Financial, Inc. | 4.9 | 5.1 |
Cummins, Inc. | 4.9 | 4.8 |
American Airlines Group, Inc. | 4.8 | 0.3 |
Google, Inc. Class A | 4.5 | 4.9 |
Cabot Oil & Gas Corp. | 4.1 | 5.3 |
Halliburton Co. | 3.2 | 0.0 |
Range Resources Corp. | 3.1 | 0.0 |
Noble Energy, Inc. | 3.0 | 2.8 |
| 43.0 | |
Top Five Market Sectors as of June 30, 2014 |
| % of fund's
net assets | % of fund's net assets
6 months ago |
Information Technology | 24.2 | 27.0 |
Energy | 19.0 | 12.8 |
Industrials | 16.0 | 13.3 |
Financials | 13.0 | 16.4 |
Health Care | 11.8 | 15.1 |
Asset Allocation (% of fund's net assets) |
As of June 30, 2014* | As of December 31, 2013** |
| Stocks 99.5% | | | Stocks 99.7% | |
| Short-Term
Investments and
Net Other Assets
(Liabilities) 0.5% | | | Short-Term
Investments and
Net Other Assets
(Liabilities) 0.3% | |
* Foreign investments | 5.1% | | ** Foreign investments | 4.2% | |

Annual Report
Investments June 30, 2014
Showing Percentage of Net Assets
Common Stocks - 99.5% |
| Shares | | Value |
CONSUMER DISCRETIONARY - 7.6% |
Hotels, Restaurants & Leisure - 2.2% |
Marriott International, Inc. Class A | 268,000 | | $ 17,178,800 |
Media - 2.9% |
Comcast Corp. Class A | 304,000 | | 16,318,720 |
The Walt Disney Co. | 76,000 | | 6,516,240 |
| | 22,834,960 |
Specialty Retail - 2.5% |
AutoZone, Inc. (a) | 37,200 | | 19,948,128 |
TOTAL CONSUMER DISCRETIONARY | | 59,961,888 |
CONSUMER STAPLES - 3.4% |
Food & Staples Retailing - 2.4% |
CVS Caremark Corp. | 254,000 | | 19,143,980 |
Personal Products - 1.0% |
Estee Lauder Companies, Inc. Class A | 106,000 | | 7,871,560 |
TOTAL CONSUMER STAPLES | | 27,015,540 |
ENERGY - 19.0% |
Energy Equipment & Services - 3.2% |
Halliburton Co. | 357,000 | | 25,350,570 |
Oil, Gas & Consumable Fuels - 15.8% |
Cabot Oil & Gas Corp. | 956,000 | | 32,637,840 |
Devon Energy Corp. | 133,000 | | 10,560,200 |
EOG Resources, Inc. | 90,000 | | 10,517,400 |
Newfield Exploration Co. (a) | 307,000 | | 13,569,400 |
Noble Energy, Inc. | 311,798 | | 24,151,873 |
Pioneer Natural Resources Co. | 44,500 | | 10,226,545 |
Range Resources Corp. | 278,000 | | 24,172,100 |
| | 125,835,358 |
TOTAL ENERGY | | 151,185,928 |
FINANCIALS - 13.0% |
Banks - 1.7% |
Wells Fargo & Co. | 259,000 | | 13,613,040 |
Capital Markets - 5.1% |
Ameriprise Financial, Inc. | 336,200 | | 40,344,000 |
Consumer Finance - 0.5% |
American Express Co. | 39,000 | | 3,699,930 |
Common Stocks - continued |
| Shares | | Value |
FINANCIALS - continued |
Diversified Financial Services - 5.7% |
McGraw Hill Financial, Inc. | 472,000 | | $ 39,190,160 |
Moody's Corp. | 72,000 | | 6,311,520 |
| | 45,501,680 |
TOTAL FINANCIALS | | 103,158,650 |
HEALTH CARE - 11.8% |
Biotechnology - 2.8% |
Biogen Idec, Inc. (a) | 45,000 | | 14,188,950 |
Intercept Pharmaceuticals, Inc. (a) | 34,477 | | 8,158,293 |
| | 22,347,243 |
Health Care Equipment & Supplies - 1.7% |
Covidien PLC | 109,000 | | 9,829,620 |
The Cooper Companies, Inc. | 27,327 | | 3,703,628 |
| | 13,533,248 |
Life Sciences Tools & Services - 3.4% |
Illumina, Inc. (a) | 31,700 | | 5,659,718 |
Thermo Fisher Scientific, Inc. | 183,000 | | 21,594,000 |
| | 27,253,718 |
Pharmaceuticals - 3.9% |
Actavis PLC (a) | 40,720 | | 9,082,596 |
Johnson & Johnson | 135,000 | | 14,123,700 |
Prestige Brands Holdings, Inc. (a) | 221,000 | | 7,489,690 |
| | 30,695,986 |
TOTAL HEALTH CARE | | 93,830,195 |
INDUSTRIALS - 16.0% |
Airlines - 5.2% |
American Airlines Group, Inc. | 880,000 | | 37,804,800 |
Spirit Airlines, Inc. (a) | 56,107 | | 3,548,207 |
| | 41,353,007 |
Machinery - 4.9% |
Cummins, Inc. | 251,200 | | 38,757,648 |
Road & Rail - 5.0% |
Norfolk Southern Corp. | 194,100 | | 19,998,123 |
Union Pacific Corp. | 197,000 | | 19,650,750 |
| | 39,648,873 |
Common Stocks - continued |
| Shares | | Value |
INDUSTRIALS - continued |
Trading Companies & Distributors - 0.9% |
AerCap Holdings NV (a) | 158,000 | | $ 7,236,400 |
TOTAL INDUSTRIALS | | 126,995,928 |
INFORMATION TECHNOLOGY - 24.2% |
Electronic Equipment & Components - 3.7% |
TE Connectivity Ltd. | 239,000 | | 14,779,760 |
Zebra Technologies Corp. Class A (a) | 182,000 | | 14,982,240 |
| | 29,762,000 |
Internet Software & Services - 6.1% |
Facebook, Inc. Class A (a) | 185,300 | | 12,468,837 |
Google, Inc. Class A (a) | 61,200 | | 35,781,804 |
| | 48,250,641 |
IT Services - 2.4% |
Fidelity National Information Services, Inc. | 263,000 | | 14,396,620 |
MasterCard, Inc. Class A | 63,000 | | 4,628,610 |
| | 19,025,230 |
Semiconductors & Semiconductor Equipment - 2.0% |
Applied Materials, Inc. | 345,000 | | 7,779,750 |
Micron Technology, Inc. (a) | 253,000 | | 8,336,350 |
| | 16,116,100 |
Software - 10.0% |
Adobe Systems, Inc. (a) | 595,025 | | 43,056,008 |
Microsoft Corp. | 500,000 | | 20,850,000 |
Oracle Corp. | 159,000 | | 6,444,270 |
salesforce.com, Inc. (a) | 152,700 | | 8,868,816 |
| | 79,219,094 |
TOTAL INFORMATION TECHNOLOGY | | 192,373,065 |
MATERIALS - 0.5% |
Chemicals - 0.5% |
Monsanto Co. | 30,000 | | 3,742,200 |
UTILITIES - 4.0% |
Independent Power and Renewable Electricity Producers - 0.1% |
NextEra Energy Partners LP | 12,000 | | 402,120 |
Common Stocks - continued |
| Shares | | Value |
UTILITIES - continued |
Independent Power Producers & Energy Traders - 1.5% |
Dynegy, Inc. (a) | 136,884 | | $ 4,763,563 |
NRG Energy, Inc. | 193,000 | | 7,179,600 |
| | 11,943,163 |
Multi-Utilities - 2.4% |
Sempra Energy | 183,000 | | 19,161,930 |
TOTAL UTILITIES | | 31,507,213 |
TOTAL COMMON STOCKS (Cost $717,108,646) |
789,770,607
|
Money Market Funds - 0.3% |
| | | |
Fidelity Cash Central Fund, 0.11% (b)
(Cost $2,551,460) | 2,551,460 | |
2,551,460
|
TOTAL INVESTMENT PORTFOLIO - 99.8% (Cost $719,660,106) | 792,322,067 |
NET OTHER ASSETS (LIABILITIES) - 0.2% | | 1,524,449 |
NET ASSETS - 100% | $ 793,846,516 |
Legend |
(a) Non-income producing |
(b) Affiliated fund that is generally available only to investment companies and other accounts managed by Fidelity Investments. The rate quoted is the annualized seven-day yield of the fund at period end. A complete unaudited listing of the fund's holdings as of its most recent quarter end is available upon request. In addition, each Fidelity Central Fund's financial statements, which are not covered by the Fund's Report of Independent Registered Public Accounting Firm, are available on the SEC's website or upon request. |
Affiliated Central Funds |
Information regarding fiscal year to date income earned by the Fund from investments in Fidelity Central Funds is as follows: |
Fund | Income earned |
Fidelity Cash Central Fund | $ 7,983 |
Fidelity Securities Lending Cash Central Fund | 21,476 |
Total | $ 29,459 |
Other Information |
All investments are categorized as Level 1 under the Fair Value Hierarchy. The inputs or methodology used for valuing securities may not be an indication of the risk associated with investing in those securities. For more information on valuation inputs, please refer to the Investment Valuation section in the accompanying Notes to Financial Statements. |
See accompanying notes which are an integral part of the financial statements.
Annual Report
Statement of Assets and Liabilities
| June 30, 2014 |
| | |
Assets | | |
Investment in securities, at value - See accompanying schedule: Unaffiliated issuers (cost $717,108,646) | $ 789,770,607 | |
Fidelity Central Funds (cost $2,551,460) | 2,551,460 | |
Total Investments (cost $719,660,106) | | $ 792,322,067 |
Receivable for investments sold | | 5,923,975 |
Receivable for fund shares sold | | 219,373 |
Dividends receivable | | 368,700 |
Distributions receivable from Fidelity Central Funds | | 264 |
Receivable from investment adviser for expense reductions | | 568 |
Other receivables | | 7,797 |
Total assets | | 798,842,744 |
| | |
Liabilities | | |
Payable to custodian bank | $ 6,480 | |
Payable for investments purchased | 4,101,735 | |
Payable for fund shares redeemed | 353,281 | |
Accrued management fee | 332,947 | |
Other affiliated payables | 145,071 | |
Other payables and accrued expenses | 56,714 | |
Total liabilities | | 4,996,228 |
| | |
Net Assets | | $ 793,846,516 |
Net Assets consist of: | | |
Paid in capital | | $ 753,635,813 |
Distributions in excess of net investment income | | (760,067) |
Accumulated undistributed net realized gain (loss) on investments and foreign currency transactions | | (31,690,440) |
Net unrealized appreciation (depreciation) on investments and assets and liabilities in foreign currencies | | 72,661,210 |
Net Assets, for 26,976,826 shares outstanding | | $ 793,846,516 |
Net Asset Value, offering price and redemption price per share ($793,846,516 ÷ 26,976,826 shares) | | $ 29.43 |
See accompanying notes which are an integral part of the financial statements.
Annual Report
Statement of Operations
| Year ended June 30, 2014 |
| | |
Investment Income | | |
Dividends | | $ 5,006,284 |
Interest | | 4 |
Income from Fidelity Central Funds | | 29,459 |
Total income | | 5,035,747 |
| | |
Expenses | | |
Management fee
Basic fee | $ 4,150,988 | |
Performance adjustment | 233,775 | |
Transfer agent fees | 1,464,010 | |
Accounting and security lending fees | 266,426 | |
Custodian fees and expenses | 58,255 | |
Independent trustees' compensation | 3,259 | |
Registration fees | 36,997 | |
Audit | 46,698 | |
Legal | 4,239 | |
Miscellaneous | 6,412 | |
Total expenses before reductions | 6,271,059 | |
Expense reductions | (29,280) | 6,241,779 |
Net investment income (loss) | | (1,206,032) |
Realized and Unrealized Gain (Loss) Net realized gain (loss) on: | | |
Investment securities: | | |
Unaffiliated issuers | 171,815,865 | |
Foreign currency transactions | 6,340 | |
Total net realized gain (loss) | | 171,822,205 |
Change in net unrealized appreciation (depreciation) on: Investment securities | 9,994,553 | |
Assets and liabilities in foreign currencies | 683 | |
Total change in net unrealized appreciation (depreciation) | | 9,995,236 |
Net gain (loss) | | 181,817,441 |
Net increase (decrease) in net assets resulting from operations | | $ 180,611,409 |
See accompanying notes which are an integral part of the financial statements.
Annual Report
Financial Statements - continued
Statement of Changes in Net Assets
| Year ended
June 30,
2014 | Year ended
June 30,
2013 |
Increase (Decrease) in Net Assets | | |
Operations | | |
Net investment income (loss) | $ (1,206,032) | $ 1,374,363 |
Net realized gain (loss) | 171,822,205 | 113,784,552 |
Change in net unrealized appreciation (depreciation) | 9,995,236 | 12,277,520 |
Net increase (decrease) in net assets resulting
from operations | 180,611,409 | 127,436,435 |
Distributions to shareholders from net investment income | - | (2,203,361) |
Share transactions
Proceeds from sales of shares | 57,920,748 | 44,588,976 |
Reinvestment of distributions | - | 2,146,958 |
Cost of shares redeemed | (111,976,261) | (176,512,715) |
Net increase (decrease) in net assets resulting from share transactions | (54,055,513) | (129,776,781) |
Total increase (decrease) in net assets | 126,555,896 | (4,543,707) |
| | |
Net Assets | | |
Beginning of period | 667,290,620 | 671,834,327 |
End of period (including distributions in excess of net investment income of $760,067 and distributions in excess of net investment income of $467,918, respectively) | $ 793,846,516 | $ 667,290,620 |
Other Information Shares | | |
Sold | 2,124,009 | 2,140,763 |
Issued in reinvestment of distributions | - | 108,835 |
Redeemed | (4,165,726) | (8,424,922) |
Net increase (decrease) | (2,041,717) | (6,175,324) |
See accompanying notes which are an integral part of the financial statements.
Annual Report
Financial Highlights
Years ended June 30, | 2014 | 2013 | 2012 | 2011 | 2010 |
Selected Per-Share Data | | | | | |
Net asset value, beginning of period | $ 23.00 | $ 19.09 | $ 18.97 | $ 13.95 | $ 12.59 |
Income from Investment Operations | | | | | |
Net investment income (loss) B | (.04) | .04 | .05 | .06 | .07 |
Net realized and unrealized gain (loss) | 6.47 | 3.94 | .12 | 5.05 | 1.35 |
Total from investment operations | 6.43 | 3.98 | .17 | 5.11 | 1.42 |
Distributions from net investment income | - | (.07) | (.05) | (.09) | (.05) |
Distributions from net realized gain | - | - | - | - | (.02) |
Total distributions | - | (.07) | (.05) | (.09) | (.06)F |
Net asset value, end of period | $ 29.43 | $ 23.00 | $ 19.09 | $ 18.97 | $ 13.95 |
Total ReturnA | 27.96% | 20.89% | .93% | 36.71% | 11.26% |
Ratios to Average Net AssetsC, E | | | | | |
Expenses before reductions | .83% | .83% | .94% | .71% | .73% |
Expenses net of fee waivers, if any | .83% | .83% | .94% | .71% | .73% |
Expenses net of all reductions | .83% | .80% | .92% | .69% | .69% |
Net investment income (loss) | (.16)% | .20% | .26% | .36% | .50% |
Supplemental Data | | | | | |
Net assets, end of period (000 omitted) | $ 793,847 | $ 667,291 | $ 671,834 | $ 825,367 | $ 646,032 |
Portfolio turnover rateD | 197% | 246% | 277% | 257% | 246% |
A Total returns would have been lower if certain expenses had not been reduced during the applicable periods shown.
B Calculated based on average shares outstanding during the period.
C Fees and expenses of any underlying Fidelity Central Funds are not included in the Fund's expense ratio. The Fund indirectly bears its proportionate share of the expenses of any underlying Fidelity Central Funds.
D Amount does not include the portfolio activity of any underlying Fidelity Central Funds.
E Expense ratios reflect operating expenses of the Fund. Expenses before reductions do not reflect amounts reimbursed by the investment adviser or reductions from brokerage service arrangements or reductions from other expense offset arrangements and do not represent the amount paid by the Fund during periods when reimbursements or reductions occur. Expenses net of fee waivers reflect expenses after reimbursement by the investment adviser but prior to reductions from brokerage service arrangements or other expense offset arrangements. Expenses net of all reductions represent the net expenses paid by the Fund.
F Total distributions of $.06 per share is comprised of distributions from net investment income of $.045 and distributions from net realized gain of $.015 per share.
See accompanying notes which are an integral part of the financial statements.
Annual Report
Notes to Financial Statements
For the period ended June 30, 2014
1. Organization.
Fidelity Fifty (the Fund) is a non-diversified fund of Fidelity Hastings Street Trust (the Trust) and is authorized to issue an unlimited number of shares. The Trust is registered under the Investment Company Act of 1940, as amended (the 1940 Act), as an open-end management investment company organized as a Massachusetts business trust. Effective after the close of business on October 12, 2012, the Fund was closed to new accounts with certain exceptions.
2. Investments in Fidelity Central Funds.
The Fund invests in Fidelity Central Funds, which are open-end investment companies generally available only to other investment companies and accounts managed by the investment adviser and its affiliates. The Fund's Schedule of Investments lists each of the Fidelity Central Funds held as of period end, if any, as an investment of the Fund, but does not include the underlying holdings of each Fidelity Central Fund. As an Investing Fund, the Fund indirectly bears its proportionate share of the expenses of the underlying Fidelity Central Funds.
The Money Market Central Funds seek preservation of capital and current income and are managed by Fidelity Investments Money Management, Inc. (FIMM), an affiliate of the investment adviser. Annualized expenses of the Money Market Central Funds as of their most recent shareholder report date are less than .01%.
A complete unaudited list of holdings for each Fidelity Central Fund is available upon request or at the Securities and Exchange Commission (the SEC) website at www.sec.gov. In addition, the financial statements of the Fidelity Central Funds, which are not covered by the Fund's Report of Independent Registered Public Accounting Firm, are available on the SEC website or upon request.
3. Significant Accounting Policies.
The financial statements have been prepared in conformity with accounting principles generally accepted in the United States of America (GAAP), which require management to make certain estimates and assumptions at the date of the financial statements. Actual results could differ from those estimates. Subsequent events, if any, through the date that the financial statements were issued have been evaluated in the preparation of the financial statements. The following summarizes the significant accounting policies of the Fund:
Investment Valuation. Investments are valued as of 4:00 p.m. Eastern time on the last calendar day of the period. In accordance with valuation policies and procedures approved by the Board of Trustees (the Board), the Fund attempts to obtain prices from one or more third party pricing vendors or brokers to value its investments. When
Annual Report
Notes to Financial Statements - continued
3. Significant Accounting Policies - continued
Investment Valuation - continued
current market prices, quotations or currency exchange rates are not readily available or reliable, investments will be fair valued in good faith by the Fidelity Management & Research Company (FMR) Fair Value Committee (the Committee), in accordance with procedures adopted by the Board. Factors used in determining fair value vary by investment type and may include market or investment specific events. The frequency with which these procedures are used cannot be predicted and they may be utilized to a significant extent. The Committee oversees the Fund's valuation policies and procedures and is responsible for approving and reporting to the Board all fair value determinations.
The Fund categorizes the inputs to valuation techniques used to value its investments into a disclosure hierarchy consisting of three levels as shown below:
Level 1 - quoted prices in active markets for identical investments
Level 2 - other significant observable inputs (including quoted prices for similar investments, interest rates, prepayment speeds, etc.)
Level 3 - unobservable inputs (including the Fund's own assumptions based on the best information available)
Valuation techniques used to value the Fund's investments by major category are as follows:
Equity securities, including restricted securities, for which market quotations are readily available, are valued at the last reported sale price or official closing price as reported by a third party pricing vendor on the primary market or exchange on which they are traded and are categorized as Level 1 in the hierarchy. In the event there were no sales during the day or closing prices are not available, securities are valued at the last quoted bid price or may be valued using the last available price and are generally categorized as Level 2 in the hierarchy. For foreign equity securities, when market or security specific events arise, comparisons to the valuation of American Depositary Receipts (ADRs), futures contracts, Exchange-Traded Funds (ETFs) and certain indexes as well as quoted prices for similar securities may be used and would be categorized as Level 2 in the hierarchy. Utilizing these techniques may result in transfers between Level 1 and Level 2. For equity securities, including restricted securities, where observable inputs are limited, assumptions about market activity and risk are used and these securities may be categorized as Level 3 in the hierarchy.
Investments in open-end mutual funds, including the Fidelity Central Funds, are valued at their closing net asset value (NAV) each business day and are categorized as Level 1 in the hierarchy.
Annual Report
3. Significant Accounting Policies - continued
Investment Valuation - continued
Changes in valuation techniques may result in transfers in or out of an assigned level within the disclosure hierarchy.
Foreign Currency. The Fund may use foreign currency contracts to facilitate transactions in foreign-denominated securities. Gains and losses from these transactions may arise from changes in the value of the foreign currency or if the counterparties do not perform under the contracts' terms.
Foreign-denominated assets, including investment securities, and liabilities are translated into U.S. dollars at the exchange rates at period end. Purchases and sales of investment securities, income and dividends received and expenses denominated in foreign currencies are translated into U.S. dollars at the exchange rate in effect on the transaction date.
The effects of exchange rate fluctuations on investments are included with the net realized and unrealized gain (loss) on investment securities. Other foreign currency transactions resulting in realized and unrealized gain (loss) are disclosed separately.
Investment Transactions and Income. For financial reporting purposes, the Fund's investment holdings and NAV include trades executed through the end of the last business day of the period. The NAV per share for processing shareholder transactions is calculated as of the close of business of the New York Stock Exchange (NYSE), normally 4:00 p.m. Eastern time and includes trades executed through the end of the prior business day. Gains and losses on securities sold are determined on the basis of identified cost and may include proceeds received from litigation. Dividend income is recorded on the ex-dividend date, except for certain dividends from foreign securities where the ex-dividend date may have passed, which are recorded as soon as the Fund is informed of the ex-dividend date. Non-cash dividends included in dividend income, if any, are recorded at the fair market value of the securities received. Income and capital gain distributions from Fidelity Central Funds, if any, are recorded on the ex-dividend date. Distributions received on securities that represent a return of capital or capital gain are recorded as a reduction of cost of investments and/or as a realized gain. Subsequent to ex-dividend date the Fund determines the components of these distributions, based upon receipt of tax filings or other correspondence relating to the underlying investment. Interest income is accrued as earned and includes coupon interest and amortization of premium and accretion of discount on debt securities as applicable. Investment income is recorded net of foreign taxes withheld where recovery of such taxes is uncertain.
Expenses. Expenses directly attributable to a fund are charged to that fund. Expenses attributable to more than one fund are allocated among the respective funds on the basis
Annual Report
Notes to Financial Statements - continued
3. Significant Accounting Policies - continued
Expenses - continued
of relative net assets or other appropriate methods. Expense estimates are accrued in the period to which they relate and adjustments are made when actual amounts are known.
Income Tax Information and Distributions to Shareholders. Each year, the Fund intends to qualify as a regulated investment company under Subchapter M of the Internal Revenue Code, including distributing substantially all of its taxable income and realized gains. As a result, no provision for U.S. Federal income taxes is required. As of June 30, 2014, the Fund did not have any unrecognized tax benefits in the financial statements; nor is the Fund aware of any tax positions for which it is reasonably possible that the total amounts of unrecognized tax benefits will significantly change in the next twelve months. The Fund files a U.S. federal tax return, in addition to state and local tax returns as required. The Fund's federal income tax returns are subject to examination by the Internal Revenue Service (IRS) for a period of three fiscal years after they are filed. State and local tax returns may be subject to examination for an additional fiscal year depending on the jurisdiction. Foreign taxes are provided for based on the Fund's understanding of the tax rules and rates that exist in the foreign markets in which it invests.
Distributions are declared and recorded on the ex-dividend date. Income and capital gain distributions are determined in accordance with income tax regulations, which may differ from GAAP.
Capital accounts within the financial statements are adjusted for permanent book-tax differences. These adjustments have no impact on net assets or the results of operations. Capital accounts are not adjusted for temporary book-tax differences which will reverse in a subsequent period.
Book-tax differences are primarily due to foreign currency transactions, partnerships, deferred trustees compensation, net operating losses, capital loss carryforwards and losses deferred due to wash sales and excise tax regulations.
The federal tax cost of investment securities and unrealized appreciation (depreciation) as of period end were as follows:
Gross unrealized appreciation | $ 76,748,633 |
Gross unrealized depreciation | (4,826,875) |
Net unrealized appreciation (depreciation) on securities and other investments | $ 71,921,758 |
| |
Tax Cost | $ 720,400,309 |
Annual Report
3. Significant Accounting Policies - continued
Income Tax Information and Distributions to Shareholders - continued
The tax-based components of distributable earnings as of period end were as follows:
Capital loss carryforward | $ (30,950,236) |
Net unrealized appreciation (depreciation) | $ 71,921,007 |
Capital loss carryforwards are only available to offset future capital gains of the Fund to the extent provided by regulations and may be limited. Under the Regulated Investment Company Modernization Act of 2010 (the Act), the Fund is permitted to carry forward capital losses incurred in taxable years beginning after December 22, 2010 for an unlimited period and such capital losses are required to be used prior to any losses that expire. The capital loss carryforward information presented below, including any applicable limitation, is estimated as of fiscal period end and is subject to adjustment.
Fiscal year of expiration | |
2017 | $ (30,950,236) |
The tax character of distributions paid was as follows:
| June 30, 2014 | June 30, 2013 |
Ordinary Income | $ - | $ 2,203,361 |
4. Purchases and Sales of Investments.
Purchases and sales of securities, other than short-term securities, aggregated $1,458,199,024 and $1,510,137,017, respectively.
5. Fees and Other Transactions with Affiliates.
Management Fee. Fidelity Management & Research Company (the investment adviser) and its affiliates provide the Fund with investment management related services for which the Fund pays a monthly management fee. The management fee is the sum of an individual fund fee rate that is based on an annual rate of .30% of the Fund's average net assets and an annualized group fee rate that averaged .25% during the period. The group fee rate is based upon the average net assets of all the mutual funds advised by the investment adviser, including any mutual funds previously advised by the investment adviser that are currently advised by Fidelity SelectCo, LLC, an affiliate of the investment adviser. The group fee rate decreases as assets under management increase and increases as assets under management decrease. In addition, the management fee is subject to a performance adjustment (up to a maximum of ± .20% of the Fund's average net assets over a 36 month performance period). The upward or downward adjustment to
Annual Report
Notes to Financial Statements - continued
5. Fees and Other Transactions with Affiliates - continued
Management Fee - continued
the management fee is based on the Fund's relative investment performance as compared to its benchmark index, the S&P 500 Index, over the same 36 month performance period. For the reporting period, the total annual management fee rate, including the performance adjustment, was ..58% of the Fund's average net assets. The performance adjustment included in the management fee rate may be higher or lower than the maximum performance adjustment rate due to the difference between the average net assets for the reporting and performance periods.
Transfer Agent Fees. Fidelity Investments Institutional Operations Company, Inc. (FIIOC), an affiliate of the investment adviser, is the Fund's transfer, dividend disbursing and shareholder servicing agent. FIIOC receives account fees and asset-based fees that vary according to account size and type of account. FIIOC pays for typesetting, printing and mailing of shareholder reports, except proxy statements. For the period, the transfer agent fees were equivalent to an annual rate of .19% of average net assets.
Accounting and Security Lending Fees. Fidelity Service Company, Inc. (FSC), an affiliate of the investment adviser, maintains the Fund's accounting records. The accounting fee is based on the level of average net assets for each month. Under a separate contract, FSC administers the security lending program. The security lending fee is based on the number and duration of lending transactions.
Brokerage Commissions. The Fund placed a portion of its portfolio transactions with brokerage firms which are affiliates of the investment adviser. Brokerage commissions are included in net realized gain (loss) and change in net unrealized appreciation (depreciation) in the Statement of Operations. The commissions paid to these affiliated firms were $28,343 for the period.
6. Committed Line of Credit.
The Fund participates with other funds managed by the investment adviser or an affiliate in a $4.25 billion credit facility (the "line of credit") to be utilized for temporary or emergency purposes to fund shareholder redemptions or for other short-term liquidity purposes. The Fund has agreed to pay commitment fees on its pro-rata portion of the line of credit, which amounted to $1,322 and is reflected in Miscellaneous expenses on the Statement of Operations. During the period, the Fund did not borrow on this line of credit.
7. Security Lending.
The Fund lends portfolio securities through a lending agent from time to time in order to earn additional income. For equity securities, a lending agent is used and may loan
Annual Report
7. Security Lending - continued
securities to certain qualified borrowers, including Fidelity Capital Markets (FCM), a broker-dealer affiliated with the Fund. On the settlement date of the loan, the Fund receives collateral (in the form of U.S. Treasury obligations, letters of credit and/or cash) against the loaned securities and maintains collateral in an amount not less than 100% of the market value of the loaned securities during the period of the loan. The market value of the loaned securities is determined at the close of business of the Fund and any additional required collateral is delivered to the Fund on the next business day. If the borrower defaults on its obligation to return the securities loaned because of insolvency or other reasons, the Fund may apply collateral received from the borrower against the obligation. The Fund may experience delays and costs in recovering the securities loaned. Any cash collateral received is invested in the Fidelity Securities Lending Cash Central Fund. At period end, there were no security loans outstanding. Security lending income represents the income earned on investing cash collateral, less rebates paid to borrowers and any lending agent fees associated with the loan, plus any premium payments received for lending certain types of securities. Security lending income is presented in the Statement of Operations as a component of income from Fidelity Central Funds. Total security lending income during the period amounted to $21,476, including $652 from securities loaned to FCM.
8. Expense Reductions.
Commissions paid to certain brokers with whom the investment adviser, or its affiliates, places trades on behalf of the Fund include an amount in addition to trade execution, which may be rebated back to the Fund to offset certain expenses. This amount totaled $18,274 for the period.
In addition, the investment adviser reimbursed a portion of the Fund's operating expenses during the period in the amount of $11,006.
9. Other.
The Fund's organizational documents provide former and current trustees and officers with a limited indemnification against liabilities arising in connection with the performance of their duties to the Fund. In the normal course of business, the Fund may also enter into contracts that provide general indemnifications. The Fund's maximum exposure under these arrangements is unknown as this would be dependent on future claims that may be made against the Fund. The risk of material loss from such claims is considered remote.
Annual Report
To the Trustees of Fidelity Hastings Street Trust and the Shareholders of Fidelity Fifty:
In our opinion, the accompanying statement of assets and liabilities, including the schedule of investments, and the related statements of operations and of changes in net assets and the financial highlights present fairly, in all material respects, the financial position of Fidelity Fifty (a fund of Fidelity Hastings Street Trust) at June 30, 2014, the results of its operations for the year then ended, the changes in its net assets for each of the two years in the period then ended and the financial highlights for each of the five years in the period then ended, in conformity with accounting principles generally accepted in the United States of America. These financial statements and financial highlights (hereafter referred to as "financial statements") are the responsibility of the Fidelity Fifty's management. Our responsibility is to express an opinion on these financial statements based on our audits. We conducted our audits of these financial statements in accordance with the standards of the Public Company Accounting Oversight Board (United States). Those standards require that we plan and perform the audit to obtain reasonable assurance about whether the financial statements are free of material misstatement. An audit includes examining, on a test basis, evidence supporting the amounts and disclosures in the financial statements, assessing the accounting principles used and significant estimates made by management, and evaluating the overall financial statement presentation. We believe that our audits, which included confirmation of securities at June 30, 2014 by correspondence with the custodian and brokers, provide a reasonable basis for our opinion.
PricewaterhouseCoopers LLP
Boston, Massachusetts
August 14, 2014
Annual Report
The Trustees, Member of the Advisory Board, and officers of the trust and fund, as applicable, are listed below. The Board of Trustees governs the fund and is responsible for protecting the interests of shareholders. The Trustees are experienced executives who meet periodically throughout the year to oversee the fund's activities, review contractual arrangements with companies that provide services to the fund, oversee management of the risks associated with such activities and contractual arrangements, and review the fund's performance. Except for James C. Curvey, each of the Trustees oversees 173 funds. Mr. Curvey oversees 397 funds.
The Trustees hold office without limit in time except that (a) any Trustee may resign; (b) any Trustee may be removed by written instrument, signed by at least two-thirds of the number of Trustees prior to such removal; (c) any Trustee who requests to be retired or who has become incapacitated by illness or injury may be retired by written instrument signed by a majority of the other Trustees; and (d) any Trustee may be removed at any special meeting of shareholders by a two-thirds vote of the outstanding voting securities of the trust. Each Trustee who is not an interested person (as defined in the 1940 Act) of the trust and the fund (Independent Trustee), shall retire not later than the last day of the calendar year in which his or her 75th birthday occurs. The Independent Trustees may waive this mandatory retirement age policy with respect to individual Trustees. The officers and Advisory Board Member hold office without limit in time, except that any officer and Advisory Board Member may resign or may be removed by a vote of a majority of the Trustees at any regular meeting or any special meeting of the Trustees. Except as indicated, each individual has held the office shown or other offices in the same company for the past five years.
Experience, Skills, Attributes, and Qualifications of the Fund's Trustees. The Governance and Nominating Committee has adopted a statement of policy that describes the experience, qualifications, attributes, and skills that are necessary and desirable for potential Independent Trustee candidates (Statement of Policy). The Board believes that each Trustee satisfied at the time he or she was initially elected or appointed a Trustee, and continues to satisfy, the standards contemplated by the Statement of Policy. The Governance and Nominating Committee also engages professional search firms to help identify potential Independent Trustee candidates who have the experience, qualifications, attributes, and skills consistent with the Statement of Policy. From time to time, additional criteria based on the composition and skills of the current Independent Trustees, as well as experience or skills that may be appropriate in light of future changes to board composition, business conditions, and regulatory or other developments, have also been considered by the professional search firms and the Governance and Nominating Committee. In addition, the Board takes into account the Trustees' commitment and participation in Board and committee meetings, as well as their leadership of standing and ad hoc committees throughout their tenure.
In determining that a particular Trustee was and continues to be qualified to serve as a Trustee, the Board has considered a variety of criteria, none of which, in isolation, was controlling. The Board believes that, collectively, the Trustees have balanced and diverse experience, qualifications, attributes, and skills, which allow the Board to operate effectively in governing the fund and protecting the interests of shareholders. Information about the specific experience, skills, attributes, and qualifications of each Trustee, which in each case led to the Board's conclusion that the Trustee should serve (or continue to serve) as a trustee of the fund, is provided below.
Annual Report
Trustees and Officers - continued
Board Structure and Oversight Function. James C. Curvey is an interested person (as defined in the 1940 Act) and currently serves as Chairman. The Trustees have determined that an interested Chairman is appropriate and benefits shareholders because an interested Chairman has a personal and professional stake in the quality and continuity of services provided to the fund. Independent Trustees exercise their informed business judgment to appoint an individual of their choosing to serve as Chairman, regardless of whether the Trustee happens to be independent or a member of management. The Independent Trustees have determined that they can act independently and effectively without having an Independent Trustee serve as Chairman and that a key structural component for assuring that they are in a position to do so is for the Independent Trustees to constitute a substantial majority for the Board. The Independent Trustees also regularly meet in executive session. Ned C. Lautenbach serves as Chairman of the Independent Trustees and as such (i) acts as a liaison between the Independent Trustees and management with respect to matters important to the Independent Trustees and (ii) with management prepares agendas for Board meetings.
Fidelity funds are overseen by different Boards of Trustees. The fund's Board oversees Fidelity's equity and high income funds and another Board oversees Fidelity's investment-grade bond, money market, and asset allocation funds. The asset allocation funds may invest in Fidelity funds overseen by the fund's Board. The use of separate Boards, each with its own committee structure, allows the Trustees of each group of Fidelity funds to focus on the unique issues of the funds they oversee, including common research, investment, and operational issues. On occasion, the separate Boards establish joint committees to address issues of overlapping consequences for the Fidelity funds overseen by each Board.
The Trustees operate using a system of committees to facilitate the timely and efficient consideration of all matters of importance to the Trustees, the fund, and fund shareholders and to facilitate compliance with legal and regulatory requirements and oversight of the fund's activities and associated risks. The Board, acting through its committees, has charged FMR and its affiliates with (i) identifying events or circumstances the occurrence of which could have demonstrably adverse effects on the fund's business and/or reputation; (ii) implementing processes and controls to lessen the possibility that such events or circumstances occur or to mitigate the effects of such events or circumstances if they do occur; and (iii) creating and maintaining a system designed to evaluate continuously business and market conditions in order to facilitate the identification and implementation processes described in (i) and (ii) above. Because the day-to-day operations and activities of the fund are carried out by or through FMR, its affiliates and other service providers, the fund's exposure to risks is mitigated but not eliminated by the processes overseen by the Trustees. While each of the Board's committees has responsibility for overseeing different aspects of the fund's activities, oversight is exercised primarily through the Operations, Audit, and Compliance Committees. In addition, the Independent Trustees have worked with FMR to enhance the Board's oversight of investment and financial risks, legal and regulatory risks, technology risks, and operational risks, including the development of additional risk reporting to the Board. For example, a working group comprised of Independent Trustees and FMR has worked and continues to work to review the Fidelity funds' valuation-related activities, reporting and risk management. Appropriate personnel, including but not limited to the fund's Chief Compliance Officer (CCO), FMR's internal auditor, the independent accountants, the fund's Treasurer and portfolio management personnel, make periodic reports to the Board's committees, as appropriate, including an annual review of FMR's risk management program for the Fidelity funds. The responsibilities of each standing committee, including their oversight responsibilities, are described further under "Standing Committees of the Fund's Trustees."
Annual Report
The fund's Statement of Additional Information (SAI) includes more information about the Trustees. To request a free copy, call Fidelity at 1-800-544-8544.
Interested Trustees*:
Correspondence intended for each Trustee who is an interested person may be sent to Fidelity Investments, 245 Summer Street, Boston, Massachusetts 02210.
Name, Year of Birth; Principal Occupations and Other Relevant Experience+ |
James C. Curvey (1935) |
Year of Election or Appointment: 2007 Trustee Chairman of the Board of Trustees |
| Mr. Curvey also serves as Trustee of other Fidelity funds. Mr. Curvey is a Director of Fidelity Research & Analysis Co. (2009-present), and Vice Chairman (2007-present) and Director of FMR LLC. In addition, Mr. Curvey serves as an Overseer for the Boston Symphony Orchestra and a member of the Trustees of Villanova University. Previously, Mr. Curvey served as a Director of Fidelity Investments Money Management, Inc. (2009-2014), a Director of FMR (2007-2014), a Director of FMR Co., Inc. (2007-2014) and was the Vice Chairman (2006-2007) and Director (2000-2007) of FMR Corp. |
Charles S. Morrison (1960) |
Year of Election or Appointment: 2014 Trustee |
| Mr. Morrison also serves as Trustee of other funds. He serves as President, Asset Management (2014-present) and is an employee of Fidelity Investments. Previously, Mr. Morrison served as Vice President of Fidelity's Fixed Income and Asset Allocation Funds (2012-2014), President, Fixed Income (2011-2014), Vice President of Fidelity's Money Market Funds (2005-2009), President, Money Market Group Leader of FMR (2009), and Senior Vice President, Money Market Group of FMR (2004-2009). Mr. Morrison also served as Vice President of Fidelity's Bond Funds (2002-2005), certain Balanced Funds (2002-2005), and certain Asset Allocation Funds (2002-2007), and as Senior Vice President (2002-2005) of Fidelity's Bond Division. |
* Trustees have been determined to be "Interested Trustees" by virtue of, among other things, their affiliation with the trust or various entities under common control with FMR.
+ The information above includes each Trustee's principal occupation during the last five years and other information relating to the experience, attributes, and skills relevant to each Trustee's qualifications to serve as a Trustee, which led to the conclusion that each Trustee should serve as a Trustee for the fund.
Annual Report
Independent Trustees:
Correspondence intended for each Independent Trustee (that is, the Trustees other than the Interested Trustees) may be sent to Fidelity Investments, P.O. Box 55235, Boston, Massachusetts 02205-5235.
Name, Year of Birth; Principal Occupations and Other Relevant Experience+ |
Dennis J. Dirks (1948) |
Year of Election or Appointment: 2005 Trustee |
| Mr. Dirks also serves as Trustee of other Fidelity funds. Prior to his retirement in May 2003, Mr. Dirks was Chief Operating Officer and a member of the Board of The Depository Trust & Clearing Corporation (DTCC). He also served as President, Chief Operating Officer, and Board member of The Depository Trust Company (DTC) and President and Board member of the National Securities Clearing Corporation (NSCC). In addition, Mr. Dirks served as Chief Executive Officer and Board member of the Government Securities Clearing Corporation, Chief Executive Officer and Board member of the Mortgage-Backed Securities Clearing Corporation, as a Trustee and a member of the Finance Committee of Manhattan College (2005-2008), and as a Trustee and a member of the Finance Committee of AHRC of Nassau County (2006-2008). Mr. Dirks is a member of the Independent Directors Council (IDC) Governing Council (2010-present) and Board of Directors for The Brookville Center for Children's Services, Inc. (2009-present). |
Alan J. Lacy (1953) |
Year of Election or Appointment: 2008 Trustee |
| Mr. Lacy also serves as Trustee of other Fidelity funds. Mr. Lacy serves as Senior Adviser (2007-present) of Oak Hill Capital Partners, L.P. (private equity). Mr. Lacy also served as Chief Executive Officer (2000-2005) and Vice Chairman (2005-2006) of Sears Holdings Corporation and Sears, Roebuck and Co. (retail). In addition, Mr. Lacy serves as a member of the Board of Directors of Dave & Buster's Entertainment, Inc. (restaurant and entertainment complexes, 2010-present), Earth Fare, Inc. (retail grocery, 2012-present), The Hillman Companies, Inc. (hardware wholesalers, 2010-present), and Bristol-Myers Squibb Company (global pharmaceuticals, 2008-present). Mr. Lacy is a member of the Board of Trustees of The National Parks Conservation Association (2006-present). Previously, Mr. Lacy served as Chairman of the Board of Trustees of the National Parks Conservation Association (2008-2011) and as a member of the Board of Directors for the Western Union Company (global money transfer, 2006-2011). |
Ned C. Lautenbach (1944) |
Year of Election or Appointment: 2000 Trustee Chairman of the Independent Trustees |
| Mr. Lautenbach also serves as Trustee of other Fidelity funds. Mr. Lautenbach currently serves as the Lead Director of the Eaton Corporation Board of Directors (diversified industrial, 1997-present). Mr. Lautenbach is Chairman of the Board of Directors of the Philharmonic Center for the Arts in Naples, Florida (2012-present) and a member of the Council on Foreign Relations (1994-present). Previously, Mr. Lautenbach was a Partner/Advisory Partner at Clayton, Dubilier & Rice, LLC (private equity investment, 1998-2010), as well as a Director of Sony Corporation (2006-2007). |
Joseph Mauriello (1944) |
Year of Election or Appointment: 2008 Trustee |
| Mr. Mauriello also serves as Trustee of other Fidelity funds. Prior to his retirement in January 2006, Mr. Mauriello served in numerous senior management positions including Deputy Chairman and Chief Operating Officer (2004-2005), and Vice Chairman of Financial Services (2002-2004) of KPMG LLP US (professional services, 1965-2005). Mr. Mauriello currently serves as a member of the Board of Directors of XL Group plc. (global insurance and re-insurance, 2006-present). Previously, Mr. Mauriello served as a Director of the Hamilton Funds of the Bank of New York (2006-2007) and of Arcadia Resources Inc. (health care services and products, 2007-2012). |
Robert W. Selander (1950) |
Year of Election or Appointment: 2011 Trustee |
| Mr. Selander also serves as Trustee of other Fidelity funds. Previously, Mr. Selander served as a Member of the Advisory Board of other Fidelity funds (2011), and Executive Vice Chairman (2010), Chief Executive Officer (2009-2010), and President and Chief Executive Officer (1997-2009) of Mastercard, Inc. |
Cornelia M. Small (1944) |
Year of Election or Appointment: 2005 Trustee |
| Ms. Small also serves as Trustee of other Fidelity funds. Ms. Small is a member of the Board of Directors (2009-present) and Chair of the Investment Committee (2010-present) of the Teagle Foundation. Ms. Small also serves on the Investment Committee of the Berkshire Taconic Community Foundation (2008-present). Previously, Ms. Small served as Chairperson (2002-2008) and a member of the Investment Committee and Chairperson (2008-2012) and a member of the Board of Trustees of Smith College. In addition, Ms. Small served as Chief Investment Officer, Director of Global Equity Investments, and a member of the Board of Directors of Scudder, Stevens & Clark and Scudder Kemper Investments. |
William S. Stavropoulos (1939) |
Year of Election or Appointment: 2001 Trustee Vice Chairman of the Independent Trustees |
| Mr. Stavropoulos also serves as Trustee of other Fidelity funds. Mr. Stavropoulos serves as President and Founder of the Michigan Baseball Foundation, the Great Lakes Loons (2007-present). Mr. Stavropoulos is Chairman Emeritus of the Board of Directors of The Dow Chemical Company, where he previously served in numerous senior management positions, including President, CEO (1995-2000; 2002-2004), Chairman of the Executive Committee (2000-2006), and as a member of the Board of Directors (1990-2006). Currently, Mr. Stavropoulos is Chairman of the Board of Directors of Univar Inc. (global distributor of commodity and specialty chemicals), a Director of Teradata Corporation (data warehousing and technology solutions), and Maersk Inc. (industrial conglomerate), and a member of the Advisory Board for Metalmark Capital LLC (private equity investment, 2005-present). Mr. Stavropoulos is an operating advisor to Clayton, Dubilier & Rice, LLC (private equity investment). In addition, Mr. Stavropoulos is a member of the University of Notre Dame Advisory Council for the College of Science, a Trustee of the Rollin L. Gerstacker Foundation, and a Director of the Naples Philharmonic Center for the Arts. Previously, Mr. Stavropoulos served as a Director of Chemical Financial Corporation (bank holding company, 1993-2012) and Tyco International, Ltd. (multinational manufacturing and services, 2007-2012). |
David M. Thomas (1949) |
Year of Election or Appointment: 2008 Trustee |
| Mr. Thomas also serves as Trustee of other Fidelity funds. Mr. Thomas serves as Non-Executive Chairman of the Board of Directors of Fortune Brands Home and Security (home and security products, 2011-present), and as a member of the Board of Directors of Interpublic Group of Companies, Inc. (marketing communication, 2004-present). Previously, Mr. Thomas served as Executive Chairman (2005-2006) and Chairman and Chief Executive Officer (2000-2005) of IMS Health, Inc. (pharmaceutical and healthcare information solutions), and a Director of Fortune Brands, Inc. (consumer products, 2000-2011). |
+ The information above includes each Trustee's principal occupation during the last five years and other information relating to the experience, attributes, and skills relevant to each Trustee's qualifications to serve as a Trustee, which led to the conclusion that each Trustee should serve as a Trustee for the fund.
Advisory Board Member and Officers:
Correspondence intended for each officer and Peter S. Lynch may be sent to Fidelity Investments, 245 Summer Street, Boston, Massachusetts 02210. Officers appear below in alphabetical order.
Name, Year of Birth; Principal Occupation |
Peter S. Lynch (1944) |
Year of Election or Appointment: 2003 Member of the Advisory Board |
| Mr. Lynch also serves as Member of the Advisory Board of other Fidelity funds. Mr. Lynch is Vice Chairman and a Director of FMR and FMR Co., Inc. In addition, Mr. Lynch serves as a Trustee of Boston College and as the Chairman of the Inner-City Scholarship Fund. Previously, Mr. Lynch served on the Special Olympics International Board of Directors (1997-2006). |
Elizabeth Paige Baumann (1968) |
Year of Election or Appointment: 2012 Anti-Money Laundering (AML) Officer |
| Ms. Baumann also serves as AML Officer of other funds. She is Chief AML Officer of FMR LLC (2012-present) and is an employee of Fidelity Investments. Previously, Ms. Baumann served as Vice President and Deputy Anti-Money Laundering Officer (2007-2012). |
William C. Coffey (1969) |
Year of Election or Appointment: 2009 Assistant Secretary |
| Mr. Coffey also serves as Assistant Secretary of other funds. He is Senior Vice President and Deputy General Counsel of FMR LLC (2010-present), and is an employee of Fidelity Investments. Previously, Mr. Coffey served as Vice President and Associate General Counsel of FMR LLC (2005-2009). |
Jonathan Davis (1968) |
Year of Election or Appointment: 2010 Assistant Treasurer |
| Mr. Davis also serves as Assistant Treasurer of other funds. Mr. Davis is an employee of Fidelity Investments. Previously, Mr. Davis served as Vice President and Associate General Counsel of FMR LLC (2003-2010). |
Adrien E. Deberghes (1967) |
Year of Election or Appointment: 2008 Deputy Treasurer |
| Mr. Deberghes also serves as an officer of other funds. He is an employee of Fidelity Investments (2008-present). Prior to joining Fidelity Investments, Mr. Deberghes was Senior Vice President of Mutual Fund Administration at State Street Corporation (2007-2008), Senior Director of Mutual Fund Administration at Investors Bank & Trust (2005-2007), and Director of Finance for Dunkin' Brands (2000-2005). |
Stephanie J. Dorsey (1969) |
Year of Election or Appointment: 2010 Assistant Treasurer |
| Ms. Dorsey also serves as an officer of other funds. She is an employee of Fidelity Investments (2008-present) and has served in other fund officer roles. Prior to joining Fidelity Investments, Ms. Dorsey served as Treasurer (2004-2008) of the JPMorgan Mutual Funds and Vice President (2004-2008) of JPMorgan Chase Bank. |
Howard J. Galligan III (1966) |
Year of Election or Appointment: 2014 Chief Financial Officer |
| Mr. Galligan also serves as Chief Financial Officer of other funds. Mr. Galligan serves as President of Fidelity Pricing and Cash Management Services (FPCMS) (2014-present) and as a Director of Strategic Advisers, Inc. (2008-present). Previously, Mr. Galligan served as Chief Administrative Officer of Asset Management (2011-2014) and Chief Operating Officer and Senior Vice President of Investment Support for Strategic Advisers, Inc. (2003-2011). |
Scott C. Goebel (1968) |
Year of Election or Appointment: 2008 Secretary and Chief Legal Officer (CLO) |
| Mr. Goebel serves as Secretary and CLO of other funds. Mr. Goebel also serves as Secretary of Fidelity SelectCo, LLC (2013-present), Fidelity Investments Money Management, Inc. (FIMM) (2010-present) and Fidelity Research and Analysis Company (FRAC) (2010-present); General Counsel, Secretary, and Senior Vice President of FMR (2008-present) and FMR Co., Inc. (2008-present); Chief Legal Officer of Fidelity Management & Research (Hong Kong) Limited (2008-present); and Assistant Secretary of Fidelity Management & Research (Japan) Inc. (2008-present) and Fidelity Management & Research (U.K.) Inc. (2008-present). Previously, Mr. Goebel served as Secretary and CLO of other Fidelity funds (2008-2013), Assistant Secretary of FIMM (2008-2010), FRAC (2008-2010), and certain funds (2007-2008); and as Vice President and Secretary of Fidelity Distributors Corporation (FDC) (2005-2007). Mr. Goebel has been employed by FMR LLC or an affiliate since 2001. |
Brian B. Hogan (1964) |
Year of Election or Appointment: 2009 Vice President |
| Mr. Hogan also serves as Trustee or Vice President of other funds. Mr. Hogan serves as President of FMR's Equity Division (2009-present). Previously, Mr. Hogan served as Senior Vice President, Equity Research of FMR (2006-2009) and as a portfolio manager. |
Chris Maher (1972) |
Year of Election or Appointment: 2013 Assistant Treasurer |
| Mr. Maher serves as Assistant Treasurer of other funds. Mr. Maher is Vice President of Valuation Oversight and is an employee of Fidelity Investments. Previously, Mr. Maher served as Vice President of Asset Management Compliance (2013), Vice President of FMR's Program Management Group (2010-2013), and Vice President of Valuation Oversight (2008-2010). |
Melissa M. Reilly (1971) |
Year of Election or Appointment: 2014 Vice President of certain Equity Funds |
| Ms. Reilly also serves as Vice President of other funds. Ms. Reilly is an employee of Fidelity Investments (2004-present). |
Kenneth B. Robins (1969) |
Year of Election or Appointment: 2008 President and Treasurer |
| Mr. Robins also serves as an officer of other funds. Mr. Robins serves as Executive Vice President of Fidelity Investments Money Management, Inc. (FIMM) (2013-present) and is an employee of Fidelity Investments (2004-present). Previously, Mr. Robins served in other fund officer roles. |
Stephen Sadoski (1971) |
Year of Election or Appointment: 2012 Deputy Treasurer |
| Mr. Sadoski also serves as Deputy Treasurer of other funds. He is an employee of Fidelity Investments (2012-present) and has served in another fund officer role. Prior to joining Fidelity Investments, Mr. Sadoski served as an assistant chief accountant in the Division of Investment Management of the Securities and Exchange Commission (SEC) (2009-2012) and as a senior manager at Deloitte & Touche LLP (1997-2009). |
Stacie M. Smith (1974) |
Year of Election or Appointment: 2013 Deputy Treasurer |
| Ms. Smith also serves as an officer of other funds. She is an employee of Fidelity Investments (2009-present) and has served in other fund officer roles. Prior to joining Fidelity Investments, Ms. Smith served as Senior Audit Manager of Ernst & Young LLP (1996-2009). |
Renee Stagnone (1975) |
Year of Election or Appointment: 2013 Deputy Treasurer |
| Ms. Stagnone also serves as Deputy Treasurer of other funds. Ms. Stagnone is an employee of Fidelity Investments. |
Linda J. Wondrack (1964) |
Year of Election or Appointment: 2014 Chief Compliance Officer |
| Ms. Wondrack also serves as Chief Compliance Officer of other funds. Ms. Wondrack is Executive Vice President and head of the Ethics Office and Asset Management Compliance for Fidelity Investments (2012-present). Ms. Wondrack also serves as Chief Compliance Officer of Fidelity SelectCo, LLC (2014-present); Chief Compliance Officer of Impresa Management LLC (2013-present); and Chief Compliance Officer of FMR Co., Inc., Fidelity Investments Money Management, Inc., Fidelity Management & Research (Japan) Inc., Fidelity Management & Research (U.K.) Inc., Fidelity Management & Research (Hong Kong), Fidelity Management & Research Company, Pyramis Global Advisors, LLC, and Strategic Advisers, Inc., Ballyrock Investment Advisors LLC, and Northern Neck Investors LLC (2012-present). Previously, Ms. Wondrack served as Senior Vice President and Chief Compliance Officer for Columbia Management Investment Advisers, LLC (2005-2012); Chief Compliance Officer for certain funds within the Columbia Family of Funds (2007-2012); and Senior Vice President of Compliance Risk Management at Bank of America (2005-2010). |
Joseph F. Zambello (1957) |
Year of Election or Appointment: 2011 Deputy Treasurer |
| Mr. Zambello also serves as Deputy Treasurer of other funds. Mr. Zambello is an employee of Fidelity Investments. Previously, Mr. Zambello served as Vice President of FMR's Program Management Group (2009-2011) and Vice President of the Transfer Agent Oversight Group (2005-2009). |
Annual Report
Investment Adviser
Fidelity Management & Research Company
Boston, MA
Investment Sub-Advisers
Fidelity Management & Research
(Hong Kong) Limited
Fidelity Management & Research
(Japan) Inc.
FMR Co., Inc.
Fidelity Management & Research
(U.K.) Inc.
General Distributor
Fidelity Distributors Corporation
Smithfield, RI
Transfer and Service Agents
Fidelity Investments Institutional
Operations Company, Inc.
Boston, MA
Fidelity Service Company, Inc.
Boston, MA
Custodian
Citibank, N.A.
New York, NY
The Fidelity Telephone Connection
Mutual Fund 24-Hour Service
Exchanges/Redemptions
and Account Assistance 1-800-544-6666
Product Information 1-800-544-6666
Retirement Accounts 1-800-544-4774
(8 a.m. - 9 p.m.)
TDD Service 1-800-544-0118
for the deaf and hearing impaired
(9 a.m. - 9 p.m. Eastern time)
Fidelity Automated Service
Telephone (FAST®)
1-800-544-5555
Automated line for quickest service
(Fidelity Investment logo)(registered trademark)
Corporate Headquarters
245 Summer St., Boston, MA 02210
www.fidelity.com
FIF-UANN-0814
1.787732.111
(Fidelity Investment logo)(registered trademark)
Fidelity Advisor®
Series Growth & Income
Fund
Annual Report
June 30, 2014
(Fidelity Cover Art)
Contents
Performance | (Click Here) | How the fund has done over time. |
Management's Discussion of Fund Performance | (Click Here) | The Portfolio Manager's review of fund performance and strategy. |
Shareholder Expense Example | (Click Here) | An example of shareholder expenses. |
Investment Changes | (Click Here) | A summary of major shifts in the fund's investments over the past six months. |
Investments | (Click Here) | A complete list of the fund's investments with their market values. |
Financial Statements | (Click Here) | Statements of assets and liabilities, operations, and changes in net assets, as well as financial highlights. |
Notes | (Click Here) | Notes to the financial statements. |
Report of Independent Registered Public Accounting Firm | (Click Here) | |
Trustees and Officers | (Click Here) | |
Distributions | (Click Here) | |
To view a fund's proxy voting guidelines and proxy voting record for the 12-month period ended June 30, visit http://www.fidelity.com/proxyvotingresults or visit the Securities and Exchange Commission's (SEC) web site at http://www.sec.gov. You may also call 1-877-208-0098 to request a free copy of the proxy voting guidelines.
Standard & Poor's, S&P and S&P 500 are registered service marks of The McGraw-Hill Companies, Inc. and have been licensed for use by Fidelity Distributors Corporation.
Other third-party marks appearing herein are the property of their respective owners.
All other marks appearing herein are registered or unregistered trademarks or service marks of FMR LLC or an affiliated company. © 2014 FMR LLC. All rights reserved.
Annual Report
This report and the financial statements contained herein are submitted for the general information of the shareholders of the fund. This report is not authorized for distribution to prospective investors in the fund unless preceded or accompanied by an effective prospectus.
A fund files its complete schedule of portfolio holdings with the SEC for the first and third quarters of each fiscal year on Form N-Q. Forms N-Q are available on the SEC's web site at http://www.sec.gov. A fund's Forms N-Q may be reviewed and copied at the SEC's Public Reference Room in Washington, DC. Information regarding the operation of the SEC's Public Reference Room may be obtained by calling 1-800-SEC-0330. For a complete list of a fund's portfolio holdings, view the most recent holdings listing, semiannual report, or annual report on Fidelity's web site at http://www.fidelity.com, http://www.advisor.fidelity.com, or http://www.401k.com, as applicable.
NOT FDIC INSURED • MAY LOSE VALUE • NO BANK GUARANTEE
Neither the fund nor Fidelity Distributors Corporation is a bank.
Annual Report
Average annual total return reflects the change in the value of an investment, assuming reinvestment of the fund's distributions from dividend income and capital gains (the profits earned upon the sale of securities that have grown in value, if any) and assuming a constant rate of performance each year. The $10,000 table and the fund's returns do not reflect the deduction of taxes that a shareholder would pay on fund distributions or the redemption of fund shares. During periods of reimbursement by Fidelity, a fund's total return will be greater than it would be had the reimbursement not occurred. How a fund did yesterday is no guarantee of how it will do tomorrow.
Average Annual Total Returns
Periods ended June 30, 2014 | | Past 1 year | Life of
Fund A |
Fidelity Advisor® Series Growth & Income Fund B | | 22.48% | 25.04% |
A From December 6, 2012
B Prior to August 1, 2013, Fidelity Advisor® Series Growth & Income Fund was named Fidelity Advisor Series Mega Cap Fund, and the fund operated under certain different investment policies and compared its performance to a different additional index. The fund's historical performance may not represent its current investment policies.
$10,000 Over Life of Fund
Let's say hypothetically that $10,000 was invested in Fidelity Advisor Series Growth & Income Fund on December 6, 2012, when the fund started. The chart shows how the value of your investment would have changed, and also shows how the S&P 500® Index and the Russell Top 200® Index performed over the same period.
Effective August 1, 2013, Fidelity Advisor Series Growth & Income Fund began comparing its performance to the S&P 500® Index rather than the Russell Top 200® Index because the S&P 500 Index provides a more appropriate performance comparison for the fund.
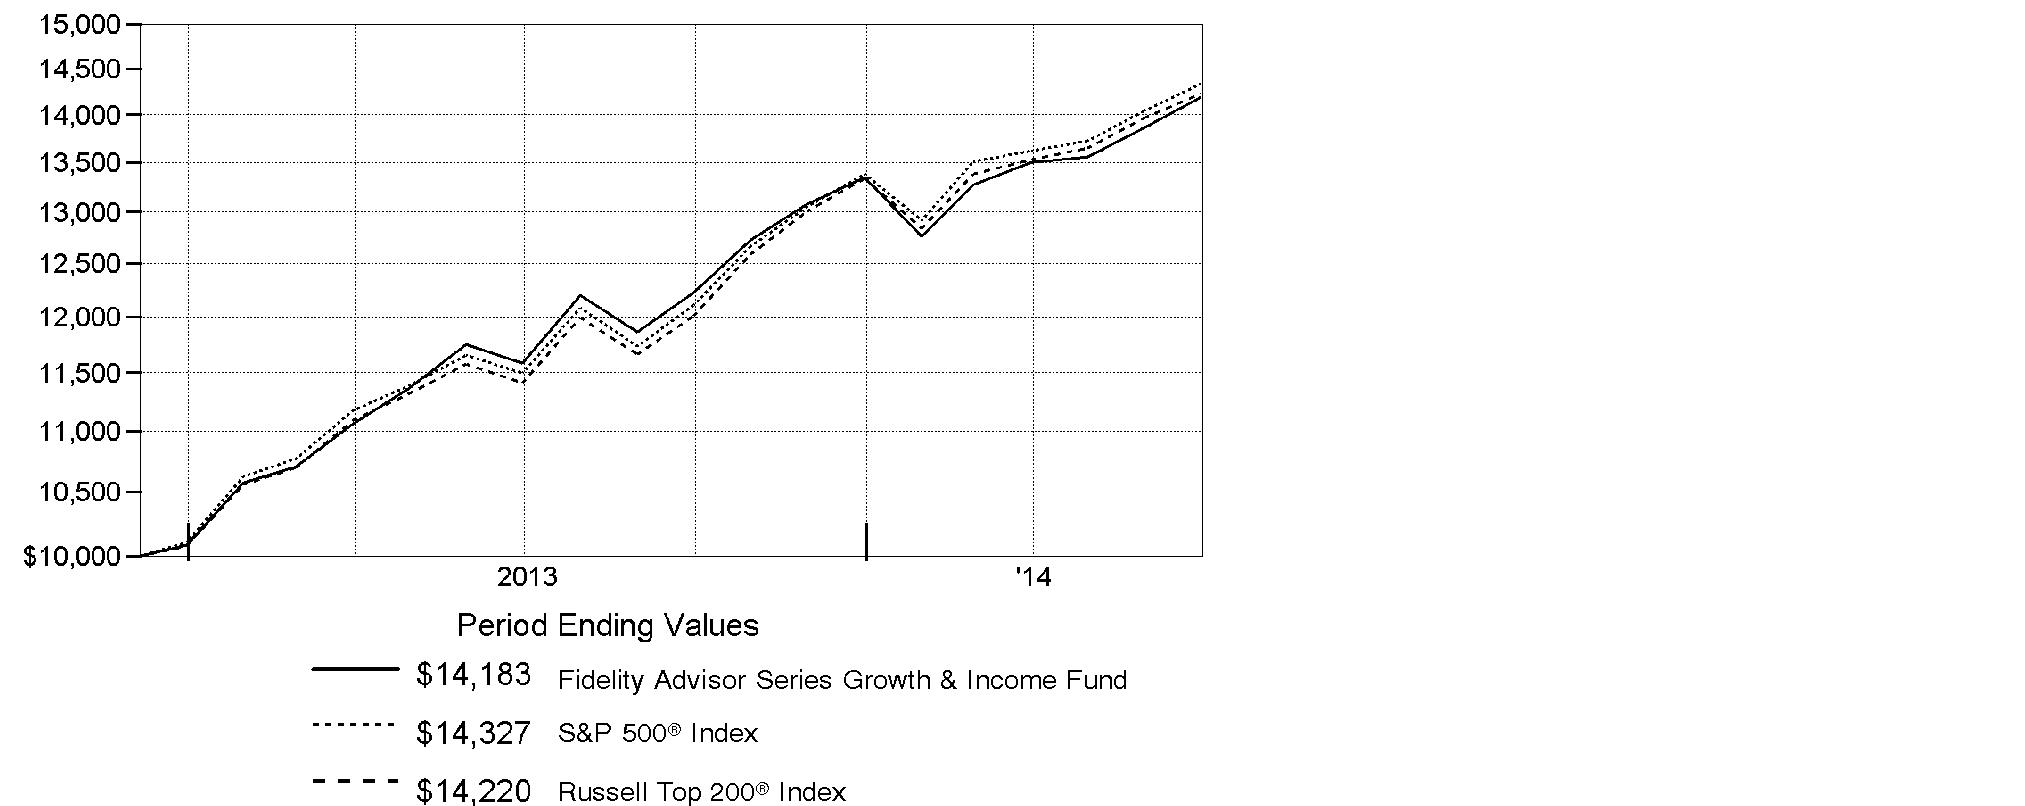
Annual Report
Market Recap: Despite intermittent volatility driven by geopolitical concerns, stocks posted a series of new highs during the 12 months ending June 30, 2014, amid a decidedly favorable environment for riskier assets. The S&P 500® Index rose 24.61% for the year, helped by a rise in consumer spending and the lowest unemployment rate since 2008. The U.S. Federal Reserve balanced stimulus reductions with continued low interest rates, aiding a broad advance. All 10 S&P 500® market sectors gained, seven by more than 20%. Materials (+33%) was tops, as investors seemed to anticipate sustained economic improvement and renewed infrastructure build-outs. Information technology (+32%) benefited from large cash balances, rising dividends and stock buybacks, and a bevy of innovations. Health care (+30%) was aided by new drugs and predictable reimbursements. Conversely, the biggest laggard, telecommunication services (+5%), battled slow growth and stiff pricing competition. Across size and style segments: overall, investors showed some preference for large-cap stocks over small-caps and growth stocks over value, although market leadership rotated during the year. With the "risk-on" trade alive and well, the growth-oriented Nasdaq Composite Index® flourished, advancing 31.17%, while the blue-chip Dow Jones Industrial AverageSM delivered a more subdued 15.56% return.
Comments from Matthew Fruhan, Portfolio Manager of Fidelity Advisor® Series Growth & Income Fund: For the year, the fund returned 22.48%. For comparison, the S&P 500® advanced 24.61%, the Russell Top 200® Index returned 24.69% and the custom linked index specific to this fund added 24.69%. Relative to the linked index, it hurt the most by far to overweight big-box retailer Target, which was among the fund's biggest holdings. The lingering effects of the firm's troubled expansion into Canada and a holiday-season credit breach continued to weigh on the stock, but this weak stretch allowed me to add notable exposure at a valuation I liked. Picks in information technology hurt, as we didn't own outperforming index component Facebook, while choices in industrials and consumer discretionary also were weak. Stock selection and an overweight in financials detracted, including investment banks JPMorgan Chase and Citigroup, both of which were among the fund's largest holdings. Stock selection in consumer staples helped the most, especially drugstore chain Walgreen, while an overweight in the outperforming shares of natural gas pipeline firm Williams Companies also added value.
The views expressed above reflect those of the portfolio manager(s) only through the end of the period as stated on the cover of this report and do not necessarily represent the views of Fidelity or any other person in the Fidelity organization. Any such views are subject to change at any time based upon market or other conditions and Fidelity disclaims any responsibility to update such views. These views may not be relied on as investment advice and, because investment decisions for a Fidelity fund are based on numerous factors, may not be relied on as an indication of trading intent on behalf of any Fidelity fund.
Annual Report
Shareholder Expense Example
As a shareholder of the Fund, you incur two types of costs: (1) transaction costs, and (2) ongoing costs, including management fees and other Fund expenses. This Example is intended to help you understand your ongoing costs (in dollars) of investing in the Fund and to compare these costs with the ongoing costs of investing in other mutual funds.
The Example is based on an investment of $1,000 invested at the beginning of the period and held for the entire period (January 1, 2014 to June 30, 2014).
Actual Expenses
The first line of the accompanying table provides information about actual account values and actual expenses. You may use the information in this line, together with the amount you invested, to estimate the expenses that you paid over the period. Simply divide your account value by $1,000.00 (for example, an $8,600 account value divided by $1,000.00 = 8.6), then multiply the result by the number in the first line under the heading entitled "Expenses Paid During Period" to estimate the expenses you paid on your account during this period. In addition, the Fund, as a shareholder in the underlying Fidelity Central Funds, will indirectly bear its pro-rata share of the fees and expenses incurred by the underlying Fidelity Central Funds. These fees and expenses are not included in the Fund's annualized expense ratio used to calculate the expense estimate in the table below.
Hypothetical Example for Comparison Purposes
The second line of the accompanying table provides information about hypothetical account values and hypothetical expenses based on the Fund's actual expense ratio and an assumed rate of return of 5% per year before expenses, which is not the Fund's actual return. The hypothetical account values and expenses may not be used to estimate the actual ending account balance or expenses you paid for the period. You may use this information to compare the ongoing costs of investing in the Fund and other funds. To do so, compare this 5% hypothetical example with the 5% hypothetical examples that appear in the shareholder reports of the other funds. In addition, the Fund, as a shareholder in the underlying Fidelity Central Funds, will indirectly bear its pro-rata share of the fees and expenses incurred by the underlying Fidelity Central Funds. These fees and expenses are not included in the Fund's annualized expense ratio used to calculate the expense estimate in the table below.
Please note that the expenses shown in the table are meant to highlight your ongoing costs only and do not reflect any transaction costs. Therefore, the second line of the table is useful in comparing ongoing costs only, and will not help you determine the relative total costs of owning different funds.
Annual Report
| Annualized
Expense Ratio B | Beginning
Account Value
January 1, 2014 | Ending
Account Value
June 30, 2014 | Expenses Paid
During Period*
January 1, 2014
to June 30, 2014 |
Actual | .67% | $ 1,000.00 | $ 1,063.20 | $ 3.43 |
HypotheticalA | | $ 1,000.00 | $ 1,021.47 | $ 3.36 |
A 5% return per year before expenses
B Annualized expense ratio reflects expenses net of applicable fee waivers.
* Expenses are equal to the Fund's annualized expense ratio, multiplied by the average account value over the period, multiplied by 181/365 (to reflect the one-half year period).
Annual Report
Investment Changes (Unaudited)
Top Ten Stocks as of June 30, 2014 |
| % of fund's
net assets | % of fund's net assets
6 months ago |
JPMorgan Chase & Co. | 4.0 | 3.9 |
Apple, Inc. | 3.7 | 3.8 |
Microsoft Corp. | 3.2 | 2.8 |
General Electric Co. | 3.0 | 3.1 |
Chevron Corp. | 2.8 | 2.4 |
Citigroup, Inc. | 2.1 | 2.1 |
Target Corp. | 2.0 | 1.8 |
Verizon Communications, Inc. | 1.9 | 1.2 |
Comcast Corp. Class A (special) (non-vtg.) | 1.9 | 1.7 |
Procter & Gamble Co. | 1.8 | 1.9 |
| 26.4 | |
Top Five Market Sectors as of June 30, 2014 |
| % of fund's
net assets | % of fund's net assets
6 months ago |
Information Technology | 19.4 | 19.0 |
Financials | 19.1 | 19.1 |
Consumer Staples | 12.2 | 12.0 |
Energy | 12.0 | 12.0 |
Industrials | 11.4 | 11.3 |
Asset Allocation (% of fund's net assets) |
As of June 30, 2014* | As of December 31, 2013** |
| Stocks 99.1% | | | Stocks 98.8% | |
 | Convertible
Securities 0.8% | | | Convertible
Securities 0.8% | |
 | Other Investments 0.1% | | | Other Investments 0.1% | |
| Short-Term
Investments and
Net Other Assets (Liabilities) 0.0%† | | | Short-Term
Investments and
Net Other Assets (Liabilities) 0.3% | |
* Foreign investments | 13.5% | | ** Foreign investments | 13.7% | |

† Amount represents less than 0.1% |
Annual Report
Investments June 30, 2014
Showing Percentage of Net Assets
Common Stocks - 99.1% |
| Shares | | Value |
CONSUMER DISCRETIONARY - 9.8% |
Diversified Consumer Services - 0.3% |
H&R Block, Inc. | 138,600 | | $ 4,645,872 |
Hotels, Restaurants & Leisure - 1.9% |
Darden Restaurants, Inc. | 89,500 | | 4,141,165 |
Domino's Pizza, Inc. | 7,600 | | 555,484 |
McDonald's Corp. | 88,895 | | 8,955,282 |
Yum! Brands, Inc. | 144,201 | | 11,709,121 |
| | 25,361,052 |
Household Durables - 0.1% |
Tupperware Brands Corp. | 18,900 | | 1,581,930 |
Media - 3.8% |
Comcast Corp. Class A (special) (non-vtg.) | 481,490 | | 25,677,862 |
Lamar Advertising Co. Class A | 22,600 | | 1,197,800 |
Scripps Networks Interactive, Inc. Class A | 12,350 | | 1,002,079 |
Sinclair Broadcast Group, Inc. Class A (d) | 160,271 | | 5,569,417 |
Time Warner, Inc. | 254,841 | | 17,902,580 |
| | 51,349,738 |
Multiline Retail - 2.0% |
Target Corp. | 460,009 | | 26,657,522 |
Specialty Retail - 1.6% |
DSW, Inc. Class A | 56,700 | | 1,584,198 |
Lewis Group Ltd. | 82,463 | | 502,454 |
Lowe's Companies, Inc. | 377,877 | | 18,134,317 |
Sally Beauty Holdings, Inc. (a) | 5,400 | | 135,432 |
Staples, Inc. | 115,028 | | 1,246,904 |
| | 21,603,305 |
Textiles, Apparel & Luxury Goods - 0.1% |
adidas AG | 15,900 | | 1,610,465 |
TOTAL CONSUMER DISCRETIONARY | | 132,809,884 |
CONSUMER STAPLES - 12.2% |
Beverages - 3.7% |
Diageo PLC | 140,155 | | 4,463,811 |
Molson Coors Brewing Co. Class B | 56,860 | | 4,216,738 |
PepsiCo, Inc. | 130,194 | | 11,631,532 |
Pernod Ricard SA (d) | 11,100 | | 1,332,972 |
Remy Cointreau SA | 5,205 | | 478,877 |
Common Stocks - continued |
| Shares | | Value |
CONSUMER STAPLES - continued |
Beverages - continued |
SABMiller PLC | 99,829 | | $ 5,788,308 |
The Coca-Cola Co. | 521,748 | | 22,101,245 |
| | 50,013,483 |
Food & Staples Retailing - 1.6% |
CVS Caremark Corp. | 105,790 | | 7,973,392 |
Kroger Co. | 87,963 | | 4,348,011 |
Walgreen Co. | 134,238 | | 9,951,063 |
| | 22,272,466 |
Food Products - 0.5% |
Kellogg Co. | 97,879 | | 6,430,650 |
Household Products - 1.9% |
Procter & Gamble Co. | 305,317 | | 23,994,863 |
Svenska Cellulosa AB (SCA) (B Shares) | 67,906 | | 1,769,415 |
| | 25,764,278 |
Tobacco - 4.5% |
British American Tobacco PLC sponsored ADR | 195,885 | | 23,325,986 |
Lorillard, Inc. | 289,486 | | 17,649,961 |
Philip Morris International, Inc. | 158,987 | | 13,404,194 |
Reynolds American, Inc. | 108,100 | | 6,523,835 |
| | 60,903,976 |
TOTAL CONSUMER STAPLES | | 165,384,853 |
ENERGY - 11.8% |
Energy Equipment & Services - 1.2% |
Ensco PLC Class A | 91,000 | | 5,056,870 |
National Oilwell Varco, Inc. | 8,600 | | 708,210 |
Oceaneering International, Inc. | 23,200 | | 1,812,616 |
Schlumberger Ltd. | 72,420 | | 8,541,939 |
| | 16,119,635 |
Oil, Gas & Consumable Fuels - 10.6% |
Access Midstream Partners LP | 43,560 | | 2,768,238 |
Apache Corp. | 106,547 | | 10,720,759 |
Atlas Pipeline Partners LP | 76,674 | | 2,637,586 |
BG Group PLC | 579,864 | | 12,255,884 |
Canadian Natural Resources Ltd. | 162,245 | | 7,455,014 |
Chevron Corp. | 286,488 | | 37,401,008 |
EQT Midstream Partners LP | 12,100 | | 1,170,554 |
EV Energy Partners LP | 10,600 | | 419,972 |
Common Stocks - continued |
| Shares | | Value |
ENERGY - continued |
Oil, Gas & Consumable Fuels - continued |
Exxon Mobil Corp. | 26,660 | | $ 2,684,129 |
Golar LNG Ltd. (d) | 30,700 | | 1,845,070 |
Imperial Oil Ltd. | 138,400 | | 7,293,222 |
Magellan Midstream Partners LP | 1,320 | | 110,933 |
Markwest Energy Partners LP | 152,771 | | 10,935,348 |
MPLX LP | 14,500 | | 935,250 |
Occidental Petroleum Corp. | 152,891 | | 15,691,203 |
Peabody Energy Corp. | 76,660 | | 1,253,391 |
PrairieSky Royalty Ltd. | 5,400 | | 196,354 |
Suncor Energy, Inc. | 322,590 | | 13,755,536 |
The Williams Companies, Inc. | 220,074 | | 12,810,508 |
Western Gas Partners LP | 17,760 | | 1,358,285 |
| | 143,698,244 |
TOTAL ENERGY | | 159,817,879 |
FINANCIALS - 19.0% |
Banks - 11.2% |
Bank of America Corp. | 1,250,837 | | 19,225,365 |
Citigroup, Inc. | 593,731 | | 27,964,730 |
JPMorgan Chase & Co. | 954,998 | | 55,026,984 |
M&T Bank Corp. | 17,580 | | 2,180,799 |
PNC Financial Services Group, Inc. | 104,844 | | 9,336,358 |
Standard Chartered PLC (United Kingdom) | 581,507 | | 11,882,582 |
SunTrust Banks, Inc. | 33,550 | | 1,344,013 |
U.S. Bancorp | 256,371 | | 11,105,992 |
Wells Fargo & Co. | 269,000 | | 14,138,640 |
| | 152,205,463 |
Capital Markets - 4.5% |
Apollo Investment Corp. | 54,100 | | 465,801 |
Ares Capital Corp. | 56,830 | | 1,014,984 |
Artisan Partners Asset Management, Inc. | 7,300 | | 413,764 |
BlackRock, Inc. Class A | 4,600 | | 1,470,160 |
Carlyle Group LP | 36,907 | | 1,253,362 |
Charles Schwab Corp. | 429,854 | | 11,575,968 |
Greenhill & Co., Inc. | 5,000 | | 246,250 |
Invesco Ltd. | 29,900 | | 1,128,725 |
KKR & Co. LP | 380,778 | | 9,264,329 |
Morgan Stanley, Inc. | 270,980 | | 8,760,783 |
Northern Trust Corp. | 135,310 | | 8,688,255 |
Common Stocks - continued |
| Shares | | Value |
FINANCIALS - continued |
Capital Markets - continued |
State Street Corp. | 219,574 | | $ 14,768,547 |
The Blackstone Group LP | 65,600 | | 2,193,664 |
| | 61,244,592 |
Diversified Financial Services - 0.7% |
IntercontinentalExchange Group, Inc. | 26,798 | | 5,062,142 |
TPG Specialty Lending, Inc. (d) | 169,100 | | 3,691,453 |
| | 8,753,595 |
Insurance - 1.8% |
Arthur J. Gallagher & Co. | 45,080 | | 2,100,728 |
Brown & Brown, Inc. | 22,060 | | 677,463 |
Genworth Financial, Inc. Class A (a) | 46,900 | | 816,060 |
Marsh & McLennan Companies, Inc. | 61,819 | | 3,203,461 |
MetLife, Inc. | 276,859 | | 15,382,286 |
MetLife, Inc. unit | 52,000 | | 1,660,880 |
Ping An Insurance (Group) Co. of China Ltd. (H Shares) | 13,000 | | 100,640 |
| | 23,941,518 |
Real Estate Investment Trusts - 0.5% |
CBL & Associates Properties, Inc. | 183,488 | | 3,486,272 |
First Potomac Realty Trust | 34,579 | | 453,676 |
Gaming & Leisure Properties | 16,100 | | 546,917 |
Sun Communities, Inc. | 53,700 | | 2,676,408 |
| | 7,163,273 |
Thrifts & Mortgage Finance - 0.3% |
MGIC Investment Corp. (a) | 62,400 | | 576,576 |
Radian Group, Inc. | 236,565 | | 3,503,528 |
| | 4,080,104 |
TOTAL FINANCIALS | | 257,388,545 |
HEALTH CARE - 10.1% |
Biotechnology - 1.1% |
Amgen, Inc. | 119,265 | | 14,117,398 |
Intercept Pharmaceuticals, Inc. (a) | 3,400 | | 804,542 |
| | 14,921,940 |
Health Care Equipment & Supplies - 1.6% |
Abbott Laboratories | 89,591 | | 3,664,272 |
Ansell Ltd. | 49,724 | | 929,774 |
ResMed, Inc. (d) | 52,930 | | 2,679,846 |
St. Jude Medical, Inc. | 55,570 | | 3,848,223 |
Common Stocks - continued |
| Shares | | Value |
HEALTH CARE - continued |
Health Care Equipment & Supplies - continued |
Steris Corp. | 10,900 | | $ 582,932 |
Stryker Corp. | 49,366 | | 4,162,541 |
The Cooper Companies, Inc. | 14,732 | | 1,996,628 |
Zimmer Holdings, Inc. | 33,200 | | 3,448,152 |
| | 21,312,368 |
Health Care Providers & Services - 1.9% |
Fresenius Medical Care AG & Co. KGaA | 21,100 | | 1,419,635 |
McKesson Corp. | 53,025 | | 9,873,785 |
Patterson Companies, Inc. | 72,477 | | 2,863,566 |
Quest Diagnostics, Inc. (d) | 87,831 | | 5,154,801 |
UnitedHealth Group, Inc. | 75,378 | | 6,162,152 |
| | 25,473,939 |
Health Care Technology - 0.1% |
Quality Systems, Inc. | 53,959 | | 866,042 |
Life Sciences Tools & Services - 0.0% |
Lonza Group AG | 6,742 | | 733,652 |
Pharmaceuticals - 5.4% |
AbbVie, Inc. | 122,979 | | 6,940,935 |
Astellas Pharma, Inc. | 163,300 | | 2,147,488 |
AstraZeneca PLC sponsored ADR | 7,400 | | 549,894 |
GlaxoSmithKline PLC sponsored ADR | 247,340 | | 13,227,743 |
Johnson & Johnson | 196,374 | | 20,544,648 |
Merck & Co., Inc. | 114,555 | | 6,627,007 |
Novartis AG sponsored ADR | 87,032 | | 7,879,007 |
Sanofi SA | 35,610 | | 3,784,971 |
Teva Pharmaceutical Industries Ltd. sponsored ADR | 185,949 | | 9,747,447 |
Zoetis, Inc. Class A | 63,200 | | 2,039,464 |
| | 73,488,604 |
TOTAL HEALTH CARE | | 136,796,545 |
INDUSTRIALS - 11.4% |
Aerospace & Defense - 2.0% |
Meggitt PLC | 414,600 | | 3,590,305 |
Rolls-Royce Group PLC | 159,489 | | 2,917,830 |
The Boeing Co. | 103,479 | | 13,165,633 |
United Technologies Corp. | 68,420 | | 7,899,089 |
| | 27,572,857 |
Common Stocks - continued |
| Shares | | Value |
INDUSTRIALS - continued |
Air Freight & Logistics - 1.7% |
C.H. Robinson Worldwide, Inc. | 73,413 | | $ 4,683,015 |
PostNL NV (a) | 131,000 | | 618,855 |
United Parcel Service, Inc. Class B | 170,470 | | 17,500,450 |
| | 22,802,320 |
Airlines - 0.0% |
Copa Holdings SA Class A | 4,300 | | 613,051 |
Commercial Services & Supplies - 0.5% |
ADT Corp. (d) | 100,900 | | 3,525,446 |
KAR Auction Services, Inc. | 93,297 | | 2,973,375 |
Ritchie Brothers Auctioneers, Inc. | 3,870 | | 95,385 |
| | 6,594,206 |
Electrical Equipment - 0.4% |
General Cable Corp. | 43,697 | | 1,121,265 |
Hubbell, Inc. Class B | 38,437 | | 4,733,517 |
| | 5,854,782 |
Industrial Conglomerates - 3.0% |
General Electric Co. | 1,569,766 | | 41,253,450 |
Machinery - 0.3% |
Ingersoll-Rand PLC | 59,324 | | 3,708,343 |
Stanley Black & Decker, Inc. | 6,000 | | 526,920 |
Valmont Industries, Inc. | 2,700 | | 410,265 |
| | 4,645,528 |
Professional Services - 0.5% |
Acacia Research Corp. | 93,900 | | 1,666,725 |
Bureau Veritas SA (d) | 148,550 | | 4,123,111 |
Exova Group Ltd. PLC (a) | 138,200 | | 581,828 |
| | 6,371,664 |
Road & Rail - 2.3% |
CSX Corp. | 431,612 | | 13,297,966 |
J.B. Hunt Transport Services, Inc. | 103,165 | | 7,611,514 |
Kansas City Southern | 16,000 | | 1,720,160 |
Norfolk Southern Corp. | 62,680 | | 6,457,920 |
TransForce, Inc. | 64,800 | | 1,492,091 |
| | 30,579,651 |
Trading Companies & Distributors - 0.7% |
Beijer Ref AB Series B | 9,747 | | 221,737 |
Brenntag AG | 3,300 | | 589,689 |
Common Stocks - continued |
| Shares | | Value |
INDUSTRIALS - continued |
Trading Companies & Distributors - continued |
W.W. Grainger, Inc. | 18,770 | | $ 4,772,648 |
Watsco, Inc. | 35,051 | | 3,601,841 |
| | 9,185,915 |
TOTAL INDUSTRIALS | | 155,473,424 |
INFORMATION TECHNOLOGY - 19.4% |
Communications Equipment - 2.4% |
Cisco Systems, Inc. | 843,740 | | 20,966,939 |
QUALCOMM, Inc. | 148,110 | | 11,730,312 |
| | 32,697,251 |
Internet Software & Services - 2.9% |
Google, Inc.: | | | |
Class A (a) | 29,759 | | 17,399,195 |
Class C (a) | 26,759 | | 15,393,918 |
Yahoo!, Inc. (a) | 199,386 | | 7,004,430 |
| | 39,797,543 |
IT Services - 4.8% |
Amadeus IT Holding SA Class A | 6,200 | | 255,709 |
Cognizant Technology Solutions Corp. Class A (a) | 115,602 | | 5,654,094 |
Computer Sciences Corp. | 91,387 | | 5,775,658 |
Fidelity National Information Services, Inc. | 67,511 | | 3,695,552 |
IBM Corp. | 27,474 | | 4,980,212 |
MasterCard, Inc. Class A | 163,750 | | 12,030,713 |
Paychex, Inc. | 387,714 | | 16,113,394 |
Quindell PLC | 233,420 | | 918,792 |
The Western Union Co. | 196,830 | | 3,413,032 |
Visa, Inc. Class A | 59,770 | | 12,594,137 |
| | 65,431,293 |
Semiconductors & Semiconductor Equipment - 1.6% |
Applied Materials, Inc. | 383,226 | | 8,641,746 |
Broadcom Corp. Class A | 292,137 | | 10,844,125 |
Maxim Integrated Products, Inc. | 78,345 | | 2,648,844 |
| | 22,134,715 |
Software - 3.3% |
Microsoft Corp. | 1,031,708 | | 43,022,224 |
Oracle Corp. | 36,713 | | 1,487,978 |
| | 44,510,202 |
Common Stocks - continued |
| Shares | | Value |
INFORMATION TECHNOLOGY - continued |
Technology Hardware, Storage & Peripherals - 4.4% |
Apple, Inc. | 547,406 | | $ 50,870,440 |
EMC Corp. | 181,223 | | 4,773,414 |
First Data Holdings, Inc. Class B (h)(i) | 911,424 | | 3,645,696 |
| | 59,289,550 |
TOTAL INFORMATION TECHNOLOGY | | 263,860,554 |
MATERIALS - 3.5% |
Chemicals - 3.0% |
Airgas, Inc. | 68,919 | | 7,505,968 |
E.I. du Pont de Nemours & Co. | 66,130 | | 4,327,547 |
FMC Corp. | 49,671 | | 3,536,078 |
Johnson Matthey PLC | 19,562 | | 1,037,831 |
Methanex Corp. | 12,200 | | 754,261 |
Monsanto Co. | 99,214 | | 12,375,954 |
Potash Corp. of Saskatchewan, Inc. | 37,310 | | 1,418,902 |
Royal DSM NV | 33,362 | | 2,429,857 |
Syngenta AG (Switzerland) | 15,636 | | 5,776,709 |
Tronox Ltd. Class A | 37,589 | | 1,011,144 |
| | 40,174,251 |
Metals & Mining - 0.5% |
Freeport-McMoRan Copper & Gold, Inc. | 187,300 | | 6,836,450 |
SunCoke Energy Partners LP | 19,138 | | 577,968 |
| | 7,414,418 |
TOTAL MATERIALS | | 47,588,669 |
TELECOMMUNICATION SERVICES - 1.9% |
Diversified Telecommunication Services - 1.9% |
Verizon Communications, Inc. | 534,359 | | 26,146,186 |
UTILITIES - 0.0% |
Electric Utilities - 0.0% |
ITC Holdings Corp. | 16,730 | | 610,310 |
TOTAL COMMON STOCKS (Cost $1,189,349,566) | 1,345,876,849 |
Convertible Preferred Stocks - 0.6% |
| Shares | | Value |
CONSUMER DISCRETIONARY - 0.0% |
Leisure Products - 0.0% |
NJOY, Inc. Series D (i) | 12,494 | | $ 211,475 |
HEALTH CARE - 0.6% |
Health Care Equipment & Supplies - 0.6% |
Alere, Inc. 3.00% | 26,487 | | 8,339,697 |
TOTAL CONVERTIBLE PREFERRED STOCKS (Cost $7,402,337) | 8,551,172 |
Convertible Bonds - 0.2% |
| Principal Amount (g) | | |
ENERGY - 0.2% |
Oil, Gas & Consumable Fuels - 0.2% |
Amyris, Inc.: | | | | |
3% 2/27/17 | | $ 820,000 | | 682,601 |
5% 10/15/18 (i) | | 750,000 | | 599,700 |
Peabody Energy Corp. 4.75% 12/15/41 | | 1,920,000 | | 1,441,200 |
TOTAL CONVERTIBLE BONDS (Cost $2,960,958) | 2,723,501 |
Preferred Securities - 0.1% |
|
FINANCIALS - 0.1% |
Diversified Financial Services - 0.1% |
Baggot Securities Ltd. 10.24% (e)(f) | |
(Cost $829,241) | EUR | 540,000 | 840,539 |
Money Market Funds - 2.0% |
| Shares | | Value |
Fidelity Cash Central Fund, 0.11% (b) | 4,952,255 | | $ 4,952,255 |
Fidelity Securities Lending Cash Central Fund, 0.10% (b)(c) | 22,221,038 | | 22,221,038 |
TOTAL MONEY MARKET FUNDS (Cost $27,173,293) | 27,173,293 |
TOTAL INVESTMENT PORTFOLIO - 102.0% (Cost $1,227,715,395) | | 1,385,165,354 |
NET OTHER ASSETS (LIABILITIES) - (2.0)% | | (27,310,860) |
NET ASSETS - 100% | $ 1,357,854,494 |
Currency Abbreviations |
EUR | - | European Monetary Unit |
Legend |
(a) Non-income producing |
(b) Affiliated fund that is generally available only to investment companies and other accounts managed by Fidelity Investments. The rate quoted is the annualized seven-day yield of the fund at period end. A complete unaudited listing of the fund's holdings as of its most recent quarter end is available upon request. In addition, each Fidelity Central Fund's financial statements, which are not covered by the Fund's Report of Independent Registered Public Accounting Firm, are available on the SEC's website or upon request. |
(c) Investment made with cash collateral received from securities on loan. |
(d) Security or a portion of the security is on loan at period end. |
(e) Security exempt from registration under Rule 144A of the Securities Act of 1933. These securities may be resold in transactions exempt from registration, normally to qualified institutional buyers. At the end of the period, the value of these securities amounted to $840,539 or 0.1% of net assets. |
(f) Security is perpetual in nature with no stated maturity date. |
(g) Amount is stated in United States dollars unless otherwise noted. |
(h) Security or a portion of the security purchased on a delayed delivery or when-issued basis. |
(i) Restricted securities - Investment in securities not registered under the Securities Act of 1933 (excluding 144A issues). At the end of the period, the value of restricted securities (excluding 144A issues) amounted to $4,456,871 or 0.3% of net assets. |
Additional information on each restricted holding is as follows: |
Security | Acquisition Date | Acquisition Cost |
Amyris, Inc. 5% 10/15/18 | 10/16/13 | $ 750,000 |
First Data Holdings, Inc. Class B | 6/26/14 | $ 3,645,696 |
NJOY, Inc. Series D | 2/14/14 | $ 211,475 |
Affiliated Central Funds |
Information regarding fiscal year to date income earned by the Fund from investments in Fidelity Central Funds is as follows: |
Fund | Income earned |
Fidelity Cash Central Fund | $ 4,605 |
Fidelity Securities Lending Cash Central Fund | 111,543 |
Total | $ 116,148 |
Other Information |
The following is a summary of the inputs used, as of June 30, 2014, involving the Fund's assets and liabilities carried at fair value. The inputs or methodology used for valuing securities may not be an indication of the risk associated with investing in those securities. For more information on valuation inputs, and their aggregation into the levels used in the table below, please refer to the Investment Valuation section in the accompanying Notes to Financial Statements. |
Valuation Inputs at Reporting Date: |
Description | Total | Level 1 | Level 2 | Level 3 |
Investments in Securities: | | | | |
Equities: | | | | |
Consumer Discretionary | $ 133,021,359 | $ 132,809,884 | $ - | $ 211,475 |
Consumer Staples | 165,384,853 | 160,921,042 | 4,463,811 | - |
Energy | 159,817,879 | 159,817,879 | - | - |
Financials | 257,388,545 | 255,727,665 | 1,660,880 | - |
Health Care | 145,136,242 | 137,784,148 | 7,352,094 | - |
Industrials | 155,473,424 | 155,473,424 | - | - |
Information Technology | 263,860,554 | 260,214,858 | - | 3,645,696 |
Materials | 47,588,669 | 41,811,960 | 5,776,709 | - |
Telecommunication Services | 26,146,186 | 26,146,186 | - | - |
Utilities | 610,310 | 610,310 | - | - |
Corporate Bonds | 2,723,501 | - | 2,723,501 | - |
Preferred Securities | 840,539 | - | 840,539 | - |
Money Market Funds | 27,173,293 | 27,173,293 | - | - |
Total Investments in Securities: | $ 1,385,165,354 | $ 1,358,490,649 | $ 22,817,534 | $ 3,857,171 |
Distribution of investments by country or territory of incorporation, as a percentage of total net assets, is as follows (Unaudited): |
United States of America | 86.5% |
United Kingdom | 6.3% |
Canada | 2.4% |
Switzerland | 1.0% |
Others (Individually Less Than 1%) | 3.8% |
| 100.0% |
See accompanying notes which are an integral part of the financial statements.
Annual Report
Statement of Assets and Liabilities
| June 30, 2014 |
| | |
Assets | | |
Investment in securities, at value (including securities loaned of $21,711,703) - See accompanying schedule: Unaffiliated issuers (cost $1,200,542,102) | $ 1,357,992,061 | |
Fidelity Central Funds (cost $27,173,293) | 27,173,293 | |
Total Investments (cost $1,227,715,395) | | $ 1,385,165,354 |
Cash | | 265,498 |
Receivable for investments sold | | |
Regular delivery | | 11,497,611 |
Delayed delivery | | 29,948 |
Receivable for fund shares sold | | 23,057 |
Dividends receivable | | 1,948,442 |
Interest receivable | | 33,854 |
Distributions receivable from Fidelity Central Funds | | 20,985 |
Other affiliated receivables | | 10,596 |
Other receivables | | 6,325 |
Total assets | | 1,399,001,670 |
| | |
Liabilities | | |
Payable for investments purchased | | |
Regular delivery | $ 8,013,661 | |
Delayed delivery | 3,645,696 | |
Payable for fund shares redeemed | 6,423,834 | |
Accrued management fee | 508,601 | |
Other affiliated payables | 230,212 | |
Other payables and accrued expenses | 104,134 | |
Collateral on securities loaned, at value | 22,221,038 | |
Total liabilities | | 41,147,176 |
| | |
Net Assets | | $ 1,357,854,494 |
Net Assets consist of: | | |
Paid in capital | | $ 1,168,192,307 |
Undistributed net investment income | | 6,351,276 |
Accumulated undistributed net realized gain (loss) on investments and foreign currency transactions | | 25,859,566 |
Net unrealized appreciation (depreciation) on investments and assets and liabilities in foreign currencies | | 157,451,345 |
Net Assets, for 98,894,100 shares outstanding | | $ 1,357,854,494 |
Net Asset Value, offering price and redemption price per
share ($1,357,854,494 ÷ 98,894,100 shares) | | $ 13.73 |
See accompanying notes which are an integral part of the financial statements.
Annual Report
Financial Statements - continued
Statement of Operations
| Year ended June 30, 2014 |
| | |
Investment Income | | |
Dividends | | $ 26,278,386 |
Interest | | 201,156 |
Income from Fidelity Central Funds | | 116,148 |
Total income | | 26,595,690 |
| | |
Expenses | | |
Management fee | $ 4,826,606 | |
Transfer agent fees | 1,901,594 | |
Accounting and security lending fees | 348,272 | |
Custodian fees and expenses | 119,141 | |
Independent trustees' compensation | 3,941 | |
Registration fees | 27,894 | |
Audit | 44,284 | |
Legal | 2,103 | |
Interest | 2,960 | |
Miscellaneous | 3,171 | |
Total expenses before reductions | 7,279,966 | |
Expense reductions | (16,989) | 7,262,977 |
Net investment income (loss) | | 19,332,713 |
Realized and Unrealized Gain (Loss) Net realized gain (loss) on: | | |
Investment securities: | | |
Unaffiliated issuers | 35,035,946 | |
Foreign currency transactions | (6,559) | |
Futures contracts | (39,243) | |
Total net realized gain (loss) | | 34,990,144 |
Change in net unrealized appreciation (depreciation) on: Investment securities | 137,214,729 | |
Assets and liabilities in foreign currencies | 1,386 | |
Total change in net unrealized appreciation (depreciation) | | 137,216,115 |
Net gain (loss) | | 172,206,259 |
Net increase (decrease) in net assets resulting from operations | | $ 191,538,972 |
See accompanying notes which are an integral part of the financial statements.
Annual Report
Statement of Changes in Net Assets
| Year ended
June 30,
2014 | For the period
December 6, 2012
(commencement of
operations) to
June 30, 2013 |
Increase (Decrease) in Net Assets | | |
Operations | | |
Net investment income (loss) | $ 19,332,713 | $ 1,224,506 |
Net realized gain (loss) | 34,990,144 | 2,233,113 |
Change in net unrealized appreciation (depreciation) | 137,216,115 | 20,235,230 |
Net increase (decrease) in net assets resulting
from operations | 191,538,972 | 23,692,849 |
Distributions to shareholders from net investment income | (13,325,330) | (136,030) |
Distributions to shareholders from net realized gain | (12,109,121) | - |
Total distributions | (25,434,451) | (136,030) |
Share transactions
Proceeds from sales of shares | 1,214,105,931 | 157,115,877 |
Reinvestment of distributions | 25,434,451 | 136,030 |
Cost of shares redeemed | (217,746,396) | (10,852,739) |
Net increase (decrease) in net assets resulting from share transactions | 1,021,793,986 | 146,399,168 |
Total increase (decrease) in net assets | 1,187,898,507 | 169,955,987 |
| | |
Net Assets | | |
Beginning of period | 169,955,987 | - |
End of period (including undistributed net investment income of $6,351,276 and undistributed net investment income of $1,086,549, respectively) | $ 1,357,854,494 | $ 169,955,987 |
Other Information Shares | | |
Sold | 99,056,916 | 15,645,460 |
Issued in reinvestment of distributions | 2,006,948 | 13,468 |
Redeemed | (16,855,464) | (973,228) |
Net increase (decrease) | 84,208,400 | 14,685,700 |
See accompanying notes which are an integral part of the financial statements.
Annual Report
Financial Highlights
Years ended June 30, | 2014 | 2013 G |
Selected Per-Share Data | | |
Net asset value, beginning of period | $ 11.57 | $ 10.00 |
Income from Investment Operations | | |
Net investment income (loss) D | .23 | .08 |
Net realized and unrealized gain (loss) | 2.33 | 1.50 |
Total from investment operations | 2.56 | 1.58 |
Distributions from net investment income | (.15) | (.01) |
Distributions from net realized gain | (.25) | - |
Total distributions | (.40) | (.01) |
Net asset value, end of period | $ 13.73 | $ 11.57 |
Total ReturnB, C | 22.48% | 15.80% |
Ratios to Average Net AssetsE,H | | |
Expenses before reductions | .69% | .84%A |
Expenses net of fee waivers, if any | .69% | .84%A |
Expenses net of all reductions | .69% | .83%A |
Net investment income (loss) | 1.83% | 1.33% A |
Supplemental Data | | |
Net assets, end of period (000 omitted) | $ 1,357,854 | $ 169,956 |
Portfolio turnover rateF | 60% I | 50% A |
A Annualized
B Total returns for periods of less than one year are not annualized.
C Total returns would have been lower if certain expenses had not been reduced during the applicable periods shown.
D Calculated based on average shares outstanding during the period.
E Fees and expenses of any underlying Fidelity Central Funds are not included in the Fund's expense ratio. The Fund indirectly bears its proportionate share of the expenses of any underlying Fidelity Central Funds.
F Amount does not include the portfolio activity of any underlying Fidelity Central Funds.
G For the period December 6, 2012 (commencement of operations) to June 30, 2013.
H Expense ratios reflect operating expenses of the Fund. Expenses before reductions do not reflect amounts reimbursed by the investment adviser or reductions from brokerage service arrangements or reductions from other expense offset arrangements and do not represent the amount paid by the Fund during periods when reimbursements or reductions occur. Expense ratios before reductions for start-up periods may not be representative of longer term operating periods. Expenses net of fee waivers reflect expenses after reimbursement by the investment adviser but prior to reductions from brokerage service arrangements or other expense offset arrangements. Expenses net of all reductions represent the net expenses paid by the Fund.
I Portfolio turnover rate excludes securities received or delivered in-kind.
See accompanying notes which are an integral part of the financial statements.
Annual Report
Notes to Financial Statements
For the period ended June 30, 2014
1. Organization.
Fidelity Advisor Series Growth & Income Fund (the Fund) is a fund of Fidelity Hastings Street Trust (the Trust) and is authorized to issue an unlimited number of shares. Shares of the Fund are only available for purchase by mutual funds for which Fidelity Management & Research Company (FMR) or an affiliate serves as an investment manager. The Trust is registered under the Investment Company Act of 1940, as amended (the 1940 Act), as an open-end management investment company organized as a Massachusetts business trust.
2. Investments in Fidelity Central Funds.
The Fund invests in Fidelity Central Funds, which are open-end investment companies generally available only to other investment companies and accounts managed by the investment adviser and its affiliates. The Fund's Schedule of Investments lists each of the Fidelity Central Funds held as of period end, if any, as an investment of the Fund, but does not include the underlying holdings of each Fidelity Central Fund. As an Investing Fund, the Fund indirectly bears its proportionate share of the expenses of the underlying Fidelity Central Funds.
The Money Market Central Funds seek preservation of capital and current income and are managed by Fidelity Investments Money Management, Inc. (FIMM), an affiliate of the investment adviser. Annualized expenses of the Money Market Central Funds as of their most recent shareholder report date are less than .01%.
A complete unaudited list of holdings for each Fidelity Central Fund is available upon request or at the Securities and Exchange Commission (the SEC) website at www.sec.gov. In addition, the financial statements of the Fidelity Central Funds, which are not covered by the Fund's Report of Independent Registered Public Accounting Firm, are available on the SEC website or upon request.
3. Significant Accounting Policies.
The financial statements have been prepared in conformity with accounting principles generally accepted in the United States of America (GAAP), which require management to make certain estimates and assumptions at the date of the financial statements. Actual results could differ from those estimates. Subsequent events, if any, through the date that the financial statements were issued have been evaluated in the preparation of the financial statements. The following summarizes the significant accounting policies of the Fund:
Investment Valuation. Investments are valued as of 4:00 p.m. Eastern time on the last calendar day of the period. In accordance with valuation policies and procedures approved by the Board of Trustees (the Board), the Fund attempts to obtain prices from one or more third party pricing vendors or brokers to value its investments. When
Annual Report
Notes to Financial Statements - continued
3. Significant Accounting Policies - continued
Investment Valuation - continued
current market prices, quotations or currency exchange rates are not readily available or reliable, investments will be fair valued in good faith by the FMR Fair Value Committee (the Committee), in accordance with procedures adopted by the Board. Factors used in determining fair value vary by investment type and may include market or investment specific events, changes in interest rates and credit quality. The frequency with which these procedures are used cannot be predicted and they may be utilized to a significant extent. The Committee oversees the Fund's valuation policies and procedures and is responsible for approving and reporting to the Board all fair value determinations.
The Fund categorizes the inputs to valuation techniques used to value its investments into a disclosure hierarchy consisting of three levels as shown below:
Level 1 - quoted prices in active markets for identical investments
Level 2 - other significant observable inputs (including quoted prices for similar investments, interest rates, prepayment speeds, etc.)
Level 3 - unobservable inputs (including the Fund's own assumptions based on the best information available)
Valuation techniques used to value the Fund's investments by major category are as follows:
Equity securities, including restricted securities, for which market quotations are readily available, are valued at the last reported sale price or official closing price as reported by a third party pricing vendor on the primary market or exchange on which they are traded and are categorized as Level 1 in the hierarchy. In the event there were no sales during the day or closing prices are not available, securities are valued at the last quoted bid price or may be valued using the last available price and are generally categorized as Level 2 in the hierarchy. For foreign equity securities, when market or security specific events arise, comparisons to the valuation of American Depositary Receipts (ADRs), futures contracts, Exchange-Traded Funds (ETFs) and certain indexes as well as quoted prices for similar securities may be used and would be categorized as Level 2 in the hierarchy. Utilizing these techniques may result in transfers between Level 1 and Level 2. For equity securities, including restricted securities, where observable inputs are limited, assumptions about market activity and risk are used and these securities may be categorized as Level 3 in the hierarchy.
Debt securities, including restricted securities, are valued based on evaluated prices received from third party pricing vendors or from brokers who make markets in such securities. Corporate bonds and preferred securities are valued by pricing vendors who utilize matrix pricing which considers yield or price of bonds of comparable quality,
Annual Report
3. Significant Accounting Policies - continued
Investment Valuation - continued
coupon, maturity and type or by broker-supplied prices. When independent prices are unavailable or unreliable, debt securities may be valued utilizing pricing methodologies which consider similar factors that would be used by third party pricing vendors. Debt securities are generally categorized as Level 2 in the hierarchy but may be Level 3 depending on the circumstances.
Investments in open-end mutual funds, including the Fidelity Central Funds, are valued at their closing net asset value (NAV) each business day and are categorized as Level 1 in the hierarchy.
Changes in valuation techniques may result in transfers in or out of an assigned level within the disclosure hierarchy. The aggregate value of investments by input level, as of June 30, 2014, is included at the end of the Fund's Schedule of Investments.
Foreign Currency. The Fund may use foreign currency contracts to facilitate transactions in foreign-denominated securities. Gains and losses from these transactions may arise from changes in the value of the foreign currency or if the counterparties do not perform under the contracts' terms.
Foreign-denominated assets, including investment securities, and liabilities are translated into U.S. dollars at the exchange rates at period end. Purchases and sales of investment securities, income and dividends received and expenses denominated in foreign currencies are translated into U.S. dollars at the exchange rate in effect on the transaction date.
The effects of exchange rate fluctuations on investments are included with the net realized and unrealized gain (loss) on investment securities. Other foreign currency transactions resulting in realized and unrealized gain (loss) are disclosed separately.
Investment Transactions and Income. For financial reporting purposes, the Fund's investment holdings and NAV include trades executed through the end of the last business day of the period. The NAV per share for processing shareholder transactions is calculated as of the close of business of the New York Stock Exchange (NYSE), normally 4:00 p.m. Eastern time and includes trades executed through the end of the prior business day. Gains and losses on securities sold are determined on the basis of identified cost and may include proceeds received from litigation. Dividend income is recorded on the ex-dividend date, except for certain dividends from foreign securities where the ex-dividend date may have passed, which are recorded as soon as the Fund is informed of the ex-dividend date. Non-cash dividends included in dividend income, if any, are recorded at the fair market value of the securities received. Income and capital gain distributions from Fidelity Central Funds, if any, are recorded on the ex-dividend date. Distributions received on securities that represent a return of capital or capital gain are
Annual Report
Notes to Financial Statements - continued
3. Significant Accounting Policies - continued
Investment Transactions and Income - continued
recorded as a reduction of cost of investments and/or as a realized gain. Subsequent to ex-dividend date the Fund determines the components of these distributions, based upon receipt of tax filings or other correspondence relating to the underlying investment. Interest income is accrued as earned and includes coupon interest and amortization of premium and accretion of discount on debt securities as applicable. Investment income is recorded net of foreign taxes withheld where recovery of such taxes is uncertain.
Expenses. Expenses directly attributable to a fund are charged to that fund. Expenses attributable to more than one fund are allocated among the respective funds on the basis of relative net assets or other appropriate methods. Expense estimates are accrued in the period to which they relate and adjustments are made when actual amounts are known.
Income Tax Information and Distributions to Shareholders. Each year, the Fund intends to qualify as a regulated investment company under Subchapter M of the Internal Revenue Code, including distributing substantially all of its taxable income and realized gains. As a result, no provision for U.S. Federal income taxes is required. As of June 30, 2014, the Fund did not have any unrecognized tax benefits in the financial statements; nor is the Fund aware of any tax positions for which it is reasonably possible that the total amounts of unrecognized tax benefits will significantly change in the next twelve months. The Fund files a U.S. federal tax return, in addition to state and local tax returns as required. The Fund's federal income tax returns are subject to examination by the Internal Revenue Service (IRS) for a period of three fiscal years after they are filed. State and local tax returns may be subject to examination for an additional fiscal year depending on the jurisdiction. Foreign taxes are provided for based on the Fund's understanding of the tax rules and rates that exist in the foreign markets in which it invests.
Distributions are declared and recorded on the ex-dividend date. Income and capital gain distributions are determined in accordance with income tax regulations, which may differ from GAAP.
Capital accounts within the financial statements are adjusted for permanent book-tax differences. These adjustments have no impact on net assets or the results of operations. Capital accounts are not adjusted for temporary book-tax differences which will reverse in a subsequent period.
Book-tax differences are primarily due to futures contracts, foreign currency transactions, market discount, equity-debt classifications, partnerships and losses deferred due to wash sales.
Annual Report
3. Significant Accounting Policies - continued
Income Tax Information and Distributions to Shareholders - continued
The federal tax cost of investment securities and unrealized appreciation (depreciation) as of period end were as follows:
Gross unrealized appreciation | $ 171,073,254 |
Gross unrealized depreciation | (14,648,301) |
Net unrealized appreciation (depreciation) on securities and other investments | $ 156,424,953 |
| |
Tax Cost | $ 1,228,740,401 |
The tax-based components of distributable earnings as of period end were as follows:
Undistributed ordinary income | $ 27,345,042 |
Undistributed long-term capital gain | $ 5,896,683 |
Net unrealized appreciation (depreciation) | $ 156,426,339 |
The tax character of distributions paid was as follows:
| June 30, 2014 | June 30, 2013 |
Ordinary Income | $ 25,434,451 | $ 136,030 |
Delayed Delivery Transactions and When-Issued Securities. During the period, the Fund transacted in securities on a delayed delivery or when-issued basis. Payment and delivery may take place after the customary settlement period for that security. The price of the underlying securities and the date when the securities will be delivered and paid for are fixed at the time the transaction is negotiated. The securities purchased on a delayed delivery or when-issued basis are identified as such in the Fund's Schedule of Investments. The Fund may receive compensation for interest forgone in the purchase of a delayed delivery or when-issued security. With respect to purchase commitments, the Fund identifies securities as segregated in its records with a value at least equal to the amount of the commitment. Losses may arise due to changes in the value of the underlying securities or if the counterparty does not perform under the contract's terms, or if the issuer does not issue the securities due to political, economic, or other factors.
Restricted Securities. The Fund may invest in securities that are subject to legal or contractual restrictions on resale. These securities generally may be resold in transactions exempt from registration or to the public if the securities are registered. Disposal of these securities may involve time-consuming negotiations and expense, and prompt sale at an acceptable price may be difficult. Information regarding restricted securities is included at the end of the Fund's Schedule of Investments.
Annual Report
Notes to Financial Statements - continued
4. Derivative Instruments.
Risk Exposures and the Use of Derivative Instruments. The Fund's investment objective allows the Fund to enter into various types of derivative contracts, including futures contracts. Derivatives are investments whose value is primarily derived from underlying assets, indices or reference rates and may be transacted on an exchange or over-the-counter (OTC). Derivatives may involve a future commitment to buy or sell a specified asset based on specified terms, to exchange future cash flows at periodic intervals based on a notional principal amount, or for one party to make one or more payments upon the occurrence of specified events in exchange for periodic payments from the other party.
The Fund used derivatives to increase returns and to manage exposure to certain risks as defined below. The success of any strategy involving derivatives depends on analysis of numerous economic factors, and if the strategies for investment do not work as intended, the Fund may not achieve its objectives.
The Fund's use of derivatives increased or decreased its exposure to the following risk:
Equity Risk | Equity risk relates to the fluctuations in the value of financial instruments as a result of changes in market prices (other than those arising from interest rate risk or foreign exchange risk), whether caused by factors specific to an individual investment, its issuer, or all factors affecting all instruments traded in a market or market segment. |
The Fund is also exposed to additional risks from investing in derivatives, such as liquidity risk and counterparty credit risk. Liquidity risk is the risk that the Fund will be unable to close out the derivative in the open market in a timely manner. Counterparty credit risk is the risk that the counterparty will not be able to fulfill its obligation to the Fund. Counterparty credit risk related to exchange-traded futures contracts may be mitigated by the protection provided by the exchange on which they trade.
Investing in derivatives may involve greater risks than investing in the underlying assets directly and, to varying degrees, may involve risk of loss in excess of any initial investment and collateral received and amounts recognized in the Statement of Assets and Liabilities. In addition, there may be the risk that the change in value of the derivative contract does not correspond to the change in value of the underlying instrument.
Futures Contracts. A futures contract is an agreement between two parties to buy or sell a specified underlying instrument for a fixed price at a specified future date. The Fund used futures contracts to manage its exposure to the stock market.
Upon entering into a futures contract, a fund is required to deposit either cash or securities (initial margin) with a clearing broker in an amount equal to a certain percentage of the face value of the contract. Futures contracts are marked-to-market daily and subsequent daily payments (variation margin) are made or received by a fund depending on the daily fluctuations in the value of the futures contracts and are recorded as unrealized
Annual Report
4. Derivative Instruments - continued
Futures Contracts - continued
appreciation or (depreciation). This receivable and/or payable, if any, is included in daily variation margin for derivative instruments in the Statement of Assets and Liabilities. Realized gain or (loss) is recorded upon the expiration or closing of a futures contract.
Any open futures contracts at period end are presented in the Schedule of Investments under the caption "Futures Contracts." The underlying face amount at value reflects each contract's exposure to the underlying instrument or index at period end.
During the period the Fund recognized net realized gain (loss) of $(39,243) related to its investment in futures contracts. This amount is included in the Statement of Operations.
5. Purchases and Sales of Investments.
Purchases and sales of securities, other than short-term securities and in-kind transactions, aggregated $619,949,210 and $577,957,054, respectively.
6. Fees and Other Transactions with Affiliates.
Management Fee. Fidelity Management & Research Company (the investment adviser) and its affiliates provide the Fund with investment management related services for which the Fund pays a monthly management fee. The management fee is the sum of an individual fund fee rate that is based on an annual rate of .30% of the Fund's average net assets and an annualized group fee rate that averaged .25% during the period. The group fee rate is based upon the average net assets of all the mutual funds advised by the investment adviser, including any mutual funds previously advised by the investment adviser that are currently advised by Fidelity SelectCo, LLC, an affiliate of the investment adviser. The group fee rate decreases as assets under management increase and increases as assets under management decrease. In addition, the management fee would have been subject to a performance adjustment effective December 1, 2013. However, effective August 1, 2013, the performance adjustment was removed and the individual fund fee rate decreased from .30% to .20% of the Fund's average net assets. For the reporting period, the total annual management fee rate was .46% of the Fund's average net assets.
Transfer Agent Fees. Fidelity Investments Institutional Operations Company, Inc. (FIIOC), an affiliate of the investment adviser, is the Fund's transfer, dividend disbursing and shareholder servicing agent. FIIOC receives account fees and asset-based fees that vary according to account size and type of account. FIIOC pays for typesetting, printing and mailing of shareholder reports, except proxy statements. For the period, the transfer agent fees were equivalent to an annual rate of .18% of average net assets.
Annual Report
Notes to Financial Statements - continued
6. Fees and Other Transactions with Affiliates - continued
Accounting and Security Lending Fees. Fidelity Service Company, Inc. (FSC), an affiliate of the investment adviser, maintains the Fund's accounting records. The accounting fee is based on the level of average net assets for each month. Under a separate contract, FSC administers the security lending program. The security lending fee is based on the number and duration of lending transactions.
Brokerage Commissions. The Fund placed a portion of its portfolio transactions with brokerage firms which are affiliates of the investment adviser. Brokerage commissions are included in net realized gain (loss) and change in net unrealized appreciation (depreciation) in the Statement of Operations. The commissions paid to these affiliated firms were $11,051 for the period.
Interfund Lending Program. Pursuant to an Exemptive Order issued by the SEC, the Fund, along with other registered investment companies having management contracts with FMR or other affiliated entities of FMR, may participate in an interfund lending program. This program provides an alternative credit facility allowing the funds to borrow from, or lend money to, other participating affiliated funds. At period end, there were no interfund loans outstanding. The Fund's activity in this program during the period for which loans were outstanding was as follows:
Borrower or Lender | Average Loan
Balance | Weighted Average Interest Rate | Interest Expense |
Borrower | $ 11,172,333 | .32% | $ 2,934 |
Exchanges In-Kind. During the period, certain investment companies managed by the investment adviser or its affiliates (Investing Funds) completed exchanges in-kind with the Fund. The Investing Funds delivered securities and other assets, including accrued interest, valued at $984,552,932 in exchange for 80,754,305 shares of the Fund. The amount of in-kind exchanges is included in share transactions in the accompanying Statement of Changes in Net Assets. The Fund recognized no gain or loss for federal income tax purposes.
7. Committed Line of Credit.
The Fund participates with other funds managed by the investment adviser or an affiliate in a $4.25 billion credit facility (the "line of credit") to be utilized for temporary or emergency purposes to fund shareholder redemptions or for other short-term liquidity purposes. The Fund has agreed to pay commitment fees on its pro-rata portion of the line of credit, which amounted to $1,421 and is reflected in Miscellaneous expenses on the Statement of Operations. During the period, the Fund did not borrow on this line of credit.
Annual Report
8. Security Lending.
The Fund lends portfolio securities through a lending agent from time to time in order to earn additional income. For equity securities, a lending agent is used and may loan securities to certain qualified borrowers, including Fidelity Capital Markets (FCM), a broker-dealer affiliated with the Fund. On the settlement date of the loan, the Fund receives collateral (in the form of U.S. Treasury obligations, letters of credit and/or cash) against the loaned securities and maintains collateral in an amount not less than 100% of the market value of the loaned securities during the period of the loan. The market value of the loaned securities is determined at the close of business of the Fund and any additional required collateral is delivered to the Fund on the next business day. If the borrower defaults on its obligation to return the securities loaned because of insolvency or other reasons, the Fund may apply collateral received from the borrower against the obligation. The Fund may experience delays and costs in recovering the securities loaned. Any cash collateral received is invested in the Fidelity Securities Lending Cash Central Fund. At period end, there were no security loans outstanding with FCM. Security lending income represents the income earned on investing cash collateral, less rebates paid to borrowers and any lending agent fees associated with the loan, plus any premium payments received for lending certain types of securities. Security lending income is presented in the Statement of Operations as a component of income from Fidelity Central Funds. Total security lending income during the period amounted to $111,543, including $3,037 from securities loaned to FCM.
9. Bank Borrowings.
The Fund is permitted to have bank borrowings for temporary or emergency purposes to fund shareholder redemptions or for other short-term liquidity requirements. The Fund has established borrowing arrangements with certain banks. The interest rate on the borrowings is the bank's base rate, as revised from time to time. The average loan balance during the period for which loans were outstanding amounted to $772,000. The weighted average interest rate was .60%. The interest expense amounted to $26 under the bank borrowing program. At period end, there were no bank borrowings outstanding.
10. Expense Reductions.
Commissions paid to certain brokers with whom the investment adviser, or its affiliates, places trades on behalf of the Fund include an amount in addition to trade execution, which may be rebated back to the Fund to offset certain expenses. This amount totaled $16,989 for the period.
Annual Report
Notes to Financial Statements - continued
11. Other.
The Fund's organizational documents provide former and current trustees and officers with a limited indemnification against liabilities arising in connection with the performance of their duties to the Fund. In the normal course of business, the Fund may also enter into contracts that provide general indemnifications. The Fund's maximum exposure under these arrangements is unknown as this would be dependent on future claims that may be made against the Fund. The risk of material loss from such claims is considered remote.
At the end of the period, mutual funds managed by the investment adviser or its affiliates were the owners of record of all of the outstanding shares of the Fund.
Annual Report
To the Trustees of Fidelity Hastings Street Trust and the Shareholders of Fidelity Advisor Series Growth & Income Fund:
In our opinion, the accompanying statement of assets and liabilities, including the schedule of investments, and the related statements of operations and of changes in net assets and the financial highlights present fairly, in all material respects, the financial position of Fidelity Advisor Series Growth & Income Fund (a fund of Fidelity Hastings Street Trust) at June 30, 2014, the results of its operations for the year then ended, the changes in its net assets for each of the periods indicated and the financial highlights for each of the periods indicated, in conformity with accounting principles generally accepted in the United States of America. These financial statements and financial highlights (hereafter referred to as "financial statements") are the responsibility of the Fidelity Advisor Series Growth & Income Fund's management. Our responsibility is to express an opinion on these financial statements based on our audits. We conducted our audits of these financial statements in accordance with the standards of the Public Company Accounting Oversight Board (United States). Those standards require that we plan and perform the audit to obtain reasonable assurance about whether the financial statements are free of material misstatement. An audit includes examining, on a test basis, evidence supporting the amounts and disclosures in the financial statements, assessing the accounting principles used and significant estimates made by management, and evaluating the overall financial statement presentation. We believe that our audits, which included confirmation of securities at June 30, 2014 by correspondence with the custodian and brokers, provide a reasonable basis for our opinion.
PricewaterhouseCoopers LLP
Boston, Massachusetts
August 14, 2014
Annual Report
The Trustees, Member of the Advisory Board, and officers of the trust and fund, as applicable, are listed below. The Board of Trustees governs the fund and is responsible for protecting the interests of shareholders. The Trustees are experienced executives who meet periodically throughout the year to oversee the fund's activities, review contractual arrangements with companies that provide services to the fund, oversee management of the risks associated with such activities and contractual arrangements, and review the fund's performance. Except for James C. Curvey, each of the Trustees oversees 173 funds. Mr. Curvey oversees 397 funds.
The Trustees hold office without limit in time except that (a) any Trustee may resign; (b) any Trustee may be removed by written instrument, signed by at least two-thirds of the number of Trustees prior to such removal; (c) any Trustee who requests to be retired or who has become incapacitated by illness or injury may be retired by written instrument signed by a majority of the other Trustees; and (d) any Trustee may be removed at any special meeting of shareholders by a two-thirds vote of the outstanding voting securities of the trust. Each Trustee who is not an interested person (as defined in the 1940 Act) of the trust and the fund (Independent Trustee), shall retire not later than the last day of the calendar year in which his or her 75th birthday occurs. The Independent Trustees may waive this mandatory retirement age policy with respect to individual Trustees. The officers and Advisory Board Member hold office without limit in time, except that any officer and Advisory Board Member may resign or may be removed by a vote of a majority of the Trustees at any regular meeting or any special meeting of the Trustees. Except as indicated, each individual has held the office shown or other offices in the same company for the past five years.
Experience, Skills, Attributes, and Qualifications of the Fund's Trustees. The Governance and Nominating Committee has adopted a statement of policy that describes the experience, qualifications, attributes, and skills that are necessary and desirable for potential Independent Trustee candidates (Statement of Policy). The Board believes that each Trustee satisfied at the time he or she was initially elected or appointed a Trustee, and continues to satisfy, the standards contemplated by the Statement of Policy. The Governance and Nominating Committee also engages professional search firms to help identify potential Independent Trustee candidates who have the experience, qualifications, attributes, and skills consistent with the Statement of Policy. From time to time, additional criteria based on the composition and skills of the current Independent Trustees, as well as experience or skills that may be appropriate in light of future changes to board composition, business conditions, and regulatory or other developments, have also been considered by the professional search firms and the Governance and Nominating Committee. In addition, the Board takes into account the Trustees' commitment and participation in Board and committee meetings, as well as their leadership of standing and ad hoc committees throughout their tenure.
In determining that a particular Trustee was and continues to be qualified to serve as a Trustee, the Board has considered a variety of criteria, none of which, in isolation, was controlling. The Board believes that, collectively, the Trustees have balanced and diverse experience, qualifications, attributes, and skills, which allow the Board to operate effectively in governing the fund and protecting the interests of shareholders. Information about the specific experience, skills, attributes, and qualifications of each Trustee, which in each case led to the Board's conclusion that the Trustee should serve (or continue to serve) as a trustee of the fund, is provided below.
Annual Report
Board Structure and Oversight Function. James C. Curvey is an interested person (as defined in the 1940 Act) and currently serves as Chairman. The Trustees have determined that an interested Chairman is appropriate and benefits shareholders because an interested Chairman has a personal and professional stake in the quality and continuity of services provided to the fund. Independent Trustees exercise their informed business judgment to appoint an individual of their choosing to serve as Chairman, regardless of whether the Trustee happens to be independent or a member of management. The Independent Trustees have determined that they can act independently and effectively without having an Independent Trustee serve as Chairman and that a key structural component for assuring that they are in a position to do so is for the Independent Trustees to constitute a substantial majority for the Board. The Independent Trustees also regularly meet in executive session. Ned C. Lautenbach serves as Chairman of the Independent Trustees and as such (i) acts as a liaison between the Independent Trustees and management with respect to matters important to the Independent Trustees and (ii) with management prepares agendas for Board meetings.
Fidelity funds are overseen by different Boards of Trustees. The fund's Board oversees Fidelity's equity and high income funds and another Board oversees Fidelity's investment-grade bond, money market, and asset allocation funds. The asset allocation funds may invest in Fidelity funds overseen by the fund's Board. The use of separate Boards, each with its own committee structure, allows the Trustees of each group of Fidelity funds to focus on the unique issues of the funds they oversee, including common research, investment, and operational issues. On occasion, the separate Boards establish joint committees to address issues of overlapping consequences for the Fidelity funds overseen by each Board.
The Trustees operate using a system of committees to facilitate the timely and efficient consideration of all matters of importance to the Trustees, the fund, and fund shareholders and to facilitate compliance with legal and regulatory requirements and oversight of the fund's activities and associated risks. The Board, acting through its committees, has charged FMR and its affiliates with (i) identifying events or circumstances the occurrence of which could have demonstrably adverse effects on the fund's business and/or reputation; (ii) implementing processes and controls to lessen the possibility that such events or circumstances occur or to mitigate the effects of such events or circumstances if they do occur; and (iii) creating and maintaining a system designed to evaluate continuously business and market conditions in order to facilitate the identification and implementation processes described in (i) and (ii) above. Because the day-to-day operations and activities of the fund are carried out by or through FMR, its affiliates and other service providers, the fund's exposure to risks is mitigated but not eliminated by the processes overseen by the Trustees. While each of the Board's committees has responsibility for overseeing different aspects of the fund's activities, oversight is exercised primarily through the Operations, Audit, and Compliance Committees. In addition, the Independent Trustees have worked with FMR to enhance the Board's oversight of investment and financial risks, legal and regulatory risks, technology risks, and operational risks, including the development of additional risk reporting to the Board. For example, a working group comprised of Independent Trustees and FMR has worked and continues to work to review the Fidelity funds' valuation-related activities, reporting and risk management. Appropriate personnel, including but not limited to the fund's Chief Compliance Officer (CCO), FMR's internal auditor, the independent accountants, the fund's Treasurer and portfolio management personnel, make periodic reports to the Board's committees, as appropriate, including an annual review of FMR's risk management program for the Fidelity funds. The responsibilities of each standing committee, including their oversight responsibilities, are described further under "Standing Committees of the Fund's Trustees."
Annual Report
Trustees and Officers - continued
The fund's Statement of Additional Information (SAI) includes more information about the Trustees. To request a free copy, call Fidelity at 1-877-208-0098.
Interested Trustees*:
Correspondence intended for each Trustee who is an interested person may be sent to Fidelity Investments, 245 Summer Street, Boston, Massachusetts 02210.
Name, Year of Birth; Principal Occupations and Other Relevant Experience+ |
James C. Curvey (1935) |
Year of Election or Appointment: 2007 Trustee Chairman of the Board of Trustees |
| Mr. Curvey also serves as Trustee of other Fidelity funds. Mr. Curvey is a Director of Fidelity Research & Analysis Co. (2009-present), and Vice Chairman (2007-present) and Director of FMR LLC. In addition, Mr. Curvey serves as an Overseer for the Boston Symphony Orchestra and a member of the Trustees of Villanova University. Previously, Mr. Curvey served as a Director of Fidelity Investments Money Management, Inc. (2009-2014), a Director of FMR (2007-2014), a Director of FMR Co., Inc. (2007-2014) and was the Vice Chairman (2006-2007) and Director (2000-2007) of FMR Corp. |
Charles S. Morrison (1960) |
Year of Election or Appointment: 2014 Trustee |
| Mr. Morrison also serves as Trustee of other funds. He serves as President, Asset Management (2014-present) and is an employee of Fidelity Investments. Previously, Mr. Morrison served as Vice President of Fidelity's Fixed Income and Asset Allocation Funds (2012-2014), President, Fixed Income (2011-2014), Vice President of Fidelity's Money Market Funds (2005-2009), President, Money Market Group Leader of FMR (2009), and Senior Vice President, Money Market Group of FMR (2004-2009). Mr. Morrison also served as Vice President of Fidelity's Bond Funds (2002-2005), certain Balanced Funds (2002-2005), and certain Asset Allocation Funds (2002-2007), and as Senior Vice President (2002-2005) of Fidelity's Bond Division. |
* Trustees have been determined to be "Interested Trustees" by virtue of, among other things, their affiliation with the trust or various entities under common control with FMR.
+ The information above includes each Trustee's principal occupation during the last five years and other information relating to the experience, attributes, and skills relevant to each Trustee's qualifications to serve as a Trustee, which led to the conclusion that each Trustee should serve as a Trustee for the fund.
Annual Report
Trustees and Officers - continued
Independent Trustees:
Correspondence intended for each Independent Trustee (that is, the Trustees other than the Interested Trustees) may be sent to Fidelity Investments, P.O. Box 55235, Boston, Massachusetts 02205-5235.
Name, Year of Birth; Principal Occupations and Other Relevant Experience+ |
Dennis J. Dirks (1948) |
Year of Election or Appointment: 2005 Trustee |
| Mr. Dirks also serves as Trustee of other Fidelity funds. Prior to his retirement in May 2003, Mr. Dirks was Chief Operating Officer and a member of the Board of The Depository Trust & Clearing Corporation (DTCC). He also served as President, Chief Operating Officer, and Board member of The Depository Trust Company (DTC) and President and Board member of the National Securities Clearing Corporation (NSCC). In addition, Mr. Dirks served as Chief Executive Officer and Board member of the Government Securities Clearing Corporation, Chief Executive Officer and Board member of the Mortgage-Backed Securities Clearing Corporation, as a Trustee and a member of the Finance Committee of Manhattan College (2005-2008), and as a Trustee and a member of the Finance Committee of AHRC of Nassau County (2006-2008). Mr. Dirks is a member of the Independent Directors Council (IDC) Governing Council (2010-present) and Board of Directors for The Brookville Center for Children's Services, Inc. (2009-present). |
Alan J. Lacy (1953) |
Year of Election or Appointment: 2008 Trustee |
| Mr. Lacy also serves as Trustee of other Fidelity funds. Mr. Lacy serves as Senior Adviser (2007-present) of Oak Hill Capital Partners, L.P. (private equity). Mr. Lacy also served as Chief Executive Officer (2000-2005) and Vice Chairman (2005-2006) of Sears Holdings Corporation and Sears, Roebuck and Co. (retail). In addition, Mr. Lacy serves as a member of the Board of Directors of Dave & Buster's Entertainment, Inc. (restaurant and entertainment complexes, 2010-present), Earth Fare, Inc. (retail grocery, 2012-present), The Hillman Companies, Inc. (hardware wholesalers, 2010-present), and Bristol-Myers Squibb Company (global pharmaceuticals, 2008-present). Mr. Lacy is a member of the Board of Trustees of The National Parks Conservation Association (2006-present). Previously, Mr. Lacy served as Chairman of the Board of Trustees of the National Parks Conservation Association (2008-2011) and as a member of the Board of Directors for the Western Union Company (global money transfer, 2006-2011). |
Ned C. Lautenbach (1944) |
Year of Election or Appointment: 2000 Trustee Chairman of the Independent Trustees |
| Mr. Lautenbach also serves as Trustee of other Fidelity funds. Mr. Lautenbach currently serves as the Lead Director of the Eaton Corporation Board of Directors (diversified industrial, 1997-present). Mr. Lautenbach is Chairman of the Board of Directors of the Philharmonic Center for the Arts in Naples, Florida (2012-present) and a member of the Council on Foreign Relations (1994-present). Previously, Mr. Lautenbach was a Partner/Advisory Partner at Clayton, Dubilier & Rice, LLC (private equity investment, 1998-2010), as well as a Director of Sony Corporation (2006-2007). |
Joseph Mauriello (1944) |
Year of Election or Appointment: 2008 Trustee |
| Mr. Mauriello also serves as Trustee of other Fidelity funds. Prior to his retirement in January 2006, Mr. Mauriello served in numerous senior management positions including Deputy Chairman and Chief Operating Officer (2004-2005), and Vice Chairman of Financial Services (2002-2004) of KPMG LLP US (professional services, 1965-2005). Mr. Mauriello currently serves as a member of the Board of Directors of XL Group plc. (global insurance and re-insurance, 2006-present). Previously, Mr. Mauriello served as a Director of the Hamilton Funds of the Bank of New York (2006-2007) and of Arcadia Resources Inc. (health care services and products, 2007-2012). |
Robert W. Selander (1950) |
Year of Election or Appointment: 2011 Trustee |
| Mr. Selander also serves as Trustee of other Fidelity funds. Previously, Mr. Selander served as a Member of the Advisory Board of other Fidelity funds (2011), and Executive Vice Chairman (2010), Chief Executive Officer (2009-2010), and President and Chief Executive Officer (1997-2009) of Mastercard, Inc. |
Cornelia M. Small (1944) |
Year of Election or Appointment: 2005 Trustee |
| Ms. Small also serves as Trustee of other Fidelity funds. Ms. Small is a member of the Board of Directors (2009-present) and Chair of the Investment Committee (2010-present) of the Teagle Foundation. Ms. Small also serves on the Investment Committee of the Berkshire Taconic Community Foundation (2008-present). Previously, Ms. Small served as Chairperson (2002-2008) and a member of the Investment Committee and Chairperson (2008-2012) and a member of the Board of Trustees of Smith College. In addition, Ms. Small served as Chief Investment Officer, Director of Global Equity Investments, and a member of the Board of Directors of Scudder, Stevens & Clark and Scudder Kemper Investments. |
William S. Stavropoulos (1939) |
Year of Election or Appointment: 2001 Trustee Vice Chairman of the Independent Trustees |
| Mr. Stavropoulos also serves as Trustee of other Fidelity funds. Mr. Stavropoulos serves as President and Founder of the Michigan Baseball Foundation, the Great Lakes Loons (2007-present). Mr. Stavropoulos is Chairman Emeritus of the Board of Directors of The Dow Chemical Company, where he previously served in numerous senior management positions, including President, CEO (1995-2000; 2002-2004), Chairman of the Executive Committee (2000-2006), and as a member of the Board of Directors (1990-2006). Currently, Mr. Stavropoulos is Chairman of the Board of Directors of Univar Inc. (global distributor of commodity and specialty chemicals), a Director of Teradata Corporation (data warehousing and technology solutions), and Maersk Inc. (industrial conglomerate), and a member of the Advisory Board for Metalmark Capital LLC (private equity investment, 2005-present). Mr. Stavropoulos is an operating advisor to Clayton, Dubilier & Rice, LLC (private equity investment). In addition, Mr. Stavropoulos is a member of the University of Notre Dame Advisory Council for the College of Science, a Trustee of the Rollin L. Gerstacker Foundation, and a Director of the Naples Philharmonic Center for the Arts. Previously, Mr. Stavropoulos served as a Director of Chemical Financial Corporation (bank holding company, 1993-2012) and Tyco International, Ltd. (multinational manufacturing and services, 2007-2012). |
David M. Thomas (1949) |
Year of Election or Appointment: 2008 Trustee |
| Mr. Thomas also serves as Trustee of other Fidelity funds. Mr. Thomas serves as Non-Executive Chairman of the Board of Directors of Fortune Brands Home and Security (home and security products, 2011-present), and as a member of the Board of Directors of Interpublic Group of Companies, Inc. (marketing communication, 2004-present). Previously, Mr. Thomas served as Executive Chairman (2005-2006) and Chairman and Chief Executive Officer (2000-2005) of IMS Health, Inc. (pharmaceutical and healthcare information solutions), and a Director of Fortune Brands, Inc. (consumer products, 2000-2011). |
+ The information above includes each Trustee's principal occupation during the last five years and other information relating to the experience, attributes, and skills relevant to each Trustee's qualifications to serve as a Trustee, which led to the conclusion that each Trustee should serve as a Trustee for the fund.
Advisory Board Member and Officers:
Correspondence intended for each officer and Peter S. Lynch may be sent to Fidelity Investments, 245 Summer Street, Boston, Massachusetts 02210. Officers appear below in alphabetical order.
Name, Year of Birth; Principal Occupation |
Peter S. Lynch (1944) |
Year of Election or Appointment: 2003 Member of the Advisory Board |
| Mr. Lynch also serves as Member of the Advisory Board of other Fidelity funds. Mr. Lynch is Vice Chairman and a Director of FMR and FMR Co., Inc. In addition, Mr. Lynch serves as a Trustee of Boston College and as the Chairman of the Inner-City Scholarship Fund. Previously, Mr. Lynch served on the Special Olympics International Board of Directors (1997-2006). |
Elizabeth Paige Baumann (1968) |
Year of Election or Appointment: 2012 Anti-Money Laundering (AML) Officer |
| Ms. Baumann also serves as AML Officer of other funds. She is Chief AML Officer of FMR LLC (2012-present) and is an employee of Fidelity Investments. Previously, Ms. Baumann served as Vice President and Deputy Anti-Money Laundering Officer (2007-2012). |
William C. Coffey (1969) |
Year of Election or Appointment: 2009 Assistant Secretary |
| Mr. Coffey also serves as Assistant Secretary of other funds. He is Senior Vice President and Deputy General Counsel of FMR LLC (2010-present), and is an employee of Fidelity Investments. Previously, Mr. Coffey served as Vice President and Associate General Counsel of FMR LLC (2005-2009). |
Jonathan Davis (1968) |
Year of Election or Appointment: 2010 Assistant Treasurer |
| Mr. Davis also serves as Assistant Treasurer of other funds. Mr. Davis is an employee of Fidelity Investments. Previously, Mr. Davis served as Vice President and Associate General Counsel of FMR LLC (2003-2010). |
Adrien E. Deberghes (1967) |
Year of Election or Appointment: 2008 Deputy Treasurer |
| Mr. Deberghes also serves as an officer of other funds. He is an employee of Fidelity Investments (2008-present). Prior to joining Fidelity Investments, Mr. Deberghes was Senior Vice President of Mutual Fund Administration at State Street Corporation (2007-2008), Senior Director of Mutual Fund Administration at Investors Bank & Trust (2005-2007), and Director of Finance for Dunkin' Brands (2000-2005). |
Stephanie J. Dorsey (1969) |
Year of Election or Appointment: 2010 Assistant Treasurer |
| Ms. Dorsey also serves as an officer of other funds. She is an employee of Fidelity Investments (2008-present) and has served in other fund officer roles. Prior to joining Fidelity Investments, Ms. Dorsey served as Treasurer (2004-2008) of the JPMorgan Mutual Funds and Vice President (2004-2008) of JPMorgan Chase Bank. |
Howard J. Galligan III (1966) |
Year of Election or Appointment: 2014 Chief Financial Officer |
| Mr. Galligan also serves as Chief Financial Officer of other funds. Mr. Galligan serves as President of Fidelity Pricing and Cash Management Services (FPCMS) (2014-present) and as a Director of Strategic Advisers, Inc. (2008-present). Previously, Mr. Galligan served as Chief Administrative Officer of Asset Management (2011-2014) and Chief Operating Officer and Senior Vice President of Investment Support for Strategic Advisers, Inc. (2003-2011). |
Scott C. Goebel (1968) |
Year of Election or Appointment: 2008 Secretary and Chief Legal Officer (CLO) |
| Mr. Goebel serves as Secretary and CLO of other funds. Mr. Goebel also serves as Secretary of Fidelity SelectCo, LLC (2013-present), Fidelity Investments Money Management, Inc. (FIMM) (2010-present) and Fidelity Research and Analysis Company (FRAC) (2010-present); General Counsel, Secretary, and Senior Vice President of FMR (2008-present) and FMR Co., Inc. (2008-present); Chief Legal Officer of Fidelity Management & Research (Hong Kong) Limited (2008-present); and Assistant Secretary of Fidelity Management & Research (Japan) Inc. (2008-present) and Fidelity Management & Research (U.K.) Inc. (2008-present). Previously, Mr. Goebel served as Secretary and CLO of other Fidelity funds (2008-2013), Assistant Secretary of FIMM (2008-2010), FRAC (2008-2010), and certain funds (2007-2008); and as Vice President and Secretary of Fidelity Distributors Corporation (FDC) (2005-2007). Mr. Goebel has been employed by FMR LLC or an affiliate since 2001. |
Brian B. Hogan (1964) |
Year of Election or Appointment: 2009 Vice President |
| Mr. Hogan also serves as Trustee or Vice President of other funds. Mr. Hogan serves as President of FMR's Equity Division (2009-present). Previously, Mr. Hogan served as Senior Vice President, Equity Research of FMR (2006-2009) and as a portfolio manager. |
Chris Maher (1972) |
Year of Election or Appointment: 2013 Assistant Treasurer |
| Mr. Maher serves as Assistant Treasurer of other funds. Mr. Maher is Vice President of Valuation Oversight and is an employee of Fidelity Investments. Previously, Mr. Maher served as Vice President of Asset Management Compliance (2013), Vice President of FMR's Program Management Group (2010-2013), and Vice President of Valuation Oversight (2008-2010). |
Melissa M. Reilly (1971) |
Year of Election or Appointment: 2014 Vice President of certain Equity Funds |
| Ms. Reilly also serves as Vice President of other funds. Ms. Reilly is an employee of Fidelity Investments (2004-present). |
Kenneth B. Robins (1969) |
Year of Election or Appointment: 2008 President and Treasurer |
| Mr. Robins also serves as an officer of other funds. Mr. Robins serves as Executive Vice President of Fidelity Investments Money Management, Inc. (FIMM) (2013-present) and is an employee of Fidelity Investments (2004-present). Previously, Mr. Robins served in other fund officer roles. |
Stephen Sadoski (1971) |
Year of Election or Appointment: 2012 Deputy Treasurer |
| Mr. Sadoski also serves as Deputy Treasurer of other funds. He is an employee of Fidelity Investments (2012-present) and has served in another fund officer role. Prior to joining Fidelity Investments, Mr. Sadoski served as an assistant chief accountant in the Division of Investment Management of the Securities and Exchange Commission (SEC) (2009-2012) and as a senior manager at Deloitte & Touche LLP (1997-2009). |
Stacie M. Smith (1974) |
Year of Election or Appointment: 2013 Deputy Treasurer |
| Ms. Smith also serves as an officer of other funds. She is an employee of Fidelity Investments (2009-present) and has served in other fund officer roles. Prior to joining Fidelity Investments, Ms. Smith served as Senior Audit Manager of Ernst & Young LLP (1996-2009). |
Renee Stagnone (1975) |
Year of Election or Appointment: 2013 Deputy Treasurer |
| Ms. Stagnone also serves as Deputy Treasurer of other funds. Ms. Stagnone is an employee of Fidelity Investments. |
Linda J. Wondrack (1964) |
Year of Election or Appointment: 2014 Chief Compliance Officer |
| Ms. Wondrack also serves as Chief Compliance Officer of other funds. Ms. Wondrack is Executive Vice President and head of the Ethics Office and Asset Management Compliance for Fidelity Investments (2012-present). Ms. Wondrack also serves as Chief Compliance Officer of Fidelity SelectCo, LLC (2014-present); Chief Compliance Officer of Impresa Management LLC (2013-present); and Chief Compliance Officer of FMR Co., Inc., Fidelity Investments Money Management, Inc., Fidelity Management & Research (Japan) Inc., Fidelity Management & Research (U.K.) Inc., Fidelity Management & Research (Hong Kong), Fidelity Management & Research Company, Pyramis Global Advisors, LLC, and Strategic Advisers, Inc., Ballyrock Investment Advisors LLC, and Northern Neck Investors LLC (2012-present). Previously, Ms. Wondrack served as Senior Vice President and Chief Compliance Officer for Columbia Management Investment Advisers, LLC (2005-2012); Chief Compliance Officer for certain funds within the Columbia Family of Funds (2007-2012); and Senior Vice President of Compliance Risk Management at Bank of America (2005-2010). |
Joseph F. Zambello (1957) |
Year of Election or Appointment: 2011 Deputy Treasurer |
| Mr. Zambello also serves as Deputy Treasurer of other funds. Mr. Zambello is an employee of Fidelity Investments. Previously, Mr. Zambello served as Vice President of FMR's Program Management Group (2009-2011) and Vice President of the Transfer Agent Oversight Group (2005-2009). |
Annual Report
The Board of Trustees of Fidelity Advisor Series Growth & Income Fund voted to pay on August 11, 2014, to shareholders of record at the opening of business on August 8, 2014, a distribution of $0.275 per share derived from capital gains realized from sales of portfolio securities.
The fund hereby designates as a capital gain dividend with respect to the taxable year ended June 30, 2014, $5,896,683, or, if subsequently determined to be different, the net capital gain of such year.
A total of 0.01% of the dividends distributed during the fiscal year was derived from interest on U.S. Government securities which is generally exempt from state income tax.
The fund designates 54%, 49%, 46% and 100% of the dividends distributed in August, October, December and April, respectively during the fiscal year as qualifying for the dividends-received deduction for corporate shareholders.
The fund designates 54%, 53%, 52% and 100% of the dividends distributed in August, October, December and April, respectively during the fiscal year as amounts which may be taken into account as a dividend for the purposes of the maximum rate under section 1(h)(11) of the Internal Revenue Code.
The fund will notify shareholders in January 2015 of amounts for use in preparing 2014 income tax returns.
Annual Report
Investment Adviser
Fidelity Management & Research Company
Boston, MA
Investment Sub-Advisers
FMR Co., Inc.
Fidelity Management & Research
(U.K.) Inc.
Fidelity Management & Research
(Japan) Inc.
Fidelity Management & Research
(Hong Kong) Limited
General Distributor
Fidelity Distributors Corporation
Smithfield, RI
Transfer and Service Agents
Fidelity Investments Institutional
Operations Company, Inc.
Boston, MA
Fidelity Service Company, Inc.
Boston, MA
Custodian
The Northern Trust Company
Chicago, IL
(Fidelity Investment logo)(registered trademark)
AMHTI-ANN-0814
1.950941.102
Fidelity®
Series Growth & Income Fund
Fidelity Series Growth & Income Fund
Class F
Annual Report
June 30, 2014
(Fidelity Cover Art)
Contents
Performance | (Click Here) | How the fund has done over time. |
Management's Discussion of Fund Performance | (Click Here) | The Portfolio Manager's review of fund performance and strategy. |
Shareholder Expense Example | (Click Here) | An example of shareholder expenses. |
Investment Changes | (Click Here) | A summary of major shifts in the fund's investments over the past six months. |
Investments | (Click Here) | A complete list of the fund's investments with their market values. |
Financial Statements | (Click Here) | Statements of assets and liabilities, operations, and changes in net assets, as well as financial highlights. |
Notes | (Click Here) | Notes to the financial statements. |
Report of Independent Registered Public Accounting Firm | (Click Here) | |
Trustees and Officers | (Click Here) | |
Distributions | (Click Here) | |
To view a fund's proxy voting guidelines and proxy voting record for the 12-month period ended June 30, visit http://www.fidelity.com/proxyvotingresults or visit the Securities and Exchange Commission's (SEC) web site at http://www.sec.gov. You may also call 1-800-544-8544 for Fidelity® Series Growth & Income Fund or 1-800-835-5092 for Class F of the fund to request a free copy of the proxy voting guidelines.
Standard & Poor's, S&P and S&P 500 are registered service marks of The McGraw-Hill Companies, Inc. and have been licensed for use by Fidelity Distributors Corporation.
Other third-party marks appearing herein are the property of their respective owners.
All other marks appearing herein are registered or unregistered trademarks or service marks of FMR LLC or an affiliated company. © 2014 FMR LLC. All rights reserved.
Annual Report
This report and the financial statements contained herein are submitted for the general information of the shareholders of the fund. This report is not authorized for distribution to prospective investors in the fund unless preceded or accompanied by an effective prospectus.
A fund files its complete schedule of portfolio holdings with the SEC for the first and third quarters of each fiscal year on Form N-Q. Forms N-Q are available on the SEC's web site at http://www.sec.gov. A fund's Forms N-Q may be reviewed and copied at the SEC's Public Reference Room in Washington, DC. Information regarding the operation of the SEC's Public Reference Room may be obtained by calling 1-800-SEC-0330. For a complete list of a fund's portfolio holdings, view the most recent holdings listing, semiannual report, or annual report on Fidelity's web site at http://www.fidelity.com, http://www.advisor.fidelity.com, or http://www.401k.com, as applicable.
NOT FDIC INSURED • MAY LOSE VALUE • NO BANK GUARANTEE
Neither the fund nor Fidelity Distributors Corporation is a bank.
Annual Report
Average annual total return reflects the change in the value of an investment, assuming reinvestment of the class' distributions from dividend income and capital gains (the profits earned upon the sale of securities that have grown in value, if any) and assuming a constant rate of performance each year. The $10,000 table and the fund's returns do not reflect the deduction of taxes that a shareholder would pay on fund distributions or the redemption of fund shares. During periods of reimbursement by Fidelity, a fund's total return will be greater than it would be had the reimbursement not occurred. How a fund did yesterday is no guarantee of how it will do tomorrow.
Average Annual Total Returns
Periods ended June 30, 2014 | Past 1
year | Life of
fund A |
Fidelity® Series Growth & Income Fund B | 22.40% | 24.72% |
Class F B | 22.61% | 24.94% |
A From December 6, 2012.
B Prior to August 1, 2013, Fidelity® Series Growth & Income Fund was named Fidelity Series Mega Cap Fund, and the fund operated under certain different investment policies and compared its performance to a different additional index. The fund's historical performance may not represent its current investment policies.
Annual Report
$10,000 Over Life of Fund
Let's say hypothetically that $10,000 was invested in Fidelity Series Growth & Income Fund, a class of the fund, on December 6, 2012, when the fund started. The chart shows how the value of your investment would have changed, and also shows how the S&P 500® Index and the Russell Top 200® Index performed over the same period.
Effective August 1, 2013, Fidelity Series Growth & Income Fund began comparing its performance to the S&P 500® Index rather than the Russell Top 200® Index because the S&P 500 Index provides a more appropriate performance comparison for the fund.
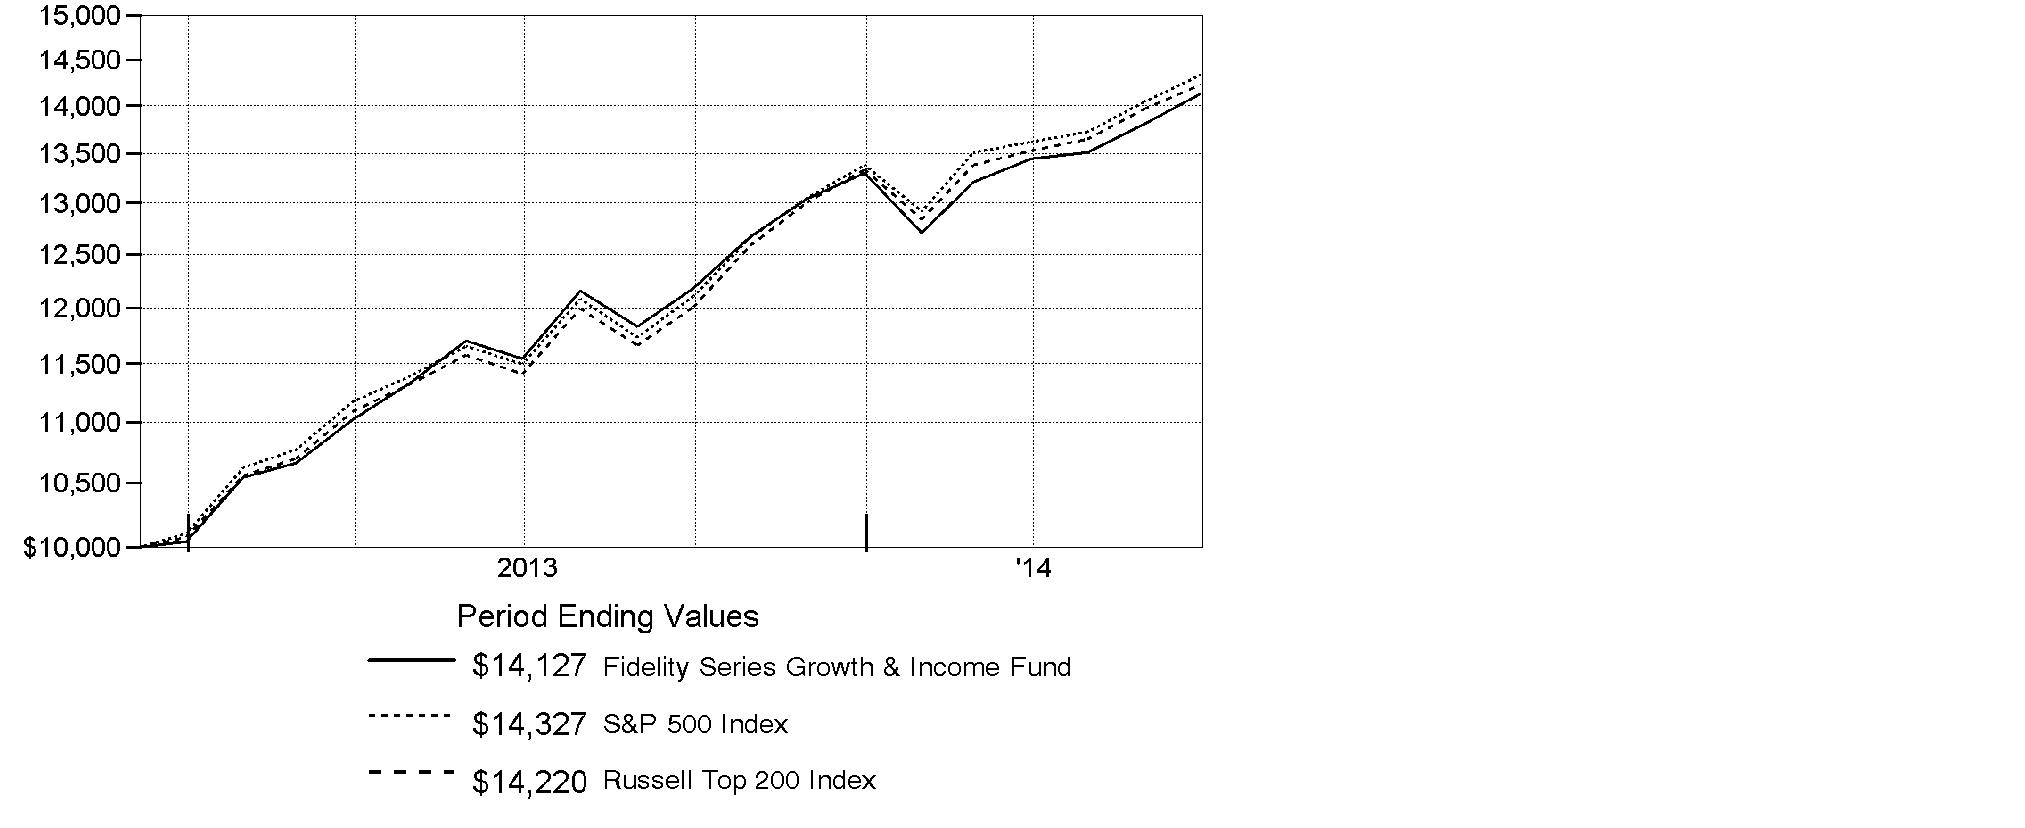
Annual Report
Market Recap: Despite intermittent volatility driven by geopolitical concerns, stocks posted a series of new highs during the 12 months ending June 30, 2014, amid a decidedly favorable environment for riskier assets. The S&P 500® Index rose 24.61% for the year, helped by a rise in consumer spending and the lowest unemployment rate since 2008. The U.S. Federal Reserve balanced stimulus reductions with continued low interest rates, aiding a broad advance. All 10 S&P 500® market sectors gained, seven by more than 20%. Materials (+33%) was tops, as investors seemed to anticipate sustained economic improvement and renewed infrastructure build-outs. Information technology (+32%) benefited from large cash balances, rising dividends and stock buybacks, and a bevy of innovations. Health care (+30%) was aided by new drugs and predictable reimbursements. Conversely, the biggest laggard, telecommunication services (+5%), battled slow growth and stiff pricing competition. Across size and style segments: overall, investors showed some preference for large-cap stocks over small-caps and growth stocks over value, although market leadership rotated during the year. With the "risk-on" trade alive and well, the growth-oriented Nasdaq Composite Index® flourished, advancing 31.17%, while the blue-chip Dow Jones Industrial AverageSM delivered a more subdued 15.56% return.
Comments from Matthew Fruhan, Portfolio Manager of Fidelity® Series Growth & Income Fund: For the year, the fund's Series Growth & Income and Class F shares returned 22.40% and 22.61%, respectively. For comparison, the S&P 500® advanced 24.61%, the Russell Top 200® Index returned 24.69% and the custom linked index specific to this fund added 24.69%. Relative to the linked index, it hurt the most by far to overweight big-box retailer Target, which was among the fund's biggest holdings. The lingering effects of the firm's troubled expansion into Canada and a holiday-season credit breach continued to weigh on the stock, but this weak stretch allowed me to add notable exposure at a valuation I liked. Picks in information technology hurt, as we didn't own outperforming index component Facebook, while choices in industrials and consumer discretionary also were weak. Stock selection and an overweight in financials detracted, including investment banks JPMorgan Chase and Citigroup, both of which were among the fund's largest holdings. Stock selection in consumer staples helped the most, especially drugstore chain Walgreen, while an overweight in the outperforming shares of natural gas pipeline firm Williams Companies also added value.
The views expressed above reflect those of the portfolio manager(s) only through the end of the period as stated on the cover of this report and do not necessarily represent the views of Fidelity or any other person in the Fidelity organization. Any such views are subject to change at any time based upon market or other conditions and Fidelity disclaims any responsibility to update such views. These views may not be relied on as investment advice and, because investment decisions for a Fidelity fund are based on numerous factors, may not be relied on as an indication of trading intent on behalf of any Fidelity fund.
Annual Report
Shareholder Expense Example
As a shareholder of the Fund, you incur two types of costs: (1) transaction costs, and (2) ongoing costs, including management fees and other Fund expenses. This Example is intended to help you understand your ongoing costs (in dollars) of investing in the Fund and to compare these costs with the ongoing costs of investing in other mutual funds.
The Example is based on an investment of $1,000 invested at the beginning of the period and held for the entire period (January 1, 2014 to June 30, 2014).
Actual Expenses
The first line of the accompanying table for each class of the Fund provides information about actual account values and actual expenses. You may use the information in this line, together with the amount you invested, to estimate the expenses that you paid over the period. Simply divide your account value by $1,000.00 (for example, an $8,600 account value divided by $1,000.00 = 8.6), then multiply the result by the number in the first line for a class of the Fund under the heading entitled "Expenses Paid During Period" to estimate the expenses you paid on your account during this period. In addition, the Fund, as a shareholder in the underlying Fidelity Central Funds, will indirectly bear its pro-rata share of the fees and expenses incurred by the underlying Fidelity Central Funds. These fees and expenses are not included in the Fund's annualized expense ratio used to calculate the expense estimate in the table below.
Hypothetical Example for Comparison Purposes
The second line of the accompanying table for each class of the Fund provides information about hypothetical account values and hypothetical expenses based on a Class' actual expense ratio and an assumed rate of return of 5% per year before expenses, which is not the Class' actual return. The hypothetical account values and expenses may not be used to estimate the actual ending account balance or expenses you paid for the period. You may use this information to compare the ongoing costs of investing in the Fund and other funds. To do so, compare this 5% hypothetical example with the 5% hypothetical examples that appear in the shareholder reports of the other funds. In addition, the Fund, as a shareholder in the underlying Fidelity Central Funds, will indirectly bear its pro-rata share of the fees and expenses incurred by the underlying Fidelity Central Funds. These fees and expenses are not included in the Fund's annualized expense ratio used to calculate the expense estimate in the table below.
Please note that the expenses shown in the table are meant to highlight your ongoing costs only and do not reflect any transaction costs. Therefore, the second line of the table is useful in comparing ongoing costs only, and will not help you determine the relative total costs of owning different funds.
Annual Report
| Annualized
Expense Ratio B | Beginning
Account Value
January 1, 2014 | Ending
Account Value
June 30, 2014 | Expenses Paid
During Period*
January 1, 2014
to June 30, 2014 |
Series Growth & Income | .64% | | | |
Actual | | $ 1,000.00 | $ 1,062.70 | $ 3.27 |
HypotheticalA | | $ 1,000.00 | $ 1,021.62 | $ 3.21 |
Class F | .47% | | | |
Actual | | $ 1,000.00 | $ 1,064.00 | $ 2.41 |
HypotheticalA | | $ 1,000.00 | $ 1,022.46 | $ 2.36 |
A 5% return per year before expenses
B Annualized expense ratio reflects expenses net of applicable fee waivers.
* Expenses are equal to each Class' annualized expense ratio, multiplied by the average account value over the period, multiplied by 181/365 (to reflect the one-half year period).
Annual Report
Investment Changes (Unaudited)
Top Ten Stocks as of June 30, 2014 |
| % of fund's
net assets | % of fund's net assets
6 months ago |
JPMorgan Chase & Co. | 4.1 | 3.8 |
Apple, Inc. | 3.8 | 3.8 |
Microsoft Corp. | 3.2 | 2.9 |
General Electric Co. | 3.1 | 3.1 |
Chevron Corp. | 2.8 | 2.4 |
Citigroup, Inc. | 2.1 | 2.1 |
Comcast Corp. Class A (special) (non-vtg.) | 2.0 | 1.7 |
Target Corp. | 2.0 | 1.8 |
Verizon Communications, Inc. | 2.0 | 1.2 |
Procter & Gamble Co. | 1.8 | 1.9 |
| 26.9 | |
Top Five Market Sectors as of June 30, 2014 |
| % of fund's
net assets | % of fund's net assets
6 months ago |
Information Technology | 19.6 | 19.1 |
Financials | 18.9 | 18.8 |
Consumer Staples | 12.3 | 12.0 |
Energy | 11.9 | 12.0 |
Industrials | 11.5 | 11.3 |
Asset Allocation (% of fund's net assets) |
As of June 30, 2014* | As of December 31, 2013** |
| Stocks 99.7% | | | Stocks 98.8% | |
| Convertible
Securities 0.4% | | | Convertible
Securities 0.4% | |
 | Other Investments 0.0%† | | | Other Investments 0.0%† | |
 | Short-Term
Investments and
Net Other Assets (Liabilities) (0.1)%†† | | | Short-Term
Investments and
Net Other Assets (Liabilities) 0.8% | |
* Foreign investments | 13.3% | | ** Foreign investments | 13.8% | |

† Amount represents less than 0.1% |
†† Net Other Assets (Liabilities) are not included in the pie chart. |
Annual Report
Investments June 30, 2014
Showing Percentage of Net Assets
Common Stocks - 99.7% |
| Shares | | Value |
CONSUMER DISCRETIONARY - 9.9% |
Diversified Consumer Services - 0.3% |
H&R Block, Inc. | 872,364 | | $ 29,241,641 |
Hotels, Restaurants & Leisure - 1.9% |
Darden Restaurants, Inc. | 616,600 | | 28,530,082 |
Domino's Pizza, Inc. | 52,400 | | 3,829,916 |
McDonald's Corp. | 611,710 | | 61,623,665 |
Yum! Brands, Inc. | 988,355 | | 80,254,426 |
| | 174,238,089 |
Household Durables - 0.1% |
Tupperware Brands Corp. | 129,900 | | 10,872,630 |
Media - 3.9% |
Comcast Corp. Class A (special) (non-vtg.) | 3,431,400 | | 182,996,562 |
Lamar Advertising Co. Class A | 155,700 | | 8,252,100 |
Scripps Networks Interactive, Inc. Class A | 85,014 | | 6,898,036 |
Sinclair Broadcast Group, Inc. Class A (e) | 1,103,823 | | 38,357,849 |
Time Warner, Inc. | 1,756,377 | | 123,385,484 |
| | 359,890,031 |
Multiline Retail - 2.0% |
Target Corp. | 3,153,475 | | 182,743,876 |
Specialty Retail - 1.6% |
DSW, Inc. Class A | 390,200 | | 10,902,188 |
Lewis Group Ltd. | 565,073 | | 3,443,040 |
Lowe's Companies, Inc. | 2,616,700 | | 125,575,433 |
Sally Beauty Holdings, Inc. (a) | 37,400 | | 937,992 |
Staples, Inc. | 788,484 | | 8,547,167 |
| | 149,405,820 |
Textiles, Apparel & Luxury Goods - 0.1% |
adidas AG | 108,750 | | 11,014,974 |
TOTAL CONSUMER DISCRETIONARY | | 917,407,061 |
CONSUMER STAPLES - 12.3% |
Beverages - 3.7% |
Diageo PLC | 962,995 | | 30,670,525 |
Molson Coors Brewing Co. Class B | 392,700 | | 29,122,632 |
PepsiCo, Inc. | 892,400 | | 79,727,016 |
Pernod Ricard SA (e) | 77,800 | | 9,342,816 |
Remy Cointreau SA | 35,802 | | 3,293,901 |
Common Stocks - continued |
| Shares | | Value |
CONSUMER STAPLES - continued |
Beverages - continued |
SABMiller PLC | 687,213 | | $ 39,846,144 |
The Coca-Cola Co. | 3,576,918 | | 151,518,246 |
| | 343,521,280 |
Food & Staples Retailing - 1.7% |
CVS Caremark Corp. | 725,400 | | 54,673,398 |
Kroger Co. | 601,228 | | 29,718,700 |
Walgreen Co. | 920,193 | | 68,213,907 |
| | 152,606,005 |
Food Products - 0.5% |
Kellogg Co. | 668,973 | | 43,951,526 |
Household Products - 1.9% |
Procter & Gamble Co. | 2,100,000 | | 165,039,000 |
Svenska Cellulosa AB (SCA) (B Shares) | 468,953 | | 12,219,428 |
| | 177,258,428 |
Tobacco - 4.5% |
British American Tobacco PLC sponsored ADR | 1,347,459 | | 160,455,418 |
Lorillard, Inc. | 1,992,265 | | 121,468,397 |
Philip Morris International, Inc. | 1,094,866 | | 92,308,152 |
Reynolds American, Inc. | 741,600 | | 44,755,560 |
| | 418,987,527 |
TOTAL CONSUMER STAPLES | | 1,136,324,766 |
ENERGY - 11.8% |
Energy Equipment & Services - 1.2% |
Ensco PLC Class A | 621,600 | | 34,542,312 |
National Oilwell Varco, Inc. | 60,800 | | 5,006,880 |
Oceaneering International, Inc. | 159,900 | | 12,492,987 |
Schlumberger Ltd. | 490,607 | | 57,867,096 |
| | 109,909,275 |
Oil, Gas & Consumable Fuels - 10.6% |
Access Midstream Partners LP | 300,700 | | 19,109,485 |
Apache Corp. | 730,441 | | 73,496,973 |
Atlas Pipeline Partners LP | 534,061 | | 18,371,698 |
BG Group PLC | 3,990,450 | | 84,341,314 |
Canadian Natural Resources Ltd. | 1,116,600 | | 51,306,779 |
Chevron Corp. | 1,964,435 | | 256,456,989 |
EQT Midstream Partners LP | 83,800 | | 8,106,812 |
Common Stocks - continued |
| Shares | | Value |
ENERGY - continued |
Oil, Gas & Consumable Fuels - continued |
EV Energy Partners LP | 73,300 | | $ 2,904,146 |
Exxon Mobil Corp. | 183,565 | | 18,481,324 |
Golar LNG Ltd. (e) | 211,600 | | 12,717,160 |
Imperial Oil Ltd. | 955,200 | | 50,335,876 |
Magellan Midstream Partners LP | 8,800 | | 739,552 |
Markwest Energy Partners LP | 1,051,940 | | 75,297,865 |
MPLX LP | 99,383 | | 6,410,204 |
Occidental Petroleum Corp. | 1,047,960 | | 107,552,135 |
Peabody Energy Corp. | 528,487 | | 8,640,762 |
PrairieSky Royalty Ltd. | 36,900 | | 1,341,755 |
Suncor Energy, Inc. | 2,226,200 | | 94,927,229 |
The Williams Companies, Inc. | 1,506,457 | | 87,690,862 |
Western Gas Partners LP | 124,000 | | 9,483,520 |
| | 987,712,440 |
TOTAL ENERGY | | 1,097,621,715 |
FINANCIALS - 18.9% |
Banks - 11.3% |
Bank of America Corp. | 8,686,405 | | 133,510,045 |
Citigroup, Inc. | 4,107,983 | | 193,485,999 |
JPMorgan Chase & Co. | 6,607,554 | | 380,727,264 |
M&T Bank Corp. | 120,309 | | 14,924,331 |
PNC Financial Services Group, Inc. | 718,724 | | 64,002,372 |
Standard Chartered PLC (United Kingdom) | 4,010,807 | | 81,957,296 |
SunTrust Banks, Inc. | 231,300 | | 9,265,878 |
U.S. Bancorp | 1,757,639 | | 76,140,921 |
Wells Fargo & Co. | 1,851,199 | | 97,299,019 |
| | 1,051,313,125 |
Capital Markets - 4.5% |
Apollo Investment Corp. | 353,700 | | 3,045,357 |
Ares Capital Corp. | 389,914 | | 6,963,864 |
Artisan Partners Asset Management, Inc. | 50,600 | | 2,868,008 |
BlackRock, Inc. Class A | 31,300 | | 10,003,480 |
Carlyle Group LP | 245,400 | | 8,333,784 |
Charles Schwab Corp. | 2,966,081 | | 79,876,561 |
Greenhill & Co., Inc. | 34,200 | | 1,684,350 |
Invesco Ltd. | 205,600 | | 7,761,400 |
Common Stocks - continued |
| Shares | | Value |
FINANCIALS - continued |
Capital Markets - continued |
KKR & Co. LP | 2,338,362 | | $ 56,892,347 |
Morgan Stanley, Inc. | 1,864,700 | | 60,285,751 |
Northern Trust Corp. | 927,451 | | 59,551,629 |
State Street Corp. | 1,512,536 | | 101,733,171 |
The Blackstone Group LP | 451,500 | | 15,098,160 |
| | 414,097,862 |
Diversified Financial Services - 0.7% |
IntercontinentalExchange Group, Inc. | 185,325 | | 35,007,893 |
TPG Specialty Lending, Inc. | 1,130,400 | | 24,676,632 |
| | 59,684,525 |
Insurance - 1.8% |
Arthur J. Gallagher & Co. | 311,050 | | 14,494,930 |
Brown & Brown, Inc. | 151,400 | | 4,649,494 |
Genworth Financial, Inc. Class A (a) | 580,900 | | 10,107,660 |
Marsh & McLennan Companies, Inc. | 431,007 | | 22,334,783 |
MetLife, Inc. | 1,898,300 | | 105,469,548 |
MetLife, Inc. unit | 360,900 | | 11,527,146 |
Ping An Insurance (Group) Co. of China Ltd. (H Shares) | 89,500 | | 692,867 |
| | 169,276,428 |
Real Estate Investment Trusts - 0.4% |
CBL & Associates Properties, Inc. | 1,263,936 | | 24,014,784 |
First Potomac Realty Trust | 236,931 | | 3,108,535 |
Gaming & Leisure Properties | 111,000 | | 3,770,670 |
Sun Communities, Inc. | 79,369 | | 3,955,751 |
| | 34,849,740 |
Thrifts & Mortgage Finance - 0.2% |
MGIC Investment Corp. (a) | 689,400 | | 6,370,056 |
Radian Group, Inc. | 944,594 | | 13,989,437 |
| | 20,359,493 |
TOTAL FINANCIALS | | 1,749,581,173 |
HEALTH CARE - 10.2% |
Biotechnology - 1.1% |
Amgen, Inc. | 823,219 | | 97,444,433 |
Intercept Pharmaceuticals, Inc. (a) | 21,400 | | 5,063,882 |
| | 102,508,315 |
Common Stocks - continued |
| Shares | | Value |
HEALTH CARE - continued |
Health Care Equipment & Supplies - 1.6% |
Abbott Laboratories | 617,249 | | $ 25,245,484 |
Ansell Ltd. | 354,030 | | 6,619,900 |
ResMed, Inc. (e) | 364,657 | | 18,462,584 |
St. Jude Medical, Inc. | 382,085 | | 26,459,386 |
Steris Corp. | 74,600 | | 3,989,608 |
Stryker Corp. | 340,200 | | 28,685,664 |
The Cooper Companies, Inc. | 103,198 | | 13,986,425 |
Zimmer Holdings, Inc. | 227,600 | | 23,638,536 |
| | 147,087,587 |
Health Care Providers & Services - 1.9% |
Fresenius Medical Care AG & Co. KGaA | 145,240 | | 9,771,934 |
McKesson Corp. | 365,247 | | 68,012,644 |
Patterson Companies, Inc. | 499,360 | | 19,729,714 |
Quest Diagnostics, Inc. | 605,718 | | 35,549,589 |
UnitedHealth Group, Inc. | 517,242 | | 42,284,534 |
| | 175,348,415 |
Health Care Technology - 0.1% |
Quality Systems, Inc. | 372,088 | | 5,972,012 |
Life Sciences Tools & Services - 0.1% |
Lonza Group AG | 45,749 | | 4,978,325 |
Pharmaceuticals - 5.4% |
AbbVie, Inc. | 864,820 | | 48,810,441 |
Astellas Pharma, Inc. | 1,126,900 | | 14,819,373 |
AstraZeneca PLC sponsored ADR | 50,500 | | 3,752,655 |
GlaxoSmithKline PLC sponsored ADR | 1,703,500 | | 91,103,180 |
Johnson & Johnson | 1,345,970 | | 140,815,381 |
Merck & Co., Inc. | 785,217 | | 45,424,803 |
Novartis AG sponsored ADR | 596,730 | | 54,021,967 |
Sanofi SA | 245,473 | | 26,091,215 |
Teva Pharmaceutical Industries Ltd. sponsored ADR | 1,272,384 | | 66,698,369 |
Zoetis, Inc. Class A | 436,009 | | 14,070,010 |
| | 505,607,394 |
TOTAL HEALTH CARE | | 941,502,048 |
INDUSTRIALS - 11.5% |
Aerospace & Defense - 2.0% |
Meggitt PLC | 2,836,100 | | 24,559,730 |
Rolls-Royce Group PLC | 1,100,350 | | 20,130,756 |
Common Stocks - continued |
| Shares | | Value |
INDUSTRIALS - continued |
Aerospace & Defense - continued |
The Boeing Co. | 712,041 | | $ 90,592,976 |
United Technologies Corp. | 469,200 | | 54,169,140 |
| | 189,452,602 |
Air Freight & Logistics - 1.7% |
C.H. Robinson Worldwide, Inc. | 501,047 | | 31,961,788 |
PostNL NV (a) | 898,200 | | 4,243,173 |
United Parcel Service, Inc. Class B | 1,179,745 | | 121,112,622 |
| | 157,317,583 |
Airlines - 0.0% |
Copa Holdings SA Class A | 29,300 | | 4,177,301 |
Commercial Services & Supplies - 0.5% |
ADT Corp. | 694,700 | | 24,272,818 |
KAR Auction Services, Inc. | 637,385 | | 20,313,460 |
Ritchie Brothers Auctioneers, Inc. | 26,300 | | 648,226 |
| | 45,234,504 |
Electrical Equipment - 0.4% |
General Cable Corp. | 301,624 | | 7,739,672 |
Hubbell, Inc. Class B | 264,592 | | 32,584,505 |
| | 40,324,177 |
Industrial Conglomerates - 3.1% |
General Electric Co. | 10,810,956 | | 284,111,924 |
Machinery - 0.3% |
Ingersoll-Rand PLC | 406,398 | | 25,403,939 |
Stanley Black & Decker, Inc. | 40,500 | | 3,556,710 |
Valmont Industries, Inc. | 16,367 | | 2,486,966 |
| | 31,447,615 |
Professional Services - 0.5% |
Acacia Research Corp. | 582,945 | | 10,347,274 |
Bureau Veritas SA | 1,015,555 | | 28,187,451 |
Exova Group Ltd. PLC (a) | 933,800 | | 3,931,339 |
| | 42,466,064 |
Road & Rail - 2.3% |
CSX Corp. | 2,978,508 | | 91,767,831 |
J.B. Hunt Transport Services, Inc. | 711,388 | | 52,486,207 |
Kansas City Southern | 110,000 | | 11,826,100 |
Norfolk Southern Corp. | 429,934 | | 44,296,100 |
TransForce, Inc. | 446,000 | | 10,269,641 |
| | 210,645,879 |
Common Stocks - continued |
| Shares | | Value |
INDUSTRIALS - continued |
Trading Companies & Distributors - 0.7% |
Beijer Ref AB Series B | 66,640 | | $ 1,516,008 |
Brenntag AG | 22,400 | | 4,002,738 |
W.W. Grainger, Inc. | 128,300 | | 32,622,841 |
Watsco, Inc. | 241,947 | | 24,862,474 |
| | 63,004,061 |
TOTAL INDUSTRIALS | | 1,068,181,710 |
INFORMATION TECHNOLOGY - 19.6% |
Communications Equipment - 2.4% |
Cisco Systems, Inc. | 5,784,633 | | 143,748,130 |
QUALCOMM, Inc. | 1,021,900 | | 80,934,480 |
| | 224,682,610 |
Internet Software & Services - 3.0% |
Google, Inc.: | | | |
Class A (a) | 205,609 | | 120,213,414 |
Class C (a) | 183,709 | | 105,684,114 |
Yahoo!, Inc. (a) | 1,372,142 | | 48,203,348 |
| | 274,100,876 |
IT Services - 4.8% |
Amadeus IT Holding SA Class A | 41,800 | | 1,723,971 |
Cognizant Technology Solutions Corp. Class A (a) | 794,618 | | 38,864,766 |
Computer Sciences Corp. | 625,988 | | 39,562,442 |
Fidelity National Information Services, Inc. | 459,900 | | 25,174,926 |
IBM Corp. | 188,994 | | 34,258,942 |
MasterCard, Inc. Class A | 1,121,800 | | 82,418,646 |
Paychex, Inc. | 2,658,341 | | 110,480,652 |
Quindell PLC | 1,563,786 | | 6,155,406 |
The Western Union Co. | 1,327,000 | | 23,010,180 |
Visa, Inc. Class A | 409,600 | | 86,306,816 |
| | 447,956,747 |
Semiconductors & Semiconductor Equipment - 1.7% |
Applied Materials, Inc. | 2,644,500 | | 59,633,475 |
Broadcom Corp. Class A | 2,016,460 | | 74,850,995 |
Maxim Integrated Products, Inc. | 546,010 | | 18,460,598 |
| | 152,945,068 |
Common Stocks - continued |
| Shares | | Value |
INFORMATION TECHNOLOGY - continued |
Software - 3.3% |
Microsoft Corp. | 7,137,217 | | $ 297,621,949 |
Oracle Corp. | 251,869 | | 10,208,251 |
| | 307,830,200 |
Technology Hardware, Storage & Peripherals - 4.4% |
Apple, Inc. | 3,770,360 | | 350,379,555 |
EMC Corp. | 1,241,169 | | 32,692,391 |
First Data Holdings, Inc. Class B (h)(i) | 6,283,849 | | 25,135,396 |
| | 408,207,342 |
TOTAL INFORMATION TECHNOLOGY | | 1,815,722,843 |
MATERIALS - 3.5% |
Chemicals - 3.0% |
Airgas, Inc. | 475,432 | | 51,779,299 |
E.I. du Pont de Nemours & Co. | 453,631 | | 29,685,613 |
FMC Corp. | 342,080 | | 24,352,675 |
Johnson Matthey PLC | 135,384 | | 7,182,582 |
Methanex Corp. | 84,200 | | 5,205,636 |
Monsanto Co. | 694,921 | | 86,684,446 |
Potash Corp. of Saskatchewan, Inc. | 256,600 | | 9,758,519 |
Royal DSM NV | 230,225 | | 16,767,993 |
Syngenta AG (Switzerland) | 107,197 | | 39,603,853 |
Tronox Ltd. Class A | 250,150 | | 6,729,035 |
| | 277,749,651 |
Metals & Mining - 0.5% |
Freeport-McMoRan Copper & Gold, Inc. | 1,280,000 | | 46,720,000 |
SunCoke Energy Partners LP | 133,499 | | 4,031,670 |
| | 50,751,670 |
TOTAL MATERIALS | | 328,501,321 |
TELECOMMUNICATION SERVICES - 2.0% |
Diversified Telecommunication Services - 2.0% |
Verizon Communications, Inc. | 3,699,023 | | 180,993,195 |
Common Stocks - continued |
| Shares | | Value |
UTILITIES - 0.0% |
Electric Utilities - 0.0% |
ITC Holdings Corp. | 121,084 | | $ 4,417,144 |
TOTAL COMMON STOCKS (Cost $8,203,498,803) |
9,240,252,976
|
Convertible Preferred Stocks - 0.3% |
| | | |
CONSUMER DISCRETIONARY - 0.0% |
Leisure Products - 0.0% |
NJOY, Inc. Series D (i) | 81,101 | | 1,372,724 |
HEALTH CARE - 0.3% |
Health Care Equipment & Supplies - 0.3% |
Alere, Inc. 3.00% | 72,255 | | 22,750,209 |
TOTAL CONVERTIBLE PREFERRED STOCKS (Cost $22,003,530) |
24,122,933
|
Convertible Bonds - 0.1% |
| Principal Amount (d) | | |
ENERGY - 0.1% |
Oil, Gas & Consumable Fuels - 0.1% |
Amyris, Inc. 5% 10/15/18 (i) | | $ 2,350,000 | | 1,879,060 |
Peabody Energy Corp. 4.75% 12/15/41 | | 13,140,000 | | 9,863,213 |
| | 11,742,273 |
TOTAL CONVERTIBLE BONDS (Cost $13,360,202) |
11,742,273
|
Preferred Securities - 0.0% |
|
FINANCIALS - 0.0% |
Diversified Financial Services - 0.0% |
Baggot Securities Ltd. 10.24% (f)(g) (Cost $5,175,080) | EUR | 3,370,000 | |
5,245,587
|
Money Market Funds - 0.9% |
| Shares | | Value |
Fidelity Cash Central Fund, 0.11% (b) | 55,129,962 | | $ 55,129,962 |
Fidelity Securities Lending Cash Central Fund, 0.10% (b)(c) | 24,898,201 | | 24,898,201 |
TOTAL MONEY MARKET FUNDS (Cost $80,028,163) |
80,028,163
|
TOTAL INVESTMENT PORTFOLIO - 101.0% (Cost $8,324,065,778) | | 9,361,391,932 |
NET OTHER ASSETS (LIABILITIES) - (1.0)% | | (90,334,606) |
NET ASSETS - 100% | $ 9,271,057,326 |
Currency Abbreviations |
EUR | - | European Monetary Unit |
Legend |
(a) Non-income producing |
(b) Affiliated fund that is generally available only to investment companies and other accounts managed by Fidelity Investments. The rate quoted is the annualized seven-day yield of the fund at period end. A complete unaudited listing of the fund's holdings as of its most recent quarter end is available upon request. In addition, each Fidelity Central Fund's financial statements, which are not covered by the Fund's Report of Independent Registered Public Accounting Firm, are available on the SEC's website or upon request. |
(c) Investment made with cash collateral received from securities on loan. |
(d) Amount is stated in United States dollars unless otherwise noted. |
(e) Security or a portion of the security is on loan at period end. |
(f) Security exempt from registration under Rule 144A of the Securities Act of 1933. These securities may be resold in transactions exempt from registration, normally to qualified institutional buyers. At the end of the period, the value of these securities amounted to $5,245,587 or 0.0% of net assets. |
(g) Security is perpetual in nature with no stated maturity date. |
(h) Security or a portion of the security purchased on a delayed delivery or when-issued basis. |
(i) Restricted securities - Investment in securities not registered under the Securities Act of 1933 (excluding 144A issues). At the end of the period, the value of restricted securities (excluding 144A issues) amounted to $28,387,180 or 0.3% of net assets. |
Additional information on each restricted holding is as follows: |
Security | Acquisition Date | Acquisition Cost |
Amyris, Inc. 5% 10/15/18 | 10/16/13 | $ 2,350,000 |
Security | Acquisition Date | Acquisition Cost |
First Data Holdings, Inc. Class B | 6/26/14 | $ 25,135,396 |
NJOY, Inc.
Series D | 2/14/14 | $ 1,372,724 |
Affiliated Central Funds |
Information regarding fiscal year to date income earned by the Fund from investments in Fidelity Central Funds is as follows: |
Fund | Income earned |
Fidelity Cash Central Fund | $ 70,041 |
Fidelity Securities Lending Cash Central Fund | 461,394 |
Total | $ 531,435 |
Other Information |
The following is a summary of the inputs used, as of June 30, 2014, involving the Fund's assets and liabilities carried at fair value. The inputs or methodology used for valuing securities may not be an indication of the risk associated with investing in those securities. For more information on valuation inputs, and their aggregation into the levels used in the table below, please refer to the Investment Valuation section in the accompanying Notes to Financial Statements. |
Valuation Inputs at Reporting Date: |
Description | Total | Level 1 | Level 2 | Level 3 |
Investments in Securities: | | | | |
Equities: | | | | |
Consumer Discretionary | $ 918,779,785 | $ 917,407,061 | $ - | $ 1,372,724 |
Consumer Staples | 1,136,324,766 | 1,105,654,241 | 30,670,525 | - |
Energy | 1,097,621,715 | 1,097,621,715 | - | - |
Financials | 1,749,581,173 | 1,738,054,027 | 11,527,146 | - |
Health Care | 964,252,257 | 913,569,735 | 50,682,522 | - |
Industrials | 1,068,181,710 | 1,068,181,710 | - | - |
Valuation Inputs at Reporting Date: |
Description | Total | Level 1 | Level 2 | Level 3 |
Investments in Securities: | | | | |
Equities: | | | | |
Information Technology | $ 1,815,722,843 | $ 1,790,587,447 | $ - | $ 25,135,396 |
Materials | 328,501,321 | 288,897,468 | 39,603,853 | - |
Telecommunication Services | 180,993,195 | 180,993,195 | - | - |
Utilities | 4,417,144 | 4,417,144 | - | - |
Corporate Bonds | 11,742,273 | - | 11,742,273 | - |
Preferred Securities | 5,245,587 | - | 5,245,587 | - |
Money Market Funds | 80,028,163 | 80,028,163 | - | - |
Total Investments in Securities: | $ 9,361,391,932 | $ 9,185,411,906 | $ 149,471,906 | $ 26,508,120 |
Distribution of investments by country or territory of incorporation, as a percentage of total net assets, is as follows (Unaudited): |
United States of America | 86.7% |
United Kingdom | 6.3% |
Canada | 2.3% |
Switzerland | 1.1% |
Others (Individually Less Than 1%) | 3.6% |
| 100.0% |
See accompanying notes which are an integral part of the financial statements.
Annual Report
Statement of Assets and Liabilities
| June 30, 2014 |
| | |
Assets | | |
Investment in securities, at value (including securities loaned of $23,937,160) - See accompanying schedule: Unaffiliated issuers (cost $8,244,037,615) | $ 9,281,363,769 | |
Fidelity Central Funds (cost $80,028,163) | 80,028,163 | |
Total Investments (cost $8,324,065,778) | | $ 9,361,391,932 |
Cash | | 1,077,399 |
Receivable for investments sold
Regular delivery | | 119,278,698 |
Delayed delivery | | 202,324 |
Receivable for fund shares sold | | 6,180 |
Dividends receivable | | 12,889,286 |
Interest receivable | | 77,576 |
Distributions receivable from Fidelity Central Funds | | 68,902 |
Other affiliated receivables | | 50,782 |
Other receivables | | 39,181 |
Total assets | | 9,495,082,260 |
| | |
Liabilities | | |
Payable for investments purchased
Regular delivery | $ 48,329,386 | |
Delayed delivery | 25,135,396 | |
Payable for fund shares redeemed | 121,205,674 | |
Accrued management fee | 3,501,227 | |
Other affiliated payables | 641,751 | |
Other payables and accrued expenses | 313,299 | |
Collateral on securities loaned, at value | 24,898,201 | |
Total liabilities | | 224,024,934 |
| | |
Net Assets | | $ 9,271,057,326 |
Net Assets consist of: | | |
Paid in capital | | $ 8,056,109,065 |
Undistributed net investment income | | 46,483,923 |
Accumulated undistributed net realized gain (loss) on investments and foreign currency transactions | | 131,131,758 |
Net unrealized appreciation (depreciation) on investments and assets and liabilities in foreign currencies | | 1,037,332,580 |
Net Assets | | $ 9,271,057,326 |
See accompanying notes which are an integral part of the financial statements.
Annual Report
Financial Statements - continued
Statement of Assets and Liabilities - continued
| June 30, 2014 |
| | |
Series Growth & Income:
Net Asset Value, offering price and redemption price per share ($3,910,454,637 ÷ 288,007,923 shares) | | $ 13.58 |
| | |
Class F:
Net Asset Value, offering price and redemption price per share ($5,360,602,689 ÷ 394,205,503 shares) | | $ 13.60 |
See accompanying notes which are an integral part of the financial statements.
Annual Report
Statement of Operations
| Year ended June 30, 2014 |
| | |
Investment Income | | |
Dividends | | $ 162,314,009 |
Interest | | 752,073 |
Income from Fidelity Central Funds | | 531,435 |
Total income | | 163,597,517 |
| | |
Expenses | | |
Management fee | $ 29,733,096 | |
Transfer agent fees | 4,874,360 | |
Accounting and security lending fees | 1,072,688 | |
Custodian fees and expenses | 250,692 | |
Independent trustees' compensation | 24,416 | |
Registration fees | 194,280 | |
Audit | 54,561 | |
Legal | 13,383 | |
Interest | 1,426 | |
Miscellaneous | 24,693 | |
Total expenses before reductions | 36,243,595 | |
Expense reductions | (111,867) | 36,131,728 |
Net investment income (loss) | | 127,465,789 |
Realized and Unrealized Gain (Loss) Net realized gain (loss) on: | | |
Investment securities: | | |
Unaffiliated issuers | 229,516,527 | |
Foreign currency transactions | (1,712) | |
Futures contracts | (18,511) | |
Total net realized gain (loss) | | 229,496,304 |
Change in net unrealized appreciation (depreciation) on: Investment securities | 792,729,366 | |
Assets and liabilities in foreign currencies | 6,426 | |
Total change in net unrealized appreciation (depreciation) | | 792,735,792 |
Net gain (loss) | | 1,022,232,096 |
Net increase (decrease) in net assets resulting from operations | | $ 1,149,697,885 |
See accompanying notes which are an integral part of the financial statements.
Annual Report
Financial Statements - continued
Statement of Changes in Net Assets
| Year ended
June 30,
2014 | For the period
December 6, 2012
(Commencement of Operations) to
June 30, 2013 |
Increase (Decrease) in Net Assets | | |
Operations | | |
Net investment income (loss) | $ 127,465,789 | $ 17,353,281 |
Net realized gain (loss) | 229,496,304 | 20,427,078 |
Change in net unrealized appreciation (depreciation) | 792,735,792 | 244,596,788 |
Net increase (decrease) in net assets resulting from operations | 1,149,697,885 | 282,377,147 |
Distributions to shareholders from net investment income | (91,176,470) | (1,959,964) |
Distributions to shareholders from net realized gain | (123,990,338) | - |
Total distributions | (215,166,808) | (1,959,964) |
Share transactions - net increase (decrease) | 6,107,960,785 | 1,948,148,281 |
Total increase (decrease) in net assets | 7,042,491,862 | 2,228,565,464 |
| | |
Net Assets | | |
Beginning of period | 2,228,565,464 | - |
End of period (including undistributed net investment income of $46,483,923 and undistributed net investment income of $15,366,382, respectively) | $ 9,271,057,326 | $ 2,228,565,464 |
See accompanying notes which are an integral part of the financial statements.
Annual Report
Financial Highlights - Series Growth & Income
Years ended June 30, | 2014 | 2013 G |
Selected Per-Share Data | | |
Net asset value, beginning of period | $ 11.53 | $ 10.00 |
Income from Investment Operations | | |
Net investment income (loss) D | .24 | .09 |
Net realized and unrealized gain (loss) | 2.29 | 1.45 |
Total from investment operations | 2.53 | 1.54 |
Distributions from net investment income | (.21) | (.01) |
Distributions from net realized gain | (.27) | - |
Total distributions | (.48) | (.01) |
Net asset value, end of period | $ 13.58 | $ 11.53 |
Total Return B, C | 22.40% | 15.41% |
Ratios to Average Net Assets E, H | | |
Expenses before reductions | .66% | .78% A |
Expenses net of fee waivers, if any | .66% | .78% A |
Expenses net of all reductions | .66% | .77% A |
Net investment income (loss) | 1.87% | 1.42% A |
Supplemental Data | | |
Net assets, end of period (000 omitted) | $ 3,910,455 | $ 1,000,854 |
Portfolio turnover rate F | 53% I | 80% A |
A Annualized
B Total returns for periods of less than one year are not annualized.
C Total returns would have been lower if certain expenses had not been reduced during the applicable periods shown.
D Calculated based on average shares outstanding during the period.
E Fees and expenses of any underlying Fidelity Central Funds are not included in the Fund's expense ratio. The Fund indirectly bears its proportionate share of the expenses of any underlying Fidelity Central Funds.
F Amount does not include the portfolio activity of any underlying Fidelity Central Funds.
G For the period December 6, 2012 (commencement of operations) to June 30, 2013.
H Expense ratios reflect operating expenses of the class. Expenses before reductions do not reflect amounts reimbursed by the investment adviser or reductions from brokerage service arrangements or reductions from other expense offset arrangements and do not represent the amount paid by the class during periods when reimbursements or reductions occur. Expense ratios before reductions for start-up periods may not be representative of longer-term operating periods. Expenses net of fee waivers reflect expenses after reimbursement by the investment adviser but prior to reductions from brokerage service arrangements or other expense offset arrangements. Expenses net of all reductions represent the net expenses paid by the class.
I Portfolio turnover rate excludes securities received or delivered in-kind.
See accompanying notes which are an integral part of the financial statements.
Annual Report
Financial Highlights - Class F
Years ended June 30, | 2014 | 2013 G |
Selected Per-Share Data | | |
Net asset value, beginning of period | $ 11.54 | $ 10.00 |
Income from Investment Operations | | |
Net investment income (loss) D | .26 | .10 |
Net realized and unrealized gain (loss) | 2.29 | 1.45 |
Total from investment operations | 2.55 | 1.55 |
Distributions from net investment income | (.23) | (.01) |
Distributions from net realized gain | (.27) | - |
Total distributions | (.49) J | (.01) |
Net asset value, end of period | $ 13.60 | $ 11.54 |
Total Return B, C | 22.61% | 15.53% |
Ratios to Average Net Assets E, H | | |
Expenses before reductions | .48% | .59% A |
Expenses net of fee waivers, if any | .48% | .59% A |
Expenses net of all reductions | .48% | .58% A |
Net investment income (loss) | 2.04% | 1.60% A |
Supplemental Data | | |
Net assets, end of period (000 omitted) | $ 5,360,603 | $ 1,227,712 |
Portfolio turnover rate F | 53% I | 80% A |
A Annualized
B Total returns for periods of less than one year are not annualized.
C Total returns would have been lower if certain expenses had not been reduced during the applicable periods shown.
D Calculated based on average shares outstanding during the period.
E Fees and expenses of any underlying Fidelity Central Funds are not included in the Fund's expense ratio. The Fund indirectly bears its proportionate share of the expenses of any underlying Fidelity Central Funds.
F Amount does not include the portfolio activity of any underlying Fidelity Central Funds.
G For the period December 6, 2012 (commencement of operations) to June 30, 2013.
H Expense ratios reflect operating expenses of the class. Expenses before reductions do not reflect amounts reimbursed by the investment adviser or reductions from brokerage service arrangements or reductions from other expense offset arrangements and do not represent the amount paid by the class during periods when reimbursements or reductions occur. Expense ratios before reductions for start-up periods may not be representative of longer-term operating periods. Expenses net of fee waivers reflect expenses after reimbursement by the investment adviser but prior to reductions from brokerage service arrangements or other expense offset arrangements. Expenses net of all reductions represent the net expenses paid by the class.
I Portfolio turnover rate excludes securities received or delivered in-kind.
J Total distributions of $.49 per share is comprised of distributions from net investment income of $.228 and distributions from net realized gain of $.266 per share.
See accompanying notes which are an integral part of the financial statements.
Annual Report
Notes to Financial Statements
For the period ended June 30, 2014
1. Organization.
Fidelity Series Growth & Income Fund (the Fund) is a fund of Fidelity Hastings Street Trust (the Trust) and is authorized to issue an unlimited number of shares. Shares of the Fund are only available for purchase by mutual funds for which Fidelity Management & Research Company (FMR) or an affiliate serves as an investment manager. The Trust is registered under the Investment Company Act of 1940, as amended (the 1940 Act), as an open-end management investment company organized as a Massachusetts business trust. The Fund offers Series Growth & Income and Class F, each of which has equal rights as to assets and voting privileges. Each class has exclusive voting rights with respect to matters that affect that class.
2. Investments in Fidelity Central Funds.
The Fund invests in Fidelity Central Funds, which are open-end investment companies generally available only to other investment companies and accounts managed by the investment adviser and its affiliates. The Fund's Schedule of Investments lists each of the Fidelity Central Funds held as of period end, if any, as an investment of the Fund, but does not include the underlying holdings of each Fidelity Central Fund. As an Investing Fund, the Fund indirectly bears its proportionate share of the expenses of the underlying Fidelity Central Funds.
The Money Market Central Funds seek preservation of capital and current income and are managed by Fidelity Investments Money Management, Inc. (FIMM), an affiliate of the investment adviser. Annualized expenses of the Money Market Central Funds as of their most recent shareholder report date are less than .01%.
A complete unaudited list of holdings for each Fidelity Central Fund is available upon request or at the Securities and Exchange Commission (the SEC) website at www.sec.gov. In addition, the financial statements of the Fidelity Central Funds, which are not covered by the Fund's Report of Independent Registered Public Accounting Firm, are available on the SEC website or upon request.
3. Significant Accounting Policies.
The financial statements have been prepared in conformity with accounting principles generally accepted in the United States of America (GAAP), which require management to make certain estimates and assumptions at the date of the financial statements. Actual results could differ from those estimates. Subsequent events, if any, through the date that the financial statements were issued have been evaluated in the preparation of
Annual Report
Notes to Financial Statements - continued
3. Significant Accounting Policies - continued
the financial statements. The following summarizes the significant accounting policies of the Fund:
Investment Valuation. Investments are valued as of 4:00 p.m. Eastern time on the last calendar day of the period. In accordance with valuation policies and procedures approved by the Board of Trustees (the Board), the Fund attempts to obtain prices from one or more third party pricing vendors or brokers to value its investments. When current market prices, quotations or currency exchange rates are not readily available or reliable, investments will be fair valued in good faith by the FMR Fair Value Committee (the Committee), in accordance with procedures adopted by the Board. Factors used in determining fair value vary by investment type and may include market or investment specific events, changes in interest rates and credit quality. The frequency with which these procedures are used cannot be predicted and they may be utilized to a significant extent. The Committee oversees the Fund's valuation policies and procedures and is responsible for approving and reporting to the Board all fair value determinations.
The Fund categorizes the inputs to valuation techniques used to value its investments into a disclosure hierarchy consisting of three levels as shown below:
Level 1 - quoted prices in active markets for identical investments
Level 2 - other significant observable inputs (including quoted prices for similar investments, interest rates, prepayment speeds, etc.)
Level 3 - unobservable inputs (including the Fund's own assumptions based on the best information available)
Valuation techniques used to value the Fund's investments by major category are as follows:
Equity securities, including restricted securities, for which market quotations are readily available, are valued at the last reported sale price or official closing price as reported by a third party pricing vendor on the primary market or exchange on which they are traded and are categorized as Level 1 in the hierarchy. In the event there were no sales during the day or closing prices are not available, securities are valued at the last quoted bid price or may be valued using the last available price and are generally categorized as Level 2 in the hierarchy. For foreign equity securities, when market or security specific events arise, comparisons to the valuation of American Depositary Receipts (ADRs), futures contracts, Exchange-Traded Funds (ETFs) and certain indexes as well as quoted prices for similar securities may be used and would be categorized as Level 2 in the hierarchy. Utilizing these techniques may result in transfers between Level 1 and Level 2. For equity securities, including restricted securities, where observable inputs are
Annual Report
3. Significant Accounting Policies - continued
Investment Valuation - continued
limited, assumptions about market activity and risk are used and these securities may be categorized as Level 3 in the hierarchy.
Debt securities, including restricted securities, are valued based on evaluated prices received from third party pricing vendors or from brokers who make markets in such securities. Corporate bonds and preferred securities are valued by pricing vendors who utilize matrix pricing which considers yield or price of bonds of comparable quality, coupon, maturity and type or by broker-supplied prices. When independent prices are unavailable or unreliable, debt securities may be valued utilizing pricing methodologies which consider similar factors that would be used by third party pricing vendors. Debt securities are generally categorized as Level 2 in the hierarchy but may be Level 3 depending on the circumstances.
Investments in open-end mutual funds, including the Fidelity Central Funds, are valued at their closing net asset value (NAV) each business day and are categorized as Level 1 in the hierarchy.
Changes in valuation techniques may result in transfers in or out of an assigned level within the disclosure hierarchy. The aggregate value of investments by input level, as of June 30, 2014 is included at the end of the Fund's Schedule of Investments.
Foreign Currency. The Fund may use foreign currency contracts to facilitate transactions in foreign-denominated securities. Gains and losses from these transactions may arise from changes in the value of the foreign currency or if the counterparties do not perform under the contracts' terms.
Foreign-denominated assets, including investment securities, and liabilities are translated into U.S. dollars at the exchange rates at period end. Purchases and sales of investment securities, income and dividends received and expenses denominated in foreign currencies are translated into U.S. dollars at the exchange rate in effect on the transaction date.
The effects of exchange rate fluctuations on investments are included with the net realized and unrealized gain (loss) on investment securities. Other foreign currency transactions resulting in realized and unrealized gain (loss) are disclosed separately.
Investment Transactions and Income. For financial reporting purposes, the Fund's investment holdings and NAV include trades executed through the end of the last business day of the period. The NAV per share for processing shareholder transactions is calculated as of the close of business of the New York Stock Exchange (NYSE), normally 4:00 p.m. Eastern time and includes trades executed through the end of the prior business day. Gains and losses on securities sold are determined on the basis of identified
Annual Report
Notes to Financial Statements - continued
3. Significant Accounting Policies - continued
Investment Transactions and Income - continued
cost and may include proceeds received from litigation. Dividend income is recorded on the ex-dividend date, except for certain dividends from foreign securities where the ex-dividend date may have passed, which are recorded as soon as the Fund is informed of the ex-dividend date. Non-cash dividends included in dividend income, if any, are recorded at the fair market value of the securities received. Income and capital gain distributions from Fidelity Central Funds, if any, are recorded on the ex-dividend date. Distributions received on securities that represent a return of capital or capital gain are recorded as a reduction of cost of investments and/or as a realized gain. Subsequent to ex-dividend date the Fund determines the components of these distributions, based upon receipt of tax filings or other correspondence relating to the underlying investment. Interest income is accrued as earned and includes coupon interest and amortization of premium and accretion of discount on debt securities as applicable. Investment income is recorded net of foreign taxes withheld where recovery of such taxes is uncertain.
Class Allocations and Expenses. Investment income, realized and unrealized capital gains and losses, common expenses of the Fund, and certain fund-level expense reductions, if any, are allocated daily on a pro-rata basis to each class based on the relative net assets of each class to the total net assets of the Fund. Each class differs with respect to transfer agent fees incurred. Certain expense reductions may also differ by class. For the reporting period, the allocated portion of income and expenses to each class as a percent of its average net assets may vary due to the timing of recording these transactions in relation to fluctuating net assets of the classes. Expenses directly attributable to a fund are charged to that fund. Expenses attributable to more than one fund are allocated among the respective funds on the basis of relative net assets or other appropriate methods. Expense estimates are accrued in the period to which they relate and adjustments are made when actual amounts are known.
Income Tax Information and Distributions to Shareholders. Each year, the Fund intends to qualify as a regulated investment company under Subchapter M of the Internal Revenue Code, including distributing substantially all of its taxable income and realized gains. As a result, no provision for U.S. Federal income taxes is required. As of June 30, 2014, the Fund did not have any unrecognized tax benefits in the financial statements; nor is the Fund aware of any tax positions for which it is reasonably possible that the total amounts of unrecognized tax benefits will significantly change in the next twelve months. The Fund files a U.S. federal tax return, in addition to state and local tax returns as required. The Fund's federal income tax returns are subject to examination by the Internal Revenue Service (IRS) for a period of three fiscal years after they are filed. State and local tax returns may be subject to examination for an additional fiscal year depending on the jurisdiction. Foreign taxes are provided for based on the Fund's understanding of the tax rules and rates that exist in the foreign markets in which it invests.
Annual Report
3. Significant Accounting Policies - continued
Income Tax Information and Distributions to Shareholders - continued
Distributions are declared and recorded on the ex-dividend date. Income dividends and capital gain distributions are declared separately for each class. Income and capital gain distributions are determined in accordance with income tax regulations, which may differ from GAAP.
Capital accounts within the financial statements are adjusted for permanent book-tax differences. These adjustments have no impact on net assets or the results of operations. Capital accounts are not adjusted for temporary book-tax differences which will reverse in a subsequent period.
Book-tax differences are primarily due to futures contracts, foreign currency transactions, market discount, partnerships, equity-debt classifications and losses deferred due to wash sales.
The federal tax cost of investment securities and unrealized appreciation (depreciation) as of period end were as follows:
Gross unrealized appreciation | $ 1,136,827,885 |
Gross unrealized depreciation | (100,599,532) |
Net unrealized appreciation (depreciation) on securities and other investments | $ 1,036,228,353 |
| |
Tax Cost | $ 8,325,163,579 |
The tax-based components of distributable earnings as of period end were as follows:
Undistributed ordinary income | $ 137,914,980 |
Undistributed long-term capital gain | $ 40,839,288 |
Net unrealized appreciation (depreciation) | $ 1,036,234,779 |
The tax character of distributions paid was as follows:
| June 30, 2014 | June 30, 2013 |
| | |
Ordinary Income | $ 215,166,808 | $ 1,959,964 |
Delayed Delivery Transactions and When-Issued Securities. During the period, the Fund transacted in securities on a delayed delivery or when-issued basis. Payment and delivery may take place after the customary settlement period for that security. The price of the underlying securities and the date when the securities will be delivered and paid for are fixed at the time the transaction is negotiated. The securities purchased on a delayed delivery or when-issued basis are identified as such in the Fund's Schedule of
Annual Report
Notes to Financial Statements - continued
3. Significant Accounting Policies - continued
Delayed Delivery Transactions and When-Issued Securities - continued
Investments. The Fund may receive compensation for interest forgone in the purchase of a delayed delivery or when-issued security. With respect to purchase commitments, the Fund identifies securities as segregated in its records with a value at least equal to the amount of the commitment. Losses may arise due to changes in the value of the underlying securities or if the counterparty does not perform under the contract's terms, or if the issuer does not issue the securities due to political, economic, or other factors.
Restricted Securities. The Fund may invest in securities that are subject to legal or contractual restrictions on resale. These securities generally may be resold in transactions exempt from registration or to the public if the securities are registered. Disposal of these securities may involve time-consuming negotiations and expense, and prompt sale at an acceptable price may be difficult. Information regarding restricted securities is included at the end of the Fund's Schedule of Investments.
4. Derivative Instruments.
Risk Exposures and the Use of Derivative Instruments. The Fund's investment objective allows the Fund to enter into various types of derivative contracts, including futures contracts. Derivatives are investments whose value is primarily derived from underlying assets, indices or reference rates and may be transacted on an exchange or over-the-counter (OTC). Derivatives may involve a future commitment to buy or sell a specified asset based on specified terms, to exchange future cash flows at periodic intervals based on a notional principal amount, or for one party to make one or more payments upon the occurrence of specified events in exchange for periodic payments from the other party.
The Fund used derivatives to increase returns and to manage exposure to certain risks as defined below. The success of any strategy involving derivatives depends on analysis of numerous economic factors, and if the strategies for investment do not work as intended, the Fund may not achieve its objectives.
The Fund's use of derivatives increased or decreased its exposure to the following risk:
Equity Risk | Equity risk relates to the fluctuations in the value of financial instruments as a result of changes in market prices (other than those arising from interest rate risk or foreign exchange risk), whether caused by factors specific to an individual investment, its issuer, or all factors affecting all instruments traded in a market or market segment. |
The Fund is also exposed to additional risks from investing in derivatives, such as liquidity risk and counterparty credit risk. Liquidity risk is the risk that the Fund will be
Annual Report
4. Derivative Instruments - continued
Risk Exposures and the Use of Derivative Instruments - continued
unable to close out the derivative in the open market in a timely manner. Counterparty credit risk is the risk that the counterparty will not be able to fulfill its obligation to the Fund. Counterparty credit risk related to exchange-traded futures contracts may be mitigated by the protection provided by the exchange on which they trade.
Investing in derivatives may involve greater risks than investing in the underlying assets directly and, to varying degrees, may involve risk of loss in excess of any initial investment and collateral received and amounts recognized in the Statement of Assets and Liabilities. In addition, there may be the risk that the change in value of the derivative contract does not correspond to the change in value of the underlying instrument.
Futures Contracts. A futures contract is an agreement between two parties to buy or sell a specified underlying instrument for a fixed price at a specified future date. The Fund used futures contracts to manage its exposure to the stock market.
Upon entering into a futures contract, a fund is required to deposit either cash or securities (initial margin) with a clearing broker in an amount equal to a certain percentage of the face value of the contract. Futures contracts are marked-to-market daily and subsequent daily payments (variation margin) are made or received by a fund depending on the daily fluctuations in the value of the futures contracts and are recorded as unrealized appreciation or (depreciation). This receivable and/or payable, if any, is included in daily variation margin for derivative instruments in the Statement of Assets and Liabilities. Realized gain or (loss) is recorded upon the expiration or closing of a futures contract.
Any open futures contracts at period end are presented in the Schedule of Investments under the caption "Futures Contracts." The underlying face amount at value reflects each contract's exposure to the underlying instrument or index at period end.
During the period the Fund recognized net realized gain (loss) of $(18,511) related to its investment in futures contracts. This amount is included in the Statement of Operations.
5. Purchases and Sales of Investments.
Purchases and sales of securities excluding in-kind transactions, other than short-term securities, aggregated $7,182,302,684 and $3,303,579,073, respectively.
6. Fees and Other Transactions with Affiliates.
Management Fee. Fidelity Management & Research Company (the investment adviser) and its affiliates provide the Fund with investment management related services for which the Fund pays a monthly management fee. The management fee is the sum of an individual fund fee rate that is based on an annual rate of .30% of the Fund's
Annual Report
Notes to Financial Statements - continued
6. Fees and Other Transactions with Affiliates - continued
Management Fee - continued
average net assets and an annualized group fee rate that averaged .25% during the period. The group fee rate is based upon the average net assets of all the mutual funds advised by the investment adviser, including any mutual funds previously advised by the investment adviser that are currently advised by Fidelity SelectCo, LLC, an affiliate of the investment adviser. The group fee rate decreases as assets under management increase and increases as assets under management decrease. In addition, the management fee would have been subject to a performance adjustment effective December 1, 2013. However, effective August 1, 2013, the performance adjustment was removed and the individual fund fee rate decreased from .30% to .20% of the Fund's average net assets. For the reporting period, the total annual management fee rate was .46% of the Fund's average net assets.
Transfer Agent Fees. Fidelity Investments Institutional Operations Company, Inc., (FIIOC), an affiliate of the investment adviser, is the transfer, dividend disbursing and shareholder servicing agent for each class of the Fund. FIIOC receives account fees and asset-based fees that vary according to the account size and type of account of the shareholders of Series Growth & Income. FIIOC receives no fees for providing transfer agency services to Class F. FIIOC pays for typesetting, printing and mailing of shareholder reports, except proxy statements.
For the period, transfer agent fees for each applicable class were as follows:
| Amount | % of
Average
Net Assets |
Series Growth & Income | $ 4,874,360 | .17 |
Accounting and Security Lending Fees. Fidelity Service Company, Inc. (FSC), an affiliate of the investment adviser, maintains the Fund's accounting records. The accounting fee is based on the level of average net assets for each month. Under a separate contract, FSC administers the security lending program. The security lending fee is based on the number and duration of lending transactions.
Brokerage Commissions. The Fund placed a portion of its portfolio transactions with brokerage firms which are affiliates of the investment adviser. Brokerage commissions are included in net realized gain (loss) and change in net unrealized appreciation (depreciation) in the Statement of Operations. The commissions paid to these affiliated firms were $110,997 for the period.
Annual Report
6. Fees and Other Transactions with Affiliates - continued
Interfund Lending Program. Pursuant to an Exemptive Order issued by the SEC, the Fund, along with other registered investment companies having management contracts with FMR or other affiliated entities of FMR, may participate in an interfund lending program. This program provides an alternative credit facility allowing the funds to borrow from, or lend money to, other participating affiliated funds. At period end, there were no interfund loans outstanding. The Fund's activity in this program during the period for which loans were outstanding was as follows:
Borrower or Lender | Average Loan
Balance | Weighted Average Interest Rate | Interest
Expense |
Borrower | $ 16,702,300 | .31% | $ 1,426 |
Exchanges In-Kind. During the period, certain investment companies managed by the investment adviser or its affiliates (Investing Funds) completed exchanges in-kind with the Fund. The Investing Funds delivered securities and other assets, including accrued interest, valued at $2,210,665,953 in exchange for 175,851,233 shares of the Fund. The amount of in-kind exchanges is included in share transactions in the accompanying Statement of Changes in Net Assets as well as Note 11: Share Transactions. The Fund recognized no gain or loss for federal income tax purposes.
7. Committed Line of Credit.
The Fund participates with other funds managed by the investment adviser or an affiliate in a $4.25 billion credit facility (the "line of credit") to be utilized for temporary or emergency purposes to fund shareholder redemptions or for other short-term liquidity purposes. The Fund has agreed to pay commitment fees on its pro-rata portion of the line of credit, which amounted to $8,839 and is reflected in Miscellaneous expenses on the Statement of Operations. During the period, the Fund did not borrow on this line of credit.
8. Security Lending.
The Fund lends portfolio securities through a lending agent from time to time in order to earn additional income. For equity securities, a lending agent is used and may loan securities to certain qualified borrowers, including Fidelity Capital Markets (FCM), a broker-dealer affiliated with the Fund. On the settlement date of the loan, the Fund receives collateral (in the form of U.S. Treasury obligations, letters of credit and/or cash) against the loaned securities and maintains collateral in an amount not less than 100% of the market value of the loaned securities during the period of the loan. The market value of the loaned securities is determined at the close of business of the Fund and any
Annual Report
Notes to Financial Statements - continued
8. Security Lending - continued
additional required collateral is delivered to the Fund on the next business day. If the borrower defaults on its obligation to return the securities loaned because of insolvency or other reasons, the Fund may apply collateral received from the borrower against the obligation. The Fund may experience delays and costs in recovering the securities loaned. Any cash collateral received is invested in the Fidelity Securities Lending Cash Central Fund. The value of loaned securities and cash collateral at period end are disclosed on the Fund's Statement of Assets and Liabilities. At period end, there were no security loans outstanding with FCM. Security lending income represents the income earned on investing cash collateral, less rebates paid to borrowers and any lending agent fees associated with the loan, plus any premium payments received for lending certain types of securities. Security lending income is presented in the Statement of Operations as a component of income from Fidelity Central Funds. Total security lending income during the period amounted to $461,394, including $31,052 from securities loaned to FCM.
9. Expense Reductions.
Commissions paid to certain brokers with whom the investment adviser, or its affiliates, places trades on behalf of the Fund include an amount in addition to trade execution, which may be rebated back to the Fund to offset certain expenses. This amount totaled $111,715 for the period. In addition, through arrangements with the Fund's custodian, credits realized as a result of uninvested cash balances were used to reduce the Fund's expenses. During the period, these credits reduced the Fund's custody expenses by $152.
10. Distributions to Shareholders.
Distributions to shareholders of each class were as follows:
Years ended June 30, | 2014 | 2013 A |
From net investment income | | |
Series Growth & Income | $ 37,541,666 | $ 905,843 |
Class F | 53,634,804 | 1,054,121 |
Total | $ 91,176,470 | $ 1,959,964 |
From net realized gain | | |
Series Growth & Income | $ 54,222,177 | $ - |
Class F | 69,768,161 | - |
Total | $ 123,990,338 | $ - |
A For the period December 6, 2012(commencement of operations) to June 30, 2013.
Annual Report
11. Share Transactions.
Transactions for each class of shares were as follows:
| Shares | Dollars |
Years ended June 30, | 2014 | 2013 A | 2014 | 2013 A |
Series Growth & Income | | | | |
Shares sold | 242,743,841 B | 96,902,349 C | $ 3,040,662,355B | $ 979,211,727 C |
Reinvestment of distributions | 7,325,735 | 90,044 | 91,763,843 | 905,843 |
Shares redeemed | (48,854,269) | (10,199,777) | (623,276,343) | (110,540,125) |
Net increase (decrease) | 201,215,307 | 86,792,616 | $ 2,509,149,855 | $ 869,577,445 |
Class F | | | | |
Shares sold | 330,002,977 B | 109,570,857 C | $ 4,146,555,651 B | $ 1,113,133,023 C |
Reinvestment of distributions | 9,833,824 | 104,783 | 123,402,965 | 1,054,121 |
Shares redeemed | (51,994,506) | (3,312,432) | (671,147,686) | (35,616,308) |
Net increase (decrease) | 287,842,295 | 106,363,208 | $ 3,598,810,930 | $ 1,078,570,836 |
A For the period December 6, 2012 (commencement of operations) to June 30, 2013.
B Amount includes in-kind exchanges (see Note 6: Exchanges In-Kind).
C Amount includes in-kind exchanges.
12. Other.
The Fund's organizational documents provide former and current trustees and officers with a limited indemnification against liabilities arising in connection with the performance of their duties to the Fund. In the normal course of business, the Fund may also enter into contracts that provide general indemnifications. The Fund's maximum exposure under these arrangements is unknown as this would be dependent on future claims that may be made against the Fund. The risk of material loss from such claims is considered remote.
At the end of the period, mutual funds managed by the investment adviser or its affiliates were the owners of record of all of the outstanding shares of the Fund.
Annual Report
To the Trustees of Fidelity Hastings Street Trust and the Shareholders of Fidelity Series Growth & Income Fund:
In our opinion, the accompanying statement of assets and liabilities, including the schedule of investments, and the related statements of operations and of changes in net assets and the financial highlights present fairly, in all material respects, the financial position of Fidelity Series Growth & Income Fund (a fund of Fidelity Hastings Street Trust) at June 30, 2014, the results of its operations for the year then ended, the changes in its net assets for each of the two years in the period then ended and the financial highlights for each of the periods indicated, in conformity with accounting principles generally accepted in the United States of America. These financial statements and financial highlights (hereafter referred to as "financial statements") are the responsibility of the Fidelity Series Growth & Income Fund's management. Our responsibility is to express an opinion on these financial statements based on our audits. We conducted our audits of these financial statements in accordance with the standards of the Public Company Accounting Oversight Board (United States). Those standards require that we plan and perform the audit to obtain reasonable assurance about whether the financial statements are free of material misstatement. An audit includes examining, on a test basis, evidence supporting the amounts and disclosures in the financial statements, assessing the accounting principles used and significant estimates made by management, and evaluating the overall financial statement presentation. We believe that our audits, which included confirmation of securities at June 30, 2014 by correspondence with the custodian and brokers, provide a reasonable basis for our opinion.
PricewaterhouseCoopers LLP
Boston, Massachusetts
August 14, 2014
Annual Report
The Trustees, Member of the Advisory Board, and officers of the trust and fund, as applicable, are listed below. The Board of Trustees governs the fund and is responsible for protecting the interests of shareholders. The Trustees are experienced executives who meet periodically throughout the year to oversee the fund's activities, review contractual arrangements with companies that provide services to the fund, oversee management of the risks associated with such activities and contractual arrangements, and review the fund's performance. Except for James C. Curvey, each of the Trustees oversees 173 funds. Mr. Curvey oversees 397 funds.
The Trustees hold office without limit in time except that (a) any Trustee may resign; (b) any Trustee may be removed by written instrument, signed by at least two-thirds of the number of Trustees prior to such removal; (c) any Trustee who requests to be retired or who has become incapacitated by illness or injury may be retired by written instrument signed by a majority of the other Trustees; and (d) any Trustee may be removed at any special meeting of shareholders by a two-thirds vote of the outstanding voting securities of the trust. Each Trustee who is not an interested person (as defined in the 1940 Act) of the trust and the fund (Independent Trustee), shall retire not later than the last day of the calendar year in which his or her 75th birthday occurs. The Independent Trustees may waive this mandatory retirement age policy with respect to individual Trustees. The officers and Advisory Board Member hold office without limit in time, except that any officer and Advisory Board Member may resign or may be removed by a vote of a majority of the Trustees at any regular meeting or any special meeting of the Trustees. Except as indicated, each individual has held the office shown or other offices in the same company for the past five years.
Experience, Skills, Attributes, and Qualifications of the Fund's Trustees. The Governance and Nominating Committee has adopted a statement of policy that describes the experience, qualifications, attributes, and skills that are necessary and desirable for potential Independent Trustee candidates (Statement of Policy). The Board believes that each Trustee satisfied at the time he or she was initially elected or appointed a Trustee, and continues to satisfy, the standards contemplated by the Statement of Policy. The Governance and Nominating Committee also engages professional search firms to help identify potential Independent Trustee candidates who have the experience, qualifications, attributes, and skills consistent with the Statement of Policy. From time to time, additional criteria based on the composition and skills of the current Independent Trustees, as well as experience or skills that may be appropriate in light of future changes to board composition, business conditions, and regulatory or other developments, have also been considered by the professional search firms and the Governance and Nominating Committee. In addition, the Board takes into account the Trustees' commitment and participation in Board and committee meetings, as well as their leadership of standing and ad hoc committees throughout their tenure.
In determining that a particular Trustee was and continues to be qualified to serve as a Trustee, the Board has considered a variety of criteria, none of which, in isolation, was controlling. The Board believes that, collectively, the Trustees have balanced and diverse experience, qualifications, attributes, and skills, which allow the Board to operate effectively in governing the fund and protecting the interests of shareholders. Information about the specific experience, skills, attributes, and qualifications of each Trustee, which in each case led to the Board's conclusion that the Trustee should serve (or continue to serve) as a trustee of the fund, is provided below.
Annual Report
Board Structure and Oversight Function. James C. Curvey is an interested person (as defined in the 1940 Act) and currently serves as Chairman. The Trustees have determined that an interested Chairman is appropriate and benefits shareholders because an interested Chairman has a personal and professional stake in the quality and continuity of services provided to the fund. Independent Trustees exercise their informed business judgment to appoint an individual of their choosing to serve as Chairman, regardless of whether the Trustee happens to be independent or a member of management. The Independent Trustees have determined that they can act independently and effectively without having an Independent Trustee serve as Chairman and that a key structural component for assuring that they are in a position to do so is for the Independent Trustees to constitute a substantial majority for the Board. The Independent Trustees also regularly meet in executive session. Ned C. Lautenbach serves as Chairman of the Independent Trustees and as such (i) acts as a liaison between the Independent Trustees and management with respect to matters important to the Independent Trustees and (ii) with management prepares agendas for Board meetings.
Fidelity funds are overseen by different Boards of Trustees. The fund's Board oversees Fidelity's equity and high income funds and another Board oversees Fidelity's investment-grade bond, money market, and asset allocation funds. The asset allocation funds may invest in Fidelity funds overseen by the fund's Board. The use of separate Boards, each with its own committee structure, allows the Trustees of each group of Fidelity funds to focus on the unique issues of the funds they oversee, including common research, investment, and operational issues. On occasion, the separate Boards establish joint committees to address issues of overlapping consequences for the Fidelity funds overseen by each Board.
The Trustees operate using a system of committees to facilitate the timely and efficient consideration of all matters of importance to the Trustees, the fund, and fund shareholders and to facilitate compliance with legal and regulatory requirements and oversight of the fund's activities and associated risks. The Board, acting through its committees, has charged FMR and its affiliates with (i) identifying events or circumstances the occurrence of which could have demonstrably adverse effects on the fund's business and/or reputation; (ii) implementing processes and controls to lessen the possibility that such events or circumstances occur or to mitigate the effects of such events or circumstances if they do occur; and (iii) creating and maintaining a system designed to evaluate continuously business and market conditions in order to facilitate the identification and implementation processes described in (i) and (ii) above. Because the day-to-day operations and activities of the fund are carried out by or through FMR, its affiliates and other service providers, the fund's exposure to risks is mitigated but not eliminated by the processes overseen by the Trustees. While each of the Board's committees has responsibility for overseeing different aspects of the fund's activities, oversight is exercised primarily through the Operations, Audit, and Compliance Committees. In addition, the Independent Trustees have worked with FMR to enhance the Board's oversight of investment and financial risks, legal and regulatory risks, technology risks, and operational risks, including the development of additional risk reporting to the Board. For example, a working group comprised of Independent Trustees and FMR has worked and continues to work to review the Fidelity funds' valuation-related activities, reporting and risk management. Appropriate personnel, including but not limited to the fund's Chief Compliance Officer (CCO), FMR's internal auditor, the independent accountants, the fund's Treasurer and portfolio management personnel, make periodic reports to the Board's committees, as appropriate, including an annual review of FMR's risk management program for the Fidelity funds. The responsibilities of each standing committee, including their oversight responsibilities, are described further under "Standing Committees of the Fund's Trustees."
Annual Report
Trustees and Officers - continued
The fund's Statement of Additional Information (SAI) includes more information about the Trustees. To request a free copy, call Fidelity at 1-800-544-8544 for Fidelity Series Growth & Income Fund, or 1-800-835-5092 for Class F.
Interested Trustees*:
Correspondence intended for each Trustee who is an interested person may be sent to Fidelity Investments, 245 Summer Street, Boston, Massachusetts 02210.
Name, Year of Birth; Principal Occupations and Other Relevant Experience+ |
James C. Curvey (1935) |
Year of Election or Appointment: 2007 Trustee Chairman of the Board of Trustees |
| Mr. Curvey also serves as Trustee of other Fidelity funds. Mr. Curvey is a Director of Fidelity Research & Analysis Co. (2009-present), and Vice Chairman (2007-present) and Director of FMR LLC. In addition, Mr. Curvey serves as an Overseer for the Boston Symphony Orchestra and a member of the Trustees of Villanova University. Previously, Mr. Curvey served as a Director of Fidelity Investments Money Management, Inc. (2009-2014), a Director of FMR (2007-2014), a Director of FMR Co., Inc. (2007-2014) and was the Vice Chairman (2006-2007) and Director (2000-2007) of FMR Corp. |
Charles S. Morrison (1960) |
Year of Election or Appointment: 2014 Trustee |
| Mr. Morrison also serves as Trustee of other funds. He serves as President, Asset Management (2014-present) and is an employee of Fidelity Investments. Previously, Mr. Morrison served as Vice President of Fidelity's Fixed Income and Asset Allocation Funds (2012-2014), President, Fixed Income (2011-2014), Vice President of Fidelity's Money Market Funds (2005-2009), President, Money Market Group Leader of FMR (2009), and Senior Vice President, Money Market Group of FMR (2004-2009). Mr. Morrison also served as Vice President of Fidelity's Bond Funds (2002-2005), certain Balanced Funds (2002-2005), and certain Asset Allocation Funds (2002-2007), and as Senior Vice President (2002-2005) of Fidelity's Bond Division. |
* Trustees have been determined to be "Interested Trustees" by virtue of, among other things, their affiliation with the trust or various entities under common control with FMR.
+ The information above includes each Trustee's principal occupation during the last five years and other information relating to the experience, attributes, and skills relevant to each Trustee's qualifications to serve as a Trustee, which led to the conclusion that each Trustee should serve as a Trustee for the fund.
Annual Report
Trustees and Officers - continued
Independent Trustees:
Correspondence intended for each Independent Trustee (that is, the Trustees other than the Interested Trustees) may be sent to Fidelity Investments, P.O. Box 55235, Boston, Massachusetts 02205-5235.
Name, Year of Birth; Principal Occupations and Other Relevant Experience+ |
Dennis J. Dirks (1948) |
Year of Election or Appointment: 2005 Trustee |
| Mr. Dirks also serves as Trustee of other Fidelity funds. Prior to his retirement in May 2003, Mr. Dirks was Chief Operating Officer and a member of the Board of The Depository Trust & Clearing Corporation (DTCC). He also served as President, Chief Operating Officer, and Board member of The Depository Trust Company (DTC) and President and Board member of the National Securities Clearing Corporation (NSCC). In addition, Mr. Dirks served as Chief Executive Officer and Board member of the Government Securities Clearing Corporation, Chief Executive Officer and Board member of the Mortgage-Backed Securities Clearing Corporation, as a Trustee and a member of the Finance Committee of Manhattan College (2005-2008), and as a Trustee and a member of the Finance Committee of AHRC of Nassau County (2006-2008). Mr. Dirks is a member of the Independent Directors Council (IDC) Governing Council (2010-present) and Board of Directors for The Brookville Center for Children's Services, Inc. (2009-present). |
Alan J. Lacy (1953) |
Year of Election or Appointment: 2008 Trustee |
| Mr. Lacy also serves as Trustee of other Fidelity funds. Mr. Lacy serves as Senior Adviser (2007-present) of Oak Hill Capital Partners, L.P. (private equity). Mr. Lacy also served as Chief Executive Officer (2000-2005) and Vice Chairman (2005-2006) of Sears Holdings Corporation and Sears, Roebuck and Co. (retail). In addition, Mr. Lacy serves as a member of the Board of Directors of Dave & Buster's Entertainment, Inc. (restaurant and entertainment complexes, 2010-present), Earth Fare, Inc. (retail grocery, 2012-present), The Hillman Companies, Inc. (hardware wholesalers, 2010-present), and Bristol-Myers Squibb Company (global pharmaceuticals, 2008-present). Mr. Lacy is a member of the Board of Trustees of The National Parks Conservation Association (2006-present). Previously, Mr. Lacy served as Chairman of the Board of Trustees of the National Parks Conservation Association (2008-2011) and as a member of the Board of Directors for the Western Union Company (global money transfer, 2006-2011). |
Ned C. Lautenbach (1944) |
Year of Election or Appointment: 2000 Trustee Chairman of the Independent Trustees |
| Mr. Lautenbach also serves as Trustee of other Fidelity funds. Mr. Lautenbach currently serves as the Lead Director of the Eaton Corporation Board of Directors (diversified industrial, 1997-present). Mr. Lautenbach is Chairman of the Board of Directors of the Philharmonic Center for the Arts in Naples, Florida (2012-present) and a member of the Council on Foreign Relations (1994-present). Previously, Mr. Lautenbach was a Partner/Advisory Partner at Clayton, Dubilier & Rice, LLC (private equity investment, 1998-2010), as well as a Director of Sony Corporation (2006-2007). |
Joseph Mauriello (1944) |
Year of Election or Appointment: 2008 Trustee |
| Mr. Mauriello also serves as Trustee of other Fidelity funds. Prior to his retirement in January 2006, Mr. Mauriello served in numerous senior management positions including Deputy Chairman and Chief Operating Officer (2004-2005), and Vice Chairman of Financial Services (2002-2004) of KPMG LLP US (professional services, 1965-2005). Mr. Mauriello currently serves as a member of the Board of Directors of XL Group plc. (global insurance and re-insurance, 2006-present). Previously, Mr. Mauriello served as a Director of the Hamilton Funds of the Bank of New York (2006-2007) and of Arcadia Resources Inc. (health care services and products, 2007-2012). |
Robert W. Selander (1950) |
Year of Election or Appointment: 2011 Trustee |
| Mr. Selander also serves as Trustee of other Fidelity funds. Previously, Mr. Selander served as a Member of the Advisory Board of other Fidelity funds (2011), and Executive Vice Chairman (2010), Chief Executive Officer (2009-2010), and President and Chief Executive Officer (1997-2009) of Mastercard, Inc. |
Cornelia M. Small (1944) |
Year of Election or Appointment: 2005 Trustee |
| Ms. Small also serves as Trustee of other Fidelity funds. Ms. Small is a member of the Board of Directors (2009-present) and Chair of the Investment Committee (2010-present) of the Teagle Foundation. Ms. Small also serves on the Investment Committee of the Berkshire Taconic Community Foundation (2008-present). Previously, Ms. Small served as Chairperson (2002-2008) and a member of the Investment Committee and Chairperson (2008-2012) and a member of the Board of Trustees of Smith College. In addition, Ms. Small served as Chief Investment Officer, Director of Global Equity Investments, and a member of the Board of Directors of Scudder, Stevens & Clark and Scudder Kemper Investments. |
William S. Stavropoulos (1939) |
Year of Election or Appointment: 2001 Trustee Vice Chairman of the Independent Trustees |
| Mr. Stavropoulos also serves as Trustee of other Fidelity funds. Mr. Stavropoulos serves as President and Founder of the Michigan Baseball Foundation, the Great Lakes Loons (2007-present). Mr. Stavropoulos is Chairman Emeritus of the Board of Directors of The Dow Chemical Company, where he previously served in numerous senior management positions, including President, CEO (1995-2000; 2002-2004), Chairman of the Executive Committee (2000-2006), and as a member of the Board of Directors (1990-2006). Currently, Mr. Stavropoulos is Chairman of the Board of Directors of Univar Inc. (global distributor of commodity and specialty chemicals), a Director of Teradata Corporation (data warehousing and technology solutions), and Maersk Inc. (industrial conglomerate), and a member of the Advisory Board for Metalmark Capital LLC (private equity investment, 2005-present). Mr. Stavropoulos is an operating advisor to Clayton, Dubilier & Rice, LLC (private equity investment). In addition, Mr. Stavropoulos is a member of the University of Notre Dame Advisory Council for the College of Science, a Trustee of the Rollin L. Gerstacker Foundation, and a Director of the Naples Philharmonic Center for the Arts. Previously, Mr. Stavropoulos served as a Director of Chemical Financial Corporation (bank holding company, 1993-2012) and Tyco International, Ltd. (multinational manufacturing and services, 2007-2012). |
David M. Thomas (1949) |
Year of Election or Appointment: 2008 Trustee |
| Mr. Thomas also serves as Trustee of other Fidelity funds. Mr. Thomas serves as Non-Executive Chairman of the Board of Directors of Fortune Brands Home and Security (home and security products, 2011-present), and as a member of the Board of Directors of Interpublic Group of Companies, Inc. (marketing communication, 2004-present). Previously, Mr. Thomas served as Executive Chairman (2005-2006) and Chairman and Chief Executive Officer (2000-2005) of IMS Health, Inc. (pharmaceutical and healthcare information solutions), and a Director of Fortune Brands, Inc. (consumer products, 2000-2011). |
+ The information above includes each Trustee's principal occupation during the last five years and other information relating to the experience, attributes, and skills relevant to each Trustee's qualifications to serve as a Trustee, which led to the conclusion that each Trustee should serve as a Trustee for the fund.
Advisory Board Member and Officers:
Correspondence intended for each officer and Peter S. Lynch may be sent to Fidelity Investments, 245 Summer Street, Boston, Massachusetts 02210. Officers appear below in alphabetical order.
Name, Year of Birth; Principal Occupation |
Peter S. Lynch (1944) |
Year of Election or Appointment: 2003 Member of the Advisory Board |
| Mr. Lynch also serves as Member of the Advisory Board of other Fidelity funds. Mr. Lynch is Vice Chairman and a Director of FMR and FMR Co., Inc. In addition, Mr. Lynch serves as a Trustee of Boston College and as the Chairman of the Inner-City Scholarship Fund. Previously, Mr. Lynch served on the Special Olympics International Board of Directors (1997-2006). |
Elizabeth Paige Baumann (1968) |
Year of Election or Appointment: 2012 Anti-Money Laundering (AML) Officer |
| Ms. Baumann also serves as AML Officer of other funds. She is Chief AML Officer of FMR LLC (2012-present) and is an employee of Fidelity Investments. Previously, Ms. Baumann served as Vice President and Deputy Anti-Money Laundering Officer (2007-2012). |
William C. Coffey (1969) |
Year of Election or Appointment: 2009 Assistant Secretary |
| Mr. Coffey also serves as Assistant Secretary of other funds. He is Senior Vice President and Deputy General Counsel of FMR LLC (2010-present), and is an employee of Fidelity Investments. Previously, Mr. Coffey served as Vice President and Associate General Counsel of FMR LLC (2005-2009). |
Jonathan Davis (1968) |
Year of Election or Appointment: 2010 Assistant Treasurer |
| Mr. Davis also serves as Assistant Treasurer of other funds. Mr. Davis is an employee of Fidelity Investments. Previously, Mr. Davis served as Vice President and Associate General Counsel of FMR LLC (2003-2010). |
Adrien E. Deberghes (1967) |
Year of Election or Appointment: 2008 Deputy Treasurer |
| Mr. Deberghes also serves as an officer of other funds. He is an employee of Fidelity Investments (2008-present). Prior to joining Fidelity Investments, Mr. Deberghes was Senior Vice President of Mutual Fund Administration at State Street Corporation (2007-2008), Senior Director of Mutual Fund Administration at Investors Bank & Trust (2005-2007), and Director of Finance for Dunkin' Brands (2000-2005). |
Stephanie J. Dorsey (1969) |
Year of Election or Appointment: 2010 Assistant Treasurer |
| Ms. Dorsey also serves as an officer of other funds. She is an employee of Fidelity Investments (2008-present) and has served in other fund officer roles. Prior to joining Fidelity Investments, Ms. Dorsey served as Treasurer (2004-2008) of the JPMorgan Mutual Funds and Vice President (2004-2008) of JPMorgan Chase Bank. |
Howard J. Galligan III (1966) |
Year of Election or Appointment: 2014 Chief Financial Officer |
| Mr. Galligan also serves as Chief Financial Officer of other funds. Mr. Galligan serves as President of Fidelity Pricing and Cash Management Services (FPCMS) (2014-present) and as a Director of Strategic Advisers, Inc. (2008-present). Previously, Mr. Galligan served as Chief Administrative Officer of Asset Management (2011-2014) and Chief Operating Officer and Senior Vice President of Investment Support for Strategic Advisers, Inc. (2003-2011). |
Scott C. Goebel (1968) |
Year of Election or Appointment: 2008 Secretary and Chief Legal Officer (CLO) |
| Mr. Goebel serves as Secretary and CLO of other funds. Mr. Goebel also serves as Secretary of Fidelity SelectCo, LLC (2013-present), Fidelity Investments Money Management, Inc. (FIMM) (2010-present) and Fidelity Research and Analysis Company (FRAC) (2010-present); General Counsel, Secretary, and Senior Vice President of FMR (2008-present) and FMR Co., Inc. (2008-present); Chief Legal Officer of Fidelity Management & Research (Hong Kong) Limited (2008-present); and Assistant Secretary of Fidelity Management & Research (Japan) Inc. (2008-present) and Fidelity Management & Research (U.K.) Inc. (2008-present). Previously, Mr. Goebel served as Secretary and CLO of other Fidelity funds (2008-2013), Assistant Secretary of FIMM (2008-2010), FRAC (2008-2010), and certain funds (2007-2008); and as Vice President and Secretary of Fidelity Distributors Corporation (FDC) (2005-2007). Mr. Goebel has been employed by FMR LLC or an affiliate since 2001. |
Brian B. Hogan (1964) |
Year of Election or Appointment: 2009 Vice President |
| Mr. Hogan also serves as Trustee or Vice President of other funds. Mr. Hogan serves as President of FMR's Equity Division (2009-present). Previously, Mr. Hogan served as Senior Vice President, Equity Research of FMR (2006-2009) and as a portfolio manager. |
Chris Maher (1972) |
Year of Election or Appointment: 2013 Assistant Treasurer |
| Mr. Maher serves as Assistant Treasurer of other funds. Mr. Maher is Vice President of Valuation Oversight and is an employee of Fidelity Investments. Previously, Mr. Maher served as Vice President of Asset Management Compliance (2013), Vice President of FMR's Program Management Group (2010-2013), and Vice President of Valuation Oversight (2008-2010). |
Melissa M. Reilly (1971) |
Year of Election or Appointment: 2014 Vice President of certain Equity Funds |
| Ms. Reilly also serves as Vice President of other funds. Ms. Reilly is an employee of Fidelity Investments (2004-present). |
Kenneth B. Robins (1969) |
Year of Election or Appointment: 2008 President and Treasurer |
| Mr. Robins also serves as an officer of other funds. Mr. Robins serves as Executive Vice President of Fidelity Investments Money Management, Inc. (FIMM) (2013-present) and is an employee of Fidelity Investments (2004-present). Previously, Mr. Robins served in other fund officer roles. |
Stephen Sadoski (1971) |
Year of Election or Appointment: 2012 Deputy Treasurer |
| Mr. Sadoski also serves as Deputy Treasurer of other funds. He is an employee of Fidelity Investments (2012-present) and has served in another fund officer role. Prior to joining Fidelity Investments, Mr. Sadoski served as an assistant chief accountant in the Division of Investment Management of the Securities and Exchange Commission (SEC) (2009-2012) and as a senior manager at Deloitte & Touche LLP (1997-2009). |
Stacie M. Smith (1974) |
Year of Election or Appointment: 2013 Deputy Treasurer |
| Ms. Smith also serves as an officer of other funds. She is an employee of Fidelity Investments (2009-present) and has served in other fund officer roles. Prior to joining Fidelity Investments, Ms. Smith served as Senior Audit Manager of Ernst & Young LLP (1996-2009). |
Renee Stagnone (1975) |
Year of Election or Appointment: 2013 Deputy Treasurer |
| Ms. Stagnone also serves as Deputy Treasurer of other funds. Ms. Stagnone is an employee of Fidelity Investments. |
Linda J. Wondrack (1964) |
Year of Election or Appointment: 2014 Chief Compliance Officer |
| Ms. Wondrack also serves as Chief Compliance Officer of other funds. Ms. Wondrack is Executive Vice President and head of the Ethics Office and Asset Management Compliance for Fidelity Investments (2012-present). Ms. Wondrack also serves as Chief Compliance Officer of Fidelity SelectCo, LLC (2014-present); Chief Compliance Officer of Impresa Management LLC (2013-present); and Chief Compliance Officer of FMR Co., Inc., Fidelity Investments Money Management, Inc., Fidelity Management & Research (Japan) Inc., Fidelity Management & Research (U.K.) Inc., Fidelity Management & Research (Hong Kong), Fidelity Management & Research Company, Pyramis Global Advisors, LLC, and Strategic Advisers, Inc., Ballyrock Investment Advisors LLC, and Northern Neck Investors LLC (2012-present). Previously, Ms. Wondrack served as Senior Vice President and Chief Compliance Officer for Columbia Management Investment Advisers, LLC (2005-2012); Chief Compliance Officer for certain funds within the Columbia Family of Funds (2007-2012); and Senior Vice President of Compliance Risk Management at Bank of America (2005-2010). |
Joseph F. Zambello (1957) |
Year of Election or Appointment: 2011 Deputy Treasurer |
| Mr. Zambello also serves as Deputy Treasurer of other funds. Mr. Zambello is an employee of Fidelity Investments. Previously, Mr. Zambello served as Vice President of FMR's Program Management Group (2009-2011) and Vice President of the Transfer Agent Oversight Group (2005-2009). |
Annual Report
The Board of Trustees of Fidelity Series Growth & Income Fund voted to pay to shareholders of record at the opening of business on record date, the following distributions per share derived from capital gains realized from sales of portfolio securities:
| Pay Date | Record Date | Capital Gains |
Series Growth & Income | 08/11/14 | 08/08/14 | $0.194 |
| | | |
Class F | 08/11/14 | 08/08/14 | $0.194 |
The fund hereby designates as a capital gain dividend with respect to the taxable year ended June 30, 2014, $40,839,288, or, if subsequently determined to be different, the net capital gain of such year.
A total of 0.02% of the dividends distributed during the fiscal year was derived from interest on U.S. Government securities which is generally exempt from state income tax.
Series Growth & Income designates 60%, 49%, 30% and 100%; and Class F designates 60%, 47%, 29% and 100% of the dividends distributed in August, October, December and April, respectively during the fiscal year as qualifying for the dividends-received deduction for corporate shareholders.
Series Growth & Income designates 61%, 51%, 34% and 100%; and Class F designates 61%, 49%, 33% and 100% of the dividends distributed in August, October, December and April, respectively during the fiscal year as amounts which may be taken into account as a dividend for the purposes of the maximum rate under section 1(h)(11) of the Internal Revenue Code.
The fund will notify shareholders in January 2015 of amounts for use in preparing 2014 income tax returns.
Annual Report
Investment Adviser
Fidelity Management & Research Company
Boston, MA
Investment Sub-Advisers
FMR Co., Inc.
Fidelity Management & Research
(U.K.) Inc.
Fidelity Management & Research
(Hong Kong) Limited
Fidelity Management & Research
(Japan) Inc.
General Distributor
Fidelity Distributors Corporation
Smithfield, RI
Transfer and Service Agents
Fidelity Investments Institutional
Operations Company, Inc.
Boston, MA
Fidelity Service Company, Inc.
Boston, MA
Custodian
The Northern Trust Company
Chicago, IL
(Fidelity Investment logo)(registered trademark)
Corporate Headquarters
245 Summer St., Boston, MA 02210
www.fidelity.com
MHT-ANN-0814
1.951035.101
Item 2. Code of Ethics
As of the end of the period, June 30, 2014, Fidelity Hastings Street Trust (the trust) has adopted a code of ethics, as defined in Item 2 of Form N-CSR, that applies to its President and Treasurer and its Chief Financial Officer. A copy of the code of ethics is filed as an exhibit to this Form N-CSR.
Item 3. Audit Committee Financial Expert
The Board of Trustees of the trust has determined that Joseph Mauriello is an audit committee financial expert, as defined in Item 3 of Form N-CSR. Mr. Mauriello is independent for purposes of Item 3 of Form N-CSR.
Item 4. Principal Accountant Fees and Services
Fees and Services
The following table presents fees billed by PricewaterhouseCoopers LLP ("PwC") in each of the last two fiscal years for services rendered to Fidelity Advisor Series Growth & Income Fund, Fidelity Fifty, Fidelity Fund, Fidelity Growth Discovery Fund, Fidelity Mega Cap Stock Fund and Fidelity Series Growth & Income Fund (the "Funds"):
Services Billed by PwC
June 30, 2014 FeesA
| Audit Fees | Audit-Related Fees | Tax Fees | All Other Fees |
Fidelity Advisor Series Growth & Income Fund | $38,000 | $- | $3,600 | $1,900 |
Fidelity Fifty | $39,000 | $- | $4,000 | $1,800 |
Fidelity Fund | $66,000 | $- | $4,200 | $3,900 |
Fidelity Growth Discovery Fund | $43,000 | $- | $3,600 | $1,900 |
Fidelity Mega Cap Stock Fund | $48,000 | $- | $3,400 | $2,600 |
Fidelity Series Growth & Income Fund | $45,000 | $- | $3,400 | $3,600 |
June 30, 2013 FeesA,B
| Audit Fees | Audit-Related Fees | Tax Fees | All Other Fees |
Fidelity Advisor Series Growth & Income Fund | $26,000 | $- | $3,300 | $800 |
Fidelity Fifty | $39,000 | $- | $3,300 | $1,800 |
Fidelity Fund | $65,000 | $- | $3,300 | $3,700 |
Fidelity Growth Discovery Fund | $42,000 | $- | $3,300 | $1,900 |
Fidelity Mega Cap Stock Fund | $42,000 | $- | $3,300 | $2,300 |
Fidelity Series Growth & Income Fund | $29,000 | $- | $3,300 | $1,100 |
A Amounts may reflect rounding.
B The Fidelity Advisor Series Growth & Income Fund and Fidelity Series Growth & Income Fund commenced operations on December 6, 2012.
The following table presents fees billed by PwC that were required to be approved by the Audit Committee for services that relate directly to the operations and financial reporting of the Funds and that are rendered on behalf of Fidelity Management & Research Company ("FMR") and entities controlling, controlled by, or under common control with FMR (not including any sub-adviser whose role is primarily portfolio management and is subcontracted with or overseen by another investment adviser) that provide ongoing services to the Funds ("Fund Service Providers"):
Services Billed by PwC
| June 30, 2014A | June 30, 2013A,B |
Audit-Related Fees | $6,795,000 | $3,665,000 |
Tax Fees | $- | $- |
All Other Fees | $50,000 | $- |
A Amounts may reflect rounding.
B May include amounts billed prior to the Fidelity Advisor Series Growth & Income Fund and Fidelity Series Growth & Income Fund's commencement of operations.
"Audit-Related Fees" represent fees billed for assurance and related services that are reasonably related to the performance of the fund audit or the review of the fund's financial statements and that are not reported under Audit Fees.
"Tax Fees" represent fees billed for tax compliance, tax advice or tax planning that relate directly to the operations and financial reporting of the fund.
"All Other Fees" represent fees billed for services provided to the fund or Fund Service Provider, a significant portion of which are assurance related, that relate directly to the operations and financial reporting of the fund, excluding those services that are reported under Audit Fees, Audit-Related Fees or Tax Fees.
Assurance services must be performed by an independent public accountant.
* * *
The aggregate non-audit fees billed by PwC for services rendered to the Funds, FMR (not including any sub-adviser whose role is primarily portfolio management and is subcontracted with or overseen by another investment adviser), and any Fund Service Provider for each of the last two fiscal years of the Funds are as follows:
Billed By | June 30, 2014 A | June 30, 2013 A,B |
PwC | $8,285,000 | $4,255,000 |
A Amounts may reflect rounding.
B May include amounts billed prior to the Fidelity Advisor Series Growth & Income Fund and Fidelity Series Growth & Income Fund's commencement of operations.
The trust's Audit Committee has considered non-audit services that were not pre-approved that were provided by PwC to Fund Service Providers to be compatible with maintaining the independence of PwC in its audit of the Funds, taking into account representations from PwC, in accordance with Public Company Accounting Oversight Board rules, regarding its independence from the Funds and their related entities and FMR's review of the appropriateness and permissibility under applicable law of such non-audit services prior to their provision to the Fund Service Providers.
Audit Committee Pre-Approval Policies and Procedures
The trust's Audit Committee must pre-approve all audit and non-audit services provided by a fund's independent registered public accounting firm relating to the operations or financial reporting of the fund. Prior to the commencement of any audit or non-audit services to a fund, the Audit Committee reviews the services to determine whether they are appropriate and permissible under applicable law.
The Audit Committee has adopted policies and procedures to, among other purposes, provide a framework for the Committee's consideration of non-audit services by the audit firms that audit the Fidelity funds. The policies and procedures require that any non-audit service provided by a fund audit firm to a Fidelity fund and any non-audit service provided by a fund auditor to a Fund Service Provider that relates directly to the operations and financial reporting of a Fidelity fund ("Covered Service") are subject to approval by the Audit Committee before such service is provided.
All Covered Services must be approved in advance of provision of the service either: (i) by formal resolution of the Audit Committee, or (ii) by oral or written approval of the service by the Chair of the Audit Committee (or if the Chair is unavailable, such other member of the Audit Committee as may be designated by the Chair to act in the Chair's absence). The approval contemplated by (ii) above is permitted where the Treasurer determines that action on such an engagement is necessary before the next meeting of the Audit Committee.
Non-audit services provided by a fund audit firm to a Fund Service Provider that do not relate directly to the operations and financial reporting of a Fidelity fund are reported to the Audit Committee on a periodic basis.
Non-Audit Services Approved Pursuant to Rule 2-01(c)(7)(i)(C) and (ii) of Regulation S-X ("De Minimis Exception")
There were no non-audit services approved or required to be approved by the Audit Committee pursuant to the De Minimis Exception during the Funds' last two fiscal years relating to services provided to (i) the Funds or (ii) any Fund Service Provider that relate directly to the operations and financial reporting of the Funds.
Item 5. Audit Committee of Listed Registrants
Not applicable.
Item 6. Investments
(a) Not applicable.
(b) Not applicable
Item 7. Disclosure of Proxy Voting Policies and Procedures for Closed-End Management Investment Companies
Not applicable.
Item 8. Portfolio Managers of Closed-End Management Investment Companies
Not applicable.
Item 9. Purchase of Equity Securities by Closed-End Management Investment Company and Affiliated Purchasers
Not applicable.
Item 10. Submission of Matters to a Vote of Security Holders
There were no material changes to the procedures by which shareholders may recommend nominees to the trust's Board of Trustees.
Item 11. Controls and Procedures
(a)(i) The President and Treasurer and the Chief Financial Officer have concluded that the trust's disclosure controls and procedures (as defined in Rule 30a-3(c) under the Investment Company Act) provide reasonable assurances that material information relating to the trust is made known to them by the appropriate persons, based on their evaluation of these controls and procedures as of a date within 90 days of the filing date of this report.
(a)(ii) There was no change in the trust's internal control over financial reporting (as defined in Rule 30a-3(d) under the Investment Company Act) that occurred during the second fiscal quarter of the period covered by this report that has materially affected, or is reasonably likely to materially affect, the trust's internal control over financial reporting.
Item 12. Exhibits
(a) | (1) | Code of Ethics pursuant to Item 2 of Form N-CSR is filed and attached hereto as EX-99.CODE ETH. |
(a) | (2) | Certification pursuant to Rule 30a-2(a) under the Investment Company Act of 1940 (17 CFR 270.30a-2(a)) is filed and attached hereto as Exhibit 99.CERT. |
(a) | (3) | Not applicable. |
(b) | | Certification pursuant to Rule 30a-2(b) under the Investment Company Act of 1940 (17 CFR 270.30a-2(b)) is furnished and attached hereto as Exhibit 99.906CERT. |
SIGNATURES
Pursuant to the requirements of the Securities Exchange Act of 1934 and the Investment Company Act of 1940, the registrant has duly caused this report to be signed on its behalf by the undersigned, thereunto duly authorized.
Fidelity Hastings Street Trust
By: | /s/Kenneth B. Robins |
| Kenneth B. Robins |
| President and Treasurer |
| |
Date: | August 27, 2014 |
Pursuant to the requirements of the Securities Exchange Act of 1934 and the Investment Company Act of 1940, this report has been signed below by the following persons on behalf of the registrant and in the capacities and on the dates indicated.
By: | /s/Kenneth B. Robins |
| Kenneth B. Robins |
| President and Treasurer |
| |
Date: | August 27, 2014 |
By: | /s/Howard J. Galligan III |
| Howard J. Galligan III |
| Chief Financial Officer |
| |
Date: | August 27, 2014 |