UNITED STATES
SECURITIES AND EXCHANGE COMMISSION
Washington, D.C. 20549
FORM N-CSR
CERTIFIED SHAREHOLDER REPORT OF REGISTERED
MANAGEMENT INVESTMENT COMPANIES
Investment Company Act file number 811-215
Fidelity Hastings Street Trust
(Exact name of registrant as specified in charter)
245 Summer St., Boston, Massachusetts 02210
(Address of principal executive offices) (Zip code)
Marc Bryant, Secretary
245 Summer St.
Boston, Massachusetts 02210
(Name and address of agent for service)
Registrant's telephone number, including area code:
617-563-7000
| |
Date of fiscal year end: | June 30 |
| |
Date of reporting period: | June 30, 2018 |
Item 1.
Reports to Stockholders
Fidelity® Series Growth & Income Fund (To be renamed Fidelity® Series Large Cap Stock Fund effective September 29, 2018)
Annual Report June 30, 2018 |
 |
Contents
To view a fund's proxy voting guidelines and proxy voting record for the 12-month period ended June 30, visit http://www.fidelity.com/proxyvotingresults or visit the Securities and Exchange Commission's (SEC) web site at http://www.sec.gov.
You may also call 1-800-544-8544 to request a free copy of the proxy voting guidelines.
Standard & Poor's, S&P and S&P 500 are registered service marks of The McGraw-Hill Companies, Inc. and have been licensed for use by Fidelity Distributors Corporation.
Other third-party marks appearing herein are the property of their respective owners.
All other marks appearing herein are registered or unregistered trademarks or service marks of FMR LLC or an affiliated company. © 2018 FMR LLC. All rights reserved.
This report and the financial statements contained herein are submitted for the general information of the shareholders of the Fund. This report is not authorized for distribution to prospective investors in the Fund unless preceded or accompanied by an effective prospectus.
A fund files its complete schedule of portfolio holdings with the SEC for the first and third quarters of each fiscal year on Form N-Q. Forms N-Q are available on the SEC’s web site at http://www.sec.gov. A fund's Forms N-Q may be reviewed and copied at the SEC’s Public Reference Room in Washington, DC. Information regarding the operation of the SEC's Public Reference Room may be obtained by calling 1-800-SEC-0330.
For a complete list of a fund's portfolio holdings, view the most recent holdings listing, semiannual report, or annual report on Fidelity's web site at http://www.fidelity.com, http://www.institutional.fidelity.com, or http://www.401k.com, as applicable.
NOT FDIC INSURED •MAY LOSE VALUE •NO BANK GUARANTEE
Neither the Fund nor Fidelity Distributors Corporation is a bank.
Performance: The Bottom Line
Average annual total return reflects the change in the value of an investment, assuming reinvestment of distributions from dividend income and capital gains (the profits earned upon the sale of securities that have grown in value, if any) and assuming a constant rate of performance each year. The hypothetical investment and the average annual total returns do not reflect the deduction of taxes that a shareholder would pay on fund distributions or the redemption of fund shares. During periods of reimbursement by Fidelity, a fund’s total return will be greater than it would be had the reimbursement not occurred. How a fund did yesterday is no guarantee of how it will do tomorrow.
Average Annual Total Returns
| For the periods ended June 30, 2018 | Past 1 year | Past 5 years | Life of fundA |
| Fidelity® Series Growth & Income | 11.35% | 11.10% | 12.78% |
A From December 6, 2012
Prior to August 1, 2013, the fund was named Fidelity® Series Mega Cap Fund, and the fund operated under certain different investment policies and compared its performance to a different additional index. The fund's historical performance may not represent its current investment policies.
$10,000 Over Life of Fund
Let's say hypothetically that $10,000 was invested in Fidelity® Series Growth & Income on December 6, 2012, when the fund started.
The chart shows how the value of your investment would have changed, and also shows how the S&P 500® Index performed over the same period.

| Period Ending Values |
| $19,535 | Fidelity® Series Growth & Income |
| $21,581 | S&P 500® Index |
Management's Discussion of Fund Performance
Market Recap: The U.S. equity bellwether S&P 500
® index gained 14.37% for the 12 months ending June 30, 2018, despite a resurgence in volatility that challenged the multiyear bull market. The steady growth seen throughout 2017 extended into the new year, as investors remained upbeat on hopes of continued strong economic and earnings growth. Stocks surged 5.73% in January alone. February was a decidedly different story, though, as volatility spiked amid fear that rising inflation and the potential for the economy to overheat would prompt the U.S. Federal Reserve to pick up the pace of interest rate hikes. The index returned -3.69% for the month, its first negative result since October 2016, and lost further ground in March on fear of a global trade war. The market stabilized in April and went on to achieve a solid gain for May. The uptrend continued through roughly mid-June, when escalating trade tension between the U.S. and China soured investor sentiment, and the index ended the 12 months with a two-week slump. By sector, information technology (+31%) led the way, rising on strong earnings growth from several major index constituents. Consumer discretionary (+24%) also stood out, largely driven by retailers (+50%). Energy gained 21% alongside higher oil prices. Notable laggards included some defensive groups – consumer staples (-4%), telecommunication services (+1%) and utilities (+3%) – that struggled amid rising interest rates and a general preference for risk.
Comments from Portfolio Manager Matthew Fruhan: For the fiscal year, the fund gained 11.35%, trailing the benchmark S&P 500
® index. The fund's underperformance of the benchmark was primarily due to weak security selection, especially in the health care, consumer discretionary and industrials sectors. The fund also was hurt by a significant underweight in the top-performing information technology and consumer discretionary sectors. Within the latter, lacking exposure to two large benchmark components, online retail giant Amazon.com and video-streaming service provider Netflix – neither of which we saw as attractively valued – stood out as significant relative detractors. It also hurt to overweight cable and media giant Comcast, one of our largest positions. In industrials, overweighting General Electric detracted, while in health care, our biggest individual detractor was a non-benchmark stake in drug manufacturer Teva Pharmaceutical Industries. In contrast, an overweight in the energy sector, which outperformed, was beneficial, while security selection in financials also notably contributed, even as an overweighting in the group was a partly offsetting negative. Within energy, top individual contributors were energy producer ConocoPhillips and Suncor Energy, the latter a non-benchmark holding. Timely positioning in lagging energy giant Exxon Mobil also helped. Suncor and Exxon Mobil were among the fund's largest positions on June 30. Lastly, not owning poor-performing tobacco manufacturer and benchmark component Philip Morris International provided a meaningful lift.
The views expressed above reflect those of the portfolio manager(s) only through the end of the period as stated on the cover of this report and do not necessarily represent the views of Fidelity or any other person in the Fidelity organization. Any such views are subject to change at any time based upon market or other conditions and Fidelity disclaims any responsibility to update such views. These views may not be relied on as investment advice and, because investment decisions for a Fidelity fund are based on numerous factors, may not be relied on as an indication of trading intent on behalf of any Fidelity fund.
Investment Summary (Unaudited)
Top Ten Stocks as of June 30, 2018
| | % of fund's net assets |
| Microsoft Corp. | 4.0 |
| Bank of America Corp. | 3.2 |
| Exxon Mobil Corp. | 3.0 |
| Apple, Inc. | 2.6 |
| Comcast Corp. Class A | 2.6 |
| JPMorgan Chase & Co. | 2.5 |
| Citigroup, Inc. | 2.5 |
| Chevron Corp. | 2.3 |
| Wells Fargo & Co. | 2.2 |
| Suncor Energy, Inc. | 2.2 |
| | 27.1 |
Top Five Market Sectors as of June 30, 2018
| | % of fund's net assets |
| Financials | 20.2 |
| Information Technology | 16.1 |
| Energy | 14.8 |
| Health Care | 13.7 |
| Industrials | 11.5 |
Asset Allocation (% of fund's net assets)
| As of June 30, 2018 *,** |
| | Stocks | 98.0% |
| | Convertible Securities | 0.4% |
| | Other Investments | 0.1% |
| | Short-Term Investments and Net Other Assets (Liabilities) | 1.5% |

* Foreign investments - 14.0%
** Written options - 0.0%
Percentages shown as 0.0% may reflect amounts less than 0.05%.
Schedule of Investments June 30, 2018
Showing Percentage of Net Assets
| Common Stocks - 98.0% | | | |
| | | Shares | Value |
| CONSUMER DISCRETIONARY - 8.3% | | | |
| Hotels, Restaurants & Leisure - 0.7% | | | |
| Cedar Fair LP (depositary unit) | | 95,200 | $5,998,552 |
| Dine Brands Global, Inc. | | 280,727 | 20,998,380 |
| Dunkin' Brands Group, Inc. | | 798,000 | 55,117,860 |
| Papa John's International, Inc. (a) | | 166,900 | 8,465,168 |
| Starbucks Corp. | | 26,900 | 1,314,065 |
| | | | 91,894,025 |
| Media - 4.6% | | | |
| Comcast Corp. Class A | | 10,180,000 | 334,005,800 |
| Interpublic Group of Companies, Inc. | | 3,149,800 | 73,831,312 |
| Omnicom Group, Inc. | | 349,800 | 26,679,246 |
| The Walt Disney Co. | | 1,496,100 | 156,806,241 |
| Viacom, Inc. Class B (non-vtg.) | | 332,200 | 10,019,152 |
| | | | 601,341,751 |
| Multiline Retail - 0.3% | | | |
| Target Corp. | | 515,575 | 39,245,569 |
| Specialty Retail - 2.7% | | | |
| L Brands, Inc. | | 1,401,400 | 51,683,632 |
| Lowe's Companies, Inc. | | 1,563,200 | 149,395,024 |
| Ross Stores, Inc. | | 567,300 | 48,078,675 |
| TJX Companies, Inc. (b) | | 1,050,600 | 99,996,108 |
| | | | 349,153,439 |
|
| TOTAL CONSUMER DISCRETIONARY | | | 1,081,634,784 |
|
| CONSUMER STAPLES - 7.4% | | | |
| Beverages - 1.3% | | | |
| The Coca-Cola Co. | | 3,781,918 | 165,874,923 |
| Food & Staples Retailing - 1.2% | | | |
| Walmart, Inc. | | 1,859,200 | 159,240,480 |
| Food Products - 0.4% | | | |
| Campbell Soup Co. (a) | | 370,400 | 15,016,016 |
| The Hershey Co. | | 368,700 | 34,311,222 |
| | | | 49,327,238 |
| Household Products - 1.7% | | | |
| Kimberly-Clark Corp. | | 378,800 | 39,902,792 |
| Procter & Gamble Co. | | 1,978,100 | 154,410,486 |
| Reckitt Benckiser Group PLC | | 291,811 | 23,976,602 |
| Spectrum Brands Holdings, Inc. | | 105,000 | 8,570,100 |
| | | | 226,859,980 |
| Tobacco - 2.8% | | | |
| Altria Group, Inc. | | 4,383,600 | 248,944,644 |
| British American Tobacco PLC sponsored ADR | | 2,416,000 | 121,887,200 |
| | | | 370,831,844 |
|
| TOTAL CONSUMER STAPLES | | | 972,134,465 |
|
| ENERGY - 14.7% | | | |
| Energy Equipment & Services - 1.2% | | | |
| Baker Hughes, a GE Co. Class A | | 2,082,900 | 68,798,187 |
| Nabors Industries Ltd. | | 1,358,400 | 8,707,344 |
| National Oilwell Varco, Inc. | | 987,500 | 42,857,500 |
| Oceaneering International, Inc. | | 1,326,930 | 33,783,638 |
| | | | 154,146,669 |
| Oil, Gas & Consumable Fuels - 13.5% | | | |
| Anadarko Petroleum Corp. | | 390,100 | 28,574,825 |
| BP PLC sponsored ADR | | 2,863,754 | 130,759,008 |
| Cabot Oil & Gas Corp. | | 2,156,800 | 51,331,840 |
| Cenovus Energy, Inc. | | 15,898,940 | 165,078,562 |
| Cenovus Energy, Inc. | | 67,300 | 698,574 |
| Chevron Corp. | | 2,329,935 | 294,573,682 |
| ConocoPhillips Co. | | 1,244,380 | 86,633,736 |
| Enterprise Products Partners LP | | 730,200 | 20,204,634 |
| Equinor ASA sponsored ADR | | 1,747,800 | 46,159,398 |
| Exxon Mobil Corp. | | 4,803,000 | 397,352,190 |
| Golar LNG Ltd. | | 1,106,668 | 32,602,439 |
| Imperial Oil Ltd. | | 1,700,100 | 56,512,661 |
| Legacy Reserves LP (c) | | 1,926,800 | 13,294,920 |
| Suncor Energy, Inc. | | 6,991,810 | 284,533,401 |
| Teekay LNG Partners LP | | 692,700 | 11,671,995 |
| The Williams Companies, Inc. | | 2,913,757 | 78,991,952 |
| Williams Partners LP | | 1,487,291 | 60,369,142 |
| | | | 1,759,342,959 |
|
| TOTAL ENERGY | | | 1,913,489,628 |
|
| FINANCIALS - 20.2% | | | |
| Banks - 13.4% | | | |
| Bank of America Corp. | | 14,629,905 | 412,417,022 |
| BNP Paribas SA | | 65,200 | 4,049,916 |
| Citigroup, Inc. | | 4,804,378 | 321,508,976 |
| Cullen/Frost Bankers, Inc. | | 18,300 | 1,980,792 |
| First Hawaiian, Inc. | | 341,900 | 9,921,938 |
| JPMorgan Chase & Co. | | 3,195,149 | 332,934,526 |
| M&T Bank Corp. | | 6,990 | 1,189,349 |
| PNC Financial Services Group, Inc. | | 778,824 | 105,219,122 |
| SunTrust Banks, Inc. | | 2,248,740 | 148,461,815 |
| U.S. Bancorp | | 2,361,739 | 118,134,185 |
| Wells Fargo & Co. | | 5,158,999 | 286,014,905 |
| | | | 1,741,832,546 |
| Capital Markets - 5.7% | | | |
| Apollo Global Management LLC Class A (b) | | 870,000 | 27,726,900 |
| Charles Schwab Corp. (b) | | 1,268,981 | 64,844,929 |
| KKR & Co. LP | | 3,803,711 | 94,522,218 |
| Morgan Stanley | | 1,804,100 | 85,514,340 |
| Northern Trust Corp. | | 1,628,651 | 167,571,901 |
| Oaktree Capital Group LLC Class A | | 658,800 | 26,780,220 |
| S&P Global, Inc.(b) | | 289,500 | 59,026,155 |
| State Street Corp. | | 2,392,901 | 222,755,154 |
| | | | 748,741,817 |
| Insurance - 0.9% | | | |
| Chubb Ltd. | | 106,000 | 13,464,120 |
| Marsh & McLennan Companies, Inc. | | 516,607 | 42,346,276 |
| MetLife, Inc. | | 1,271,900 | 55,454,840 |
| The Travelers Companies, Inc. | | 53,700 | 6,569,658 |
| | | | 117,834,894 |
| Thrifts & Mortgage Finance - 0.2% | | | |
| Radian Group, Inc. | | 1,668,664 | 27,065,730 |
|
| TOTAL FINANCIALS | | | 2,635,474,987 |
|
| HEALTH CARE - 13.4% | | | |
| Biotechnology - 2.0% | | | |
| Alexion Pharmaceuticals, Inc. (c) | | 701,700 | 87,116,055 |
| Amgen, Inc. | | 778,931 | 143,782,873 |
| Biogen, Inc. (c) | | 24,900 | 7,226,976 |
| Intercept Pharmaceuticals, Inc. (c) | | 272,806 | 22,891,151 |
| | | | 261,017,055 |
| Health Care Equipment & Supplies - 0.9% | | | |
| Becton, Dickinson & Co. | | 31,900 | 7,641,964 |
| Boston Scientific Corp. (c) | | 654,300 | 21,395,610 |
| Danaher Corp. | | 477,400 | 47,109,832 |
| Fisher & Paykel Healthcare Corp. | | 649,835 | 6,553,584 |
| ResMed, Inc. | | 119,900 | 12,419,242 |
| Steris PLC | | 102,200 | 10,732,022 |
| Zimmer Biomet Holdings, Inc. | | 99,700 | 11,110,568 |
| | | | 116,962,822 |
| Health Care Providers & Services - 5.6% | | | |
| AmerisourceBergen Corp. | | 927,900 | 79,122,033 |
| Anthem, Inc. | | 331,900 | 79,002,157 |
| Cardinal Health, Inc. | | 1,657,500 | 80,935,725 |
| Cigna Corp. | | 387,500 | 65,855,625 |
| CVS Health Corp. | | 3,046,520 | 196,043,562 |
| Fresenius Medical Care AG & Co. KGaA sponsored ADR | | 327,900 | 16,509,765 |
| Humana, Inc. | | 107,200 | 31,905,936 |
| McKesson Corp. | | 646,947 | 86,302,730 |
| Patterson Companies, Inc. (a) | | 1,486,438 | 33,697,549 |
| UnitedHealth Group, Inc. | | 241,400 | 59,225,076 |
| | | | 728,600,158 |
| Pharmaceuticals - 4.9% | | | |
| Allergan PLC | | 161,800 | 26,975,296 |
| AstraZeneca PLC sponsored ADR | | 1,371,500 | 48,153,365 |
| Bayer AG | | 728,808 | 80,040,324 |
| GlaxoSmithKline PLC sponsored ADR | | 5,244,900 | 211,421,919 |
| Johnson & Johnson | | 1,400,070 | 169,884,494 |
| Novartis AG sponsored ADR | | 65,630 | 4,957,690 |
| Perrigo Co. PLC | | 94,800 | 6,911,868 |
| Sanofi SA | | 500,133 | 40,140,437 |
| Teva Pharmaceutical Industries Ltd. sponsored ADR | | 2,294,984 | 55,814,011 |
| | | | 644,299,404 |
|
| TOTAL HEALTH CARE | | | 1,750,879,439 |
|
| INDUSTRIALS - 11.4% | | | |
| Aerospace & Defense - 2.2% | | | |
| General Dynamics Corp. | | 285,400 | 53,201,414 |
| Meggitt PLC | | 382,490 | 2,490,135 |
| Rolls-Royce Holdings PLC | | 2,310,900 | 30,099,657 |
| United Technologies Corp. | | 1,593,700 | 199,260,311 |
| | | | 285,051,517 |
| Air Freight & Logistics - 1.6% | | | |
| C.H. Robinson Worldwide, Inc. | | 471,400 | 39,437,324 |
| Expeditors International of Washington, Inc. | | 145,900 | 10,665,290 |
| United Parcel Service, Inc. Class B | | 1,491,845 | 158,478,694 |
| | | | 208,581,308 |
| Commercial Services & Supplies - 0.2% | | | |
| Healthcare Services Group, Inc. | | 453,800 | 19,599,622 |
| Ritchie Brothers Auctioneers, Inc. | | 195,400 | 6,664,691 |
| | | | 26,264,313 |
| Electrical Equipment - 0.7% | | | |
| Acuity Brands, Inc. | | 407,400 | 47,205,438 |
| Hubbell, Inc. Class B | | 350,403 | 37,051,613 |
| Rockwell Automation, Inc. | | 39,500 | 6,566,085 |
| | | | 90,823,136 |
| Industrial Conglomerates - 1.8% | | | |
| 3M Co. | | 13,100 | 2,577,032 |
| General Electric Co. | | 16,858,256 | 229,440,864 |
| | | | 232,017,896 |
| Machinery - 1.1% | | | |
| Donaldson Co., Inc. | | 287,600 | 12,976,512 |
| Flowserve Corp. | | 1,704,300 | 68,853,720 |
| PACCAR, Inc. | | 37,300 | 2,311,108 |
| Snap-On, Inc. | | 107,200 | 17,229,184 |
| Wabtec Corp. | | 464,400 | 45,780,552 |
| | | | 147,151,076 |
| Professional Services - 0.3% | | | |
| Nielsen Holdings PLC | | 1,103,200 | 34,121,976 |
| Road & Rail - 2.5% | | | |
| CSX Corp. (b) | | 838,408 | 53,473,662 |
| J.B. Hunt Transport Services, Inc. (b) | | 668,993 | 81,316,099 |
| Norfolk Southern Corp. | | 442,434 | 66,750,018 |
| Union Pacific Corp. | | 906,600 | 128,447,088 |
| | | | 329,986,867 |
| Trading Companies & Distributors - 1.0% | | | |
| Bunzl PLC | | 281,500 | 8,526,146 |
| Fastenal Co. | | 858,600 | 41,324,418 |
| Howden Joinery Group PLC | | 394,000 | 2,788,141 |
| MSC Industrial Direct Co., Inc. Class A | | 194,000 | 16,460,900 |
| Watsco, Inc. | | 332,709 | 59,315,361 |
| | | | 128,414,966 |
|
| TOTAL INDUSTRIALS | | | 1,482,413,055 |
|
| INFORMATION TECHNOLOGY - 16.1% | | | |
| Communications Equipment - 1.3% | | | |
| Cisco Systems, Inc. | | 3,906,533 | 168,098,115 |
| Electronic Equipment & Components - 0.1% | | | |
| Avnet, Inc. | | 224,000 | 9,607,360 |
| Philips Lighting NV (a)(d) | | 252,900 | 6,571,240 |
| | | | 16,178,600 |
| Internet Software & Services - 1.2% | | | |
| Alphabet, Inc.: | | | |
| Class A (c) | | 70,209 | 79,279,301 |
| Class C (c) | | 64,965 | 72,478,202 |
| LogMeIn, Inc. | | 43,900 | 4,532,675 |
| | | | 156,290,178 |
| IT Services - 3.3% | | | |
| Accenture PLC Class A | | 133,000 | 21,757,470 |
| IBM Corp. | | 164,900 | 23,036,530 |
| MasterCard, Inc. Class A (b) | | 225,700 | 44,354,564 |
| Paychex, Inc. | | 1,980,241 | 135,349,472 |
| Unisys Corp. (a)(c) | | 1,836,917 | 23,696,229 |
| Visa, Inc. Class A | | 1,443,700 | 191,218,065 |
| | | | 439,412,330 |
| Semiconductors & Semiconductor Equipment - 1.7% | | | |
| Analog Devices, Inc. | | 125,700 | 12,057,144 |
| Qualcomm, Inc. | | 3,731,000 | 209,383,720 |
| United Microelectronics Corp. sponsored ADR | | 1,967,400 | 5,548,068 |
| | | | 226,988,932 |
| Software - 5.9% | | | |
| Micro Focus International PLC | | 1,784,883 | 30,970,085 |
| Microsoft Corp. | | 5,253,317 | 518,029,588 |
| Oracle Corp. | | 3,254,869 | 143,409,528 |
| SAP SE sponsored ADR (a) | | 637,300 | 73,710,118 |
| | | | 766,119,319 |
| Technology Hardware, Storage & Peripherals - 2.6% | | | |
| Apple, Inc. | | 1,810,960 | 335,226,806 |
|
| TOTAL INFORMATION TECHNOLOGY | | | 2,108,314,280 |
|
| MATERIALS - 1.9% | | | |
| Chemicals - 1.6% | | | |
| CF Industries Holdings, Inc. | | 827,000 | 36,718,800 |
| LyondellBasell Industries NV Class A | | 694,000 | 76,235,900 |
| Nutrien Ltd. | | 1,399,040 | 76,111,011 |
| The Scotts Miracle-Gro Co. Class A | | 264,700 | 22,012,452 |
| | | | 211,078,163 |
| Metals & Mining - 0.3% | | | |
| BHP Billiton Ltd. sponsored ADR (a) | | 778,800 | 38,947,788 |
|
| TOTAL MATERIALS | | | 250,025,951 |
|
| REAL ESTATE - 1.6% | | | |
| Equity Real Estate Investment Trusts (REITs) - 1.6% | | | |
| American Tower Corp. | | 302,300 | 43,582,591 |
| CoreSite Realty Corp. | | 308,600 | 34,199,052 |
| Equinix, Inc. | | 123,000 | 52,876,470 |
| Omega Healthcare Investors, Inc. | | 260,300 | 8,069,300 |
| Public Storage | | 168,800 | 38,293,968 |
| Sabra Health Care REIT, Inc. | | 471,200 | 10,239,176 |
| Spirit MTA REIT (c) | | 177,380 | 1,827,014 |
| Spirit Realty Capital, Inc. | | 1,773,800 | 14,243,614 |
| | | | 203,331,185 |
| TELECOMMUNICATION SERVICES - 1.5% | | | |
| Diversified Telecommunication Services - 1.5% | | | |
| AT&T, Inc. | | 521,597 | 16,748,480 |
| Verizon Communications, Inc. | | 3,555,923 | 178,898,486 |
| | | | 195,646,966 |
| UTILITIES - 1.5% | | | |
| Electric Utilities - 1.3% | | | |
| Exelon Corp. | | 2,837,400 | 120,873,240 |
| PPL Corp. | | 1,332,900 | 38,054,295 |
| Southern Co. | | 297,700 | 13,786,487 |
| | | | 172,714,022 |
| Independent Power and Renewable Electricity Producers - 0.1% | | | |
| The AES Corp. | | 1,125,900 | 15,098,319 |
| Multi-Utilities - 0.1% | | | |
| Sempra Energy | | 122,700 | 14,246,697 |
|
| TOTAL UTILITIES | | | 202,059,038 |
|
| TOTAL COMMON STOCKS | | | |
| (Cost $10,596,158,450) | | | 12,795,403,778 |
|
| Preferred Stocks - 0.3% | | | |
| Convertible Preferred Stocks - 0.3% | | | |
| HEALTH CARE - 0.2% | | | |
| Health Care Equipment & Supplies - 0.2% | | | |
| Becton, Dickinson & Co. Series A, 6.125% | | 350,100 | 21,624,802 |
| INDUSTRIALS - 0.1% | | | |
| Commercial Services & Supplies - 0.1% | | | |
| Stericycle, Inc. 2.25% | | 202,999 | 9,927,828 |
| UTILITIES - 0.0% | | | |
| Electric Utilities - 0.0% | | | |
| Vistra Energy Corp. 7.00% | | 85,300 | 8,048,055 |
|
| TOTAL CONVERTIBLE PREFERRED STOCKS | | | 39,600,685 |
|
| Nonconvertible Preferred Stocks - 0.0% | | | |
| INDUSTRIALS - 0.0% | | | |
| Aerospace & Defense - 0.0% | | | |
| Rolls-Royce Holdings PLC (C Shares) | | 638,661,800 | 842,874 |
| TOTAL PREFERRED STOCKS | | | |
| (Cost $41,357,661) | | | 40,443,559 |
| | | Principal Amount | Value |
|
| Convertible Bonds - 0.1% | | | |
| HEALTH CARE - 0.1% | | | |
| Pharmaceuticals - 0.1% | | | |
| Bayer Capital Corp. BV 5.625% 11/22/19 (d) | EUR | | |
| (Cost $11,711,431) | | 10,600,000 | 13,208,794 |
| | | Shares | Value |
|
| Other - 0.1% | | | |
| ENERGY - 0.1% | | | |
| Oil, Gas & Consumable Fuels - 0.1% | | | |
| Utica Shale Drilling Program (non-operating revenue interest) (e)(f)(g) | | | |
| (Cost $25,755,177) | | 25,755,177 | 13,779,020 |
|
| Money Market Funds - 3.6% | | | |
| Fidelity Cash Central Fund, 1.93% (h) | | 387,410,128 | 387,487,610 |
| Fidelity Securities Lending Cash Central Fund 1.92% (h)(i) | | 87,847,241 | 87,864,811 |
| TOTAL MONEY MARKET FUNDS | | | |
| (Cost $475,344,400) | | | 475,352,421 |
| TOTAL INVESTMENT IN SECURITIES - 102.1% | | | |
| (Cost $11,150,327,119) | | | 13,338,187,572 |
| NET OTHER ASSETS (LIABILITIES) - (2.1)% | | | (278,382,459) |
| NET ASSETS - 100% | | | $13,059,805,113 |
| Written Options | | | | | | |
| | Counterparty | Number of Contracts | Notional Amount | Exercise Price | Expiration Date | Value |
| Call Options | | | | | | |
| Apollo Global Management, LLC Class A | Chicago Board Options Exchange | 2,146 | $6,839,302 | $34.00 | 7/20/18 | $(16,095) |
| Charles Schwab Corp. | Chicago Board Options Exchange | 2,505 | 12,800,550 | 60.00 | 9/21/18 | (68,888) |
| CSX Corp. | Chicago Board Options Exchange | 8,363 | 53,339,214 | 70.00 | 8/17/18 | (384,698) |
| J.B. Hunt Transport Services, Inc. | Chicago Board Options Exchange | 1,332 | 16,190,460 | 135.00 | 7/20/18 | (29,970) |
| MasterCard, Inc. Class A | Chicago Board Options Exchange | 559 | 10,985,468 | 200.00 | 7/20/18 | (128,850) |
| Paychex, Inc. | Bank of America NA | 3,886 | 26,560,810 | 67.50 | 7/20/18 | (668,435) |
| S&P Global, Inc. | Bank of America NA | 1,391 | 28,361,099 | 210.00 | 8/17/18 | (480,881) |
| TJX Companies, Inc. | Chicago Board Options Exchange | 3,736 | 35,559,248 | 97.50 | 10/19/18 | (1,270,239) |
| TOTAL WRITTEN OPTIONS | | | | | | $(3,048,056) |
Currency Abbreviations
EUR – European Monetary Unit
Legend
(a) Security or a portion of the security is on loan at period end.
(b) Security or a portion of the security is pledged as collateral for call options written. At period end, the value of securities pledged amounted to $137,097,297.
(c) Non-income producing
(d) Security exempt from registration under Rule 144A of the Securities Act of 1933. These securities may be resold in transactions exempt from registration, normally to qualified institutional buyers. At the end of the period, the value of these securities amounted to $19,780,034 or 0.2% of net assets.
(e) Investment is owned by a wholly-owned subsidiary (Subsidiary) that is treated as a corporation for U.S. tax purposes.
(f) Restricted securities - Investment in securities not registered under the Securities Act of 1933 (excluding 144A issues). At the end of the period, the value of restricted securities (excluding 144A issues) amounted to $13,779,020 or 0.1% of net assets.
(g) Level 3 security
(h) Affiliated fund that is generally available only to investment companies and other accounts managed by Fidelity Investments. The rate quoted is the annualized seven-day yield of the fund at period end. A complete unaudited listing of the fund's holdings as of its most recent quarter end is available upon request. In addition, each Fidelity Central Fund's financial statements are available on the SEC's website or upon request.
(i) Investment made with cash collateral received from securities on loan.
Additional information on each restricted holding is as follows:
| Security | Acquisition Date | Acquisition Cost |
| Utica Shale Drilling Program (non-operating revenue interest) | 10/5/16 - 9/1/17 | $25,755,177 |
Affiliated Central Funds
Information regarding fiscal year to date income earned by the Fund from investments in Fidelity Central Funds is as follows:
| Fund | Income earned |
| Fidelity Cash Central Fund | $2,807,887 |
| Fidelity Securities Lending Cash Central Fund | 584,068 |
| Total | $3,391,955 |
Amounts in the income column in the above table include any capital gain distributions from underlying funds, which are presented in the corresponding line-item in the Statement of Operations if applicable.
Investment Valuation
The following is a summary of the inputs used, as of June 30, 2018, involving the Fund's assets and liabilities carried at fair value. The inputs or methodology used for valuing securities may not be an indication of the risk associated with investing in those securities. For more information on valuation inputs, and their aggregation into the levels used below, please refer to the Investment Valuation section in the accompanying Notes to Financial Statements.
| | Valuation Inputs at Reporting Date: |
| Description | Total | Level 1 | Level 2 | Level 3 |
| Investments in Securities: | | | | |
| Equities: | | | | |
| Consumer Discretionary | $1,081,634,784 | $1,081,634,784 | $-- | $-- |
| Consumer Staples | 972,134,465 | 948,157,863 | 23,976,602 | -- |
| Energy | 1,913,489,628 | 1,913,489,628 | -- | -- |
| Financials | 2,635,474,987 | 2,635,474,987 | -- | -- |
| Health Care | 1,772,504,241 | 1,630,698,678 | 141,805,563 | -- |
| Industrials | 1,493,183,757 | 1,453,156,272 | 40,027,485 | -- |
| Information Technology | 2,108,314,280 | 2,077,344,195 | 30,970,085 | -- |
| Materials | 250,025,951 | 250,025,951 | -- | -- |
| Real Estate | 203,331,185 | 203,331,185 | -- | -- |
| Telecommunication Services | 195,646,966 | 195,646,966 | -- | -- |
| Utilities | 210,107,093 | 202,059,038 | 8,048,055 | -- |
| Corporate Bonds | 13,208,794 | -- | 13,208,794 | -- |
| Other | 13,779,020 | -- | -- | 13,779,020 |
| Money Market Funds | 475,352,421 | 475,352,421 | -- | -- |
| Total Investments in Securities: | $13,338,187,572 | $13,066,371,968 | $258,036,584 | $13,779,020 |
| Derivative Instruments: | | | | |
| Liabilities | | | | |
| Written Options | $(3,048,056) | $(1,898,740) | $(1,149,316) | $-- |
| Total Liabilities | $(3,048,056) | $(1,898,740) | $(1,149,316) | $-- |
| Total Derivative Instruments: | $(3,048,056) | $(1,898,740) | $(1,149,316) | $-- |
Value of Derivative Instruments
The following table is a summary of the Fund's value of derivative instruments by primary risk exposure as of June 30, 2018. For additional information on derivative instruments, please refer to the Derivative Instruments section in the accompanying Notes to Financial Statements.
| Primary Risk Exposure / Derivative Type | Value |
| | Asset | Liability |
| Equity Risk | | |
| Written Options(a) | $0 | $(3,048,056) |
| Total Equity Risk | 0 | (3,048,056) |
| Total Value of Derivatives | $0 | $(3,048,056) |
(a) Gross value is presented in the Statement of Assets and Liabilities in the written options, at value line-item.
Other Information
Distribution of investments by country or territory of incorporation, as a percentage of Total Net Assets, is as follows (Unaudited):
| United States of America | 86.0% |
| United Kingdom | 5.1% |
| Canada | 4.6% |
| Germany | 1.3% |
| Others (Individually Less Than 1%) | 3.0% |
| | 100.0% |
See accompanying notes which are an integral part of the financial statements.
Financial Statements
Statement of Assets and Liabilities
| | | June 30, 2018 |
| Assets | | |
Investment in securities, at value (including securities loaned of $86,062,779) — See accompanying schedule:
Unaffiliated issuers (cost $10,674,982,719) | $12,862,835,151 | |
| Fidelity Central Funds (cost $475,344,400) | 475,352,421 | |
| Total Investment in Securities (cost $11,150,327,119) | | $13,338,187,572 |
| Restricted cash | | 323,998 |
| Foreign currency held at value (cost $513,665) | | 513,665 |
| Receivable for investments sold | | 27,064,625 |
| Receivable for fund shares sold | | 10,928 |
| Dividends receivable | | 18,857,709 |
| Interest receivable | | 689,105 |
| Distributions receivable from Fidelity Central Funds | | 727,629 |
| Other receivables | | 170,328 |
| Total assets | | 13,386,545,559 |
| Liabilities | | |
| Payable for investments purchased | $58,594,084 | |
| Payable for fund shares redeemed | 177,167,057 | |
| Written options, at value (premium received $3,470,545) | 3,048,056 | |
| Other payables and accrued expenses | 72,314 | |
| Collateral on securities loaned | 87,858,935 | |
| Total liabilities | | 326,740,446 |
| Net Assets | | $13,059,805,113 |
| Net Assets consist of: | | |
| Paid in capital | | $10,201,229,246 |
| Undistributed net investment income | | 56,178,053 |
| Accumulated undistributed net realized gain (loss) on investments and foreign currency transactions | | 614,146,400 |
| Net unrealized appreciation (depreciation) on investments and assets and liabilities in foreign currencies | | 2,188,251,414 |
| Net Assets | | $13,059,805,113 |
| Series Growth and Income: | | |
| Net Asset Value, offering price and redemption price per share ($13,059,805,113 ÷ 828,600,186 shares) | | $15.76 |
See accompanying notes which are an integral part of the financial statements.
Statement of Operations
| | | Year ended June 30, 2018 |
| Investment Income | | |
| Dividends | | $317,612,479 |
| Interest | | 713,803 |
| Income from Fidelity Central Funds | | 3,391,955 |
| Total income | | 321,718,237 |
| Expenses | | |
| Custodian fees and expenses | $213,361 | |
| Independent trustees' fees and expenses | 54,011 | |
| Interest | 9,739 | |
| Miscellaneous | 35,953 | |
| Total expenses before reductions | 313,064 | |
| Expense reductions | (41,195) | |
| Total expenses after reductions | | 271,869 |
| Net investment income (loss) | | 321,446,368 |
| Realized and Unrealized Gain (Loss) | | |
| Net realized gain (loss) on: | | |
| Investment securities: | | |
| Unaffiliated issuers | 767,932,889 | |
| Fidelity Central Funds | 3,969 | |
| Foreign currency transactions | (41,367) | |
| Written options | 23,653,431 | |
| Total net realized gain (loss) | | 791,548,922 |
| Change in net unrealized appreciation (depreciation) on: | | |
| Investment securities: | | |
| Unaffiliated issuers | 300,502,084 | |
| Fidelity Central Funds | 7,820 | |
| Assets and liabilities in foreign currencies | (29,043) | |
| Written options | 3,626,177 | |
| Total change in net unrealized appreciation (depreciation) | | 304,107,038 |
| Net gain (loss) | | 1,095,655,960 |
| Net increase (decrease) in net assets resulting from operations | | $1,417,102,328 |
See accompanying notes which are an integral part of the financial statements.
Statement of Changes in Net Assets
| | Year ended June 30, 2018 | Year ended June 30, 2017 |
| Increase (Decrease) in Net Assets | | |
| Operations | | |
| Net investment income (loss) | $321,446,368 | $180,595,637 |
| Net realized gain (loss) | 791,548,922 | 344,658,166 |
| Change in net unrealized appreciation (depreciation) | 304,107,038 | 1,255,957,577 |
| Net increase (decrease) in net assets resulting from operations | 1,417,102,328 | 1,781,211,380 |
| Distributions to shareholders from net investment income | (288,670,134) | (133,641,340) |
| Distributions to shareholders from net realized gain | (448,205,547) | (12,492,488) |
| Total distributions | (736,875,681) | (146,133,828) |
| Share transactions - net increase (decrease) | (109,955,037) | 2,137,278,446 |
| Total increase (decrease) in net assets | 570,271,610 | 3,772,355,998 |
| Net Assets | | |
| Beginning of period | 12,489,533,503 | 8,717,177,505 |
| End of period | $13,059,805,113 | $12,489,533,503 |
| Other Information | | |
| Undistributed net investment income end of period | $56,178,053 | $39,964,790 |
See accompanying notes which are an integral part of the financial statements.
Financial Highlights
Fidelity Series Growth & Income Fund
| Years ended June 30, | 2018 | 2017 | 2016 | 2015 | 2014 |
| Selected Per–Share Data | | | | | |
| Net asset value, beginning of period | $15.00 | $12.57 | $13.67 | $13.58 | $11.53 |
| Income from Investment Operations | | | | | |
| Net investment income (loss)A | .38 | .26 | .24 | .25 | .24 |
| Net realized and unrealized gain (loss) | 1.26 | 2.38 | (.59) | .43 | 2.29 |
| Total from investment operations | 1.64 | 2.64 | (.35) | .68 | 2.53 |
| Distributions from net investment income | (.34) | (.19) | (.26) | (.24) | (.21) |
| Distributions from net realized gain | (.54) | (.02) | (.49) | (.36) | (.27) |
| Total distributions | (.88) | (.21) | (.75) | (.59)B | (.48) |
| Net asset value, end of period | $15.76 | $15.00 | $12.57 | $13.67 | $13.58 |
| Total ReturnC | 11.35% | 21.15% | (2.56)% | 5.21% | 22.40% |
| Ratios to Average Net AssetsD,E | | | | | |
| Expenses before reductions | - %F | .56% | .63% | .63% | .66% |
| Expenses net of fee waivers, if any | - %F | .56% | .63% | .63% | .66% |
| Expenses net of all reductions | - %F | .56% | .63% | .63% | .66% |
| Net investment income (loss) | 2.47% | 1.83% | 1.89% | 1.82% | 1.87% |
| Supplemental Data | | | | | |
| Net assets, end of period (000 omitted) | $13,059,805 | $4,904,453 | $3,411,837 | $3,849,841 | $3,910,455 |
| Portfolio turnover rateG | 44% | 54%H | 36% | 40% | 53%H |
A Calculated based on average shares outstanding during the period.
B Total distributions of $.59 per share is comprised of distributions from net investment income of $.235 and distributions from net realized gain of $.359 per share.
C Total returns would have been lower if certain expenses had not been reduced during the applicable periods shown.
D Fees and expenses of any underlying Fidelity Central Funds are not included in the Fund's expense ratio. The Fund indirectly bears its proportionate share of the expenses of any underlying Fidelity Central Funds.
E Expense ratios reflect operating expenses of the class. Expenses before reductions do not reflect amounts reimbursed by the investment adviser or reductions from brokerage service arrangements or reductions from other expense offset arrangements and do not represent the amount paid by the class during periods when reimbursements or reductions occur. Expenses net of fee waivers reflect expenses after reimbursement by the investment adviser but prior to reductions from brokerage service arrangements or other expense offset arrangements. Expenses net of all reductions represent the net expenses paid by the class.
F Amount represents less than .005%.
G Amount does not include the portfolio activity of any underlying Fidelity Central Funds.
H Portfolio turnover rate excludes securities received or delivered in-kind.
See accompanying notes which are an integral part of the financial statements.
Notes to Financial Statements
For the period ended June 30, 2018
1. Organization.
Fidelity Series Growth & Income Fund (the Fund) is a fund of Fidelity Hastings Street Trust (the Trust) and is authorized to issue an unlimited number of shares. Shares of the Fund are only available for purchase by mutual funds for which FMR or an affiliate serves as an investment manager. The Trust is registered under the Investment Company Act of 1940, as amended (the 1940 Act), as an open-end management investment company organized as a Massachusetts business trust. Effective August 28,2017, the Fund no longer offered Class F, and all outstanding shares of Class F were exchanged for shares of Series Growth & Income.
2. Investments in Fidelity Central Funds.
The Fund invests in Fidelity Central Funds, which are open-end investment companies generally available only to other investment companies and accounts managed by the investment adviser and its affiliates. The Fund's Schedule of Investments lists each of the Fidelity Central Funds held as of period end, if any, as an investment of the Fund, but does not include the underlying holdings of each Fidelity Central Fund. As an Investing Fund, the Fund indirectly bears its proportionate share of the expenses of the underlying Fidelity Central Funds.
The Money Market Central Funds seek preservation of capital and current income and are managed by Fidelity Investments Money Management, Inc. (FIMM), an affiliate of the investment adviser. Annualized expenses of the Money Market Central Funds as of their most recent shareholder report date are less than .005%.
A complete unaudited list of holdings for each Fidelity Central Fund is available upon request or at the Securities and Exchange Commission (the SEC) website at www.sec.gov. In addition, the financial statements of the Fidelity Central Funds, which are not covered by the Fund's Report of Independent Registered Public Accounting Firm, are available on the SEC website or upon request.
3. Significant Accounting Policies.
The Fund is an investment company and applies the accounting and reporting guidance of the Financial Accounting Standards Board (FASB) Accounting Standards Codification Topic 946 Financial Services – Investments Companies. The financial statements have been prepared in conformity with accounting principles generally accepted in the United States of America (GAAP), which require management to make certain estimates and assumptions at the date of the financial statements. Actual results could differ from those estimates. Subsequent events, if any, through the date that the financial statements were issued have been evaluated in the preparation of the financial statements. The following summarizes the significant accounting policies of the Fund:
Investment Valuation. Investments are valued as of 4:00 p.m. Eastern time on the last calendar day of the period. The Board of Trustees (the Board) has delegated the day to day responsibility for the valuation of the Fund's investments to the Fair Value Committee (the Committee) established by the Fund's investment adviser. In accordance with valuation policies and procedures approved by the Board, the Fund attempts to obtain prices from one or more third party pricing vendors or brokers to value its investments. When current market prices, quotations or currency exchange rates are not readily available or reliable, investments will be fair valued in good faith by the Committee, in accordance with procedures adopted by the Board. Factors used in determining fair value vary by investment type and may include market or investment specific events, changes in interest rates and credit quality. The frequency with which these procedures are used cannot be predicted and they may be utilized to a significant extent. The Committee oversees the Fund's valuation policies and procedures and reports to the Board on the Committee's activities and fair value determinations. The Board monitors the appropriateness of the procedures used in valuing the Fund's investments and ratifies the fair value determinations of the Committee.
The Fund categorizes the inputs to valuation techniques used to value its investments into a disclosure hierarchy consisting of three levels as shown below:
- Level 1 – quoted prices in active markets for identical investments
- Level 2 – other significant observable inputs (including quoted prices for similar investments, interest rates, prepayment speeds, etc.)
- Level 3 – unobservable inputs (including the Fund's own assumptions based on the best information available)
Valuation techniques used to value the Fund's investments by major category are as follows:
Equity securities, including restricted securities, for which market quotations are readily available, are valued at the last reported sale price or official closing price as reported by a third party pricing vendor on the primary market or exchange on which they are traded and are categorized as Level 1 in the hierarchy. In the event there were no sales during the day or closing prices are not available, securities are valued at the last quoted bid price or may be valued using the last available price and are generally categorized as Level 2 in the hierarchy. For foreign equity securities, when market or security specific events arise, comparisons to the valuation of American Depositary Receipts (ADRs), futures contracts, Exchange-Traded Funds (ETFs) and certain indexes as well as quoted prices for similar securities may be used and would be categorized as Level 2 in the hierarchy. Utilizing these techniques may result in transfers between Level 1 and Level 2. For equity securities, including restricted securities, where observable inputs are limited, assumptions about market activity and risk are used and these securities may be categorized as Level 3 in the hierarchy.
Debt securities, including restricted securities, are valued based on evaluated prices received from third party pricing vendors or from brokers who make markets in such securities. Corporate bonds are valued by pricing vendors who utilize matrix pricing which considers yield or price of bonds of comparable quality, coupon, maturity and type or by broker-supplied prices. When independent prices are unavailable or unreliable, debt securities may be valued utilizing pricing methodologies which consider similar factors that would be used by third party pricing vendors. Debt securities are generally categorized as Level 2 in the hierarchy but may be Level 3 depending on the circumstances.
Exchange-traded options are valued using the last sale price or, in the absence of a sale, the last offering price and are categorized as Level 1 in the hierarchy. Options traded over-the-counter are valued using vendor or broker-supplied valuations and are categorized as Level 2 in the hierarchy. Investments in open-end mutual funds, including the Fidelity Central Funds, are valued at their closing net asset value (NAV) each business day and are categorized as Level 1 in the hierarchy.
Changes in valuation techniques may result in transfers in or out of an assigned level within the disclosure hierarchy. The aggregate value of investments by input level as of June 30, 2018 is included at the end of the Fund's Schedule of Investments.
Foreign Currency. The Fund may use foreign currency contracts to facilitate transactions in foreign-denominated securities. Gains and losses from these transactions may arise from changes in the value of the foreign currency or if the counterparties do not perform under the contracts' terms.
Foreign-denominated assets, including investment securities, and liabilities are translated into U.S. dollars at the exchange rates at period end. Purchases and sales of investment securities, income and dividends received and expenses denominated in foreign currencies are translated into U.S. dollars at the exchange rate in effect on the transaction date.
The effects of exchange rate fluctuations on investments are included with the net realized and unrealized gain (loss) on investment securities. Other foreign currency transactions resulting in realized and unrealized gain (loss) are disclosed separately.
Investment Transactions and Income. For financial reporting purposes, the Fund's investment holdings and NAV include trades executed through the end of the last business day of the period. The NAV per share for processing shareholder transactions is calculated as of the close of business of the New York Stock Exchange (NYSE), normally 4:00 p.m. Eastern time and includes trades executed through the end of the prior business day. Gains and losses on securities sold are determined on the basis of identified cost and include proceeds received from litigation. Dividend income is recorded on the ex-dividend date, except for certain dividends from foreign securities where the ex-dividend date may have passed, which are recorded as soon as the Fund is informed of the ex-dividend date. Non-cash dividends included in dividend income, if any, are recorded at the fair market value of the securities received. Income and capital gain distributions from Fidelity Central Funds, if any, are recorded on the ex-dividend date. Certain distributions received by the Fund represent a return of capital or capital gain. The Fund determines the components of these distributions subsequent to the ex-dividend date, based upon receipt of tax filings or other correspondence relating to the underlying investment. These distributions are recorded as a reduction of cost of investments and/or as a realized gain. Interest income is accrued as earned and includes coupon interest and amortization of premium and accretion of discount on debt securities as applicable. Investment income is recorded net of foreign taxes withheld where recovery of such taxes is uncertain. Debt obligations may be placed on non-accrual status and related interest income may be reduced by ceasing current accruals and writing off interest receivables when the collection of all or a portion of interest has become doubtful based on consistently applied procedures. A debt obligation is removed from non-accrual status when the issuer resumes interest payments or when collectability of interest is reasonably assured.
Class Allocations and Expenses. Investment income, realized and unrealized capital gains and losses, common expenses of the Fund, and certain fund-level expense reductions, if any, are allocated daily on a pro-rata basis to each class based on the relative net assets of each class to the total net assets of the Fund. Each class differs with respect to fees incurred. Certain expense reductions may also differ by class. For the reporting period, the allocated portion of income and expenses to each class as a percent of its average net assets may vary due to the timing of recording these transactions in relation to fluctuating net assets of the classes. Expenses directly attributable to a fund are charged to that fund. Expenses attributable to more than one fund are allocated among the respective funds on the basis of relative net assets or other appropriate methods. Expense estimates are accrued in the period to which they relate and adjustments are made when actual amounts are known.
Income Tax Information and Distributions to Shareholders. Each year, the Fund intends to qualify as a regulated investment company under Subchapter M of the Internal Revenue Code, including distributing substantially all of its taxable income and realized gains. As a result, no provision for U.S. Federal income taxes is required. As of June 30, 2018, the Fund did not have any unrecognized tax benefits in the financial statements; nor is the Fund aware of any tax positions for which it is reasonably possible that the total amounts of unrecognized tax benefits will significantly change in the next twelve months. The Fund files a U.S. federal tax return, in addition to state and local tax returns as required. The Fund's federal income tax returns are subject to examination by the Internal Revenue Service (IRS) for a period of three fiscal years after they are filed. State and local tax returns may be subject to examination for an additional fiscal year depending on the jurisdiction. Foreign taxes are provided for based on the Fund's understanding of the tax rules and rates that exist in the foreign markets in which it invests.
Distributions are declared and recorded on the ex-dividend date. Income and capital gain distributions are declared separately for each class. Income and capital gain distributions are determined in accordance with income tax regulations, which may differ from GAAP.
Capital accounts within the financial statements are adjusted for permanent book-tax differences. These adjustments have no impact on net assets or the results of operations. Capital accounts are not adjusted for temporary book-tax differences which will reverse in a subsequent period.
Book-tax differences are primarily due to foreign currency transactions, passive foreign investment companies (PFIC), equity-debt classifications, certain conversion ratio adjustments, partnerships and losses deferred due to wash sales.
As of period end, the cost and unrealized appreciation (depreciation) in securities, and derivatives if applicable, for federal income tax purposes were as follows:
| Gross unrealized appreciation | $2,818,892,049 |
| Gross unrealized depreciation | (671,544,990) |
| Net unrealized appreciation (depreciation) | $2,147,347,059 |
| Tax Cost | $11,187,792,457 |
The tax-based components of distributable earnings as of period end were as follows:
| Undistributed ordinary income | $302,450,709 |
| Undistributed long-term capital gain | $453,080,392 |
| Net unrealized appreciation (depreciation) on securities and other investments | $2,103,047,539 |
The tax character of distributions paid was as follows:
| | June 30, 2018 | June 30, 2017 |
| Ordinary Income | $324,306,848 | $ 146,133,828 |
| Long-term Capital Gains | 412,568,833 | – |
| Total | $736,875,681 | $ 146,133,828 |
Restricted Securities. The Fund may invest in securities that are subject to legal or contractual restrictions on resale. These securities generally may be resold in transactions exempt from registration or to the public if the securities are registered. Disposal of these securities may involve time-consuming negotiations and expense, and prompt sale at an acceptable price may be difficult. Information regarding restricted securities is included at the end of the Fund's Schedule of Investments.
Consolidated Subsidiary. The Fund invests in certain investments through a wholly-owned subsidiary ("Subsidiary"), which may be subject to federal and state taxes upon disposition.
As of period end, the Fund held an investment of $14,103,018 in this Subsidiary, representing .11% of the Fund's net assets. The financial statements have been consolidated and include accounts of the Fund and the Subsidiary. Accordingly, all inter-company transactions and balances have been eliminated.
Any cash held by the Subsidiary is restricted as to its use and is presented as Restricted cash in the Statement of Assets and Liabilities.
4. Derivative Instruments.
Risk Exposures and the Use of Derivative Instruments. The Fund's investment objective allows the Fund to enter into various types of derivative contracts, including options. Derivatives are investments whose value is primarily derived from underlying assets, indices or reference rates and may be transacted on an exchange or over-the-counter (OTC). Derivatives may involve a future commitment to buy or sell a specified asset based on specified terms, to exchange future cash flows at periodic intervals based on a notional principal amount, or for one party to make one or more payments upon the occurrence of specified events in exchange for periodic payments from the other party.
The Fund used derivatives to increase returns and to manage exposure to certain risks as defined below. The success of any strategy involving derivatives depends on analysis of numerous economic factors, and if the strategies for investment do not work as intended, the Fund may not achieve its objectives.
The Fund's use of derivatives increased or decreased its exposure to the following risk:
| Equity Risk | Equity risk relates to the fluctuations in the value of financial instruments as a result of changes in market prices (other than those arising from interest rate risk or foreign exchange risk), whether caused by factors specific to an individual investment, its issuer, or all factors affecting all instruments traded in a market or market segment.
|
The Fund is also exposed to additional risks from investing in derivatives, such as liquidity risk and counterparty credit risk. Liquidity risk is the risk that the Fund will be unable to close out the derivative in the open market in a timely manner. Counterparty credit risk is the risk that the counterparty will not be able to fulfill its obligation to the Fund. Derivative counterparty credit risk is managed through formal evaluation of the creditworthiness of all potential counterparties. On certain OTC derivatives such as options, the Fund attempts to reduce its exposure to counterparty credit risk by entering into an International Swaps and Derivatives Association, Inc. (ISDA) Master Agreement with each of its counterparties. The ISDA Master Agreement gives the Fund the right to terminate all transactions traded under such agreement upon the deterioration in the credit quality of the counterparty beyond specified levels. The ISDA Master Agreement gives each party the right, upon an event of default by the other party or a termination of the agreement, to close out all transactions traded under such agreement and to net amounts owed under each transaction to one net payable by one party to the other. To mitigate counterparty credit risk on bi-lateral OTC derivatives, the Fund receives collateral in the form of cash or securities once the Fund's net unrealized appreciation on outstanding derivative contracts under an ISDA Master Agreement exceeds certain applicable thresholds, subject to certain minimum transfer provisions. The collateral received is held in segregated accounts with the Fund's custodian bank in accordance with the collateral agreements entered into between the Fund, the counterparty and the Fund's custodian bank. The Fund could experience delays and costs in gaining access to the collateral even though it is held by the Fund's custodian bank. The Fund's maximum risk of loss from counterparty credit risk related to bi-lateral OTC derivatives is generally the aggregate unrealized appreciation and unpaid counterparty payments in excess of any collateral pledged by the counterparty to the Fund. The Fund may be required to pledge collateral for the benefit of the counterparties on bi-lateral OTC derivatives in an amount not less than each counterparty's unrealized appreciation on outstanding derivative contracts, subject to certain minimum transfer provisions, and any such pledged collateral is identified in the Schedule of Investments. Counterparty credit risk related to exchange-traded options may be mitigated by the protection provided by the exchange on which they trade.
Investing in derivatives may involve greater risks than investing in the underlying assets directly and, to varying degrees, may involve risk of loss in excess of any initial investment and collateral received and amounts recognized in the Statement of Assets and Liabilities. In addition, there may be the risk that the change in value of the derivative contract does not correspond to the change in value of the underlying instrument.
Options. Options give the purchaser the right, but not the obligation, to buy (call) or sell (put) an underlying security or financial instrument at an agreed exercise or strike price between or on certain dates. Options obligate the seller (writer) to buy (put) or sell (call) an underlying instrument at the exercise or strike price or cash settle an underlying derivative instrument if the holder exercises the option on or before the expiration date.
The Fund used exchange-traded and OTC written covered call options to manage its exposure to the market. When the Fund writes a covered call option, the Fund holds the underlying instrument which must be delivered to the holder upon the exercise of the option.
Upon entering into a written options contract, the Fund will receive a premium. Premiums received are reflected as a liability on the Statement of Assets and Liabilities. Options are valued daily and any unrealized appreciation (depreciation) is reflected on the Statement of Assets and Liabilities. When a written option is exercised, the premium is added to the proceeds from the sale of the underlying instrument in determining the gain or loss realized on that investment. When an option is closed the Fund will realize a gain or loss depending on whether the proceeds or amount paid for the closing sale transaction are greater or less than the premium received. When an option expires, gains and losses are realized to the extent of premiums received. The net realized gain (loss) on closed and expired written options and the change in net unrealized appreciation (depreciation) on written options are presented in the Statement of Operations.
Writing call options tends to decrease exposure to the underlying instrument and risk of loss is the change in value in excess of the premium received.
Any open options at period end are presented in the Schedule of Investments under the caption "Written Options" and are representative of volume of activity during the period.
5. Purchases and Sales of Investments.
Purchases and sales of securities, other than short-term securities, aggregated $5,476,876,300 and $6,019,353,403, respectively.
6. Fees and Other Transactions with Affiliates.
Management Fee. Fidelity Management & Research Company (the investment adviser) and its affiliates provide the Fund with investment management related services for which the Fund does not pay a management fee. Under the management contract, the investment adviser or an affiliate pays all ordinary operating expenses of the Fund, except custody fees, fees and expenses of the independent Trustees, and certain miscellaneous expenses such as proxy and shareholder meeting expenses.
Brokerage Commissions. The Fund placed a portion of its portfolio transactions with brokerage firms which are affiliates of the investment adviser. Brokerage commissions are included in net realized gain (loss) and change in net unrealized appreciation (depreciation) in the Statement of Operations. The commissions paid to these affiliated firms were $109,167 for the period.
Interfund Lending Program. Pursuant to an Exemptive Order issued by the SEC, the Fund, along with other registered investment companies having management contracts with Fidelity Management & Research Company (FMR) or other affiliated entities of FMR, may participate in an interfund lending program. This program provides an alternative credit facility allowing the funds to borrow from, or lend money to, other participating affiliated funds. At period end, there were no interfund loans outstanding. The Fund's activity in this program during the period for which loans were outstanding was as follows:
| Borrower or Lender | Average Loan Balance | Weighted Average Interest Rate | Interest Expense |
| Borrower | $78,934,667 | 1.48% | $9,739 |
Interfund Trades. The Fund may purchase from or sell securities to other Fidelity Funds under procedures adopted by the Board. The procedures have been designed to ensure these interfund trades are executed in accordance with Rule 17a-7 of the 1940 Act. Interfund trades are included within the respective purchases and sales amounts shown in the Purchases and Sales of Investments note.
Prior Fiscal Year Exchanges In-Kind. During the prior period, certain affiliated entities (Investing Funds) completed exchanges in-kind with the Fund. The Investing Funds delivered investments and cash valued at $3,024,754,769 in exchange for 201,755,383 shares of the Fund. The amount of in-kind exchanges is included in share transactions in the accompanying Statement of Changes in Net Assets as well as the Notes to Financial Statements. The Fund recognized no gain or loss for federal income tax purposes.
7. Committed Line of Credit.
The Fund participates with other funds managed by the investment adviser or an affiliate in a $4.25 billion credit facility (the "line of credit") to be utilized for temporary or emergency purposes to fund shareholder redemptions or for other short-term liquidity purposes. The Fund has agreed to pay commitment fees on its pro-rata portion of the line of credit, which amounted to $35,713 and is reflected in Miscellaneous expenses on the Statement of Operations. During the period, the Fund did not borrow on this line of credit.
8. Security Lending.
The Fund lends portfolio securities through a lending agent from time to time in order to earn additional income. For equity securities, a lending agent is used and may loan securities to certain qualified borrowers, including Fidelity Capital Markets (FCM), a broker-dealer affiliated with the Fund. On the settlement date of the loan, the Fund receives collateral (in the form of U.S. Treasury obligations, letters of credit and/or cash) against the loaned securities and maintains collateral in an amount not less than 100% of the market value of the loaned securities during the period of the loan. The market value of the loaned securities is determined at the close of business of the Fund and any additional required collateral is delivered to the Fund on the next business day. The Fund or borrower may terminate the loan at any time, and if the borrower defaults on its obligation to return the securities loaned because of insolvency or other reasons, the Fund may apply collateral received from the borrower against the obligation. The Fund may experience delays and costs in recovering the securities loaned. Any cash collateral received is invested in the Fidelity Securities Lending Cash Central Fund. The value of loaned securities and cash collateral at period end are disclosed on the Fund's Statement of Assets and Liabilities. At period end, there were no security loans outstanding with FCM. Security lending income represents the income earned on investing cash collateral, less rebates paid to borrowers and any lending agent fees associated with the loan, plus any premium payments received for lending certain types of securities. Security lending income is presented in the Statement of Operations as a component of income from Fidelity Central Funds. Total security lending income during the period amounted to $584,068, including $17,288 from securities loaned to FCM.
9. Expense Reductions.
During the period the investment adviser reimbursed and/or waived a portion of fund-level operating expenses in the amount of $41,195.
10. Distributions to Shareholders.
Distributions to shareholders of each class were as follows:
| | Year ended
June 30, 2018 | Year ended
June 30, 2017 |
| From net investment income | | |
| Series Growth and Income | $260,517,508 | $48,856,189 |
| Class F | 28,152,626 | 84,785,151 |
| Total | $288,670,134 | $133,641,340 |
| From net realized gain | | |
| Series Growth and Income | $266,448,987 | $4,884,467 |
| Class F | 181,756,560 | 7,608,021 |
| Total | $448,205,547 | $12,492,488 |
11. Share Transactions.
Transactions for each class of shares were as follows:
| | Shares | Shares | Dollars | Dollars |
| | Year ended June 30, 2018 | Year ended June 30, 2017 | Year ended June 30, 2018 | Year ended June 30, 2017 |
| Series Growth and Income | | | | |
| Shares sold | 602,049,593 | 97,037,852(a) | $8,832,302,915 | $1,440,536,935(a) |
| Reinvestment of distributions | 34,676,099 | 3,953,948 | 526,966,495 | 53,740,656 |
| Shares redeemed | (135,036,139) | (45,528,048) | (2,104,425,625) | (639,527,031) |
| Net increase (decrease) | 501,689,553 | 55,463,752 | $7,254,843,785 | $854,750,560 |
| Class F | | | | |
| Shares sold | 10,170,158 | 167,724,008(a) | $153,318,165 | $2,478,334,345(a) |
| Reinvestment of distributions | 14,338,215 | 6,778,501 | 209,909,186 | 92,393,172 |
| Shares redeemed | (529,257,587) | (91,118,116) | (7,728,026,173) | (1,288,199,631) |
| Net increase (decrease) | (504,749,214) | 83,384,393 | $(7,364,798,822) | $1,282,527,886 |
(a) Amount includes in-kind exchanges (see the Prior Fiscal Year Exchanges In-Kind note for additional details).
12. Proposed Reorganization.
The Board of Trustees of the Fund approved an Agreement and Plan of Reorganization (the Agreement) between the Fund and Fidelity Advisor Series Growth and Income Fund. The Agreement provides for the transfer of all the assets and the assumption of all the liabilities of Fidelity Advisor Series Growth and Income Fund in exchange for corresponding shares of the Fund equal in value to the net assets of the Fidelity Advisor Series Growth and Income Fund on the day the reorganization is effective.
The reorganization does not require Fidelity Advisor Series Growth and Income Fund's shareholder approval and is expected to become effective in September 2018. The reorganization is expected to qualify as a tax-free transaction for federal income tax purposes with no gain or loss recognized by the funds or their shareholders.
13. Other.
The Fund's organizational documents provide former and current trustees and officers with a limited indemnification against liabilities arising in connection with the performance of their duties to the Fund. In the normal course of business, the Fund may also enter into contracts that provide general indemnifications. The Fund's maximum exposure under these arrangements is unknown as this would be dependent on future claims that may be made against the Fund. The risk of material loss from such claims is considered remote.
At the end of the period, mutual funds managed by the investment advisor or its affiliates were the owners of record of all of the outstanding shares of the Fund.
Report of Independent Registered Public Accounting Firm
To the Board of Trustees of Fidelity Hastings Street Trust and Shareholders of Fidelity Series Growth & Income Fund:
Opinion on the Financial Statements
We have audited the accompanying statement of assets and liabilities, including the schedule of investments, of Fidelity Series Growth & Income Fund (one of the funds constituting Fidelity Hastings Street Trust, referred to hereafter as the "Fund") as of June 30, 2018, the related statement of operations for the year ended June 30, 2018, the statement of changes in net assets for each of the two years in the period ended June 30, 2018, including the related notes, and the financial highlights for each of the five years in the period ended June 30, 2018 (collectively referred to as the “financial statements”). In our opinion, the financial statements present fairly, in all material respects, the financial position of the Fund as of June 30, 2018, the results of its operations for the year then ended, the changes in its net assets for each of the two years in the period ended June 30, 2018 and the financial highlights for each of the five years in the period ended June 30, 2018 in conformity with accounting principles generally accepted in the United States of America.
Basis for Opinion
These financial statements are the responsibility of the Fund’s management. Our responsibility is to express an opinion on the Fund’s financial statements based on our audits. We are a public accounting firm registered with the Public Company Accounting Oversight Board (United States) (“PCAOB”) and are required to be independent with respect to the Fund in accordance with the U.S. federal securities laws and the applicable rules and regulations of the Securities and Exchange Commission and the PCAOB.
We conducted our audits of these financial statements in accordance with the standards of the PCAOB. Those standards require that we plan and perform the audit to obtain reasonable assurance about whether the financial statements are free of material misstatement, whether due to error or fraud.
Our audits included performing procedures to assess the risks of material misstatement of the financial statements, whether due to error or fraud, and performing procedures that respond to those risks. Such procedures included examining, on a test basis, evidence regarding the amounts and disclosures in the financial statements. Our audits also included evaluating the accounting principles used and significant estimates made by management, as well as evaluating the overall presentation of the financial statements. Our procedures included confirmation of securities owned as of June 30, 2018 by correspondence with the custodian, and brokers; when replies were not received from brokers, we performed other auditing procedures. We believe that our audits provide a reasonable basis for our opinion.
PricewaterhouseCoopers LLP
Boston, Massachusetts
August 16, 2018
We have served as the auditor of one or more investment companies in the Fidelity group of funds since 1932.
Trustees and Officers
The Trustees, Members of the Advisory Board (if any), and officers of the trust and fund, as applicable, are listed below. The Board of Trustees governs the fund and is responsible for protecting the interests of shareholders. The Trustees are experienced executives who meet periodically throughout the year to oversee the fund's activities, review contractual arrangements with companies that provide services to the fund, oversee management of the risks associated with such activities and contractual arrangements, and review the fund's performance. Except for Michael E. Wiley, each of the Trustees oversees 284 funds. Mr. Wiley oversees 197 funds.
The Trustees hold office without limit in time except that (a) any Trustee may resign; (b) any Trustee may be removed by written instrument, signed by at least two-thirds of the number of Trustees prior to such removal; (c) any Trustee who requests to be retired or who has become incapacitated by illness or injury may be retired by written instrument signed by a majority of the other Trustees; and (d) any Trustee may be removed at any special meeting of shareholders by a two-thirds vote of the outstanding voting securities of the trust. Each Trustee who is not an interested person (as defined in the 1940 Act) of the trust and the fund is referred to herein as an Independent Trustee. Each Independent Trustee shall retire not later than the last day of the calendar year in which his or her 75th birthday occurs. The Independent Trustees may waive this mandatory retirement age policy with respect to individual Trustees. Officers and Advisory Board Members hold office without limit in time, except that any officer or Advisory Board Member may resign or may be removed by a vote of a majority of the Trustees at any regular meeting or any special meeting of the Trustees. Except as indicated, each individual has held the office shown or other offices in the same company for the past five years.
The fund’s Statement of Additional Information (SAI) includes more information about the Trustees. To request a free copy, call Fidelity at 1-800-544-8544.
Experience, Skills, Attributes, and Qualifications of the Trustees. The Governance and Nominating Committee has adopted a statement of policy that describes the experience, qualifications, attributes, and skills that are necessary and desirable for potential Independent Trustee candidates (Statement of Policy). The Board believes that each Trustee satisfied at the time he or she was initially elected or appointed a Trustee, and continues to satisfy, the standards contemplated by the Statement of Policy. The Governance and Nominating Committee also engages professional search firms to help identify potential Independent Trustee candidates who have the experience, qualifications, attributes, and skills consistent with the Statement of Policy. From time to time, additional criteria based on the composition and skills of the current Independent Trustees, as well as experience or skills that may be appropriate in light of future changes to board composition, business conditions, and regulatory or other developments, have also been considered by the professional search firms and the Governance and Nominating Committee. In addition, the Board takes into account the Trustees' commitment and participation in Board and committee meetings, as well as their leadership of standing and ad hoc committees throughout their tenure.
In determining that a particular Trustee was and continues to be qualified to serve as a Trustee, the Board has considered a variety of criteria, none of which, in isolation, was controlling. The Board believes that, collectively, the Trustees have balanced and diverse experience, qualifications, attributes, and skills, which allow the Board to operate effectively in governing the fund and protecting the interests of shareholders. Information about the specific experience, skills, attributes, and qualifications of each Trustee, which in each case led to the Board's conclusion that the Trustee should serve (or continue to serve) as a trustee of the fund, is provided below.
Board Structure and Oversight Function. James C. Curvey is an interested person and currently serves as Chairman. The Trustees have determined that an interested Chairman is appropriate and benefits shareholders because an interested Chairman has a personal and professional stake in the quality and continuity of services provided to the fund. Independent Trustees exercise their informed business judgment to appoint an individual of their choosing to serve as Chairman, regardless of whether the Trustee happens to be independent or a member of management. The Independent Trustees have determined that they can act independently and effectively without having an Independent Trustee serve as Chairman and that a key structural component for assuring that they are in a position to do so is for the Independent Trustees to constitute a substantial majority for the Board. The Independent Trustees also regularly meet in executive session. Ned C. Lautenbach serves as Chairman of the Independent Trustees and as such (i) acts as a liaison between the Independent Trustees and management with respect to matters important to the Independent Trustees and (ii) with management prepares agendas for Board meetings.
Fidelity® funds are overseen by different Boards of Trustees. The fund's Board oversees Fidelity's high income and certain equity funds, and other Boards oversee Fidelity's investment-grade bond, money market, asset allocation, and other equity funds. The asset allocation funds may invest in Fidelity® funds overseen by the fund's Board. The use of separate Boards, each with its own committee structure, allows the Trustees of each group of Fidelity® funds to focus on the unique issues of the funds they oversee, including common research, investment, and operational issues. On occasion, the separate Boards establish joint committees to address issues of overlapping consequences for the Fidelity® funds overseen by each Board.
The Trustees operate using a system of committees to facilitate the timely and efficient consideration of all matters of importance to the Trustees, the fund, and fund shareholders and to facilitate compliance with legal and regulatory requirements and oversight of the fund's activities and associated risks. The Board, acting through its committees, has charged FMR and its affiliates with (i) identifying events or circumstances the occurrence of which could have demonstrably adverse effects on the fund's business and/or reputation; (ii) implementing processes and controls to lessen the possibility that such events or circumstances occur or to mitigate the effects of such events or circumstances if they do occur; and (iii) creating and maintaining a system designed to evaluate continuously business and market conditions in order to facilitate the identification and implementation processes described in (i) and (ii) above. Because the day-to-day operations and activities of the fund are carried out by or through FMR, its affiliates, and other service providers, the fund's exposure to risks is mitigated but not eliminated by the processes overseen by the Trustees. While each of the Board's committees has responsibility for overseeing different aspects of the fund's activities, oversight is exercised primarily through the Operations, Audit, and Compliance Committees. In addition, the Independent Trustees have worked with Fidelity to enhance the Board's oversight of investment and financial risks, legal and regulatory risks, technology risks, and operational risks, including the development of additional risk reporting to the Board. Appropriate personnel, including but not limited to the fund's Chief Compliance Officer (CCO), FMR's internal auditor, the independent accountants, the fund's Treasurer and portfolio management personnel, make periodic reports to the Board's committees, as appropriate, including an annual review of Fidelity's risk management program for the Fidelity® funds. The responsibilities of each standing committee, including their oversight responsibilities, are described further under "Standing Committees of the Trustees."
Interested Trustees*:
Correspondence intended for a Trustee who is an interested person may be sent to Fidelity Investments, 245 Summer Street, Boston, Massachusetts 02210.
Name, Year of Birth; Principal Occupations and Other Relevant Experience+
James C. Curvey (1935)
Year of Election or Appointment: 2007
Trustee
Chairman of the Board of Trustees
Mr. Curvey also serves as Trustee of other Fidelity® funds. Mr. Curvey is Vice Chairman (2007-present) and Director of FMR LLC (diversified financial services company). In addition, Mr. Curvey is an Overseer Emeritus for the Boston Symphony Orchestra, a Director of Artis-Naples, and a Trustee of Brewster Academy in Wolfeboro, New Hampshire. Previously, Mr. Curvey served as a Director of Fidelity Research & Analysis Co. (investment adviser firm, 2009-2018), Director of Fidelity Investments Money Management, Inc. (investment adviser firm, 2009-2014) and a Director of FMR and FMR Co., Inc. (investment adviser firms, 2007-2014).
Charles S. Morrison (1960)
Year of Election or Appointment: 2014
Trustee
Mr. Morrison also serves as Trustee of other funds. He serves as President of Fidelity SelectCo, LLC (investment adviser firm, 2017-present) and Fidelity Management & Research Company (FMR) (investment adviser firm, 2016-present), a Director of Fidelity Investments Money Management, Inc. (FIMM) (investment adviser firm, 2014-present), Director of Fidelity SelectCo, LLC (investment adviser firm, 2014-present), President, Asset Management (2014-present), and is an employee of Fidelity Investments. Previously, Mr. Morrison served as Vice President of Fidelity's Fixed Income and Asset Allocation Funds (2012-2014), President, Fixed Income (2011-2014), Vice President of Fidelity's Money Market Funds (2005-2009), President, Money Market Group Leader of FMR (investment adviser firm, 2009), and Senior Vice President, Money Market Group of FMR (2004-2009). Mr. Morrison also served as Vice President of Fidelity's Bond Funds (2002-2005), certain Balanced Funds (2002-2005), and certain Asset Allocation Funds (2002-2007), and as Senior Vice President (2002-2005) of Fidelity's Bond Division.
* Determined to be an “Interested Trustee” by virtue of, among other things, his or her affiliation with the trust or various entities under common control with FMR.
+ The information includes the Trustee's principal occupation during the last five years and other information relating to the experience, attributes, and skills relevant to the Trustee's qualifications to serve as a Trustee, which led to the conclusion that the Trustee should serve as a Trustee for the fund.
Independent Trustees:
Correspondence intended for an Independent Trustee may be sent to Fidelity Investments, P.O. Box 55235, Boston, Massachusetts 02205-5235.
Name, Year of Birth; Principal Occupations and Other Relevant Experience+
Dennis J. Dirks (1948)
Year of Election or Appointment: 2005
Trustee
Mr. Dirks also serves as Trustee of other Fidelity® funds. Prior to his retirement in May 2003, Mr. Dirks was Chief Operating Officer and a member of the Board of The Depository Trust & Clearing Corporation (DTCC). He also served as President, Chief Operating Officer, and Board member of The Depository Trust Company (DTC) and President and Board member of the National Securities Clearing Corporation (NSCC). In addition, Mr. Dirks served as Chief Executive Officer and Board member of the Government Securities Clearing Corporation, Chief Executive Officer and Board member of the Mortgage-Backed Securities Clearing Corporation, as a Trustee and a member of the Finance Committee of Manhattan College (2005-2008), as a Trustee and a member of the Finance Committee of AHRC of Nassau County (2006-2008), as a member of the Independent Directors Council (IDC) Governing Council (2010-2015), and as a member of the Board of Directors for The Brookville Center for Children’s Services, Inc. (2009-2017). Mr. Dirks is a member of the Finance Committee (2016-present), Board of Directors (2017-present) and Board of Trustees (2018-present) and is Treasurer (2018-present) of the Asolo Repertory Theatre.
Donald F. Donahue (1950)
Year of Election or Appointment: 2018
Trustee
Mr. Donahue also serves as a Trustee of other Fidelity® funds. Mr. Donahue is President and Chief Executive Officer of Miranda Partners, LLC (risk consulting for the financial services industry, 2012-present). Previously, Mr. Donahue served as a Member of the Advisory Board of certain Fidelity® funds (2015-2018) and Chief Executive Officer (2006-2012), Chief Operating Officer (2003-2006), and Managing Director, Customer Marketing and Development (1999-2003) of The Depository Trust & Clearing Corporation (financial markets infrastructure). Mr. Donahue serves as a Member (2007-present) and Co-Chairman (2016-present) of the Board of Directors of United Way of New York, Member of the Board of Directors of NYC Leadership Academy (2012-present) and Member of the Board of Advisors of Ripple Labs, Inc. (financial services, 2015-present). He also served as Chairman (2010-2012) and Member of the Board of Directors (2012-2013) of Omgeo, LLC (financial services), Treasurer of United Way of New York (2012-2016), and Member of the Board of Directors of XBRL US (financial services non-profit, 2009-2012) and the International Securities Services Association (2009-2012).
Alan J. Lacy (1953)
Year of Election or Appointment: 2008
Trustee
Mr. Lacy also serves as Trustee of other Fidelity® funds. Mr. Lacy serves as a Director of Bristol-Myers Squibb Company (global pharmaceuticals, 2008-present). He is a Trustee of the California Chapter of The Nature Conservancy (2015-present) and a Director of the Center for Advanced Study in the Behavioral Sciences at Stanford University (2015-present). In addition, Mr. Lacy served as Senior Adviser (2007-2014) of Oak Hill Capital Partners, L.P. (private equity) and also served as Chief Executive Officer (2005) and Vice Chairman (2005-2006) of Sears Holdings Corporation (retail) and Chief Executive Officer and Chairman of the Board of Sears, Roebuck and Co. (retail, 2000-2005). Previously, Mr. Lacy served as Chairman (2014-2017) and a member (2010-2017) of the Board of Directors of Dave & Buster’s Entertainment, Inc. (restaurant and entertainment complexes), as Chairman (2008-2011) and a member (2006-2015) of the Board of Trustees of the National Parks Conservation Association, and as a member of the Board of Directors for The Hillman Companies, Inc. (hardware wholesalers, 2010-2014), Earth Fare, Inc. (retail grocery, 2010-2014), and The Western Union Company (global money transfer, 2006-2011).
Ned C. Lautenbach (1944)
Year of Election or Appointment: 2000
Trustee
Chairman of the Independent Trustees
Mr. Lautenbach also serves as Trustee of other Fidelity® funds. Mr. Lautenbach currently serves as Vice Chair of the Board of Governors, State University System of Florida (2013-present) and is a member of the Council on Foreign Relations (1994-present). He is also a member and has most recently served as Chairman of the Board of Directors of Artis-Naples (2012-present). Previously, Mr. Lautenbach served as a member and then Lead Director of the Board of Directors of Eaton Corporation (diversified industrial, 1997-2016). He was also a Partner and Advisory Partner at Clayton, Dubilier & Rice, LLC (private equity investment, 1998-2010), as well as a Director of Sony Corporation (2006-2007). In addition, Mr. Lautenbach also had a 30-year career with IBM (technology company) during which time he served as Senior Vice President and a member of the Corporate Executive Committee (1968-1998).
Joseph Mauriello (1944)
Year of Election or Appointment: 2008
Trustee
Mr. Mauriello also serves as Trustee of other Fidelity® funds. Prior to his retirement in January 2006, Mr. Mauriello served in numerous senior management positions including Deputy Chairman and Chief Operating Officer (2004-2005), and Vice Chairman of Financial Services (2002-2004) of KPMG LLP US (professional services, 1965-2005). Mr. Mauriello currently serves as a member of the Board of Directors of XL Group plc. (global insurance and re-insurance, 2006-present) and the Independent Directors Council (IDC) Governing Council (2015-present). Previously, Mr. Mauriello served as a Director of the Hamilton Funds of the Bank of New York (2006-2007) and of Arcadia Resources Inc. (health care services and products, 2007-2012).
Cornelia M. Small (1944)
Year of Election or Appointment: 2005
Trustee
Ms. Small also serves as Trustee of other Fidelity® funds. Ms. Small is a member of the Board of Directors (2009-present) and Chair of the Investment Committee (2010-present) of the Teagle Foundation. Ms. Small also serves on the Investment Committee of the Berkshire Taconic Community Foundation (2008-present). Previously, Ms. Small served as Chairperson (2002-2008) and a member of the Investment Committee and Chairperson (2008-2012) and a member of the Board of Trustees of Smith College. In addition, Ms. Small served as Chief Investment Officer, Director of Global Equity Investments, and a member of the Board of Directors of Scudder, Stevens & Clark and Scudder Kemper Investments.
Garnett A. Smith (1947)
Year of Election or Appointment: 2018
Trustee
Mr. Smith also serves as Trustee of other Fidelity® funds. Prior to Mr. Smith's retirement, he served as Chairman and Chief Executive Officer of Inbrand Corp. (manufacturer of personal absorbent products, 1990-1997). He also served as President (1986-1990) of Inbrand Corp. Prior to his employment with Inbrand Corp., he was employed by a retail fabric chain and North Carolina National Bank. In addition, Mr. Smith served as a Member of the Advisory Board of certain Fidelity® funds (2012-2013) and as a board member of the Jackson Hole Land Trust (2009-2012).
David M. Thomas (1949)
Year of Election or Appointment: 2008
Trustee
Mr. Thomas also serves as Trustee of other Fidelity® funds. Mr. Thomas serves as Non-Executive Chairman of the Board of Directors of Fortune Brands Home and Security (home and security products, 2011-present), as a member of the Board of Directors (2004-present) and Presiding Director (2013-present) of Interpublic Group of Companies, Inc. (marketing communication), and as a member of the Board of Trustees of the University of Florida (2013-present). Previously, Mr. Thomas served as Executive Chairman (2005-2006) and Chairman and Chief Executive Officer (2000-2005) of IMS Health, Inc. (pharmaceutical and healthcare information solutions), and a Director of Fortune Brands, Inc. (consumer products, 2000-2011).
Michael E. Wiley (1950)
Year of Election or Appointment: 2018
Trustee
Mr. Wiley also serves as Trustee or Member of the Advisory Board of other Fidelity® funds. Mr. Wiley serves as a Director of Andeavor Corporation (independent oil refiner and marketer, 2005-present), a Director of Andeavor Logistics LP (natural resources logistics, 2015-present), and a Director of Bill Barrett Corporation (exploration and production, 2005-present). In addition, Mr. Wiley also serves as a Director of Post Oak Bank (privately-held bank, 2004-present). Previously, Mr. Wiley served as a Trustee of other Fidelity® funds (2008-2013), as a Director of Asia Pacific Exploration Consolidated (international oil and gas exploration and production, 2008-2013), as a member of the Board of Trustees of the University of Tulsa (2000-2006; 2007-2010), as a Senior Energy Advisor of Katzenbach Partners, LLC (consulting, 2006-2007), as an Advisory Director of Riverstone Holdings (private investment), Chairman, President, and CEO of Baker Hughes, Inc. (oilfield services, 2000-2004), and as Director of Spinnaker Exploration Company (exploration and production, 2001-2005).
+ The information includes the Trustee's principal occupation during the last five years and other information relating to the experience, attributes, and skills relevant to the Trustee's qualifications to serve as a Trustee, which led to the conclusion that the Trustee should serve as a Trustee for the fund.
Advisory Board Members and Officers:
Correspondence intended for a Member of the Advisory Board (if any) may be sent to Fidelity Investments, P.O. Box 55235, Boston, Massachusetts 02205-5235. Correspondence intended for an officer or Peter S. Lynch may be sent to Fidelity Investments, 245 Summer Street, Boston, Massachusetts 02210. Officers appear below in alphabetical order.
Name, Year of Birth; Principal Occupation
Peter S. Lynch (1944)
Year of Election or Appointment: 2003
Member of the Advisory Board
Mr. Lynch also serves as Member of the Advisory Board of other Fidelity® funds. Mr. Lynch is Vice Chairman and a Director of FMR (investment adviser firm) and FMR Co., Inc. (investment adviser firm). In addition, Mr. Lynch serves as a Trustee of Boston College and as the Chairman of the Inner-City Scholarship Fund. Previously, Mr. Lynch served on the Special Olympics International Board of Directors (1997-2006).
William S. Stavropoulos (1939)
Year of Election or Appointment: 2018
Member of the Advisory Board
Mr. Stavropoulos also serves as Member of the Advisory Board of other Fidelity® funds. Mr. Stavropoulos serves as President and Founder of the Michigan Baseball Foundation, the Great Lakes Loons (2007-present). Mr. Stavropoulos is Chairman Emeritus of the Board of Directors of The Dow Chemical Company, where he previously served in numerous senior management positions, including President, CEO (1995-2000; 2002-2004), Chairman of the Executive Committee (2000-2006), and as a member of the Board of Directors (1990-2006). Currently, Mr. Stavropoulos is Chairman of the Board of Directors of Univar Inc. (global distributor of commodity and specialty chemicals), a Director of Teradata Corporation (data warehousing and technology solutions), and a member of the Advisory Board for Metalmark Capital LLC (private equity investment, 2005-present). Mr. Stavropoulos is an operating advisor to Clayton, Dubilier & Rice, LLC (private equity investment). In addition, Mr. Stavropoulos is a member of the University of Notre Dame Advisory Council for the College of Science, a Trustee of the Rollin L. Gerstacker Foundation, and a Director of Artis-Naples in Naples, Florida. Previously, Mr. Stavropoulos served as Trustee of certain Fidelity® funds (2001-2018) and as a Director of Chemical Financial Corporation (bank holding company, 1993-2012) and Tyco International, Ltd. (multinational manufacturing and services, 2007-2012).
Carol B. Tomé (1957)
Year of Election or Appointment: 2018
Member of the Advisory Board
Ms. Tomé also serves as Member of the Advisory Board of other Fidelity® funds. Ms. Tomé is Chief Financial Officer (2001-present) and Executive Vice President of Corporate Services (2007-present) of The Home Depot, Inc. (home improvement retailer) and a Director (2003-present) and Chair of the Audit Committee (2004-present) of United Parcel Service, Inc. (package delivery and supply chain management). Previously, Ms. Tomé served as Trustee of certain Fidelity® funds (2017), Senior Vice President of Finance and Accounting/Treasurer (2000-2007) and Vice President and Treasurer (1995-2000) of The Home Depot, Inc. and Chair of the Board (2010-2012), Vice Chair of the Board (2009 and 2013), and a Director (2008-2013) of the Federal Reserve Bank of Atlanta. Ms. Tomé is also a director or trustee of many community and professional organizations.
Elizabeth Paige Baumann (1968)
Year of Election or Appointment: 2017
Anti-Money Laundering (AML) Officer
Ms. Baumann also serves as AML Officer of other funds. She is Chief AML Officer (2012-present) and Senior Vice President (2014-present) of FMR LLC (diversified financial services company) and is an employee of Fidelity Investments. Previously, Ms. Baumann served as AML Officer of the funds (2012-2016), and Vice President (2007-2014) and Deputy Anti-Money Laundering Officer (2007-2012) of FMR LLC.
Marc R. Bryant (1966)
Year of Election or Appointment: 2015
Secretary and Chief Legal Officer (CLO)
Mr. Bryant also serves as Secretary and CLO of other funds. Mr. Bryant serves as CLO, Secretary, and Senior Vice President of Fidelity Management & Research Company (investment adviser firm, 2015-present) and FMR Co., Inc. (investment adviser firm, 2015-present); Secretary of Fidelity SelectCo, LLC (investment adviser firm, 2015-present) and Fidelity Investments Money Management, Inc. (investment adviser firm, 2015-present); and CLO of Fidelity Management & Research (Hong Kong) Limited and FMR Investment Management (UK) Limited (investment adviser firms, 2015-present) and Fidelity Management & Research (Japan) Limited (investment adviser firm, 2016-present). He is Senior Vice President and Deputy General Counsel of FMR LLC (diversified financial services company). Previously, Mr. Bryant served as Secretary and CLO of Fidelity Rutland Square Trust II (2010-2014) and Assistant Secretary of Fidelity's Fixed Income and Asset Allocation Funds (2013-2015). Prior to joining Fidelity Investments, Mr. Bryant served as a Senior Vice President and the Head of Global Retail Legal for AllianceBernstein L.P. (2006-2010), and as the General Counsel for ProFund Advisors LLC (2001-2006).
John J. Burke III (1964)
Year of Election or Appointment: 2018
Chief Financial Officer
Mr. Burke also serves as Chief Financial Officer of other funds. Mr. Burke serves as Head of Investment Operations for Fidelity Fund and Investment Operations (2018-present) and is an employee of Fidelity Investments (1998-present). Previously Mr. Burke served as head of Asset Management Investment Operations (2012-2018).
William C. Coffey (1969)
Year of Election or Appointment: 2009
Assistant Secretary
Mr. Coffey also serves as Assistant Secretary of other funds. He is Senior Vice President and Deputy General Counsel of FMR LLC (diversified financial services company, 2010-present), and is an employee of Fidelity Investments. Previously, Mr. Coffey served as Vice President and Associate General Counsel of FMR LLC (2005-2009).
Timothy M. Cohen (1969)
Year of Election or Appointment: 2018
Vice President
Mr. Cohen also serves as Vice President of other funds. Mr. Cohen serves as Co-Head of Global Equity Research (2016-present), a Director of Fidelity Management & Research (Japan) Limited (investment adviser firm, 2016-present), and is an employee of Fidelity Investments. Previously, Mr. Cohen served as Chief Investment Officer - Equity and a Director of Fidelity Management & Research (U.K.) Inc. (investment adviser firm, 2013-2015) and as a Director of Fidelity Management & Research (Hong Kong) Limited (investment adviser firm, 2017).
Jonathan Davis (1968)
Year of Election or Appointment: 2010
Assistant Treasurer
Mr. Davis also serves as Assistant Treasurer of other funds. Mr. Davis serves as Assistant Treasurer of FMR Capital, Inc. (2017-present) and is an employee of Fidelity Investments. Previously, Mr. Davis served as Vice President and Associate General Counsel of FMR LLC (diversified financial services company, 2003-2010).
Adrien E. Deberghes (1967)
Year of Election or Appointment: 2016
Assistant Treasurer
Mr. Deberghes also serves as an officer of other funds. He serves as Assistant Treasurer of FMR Capital, Inc. (2017-present), Executive Vice President of Fidelity Investments Money Management, Inc. (FIMM) (investment adviser firm, 2016-present), and is an employee of Fidelity Investments (2008-present). Previously, Mr. Deberghes served as President and Treasurer of certain Fidelity® funds (2013-2018). Prior to joining Fidelity Investments, Mr. Deberghes was Senior Vice President of Mutual Fund Administration at State Street Corporation (2007-2008), Senior Director of Mutual Fund Administration at Investors Bank & Trust (2005-2007), and Director of Finance for Dunkin' Brands (2000-2005). Previously, Mr. Deberghes served in other fund officer roles.
Laura M. Del Prato (1964)
Year of Election or Appointment: 2018
Assistant Treasurer
Ms. Del Prato also serves as an officer of other funds. Ms. Del Prato is an employee of Fidelity Investments (2017-present). Prior to joining Fidelity Investments, Ms. Del Prato served as a Managing Director and Treasurer of the JPMorgan Mutual Funds (2014-2017). Prior to JPMorgan, Ms. Del Prato served as a partner at Cohen Fund Audit Services (accounting firm, 2012-2013) and KPMG LLP (accounting firm, 2004-2012).
Colm A. Hogan (1973)
Year of Election or Appointment: 2016
Deputy Treasurer
Mr. Hogan also serves as an officer of other funds. Mr. Hogan serves as Assistant Treasurer of FMR Capital, Inc. (2017-present) and is an employee of Fidelity Investments (2005-present). Previously, Mr. Hogan served as Assistant Treasurer of certain Fidelity® funds (2016-2018).
Pamela R. Holding (1964)
Year of Election or Appointment: 2018
Vice President
Ms. Holding also serves as a Vice President of other funds. Ms. Holding serves as Co-Head of Global Equity Research (2018-present) and is an employee of Fidelity Investments (2013-present).
Chris Maher (1972)
Year of Election or Appointment: 2013
Assistant Treasurer
Mr. Maher serves as Assistant Treasurer of other funds. Mr. Maher is Vice President of Valuation Oversight, serves as Assistant Treasurer of FMR Capital, Inc. (2017-present), and is an employee of Fidelity Investments. Previously, Mr. Maher served as Vice President of Asset Management Compliance (2013), Vice President of the Program Management Group of FMR (investment adviser firm, 2010-2013), and Vice President of Valuation Oversight (2008-2010).
Rieco E. Mello (1969)
Year of Election or Appointment: 2017
Assistant Treasurer
Mr. Mello also serves as Assistant Treasurer of other funds. Mr. Mello serves as Assistant Treasurer of FMR Capital, Inc. (2017-present) and is an employee of Fidelity Investments (1995-present).
Kenneth B. Robins (1969)
Year of Election or Appointment: 2016
Chief Compliance Officer
Mr. Robins also serves as an officer of other funds. Mr. Robins serves as Compliance Officer of Fidelity Management & Research Company and FMR Co., Inc. (investment adviser firms, 2016-present) and is an employee of Fidelity Investments (2004-present). Previously, Mr. Robins served as Executive Vice President of Fidelity Investments Money Management, Inc. (investment adviser firm, 2013-2016) and served in other fund officer roles.
Stacie M. Smith (1974)
Year of Election or Appointment: 2016
President and Treasurer
Ms. Smith also serves as an officer of other funds. Ms. Smith serves as Assistant Treasurer of FMR Capital, Inc. (2017-present), is an employee of Fidelity Investments (2009-present), and has served in other fund officer roles. Prior to joining Fidelity Investments, Ms. Smith served as Senior Audit Manager of Ernst & Young LLP (accounting firm, 1996-2009). Previously, Ms. Smith served as Assistant Treasurer (2013-2018) and Deputy Treasurer (2013-2016) of certain Fidelity® funds.
Marc L. Spector (1972)
Year of Election or Appointment: 2016
Assistant Treasurer
Mr. Spector also serves as an officer of other funds. Mr. Spector serves as Assistant Treasurer of FMR Capital, Inc. (2017-present) and is an employee of Fidelity Investments (2016-present). Prior to joining Fidelity Investments, Mr. Spector served as Director at the Siegfried Group (accounting firm, 2013-2016), and prior to Siegfried Group as audit senior manager at Deloitte & Touche (accounting firm, 2005-2013).
Renee Stagnone (1975)
Year of Election or Appointment: 2016
Assistant Treasurer
Ms. Stagnone also serves as an officer of other funds. Ms. Stagnone serves as Assistant Treasurer of FMR Capital, Inc. (2017-present) and is an employee of Fidelity Investments (1997-present). Previously, Ms. Stagnone served as Deputy Treasurer of certain Fidelity® funds (2013-2016).
Shareholder Expense Example
As a shareholder of the Fund, you incur two types of costs: (1) transaction costs and (2) ongoing costs, including other Fund expenses. This Example is intended to help you understand your ongoing costs (in dollars) of investing in the Fund and to compare these costs with the ongoing costs of investing in other mutual funds.
The Example is based on an investment of $1,000 invested at the beginning of the period and held for the entire period (January 1, 2018 to June 30, 2018).
Actual Expenses
The first line of the accompanying table provides information about actual account values and actual expenses. You may use the information in this line, together with the amount you invested, to estimate the expenses that you paid over the period. Simply divide your account value by $1,000.00 (for example, an $8,600 account value divided by $1,000.00 = 8.6), then multiply the result by the number in the first line under the heading entitled "Expenses Paid During Period" to estimate the expenses you paid on your account during this period. In addition, the Fund, as a shareholder in the underlying Fidelity Central Funds, will indirectly bear its pro-rata share of the fees and expenses incurred by the underlying Fidelity Central Funds. These fees and expenses are not included in the Fund's annualized expense ratio used to calculate the expense estimate in the table below.
Hypothetical Example for Comparison Purposes
The second line of the accompanying table provides information about hypothetical account values and hypothetical expenses based on the Fund's actual expense ratio and an assumed rate of return of 5% per year before expenses, which is not the Fund's actual return. The hypothetical account values and expenses may not be used to estimate the actual ending account balance or expenses you paid for the period. You may use this information to compare the ongoing costs of investing in the Fund and other funds. To do so, compare this 5% hypothetical example with the 5% hypothetical examples that appear in the shareholder reports of the other funds. In addition, the Fund, as a shareholder in the underlying Fidelity Central Funds, will indirectly bear its pro-rata share of the fees and expenses incurred by the underlying Fidelity Central Funds. These fees and expenses are not included in the Fund's annualized expense ratio used to calculate the expense estimate in the table below.
Please note that the expenses shown in the table are meant to highlight your ongoing costs only and do not reflect any transaction costs. Therefore, the second line of the table is useful in comparing ongoing costs only, and will not help you determine the relative total costs of owning different funds.
| | Annualized Expense Ratio-A | Beginning
Account Value
January 1, 2018 | Ending
Account Value
June 30, 2018 | Expenses Paid
During Period-B
January 1, 2018
to June 30, 2018 |
| Series Growth and Income | - %-C | | | |
| Actual | | $1,000.00 | $1,005.40 | $--D |
| Hypothetical-E | | $1,000.00 | $1,024.79 | $--D |
A Annualized expense ratio reflects expenses net of applicable fee waivers.
B Expenses are equal to the Fund's annualized expense ratio, multiplied by the average account value over the period, multiplied by 181/365 (to reflect the one-half year period).
C Amount represents less than .005%.
D Amount represents less than $.005.
E 5% return per year before expenses
Distributions (Unaudited)
The Board of Trustees of Fidelity Series Growth & Income Fund voted to pay on August 13, 2018, to shareholders of record at the opening of business on August 10, 2018, a distribution of $0.806 per share derived from capital gains realized from sales of portfolio securities.
The fund hereby designates as a capital gain dividend with respect to the taxable year ended June 30, 2018, $ 563,433,891, or, if subsequently determined to be different, the net capital gain of such year.
A total of 0.19% of the dividends distributed during the fiscal year was derived from interest on U.S. Government securities which is generally exempt from state income tax.
A percentage of the dividends distributed during the fiscal year for the fund qualify for the dividends–received deduction for corporate shareholders:
| | Series Growth & Income | Class F |
| Fidelity Series Growth & Income Fund | | |
| July 2017 | 100% | 100% |
| October 2017 | 70% | – |
| December 2017 | 64% | – |
| April 2018 | 100% | – |
| | | |
A percentage of the dividends distributed during the fiscal year for the fund may be taken into account as a dividend for purposes of the maximum rate under section 1(h)(11) of the Internal Revenue Code.
| | Series Growth & Income | Class F |
| Fidelity Series Growth & Income Fund | | |
| July 2017 | 100% | 100% |
| October 2017 | 81% | – |
| December 2017 | 75% | – |
| April 2018 | 100% | – |
| | | |
The fund will notify shareholders in January 2019 of amounts for use in preparing 2018 income tax returns.

Corporate Headquarters
245 Summer St.
Boston, MA 02210
www.fidelity.com
MHT-ANN-0818
1.951035.105
Fidelity® Fund
Annual Report June 30, 2018 |
|
Contents
To view a fund's proxy voting guidelines and proxy voting record for the 12-month period ended June 30, visit http://www.fidelity.com/proxyvotingresults or visit the Securities and Exchange Commission's (SEC) web site at http://www.sec.gov.
You may also call 1-800-544-8544 to request a free copy of the proxy voting guidelines.
Standard & Poor's, S&P and S&P 500 are registered service marks of The McGraw-Hill Companies, Inc. and have been licensed for use by Fidelity Distributors Corporation.
Other third-party marks appearing herein are the property of their respective owners.
All other marks appearing herein are registered or unregistered trademarks or service marks of FMR LLC or an affiliated company. © 2018 FMR LLC. All rights reserved.
This report and the financial statements contained herein are submitted for the general information of the shareholders of the Fund. This report is not authorized for distribution to prospective investors in the Fund unless preceded or accompanied by an effective prospectus.
A fund files its complete schedule of portfolio holdings with the SEC for the first and third quarters of each fiscal year on Form N-Q. Forms N-Q are available on the SEC’s web site at http://www.sec.gov. A fund's Forms N-Q may be reviewed and copied at the SEC’s Public Reference Room in Washington, DC. Information regarding the operation of the SEC's Public Reference Room may be obtained by calling 1-800-SEC-0330.
For a complete list of a fund's portfolio holdings, view the most recent holdings listing, semiannual report, or annual report on Fidelity's web site at http://www.fidelity.com, http://www.institutional.fidelity.com, or http://www.401k.com, as applicable.
NOT FDIC INSURED •MAY LOSE VALUE •NO BANK GUARANTEE
Neither the Fund nor Fidelity Distributors Corporation is a bank.
Performance: The Bottom Line
Average annual total return reflects the change in the value of an investment, assuming reinvestment of distributions from dividend income and capital gains (the profits earned upon the sale of securities that have grown in value, if any) and assuming a constant rate of performance each year. The hypothetical investment and the average annual total returns do not reflect the deduction of taxes that a shareholder would pay on fund distributions or the redemption of fund shares. During periods of reimbursement by Fidelity, a fund’s total return will be greater than it would be had the reimbursement not occurred. How a fund did yesterday is no guarantee of how it will do tomorrow.
Average Annual Total Returns
| For the periods ended June 30, 2018 | Past 1 year | Past 5 years | Past 10 years |
| Fidelity® Fund | 17.51% | 12.74% | 8.30% |
$10,000 Over 10 Years
Let's say hypothetically that $10,000 was invested in Fidelity® Fund, a class of the fund, on June 30, 2008.
The chart shows how the value of your investment would have changed, and also shows how the S&P 500® Index performed over the same period.

| Period Ending Values |
| $22,207 | Fidelity® Fund |
| $26,340 | S&P 500® Index |
Management's Discussion of Fund Performance
Market Recap: The U.S. equity bellwether S&P 500
® index gained 14.37% for the 12 months ending June 30, 2018, despite a resurgence in volatility that challenged the multiyear bull market. The steady growth seen throughout 2017 extended into the new year, as investors remained upbeat on hopes of continued strong economic and earnings growth. Stocks surged 5.73% in January alone. February was a decidedly different story, though, as volatility spiked amid fear that rising inflation and the potential for the economy to overheat would prompt the U.S. Federal Reserve to pick up the pace of interest rate hikes. The index returned -3.69% for the month, its first negative result since October 2016, and lost further ground in March on fear of a global trade war. The market stabilized in April and went on to achieve a solid gain for May. The uptrend continued through roughly mid-June, when escalating trade tension between the U.S. and China soured investor sentiment, and the index ended the 12 months with a two-week slump. By sector, information technology (+31%) led the way, rising on strong earnings growth from several major index constituents. Consumer discretionary (+24%) also stood out, largely driven by retailers (+50%). Energy gained 21% alongside higher oil prices. Notable laggards included some defensive groups – consumer staples (-4%), telecommunication services (+1%) and utilities (+3%) – that struggled amid rising interest rates and a general preference for risk.
Comments from Portfolio Manager Jean Park: For the fiscal year, the fund's share classes gained about 18%, solidly outpacing the benchmark S&P 500
® index. In a strong up market for large-caps, both stock and market selection drove the fund's outperformance of the benchmark. Security selection was strongest in financials, industrials, energy and consumer staples, while a meaningful overweighting in information technology also helped, especially within software & services. Avoiding poor-performing benchmark component General Electric was the largest relative contributor. From my perspective, the industrial conglomerate's free-cash-flow (FCF) yield was not very attractive and did not fit my investment criteria. Elsewhere, Amazon.com and Microsoft, both of which offer market-leading cloud-computing services, also contributed. Amazon executed very well, expanding its already-high earnings multiple. As such, I pared the fund's position to take some gains, but it remained a sizable holding as of June 30. For Microsoft, expectations were moderate coming into the period, so I believed the stock had more room to grow as investors anticipated improved results. Conversely, stock picking in consumer discretionary was the biggest drag on our relative result. Here, not owning video-streaming service provider Netflix, whose shares gained 162% the past year, was the fund's largest relative detractor. While I do believe Netflix's products are very strong, the company had negative FCF and failed to meet one of my key investment criteria.
The views expressed above reflect those of the portfolio manager(s) only through the end of the period as stated on the cover of this report and do not necessarily represent the views of Fidelity or any other person in the Fidelity organization. Any such views are subject to change at any time based upon market or other conditions and Fidelity disclaims any responsibility to update such views. These views may not be relied on as investment advice and, because investment decisions for a Fidelity fund are based on numerous factors, may not be relied on as an indication of trading intent on behalf of any Fidelity fund.
Investment Summary (Unaudited)
Top Ten Stocks as of June 30, 2018
| | % of fund's net assets |
| Microsoft Corp. | 5.3 |
| Apple, Inc. | 4.8 |
| Alphabet, Inc. Class A | 4.2 |
| JPMorgan Chase & Co. | 4.1 |
| Amazon.com, Inc. | 3.7 |
| Bank of America Corp. | 3.3 |
| UnitedHealth Group, Inc. | 2.9 |
| Facebook, Inc. Class A | 2.7 |
| Raytheon Co. | 1.9 |
| Visa, Inc. Class A | 1.8 |
| | 34.7 |
Top Five Market Sectors as of June 30, 2018
| | % of fund's net assets |
| Information Technology | 32.1 |
| Financials | 18.0 |
| Health Care | 16.2 |
| Consumer Discretionary | 12.0 |
| Industrials | 8.0 |
Asset Allocation (% of fund's net assets)
| As of June 30, 2018* |
| | Stocks | 98.4% |
| | Short-Term Investments and Net Other Assets (Liabilities) | 1.6% |

* Foreign investments - 1.0%
Schedule of Investments June 30, 2018
Showing Percentage of Net Assets
| Common Stocks - 98.4% | | | |
| | | Shares | Value (000s) |
| CONSUMER DISCRETIONARY - 12.0% | | | |
| Auto Components - 1.0% | | | |
| Aptiv PLC | | 317,415 | $29,085 |
| Lear Corp. | | 78,000 | 14,493 |
| | | | 43,578 |
| Hotels, Restaurants & Leisure - 2.0% | | | |
| Domino's Pizza, Inc. | | 49,800 | 14,052 |
| Hilton Grand Vacations, Inc. (a) | | 370,000 | 12,839 |
| Vail Resorts, Inc. | | 17,000 | 4,661 |
| Wyndham Destinations, Inc. | | 580,000 | 25,677 |
| Wyndham Hotels & Resorts, Inc. | | 612,000 | 36,004 |
| | | | 93,233 |
| Household Durables - 0.5% | | | |
| Lennar Corp. Class A | | 470,055 | 24,678 |
| Internet & Direct Marketing Retail - 4.9% | | | |
| Amazon.com, Inc. (a) | | 98,100 | 166,750 |
| The Booking Holdings, Inc. (a) | | 27,300 | 55,340 |
| | | | 222,090 |
| Media - 0.9% | | | |
| Comcast Corp. Class A | | 1,200,000 | 39,372 |
| Specialty Retail - 2.7% | | | |
| Home Depot, Inc. | | 389,000 | 75,894 |
| Lowe's Companies, Inc. | | 510,000 | 48,741 |
| | | | 124,635 |
|
| TOTAL CONSUMER DISCRETIONARY | | | 547,586 |
|
| CONSUMER STAPLES - 4.1% | | | |
| Beverages - 0.5% | | | |
| Brown-Forman Corp. Class B (non-vtg.) | | 110,000 | 5,391 |
| PepsiCo, Inc. | | 180,000 | 19,597 |
| | | | 24,988 |
| Food & Staples Retailing - 2.4% | | | |
| Costco Wholesale Corp. | | 238,000 | 49,737 |
| Walmart, Inc. | | 699,900 | 59,946 |
| | | | 109,683 |
| Personal Products - 0.7% | | | |
| Estee Lauder Companies, Inc. Class A | | 231,900 | 33,090 |
| Tobacco - 0.5% | | | |
| Philip Morris International, Inc. | | 280,000 | 22,607 |
|
| TOTAL CONSUMER STAPLES | | | 190,368 |
|
| ENERGY - 2.8% | | | |
| Oil, Gas & Consumable Fuels - 2.8% | | | |
| ConocoPhillips Co. | | 700,000 | 48,734 |
| Phillips 66 Co. | | 233,000 | 26,168 |
| Valero Energy Corp. | | 465,000 | 51,536 |
| | | | 126,438 |
| FINANCIALS - 18.0% | | | |
| Banks - 10.3% | | | |
| Bank of America Corp. | | 5,420,000 | 152,790 |
| Citigroup, Inc. | | 780,000 | 52,198 |
| JPMorgan Chase & Co. | | 1,776,000 | 185,059 |
| SunTrust Banks, Inc. | | 1,221,077 | 80,616 |
| | | | 470,663 |
| Capital Markets - 3.9% | | | |
| Ameriprise Financial, Inc. | | 253,000 | 35,390 |
| E*TRADE Financial Corp. (a) | | 423,000 | 25,871 |
| Morgan Stanley | | 500,075 | 23,704 |
| MSCI, Inc. | | 217,600 | 35,998 |
| S&P Global, Inc. | | 291,200 | 59,373 |
| | | | 180,336 |
| Insurance - 3.8% | | | |
| AFLAC, Inc. | | 1,674,000 | 72,015 |
| Allstate Corp. | | 680,000 | 62,064 |
| Marsh & McLennan Companies, Inc. | | 90,000 | 7,377 |
| Progressive Corp. | | 542,000 | 32,059 |
| | | | 173,515 |
|
| TOTAL FINANCIALS | | | 824,514 |
|
| HEALTH CARE - 16.2% | | | |
| Biotechnology - 3.8% | | | |
| AbbVie, Inc. | | 746,000 | 69,117 |
| Amgen, Inc. | | 257,000 | 47,440 |
| Celgene Corp. (a) | | 187,937 | 14,926 |
| Gilead Sciences, Inc. | | 580,000 | 41,087 |
| | | | 172,570 |
| Health Care Equipment & Supplies - 4.7% | | | |
| Baxter International, Inc. | | 495,000 | 36,551 |
| Becton, Dickinson & Co. | | 231,000 | 55,338 |
| Boston Scientific Corp. (a) | | 670,000 | 21,909 |
| Danaher Corp. | | 571,749 | 56,420 |
| Intuitive Surgical, Inc. (a) | | 57,000 | 27,273 |
| ResMed, Inc. | | 166,100 | 17,205 |
| | | | 214,696 |
| Health Care Providers & Services - 5.9% | | | |
| AmerisourceBergen Corp. | | 131,693 | 11,229 |
| Cigna Corp. | | 335,000 | 56,933 |
| Humana, Inc. | | 190,000 | 56,550 |
| McKesson Corp. | | 92,326 | 12,316 |
| UnitedHealth Group, Inc. | | 543,969 | 133,457 |
| | | | 270,485 |
| Life Sciences Tools & Services - 0.8% | | | |
| Agilent Technologies, Inc. | | 393,000 | 24,303 |
| Waters Corp. (a) | | 56,000 | 10,841 |
| | | | 35,144 |
| Pharmaceuticals - 1.0% | | | |
| Johnson & Johnson | | 310,000 | 37,615 |
| Zoetis, Inc. Class A | | 124,520 | 10,608 |
| | | | 48,223 |
|
| TOTAL HEALTH CARE | | | 741,118 |
|
| INDUSTRIALS - 8.0% | | | |
| Aerospace & Defense - 4.7% | | | |
| Huntington Ingalls Industries, Inc. | | 186,300 | 40,388 |
| Northrop Grumman Corp. | | 199,900 | 61,509 |
| Raytheon Co. | | 439,200 | 84,845 |
| The Boeing Co. | | 75,601 | 25,365 |
| | | | 212,107 |
| Building Products - 0.6% | | | |
| Masco Corp. | | 750,000 | 28,065 |
| Commercial Services & Supplies - 0.6% | | | |
| KAR Auction Services, Inc. | | 514,812 | 28,212 |
| Electrical Equipment - 0.7% | | | |
| Fortive Corp. | | 430,100 | 33,165 |
| Industrial Conglomerates - 0.9% | | | |
| 3M Co. | | 211,100 | 41,528 |
| Machinery - 0.5% | | | |
| Cummins, Inc. | | 168,100 | 22,357 |
|
| TOTAL INDUSTRIALS | | | 365,434 |
|
| INFORMATION TECHNOLOGY - 32.1% | | | |
| Electronic Equipment & Components - 1.3% | | | |
| Amphenol Corp. Class A | | 690,100 | 60,142 |
| Internet Software & Services - 7.7% | | | |
| Akamai Technologies, Inc. (a) | | 112,000 | 8,202 |
| Alphabet, Inc.: | | | |
| Class A (a) | | 171,000 | 193,091 |
| Class C (a) | | 25,000 | 27,891 |
| Facebook, Inc. Class A (a) | | 634,900 | 123,374 |
| | | | 352,558 |
| IT Services - 3.5% | | | |
| Adyen BV (b) | | 2,400 | 1,322 |
| DXC Technology Co. | | 155,059 | 12,499 |
| MasterCard, Inc. Class A | | 327,000 | 64,262 |
| Visa, Inc. Class A | | 630,000 | 83,444 |
| | | | 161,527 |
| Semiconductors & Semiconductor Equipment - 5.1% | | | |
| Applied Materials, Inc. | | 715,000 | 33,026 |
| Intel Corp. | | 1,435,000 | 71,334 |
| KLA-Tencor Corp. | | 151,000 | 15,482 |
| Lam Research Corp. | | 136,000 | 23,508 |
| Micron Technology, Inc. (a) | | 477,000 | 25,014 |
| ON Semiconductor Corp. (a) | | 200,000 | 4,447 |
| Texas Instruments, Inc. | | 534,800 | 58,962 |
| | | | 231,773 |
| Software - 9.7% | | | |
| Adobe Systems, Inc. (a) | | 260,000 | 63,391 |
| Check Point Software Technologies Ltd. (a) | | 141,041 | 13,777 |
| Citrix Systems, Inc. (a) | | 370,000 | 38,791 |
| Electronic Arts, Inc. (a) | | 233,000 | 32,858 |
| Microsoft Corp. | | 2,451,000 | 241,691 |
| Parametric Technology Corp. (a) | | 57,587 | 5,402 |
| Red Hat, Inc. (a) | | 113,000 | 15,184 |
| Take-Two Interactive Software, Inc. (a) | | 280,000 | 33,141 |
| | | | 444,235 |
| Technology Hardware, Storage & Peripherals - 4.8% | | | |
| Apple, Inc. | | 1,191,000 | 220,466 |
|
| TOTAL INFORMATION TECHNOLOGY | | | 1,470,701 |
|
| MATERIALS - 1.8% | | | |
| Chemicals - 1.8% | | | |
| DowDuPont, Inc. | | 250,000 | 16,480 |
| Sherwin-Williams Co. | | 53,400 | 21,764 |
| The Chemours Co. LLC | | 501,000 | 22,224 |
| Westlake Chemical Corp. | | 217,000 | 23,356 |
| | | | 83,824 |
| REAL ESTATE - 0.6% | | | |
| Equity Real Estate Investment Trusts (REITs) - 0.6% | | | |
| American Tower Corp. | | 202,000 | 29,122 |
| TELECOMMUNICATION SERVICES - 1.6% | | | |
| Diversified Telecommunication Services - 1.1% | | | |
| AT&T, Inc. | | 1,580,000 | 50,734 |
| Wireless Telecommunication Services - 0.5% | | | |
| T-Mobile U.S., Inc. (a) | | 387,500 | 23,153 |
|
| TOTAL TELECOMMUNICATION SERVICES | | | 73,887 |
|
| UTILITIES - 1.2% | | | |
| Electric Utilities - 1.2% | | | |
| NextEra Energy, Inc. | | 320,000 | 53,450 |
| TOTAL COMMON STOCKS | | | |
| (Cost $3,041,630) | | | 4,506,442 |
|
| Money Market Funds - 1.8% | | | |
| Fidelity Cash Central Fund, 1.93% (c) | | | |
| (Cost $82,716) | | 82,699,855 | 82,716 |
| TOTAL INVESTMENT IN SECURITIES - 100.2% | | | |
| (Cost $3,124,346) | | | 4,589,158 |
| NET OTHER ASSETS (LIABILITIES) - (0.2)% | | | (9,816) |
| NET ASSETS - 100% | | | $4,579,342 |
Legend
(a) Non-income producing
(b) Security exempt from registration under Rule 144A of the Securities Act of 1933. These securities may be resold in transactions exempt from registration, normally to qualified institutional buyers. At the end of the period, the value of these securities amounted to $1,322,000 or 0.0% of net assets.
(c) Affiliated fund that is generally available only to investment companies and other accounts managed by Fidelity Investments. The rate quoted is the annualized seven-day yield of the fund at period end. A complete unaudited listing of the fund's holdings as of its most recent quarter end is available upon request. In addition, each Fidelity Central Fund's financial statements, which are not covered by the Fund's Report of Independent Registered Public Accounting Firm, are available on the SEC's website or upon request.
Affiliated Central Funds
Information regarding fiscal year to date income earned by the Fund from investments in Fidelity Central Funds is as follows:
| Fund | Income earned |
| | (Amounts in thousands) |
| Fidelity Cash Central Fund | $1,274 |
| Fidelity Securities Lending Cash Central Fund | 5 |
| Total | $1,279 |
Amounts in the income column in the above table include any capital gain distributions from underlying funds, which are presented in the corresponding line-item in the Statement of Operations if applicable.
Investment Valuation
All investments are categorized as Level 1 under the Fair Value Hierarchy. The inputs or methodology used for valuing securities may not be an indication of the risk associated with investing in those securities. For more information on valuation inputs please refer to the Investment Valuation section in the accompanying Notes to Financial Statements.
See accompanying notes which are an integral part of the financial statements.
Financial Statements
Statement of Assets and Liabilities
| Amounts in thousands (except per-share amounts) | | June 30, 2018 |
| Assets | | |
Investment in securities, at value — See accompanying schedule:
Unaffiliated issuers (cost $3,041,630) | $4,506,442 | |
| Fidelity Central Funds (cost $82,716) | 82,716 | |
| Total Investment in Securities (cost $3,124,346) | | $4,589,158 |
| Cash | | 1 |
| Receivable for investments sold | | 16,034 |
| Receivable for fund shares sold | | 619 |
| Dividends receivable | | 1,844 |
| Distributions receivable from Fidelity Central Funds | | 116 |
| Other receivables | | 216 |
| Total assets | | 4,607,988 |
| Liabilities | | |
| Payable for investments purchased | $23,738 | |
| Payable for fund shares redeemed | 2,767 | |
| Accrued management fee | 1,292 | |
| Other affiliated payables | 589 | |
| Other payables and accrued expenses | 260 | |
| Total liabilities | | 28,646 |
| Net Assets | | $4,579,342 |
| Net Assets consist of: | | |
| Paid in capital | | $2,895,199 |
| Undistributed net investment income | | 19,707 |
| Accumulated undistributed net realized gain (loss) on investments and foreign currency transactions | | 199,640 |
| Net unrealized appreciation (depreciation) on investments and assets and liabilities in foreign currencies | | 1,464,796 |
| Net Assets | | $4,579,342 |
| Fidelity Fund: | | |
| Net Asset Value, offering price and redemption price per share ($4,129,146 ÷ 88,112 shares) | | $46.86 |
| Class K: | | |
| Net Asset Value, offering price and redemption price per share ($450,196 ÷ 9,607 shares) | | $46.86 |
See accompanying notes which are an integral part of the financial statements.
Statement of Operations
| Amounts in thousands | | Year ended June 30, 2018 |
| Investment Income | | |
| Dividends | | $67,227 |
| Interest | | 12 |
| Income from Fidelity Central Funds | | 1,279 |
| Total income | | 68,518 |
| Expenses | | |
| Management fee | $15,331 | |
| Transfer agent fees | 5,968 | |
| Accounting and security lending fees | 1,066 | |
| Custodian fees and expenses | 73 | |
| Independent trustees' fees and expenses | 20 | |
| Registration fees | 50 | |
| Audit | 77 | |
| Legal | 13 | |
| Miscellaneous | 34 | |
| Total expenses before reductions | 22,632 | |
| Expense reductions | (165) | |
| Total expenses after reductions | | 22,467 |
| Net investment income (loss) | | 46,051 |
| Realized and Unrealized Gain (Loss) | | |
| Net realized gain (loss) on: | | |
| Investment securities: | | |
| Unaffiliated issuers | 301,875 | |
| Foreign currency transactions | 11 | |
| Futures contracts | 3,143 | |
| Total net realized gain (loss) | | 305,029 |
| Change in net unrealized appreciation (depreciation) on: | | |
| Investment securities: | | |
| Unaffiliated issuers | 389,195 | |
| Assets and liabilities in foreign currencies | 4 | |
| Futures contracts | 389 | |
| Total change in net unrealized appreciation (depreciation) | | 389,588 |
| Net gain (loss) | | 694,617 |
| Net increase (decrease) in net assets resulting from operations | | $740,668 |
See accompanying notes which are an integral part of the financial statements.
Statement of Changes in Net Assets
| Amounts in thousands | Year ended June 30, 2018 | Year ended June 30, 2017 |
| Increase (Decrease) in Net Assets | | |
| Operations | | |
| Net investment income (loss) | $46,051 | $46,426 |
| Net realized gain (loss) | 305,029 | 514,093 |
| Change in net unrealized appreciation (depreciation) | 389,588 | 31,250 |
| Net increase (decrease) in net assets resulting from operations | 740,668 | 591,769 |
| Distributions to shareholders from net investment income | (45,244) | (45,768) |
| Distributions to shareholders from net realized gain | (472,239) | (254,005) |
| Total distributions | (517,483) | (299,773) |
| Share transactions - net increase (decrease) | (90,479) | (302,961) |
| Total increase (decrease) in net assets | 132,706 | (10,965) |
| Net Assets | | |
| Beginning of period | 4,446,636 | 4,457,601 |
| End of period | $4,579,342 | $4,446,636 |
| Other Information | | |
| Undistributed net investment income end of period | $19,707 | $20,009 |
See accompanying notes which are an integral part of the financial statements.
Financial Highlights
Fidelity Fund
| Years ended June 30, | 2018 | 2017 | 2016 | 2015 | 2014 |
| Selected Per–Share Data | | | | | |
| Net asset value, beginning of period | $44.92 | $42.04 | $44.69 | $45.42 | $39.77 |
| Income from Investment Operations | | | | | |
| Net investment income (loss)A | .45 | .44 | .38 | .34 | .35 |
| Net realized and unrealized gain (loss) | 6.74 | 5.33 | (.73) | 3.91 | 8.61 |
| Total from investment operations | 7.19 | 5.77 | (.35) | 4.25 | 8.96 |
| Distributions from net investment income | (.45) | (.44) | (.31) | (.30) | (.32) |
| Distributions from net realized gain | (4.80) | (2.45) | (1.99) | (4.68) | (2.98) |
| Total distributions | (5.25) | (2.89) | (2.30) | (4.98) | (3.31)B |
| Net asset value, end of period | $46.86 | $44.92 | $42.04 | $44.69 | $45.42 |
| Total ReturnC | 17.51% | 14.34% | (.83)% | 10.52% | 23.70% |
| Ratios to Average Net AssetsD,E | | | | | |
| Expenses before reductions | .50% | .52% | .52% | .52% | .53% |
| Expenses net of fee waivers, if any | .50% | .52% | .52% | .52% | .53% |
| Expenses net of all reductions | .50% | .51% | .52% | .52% | .53% |
| Net investment income (loss) | .99% | 1.04% | .91% | .79% | .82% |
| Supplemental Data | | | | | |
| Net assets, end of period (in millions) | $4,129 | $3,884 | $3,762 | $4,143 | $4,811 |
| Portfolio turnover rateF | 38% | 82% | 67% | 59%G | 93% |
A Calculated based on average shares outstanding during the period.
B Total distributions of $3.31 per share is comprised of distributions from net investment income of $.324 and distributions from net realized gain of $2.984 per share.
C Total returns would have been lower if certain expenses had not been reduced during the applicable periods shown.
D Fees and expenses of any underlying Fidelity Central Funds are not included in the Fund's expense ratio. The Fund indirectly bears its proportionate share of the expenses of any underlying Fidelity Central Funds.
E Expense ratios reflect operating expenses of the class. Expenses before reductions do not reflect amounts reimbursed by the investment adviser or reductions from brokerage service arrangements or reductions from other expense offset arrangements and do not represent the amount paid by the class during periods when reimbursements or reductions occur. Expenses net of fee waivers reflect expenses after reimbursement by the investment adviser but prior to reductions from brokerage service arrangements or other expense offset arrangements. Expenses net of all reductions represent the net expenses paid by the class.
F Amount does not include the portfolio activity of any underlying Fidelity Central Funds.
G Portfolio turnover rate excludes securities received or delivered in-kind.
See accompanying notes which are an integral part of the financial statements.
Fidelity Fund Class K
| Years ended June 30, | 2018 | 2017 | 2016 | 2015 | 2014 |
| Selected Per–Share Data | | | | | |
| Net asset value, beginning of period | $44.92 | $42.04 | $44.69 | $45.42 | $39.78 |
| Income from Investment Operations | | | | | |
| Net investment income (loss)A | .49 | .49 | .42 | .39 | .40 |
| Net realized and unrealized gain (loss) | 6.74 | 5.32 | (.72) | 3.91 | 8.60 |
| Total from investment operations | 7.23 | 5.81 | (.30) | 4.30 | 9.00 |
| Distributions from net investment income | (.49) | (.48) | (.36) | (.35) | (.38) |
| Distributions from net realized gain | (4.80) | (2.45) | (1.99) | (4.68) | (2.98) |
| Total distributions | (5.29) | (2.93) | (2.35) | (5.03) | (3.36) |
| Net asset value, end of period | $46.86 | $44.92 | $42.04 | $44.69 | $45.42 |
| Total ReturnB | 17.63% | 14.46% | (.72)% | 10.65% | 23.83% |
| Ratios to Average Net AssetsC,D | | | | | |
| Expenses before reductions | .41% | .41% | .41% | .41% | .41% |
| Expenses net of fee waivers, if any | .41% | .41% | .41% | .41% | .41% |
| Expenses net of all reductions | .40% | .41% | .41% | .41% | .41% |
| Net investment income (loss) | 1.08% | 1.14% | 1.02% | .90% | .94% |
| Supplemental Data | | | | | |
| Net assets, end of period (in millions) | $450 | $563 | $696 | $952 | $1,119 |
| Portfolio turnover rateE | 38% | 82% | 67% | 59%F | 93% |
A Calculated based on average shares outstanding during the period.
B Total returns would have been lower if certain expenses had not been reduced during the applicable periods shown.
C Fees and expenses of any underlying Fidelity Central Funds are not included in the Fund's expense ratio. The Fund indirectly bears its proportionate share of the expenses of any underlying Fidelity Central Funds.
D Expense ratios reflect operating expenses of the class. Expenses before reductions do not reflect amounts reimbursed by the investment adviser or reductions from brokerage service arrangements or reductions from other expense offset arrangements and do not represent the amount paid by the class during periods when reimbursements or reductions occur. Expenses net of fee waivers reflect expenses after reimbursement by the investment adviser but prior to reductions from brokerage service arrangements or other expense offset arrangements. Expenses net of all reductions represent the net expenses paid by the class.
E Amount does not include the portfolio activity of any underlying Fidelity Central Funds.
F Portfolio turnover rate excludes securities received or delivered in-kind.
See accompanying notes which are an integral part of the financial statements.
Notes to Financial Statements
For the period ended June 30, 2018
(Amounts in thousands except percentages)
1. Organization.
Fidelity Fund (the Fund) is a fund of Fidelity Hastings Street Trust (the Trust) and is authorized to issue an unlimited number of shares. The Trust is registered under the Investment Company Act of 1940, as amended (the 1940 Act), as an open-end management investment company organized as a Massachusetts business trust. The Fund offers Fidelity Fund and Class K shares, each of which has equal rights as to assets and voting privileges. Each class has exclusive voting rights with respect to matters that affect that class.
2. Investments in Fidelity Central Funds.
The Fund invests in Fidelity Central Funds, which are open-end investment companies generally available only to other investment companies and accounts managed by the investment adviser and its affiliates. The Fund's Schedule of Investments lists each of the Fidelity Central Funds held as of period end, if any, as an investment of the Fund, but does not include the underlying holdings of each Fidelity Central Fund. As an Investing Fund, the Fund indirectly bears its proportionate share of the expenses of the underlying Fidelity Central Funds.
The Money Market Central Funds seek preservation of capital and current income and are managed by Fidelity Investments Money Management, Inc. (FIMM), an affiliate of the investment adviser. Annualized expenses of the Money Market Central Funds as of their most recent shareholder report date are less than .005%.
A complete unaudited list of holdings for each Fidelity Central Fund is available upon request or at the Securities and Exchange Commission (the SEC) website at www.sec.gov. In addition, the financial statements of the Fidelity Central Funds, which are not covered by the Fund's Report of Independent Registered Public Accounting Firm, are available on the SEC website or upon request.
3. Significant Accounting Policies.
The Fund is an investment company and applies the accounting and reporting guidance of the Financial Accounting Standards Board (FASB) Accounting Standards Codification Topic 946 Financial Services – Investments Companies. The financial statements have been prepared in conformity with accounting principles generally accepted in the United States of America (GAAP), which require management to make certain estimates and assumptions at the date of the financial statements. Actual results could differ from those estimates. Subsequent events, if any, through the date that the financial statements were issued have been evaluated in the preparation of the financial statements. The following summarizes the significant accounting policies of the Fund:
Investment Valuation. Investments are valued as of 4:00 p.m. Eastern time on the last calendar day of the period. The Board of Trustees (the Board) has delegated the day to day responsibility for the valuation of the Fund's investments to the Fair Value Committee (the Committee) established by the Fund's investment adviser. In accordance with valuation policies and procedures approved by the Board, the Fund attempts to obtain prices from one or more third party pricing vendors or brokers to value its investments. When current market prices, quotations or currency exchange rates are not readily available or reliable, investments will be fair valued in good faith by the Committee, in accordance with procedures adopted by the Board. Factors used in determining fair value vary by investment type and may include market or investment specific events. The frequency with which these procedures are used cannot be predicted and they may be utilized to a significant extent. The Committee oversees the Fund's valuation policies and procedures and reports to the Board on the Committee's activities and fair value determinations. The Board monitors the appropriateness of the procedures used in valuing the Fund's investments and ratifies the fair value determinations of the Committee.
The Fund categorizes the inputs to valuation techniques used to value its investments into a disclosure hierarchy consisting of three levels as shown below:
- Level 1 – quoted prices in active markets for identical investments
- Level 2 – other significant observable inputs (including quoted prices for similar investments, interest rates, prepayment speeds, etc.)
- Level 3 – unobservable inputs (including the Fund's own assumptions based on the best information available)
Valuation techniques used to value the Fund's investments by major category are as follows:
Equity securities, including restricted securities, for which market quotations are readily available, are valued at the last reported sale price or official closing price as reported by a third party pricing vendor on the primary market or exchange on which they are traded and are categorized as Level 1 in the hierarchy. In the event there were no sales during the day or closing prices are not available, securities are valued at the last quoted bid price or may be valued using the last available price and are generally categorized as Level 2 in the hierarchy. For foreign equity securities, when market or security specific events arise, comparisons to the valuation of American Depositary Receipts (ADRs), futures contracts, Exchange-Traded Funds (ETFs) and certain indexes as well as quoted prices for similar securities may be used and would be categorized as Level 2 in the hierarchy. Utilizing these techniques may result in transfers between Level 1 and Level 2. For equity securities, including restricted securities, where observable inputs are limited, assumptions about market activity and risk are used and these securities may be categorized as Level 3 in the hierarchy.
Investments in open-end mutual funds, including the Fidelity Central Funds, are valued at their closing net asset value (NAV) each business day and are categorized as Level 1 in the hierarchy.
Changes in valuation techniques may result in transfers in or out of an assigned level within the disclosure hierarchy.
Foreign Currency. The Fund may use foreign currency contracts to facilitate transactions in foreign-denominated securities. Gains and losses from these transactions may arise from changes in the value of the foreign currency or if the counterparties do not perform under the contracts' terms.
Foreign-denominated assets, including investment securities, and liabilities are translated into U.S. dollars at the exchange rates at period end. Purchases and sales of investment securities, income and dividends received and expenses denominated in foreign currencies are translated into U.S. dollars at the exchange rate in effect on the transaction date.
The effects of exchange rate fluctuations on investments are included with the net realized and unrealized gain (loss) on investment securities. Other foreign currency transactions resulting in realized and unrealized gain (loss) are disclosed separately.
Investment Transactions and Income. For financial reporting purposes, the Fund's investment holdings and NAV include trades executed through the end of the last business day of the period. The NAV per share for processing shareholder transactions is calculated as of the close of business of the New York Stock Exchange (NYSE), normally 4:00 p.m. Eastern time and includes trades executed through the end of the prior business day. Gains and losses on securities sold are determined on the basis of identified cost and include proceeds received from litigation. Dividend income is recorded on the ex-dividend date, except for certain dividends from foreign securities where the ex-dividend date may have passed, which are recorded as soon as the Fund is informed of the ex-dividend date. Non-cash dividends included in dividend income, if any, are recorded at the fair market value of the securities received. Income and capital gain distributions from Fidelity Central Funds, if any, are recorded on the ex-dividend date. Certain distributions received by the Fund represent a return of capital or capital gain. The Fund determines the components of these distributions subsequent to the ex-dividend date, based upon receipt of tax filings or other correspondence relating to the underlying investment. These distributions are recorded as a reduction of cost of investments and/or as a realized gain. Interest income is accrued as earned and includes coupon interest and amortization of premium and accretion of discount on debt securities as applicable. Investment income is recorded net of foreign taxes withheld where recovery of such taxes is uncertain.
Class Allocations and Expenses. Investment income, realized and unrealized capital gains and losses, common expenses of the Fund, and certain fund-level expense reductions, if any, are allocated daily on a pro-rata basis to each class based on the relative net assets of each class to the total net assets of the Fund. Each class differs with respect to transfer agent fees incurred. Certain expense reductions may also differ by class. For the reporting period, the allocated portion of income and expenses to each class as a percent of its average net assets may vary due to the timing of recording these transactions in relation to fluctuating net assets of the classes. Expenses directly attributable to a fund are charged to that fund. Expenses attributable to more than one fund are allocated among the respective funds on the basis of relative net assets or other appropriate methods. Expense estimates are accrued in the period to which they relate and adjustments are made when actual amounts are known.
Deferred Trustee Compensation. Under a Deferred Compensation Plan (the Plan), certain independent Trustees have elected to defer receipt of a portion of their annual compensation. Deferred amounts are invested in a cross-section of Fidelity funds, are marked-to-market and remain in the Fund until distributed in accordance with the Plan. The investment of deferred amounts and the offsetting payable to the Trustees of $176 are included in the accompanying Statement of Assets and Liabilities in other receivables and other payables and accrued expenses, respectively.
Income Tax Information and Distributions to Shareholders. Each year, the Fund intends to qualify as a regulated investment company under Subchapter M of the Internal Revenue Code, including distributing substantially all of its taxable income and realized gains. As a result, no provision for U.S. Federal income taxes is required. As of June 30, 2018, the Fund did not have any unrecognized tax benefits in the financial statements; nor is the Fund aware of any tax positions for which it is reasonably possible that the total amounts of unrecognized tax benefits will significantly change in the next twelve months. The Fund files a U.S. federal tax return, in addition to state and local tax returns as required. The Fund's federal income tax returns are subject to examination by the Internal Revenue Service (IRS) for a period of three fiscal years after they are filed. State and local tax returns may be subject to examination for an additional fiscal year depending on the jurisdiction. Foreign taxes are provided for based on the Fund's understanding of the tax rules and rates that exist in the foreign markets in which it invests.
Distributions are declared and recorded on the ex-dividend date. Income and capital gain distributions are declared separately for each class. Income and capital gain distributions are determined in accordance with income tax regulations, which may differ from GAAP. In addition, the Fund claimed a portion of the payment made to redeeming shareholders as a distribution for income tax purposes.
Capital accounts within the financial statements are adjusted for permanent book-tax differences. These adjustments have no impact on net assets or the results of operations. Capital accounts are not adjusted for temporary book-tax differences which will reverse in a subsequent period.
Book-tax differences are primarily due to futures contracts, foreign currency transactions, passive foreign investment companies (PFIC), market discount, partnerships, deferred trustees compensation and losses deferred due to wash sales.
As of period end, the cost and unrealized appreciation (depreciation) in securities, and derivatives if applicable, for federal income tax purposes were as follows:
| Gross unrealized appreciation | $1,512,246 |
| Gross unrealized depreciation | (51,056) |
| Net unrealized appreciation (depreciation) | $1,461,190 |
| Tax Cost | $3,127,968 |
The tax-based components of distributable earnings as of period end were as follows:
| Undistributed ordinary income | $19,883 |
| Undistributed long-term capital gain | $203,262 |
| Net unrealized appreciation (depreciation) on securities and other investments | $1,461,174 |
The tax character of distributions paid was as follows:
| | June 30, 2018 | June 30, 2017 |
| Ordinary Income | $45,244 | $ 45,768 |
| Long-term Capital Gains | 472,239 | 254,005 |
| Total | $517,483 | $ 299,773 |
Restricted Securities. The Fund may invest in securities that are subject to legal or contractual restrictions on resale. These securities generally may be resold in transactions exempt from registration or to the public if the securities are registered. Disposal of these securities may involve time-consuming negotiations and expense, and prompt sale at an acceptable price may be difficult. Information regarding restricted securities is included at the end of the Fund's Schedule of Investments.
4. Derivative Instruments.
Risk Exposures and the Use of Derivative Instruments. The Fund's investment objective allows the Fund to enter into various types of derivative contracts, including futures contracts. Derivatives are investments whose value is primarily derived from underlying assets, indices or reference rates and may be transacted on an exchange or over-the-counter (OTC). Derivatives may involve a future commitment to buy or sell a specified asset based on specified terms, to exchange future cash flows at periodic intervals based on a notional principal amount, or for one party to make one or more payments upon the occurrence of specified events in exchange for periodic payments from the other party.
The Fund used derivatives to increase returns and to manage exposure to certain risks as defined below. The success of any strategy involving derivatives depends on analysis of numerous economic factors, and if the strategies for investment do not work as intended, the Fund may not achieve its objectives.
The Fund's use of derivatives increased or decreased its exposure to the following risk:
| Equity Risk | Equity risk relates to the fluctuations in the value of financial instruments as a result of changes in market prices (other than those arising from interest rate risk or foreign exchange risk), whether caused by factors specific to an individual investment, its issuer, or all factors affecting all instruments traded in a market or market segment.
|
The Fund is also exposed to additional risks from investing in derivatives, such as liquidity risk and counterparty credit risk. Liquidity risk is the risk that the Fund will be unable to close out the derivative in the open market in a timely manner. Counterparty credit risk is the risk that the counterparty will not be able to fulfill its obligation to the Fund. Counterparty credit risk related to exchange-traded futures contracts may be mitigated by the protection provided by the exchange on which they trade.
Investing in derivatives may involve greater risks than investing in the underlying assets directly and, to varying degrees, may involve risk of loss in excess of any initial investment and collateral received and amounts recognized in the Statement of Assets and Liabilities. In addition, there may be the risk that the change in value of the derivative contract does not correspond to the change in value of the underlying instrument.
Futures Contracts. A futures contract is an agreement between two parties to buy or sell a specified underlying instrument for a fixed price at a specified future date. The Fund used futures contracts to manage its exposure to the stock market.
Upon entering into a futures contract, a fund is required to deposit either cash or securities (initial margin) with a clearing broker in an amount equal to a certain percentage of the face value of the contract. Futures contracts are marked-to-market daily and subsequent daily payments (variation margin) are made or received by a fund depending on the daily fluctuations in the value of the futures contracts and are recorded as unrealized appreciation or (depreciation). This receivable and/or payable, if any, is included in daily variation margin on futures contracts in the Statement of Assets and Liabilities. Realized gain or (loss) is recorded upon the expiration or closing of a futures contract. The net realized gain (loss) and change in net unrealized appreciation (depreciation) on futures contracts during the period is presented in the Statement of Operations.
Any open futures contracts at period end are presented in the Schedule of Investments under the caption "Futures Contracts". The notional amount at value reflects each contract's exposure to the underlying instrument or index at period end.
5. Purchases and Sales of Investments.
Purchases and sales of securities, other than short-term securities, aggregated $1,691,142 and $2,216,091, respectively.
6. Fees and Other Transactions with Affiliates.
Management Fee. Fidelity Management & Research Company (the investment adviser) and its affiliates provide the Fund with investment management related services for which the Fund pays a monthly management fee. The management fee is the sum of an individual fund fee rate that is based on an annual rate of .09% of the Fund's average net assets and an annualized group fee rate that averaged .24% during the period. The group fee rate is based upon the average net assets of all the mutual funds advised by the investment adviser, including any mutual funds previously advised by the investment adviser that are currently advised by Fidelity SelectCo, LLC, an affiliate of the investment adviser. The group fee rate decreases as assets under management increase and increases as assets under management decrease. For the reporting period, the total annual management fee rate was .33% of the Fund's average net assets.
Transfer Agent Fees. Fidelity Investments Institutional Operations Company, Inc., (FIIOC), an affiliate of the investment adviser, is the transfer, dividend disbursing and shareholder servicing agent for each class of the Fund. FIIOC receives account fees and asset-based fees that vary according to the account size and type of account of the shareholders of Fidelity Fund, except for Class K. FIIOC receives an asset-based fee of Class K's average net assets. FIIOC pays for typesetting, printing and mailing of shareholder reports, except proxy statements.
For the period, transfer agent fees for each class were as follows:
| | Amount | % of Class-Level Average Net Assets |
| Fidelity Fund | $5,741 | .14 |
| Class K | 227 | .05 |
| | $5,968 | |
Accounting and Security Lending Fees. Fidelity Service Company, Inc. (FSC), an affiliate of the investment adviser, maintains the Fund's accounting records. The accounting fee is based on the level of average net assets for each month. Under a separate contract, FSC administers the security lending program. The security lending fee is based on the number and duration of lending transactions. For the period, the fees were equivalent to an annual rate of .02%.
Brokerage Commissions. The Fund placed a portion of its portfolio transactions with brokerage firms which are affiliates of the investment adviser. Brokerage commissions are included in net realized gain (loss) and change in net unrealized appreciation (depreciation) in the Statement of Operations. The commissions paid to these affiliated firms were $41 for the period.
Interfund Trades. The Fund may purchase from or sell securities to other Fidelity Funds under procedures adopted by the Board. The procedures have been designed to ensure these interfund trades are executed in accordance with Rule 17a-7 of the 1940 Act. Interfund trades are included within the respective purchases and sales amounts shown in the Purchases and Sales of Investments note.
7. Committed Line of Credit.
The Fund participates with other funds managed by the investment adviser or an affiliate in a $4.25 billion credit facility (the "line of credit") to be utilized for temporary or emergency purposes to fund shareholder redemptions or for other short-term liquidity purposes. The Fund has agreed to pay commitment fees on its pro-rata portion of the line of credit, which amounted to $13 and is reflected in Miscellaneous expenses on the Statement of Operations. During the period, the Fund did not borrow on this line of credit.
8. Security Lending.
The Fund lends portfolio securities through a lending agent from time to time in order to earn additional income. For equity securities, a lending agent is used and may loan securities to certain qualified borrowers, including Fidelity Capital Markets (FCM), a broker-dealer affiliated with the Fund. On the settlement date of the loan, the Fund receives collateral (in the form of U.S. Treasury obligations, letters of credit and/or cash) against the loaned securities and maintains collateral in an amount not less than 100% of the market value of the loaned securities during the period of the loan. The market value of the loaned securities is determined at the close of business of the Fund and any additional required collateral is delivered to the Fund on the next business day. The Fund or borrower may terminate the loan at any time, and if the borrower defaults on its obligation to return the securities loaned because of insolvency or other reasons, the Fund may apply collateral received from the borrower against the obligation. The Fund may experience delays and costs in recovering the securities loaned. Any cash collateral received is invested in the Fidelity Securities Lending Cash Central Fund. At period end, there were no security loans outstanding. Security lending income represents the income earned on investing cash collateral, less rebates paid to borrowers and any lending agent fees associated with the loan, plus any premium payments received for lending certain types of securities. Security lending income is presented in the Statement of Operations as a component of income from Fidelity Central Funds. Total security lending income during the period amounted to $5. During the period, there were no securities loaned to FCM.
9. Expense Reductions.
Commissions paid to certain brokers with whom the investment adviser, or its affiliates, places trades on behalf of the Fund include an amount in addition to trade execution, which may be rebated back to the Fund to offset certain expenses. This amount totaled $122 for the period.
In addition, during the period the investment adviser reimbursed and/or waived a portion of fund-level operating expenses in the amount of $43.
10. Distributions to Shareholders.
Distributions to shareholders of each class were as follows:
| | Year ended
June 30, 2018 | Year ended
June 30, 2017 |
| From net investment income | | |
| Fidelity Fund | $39,636 | $38,394 |
| Class K | 5,608 | 7,374 |
| Total | $45,244 | $45,768 |
| From net realized gain | | |
| Fidelity Fund | $414,639 | $216,202 |
| Class K | 57,600 | 37,803 |
| Total | $472,239 | $254,005 |
11. Share Transactions.
Share transactions for each class were as follows and may contain automatic conversions between classes or exchanges between affiliated funds:
| | Shares | Shares | Dollars | Dollars |
| | Year ended June 30, 2018 | Year ended June 30, 2017 | Year ended June 30, 2018 | Year ended June 30, 2017 |
| Fidelity Fund | | | | |
| Shares sold | 2,503 | 2,301 | $115,122 | $98,348 |
| Reinvestment of distributions | 9,897 | 5,609 | 419,088 | 234,849 |
| Shares redeemed | (10,747) | (10,936) | (491,309) | (466,956) |
| Net increase (decrease) | 1,653 | (3,026) | $42,901 | $(133,759) |
| Class K | | | | |
| Shares sold | 1,517 | 1,298 | $69,781 | $55,407 |
| Reinvestment of distributions | 1,498 | 1,079 | 63,208 | 45,177 |
| Shares redeemed | (5,937) | (6,399) | (266,369) | (269,786) |
| Net increase (decrease) | (2,922) | (4,022) | $(133,380) | $(169,202) |
12. Other.
The Fund's organizational documents provide former and current trustees and officers with a limited indemnification against liabilities arising in connection with the performance of their duties to the Fund. In the normal course of business, the Fund may also enter into contracts that provide general indemnifications. The Fund's maximum exposure under these arrangements is unknown as this would be dependent on future claims that may be made against the Fund. The risk of material loss from such claims is considered remote.
Report of Independent Registered Public Accounting Firm
To the Board of Trustees of Fidelity Hastings Street Trust and Shareholders of Fidelity Fund:
Opinion on the Financial Statements
We have audited the accompanying statement of assets and liabilities, including the schedule of investments, of Fidelity Fund (one of the funds constituting Fidelity Hastings Street Trust, referred to hereafter as the "Fund") as of June 30, 2018, the related statement of operations for the year ended June 30, 2018, the statement of changes in net assets for each of the two years in the period ended June 30, 2018, including the related notes, and the financial highlights for each of the five years in the period ended June 30, 2018 (collectively referred to as the “financial statements”). In our opinion, the financial statements present fairly, in all material respects, the financial position of the Fund as of June 30, 2018, the results of its operations for the year then ended, the changes in its net assets for each of the two years in the period ended June 30, 2018 and the financial highlights for each of the five years in the period ended June 30, 2018 in conformity with accounting principles generally accepted in the United States of America.
Basis for Opinion
These financial statements are the responsibility of the Fund’s management. Our responsibility is to express an opinion on the Fund’s financial statements based on our audits. We are a public accounting firm registered with the Public Company Accounting Oversight Board (United States) (“PCAOB”) and are required to be independent with respect to the Fund in accordance with the U.S. federal securities laws and the applicable rules and regulations of the Securities and Exchange Commission and the PCAOB.
We conducted our audits of these financial statements in accordance with the standards of the PCAOB. Those standards require that we plan and perform the audit to obtain reasonable assurance about whether the financial statements are free of material misstatement, whether due to error or fraud.
Our audits included performing procedures to assess the risks of material misstatement of the financial statements, whether due to error or fraud, and performing procedures that respond to those risks. Such procedures included examining, on a test basis, evidence regarding the amounts and disclosures in the financial statements. Our audits also included evaluating the accounting principles used and significant estimates made by management, as well as evaluating the overall presentation of the financial statements. Our procedures included confirmation of securities owned as of June 30, 2018 by correspondence with the custodian and brokers; when replies were not received from brokers, we performed other auditing procedures. We believe that our audits provide a reasonable basis for our opinion.
PricewaterhouseCoopers LLP
Boston, Massachusetts
August 13, 2018
We have served as the auditor of one or more investment companies in the Fidelity group of funds since 1932.
Trustees and Officers
The Trustees, Members of the Advisory Board (if any), and officers of the trust and fund, as applicable, are listed below. The Board of Trustees governs the fund and is responsible for protecting the interests of shareholders. The Trustees are experienced executives who meet periodically throughout the year to oversee the fund's activities, review contractual arrangements with companies that provide services to the fund, oversee management of the risks associated with such activities and contractual arrangements, and review the fund's performance. Except for Michael E. Wiley, each of the Trustees oversees 284 funds. Mr. Wiley oversees 197 funds.
The Trustees hold office without limit in time except that (a) any Trustee may resign; (b) any Trustee may be removed by written instrument, signed by at least two-thirds of the number of Trustees prior to such removal; (c) any Trustee who requests to be retired or who has become incapacitated by illness or injury may be retired by written instrument signed by a majority of the other Trustees; and (d) any Trustee may be removed at any special meeting of shareholders by a two-thirds vote of the outstanding voting securities of the trust. Each Trustee who is not an interested person (as defined in the 1940 Act) of the trust and the fund is referred to herein as an Independent Trustee. Each Independent Trustee shall retire not later than the last day of the calendar year in which his or her 75th birthday occurs. The Independent Trustees may waive this mandatory retirement age policy with respect to individual Trustees. Officers and Advisory Board Members hold office without limit in time, except that any officer or Advisory Board Member may resign or may be removed by a vote of a majority of the Trustees at any regular meeting or any special meeting of the Trustees. Except as indicated, each individual has held the office shown or other offices in the same company for the past five years.
The fund’s Statement of Additional Information (SAI) includes more information about the Trustees. To request a free copy, call Fidelity at 1-800-544-8544.
Experience, Skills, Attributes, and Qualifications of the Trustees. The Governance and Nominating Committee has adopted a statement of policy that describes the experience, qualifications, attributes, and skills that are necessary and desirable for potential Independent Trustee candidates (Statement of Policy). The Board believes that each Trustee satisfied at the time he or she was initially elected or appointed a Trustee, and continues to satisfy, the standards contemplated by the Statement of Policy. The Governance and Nominating Committee also engages professional search firms to help identify potential Independent Trustee candidates who have the experience, qualifications, attributes, and skills consistent with the Statement of Policy. From time to time, additional criteria based on the composition and skills of the current Independent Trustees, as well as experience or skills that may be appropriate in light of future changes to board composition, business conditions, and regulatory or other developments, have also been considered by the professional search firms and the Governance and Nominating Committee. In addition, the Board takes into account the Trustees' commitment and participation in Board and committee meetings, as well as their leadership of standing and ad hoc committees throughout their tenure.
In determining that a particular Trustee was and continues to be qualified to serve as a Trustee, the Board has considered a variety of criteria, none of which, in isolation, was controlling. The Board believes that, collectively, the Trustees have balanced and diverse experience, qualifications, attributes, and skills, which allow the Board to operate effectively in governing the fund and protecting the interests of shareholders. Information about the specific experience, skills, attributes, and qualifications of each Trustee, which in each case led to the Board's conclusion that the Trustee should serve (or continue to serve) as a trustee of the fund, is provided below.
Board Structure and Oversight Function. James C. Curvey is an interested person and currently serves as Chairman. The Trustees have determined that an interested Chairman is appropriate and benefits shareholders because an interested Chairman has a personal and professional stake in the quality and continuity of services provided to the fund. Independent Trustees exercise their informed business judgment to appoint an individual of their choosing to serve as Chairman, regardless of whether the Trustee happens to be independent or a member of management. The Independent Trustees have determined that they can act independently and effectively without having an Independent Trustee serve as Chairman and that a key structural component for assuring that they are in a position to do so is for the Independent Trustees to constitute a substantial majority for the Board. The Independent Trustees also regularly meet in executive session. Ned C. Lautenbach serves as Chairman of the Independent Trustees and as such (i) acts as a liaison between the Independent Trustees and management with respect to matters important to the Independent Trustees and (ii) with management prepares agendas for Board meetings.
Fidelity® funds are overseen by different Boards of Trustees. The fund's Board oversees Fidelity's high income and certain equity funds, and other Boards oversee Fidelity's investment-grade bond, money market, asset allocation, and other equity funds. The asset allocation funds may invest in Fidelity® funds overseen by the fund's Board. The use of separate Boards, each with its own committee structure, allows the Trustees of each group of Fidelity® funds to focus on the unique issues of the funds they oversee, including common research, investment, and operational issues. On occasion, the separate Boards establish joint committees to address issues of overlapping consequences for the Fidelity® funds overseen by each Board.
The Trustees operate using a system of committees to facilitate the timely and efficient consideration of all matters of importance to the Trustees, the fund, and fund shareholders and to facilitate compliance with legal and regulatory requirements and oversight of the fund's activities and associated risks. The Board, acting through its committees, has charged FMR and its affiliates with (i) identifying events or circumstances the occurrence of which could have demonstrably adverse effects on the fund's business and/or reputation; (ii) implementing processes and controls to lessen the possibility that such events or circumstances occur or to mitigate the effects of such events or circumstances if they do occur; and (iii) creating and maintaining a system designed to evaluate continuously business and market conditions in order to facilitate the identification and implementation processes described in (i) and (ii) above. Because the day-to-day operations and activities of the fund are carried out by or through FMR, its affiliates, and other service providers, the fund's exposure to risks is mitigated but not eliminated by the processes overseen by the Trustees. While each of the Board's committees has responsibility for overseeing different aspects of the fund's activities, oversight is exercised primarily through the Operations, Audit, and Compliance Committees. In addition, the Independent Trustees have worked with Fidelity to enhance the Board's oversight of investment and financial risks, legal and regulatory risks, technology risks, and operational risks, including the development of additional risk reporting to the Board. Appropriate personnel, including but not limited to the fund's Chief Compliance Officer (CCO), FMR's internal auditor, the independent accountants, the fund's Treasurer and portfolio management personnel, make periodic reports to the Board's committees, as appropriate, including an annual review of Fidelity's risk management program for the Fidelity® funds. The responsibilities of each standing committee, including their oversight responsibilities, are described further under "Standing Committees of the Trustees."
Interested Trustees*:
Correspondence intended for a Trustee who is an interested person may be sent to Fidelity Investments, 245 Summer Street, Boston, Massachusetts 02210.
Name, Year of Birth; Principal Occupations and Other Relevant Experience+
James C. Curvey (1935)
Year of Election or Appointment: 2007
Trustee
Chairman of the Board of Trustees
Mr. Curvey also serves as Trustee of other Fidelity® funds. Mr. Curvey is Vice Chairman (2007-present) and Director of FMR LLC (diversified financial services company). In addition, Mr. Curvey is an Overseer Emeritus for the Boston Symphony Orchestra, a Director of Artis-Naples, and a Trustee of Brewster Academy in Wolfeboro, New Hampshire. Previously, Mr. Curvey served as a Director of Fidelity Research & Analysis Co. (investment adviser firm, 2009-2018), Director of Fidelity Investments Money Management, Inc. (investment adviser firm, 2009-2014) and a Director of FMR and FMR Co., Inc. (investment adviser firms, 2007-2014).
Charles S. Morrison (1960)
Year of Election or Appointment: 2014
Trustee
Mr. Morrison also serves as Trustee of other funds. He serves as President of Fidelity SelectCo, LLC (investment adviser firm, 2017-present) and Fidelity Management & Research Company (FMR) (investment adviser firm, 2016-present), a Director of Fidelity Investments Money Management, Inc. (FIMM) (investment adviser firm, 2014-present), Director of Fidelity SelectCo, LLC (investment adviser firm, 2014-present), President, Asset Management (2014-present), and is an employee of Fidelity Investments. Previously, Mr. Morrison served as Vice President of Fidelity's Fixed Income and Asset Allocation Funds (2012-2014), President, Fixed Income (2011-2014), Vice President of Fidelity's Money Market Funds (2005-2009), President, Money Market Group Leader of FMR (investment adviser firm, 2009), and Senior Vice President, Money Market Group of FMR (2004-2009). Mr. Morrison also served as Vice President of Fidelity's Bond Funds (2002-2005), certain Balanced Funds (2002-2005), and certain Asset Allocation Funds (2002-2007), and as Senior Vice President (2002-2005) of Fidelity's Bond Division.
* Determined to be an “Interested Trustee” by virtue of, among other things, his or her affiliation with the trust or various entities under common control with FMR.
+ The information includes the Trustee's principal occupation during the last five years and other information relating to the experience, attributes, and skills relevant to the Trustee's qualifications to serve as a Trustee, which led to the conclusion that the Trustee should serve as a Trustee for the fund.
Independent Trustees:
Correspondence intended for an Independent Trustee may be sent to Fidelity Investments, P.O. Box 55235, Boston, Massachusetts 02205-5235.
Name, Year of Birth; Principal Occupations and Other Relevant Experience+
Dennis J. Dirks (1948)
Year of Election or Appointment: 2005
Trustee
Mr. Dirks also serves as Trustee of other Fidelity® funds. Prior to his retirement in May 2003, Mr. Dirks was Chief Operating Officer and a member of the Board of The Depository Trust & Clearing Corporation (DTCC). He also served as President, Chief Operating Officer, and Board member of The Depository Trust Company (DTC) and President and Board member of the National Securities Clearing Corporation (NSCC). In addition, Mr. Dirks served as Chief Executive Officer and Board member of the Government Securities Clearing Corporation, Chief Executive Officer and Board member of the Mortgage-Backed Securities Clearing Corporation, as a Trustee and a member of the Finance Committee of Manhattan College (2005-2008), as a Trustee and a member of the Finance Committee of AHRC of Nassau County (2006-2008), as a member of the Independent Directors Council (IDC) Governing Council (2010-2015), and as a member of the Board of Directors for The Brookville Center for Children’s Services, Inc. (2009-2017). Mr. Dirks is a member of the Finance Committee (2016-present), Board of Directors (2017-present) and Board of Trustees (2018-present) and is Treasurer (2018-present) of the Asolo Repertory Theatre.
Donald F. Donahue (1950)
Year of Election or Appointment: 2018
Trustee
Mr. Donahue also serves as a Trustee of other Fidelity® funds. Mr. Donahue is President and Chief Executive Officer of Miranda Partners, LLC (risk consulting for the financial services industry, 2012-present). Previously, Mr. Donahue served as a Member of the Advisory Board of certain Fidelity® funds (2015-2018) and Chief Executive Officer (2006-2012), Chief Operating Officer (2003-2006), and Managing Director, Customer Marketing and Development (1999-2003) of The Depository Trust & Clearing Corporation (financial markets infrastructure). Mr. Donahue serves as a Member (2007-present) and Co-Chairman (2016-present) of the Board of Directors of United Way of New York, Member of the Board of Directors of NYC Leadership Academy (2012-present) and Member of the Board of Advisors of Ripple Labs, Inc. (financial services, 2015-present). He also served as Chairman (2010-2012) and Member of the Board of Directors (2012-2013) of Omgeo, LLC (financial services), Treasurer of United Way of New York (2012-2016), and Member of the Board of Directors of XBRL US (financial services non-profit, 2009-2012) and the International Securities Services Association (2009-2012).
Alan J. Lacy (1953)
Year of Election or Appointment: 2008
Trustee
Mr. Lacy also serves as Trustee of other Fidelity® funds. Mr. Lacy serves as a Director of Bristol-Myers Squibb Company (global pharmaceuticals, 2008-present). He is a Trustee of the California Chapter of The Nature Conservancy (2015-present) and a Director of the Center for Advanced Study in the Behavioral Sciences at Stanford University (2015-present). In addition, Mr. Lacy served as Senior Adviser (2007-2014) of Oak Hill Capital Partners, L.P. (private equity) and also served as Chief Executive Officer (2005) and Vice Chairman (2005-2006) of Sears Holdings Corporation (retail) and Chief Executive Officer and Chairman of the Board of Sears, Roebuck and Co. (retail, 2000-2005). Previously, Mr. Lacy served as Chairman (2014-2017) and a member (2010-2017) of the Board of Directors of Dave & Buster’s Entertainment, Inc. (restaurant and entertainment complexes), as Chairman (2008-2011) and a member (2006-2015) of the Board of Trustees of the National Parks Conservation Association, and as a member of the Board of Directors for The Hillman Companies, Inc. (hardware wholesalers, 2010-2014), Earth Fare, Inc. (retail grocery, 2010-2014), and The Western Union Company (global money transfer, 2006-2011).
Ned C. Lautenbach (1944)
Year of Election or Appointment: 2000
Trustee
Chairman of the Independent Trustees
Mr. Lautenbach also serves as Trustee of other Fidelity® funds. Mr. Lautenbach currently serves as Vice Chair of the Board of Governors, State University System of Florida (2013-present) and is a member of the Council on Foreign Relations (1994-present). He is also a member and has most recently served as Chairman of the Board of Directors of Artis-Naples (2012-present). Previously, Mr. Lautenbach served as a member and then Lead Director of the Board of Directors of Eaton Corporation (diversified industrial, 1997-2016). He was also a Partner and Advisory Partner at Clayton, Dubilier & Rice, LLC (private equity investment, 1998-2010), as well as a Director of Sony Corporation (2006-2007). In addition, Mr. Lautenbach also had a 30-year career with IBM (technology company) during which time he served as Senior Vice President and a member of the Corporate Executive Committee (1968-1998).
Joseph Mauriello (1944)
Year of Election or Appointment: 2008
Trustee
Mr. Mauriello also serves as Trustee of other Fidelity® funds. Prior to his retirement in January 2006, Mr. Mauriello served in numerous senior management positions including Deputy Chairman and Chief Operating Officer (2004-2005), and Vice Chairman of Financial Services (2002-2004) of KPMG LLP US (professional services, 1965-2005). Mr. Mauriello currently serves as a member of the Board of Directors of XL Group plc. (global insurance and re-insurance, 2006-present) and the Independent Directors Council (IDC) Governing Council (2015-present). Previously, Mr. Mauriello served as a Director of the Hamilton Funds of the Bank of New York (2006-2007) and of Arcadia Resources Inc. (health care services and products, 2007-2012).
Cornelia M. Small (1944)
Year of Election or Appointment: 2005
Trustee
Ms. Small also serves as Trustee of other Fidelity® funds. Ms. Small is a member of the Board of Directors (2009-present) and Chair of the Investment Committee (2010-present) of the Teagle Foundation. Ms. Small also serves on the Investment Committee of the Berkshire Taconic Community Foundation (2008-present). Previously, Ms. Small served as Chairperson (2002-2008) and a member of the Investment Committee and Chairperson (2008-2012) and a member of the Board of Trustees of Smith College. In addition, Ms. Small served as Chief Investment Officer, Director of Global Equity Investments, and a member of the Board of Directors of Scudder, Stevens & Clark and Scudder Kemper Investments.
Garnett A. Smith (1947)
Year of Election or Appointment: 2018
Trustee
Mr. Smith also serves as Trustee of other Fidelity® funds. Prior to Mr. Smith's retirement, he served as Chairman and Chief Executive Officer of Inbrand Corp. (manufacturer of personal absorbent products, 1990-1997). He also served as President (1986-1990) of Inbrand Corp. Prior to his employment with Inbrand Corp., he was employed by a retail fabric chain and North Carolina National Bank. In addition, Mr. Smith served as a Member of the Advisory Board of certain Fidelity® funds (2012-2013) and as a board member of the Jackson Hole Land Trust (2009-2012).
David M. Thomas (1949)
Year of Election or Appointment: 2008
Trustee
Mr. Thomas also serves as Trustee of other Fidelity® funds. Mr. Thomas serves as Non-Executive Chairman of the Board of Directors of Fortune Brands Home and Security (home and security products, 2011-present), as a member of the Board of Directors (2004-present) and Presiding Director (2013-present) of Interpublic Group of Companies, Inc. (marketing communication), and as a member of the Board of Trustees of the University of Florida (2013-present). Previously, Mr. Thomas served as Executive Chairman (2005-2006) and Chairman and Chief Executive Officer (2000-2005) of IMS Health, Inc. (pharmaceutical and healthcare information solutions), and a Director of Fortune Brands, Inc. (consumer products, 2000-2011).
Michael E. Wiley (1950)
Year of Election or Appointment: 2018
Trustee
Mr. Wiley also serves as Trustee or Member of the Advisory Board of other Fidelity® funds. Mr. Wiley serves as a Director of Andeavor Corporation (independent oil refiner and marketer, 2005-present), a Director of Andeavor Logistics LP (natural resources logistics, 2015-present), and a Director of Bill Barrett Corporation (exploration and production, 2005-present). In addition, Mr. Wiley also serves as a Director of Post Oak Bank (privately-held bank, 2004-present). Previously, Mr. Wiley served as a Trustee of other Fidelity® funds (2008-2013), as a Director of Asia Pacific Exploration Consolidated (international oil and gas exploration and production, 2008-2013), as a member of the Board of Trustees of the University of Tulsa (2000-2006; 2007-2010), as a Senior Energy Advisor of Katzenbach Partners, LLC (consulting, 2006-2007), as an Advisory Director of Riverstone Holdings (private investment), Chairman, President, and CEO of Baker Hughes, Inc. (oilfield services, 2000-2004), and as Director of Spinnaker Exploration Company (exploration and production, 2001-2005).
+ The information includes the Trustee's principal occupation during the last five years and other information relating to the experience, attributes, and skills relevant to the Trustee's qualifications to serve as a Trustee, which led to the conclusion that the Trustee should serve as a Trustee for the fund.
Advisory Board Members and Officers:
Correspondence intended for a Member of the Advisory Board (if any) may be sent to Fidelity Investments, P.O. Box 55235, Boston, Massachusetts 02205-5235. Correspondence intended for an officer or Peter S. Lynch may be sent to Fidelity Investments, 245 Summer Street, Boston, Massachusetts 02210. Officers appear below in alphabetical order.
Name, Year of Birth; Principal Occupation
Peter S. Lynch (1944)
Year of Election or Appointment: 2003
Member of the Advisory Board
Mr. Lynch also serves as Member of the Advisory Board of other Fidelity® funds. Mr. Lynch is Vice Chairman and a Director of FMR (investment adviser firm) and FMR Co., Inc. (investment adviser firm). In addition, Mr. Lynch serves as a Trustee of Boston College and as the Chairman of the Inner-City Scholarship Fund. Previously, Mr. Lynch served on the Special Olympics International Board of Directors (1997-2006).
William S. Stavropoulos (1939)
Year of Election or Appointment: 2018
Member of the Advisory Board
Mr. Stavropoulos also serves as Member of the Advisory Board of other Fidelity® funds. Mr. Stavropoulos serves as President and Founder of the Michigan Baseball Foundation, the Great Lakes Loons (2007-present). Mr. Stavropoulos is Chairman Emeritus of the Board of Directors of The Dow Chemical Company, where he previously served in numerous senior management positions, including President, CEO (1995-2000; 2002-2004), Chairman of the Executive Committee (2000-2006), and as a member of the Board of Directors (1990-2006). Currently, Mr. Stavropoulos is Chairman of the Board of Directors of Univar Inc. (global distributor of commodity and specialty chemicals), a Director of Teradata Corporation (data warehousing and technology solutions), and a member of the Advisory Board for Metalmark Capital LLC (private equity investment, 2005-present). Mr. Stavropoulos is an operating advisor to Clayton, Dubilier & Rice, LLC (private equity investment). In addition, Mr. Stavropoulos is a member of the University of Notre Dame Advisory Council for the College of Science, a Trustee of the Rollin L. Gerstacker Foundation, and a Director of Artis-Naples in Naples, Florida. Previously, Mr. Stavropoulos served as Trustee of certain Fidelity® funds (2001-2018) and as a Director of Chemical Financial Corporation (bank holding company, 1993-2012) and Tyco International, Ltd. (multinational manufacturing and services, 2007-2012).
Carol B. Tomé (1957)
Year of Election or Appointment: 2018
Member of the Advisory Board
Ms. Tomé also serves as Member of the Advisory Board of other Fidelity® funds. Ms. Tomé is Chief Financial Officer (2001-present) and Executive Vice President of Corporate Services (2007-present) of The Home Depot, Inc. (home improvement retailer) and a Director (2003-present) and Chair of the Audit Committee (2004-present) of United Parcel Service, Inc. (package delivery and supply chain management). Previously, Ms. Tomé served as Trustee of certain Fidelity® funds (2017), Senior Vice President of Finance and Accounting/Treasurer (2000-2007) and Vice President and Treasurer (1995-2000) of The Home Depot, Inc. and Chair of the Board (2010-2012), Vice Chair of the Board (2009 and 2013), and a Director (2008-2013) of the Federal Reserve Bank of Atlanta. Ms. Tomé is also a director or trustee of many community and professional organizations.
Elizabeth Paige Baumann (1968)
Year of Election or Appointment: 2017
Anti-Money Laundering (AML) Officer
Ms. Baumann also serves as AML Officer of other funds. She is Chief AML Officer (2012-present) and Senior Vice President (2014-present) of FMR LLC (diversified financial services company) and is an employee of Fidelity Investments. Previously, Ms. Baumann served as AML Officer of the funds (2012-2016), and Vice President (2007-2014) and Deputy Anti-Money Laundering Officer (2007-2012) of FMR LLC.
Marc R. Bryant (1966)
Year of Election or Appointment: 2015
Secretary and Chief Legal Officer (CLO)
Mr. Bryant also serves as Secretary and CLO of other funds. Mr. Bryant serves as CLO, Secretary, and Senior Vice President of Fidelity Management & Research Company (investment adviser firm, 2015-present) and FMR Co., Inc. (investment adviser firm, 2015-present); Secretary of Fidelity SelectCo, LLC (investment adviser firm, 2015-present) and Fidelity Investments Money Management, Inc. (investment adviser firm, 2015-present); and CLO of Fidelity Management & Research (Hong Kong) Limited and FMR Investment Management (UK) Limited (investment adviser firms, 2015-present) and Fidelity Management & Research (Japan) Limited (investment adviser firm, 2016-present). He is Senior Vice President and Deputy General Counsel of FMR LLC (diversified financial services company). Previously, Mr. Bryant served as Secretary and CLO of Fidelity Rutland Square Trust II (2010-2014) and Assistant Secretary of Fidelity's Fixed Income and Asset Allocation Funds (2013-2015). Prior to joining Fidelity Investments, Mr. Bryant served as a Senior Vice President and the Head of Global Retail Legal for AllianceBernstein L.P. (2006-2010), and as the General Counsel for ProFund Advisors LLC (2001-2006).
John J. Burke III (1964)
Year of Election or Appointment: 2018
Chief Financial Officer
Mr. Burke also serves as Chief Financial Officer of other funds. Mr. Burke serves as Head of Investment Operations for Fidelity Fund and Investment Operations (2018-present) and is an employee of Fidelity Investments (1998-present). Previously Mr. Burke served as head of Asset Management Investment Operations (2012-2018).
William C. Coffey (1969)
Year of Election or Appointment: 2009
Assistant Secretary
Mr. Coffey also serves as Assistant Secretary of other funds. He is Senior Vice President and Deputy General Counsel of FMR LLC (diversified financial services company, 2010-present), and is an employee of Fidelity Investments. Previously, Mr. Coffey served as Vice President and Associate General Counsel of FMR LLC (2005-2009).
Timothy M. Cohen (1969)
Year of Election or Appointment: 2018
Vice President
Mr. Cohen also serves as Vice President of other funds. Mr. Cohen serves as Co-Head of Global Equity Research (2016-present), a Director of Fidelity Management & Research (Japan) Limited (investment adviser firm, 2016-present), and is an employee of Fidelity Investments. Previously, Mr. Cohen served as Chief Investment Officer - Equity and a Director of Fidelity Management & Research (U.K.) Inc. (investment adviser firm, 2013-2015) and as a Director of Fidelity Management & Research (Hong Kong) Limited (investment adviser firm, 2017).
Jonathan Davis (1968)
Year of Election or Appointment: 2010
Assistant Treasurer
Mr. Davis also serves as Assistant Treasurer of other funds. Mr. Davis serves as Assistant Treasurer of FMR Capital, Inc. (2017-present) and is an employee of Fidelity Investments. Previously, Mr. Davis served as Vice President and Associate General Counsel of FMR LLC (diversified financial services company, 2003-2010).
Adrien E. Deberghes (1967)
Year of Election or Appointment: 2016
Assistant Treasurer
Mr. Deberghes also serves as an officer of other funds. He serves as Assistant Treasurer of FMR Capital, Inc. (2017-present), Executive Vice President of Fidelity Investments Money Management, Inc. (FIMM) (investment adviser firm, 2016-present), and is an employee of Fidelity Investments (2008-present). Previously, Mr. Deberghes served as President and Treasurer of certain Fidelity® funds (2013-2018). Prior to joining Fidelity Investments, Mr. Deberghes was Senior Vice President of Mutual Fund Administration at State Street Corporation (2007-2008), Senior Director of Mutual Fund Administration at Investors Bank & Trust (2005-2007), and Director of Finance for Dunkin' Brands (2000-2005). Previously, Mr. Deberghes served in other fund officer roles.
Laura M. Del Prato (1964)
Year of Election or Appointment: 2018
Assistant Treasurer
Ms. Del Prato also serves as an officer of other funds. Ms. Del Prato is an employee of Fidelity Investments (2017-present). Prior to joining Fidelity Investments, Ms. Del Prato served as a Managing Director and Treasurer of the JPMorgan Mutual Funds (2014-2017). Prior to JPMorgan, Ms. Del Prato served as a partner at Cohen Fund Audit Services (accounting firm, 2012-2013) and KPMG LLP (accounting firm, 2004-2012).
Colm A. Hogan (1973)
Year of Election or Appointment: 2016
Deputy Treasurer
Mr. Hogan also serves as an officer of other funds. Mr. Hogan serves as Assistant Treasurer of FMR Capital, Inc. (2017-present) and is an employee of Fidelity Investments (2005-present). Previously, Mr. Hogan served as Assistant Treasurer of certain Fidelity® funds (2016-2018).
Pamela R. Holding (1964)
Year of Election or Appointment: 2018
Vice President
Ms. Holding also serves as a Vice President of other funds. Ms. Holding serves as Co-Head of Global Equity Research (2018-present) and is an employee of Fidelity Investments (2013-present).
Chris Maher (1972)
Year of Election or Appointment: 2013
Assistant Treasurer
Mr. Maher serves as Assistant Treasurer of other funds. Mr. Maher is Vice President of Valuation Oversight, serves as Assistant Treasurer of FMR Capital, Inc. (2017-present), and is an employee of Fidelity Investments. Previously, Mr. Maher served as Vice President of Asset Management Compliance (2013), Vice President of the Program Management Group of FMR (investment adviser firm, 2010-2013), and Vice President of Valuation Oversight (2008-2010).
Rieco E. Mello (1969)
Year of Election or Appointment: 2017
Assistant Treasurer
Mr. Mello also serves as Assistant Treasurer of other funds. Mr. Mello serves as Assistant Treasurer of FMR Capital, Inc. (2017-present) and is an employee of Fidelity Investments (1995-present).
Kenneth B. Robins (1969)
Year of Election or Appointment: 2016
Chief Compliance Officer
Mr. Robins also serves as an officer of other funds. Mr. Robins serves as Compliance Officer of Fidelity Management & Research Company and FMR Co., Inc. (investment adviser firms, 2016-present) and is an employee of Fidelity Investments (2004-present). Previously, Mr. Robins served as Executive Vice President of Fidelity Investments Money Management, Inc. (investment adviser firm, 2013-2016) and served in other fund officer roles.
Stacie M. Smith (1974)
Year of Election or Appointment: 2016
President and Treasurer
Ms. Smith also serves as an officer of other funds. Ms. Smith serves as Assistant Treasurer of FMR Capital, Inc. (2017-present), is an employee of Fidelity Investments (2009-present), and has served in other fund officer roles. Prior to joining Fidelity Investments, Ms. Smith served as Senior Audit Manager of Ernst & Young LLP (accounting firm, 1996-2009). Previously, Ms. Smith served as Assistant Treasurer (2013-2018) and Deputy Treasurer (2013-2016) of certain Fidelity® funds.
Marc L. Spector (1972)
Year of Election or Appointment: 2016
Assistant Treasurer
Mr. Spector also serves as an officer of other funds. Mr. Spector serves as Assistant Treasurer of FMR Capital, Inc. (2017-present) and is an employee of Fidelity Investments (2016-present). Prior to joining Fidelity Investments, Mr. Spector served as Director at the Siegfried Group (accounting firm, 2013-2016), and prior to Siegfried Group as audit senior manager at Deloitte & Touche (accounting firm, 2005-2013).
Renee Stagnone (1975)
Year of Election or Appointment: 2016
Assistant Treasurer
Ms. Stagnone also serves as an officer of other funds. Ms. Stagnone serves as Assistant Treasurer of FMR Capital, Inc. (2017-present) and is an employee of Fidelity Investments (1997-present). Previously, Ms. Stagnone served as Deputy Treasurer of certain Fidelity® funds (2013-2016).
Shareholder Expense Example
As a shareholder of the Fund, you incur two types of costs: (1) transaction costs, and (2) ongoing costs, including management fees and other Fund expenses. This Example is intended to help you understand your ongoing costs (in dollars) of investing in the Fund and to compare these costs with the ongoing costs of investing in other mutual funds.
The Example is based on an investment of $1,000 invested at the beginning of the period and held for the entire period (January 1, 2018 to June 30, 2018).
Actual Expenses
The first line of the accompanying table for each class of the Fund provides information about actual account values and actual expenses. You may use the information in this line, together with the amount you invested, to estimate the expenses that you paid over the period. Simply divide your account value by $1,000.00 (for example, an $8,600 account value divided by $1,000.00 = 8.6), then multiply the result by the number in the first line for a class of the Fund under the heading entitled "Expenses Paid During Period" to estimate the expenses you paid on your account during this period. A small balance maintenance fee of $12.00 that is charged once a year may apply for certain accounts with a value of less than $2,000. This fee is not included in the table below. If it was, the estimate of expenses you paid during the period would be higher, and your ending account value lower, by this amount. In addition, the Fund, as a shareholder in the underlying Fidelity Central Funds, will indirectly bear its pro-rata share of the fees and expenses incurred by the underlying Fidelity Central Funds. These fees and expenses are not included in the Fund's annualized expense ratio used to calculate the expense estimate in the table below.
Hypothetical Example for Comparison Purposes
The second line of the accompanying table for each class of the Fund provides information about hypothetical account values and hypothetical expenses based on a Class' actual expense ratio and an assumed rate of return of 5% per year before expenses, which is not the Class' actual return. The hypothetical account values and expenses may not be used to estimate the actual ending account balance or expenses you paid for the period. You may use this information to compare the ongoing costs of investing in the Fund and other funds. To do so, compare this 5% hypothetical example with the 5% hypothetical examples that appear in the shareholder reports of the other funds. A small balance maintenance fee of $12.00 that is charged once a year may apply for certain accounts with a value of less than $2,000. This fee is not included in the table below. If it was, the estimate of expenses you paid during the period would be higher, and your ending account value lower, by this amount. In addition, the Fund, as a shareholder in the underlying Fidelity Central Funds, will indirectly bear its pro-rata share of the fees and expenses incurred by the underlying Fidelity Central Funds. These fees and expenses are not included in the Fund's annualized expense ratio used to calculate the expense estimate in the table below.
Please note that the expenses shown in the table are meant to highlight your ongoing costs only and do not reflect any transaction costs. Therefore, the second line of the table is useful in comparing ongoing costs only, and will not help you determine the relative total costs of owning different funds.
| | Annualized Expense Ratio-A | Beginning
Account Value
January 1, 2018 | Ending
Account Value
June 30, 2018 | Expenses Paid
During Period-B
January 1, 2018
to June 30, 2018 |
| Fidelity Fund | .49% | | | |
| Actual | | $1,000.00 | $1,036.00 | $2.47 |
| Hypothetical-C | | $1,000.00 | $1,022.36 | $2.46 |
| Class K | .40% | | | |
| Actual | | $1,000.00 | $1,036.50 | $2.02 |
| Hypothetical-C | | $1,000.00 | $1,022.81 | $2.01 |
A Annualized expense ratio reflects expenses net of applicable fee waivers.
B Expenses are equal to each Class' annualized expense ratio, multiplied by the average account value over the period, multiplied by 181/365 (to reflect the one-half year period).
C 5% return per year before expenses
Distributions (Unaudited)
The Board of Trustees of Fidelity Fund voted to pay to shareholders of record at the opening of business on record date, the following distributions per share derived from capital gains realized from sales of portfolio securities, and dividends derived from net investment income:
| | Pay Date | Record Date | Dividends | Capital Gains |
| Fidelity Fund | | | | |
| Fidelity Fund | 08/13/18 | 08/10/18 | $0.206 | $2.104 |
| Class K | 08/13/18 | 08/10/18 | $0.228 | $2.104 |
|
The fund hereby designates as a capital gain dividend with respect to the taxable year ended June 30, 2018, $304,332,802, or, if subsequently determined to be different, the net capital gain of such year.
Fidelity Fund and Class K designate 100% of the dividends distributed in August and December during the fiscal year as qualifying for the dividends–received deduction for corporate shareholders.
Fidelity Fund and Class K designate 100% of the dividends distributed in August and December during the fiscal year as amounts which may be taken into account as a dividend for purposes of the maximum rate under section 1(h)(11) of the Internal Revenue Code.
The fund will notify shareholders in January 2019 of amounts for use in preparing 2018 income tax returns.
Corporate Headquarters
245 Summer St.
Boston, MA 02210
www.fidelity.com
FID-ANN-0818
1.705632.121
Fidelity® Fund Class K
Annual Report June 30, 2018 |
|
Contents
To view a fund's proxy voting guidelines and proxy voting record for the 12-month period ended June 30, visit http://www.fidelity.com/proxyvotingresults or visit the Securities and Exchange Commission's (SEC) web site at http://www.sec.gov.
You may also call 1-800-835-5092 to request a free copy of the proxy voting guidelines.
Standard & Poor's, S&P and S&P 500 are registered service marks of The McGraw-Hill Companies, Inc. and have been licensed for use by Fidelity Distributors Corporation.
Other third-party marks appearing herein are the property of their respective owners.
All other marks appearing herein are registered or unregistered trademarks or service marks of FMR LLC or an affiliated company. © 2018 FMR LLC. All rights reserved.
This report and the financial statements contained herein are submitted for the general information of the shareholders of the Fund. This report is not authorized for distribution to prospective investors in the Fund unless preceded or accompanied by an effective prospectus.
A fund files its complete schedule of portfolio holdings with the SEC for the first and third quarters of each fiscal year on Form N-Q. Forms N-Q are available on the SEC’s web site at http://www.sec.gov. A fund's Forms N-Q may be reviewed and copied at the SEC’s Public Reference Room in Washington, DC. Information regarding the operation of the SEC's Public Reference Room may be obtained by calling 1-800-SEC-0330.
For a complete list of a fund's portfolio holdings, view the most recent holdings listing, semiannual report, or annual report on Fidelity's web site at http://www.fidelity.com, http://www.institutional.fidelity.com, or http://www.401k.com, as applicable.
NOT FDIC INSURED •MAY LOSE VALUE •NO BANK GUARANTEE
Neither the Fund nor Fidelity Distributors Corporation is a bank.
Performance: The Bottom Line
Average annual total return reflects the change in the value of an investment, assuming reinvestment of distributions from dividend income and capital gains (the profits earned upon the sale of securities that have grown in value, if any) and assuming a constant rate of performance each year. The hypothetical investment and the average annual total returns do not reflect the deduction of taxes that a shareholder would pay on fund distributions or the redemption of fund shares. During periods of reimbursement by Fidelity, a fund’s total return will be greater than it would be had the reimbursement not occurred. How a fund did yesterday is no guarantee of how it will do tomorrow.
Average Annual Total Returns
| For the periods ended June 30, 2018 | Past 1 year | Past 5 years | Past 10 years |
| Class K | 17.63% | 12.87% | 8.45% |
$10,000 Over 10 Years
Let's say hypothetically that $10,000 was invested in Fidelity® Fund - Class K on June 30, 2008.
The chart shows how the value of your investment would have changed, and also shows how the S&P 500® Index performed over the same period.

| Period Ending Values |
| $22,510 | Fidelity® Fund - Class K |
| $26,340 | S&P 500® Index |
Management's Discussion of Fund Performance
Market Recap: The U.S. equity bellwether S&P 500
® index gained 14.37% for the 12 months ending June 30, 2018, despite a resurgence in volatility that challenged the multiyear bull market. The steady growth seen throughout 2017 extended into the new year, as investors remained upbeat on hopes of continued strong economic and earnings growth. Stocks surged 5.73% in January alone. February was a decidedly different story, though, as volatility spiked amid fear that rising inflation and the potential for the economy to overheat would prompt the U.S. Federal Reserve to pick up the pace of interest rate hikes. The index returned -3.69% for the month, its first negative result since October 2016, and lost further ground in March on fear of a global trade war. The market stabilized in April and went on to achieve a solid gain for May. The uptrend continued through roughly mid-June, when escalating trade tension between the U.S. and China soured investor sentiment, and the index ended the 12 months with a two-week slump. By sector, information technology (+31%) led the way, rising on strong earnings growth from several major index constituents. Consumer discretionary (+24%) also stood out, largely driven by retailers (+50%). Energy gained 21% alongside higher oil prices. Notable laggards included some defensive groups – consumer staples (-4%), telecommunication services (+1%) and utilities (+3%) – that struggled amid rising interest rates and a general preference for risk.
Comments from Portfolio Manager Jean Park: For the fiscal year, the fund's share classes gained about 18%, solidly outpacing the benchmark S&P 500
® index. In a strong up market for large-caps, both stock and market selection drove the fund's outperformance of the benchmark. Security selection was strongest in financials, industrials, energy and consumer staples, while a meaningful overweighting in information technology also helped, especially within software & services. Avoiding poor-performing benchmark component General Electric was the largest relative contributor. From my perspective, the industrial conglomerate's free-cash-flow (FCF) yield was not very attractive and did not fit my investment criteria. Elsewhere, Amazon.com and Microsoft, both of which offer market-leading cloud-computing services, also contributed. Amazon executed very well, expanding its already-high earnings multiple. As such, I pared the fund's position to take some gains, but it remained a sizable holding as of June 30. For Microsoft, expectations were moderate coming into the period, so I believed the stock had more room to grow as investors anticipated improved results. Conversely, stock picking in consumer discretionary was the biggest drag on our relative result. Here, not owning video-streaming service provider Netflix, whose shares gained 162% the past year, was the fund's largest relative detractor. While I do believe Netflix's products are very strong, the company had negative FCF and failed to meet one of my key investment criteria.
The views expressed above reflect those of the portfolio manager(s) only through the end of the period as stated on the cover of this report and do not necessarily represent the views of Fidelity or any other person in the Fidelity organization. Any such views are subject to change at any time based upon market or other conditions and Fidelity disclaims any responsibility to update such views. These views may not be relied on as investment advice and, because investment decisions for a Fidelity fund are based on numerous factors, may not be relied on as an indication of trading intent on behalf of any Fidelity fund.
Investment Summary (Unaudited)
Top Ten Stocks as of June 30, 2018
| | % of fund's net assets |
| Microsoft Corp. | 5.3 |
| Apple, Inc. | 4.8 |
| Alphabet, Inc. Class A | 4.2 |
| JPMorgan Chase & Co. | 4.1 |
| Amazon.com, Inc. | 3.7 |
| Bank of America Corp. | 3.3 |
| UnitedHealth Group, Inc. | 2.9 |
| Facebook, Inc. Class A | 2.7 |
| Raytheon Co. | 1.9 |
| Visa, Inc. Class A | 1.8 |
| | 34.7 |
Top Five Market Sectors as of June 30, 2018
| | % of fund's net assets |
| Information Technology | 32.1 |
| Financials | 18.0 |
| Health Care | 16.2 |
| Consumer Discretionary | 12.0 |
| Industrials | 8.0 |
Asset Allocation (% of fund's net assets)
| As of June 30, 2018* |
| | Stocks | 98.4% |
| | Short-Term Investments and Net Other Assets (Liabilities) | 1.6% |

* Foreign investments - 1.0%
Schedule of Investments June 30, 2018
Showing Percentage of Net Assets
| Common Stocks - 98.4% | | | |
| | | Shares | Value (000s) |
| CONSUMER DISCRETIONARY - 12.0% | | | |
| Auto Components - 1.0% | | | |
| Aptiv PLC | | 317,415 | $29,085 |
| Lear Corp. | | 78,000 | 14,493 |
| | | | 43,578 |
| Hotels, Restaurants & Leisure - 2.0% | | | |
| Domino's Pizza, Inc. | | 49,800 | 14,052 |
| Hilton Grand Vacations, Inc. (a) | | 370,000 | 12,839 |
| Vail Resorts, Inc. | | 17,000 | 4,661 |
| Wyndham Destinations, Inc. | | 580,000 | 25,677 |
| Wyndham Hotels & Resorts, Inc. | | 612,000 | 36,004 |
| | | | 93,233 |
| Household Durables - 0.5% | | | |
| Lennar Corp. Class A | | 470,055 | 24,678 |
| Internet & Direct Marketing Retail - 4.9% | | | |
| Amazon.com, Inc. (a) | | 98,100 | 166,750 |
| The Booking Holdings, Inc. (a) | | 27,300 | 55,340 |
| | | | 222,090 |
| Media - 0.9% | | | |
| Comcast Corp. Class A | | 1,200,000 | 39,372 |
| Specialty Retail - 2.7% | | | |
| Home Depot, Inc. | | 389,000 | 75,894 |
| Lowe's Companies, Inc. | | 510,000 | 48,741 |
| | | | 124,635 |
|
| TOTAL CONSUMER DISCRETIONARY | | | 547,586 |
|
| CONSUMER STAPLES - 4.1% | | | |
| Beverages - 0.5% | | | |
| Brown-Forman Corp. Class B (non-vtg.) | | 110,000 | 5,391 |
| PepsiCo, Inc. | | 180,000 | 19,597 |
| | | | 24,988 |
| Food & Staples Retailing - 2.4% | | | |
| Costco Wholesale Corp. | | 238,000 | 49,737 |
| Walmart, Inc. | | 699,900 | 59,946 |
| | | | 109,683 |
| Personal Products - 0.7% | | | |
| Estee Lauder Companies, Inc. Class A | | 231,900 | 33,090 |
| Tobacco - 0.5% | | | |
| Philip Morris International, Inc. | | 280,000 | 22,607 |
|
| TOTAL CONSUMER STAPLES | | | 190,368 |
|
| ENERGY - 2.8% | | | |
| Oil, Gas & Consumable Fuels - 2.8% | | | |
| ConocoPhillips Co. | | 700,000 | 48,734 |
| Phillips 66 Co. | | 233,000 | 26,168 |
| Valero Energy Corp. | | 465,000 | 51,536 |
| | | | 126,438 |
| FINANCIALS - 18.0% | | | |
| Banks - 10.3% | | | |
| Bank of America Corp. | | 5,420,000 | 152,790 |
| Citigroup, Inc. | | 780,000 | 52,198 |
| JPMorgan Chase & Co. | | 1,776,000 | 185,059 |
| SunTrust Banks, Inc. | | 1,221,077 | 80,616 |
| | | | 470,663 |
| Capital Markets - 3.9% | | | |
| Ameriprise Financial, Inc. | | 253,000 | 35,390 |
| E*TRADE Financial Corp. (a) | | 423,000 | 25,871 |
| Morgan Stanley | | 500,075 | 23,704 |
| MSCI, Inc. | | 217,600 | 35,998 |
| S&P Global, Inc. | | 291,200 | 59,373 |
| | | | 180,336 |
| Insurance - 3.8% | | | |
| AFLAC, Inc. | | 1,674,000 | 72,015 |
| Allstate Corp. | | 680,000 | 62,064 |
| Marsh & McLennan Companies, Inc. | | 90,000 | 7,377 |
| Progressive Corp. | | 542,000 | 32,059 |
| | | | 173,515 |
|
| TOTAL FINANCIALS | | | 824,514 |
|
| HEALTH CARE - 16.2% | | | |
| Biotechnology - 3.8% | | | |
| AbbVie, Inc. | | 746,000 | 69,117 |
| Amgen, Inc. | | 257,000 | 47,440 |
| Celgene Corp. (a) | | 187,937 | 14,926 |
| Gilead Sciences, Inc. | | 580,000 | 41,087 |
| | | | 172,570 |
| Health Care Equipment & Supplies - 4.7% | | | |
| Baxter International, Inc. | | 495,000 | 36,551 |
| Becton, Dickinson & Co. | | 231,000 | 55,338 |
| Boston Scientific Corp. (a) | | 670,000 | 21,909 |
| Danaher Corp. | | 571,749 | 56,420 |
| Intuitive Surgical, Inc. (a) | | 57,000 | 27,273 |
| ResMed, Inc. | | 166,100 | 17,205 |
| | | | 214,696 |
| Health Care Providers & Services - 5.9% | | | |
| AmerisourceBergen Corp. | | 131,693 | 11,229 |
| Cigna Corp. | | 335,000 | 56,933 |
| Humana, Inc. | | 190,000 | 56,550 |
| McKesson Corp. | | 92,326 | 12,316 |
| UnitedHealth Group, Inc. | | 543,969 | 133,457 |
| | | | 270,485 |
| Life Sciences Tools & Services - 0.8% | | | |
| Agilent Technologies, Inc. | | 393,000 | 24,303 |
| Waters Corp. (a) | | 56,000 | 10,841 |
| | | | 35,144 |
| Pharmaceuticals - 1.0% | | | |
| Johnson & Johnson | | 310,000 | 37,615 |
| Zoetis, Inc. Class A | | 124,520 | 10,608 |
| | | | 48,223 |
|
| TOTAL HEALTH CARE | | | 741,118 |
|
| INDUSTRIALS - 8.0% | | | |
| Aerospace & Defense - 4.7% | | | |
| Huntington Ingalls Industries, Inc. | | 186,300 | 40,388 |
| Northrop Grumman Corp. | | 199,900 | 61,509 |
| Raytheon Co. | | 439,200 | 84,845 |
| The Boeing Co. | | 75,601 | 25,365 |
| | | | 212,107 |
| Building Products - 0.6% | | | |
| Masco Corp. | | 750,000 | 28,065 |
| Commercial Services & Supplies - 0.6% | | | |
| KAR Auction Services, Inc. | | 514,812 | 28,212 |
| Electrical Equipment - 0.7% | | | |
| Fortive Corp. | | 430,100 | 33,165 |
| Industrial Conglomerates - 0.9% | | | |
| 3M Co. | | 211,100 | 41,528 |
| Machinery - 0.5% | | | |
| Cummins, Inc. | | 168,100 | 22,357 |
|
| TOTAL INDUSTRIALS | | | 365,434 |
|
| INFORMATION TECHNOLOGY - 32.1% | | | |
| Electronic Equipment & Components - 1.3% | | | |
| Amphenol Corp. Class A | | 690,100 | 60,142 |
| Internet Software & Services - 7.7% | | | |
| Akamai Technologies, Inc. (a) | | 112,000 | 8,202 |
| Alphabet, Inc.: | | | |
| Class A (a) | | 171,000 | 193,091 |
| Class C (a) | | 25,000 | 27,891 |
| Facebook, Inc. Class A (a) | | 634,900 | 123,374 |
| | | | 352,558 |
| IT Services - 3.5% | | | |
| Adyen BV (b) | | 2,400 | 1,322 |
| DXC Technology Co. | | 155,059 | 12,499 |
| MasterCard, Inc. Class A | | 327,000 | 64,262 |
| Visa, Inc. Class A | | 630,000 | 83,444 |
| | | | 161,527 |
| Semiconductors & Semiconductor Equipment - 5.1% | | | |
| Applied Materials, Inc. | | 715,000 | 33,026 |
| Intel Corp. | | 1,435,000 | 71,334 |
| KLA-Tencor Corp. | | 151,000 | 15,482 |
| Lam Research Corp. | | 136,000 | 23,508 |
| Micron Technology, Inc. (a) | | 477,000 | 25,014 |
| ON Semiconductor Corp. (a) | | 200,000 | 4,447 |
| Texas Instruments, Inc. | | 534,800 | 58,962 |
| | | | 231,773 |
| Software - 9.7% | | | |
| Adobe Systems, Inc. (a) | | 260,000 | 63,391 |
| Check Point Software Technologies Ltd. (a) | | 141,041 | 13,777 |
| Citrix Systems, Inc. (a) | | 370,000 | 38,791 |
| Electronic Arts, Inc. (a) | | 233,000 | 32,858 |
| Microsoft Corp. | | 2,451,000 | 241,691 |
| Parametric Technology Corp. (a) | | 57,587 | 5,402 |
| Red Hat, Inc. (a) | | 113,000 | 15,184 |
| Take-Two Interactive Software, Inc. (a) | | 280,000 | 33,141 |
| | | | 444,235 |
| Technology Hardware, Storage & Peripherals - 4.8% | | | |
| Apple, Inc. | | 1,191,000 | 220,466 |
|
| TOTAL INFORMATION TECHNOLOGY | | | 1,470,701 |
|
| MATERIALS - 1.8% | | | |
| Chemicals - 1.8% | | | |
| DowDuPont, Inc. | | 250,000 | 16,480 |
| Sherwin-Williams Co. | | 53,400 | 21,764 |
| The Chemours Co. LLC | | 501,000 | 22,224 |
| Westlake Chemical Corp. | | 217,000 | 23,356 |
| | | | 83,824 |
| REAL ESTATE - 0.6% | | | |
| Equity Real Estate Investment Trusts (REITs) - 0.6% | | | |
| American Tower Corp. | | 202,000 | 29,122 |
| TELECOMMUNICATION SERVICES - 1.6% | | | |
| Diversified Telecommunication Services - 1.1% | | | |
| AT&T, Inc. | | 1,580,000 | 50,734 |
| Wireless Telecommunication Services - 0.5% | | | |
| T-Mobile U.S., Inc. (a) | | 387,500 | 23,153 |
|
| TOTAL TELECOMMUNICATION SERVICES | | | 73,887 |
|
| UTILITIES - 1.2% | | | |
| Electric Utilities - 1.2% | | | |
| NextEra Energy, Inc. | | 320,000 | 53,450 |
| TOTAL COMMON STOCKS | | | |
| (Cost $3,041,630) | | | 4,506,442 |
|
| Money Market Funds - 1.8% | | | |
| Fidelity Cash Central Fund, 1.93% (c) | | | |
| (Cost $82,716) | | 82,699,855 | 82,716 |
| TOTAL INVESTMENT IN SECURITIES - 100.2% | | | |
| (Cost $3,124,346) | | | 4,589,158 |
| NET OTHER ASSETS (LIABILITIES) - (0.2)% | | | (9,816) |
| NET ASSETS - 100% | | | $4,579,342 |
Legend
(a) Non-income producing
(b) Security exempt from registration under Rule 144A of the Securities Act of 1933. These securities may be resold in transactions exempt from registration, normally to qualified institutional buyers. At the end of the period, the value of these securities amounted to $1,322,000 or 0.0% of net assets.
(c) Affiliated fund that is generally available only to investment companies and other accounts managed by Fidelity Investments. The rate quoted is the annualized seven-day yield of the fund at period end. A complete unaudited listing of the fund's holdings as of its most recent quarter end is available upon request. In addition, each Fidelity Central Fund's financial statements, which are not covered by the Fund's Report of Independent Registered Public Accounting Firm, are available on the SEC's website or upon request.
Affiliated Central Funds
Information regarding fiscal year to date income earned by the Fund from investments in Fidelity Central Funds is as follows:
| Fund | Income earned |
| | (Amounts in thousands) |
| Fidelity Cash Central Fund | $1,274 |
| Fidelity Securities Lending Cash Central Fund | 5 |
| Total | $1,279 |
Amounts in the income column in the above table include any capital gain distributions from underlying funds, which are presented in the corresponding line-item in the Statement of Operations if applicable.
Investment Valuation
All investments are categorized as Level 1 under the Fair Value Hierarchy. The inputs or methodology used for valuing securities may not be an indication of the risk associated with investing in those securities. For more information on valuation inputs please refer to the Investment Valuation section in the accompanying Notes to Financial Statements.
See accompanying notes which are an integral part of the financial statements.
Financial Statements
Statement of Assets and Liabilities
| Amounts in thousands (except per-share amounts) | | June 30, 2018 |
| Assets | | |
Investment in securities, at value — See accompanying schedule:
Unaffiliated issuers (cost $3,041,630) | $4,506,442 | |
| Fidelity Central Funds (cost $82,716) | 82,716 | |
| Total Investment in Securities (cost $3,124,346) | | $4,589,158 |
| Cash | | 1 |
| Receivable for investments sold | | 16,034 |
| Receivable for fund shares sold | | 619 |
| Dividends receivable | | 1,844 |
| Distributions receivable from Fidelity Central Funds | | 116 |
| Other receivables | | 216 |
| Total assets | | 4,607,988 |
| Liabilities | | |
| Payable for investments purchased | $23,738 | |
| Payable for fund shares redeemed | 2,767 | |
| Accrued management fee | 1,292 | |
| Other affiliated payables | 589 | |
| Other payables and accrued expenses | 260 | |
| Total liabilities | | 28,646 |
| Net Assets | | $4,579,342 |
| Net Assets consist of: | | |
| Paid in capital | | $2,895,199 |
| Undistributed net investment income | | 19,707 |
| Accumulated undistributed net realized gain (loss) on investments and foreign currency transactions | | 199,640 |
| Net unrealized appreciation (depreciation) on investments and assets and liabilities in foreign currencies | | 1,464,796 |
| Net Assets | | $4,579,342 |
| Fidelity Fund: | | |
| Net Asset Value, offering price and redemption price per share ($4,129,146 ÷ 88,112 shares) | | $46.86 |
| Class K: | | |
| Net Asset Value, offering price and redemption price per share ($450,196 ÷ 9,607 shares) | | $46.86 |
See accompanying notes which are an integral part of the financial statements.
Statement of Operations
| Amounts in thousands | | Year ended June 30, 2018 |
| Investment Income | | |
| Dividends | | $67,227 |
| Interest | | 12 |
| Income from Fidelity Central Funds | | 1,279 |
| Total income | | 68,518 |
| Expenses | | |
| Management fee | $15,331 | |
| Transfer agent fees | 5,968 | |
| Accounting and security lending fees | 1,066 | |
| Custodian fees and expenses | 73 | |
| Independent trustees' fees and expenses | 20 | |
| Registration fees | 50 | |
| Audit | 77 | |
| Legal | 13 | |
| Miscellaneous | 34 | |
| Total expenses before reductions | 22,632 | |
| Expense reductions | (165) | |
| Total expenses after reductions | | 22,467 |
| Net investment income (loss) | | 46,051 |
| Realized and Unrealized Gain (Loss) | | |
| Net realized gain (loss) on: | | |
| Investment securities: | | |
| Unaffiliated issuers | 301,875 | |
| Foreign currency transactions | 11 | |
| Futures contracts | 3,143 | |
| Total net realized gain (loss) | | 305,029 |
| Change in net unrealized appreciation (depreciation) on: | | |
| Investment securities: | | |
| Unaffiliated issuers | 389,195 | |
| Assets and liabilities in foreign currencies | 4 | |
| Futures contracts | 389 | |
| Total change in net unrealized appreciation (depreciation) | | 389,588 |
| Net gain (loss) | | 694,617 |
| Net increase (decrease) in net assets resulting from operations | | $740,668 |
See accompanying notes which are an integral part of the financial statements.
Statement of Changes in Net Assets
| Amounts in thousands | Year ended June 30, 2018 | Year ended June 30, 2017 |
| Increase (Decrease) in Net Assets | | |
| Operations | | |
| Net investment income (loss) | $46,051 | $46,426 |
| Net realized gain (loss) | 305,029 | 514,093 |
| Change in net unrealized appreciation (depreciation) | 389,588 | 31,250 |
| Net increase (decrease) in net assets resulting from operations | 740,668 | 591,769 |
| Distributions to shareholders from net investment income | (45,244) | (45,768) |
| Distributions to shareholders from net realized gain | (472,239) | (254,005) |
| Total distributions | (517,483) | (299,773) |
| Share transactions - net increase (decrease) | (90,479) | (302,961) |
| Total increase (decrease) in net assets | 132,706 | (10,965) |
| Net Assets | | |
| Beginning of period | 4,446,636 | 4,457,601 |
| End of period | $4,579,342 | $4,446,636 |
| Other Information | | |
| Undistributed net investment income end of period | $19,707 | $20,009 |
See accompanying notes which are an integral part of the financial statements.
Financial Highlights
Fidelity Fund
| Years ended June 30, | 2018 | 2017 | 2016 | 2015 | 2014 |
| Selected Per–Share Data | | | | | |
| Net asset value, beginning of period | $44.92 | $42.04 | $44.69 | $45.42 | $39.77 |
| Income from Investment Operations | | | | | |
| Net investment income (loss)A | .45 | .44 | .38 | .34 | .35 |
| Net realized and unrealized gain (loss) | 6.74 | 5.33 | (.73) | 3.91 | 8.61 |
| Total from investment operations | 7.19 | 5.77 | (.35) | 4.25 | 8.96 |
| Distributions from net investment income | (.45) | (.44) | (.31) | (.30) | (.32) |
| Distributions from net realized gain | (4.80) | (2.45) | (1.99) | (4.68) | (2.98) |
| Total distributions | (5.25) | (2.89) | (2.30) | (4.98) | (3.31)B |
| Net asset value, end of period | $46.86 | $44.92 | $42.04 | $44.69 | $45.42 |
| Total ReturnC | 17.51% | 14.34% | (.83)% | 10.52% | 23.70% |
| Ratios to Average Net AssetsD,E | | | | | |
| Expenses before reductions | .50% | .52% | .52% | .52% | .53% |
| Expenses net of fee waivers, if any | .50% | .52% | .52% | .52% | .53% |
| Expenses net of all reductions | .50% | .51% | .52% | .52% | .53% |
| Net investment income (loss) | .99% | 1.04% | .91% | .79% | .82% |
| Supplemental Data | | | | | |
| Net assets, end of period (in millions) | $4,129 | $3,884 | $3,762 | $4,143 | $4,811 |
| Portfolio turnover rateF | 38% | 82% | 67% | 59%G | 93% |
A Calculated based on average shares outstanding during the period.
B Total distributions of $3.31 per share is comprised of distributions from net investment income of $.324 and distributions from net realized gain of $2.984 per share.
C Total returns would have been lower if certain expenses had not been reduced during the applicable periods shown.
D Fees and expenses of any underlying Fidelity Central Funds are not included in the Fund's expense ratio. The Fund indirectly bears its proportionate share of the expenses of any underlying Fidelity Central Funds.
E Expense ratios reflect operating expenses of the class. Expenses before reductions do not reflect amounts reimbursed by the investment adviser or reductions from brokerage service arrangements or reductions from other expense offset arrangements and do not represent the amount paid by the class during periods when reimbursements or reductions occur. Expenses net of fee waivers reflect expenses after reimbursement by the investment adviser but prior to reductions from brokerage service arrangements or other expense offset arrangements. Expenses net of all reductions represent the net expenses paid by the class.
F Amount does not include the portfolio activity of any underlying Fidelity Central Funds.
G Portfolio turnover rate excludes securities received or delivered in-kind.
See accompanying notes which are an integral part of the financial statements.
Fidelity Fund Class K
| Years ended June 30, | 2018 | 2017 | 2016 | 2015 | 2014 |
| Selected Per–Share Data | | | | | |
| Net asset value, beginning of period | $44.92 | $42.04 | $44.69 | $45.42 | $39.78 |
| Income from Investment Operations | | | | | |
| Net investment income (loss)A | .49 | .49 | .42 | .39 | .40 |
| Net realized and unrealized gain (loss) | 6.74 | 5.32 | (.72) | 3.91 | 8.60 |
| Total from investment operations | 7.23 | 5.81 | (.30) | 4.30 | 9.00 |
| Distributions from net investment income | (.49) | (.48) | (.36) | (.35) | (.38) |
| Distributions from net realized gain | (4.80) | (2.45) | (1.99) | (4.68) | (2.98) |
| Total distributions | (5.29) | (2.93) | (2.35) | (5.03) | (3.36) |
| Net asset value, end of period | $46.86 | $44.92 | $42.04 | $44.69 | $45.42 |
| Total ReturnB | 17.63% | 14.46% | (.72)% | 10.65% | 23.83% |
| Ratios to Average Net AssetsC,D | | | | | |
| Expenses before reductions | .41% | .41% | .41% | .41% | .41% |
| Expenses net of fee waivers, if any | .41% | .41% | .41% | .41% | .41% |
| Expenses net of all reductions | .40% | .41% | .41% | .41% | .41% |
| Net investment income (loss) | 1.08% | 1.14% | 1.02% | .90% | .94% |
| Supplemental Data | | | | | |
| Net assets, end of period (in millions) | $450 | $563 | $696 | $952 | $1,119 |
| Portfolio turnover rateE | 38% | 82% | 67% | 59%F | 93% |
A Calculated based on average shares outstanding during the period.
B Total returns would have been lower if certain expenses had not been reduced during the applicable periods shown.
C Fees and expenses of any underlying Fidelity Central Funds are not included in the Fund's expense ratio. The Fund indirectly bears its proportionate share of the expenses of any underlying Fidelity Central Funds.
D Expense ratios reflect operating expenses of the class. Expenses before reductions do not reflect amounts reimbursed by the investment adviser or reductions from brokerage service arrangements or reductions from other expense offset arrangements and do not represent the amount paid by the class during periods when reimbursements or reductions occur. Expenses net of fee waivers reflect expenses after reimbursement by the investment adviser but prior to reductions from brokerage service arrangements or other expense offset arrangements. Expenses net of all reductions represent the net expenses paid by the class.
E Amount does not include the portfolio activity of any underlying Fidelity Central Funds.
F Portfolio turnover rate excludes securities received or delivered in-kind.
See accompanying notes which are an integral part of the financial statements.
Notes to Financial Statements
For the period ended June 30, 2018
(Amounts in thousands except percentages)
1. Organization.
Fidelity Fund (the Fund) is a fund of Fidelity Hastings Street Trust (the Trust) and is authorized to issue an unlimited number of shares. The Trust is registered under the Investment Company Act of 1940, as amended (the 1940 Act), as an open-end management investment company organized as a Massachusetts business trust. The Fund offers Fidelity Fund and Class K shares, each of which has equal rights as to assets and voting privileges. Each class has exclusive voting rights with respect to matters that affect that class.
2. Investments in Fidelity Central Funds.
The Fund invests in Fidelity Central Funds, which are open-end investment companies generally available only to other investment companies and accounts managed by the investment adviser and its affiliates. The Fund's Schedule of Investments lists each of the Fidelity Central Funds held as of period end, if any, as an investment of the Fund, but does not include the underlying holdings of each Fidelity Central Fund. As an Investing Fund, the Fund indirectly bears its proportionate share of the expenses of the underlying Fidelity Central Funds.
The Money Market Central Funds seek preservation of capital and current income and are managed by Fidelity Investments Money Management, Inc. (FIMM), an affiliate of the investment adviser. Annualized expenses of the Money Market Central Funds as of their most recent shareholder report date are less than .005%.
A complete unaudited list of holdings for each Fidelity Central Fund is available upon request or at the Securities and Exchange Commission (the SEC) website at www.sec.gov. In addition, the financial statements of the Fidelity Central Funds, which are not covered by the Fund's Report of Independent Registered Public Accounting Firm, are available on the SEC website or upon request.
3. Significant Accounting Policies.
The Fund is an investment company and applies the accounting and reporting guidance of the Financial Accounting Standards Board (FASB) Accounting Standards Codification Topic 946 Financial Services – Investments Companies. The financial statements have been prepared in conformity with accounting principles generally accepted in the United States of America (GAAP), which require management to make certain estimates and assumptions at the date of the financial statements. Actual results could differ from those estimates. Subsequent events, if any, through the date that the financial statements were issued have been evaluated in the preparation of the financial statements. The following summarizes the significant accounting policies of the Fund:
Investment Valuation. Investments are valued as of 4:00 p.m. Eastern time on the last calendar day of the period. The Board of Trustees (the Board) has delegated the day to day responsibility for the valuation of the Fund's investments to the Fair Value Committee (the Committee) established by the Fund's investment adviser. In accordance with valuation policies and procedures approved by the Board, the Fund attempts to obtain prices from one or more third party pricing vendors or brokers to value its investments. When current market prices, quotations or currency exchange rates are not readily available or reliable, investments will be fair valued in good faith by the Committee, in accordance with procedures adopted by the Board. Factors used in determining fair value vary by investment type and may include market or investment specific events. The frequency with which these procedures are used cannot be predicted and they may be utilized to a significant extent. The Committee oversees the Fund's valuation policies and procedures and reports to the Board on the Committee's activities and fair value determinations. The Board monitors the appropriateness of the procedures used in valuing the Fund's investments and ratifies the fair value determinations of the Committee.
The Fund categorizes the inputs to valuation techniques used to value its investments into a disclosure hierarchy consisting of three levels as shown below:
- Level 1 – quoted prices in active markets for identical investments
- Level 2 – other significant observable inputs (including quoted prices for similar investments, interest rates, prepayment speeds, etc.)
- Level 3 – unobservable inputs (including the Fund's own assumptions based on the best information available)
Valuation techniques used to value the Fund's investments by major category are as follows:
Equity securities, including restricted securities, for which market quotations are readily available, are valued at the last reported sale price or official closing price as reported by a third party pricing vendor on the primary market or exchange on which they are traded and are categorized as Level 1 in the hierarchy. In the event there were no sales during the day or closing prices are not available, securities are valued at the last quoted bid price or may be valued using the last available price and are generally categorized as Level 2 in the hierarchy. For foreign equity securities, when market or security specific events arise, comparisons to the valuation of American Depositary Receipts (ADRs), futures contracts, Exchange-Traded Funds (ETFs) and certain indexes as well as quoted prices for similar securities may be used and would be categorized as Level 2 in the hierarchy. Utilizing these techniques may result in transfers between Level 1 and Level 2. For equity securities, including restricted securities, where observable inputs are limited, assumptions about market activity and risk are used and these securities may be categorized as Level 3 in the hierarchy.
Investments in open-end mutual funds, including the Fidelity Central Funds, are valued at their closing net asset value (NAV) each business day and are categorized as Level 1 in the hierarchy.
Changes in valuation techniques may result in transfers in or out of an assigned level within the disclosure hierarchy.
Foreign Currency. The Fund may use foreign currency contracts to facilitate transactions in foreign-denominated securities. Gains and losses from these transactions may arise from changes in the value of the foreign currency or if the counterparties do not perform under the contracts' terms.
Foreign-denominated assets, including investment securities, and liabilities are translated into U.S. dollars at the exchange rates at period end. Purchases and sales of investment securities, income and dividends received and expenses denominated in foreign currencies are translated into U.S. dollars at the exchange rate in effect on the transaction date.
The effects of exchange rate fluctuations on investments are included with the net realized and unrealized gain (loss) on investment securities. Other foreign currency transactions resulting in realized and unrealized gain (loss) are disclosed separately.
Investment Transactions and Income. For financial reporting purposes, the Fund's investment holdings and NAV include trades executed through the end of the last business day of the period. The NAV per share for processing shareholder transactions is calculated as of the close of business of the New York Stock Exchange (NYSE), normally 4:00 p.m. Eastern time and includes trades executed through the end of the prior business day. Gains and losses on securities sold are determined on the basis of identified cost and include proceeds received from litigation. Dividend income is recorded on the ex-dividend date, except for certain dividends from foreign securities where the ex-dividend date may have passed, which are recorded as soon as the Fund is informed of the ex-dividend date. Non-cash dividends included in dividend income, if any, are recorded at the fair market value of the securities received. Income and capital gain distributions from Fidelity Central Funds, if any, are recorded on the ex-dividend date. Certain distributions received by the Fund represent a return of capital or capital gain. The Fund determines the components of these distributions subsequent to the ex-dividend date, based upon receipt of tax filings or other correspondence relating to the underlying investment. These distributions are recorded as a reduction of cost of investments and/or as a realized gain. Interest income is accrued as earned and includes coupon interest and amortization of premium and accretion of discount on debt securities as applicable. Investment income is recorded net of foreign taxes withheld where recovery of such taxes is uncertain.
Class Allocations and Expenses. Investment income, realized and unrealized capital gains and losses, common expenses of the Fund, and certain fund-level expense reductions, if any, are allocated daily on a pro-rata basis to each class based on the relative net assets of each class to the total net assets of the Fund. Each class differs with respect to transfer agent fees incurred. Certain expense reductions may also differ by class. For the reporting period, the allocated portion of income and expenses to each class as a percent of its average net assets may vary due to the timing of recording these transactions in relation to fluctuating net assets of the classes. Expenses directly attributable to a fund are charged to that fund. Expenses attributable to more than one fund are allocated among the respective funds on the basis of relative net assets or other appropriate methods. Expense estimates are accrued in the period to which they relate and adjustments are made when actual amounts are known.
Deferred Trustee Compensation. Under a Deferred Compensation Plan (the Plan), certain independent Trustees have elected to defer receipt of a portion of their annual compensation. Deferred amounts are invested in a cross-section of Fidelity funds, are marked-to-market and remain in the Fund until distributed in accordance with the Plan. The investment of deferred amounts and the offsetting payable to the Trustees of $176 are included in the accompanying Statement of Assets and Liabilities in other receivables and other payables and accrued expenses, respectively.
Income Tax Information and Distributions to Shareholders. Each year, the Fund intends to qualify as a regulated investment company under Subchapter M of the Internal Revenue Code, including distributing substantially all of its taxable income and realized gains. As a result, no provision for U.S. Federal income taxes is required. As of June 30, 2018, the Fund did not have any unrecognized tax benefits in the financial statements; nor is the Fund aware of any tax positions for which it is reasonably possible that the total amounts of unrecognized tax benefits will significantly change in the next twelve months. The Fund files a U.S. federal tax return, in addition to state and local tax returns as required. The Fund's federal income tax returns are subject to examination by the Internal Revenue Service (IRS) for a period of three fiscal years after they are filed. State and local tax returns may be subject to examination for an additional fiscal year depending on the jurisdiction. Foreign taxes are provided for based on the Fund's understanding of the tax rules and rates that exist in the foreign markets in which it invests.
Distributions are declared and recorded on the ex-dividend date. Income and capital gain distributions are declared separately for each class. Income and capital gain distributions are determined in accordance with income tax regulations, which may differ from GAAP. In addition, the Fund claimed a portion of the payment made to redeeming shareholders as a distribution for income tax purposes.
Capital accounts within the financial statements are adjusted for permanent book-tax differences. These adjustments have no impact on net assets or the results of operations. Capital accounts are not adjusted for temporary book-tax differences which will reverse in a subsequent period.
Book-tax differences are primarily due to futures contracts, foreign currency transactions, passive foreign investment companies (PFIC), market discount, partnerships, deferred trustees compensation and losses deferred due to wash sales.
As of period end, the cost and unrealized appreciation (depreciation) in securities, and derivatives if applicable, for federal income tax purposes were as follows:
| Gross unrealized appreciation | $1,512,246 |
| Gross unrealized depreciation | (51,056) |
| Net unrealized appreciation (depreciation) | $1,461,190 |
| Tax Cost | $3,127,968 |
The tax-based components of distributable earnings as of period end were as follows:
| Undistributed ordinary income | $19,883 |
| Undistributed long-term capital gain | $203,262 |
| Net unrealized appreciation (depreciation) on securities and other investments | $1,461,174 |
The tax character of distributions paid was as follows:
| | June 30, 2018 | June 30, 2017 |
| Ordinary Income | $45,244 | $ 45,768 |
| Long-term Capital Gains | 472,239 | 254,005 |
| Total | $517,483 | $ 299,773 |
Restricted Securities. The Fund may invest in securities that are subject to legal or contractual restrictions on resale. These securities generally may be resold in transactions exempt from registration or to the public if the securities are registered. Disposal of these securities may involve time-consuming negotiations and expense, and prompt sale at an acceptable price may be difficult. Information regarding restricted securities is included at the end of the Fund's Schedule of Investments.
4. Derivative Instruments.
Risk Exposures and the Use of Derivative Instruments. The Fund's investment objective allows the Fund to enter into various types of derivative contracts, including futures contracts. Derivatives are investments whose value is primarily derived from underlying assets, indices or reference rates and may be transacted on an exchange or over-the-counter (OTC). Derivatives may involve a future commitment to buy or sell a specified asset based on specified terms, to exchange future cash flows at periodic intervals based on a notional principal amount, or for one party to make one or more payments upon the occurrence of specified events in exchange for periodic payments from the other party.
The Fund used derivatives to increase returns and to manage exposure to certain risks as defined below. The success of any strategy involving derivatives depends on analysis of numerous economic factors, and if the strategies for investment do not work as intended, the Fund may not achieve its objectives.
The Fund's use of derivatives increased or decreased its exposure to the following risk:
| Equity Risk | Equity risk relates to the fluctuations in the value of financial instruments as a result of changes in market prices (other than those arising from interest rate risk or foreign exchange risk), whether caused by factors specific to an individual investment, its issuer, or all factors affecting all instruments traded in a market or market segment.
|
The Fund is also exposed to additional risks from investing in derivatives, such as liquidity risk and counterparty credit risk. Liquidity risk is the risk that the Fund will be unable to close out the derivative in the open market in a timely manner. Counterparty credit risk is the risk that the counterparty will not be able to fulfill its obligation to the Fund. Counterparty credit risk related to exchange-traded futures contracts may be mitigated by the protection provided by the exchange on which they trade.
Investing in derivatives may involve greater risks than investing in the underlying assets directly and, to varying degrees, may involve risk of loss in excess of any initial investment and collateral received and amounts recognized in the Statement of Assets and Liabilities. In addition, there may be the risk that the change in value of the derivative contract does not correspond to the change in value of the underlying instrument.
Futures Contracts. A futures contract is an agreement between two parties to buy or sell a specified underlying instrument for a fixed price at a specified future date. The Fund used futures contracts to manage its exposure to the stock market.
Upon entering into a futures contract, a fund is required to deposit either cash or securities (initial margin) with a clearing broker in an amount equal to a certain percentage of the face value of the contract. Futures contracts are marked-to-market daily and subsequent daily payments (variation margin) are made or received by a fund depending on the daily fluctuations in the value of the futures contracts and are recorded as unrealized appreciation or (depreciation). This receivable and/or payable, if any, is included in daily variation margin on futures contracts in the Statement of Assets and Liabilities. Realized gain or (loss) is recorded upon the expiration or closing of a futures contract. The net realized gain (loss) and change in net unrealized appreciation (depreciation) on futures contracts during the period is presented in the Statement of Operations.
Any open futures contracts at period end are presented in the Schedule of Investments under the caption "Futures Contracts". The notional amount at value reflects each contract's exposure to the underlying instrument or index at period end.
5. Purchases and Sales of Investments.
Purchases and sales of securities, other than short-term securities, aggregated $1,691,142 and $2,216,091, respectively.
6. Fees and Other Transactions with Affiliates.
Management Fee. Fidelity Management & Research Company (the investment adviser) and its affiliates provide the Fund with investment management related services for which the Fund pays a monthly management fee. The management fee is the sum of an individual fund fee rate that is based on an annual rate of .09% of the Fund's average net assets and an annualized group fee rate that averaged .24% during the period. The group fee rate is based upon the average net assets of all the mutual funds advised by the investment adviser, including any mutual funds previously advised by the investment adviser that are currently advised by Fidelity SelectCo, LLC, an affiliate of the investment adviser. The group fee rate decreases as assets under management increase and increases as assets under management decrease. For the reporting period, the total annual management fee rate was .33% of the Fund's average net assets.
Transfer Agent Fees. Fidelity Investments Institutional Operations Company, Inc., (FIIOC), an affiliate of the investment adviser, is the transfer, dividend disbursing and shareholder servicing agent for each class of the Fund. FIIOC receives account fees and asset-based fees that vary according to the account size and type of account of the shareholders of Fidelity Fund, except for Class K. FIIOC receives an asset-based fee of Class K's average net assets. FIIOC pays for typesetting, printing and mailing of shareholder reports, except proxy statements.
For the period, transfer agent fees for each class were as follows:
| | Amount | % of Class-Level Average Net Assets |
| Fidelity Fund | $5,741 | .14 |
| Class K | 227 | .05 |
| | $5,968 | |
Accounting and Security Lending Fees. Fidelity Service Company, Inc. (FSC), an affiliate of the investment adviser, maintains the Fund's accounting records. The accounting fee is based on the level of average net assets for each month. Under a separate contract, FSC administers the security lending program. The security lending fee is based on the number and duration of lending transactions. For the period, the fees were equivalent to an annual rate of .02%.
Brokerage Commissions. The Fund placed a portion of its portfolio transactions with brokerage firms which are affiliates of the investment adviser. Brokerage commissions are included in net realized gain (loss) and change in net unrealized appreciation (depreciation) in the Statement of Operations. The commissions paid to these affiliated firms were $41 for the period.
Interfund Trades. The Fund may purchase from or sell securities to other Fidelity Funds under procedures adopted by the Board. The procedures have been designed to ensure these interfund trades are executed in accordance with Rule 17a-7 of the 1940 Act. Interfund trades are included within the respective purchases and sales amounts shown in the Purchases and Sales of Investments note.
7. Committed Line of Credit.
The Fund participates with other funds managed by the investment adviser or an affiliate in a $4.25 billion credit facility (the "line of credit") to be utilized for temporary or emergency purposes to fund shareholder redemptions or for other short-term liquidity purposes. The Fund has agreed to pay commitment fees on its pro-rata portion of the line of credit, which amounted to $13 and is reflected in Miscellaneous expenses on the Statement of Operations. During the period, the Fund did not borrow on this line of credit.
8. Security Lending.
The Fund lends portfolio securities through a lending agent from time to time in order to earn additional income. For equity securities, a lending agent is used and may loan securities to certain qualified borrowers, including Fidelity Capital Markets (FCM), a broker-dealer affiliated with the Fund. On the settlement date of the loan, the Fund receives collateral (in the form of U.S. Treasury obligations, letters of credit and/or cash) against the loaned securities and maintains collateral in an amount not less than 100% of the market value of the loaned securities during the period of the loan. The market value of the loaned securities is determined at the close of business of the Fund and any additional required collateral is delivered to the Fund on the next business day. The Fund or borrower may terminate the loan at any time, and if the borrower defaults on its obligation to return the securities loaned because of insolvency or other reasons, the Fund may apply collateral received from the borrower against the obligation. The Fund may experience delays and costs in recovering the securities loaned. Any cash collateral received is invested in the Fidelity Securities Lending Cash Central Fund. At period end, there were no security loans outstanding. Security lending income represents the income earned on investing cash collateral, less rebates paid to borrowers and any lending agent fees associated with the loan, plus any premium payments received for lending certain types of securities. Security lending income is presented in the Statement of Operations as a component of income from Fidelity Central Funds. Total security lending income during the period amounted to $5. During the period, there were no securities loaned to FCM.
9. Expense Reductions.
Commissions paid to certain brokers with whom the investment adviser, or its affiliates, places trades on behalf of the Fund include an amount in addition to trade execution, which may be rebated back to the Fund to offset certain expenses. This amount totaled $122 for the period.
In addition, during the period the investment adviser reimbursed and/or waived a portion of fund-level operating expenses in the amount of $43.
10. Distributions to Shareholders.
Distributions to shareholders of each class were as follows:
| | Year ended
June 30, 2018 | Year ended
June 30, 2017 |
| From net investment income | | |
| Fidelity Fund | $39,636 | $38,394 |
| Class K | 5,608 | 7,374 |
| Total | $45,244 | $45,768 |
| From net realized gain | | |
| Fidelity Fund | $414,639 | $216,202 |
| Class K | 57,600 | 37,803 |
| Total | $472,239 | $254,005 |
11. Share Transactions.
Share transactions for each class were as follows and may contain automatic conversions between classes or exchanges between affiliated funds:
| | Shares | Shares | Dollars | Dollars |
| | Year ended June 30, 2018 | Year ended June 30, 2017 | Year ended June 30, 2018 | Year ended June 30, 2017 |
| Fidelity Fund | | | | |
| Shares sold | 2,503 | 2,301 | $115,122 | $98,348 |
| Reinvestment of distributions | 9,897 | 5,609 | 419,088 | 234,849 |
| Shares redeemed | (10,747) | (10,936) | (491,309) | (466,956) |
| Net increase (decrease) | 1,653 | (3,026) | $42,901 | $(133,759) |
| Class K | | | | |
| Shares sold | 1,517 | 1,298 | $69,781 | $55,407 |
| Reinvestment of distributions | 1,498 | 1,079 | 63,208 | 45,177 |
| Shares redeemed | (5,937) | (6,399) | (266,369) | (269,786) |
| Net increase (decrease) | (2,922) | (4,022) | $(133,380) | $(169,202) |
12. Other.
The Fund's organizational documents provide former and current trustees and officers with a limited indemnification against liabilities arising in connection with the performance of their duties to the Fund. In the normal course of business, the Fund may also enter into contracts that provide general indemnifications. The Fund's maximum exposure under these arrangements is unknown as this would be dependent on future claims that may be made against the Fund. The risk of material loss from such claims is considered remote.
Report of Independent Registered Public Accounting Firm
To the Board of Trustees of Fidelity Hastings Street Trust and Shareholders of Fidelity Fund:
Opinion on the Financial Statements
We have audited the accompanying statement of assets and liabilities, including the schedule of investments, of Fidelity Fund (one of the funds constituting Fidelity Hastings Street Trust, referred to hereafter as the "Fund") as of June 30, 2018, the related statement of operations for the year ended June 30, 2018, the statement of changes in net assets for each of the two years in the period ended June 30, 2018, including the related notes, and the financial highlights for each of the five years in the period ended June 30, 2018 (collectively referred to as the “financial statements”). In our opinion, the financial statements present fairly, in all material respects, the financial position of the Fund as of June 30, 2018, the results of its operations for the year then ended, the changes in its net assets for each of the two years in the period ended June 30, 2018 and the financial highlights for each of the five years in the period ended June 30, 2018 in conformity with accounting principles generally accepted in the United States of America.
Basis for Opinion
These financial statements are the responsibility of the Fund’s management. Our responsibility is to express an opinion on the Fund’s financial statements based on our audits. We are a public accounting firm registered with the Public Company Accounting Oversight Board (United States) (“PCAOB”) and are required to be independent with respect to the Fund in accordance with the U.S. federal securities laws and the applicable rules and regulations of the Securities and Exchange Commission and the PCAOB.
We conducted our audits of these financial statements in accordance with the standards of the PCAOB. Those standards require that we plan and perform the audit to obtain reasonable assurance about whether the financial statements are free of material misstatement, whether due to error or fraud.
Our audits included performing procedures to assess the risks of material misstatement of the financial statements, whether due to error or fraud, and performing procedures that respond to those risks. Such procedures included examining, on a test basis, evidence regarding the amounts and disclosures in the financial statements. Our audits also included evaluating the accounting principles used and significant estimates made by management, as well as evaluating the overall presentation of the financial statements. Our procedures included confirmation of securities owned as of June 30, 2018 by correspondence with the custodian and brokers; when replies were not received from brokers, we performed other auditing procedures. We believe that our audits provide a reasonable basis for our opinion.
PricewaterhouseCoopers LLP
Boston, Massachusetts
August 13, 2018
We have served as the auditor of one or more investment companies in the Fidelity group of funds since 1932.
Trustees and Officers
The Trustees, Members of the Advisory Board (if any), and officers of the trust and fund, as applicable, are listed below. The Board of Trustees governs the fund and is responsible for protecting the interests of shareholders. The Trustees are experienced executives who meet periodically throughout the year to oversee the fund's activities, review contractual arrangements with companies that provide services to the fund, oversee management of the risks associated with such activities and contractual arrangements, and review the fund's performance. Except for Michael E. Wiley, each of the Trustees oversees 284 funds. Mr. Wiley oversees 197 funds.
The Trustees hold office without limit in time except that (a) any Trustee may resign; (b) any Trustee may be removed by written instrument, signed by at least two-thirds of the number of Trustees prior to such removal; (c) any Trustee who requests to be retired or who has become incapacitated by illness or injury may be retired by written instrument signed by a majority of the other Trustees; and (d) any Trustee may be removed at any special meeting of shareholders by a two-thirds vote of the outstanding voting securities of the trust. Each Trustee who is not an interested person (as defined in the 1940 Act) of the trust and the fund is referred to herein as an Independent Trustee. Each Independent Trustee shall retire not later than the last day of the calendar year in which his or her 75th birthday occurs. The Independent Trustees may waive this mandatory retirement age policy with respect to individual Trustees. Officers and Advisory Board Members hold office without limit in time, except that any officer or Advisory Board Member may resign or may be removed by a vote of a majority of the Trustees at any regular meeting or any special meeting of the Trustees. Except as indicated, each individual has held the office shown or other offices in the same company for the past five years.
The fund’s Statement of Additional Information (SAI) includes more information about the Trustees. To request a free copy, call Fidelity at 1-800-835-5092.
Experience, Skills, Attributes, and Qualifications of the Trustees. The Governance and Nominating Committee has adopted a statement of policy that describes the experience, qualifications, attributes, and skills that are necessary and desirable for potential Independent Trustee candidates (Statement of Policy). The Board believes that each Trustee satisfied at the time he or she was initially elected or appointed a Trustee, and continues to satisfy, the standards contemplated by the Statement of Policy. The Governance and Nominating Committee also engages professional search firms to help identify potential Independent Trustee candidates who have the experience, qualifications, attributes, and skills consistent with the Statement of Policy. From time to time, additional criteria based on the composition and skills of the current Independent Trustees, as well as experience or skills that may be appropriate in light of future changes to board composition, business conditions, and regulatory or other developments, have also been considered by the professional search firms and the Governance and Nominating Committee. In addition, the Board takes into account the Trustees' commitment and participation in Board and committee meetings, as well as their leadership of standing and ad hoc committees throughout their tenure.
In determining that a particular Trustee was and continues to be qualified to serve as a Trustee, the Board has considered a variety of criteria, none of which, in isolation, was controlling. The Board believes that, collectively, the Trustees have balanced and diverse experience, qualifications, attributes, and skills, which allow the Board to operate effectively in governing the fund and protecting the interests of shareholders. Information about the specific experience, skills, attributes, and qualifications of each Trustee, which in each case led to the Board's conclusion that the Trustee should serve (or continue to serve) as a trustee of the fund, is provided below.
Board Structure and Oversight Function. James C. Curvey is an interested person and currently serves as Chairman. The Trustees have determined that an interested Chairman is appropriate and benefits shareholders because an interested Chairman has a personal and professional stake in the quality and continuity of services provided to the fund. Independent Trustees exercise their informed business judgment to appoint an individual of their choosing to serve as Chairman, regardless of whether the Trustee happens to be independent or a member of management. The Independent Trustees have determined that they can act independently and effectively without having an Independent Trustee serve as Chairman and that a key structural component for assuring that they are in a position to do so is for the Independent Trustees to constitute a substantial majority for the Board. The Independent Trustees also regularly meet in executive session. Ned C. Lautenbach serves as Chairman of the Independent Trustees and as such (i) acts as a liaison between the Independent Trustees and management with respect to matters important to the Independent Trustees and (ii) with management prepares agendas for Board meetings.
Fidelity® funds are overseen by different Boards of Trustees. The fund's Board oversees Fidelity's high income and certain equity funds, and other Boards oversee Fidelity's investment-grade bond, money market, asset allocation, and other equity funds. The asset allocation funds may invest in Fidelity® funds overseen by the fund's Board. The use of separate Boards, each with its own committee structure, allows the Trustees of each group of Fidelity® funds to focus on the unique issues of the funds they oversee, including common research, investment, and operational issues. On occasion, the separate Boards establish joint committees to address issues of overlapping consequences for the Fidelity® funds overseen by each Board.
The Trustees operate using a system of committees to facilitate the timely and efficient consideration of all matters of importance to the Trustees, the fund, and fund shareholders and to facilitate compliance with legal and regulatory requirements and oversight of the fund's activities and associated risks. The Board, acting through its committees, has charged FMR and its affiliates with (i) identifying events or circumstances the occurrence of which could have demonstrably adverse effects on the fund's business and/or reputation; (ii) implementing processes and controls to lessen the possibility that such events or circumstances occur or to mitigate the effects of such events or circumstances if they do occur; and (iii) creating and maintaining a system designed to evaluate continuously business and market conditions in order to facilitate the identification and implementation processes described in (i) and (ii) above. Because the day-to-day operations and activities of the fund are carried out by or through FMR, its affiliates, and other service providers, the fund's exposure to risks is mitigated but not eliminated by the processes overseen by the Trustees. While each of the Board's committees has responsibility for overseeing different aspects of the fund's activities, oversight is exercised primarily through the Operations, Audit, and Compliance Committees. In addition, the Independent Trustees have worked with Fidelity to enhance the Board's oversight of investment and financial risks, legal and regulatory risks, technology risks, and operational risks, including the development of additional risk reporting to the Board. Appropriate personnel, including but not limited to the fund's Chief Compliance Officer (CCO), FMR's internal auditor, the independent accountants, the fund's Treasurer and portfolio management personnel, make periodic reports to the Board's committees, as appropriate, including an annual review of Fidelity's risk management program for the Fidelity® funds. The responsibilities of each standing committee, including their oversight responsibilities, are described further under "Standing Committees of the Trustees."
Interested Trustees*:
Correspondence intended for a Trustee who is an interested person may be sent to Fidelity Investments, 245 Summer Street, Boston, Massachusetts 02210.
Name, Year of Birth; Principal Occupations and Other Relevant Experience+
James C. Curvey (1935)
Year of Election or Appointment: 2007
Trustee
Chairman of the Board of Trustees
Mr. Curvey also serves as Trustee of other Fidelity® funds. Mr. Curvey is Vice Chairman (2007-present) and Director of FMR LLC (diversified financial services company). In addition, Mr. Curvey is an Overseer Emeritus for the Boston Symphony Orchestra, a Director of Artis-Naples, and a Trustee of Brewster Academy in Wolfeboro, New Hampshire. Previously, Mr. Curvey served as a Director of Fidelity Research & Analysis Co. (investment adviser firm, 2009-2018), Director of Fidelity Investments Money Management, Inc. (investment adviser firm, 2009-2014) and a Director of FMR and FMR Co., Inc. (investment adviser firms, 2007-2014).
Charles S. Morrison (1960)
Year of Election or Appointment: 2014
Trustee
Mr. Morrison also serves as Trustee of other funds. He serves as President of Fidelity SelectCo, LLC (investment adviser firm, 2017-present) and Fidelity Management & Research Company (FMR) (investment adviser firm, 2016-present), a Director of Fidelity Investments Money Management, Inc. (FIMM) (investment adviser firm, 2014-present), Director of Fidelity SelectCo, LLC (investment adviser firm, 2014-present), President, Asset Management (2014-present), and is an employee of Fidelity Investments. Previously, Mr. Morrison served as Vice President of Fidelity's Fixed Income and Asset Allocation Funds (2012-2014), President, Fixed Income (2011-2014), Vice President of Fidelity's Money Market Funds (2005-2009), President, Money Market Group Leader of FMR (investment adviser firm, 2009), and Senior Vice President, Money Market Group of FMR (2004-2009). Mr. Morrison also served as Vice President of Fidelity's Bond Funds (2002-2005), certain Balanced Funds (2002-2005), and certain Asset Allocation Funds (2002-2007), and as Senior Vice President (2002-2005) of Fidelity's Bond Division.
* Determined to be an “Interested Trustee” by virtue of, among other things, his or her affiliation with the trust or various entities under common control with FMR.
+ The information includes the Trustee's principal occupation during the last five years and other information relating to the experience, attributes, and skills relevant to the Trustee's qualifications to serve as a Trustee, which led to the conclusion that the Trustee should serve as a Trustee for the fund.
Independent Trustees:
Correspondence intended for an Independent Trustee may be sent to Fidelity Investments, P.O. Box 55235, Boston, Massachusetts 02205-5235.
Name, Year of Birth; Principal Occupations and Other Relevant Experience+
Dennis J. Dirks (1948)
Year of Election or Appointment: 2005
Trustee
Mr. Dirks also serves as Trustee of other Fidelity® funds. Prior to his retirement in May 2003, Mr. Dirks was Chief Operating Officer and a member of the Board of The Depository Trust & Clearing Corporation (DTCC). He also served as President, Chief Operating Officer, and Board member of The Depository Trust Company (DTC) and President and Board member of the National Securities Clearing Corporation (NSCC). In addition, Mr. Dirks served as Chief Executive Officer and Board member of the Government Securities Clearing Corporation, Chief Executive Officer and Board member of the Mortgage-Backed Securities Clearing Corporation, as a Trustee and a member of the Finance Committee of Manhattan College (2005-2008), as a Trustee and a member of the Finance Committee of AHRC of Nassau County (2006-2008), as a member of the Independent Directors Council (IDC) Governing Council (2010-2015), and as a member of the Board of Directors for The Brookville Center for Children’s Services, Inc. (2009-2017). Mr. Dirks is a member of the Finance Committee (2016-present), Board of Directors (2017-present) and Board of Trustees (2018-present) and is Treasurer (2018-present) of the Asolo Repertory Theatre.
Donald F. Donahue (1950)
Year of Election or Appointment: 2018
Trustee
Mr. Donahue also serves as a Trustee of other Fidelity® funds. Mr. Donahue is President and Chief Executive Officer of Miranda Partners, LLC (risk consulting for the financial services industry, 2012-present). Previously, Mr. Donahue served as a Member of the Advisory Board of certain Fidelity® funds (2015-2018) and Chief Executive Officer (2006-2012), Chief Operating Officer (2003-2006), and Managing Director, Customer Marketing and Development (1999-2003) of The Depository Trust & Clearing Corporation (financial markets infrastructure). Mr. Donahue serves as a Member (2007-present) and Co-Chairman (2016-present) of the Board of Directors of United Way of New York, Member of the Board of Directors of NYC Leadership Academy (2012-present) and Member of the Board of Advisors of Ripple Labs, Inc. (financial services, 2015-present). He also served as Chairman (2010-2012) and Member of the Board of Directors (2012-2013) of Omgeo, LLC (financial services), Treasurer of United Way of New York (2012-2016), and Member of the Board of Directors of XBRL US (financial services non-profit, 2009-2012) and the International Securities Services Association (2009-2012).
Alan J. Lacy (1953)
Year of Election or Appointment: 2008
Trustee
Mr. Lacy also serves as Trustee of other Fidelity® funds. Mr. Lacy serves as a Director of Bristol-Myers Squibb Company (global pharmaceuticals, 2008-present). He is a Trustee of the California Chapter of The Nature Conservancy (2015-present) and a Director of the Center for Advanced Study in the Behavioral Sciences at Stanford University (2015-present). In addition, Mr. Lacy served as Senior Adviser (2007-2014) of Oak Hill Capital Partners, L.P. (private equity) and also served as Chief Executive Officer (2005) and Vice Chairman (2005-2006) of Sears Holdings Corporation (retail) and Chief Executive Officer and Chairman of the Board of Sears, Roebuck and Co. (retail, 2000-2005). Previously, Mr. Lacy served as Chairman (2014-2017) and a member (2010-2017) of the Board of Directors of Dave & Buster’s Entertainment, Inc. (restaurant and entertainment complexes), as Chairman (2008-2011) and a member (2006-2015) of the Board of Trustees of the National Parks Conservation Association, and as a member of the Board of Directors for The Hillman Companies, Inc. (hardware wholesalers, 2010-2014), Earth Fare, Inc. (retail grocery, 2010-2014), and The Western Union Company (global money transfer, 2006-2011).
Ned C. Lautenbach (1944)
Year of Election or Appointment: 2000
Trustee
Chairman of the Independent Trustees
Mr. Lautenbach also serves as Trustee of other Fidelity® funds. Mr. Lautenbach currently serves as Vice Chair of the Board of Governors, State University System of Florida (2013-present) and is a member of the Council on Foreign Relations (1994-present). He is also a member and has most recently served as Chairman of the Board of Directors of Artis-Naples (2012-present). Previously, Mr. Lautenbach served as a member and then Lead Director of the Board of Directors of Eaton Corporation (diversified industrial, 1997-2016). He was also a Partner and Advisory Partner at Clayton, Dubilier & Rice, LLC (private equity investment, 1998-2010), as well as a Director of Sony Corporation (2006-2007). In addition, Mr. Lautenbach also had a 30-year career with IBM (technology company) during which time he served as Senior Vice President and a member of the Corporate Executive Committee (1968-1998).
Joseph Mauriello (1944)
Year of Election or Appointment: 2008
Trustee
Mr. Mauriello also serves as Trustee of other Fidelity® funds. Prior to his retirement in January 2006, Mr. Mauriello served in numerous senior management positions including Deputy Chairman and Chief Operating Officer (2004-2005), and Vice Chairman of Financial Services (2002-2004) of KPMG LLP US (professional services, 1965-2005). Mr. Mauriello currently serves as a member of the Board of Directors of XL Group plc. (global insurance and re-insurance, 2006-present) and the Independent Directors Council (IDC) Governing Council (2015-present). Previously, Mr. Mauriello served as a Director of the Hamilton Funds of the Bank of New York (2006-2007) and of Arcadia Resources Inc. (health care services and products, 2007-2012).
Cornelia M. Small (1944)
Year of Election or Appointment: 2005
Trustee
Ms. Small also serves as Trustee of other Fidelity® funds. Ms. Small is a member of the Board of Directors (2009-present) and Chair of the Investment Committee (2010-present) of the Teagle Foundation. Ms. Small also serves on the Investment Committee of the Berkshire Taconic Community Foundation (2008-present). Previously, Ms. Small served as Chairperson (2002-2008) and a member of the Investment Committee and Chairperson (2008-2012) and a member of the Board of Trustees of Smith College. In addition, Ms. Small served as Chief Investment Officer, Director of Global Equity Investments, and a member of the Board of Directors of Scudder, Stevens & Clark and Scudder Kemper Investments.
Garnett A. Smith (1947)
Year of Election or Appointment: 2018
Trustee
Mr. Smith also serves as Trustee of other Fidelity® funds. Prior to Mr. Smith's retirement, he served as Chairman and Chief Executive Officer of Inbrand Corp. (manufacturer of personal absorbent products, 1990-1997). He also served as President (1986-1990) of Inbrand Corp. Prior to his employment with Inbrand Corp., he was employed by a retail fabric chain and North Carolina National Bank. In addition, Mr. Smith served as a Member of the Advisory Board of certain Fidelity® funds (2012-2013) and as a board member of the Jackson Hole Land Trust (2009-2012).
David M. Thomas (1949)
Year of Election or Appointment: 2008
Trustee
Mr. Thomas also serves as Trustee of other Fidelity® funds. Mr. Thomas serves as Non-Executive Chairman of the Board of Directors of Fortune Brands Home and Security (home and security products, 2011-present), as a member of the Board of Directors (2004-present) and Presiding Director (2013-present) of Interpublic Group of Companies, Inc. (marketing communication), and as a member of the Board of Trustees of the University of Florida (2013-present). Previously, Mr. Thomas served as Executive Chairman (2005-2006) and Chairman and Chief Executive Officer (2000-2005) of IMS Health, Inc. (pharmaceutical and healthcare information solutions), and a Director of Fortune Brands, Inc. (consumer products, 2000-2011).
Michael E. Wiley (1950)
Year of Election or Appointment: 2018
Trustee
Mr. Wiley also serves as Trustee or Member of the Advisory Board of other Fidelity® funds. Mr. Wiley serves as a Director of Andeavor Corporation (independent oil refiner and marketer, 2005-present), a Director of Andeavor Logistics LP (natural resources logistics, 2015-present), and a Director of Bill Barrett Corporation (exploration and production, 2005-present). In addition, Mr. Wiley also serves as a Director of Post Oak Bank (privately-held bank, 2004-present). Previously, Mr. Wiley served as a Trustee of other Fidelity® funds (2008-2013), as a Director of Asia Pacific Exploration Consolidated (international oil and gas exploration and production, 2008-2013), as a member of the Board of Trustees of the University of Tulsa (2000-2006; 2007-2010), as a Senior Energy Advisor of Katzenbach Partners, LLC (consulting, 2006-2007), as an Advisory Director of Riverstone Holdings (private investment), Chairman, President, and CEO of Baker Hughes, Inc. (oilfield services, 2000-2004), and as Director of Spinnaker Exploration Company (exploration and production, 2001-2005).
+ The information includes the Trustee's principal occupation during the last five years and other information relating to the experience, attributes, and skills relevant to the Trustee's qualifications to serve as a Trustee, which led to the conclusion that the Trustee should serve as a Trustee for the fund.
Advisory Board Members and Officers:
Correspondence intended for a Member of the Advisory Board (if any) may be sent to Fidelity Investments, P.O. Box 55235, Boston, Massachusetts 02205-5235. Correspondence intended for an officer or Peter S. Lynch may be sent to Fidelity Investments, 245 Summer Street, Boston, Massachusetts 02210. Officers appear below in alphabetical order.
Name, Year of Birth; Principal Occupation
Peter S. Lynch (1944)
Year of Election or Appointment: 2003
Member of the Advisory Board
Mr. Lynch also serves as Member of the Advisory Board of other Fidelity® funds. Mr. Lynch is Vice Chairman and a Director of FMR (investment adviser firm) and FMR Co., Inc. (investment adviser firm). In addition, Mr. Lynch serves as a Trustee of Boston College and as the Chairman of the Inner-City Scholarship Fund. Previously, Mr. Lynch served on the Special Olympics International Board of Directors (1997-2006).
William S. Stavropoulos (1939)
Year of Election or Appointment: 2018
Member of the Advisory Board
Mr. Stavropoulos also serves as Member of the Advisory Board of other Fidelity® funds. Mr. Stavropoulos serves as President and Founder of the Michigan Baseball Foundation, the Great Lakes Loons (2007-present). Mr. Stavropoulos is Chairman Emeritus of the Board of Directors of The Dow Chemical Company, where he previously served in numerous senior management positions, including President, CEO (1995-2000; 2002-2004), Chairman of the Executive Committee (2000-2006), and as a member of the Board of Directors (1990-2006). Currently, Mr. Stavropoulos is Chairman of the Board of Directors of Univar Inc. (global distributor of commodity and specialty chemicals), a Director of Teradata Corporation (data warehousing and technology solutions), and a member of the Advisory Board for Metalmark Capital LLC (private equity investment, 2005-present). Mr. Stavropoulos is an operating advisor to Clayton, Dubilier & Rice, LLC (private equity investment). In addition, Mr. Stavropoulos is a member of the University of Notre Dame Advisory Council for the College of Science, a Trustee of the Rollin L. Gerstacker Foundation, and a Director of Artis-Naples in Naples, Florida. Previously, Mr. Stavropoulos served as Trustee of certain Fidelity® funds (2001-2018) and as a Director of Chemical Financial Corporation (bank holding company, 1993-2012) and Tyco International, Ltd. (multinational manufacturing and services, 2007-2012).
Carol B. Tomé (1957)
Year of Election or Appointment: 2018
Member of the Advisory Board
Ms. Tomé also serves as Member of the Advisory Board of other Fidelity® funds. Ms. Tomé is Chief Financial Officer (2001-present) and Executive Vice President of Corporate Services (2007-present) of The Home Depot, Inc. (home improvement retailer) and a Director (2003-present) and Chair of the Audit Committee (2004-present) of United Parcel Service, Inc. (package delivery and supply chain management). Previously, Ms. Tomé served as Trustee of certain Fidelity® funds (2017), Senior Vice President of Finance and Accounting/Treasurer (2000-2007) and Vice President and Treasurer (1995-2000) of The Home Depot, Inc. and Chair of the Board (2010-2012), Vice Chair of the Board (2009 and 2013), and a Director (2008-2013) of the Federal Reserve Bank of Atlanta. Ms. Tomé is also a director or trustee of many community and professional organizations.
Elizabeth Paige Baumann (1968)
Year of Election or Appointment: 2017
Anti-Money Laundering (AML) Officer
Ms. Baumann also serves as AML Officer of other funds. She is Chief AML Officer (2012-present) and Senior Vice President (2014-present) of FMR LLC (diversified financial services company) and is an employee of Fidelity Investments. Previously, Ms. Baumann served as AML Officer of the funds (2012-2016), and Vice President (2007-2014) and Deputy Anti-Money Laundering Officer (2007-2012) of FMR LLC.
Marc R. Bryant (1966)
Year of Election or Appointment: 2015
Secretary and Chief Legal Officer (CLO)
Mr. Bryant also serves as Secretary and CLO of other funds. Mr. Bryant serves as CLO, Secretary, and Senior Vice President of Fidelity Management & Research Company (investment adviser firm, 2015-present) and FMR Co., Inc. (investment adviser firm, 2015-present); Secretary of Fidelity SelectCo, LLC (investment adviser firm, 2015-present) and Fidelity Investments Money Management, Inc. (investment adviser firm, 2015-present); and CLO of Fidelity Management & Research (Hong Kong) Limited and FMR Investment Management (UK) Limited (investment adviser firms, 2015-present) and Fidelity Management & Research (Japan) Limited (investment adviser firm, 2016-present). He is Senior Vice President and Deputy General Counsel of FMR LLC (diversified financial services company). Previously, Mr. Bryant served as Secretary and CLO of Fidelity Rutland Square Trust II (2010-2014) and Assistant Secretary of Fidelity's Fixed Income and Asset Allocation Funds (2013-2015). Prior to joining Fidelity Investments, Mr. Bryant served as a Senior Vice President and the Head of Global Retail Legal for AllianceBernstein L.P. (2006-2010), and as the General Counsel for ProFund Advisors LLC (2001-2006).
John J. Burke III (1964)
Year of Election or Appointment: 2018
Chief Financial Officer
Mr. Burke also serves as Chief Financial Officer of other funds. Mr. Burke serves as Head of Investment Operations for Fidelity Fund and Investment Operations (2018-present) and is an employee of Fidelity Investments (1998-present). Previously Mr. Burke served as head of Asset Management Investment Operations (2012-2018).
William C. Coffey (1969)
Year of Election or Appointment: 2009
Assistant Secretary
Mr. Coffey also serves as Assistant Secretary of other funds. He is Senior Vice President and Deputy General Counsel of FMR LLC (diversified financial services company, 2010-present), and is an employee of Fidelity Investments. Previously, Mr. Coffey served as Vice President and Associate General Counsel of FMR LLC (2005-2009).
Timothy M. Cohen (1969)
Year of Election or Appointment: 2018
Vice President
Mr. Cohen also serves as Vice President of other funds. Mr. Cohen serves as Co-Head of Global Equity Research (2016-present), a Director of Fidelity Management & Research (Japan) Limited (investment adviser firm, 2016-present), and is an employee of Fidelity Investments. Previously, Mr. Cohen served as Chief Investment Officer - Equity and a Director of Fidelity Management & Research (U.K.) Inc. (investment adviser firm, 2013-2015) and as a Director of Fidelity Management & Research (Hong Kong) Limited (investment adviser firm, 2017).
Jonathan Davis (1968)
Year of Election or Appointment: 2010
Assistant Treasurer
Mr. Davis also serves as Assistant Treasurer of other funds. Mr. Davis serves as Assistant Treasurer of FMR Capital, Inc. (2017-present) and is an employee of Fidelity Investments. Previously, Mr. Davis served as Vice President and Associate General Counsel of FMR LLC (diversified financial services company, 2003-2010).
Adrien E. Deberghes (1967)
Year of Election or Appointment: 2016
Assistant Treasurer
Mr. Deberghes also serves as an officer of other funds. He serves as Assistant Treasurer of FMR Capital, Inc. (2017-present), Executive Vice President of Fidelity Investments Money Management, Inc. (FIMM) (investment adviser firm, 2016-present), and is an employee of Fidelity Investments (2008-present). Previously, Mr. Deberghes served as President and Treasurer of certain Fidelity® funds (2013-2018). Prior to joining Fidelity Investments, Mr. Deberghes was Senior Vice President of Mutual Fund Administration at State Street Corporation (2007-2008), Senior Director of Mutual Fund Administration at Investors Bank & Trust (2005-2007), and Director of Finance for Dunkin' Brands (2000-2005). Previously, Mr. Deberghes served in other fund officer roles.
Laura M. Del Prato (1964)
Year of Election or Appointment: 2018
Assistant Treasurer
Ms. Del Prato also serves as an officer of other funds. Ms. Del Prato is an employee of Fidelity Investments (2017-present). Prior to joining Fidelity Investments, Ms. Del Prato served as a Managing Director and Treasurer of the JPMorgan Mutual Funds (2014-2017). Prior to JPMorgan, Ms. Del Prato served as a partner at Cohen Fund Audit Services (accounting firm, 2012-2013) and KPMG LLP (accounting firm, 2004-2012).
Colm A. Hogan (1973)
Year of Election or Appointment: 2016
Deputy Treasurer
Mr. Hogan also serves as an officer of other funds. Mr. Hogan serves as Assistant Treasurer of FMR Capital, Inc. (2017-present) and is an employee of Fidelity Investments (2005-present). Previously, Mr. Hogan served as Assistant Treasurer of certain Fidelity® funds (2016-2018).
Pamela R. Holding (1964)
Year of Election or Appointment: 2018
Vice President
Ms. Holding also serves as a Vice President of other funds. Ms. Holding serves as Co-Head of Global Equity Research (2018-present) and is an employee of Fidelity Investments (2013-present).
Chris Maher (1972)
Year of Election or Appointment: 2013
Assistant Treasurer
Mr. Maher serves as Assistant Treasurer of other funds. Mr. Maher is Vice President of Valuation Oversight, serves as Assistant Treasurer of FMR Capital, Inc. (2017-present), and is an employee of Fidelity Investments. Previously, Mr. Maher served as Vice President of Asset Management Compliance (2013), Vice President of the Program Management Group of FMR (investment adviser firm, 2010-2013), and Vice President of Valuation Oversight (2008-2010).
Rieco E. Mello (1969)
Year of Election or Appointment: 2017
Assistant Treasurer
Mr. Mello also serves as Assistant Treasurer of other funds. Mr. Mello serves as Assistant Treasurer of FMR Capital, Inc. (2017-present) and is an employee of Fidelity Investments (1995-present).
Kenneth B. Robins (1969)
Year of Election or Appointment: 2016
Chief Compliance Officer
Mr. Robins also serves as an officer of other funds. Mr. Robins serves as Compliance Officer of Fidelity Management & Research Company and FMR Co., Inc. (investment adviser firms, 2016-present) and is an employee of Fidelity Investments (2004-present). Previously, Mr. Robins served as Executive Vice President of Fidelity Investments Money Management, Inc. (investment adviser firm, 2013-2016) and served in other fund officer roles.
Stacie M. Smith (1974)
Year of Election or Appointment: 2016
President and Treasurer
Ms. Smith also serves as an officer of other funds. Ms. Smith serves as Assistant Treasurer of FMR Capital, Inc. (2017-present), is an employee of Fidelity Investments (2009-present), and has served in other fund officer roles. Prior to joining Fidelity Investments, Ms. Smith served as Senior Audit Manager of Ernst & Young LLP (accounting firm, 1996-2009). Previously, Ms. Smith served as Assistant Treasurer (2013-2018) and Deputy Treasurer (2013-2016) of certain Fidelity® funds.
Marc L. Spector (1972)
Year of Election or Appointment: 2016
Assistant Treasurer
Mr. Spector also serves as an officer of other funds. Mr. Spector serves as Assistant Treasurer of FMR Capital, Inc. (2017-present) and is an employee of Fidelity Investments (2016-present). Prior to joining Fidelity Investments, Mr. Spector served as Director at the Siegfried Group (accounting firm, 2013-2016), and prior to Siegfried Group as audit senior manager at Deloitte & Touche (accounting firm, 2005-2013).
Renee Stagnone (1975)
Year of Election or Appointment: 2016
Assistant Treasurer
Ms. Stagnone also serves as an officer of other funds. Ms. Stagnone serves as Assistant Treasurer of FMR Capital, Inc. (2017-present) and is an employee of Fidelity Investments (1997-present). Previously, Ms. Stagnone served as Deputy Treasurer of certain Fidelity® funds (2013-2016).
Shareholder Expense Example
As a shareholder of the Fund, you incur two types of costs: (1) transaction costs, and (2) ongoing costs, including management fees and other Fund expenses. This Example is intended to help you understand your ongoing costs (in dollars) of investing in the Fund and to compare these costs with the ongoing costs of investing in other mutual funds.
The Example is based on an investment of $1,000 invested at the beginning of the period and held for the entire period (January 1, 2018 to June 30, 2018).
Actual Expenses
The first line of the accompanying table for each class of the Fund provides information about actual account values and actual expenses. You may use the information in this line, together with the amount you invested, to estimate the expenses that you paid over the period. Simply divide your account value by $1,000.00 (for example, an $8,600 account value divided by $1,000.00 = 8.6), then multiply the result by the number in the first line for a class of the Fund under the heading entitled "Expenses Paid During Period" to estimate the expenses you paid on your account during this period. A small balance maintenance fee of $12.00 that is charged once a year may apply for certain accounts with a value of less than $2,000. This fee is not included in the table below. If it was, the estimate of expenses you paid during the period would be higher, and your ending account value lower, by this amount. In addition, the Fund, as a shareholder in the underlying Fidelity Central Funds, will indirectly bear its pro-rata share of the fees and expenses incurred by the underlying Fidelity Central Funds. These fees and expenses are not included in the Fund's annualized expense ratio used to calculate the expense estimate in the table below.
Hypothetical Example for Comparison Purposes
The second line of the accompanying table for each class of the Fund provides information about hypothetical account values and hypothetical expenses based on a Class' actual expense ratio and an assumed rate of return of 5% per year before expenses, which is not the Class' actual return. The hypothetical account values and expenses may not be used to estimate the actual ending account balance or expenses you paid for the period. You may use this information to compare the ongoing costs of investing in the Fund and other funds. To do so, compare this 5% hypothetical example with the 5% hypothetical examples that appear in the shareholder reports of the other funds. A small balance maintenance fee of $12.00 that is charged once a year may apply for certain accounts with a value of less than $2,000. This fee is not included in the table below. If it was, the estimate of expenses you paid during the period would be higher, and your ending account value lower, by this amount. In addition, the Fund, as a shareholder in the underlying Fidelity Central Funds, will indirectly bear its pro-rata share of the fees and expenses incurred by the underlying Fidelity Central Funds. These fees and expenses are not included in the Fund's annualized expense ratio used to calculate the expense estimate in the table below.
Please note that the expenses shown in the table are meant to highlight your ongoing costs only and do not reflect any transaction costs. Therefore, the second line of the table is useful in comparing ongoing costs only, and will not help you determine the relative total costs of owning different funds.
| | Annualized Expense Ratio-A | Beginning
Account Value
January 1, 2018 | Ending
Account Value
June 30, 2018 | Expenses Paid
During Period-B
January 1, 2018
to June 30, 2018 |
| Fidelity Fund | .49% | | | |
| Actual | | $1,000.00 | $1,036.00 | $2.47 |
| Hypothetical-C | | $1,000.00 | $1,022.36 | $2.46 |
| Class K | .40% | | | |
| Actual | | $1,000.00 | $1,036.50 | $2.02 |
| Hypothetical-C | | $1,000.00 | $1,022.81 | $2.01 |
A Annualized expense ratio reflects expenses net of applicable fee waivers.
B Expenses are equal to each Class' annualized expense ratio, multiplied by the average account value over the period, multiplied by 181/365 (to reflect the one-half year period).
C 5% return per year before expenses
Distributions (Unaudited)
The Board of Trustees of Fidelity Fund voted to pay to shareholders of record at the opening of business on record date, the following distributions per share derived from capital gains realized from sales of portfolio securities, and dividends derived from net investment income:
| | Pay Date | Record Date | Dividends | Capital Gains |
| Fidelity Fund | | | | |
| Fidelity Fund | 08/13/18 | 08/10/18 | $0.206 | $2.104 |
| Class K | 08/13/18 | 08/10/18 | $0.228 | $2.104 |
|
The fund hereby designates as a capital gain dividend with respect to the taxable year ended June 30, 2018, $304,332,802, or, if subsequently determined to be different, the net capital gain of such year.
Fidelity Fund and Class K designate 100% of the dividends distributed in August and December during the fiscal year as qualifying for the dividends–received deduction for corporate shareholders.
Fidelity Fund and Class K designate 100% of the dividends distributed in August and December during the fiscal year as amounts which may be taken into account as a dividend for purposes of the maximum rate under section 1(h)(11) of the Internal Revenue Code.
The fund will notify shareholders in January 2019 of amounts for use in preparing 2018 income tax returns.
Corporate Headquarters
245 Summer St.
Boston, MA 02210
www.fidelity.com
FID-K-ANN-0818
1.863253.109
Fidelity® Growth Discovery Fund
Annual Report June 30, 2018 |
|
Contents
To view a fund's proxy voting guidelines and proxy voting record for the 12-month period ended June 30, visit http://www.fidelity.com/proxyvotingresults or visit the Securities and Exchange Commission's (SEC) web site at http://www.sec.gov.
You may also call 1-800-544-8544 to request a free copy of the proxy voting guidelines.
Standard & Poor's, S&P and S&P 500 are registered service marks of The McGraw-Hill Companies, Inc. and have been licensed for use by Fidelity Distributors Corporation.
Other third-party marks appearing herein are the property of their respective owners.
All other marks appearing herein are registered or unregistered trademarks or service marks of FMR LLC or an affiliated company. © 2018 FMR LLC. All rights reserved.
This report and the financial statements contained herein are submitted for the general information of the shareholders of the Fund. This report is not authorized for distribution to prospective investors in the Fund unless preceded or accompanied by an effective prospectus.
A fund files its complete schedule of portfolio holdings with the SEC for the first and third quarters of each fiscal year on Form N-Q. Forms N-Q are available on the SEC’s web site at http://www.sec.gov. A fund's Forms N-Q may be reviewed and copied at the SEC’s Public Reference Room in Washington, DC. Information regarding the operation of the SEC's Public Reference Room may be obtained by calling 1-800-SEC-0330.
For a complete list of a fund's portfolio holdings, view the most recent holdings listing, semiannual report, or annual report on Fidelity's web site at http://www.fidelity.com, http://www.institutional.fidelity.com, or http://www.401k.com, as applicable.
NOT FDIC INSURED •MAY LOSE VALUE •NO BANK GUARANTEE
Neither the Fund nor Fidelity Distributors Corporation is a bank.
Performance: The Bottom Line
Average annual total return reflects the change in the value of an investment, assuming reinvestment of distributions from dividend income and capital gains (the profits earned upon the sale of securities that have grown in value, if any) and assuming a constant rate of performance each year. The hypothetical investment and the average annual total returns do not reflect the deduction of taxes that a shareholder would pay on fund distributions or the redemption of fund shares. During periods of reimbursement by Fidelity, a fund’s total return will be greater than it would be had the reimbursement not occurred. How a fund did yesterday is no guarantee of how it will do tomorrow.
Average Annual Total Returns
| For the periods ended June 30, 2018 | Past 1 year | Past 5 years | Past 10 years |
| Fidelity® Growth Discovery Fund | 22.94% | 16.71% | 10.26% |
$10,000 Over 10 Years
Let's say hypothetically that $10,000 was invested in Fidelity® Growth Discovery Fund, a class of the fund, on June 30, 2008.
The chart shows how the value of your investment would have changed, and also shows how the Russell 3000® Growth Index performed over the same period.

| Period Ending Values |
| $26,547 | Fidelity® Growth Discovery Fund |
| $30,455 | Russell 3000® Growth Index |
Management's Discussion of Fund Performance
Market Recap: The U.S. equity bellwether S&P 500
® index gained 14.37% for the 12 months ending June 30, 2018, despite a resurgence in volatility that challenged the multiyear bull market. The steady growth seen throughout 2017 extended into the new year, as investors remained upbeat on hopes of continued strong economic and earnings growth. Stocks surged 5.73% in January alone. February was a decidedly different story, though, as volatility spiked amid fear that rising inflation and the potential for the economy to overheat would prompt the U.S. Federal Reserve to pick up the pace of interest rate hikes. The index returned -3.69% for the month, its first negative result since October 2016, and lost further ground in March on fear of a global trade war. The market stabilized in April and went on to achieve a solid gain for May. The uptrend continued through roughly mid-June, when escalating trade tension between the U.S. and China soured investor sentiment, and the index ended the 12 months with a two-week slump. By sector, information technology (+31%) led the way, rising on strong earnings growth from several major index constituents. Consumer discretionary (+24%) also stood out, largely driven by retailers (+50%). Energy gained 21% alongside higher oil prices. Notable laggards included some defensive groups – consumer staples (-4%), telecommunication services (+1%) and utilities (+3%) – that struggled amid rising interest rates and a general preference for risk.
Comments from Lead Portfolio Manager Jason Weiner: For the year, the fund's share classes gained about 23%, slightly outpacing the 22.47% advance of the Russell 3000
® Growth index. Versus the benchmark, security selection was the primary driver of the fund's outperformance this period, with sector allocation also contributing. In particular, stock selection and an overweighting in information technology's software & services industry helped the most, followed by choices in consumer discretionary and positioning in industrials. In terms of individual stocks, an overweighting in software firm Adobe Systems (+72%), one of the fund's largest holdings, was the biggest contributor this period. Another major contributor was mobile payments firm Square (+163%), which benefited from its acceptance and the popularity of Bitcoin cryptocurrency. On the negative side, stock picks in real estate held back the fund's relative result. A non-index stake in Realogy Holdings – a real estate brokerage company operating under brands such as Coldwell Banker and Sotheby's – was the fund's biggest individual detractor. The stock returned -29% on macro headwinds and weak financial results. The fund's 3% stake in cash, on average, amid a rising equity market also hurt the fund's performance versus the benchmark.
The views expressed above reflect those of the portfolio manager(s) only through the end of the period as stated on the cover of this report and do not necessarily represent the views of Fidelity or any other person in the Fidelity organization. Any such views are subject to change at any time based upon market or other conditions and Fidelity disclaims any responsibility to update such views. These views may not be relied on as investment advice and, because investment decisions for a Fidelity fund are based on numerous factors, may not be relied on as an indication of trading intent on behalf of any Fidelity fund.
Note to Shareholders: On July 1, 2017, Asher Anolic assumed co-manager responsibilities for the fund and served as interim Portfolio Manager while Jason Weiner was on a leave of absence from January 1, 2018, through June 2018.
Investment Summary (Unaudited)
Top Ten Stocks as of June 30, 2018
| | % of fund's net assets |
| Alphabet, Inc. Class A | 6.5 |
| Microsoft Corp. | 6.1 |
| Amazon.com, Inc. | 5.9 |
| Home Depot, Inc. | 3.1 |
| Visa, Inc. Class A | 2.8 |
| Charles Schwab Corp. | 2.7 |
| Adobe Systems, Inc. | 2.7 |
| Apple, Inc. | 2.7 |
| Facebook, Inc. Class A | 2.5 |
| Cheniere Energy, Inc. | 1.9 |
| | 36.9 |
Top Five Market Sectors as of June 30, 2018
| | % of fund's net assets |
| Information Technology | 42.8 |
| Consumer Discretionary | 13.4 |
| Financials | 10.5 |
| Health Care | 10.3 |
| Industrials | 7.2 |
Asset Allocation (% of fund's net assets)
| As of June 30, 2018* |
| | Stocks | 97.6% |
| | Convertible Securities | 0.5% |
| | Short-Term Investments and Net Other Assets (Liabilities) | 1.9% |

* Foreign investments - 10.7%
Schedule of Investments June 30, 2018
Showing Percentage of Net Assets
| Common Stocks - 97.5% | | | |
| | | Shares | Value (000s) |
| CONSUMER DISCRETIONARY - 13.4% | | | |
| Diversified Consumer Services - 0.7% | | | |
| Grand Canyon Education, Inc. (a) | | 110,300 | $12,311 |
| Hotels, Restaurants & Leisure - 0.7% | | | |
| Hilton Worldwide Holdings, Inc. | | 113,612 | 8,994 |
| Wingstop, Inc. | | 82,300 | 4,289 |
| | | | 13,283 |
| Household Durables - 0.8% | | | |
| Panasonic Corp. | | 1,070,500 | 14,435 |
| Internet & Direct Marketing Retail - 6.5% | | | |
| Amazon.com, Inc. (a) | | 66,200 | 112,527 |
| The Booking Holdings, Inc. (a) | | 6,000 | 12,163 |
| | | | 124,690 |
| Media - 0.9% | | | |
| Charter Communications, Inc. Class A (a) | | 57,200 | 16,772 |
| China Literature Ltd. (a)(b) | | 286 | 3 |
| | | | 16,775 |
| Specialty Retail - 3.1% | | | |
| Home Depot, Inc. | | 306,024 | 59,705 |
| Textiles, Apparel & Luxury Goods - 0.7% | | | |
| Kering SA | | 2,500 | 1,412 |
| LVMH Moet Hennessy - Louis Vuitton SA | | 37,780 | 12,544 |
| Puma AG | | 208 | 122 |
| | | | 14,078 |
|
| TOTAL CONSUMER DISCRETIONARY | | | 255,277 |
|
| CONSUMER STAPLES - 4.1% | | | |
| Beverages - 1.1% | | | |
| Constellation Brands, Inc. Class A (sub. vtg.) | | 39,100 | 8,558 |
| Fever-Tree Drinks PLC | | 78,960 | 3,533 |
| Kweichow Moutai Co. Ltd. (A Shares) | | 48,729 | 5,383 |
| Pernod Ricard SA ADR | | 133,100 | 4,352 |
| | | | 21,826 |
| Food & Staples Retailing - 0.1% | | | |
| Bj's Wholesale Club Holdings, Inc. | | 84,200 | 1,991 |
| Food Products - 0.3% | | | |
| McCormick & Co., Inc. (non-vtg.) | | 38,000 | 4,411 |
| The Simply Good Foods Co. | | 146,800 | 2,120 |
| | | | 6,531 |
| Household Products - 0.6% | | | |
| Energizer Holdings, Inc. | | 167,600 | 10,552 |
| Personal Products - 1.5% | | | |
| Coty, Inc. Class A | | 321,300 | 4,530 |
| Estee Lauder Companies, Inc. Class A | | 81,900 | 11,686 |
| Unilever NV (NY Reg.) | | 231,400 | 12,894 |
| | | | 29,110 |
| Tobacco - 0.5% | | | |
| British American Tobacco PLC sponsored ADR | | 179,600 | 9,061 |
|
| TOTAL CONSUMER STAPLES | | | 79,071 |
|
| ENERGY - 2.9% | | | |
| Energy Equipment & Services - 0.5% | | | |
| Baker Hughes, a GE Co. Class A | | 221,000 | 7,300 |
| Computer Modelling Group Ltd. | | 298,200 | 2,291 |
| | | | 9,591 |
| Oil, Gas & Consumable Fuels - 2.4% | | | |
| Cheniere Energy, Inc. (a) | | 549,600 | 35,828 |
| Reliance Industries Ltd. | | 697,453 | 9,907 |
| | | | 45,735 |
|
| TOTAL ENERGY | | | 55,326 |
|
| FINANCIALS - 10.4% | | | |
| Banks - 4.4% | | | |
| Bank of America Corp. | | 649,700 | 18,315 |
| First Republic Bank | | 147,000 | 14,228 |
| HDFC Bank Ltd. | | 36,455 | 1,124 |
| HDFC Bank Ltd. sponsored ADR | | 33,700 | 3,539 |
| Huntington Bancshares, Inc. | | 688,000 | 10,155 |
| JPMorgan Chase & Co. | | 301,500 | 31,416 |
| M&T Bank Corp. | | 28,600 | 4,866 |
| Metro Bank PLC (a) | | 25,300 | 1,080 |
| | | | 84,723 |
| Capital Markets - 6.0% | | | |
| Cboe Global Markets, Inc. | | 15,848 | 1,649 |
| Charles Schwab Corp. | | 1,023,500 | 52,301 |
| CME Group, Inc. | | 185,445 | 30,398 |
| Goldman Sachs Group, Inc. | | 31,200 | 6,882 |
| JMP Group, Inc. | | 75,200 | 404 |
| MSCI, Inc. | | 78,800 | 13,036 |
| The Blackstone Group LP | | 276,600 | 8,898 |
| | | | 113,568 |
|
| TOTAL FINANCIALS | | | 198,291 |
|
| HEALTH CARE - 10.2% | | | |
| Biotechnology - 3.2% | | | |
| Amgen, Inc. | | 68,900 | 12,718 |
| Biogen, Inc. (a) | | 62,000 | 17,995 |
| Calyxt, Inc. | | 95,488 | 1,783 |
| Cytokinetics, Inc. (a) | | 90,471 | 751 |
| Insmed, Inc. (a) | | 343,378 | 8,121 |
| Prothena Corp. PLC (a) | | 68,000 | 991 |
| TESARO, Inc. (a) | | 59,500 | 2,646 |
| Vertex Pharmaceuticals, Inc. (a) | | 94,693 | 16,094 |
| | | | 61,099 |
| Health Care Equipment & Supplies - 4.9% | | | |
| Becton, Dickinson & Co. | | 126,000 | 30,185 |
| Boston Scientific Corp. (a) | | 459,700 | 15,032 |
| Danaher Corp. | | 122,755 | 12,113 |
| Intuitive Surgical, Inc. (a) | | 63,800 | 30,527 |
| ResMed, Inc. | | 54,000 | 5,593 |
| | | | 93,450 |
| Health Care Providers & Services - 0.4% | | | |
| National Vision Holdings, Inc. | | 5,600 | 205 |
| Neuronetics, Inc. | | 4,200 | 112 |
| OptiNose, Inc. | | 7,100 | 199 |
| UnitedHealth Group, Inc. | | 26,600 | 6,526 |
| | | | 7,042 |
| Health Care Technology - 0.2% | | | |
| Veeva Systems, Inc. Class A (a) | | 56,600 | 4,350 |
| Life Sciences Tools & Services - 0.2% | | | |
| Codexis, Inc. (a) | | 81,800 | 1,178 |
| Sartorius Stedim Biotech | | 27,000 | 2,822 |
| | | | 4,000 |
| Pharmaceuticals - 1.3% | | | |
| AstraZeneca PLC sponsored ADR | | 347,600 | 12,204 |
| Mallinckrodt PLC (a) | | 173,600 | 3,239 |
| Mylan NV (a) | | 232,000 | 8,384 |
| | | | 23,827 |
|
| TOTAL HEALTH CARE | | | 193,768 |
|
| INDUSTRIALS - 7.2% | | | |
| Aerospace & Defense - 0.4% | | | |
| TransDigm Group, Inc. | | 19,727 | 6,809 |
| Commercial Services & Supplies - 0.8% | | | |
| Copart, Inc. (a) | | 229,700 | 12,992 |
| Prosegur Compania de Seguridad SA (Reg.) | | 252,163 | 1,648 |
| | | | 14,640 |
| Electrical Equipment - 2.0% | | | |
| AMETEK, Inc. | | 198,400 | 14,317 |
| Fortive Corp. | | 228,327 | 17,606 |
| Nidec Corp. | | 43,000 | 6,457 |
| | | | 38,380 |
| Industrial Conglomerates - 0.7% | | | |
| 3M Co. | | 25,700 | 5,056 |
| Roper Technologies, Inc. | | 28,914 | 7,978 |
| | | | 13,034 |
| Machinery - 1.8% | | | |
| Allison Transmission Holdings, Inc. | | 449,600 | 18,204 |
| Apergy Corp. (a) | | 39,800 | 1,662 |
| Gardner Denver Holdings, Inc. (a) | | 481,300 | 14,145 |
| Rational AG | | 2,000 | 1,306 |
| | | | 35,317 |
| Professional Services - 1.5% | | | |
| IHS Markit Ltd. (a) | | 173,700 | 8,961 |
| Robert Half International, Inc. | | 108,400 | 7,057 |
| TransUnion Holding Co., Inc. | | 178,100 | 12,759 |
| | | | 28,777 |
|
| TOTAL INDUSTRIALS | | | 136,957 |
|
| INFORMATION TECHNOLOGY - 42.4% | | | |
| Electronic Equipment & Components - 0.3% | | | |
| Cognex Corp. | | 111,300 | 4,965 |
| Keyence Corp. | | 2,400 | 1,356 |
| | | | 6,321 |
| Internet Software & Services - 14.2% | | | |
| Alibaba Group Holding Ltd. sponsored ADR (a) | | 97,300 | 18,052 |
| Alphabet, Inc. Class A (a) | | 109,552 | 123,709 |
| DocuSign, Inc. (c) | | 5,200 | 275 |
| Dropbox, Inc. Class A (a)(c) | | 8,800 | 285 |
| Facebook, Inc. Class A (a) | | 242,391 | 47,101 |
| GoDaddy, Inc. (a) | | 186,000 | 13,132 |
| MercadoLibre, Inc. | | 15,700 | 4,693 |
| NetEase, Inc. ADR | | 15,000 | 3,790 |
| Shopify, Inc. Class A (a) | | 44,500 | 6,489 |
| Stamps.com, Inc. (a) | | 89,571 | 22,666 |
| Tencent Holdings Ltd. | | 337,800 | 16,963 |
| VeriSign, Inc. (a) | | 96,100 | 13,206 |
| Wix.com Ltd. (a) | | 900 | 90 |
| | | | 270,451 |
| IT Services - 8.0% | | | |
| Adyen BV (a)(b) | | 4,037 | 2,224 |
| Cognizant Technology Solutions Corp. Class A | | 247,730 | 19,568 |
| Fidelity National Information Services, Inc. | | 127,700 | 13,540 |
| Global Payments, Inc. | | 108,100 | 12,052 |
| MasterCard, Inc. Class A | | 69,500 | 13,658 |
| PayPal Holdings, Inc. (a) | | 334,200 | 27,829 |
| Square, Inc. (a) | | 177,500 | 10,941 |
| Visa, Inc. Class A | | 395,496 | 52,383 |
| | | | 152,195 |
| Semiconductors & Semiconductor Equipment - 2.2% | | | |
| ASML Holding NV | | 43,300 | 8,572 |
| Broadcom, Inc. | | 14,700 | 3,567 |
| Cree, Inc. (a) | | 66,200 | 2,752 |
| Maxim Integrated Products, Inc. | | 153,705 | 9,016 |
| Monolithic Power Systems, Inc. | | 36,818 | 4,921 |
| Qualcomm, Inc. | | 228,800 | 12,840 |
| | | | 41,668 |
| Software - 15.0% | | | |
| Activision Blizzard, Inc. | | 173,887 | 13,271 |
| Adobe Systems, Inc. (a) | | 211,700 | 51,615 |
| Autodesk, Inc. (a) | | 83,600 | 10,959 |
| Avalara, Inc. | | 2,575 | 137 |
| Black Knight, Inc. (a) | | 189,700 | 10,158 |
| Electronic Arts, Inc. (a) | | 108,434 | 15,291 |
| Intuit, Inc. | | 115,400 | 23,577 |
| Microsoft Corp. | | 1,179,400 | 116,301 |
| Pluralsight, Inc. | | 38,900 | 951 |
| Red Hat, Inc. (a) | | 74,000 | 9,943 |
| Salesforce.com, Inc. (a) | | 229,864 | 31,353 |
| Splunk, Inc. (a) | | 22,800 | 2,260 |
| Zscaler, Inc. (a)(c) | | 3,700 | 132 |
| | | | 285,948 |
| Technology Hardware, Storage & Peripherals - 2.7% | | | |
| Apple, Inc. | | 275,600 | 51,016 |
|
| TOTAL INFORMATION TECHNOLOGY | | | 807,599 |
|
| MATERIALS - 4.5% | | | |
| Chemicals - 3.5% | | | |
| CF Industries Holdings, Inc. | | 254,800 | 11,313 |
| DowDuPont, Inc. | | 370,600 | 24,430 |
| Sherwin-Williams Co. | | 25,100 | 10,230 |
| The Chemours Co. LLC | | 205,000 | 9,094 |
| Umicore SA | | 200,591 | 11,513 |
| | | | 66,580 |
| Construction Materials - 1.0% | | | |
| Eagle Materials, Inc. | | 147,300 | 15,462 |
| Summit Materials, Inc. | | 155,854 | 4,091 |
| | | | 19,553 |
|
| TOTAL MATERIALS | | | 86,133 |
|
| REAL ESTATE - 2.4% | | | |
| Equity Real Estate Investment Trusts (REITs) - 1.9% | | | |
| American Tower Corp. | | 195,600 | 28,200 |
| Equinix, Inc. | | 10,200 | 4,385 |
| SBA Communications Corp. Class A (a) | | 29,500 | 4,871 |
| | | | 37,456 |
| Real Estate Management & Development - 0.5% | | | |
| Realogy Holdings Corp. (c) | | 395,181 | 9,010 |
|
| TOTAL REAL ESTATE | | | 46,466 |
|
| TOTAL COMMON STOCKS | | | |
| (Cost $1,309,509) | | | 1,858,888 |
|
| Preferred Stocks - 0.6% | | | |
| Convertible Preferred Stocks - 0.5% | | | |
| CONSUMER DISCRETIONARY - 0.0% | | | |
| Household Durables - 0.0% | | | |
| Blu Homes, Inc. Series A, 5.00% (a)(d)(e) | | 239,736 | 5 |
| HEALTH CARE - 0.1% | | | |
| Biotechnology - 0.1% | | | |
| BioNTech AG Series A (d)(e) | | 7,174 | 1,529 |
| INFORMATION TECHNOLOGY - 0.4% | | | |
| Internet Software & Services - 0.3% | | | |
| Uber Technologies, Inc. Series D, 8.00% (a)(d)(e) | | 162,572 | 6,503 |
| IT Services - 0.1% | | | |
| AppNexus, Inc. Series E (a)(d)(e) | | 48,212 | 999 |
| TOTAL INFORMATION TECHNOLOGY | | | 7,502 |
|
| TOTAL CONVERTIBLE PREFERRED STOCKS | | | 9,036 |
|
| Nonconvertible Preferred Stocks - 0.1% | | | |
| FINANCIALS - 0.1% | | | |
| Banks - 0.1% | | | |
| Itau Unibanco Holding SA sponsored ADR | | 269,900 | 2,802 |
| TOTAL PREFERRED STOCKS | | | |
| (Cost $9,856) | | | 11,838 |
|
| Money Market Funds - 2.1% | | | |
| Fidelity Cash Central Fund, 1.93% (f) | | 38,186,179 | 38,194 |
| Fidelity Securities Lending Cash Central Fund 1.92% (f)(g) | | 1,674,366 | 1,675 |
| TOTAL MONEY MARKET FUNDS | | | |
| (Cost $39,869) | | | 39,869 |
| TOTAL INVESTMENT IN SECURITIES - 100.2% | | | |
| (Cost $1,359,234) | | | 1,910,595 |
| NET OTHER ASSETS (LIABILITIES) - (0.2)% | | | (4,007) |
| NET ASSETS - 100% | | | $1,906,588 |
Legend
(a) Non-income producing
(b) Security exempt from registration under Rule 144A of the Securities Act of 1933. These securities may be resold in transactions exempt from registration, normally to qualified institutional buyers. At the end of the period, the value of these securities amounted to $2,227,000 or 0.1% of net assets.
(c) Security or a portion of the security is on loan at period end.
(d) Restricted securities - Investment in securities not registered under the Securities Act of 1933 (excluding 144A issues). At the end of the period, the value of restricted securities (excluding 144A issues) amounted to $9,036,000 or 0.5% of net assets.
(e) Level 3 security
(f) Affiliated fund that is generally available only to investment companies and other accounts managed by Fidelity Investments. The rate quoted is the annualized seven-day yield of the fund at period end. A complete unaudited listing of the fund's holdings as of its most recent quarter end is available upon request. In addition, each Fidelity Central Fund's financial statements, which are not covered by the Fund's Report of Independent Registered Public Accounting Firm, are available on the SEC's website or upon request.
(g) Investment made with cash collateral received from securities on loan.
Additional information on each restricted holding is as follows:
| Security | Acquisition Date | Acquisition Cost (000s) |
| AppNexus, Inc. Series E | 8/1/14 | $966 |
| BioNTech AG Series A | 12/29/17 | $1,571 |
| Blu Homes, Inc. Series A, 5.00% | 6/21/13 | $1,108 |
| Uber Technologies, Inc. Series D, 8.00% | 6/6/14 | $2,522 |
Affiliated Central Funds
Information regarding fiscal year to date income earned by the Fund from investments in Fidelity Central Funds is as follows:
| Fund | Income earned |
| | (Amounts in thousands) |
| Fidelity Cash Central Fund | $658 |
| Fidelity Securities Lending Cash Central Fund | 363 |
| Total | $1,021 |
Amounts in the income column in the above table include any capital gain distributions from underlying funds, which are presented in the corresponding line-item in the Statement of Operations if applicable.
Investment Valuation
The following is a summary of the inputs used, as of June 30, 2018, involving the Fund's assets and liabilities carried at fair value. The inputs or methodology used for valuing securities may not be an indication of the risk associated with investing in those securities. For more information on valuation inputs, and their aggregation into the levels used below, please refer to the Investment Valuation section in the accompanying Notes to Financial Statements.
| | Valuation Inputs at Reporting Date: |
| Description | Total | Level 1 | Level 2 | Level 3 |
| (Amounts in thousands) | | | | |
| Investments in Securities: | | | | |
| Equities: | | | | |
| Consumer Discretionary | $255,282 | $228,298 | $26,979 | $5 |
| Consumer Staples | 79,071 | 79,071 | -- | -- |
| Energy | 55,326 | 55,326 | -- | -- |
| Financials | 201,093 | 199,969 | 1,124 | -- |
| Health Care | 195,297 | 193,768 | -- | 1,529 |
| Industrials | 136,957 | 136,957 | -- | -- |
| Information Technology | 815,101 | 790,636 | 16,963 | 7,502 |
| Materials | 86,133 | 86,133 | -- | -- |
| Real Estate | 46,466 | 46,466 | -- | -- |
| Money Market Funds | 39,869 | 39,869 | -- | -- |
| Total Investments in Securities: | $1,910,595 | $1,856,493 | $45,066 | $9,036 |
Other Information
Distribution of investments by country or territory of incorporation, as a percentage of Total Net Assets, is as follows (Unaudited):
| United States of America | 89.3% |
| Cayman Islands | 2.1% |
| Netherlands | 1.6% |
| United Kingdom | 1.5% |
| Japan | 1.2% |
| France | 1.0% |
| Others (Individually Less Than 1%) | 3.3% |
| | 100.0% |
See accompanying notes which are an integral part of the financial statements.
Financial Statements
Statement of Assets and Liabilities
| Amounts in thousands (except per-share amounts) | | June 30, 2018 |
| Assets | | |
Investment in securities, at value (including securities loaned of $1,618) — See accompanying schedule:
Unaffiliated issuers (cost $1,319,365) | $1,870,726 | |
| Fidelity Central Funds (cost $39,869) | 39,869 | |
| Total Investment in Securities (cost $1,359,234) | | $1,910,595 |
| Receivable for investments sold | | 1,224 |
| Receivable for fund shares sold | | 1,867 |
| Dividends receivable | | 519 |
| Distributions receivable from Fidelity Central Funds | | 51 |
| Other receivables | | 83 |
| Total assets | | 1,914,339 |
| Liabilities | | |
| Payable for investments purchased | $1,747 | |
| Payable for fund shares redeemed | 2,647 | |
| Accrued management fee | 879 | |
| Other affiliated payables | 252 | |
| Other payables and accrued expenses | 555 | |
| Collateral on securities loaned | 1,671 | |
| Total liabilities | | 7,751 |
| Net Assets | | $1,906,588 |
| Net Assets consist of: | | |
| Paid in capital | | $1,300,936 |
| Undistributed net investment income | | 1,599 |
| Accumulated undistributed net realized gain (loss) on investments and foreign currency transactions | | 53,195 |
| Net unrealized appreciation (depreciation) on investments and assets and liabilities in foreign currencies | | 550,858 |
| Net Assets | | $1,906,588 |
| Growth Discovery: | | |
| Net Asset Value, offering price and redemption price per share ($1,545,893 ÷ 43,244 shares) | | $35.75 |
| Class K: | | |
| Net Asset Value, offering price and redemption price per share ($360,695 ÷ 10,080 shares) | | $35.78 |
See accompanying notes which are an integral part of the financial statements.
Statement of Operations
| Amounts in thousands | | Year ended June 30, 2018 |
| Investment Income | | |
| Dividends | | $15,159 |
| Income from Fidelity Central Funds | | 1,021 |
| Total income | | 16,180 |
| Expenses | | |
| Management fee | | |
| Basic fee | $9,234 | |
| Performance adjustment | 13 | |
| Transfer agent fees | 2,235 | |
| Accounting and security lending fees | 531 | |
| Custodian fees and expenses | 64 | |
| Independent trustees' fees and expenses | 7 | |
| Registration fees | 112 | |
| Audit | 59 | |
| Legal | 6 | |
| Interest | 1 | |
| Miscellaneous | 11 | |
| Total expenses before reductions | 12,273 | |
| Expense reductions | (139) | |
| Total expenses after reductions | | 12,134 |
| Net investment income (loss) | | 4,046 |
| Realized and Unrealized Gain (Loss) | | |
| Net realized gain (loss) on: | | |
| Investment securities: | | |
| Unaffiliated issuers | 104,190 | |
| Fidelity Central Funds | (1) | |
| Foreign currency transactions | (62) | |
| Total net realized gain (loss) | | 104,127 |
| Change in net unrealized appreciation (depreciation) on: | | |
| Investment securities: | | |
| Unaffiliated issuers (net of increase in deferred foreign taxes of $490) | 231,795 | |
| Fidelity Central Funds | 3 | |
| Assets and liabilities in foreign currencies | (2) | |
| Total change in net unrealized appreciation (depreciation) | | 231,796 |
| Net gain (loss) | | 335,923 |
| Net increase (decrease) in net assets resulting from operations | | $339,969 |
See accompanying notes which are an integral part of the financial statements.
Statement of Changes in Net Assets
| Amounts in thousands | Year ended June 30, 2018 | Year ended June 30, 2017 |
| Increase (Decrease) in Net Assets | | |
| Operations | | |
| Net investment income (loss) | $4,046 | $3,097 |
| Net realized gain (loss) | 104,127 | 192,029 |
| Change in net unrealized appreciation (depreciation) | 231,796 | 78,061 |
| Net increase (decrease) in net assets resulting from operations | 339,969 | 273,187 |
| Distributions to shareholders from net investment income | (2,802) | (1,135) |
| Distributions to shareholders from net realized gain | (76,753) | – |
| Total distributions | (79,555) | (1,135) |
| Share transactions - net increase (decrease) | 282,282 | (83,878) |
| Total increase (decrease) in net assets | 542,696 | 188,174 |
| Net Assets | | |
| Beginning of period | 1,363,892 | 1,175,718 |
| End of period | $1,906,588 | $1,363,892 |
| Other Information | | |
| Undistributed net investment income end of period | $1,599 | $1,292 |
See accompanying notes which are an integral part of the financial statements.
Financial Highlights
Fidelity Growth Discovery Fund
| Years ended June 30, | 2018 | 2017 | 2016 | 2015 | 2014 |
| Selected Per–Share Data | | | | | |
| Net asset value, beginning of period | $30.58 | $24.47 | $24.93 | $23.07 | $17.45 |
| Income from Investment Operations | | | | | |
| Net investment income (loss)A | .07 | .06 | .01 | .07 | .02 |
| Net realized and unrealized gain (loss) | 6.71 | 6.07 | (.43) | 1.81 | 5.63 |
| Total from investment operations | 6.78 | 6.13 | (.42) | 1.88 | 5.65 |
| Distributions from net investment income | (.05) | (.02) | (.03) | (.02) | (.02) |
| Distributions from net realized gain | (1.56) | – | (.01) | – | (.01) |
| Total distributions | (1.61) | (.02) | (.04) | (.02) | (.03) |
| Net asset value, end of period | $35.75 | $30.58 | $24.47 | $24.93 | $23.07 |
| Total ReturnB | 22.94% | 25.08% | (1.68)% | 8.17% | 32.40% |
| Ratios to Average Net AssetsC,D | | | | | |
| Expenses before reductions | .74% | .66% | .78% | .77% | .81% |
| Expenses net of fee waivers, if any | .74% | .66% | .78% | .77% | .81% |
| Expenses net of all reductions | .73% | .65% | .78% | .77% | .81% |
| Net investment income (loss) | .22% | .24% | .03% | .27% | .10% |
| Supplemental Data | | | | | |
| Net assets, end of period (in millions) | $1,546 | $1,157 | $1,000 | $1,078 | $1,072 |
| Portfolio turnover rateE | 45% | 65% | 57% | 51% | 70% |
A Calculated based on average shares outstanding during the period.
B Total returns would have been lower if certain expenses had not been reduced during the applicable periods shown.
C Fees and expenses of any underlying Fidelity Central Funds are not included in the Fund's expense ratio. The Fund indirectly bears its proportionate share of the expenses of any underlying Fidelity Central Funds.
D Expense ratios reflect operating expenses of the class. Expenses before reductions do not reflect amounts reimbursed by the investment adviser or reductions from brokerage service arrangements or reductions from other expense offset arrangements and do not represent the amount paid by the class during periods when reimbursements or reductions occur. Expenses net of fee waivers reflect expenses after reimbursement by the investment adviser but prior to reductions from brokerage service arrangements or other expense offset arrangements. Expenses net of all reductions represent the net expenses paid by the class.
E Amount does not include the portfolio activity of any underlying Fidelity Central Funds.
See accompanying notes which are an integral part of the financial statements.
Fidelity Growth Discovery Fund Class K
| Years ended June 30, | 2018 | 2017 | 2016 | 2015 | 2014 |
| Selected Per–Share Data | | | | | |
| Net asset value, beginning of period | $30.61 | $24.48 | $24.94 | $23.09 | $17.45 |
| Income from Investment Operations | | | | | |
| Net investment income (loss)A | .11 | .10 | .04 | .10 | .05 |
| Net realized and unrealized gain (loss) | 6.71 | 6.07 | (.43) | 1.82 | 5.63 |
| Total from investment operations | 6.82 | 6.17 | (.39) | 1.92 | 5.68 |
| Distributions from net investment income | (.09) | (.04) | (.06) | (.07) | (.04) |
| Distributions from net realized gain | (1.56) | – | (.01) | – | (.01) |
| Total distributions | (1.65) | (.04) | (.07) | (.07) | (.04)B |
| Net asset value, end of period | $35.78 | $30.61 | $24.48 | $24.94 | $23.09 |
| Total ReturnC | 23.05% | 25.23% | (1.57)% | 8.32% | 32.62% |
| Ratios to Average Net AssetsD,E | | | | | |
| Expenses before reductions | .63% | .54% | .66% | .64% | .68% |
| Expenses net of fee waivers, if any | .63% | .54% | .66% | .64% | .68% |
| Expenses net of all reductions | .63% | .53% | .65% | .64% | .67% |
| Net investment income (loss) | .32% | .36% | .16% | .40% | .24% |
| Supplemental Data | | | | | |
| Net assets, end of period (in millions) | $361 | $207 | $176 | $202 | $190 |
| Portfolio turnover rateF | 45% | 65% | 57% | 51% | 70% |
A Calculated based on average shares outstanding during the period.
B Total distributions of $.04 per share is comprised of distributions from net investment income of $.036 and distributions from net realized gain of $.006 per share.
C Total returns would have been lower if certain expenses had not been reduced during the applicable periods shown.
D Fees and expenses of any underlying Fidelity Central Funds are not included in the Fund's expense ratio. The Fund indirectly bears its proportionate share of the expenses of any underlying Fidelity Central Funds.
E Expense ratios reflect operating expenses of the class. Expenses before reductions do not reflect amounts reimbursed by the investment adviser or reductions from brokerage service arrangements or reductions from other expense offset arrangements and do not represent the amount paid by the class during periods when reimbursements or reductions occur. Expenses net of fee waivers reflect expenses after reimbursement by the investment adviser but prior to reductions from brokerage service arrangements or other expense offset arrangements. Expenses net of all reductions represent the net expenses paid by the class.
F Amount does not include the portfolio activity of any underlying Fidelity Central Funds.
See accompanying notes which are an integral part of the financial statements.
Notes to Financial Statements
For the period ended June 30, 2018
(Amounts in thousands except percentages)
1. Organization.
Fidelity Growth Discovery Fund (the Fund) is a fund of Fidelity Hastings Street Trust (the Trust) and is authorized to issue an unlimited number of shares. The Trust is registered under the Investment Company Act of 1940, as amended (the 1940 Act), as an open-end management investment company organized as a Massachusetts business trust. The Fund offers Growth Discovery and Class K shares, each of which has equal rights as to assets and voting privileges. Each class has exclusive voting rights with respect to matters that affect that class.
2. Investments in Fidelity Central Funds.
The Fund invests in Fidelity Central Funds, which are open-end investment companies generally available only to other investment companies and accounts managed by the investment adviser and its affiliates. The Fund's Schedule of Investments lists each of the Fidelity Central Funds held as of period end, if any, as an investment of the Fund, but does not include the underlying holdings of each Fidelity Central Fund. As an Investing Fund, the Fund indirectly bears its proportionate share of the expenses of the underlying Fidelity Central Funds.
The Money Market Central Funds seek preservation of capital and current income and are managed by Fidelity Investments Money Management, Inc. (FIMM), an affiliate of the investment adviser. Annualized expenses of the Money Market Central Funds as of their most recent shareholder report date are less than .005%.
A complete unaudited list of holdings for each Fidelity Central Fund is available upon request or at the Securities and Exchange Commission (the SEC) website at www.sec.gov. In addition, the financial statements of the Fidelity Central Funds, which are not covered by the Fund's Report of Independent Registered Public Accounting Firm, are available on the SEC website or upon request.
3. Significant Accounting Policies.
The Fund is an investment company and applies the accounting and reporting guidance of the Financial Accounting Standards Board (FASB) Accounting Standards Codification Topic 946 Financial Services – Investments Companies. The financial statements have been prepared in conformity with accounting principles generally accepted in the United States of America (GAAP), which require management to make certain estimates and assumptions at the date of the financial statements. Actual results could differ from those estimates. Subsequent events, if any, through the date that the financial statements were issued have been evaluated in the preparation of the financial statements. The following summarizes the significant accounting policies of the Fund:
Investment Valuation. Investments are valued as of 4:00 p.m. Eastern time on the last calendar day of the period. The Board of Trustees (the Board) has delegated the day to day responsibility for the valuation of the Fund's investments to the Fair Value Committee (the Committee) established by the Fund's investment adviser. In accordance with valuation policies and procedures approved by the Board, the Fund attempts to obtain prices from one or more third party pricing vendors or brokers to value its investments. When current market prices, quotations or currency exchange rates are not readily available or reliable, investments will be fair valued in good faith by the Committee, in accordance with procedures adopted by the Board. Factors used in determining fair value vary by investment type and may include market or investment specific events. The frequency with which these procedures are used cannot be predicted and they may be utilized to a significant extent. The Committee oversees the Fund's valuation policies and procedures and reports to the Board on the Committee's activities and fair value determinations. The Board monitors the appropriateness of the procedures used in valuing the Fund's investments and ratifies the fair value determinations of the Committee.
The Fund categorizes the inputs to valuation techniques used to value its investments into a disclosure hierarchy consisting of three levels as shown below:
- Level 1 – quoted prices in active markets for identical investments
- Level 2 – other significant observable inputs (including quoted prices for similar investments, interest rates, prepayment speeds, etc.)
- Level 3 – unobservable inputs (including the Fund's own assumptions based on the best information available)
Valuation techniques used to value the Fund's investments by major category are as follows:
Equity securities, including restricted securities, for which market quotations are readily available, are valued at the last reported sale price or official closing price as reported by a third party pricing vendor on the primary market or exchange on which they are traded and are categorized as Level 1 in the hierarchy. In the event there were no sales during the day or closing prices are not available, securities are valued at the last quoted bid price or may be valued using the last available price and are generally categorized as Level 2 in the hierarchy. For foreign equity securities, when market or security specific events arise, comparisons to the valuation of American Depositary Receipts (ADRs), futures contracts, Exchange-Traded Funds (ETFs) and certain indexes as well as quoted prices for similar securities may be used and would be categorized as Level 2 in the hierarchy. Utilizing these techniques may result in transfers between Level 1 and Level 2. For equity securities, including restricted securities, where observable inputs are limited, assumptions about market activity and risk are used and these securities may be categorized as Level 3 in the hierarchy.
Investments in open-end mutual funds, including the Fidelity Central Funds, are valued at their closing net asset value (NAV) each business day and are categorized as Level 1 in the hierarchy.
Changes in valuation techniques may result in transfers in or out of an assigned level within the disclosure hierarchy. The aggregate value of investments by input level as of June 30, 2018 is included at the end of the Fund's Schedule of Investments.
Foreign Currency. The Fund may use foreign currency contracts to facilitate transactions in foreign-denominated securities. Gains and losses from these transactions may arise from changes in the value of the foreign currency or if the counterparties do not perform under the contracts' terms.
Foreign-denominated assets, including investment securities, and liabilities are translated into U.S. dollars at the exchange rates at period end. Purchases and sales of investment securities, income and dividends received and expenses denominated in foreign currencies are translated into U.S. dollars at the exchange rate in effect on the transaction date.
The effects of exchange rate fluctuations on investments are included with the net realized and unrealized gain (loss) on investment securities. Other foreign currency transactions resulting in realized and unrealized gain (loss) are disclosed separately.
Investment Transactions and Income. For financial reporting purposes, the Fund's investment holdings and NAV include trades executed through the end of the last business day of the period. The NAV per share for processing shareholder transactions is calculated as of the close of business of the New York Stock Exchange (NYSE), normally 4:00 p.m. Eastern time and includes trades executed through the end of the prior business day. Gains and losses on securities sold are determined on the basis of identified cost and include proceeds received from litigation. Dividend income is recorded on the ex-dividend date, except for certain dividends from foreign securities where the ex-dividend date may have passed, which are recorded as soon as the Fund is informed of the ex-dividend date. Non-cash dividends included in dividend income, if any, are recorded at the fair market value of the securities received. Income and capital gain distributions from Fidelity Central Funds, if any, are recorded on the ex-dividend date. Certain distributions received by the Fund represent a return of capital or capital gain. The Fund determines the components of these distributions subsequent to the ex-dividend date, based upon receipt of tax filings or other correspondence relating to the underlying investment. These distributions are recorded as a reduction of cost of investments and/or as a realized gain. Investment income is recorded net of foreign taxes withheld where recovery of such taxes is uncertain.
Class Allocations and Expenses. Investment income, realized and unrealized capital gains and losses, common expenses of the Fund, and certain fund-level expense reductions, if any, are allocated daily on a pro-rata basis to each class based on the relative net assets of each class to the total net assets of the Fund. Each class differs with respect to transfer agent fees incurred. Certain expense reductions may also differ by class. For the reporting period, the allocated portion of income and expenses to each class as a percent of its average net assets may vary due to the timing of recording these transactions in relation to fluctuating net assets of the classes. Expenses directly attributable to a fund are charged to that fund. Expenses attributable to more than one fund are allocated among the respective funds on the basis of relative net assets or other appropriate methods. Expense estimates are accrued in the period to which they relate and adjustments are made when actual amounts are known.
Income Tax Information and Distributions to Shareholders. Each year, the Fund intends to qualify as a regulated investment company under Subchapter M of the Internal Revenue Code, including distributing substantially all of its taxable income and realized gains. As a result, no provision for U.S. Federal income taxes is required. As of June 30, 2018, the Fund did not have any unrecognized tax benefits in the financial statements; nor is the Fund aware of any tax positions for which it is reasonably possible that the total amounts of unrecognized tax benefits will significantly change in the next twelve months. The Fund files a U.S. federal tax return, in addition to state and local tax returns as required. The Fund's federal income tax returns are subject to examination by the Internal Revenue Service (IRS) for a period of three fiscal years after they are filed. State and local tax returns may be subject to examination for an additional fiscal year depending on the jurisdiction. Foreign taxes are provided for based on the Fund's understanding of the tax rules and rates that exist in the foreign markets in which it invests. The Fund is subject to a tax imposed on capital gains by certain countries in which it invests. An estimated deferred tax liability for net unrealized appreciation on the applicable securities is included in Other payables and accrued expenses on the Statement of Assets & Liabilities.
Distributions are declared and recorded on the ex-dividend date. Income and capital gain distributions are declared separately for each class. Income and capital gain distributions are determined in accordance with income tax regulations, which may differ from GAAP. In addition, the Fund claimed a portion of the payment made to redeeming shareholders as a distribution for income tax purposes.
Capital accounts within the financial statements are adjusted for permanent book-tax differences. These adjustments have no impact on net assets or the results of operations. Capital accounts are not adjusted for temporary book-tax differences which will reverse in a subsequent period.
Book-tax differences are primarily due to foreign currency transactions, passive foreign investment companies (PFIC), partnerships, and losses deferred due to wash sales and excise tax regulations.
As of period end, the cost and unrealized appreciation (depreciation) in securities, and derivatives if applicable, for federal income tax purposes were as follows:
| Gross unrealized appreciation | $581,353 |
| Gross unrealized depreciation | (30,186) |
| Net unrealized appreciation (depreciation) | $551,167 |
| Tax Cost | $1,359,428 |
The tax-based components of distributable earnings as of period end were as follows:
| Undistributed ordinary income | $1,599 |
| Undistributed long-term capital gain | $55,395 |
| Net unrealized appreciation (depreciation) on securities and other investments | $551,154 |
The Fund intends to elect to defer to its next fiscal year $2,006 of capital losses recognized during the period November 1, 2017 to June 30, 2018.
The tax character of distributions paid was as follows:
| | June 30, 2018 | June 30, 2017 |
| Ordinary Income | $3,368 | $ 1,135 |
| Long-term Capital Gains | 76,187 | – |
| Total | $79,555 | $ 1,135 |
Restricted Securities. The Fund may invest in securities that are subject to legal or contractual restrictions on resale. These securities generally may be resold in transactions exempt from registration or to the public if the securities are registered. Disposal of these securities may involve time-consuming negotiations and expense, and prompt sale at an acceptable price may be difficult. Information regarding restricted securities is included at the end of the Fund's Schedule of Investments.
4. Purchases and Sales of Investments.
Purchases and sales of securities, other than short-term securities, aggregated $956,627 and $742,860, respectively.
5. Fees and Other Transactions with Affiliates.
Management Fee. Fidelity Management & Research Company (the investment adviser) and its affiliates provide the Fund with investment management related services for which the Fund pays a monthly management fee. The management fee is the sum of an individual fund fee rate that is based on an annual rate of .30% of the Fund's average net assets and an annualized group fee rate that averaged .24% during the period. The group fee rate is based upon the average net assets of all the mutual funds advised by the investment adviser, including any mutual funds previously advised by the investment adviser that are currently advised by Fidelity SelectCo, LLC, an affiliate of the investment adviser. The group fee rate decreases as assets under management increase and increases as assets under management decrease. In addition, the management fee is subject to a performance adjustment (up to a maximum of +/- .20% of the Fund's average net assets over a 36 month performance period). The upward or downward adjustment to the management fee is based on the relative investment performance of Growth Discovery as compared to its benchmark index, the Russell 3000 Growth Index, over the same 36 month performance period. For the reporting period, the total annual management fee rate, including the performance adjustment, was .54% of the Fund's average net assets. The performance adjustment included in the management fee rate may be higher or lower than the maximum performance adjustment rate due to the difference between the average net assets for the reporting and performance periods.
Transfer Agent Fees. Fidelity Investments Institutional Operations Company, Inc., (FIIOC), an affiliate of the investment adviser, is the transfer, dividend disbursing and shareholder servicing agent for each class of the Fund. FIIOC receives account fees and asset-based fees that vary according to the account size and type of account of the shareholders of Growth Discovery, except for Class K. FIIOC receives an asset-based fee of Class K's average net assets. FIIOC pays for typesetting, printing and mailing of shareholder reports, except proxy statements.
For the period, transfer agent fees for each class were as follows:
| | Amount | % of Class-Level Average Net Assets |
| Growth Discovery | $2,080 | .15 |
| Class K | 155 | .05 |
| | $2,235 | |
Accounting and Security Lending Fees. Fidelity Service Company, Inc. (FSC), an affiliate of the investment adviser, maintains the Fund's accounting records. The accounting fee is based on the level of average net assets for each month. Under a separate contract, FSC administers the security lending program. The security lending fee is based on the number and duration of lending transactions. For the period, the fees were equivalent to an annual rate of .03%.
Brokerage Commissions. The Fund placed a portion of its portfolio transactions with brokerage firms which are affiliates of the investment adviser. Brokerage commissions are included in net realized gain (loss) and change in net unrealized appreciation (depreciation) in the Statement of Operations. The commissions paid to these affiliated firms were $20 for the period.
Interfund Lending Program. Pursuant to an Exemptive Order issued by the SEC, the Fund, along with other registered investment companies having management contracts with Fidelity Management & Research Company (FMR) or other affiliated entities of FMR, may participate in an interfund lending program. This program provides an alternative credit facility allowing the funds to borrow from, or lend money to, other participating affiliated funds. At period end, there were no interfund loans outstanding. The Fund's activity in this program during the period for which loans were outstanding was as follows:
| Borrower or Lender | Average Loan Balance | Weighted Average Interest Rate | Interest Expense |
| Borrower | $29,579 | 1.78% | $1 |
Interfund Trades. The Fund may purchase from or sell securities to other Fidelity Funds under procedures adopted by the Board. The procedures have been designed to ensure these interfund trades are executed in accordance with Rule 17a-7 of the 1940 Act. Interfund trades are included within the respective purchases and sales amounts shown in the Purchases and Sales of Investments note.
6. Committed Line of Credit.
The Fund participates with other funds managed by the investment adviser or an affiliate in a $4.25 billion credit facility (the "line of credit") to be utilized for temporary or emergency purposes to fund shareholder redemptions or for other short-term liquidity purposes. The Fund has agreed to pay commitment fees on its pro-rata portion of the line of credit, which amounted to $5 and is reflected in Miscellaneous expenses on the Statement of Operations. During the period, the Fund did not borrow on this line of credit.
7. Security Lending.
The Fund lends portfolio securities through a lending agent from time to time in order to earn additional income. For equity securities, a lending agent is used and may loan securities to certain qualified borrowers, including Fidelity Capital Markets (FCM), a broker-dealer affiliated with the Fund. On the settlement date of the loan, the Fund receives collateral (in the form of U.S. Treasury obligations, letters of credit and/or cash) against the loaned securities and maintains collateral in an amount not less than 100% of the market value of the loaned securities during the period of the loan. The market value of the loaned securities is determined at the close of business of the Fund and any additional required collateral is delivered to the Fund on the next business day. The Fund or borrower may terminate the loan at any time, and if the borrower defaults on its obligation to return the securities loaned because of insolvency or other reasons, the Fund may apply collateral received from the borrower against the obligation. The Fund may experience delays and costs in recovering the securities loaned. Any cash collateral received is invested in the Fidelity Securities Lending Cash Central Fund. The value of loaned securities and cash collateral at period end are disclosed on the Fund's Statement of Assets and Liabilities. At period end, there were no security loans outstanding with FCM. Security lending income represents the income earned on investing cash collateral, less rebates paid to borrowers and any lending agent fees associated with the loan, plus any premium payments received for lending certain types of securities. Security lending income is presented in the Statement of Operations as a component of income from Fidelity Central Funds. Total security lending income during the period amounted to $363, including $2 from securities loaned to FCM.
8. Expense Reductions.
Commissions paid to certain brokers with whom the investment adviser, or its affiliates, places trades on behalf of the Fund include an amount in addition to trade execution, which may be rebated back to the Fund to offset certain expenses. This amount totaled $124 for the period. In addition, through arrangements with the Fund's custodian, credits realized as a result of certain uninvested cash balances were used to reduce the Fund's expenses. During the period, these credits reduced the Fund's custody expenses by $1.
In addition, during the period the investment adviser reimbursed and/or waived a portion of fund-level operating expenses in the amount of $14.
9. Distributions to Shareholders.
Distributions to shareholders of each class were as follows:
| | Year ended
June 30, 2018 | Year ended
June 30, 2017 |
| From net investment income | | |
| Growth Discovery | $1,948 | $880 |
| Class K | 854 | 255 |
| Total | $2,802 | $1,135 |
| From net realized gain | | |
| Growth Discovery | $61,060 | $– |
| Class K | 15,693 | – |
| Total | $76,753 | $– |
10. Share Transactions.
Share transactions for each class were as follows and may contain automatic conversions between classes or exchanges between affiliated funds:
| | Shares | Shares | Dollars | Dollars |
| | Year ended June 30, 2018 | Year ended June 30, 2017 | Year ended June 30, 2018 | Year ended June 30, 2017 |
| Growth Discovery | | | | |
| Shares sold | 10,801 | 4,332 | $362,769 | $121,287 |
| Reinvestment of distributions | 1,871 | 32 | 59,167 | 821 |
| Shares redeemed | (7,251) | (7,392) | (242,656) | (196,671) |
| Net increase (decrease) | 5,421 | (3,028) | $179,280 | $(74,563) |
| Class K | | | | |
| Shares sold | 6,932 | 1,584 | $227,726 | $44,201 |
| Reinvestment of distributions | 521 | 10 | 16,547 | 255 |
| Shares redeemed | (4,139) | (2,017) | (141,271) | (53,771) |
| Net increase (decrease) | 3,314 | (423) | $103,002 | $(9,315) |
11. Other.
The Fund's organizational documents provide former and current trustees and officers with a limited indemnification against liabilities arising in connection with the performance of their duties to the Fund. In the normal course of business, the Fund may also enter into contracts that provide general indemnifications. The Fund's maximum exposure under these arrangements is unknown as this would be dependent on future claims that may be made against the Fund. The risk of material loss from such claims is considered remote.
Report of Independent Registered Public Accounting Firm
To the Board of Trustees of Fidelity Hastings Street Trust and Shareholders of Fidelity Growth Discovery Fund:
Opinion on the Financial Statements
We have audited the accompanying statement of assets and liabilities, including the schedule of investments, of Fidelity Growth Discovery Fund (one of the funds constituting Fidelity Hastings Street Trust, referred to hereafter as the "Fund") as of June 30, 2018, the related statement of operations for the year ended June 30, 2018, the statement of changes in net assets for each of the two years in the period ended June 30, 2018, including the related notes, and the financial highlights for each of the five years in the period ended June 30, 2018 (collectively referred to as the “financial statements”). In our opinion, the financial statements present fairly, in all material respects, the financial position of the Fund as of June 30, 2018, the results of its operations for the year then ended, the changes in its net assets for each of the two years in the period ended June 30, 2018 and the financial highlights for each of the five years in the period ended June 30, 2018 in conformity with accounting principles generally accepted in the United States of America.
Basis for Opinion
These financial statements are the responsibility of the Fund’s management. Our responsibility is to express an opinion on the Fund’s financial statements based on our audits. We are a public accounting firm registered with the Public Company Accounting Oversight Board (United States) (“PCAOB”) and are required to be independent with respect to the Fund in accordance with the U.S. federal securities laws and the applicable rules and regulations of the Securities and Exchange Commission and the PCAOB.
We conducted our audits of these financial statements in accordance with the standards of the PCAOB. Those standards require that we plan and perform the audit to obtain reasonable assurance about whether the financial statements are free of material misstatement, whether due to error or fraud.
Our audits included performing procedures to assess the risks of material misstatement of the financial statements, whether due to error or fraud, and performing procedures that respond to those risks. Such procedures included examining, on a test basis, evidence regarding the amounts and disclosures in the financial statements. Our audits also included evaluating the accounting principles used and significant estimates made by management, as well as evaluating the overall presentation of the financial statements. Our procedures included confirmation of securities owned as of June 30, 2018 by correspondence with the custodian, and brokers; when replies were not received from brokers, we performed other auditing procedures. We believe that our audits provide a reasonable basis for our opinion.
PricewaterhouseCoopers LLP
Boston, Massachusetts
August 13, 2018
We have served as the auditor of one or more investment companies in the Fidelity group of funds since 1932.
Trustees and Officers
The Trustees, Members of the Advisory Board (if any), and officers of the trust and fund, as applicable, are listed below. The Board of Trustees governs the fund and is responsible for protecting the interests of shareholders. The Trustees are experienced executives who meet periodically throughout the year to oversee the fund's activities, review contractual arrangements with companies that provide services to the fund, oversee management of the risks associated with such activities and contractual arrangements, and review the fund's performance. Except for Michael E. Wiley, each of the Trustees oversees 284 funds. Mr. Wiley oversees 197 funds.
The Trustees hold office without limit in time except that (a) any Trustee may resign; (b) any Trustee may be removed by written instrument, signed by at least two-thirds of the number of Trustees prior to such removal; (c) any Trustee who requests to be retired or who has become incapacitated by illness or injury may be retired by written instrument signed by a majority of the other Trustees; and (d) any Trustee may be removed at any special meeting of shareholders by a two-thirds vote of the outstanding voting securities of the trust. Each Trustee who is not an interested person (as defined in the 1940 Act) of the trust and the fund is referred to herein as an Independent Trustee. Each Independent Trustee shall retire not later than the last day of the calendar year in which his or her 75th birthday occurs. The Independent Trustees may waive this mandatory retirement age policy with respect to individual Trustees. Officers and Advisory Board Members hold office without limit in time, except that any officer or Advisory Board Member may resign or may be removed by a vote of a majority of the Trustees at any regular meeting or any special meeting of the Trustees. Except as indicated, each individual has held the office shown or other offices in the same company for the past five years.
The fund’s Statement of Additional Information (SAI) includes more information about the Trustees. To request a free copy, call Fidelity at 1-800-544-8544.
Experience, Skills, Attributes, and Qualifications of the Trustees. The Governance and Nominating Committee has adopted a statement of policy that describes the experience, qualifications, attributes, and skills that are necessary and desirable for potential Independent Trustee candidates (Statement of Policy). The Board believes that each Trustee satisfied at the time he or she was initially elected or appointed a Trustee, and continues to satisfy, the standards contemplated by the Statement of Policy. The Governance and Nominating Committee also engages professional search firms to help identify potential Independent Trustee candidates who have the experience, qualifications, attributes, and skills consistent with the Statement of Policy. From time to time, additional criteria based on the composition and skills of the current Independent Trustees, as well as experience or skills that may be appropriate in light of future changes to board composition, business conditions, and regulatory or other developments, have also been considered by the professional search firms and the Governance and Nominating Committee. In addition, the Board takes into account the Trustees' commitment and participation in Board and committee meetings, as well as their leadership of standing and ad hoc committees throughout their tenure.
In determining that a particular Trustee was and continues to be qualified to serve as a Trustee, the Board has considered a variety of criteria, none of which, in isolation, was controlling. The Board believes that, collectively, the Trustees have balanced and diverse experience, qualifications, attributes, and skills, which allow the Board to operate effectively in governing the fund and protecting the interests of shareholders. Information about the specific experience, skills, attributes, and qualifications of each Trustee, which in each case led to the Board's conclusion that the Trustee should serve (or continue to serve) as a trustee of the fund, is provided below.
Board Structure and Oversight Function. James C. Curvey is an interested person and currently serves as Chairman. The Trustees have determined that an interested Chairman is appropriate and benefits shareholders because an interested Chairman has a personal and professional stake in the quality and continuity of services provided to the fund. Independent Trustees exercise their informed business judgment to appoint an individual of their choosing to serve as Chairman, regardless of whether the Trustee happens to be independent or a member of management. The Independent Trustees have determined that they can act independently and effectively without having an Independent Trustee serve as Chairman and that a key structural component for assuring that they are in a position to do so is for the Independent Trustees to constitute a substantial majority for the Board. The Independent Trustees also regularly meet in executive session. Ned C. Lautenbach serves as Chairman of the Independent Trustees and as such (i) acts as a liaison between the Independent Trustees and management with respect to matters important to the Independent Trustees and (ii) with management prepares agendas for Board meetings.
Fidelity® funds are overseen by different Boards of Trustees. The fund's Board oversees Fidelity's high income and certain equity funds, and other Boards oversee Fidelity's investment-grade bond, money market, asset allocation, and other equity funds. The asset allocation funds may invest in Fidelity® funds overseen by the fund's Board. The use of separate Boards, each with its own committee structure, allows the Trustees of each group of Fidelity® funds to focus on the unique issues of the funds they oversee, including common research, investment, and operational issues. On occasion, the separate Boards establish joint committees to address issues of overlapping consequences for the Fidelity® funds overseen by each Board.
The Trustees operate using a system of committees to facilitate the timely and efficient consideration of all matters of importance to the Trustees, the fund, and fund shareholders and to facilitate compliance with legal and regulatory requirements and oversight of the fund's activities and associated risks. The Board, acting through its committees, has charged FMR and its affiliates with (i) identifying events or circumstances the occurrence of which could have demonstrably adverse effects on the fund's business and/or reputation; (ii) implementing processes and controls to lessen the possibility that such events or circumstances occur or to mitigate the effects of such events or circumstances if they do occur; and (iii) creating and maintaining a system designed to evaluate continuously business and market conditions in order to facilitate the identification and implementation processes described in (i) and (ii) above. Because the day-to-day operations and activities of the fund are carried out by or through FMR, its affiliates, and other service providers, the fund's exposure to risks is mitigated but not eliminated by the processes overseen by the Trustees. While each of the Board's committees has responsibility for overseeing different aspects of the fund's activities, oversight is exercised primarily through the Operations, Audit, and Compliance Committees. In addition, the Independent Trustees have worked with Fidelity to enhance the Board's oversight of investment and financial risks, legal and regulatory risks, technology risks, and operational risks, including the development of additional risk reporting to the Board. Appropriate personnel, including but not limited to the fund's Chief Compliance Officer (CCO), FMR's internal auditor, the independent accountants, the fund's Treasurer and portfolio management personnel, make periodic reports to the Board's committees, as appropriate, including an annual review of Fidelity's risk management program for the Fidelity® funds. The responsibilities of each standing committee, including their oversight responsibilities, are described further under "Standing Committees of the Trustees."
Interested Trustees*:
Correspondence intended for a Trustee who is an interested person may be sent to Fidelity Investments, 245 Summer Street, Boston, Massachusetts 02210.
Name, Year of Birth; Principal Occupations and Other Relevant Experience+
James C. Curvey (1935)
Year of Election or Appointment: 2007
Trustee
Chairman of the Board of Trustees
Mr. Curvey also serves as Trustee of other Fidelity® funds. Mr. Curvey is Vice Chairman (2007-present) and Director of FMR LLC (diversified financial services company). In addition, Mr. Curvey is an Overseer Emeritus for the Boston Symphony Orchestra, a Director of Artis-Naples, and a Trustee of Brewster Academy in Wolfeboro, New Hampshire. Previously, Mr. Curvey served as a Director of Fidelity Research & Analysis Co. (investment adviser firm, 2009-2018), Director of Fidelity Investments Money Management, Inc. (investment adviser firm, 2009-2014) and a Director of FMR and FMR Co., Inc. (investment adviser firms, 2007-2014).
Charles S. Morrison (1960)
Year of Election or Appointment: 2014
Trustee
Mr. Morrison also serves as Trustee of other funds. He serves as President of Fidelity SelectCo, LLC (investment adviser firm, 2017-present) and Fidelity Management & Research Company (FMR) (investment adviser firm, 2016-present), a Director of Fidelity Investments Money Management, Inc. (FIMM) (investment adviser firm, 2014-present), Director of Fidelity SelectCo, LLC (investment adviser firm, 2014-present), President, Asset Management (2014-present), and is an employee of Fidelity Investments. Previously, Mr. Morrison served as Vice President of Fidelity's Fixed Income and Asset Allocation Funds (2012-2014), President, Fixed Income (2011-2014), Vice President of Fidelity's Money Market Funds (2005-2009), President, Money Market Group Leader of FMR (investment adviser firm, 2009), and Senior Vice President, Money Market Group of FMR (2004-2009). Mr. Morrison also served as Vice President of Fidelity's Bond Funds (2002-2005), certain Balanced Funds (2002-2005), and certain Asset Allocation Funds (2002-2007), and as Senior Vice President (2002-2005) of Fidelity's Bond Division.
* Determined to be an “Interested Trustee” by virtue of, among other things, his or her affiliation with the trust or various entities under common control with FMR.
+ The information includes the Trustee's principal occupation during the last five years and other information relating to the experience, attributes, and skills relevant to the Trustee's qualifications to serve as a Trustee, which led to the conclusion that the Trustee should serve as a Trustee for the fund.
Independent Trustees:
Correspondence intended for an Independent Trustee may be sent to Fidelity Investments, P.O. Box 55235, Boston, Massachusetts 02205-5235.
Name, Year of Birth; Principal Occupations and Other Relevant Experience+
Dennis J. Dirks (1948)
Year of Election or Appointment: 2005
Trustee
Mr. Dirks also serves as Trustee of other Fidelity® funds. Prior to his retirement in May 2003, Mr. Dirks was Chief Operating Officer and a member of the Board of The Depository Trust & Clearing Corporation (DTCC). He also served as President, Chief Operating Officer, and Board member of The Depository Trust Company (DTC) and President and Board member of the National Securities Clearing Corporation (NSCC). In addition, Mr. Dirks served as Chief Executive Officer and Board member of the Government Securities Clearing Corporation, Chief Executive Officer and Board member of the Mortgage-Backed Securities Clearing Corporation, as a Trustee and a member of the Finance Committee of Manhattan College (2005-2008), as a Trustee and a member of the Finance Committee of AHRC of Nassau County (2006-2008), as a member of the Independent Directors Council (IDC) Governing Council (2010-2015), and as a member of the Board of Directors for The Brookville Center for Children’s Services, Inc. (2009-2017). Mr. Dirks is a member of the Finance Committee (2016-present), Board of Directors (2017-present) and Board of Trustees (2018-present) and is Treasurer (2018-present) of the Asolo Repertory Theatre.
Donald F. Donahue (1950)
Year of Election or Appointment: 2018
Trustee
Mr. Donahue also serves as a Trustee of other Fidelity® funds. Mr. Donahue is President and Chief Executive Officer of Miranda Partners, LLC (risk consulting for the financial services industry, 2012-present). Previously, Mr. Donahue served as a Member of the Advisory Board of certain Fidelity® funds (2015-2018) and Chief Executive Officer (2006-2012), Chief Operating Officer (2003-2006), and Managing Director, Customer Marketing and Development (1999-2003) of The Depository Trust & Clearing Corporation (financial markets infrastructure). Mr. Donahue serves as a Member (2007-present) and Co-Chairman (2016-present) of the Board of Directors of United Way of New York, Member of the Board of Directors of NYC Leadership Academy (2012-present) and Member of the Board of Advisors of Ripple Labs, Inc. (financial services, 2015-present). He also served as Chairman (2010-2012) and Member of the Board of Directors (2012-2013) of Omgeo, LLC (financial services), Treasurer of United Way of New York (2012-2016), and Member of the Board of Directors of XBRL US (financial services non-profit, 2009-2012) and the International Securities Services Association (2009-2012).
Alan J. Lacy (1953)
Year of Election or Appointment: 2008
Trustee
Mr. Lacy also serves as Trustee of other Fidelity® funds. Mr. Lacy serves as a Director of Bristol-Myers Squibb Company (global pharmaceuticals, 2008-present). He is a Trustee of the California Chapter of The Nature Conservancy (2015-present) and a Director of the Center for Advanced Study in the Behavioral Sciences at Stanford University (2015-present). In addition, Mr. Lacy served as Senior Adviser (2007-2014) of Oak Hill Capital Partners, L.P. (private equity) and also served as Chief Executive Officer (2005) and Vice Chairman (2005-2006) of Sears Holdings Corporation (retail) and Chief Executive Officer and Chairman of the Board of Sears, Roebuck and Co. (retail, 2000-2005). Previously, Mr. Lacy served as Chairman (2014-2017) and a member (2010-2017) of the Board of Directors of Dave & Buster’s Entertainment, Inc. (restaurant and entertainment complexes), as Chairman (2008-2011) and a member (2006-2015) of the Board of Trustees of the National Parks Conservation Association, and as a member of the Board of Directors for The Hillman Companies, Inc. (hardware wholesalers, 2010-2014), Earth Fare, Inc. (retail grocery, 2010-2014), and The Western Union Company (global money transfer, 2006-2011).
Ned C. Lautenbach (1944)
Year of Election or Appointment: 2000
Trustee
Chairman of the Independent Trustees
Mr. Lautenbach also serves as Trustee of other Fidelity® funds. Mr. Lautenbach currently serves as Vice Chair of the Board of Governors, State University System of Florida (2013-present) and is a member of the Council on Foreign Relations (1994-present). He is also a member and has most recently served as Chairman of the Board of Directors of Artis-Naples (2012-present). Previously, Mr. Lautenbach served as a member and then Lead Director of the Board of Directors of Eaton Corporation (diversified industrial, 1997-2016). He was also a Partner and Advisory Partner at Clayton, Dubilier & Rice, LLC (private equity investment, 1998-2010), as well as a Director of Sony Corporation (2006-2007). In addition, Mr. Lautenbach also had a 30-year career with IBM (technology company) during which time he served as Senior Vice President and a member of the Corporate Executive Committee (1968-1998).
Joseph Mauriello (1944)
Year of Election or Appointment: 2008
Trustee
Mr. Mauriello also serves as Trustee of other Fidelity® funds. Prior to his retirement in January 2006, Mr. Mauriello served in numerous senior management positions including Deputy Chairman and Chief Operating Officer (2004-2005), and Vice Chairman of Financial Services (2002-2004) of KPMG LLP US (professional services, 1965-2005). Mr. Mauriello currently serves as a member of the Board of Directors of XL Group plc. (global insurance and re-insurance, 2006-present) and the Independent Directors Council (IDC) Governing Council (2015-present). Previously, Mr. Mauriello served as a Director of the Hamilton Funds of the Bank of New York (2006-2007) and of Arcadia Resources Inc. (health care services and products, 2007-2012).
Cornelia M. Small (1944)
Year of Election or Appointment: 2005
Trustee
Ms. Small also serves as Trustee of other Fidelity® funds. Ms. Small is a member of the Board of Directors (2009-present) and Chair of the Investment Committee (2010-present) of the Teagle Foundation. Ms. Small also serves on the Investment Committee of the Berkshire Taconic Community Foundation (2008-present). Previously, Ms. Small served as Chairperson (2002-2008) and a member of the Investment Committee and Chairperson (2008-2012) and a member of the Board of Trustees of Smith College. In addition, Ms. Small served as Chief Investment Officer, Director of Global Equity Investments, and a member of the Board of Directors of Scudder, Stevens & Clark and Scudder Kemper Investments.
Garnett A. Smith (1947)
Year of Election or Appointment: 2018
Trustee
Mr. Smith also serves as Trustee of other Fidelity® funds. Prior to Mr. Smith's retirement, he served as Chairman and Chief Executive Officer of Inbrand Corp. (manufacturer of personal absorbent products, 1990-1997). He also served as President (1986-1990) of Inbrand Corp. Prior to his employment with Inbrand Corp., he was employed by a retail fabric chain and North Carolina National Bank. In addition, Mr. Smith served as a Member of the Advisory Board of certain Fidelity® funds (2012-2013) and as a board member of the Jackson Hole Land Trust (2009-2012).
David M. Thomas (1949)
Year of Election or Appointment: 2008
Trustee
Mr. Thomas also serves as Trustee of other Fidelity® funds. Mr. Thomas serves as Non-Executive Chairman of the Board of Directors of Fortune Brands Home and Security (home and security products, 2011-present), as a member of the Board of Directors (2004-present) and Presiding Director (2013-present) of Interpublic Group of Companies, Inc. (marketing communication), and as a member of the Board of Trustees of the University of Florida (2013-present). Previously, Mr. Thomas served as Executive Chairman (2005-2006) and Chairman and Chief Executive Officer (2000-2005) of IMS Health, Inc. (pharmaceutical and healthcare information solutions), and a Director of Fortune Brands, Inc. (consumer products, 2000-2011).
Michael E. Wiley (1950)
Year of Election or Appointment: 2018
Trustee
Mr. Wiley also serves as Trustee or Member of the Advisory Board of other Fidelity® funds. Mr. Wiley serves as a Director of Andeavor Corporation (independent oil refiner and marketer, 2005-present), a Director of Andeavor Logistics LP (natural resources logistics, 2015-present), and a Director of Bill Barrett Corporation (exploration and production, 2005-present). In addition, Mr. Wiley also serves as a Director of Post Oak Bank (privately-held bank, 2004-present). Previously, Mr. Wiley served as a Trustee of other Fidelity® funds (2008-2013), as a Director of Asia Pacific Exploration Consolidated (international oil and gas exploration and production, 2008-2013), as a member of the Board of Trustees of the University of Tulsa (2000-2006; 2007-2010), as a Senior Energy Advisor of Katzenbach Partners, LLC (consulting, 2006-2007), as an Advisory Director of Riverstone Holdings (private investment), Chairman, President, and CEO of Baker Hughes, Inc. (oilfield services, 2000-2004), and as Director of Spinnaker Exploration Company (exploration and production, 2001-2005).
+ The information includes the Trustee's principal occupation during the last five years and other information relating to the experience, attributes, and skills relevant to the Trustee's qualifications to serve as a Trustee, which led to the conclusion that the Trustee should serve as a Trustee for the fund.
Advisory Board Members and Officers:
Correspondence intended for a Member of the Advisory Board (if any) may be sent to Fidelity Investments, P.O. Box 55235, Boston, Massachusetts 02205-5235. Correspondence intended for an officer or Peter S. Lynch may be sent to Fidelity Investments, 245 Summer Street, Boston, Massachusetts 02210. Officers appear below in alphabetical order.
Name, Year of Birth; Principal Occupation
Peter S. Lynch (1944)
Year of Election or Appointment: 2003
Member of the Advisory Board
Mr. Lynch also serves as Member of the Advisory Board of other Fidelity® funds. Mr. Lynch is Vice Chairman and a Director of FMR (investment adviser firm) and FMR Co., Inc. (investment adviser firm). In addition, Mr. Lynch serves as a Trustee of Boston College and as the Chairman of the Inner-City Scholarship Fund. Previously, Mr. Lynch served on the Special Olympics International Board of Directors (1997-2006).
William S. Stavropoulos (1939)
Year of Election or Appointment: 2018
Member of the Advisory Board
Mr. Stavropoulos also serves as Member of the Advisory Board of other Fidelity® funds. Mr. Stavropoulos serves as President and Founder of the Michigan Baseball Foundation, the Great Lakes Loons (2007-present). Mr. Stavropoulos is Chairman Emeritus of the Board of Directors of The Dow Chemical Company, where he previously served in numerous senior management positions, including President, CEO (1995-2000; 2002-2004), Chairman of the Executive Committee (2000-2006), and as a member of the Board of Directors (1990-2006). Currently, Mr. Stavropoulos is Chairman of the Board of Directors of Univar Inc. (global distributor of commodity and specialty chemicals), a Director of Teradata Corporation (data warehousing and technology solutions), and a member of the Advisory Board for Metalmark Capital LLC (private equity investment, 2005-present). Mr. Stavropoulos is an operating advisor to Clayton, Dubilier & Rice, LLC (private equity investment). In addition, Mr. Stavropoulos is a member of the University of Notre Dame Advisory Council for the College of Science, a Trustee of the Rollin L. Gerstacker Foundation, and a Director of Artis-Naples in Naples, Florida. Previously, Mr. Stavropoulos served as Trustee of certain Fidelity® funds (2001-2018) and as a Director of Chemical Financial Corporation (bank holding company, 1993-2012) and Tyco International, Ltd. (multinational manufacturing and services, 2007-2012).
Carol B. Tomé (1957)
Year of Election or Appointment: 2018
Member of the Advisory Board
Ms. Tomé also serves as Member of the Advisory Board of other Fidelity® funds. Ms. Tomé is Chief Financial Officer (2001-present) and Executive Vice President of Corporate Services (2007-present) of The Home Depot, Inc. (home improvement retailer) and a Director (2003-present) and Chair of the Audit Committee (2004-present) of United Parcel Service, Inc. (package delivery and supply chain management). Previously, Ms. Tomé served as Trustee of certain Fidelity® funds (2017), Senior Vice President of Finance and Accounting/Treasurer (2000-2007) and Vice President and Treasurer (1995-2000) of The Home Depot, Inc. and Chair of the Board (2010-2012), Vice Chair of the Board (2009 and 2013), and a Director (2008-2013) of the Federal Reserve Bank of Atlanta. Ms. Tomé is also a director or trustee of many community and professional organizations.
Elizabeth Paige Baumann (1968)
Year of Election or Appointment: 2017
Anti-Money Laundering (AML) Officer
Ms. Baumann also serves as AML Officer of other funds. She is Chief AML Officer (2012-present) and Senior Vice President (2014-present) of FMR LLC (diversified financial services company) and is an employee of Fidelity Investments. Previously, Ms. Baumann served as AML Officer of the funds (2012-2016), and Vice President (2007-2014) and Deputy Anti-Money Laundering Officer (2007-2012) of FMR LLC.
Marc R. Bryant (1966)
Year of Election or Appointment: 2015
Secretary and Chief Legal Officer (CLO)
Mr. Bryant also serves as Secretary and CLO of other funds. Mr. Bryant serves as CLO, Secretary, and Senior Vice President of Fidelity Management & Research Company (investment adviser firm, 2015-present) and FMR Co., Inc. (investment adviser firm, 2015-present); Secretary of Fidelity SelectCo, LLC (investment adviser firm, 2015-present) and Fidelity Investments Money Management, Inc. (investment adviser firm, 2015-present); and CLO of Fidelity Management & Research (Hong Kong) Limited and FMR Investment Management (UK) Limited (investment adviser firms, 2015-present) and Fidelity Management & Research (Japan) Limited (investment adviser firm, 2016-present). He is Senior Vice President and Deputy General Counsel of FMR LLC (diversified financial services company). Previously, Mr. Bryant served as Secretary and CLO of Fidelity Rutland Square Trust II (2010-2014) and Assistant Secretary of Fidelity's Fixed Income and Asset Allocation Funds (2013-2015). Prior to joining Fidelity Investments, Mr. Bryant served as a Senior Vice President and the Head of Global Retail Legal for AllianceBernstein L.P. (2006-2010), and as the General Counsel for ProFund Advisors LLC (2001-2006).
John J. Burke III (1964)
Year of Election or Appointment: 2018
Chief Financial Officer
Mr. Burke also serves as Chief Financial Officer of other funds. Mr. Burke serves as Head of Investment Operations for Fidelity Fund and Investment Operations (2018-present) and is an employee of Fidelity Investments (1998-present). Previously Mr. Burke served as head of Asset Management Investment Operations (2012-2018).
William C. Coffey (1969)
Year of Election or Appointment: 2009
Assistant Secretary
Mr. Coffey also serves as Assistant Secretary of other funds. He is Senior Vice President and Deputy General Counsel of FMR LLC (diversified financial services company, 2010-present), and is an employee of Fidelity Investments. Previously, Mr. Coffey served as Vice President and Associate General Counsel of FMR LLC (2005-2009).
Timothy M. Cohen (1969)
Year of Election or Appointment: 2018
Vice President
Mr. Cohen also serves as Vice President of other funds. Mr. Cohen serves as Co-Head of Global Equity Research (2016-present), a Director of Fidelity Management & Research (Japan) Limited (investment adviser firm, 2016-present), and is an employee of Fidelity Investments. Previously, Mr. Cohen served as Chief Investment Officer - Equity and a Director of Fidelity Management & Research (U.K.) Inc. (investment adviser firm, 2013-2015) and as a Director of Fidelity Management & Research (Hong Kong) Limited (investment adviser firm, 2017).
Jonathan Davis (1968)
Year of Election or Appointment: 2010
Assistant Treasurer
Mr. Davis also serves as Assistant Treasurer of other funds. Mr. Davis serves as Assistant Treasurer of FMR Capital, Inc. (2017-present) and is an employee of Fidelity Investments. Previously, Mr. Davis served as Vice President and Associate General Counsel of FMR LLC (diversified financial services company, 2003-2010).
Adrien E. Deberghes (1967)
Year of Election or Appointment: 2016
Assistant Treasurer
Mr. Deberghes also serves as an officer of other funds. He serves as Assistant Treasurer of FMR Capital, Inc. (2017-present), Executive Vice President of Fidelity Investments Money Management, Inc. (FIMM) (investment adviser firm, 2016-present), and is an employee of Fidelity Investments (2008-present). Previously, Mr. Deberghes served as President and Treasurer of certain Fidelity® funds (2013-2018). Prior to joining Fidelity Investments, Mr. Deberghes was Senior Vice President of Mutual Fund Administration at State Street Corporation (2007-2008), Senior Director of Mutual Fund Administration at Investors Bank & Trust (2005-2007), and Director of Finance for Dunkin' Brands (2000-2005). Previously, Mr. Deberghes served in other fund officer roles.
Laura M. Del Prato (1964)
Year of Election or Appointment: 2018
Assistant Treasurer
Ms. Del Prato also serves as an officer of other funds. Ms. Del Prato is an employee of Fidelity Investments (2017-present). Prior to joining Fidelity Investments, Ms. Del Prato served as a Managing Director and Treasurer of the JPMorgan Mutual Funds (2014-2017). Prior to JPMorgan, Ms. Del Prato served as a partner at Cohen Fund Audit Services (accounting firm, 2012-2013) and KPMG LLP (accounting firm, 2004-2012).
Colm A. Hogan (1973)
Year of Election or Appointment: 2016
Deputy Treasurer
Mr. Hogan also serves as an officer of other funds. Mr. Hogan serves as Assistant Treasurer of FMR Capital, Inc. (2017-present) and is an employee of Fidelity Investments (2005-present). Previously, Mr. Hogan served as Assistant Treasurer of certain Fidelity® funds (2016-2018).
Pamela R. Holding (1964)
Year of Election or Appointment: 2018
Vice President
Ms. Holding also serves as a Vice President of other funds. Ms. Holding serves as Co-Head of Global Equity Research (2018-present) and is an employee of Fidelity Investments (2013-present).
Chris Maher (1972)
Year of Election or Appointment: 2013
Assistant Treasurer
Mr. Maher serves as Assistant Treasurer of other funds. Mr. Maher is Vice President of Valuation Oversight, serves as Assistant Treasurer of FMR Capital, Inc. (2017-present), and is an employee of Fidelity Investments. Previously, Mr. Maher served as Vice President of Asset Management Compliance (2013), Vice President of the Program Management Group of FMR (investment adviser firm, 2010-2013), and Vice President of Valuation Oversight (2008-2010).
Rieco E. Mello (1969)
Year of Election or Appointment: 2017
Assistant Treasurer
Mr. Mello also serves as Assistant Treasurer of other funds. Mr. Mello serves as Assistant Treasurer of FMR Capital, Inc. (2017-present) and is an employee of Fidelity Investments (1995-present).
Kenneth B. Robins (1969)
Year of Election or Appointment: 2016
Chief Compliance Officer
Mr. Robins also serves as an officer of other funds. Mr. Robins serves as Compliance Officer of Fidelity Management & Research Company and FMR Co., Inc. (investment adviser firms, 2016-present) and is an employee of Fidelity Investments (2004-present). Previously, Mr. Robins served as Executive Vice President of Fidelity Investments Money Management, Inc. (investment adviser firm, 2013-2016) and served in other fund officer roles.
Stacie M. Smith (1974)
Year of Election or Appointment: 2016
President and Treasurer
Ms. Smith also serves as an officer of other funds. Ms. Smith serves as Assistant Treasurer of FMR Capital, Inc. (2017-present), is an employee of Fidelity Investments (2009-present), and has served in other fund officer roles. Prior to joining Fidelity Investments, Ms. Smith served as Senior Audit Manager of Ernst & Young LLP (accounting firm, 1996-2009). Previously, Ms. Smith served as Assistant Treasurer (2013-2018) and Deputy Treasurer (2013-2016) of certain Fidelity® funds.
Marc L. Spector (1972)
Year of Election or Appointment: 2016
Assistant Treasurer
Mr. Spector also serves as an officer of other funds. Mr. Spector serves as Assistant Treasurer of FMR Capital, Inc. (2017-present) and is an employee of Fidelity Investments (2016-present). Prior to joining Fidelity Investments, Mr. Spector served as Director at the Siegfried Group (accounting firm, 2013-2016), and prior to Siegfried Group as audit senior manager at Deloitte & Touche (accounting firm, 2005-2013).
Renee Stagnone (1975)
Year of Election or Appointment: 2016
Assistant Treasurer
Ms. Stagnone also serves as an officer of other funds. Ms. Stagnone serves as Assistant Treasurer of FMR Capital, Inc. (2017-present) and is an employee of Fidelity Investments (1997-present). Previously, Ms. Stagnone served as Deputy Treasurer of certain Fidelity® funds (2013-2016).
Shareholder Expense Example
As a shareholder of the Fund, you incur two types of costs: (1) transaction costs and (2) ongoing costs, including management fees and other Fund expenses. This Example is intended to help you understand your ongoing costs (in dollars) of investing in the Fund and to compare these costs with the ongoing costs of investing in other mutual funds.
The Example is based on an investment of $1,000 invested at the beginning of the period and held for the entire period (January 1, 2018 to June 30, 2018).
Actual Expenses
The first line of the accompanying table for each class of the Fund provides information about actual account values and actual expenses. You may use the information in this line, together with the amount you invested, to estimate the expenses that you paid over the period. Simply divide your account value by $1,000.00 (for example, an $8,600 account value divided by $1,000.00 = 8.6), then multiply the result by the number in the first line for a class of the Fund under the heading entitled "Expenses Paid During Period" to estimate the expenses you paid on your account during this period. A small balance maintenance fee of $12.00 that is charged once a year may apply for certain accounts with a value of less than $2,000. This fee is not included in the table below. If it was, the estimate of expenses you paid during the period would be higher, and your ending account value lower, by this amount. In addition, the Fund, as a shareholder in the underlying Fidelity Central Funds, will indirectly bear its pro-rata share of the fees and expenses incurred by the underlying Fidelity Central Funds. These fees and expenses are not included in the Fund's annualized expense ratio used to calculate the expense estimate in the table below.
Hypothetical Example for Comparison Purposes
The second line of the accompanying table for each class of the Fund provides information about hypothetical account values and hypothetical expenses based on a Class' actual expense ratio and an assumed rate of return of 5% per year before expenses, which is not the Class' actual return. The hypothetical account values and expenses may not be used to estimate the actual ending account balance or expenses you paid for the period. You may use this information to compare the ongoing costs of investing in the Fund and other funds. To do so, compare this 5% hypothetical example with the 5% hypothetical examples that appear in the shareholder reports of the other funds. A small balance maintenance fee of $12.00 that is charged once a year may apply for certain accounts with a value of less than $2,000. This fee is not included in the table below. If it was, the estimate of expenses you paid during the period would be higher, and your ending account value lower, by this amount. In addition, the Fund, as a shareholder in the underlying Fidelity Central Funds, will indirectly bear its pro-rata share of the fees and expenses incurred by the underlying Fidelity Central Funds. These fees and expenses are not included in the Fund's annualized expense ratio used to calculate the expense estimate in the table below.
Please note that the expenses shown in the table are meant to highlight your ongoing costs only and do not reflect any transaction costs. Therefore, the second line of the table is useful in comparing ongoing costs only, and will not help you determine the relative total costs of owning different funds.
| | Annualized Expense Ratio-A | Beginning
Account Value
January 1, 2018 | Ending
Account Value
June 30, 2018 | Expenses Paid
During Period-B
January 1, 2018
to June 30, 2018 |
| Growth Discovery | .76% | | | |
| Actual | | $1,000.00 | $1,098.00 | $3.95 |
| Hypothetical-C | | $1,000.00 | $1,021.03 | $3.81 |
| Class K | .65% | | | |
| Actual | | $1,000.00 | $1,098.60 | $3.38 |
| Hypothetical-C | | $1,000.00 | $1,021.57 | $3.26 |
A Annualized expense ratio reflects expenses net of applicable fee waivers.
B Expenses are equal to each Class' annualized expense ratio, multiplied by the average account value over the period, multiplied by 181/365 (to reflect the one-half year period).
C 5% return per year before expenses
Distributions (Unaudited)
The Board of Trustees of Fidelity Growth Discovery Fund voted to pay to shareholders of record at the opening of business on record date, the following distributions per share derived from capital gains realized from sales of portfolio securities, and dividends derived from net investment income:
| | Pay Date | Record Date | Dividends | Capital Gains |
| Fidelity Growth Discovery Fund | | | | |
| Growth Discovery | 08/13/18 | 08/10/18 | $0.029 | $1.057 |
| Class K | 08/13/18 | 08/10/18 | $0.045 | $1.057 |
The fund hereby designates as a capital gain dividend with respect to the taxable year ended June 30, 2018, $106,289,730, or, if subsequently determined to be different, the net capital gain of such year.
Growth Discovery and Class K designate 100% of the dividends distributed during the fiscal year as qualifying for the dividends–received deduction for corporate shareholders.
Growth Discovery and Class K designate 100% of the dividend distributed during the fiscal year as amounts which may be taken into account as a dividend for purposes of the maximum rate under section 1(h)(11) of the Internal Revenue Code.
The fund will notify shareholders in January 2019 of amounts for use in preparing 2018 income tax returns.
Corporate Headquarters
245 Summer St.
Boston, MA 02210
www.fidelity.com
CII-ANN-0818
1.705796.120
Fidelity® Growth Discovery Fund Class K
Annual Report June 30, 2018 |
|
Contents
To view a fund's proxy voting guidelines and proxy voting record for the 12-month period ended June 30, visit http://www.fidelity.com/proxyvotingresults or visit the Securities and Exchange Commission's (SEC) web site at http://www.sec.gov.
You may also call 1-800-835-5092 to request a free copy of the proxy voting guidelines.
Standard & Poor's, S&P and S&P 500 are registered service marks of The McGraw-Hill Companies, Inc. and have been licensed for use by Fidelity Distributors Corporation.
Other third-party marks appearing herein are the property of their respective owners.
All other marks appearing herein are registered or unregistered trademarks or service marks of FMR LLC or an affiliated company. © 2018 FMR LLC. All rights reserved.
This report and the financial statements contained herein are submitted for the general information of the shareholders of the Fund. This report is not authorized for distribution to prospective investors in the Fund unless preceded or accompanied by an effective prospectus.
A fund files its complete schedule of portfolio holdings with the SEC for the first and third quarters of each fiscal year on Form N-Q. Forms N-Q are available on the SEC’s web site at http://www.sec.gov. A fund's Forms N-Q may be reviewed and copied at the SEC’s Public Reference Room in Washington, DC. Information regarding the operation of the SEC's Public Reference Room may be obtained by calling 1-800-SEC-0330.
For a complete list of a fund's portfolio holdings, view the most recent holdings listing, semiannual report, or annual report on Fidelity's web site at http://www.fidelity.com, http://www.institutional.fidelity.com, or http://www.401k.com, as applicable.
NOT FDIC INSURED •MAY LOSE VALUE •NO BANK GUARANTEE
Neither the Fund nor Fidelity Distributors Corporation is a bank.
Performance: The Bottom Line
Average annual total return reflects the change in the value of an investment, assuming reinvestment of distributions from dividend income and capital gains (the profits earned upon the sale of securities that have grown in value, if any) and assuming a constant rate of performance each year. The hypothetical investment and the average annual total returns do not reflect the deduction of taxes that a shareholder would pay on fund distributions or the redemption of fund shares. During periods of reimbursement by Fidelity, a fund’s total return will be greater than it would be had the reimbursement not occurred. How a fund did yesterday is no guarantee of how it will do tomorrow.
Average Annual Total Returns
| For the periods ended June 30, 2018 | Past 1 year | Past 5 years | Past 10 years |
| Class K | 23.05% | 16.86% | 10.43% |
$10,000 Over 10 Years
Let's say hypothetically that $10,000 was invested in Fidelity® Growth Discovery Fund - Class K on June 30, 2008.
The chart shows how the value of your investment would have changed, and also shows how the Russell 3000® Growth Index performed over the same period.
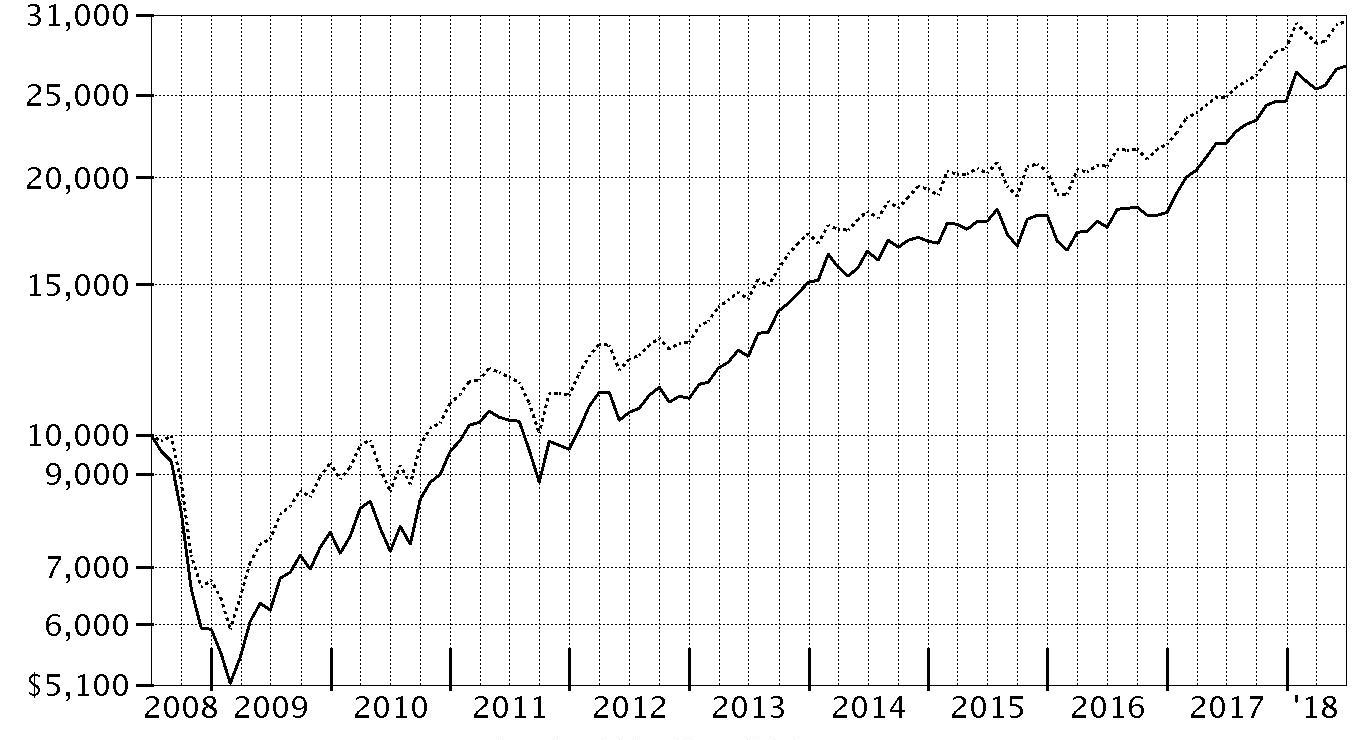
| Period Ending Values |
| $26,970 | Fidelity® Growth Discovery Fund - Class K |
| $30,455 | Russell 3000® Growth Index |
Management's Discussion of Fund Performance
Market Recap: The U.S. equity bellwether S&P 500
® index gained 14.37% for the 12 months ending June 30, 2018, despite a resurgence in volatility that challenged the multiyear bull market. The steady growth seen throughout 2017 extended into the new year, as investors remained upbeat on hopes of continued strong economic and earnings growth. Stocks surged 5.73% in January alone. February was a decidedly different story, though, as volatility spiked amid fear that rising inflation and the potential for the economy to overheat would prompt the U.S. Federal Reserve to pick up the pace of interest rate hikes. The index returned -3.69% for the month, its first negative result since October 2016, and lost further ground in March on fear of a global trade war. The market stabilized in April and went on to achieve a solid gain for May. The uptrend continued through roughly mid-June, when escalating trade tension between the U.S. and China soured investor sentiment, and the index ended the 12 months with a two-week slump. By sector, information technology (+31%) led the way, rising on strong earnings growth from several major index constituents. Consumer discretionary (+24%) also stood out, largely driven by retailers (+50%). Energy gained 21% alongside higher oil prices. Notable laggards included some defensive groups – consumer staples (-4%), telecommunication services (+1%) and utilities (+3%) – that struggled amid rising interest rates and a general preference for risk.
Comments from Lead Portfolio Manager Jason Weiner: For the year, the fund's share classes gained about 23%, slightly outpacing the 22.47% advance of the Russell 3000
® Growth index. Versus the benchmark, security selection was the primary driver of the fund's outperformance this period, with sector allocation also contributing. In particular, stock selection and an overweighting in information technology's software & services industry helped the most, followed by choices in consumer discretionary and positioning in industrials. In terms of individual stocks, an overweighting in software firm Adobe Systems (+72%), one of the fund's largest holdings, was the biggest contributor this period. Another major contributor was mobile payments firm Square (+163%), which benefited from its acceptance and the popularity of Bitcoin cryptocurrency. On the negative side, stock picks in real estate held back the fund's relative result. A non-index stake in Realogy Holdings – a real estate brokerage company operating under brands such as Coldwell Banker and Sotheby's – was the fund's biggest individual detractor. The stock returned -29% on macro headwinds and weak financial results. The fund's 3% stake in cash, on average, amid a rising equity market also hurt the fund's performance versus the benchmark.
The views expressed above reflect those of the portfolio manager(s) only through the end of the period as stated on the cover of this report and do not necessarily represent the views of Fidelity or any other person in the Fidelity organization. Any such views are subject to change at any time based upon market or other conditions and Fidelity disclaims any responsibility to update such views. These views may not be relied on as investment advice and, because investment decisions for a Fidelity fund are based on numerous factors, may not be relied on as an indication of trading intent on behalf of any Fidelity fund.
Note to Shareholders: On July 1, 2017, Asher Anolic assumed co-manager responsibilities for the fund and served as interim Portfolio Manager while Jason Weiner was on a leave of absence from January 1, 2018, through June 2018.
Investment Summary (Unaudited)
Top Ten Stocks as of June 30, 2018
| | % of fund's net assets |
| Alphabet, Inc. Class A | 6.5 |
| Microsoft Corp. | 6.1 |
| Amazon.com, Inc. | 5.9 |
| Home Depot, Inc. | 3.1 |
| Visa, Inc. Class A | 2.8 |
| Charles Schwab Corp. | 2.7 |
| Adobe Systems, Inc. | 2.7 |
| Apple, Inc. | 2.7 |
| Facebook, Inc. Class A | 2.5 |
| Cheniere Energy, Inc. | 1.9 |
| | 36.9 |
Top Five Market Sectors as of June 30, 2018
| | % of fund's net assets |
| Information Technology | 42.8 |
| Consumer Discretionary | 13.4 |
| Financials | 10.5 |
| Health Care | 10.3 |
| Industrials | 7.2 |
Asset Allocation (% of fund's net assets)
| As of June 30, 2018* |
| | Stocks | 97.6% |
| | Convertible Securities | 0.5% |
| | Short-Term Investments and Net Other Assets (Liabilities) | 1.9% |

* Foreign investments - 10.7%
Schedule of Investments June 30, 2018
Showing Percentage of Net Assets
| Common Stocks - 97.5% | | | |
| | | Shares | Value (000s) |
| CONSUMER DISCRETIONARY - 13.4% | | | |
| Diversified Consumer Services - 0.7% | | | |
| Grand Canyon Education, Inc. (a) | | 110,300 | $12,311 |
| Hotels, Restaurants & Leisure - 0.7% | | | |
| Hilton Worldwide Holdings, Inc. | | 113,612 | 8,994 |
| Wingstop, Inc. | | 82,300 | 4,289 |
| | | | 13,283 |
| Household Durables - 0.8% | | | |
| Panasonic Corp. | | 1,070,500 | 14,435 |
| Internet & Direct Marketing Retail - 6.5% | | | |
| Amazon.com, Inc. (a) | | 66,200 | 112,527 |
| The Booking Holdings, Inc. (a) | | 6,000 | 12,163 |
| | | | 124,690 |
| Media - 0.9% | | | |
| Charter Communications, Inc. Class A (a) | | 57,200 | 16,772 |
| China Literature Ltd. (a)(b) | | 286 | 3 |
| | | | 16,775 |
| Specialty Retail - 3.1% | | | |
| Home Depot, Inc. | | 306,024 | 59,705 |
| Textiles, Apparel & Luxury Goods - 0.7% | | | |
| Kering SA | | 2,500 | 1,412 |
| LVMH Moet Hennessy - Louis Vuitton SA | | 37,780 | 12,544 |
| Puma AG | | 208 | 122 |
| | | | 14,078 |
|
| TOTAL CONSUMER DISCRETIONARY | | | 255,277 |
|
| CONSUMER STAPLES - 4.1% | | | |
| Beverages - 1.1% | | | |
| Constellation Brands, Inc. Class A (sub. vtg.) | | 39,100 | 8,558 |
| Fever-Tree Drinks PLC | | 78,960 | 3,533 |
| Kweichow Moutai Co. Ltd. (A Shares) | | 48,729 | 5,383 |
| Pernod Ricard SA ADR | | 133,100 | 4,352 |
| | | | 21,826 |
| Food & Staples Retailing - 0.1% | | | |
| Bj's Wholesale Club Holdings, Inc. | | 84,200 | 1,991 |
| Food Products - 0.3% | | | |
| McCormick & Co., Inc. (non-vtg.) | | 38,000 | 4,411 |
| The Simply Good Foods Co. | | 146,800 | 2,120 |
| | | | 6,531 |
| Household Products - 0.6% | | | |
| Energizer Holdings, Inc. | | 167,600 | 10,552 |
| Personal Products - 1.5% | | | |
| Coty, Inc. Class A | | 321,300 | 4,530 |
| Estee Lauder Companies, Inc. Class A | | 81,900 | 11,686 |
| Unilever NV (NY Reg.) | | 231,400 | 12,894 |
| | | | 29,110 |
| Tobacco - 0.5% | | | |
| British American Tobacco PLC sponsored ADR | | 179,600 | 9,061 |
|
| TOTAL CONSUMER STAPLES | | | 79,071 |
|
| ENERGY - 2.9% | | | |
| Energy Equipment & Services - 0.5% | | | |
| Baker Hughes, a GE Co. Class A | | 221,000 | 7,300 |
| Computer Modelling Group Ltd. | | 298,200 | 2,291 |
| | | | 9,591 |
| Oil, Gas & Consumable Fuels - 2.4% | | | |
| Cheniere Energy, Inc. (a) | | 549,600 | 35,828 |
| Reliance Industries Ltd. | | 697,453 | 9,907 |
| | | | 45,735 |
|
| TOTAL ENERGY | | | 55,326 |
|
| FINANCIALS - 10.4% | | | |
| Banks - 4.4% | | | |
| Bank of America Corp. | | 649,700 | 18,315 |
| First Republic Bank | | 147,000 | 14,228 |
| HDFC Bank Ltd. | | 36,455 | 1,124 |
| HDFC Bank Ltd. sponsored ADR | | 33,700 | 3,539 |
| Huntington Bancshares, Inc. | | 688,000 | 10,155 |
| JPMorgan Chase & Co. | | 301,500 | 31,416 |
| M&T Bank Corp. | | 28,600 | 4,866 |
| Metro Bank PLC (a) | | 25,300 | 1,080 |
| | | | 84,723 |
| Capital Markets - 6.0% | | | |
| Cboe Global Markets, Inc. | | 15,848 | 1,649 |
| Charles Schwab Corp. | | 1,023,500 | 52,301 |
| CME Group, Inc. | | 185,445 | 30,398 |
| Goldman Sachs Group, Inc. | | 31,200 | 6,882 |
| JMP Group, Inc. | | 75,200 | 404 |
| MSCI, Inc. | | 78,800 | 13,036 |
| The Blackstone Group LP | | 276,600 | 8,898 |
| | | | 113,568 |
|
| TOTAL FINANCIALS | | | 198,291 |
|
| HEALTH CARE - 10.2% | | | |
| Biotechnology - 3.2% | | | |
| Amgen, Inc. | | 68,900 | 12,718 |
| Biogen, Inc. (a) | | 62,000 | 17,995 |
| Calyxt, Inc. | | 95,488 | 1,783 |
| Cytokinetics, Inc. (a) | | 90,471 | 751 |
| Insmed, Inc. (a) | | 343,378 | 8,121 |
| Prothena Corp. PLC (a) | | 68,000 | 991 |
| TESARO, Inc. (a) | | 59,500 | 2,646 |
| Vertex Pharmaceuticals, Inc. (a) | | 94,693 | 16,094 |
| | | | 61,099 |
| Health Care Equipment & Supplies - 4.9% | | | |
| Becton, Dickinson & Co. | | 126,000 | 30,185 |
| Boston Scientific Corp. (a) | | 459,700 | 15,032 |
| Danaher Corp. | | 122,755 | 12,113 |
| Intuitive Surgical, Inc. (a) | | 63,800 | 30,527 |
| ResMed, Inc. | | 54,000 | 5,593 |
| | | | 93,450 |
| Health Care Providers & Services - 0.4% | | | |
| National Vision Holdings, Inc. | | 5,600 | 205 |
| Neuronetics, Inc. | | 4,200 | 112 |
| OptiNose, Inc. | | 7,100 | 199 |
| UnitedHealth Group, Inc. | | 26,600 | 6,526 |
| | | | 7,042 |
| Health Care Technology - 0.2% | | | |
| Veeva Systems, Inc. Class A (a) | | 56,600 | 4,350 |
| Life Sciences Tools & Services - 0.2% | | | |
| Codexis, Inc. (a) | | 81,800 | 1,178 |
| Sartorius Stedim Biotech | | 27,000 | 2,822 |
| | | | 4,000 |
| Pharmaceuticals - 1.3% | | | |
| AstraZeneca PLC sponsored ADR | | 347,600 | 12,204 |
| Mallinckrodt PLC (a) | | 173,600 | 3,239 |
| Mylan NV (a) | | 232,000 | 8,384 |
| | | | 23,827 |
|
| TOTAL HEALTH CARE | | | 193,768 |
|
| INDUSTRIALS - 7.2% | | | |
| Aerospace & Defense - 0.4% | | | |
| TransDigm Group, Inc. | | 19,727 | 6,809 |
| Commercial Services & Supplies - 0.8% | | | |
| Copart, Inc. (a) | | 229,700 | 12,992 |
| Prosegur Compania de Seguridad SA (Reg.) | | 252,163 | 1,648 |
| | | | 14,640 |
| Electrical Equipment - 2.0% | | | |
| AMETEK, Inc. | | 198,400 | 14,317 |
| Fortive Corp. | | 228,327 | 17,606 |
| Nidec Corp. | | 43,000 | 6,457 |
| | | | 38,380 |
| Industrial Conglomerates - 0.7% | | | |
| 3M Co. | | 25,700 | 5,056 |
| Roper Technologies, Inc. | | 28,914 | 7,978 |
| | | | 13,034 |
| Machinery - 1.8% | | | |
| Allison Transmission Holdings, Inc. | | 449,600 | 18,204 |
| Apergy Corp. (a) | | 39,800 | 1,662 |
| Gardner Denver Holdings, Inc. (a) | | 481,300 | 14,145 |
| Rational AG | | 2,000 | 1,306 |
| | | | 35,317 |
| Professional Services - 1.5% | | | |
| IHS Markit Ltd. (a) | | 173,700 | 8,961 |
| Robert Half International, Inc. | | 108,400 | 7,057 |
| TransUnion Holding Co., Inc. | | 178,100 | 12,759 |
| | | | 28,777 |
|
| TOTAL INDUSTRIALS | | | 136,957 |
|
| INFORMATION TECHNOLOGY - 42.4% | | | |
| Electronic Equipment & Components - 0.3% | | | |
| Cognex Corp. | | 111,300 | 4,965 |
| Keyence Corp. | | 2,400 | 1,356 |
| | | | 6,321 |
| Internet Software & Services - 14.2% | | | |
| Alibaba Group Holding Ltd. sponsored ADR (a) | | 97,300 | 18,052 |
| Alphabet, Inc. Class A (a) | | 109,552 | 123,709 |
| DocuSign, Inc. (c) | | 5,200 | 275 |
| Dropbox, Inc. Class A (a)(c) | | 8,800 | 285 |
| Facebook, Inc. Class A (a) | | 242,391 | 47,101 |
| GoDaddy, Inc. (a) | | 186,000 | 13,132 |
| MercadoLibre, Inc. | | 15,700 | 4,693 |
| NetEase, Inc. ADR | | 15,000 | 3,790 |
| Shopify, Inc. Class A (a) | | 44,500 | 6,489 |
| Stamps.com, Inc. (a) | | 89,571 | 22,666 |
| Tencent Holdings Ltd. | | 337,800 | 16,963 |
| VeriSign, Inc. (a) | | 96,100 | 13,206 |
| Wix.com Ltd. (a) | | 900 | 90 |
| | | | 270,451 |
| IT Services - 8.0% | | | |
| Adyen BV (a)(b) | | 4,037 | 2,224 |
| Cognizant Technology Solutions Corp. Class A | | 247,730 | 19,568 |
| Fidelity National Information Services, Inc. | | 127,700 | 13,540 |
| Global Payments, Inc. | | 108,100 | 12,052 |
| MasterCard, Inc. Class A | | 69,500 | 13,658 |
| PayPal Holdings, Inc. (a) | | 334,200 | 27,829 |
| Square, Inc. (a) | | 177,500 | 10,941 |
| Visa, Inc. Class A | | 395,496 | 52,383 |
| | | | 152,195 |
| Semiconductors & Semiconductor Equipment - 2.2% | | | |
| ASML Holding NV | | 43,300 | 8,572 |
| Broadcom, Inc. | | 14,700 | 3,567 |
| Cree, Inc. (a) | | 66,200 | 2,752 |
| Maxim Integrated Products, Inc. | | 153,705 | 9,016 |
| Monolithic Power Systems, Inc. | | 36,818 | 4,921 |
| Qualcomm, Inc. | | 228,800 | 12,840 |
| | | | 41,668 |
| Software - 15.0% | | | |
| Activision Blizzard, Inc. | | 173,887 | 13,271 |
| Adobe Systems, Inc. (a) | | 211,700 | 51,615 |
| Autodesk, Inc. (a) | | 83,600 | 10,959 |
| Avalara, Inc. | | 2,575 | 137 |
| Black Knight, Inc. (a) | | 189,700 | 10,158 |
| Electronic Arts, Inc. (a) | | 108,434 | 15,291 |
| Intuit, Inc. | | 115,400 | 23,577 |
| Microsoft Corp. | | 1,179,400 | 116,301 |
| Pluralsight, Inc. | | 38,900 | 951 |
| Red Hat, Inc. (a) | | 74,000 | 9,943 |
| Salesforce.com, Inc. (a) | | 229,864 | 31,353 |
| Splunk, Inc. (a) | | 22,800 | 2,260 |
| Zscaler, Inc. (a)(c) | | 3,700 | 132 |
| | | | 285,948 |
| Technology Hardware, Storage & Peripherals - 2.7% | | | |
| Apple, Inc. | | 275,600 | 51,016 |
|
| TOTAL INFORMATION TECHNOLOGY | | | 807,599 |
|
| MATERIALS - 4.5% | | | |
| Chemicals - 3.5% | | | |
| CF Industries Holdings, Inc. | | 254,800 | 11,313 |
| DowDuPont, Inc. | | 370,600 | 24,430 |
| Sherwin-Williams Co. | | 25,100 | 10,230 |
| The Chemours Co. LLC | | 205,000 | 9,094 |
| Umicore SA | | 200,591 | 11,513 |
| | | | 66,580 |
| Construction Materials - 1.0% | | | |
| Eagle Materials, Inc. | | 147,300 | 15,462 |
| Summit Materials, Inc. | | 155,854 | 4,091 |
| | | | 19,553 |
|
| TOTAL MATERIALS | | | 86,133 |
|
| REAL ESTATE - 2.4% | | | |
| Equity Real Estate Investment Trusts (REITs) - 1.9% | | | |
| American Tower Corp. | | 195,600 | 28,200 |
| Equinix, Inc. | | 10,200 | 4,385 |
| SBA Communications Corp. Class A (a) | | 29,500 | 4,871 |
| | | | 37,456 |
| Real Estate Management & Development - 0.5% | | | |
| Realogy Holdings Corp. (c) | | 395,181 | 9,010 |
|
| TOTAL REAL ESTATE | | | 46,466 |
|
| TOTAL COMMON STOCKS | | | |
| (Cost $1,309,509) | | | 1,858,888 |
|
| Preferred Stocks - 0.6% | | | |
| Convertible Preferred Stocks - 0.5% | | | |
| CONSUMER DISCRETIONARY - 0.0% | | | |
| Household Durables - 0.0% | | | |
| Blu Homes, Inc. Series A, 5.00% (a)(d)(e) | | 239,736 | 5 |
| HEALTH CARE - 0.1% | | | |
| Biotechnology - 0.1% | | | |
| BioNTech AG Series A (d)(e) | | 7,174 | 1,529 |
| INFORMATION TECHNOLOGY - 0.4% | | | |
| Internet Software & Services - 0.3% | | | |
| Uber Technologies, Inc. Series D, 8.00% (a)(d)(e) | | 162,572 | 6,503 |
| IT Services - 0.1% | | | |
| AppNexus, Inc. Series E (a)(d)(e) | | 48,212 | 999 |
| TOTAL INFORMATION TECHNOLOGY | | | 7,502 |
|
| TOTAL CONVERTIBLE PREFERRED STOCKS | | | 9,036 |
|
| Nonconvertible Preferred Stocks - 0.1% | | | |
| FINANCIALS - 0.1% | | | |
| Banks - 0.1% | | | |
| Itau Unibanco Holding SA sponsored ADR | | 269,900 | 2,802 |
| TOTAL PREFERRED STOCKS | | | |
| (Cost $9,856) | | | 11,838 |
|
| Money Market Funds - 2.1% | | | |
| Fidelity Cash Central Fund, 1.93% (f) | | 38,186,179 | 38,194 |
| Fidelity Securities Lending Cash Central Fund 1.92% (f)(g) | | 1,674,366 | 1,675 |
| TOTAL MONEY MARKET FUNDS | | | |
| (Cost $39,869) | | | 39,869 |
| TOTAL INVESTMENT IN SECURITIES - 100.2% | | | |
| (Cost $1,359,234) | | | 1,910,595 |
| NET OTHER ASSETS (LIABILITIES) - (0.2)% | | | (4,007) |
| NET ASSETS - 100% | | | $1,906,588 |
Legend
(a) Non-income producing
(b) Security exempt from registration under Rule 144A of the Securities Act of 1933. These securities may be resold in transactions exempt from registration, normally to qualified institutional buyers. At the end of the period, the value of these securities amounted to $2,227,000 or 0.1% of net assets.
(c) Security or a portion of the security is on loan at period end.
(d) Restricted securities - Investment in securities not registered under the Securities Act of 1933 (excluding 144A issues). At the end of the period, the value of restricted securities (excluding 144A issues) amounted to $9,036,000 or 0.5% of net assets.
(e) Level 3 security
(f) Affiliated fund that is generally available only to investment companies and other accounts managed by Fidelity Investments. The rate quoted is the annualized seven-day yield of the fund at period end. A complete unaudited listing of the fund's holdings as of its most recent quarter end is available upon request. In addition, each Fidelity Central Fund's financial statements, which are not covered by the Fund's Report of Independent Registered Public Accounting Firm, are available on the SEC's website or upon request.
(g) Investment made with cash collateral received from securities on loan.
Additional information on each restricted holding is as follows:
| Security | Acquisition Date | Acquisition Cost (000s) |
| AppNexus, Inc. Series E | 8/1/14 | $966 |
| BioNTech AG Series A | 12/29/17 | $1,571 |
| Blu Homes, Inc. Series A, 5.00% | 6/21/13�� | $1,108 |
| Uber Technologies, Inc. Series D, 8.00% | 6/6/14 | $2,522 |
Affiliated Central Funds
Information regarding fiscal year to date income earned by the Fund from investments in Fidelity Central Funds is as follows:
| Fund | Income earned |
| | (Amounts in thousands) |
| Fidelity Cash Central Fund | $658 |
| Fidelity Securities Lending Cash Central Fund | 363 |
| Total | $1,021 |
Amounts in the income column in the above table include any capital gain distributions from underlying funds, which are presented in the corresponding line-item in the Statement of Operations if applicable.
Investment Valuation
The following is a summary of the inputs used, as of June 30, 2018, involving the Fund's assets and liabilities carried at fair value. The inputs or methodology used for valuing securities may not be an indication of the risk associated with investing in those securities. For more information on valuation inputs, and their aggregation into the levels used below, please refer to the Investment Valuation section in the accompanying Notes to Financial Statements.
| | Valuation Inputs at Reporting Date: |
| Description | Total | Level 1 | Level 2 | Level 3 |
| (Amounts in thousands) | | | | |
| Investments in Securities: | | | | |
| Equities: | | | | |
| Consumer Discretionary | $255,282 | $228,298 | $26,979 | $5 |
| Consumer Staples | 79,071 | 79,071 | -- | -- |
| Energy | 55,326 | 55,326 | -- | -- |
| Financials | 201,093 | 199,969 | 1,124 | -- |
| Health Care | 195,297 | 193,768 | -- | 1,529 |
| Industrials | 136,957 | 136,957 | -- | -- |
| Information Technology | 815,101 | 790,636 | 16,963 | 7,502 |
| Materials | 86,133 | 86,133 | -- | -- |
| Real Estate | 46,466 | 46,466 | -- | -- |
| Money Market Funds | 39,869 | 39,869 | -- | -- |
| Total Investments in Securities: | $1,910,595 | $1,856,493 | $45,066 | $9,036 |
Other Information
Distribution of investments by country or territory of incorporation, as a percentage of Total Net Assets, is as follows (Unaudited):
| United States of America | 89.3% |
| Cayman Islands | 2.1% |
| Netherlands | 1.6% |
| United Kingdom | 1.5% |
| Japan | 1.2% |
| France | 1.0% |
| Others (Individually Less Than 1%) | 3.3% |
| | 100.0% |
See accompanying notes which are an integral part of the financial statements.
Financial Statements
Statement of Assets and Liabilities
| Amounts in thousands (except per-share amounts) | | June 30, 2018 |
| Assets | | |
Investment in securities, at value (including securities loaned of $1,618) — See accompanying schedule:
Unaffiliated issuers (cost $1,319,365) | $1,870,726 | |
| Fidelity Central Funds (cost $39,869) | 39,869 | |
| Total Investment in Securities (cost $1,359,234) | | $1,910,595 |
| Receivable for investments sold | | 1,224 |
| Receivable for fund shares sold | | 1,867 |
| Dividends receivable | | 519 |
| Distributions receivable from Fidelity Central Funds | | 51 |
| Other receivables | | 83 |
| Total assets | | 1,914,339 |
| Liabilities | | |
| Payable for investments purchased | $1,747 | |
| Payable for fund shares redeemed | 2,647 | |
| Accrued management fee | 879 | |
| Other affiliated payables | 252 | |
| Other payables and accrued expenses | 555 | |
| Collateral on securities loaned | 1,671 | |
| Total liabilities | | 7,751 |
| Net Assets | | $1,906,588 |
| Net Assets consist of: | | |
| Paid in capital | | $1,300,936 |
| Undistributed net investment income | | 1,599 |
| Accumulated undistributed net realized gain (loss) on investments and foreign currency transactions | | 53,195 |
| Net unrealized appreciation (depreciation) on investments and assets and liabilities in foreign currencies | | 550,858 |
| Net Assets | | $1,906,588 |
| Growth Discovery: | | |
| Net Asset Value, offering price and redemption price per share ($1,545,893 ÷ 43,244 shares) | | $35.75 |
| Class K: | | |
| Net Asset Value, offering price and redemption price per share ($360,695 ÷ 10,080 shares) | | $35.78 |
See accompanying notes which are an integral part of the financial statements.
Statement of Operations
| Amounts in thousands | | Year ended June 30, 2018 |
| Investment Income | | |
| Dividends | | $15,159 |
| Income from Fidelity Central Funds | | 1,021 |
| Total income | | 16,180 |
| Expenses | | |
| Management fee | | |
| Basic fee | $9,234 | |
| Performance adjustment | 13 | |
| Transfer agent fees | 2,235 | |
| Accounting and security lending fees | 531 | |
| Custodian fees and expenses | 64 | |
| Independent trustees' fees and expenses | 7 | |
| Registration fees | 112 | |
| Audit | 59 | |
| Legal | 6 | |
| Interest | 1 | |
| Miscellaneous | 11 | |
| Total expenses before reductions | 12,273 | |
| Expense reductions | (139) | |
| Total expenses after reductions | | 12,134 |
| Net investment income (loss) | | 4,046 |
| Realized and Unrealized Gain (Loss) | | |
| Net realized gain (loss) on: | | |
| Investment securities: | | |
| Unaffiliated issuers | 104,190 | |
| Fidelity Central Funds | (1) | |
| Foreign currency transactions | (62) | |
| Total net realized gain (loss) | | 104,127 |
| Change in net unrealized appreciation (depreciation) on: | | |
| Investment securities: | | |
| Unaffiliated issuers (net of increase in deferred foreign taxes of $490) | 231,795 | |
| Fidelity Central Funds | 3 | |
| Assets and liabilities in foreign currencies | (2) | |
| Total change in net unrealized appreciation (depreciation) | | 231,796 |
| Net gain (loss) | | 335,923 |
| Net increase (decrease) in net assets resulting from operations | | $339,969 |
See accompanying notes which are an integral part of the financial statements.
Statement of Changes in Net Assets
| Amounts in thousands | Year ended June 30, 2018 | Year ended June 30, 2017 |
| Increase (Decrease) in Net Assets | | |
| Operations | | |
| Net investment income (loss) | $4,046 | $3,097 |
| Net realized gain (loss) | 104,127 | 192,029 |
| Change in net unrealized appreciation (depreciation) | 231,796 | 78,061 |
| Net increase (decrease) in net assets resulting from operations | 339,969 | 273,187 |
| Distributions to shareholders from net investment income | (2,802) | (1,135) |
| Distributions to shareholders from net realized gain | (76,753) | – |
| Total distributions | (79,555) | (1,135) |
| Share transactions - net increase (decrease) | 282,282 | (83,878) |
| Total increase (decrease) in net assets | 542,696 | 188,174 |
| Net Assets | | |
| Beginning of period | 1,363,892 | 1,175,718 |
| End of period | $1,906,588 | $1,363,892 |
| Other Information | | |
| Undistributed net investment income end of period | $1,599 | $1,292 |
See accompanying notes which are an integral part of the financial statements.
Financial Highlights
Fidelity Growth Discovery Fund
| Years ended June 30, | 2018 | 2017 | 2016 | 2015 | 2014 |
| Selected Per–Share Data | | | | | |
| Net asset value, beginning of period | $30.58 | $24.47 | $24.93 | $23.07 | $17.45 |
| Income from Investment Operations | | | | | |
| Net investment income (loss)A | .07 | .06 | .01 | .07 | .02 |
| Net realized and unrealized gain (loss) | 6.71 | 6.07 | (.43) | 1.81 | 5.63 |
| Total from investment operations | 6.78 | 6.13 | (.42) | 1.88 | 5.65 |
| Distributions from net investment income | (.05) | (.02) | (.03) | (.02) | (.02) |
| Distributions from net realized gain | (1.56) | – | (.01) | – | (.01) |
| Total distributions | (1.61) | (.02) | (.04) | (.02) | (.03) |
| Net asset value, end of period | $35.75 | $30.58 | $24.47 | $24.93 | $23.07 |
| Total ReturnB | 22.94% | 25.08% | (1.68)% | 8.17% | 32.40% |
| Ratios to Average Net AssetsC,D | | | | | |
| Expenses before reductions | .74% | .66% | .78% | .77% | .81% |
| Expenses net of fee waivers, if any | .74% | .66% | .78% | .77% | .81% |
| Expenses net of all reductions | .73% | .65% | .78% | .77% | .81% |
| Net investment income (loss) | .22% | .24% | .03% | .27% | .10% |
| Supplemental Data | | | | | |
| Net assets, end of period (in millions) | $1,546 | $1,157 | $1,000 | $1,078 | $1,072 |
| Portfolio turnover rateE | 45% | 65% | 57% | 51% | 70% |
A Calculated based on average shares outstanding during the period.
B Total returns would have been lower if certain expenses had not been reduced during the applicable periods shown.
C Fees and expenses of any underlying Fidelity Central Funds are not included in the Fund's expense ratio. The Fund indirectly bears its proportionate share of the expenses of any underlying Fidelity Central Funds.
D Expense ratios reflect operating expenses of the class. Expenses before reductions do not reflect amounts reimbursed by the investment adviser or reductions from brokerage service arrangements or reductions from other expense offset arrangements and do not represent the amount paid by the class during periods when reimbursements or reductions occur. Expenses net of fee waivers reflect expenses after reimbursement by the investment adviser but prior to reductions from brokerage service arrangements or other expense offset arrangements. Expenses net of all reductions represent the net expenses paid by the class.
E Amount does not include the portfolio activity of any underlying Fidelity Central Funds.
See accompanying notes which are an integral part of the financial statements.
Fidelity Growth Discovery Fund Class K
| Years ended June 30, | 2018 | 2017 | 2016 | 2015 | 2014 |
| Selected Per–Share Data | | | | | |
| Net asset value, beginning of period | $30.61 | $24.48 | $24.94 | $23.09 | $17.45 |
| Income from Investment Operations | | | | | |
| Net investment income (loss)A | .11 | .10 | .04 | .10 | .05 |
| Net realized and unrealized gain (loss) | 6.71 | 6.07 | (.43) | 1.82 | 5.63 |
| Total from investment operations | 6.82 | 6.17 | (.39) | 1.92 | 5.68 |
| Distributions from net investment income | (.09) | (.04) | (.06) | (.07) | (.04) |
| Distributions from net realized gain | (1.56) | – | (.01) | – | (.01) |
| Total distributions | (1.65) | (.04) | (.07) | (.07) | (.04)B |
| Net asset value, end of period | $35.78 | $30.61 | $24.48 | $24.94 | $23.09 |
| Total ReturnC | 23.05% | 25.23% | (1.57)% | 8.32% | 32.62% |
| Ratios to Average Net AssetsD,E | | | | | |
| Expenses before reductions | .63% | .54% | .66% | .64% | .68% |
| Expenses net of fee waivers, if any | .63% | .54% | .66% | .64% | .68% |
| Expenses net of all reductions | .63% | .53% | .65% | .64% | .67% |
| Net investment income (loss) | .32% | .36% | .16% | .40% | .24% |
| Supplemental Data | | | | | |
| Net assets, end of period (in millions) | $361 | $207 | $176 | $202 | $190 |
| Portfolio turnover rateF | 45% | 65% | 57% | 51% | 70% |
A Calculated based on average shares outstanding during the period.
B Total distributions of $.04 per share is comprised of distributions from net investment income of $.036 and distributions from net realized gain of $.006 per share.
C Total returns would have been lower if certain expenses had not been reduced during the applicable periods shown.
D Fees and expenses of any underlying Fidelity Central Funds are not included in the Fund's expense ratio. The Fund indirectly bears its proportionate share of the expenses of any underlying Fidelity Central Funds.
E Expense ratios reflect operating expenses of the class. Expenses before reductions do not reflect amounts reimbursed by the investment adviser or reductions from brokerage service arrangements or reductions from other expense offset arrangements and do not represent the amount paid by the class during periods when reimbursements or reductions occur. Expenses net of fee waivers reflect expenses after reimbursement by the investment adviser but prior to reductions from brokerage service arrangements or other expense offset arrangements. Expenses net of all reductions represent the net expenses paid by the class.
F Amount does not include the portfolio activity of any underlying Fidelity Central Funds.
See accompanying notes which are an integral part of the financial statements.
Notes to Financial Statements
For the period ended June 30, 2018
(Amounts in thousands except percentages)
1. Organization.
Fidelity Growth Discovery Fund (the Fund) is a fund of Fidelity Hastings Street Trust (the Trust) and is authorized to issue an unlimited number of shares. The Trust is registered under the Investment Company Act of 1940, as amended (the 1940 Act), as an open-end management investment company organized as a Massachusetts business trust. The Fund offers Growth Discovery and Class K shares, each of which has equal rights as to assets and voting privileges. Each class has exclusive voting rights with respect to matters that affect that class.
2. Investments in Fidelity Central Funds.
The Fund invests in Fidelity Central Funds, which are open-end investment companies generally available only to other investment companies and accounts managed by the investment adviser and its affiliates. The Fund's Schedule of Investments lists each of the Fidelity Central Funds held as of period end, if any, as an investment of the Fund, but does not include the underlying holdings of each Fidelity Central Fund. As an Investing Fund, the Fund indirectly bears its proportionate share of the expenses of the underlying Fidelity Central Funds.
The Money Market Central Funds seek preservation of capital and current income and are managed by Fidelity Investments Money Management, Inc. (FIMM), an affiliate of the investment adviser. Annualized expenses of the Money Market Central Funds as of their most recent shareholder report date are less than .005%.
A complete unaudited list of holdings for each Fidelity Central Fund is available upon request or at the Securities and Exchange Commission (the SEC) website at www.sec.gov. In addition, the financial statements of the Fidelity Central Funds, which are not covered by the Fund's Report of Independent Registered Public Accounting Firm, are available on the SEC website or upon request.
3. Significant Accounting Policies.
The Fund is an investment company and applies the accounting and reporting guidance of the Financial Accounting Standards Board (FASB) Accounting Standards Codification Topic 946 Financial Services – Investments Companies. The financial statements have been prepared in conformity with accounting principles generally accepted in the United States of America (GAAP), which require management to make certain estimates and assumptions at the date of the financial statements. Actual results could differ from those estimates. Subsequent events, if any, through the date that the financial statements were issued have been evaluated in the preparation of the financial statements. The following summarizes the significant accounting policies of the Fund:
Investment Valuation. Investments are valued as of 4:00 p.m. Eastern time on the last calendar day of the period. The Board of Trustees (the Board) has delegated the day to day responsibility for the valuation of the Fund's investments to the Fair Value Committee (the Committee) established by the Fund's investment adviser. In accordance with valuation policies and procedures approved by the Board, the Fund attempts to obtain prices from one or more third party pricing vendors or brokers to value its investments. When current market prices, quotations or currency exchange rates are not readily available or reliable, investments will be fair valued in good faith by the Committee, in accordance with procedures adopted by the Board. Factors used in determining fair value vary by investment type and may include market or investment specific events. The frequency with which these procedures are used cannot be predicted and they may be utilized to a significant extent. The Committee oversees the Fund's valuation policies and procedures and reports to the Board on the Committee's activities and fair value determinations. The Board monitors the appropriateness of the procedures used in valuing the Fund's investments and ratifies the fair value determinations of the Committee.
The Fund categorizes the inputs to valuation techniques used to value its investments into a disclosure hierarchy consisting of three levels as shown below:
- Level 1 – quoted prices in active markets for identical investments
- Level 2 – other significant observable inputs (including quoted prices for similar investments, interest rates, prepayment speeds, etc.)
- Level 3 – unobservable inputs (including the Fund's own assumptions based on the best information available)
Valuation techniques used to value the Fund's investments by major category are as follows:
Equity securities, including restricted securities, for which market quotations are readily available, are valued at the last reported sale price or official closing price as reported by a third party pricing vendor on the primary market or exchange on which they are traded and are categorized as Level 1 in the hierarchy. In the event there were no sales during the day or closing prices are not available, securities are valued at the last quoted bid price or may be valued using the last available price and are generally categorized as Level 2 in the hierarchy. For foreign equity securities, when market or security specific events arise, comparisons to the valuation of American Depositary Receipts (ADRs), futures contracts, Exchange-Traded Funds (ETFs) and certain indexes as well as quoted prices for similar securities may be used and would be categorized as Level 2 in the hierarchy. Utilizing these techniques may result in transfers between Level 1 and Level 2. For equity securities, including restricted securities, where observable inputs are limited, assumptions about market activity and risk are used and these securities may be categorized as Level 3 in the hierarchy.
Investments in open-end mutual funds, including the Fidelity Central Funds, are valued at their closing net asset value (NAV) each business day and are categorized as Level 1 in the hierarchy.
Changes in valuation techniques may result in transfers in or out of an assigned level within the disclosure hierarchy. The aggregate value of investments by input level as of June 30, 2018 is included at the end of the Fund's Schedule of Investments.
Foreign Currency. The Fund may use foreign currency contracts to facilitate transactions in foreign-denominated securities. Gains and losses from these transactions may arise from changes in the value of the foreign currency or if the counterparties do not perform under the contracts' terms.
Foreign-denominated assets, including investment securities, and liabilities are translated into U.S. dollars at the exchange rates at period end. Purchases and sales of investment securities, income and dividends received and expenses denominated in foreign currencies are translated into U.S. dollars at the exchange rate in effect on the transaction date.
The effects of exchange rate fluctuations on investments are included with the net realized and unrealized gain (loss) on investment securities. Other foreign currency transactions resulting in realized and unrealized gain (loss) are disclosed separately.
Investment Transactions and Income. For financial reporting purposes, the Fund's investment holdings and NAV include trades executed through the end of the last business day of the period. The NAV per share for processing shareholder transactions is calculated as of the close of business of the New York Stock Exchange (NYSE), normally 4:00 p.m. Eastern time and includes trades executed through the end of the prior business day. Gains and losses on securities sold are determined on the basis of identified cost and include proceeds received from litigation. Dividend income is recorded on the ex-dividend date, except for certain dividends from foreign securities where the ex-dividend date may have passed, which are recorded as soon as the Fund is informed of the ex-dividend date. Non-cash dividends included in dividend income, if any, are recorded at the fair market value of the securities received. Income and capital gain distributions from Fidelity Central Funds, if any, are recorded on the ex-dividend date. Certain distributions received by the Fund represent a return of capital or capital gain. The Fund determines the components of these distributions subsequent to the ex-dividend date, based upon receipt of tax filings or other correspondence relating to the underlying investment. These distributions are recorded as a reduction of cost of investments and/or as a realized gain. Investment income is recorded net of foreign taxes withheld where recovery of such taxes is uncertain.
Class Allocations and Expenses. Investment income, realized and unrealized capital gains and losses, common expenses of the Fund, and certain fund-level expense reductions, if any, are allocated daily on a pro-rata basis to each class based on the relative net assets of each class to the total net assets of the Fund. Each class differs with respect to transfer agent fees incurred. Certain expense reductions may also differ by class. For the reporting period, the allocated portion of income and expenses to each class as a percent of its average net assets may vary due to the timing of recording these transactions in relation to fluctuating net assets of the classes. Expenses directly attributable to a fund are charged to that fund. Expenses attributable to more than one fund are allocated among the respective funds on the basis of relative net assets or other appropriate methods. Expense estimates are accrued in the period to which they relate and adjustments are made when actual amounts are known.
Income Tax Information and Distributions to Shareholders. Each year, the Fund intends to qualify as a regulated investment company under Subchapter M of the Internal Revenue Code, including distributing substantially all of its taxable income and realized gains. As a result, no provision for U.S. Federal income taxes is required. As of June 30, 2018, the Fund did not have any unrecognized tax benefits in the financial statements; nor is the Fund aware of any tax positions for which it is reasonably possible that the total amounts of unrecognized tax benefits will significantly change in the next twelve months. The Fund files a U.S. federal tax return, in addition to state and local tax returns as required. The Fund's federal income tax returns are subject to examination by the Internal Revenue Service (IRS) for a period of three fiscal years after they are filed. State and local tax returns may be subject to examination for an additional fiscal year depending on the jurisdiction. Foreign taxes are provided for based on the Fund's understanding of the tax rules and rates that exist in the foreign markets in which it invests. The Fund is subject to a tax imposed on capital gains by certain countries in which it invests. An estimated deferred tax liability for net unrealized appreciation on the applicable securities is included in Other payables and accrued expenses on the Statement of Assets & Liabilities.
Distributions are declared and recorded on the ex-dividend date. Income and capital gain distributions are declared separately for each class. Income and capital gain distributions are determined in accordance with income tax regulations, which may differ from GAAP. In addition, the Fund claimed a portion of the payment made to redeeming shareholders as a distribution for income tax purposes.
Capital accounts within the financial statements are adjusted for permanent book-tax differences. These adjustments have no impact on net assets or the results of operations. Capital accounts are not adjusted for temporary book-tax differences which will reverse in a subsequent period.
Book-tax differences are primarily due to foreign currency transactions, passive foreign investment companies (PFIC), partnerships, and losses deferred due to wash sales and excise tax regulations.
As of period end, the cost and unrealized appreciation (depreciation) in securities, and derivatives if applicable, for federal income tax purposes were as follows:
| Gross unrealized appreciation | $581,353 |
| Gross unrealized depreciation | (30,186) |
| Net unrealized appreciation (depreciation) | $551,167 |
| Tax Cost | $1,359,428 |
The tax-based components of distributable earnings as of period end were as follows:
| Undistributed ordinary income | $1,599 |
| Undistributed long-term capital gain | $55,395 |
| Net unrealized appreciation (depreciation) on securities and other investments | $551,154 |
The Fund intends to elect to defer to its next fiscal year $2,006 of capital losses recognized during the period November 1, 2017 to June 30, 2018.
The tax character of distributions paid was as follows:
| | June 30, 2018 | June 30, 2017 |
| Ordinary Income | $3,368 | $ 1,135 |
| Long-term Capital Gains | 76,187 | – |
| Total | $79,555 | $ 1,135 |
Restricted Securities. The Fund may invest in securities that are subject to legal or contractual restrictions on resale. These securities generally may be resold in transactions exempt from registration or to the public if the securities are registered. Disposal of these securities may involve time-consuming negotiations and expense, and prompt sale at an acceptable price may be difficult. Information regarding restricted securities is included at the end of the Fund's Schedule of Investments.
4. Purchases and Sales of Investments.
Purchases and sales of securities, other than short-term securities, aggregated $956,627 and $742,860, respectively.
5. Fees and Other Transactions with Affiliates.
Management Fee. Fidelity Management & Research Company (the investment adviser) and its affiliates provide the Fund with investment management related services for which the Fund pays a monthly management fee. The management fee is the sum of an individual fund fee rate that is based on an annual rate of .30% of the Fund's average net assets and an annualized group fee rate that averaged .24% during the period. The group fee rate is based upon the average net assets of all the mutual funds advised by the investment adviser, including any mutual funds previously advised by the investment adviser that are currently advised by Fidelity SelectCo, LLC, an affiliate of the investment adviser. The group fee rate decreases as assets under management increase and increases as assets under management decrease. In addition, the management fee is subject to a performance adjustment (up to a maximum of +/- .20% of the Fund's average net assets over a 36 month performance period). The upward or downward adjustment to the management fee is based on the relative investment performance of Growth Discovery as compared to its benchmark index, the Russell 3000 Growth Index, over the same 36 month performance period. For the reporting period, the total annual management fee rate, including the performance adjustment, was .54% of the Fund's average net assets. The performance adjustment included in the management fee rate may be higher or lower than the maximum performance adjustment rate due to the difference between the average net assets for the reporting and performance periods.
Transfer Agent Fees. Fidelity Investments Institutional Operations Company, Inc., (FIIOC), an affiliate of the investment adviser, is the transfer, dividend disbursing and shareholder servicing agent for each class of the Fund. FIIOC receives account fees and asset-based fees that vary according to the account size and type of account of the shareholders of Growth Discovery, except for Class K. FIIOC receives an asset-based fee of Class K's average net assets. FIIOC pays for typesetting, printing and mailing of shareholder reports, except proxy statements.
For the period, transfer agent fees for each class were as follows:
| | Amount | % of Class-Level Average Net Assets |
| Growth Discovery | $2,080 | .15 |
| Class K | 155 | .05 |
| | $2,235 | |
Accounting and Security Lending Fees. Fidelity Service Company, Inc. (FSC), an affiliate of the investment adviser, maintains the Fund's accounting records. The accounting fee is based on the level of average net assets for each month. Under a separate contract, FSC administers the security lending program. The security lending fee is based on the number and duration of lending transactions. For the period, the fees were equivalent to an annual rate of .03%.
Brokerage Commissions. The Fund placed a portion of its portfolio transactions with brokerage firms which are affiliates of the investment adviser. Brokerage commissions are included in net realized gain (loss) and change in net unrealized appreciation (depreciation) in the Statement of Operations. The commissions paid to these affiliated firms were $20 for the period.
Interfund Lending Program. Pursuant to an Exemptive Order issued by the SEC, the Fund, along with other registered investment companies having management contracts with Fidelity Management & Research Company (FMR) or other affiliated entities of FMR, may participate in an interfund lending program. This program provides an alternative credit facility allowing the funds to borrow from, or lend money to, other participating affiliated funds. At period end, there were no interfund loans outstanding. The Fund's activity in this program during the period for which loans were outstanding was as follows:
| Borrower or Lender | Average Loan Balance | Weighted Average Interest Rate | Interest Expense |
| Borrower | $29,579 | 1.78% | $1 |
Interfund Trades. The Fund may purchase from or sell securities to other Fidelity Funds under procedures adopted by the Board. The procedures have been designed to ensure these interfund trades are executed in accordance with Rule 17a-7 of the 1940 Act. Interfund trades are included within the respective purchases and sales amounts shown in the Purchases and Sales of Investments note.
6. Committed Line of Credit.
The Fund participates with other funds managed by the investment adviser or an affiliate in a $4.25 billion credit facility (the "line of credit") to be utilized for temporary or emergency purposes to fund shareholder redemptions or for other short-term liquidity purposes. The Fund has agreed to pay commitment fees on its pro-rata portion of the line of credit, which amounted to $5 and is reflected in Miscellaneous expenses on the Statement of Operations. During the period, the Fund did not borrow on this line of credit.
7. Security Lending.
The Fund lends portfolio securities through a lending agent from time to time in order to earn additional income. For equity securities, a lending agent is used and may loan securities to certain qualified borrowers, including Fidelity Capital Markets (FCM), a broker-dealer affiliated with the Fund. On the settlement date of the loan, the Fund receives collateral (in the form of U.S. Treasury obligations, letters of credit and/or cash) against the loaned securities and maintains collateral in an amount not less than 100% of the market value of the loaned securities during the period of the loan. The market value of the loaned securities is determined at the close of business of the Fund and any additional required collateral is delivered to the Fund on the next business day. The Fund or borrower may terminate the loan at any time, and if the borrower defaults on its obligation to return the securities loaned because of insolvency or other reasons, the Fund may apply collateral received from the borrower against the obligation. The Fund may experience delays and costs in recovering the securities loaned. Any cash collateral received is invested in the Fidelity Securities Lending Cash Central Fund. The value of loaned securities and cash collateral at period end are disclosed on the Fund's Statement of Assets and Liabilities. At period end, there were no security loans outstanding with FCM. Security lending income represents the income earned on investing cash collateral, less rebates paid to borrowers and any lending agent fees associated with the loan, plus any premium payments received for lending certain types of securities. Security lending income is presented in the Statement of Operations as a component of income from Fidelity Central Funds. Total security lending income during the period amounted to $363, including $2 from securities loaned to FCM.
8. Expense Reductions.
Commissions paid to certain brokers with whom the investment adviser, or its affiliates, places trades on behalf of the Fund include an amount in addition to trade execution, which may be rebated back to the Fund to offset certain expenses. This amount totaled $124 for the period. In addition, through arrangements with the Fund's custodian, credits realized as a result of certain uninvested cash balances were used to reduce the Fund's expenses. During the period, these credits reduced the Fund's custody expenses by $1.
In addition, during the period the investment adviser reimbursed and/or waived a portion of fund-level operating expenses in the amount of $14.
9. Distributions to Shareholders.
Distributions to shareholders of each class were as follows:
| | Year ended
June 30, 2018 | Year ended
June 30, 2017 |
| From net investment income | | |
| Growth Discovery | $1,948 | $880 |
| Class K | 854 | 255 |
| Total | $2,802 | $1,135 |
| From net realized gain | | |
| Growth Discovery | $61,060 | $– |
| Class K | 15,693 | – |
| Total | $76,753 | $– |
10. Share Transactions.
Share transactions for each class were as follows and may contain automatic conversions between classes or exchanges between affiliated funds:
| | Shares | Shares | Dollars | Dollars |
| | Year ended June 30, 2018 | Year ended June 30, 2017 | Year ended June 30, 2018 | Year ended June 30, 2017 |
| Growth Discovery | | | | |
| Shares sold | 10,801 | 4,332 | $362,769 | $121,287 |
| Reinvestment of distributions | 1,871 | 32 | 59,167 | 821 |
| Shares redeemed | (7,251) | (7,392) | (242,656) | (196,671) |
| Net increase (decrease) | 5,421 | (3,028) | $179,280 | $(74,563) |
| Class K | | | | |
| Shares sold | 6,932 | 1,584 | $227,726 | $44,201 |
| Reinvestment of distributions | 521 | 10 | 16,547 | 255 |
| Shares redeemed | (4,139) | (2,017) | (141,271) | (53,771) |
| Net increase (decrease) | 3,314 | (423) | $103,002 | $(9,315) |
11. Other.
The Fund's organizational documents provide former and current trustees and officers with a limited indemnification against liabilities arising in connection with the performance of their duties to the Fund. In the normal course of business, the Fund may also enter into contracts that provide general indemnifications. The Fund's maximum exposure under these arrangements is unknown as this would be dependent on future claims that may be made against the Fund. The risk of material loss from such claims is considered remote.
Report of Independent Registered Public Accounting Firm
To the Board of Trustees of Fidelity Hastings Street Trust and Shareholders of Fidelity Growth Discovery Fund:
Opinion on the Financial Statements
We have audited the accompanying statement of assets and liabilities, including the schedule of investments, of Fidelity Growth Discovery Fund (one of the funds constituting Fidelity Hastings Street Trust, referred to hereafter as the "Fund") as of June 30, 2018, the related statement of operations for the year ended June 30, 2018, the statement of changes in net assets for each of the two years in the period ended June 30, 2018, including the related notes, and the financial highlights for each of the five years in the period ended June 30, 2018 (collectively referred to as the “financial statements”). In our opinion, the financial statements present fairly, in all material respects, the financial position of the Fund as of June 30, 2018, the results of its operations for the year then ended, the changes in its net assets for each of the two years in the period ended June 30, 2018 and the financial highlights for each of the five years in the period ended June 30, 2018 in conformity with accounting principles generally accepted in the United States of America.
Basis for Opinion
These financial statements are the responsibility of the Fund’s management. Our responsibility is to express an opinion on the Fund’s financial statements based on our audits. We are a public accounting firm registered with the Public Company Accounting Oversight Board (United States) (“PCAOB”) and are required to be independent with respect to the Fund in accordance with the U.S. federal securities laws and the applicable rules and regulations of the Securities and Exchange Commission and the PCAOB.
We conducted our audits of these financial statements in accordance with the standards of the PCAOB. Those standards require that we plan and perform the audit to obtain reasonable assurance about whether the financial statements are free of material misstatement, whether due to error or fraud.
Our audits included performing procedures to assess the risks of material misstatement of the financial statements, whether due to error or fraud, and performing procedures that respond to those risks. Such procedures included examining, on a test basis, evidence regarding the amounts and disclosures in the financial statements. Our audits also included evaluating the accounting principles used and significant estimates made by management, as well as evaluating the overall presentation of the financial statements. Our procedures included confirmation of securities owned as of June 30, 2018 by correspondence with the custodian, and brokers; when replies were not received from brokers, we performed other auditing procedures. We believe that our audits provide a reasonable basis for our opinion.
PricewaterhouseCoopers LLP
Boston, Massachusetts
August 13, 2018
We have served as the auditor of one or more investment companies in the Fidelity group of funds since 1932.
Trustees and Officers
The Trustees, Members of the Advisory Board (if any), and officers of the trust and fund, as applicable, are listed below. The Board of Trustees governs the fund and is responsible for protecting the interests of shareholders. The Trustees are experienced executives who meet periodically throughout the year to oversee the fund's activities, review contractual arrangements with companies that provide services to the fund, oversee management of the risks associated with such activities and contractual arrangements, and review the fund's performance. Except for Michael E. Wiley, each of the Trustees oversees 284 funds. Mr. Wiley oversees 197 funds.
The Trustees hold office without limit in time except that (a) any Trustee may resign; (b) any Trustee may be removed by written instrument, signed by at least two-thirds of the number of Trustees prior to such removal; (c) any Trustee who requests to be retired or who has become incapacitated by illness or injury may be retired by written instrument signed by a majority of the other Trustees; and (d) any Trustee may be removed at any special meeting of shareholders by a two-thirds vote of the outstanding voting securities of the trust. Each Trustee who is not an interested person (as defined in the 1940 Act) of the trust and the fund is referred to herein as an Independent Trustee. Each Independent Trustee shall retire not later than the last day of the calendar year in which his or her 75th birthday occurs. The Independent Trustees may waive this mandatory retirement age policy with respect to individual Trustees. Officers and Advisory Board Members hold office without limit in time, except that any officer or Advisory Board Member may resign or may be removed by a vote of a majority of the Trustees at any regular meeting or any special meeting of the Trustees. Except as indicated, each individual has held the office shown or other offices in the same company for the past five years.
The fund’s Statement of Additional Information (SAI) includes more information about the Trustees. To request a free copy, call Fidelity at 1-800-835-5092.
Experience, Skills, Attributes, and Qualifications of the Trustees. The Governance and Nominating Committee has adopted a statement of policy that describes the experience, qualifications, attributes, and skills that are necessary and desirable for potential Independent Trustee candidates (Statement of Policy). The Board believes that each Trustee satisfied at the time he or she was initially elected or appointed a Trustee, and continues to satisfy, the standards contemplated by the Statement of Policy. The Governance and Nominating Committee also engages professional search firms to help identify potential Independent Trustee candidates who have the experience, qualifications, attributes, and skills consistent with the Statement of Policy. From time to time, additional criteria based on the composition and skills of the current Independent Trustees, as well as experience or skills that may be appropriate in light of future changes to board composition, business conditions, and regulatory or other developments, have also been considered by the professional search firms and the Governance and Nominating Committee. In addition, the Board takes into account the Trustees' commitment and participation in Board and committee meetings, as well as their leadership of standing and ad hoc committees throughout their tenure.
In determining that a particular Trustee was and continues to be qualified to serve as a Trustee, the Board has considered a variety of criteria, none of which, in isolation, was controlling. The Board believes that, collectively, the Trustees have balanced and diverse experience, qualifications, attributes, and skills, which allow the Board to operate effectively in governing the fund and protecting the interests of shareholders. Information about the specific experience, skills, attributes, and qualifications of each Trustee, which in each case led to the Board's conclusion that the Trustee should serve (or continue to serve) as a trustee of the fund, is provided below.
Board Structure and Oversight Function. James C. Curvey is an interested person and currently serves as Chairman. The Trustees have determined that an interested Chairman is appropriate and benefits shareholders because an interested Chairman has a personal and professional stake in the quality and continuity of services provided to the fund. Independent Trustees exercise their informed business judgment to appoint an individual of their choosing to serve as Chairman, regardless of whether the Trustee happens to be independent or a member of management. The Independent Trustees have determined that they can act independently and effectively without having an Independent Trustee serve as Chairman and that a key structural component for assuring that they are in a position to do so is for the Independent Trustees to constitute a substantial majority for the Board. The Independent Trustees also regularly meet in executive session. Ned C. Lautenbach serves as Chairman of the Independent Trustees and as such (i) acts as a liaison between the Independent Trustees and management with respect to matters important to the Independent Trustees and (ii) with management prepares agendas for Board meetings.
Fidelity® funds are overseen by different Boards of Trustees. The fund's Board oversees Fidelity's high income and certain equity funds, and other Boards oversee Fidelity's investment-grade bond, money market, asset allocation, and other equity funds. The asset allocation funds may invest in Fidelity® funds overseen by the fund's Board. The use of separate Boards, each with its own committee structure, allows the Trustees of each group of Fidelity® funds to focus on the unique issues of the funds they oversee, including common research, investment, and operational issues. On occasion, the separate Boards establish joint committees to address issues of overlapping consequences for the Fidelity® funds overseen by each Board.
The Trustees operate using a system of committees to facilitate the timely and efficient consideration of all matters of importance to the Trustees, the fund, and fund shareholders and to facilitate compliance with legal and regulatory requirements and oversight of the fund's activities and associated risks. The Board, acting through its committees, has charged FMR and its affiliates with (i) identifying events or circumstances the occurrence of which could have demonstrably adverse effects on the fund's business and/or reputation; (ii) implementing processes and controls to lessen the possibility that such events or circumstances occur or to mitigate the effects of such events or circumstances if they do occur; and (iii) creating and maintaining a system designed to evaluate continuously business and market conditions in order to facilitate the identification and implementation processes described in (i) and (ii) above. Because the day-to-day operations and activities of the fund are carried out by or through FMR, its affiliates, and other service providers, the fund's exposure to risks is mitigated but not eliminated by the processes overseen by the Trustees. While each of the Board's committees has responsibility for overseeing different aspects of the fund's activities, oversight is exercised primarily through the Operations, Audit, and Compliance Committees. In addition, the Independent Trustees have worked with Fidelity to enhance the Board's oversight of investment and financial risks, legal and regulatory risks, technology risks, and operational risks, including the development of additional risk reporting to the Board. Appropriate personnel, including but not limited to the fund's Chief Compliance Officer (CCO), FMR's internal auditor, the independent accountants, the fund's Treasurer and portfolio management personnel, make periodic reports to the Board's committees, as appropriate, including an annual review of Fidelity's risk management program for the Fidelity® funds. The responsibilities of each standing committee, including their oversight responsibilities, are described further under "Standing Committees of the Trustees."
Interested Trustees*:
Correspondence intended for a Trustee who is an interested person may be sent to Fidelity Investments, 245 Summer Street, Boston, Massachusetts 02210.
Name, Year of Birth; Principal Occupations and Other Relevant Experience+
James C. Curvey (1935)
Year of Election or Appointment: 2007
Trustee
Chairman of the Board of Trustees
Mr. Curvey also serves as Trustee of other Fidelity® funds. Mr. Curvey is Vice Chairman (2007-present) and Director of FMR LLC (diversified financial services company). In addition, Mr. Curvey is an Overseer Emeritus for the Boston Symphony Orchestra, a Director of Artis-Naples, and a Trustee of Brewster Academy in Wolfeboro, New Hampshire. Previously, Mr. Curvey served as a Director of Fidelity Research & Analysis Co. (investment adviser firm, 2009-2018), Director of Fidelity Investments Money Management, Inc. (investment adviser firm, 2009-2014) and a Director of FMR and FMR Co., Inc. (investment adviser firms, 2007-2014).
Charles S. Morrison (1960)
Year of Election or Appointment: 2014
Trustee
Mr. Morrison also serves as Trustee of other funds. He serves as President of Fidelity SelectCo, LLC (investment adviser firm, 2017-present) and Fidelity Management & Research Company (FMR) (investment adviser firm, 2016-present), a Director of Fidelity Investments Money Management, Inc. (FIMM) (investment adviser firm, 2014-present), Director of Fidelity SelectCo, LLC (investment adviser firm, 2014-present), President, Asset Management (2014-present), and is an employee of Fidelity Investments. Previously, Mr. Morrison served as Vice President of Fidelity's Fixed Income and Asset Allocation Funds (2012-2014), President, Fixed Income (2011-2014), Vice President of Fidelity's Money Market Funds (2005-2009), President, Money Market Group Leader of FMR (investment adviser firm, 2009), and Senior Vice President, Money Market Group of FMR (2004-2009). Mr. Morrison also served as Vice President of Fidelity's Bond Funds (2002-2005), certain Balanced Funds (2002-2005), and certain Asset Allocation Funds (2002-2007), and as Senior Vice President (2002-2005) of Fidelity's Bond Division.
* Determined to be an “Interested Trustee” by virtue of, among other things, his or her affiliation with the trust or various entities under common control with FMR.
+ The information includes the Trustee's principal occupation during the last five years and other information relating to the experience, attributes, and skills relevant to the Trustee's qualifications to serve as a Trustee, which led to the conclusion that the Trustee should serve as a Trustee for the fund.
Independent Trustees:
Correspondence intended for an Independent Trustee may be sent to Fidelity Investments, P.O. Box 55235, Boston, Massachusetts 02205-5235.
Name, Year of Birth; Principal Occupations and Other Relevant Experience+
Dennis J. Dirks (1948)
Year of Election or Appointment: 2005
Trustee
Mr. Dirks also serves as Trustee of other Fidelity® funds. Prior to his retirement in May 2003, Mr. Dirks was Chief Operating Officer and a member of the Board of The Depository Trust & Clearing Corporation (DTCC). He also served as President, Chief Operating Officer, and Board member of The Depository Trust Company (DTC) and President and Board member of the National Securities Clearing Corporation (NSCC). In addition, Mr. Dirks served as Chief Executive Officer and Board member of the Government Securities Clearing Corporation, Chief Executive Officer and Board member of the Mortgage-Backed Securities Clearing Corporation, as a Trustee and a member of the Finance Committee of Manhattan College (2005-2008), as a Trustee and a member of the Finance Committee of AHRC of Nassau County (2006-2008), as a member of the Independent Directors Council (IDC) Governing Council (2010-2015), and as a member of the Board of Directors for The Brookville Center for Children’s Services, Inc. (2009-2017). Mr. Dirks is a member of the Finance Committee (2016-present), Board of Directors (2017-present) and Board of Trustees (2018-present) and is Treasurer (2018-present) of the Asolo Repertory Theatre.
Donald F. Donahue (1950)
Year of Election or Appointment: 2018
Trustee
Mr. Donahue also serves as a Trustee of other Fidelity® funds. Mr. Donahue is President and Chief Executive Officer of Miranda Partners, LLC (risk consulting for the financial services industry, 2012-present). Previously, Mr. Donahue served as a Member of the Advisory Board of certain Fidelity® funds (2015-2018) and Chief Executive Officer (2006-2012), Chief Operating Officer (2003-2006), and Managing Director, Customer Marketing and Development (1999-2003) of The Depository Trust & Clearing Corporation (financial markets infrastructure). Mr. Donahue serves as a Member (2007-present) and Co-Chairman (2016-present) of the Board of Directors of United Way of New York, Member of the Board of Directors of NYC Leadership Academy (2012-present) and Member of the Board of Advisors of Ripple Labs, Inc. (financial services, 2015-present). He also served as Chairman (2010-2012) and Member of the Board of Directors (2012-2013) of Omgeo, LLC (financial services), Treasurer of United Way of New York (2012-2016), and Member of the Board of Directors of XBRL US (financial services non-profit, 2009-2012) and the International Securities Services Association (2009-2012).
Alan J. Lacy (1953)
Year of Election or Appointment: 2008
Trustee
Mr. Lacy also serves as Trustee of other Fidelity® funds. Mr. Lacy serves as a Director of Bristol-Myers Squibb Company (global pharmaceuticals, 2008-present). He is a Trustee of the California Chapter of The Nature Conservancy (2015-present) and a Director of the Center for Advanced Study in the Behavioral Sciences at Stanford University (2015-present). In addition, Mr. Lacy served as Senior Adviser (2007-2014) of Oak Hill Capital Partners, L.P. (private equity) and also served as Chief Executive Officer (2005) and Vice Chairman (2005-2006) of Sears Holdings Corporation (retail) and Chief Executive Officer and Chairman of the Board of Sears, Roebuck and Co. (retail, 2000-2005). Previously, Mr. Lacy served as Chairman (2014-2017) and a member (2010-2017) of the Board of Directors of Dave & Buster’s Entertainment, Inc. (restaurant and entertainment complexes), as Chairman (2008-2011) and a member (2006-2015) of the Board of Trustees of the National Parks Conservation Association, and as a member of the Board of Directors for The Hillman Companies, Inc. (hardware wholesalers, 2010-2014), Earth Fare, Inc. (retail grocery, 2010-2014), and The Western Union Company (global money transfer, 2006-2011).
Ned C. Lautenbach (1944)
Year of Election or Appointment: 2000
Trustee
Chairman of the Independent Trustees
Mr. Lautenbach also serves as Trustee of other Fidelity® funds. Mr. Lautenbach currently serves as Vice Chair of the Board of Governors, State University System of Florida (2013-present) and is a member of the Council on Foreign Relations (1994-present). He is also a member and has most recently served as Chairman of the Board of Directors of Artis-Naples (2012-present). Previously, Mr. Lautenbach served as a member and then Lead Director of the Board of Directors of Eaton Corporation (diversified industrial, 1997-2016). He was also a Partner and Advisory Partner at Clayton, Dubilier & Rice, LLC (private equity investment, 1998-2010), as well as a Director of Sony Corporation (2006-2007). In addition, Mr. Lautenbach also had a 30-year career with IBM (technology company) during which time he served as Senior Vice President and a member of the Corporate Executive Committee (1968-1998).
Joseph Mauriello (1944)
Year of Election or Appointment: 2008
Trustee
Mr. Mauriello also serves as Trustee of other Fidelity® funds. Prior to his retirement in January 2006, Mr. Mauriello served in numerous senior management positions including Deputy Chairman and Chief Operating Officer (2004-2005), and Vice Chairman of Financial Services (2002-2004) of KPMG LLP US (professional services, 1965-2005). Mr. Mauriello currently serves as a member of the Board of Directors of XL Group plc. (global insurance and re-insurance, 2006-present) and the Independent Directors Council (IDC) Governing Council (2015-present). Previously, Mr. Mauriello served as a Director of the Hamilton Funds of the Bank of New York (2006-2007) and of Arcadia Resources Inc. (health care services and products, 2007-2012).
Cornelia M. Small (1944)
Year of Election or Appointment: 2005
Trustee
Ms. Small also serves as Trustee of other Fidelity® funds. Ms. Small is a member of the Board of Directors (2009-present) and Chair of the Investment Committee (2010-present) of the Teagle Foundation. Ms. Small also serves on the Investment Committee of the Berkshire Taconic Community Foundation (2008-present). Previously, Ms. Small served as Chairperson (2002-2008) and a member of the Investment Committee and Chairperson (2008-2012) and a member of the Board of Trustees of Smith College. In addition, Ms. Small served as Chief Investment Officer, Director of Global Equity Investments, and a member of the Board of Directors of Scudder, Stevens & Clark and Scudder Kemper Investments.
Garnett A. Smith (1947)
Year of Election or Appointment: 2018
Trustee
Mr. Smith also serves as Trustee of other Fidelity® funds. Prior to Mr. Smith's retirement, he served as Chairman and Chief Executive Officer of Inbrand Corp. (manufacturer of personal absorbent products, 1990-1997). He also served as President (1986-1990) of Inbrand Corp. Prior to his employment with Inbrand Corp., he was employed by a retail fabric chain and North Carolina National Bank. In addition, Mr. Smith served as a Member of the Advisory Board of certain Fidelity® funds (2012-2013) and as a board member of the Jackson Hole Land Trust (2009-2012).
David M. Thomas (1949)
Year of Election or Appointment: 2008
Trustee
Mr. Thomas also serves as Trustee of other Fidelity® funds. Mr. Thomas serves as Non-Executive Chairman of the Board of Directors of Fortune Brands Home and Security (home and security products, 2011-present), as a member of the Board of Directors (2004-present) and Presiding Director (2013-present) of Interpublic Group of Companies, Inc. (marketing communication), and as a member of the Board of Trustees of the University of Florida (2013-present). Previously, Mr. Thomas served as Executive Chairman (2005-2006) and Chairman and Chief Executive Officer (2000-2005) of IMS Health, Inc. (pharmaceutical and healthcare information solutions), and a Director of Fortune Brands, Inc. (consumer products, 2000-2011).
Michael E. Wiley (1950)
Year of Election or Appointment: 2018
Trustee
Mr. Wiley also serves as Trustee or Member of the Advisory Board of other Fidelity® funds. Mr. Wiley serves as a Director of Andeavor Corporation (independent oil refiner and marketer, 2005-present), a Director of Andeavor Logistics LP (natural resources logistics, 2015-present), and a Director of Bill Barrett Corporation (exploration and production, 2005-present). In addition, Mr. Wiley also serves as a Director of Post Oak Bank (privately-held bank, 2004-present). Previously, Mr. Wiley served as a Trustee of other Fidelity® funds (2008-2013), as a Director of Asia Pacific Exploration Consolidated (international oil and gas exploration and production, 2008-2013), as a member of the Board of Trustees of the University of Tulsa (2000-2006; 2007-2010), as a Senior Energy Advisor of Katzenbach Partners, LLC (consulting, 2006-2007), as an Advisory Director of Riverstone Holdings (private investment), Chairman, President, and CEO of Baker Hughes, Inc. (oilfield services, 2000-2004), and as Director of Spinnaker Exploration Company (exploration and production, 2001-2005).
+ The information includes the Trustee's principal occupation during the last five years and other information relating to the experience, attributes, and skills relevant to the Trustee's qualifications to serve as a Trustee, which led to the conclusion that the Trustee should serve as a Trustee for the fund.
Advisory Board Members and Officers:
Correspondence intended for a Member of the Advisory Board (if any) may be sent to Fidelity Investments, P.O. Box 55235, Boston, Massachusetts 02205-5235. Correspondence intended for an officer or Peter S. Lynch may be sent to Fidelity Investments, 245 Summer Street, Boston, Massachusetts 02210. Officers appear below in alphabetical order.
Name, Year of Birth; Principal Occupation
Peter S. Lynch (1944)
Year of Election or Appointment: 2003
Member of the Advisory Board
Mr. Lynch also serves as Member of the Advisory Board of other Fidelity® funds. Mr. Lynch is Vice Chairman and a Director of FMR (investment adviser firm) and FMR Co., Inc. (investment adviser firm). In addition, Mr. Lynch serves as a Trustee of Boston College and as the Chairman of the Inner-City Scholarship Fund. Previously, Mr. Lynch served on the Special Olympics International Board of Directors (1997-2006).
William S. Stavropoulos (1939)
Year of Election or Appointment: 2018
Member of the Advisory Board
Mr. Stavropoulos also serves as Member of the Advisory Board of other Fidelity® funds. Mr. Stavropoulos serves as President and Founder of the Michigan Baseball Foundation, the Great Lakes Loons (2007-present). Mr. Stavropoulos is Chairman Emeritus of the Board of Directors of The Dow Chemical Company, where he previously served in numerous senior management positions, including President, CEO (1995-2000; 2002-2004), Chairman of the Executive Committee (2000-2006), and as a member of the Board of Directors (1990-2006). Currently, Mr. Stavropoulos is Chairman of the Board of Directors of Univar Inc. (global distributor of commodity and specialty chemicals), a Director of Teradata Corporation (data warehousing and technology solutions), and a member of the Advisory Board for Metalmark Capital LLC (private equity investment, 2005-present). Mr. Stavropoulos is an operating advisor to Clayton, Dubilier & Rice, LLC (private equity investment). In addition, Mr. Stavropoulos is a member of the University of Notre Dame Advisory Council for the College of Science, a Trustee of the Rollin L. Gerstacker Foundation, and a Director of Artis-Naples in Naples, Florida. Previously, Mr. Stavropoulos served as Trustee of certain Fidelity® funds (2001-2018) and as a Director of Chemical Financial Corporation (bank holding company, 1993-2012) and Tyco International, Ltd. (multinational manufacturing and services, 2007-2012).
Carol B. Tomé (1957)
Year of Election or Appointment: 2018
Member of the Advisory Board
Ms. Tomé also serves as Member of the Advisory Board of other Fidelity® funds. Ms. Tomé is Chief Financial Officer (2001-present) and Executive Vice President of Corporate Services (2007-present) of The Home Depot, Inc. (home improvement retailer) and a Director (2003-present) and Chair of the Audit Committee (2004-present) of United Parcel Service, Inc. (package delivery and supply chain management). Previously, Ms. Tomé served as Trustee of certain Fidelity® funds (2017), Senior Vice President of Finance and Accounting/Treasurer (2000-2007) and Vice President and Treasurer (1995-2000) of The Home Depot, Inc. and Chair of the Board (2010-2012), Vice Chair of the Board (2009 and 2013), and a Director (2008-2013) of the Federal Reserve Bank of Atlanta. Ms. Tomé is also a director or trustee of many community and professional organizations.
Elizabeth Paige Baumann (1968)
Year of Election or Appointment: 2017
Anti-Money Laundering (AML) Officer
Ms. Baumann also serves as AML Officer of other funds. She is Chief AML Officer (2012-present) and Senior Vice President (2014-present) of FMR LLC (diversified financial services company) and is an employee of Fidelity Investments. Previously, Ms. Baumann served as AML Officer of the funds (2012-2016), and Vice President (2007-2014) and Deputy Anti-Money Laundering Officer (2007-2012) of FMR LLC.
Marc R. Bryant (1966)
Year of Election or Appointment: 2015
Secretary and Chief Legal Officer (CLO)
Mr. Bryant also serves as Secretary and CLO of other funds. Mr. Bryant serves as CLO, Secretary, and Senior Vice President of Fidelity Management & Research Company (investment adviser firm, 2015-present) and FMR Co., Inc. (investment adviser firm, 2015-present); Secretary of Fidelity SelectCo, LLC (investment adviser firm, 2015-present) and Fidelity Investments Money Management, Inc. (investment adviser firm, 2015-present); and CLO of Fidelity Management & Research (Hong Kong) Limited and FMR Investment Management (UK) Limited (investment adviser firms, 2015-present) and Fidelity Management & Research (Japan) Limited (investment adviser firm, 2016-present). He is Senior Vice President and Deputy General Counsel of FMR LLC (diversified financial services company). Previously, Mr. Bryant served as Secretary and CLO of Fidelity Rutland Square Trust II (2010-2014) and Assistant Secretary of Fidelity's Fixed Income and Asset Allocation Funds (2013-2015). Prior to joining Fidelity Investments, Mr. Bryant served as a Senior Vice President and the Head of Global Retail Legal for AllianceBernstein L.P. (2006-2010), and as the General Counsel for ProFund Advisors LLC (2001-2006).
John J. Burke III (1964)
Year of Election or Appointment: 2018
Chief Financial Officer
Mr. Burke also serves as Chief Financial Officer of other funds. Mr. Burke serves as Head of Investment Operations for Fidelity Fund and Investment Operations (2018-present) and is an employee of Fidelity Investments (1998-present). Previously Mr. Burke served as head of Asset Management Investment Operations (2012-2018).
William C. Coffey (1969)
Year of Election or Appointment: 2009
Assistant Secretary
Mr. Coffey also serves as Assistant Secretary of other funds. He is Senior Vice President and Deputy General Counsel of FMR LLC (diversified financial services company, 2010-present), and is an employee of Fidelity Investments. Previously, Mr. Coffey served as Vice President and Associate General Counsel of FMR LLC (2005-2009).
Timothy M. Cohen (1969)
Year of Election or Appointment: 2018
Vice President
Mr. Cohen also serves as Vice President of other funds. Mr. Cohen serves as Co-Head of Global Equity Research (2016-present), a Director of Fidelity Management & Research (Japan) Limited (investment adviser firm, 2016-present), and is an employee of Fidelity Investments. Previously, Mr. Cohen served as Chief Investment Officer - Equity and a Director of Fidelity Management & Research (U.K.) Inc. (investment adviser firm, 2013-2015) and as a Director of Fidelity Management & Research (Hong Kong) Limited (investment adviser firm, 2017).
Jonathan Davis (1968)
Year of Election or Appointment: 2010
Assistant Treasurer
Mr. Davis also serves as Assistant Treasurer of other funds. Mr. Davis serves as Assistant Treasurer of FMR Capital, Inc. (2017-present) and is an employee of Fidelity Investments. Previously, Mr. Davis served as Vice President and Associate General Counsel of FMR LLC (diversified financial services company, 2003-2010).
Adrien E. Deberghes (1967)
Year of Election or Appointment: 2016
Assistant Treasurer
Mr. Deberghes also serves as an officer of other funds. He serves as Assistant Treasurer of FMR Capital, Inc. (2017-present), Executive Vice President of Fidelity Investments Money Management, Inc. (FIMM) (investment adviser firm, 2016-present), and is an employee of Fidelity Investments (2008-present). Previously, Mr. Deberghes served as President and Treasurer of certain Fidelity® funds (2013-2018). Prior to joining Fidelity Investments, Mr. Deberghes was Senior Vice President of Mutual Fund Administration at State Street Corporation (2007-2008), Senior Director of Mutual Fund Administration at Investors Bank & Trust (2005-2007), and Director of Finance for Dunkin' Brands (2000-2005). Previously, Mr. Deberghes served in other fund officer roles.
Laura M. Del Prato (1964)
Year of Election or Appointment: 2018
Assistant Treasurer
Ms. Del Prato also serves as an officer of other funds. Ms. Del Prato is an employee of Fidelity Investments (2017-present). Prior to joining Fidelity Investments, Ms. Del Prato served as a Managing Director and Treasurer of the JPMorgan Mutual Funds (2014-2017). Prior to JPMorgan, Ms. Del Prato served as a partner at Cohen Fund Audit Services (accounting firm, 2012-2013) and KPMG LLP (accounting firm, 2004-2012).
Colm A. Hogan (1973)
Year of Election or Appointment: 2016
Deputy Treasurer
Mr. Hogan also serves as an officer of other funds. Mr. Hogan serves as Assistant Treasurer of FMR Capital, Inc. (2017-present) and is an employee of Fidelity Investments (2005-present). Previously, Mr. Hogan served as Assistant Treasurer of certain Fidelity® funds (2016-2018).
Pamela R. Holding (1964)
Year of Election or Appointment: 2018
Vice President
Ms. Holding also serves as a Vice President of other funds. Ms. Holding serves as Co-Head of Global Equity Research (2018-present) and is an employee of Fidelity Investments (2013-present).
Chris Maher (1972)
Year of Election or Appointment: 2013
Assistant Treasurer
Mr. Maher serves as Assistant Treasurer of other funds. Mr. Maher is Vice President of Valuation Oversight, serves as Assistant Treasurer of FMR Capital, Inc. (2017-present), and is an employee of Fidelity Investments. Previously, Mr. Maher served as Vice President of Asset Management Compliance (2013), Vice President of the Program Management Group of FMR (investment adviser firm, 2010-2013), and Vice President of Valuation Oversight (2008-2010).
Rieco E. Mello (1969)
Year of Election or Appointment: 2017
Assistant Treasurer
Mr. Mello also serves as Assistant Treasurer of other funds. Mr. Mello serves as Assistant Treasurer of FMR Capital, Inc. (2017-present) and is an employee of Fidelity Investments (1995-present).
Kenneth B. Robins (1969)
Year of Election or Appointment: 2016
Chief Compliance Officer
Mr. Robins also serves as an officer of other funds. Mr. Robins serves as Compliance Officer of Fidelity Management & Research Company and FMR Co., Inc. (investment adviser firms, 2016-present) and is an employee of Fidelity Investments (2004-present). Previously, Mr. Robins served as Executive Vice President of Fidelity Investments Money Management, Inc. (investment adviser firm, 2013-2016) and served in other fund officer roles.
Stacie M. Smith (1974)
Year of Election or Appointment: 2016
President and Treasurer
Ms. Smith also serves as an officer of other funds. Ms. Smith serves as Assistant Treasurer of FMR Capital, Inc. (2017-present), is an employee of Fidelity Investments (2009-present), and has served in other fund officer roles. Prior to joining Fidelity Investments, Ms. Smith served as Senior Audit Manager of Ernst & Young LLP (accounting firm, 1996-2009). Previously, Ms. Smith served as Assistant Treasurer (2013-2018) and Deputy Treasurer (2013-2016) of certain Fidelity® funds.
Marc L. Spector (1972)
Year of Election or Appointment: 2016
Assistant Treasurer
Mr. Spector also serves as an officer of other funds. Mr. Spector serves as Assistant Treasurer of FMR Capital, Inc. (2017-present) and is an employee of Fidelity Investments (2016-present). Prior to joining Fidelity Investments, Mr. Spector served as Director at the Siegfried Group (accounting firm, 2013-2016), and prior to Siegfried Group as audit senior manager at Deloitte & Touche (accounting firm, 2005-2013).
Renee Stagnone (1975)
Year of Election or Appointment: 2016
Assistant Treasurer
Ms. Stagnone also serves as an officer of other funds. Ms. Stagnone serves as Assistant Treasurer of FMR Capital, Inc. (2017-present) and is an employee of Fidelity Investments (1997-present). Previously, Ms. Stagnone served as Deputy Treasurer of certain Fidelity® funds (2013-2016).
Shareholder Expense Example
As a shareholder of the Fund, you incur two types of costs: (1) transaction costs and (2) ongoing costs, including management fees and other Fund expenses. This Example is intended to help you understand your ongoing costs (in dollars) of investing in the Fund and to compare these costs with the ongoing costs of investing in other mutual funds.
The Example is based on an investment of $1,000 invested at the beginning of the period and held for the entire period (January 1, 2018 to June 30, 2018).
Actual Expenses
The first line of the accompanying table for each class of the Fund provides information about actual account values and actual expenses. You may use the information in this line, together with the amount you invested, to estimate the expenses that you paid over the period. Simply divide your account value by $1,000.00 (for example, an $8,600 account value divided by $1,000.00 = 8.6), then multiply the result by the number in the first line for a class of the Fund under the heading entitled "Expenses Paid During Period" to estimate the expenses you paid on your account during this period. A small balance maintenance fee of $12.00 that is charged once a year may apply for certain accounts with a value of less than $2,000. This fee is not included in the table below. If it was, the estimate of expenses you paid during the period would be higher, and your ending account value lower, by this amount. In addition, the Fund, as a shareholder in the underlying Fidelity Central Funds, will indirectly bear its pro-rata share of the fees and expenses incurred by the underlying Fidelity Central Funds. These fees and expenses are not included in the Fund's annualized expense ratio used to calculate the expense estimate in the table below.
Hypothetical Example for Comparison Purposes
The second line of the accompanying table for each class of the Fund provides information about hypothetical account values and hypothetical expenses based on a Class' actual expense ratio and an assumed rate of return of 5% per year before expenses, which is not the Class' actual return. The hypothetical account values and expenses may not be used to estimate the actual ending account balance or expenses you paid for the period. You may use this information to compare the ongoing costs of investing in the Fund and other funds. To do so, compare this 5% hypothetical example with the 5% hypothetical examples that appear in the shareholder reports of the other funds. A small balance maintenance fee of $12.00 that is charged once a year may apply for certain accounts with a value of less than $2,000. This fee is not included in the table below. If it was, the estimate of expenses you paid during the period would be higher, and your ending account value lower, by this amount. In addition, the Fund, as a shareholder in the underlying Fidelity Central Funds, will indirectly bear its pro-rata share of the fees and expenses incurred by the underlying Fidelity Central Funds. These fees and expenses are not included in the Fund's annualized expense ratio used to calculate the expense estimate in the table below.
Please note that the expenses shown in the table are meant to highlight your ongoing costs only and do not reflect any transaction costs. Therefore, the second line of the table is useful in comparing ongoing costs only, and will not help you determine the relative total costs of owning different funds.
| | Annualized Expense Ratio-A | Beginning
Account Value
January 1, 2018 | Ending
Account Value
June 30, 2018 | Expenses Paid
During Period-B
January 1, 2018
to June 30, 2018 |
| Growth Discovery | .76% | | | |
| Actual | | $1,000.00 | $1,098.00 | $3.95 |
| Hypothetical-C | | $1,000.00 | $1,021.03 | $3.81 |
| Class K | .65% | | | |
| Actual | | $1,000.00 | $1,098.60 | $3.38 |
| Hypothetical-C | | $1,000.00 | $1,021.57 | $3.26 |
A Annualized expense ratio reflects expenses net of applicable fee waivers.
B Expenses are equal to each Class' annualized expense ratio, multiplied by the average account value over the period, multiplied by 181/365 (to reflect the one-half year period).
C 5% return per year before expenses
Distributions (Unaudited)
The Board of Trustees of Fidelity Growth Discovery Fund voted to pay to shareholders of record at the opening of business on record date, the following distributions per share derived from capital gains realized from sales of portfolio securities, and dividends derived from net investment income:
| | Pay Date | Record Date | Dividends | Capital Gains |
| Fidelity Growth Discovery Fund | | | | |
| Growth Discovery | 08/13/18 | 08/10/18 | $0.029 | $1.057 |
| Class K | 08/13/18 | 08/10/18 | $0.045 | $1.057 |
The fund hereby designates as a capital gain dividend with respect to the taxable year ended June 30, 2018, $106,289,730, or, if subsequently determined to be different, the net capital gain of such year.
Growth Discovery and Class K designate 100% of the dividends distributed during the fiscal year as qualifying for the dividends–received deduction for corporate shareholders.
Growth Discovery and Class K designate 100% of the dividend distributed during the fiscal year as amounts which may be taken into account as a dividend for purposes of the maximum rate under section 1(h)(11) of the Internal Revenue Code.
The fund will notify shareholders in January 2019 of amounts for use in preparing 2018 income tax returns.
Corporate Headquarters
245 Summer St.
Boston, MA 02210
www.fidelity.com
CII-K-ANN-0818
1.863271.109
Fidelity Advisor® Mega Cap Stock Fund - Class A, Class M, Class C, Class I and Class Z
Annual Report June 30, 2018 Class A, Class M, Class C, Class I and Class Z are classes of Fidelity® Mega Cap Stock Fund |
|
Contents
To view a fund's proxy voting guidelines and proxy voting record for the 12-month period ended June 30, visit http://www.fidelity.com/proxyvotingresults or visit the Securities and Exchange Commission's (SEC) web site at http://www.sec.gov.
You may also call 1-877-208-0098 to request a free copy of the proxy voting guidelines.
Standard & Poor's, S&P and S&P 500 are registered service marks of The McGraw-Hill Companies, Inc. and have been licensed for use by Fidelity Distributors Corporation.
Other third-party marks appearing herein are the property of their respective owners.
All other marks appearing herein are registered or unregistered trademarks or service marks of FMR LLC or an affiliated company. © 2018 FMR LLC. All rights reserved.
This report and the financial statements contained herein are submitted for the general information of the shareholders of the Fund. This report is not authorized for distribution to prospective investors in the Fund unless preceded or accompanied by an effective prospectus.
A fund files its complete schedule of portfolio holdings with the SEC for the first and third quarters of each fiscal year on Form N-Q. Forms N-Q are available on the SEC’s web site at http://www.sec.gov. A fund's Forms N-Q may be reviewed and copied at the SEC’s Public Reference Room in Washington, DC. Information regarding the operation of the SEC's Public Reference Room may be obtained by calling 1-800-SEC-0330.
For a complete list of a fund's portfolio holdings, view the most recent holdings listing, semiannual report, or annual report on Fidelity's web site at http://www.fidelity.com, http://www.institutional.fidelity.com, or http://www.401k.com, as applicable.
NOT FDIC INSURED •MAY LOSE VALUE •NO BANK GUARANTEE
Neither the Fund nor Fidelity Distributors Corporation is a bank.
Performance: The Bottom Line
Average annual total return reflects the change in the value of an investment, assuming reinvestment of distributions from dividend income and capital gains (the profits earned upon the sale of securities that have grown in value, if any) and assuming a constant rate of performance each year. The hypothetical investment and the average annual total returns do not reflect the deduction of taxes that a shareholder would pay on fund distributions or the redemption of fund shares. During periods of reimbursement by Fidelity, a fund’s total return will be greater than it would be had the reimbursement not occurred. How a fund did yesterday is no guarantee of how it will do tomorrow.
Average Annual Total Returns
| For the periods ended June 30, 2018 | Past 1 year | Past 5 years | Past 10 years |
| Class A (incl. 5.75% sales charge) | 4.24% | 9.89% | 8.78% |
| Class M (incl. 3.50% sales charge) | 6.46% | 10.14% | 8.76% |
| Class C (incl. contingent deferred sales charge) | 8.87% | 10.39% | 8.61% |
| Class I | 10.87% | 11.53% | 9.72% |
| Class Z | 11.09% | 11.69% | 9.80% |
Class C shares' contingent deferred sales charges included in the past one year, past five years and past ten years total return figures are 1%, 0% and 0%, respectively.
The initial offering of Class Z shares took place on August 13, 2013. Returns prior to August 13, 2013 are those of Class I.
$10,000 Over 10 Years
Let's say hypothetically that $10,000 was invested in Fidelity Advisor® Mega Cap Stock Fund - Class A on June 30, 2008, and the current 5.75% sales charge was paid.
The chart shows how the value of your investment would have changed, and also shows how the S&P 500® Index performed over the same period.
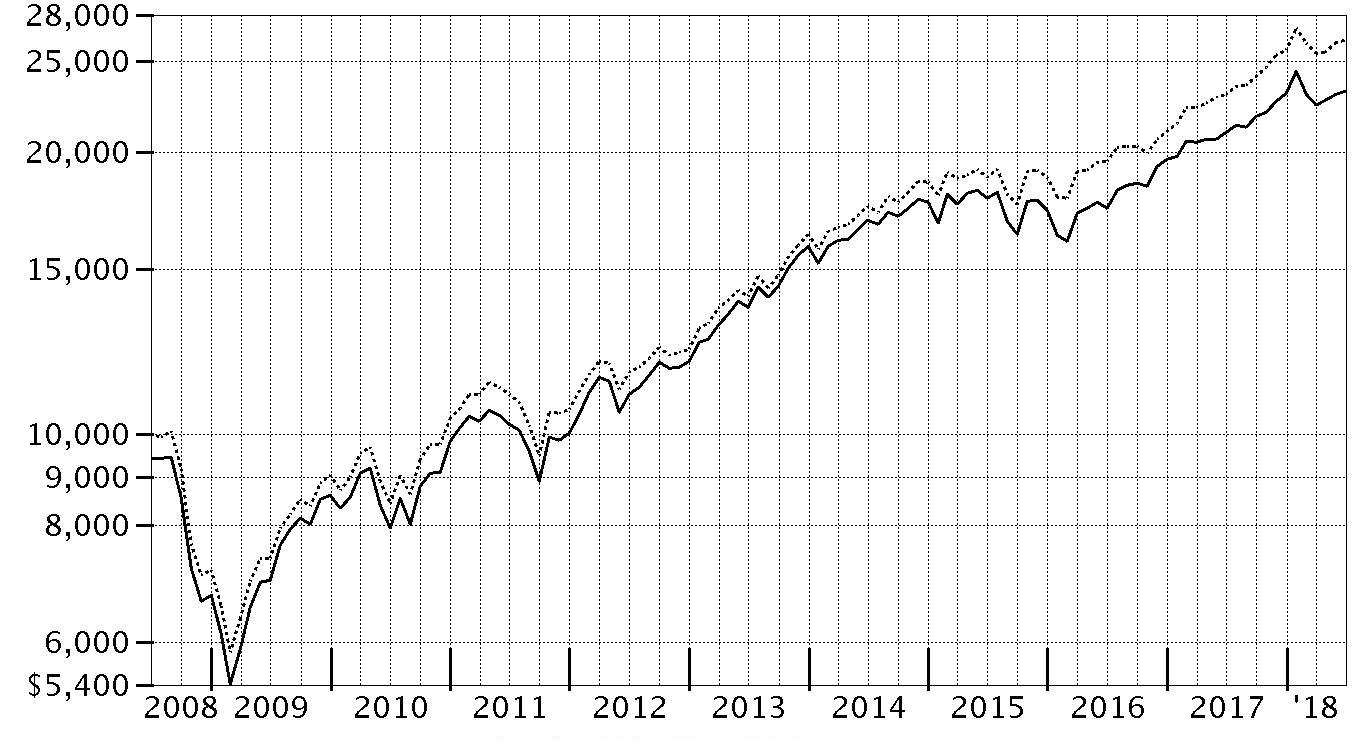
| Period Ending Values |
| $23,200 | Fidelity Advisor® Mega Cap Stock Fund - Class A |
| $26,340 | S&P 500® Index |
Management's Discussion of Fund Performance
Market Recap: The U.S. equity bellwether S&P 500
® index gained 14.37% for the 12 months ending June 30, 2018, despite a resurgence in volatility that challenged the multiyear bull market. The steady growth seen throughout 2017 extended into the new year, as investors remained upbeat on hopes of continued strong economic and earnings growth. Stocks surged 5.73% in January alone. February was a decidedly different story, though, as volatility spiked amid fear that rising inflation and the potential for the economy to overheat would prompt the U.S. Federal Reserve to pick up the pace of interest rate hikes. The index returned -3.69% for the month, its first negative result since October 2016, and lost further ground in March on fear of a global trade war. The market stabilized in April and went on to achieve a solid gain for May. The uptrend continued through roughly mid-June, when escalating trade tension between the U.S. and China soured investor sentiment, and the index ended the 12 months with a two-week slump. By sector, information technology (+31%) led the way, rising on strong earnings growth from several major index constituents. Consumer discretionary (+24%) also stood out, largely driven by retailers (+50%). Energy gained 21% alongside higher oil prices. Notable laggards included some defensive groups – consumer staples (-4%), telecommunication services (+1%) and utilities (+3%) – that struggled amid rising interest rates and a general preference for risk.
Comments from Lead Portfolio Manager Matthew Fruhan: For the fiscal year, the fund's share classes (excluding sales charges, if applicable) gained roughly 10% to 11%, lagging the 15.42% advance of the mega-cap proxy Russell Top 200
® Index, as well as the S&P 500
®. The fund's underperformance of the Russell mega-cap index was primarily due to weak security selection, especially in the health care, consumer discretionary and industrials sectors. The fund also was hurt by a significant underweight in the top-performing information technology and consumer discretionary sectors. Within the latter, lacking exposure to two large Russell index components, online retail giant Amazon.com and video-streaming service provider Netflix – neither of which we saw as attractively valued – stood out as significant detractors, as did an overweight in cable and media giant Comcast. In industrials, it hurt to overweight General Electric, while in health care, our biggest individual detractor was out-of-index drug manufacturer Teva Pharmaceutical Industries. In contrast, an overweight in the energy sector, which outperformed, was beneficial. Here, top relative contributors were energy producer ConocoPhillips and Suncor Energy. Timely positioning in lagging energy giant Exxon Mobil also contributed. Suncor and Exxon Mobil were among the fund's largest positions on June 30. Within information technology, software maker Microsoft added value. It was the fund's largest holding.
The views expressed above reflect those of the portfolio manager(s) only through the end of the period as stated on the cover of this report and do not necessarily represent the views of Fidelity or any other person in the Fidelity organization. Any such views are subject to change at any time based upon market or other conditions and Fidelity disclaims any responsibility to update such views. These views may not be relied on as investment advice and, because investment decisions for a Fidelity fund are based on numerous factors, may not be relied on as an indication of trading intent on behalf of any Fidelity fund.
Note to shareholders: On October 20, 2017, Ashley Fernandes assumed co-manager responsibilities on the fund, joining Lead Manager Matt Fruhan.
Investment Summary (Unaudited)
Top Ten Stocks as of June 30, 2018
| | % of fund's net assets |
| Microsoft Corp. | 5.0 |
| Bank of America Corp. | 4.0 |
| Apple, Inc. | 3.7 |
| Exxon Mobil Corp. | 3.5 |
| JPMorgan Chase & Co. | 3.5 |
| Chevron Corp. | 3.5 |
| Citigroup, Inc. | 3.0 |
| Comcast Corp. Class A | 2.9 |
| Wells Fargo & Co. | 2.8 |
| Suncor Energy, Inc. | 2.4 |
| | 34.3 |
Top Five Market Sectors as of June 30, 2018
| | % of fund's net assets |
| Information Technology | 20.5 |
| Financials | 20.3 |
| Energy | 15.0 |
| Health Care | 14.7 |
| Consumer Staples | 8.6 |
Asset Allocation (% of fund's net assets)
| As of June 30, 2018*,** |
| | Stocks | 99.5% |
| | Convertible Securities | 0.1% |
| | Other Investments | 0.2% |
| | Short-Term Investments and Net Other Assets (Liabilities) | 0.2% |

* Foreign investments - 12.9%
** Written options - (0.0)%
Schedule of Investments June 30, 2018
Showing Percentage of Net Assets
| Common Stocks - 99.5% | | | |
| | | Shares | Value |
| CONSUMER DISCRETIONARY - 7.3% | | | |
| Automobiles - 0.2% | | | |
| General Motors Co. | | 81,700 | $3,218,980 |
| Media - 4.6% | | | |
| Charter Communications, Inc. Class A (a) | | 17,300 | 5,072,533 |
| Comcast Corp. Class A | | 1,803,300 | 59,166,273 |
| The Walt Disney Co. | | 302,600 | 31,715,506 |
| | | | 95,954,312 |
| Multiline Retail - 0.3% | | | |
| Target Corp. | | 82,400 | 6,272,288 |
| Specialty Retail - 2.2% | | | |
| Lowe's Companies, Inc. | | 341,500 | 32,637,155 |
| TJX Companies, Inc. (b) | | 136,900 | 13,030,142 |
| | | | 45,667,297 |
|
| TOTAL CONSUMER DISCRETIONARY | | | 151,112,877 |
|
| CONSUMER STAPLES - 8.6% | | | |
| Beverages - 2.0% | | | |
| PepsiCo, Inc. | | 77,805 | 8,470,630 |
| The Coca-Cola Co. | | 764,000 | 33,509,040 |
| | | | 41,979,670 |
| Food & Staples Retailing - 1.7% | | | |
| Costco Wholesale Corp. | | 13,800 | 2,883,924 |
| Walmart, Inc. | | 363,900 | 31,168,035 |
| | | | 34,051,959 |
| Household Products - 2.0% | | | |
| Kimberly-Clark Corp. | | 23,900 | 2,517,626 |
| Procter & Gamble Co. | | 445,400 | 34,767,924 |
| Reckitt Benckiser Group PLC | | 45,354 | 3,726,504 |
| | | | 41,012,054 |
| Tobacco - 2.9% | | | |
| Altria Group, Inc. | | 734,005 | 41,684,144 |
| British American Tobacco PLC sponsored ADR | | 368,300 | 18,580,735 |
| | | | 60,264,879 |
|
| TOTAL CONSUMER STAPLES | | | 177,308,562 |
|
| ENERGY - 14.8% | | | |
| Energy Equipment & Services - 0.5% | | | |
| Baker Hughes, a GE Co. Class A | | 268,800 | 8,878,464 |
| Oil, Gas & Consumable Fuels - 14.3% | | | |
| Anadarko Petroleum Corp. | | 172,000 | 12,599,000 |
| BP PLC sponsored ADR | | 636,849 | 29,078,525 |
| Cenovus Energy, Inc. | | 1,832,200 | 19,023,717 |
| Chevron Corp. | | 570,900 | 72,178,887 |
| ConocoPhillips Co. | | 217,800 | 15,163,236 |
| Equinor ASA sponsored ADR (c) | | 371,200 | 9,803,392 |
| Exxon Mobil Corp. | | 875,100 | 72,397,023 |
| Imperial Oil Ltd. | | 254,600 | 8,463,104 |
| Suncor Energy, Inc. | | 1,186,700 | 48,293,044 |
| The Williams Companies, Inc. | | 317,460 | 8,606,341 |
| | | | 295,606,269 |
|
| TOTAL ENERGY | | | 304,484,733 |
|
| FINANCIALS - 20.3% | | | |
| Banks - 15.8% | | | |
| Bank of America Corp. | | 2,902,100 | 81,810,199 |
| Citigroup, Inc. | | 944,670 | 63,217,316 |
| JPMorgan Chase & Co. | | 693,800 | 72,293,960 |
| PNC Financial Services Group, Inc. | | 166,500 | 22,494,150 |
| U.S. Bancorp | | 585,900 | 29,306,718 |
| Wells Fargo & Co. | | 1,046,930 | 58,041,799 |
| | | | 327,164,142 |
| Capital Markets - 3.6% | | | |
| Charles Schwab Corp. (b) | | 223,600 | 11,425,960 |
| Goldman Sachs Group, Inc. | | 24,400 | 5,381,908 |
| Morgan Stanley | | 418,000 | 19,813,200 |
| State Street Corp. | | 397,000 | 36,956,730 |
| | | | 73,577,798 |
| Insurance - 0.9% | | | |
| Chubb Ltd. | | 18,200 | 2,311,764 |
| Marsh & McLennan Companies, Inc. | | 97,980 | 8,031,421 |
| MetLife, Inc. | | 183,200 | 7,987,520 |
| | | | 18,330,705 |
|
| TOTAL FINANCIALS | | | 419,072,645 |
|
| HEALTH CARE - 14.6% | | | |
| Biotechnology - 2.6% | | | |
| Alexion Pharmaceuticals, Inc. (a) | | 134,800 | 16,735,420 |
| Amgen, Inc. | | 141,343 | 26,090,504 |
| Biogen, Inc. (a) | | 17,800 | 5,166,272 |
| Intercept Pharmaceuticals, Inc. (a) | | 46,700 | 3,918,597 |
| Regeneron Pharmaceuticals, Inc. (a) | | 7,200 | 2,483,928 |
| | | | 54,394,721 |
| Health Care Equipment & Supplies - 1.1% | | | |
| Becton, Dickinson & Co. | | 8,300 | 1,988,348 |
| Boston Scientific Corp. (a) | | 291,600 | 9,535,320 |
| Danaher Corp. | | 38,700 | 3,818,916 |
| Medtronic PLC | | 75,413 | 6,456,107 |
| | | | 21,798,691 |
| Health Care Providers & Services - 4.8% | | | |
| Anthem, Inc. | | 63,900 | 15,210,117 |
| Cardinal Health, Inc. | | 116,300 | 5,678,929 |
| Cigna Corp. | | 52,600 | 8,939,370 |
| CVS Health Corp. | | 478,100 | 30,765,735 |
| Humana, Inc. | | 22,100 | 6,577,623 |
| McKesson Corp. | | 139,400 | 18,595,960 |
| UnitedHealth Group, Inc. | | 55,700 | 13,665,438 |
| | | | 99,433,172 |
| Pharmaceuticals - 6.1% | | | |
| Allergan PLC | | 51,100 | 8,519,392 |
| AstraZeneca PLC sponsored ADR | | 206,500 | 7,250,215 |
| Bayer AG | | 112,726 | 12,379,976 |
| GlaxoSmithKline PLC sponsored ADR | | 814,400 | 32,828,464 |
| Johnson & Johnson | | 366,700 | 44,495,378 |
| Novartis AG sponsored ADR | | 37,300 | 2,817,642 |
| Sanofi SA | | 104,709 | 8,403,895 |
| Teva Pharmaceutical Industries Ltd. sponsored ADR | | 347,300 | 8,446,336 |
| | | | 125,141,298 |
|
| TOTAL HEALTH CARE | | | 300,767,882 |
|
| INDUSTRIALS - 8.4% | | | |
| Aerospace & Defense - 2.1% | | | |
| General Dynamics Corp. | | 23,300 | 4,343,353 |
| The Boeing Co. | | 600 | 201,306 |
| United Technologies Corp. | | 310,600 | 38,834,318 |
| | | | 43,378,977 |
| Air Freight & Logistics - 1.7% | | | |
| FedEx Corp. | | 30,100 | 6,834,506 |
| United Parcel Service, Inc. Class B | | 268,600 | 28,533,378 |
| | | | 35,367,884 |
| Industrial Conglomerates - 2.0% | | | |
| General Electric Co. | | 3,028,700 | 41,220,607 |
| Road & Rail - 2.6% | | | |
| CSX Corp. (b) | | 127,100 | 8,106,438 |
| Norfolk Southern Corp. | | 94,500 | 14,257,215 |
| Union Pacific Corp. | | 221,290 | 31,352,367 |
| | | | 53,716,020 |
|
| TOTAL INDUSTRIALS | | | 173,683,488 |
|
| INFORMATION TECHNOLOGY - 20.5% | | | |
| Communications Equipment - 1.6% | | | |
| Cisco Systems, Inc. | | 776,800 | 33,425,704 |
| Internet Software & Services - 2.0% | | | |
| Alphabet, Inc.: | | | |
| Class A (a) | | 19,050 | 21,511,070 |
| Class C (a) | | 18,426 | 20,556,967 |
| | | | 42,068,037 |
| IT Services - 3.6% | | | |
| Accenture PLC Class A | | 26,000 | 4,253,340 |
| Cognizant Technology Solutions Corp. Class A | | 57,700 | 4,557,723 |
| IBM Corp. | | 20,300 | 2,835,910 |
| MasterCard, Inc. Class A (b) | | 82,400 | 16,193,248 |
| PayPal Holdings, Inc. (a) | | 8,399 | 699,385 |
| Visa, Inc. Class A | | 343,900 | 45,549,555 |
| | | | 74,089,161 |
| Semiconductors & Semiconductor Equipment - 2.0% | | | |
| Qualcomm, Inc. | | 715,200 | 40,137,024 |
| Software - 7.6% | | | |
| Adobe Systems, Inc. (a) | | 56,700 | 13,824,027 |
| Microsoft Corp. | | 1,057,600 | 104,289,934 |
| Oracle Corp. | | 612,632 | 26,992,566 |
| Salesforce.com, Inc. (a) | | 15,000 | 2,046,000 |
| SAP SE sponsored ADR | | 85,400 | 9,877,364 |
| | | | 157,029,891 |
| Technology Hardware, Storage & Peripherals - 3.7% | | | |
| Apple, Inc. | | 417,107 | 77,210,677 |
|
| TOTAL INFORMATION TECHNOLOGY | | | 423,960,494 |
|
| MATERIALS - 1.5% | | | |
| Chemicals - 1.0% | | | |
| DowDuPont, Inc. | | 100,967 | 6,655,745 |
| LyondellBasell Industries NV Class A | | 131,100 | 14,401,335 |
| | | | 21,057,080 |
| Metals & Mining - 0.5% | | | |
| BHP Billiton Ltd. sponsored ADR (c) | | 178,400 | 8,921,784 |
|
| TOTAL MATERIALS | | | 29,978,864 |
|
| REAL ESTATE - 0.8% | | | |
| Equity Real Estate Investment Trusts (REITs) - 0.8% | | | |
| American Tower Corp. | | 45,300 | 6,530,901 |
| Crown Castle International Corp. | | 4,500 | 485,190 |
| Equinix, Inc. | | 17,800 | 7,652,042 |
| Public Storage | | 12,000 | 2,722,320 |
| | | | 17,390,453 |
| TELECOMMUNICATION SERVICES - 1.9% | | | |
| Diversified Telecommunication Services - 1.9% | | | |
| AT&T, Inc. | | 115,146 | 3,697,338 |
| Verizon Communications, Inc. | | 688,825 | 34,654,786 |
| | | | 38,352,124 |
| UTILITIES - 0.8% | | | |
| Electric Utilities - 0.8% | | | |
| Exelon Corp. | | 374,200 | 15,940,920 |
| TOTAL COMMON STOCKS | | | |
| (Cost $1,381,054,110) | | | 2,052,053,042 |
|
| Convertible Preferred Stocks - 0.1% | | | |
| HEALTH CARE - 0.1% | | | |
| Health Care Equipment & Supplies - 0.1% | | | |
| Becton, Dickinson & Co. Series A, 6.125% | | | |
| (Cost $2,005,000) | | 40,100 | 2,476,877 |
|
| Other - 0.2% | | | |
| ENERGY - 0.2% | | | |
| Oil, Gas, Consumable Fuels - 0.2% | | | |
| Utica Shale Drilling Program (non-operating revenue interest) (d)(e)(f) | | | |
| (Cost $9,242,241) | | 9,242,241 | 4,944,599 |
|
| Money Market Funds - 1.3% | | | |
| Fidelity Cash Central Fund, 1.93% (g) | | 11,552,877 | 11,555,188 |
| Fidelity Securities Lending Cash Central Fund 1.92% (g)(h) | | 14,312,599 | 14,315,462 |
| TOTAL MONEY MARKET FUNDS | | | |
| (Cost $25,869,313) | | | 25,870,650 |
| TOTAL INVESTMENT IN SECURITIES - 101.1% | | | |
| (Cost $1,418,170,664) | | | 2,085,345,168 |
| NET OTHER ASSETS (LIABILITIES) - (1.1)% | | | (21,814,211) |
| NET ASSETS - 100% | | | $2,063,530,957 |
| Written Options | | | | | | |
| | Counterparty | Number of Contracts | Notional Amount | Exercise Price | Expiration Date | Value |
| Call Options | | | | | | |
| Charles Schwab Corp. | Chicago Board Options Exchange | 446 | $2,279,060 | $60.00 | 9/21/18 | $(12,265) |
| CSX Corp. | Chicago Board Options Exchange | 1,271 | 8,106,438 | 70.00 | 8/17/18 | (58,466) |
| Mastercard, Inc. Class A | Chicago Board Options Exchange | 198 | 3,891,096 | 200.00 | 7/20/18 | (45,639) |
| TJX Companies, Inc. | Chicago Board Options Exchange | 445 | 4,235,510 | 97.50 | 10/19/18 | (151,300) |
| TOTAL WRITTEN OPTIONS | | | | | | $(267,670) |
Legend
(a) Non-income producing
(b) Security or a portion of the security is pledged as collateral for call options written. At period end, the value of securities pledged amounted to $18,512,104.
(c) Security or a portion of the security is on loan at period end.
(d) Investment is owned by a wholly-owned subsidiary (Subsidiary) that is treated as a corporation for U.S. tax purposes.
(e) Restricted securities - Investment in securities not registered under the Securities Act of 1933 (excluding 144A issues). At the end of the period, the value of restricted securities (excluding 144A issues) amounted to $4,944,599 or 0.2% of net assets.
(f) Level 3 security
(g) Affiliated fund that is generally available only to investment companies and other accounts managed by Fidelity Investments. The rate quoted is the annualized seven-day yield of the fund at period end. A complete unaudited listing of the fund's holdings as of its most recent quarter end is available upon request. In addition, each Fidelity Central Fund's financial statements, which are not covered by the Fund's Report of Independent Registered Public Accounting Firm, are available on the SEC's website or upon request.
(h) Investment made with cash collateral received from securities on loan.
Additional information on each restricted holding is as follows:
| Security | Acquisition Date | Acquisition Cost |
| Utica Shale Drilling Program (non-operating revenue interest) | 10/5/16 - 9/1/17 | $9,242,241 |
Affiliated Central Funds
Information regarding fiscal year to date income earned by the Fund from investments in Fidelity Central Funds is as follows:
| Fund | Income earned |
| Fidelity Cash Central Fund | $144,196 |
| Fidelity Securities Lending Cash Central Fund | 69,639 |
| Total | $213,835 |
Amounts in the income column in the above table include any capital gain distributions from underlying funds, which are presented in the corresponding line-item in the Statement of Operations if applicable.
Investment Valuation
The following is a summary of the inputs used, as of June 30, 2018, involving the Fund's assets and liabilities carried at fair value. The inputs or methodology used for valuing securities may not be an indication of the risk associated with investing in those securities. For more information on valuation inputs, and their aggregation into the levels used below, please refer to the Investment Valuation section in the accompanying Notes to Financial Statements.
| | Valuation Inputs at Reporting Date: |
| Description | Total | Level 1 | Level 2 | Level 3 |
| Investments in Securities: | | | | |
| Equities: | | | | |
| Consumer Discretionary | $151,112,877 | $151,112,877 | $-- | $-- |
| Consumer Staples | 177,308,562 | 173,582,058 | 3,726,504 | -- |
| Energy | 304,484,733 | 304,484,733 | -- | -- |
| Financials | 419,072,645 | 419,072,645 | -- | -- |
| Health Care | 303,244,759 | 279,984,011 | 23,260,748 | -- |
| Industrials | 173,683,488 | 173,683,488 | -- | -- |
| Information Technology | 423,960,494 | 423,960,494 | -- | -- |
| Materials | 29,978,864 | 29,978,864 | -- | -- |
| Real Estate | 17,390,453 | 17,390,453 | -- | -- |
| Telecommunication Services | 38,352,124 | 38,352,124 | -- | -- |
| Utilities | 15,940,920 | 15,940,920 | -- | -- |
| Other | 4,944,599 | -- | -- | 4,944,599 |
| Money Market Funds | 25,870,650 | 25,870,650 | -- | -- |
| Total Investments in Securities: | $2,085,345,168 | $2,053,413,317 | $26,987,252 | $4,944,599 |
| Derivative Instruments: | | | | |
| Liabilities | | | | |
| Written Options | $(267,670) | $(267,670) | $-- | $-- |
| Total Liabilities | $(267,670) | $(267,670) | $-- | $-- |
| Total Derivative Instruments: | $(267,670) | $(267,670) | $-- | $-- |
Value of Derivative Instruments
The following table is a summary of the Fund's value of derivative instruments by primary risk exposure as of June 30, 2018. For additional information on derivative instruments, please refer to the Derivative Instruments section in the accompanying Notes to Financial Statements.
| Primary Risk Exposure / Derivative Type | Value |
| | Asset | Liability |
| Equity Risk | | |
| Written Options(a) | $0 | $(267,670) |
| Total Value of Derivatives | $0 | $(267,670) |
(a) Gross value is presented in the Statement of Assets and Liabilities in the written options, at value line-item.
Other Information
Distribution of investments by country or territory of incorporation, as a percentage of Total Net Assets, is as follows (Unaudited):
| United States of America | 87.1% |
| United Kingdom | 4.5% |
| Canada | 3.7% |
| Germany | 1.1% |
| Others (Individually Less Than 1%) | 3.6% |
| | 100.0% |
See accompanying notes which are an integral part of the financial statements.
Financial Statements
Statement of Assets and Liabilities
| | | June 30, 2018 |
| Assets | | |
Investment in securities, at value (including securities loaned of $13,981,940) — See accompanying schedule:
Unaffiliated issuers (cost $1,392,301,351) | $2,059,474,518 | |
| Fidelity Central Funds (cost $25,869,313) | 25,870,650 | |
| Total Investment in Securities (cost $1,418,170,664) | | $2,085,345,168 |
| Restricted cash | | 116,580 |
| Receivable for investments sold | | 2,912,965 |
| Receivable for fund shares sold | | 370,848 |
| Dividends receivable | | 2,607,408 |
| Distributions receivable from Fidelity Central Funds | | 14,300 |
| Other receivables | | 34,563 |
| Total assets | | 2,091,401,832 |
| Liabilities | | |
| Payable for investments purchased | $7,865,086 | |
| Payable for fund shares redeemed | 4,165,744 | |
| Accrued management fee | 769,676 | |
| Distribution and service plan fees payable | 52,918 | |
| Written options, at value (premium received $342,778) | 267,670 | |
| Other affiliated payables | 364,918 | |
| Other payables and accrued expenses | 68,663 | |
| Collateral on securities loaned | 14,316,200 | |
| Total liabilities | | 27,870,875 |
| Net Assets | | $2,063,530,957 |
| Net Assets consist of: | | |
| Paid in capital | | $1,202,853,284 |
| Undistributed net investment income | | 15,467,343 |
| Accumulated undistributed net realized gain (loss) on investments and foreign currency transactions | | 177,967,596 |
| Net unrealized appreciation (depreciation) on investments and assets and liabilities in foreign currencies | | 667,242,734 |
| Net Assets | | $2,063,530,957 |
| Calculation of Maximum Offering Price | | |
| Class A: | | |
| Net Asset Value and redemption price per share ($62,332,582 ÷ 3,595,363 shares) | | $17.34 |
| Maximum offering price per share (100/94.25 of $17.34) | | $18.40 |
| Class M: | | |
| Net Asset Value and redemption price per share ($26,445,901 ÷ 1,527,598 shares) | | $17.31 |
| Maximum offering price per share (100/96.50 of $17.31) | | $17.94 |
| Class C: | | |
| Net Asset Value and offering price per share ($33,640,368 ÷ 1,975,429 shares)(a) | | $17.03 |
| Mega Cap Stock: | | |
| Net Asset Value, offering price and redemption price per share ($1,715,822,431 ÷ 97,934,675 shares) | | $17.52 |
| Class I: | | |
| Net Asset Value, offering price and redemption price per share ($143,472,288 ÷ 8,183,765 shares) | | $17.53 |
| Class Z: | | |
| Net Asset Value, offering price and redemption price per share ($81,817,387 ÷ 4,686,246 shares) | | $17.46 |
(a) Redemption price per share is equal to net asset value less any applicable contingent deferred sales charge.
See accompanying notes which are an integral part of the financial statements.
Statement of Operations
| | | Year ended June 30, 2018 |
| Investment Income | | |
| Dividends | | $52,101,937 |
| Income from Fidelity Central Funds | | 213,835 |
| Total income | | 52,315,772 |
| Expenses | | |
| Management fee | $10,250,513 | |
| Transfer agent fees | 4,099,650 | |
| Distribution and service plan fees | 636,454 | |
| Accounting and security lending fees | 696,990 | |
| Custodian fees and expenses | 42,631 | |
| Independent trustees' fees and expenses | 9,805 | |
| Registration fees | 120,309 | |
| Audit | 64,816 | |
| Legal | 7,106 | |
| Interest | 19,432 | |
| Miscellaneous | 18,103 | |
| Total expenses before reductions | 15,965,809 | |
| Expense reductions | (106,657) | |
| Total expenses after reductions | | 15,859,152 |
| Net investment income (loss) | | 36,456,620 |
| Realized and Unrealized Gain (Loss) | | |
| Net realized gain (loss) on: | | |
| Investment securities: | | |
| Unaffiliated issuers | 279,125,575 | |
| Fidelity Central Funds | (2,058) | |
| Foreign currency transactions | (7,607) | |
| Written options | 3,585,965 | |
| Total net realized gain (loss) | | 282,701,875 |
| Change in net unrealized appreciation (depreciation) on: | | |
| Investment securities: | | |
| Unaffiliated issuers | (93,699,725) | |
| Fidelity Central Funds | 1,337 | |
| Assets and liabilities in foreign currencies | (3,400) | |
| Written options | 1,072,168 | |
| Total change in net unrealized appreciation (depreciation) | | (92,629,620) |
| Net gain (loss) | | 190,072,255 |
| Net increase (decrease) in net assets resulting from operations | | $226,528,875 |
See accompanying notes which are an integral part of the financial statements.
Statement of Changes in Net Assets
| | Year ended June 30, 2018 | Year ended June 30, 2017 |
| Increase (Decrease) in Net Assets | | |
| Operations | | |
| Net investment income (loss) | $36,456,620 | $49,096,205 |
| Net realized gain (loss) | 282,701,875 | 340,272,578 |
| Change in net unrealized appreciation (depreciation) | (92,629,620) | 237,023,573 |
| Net increase (decrease) in net assets resulting from operations | 226,528,875 | 626,392,356 |
| Distributions to shareholders from net investment income | (35,334,838) | (52,216,198) |
| Distributions to shareholders from net realized gain | (308,590,093) | (17,291,428) |
| Total distributions | (343,924,931) | (69,507,626) |
| Share transactions - net increase (decrease) | (27,457,731) | (1,685,570,408) |
| Total increase (decrease) in net assets | (144,853,787) | (1,128,685,678) |
| Net Assets | | |
| Beginning of period | 2,208,384,744 | 3,337,070,422 |
| End of period | $2,063,530,957 | $2,208,384,744 |
| Other Information | | |
| Undistributed net investment income end of period | $15,467,343 | $17,400,130 |
See accompanying notes which are an integral part of the financial statements.
Financial Highlights
Fidelity Mega Cap Stock Fund Class A
| Years ended June 30, | 2018 | 2017 | 2016 | 2015 | 2014 |
| Selected Per–Share Data | | | | | |
| Net asset value, beginning of period | $18.42 | $15.56 | $16.56 | $16.32 | $13.51 |
| Income from Investment Operations | | | | | |
| Net investment income (loss)A | .23 | .22 | .23 | .18 | .18 |
| Net realized and unrealized gain (loss) | 1.49 | 2.94 | (.65) | .71 | 3.00 |
| Total from investment operations | 1.72 | 3.16 | (.42) | .89 | 3.18 |
| Distributions from net investment income | (.24) | (.22) | (.18) | (.17) | (.16) |
| Distributions from net realized gain | (2.56) | (.09) | (.40) | (.47) | (.21) |
| Total distributions | (2.80) | (.30)B | (.58) | (.65)C | (.37) |
| Net asset value, end of period | $17.34 | $18.42 | $15.56 | $16.56 | $16.32 |
| Total ReturnD,E | 10.60% | 20.49% | (2.56)% | 5.69% | 23.88% |
| Ratios to Average Net AssetsF,G | | | | | |
| Expenses before reductions | .93% | .94% | .95% | 1.05% | .96% |
| Expenses net of fee waivers, if any | .93% | .94% | .95% | 1.05% | .96% |
| Expenses net of all reductions | .93% | .94% | .95% | 1.05% | .96% |
| Net investment income (loss) | 1.33% | 1.30% | 1.46% | 1.10% | 1.19% |
| Supplemental Data | | | | | |
| Net assets, end of period (000 omitted) | $62,333 | $60,362 | $68,801 | $117,385 | $77,335 |
| Portfolio turnover rateH | 39% | 25% | 25% | 22%I | 28% |
A Calculated based on average shares outstanding during the period.
B Total distributions of $.30 per share is comprised of distributions from net investment income of $.218 and distributions from net realized gain of $.085 per share.
C Total distributions of $.65 per share is comprised of distributions from net investment income of $.174 and distributions from net realized gain of $.474 per share.
D Total returns would have been lower if certain expenses had not been reduced during the applicable periods shown.
E Total returns do not include the effect of the sales charges.
F Fees and expenses of any underlying Fidelity Central Funds are not included in the Fund's expense ratio. The Fund indirectly bears its proportionate share of the expenses of any underlying Fidelity Central Funds.
G Expense ratios reflect operating expenses of the class. Expenses before reductions do not reflect amounts reimbursed by the investment adviser or reductions from brokerage service arrangements or reductions from other expense offset arrangements and do not represent the amount paid by the class during periods when reimbursements or reductions occur. Expenses net of fee waivers reflect expenses after reimbursement by the investment adviser but prior to reductions from brokerage service arrangements or other expense offset arrangements. Expenses net of all reductions represent the net expenses paid by the class.
H Amount does not include the portfolio activity of any underlying Fidelity Central Funds.
I Portfolio turnover rate excludes securities received or delivered in-kind.
See accompanying notes which are an integral part of the financial statements.
Fidelity Mega Cap Stock Fund Class M
| Years ended June 30, | 2018 | 2017 | 2016 | 2015 | 2014 |
| Selected Per–Share Data | | | | | |
| Net asset value, beginning of period | $18.39 | $15.54 | $16.57 | $16.31 | $13.51 |
| Income from Investment Operations | | | | | |
| Net investment income (loss)A | .19 | .18 | .19 | .16 | .14 |
| Net realized and unrealized gain (loss) | 1.48 | 2.93 | (.65) | .70 | 3.00 |
| Total from investment operations | 1.67 | 3.11 | (.46) | .86 | 3.14 |
| Distributions from net investment income | (.19) | (.18) | (.16) | (.13) | (.13) |
| Distributions from net realized gain | (2.56) | (.09) | (.40) | (.47) | (.21) |
| Total distributions | (2.75) | (.26)B | (.57)C | (.60) | (.34) |
| Net asset value, end of period | $17.31 | $18.39 | $15.54 | $16.57 | $16.31 |
| Total ReturnD,E | 10.33% | 20.17% | (2.83)% | 5.53% | 23.54% |
| Ratios to Average Net AssetsF,G | | | | | |
| Expenses before reductions | 1.19% | 1.20% | 1.21% | 1.21% | 1.22% |
| Expenses net of fee waivers, if any | 1.19% | 1.20% | 1.21% | 1.20% | 1.22% |
| Expenses net of all reductions | 1.18% | 1.20% | 1.20% | 1.20% | 1.22% |
| Net investment income (loss) | 1.07% | 1.04% | 1.21% | .95% | .92% |
| Supplemental Data | | | | | |
| Net assets, end of period (000 omitted) | $26,446 | $28,248 | $26,145 | $23,231 | $15,728 |
| Portfolio turnover rateH | 39% | 25% | 25% | 22%I | 28% |
A Calculated based on average shares outstanding during the period.
B Total distributions of $.26 per share is comprised of distributions from net investment income of $.178 and distributions from net realized gain of $.085 per share.
C Total distributions of $.57 per share is comprised of distributions from net investment income of $.164 and distributions from net realized gain of $.404 per share.
D Total returns would have been lower if certain expenses had not been reduced during the applicable periods shown.
E Total returns do not include the effect of the sales charges.
F Fees and expenses of any underlying Fidelity Central Funds are not included in the Fund's expense ratio. The Fund indirectly bears its proportionate share of the expenses of any underlying Fidelity Central Funds.
G Expense ratios reflect operating expenses of the class. Expenses before reductions do not reflect amounts reimbursed by the investment adviser or reductions from brokerage service arrangements or reductions from other expense offset arrangements and do not represent the amount paid by the class during periods when reimbursements or reductions occur. Expenses net of fee waivers reflect expenses after reimbursement by the investment adviser but prior to reductions from brokerage service arrangements or other expense offset arrangements. Expenses net of all reductions represent the net expenses paid by the class.
H Amount does not include the portfolio activity of any underlying Fidelity Central Funds.
I Portfolio turnover rate excludes securities received or delivered in-kind.
See accompanying notes which are an integral part of the financial statements.
Fidelity Mega Cap Stock Fund Class C
| Years ended June 30, | 2018 | 2017 | 2016 | 2015 | 2014 |
| Selected Per–Share Data | | | | | |
| Net asset value, beginning of period | $18.13 | $15.32 | $16.35 | $16.12 | $13.38 |
| Income from Investment Operations | | | | | |
| Net investment income (loss)A | .10 | .09 | .11 | .07 | .06 |
| Net realized and unrealized gain (loss) | 1.47 | 2.90 | (.64) | .71 | 2.97 |
| Total from investment operations | 1.57 | 2.99 | (.53) | .78 | 3.03 |
| Distributions from net investment income | (.11) | (.09) | (.09) | (.08) | (.08) |
| Distributions from net realized gain | (2.56) | (.09) | (.40) | (.47) | (.21) |
| Total distributions | (2.67) | (.18) | (.50)B | (.55) | (.29) |
| Net asset value, end of period | $17.03 | $18.13 | $15.32 | $16.35 | $16.12 |
| Total ReturnC,D | 9.81% | 19.59% | (3.32)% | 5.05% | 22.90% |
| Ratios to Average Net AssetsE,F | | | | | |
| Expenses before reductions | 1.68% | 1.69% | 1.70% | 1.70% | 1.71% |
| Expenses net of fee waivers, if any | 1.68% | 1.69% | 1.70% | 1.70% | 1.71% |
| Expenses net of all reductions | 1.68% | 1.69% | 1.69% | 1.70% | 1.71% |
| Net investment income (loss) | .58% | .55% | .72% | .45% | .43% |
| Supplemental Data | | | | | |
| Net assets, end of period (000 omitted) | $33,640 | $34,205 | $31,605 | $34,790 | $16,600 |
| Portfolio turnover rateG | 39% | 25% | 25% | 22%H | 28% |
A Calculated based on average shares outstanding during the period.
B Total distributions of $.50 per share is comprised of distributions from net investment income of $.091 and distributions from net realized gain of $.404 per share.
C Total returns would have been lower if certain expenses had not been reduced during the applicable periods shown.
D Total returns do not include the effect of the contingent deferred sales charge.
E Fees and expenses of any underlying Fidelity Central Funds are not included in the Fund's expense ratio. The Fund indirectly bears its proportionate share of the expenses of any underlying Fidelity Central Funds.
F Expense ratios reflect operating expenses of the class. Expenses before reductions do not reflect amounts reimbursed by the investment adviser or reductions from brokerage service arrangements or reductions from other expense offset arrangements and do not represent the amount paid by the class during periods when reimbursements or reductions occur. Expenses net of fee waivers reflect expenses after reimbursement by the investment adviser but prior to reductions from brokerage service arrangements or other expense offset arrangements. Expenses net of all reductions represent the net expenses paid by the class.
G Amount does not include the portfolio activity of any underlying Fidelity Central Funds.
H Portfolio turnover rate excludes securities received or delivered in-kind.
See accompanying notes which are an integral part of the financial statements.
Fidelity Mega Cap Stock Fund
| Years ended June 30, | 2018 | 2017 | 2016 | 2015 | 2014 |
| Selected Per–Share Data | | | | | |
| Net asset value, beginning of period | $18.58 | $15.68 | $16.72 | $16.44 | $13.60 |
| Income from Investment Operations | | | | | |
| Net investment income (loss)A | .28 | .27 | .27 | .24 | .22 |
| Net realized and unrealized gain (loss) | 1.50 | 2.97 | (.66) | .72 | 3.02 |
| Total from investment operations | 1.78 | 3.24 | (.39) | .96 | 3.24 |
| Distributions from net investment income | (.27) | (.26) | (.25) | (.21) | (.19) |
| Distributions from net realized gain | (2.56) | (.09) | (.40) | (.47) | (.21) |
| Total distributions | (2.84)B | (.34)C | (.65) | (.68) | (.40) |
| Net asset value, end of period | $17.52 | $18.58 | $15.68 | $16.72 | $16.44 |
| Total ReturnD | 10.86% | 20.87% | (2.36)% | 6.13% | 24.18% |
| Ratios to Average Net AssetsE,F | | | | | |
| Expenses before reductions | .68% | .68% | .69% | .67% | .68% |
| Expenses net of fee waivers, if any | .68% | .68% | .69% | .67% | .68% |
| Expenses net of all reductions | .68% | .68% | .68% | .67% | .68% |
| Net investment income (loss) | 1.58% | 1.56% | 1.73% | 1.48% | 1.47% |
| Supplemental Data | | | | | |
| Net assets, end of period (000 omitted) | $1,715,822 | $1,613,374 | $3,059,691 | $3,300,700 | $2,860,197 |
| Portfolio turnover rateG | 39% | 25% | 25% | 22%H | 28% |
A Calculated based on average shares outstanding during the period.
B Total distributions of $2.84 per share is comprised of distributions from net investment income of $.274 and distributions from net realized gain of $2.562 per share.
C Total distributions of $.34 per share is comprised of distributions from net investment income of $.258 and distributions from net realized gain of $.085 per share.
D Total returns would have been lower if certain expenses had not been reduced during the applicable periods shown.
E Fees and expenses of any underlying Fidelity Central Funds are not included in the Fund's expense ratio. The Fund indirectly bears its proportionate share of the expenses of any underlying Fidelity Central Funds.
F Expense ratios reflect operating expenses of the class. Expenses before reductions do not reflect amounts reimbursed by the investment adviser or reductions from brokerage service arrangements or reductions from other expense offset arrangements and do not represent the amount paid by the class during periods when reimbursements or reductions occur. Expenses net of fee waivers reflect expenses after reimbursement by the investment adviser but prior to reductions from brokerage service arrangements or other expense offset arrangements. Expenses net of all reductions represent the net expenses paid by the class.
G Amount does not include the portfolio activity of any underlying Fidelity Central Funds.
H Portfolio turnover rate excludes securities received or delivered in-kind.
See accompanying notes which are an integral part of the financial statements.
Fidelity Mega Cap Stock Fund Class I
| Years ended June 30, | 2018 | 2017 | 2016 | 2015 | 2014 |
| Selected Per–Share Data | | | | | |
| Net asset value, beginning of period | $18.60 | $15.70 | $16.73 | $16.39 | $13.55 |
| Income from Investment Operations | | | | | |
| Net investment income (loss)A | .28 | .27 | .27 | .24 | .22 |
| Net realized and unrealized gain (loss) | 1.50 | 2.97 | (.65) | .72 | 3.02 |
| Total from investment operations | 1.78 | 3.24 | (.38) | .96 | 3.24 |
| Distributions from net investment income | (.29) | (.26) | (.24) | (.15) | (.18) |
| Distributions from net realized gain | (2.56) | (.09) | (.40) | (.47) | (.21) |
| Total distributions | (2.85) | (.34)B | (.65)C | (.62) | (.40)D |
| Net asset value, end of period | $17.53 | $18.60 | $15.70 | $16.73 | $16.39 |
| Total ReturnE | 10.87% | 20.84% | (2.31)% | 6.11% | 24.23% |
| Ratios to Average Net AssetsF,G | | | | | |
| Expenses before reductions | .67% | .67% | .68% | .69% | .71% |
| Expenses net of fee waivers, if any | .67% | .67% | .68% | .68% | .71% |
| Expenses net of all reductions | .66% | .67% | .68% | .68% | .71% |
| Net investment income (loss) | 1.60% | 1.57% | 1.73% | 1.47% | 1.43% |
| Supplemental Data | | | | | |
| Net assets, end of period (000 omitted) | $143,472 | $153,622 | $148,414 | $186,637 | $674,416 |
| Portfolio turnover rateH | 39% | 25% | 25% | 22%I | 28% |
A Calculated based on average shares outstanding during the period.
B Total distributions of $.34 per share is comprised of distributions from net investment income of $.257 and distributions from net realized gain of $.085 per share.
C Total distributions of $.65 per share is comprised of distributions from net investment income of $.244 and distributions from net realized gain of $.404 per share.
D Total distributions of $.40 per share is comprised of distributions from net investment income of $.182 and distributions from net realized gain of $.213 per share.
E Total returns would have been lower if certain expenses had not been reduced during the applicable periods shown.
F Fees and expenses of any underlying Fidelity Central Funds are not included in the Fund's expense ratio. The Fund indirectly bears its proportionate share of the expenses of any underlying Fidelity Central Funds.
G Expense ratios reflect operating expenses of the class. Expenses before reductions do not reflect amounts reimbursed by the investment adviser or reductions from brokerage service arrangements or reductions from other expense offset arrangements and do not represent the amount paid by the class during periods when reimbursements or reductions occur. Expenses net of fee waivers reflect expenses after reimbursement by the investment adviser but prior to reductions from brokerage service arrangements or other expense offset arrangements. Expenses net of all reductions represent the net expenses paid by the class.
H Amount does not include the portfolio activity of any underlying Fidelity Central Funds.
I Portfolio turnover rate excludes securities received or delivered in-kind.
See accompanying notes which are an integral part of the financial statements.
Fidelity Mega Cap Stock Fund Class Z
| Years ended June 30, | 2018 | 2017 | 2016 | 2015 | 2014 A |
| Selected Per–Share Data | | | | | |
| Net asset value, beginning of period | $18.53 | $15.65 | $16.69 | $16.40 | $14.31 |
| Income from Investment Operations | | | | | |
| Net investment income (loss)B | .30 | .31 | .29 | .27 | .21 |
| Net realized and unrealized gain (loss) | 1.51 | 2.94 | (.66) | .72 | 2.20 |
| Total from investment operations | 1.81 | 3.25 | (.37) | .99 | 2.41 |
| Distributions from net investment income | (.31) | (.28) | (.27) | (.23) | (.10) |
| Distributions from net realized gain | (2.56) | (.09) | (.40) | (.47) | (.21) |
| Total distributions | (2.88)C | (.37) | (.67) | (.70) | (.32)D |
| Net asset value, end of period | $17.46 | $18.53 | $15.65 | $16.69 | $16.40 |
| Total ReturnE,F | 11.09% | 20.96% | (2.21)% | 6.33% | 17.06% |
| Ratios to Average Net AssetsG,H | | | | | |
| Expenses before reductions | .53% | .53% | .54% | .54% | .54%I |
| Expenses net of fee waivers, if any | .53% | .53% | .54% | .54% | .54%I |
| Expenses net of all reductions | .53% | .53% | .53% | .54% | .54%I |
| Net investment income (loss) | 1.73% | 1.71% | 1.88% | 1.61% | 1.59%I |
| Supplemental Data | | | | | |
| Net assets, end of period (000 omitted) | $81,817 | $318,575 | $2,414 | $2,449 | $117 |
| Portfolio turnover rateJ | 39% | 25% | 25% | 22%K | 28% |
A For the period August 13, 2013 (commencement of sale of shares) to June 30, 2014.
B Calculated based on average shares outstanding during the period.
C Total distributions of $2.88 per share is comprised of distributions from net investment income of $.313 and distributions from net realized gain of $2.562 per share.
D Total distributions of $.32 per share is comprised of distributions from net investment income of $.104 and distributions from net realized gain of $.213 per share.
E Total returns for periods of less than one year are not annualized.
F Total returns would have been lower if certain expenses had not been reduced during the applicable periods shown.
G Fees and expenses of any underlying Fidelity Central Funds are not included in the Fund's expense ratio. The Fund indirectly bears its proportionate share of the expenses of any underlying Fidelity Central Funds.
H Expense ratios reflect operating expenses of the class. Expenses before reductions do not reflect amounts reimbursed by the investment adviser or reductions from brokerage service arrangements or reductions from other expense offset arrangements and do not represent the amount paid by the class during periods when reimbursements or reductions occur. Expense ratios before reductions for start-up periods may not be representative of longer-term operating periods. Expenses net of fee waivers reflect expenses after reimbursement by the investment adviser but prior to reductions from brokerage service arrangements or other expense offset arrangements. Expenses net of all reductions represent the net expenses paid by the class.
I Annualized
J Amount does not include the portfolio activity of any underlying Fidelity Central Funds.
K Portfolio turnover rate excludes securities received or delivered in-kind.
See accompanying notes which are an integral part of the financial statements.
Notes to Financial Statements
For the period ended June 30, 2018
1. Organization.
Fidelity Mega Cap Stock Fund (the Fund) is a fund of Fidelity Hastings Street Trust (the Trust) and is authorized to issue an unlimited number of shares. The Trust is registered under the Investment Company Act of 1940, as amended (the 1940 Act), as an open-end management investment company organized as a Massachusetts business trust. The Fund offers Class A, Class M, Class C, Mega Cap Stock, Class I, and Class Z shares, each of which has equal rights as to assets and voting privileges. Each class has exclusive voting rights with respect to matters that affect that class.
2. Investments in Fidelity Central Funds.
The Fund invests in Fidelity Central Funds, which are open-end investment companies generally available only to other investment companies and accounts managed by the investment adviser and its affiliates. The Fund's Schedule of Investments lists each of the Fidelity Central Funds held as of period end, if any, as an investment of the Fund, but does not include the underlying holdings of each Fidelity Central Fund. As an Investing Fund, the Fund indirectly bears its proportionate share of the expenses of the underlying Fidelity Central Funds.
The Money Market Central Funds seek preservation of capital and current income and are managed by Fidelity Investments Money Management, Inc. (FIMM), an affiliate of the investment adviser. Annualized expenses of the Money Market Central Funds as of their most recent shareholder report date are less than .005%.
A complete unaudited list of holdings for each Fidelity Central Fund is available upon request or at the Securities and Exchange Commission (the SEC) website at www.sec.gov. In addition, the financial statements of the Fidelity Central Funds, which are not covered by the Fund's Report of Independent Registered Public Accounting Firm, are available on the SEC website or upon request.
3. Significant Accounting Policies.
The Fund is an investment company and applies the accounting and reporting guidance of the Financial Accounting Standards Board (FASB) Accounting Standards Codification Topic 946 Financial Services – Investments Companies. The financial statements have been prepared in conformity with accounting principles generally accepted in the United States of America (GAAP), which require management to make certain estimates and assumptions at the date of the financial statements. Actual results could differ from those estimates. Subsequent events, if any, through the date that the financial statements were issued have been evaluated in the preparation of the financial statements. The following summarizes the significant accounting policies of the Fund:
Investment Valuation. Investments are valued as of 4:00 p.m. Eastern time on the last calendar day of the period. The Board of Trustees (the Board) has delegated the day to day responsibility for the valuation of the Fund's investments to the Fair Value Committee (the Committee) established by the Fund's investment adviser. In accordance with valuation policies and procedures approved by the Board, the Fund attempts to obtain prices from one or more third party pricing vendors or brokers to value its investments. When current market prices, quotations or currency exchange rates are not readily available or reliable, investments will be fair valued in good faith by the Committee, in accordance with procedures adopted by the Board. Factors used in determining fair value vary by investment type and may include market or investment specific events. The frequency with which these procedures are used cannot be predicted and they may be utilized to a significant extent. The Committee oversees the Fund's valuation policies and procedures and reports to the Board on the Committee's activities and fair value determinations. The Board monitors the appropriateness of the procedures used in valuing the Fund's investments and ratifies the fair value determinations of the Committee.
The Fund categorizes the inputs to valuation techniques used to value its investments into a disclosure hierarchy consisting of three levels as shown below:
- Level 1 – quoted prices in active markets for identical investments
- Level 2 – other significant observable inputs (including quoted prices for similar investments, interest rates, prepayment speeds, etc.)
- Level 3 – unobservable inputs (including the Fund's own assumptions based on the best information available)
Valuation techniques used to value the Fund's investments by major category are as follows:
Equity securities, including restricted securities, for which market quotations are readily available, are valued at the last reported sale price or official closing price as reported by a third party pricing vendor on the primary market or exchange on which they are traded and are categorized as Level 1 in the hierarchy. In the event there were no sales during the day or closing prices are not available, securities are valued at the last quoted bid price or may be valued using the last available price and are generally categorized as Level 2 in the hierarchy. For foreign equity securities, when market or security specific events arise, comparisons to the valuation of American Depositary Receipts (ADRs), futures contracts, Exchange-Traded Funds (ETFs) and certain indexes as well as quoted prices for similar securities may be used and would be categorized as Level 2 in the hierarchy. Utilizing these techniques may result in transfers between Level 1 and Level 2. For equity securities, including restricted securities, where observable inputs are limited, assumptions about market activity and risk are used and these securities may be categorized as Level 3 in the hierarchy.
Exchange-traded options are valued using the last sale price or, in the absence of a sale, the last offering price and are categorized as Level 1 in the hierarchy. Investments in open-end mutual funds, including the Fidelity Central Funds, are valued at their closing net asset value (NAV) each business day and are categorized as Level 1 in the hierarchy.
Changes in valuation techniques may result in transfers in or out of an assigned level within the disclosure hierarchy. The aggregate value of investments by input level as of June 30, 2018 is included at the end of the Fund's Schedule of Investments.
Foreign Currency. The Fund may use foreign currency contracts to facilitate transactions in foreign-denominated securities. Gains and losses from these transactions may arise from changes in the value of the foreign currency or if the counterparties do not perform under the contracts' terms.
Foreign-denominated assets, including investment securities, and liabilities are translated into U.S. dollars at the exchange rates at period end. Purchases and sales of investment securities, income and dividends received and expenses denominated in foreign currencies are translated into U.S. dollars at the exchange rate in effect on the transaction date.
The effects of exchange rate fluctuations on investments are included with the net realized and unrealized gain (loss) on investment securities. Other foreign currency transactions resulting in realized and unrealized gain (loss) are disclosed separately.
Investment Transactions and Income. For financial reporting purposes, the Fund's investment holdings and NAV include trades executed through the end of the last business day of the period. The NAV per share for processing shareholder transactions is calculated as of the close of business of the New York Stock Exchange (NYSE), normally 4:00 p.m. Eastern time and includes trades executed through the end of the prior business day. Gains and losses on securities sold are determined on the basis of identified cost and include proceeds received from litigation. Dividend income is recorded on the ex-dividend date, except for certain dividends from foreign securities where the ex-dividend date may have passed, which are recorded as soon as the Fund is informed of the ex-dividend date. Non-cash dividends included in dividend income, if any, are recorded at the fair market value of the securities received. Income and capital gain distributions from Fidelity Central Funds, if any, are recorded on the ex-dividend date. Certain distributions received by the Fund represent a return of capital or capital gain. The Fund determines the components of these distributions subsequent to the ex-dividend date, based upon receipt of tax filings or other correspondence relating to the underlying investment. These distributions are recorded as a reduction of cost of investments and/or as a realized gain. Investment income is recorded net of foreign taxes withheld where recovery of such taxes is uncertain.
Class Allocations and Expenses. Investment income, realized and unrealized capital gains and losses, common expenses of the Fund, and certain fund-level expense reductions, if any, are allocated daily on a pro-rata basis to each class based on the relative net assets of each class to the total net assets of the Fund. Each class differs with respect to transfer agent and distribution and service plan fees incurred. Certain expense reductions may also differ by class. For the reporting period, the allocated portion of income and expenses to each class as a percent of its average net assets may vary due to the timing of recording these transactions in relation to fluctuating net assets of the classes. Expenses directly attributable to a fund are charged to that fund. Expenses attributable to more than one fund are allocated among the respective funds on the basis of relative net assets or other appropriate methods. Expense estimates are accrued in the period to which they relate and adjustments are made when actual amounts are known.
Income Tax Information and Distributions to Shareholders. Each year, the Fund intends to qualify as a regulated investment company under Subchapter M of the Internal Revenue Code, including distributing substantially all of its taxable income and realized gains. As a result, no provision for U.S. Federal income taxes is required. As of June 30, 2018, the Fund did not have any unrecognized tax benefits in the financial statements; nor is the Fund aware of any tax positions for which it is reasonably possible that the total amounts of unrecognized tax benefits will significantly change in the next twelve months. The Fund files a U.S. federal tax return, in addition to state and local tax returns as required. The Fund's federal income tax returns are subject to examination by the Internal Revenue Service (IRS) for a period of three fiscal years after they are filed. State and local tax returns may be subject to examination for an additional fiscal year depending on the jurisdiction. Foreign taxes are provided for based on the Fund's understanding of the tax rules and rates that exist in the foreign markets in which it invests.
Distributions are declared and recorded on the ex-dividend date. Income and capital gain distributions are declared separately for each class. Income and capital gain distributions are determined in accordance with income tax regulations, which may differ from GAAP. In addition, the Fund claimed a portion of the payment made to redeeming shareholders as a distribution for income tax purposes.
Capital accounts within the financial statements are adjusted for permanent book-tax differences. These adjustments have no impact on net assets or the results of operations. Capital accounts are not adjusted for temporary book-tax differences which will reverse in a subsequent period.
Book-tax differences are primarily due to foreign currency transactions and losses deferred due to wash sales.
As of period end, the cost and unrealized appreciation (depreciation) in securities, and derivatives if applicable, for federal income tax purposes were as follows:
| Gross unrealized appreciation | $723,093,363 |
| Gross unrealized depreciation | (63,001,734) |
| Net unrealized appreciation (depreciation) | $660,091,629 |
| Tax Cost | $1,424,985,869 |
The tax-based components of distributable earnings as of period end were as follows:
| Undistributed ordinary income | $15,869,174 |
| Undistributed long-term capital gain | $184,723,748 |
| Net unrealized appreciation (depreciation) on securities and other investments | $660,084,751 |
The tax character of distributions paid was as follows:
| | June 30, 2018 | June 30, 2017 |
| Ordinary Income | $35,334,838 | $ 52,216,198 |
| Long-term Capital Gains | 308,590,093 | 17,291,428 |
| Total | $343,924,931 | $ 69,507,626 |
Restricted Securities. The Fund may invest in securities that are subject to legal or contractual restrictions on resale. These securities generally may be resold in transactions exempt from registration or to the public if the securities are registered. Disposal of these securities may involve time-consuming negotiations and expense, and prompt sale at an acceptable price may be difficult. Information regarding restricted securities is included at the end of the Fund's Schedule of Investments.
Consolidated Subsidiary. The Fund invests in certain investments through a wholly-owned subsidiary ("Subsidiary"), which may be subject to federal and state taxes upon disposition.
As of period end, the Fund held an investment of $5,061,179 in this Subsidiary, representing .25% of the Fund's net assets. The financial statements have been consolidated and include accounts of the Fund and the Subsidiary. Accordingly, all inter-company transactions and balances have been eliminated.
Any cash held by the Subsidiary is restricted as to its use and is presented as Restricted cash in the Statement of Assets and Liabilities.
4. Derivative Instruments.
Risk Exposures and the Use of Derivative Instruments. The Fund's investment objective allows the Fund to enter into various types of derivative contracts, including options. Derivatives are investments whose value is primarily derived from underlying assets, indices or reference rates and may be transacted on an exchange or over-the-counter (OTC). Derivatives may involve a future commitment to buy or sell a specified asset based on specified terms, to exchange future cash flows at periodic intervals based on a notional principal amount, or for one party to make one or more payments upon the occurrence of specified events in exchange for periodic payments from the other party.
The Fund used derivatives to increase returns and to manage exposure to certain risks as defined below. The success of any strategy involving derivatives depends on analysis of numerous economic factors, and if the strategies for investment do not work as intended, the Fund may not achieve its objectives.
The Fund's use of derivatives increased or decreased its exposure to the following risk:
| Equity Risk | Equity risk relates to the fluctuations in the value of financial instruments as a result of changes in market prices (other than those arising from interest rate risk or foreign exchange risk), whether caused by factors specific to an individual investment, its issuer, or all factors affecting all instruments traded in a market or market segment.
|
The Fund is also exposed to additional risks from investing in derivatives, such as liquidity risk and counterparty credit risk. Liquidity risk is the risk that the Fund will be unable to close out the derivative in the open market in a timely manner. Counterparty credit risk is the risk that the counterparty will not be able to fulfill its obligation to the Fund. Derivative counterparty credit risk is managed through formal evaluation of the creditworthiness of all potential counterparties. On certain OTC derivatives such as options, the Fund attempts to reduce its exposure to counterparty credit risk by entering into an International Swaps and Derivatives Association, Inc. (ISDA) Master Agreement with each of its counterparties. The ISDA Master Agreement gives the Fund the right to terminate all transactions traded under such agreement upon the deterioration in the credit quality of the counterparty beyond specified levels. The ISDA Master Agreement gives each party the right, upon an event of default by the other party or a termination of the agreement, to close out all transactions traded under such agreement and to net amounts owed under each transaction to one net payable by one party to the other. To mitigate counterparty credit risk on bi-lateral OTC derivatives, the Fund receives collateral in the form of cash or securities once the Fund's net unrealized appreciation on outstanding derivative contracts under an ISDA Master Agreement exceeds certain applicable thresholds, subject to certain minimum transfer provisions. The collateral received is held in segregated accounts with the Fund's custodian bank in accordance with the collateral agreements entered into between the Fund, the counterparty and the Fund's custodian bank. The Fund could experience delays and costs in gaining access to the collateral even though it is held by the Fund's custodian bank. The Fund's maximum risk of loss from counterparty credit risk related to bi-lateral OTC derivatives is generally the aggregate unrealized appreciation and unpaid counterparty payments in excess of any collateral pledged by the counterparty to the Fund. The Fund may be required to pledge collateral for the benefit of the counterparties on bi-lateral OTC derivatives in an amount not less than each counterparty's unrealized appreciation on outstanding derivative contracts, subject to certain minimum transfer provisions, and any such pledged collateral is identified in the Schedule of Investments. Counterparty credit risk related to exchange-traded options may be mitigated by the protection provided by the exchange on which they trade.
Investing in derivatives may involve greater risks than investing in the underlying assets directly and, to varying degrees, may involve risk of loss in excess of any initial investment and collateral received and amounts recognized in the Statement of Assets and Liabilities. In addition, there may be the risk that the change in value of the derivative contract does not correspond to the change in value of the underlying instrument.
Options. Options give the purchaser the right, but not the obligation, to buy (call) or sell (put) an underlying security or financial instrument at an agreed exercise or strike price between or on certain dates. Options obligate the seller (writer) to buy (put) or sell (call) an underlying instrument at the exercise or strike price or cash settle an underlying derivative instrument if the holder exercises the option on or before the expiration date.
The Fund used exchange-traded and OTC written covered call options to manage its exposure to the market. When the Fund writes a covered call option, the Fund holds the underlying instrument which must be delivered to the holder upon the exercise of the option.
Upon entering into a written options contract, the Fund will receive a premium. Premiums received are reflected as a liability on the Statement of Assets and Liabilities. Options are valued daily and any unrealized appreciation (depreciation) is reflected on the Statement of Assets and Liabilities. When a written option is exercised, the premium is added to the proceeds from the sale of the underlying instrument in determining the gain or loss realized on that investment. When an option is closed the Fund will realize a gain or loss depending on whether the proceeds or amount paid for the closing sale transaction are greater or less than the premium received. When an option expires, gains and losses are realized to the extent of premiums received. The net realized gain (loss) on closed and expired written options and the change in net unrealized appreciation (depreciation) on written options are presented in the Statement of Operations.
Writing call options tends to decrease exposure to the underlying instrument and risk of loss is the change in value in excess of the premium received.
Any open options at period end are presented in the Schedule of Investments under the caption "Written Options" and are representative of volume of activity during the period.
5. Purchases and Sales of Investments.
Purchases and sales of securities, other than short-term securities, aggregated $899,940,909 and $1,229,414,666, respectively.
6. Fees and Other Transactions with Affiliates.
Management Fee. Fidelity Management & Research Company (the investment adviser) and its affiliates provide the Fund with investment management related services for which the Fund pays a monthly management fee. The management fee is the sum of an individual fund fee rate that is based on an annual rate of .20% of the Fund's average net assets and an annualized group fee rate that averaged .24% during the period. The group fee rate is based upon the average net assets of all the mutual funds advised by the investment adviser, including any mutual funds previously advised by the investment adviser that are currently advised by Fidelity SelectCo, LLC, an affiliate of the investment adviser. The group fee rate decreases as assets under management increase and increases as assets under management decrease. For the reporting period, the total annual management fee rate was .44% of the Fund's average net assets.
Distribution and Service Plan Fees. In accordance with Rule 12b-1 of the 1940 Act, the Fund has adopted separate Distribution and Service Plans for each class of shares. Certain classes pay Fidelity Distributors Corporation (FDC), an affiliate of the investment adviser, separate Distribution and Service Fees, each of which is based on an annual percentage of each class' average net assets. In addition, FDC may pay financial intermediaries for selling shares of the Fund and providing shareholder support services. For the period, the Distribution and Service Fee rates, total fees and amounts retained by FDC were as follows:
| | Distribution Fee | Service Fee | Total Fees | Retained by FDC |
| Class A | -% | .25% | $154,726 | $6,739 |
| Class M | .25% | .25% | 140,024 | 376 |
| Class C | .75% | .25% | 341,704 | 35,842 |
| | | | $636,454 | $ 42,957 |
Sales Load. FDC may receive a front-end sales charge of up to 5.75% for selling Class A shares and 3.50% for selling Class M shares, some of which is paid to financial intermediaries for selling shares of the Fund. Depending on the holding period, FDC may receive contingent deferred sales charges levied on Class A, Class M and Class C redemptions. The deferred sales charges are 1.00% for Class C shares, 1.00% for certain purchases of Class A shares and .25% for certain purchases of Class M shares.
For the period, sales charge amounts retained by FDC were as follows:
| | Retained by FDC |
| Class A | $26,542 |
| Class M | 2,683 |
| Class C(a) | 2,009 |
| | $31,234 |
(a) When Class C shares are initially sold, FDC pays commissions from its own resources to financial intermediaries through which the sales are made.
Transfer Agent Fees. Fidelity Investments Institutional Operations Company, Inc., (FIIOC), an affiliate of the investment adviser, is the transfer, dividend disbursing and shareholder servicing agent for each class of the Fund. FIIOC receives account fees and asset-based fees that vary according to the account size and type of account of the shareholders of the respective classes of the Fund, except for Class Z. FIIOC receives an asset-based fee of Class Z's average net assets. FIIOC pays for typesetting, printing and mailing of shareholder reports, except proxy statements.
For the period, transfer agent fees for each class were as follows:
| | Amount | % of Class-Level Average Net Assets |
| Class A | $123,723 | .20 |
| Class M | 57,225 | .20 |
| Class C | 67,781 | .20 |
| Mega Cap Stock | 3,448,685 | .20 |
| Class I | 274,939 | .18 |
| Class Z | 127,297 | .05 |
| | $4,099,650 | |
Accounting and Security Lending Fees. Fidelity Service Company, Inc. (FSC), an affiliate of the investment adviser, maintains the Fund's accounting records. The accounting fee is based on the level of average net assets for each month. Under a separate contract, FSC administers the security lending program. The security lending fee is based on the number and duration of lending transactions. For the period, the fees were equivalent to an annual rate of .03%.
Brokerage Commissions. The Fund placed a portion of its portfolio transactions with brokerage firms which are affiliates of the investment adviser. Brokerage commissions are included in net realized gain (loss) and change in net unrealized appreciation (depreciation) in the Statement of Operations. The commissions paid to these affiliated firms were $12,963 for the period.
Interfund Lending Program. Pursuant to an Exemptive Order issued by the SEC, the Fund, along with other registered investment companies having management contracts with Fidelity Management & Research Company (FMR) or other affiliated entities of FMR, may participate in an interfund lending program. This program provides an alternative credit facility allowing the funds to borrow from, or lend money to, other participating affiliated funds. At period end, there were no interfund loans outstanding. The Fund's activity in this program during the period for which loans were outstanding was as follows:
| Borrower or Lender | Average Loan Balance | Weighted Average Interest Rate | Interest Expense |
| Borrower | $16,479,385 | 1.63% | $19,432 |
Interfund Trades. The Fund may purchase from or sell securities to other Fidelity Funds under procedures adopted by the Board. The procedures have been designed to ensure these interfund trades are executed in accordance with Rule 17a-7 of the 1940 Act. Interfund trades are included within the respective purchases and sales amounts shown in the Purchases and Sales of Investments note.
Other. During the period, the investment adviser reimbursed the Fund for certain losses in the amount of $5,369.
7. Committed Line of Credit.
The Fund participates with other funds managed by the investment adviser or an affiliate in a $4.25 billion credit facility (the "line of credit") to be utilized for temporary or emergency purposes to fund shareholder redemptions or for other short-term liquidity purposes. The Fund has agreed to pay commitment fees on its pro-rata portion of the line of credit, which amounted to $6,930 and is reflected in Miscellaneous expenses on the Statement of Operations. During the period, the Fund did not borrow on this line of credit.
8. Security Lending.
The Fund lends portfolio securities through a lending agent from time to time in order to earn additional income. For equity securities, a lending agent is used and may loan securities to certain qualified borrowers, including Fidelity Capital Markets (FCM), a broker-dealer affiliated with the Fund. On the settlement date of the loan, the Fund receives collateral (in the form of U.S. Treasury obligations, letters of credit and/or cash) against the loaned securities and maintains collateral in an amount not less than 100% of the market value of the loaned securities during the period of the loan. The market value of the loaned securities is determined at the close of business of the Fund and any additional required collateral is delivered to the Fund on the next business day. The Fund or borrower may terminate the loan at any time, and if the borrower defaults on its obligation to return the securities loaned because of insolvency or other reasons, the Fund may apply collateral received from the borrower against the obligation. The Fund may experience delays and costs in recovering the securities loaned. Any cash collateral received is invested in the Fidelity Securities Lending Cash Central Fund. The value of loaned securities and cash collateral at period end are disclosed on the Fund's Statement of Assets and Liabilities. At period end, there were no security loans outstanding with FCM. Security lending income represents the income earned on investing cash collateral, less rebates paid to borrowers and any lending agent fees associated with the loan, plus any premium payments received for lending certain types of securities. Security lending income is presented in the Statement of Operations as a component of income from Fidelity Central Funds. Total security lending income during the period amounted to $69,639, including $9,575 from securities loaned to FCM.
9. Expense Reductions.
Commissions paid to certain brokers with whom the investment adviser, or its affiliates, places trades on behalf of the Fund include an amount in addition to trade execution, which may be rebated back to the Fund to offset certain expenses. This amount totaled $73,480 for the period. Through arrangements with the Fund's custodian, credits realized as a result of certain uninvested cash balances were used to reduce the Fund's expenses. During the period, these credits reduced the Fund's custody expenses by $4,152.
In addition, during the period the investment adviser reimbursed and/or waived a portion of fund-level operating expenses in the amount of $29,025.
10. Distributions to Shareholders.
Distributions to shareholders of each class were as follows:
| | Year ended
June 30, 2018 | Year ended
June 30, 2017 |
| From net investment income | | |
| Class A | $797,191 | $899,180 |
| Class M | 298,321 | 291,257 |
| Class C | 202,655 | 185,391 |
| Mega Cap Stock | 25,922,911 | 48,569,058 |
| Class I | 2,395,397 | 2,230,910 |
| Class Z | 5,718,363 | 40,402 |
| Total | $35,334,838 | $52,216,198 |
| From net realized gain | | |
| Class A | $8,451,193 | $344,305 |
| Class M | 3,919,910 | 137,941 |
| Class C | 4,788,475 | 163,362 |
| Mega Cap Stock | 224,982,442 | 15,922,546 |
| Class I | 21,104,231 | 711,666 |
| Class Z | 45,343,842 | 11,608 |
| Total | $308,590,093 | $17,291,428 |
11. Share Transactions.
Share transactions for each class were as follows and may contain automatic conversions between classes or exchanges between affiliated funds:
| | Shares | Shares | Dollars | Dollars |
| | Year ended June 30, 2018 | Year ended June 30, 2017 | Year ended June 30, 2018 | Year ended June 30, 2017 |
| Class A | | | | |
| Shares sold | 874,212 | 1,038,892 | $15,067,671 | $18,074,597 |
| Reinvestment of distributions | 559,999 | 70,692 | 9,205,183 | 1,204,625 |
| Shares redeemed | (1,116,309) | (2,254,920) | (19,199,830) | (39,387,612) |
| Net increase (decrease) | 317,902 | (1,145,336) | $5,073,024 | $(20,108,390) |
| Class M | | | | |
| Shares sold | 150,897 | 351,517 | $2,604,152 | $6,011,579 |
| Reinvestment of distributions | 255,533 | 24,971 | 4,196,932 | 425,997 |
| Shares redeemed | (414,715) | (523,179) | (7,130,591) | (8,962,447) |
| Net increase (decrease) | (8,285) | (146,691) | $(329,507) | $(2,524,871) |
| Class C | | | | |
| Shares sold | 194,437 | 321,807 | $3,315,957 | $5,527,295 |
| Reinvestment of distributions | 306,537 | 20,217 | 4,962,564 | 342,413 |
| Shares redeemed | (411,860) | (518,468) | (7,044,158) | (8,770,183) |
| Net increase (decrease) | 89,114 | (176,444) | $1,234,363 | $(2,900,475) |
| Mega Cap Stock | | | | |
| Shares sold | 30,261,141 | 37,223,324 | $526,149,849 | $643,884,050 |
| Reinvestment of distributions | 14,397,242 | 3,517,132 | 239,269,740 | 60,338,870 |
| Shares redeemed | (33,576,247) | (148,979,826) | (587,646,893) | (2,654,363,774) |
| Net increase (decrease) | 11,082,136 | (108,239,370) | $177,772,696 | $(1,950,140,854) |
| Class I | | | | |
| Shares sold | 1,353,002 | 1,883,800 | $23,702,795 | $33,590,247 |
| Reinvestment of distributions | 1,407,682 | 170,239 | 23,366,927 | 2,921,152 |
| Shares redeemed | (2,838,061) | (3,246,889) | (49,414,486) | (56,705,836) |
| Net increase (decrease) | (77,377) | (1,192,850) | $(2,344,764) | $(20,194,437) |
| Class Z | | | | |
| Shares sold | 4,063,436 | 17,352,586 | $69,724,386 | $316,033,855 |
| Reinvestment of distributions | 1,742,762 | 3,045 | 28,819,243 | 52,010 |
| Shares redeemed | (18,308,914) | (320,945) | (307,407,172) | (5,787,246) |
| Net increase (decrease) | (12,502,716) | 17,034,686 | $(208,863,543) | $310,298,619 |
12. Other.
The Fund's organizational documents provide former and current trustees and officers with a limited indemnification against liabilities arising in connection with the performance of their duties to the Fund. In the normal course of business, the Fund may also enter into contracts that provide general indemnifications. The Fund's maximum exposure under these arrangements is unknown as this would be dependent on future claims that may be made against the Fund. The risk of material loss from such claims is considered remote.
Report of Independent Registered Public Accounting Firm
To the Board of Trustees of Fidelity Hastings Street Trust and Shareholders of Fidelity Mega Cap Stock Fund:
Opinion on the Financial Statements
We have audited the accompanying statement of assets and liabilities, including the schedule of investments, of Fidelity Mega Cap Stock Fund (one of the funds constituting Fidelity Hastings Street Trust, referred to hereafter as the "Fund") as of June 30, 2018, the related statement of operations for the year ended June 30, 2018, the statement of changes in net assets for each of the two years in the period ended June 30, 2018, including the related notes, and the financial highlights for each of the periods indicated therein (collectively referred to as the “financial statements”). In our opinion, the financial statements present fairly, in all material respects, the financial position of the Fund as of June 30, 2018, the results of its operations for the year then ended, the changes in its net assets for each of the two years in the period ended June 30, 2018 and the financial highlights for each of the periods indicated therein in conformity with accounting principles generally accepted in the United States of America.
Basis for Opinion
These financial statements are the responsibility of the Fund’s management. Our responsibility is to express an opinion on the Fund’s financial statements based on our audits. We are a public accounting firm registered with the Public Company Accounting Oversight Board (United States) (“PCAOB”) and are required to be independent with respect to the Fund in accordance with the U.S. federal securities laws and the applicable rules and regulations of the Securities and Exchange Commission and the PCAOB.
We conducted our audits of these financial statements in accordance with the standards of the PCAOB. Those standards require that we plan and perform the audit to obtain reasonable assurance about whether the financial statements are free of material misstatement, whether due to error or fraud.
Our audits included performing procedures to assess the risks of material misstatement of the financial statements, whether due to error or fraud, and performing procedures that respond to those risks. Such procedures included examining, on a test basis, evidence regarding the amounts and disclosures in the financial statements. Our audits also included evaluating the accounting principles used and significant estimates made by management, as well as evaluating the overall presentation of the financial statements. Our procedures included confirmation of securities owned as of June 30, 2018 by correspondence with the custodian, and brokers; when replies were not received from brokers, we performed other auditing procedures. We believe that our audits provide a reasonable basis for our opinion.
PricewaterhouseCoopers LLP
Boston, Massachusetts
August 13, 2018
We have served as the auditor of one or more investment companies in the Fidelity group of funds since 1932.
Trustees and Officers
The Trustees, Members of the Advisory Board (if any), and officers of the trust and fund, as applicable, are listed below. The Board of Trustees governs the fund and is responsible for protecting the interests of shareholders. The Trustees are experienced executives who meet periodically throughout the year to oversee the fund's activities, review contractual arrangements with companies that provide services to the fund, oversee management of the risks associated with such activities and contractual arrangements, and review the fund's performance. Except for Michael E. Wiley, each of the Trustees oversees 284 funds. Mr. Wiley oversees 197 funds.
The Trustees hold office without limit in time except that (a) any Trustee may resign; (b) any Trustee may be removed by written instrument, signed by at least two-thirds of the number of Trustees prior to such removal; (c) any Trustee who requests to be retired or who has become incapacitated by illness or injury may be retired by written instrument signed by a majority of the other Trustees; and (d) any Trustee may be removed at any special meeting of shareholders by a two-thirds vote of the outstanding voting securities of the trust. Each Trustee who is not an interested person (as defined in the 1940 Act) of the trust and the fund is referred to herein as an Independent Trustee. Each Independent Trustee shall retire not later than the last day of the calendar year in which his or her 75th birthday occurs. The Independent Trustees may waive this mandatory retirement age policy with respect to individual Trustees. Officers and Advisory Board Members hold office without limit in time, except that any officer or Advisory Board Member may resign or may be removed by a vote of a majority of the Trustees at any regular meeting or any special meeting of the Trustees. Except as indicated, each individual has held the office shown or other offices in the same company for the past five years.
The fund’s Statement of Additional Information (SAI) includes more information about the Trustees. To request a free copy, call Fidelity at 1-877-208-0098.
Experience, Skills, Attributes, and Qualifications of the Trustees. The Governance and Nominating Committee has adopted a statement of policy that describes the experience, qualifications, attributes, and skills that are necessary and desirable for potential Independent Trustee candidates (Statement of Policy). The Board believes that each Trustee satisfied at the time he or she was initially elected or appointed a Trustee, and continues to satisfy, the standards contemplated by the Statement of Policy. The Governance and Nominating Committee also engages professional search firms to help identify potential Independent Trustee candidates who have the experience, qualifications, attributes, and skills consistent with the Statement of Policy. From time to time, additional criteria based on the composition and skills of the current Independent Trustees, as well as experience or skills that may be appropriate in light of future changes to board composition, business conditions, and regulatory or other developments, have also been considered by the professional search firms and the Governance and Nominating Committee. In addition, the Board takes into account the Trustees' commitment and participation in Board and committee meetings, as well as their leadership of standing and ad hoc committees throughout their tenure.
In determining that a particular Trustee was and continues to be qualified to serve as a Trustee, the Board has considered a variety of criteria, none of which, in isolation, was controlling. The Board believes that, collectively, the Trustees have balanced and diverse experience, qualifications, attributes, and skills, which allow the Board to operate effectively in governing the fund and protecting the interests of shareholders. Information about the specific experience, skills, attributes, and qualifications of each Trustee, which in each case led to the Board's conclusion that the Trustee should serve (or continue to serve) as a trustee of the fund, is provided below.
Board Structure and Oversight Function. James C. Curvey is an interested person and currently serves as Chairman. The Trustees have determined that an interested Chairman is appropriate and benefits shareholders because an interested Chairman has a personal and professional stake in the quality and continuity of services provided to the fund. Independent Trustees exercise their informed business judgment to appoint an individual of their choosing to serve as Chairman, regardless of whether the Trustee happens to be independent or a member of management. The Independent Trustees have determined that they can act independently and effectively without having an Independent Trustee serve as Chairman and that a key structural component for assuring that they are in a position to do so is for the Independent Trustees to constitute a substantial majority for the Board. The Independent Trustees also regularly meet in executive session. Ned C. Lautenbach serves as Chairman of the Independent Trustees and as such (i) acts as a liaison between the Independent Trustees and management with respect to matters important to the Independent Trustees and (ii) with management prepares agendas for Board meetings.
Fidelity® funds are overseen by different Boards of Trustees. The fund's Board oversees Fidelity's high income and certain equity funds, and other Boards oversee Fidelity's investment-grade bond, money market, asset allocation, and other equity funds. The asset allocation funds may invest in Fidelity® funds overseen by the fund's Board. The use of separate Boards, each with its own committee structure, allows the Trustees of each group of Fidelity® funds to focus on the unique issues of the funds they oversee, including common research, investment, and operational issues. On occasion, the separate Boards establish joint committees to address issues of overlapping consequences for the Fidelity® funds overseen by each Board.
The Trustees operate using a system of committees to facilitate the timely and efficient consideration of all matters of importance to the Trustees, the fund, and fund shareholders and to facilitate compliance with legal and regulatory requirements and oversight of the fund's activities and associated risks. The Board, acting through its committees, has charged FMR and its affiliates with (i) identifying events or circumstances the occurrence of which could have demonstrably adverse effects on the fund's business and/or reputation; (ii) implementing processes and controls to lessen the possibility that such events or circumstances occur or to mitigate the effects of such events or circumstances if they do occur; and (iii) creating and maintaining a system designed to evaluate continuously business and market conditions in order to facilitate the identification and implementation processes described in (i) and (ii) above. Because the day-to-day operations and activities of the fund are carried out by or through FMR, its affiliates, and other service providers, the fund's exposure to risks is mitigated but not eliminated by the processes overseen by the Trustees. While each of the Board's committees has responsibility for overseeing different aspects of the fund's activities, oversight is exercised primarily through the Operations, Audit, and Compliance Committees. In addition, the Independent Trustees have worked with Fidelity to enhance the Board's oversight of investment and financial risks, legal and regulatory risks, technology risks, and operational risks, including the development of additional risk reporting to the Board. Appropriate personnel, including but not limited to the fund's Chief Compliance Officer (CCO), FMR's internal auditor, the independent accountants, the fund's Treasurer and portfolio management personnel, make periodic reports to the Board's committees, as appropriate, including an annual review of Fidelity's risk management program for the Fidelity® funds. The responsibilities of each standing committee, including their oversight responsibilities, are described further under "Standing Committees of the Trustees."
Interested Trustees*:
Correspondence intended for a Trustee who is an interested person may be sent to Fidelity Investments, 245 Summer Street, Boston, Massachusetts 02210.
Name, Year of Birth; Principal Occupations and Other Relevant Experience+
James C. Curvey (1935)
Year of Election or Appointment: 2007
Trustee
Chairman of the Board of Trustees
Mr. Curvey also serves as Trustee of other Fidelity® funds. Mr. Curvey is Vice Chairman (2007-present) and Director of FMR LLC (diversified financial services company). In addition, Mr. Curvey is an Overseer Emeritus for the Boston Symphony Orchestra, a Director of Artis-Naples, and a Trustee of Brewster Academy in Wolfeboro, New Hampshire. Previously, Mr. Curvey served as a Director of Fidelity Research & Analysis Co. (investment adviser firm, 2009-2018), Director of Fidelity Investments Money Management, Inc. (investment adviser firm, 2009-2014) and a Director of FMR and FMR Co., Inc. (investment adviser firms, 2007-2014).
Charles S. Morrison (1960)
Year of Election or Appointment: 2014
Trustee
Mr. Morrison also serves as Trustee of other funds. He serves as President of Fidelity SelectCo, LLC (investment adviser firm, 2017-present) and Fidelity Management & Research Company (FMR) (investment adviser firm, 2016-present), a Director of Fidelity Investments Money Management, Inc. (FIMM) (investment adviser firm, 2014-present), Director of Fidelity SelectCo, LLC (investment adviser firm, 2014-present), President, Asset Management (2014-present), and is an employee of Fidelity Investments. Previously, Mr. Morrison served as Vice President of Fidelity's Fixed Income and Asset Allocation Funds (2012-2014), President, Fixed Income (2011-2014), Vice President of Fidelity's Money Market Funds (2005-2009), President, Money Market Group Leader of FMR (investment adviser firm, 2009), and Senior Vice President, Money Market Group of FMR (2004-2009). Mr. Morrison also served as Vice President of Fidelity's Bond Funds (2002-2005), certain Balanced Funds (2002-2005), and certain Asset Allocation Funds (2002-2007), and as Senior Vice President (2002-2005) of Fidelity's Bond Division.
* Determined to be an “Interested Trustee” by virtue of, among other things, his or her affiliation with the trust or various entities under common control with FMR.
+ The information includes the Trustee's principal occupation during the last five years and other information relating to the experience, attributes, and skills relevant to the Trustee's qualifications to serve as a Trustee, which led to the conclusion that the Trustee should serve as a Trustee for the fund.
Independent Trustees:
Correspondence intended for an Independent Trustee may be sent to Fidelity Investments, P.O. Box 55235, Boston, Massachusetts 02205-5235.
Name, Year of Birth; Principal Occupations and Other Relevant Experience+
Dennis J. Dirks (1948)
Year of Election or Appointment: 2005
Trustee
Mr. Dirks also serves as Trustee of other Fidelity® funds. Prior to his retirement in May 2003, Mr. Dirks was Chief Operating Officer and a member of the Board of The Depository Trust & Clearing Corporation (DTCC). He also served as President, Chief Operating Officer, and Board member of The Depository Trust Company (DTC) and President and Board member of the National Securities Clearing Corporation (NSCC). In addition, Mr. Dirks served as Chief Executive Officer and Board member of the Government Securities Clearing Corporation, Chief Executive Officer and Board member of the Mortgage-Backed Securities Clearing Corporation, as a Trustee and a member of the Finance Committee of Manhattan College (2005-2008), as a Trustee and a member of the Finance Committee of AHRC of Nassau County (2006-2008), as a member of the Independent Directors Council (IDC) Governing Council (2010-2015), and as a member of the Board of Directors for The Brookville Center for Children’s Services, Inc. (2009-2017). Mr. Dirks is a member of the Finance Committee (2016-present), Board of Directors (2017-present) and Board of Trustees (2018-present) and is Treasurer (2018-present) of the Asolo Repertory Theatre.
Donald F. Donahue (1950)
Year of Election or Appointment: 2018
Trustee
Mr. Donahue also serves as a Trustee of other Fidelity® funds. Mr. Donahue is President and Chief Executive Officer of Miranda Partners, LLC (risk consulting for the financial services industry, 2012-present). Previously, Mr. Donahue served as a Member of the Advisory Board of certain Fidelity® funds (2015-2018) and Chief Executive Officer (2006-2012), Chief Operating Officer (2003-2006), and Managing Director, Customer Marketing and Development (1999-2003) of The Depository Trust & Clearing Corporation (financial markets infrastructure). Mr. Donahue serves as a Member (2007-present) and Co-Chairman (2016-present) of the Board of Directors of United Way of New York, Member of the Board of Directors of NYC Leadership Academy (2012-present) and Member of the Board of Advisors of Ripple Labs, Inc. (financial services, 2015-present). He also served as Chairman (2010-2012) and Member of the Board of Directors (2012-2013) of Omgeo, LLC (financial services), Treasurer of United Way of New York (2012-2016), and Member of the Board of Directors of XBRL US (financial services non-profit, 2009-2012) and the International Securities Services Association (2009-2012).
Alan J. Lacy (1953)
Year of Election or Appointment: 2008
Trustee
Mr. Lacy also serves as Trustee of other Fidelity® funds. Mr. Lacy serves as a Director of Bristol-Myers Squibb Company (global pharmaceuticals, 2008-present). He is a Trustee of the California Chapter of The Nature Conservancy (2015-present) and a Director of the Center for Advanced Study in the Behavioral Sciences at Stanford University (2015-present). In addition, Mr. Lacy served as Senior Adviser (2007-2014) of Oak Hill Capital Partners, L.P. (private equity) and also served as Chief Executive Officer (2005) and Vice Chairman (2005-2006) of Sears Holdings Corporation (retail) and Chief Executive Officer and Chairman of the Board of Sears, Roebuck and Co. (retail, 2000-2005). Previously, Mr. Lacy served as Chairman (2014-2017) and a member (2010-2017) of the Board of Directors of Dave & Buster’s Entertainment, Inc. (restaurant and entertainment complexes), as Chairman (2008-2011) and a member (2006-2015) of the Board of Trustees of the National Parks Conservation Association, and as a member of the Board of Directors for The Hillman Companies, Inc. (hardware wholesalers, 2010-2014), Earth Fare, Inc. (retail grocery, 2010-2014), and The Western Union Company (global money transfer, 2006-2011).
Ned C. Lautenbach (1944)
Year of Election or Appointment: 2000
Trustee
Chairman of the Independent Trustees
Mr. Lautenbach also serves as Trustee of other Fidelity® funds. Mr. Lautenbach currently serves as Vice Chair of the Board of Governors, State University System of Florida (2013-present) and is a member of the Council on Foreign Relations (1994-present). He is also a member and has most recently served as Chairman of the Board of Directors of Artis-Naples (2012-present). Previously, Mr. Lautenbach served as a member and then Lead Director of the Board of Directors of Eaton Corporation (diversified industrial, 1997-2016). He was also a Partner and Advisory Partner at Clayton, Dubilier & Rice, LLC (private equity investment, 1998-2010), as well as a Director of Sony Corporation (2006-2007). In addition, Mr. Lautenbach also had a 30-year career with IBM (technology company) during which time he served as Senior Vice President and a member of the Corporate Executive Committee (1968-1998).
Joseph Mauriello (1944)
Year of Election or Appointment: 2008
Trustee
Mr. Mauriello also serves as Trustee of other Fidelity® funds. Prior to his retirement in January 2006, Mr. Mauriello served in numerous senior management positions including Deputy Chairman and Chief Operating Officer (2004-2005), and Vice Chairman of Financial Services (2002-2004) of KPMG LLP US (professional services, 1965-2005). Mr. Mauriello currently serves as a member of the Board of Directors of XL Group plc. (global insurance and re-insurance, 2006-present) and the Independent Directors Council (IDC) Governing Council (2015-present). Previously, Mr. Mauriello served as a Director of the Hamilton Funds of the Bank of New York (2006-2007) and of Arcadia Resources Inc. (health care services and products, 2007-2012).
Cornelia M. Small (1944)
Year of Election or Appointment: 2005
Trustee
Ms. Small also serves as Trustee of other Fidelity® funds. Ms. Small is a member of the Board of Directors (2009-present) and Chair of the Investment Committee (2010-present) of the Teagle Foundation. Ms. Small also serves on the Investment Committee of the Berkshire Taconic Community Foundation (2008-present). Previously, Ms. Small served as Chairperson (2002-2008) and a member of the Investment Committee and Chairperson (2008-2012) and a member of the Board of Trustees of Smith College. In addition, Ms. Small served as Chief Investment Officer, Director of Global Equity Investments, and a member of the Board of Directors of Scudder, Stevens & Clark and Scudder Kemper Investments.
Garnett A. Smith (1947)
Year of Election or Appointment: 2018
Trustee
Mr. Smith also serves as Trustee of other Fidelity® funds. Prior to Mr. Smith's retirement, he served as Chairman and Chief Executive Officer of Inbrand Corp. (manufacturer of personal absorbent products, 1990-1997). He also served as President (1986-1990) of Inbrand Corp. Prior to his employment with Inbrand Corp., he was employed by a retail fabric chain and North Carolina National Bank. In addition, Mr. Smith served as a Member of the Advisory Board of certain Fidelity® funds (2012-2013) and as a board member of the Jackson Hole Land Trust (2009-2012).
David M. Thomas (1949)
Year of Election or Appointment: 2008
Trustee
Mr. Thomas also serves as Trustee of other Fidelity® funds. Mr. Thomas serves as Non-Executive Chairman of the Board of Directors of Fortune Brands Home and Security (home and security products, 2011-present), as a member of the Board of Directors (2004-present) and Presiding Director (2013-present) of Interpublic Group of Companies, Inc. (marketing communication), and as a member of the Board of Trustees of the University of Florida (2013-present). Previously, Mr. Thomas served as Executive Chairman (2005-2006) and Chairman and Chief Executive Officer (2000-2005) of IMS Health, Inc. (pharmaceutical and healthcare information solutions), and a Director of Fortune Brands, Inc. (consumer products, 2000-2011).
Michael E. Wiley (1950)
Year of Election or Appointment: 2018
Trustee
Mr. Wiley also serves as Trustee or Member of the Advisory Board of other Fidelity® funds. Mr. Wiley serves as a Director of Andeavor Corporation (independent oil refiner and marketer, 2005-present), a Director of Andeavor Logistics LP (natural resources logistics, 2015-present), and a Director of Bill Barrett Corporation (exploration and production, 2005-present). In addition, Mr. Wiley also serves as a Director of Post Oak Bank (privately-held bank, 2004-present). Previously, Mr. Wiley served as a Trustee of other Fidelity® funds (2008-2013), as a Director of Asia Pacific Exploration Consolidated (international oil and gas exploration and production, 2008-2013), as a member of the Board of Trustees of the University of Tulsa (2000-2006; 2007-2010), as a Senior Energy Advisor of Katzenbach Partners, LLC (consulting, 2006-2007), as an Advisory Director of Riverstone Holdings (private investment), Chairman, President, and CEO of Baker Hughes, Inc. (oilfield services, 2000-2004), and as Director of Spinnaker Exploration Company (exploration and production, 2001-2005).
+ The information includes the Trustee's principal occupation during the last five years and other information relating to the experience, attributes, and skills relevant to the Trustee's qualifications to serve as a Trustee, which led to the conclusion that the Trustee should serve as a Trustee for the fund.
Advisory Board Members and Officers:
Correspondence intended for a Member of the Advisory Board (if any) may be sent to Fidelity Investments, P.O. Box 55235, Boston, Massachusetts 02205-5235. Correspondence intended for an officer or Peter S. Lynch may be sent to Fidelity Investments, 245 Summer Street, Boston, Massachusetts 02210. Officers appear below in alphabetical order.
Name, Year of Birth; Principal Occupation
Peter S. Lynch (1944)
Year of Election or Appointment: 2003
Member of the Advisory Board
Mr. Lynch also serves as Member of the Advisory Board of other Fidelity® funds. Mr. Lynch is Vice Chairman and a Director of FMR (investment adviser firm) and FMR Co., Inc. (investment adviser firm). In addition, Mr. Lynch serves as a Trustee of Boston College and as the Chairman of the Inner-City Scholarship Fund. Previously, Mr. Lynch served on the Special Olympics International Board of Directors (1997-2006).
William S. Stavropoulos (1939)
Year of Election or Appointment: 2018
Member of the Advisory Board
Mr. Stavropoulos also serves as Member of the Advisory Board of other Fidelity® funds. Mr. Stavropoulos serves as President and Founder of the Michigan Baseball Foundation, the Great Lakes Loons (2007-present). Mr. Stavropoulos is Chairman Emeritus of the Board of Directors of The Dow Chemical Company, where he previously served in numerous senior management positions, including President, CEO (1995-2000; 2002-2004), Chairman of the Executive Committee (2000-2006), and as a member of the Board of Directors (1990-2006). Currently, Mr. Stavropoulos is Chairman of the Board of Directors of Univar Inc. (global distributor of commodity and specialty chemicals), a Director of Teradata Corporation (data warehousing and technology solutions), and a member of the Advisory Board for Metalmark Capital LLC (private equity investment, 2005-present). Mr. Stavropoulos is an operating advisor to Clayton, Dubilier & Rice, LLC (private equity investment). In addition, Mr. Stavropoulos is a member of the University of Notre Dame Advisory Council for the College of Science, a Trustee of the Rollin L. Gerstacker Foundation, and a Director of Artis-Naples in Naples, Florida. Previously, Mr. Stavropoulos served as Trustee of certain Fidelity® funds (2001-2018) and as a Director of Chemical Financial Corporation (bank holding company, 1993-2012) and Tyco International, Ltd. (multinational manufacturing and services, 2007-2012).
Carol B. Tomé (1957)
Year of Election or Appointment: 2018
Member of the Advisory Board
Ms. Tomé also serves as Member of the Advisory Board of other Fidelity® funds. Ms. Tomé is Chief Financial Officer (2001-present) and Executive Vice President of Corporate Services (2007-present) of The Home Depot, Inc. (home improvement retailer) and a Director (2003-present) and Chair of the Audit Committee (2004-present) of United Parcel Service, Inc. (package delivery and supply chain management). Previously, Ms. Tomé served as Trustee of certain Fidelity® funds (2017), Senior Vice President of Finance and Accounting/Treasurer (2000-2007) and Vice President and Treasurer (1995-2000) of The Home Depot, Inc. and Chair of the Board (2010-2012), Vice Chair of the Board (2009 and 2013), and a Director (2008-2013) of the Federal Reserve Bank of Atlanta. Ms. Tomé is also a director or trustee of many community and professional organizations.
Elizabeth Paige Baumann (1968)
Year of Election or Appointment: 2017
Anti-Money Laundering (AML) Officer
Ms. Baumann also serves as AML Officer of other funds. She is Chief AML Officer (2012-present) and Senior Vice President (2014-present) of FMR LLC (diversified financial services company) and is an employee of Fidelity Investments. Previously, Ms. Baumann served as AML Officer of the funds (2012-2016), and Vice President (2007-2014) and Deputy Anti-Money Laundering Officer (2007-2012) of FMR LLC.
Marc R. Bryant (1966)
Year of Election or Appointment: 2015
Secretary and Chief Legal Officer (CLO)
Mr. Bryant also serves as Secretary and CLO of other funds. Mr. Bryant serves as CLO, Secretary, and Senior Vice President of Fidelity Management & Research Company (investment adviser firm, 2015-present) and FMR Co., Inc. (investment adviser firm, 2015-present); Secretary of Fidelity SelectCo, LLC (investment adviser firm, 2015-present) and Fidelity Investments Money Management, Inc. (investment adviser firm, 2015-present); and CLO of Fidelity Management & Research (Hong Kong) Limited and FMR Investment Management (UK) Limited (investment adviser firms, 2015-present) and Fidelity Management & Research (Japan) Limited (investment adviser firm, 2016-present). He is Senior Vice President and Deputy General Counsel of FMR LLC (diversified financial services company). Previously, Mr. Bryant served as Secretary and CLO of Fidelity Rutland Square Trust II (2010-2014) and Assistant Secretary of Fidelity's Fixed Income and Asset Allocation Funds (2013-2015). Prior to joining Fidelity Investments, Mr. Bryant served as a Senior Vice President and the Head of Global Retail Legal for AllianceBernstein L.P. (2006-2010), and as the General Counsel for ProFund Advisors LLC (2001-2006).
John J. Burke III (1964)
Year of Election or Appointment: 2018
Chief Financial Officer
Mr. Burke also serves as Chief Financial Officer of other funds. Mr. Burke serves as Head of Investment Operations for Fidelity Fund and Investment Operations (2018-present) and is an employee of Fidelity Investments (1998-present). Previously Mr. Burke served as head of Asset Management Investment Operations (2012-2018).
William C. Coffey (1969)
Year of Election or Appointment: 2009
Assistant Secretary
Mr. Coffey also serves as Assistant Secretary of other funds. He is Senior Vice President and Deputy General Counsel of FMR LLC (diversified financial services company, 2010-present), and is an employee of Fidelity Investments. Previously, Mr. Coffey served as Vice President and Associate General Counsel of FMR LLC (2005-2009).
Timothy M. Cohen (1969)
Year of Election or Appointment: 2018
Vice President
Mr. Cohen also serves as Vice President of other funds. Mr. Cohen serves as Co-Head of Global Equity Research (2016-present), a Director of Fidelity Management & Research (Japan) Limited (investment adviser firm, 2016-present), and is an employee of Fidelity Investments. Previously, Mr. Cohen served as Chief Investment Officer - Equity and a Director of Fidelity Management & Research (U.K.) Inc. (investment adviser firm, 2013-2015) and as a Director of Fidelity Management & Research (Hong Kong) Limited (investment adviser firm, 2017).
Jonathan Davis (1968)
Year of Election or Appointment: 2010
Assistant Treasurer
Mr. Davis also serves as Assistant Treasurer of other funds. Mr. Davis serves as Assistant Treasurer of FMR Capital, Inc. (2017-present) and is an employee of Fidelity Investments. Previously, Mr. Davis served as Vice President and Associate General Counsel of FMR LLC (diversified financial services company, 2003-2010).
Adrien E. Deberghes (1967)
Year of Election or Appointment: 2016
Assistant Treasurer
Mr. Deberghes also serves as an officer of other funds. He serves as Assistant Treasurer of FMR Capital, Inc. (2017-present), Executive Vice President of Fidelity Investments Money Management, Inc. (FIMM) (investment adviser firm, 2016-present), and is an employee of Fidelity Investments (2008-present). Previously, Mr. Deberghes served as President and Treasurer of certain Fidelity® funds (2013-2018). Prior to joining Fidelity Investments, Mr. Deberghes was Senior Vice President of Mutual Fund Administration at State Street Corporation (2007-2008), Senior Director of Mutual Fund Administration at Investors Bank & Trust (2005-2007), and Director of Finance for Dunkin' Brands (2000-2005). Previously, Mr. Deberghes served in other fund officer roles.
Laura M. Del Prato (1964)
Year of Election or Appointment: 2018
Assistant Treasurer
Ms. Del Prato also serves as an officer of other funds. Ms. Del Prato is an employee of Fidelity Investments (2017-present). Prior to joining Fidelity Investments, Ms. Del Prato served as a Managing Director and Treasurer of the JPMorgan Mutual Funds (2014-2017). Prior to JPMorgan, Ms. Del Prato served as a partner at Cohen Fund Audit Services (accounting firm, 2012-2013) and KPMG LLP (accounting firm, 2004-2012).
Colm A. Hogan (1973)
Year of Election or Appointment: 2016
Deputy Treasurer
Mr. Hogan also serves as an officer of other funds. Mr. Hogan serves as Assistant Treasurer of FMR Capital, Inc. (2017-present) and is an employee of Fidelity Investments (2005-present). Previously, Mr. Hogan served as Assistant Treasurer of certain Fidelity® funds (2016-2018).
Pamela R. Holding (1964)
Year of Election or Appointment: 2018
Vice President
Ms. Holding also serves as a Vice President of other funds. Ms. Holding serves as Co-Head of Global Equity Research (2018-present) and is an employee of Fidelity Investments (2013-present).
Chris Maher (1972)
Year of Election or Appointment: 2013
Assistant Treasurer
Mr. Maher serves as Assistant Treasurer of other funds. Mr. Maher is Vice President of Valuation Oversight, serves as Assistant Treasurer of FMR Capital, Inc. (2017-present), and is an employee of Fidelity Investments. Previously, Mr. Maher served as Vice President of Asset Management Compliance (2013), Vice President of the Program Management Group of FMR (investment adviser firm, 2010-2013), and Vice President of Valuation Oversight (2008-2010).
Rieco E. Mello (1969)
Year of Election or Appointment: 2017
Assistant Treasurer
Mr. Mello also serves as Assistant Treasurer of other funds. Mr. Mello serves as Assistant Treasurer of FMR Capital, Inc. (2017-present) and is an employee of Fidelity Investments (1995-present).
Kenneth B. Robins (1969)
Year of Election or Appointment: 2016
Chief Compliance Officer
Mr. Robins also serves as an officer of other funds. Mr. Robins serves as Compliance Officer of Fidelity Management & Research Company and FMR Co., Inc. (investment adviser firms, 2016-present) and is an employee of Fidelity Investments (2004-present). Previously, Mr. Robins served as Executive Vice President of Fidelity Investments Money Management, Inc. (investment adviser firm, 2013-2016) and served in other fund officer roles.
Stacie M. Smith (1974)
Year of Election or Appointment: 2016
President and Treasurer
Ms. Smith also serves as an officer of other funds. Ms. Smith serves as Assistant Treasurer of FMR Capital, Inc. (2017-present), is an employee of Fidelity Investments (2009-present), and has served in other fund officer roles. Prior to joining Fidelity Investments, Ms. Smith served as Senior Audit Manager of Ernst & Young LLP (accounting firm, 1996-2009). Previously, Ms. Smith served as Assistant Treasurer (2013-2018) and Deputy Treasurer (2013-2016) of certain Fidelity® funds.
Marc L. Spector (1972)
Year of Election or Appointment: 2016
Assistant Treasurer
Mr. Spector also serves as an officer of other funds. Mr. Spector serves as Assistant Treasurer of FMR Capital, Inc. (2017-present) and is an employee of Fidelity Investments (2016-present). Prior to joining Fidelity Investments, Mr. Spector served as Director at the Siegfried Group (accounting firm, 2013-2016), and prior to Siegfried Group as audit senior manager at Deloitte & Touche (accounting firm, 2005-2013).
Renee Stagnone (1975)
Year of Election or Appointment: 2016
Assistant Treasurer
Ms. Stagnone also serves as an officer of other funds. Ms. Stagnone serves as Assistant Treasurer of FMR Capital, Inc. (2017-present) and is an employee of Fidelity Investments (1997-present). Previously, Ms. Stagnone served as Deputy Treasurer of certain Fidelity® funds (2013-2016).
Shareholder Expense Example
As a shareholder of the Fund, you incur two types of costs: (1) transaction costs, including sales charges (loads) on purchase payments or redemption proceeds, and (2) ongoing costs, including management fees, distribution and/or service (12b-1) fees and other Fund expenses. This Example is intended to help you understand your ongoing costs (in dollars) of investing in the Fund and to compare these costs with the ongoing costs of investing in other mutual funds.
The Example is based on an investment of $1,000 invested at the beginning of the period and held for the entire period (January 1, 2018 to June 30, 2018).
Actual Expenses
The first line of the accompanying table for each class of the Fund provides information about actual account values and actual expenses. You may use the information in this line, together with the amount you invested, to estimate the expenses that you paid over the period. Simply divide your account value by $1,000.00 (for example, an $8,600 account value divided by $1,000.00 = 8.6), then multiply the result by the number in the first line for a class of the Fund under the heading entitled "Expenses Paid During Period" to estimate the expenses you paid on your account during this period. A small balance maintenance fee of $12.00 that is charged once a year may apply for certain accounts with a value of less than $2,000. This fee is not included in the table below. If it was, the estimate of expenses you paid during the period would be higher, and your ending account value lower, by this amount. In addition, the Fund, as a shareholder in the underlying Fidelity Central Funds, will indirectly bear its pro-rata share of the fees and expenses incurred by the underlying Fidelity Central Funds. These fees and expenses are not included in the Fund's annualized expense ratio used to calculate the expense estimate in the table below.
Hypothetical Example for Comparison Purposes
The second line of the accompanying table for each class of the Fund provides information about hypothetical account values and hypothetical expenses based on a Class' actual expense ratio and an assumed rate of return of 5% per year before expenses, which is not the Class' actual return. The hypothetical account values and expenses may not be used to estimate the actual ending account balance or expenses you paid for the period. You may use this information to compare the ongoing costs of investing in the Fund and other funds. To do so, compare this 5% hypothetical example with the 5% hypothetical examples that appear in the shareholder reports of the other funds. A small balance maintenance fee of $12.00 that is charged once a year may apply for certain accounts with a value of less than $2,000. This fee is not included in the table below. If it was, the estimate of expenses you paid during the period would be higher, and your ending account value lower, by this amount. In addition, the Fund, as a shareholder in the underlying Fidelity Central Funds, will indirectly bear its pro-rata share of the fees and expenses incurred by the underlying Fidelity Central Funds. These fees and expenses are not included in the Fund's annualized expense ratio used to calculate the expense estimate in the table below.
Please note that the expenses shown in the table are meant to highlight your ongoing costs only and do not reflect any transaction costs. Therefore, the second line of the table is useful in comparing ongoing costs only, and will not help you determine the relative total costs of owning different funds. In addition, if these transactional costs were included, your costs would have been higher.
| | Annualized Expense Ratio-A | Beginning
Account Value
January 1, 2018 | Ending
Account Value
June 30, 2018 | Expenses Paid
During Period-B
January 1, 2018
to June 30, 2018 |
| Class A | .93% | | | |
| Actual | | $1,000.00 | $1,004.10 | $4.62 |
| Hypothetical-C | | $1,000.00 | $1,020.18 | $4.66 |
| Class M | 1.19% | | | |
| Actual | | $1,000.00 | $1,002.30 | $5.91 |
| Hypothetical-C | | $1,000.00 | $1,018.89 | $5.96 |
| Class C | 1.68% | | | |
| Actual | | $1,000.00 | $1,000.00 | $8.33 |
| Hypothetical-C | | $1,000.00 | $1,016.46 | $8.40 |
| Mega Cap Stock | .67% | | | |
| Actual | | $1,000.00 | $1,005.20 | $3.33 |
| Hypothetical-C | | $1,000.00 | $1,021.47 | $3.36 |
| Class I | .66% | | | |
| Actual | | $1,000.00 | $1,005.20 | $3.28 |
| Hypothetical-C | | $1,000.00 | $1,021.52 | $3.31 |
| Class Z | .53% | | | |
| Actual | | $1,000.00 | $1,005.80 | $2.64 |
| Hypothetical-C | | $1,000.00 | $1,022.17 | $2.66 |
A Annualized expense ratio reflects expenses net of applicable fee waivers.
B Expenses are equal to each Class' annualized expense ratio, multiplied by the average account value over the period, multiplied by 181/365 (to reflect the one-half year period).
C 5% return per year before expenses
Distributions (Unaudited)
The Board of Trustees of Fidelity Mega Cap Stock Fund voted to pay to shareholders of record at the opening of business on record date, the following distributions per share derived from capital gains realized from sales of portfolio securities, and dividends derived from net investment income:
| | Pay Date | Record Date | Dividends | Capital Gains |
| Fidelity Mega Cap Stock Fund | | | | |
| Class A | 08/13/18 | 08/10/18 | $0.125 | $1.633 |
| Class M | 08/13/18 | 08/10/18 | $0.098 | $1.633 |
| Class C | 08/13/18 | 08/10/18 | $0.058 | $1.633 |
| Mega Cap Stock | 08/13/18 | 08/10/18 | $0.145 | $1.633 |
| Class I | 08/13/18 | 08/10/18 | $0.147 | $1.633 |
| Class Z | 08/13/18 | 08/10/18 | $0.153 | $1.633 |
The fund hereby designates as a capital gain dividend with respect to the taxable year ended June 30, 2018, $273,762,945, or, if subsequently determined to be different, the net capital gain of such year.
Class A, Class M, Class C, Mega Cap Stock, Class I and Class Z designate 100% of the dividends distributed in August and December during the fiscal year as qualifying for the dividends–received deduction for corporate shareholders.
Class A, Class M, Class C, Mega Cap Stock, Class I and Class Z designate 100% of the dividends distributed in August and December during the fiscal year as amounts which may be taken into account as a dividend for purposes of the maximum rate under section 1(h)(11) of the Internal Revenue Code.
The fund will notify shareholders in January 2019 of amounts for use in preparing 2018 income tax returns.
AGII-ANN-0818
1.855227.110
Fidelity® Mega Cap Stock Fund
Annual Report June 30, 2018 |
|
Contents
To view a fund's proxy voting guidelines and proxy voting record for the 12-month period ended June 30, visit http://www.fidelity.com/proxyvotingresults or visit the Securities and Exchange Commission's (SEC) web site at http://www.sec.gov.
You may also call 1-800-544-8544 to request a free copy of the proxy voting guidelines.
Standard & Poor's, S&P and S&P 500 are registered service marks of The McGraw-Hill Companies, Inc. and have been licensed for use by Fidelity Distributors Corporation.
Other third-party marks appearing herein are the property of their respective owners.
All other marks appearing herein are registered or unregistered trademarks or service marks of FMR LLC or an affiliated company. © 2018 FMR LLC. All rights reserved.
This report and the financial statements contained herein are submitted for the general information of the shareholders of the Fund. This report is not authorized for distribution to prospective investors in the Fund unless preceded or accompanied by an effective prospectus.
A fund files its complete schedule of portfolio holdings with the SEC for the first and third quarters of each fiscal year on Form N-Q. Forms N-Q are available on the SEC’s web site at http://www.sec.gov. A fund's Forms N-Q may be reviewed and copied at the SEC’s Public Reference Room in Washington, DC. Information regarding the operation of the SEC's Public Reference Room may be obtained by calling 1-800-SEC-0330.
For a complete list of a fund's portfolio holdings, view the most recent holdings listing, semiannual report, or annual report on Fidelity's web site at http://www.fidelity.com, http://www.institutional.fidelity.com, or http://www.401k.com, as applicable.
NOT FDIC INSURED •MAY LOSE VALUE •NO BANK GUARANTEE
Neither the Fund nor Fidelity Distributors Corporation is a bank.
Performance: The Bottom Line
Average annual total return reflects the change in the value of an investment, assuming reinvestment of distributions from dividend income and capital gains (the profits earned upon the sale of securities that have grown in value, if any) and assuming a constant rate of performance each year. The hypothetical investment and the average annual total returns do not reflect the deduction of taxes that a shareholder would pay on fund distributions or the redemption of fund shares. During periods of reimbursement by Fidelity, a fund’s total return will be greater than it would be had the reimbursement not occurred. How a fund did yesterday is no guarantee of how it will do tomorrow.
Average Annual Total Returns
| For the periods ended June 30, 2018 | Past 1 year | Past 5 years | Past 10 years |
| Fidelity® Mega Cap Stock Fund | 10.86% | 11.51% | 9.73% |
$10,000 Over 10 Years
Let's say hypothetically that $10,000 was invested in Fidelity® Mega Cap Stock Fund, a class of the fund, on June 30, 2008.
The chart shows how the value of your investment would have changed, and also shows how the S&P 500® Index performed over the same period.

| Period Ending Values |
| $25,308 | Fidelity® Mega Cap Stock Fund |
| $26,340 | S&P 500® Index |
Management's Discussion of Fund Performance
Market Recap: The U.S. equity bellwether S&P 500
® index gained 14.37% for the 12 months ending June 30, 2018, despite a resurgence in volatility that challenged the multiyear bull market. The steady growth seen throughout 2017 extended into the new year, as investors remained upbeat on hopes of continued strong economic and earnings growth. Stocks surged 5.73% in January alone. February was a decidedly different story, though, as volatility spiked amid fear that rising inflation and the potential for the economy to overheat would prompt the U.S. Federal Reserve to pick up the pace of interest rate hikes. The index returned -3.69% for the month, its first negative result since October 2016, and lost further ground in March on fear of a global trade war. The market stabilized in April and went on to achieve a solid gain for May. The uptrend continued through roughly mid-June, when escalating trade tension between the U.S. and China soured investor sentiment, and the index ended the 12 months with a two-week slump. By sector, information technology (+31%) led the way, rising on strong earnings growth from several major index constituents. Consumer discretionary (+24%) also stood out, largely driven by retailers (+50%). Energy gained 21% alongside higher oil prices. Notable laggards included some defensive groups – consumer staples (-4%), telecommunication services (+1%) and utilities (+3%) – that struggled amid rising interest rates and a general preference for risk.
Comments from Lead Portfolio Manager Matthew Fruhan: For the fiscal year, the fund's share classes (excluding sales charges, if applicable) gained roughly 10% to 11%, lagging the 15.42% advance of the mega-cap proxy Russell Top 200
® Index, as well as the S&P 500
®. The fund's underperformance of the Russell mega-cap index was primarily due to weak security selection, especially in the health care, consumer discretionary and industrials sectors. The fund also was hurt by a significant underweight in the top-performing information technology and consumer discretionary sectors. Within the latter, lacking exposure to two large Russell index components, online retail giant Amazon.com and video-streaming service provider Netflix – neither of which we saw as attractively valued – stood out as significant detractors, as did an overweight in cable and media giant Comcast. In industrials, it hurt to overweight General Electric, while in health care, our biggest individual detractor was out-of-index drug manufacturer Teva Pharmaceutical Industries. In contrast, an overweight in the energy sector, which outperformed, was beneficial. Here, top relative contributors were energy producer ConocoPhillips and Suncor Energy. Timely positioning in lagging energy giant Exxon Mobil also contributed. Suncor and Exxon Mobil were among the fund's largest positions on June 30. Within information technology, software maker Microsoft added value. It was the fund's largest holding.
The views expressed above reflect those of the portfolio manager(s) only through the end of the period as stated on the cover of this report and do not necessarily represent the views of Fidelity or any other person in the Fidelity organization. Any such views are subject to change at any time based upon market or other conditions and Fidelity disclaims any responsibility to update such views. These views may not be relied on as investment advice and, because investment decisions for a Fidelity fund are based on numerous factors, may not be relied on as an indication of trading intent on behalf of any Fidelity fund.
Note to shareholders: On October 20, 2017, Ashley Fernandes assumed co-manager responsibilities on the fund, joining Lead Manager Matt Fruhan.
Investment Summary (Unaudited)
Top Ten Stocks as of June 30, 2018
| | % of fund's net assets |
| Microsoft Corp. | 5.0 |
| Bank of America Corp. | 4.0 |
| Apple, Inc. | 3.7 |
| Exxon Mobil Corp. | 3.5 |
| JPMorgan Chase & Co. | 3.5 |
| Chevron Corp. | 3.5 |
| Citigroup, Inc. | 3.0 |
| Comcast Corp. Class A | 2.9 |
| Wells Fargo & Co. | 2.8 |
| Suncor Energy, Inc. | 2.4 |
| | 34.3 |
Top Five Market Sectors as of June 30, 2018
| | % of fund's net assets |
| Information Technology | 20.5 |
| Financials | 20.3 |
| Energy | 15.0 |
| Health Care | 14.7 |
| Consumer Staples | 8.6 |
Asset Allocation (% of fund's net assets)
| As of June 30, 2018*,** |
| | Stocks | 99.5% |
| | Convertible Securities | 0.1% |
| | Other Investments | 0.2% |
| | Short-Term Investments and Net Other Assets (Liabilities) | 0.2% |

* Foreign investments - 12.9%
** Written options - (0.0)%
Schedule of Investments June 30, 2018
Showing Percentage of Net Assets
| Common Stocks - 99.5% | | | |
| | | Shares | Value |
| CONSUMER DISCRETIONARY - 7.3% | | | |
| Automobiles - 0.2% | | | |
| General Motors Co. | | 81,700 | $3,218,980 |
| Media - 4.6% | | | |
| Charter Communications, Inc. Class A (a) | | 17,300 | 5,072,533 |
| Comcast Corp. Class A | | 1,803,300 | 59,166,273 |
| The Walt Disney Co. | | 302,600 | 31,715,506 |
| | | | 95,954,312 |
| Multiline Retail - 0.3% | | | |
| Target Corp. | | 82,400 | 6,272,288 |
| Specialty Retail - 2.2% | | | |
| Lowe's Companies, Inc. | | 341,500 | 32,637,155 |
| TJX Companies, Inc. (b) | | 136,900 | 13,030,142 |
| | | | 45,667,297 |
|
| TOTAL CONSUMER DISCRETIONARY | | | 151,112,877 |
|
| CONSUMER STAPLES - 8.6% | | | |
| Beverages - 2.0% | | | |
| PepsiCo, Inc. | | 77,805 | 8,470,630 |
| The Coca-Cola Co. | | 764,000 | 33,509,040 |
| | | | 41,979,670 |
| Food & Staples Retailing - 1.7% | | | |
| Costco Wholesale Corp. | | 13,800 | 2,883,924 |
| Walmart, Inc. | | 363,900 | 31,168,035 |
| | | | 34,051,959 |
| Household Products - 2.0% | | | |
| Kimberly-Clark Corp. | | 23,900 | 2,517,626 |
| Procter & Gamble Co. | | 445,400 | 34,767,924 |
| Reckitt Benckiser Group PLC | | 45,354 | 3,726,504 |
| | | | 41,012,054 |
| Tobacco - 2.9% | | | |
| Altria Group, Inc. | | 734,005 | 41,684,144 |
| British American Tobacco PLC sponsored ADR | | 368,300 | 18,580,735 |
| | | | 60,264,879 |
|
| TOTAL CONSUMER STAPLES | | | 177,308,562 |
|
| ENERGY - 14.8% | | | |
| Energy Equipment & Services - 0.5% | | | |
| Baker Hughes, a GE Co. Class A | | 268,800 | 8,878,464 |
| Oil, Gas & Consumable Fuels - 14.3% | | | |
| Anadarko Petroleum Corp. | | 172,000 | 12,599,000 |
| BP PLC sponsored ADR | | 636,849 | 29,078,525 |
| Cenovus Energy, Inc. | | 1,832,200 | 19,023,717 |
| Chevron Corp. | | 570,900 | 72,178,887 |
| ConocoPhillips Co. | | 217,800 | 15,163,236 |
| Equinor ASA sponsored ADR (c) | | 371,200 | 9,803,392 |
| Exxon Mobil Corp. | | 875,100 | 72,397,023 |
| Imperial Oil Ltd. | | 254,600 | 8,463,104 |
| Suncor Energy, Inc. | | 1,186,700 | 48,293,044 |
| The Williams Companies, Inc. | | 317,460 | 8,606,341 |
| | | | 295,606,269 |
|
| TOTAL ENERGY | | | 304,484,733 |
|
| FINANCIALS - 20.3% | | | |
| Banks - 15.8% | | | |
| Bank of America Corp. | | 2,902,100 | 81,810,199 |
| Citigroup, Inc. | | 944,670 | 63,217,316 |
| JPMorgan Chase & Co. | | 693,800 | 72,293,960 |
| PNC Financial Services Group, Inc. | | 166,500 | 22,494,150 |
| U.S. Bancorp | | 585,900 | 29,306,718 |
| Wells Fargo & Co. | | 1,046,930 | 58,041,799 |
| | | | 327,164,142 |
| Capital Markets - 3.6% | | | |
| Charles Schwab Corp. (b) | | 223,600 | 11,425,960 |
| Goldman Sachs Group, Inc. | | 24,400 | 5,381,908 |
| Morgan Stanley | | 418,000 | 19,813,200 |
| State Street Corp. | | 397,000 | 36,956,730 |
| | | | 73,577,798 |
| Insurance - 0.9% | | | |
| Chubb Ltd. | | 18,200 | 2,311,764 |
| Marsh & McLennan Companies, Inc. | | 97,980 | 8,031,421 |
| MetLife, Inc. | | 183,200 | 7,987,520 |
| | | | 18,330,705 |
|
| TOTAL FINANCIALS | | | 419,072,645 |
|
| HEALTH CARE - 14.6% | | | |
| Biotechnology - 2.6% | | | |
| Alexion Pharmaceuticals, Inc. (a) | | 134,800 | 16,735,420 |
| Amgen, Inc. | | 141,343 | 26,090,504 |
| Biogen, Inc. (a) | | 17,800 | 5,166,272 |
| Intercept Pharmaceuticals, Inc. (a) | | 46,700 | 3,918,597 |
| Regeneron Pharmaceuticals, Inc. (a) | | 7,200 | 2,483,928 |
| | | | 54,394,721 |
| Health Care Equipment & Supplies - 1.1% | | | |
| Becton, Dickinson & Co. | | 8,300 | 1,988,348 |
| Boston Scientific Corp. (a) | | 291,600 | 9,535,320 |
| Danaher Corp. | | 38,700 | 3,818,916 |
| Medtronic PLC | | 75,413 | 6,456,107 |
| | | | 21,798,691 |
| Health Care Providers & Services - 4.8% | | | |
| Anthem, Inc. | | 63,900 | 15,210,117 |
| Cardinal Health, Inc. | | 116,300 | 5,678,929 |
| Cigna Corp. | | 52,600 | 8,939,370 |
| CVS Health Corp. | | 478,100 | 30,765,735 |
| Humana, Inc. | | 22,100 | 6,577,623 |
| McKesson Corp. | | 139,400 | 18,595,960 |
| UnitedHealth Group, Inc. | | 55,700 | 13,665,438 |
| | | | 99,433,172 |
| Pharmaceuticals - 6.1% | | | |
| Allergan PLC | | 51,100 | 8,519,392 |
| AstraZeneca PLC sponsored ADR | | 206,500 | 7,250,215 |
| Bayer AG | | 112,726 | 12,379,976 |
| GlaxoSmithKline PLC sponsored ADR | | 814,400 | 32,828,464 |
| Johnson & Johnson | | 366,700 | 44,495,378 |
| Novartis AG sponsored ADR | | 37,300 | 2,817,642 |
| Sanofi SA | | 104,709 | 8,403,895 |
| Teva Pharmaceutical Industries Ltd. sponsored ADR | | 347,300 | 8,446,336 |
| | | | 125,141,298 |
|
| TOTAL HEALTH CARE | | | 300,767,882 |
|
| INDUSTRIALS - 8.4% | | | |
| Aerospace & Defense - 2.1% | | | |
| General Dynamics Corp. | | 23,300 | 4,343,353 |
| The Boeing Co. | | 600 | 201,306 |
| United Technologies Corp. | | 310,600 | 38,834,318 |
| | | | 43,378,977 |
| Air Freight & Logistics - 1.7% | | | |
| FedEx Corp. | | 30,100 | 6,834,506 |
| United Parcel Service, Inc. Class B | | 268,600 | 28,533,378 |
| | | | 35,367,884 |
| Industrial Conglomerates - 2.0% | | | |
| General Electric Co. | | 3,028,700 | 41,220,607 |
| Road & Rail - 2.6% | | | |
| CSX Corp. (b) | | 127,100 | 8,106,438 |
| Norfolk Southern Corp. | | 94,500 | 14,257,215 |
| Union Pacific Corp. | | 221,290 | 31,352,367 |
| | | | 53,716,020 |
|
| TOTAL INDUSTRIALS | | | 173,683,488 |
|
| INFORMATION TECHNOLOGY - 20.5% | | | |
| Communications Equipment - 1.6% | | | |
| Cisco Systems, Inc. | | 776,800 | 33,425,704 |
| Internet Software & Services - 2.0% | | | |
| Alphabet, Inc.: | | | |
| Class A (a) | | 19,050 | 21,511,070 |
| Class C (a) | | 18,426 | 20,556,967 |
| | | | 42,068,037 |
| IT Services - 3.6% | | | |
| Accenture PLC Class A | | 26,000 | 4,253,340 |
| Cognizant Technology Solutions Corp. Class A | | 57,700 | 4,557,723 |
| IBM Corp. | | 20,300 | 2,835,910 |
| MasterCard, Inc. Class A (b) | | 82,400 | 16,193,248 |
| PayPal Holdings, Inc. (a) | | 8,399 | 699,385 |
| Visa, Inc. Class A | | 343,900 | 45,549,555 |
| | | | 74,089,161 |
| Semiconductors & Semiconductor Equipment - 2.0% | | | |
| Qualcomm, Inc. | | 715,200 | 40,137,024 |
| Software - 7.6% | | | |
| Adobe Systems, Inc. (a) | | 56,700 | 13,824,027 |
| Microsoft Corp. | | 1,057,600 | 104,289,934 |
| Oracle Corp. | | 612,632 | 26,992,566 |
| Salesforce.com, Inc. (a) | | 15,000 | 2,046,000 |
| SAP SE sponsored ADR | | 85,400 | 9,877,364 |
| | | | 157,029,891 |
| Technology Hardware, Storage & Peripherals - 3.7% | | | |
| Apple, Inc. | | 417,107 | 77,210,677 |
|
| TOTAL INFORMATION TECHNOLOGY | | | 423,960,494 |
|
| MATERIALS - 1.5% | | | |
| Chemicals - 1.0% | | | |
| DowDuPont, Inc. | | 100,967 | 6,655,745 |
| LyondellBasell Industries NV Class A | | 131,100 | 14,401,335 |
| | | | 21,057,080 |
| Metals & Mining - 0.5% | | | |
| BHP Billiton Ltd. sponsored ADR (c) | | 178,400 | 8,921,784 |
|
| TOTAL MATERIALS | | | 29,978,864 |
|
| REAL ESTATE - 0.8% | | | |
| Equity Real Estate Investment Trusts (REITs) - 0.8% | | | |
| American Tower Corp. | | 45,300 | 6,530,901 |
| Crown Castle International Corp. | | 4,500 | 485,190 |
| Equinix, Inc. | | 17,800 | 7,652,042 |
| Public Storage | | 12,000 | 2,722,320 |
| | | | 17,390,453 |
| TELECOMMUNICATION SERVICES - 1.9% | | | |
| Diversified Telecommunication Services - 1.9% | | | |
| AT&T, Inc. | | 115,146 | 3,697,338 |
| Verizon Communications, Inc. | | 688,825 | 34,654,786 |
| | | | 38,352,124 |
| UTILITIES - 0.8% | | | |
| Electric Utilities - 0.8% | | | |
| Exelon Corp. | | 374,200 | 15,940,920 |
| TOTAL COMMON STOCKS | | | |
| (Cost $1,381,054,110) | | | 2,052,053,042 |
|
| Convertible Preferred Stocks - 0.1% | | | |
| HEALTH CARE - 0.1% | | | |
| Health Care Equipment & Supplies - 0.1% | | | |
| Becton, Dickinson & Co. Series A, 6.125% | | | |
| (Cost $2,005,000) | | 40,100 | 2,476,877 |
|
| Other - 0.2% | | | |
| ENERGY - 0.2% | | | |
| Oil, Gas, Consumable Fuels - 0.2% | | | |
| Utica Shale Drilling Program (non-operating revenue interest) (d)(e)(f) | | | |
| (Cost $9,242,241) | | 9,242,241 | 4,944,599 |
|
| Money Market Funds - 1.3% | | | |
| Fidelity Cash Central Fund, 1.93% (g) | | 11,552,877 | 11,555,188 |
| Fidelity Securities Lending Cash Central Fund 1.92% (g)(h) | | 14,312,599 | 14,315,462 |
| TOTAL MONEY MARKET FUNDS | | | |
| (Cost $25,869,313) | | | 25,870,650 |
| TOTAL INVESTMENT IN SECURITIES - 101.1% | | | |
| (Cost $1,418,170,664) | | | 2,085,345,168 |
| NET OTHER ASSETS (LIABILITIES) - (1.1)% | | | (21,814,211) |
| NET ASSETS - 100% | | | $2,063,530,957 |
| Written Options | | | | | | |
| | Counterparty | Number of Contracts | Notional Amount | Exercise Price | Expiration Date | Value |
| Call Options | | | | | | |
| Charles Schwab Corp. | Chicago Board Options Exchange | 446 | $2,279,060 | $60.00 | 9/21/18 | $(12,265) |
| CSX Corp. | Chicago Board Options Exchange | 1,271 | 8,106,438 | 70.00 | 8/17/18 | (58,466) |
| Mastercard, Inc. Class A | Chicago Board Options Exchange | 198 | 3,891,096 | 200.00 | 7/20/18 | (45,639) |
| TJX Companies, Inc. | Chicago Board Options Exchange | 445 | 4,235,510 | 97.50 | 10/19/18 | (151,300) |
| TOTAL WRITTEN OPTIONS | | | | | | $(267,670) |
Legend
(a) Non-income producing
(b) Security or a portion of the security is pledged as collateral for call options written. At period end, the value of securities pledged amounted to $18,512,104.
(c) Security or a portion of the security is on loan at period end.
(d) Investment is owned by a wholly-owned subsidiary (Subsidiary) that is treated as a corporation for U.S. tax purposes.
(e) Restricted securities - Investment in securities not registered under the Securities Act of 1933 (excluding 144A issues). At the end of the period, the value of restricted securities (excluding 144A issues) amounted to $4,944,599 or 0.2% of net assets.
(f) Level 3 security
(g) Affiliated fund that is generally available only to investment companies and other accounts managed by Fidelity Investments. The rate quoted is the annualized seven-day yield of the fund at period end. A complete unaudited listing of the fund's holdings as of its most recent quarter end is available upon request. In addition, each Fidelity Central Fund's financial statements, which are not covered by the Fund's Report of Independent Registered Public Accounting Firm, are available on the SEC's website or upon request.
(h) Investment made with cash collateral received from securities on loan.
Additional information on each restricted holding is as follows:
| Security | Acquisition Date | Acquisition Cost |
| Utica Shale Drilling Program (non-operating revenue interest) | 10/5/16 - 9/1/17 | $9,242,241 |
Affiliated Central Funds
Information regarding fiscal year to date income earned by the Fund from investments in Fidelity Central Funds is as follows:
| Fund | Income earned |
| Fidelity Cash Central Fund | $144,196 |
| Fidelity Securities Lending Cash Central Fund | 69,639 |
| Total | $213,835 |
Amounts in the income column in the above table include any capital gain distributions from underlying funds, which are presented in the corresponding line-item in the Statement of Operations if applicable.
Investment Valuation
The following is a summary of the inputs used, as of June 30, 2018, involving the Fund's assets and liabilities carried at fair value. The inputs or methodology used for valuing securities may not be an indication of the risk associated with investing in those securities. For more information on valuation inputs, and their aggregation into the levels used below, please refer to the Investment Valuation section in the accompanying Notes to Financial Statements.
| | Valuation Inputs at Reporting Date: |
| Description | Total | Level 1 | Level 2 | Level 3 |
| Investments in Securities: | | | | |
| Equities: | | | | |
| Consumer Discretionary | $151,112,877 | $151,112,877 | $-- | $-- |
| Consumer Staples | 177,308,562 | 173,582,058 | 3,726,504 | -- |
| Energy | 304,484,733 | 304,484,733 | -- | -- |
| Financials | 419,072,645 | 419,072,645 | -- | -- |
| Health Care | 303,244,759 | 279,984,011 | 23,260,748 | -- |
| Industrials | 173,683,488 | 173,683,488 | -- | -- |
| Information Technology | 423,960,494 | 423,960,494 | -- | -- |
| Materials | 29,978,864 | 29,978,864 | -- | -- |
| Real Estate | 17,390,453 | 17,390,453 | -- | -- |
| Telecommunication Services | 38,352,124 | 38,352,124 | -- | -- |
| Utilities | 15,940,920 | 15,940,920 | -- | -- |
| Other | 4,944,599 | -- | -- | 4,944,599 |
| Money Market Funds | 25,870,650 | 25,870,650 | -- | -- |
| Total Investments in Securities: | $2,085,345,168 | $2,053,413,317 | $26,987,252 | $4,944,599 |
| Derivative Instruments: | | | | |
| Liabilities | | | | |
| Written Options | $(267,670) | $(267,670) | $-- | $-- |
| Total Liabilities | $(267,670) | $(267,670) | $-- | $-- |
| Total Derivative Instruments: | $(267,670) | $(267,670) | $-- | $-- |
Value of Derivative Instruments
The following table is a summary of the Fund's value of derivative instruments by primary risk exposure as of June 30, 2018. For additional information on derivative instruments, please refer to the Derivative Instruments section in the accompanying Notes to Financial Statements.
| Primary Risk Exposure / Derivative Type | Value |
| | Asset | Liability |
| Equity Risk | | |
| Written Options(a) | $0 | $(267,670) |
| Total Value of Derivatives | $0 | $(267,670) |
(a) Gross value is presented in the Statement of Assets and Liabilities in the written options, at value line-item.
Other Information
Distribution of investments by country or territory of incorporation, as a percentage of Total Net Assets, is as follows (Unaudited):
| United States of America | 87.1% |
| United Kingdom | 4.5% |
| Canada | 3.7% |
| Germany | 1.1% |
| Others (Individually Less Than 1%) | 3.6% |
| | 100.0% |
See accompanying notes which are an integral part of the financial statements.
Financial Statements
Statement of Assets and Liabilities
| | | June 30, 2018 |
| Assets | | |
Investment in securities, at value (including securities loaned of $13,981,940) — See accompanying schedule:
Unaffiliated issuers (cost $1,392,301,351) | $2,059,474,518 | |
| Fidelity Central Funds (cost $25,869,313) | 25,870,650 | |
| Total Investment in Securities (cost $1,418,170,664) | | $2,085,345,168 |
| Restricted cash | | 116,580 |
| Receivable for investments sold | | 2,912,965 |
| Receivable for fund shares sold | | 370,848 |
| Dividends receivable | | 2,607,408 |
| Distributions receivable from Fidelity Central Funds | | 14,300 |
| Other receivables | | 34,563 |
| Total assets | | 2,091,401,832 |
| Liabilities | | |
| Payable for investments purchased | $7,865,086 | |
| Payable for fund shares redeemed | 4,165,744 | |
| Accrued management fee | 769,676 | |
| Distribution and service plan fees payable | 52,918 | |
| Written options, at value (premium received $342,778) | 267,670 | |
| Other affiliated payables | 364,918 | |
| Other payables and accrued expenses | 68,663 | |
| Collateral on securities loaned | 14,316,200 | |
| Total liabilities | | 27,870,875 |
| Net Assets | | $2,063,530,957 |
| Net Assets consist of: | | |
| Paid in capital | | $1,202,853,284 |
| Undistributed net investment income | | 15,467,343 |
| Accumulated undistributed net realized gain (loss) on investments and foreign currency transactions | | 177,967,596 |
| Net unrealized appreciation (depreciation) on investments and assets and liabilities in foreign currencies | | 667,242,734 |
| Net Assets | | $2,063,530,957 |
| Calculation of Maximum Offering Price | | |
| Class A: | | |
| Net Asset Value and redemption price per share ($62,332,582 ÷ 3,595,363 shares) | | $17.34 |
| Maximum offering price per share (100/94.25 of $17.34) | | $18.40 |
| Class M: | | |
| Net Asset Value and redemption price per share ($26,445,901 ÷ 1,527,598 shares) | | $17.31 |
| Maximum offering price per share (100/96.50 of $17.31) | | $17.94 |
| Class C: | | |
| Net Asset Value and offering price per share ($33,640,368 ÷ 1,975,429 shares)(a) | | $17.03 |
| Mega Cap Stock: | | |
| Net Asset Value, offering price and redemption price per share ($1,715,822,431 ÷ 97,934,675 shares) | | $17.52 |
| Class I: | | |
| Net Asset Value, offering price and redemption price per share ($143,472,288 ÷ 8,183,765 shares) | | $17.53 |
| Class Z: | | |
| Net Asset Value, offering price and redemption price per share ($81,817,387 ÷ 4,686,246 shares) | | $17.46 |
(a) Redemption price per share is equal to net asset value less any applicable contingent deferred sales charge.
See accompanying notes which are an integral part of the financial statements.
Statement of Operations
| | | Year ended June 30, 2018 |
| Investment Income | | |
| Dividends | | $52,101,937 |
| Income from Fidelity Central Funds | | 213,835 |
| Total income | | 52,315,772 |
| Expenses | | |
| Management fee | $10,250,513 | |
| Transfer agent fees | 4,099,650 | |
| Distribution and service plan fees | 636,454 | |
| Accounting and security lending fees | 696,990 | |
| Custodian fees and expenses | 42,631 | |
| Independent trustees' fees and expenses | 9,805 | |
| Registration fees | 120,309 | |
| Audit | 64,816 | |
| Legal | 7,106 | |
| Interest | 19,432 | |
| Miscellaneous | 18,103 | |
| Total expenses before reductions | 15,965,809 | |
| Expense reductions | (106,657) | |
| Total expenses after reductions | | 15,859,152 |
| Net investment income (loss) | | 36,456,620 |
| Realized and Unrealized Gain (Loss) | | |
| Net realized gain (loss) on: | | |
| Investment securities: | | |
| Unaffiliated issuers | 279,125,575 | |
| Fidelity Central Funds | (2,058) | |
| Foreign currency transactions | (7,607) | |
| Written options | 3,585,965 | |
| Total net realized gain (loss) | | 282,701,875 |
| Change in net unrealized appreciation (depreciation) on: | | |
| Investment securities: | | |
| Unaffiliated issuers | (93,699,725) | |
| Fidelity Central Funds | 1,337 | |
| Assets and liabilities in foreign currencies | (3,400) | |
| Written options | 1,072,168 | |
| Total change in net unrealized appreciation (depreciation) | | (92,629,620) |
| Net gain (loss) | | 190,072,255 |
| Net increase (decrease) in net assets resulting from operations | | $226,528,875 |
See accompanying notes which are an integral part of the financial statements.
Statement of Changes in Net Assets
| | Year ended June 30, 2018 | Year ended June 30, 2017 |
| Increase (Decrease) in Net Assets | | |
| Operations | | |
| Net investment income (loss) | $36,456,620 | $49,096,205 |
| Net realized gain (loss) | 282,701,875 | 340,272,578 |
| Change in net unrealized appreciation (depreciation) | (92,629,620) | 237,023,573 |
| Net increase (decrease) in net assets resulting from operations | 226,528,875 | 626,392,356 |
| Distributions to shareholders from net investment income | (35,334,838) | (52,216,198) |
| Distributions to shareholders from net realized gain | (308,590,093) | (17,291,428) |
| Total distributions | (343,924,931) | (69,507,626) |
| Share transactions - net increase (decrease) | (27,457,731) | (1,685,570,408) |
| Total increase (decrease) in net assets | (144,853,787) | (1,128,685,678) |
| Net Assets | | |
| Beginning of period | 2,208,384,744 | 3,337,070,422 |
| End of period | $2,063,530,957 | $2,208,384,744 |
| Other Information | | |
| Undistributed net investment income end of period | $15,467,343 | $17,400,130 |
See accompanying notes which are an integral part of the financial statements.
Financial Highlights
Fidelity Mega Cap Stock Fund Class A
| Years ended June 30, | 2018 | 2017 | 2016 | 2015 | 2014 |
| Selected Per–Share Data | | | | | |
| Net asset value, beginning of period | $18.42 | $15.56 | $16.56 | $16.32 | $13.51 |
| Income from Investment Operations | | | | | |
| Net investment income (loss)A | .23 | .22 | .23 | .18 | .18 |
| Net realized and unrealized gain (loss) | 1.49 | 2.94 | (.65) | .71 | 3.00 |
| Total from investment operations | 1.72 | 3.16 | (.42) | .89 | 3.18 |
| Distributions from net investment income | (.24) | (.22) | (.18) | (.17) | (.16) |
| Distributions from net realized gain | (2.56) | (.09) | (.40) | (.47) | (.21) |
| Total distributions | (2.80) | (.30)B | (.58) | (.65)C | (.37) |
| Net asset value, end of period | $17.34 | $18.42 | $15.56 | $16.56 | $16.32 |
| Total ReturnD,E | 10.60% | 20.49% | (2.56)% | 5.69% | 23.88% |
| Ratios to Average Net AssetsF,G | | | | | |
| Expenses before reductions | .93% | .94% | .95% | 1.05% | .96% |
| Expenses net of fee waivers, if any | .93% | .94% | .95% | 1.05% | .96% |
| Expenses net of all reductions | .93% | .94% | .95% | 1.05% | .96% |
| Net investment income (loss) | 1.33% | 1.30% | 1.46% | 1.10% | 1.19% |
| Supplemental Data | | | | | |
| Net assets, end of period (000 omitted) | $62,333 | $60,362 | $68,801 | $117,385 | $77,335 |
| Portfolio turnover rateH | 39% | 25% | 25% | 22%I | 28% |
A Calculated based on average shares outstanding during the period.
B Total distributions of $.30 per share is comprised of distributions from net investment income of $.218 and distributions from net realized gain of $.085 per share.
C Total distributions of $.65 per share is comprised of distributions from net investment income of $.174 and distributions from net realized gain of $.474 per share.
D Total returns would have been lower if certain expenses had not been reduced during the applicable periods shown.
E Total returns do not include the effect of the sales charges.
F Fees and expenses of any underlying Fidelity Central Funds are not included in the Fund's expense ratio. The Fund indirectly bears its proportionate share of the expenses of any underlying Fidelity Central Funds.
G Expense ratios reflect operating expenses of the class. Expenses before reductions do not reflect amounts reimbursed by the investment adviser or reductions from brokerage service arrangements or reductions from other expense offset arrangements and do not represent the amount paid by the class during periods when reimbursements or reductions occur. Expenses net of fee waivers reflect expenses after reimbursement by the investment adviser but prior to reductions from brokerage service arrangements or other expense offset arrangements. Expenses net of all reductions represent the net expenses paid by the class.
H Amount does not include the portfolio activity of any underlying Fidelity Central Funds.
I Portfolio turnover rate excludes securities received or delivered in-kind.
See accompanying notes which are an integral part of the financial statements.
Fidelity Mega Cap Stock Fund Class M
| Years ended June 30, | 2018 | 2017 | 2016 | 2015 | 2014 |
| Selected Per–Share Data | | | | | |
| Net asset value, beginning of period | $18.39 | $15.54 | $16.57 | $16.31 | $13.51 |
| Income from Investment Operations | | | | | |
| Net investment income (loss)A | .19 | .18 | .19 | .16 | .14 |
| Net realized and unrealized gain (loss) | 1.48 | 2.93 | (.65) | .70 | 3.00 |
| Total from investment operations | 1.67 | 3.11 | (.46) | .86 | 3.14 |
| Distributions from net investment income | (.19) | (.18) | (.16) | (.13) | (.13) |
| Distributions from net realized gain | (2.56) | (.09) | (.40) | (.47) | (.21) |
| Total distributions | (2.75) | (.26)B | (.57)C | (.60) | (.34) |
| Net asset value, end of period | $17.31 | $18.39 | $15.54 | $16.57 | $16.31 |
| Total ReturnD,E | 10.33% | 20.17% | (2.83)% | 5.53% | 23.54% |
| Ratios to Average Net AssetsF,G | | | | | |
| Expenses before reductions | 1.19% | 1.20% | 1.21% | 1.21% | 1.22% |
| Expenses net of fee waivers, if any | 1.19% | 1.20% | 1.21% | 1.20% | 1.22% |
| Expenses net of all reductions | 1.18% | 1.20% | 1.20% | 1.20% | 1.22% |
| Net investment income (loss) | 1.07% | 1.04% | 1.21% | .95% | .92% |
| Supplemental Data | | | | | |
| Net assets, end of period (000 omitted) | $26,446 | $28,248 | $26,145 | $23,231 | $15,728 |
| Portfolio turnover rateH | 39% | 25% | 25% | 22%I | 28% |
A Calculated based on average shares outstanding during the period.
B Total distributions of $.26 per share is comprised of distributions from net investment income of $.178 and distributions from net realized gain of $.085 per share.
C Total distributions of $.57 per share is comprised of distributions from net investment income of $.164 and distributions from net realized gain of $.404 per share.
D Total returns would have been lower if certain expenses had not been reduced during the applicable periods shown.
E Total returns do not include the effect of the sales charges.
F Fees and expenses of any underlying Fidelity Central Funds are not included in the Fund's expense ratio. The Fund indirectly bears its proportionate share of the expenses of any underlying Fidelity Central Funds.
G Expense ratios reflect operating expenses of the class. Expenses before reductions do not reflect amounts reimbursed by the investment adviser or reductions from brokerage service arrangements or reductions from other expense offset arrangements and do not represent the amount paid by the class during periods when reimbursements or reductions occur. Expenses net of fee waivers reflect expenses after reimbursement by the investment adviser but prior to reductions from brokerage service arrangements or other expense offset arrangements. Expenses net of all reductions represent the net expenses paid by the class.
H Amount does not include the portfolio activity of any underlying Fidelity Central Funds.
I Portfolio turnover rate excludes securities received or delivered in-kind.
See accompanying notes which are an integral part of the financial statements.
Fidelity Mega Cap Stock Fund Class C
| Years ended June 30, | 2018 | 2017 | 2016 | 2015 | 2014 |
| Selected Per–Share Data | | | | | |
| Net asset value, beginning of period | $18.13 | $15.32 | $16.35 | $16.12 | $13.38 |
| Income from Investment Operations | | | | | |
| Net investment income (loss)A | .10 | .09 | .11 | .07 | .06 |
| Net realized and unrealized gain (loss) | 1.47 | 2.90 | (.64) | .71 | 2.97 |
| Total from investment operations | 1.57 | 2.99 | (.53) | .78 | 3.03 |
| Distributions from net investment income | (.11) | (.09) | (.09) | (.08) | (.08) |
| Distributions from net realized gain | (2.56) | (.09) | (.40) | (.47) | (.21) |
| Total distributions | (2.67) | (.18) | (.50)B | (.55) | (.29) |
| Net asset value, end of period | $17.03 | $18.13 | $15.32 | $16.35 | $16.12 |
| Total ReturnC,D | 9.81% | 19.59% | (3.32)% | 5.05% | 22.90% |
| Ratios to Average Net AssetsE,F | | | | | |
| Expenses before reductions | 1.68% | 1.69% | 1.70% | 1.70% | 1.71% |
| Expenses net of fee waivers, if any | 1.68% | 1.69% | 1.70% | 1.70% | 1.71% |
| Expenses net of all reductions | 1.68% | 1.69% | 1.69% | 1.70% | 1.71% |
| Net investment income (loss) | .58% | .55% | .72% | .45% | .43% |
| Supplemental Data | | | | | |
| Net assets, end of period (000 omitted) | $33,640 | $34,205 | $31,605 | $34,790 | $16,600 |
| Portfolio turnover rateG | 39% | 25% | 25% | 22%H | 28% |
A Calculated based on average shares outstanding during the period.
B Total distributions of $.50 per share is comprised of distributions from net investment income of $.091 and distributions from net realized gain of $.404 per share.
C Total returns would have been lower if certain expenses had not been reduced during the applicable periods shown.
D Total returns do not include the effect of the contingent deferred sales charge.
E Fees and expenses of any underlying Fidelity Central Funds are not included in the Fund's expense ratio. The Fund indirectly bears its proportionate share of the expenses of any underlying Fidelity Central Funds.
F Expense ratios reflect operating expenses of the class. Expenses before reductions do not reflect amounts reimbursed by the investment adviser or reductions from brokerage service arrangements or reductions from other expense offset arrangements and do not represent the amount paid by the class during periods when reimbursements or reductions occur. Expenses net of fee waivers reflect expenses after reimbursement by the investment adviser but prior to reductions from brokerage service arrangements or other expense offset arrangements. Expenses net of all reductions represent the net expenses paid by the class.
G Amount does not include the portfolio activity of any underlying Fidelity Central Funds.
H Portfolio turnover rate excludes securities received or delivered in-kind.
See accompanying notes which are an integral part of the financial statements.
Fidelity Mega Cap Stock Fund
| Years ended June 30, | 2018 | 2017 | 2016 | 2015 | 2014 |
| Selected Per–Share Data | | | | | |
| Net asset value, beginning of period | $18.58 | $15.68 | $16.72 | $16.44 | $13.60 |
| Income from Investment Operations | | | | | |
| Net investment income (loss)A | .28 | .27 | .27 | .24 | .22 |
| Net realized and unrealized gain (loss) | 1.50 | 2.97 | (.66) | .72 | 3.02 |
| Total from investment operations | 1.78 | 3.24 | (.39) | .96 | 3.24 |
| Distributions from net investment income | (.27) | (.26) | (.25) | (.21) | (.19) |
| Distributions from net realized gain | (2.56) | (.09) | (.40) | (.47) | (.21) |
| Total distributions | (2.84)B | (.34)C | (.65) | (.68) | (.40) |
| Net asset value, end of period | $17.52 | $18.58 | $15.68 | $16.72 | $16.44 |
| Total ReturnD | 10.86% | 20.87% | (2.36)% | 6.13% | 24.18% |
| Ratios to Average Net AssetsE,F | | | | | |
| Expenses before reductions | .68% | .68% | .69% | .67% | .68% |
| Expenses net of fee waivers, if any | .68% | .68% | .69% | .67% | .68% |
| Expenses net of all reductions | .68% | .68% | .68% | .67% | .68% |
| Net investment income (loss) | 1.58% | 1.56% | 1.73% | 1.48% | 1.47% |
| Supplemental Data | | | | | |
| Net assets, end of period (000 omitted) | $1,715,822 | $1,613,374 | $3,059,691 | $3,300,700 | $2,860,197 |
| Portfolio turnover rateG | 39% | 25% | 25% | 22%H | 28% |
A Calculated based on average shares outstanding during the period.
B Total distributions of $2.84 per share is comprised of distributions from net investment income of $.274 and distributions from net realized gain of $2.562 per share.
C Total distributions of $.34 per share is comprised of distributions from net investment income of $.258 and distributions from net realized gain of $.085 per share.
D Total returns would have been lower if certain expenses had not been reduced during the applicable periods shown.
E Fees and expenses of any underlying Fidelity Central Funds are not included in the Fund's expense ratio. The Fund indirectly bears its proportionate share of the expenses of any underlying Fidelity Central Funds.
F Expense ratios reflect operating expenses of the class. Expenses before reductions do not reflect amounts reimbursed by the investment adviser or reductions from brokerage service arrangements or reductions from other expense offset arrangements and do not represent the amount paid by the class during periods when reimbursements or reductions occur. Expenses net of fee waivers reflect expenses after reimbursement by the investment adviser but prior to reductions from brokerage service arrangements or other expense offset arrangements. Expenses net of all reductions represent the net expenses paid by the class.
G Amount does not include the portfolio activity of any underlying Fidelity Central Funds.
H Portfolio turnover rate excludes securities received or delivered in-kind.
See accompanying notes which are an integral part of the financial statements.
Fidelity Mega Cap Stock Fund Class I
| Years ended June 30, | 2018 | 2017 | 2016 | 2015 | 2014 |
| Selected Per–Share Data | | | | | |
| Net asset value, beginning of period | $18.60 | $15.70 | $16.73 | $16.39 | $13.55 |
| Income from Investment Operations | | | | | |
| Net investment income (loss)A | .28 | .27 | .27 | .24 | .22 |
| Net realized and unrealized gain (loss) | 1.50 | 2.97 | (.65) | .72 | 3.02 |
| Total from investment operations | 1.78 | 3.24 | (.38) | .96 | 3.24 |
| Distributions from net investment income | (.29) | (.26) | (.24) | (.15) | (.18) |
| Distributions from net realized gain | (2.56) | (.09) | (.40) | (.47) | (.21) |
| Total distributions | (2.85) | (.34)B | (.65)C | (.62) | (.40)D |
| Net asset value, end of period | $17.53 | $18.60 | $15.70 | $16.73 | $16.39 |
| Total ReturnE | 10.87% | 20.84% | (2.31)% | 6.11% | 24.23% |
| Ratios to Average Net AssetsF,G | | | | | |
| Expenses before reductions | .67% | .67% | .68% | .69% | .71% |
| Expenses net of fee waivers, if any | .67% | .67% | .68% | .68% | .71% |
| Expenses net of all reductions | .66% | .67% | .68% | .68% | .71% |
| Net investment income (loss) | 1.60% | 1.57% | 1.73% | 1.47% | 1.43% |
| Supplemental Data | | | | | |
| Net assets, end of period (000 omitted) | $143,472 | $153,622 | $148,414 | $186,637 | $674,416 |
| Portfolio turnover rateH | 39% | 25% | 25% | 22%I | 28% |
A Calculated based on average shares outstanding during the period.
B Total distributions of $.34 per share is comprised of distributions from net investment income of $.257 and distributions from net realized gain of $.085 per share.
C Total distributions of $.65 per share is comprised of distributions from net investment income of $.244 and distributions from net realized gain of $.404 per share.
D Total distributions of $.40 per share is comprised of distributions from net investment income of $.182 and distributions from net realized gain of $.213 per share.
E Total returns would have been lower if certain expenses had not been reduced during the applicable periods shown.
F Fees and expenses of any underlying Fidelity Central Funds are not included in the Fund's expense ratio. The Fund indirectly bears its proportionate share of the expenses of any underlying Fidelity Central Funds.
G Expense ratios reflect operating expenses of the class. Expenses before reductions do not reflect amounts reimbursed by the investment adviser or reductions from brokerage service arrangements or reductions from other expense offset arrangements and do not represent the amount paid by the class during periods when reimbursements or reductions occur. Expenses net of fee waivers reflect expenses after reimbursement by the investment adviser but prior to reductions from brokerage service arrangements or other expense offset arrangements. Expenses net of all reductions represent the net expenses paid by the class.
H Amount does not include the portfolio activity of any underlying Fidelity Central Funds.
I Portfolio turnover rate excludes securities received or delivered in-kind.
See accompanying notes which are an integral part of the financial statements.
Fidelity Mega Cap Stock Fund Class Z
| Years ended June 30, | 2018 | 2017 | 2016 | 2015 | 2014 A |
| Selected Per–Share Data | | | | | |
| Net asset value, beginning of period | $18.53 | $15.65 | $16.69 | $16.40 | $14.31 |
| Income from Investment Operations | | | | | |
| Net investment income (loss)B | .30 | .31 | .29 | .27 | .21 |
| Net realized and unrealized gain (loss) | 1.51 | 2.94 | (.66) | .72 | 2.20 |
| Total from investment operations | 1.81 | 3.25 | (.37) | .99 | 2.41 |
| Distributions from net investment income | (.31) | (.28) | (.27) | (.23) | (.10) |
| Distributions from net realized gain | (2.56) | (.09) | (.40) | (.47) | (.21) |
| Total distributions | (2.88)C | (.37) | (.67) | (.70) | (.32)D |
| Net asset value, end of period | $17.46 | $18.53 | $15.65 | $16.69 | $16.40 |
| Total ReturnE,F | 11.09% | 20.96% | (2.21)% | 6.33% | 17.06% |
| Ratios to Average Net AssetsG,H | | | | | |
| Expenses before reductions | .53% | .53% | .54% | .54% | .54%I |
| Expenses net of fee waivers, if any | .53% | .53% | .54% | .54% | .54%I |
| Expenses net of all reductions | .53% | .53% | .53% | .54% | .54%I |
| Net investment income (loss) | 1.73% | 1.71% | 1.88% | 1.61% | 1.59%I |
| Supplemental Data | | | | | |
| Net assets, end of period (000 omitted) | $81,817 | $318,575 | $2,414 | $2,449 | $117 |
| Portfolio turnover rateJ | 39% | 25% | 25% | 22%K | 28% |
A For the period August 13, 2013 (commencement of sale of shares) to June 30, 2014.
B Calculated based on average shares outstanding during the period.
C Total distributions of $2.88 per share is comprised of distributions from net investment income of $.313 and distributions from net realized gain of $2.562 per share.
D Total distributions of $.32 per share is comprised of distributions from net investment income of $.104 and distributions from net realized gain of $.213 per share.
E Total returns for periods of less than one year are not annualized.
F Total returns would have been lower if certain expenses had not been reduced during the applicable periods shown.
G Fees and expenses of any underlying Fidelity Central Funds are not included in the Fund's expense ratio. The Fund indirectly bears its proportionate share of the expenses of any underlying Fidelity Central Funds.
H Expense ratios reflect operating expenses of the class. Expenses before reductions do not reflect amounts reimbursed by the investment adviser or reductions from brokerage service arrangements or reductions from other expense offset arrangements and do not represent the amount paid by the class during periods when reimbursements or reductions occur. Expense ratios before reductions for start-up periods may not be representative of longer-term operating periods. Expenses net of fee waivers reflect expenses after reimbursement by the investment adviser but prior to reductions from brokerage service arrangements or other expense offset arrangements. Expenses net of all reductions represent the net expenses paid by the class.
I Annualized
J Amount does not include the portfolio activity of any underlying Fidelity Central Funds.
K Portfolio turnover rate excludes securities received or delivered in-kind.
See accompanying notes which are an integral part of the financial statements.
Notes to Financial Statements
For the period ended June 30, 2018
1. Organization.
Fidelity Mega Cap Stock Fund (the Fund) is a fund of Fidelity Hastings Street Trust (the Trust) and is authorized to issue an unlimited number of shares. The Trust is registered under the Investment Company Act of 1940, as amended (the 1940 Act), as an open-end management investment company organized as a Massachusetts business trust. The Fund offers Class A, Class M, Class C, Mega Cap Stock, Class I, and Class Z shares, each of which has equal rights as to assets and voting privileges. Each class has exclusive voting rights with respect to matters that affect that class.
2. Investments in Fidelity Central Funds.
The Fund invests in Fidelity Central Funds, which are open-end investment companies generally available only to other investment companies and accounts managed by the investment adviser and its affiliates. The Fund's Schedule of Investments lists each of the Fidelity Central Funds held as of period end, if any, as an investment of the Fund, but does not include the underlying holdings of each Fidelity Central Fund. As an Investing Fund, the Fund indirectly bears its proportionate share of the expenses of the underlying Fidelity Central Funds.
The Money Market Central Funds seek preservation of capital and current income and are managed by Fidelity Investments Money Management, Inc. (FIMM), an affiliate of the investment adviser. Annualized expenses of the Money Market Central Funds as of their most recent shareholder report date are less than .005%.
A complete unaudited list of holdings for each Fidelity Central Fund is available upon request or at the Securities and Exchange Commission (the SEC) website at www.sec.gov. In addition, the financial statements of the Fidelity Central Funds, which are not covered by the Fund's Report of Independent Registered Public Accounting Firm, are available on the SEC website or upon request.
3. Significant Accounting Policies.
The Fund is an investment company and applies the accounting and reporting guidance of the Financial Accounting Standards Board (FASB) Accounting Standards Codification Topic 946 Financial Services – Investments Companies. The financial statements have been prepared in conformity with accounting principles generally accepted in the United States of America (GAAP), which require management to make certain estimates and assumptions at the date of the financial statements. Actual results could differ from those estimates. Subsequent events, if any, through the date that the financial statements were issued have been evaluated in the preparation of the financial statements. The following summarizes the significant accounting policies of the Fund:
Investment Valuation. Investments are valued as of 4:00 p.m. Eastern time on the last calendar day of the period. The Board of Trustees (the Board) has delegated the day to day responsibility for the valuation of the Fund's investments to the Fair Value Committee (the Committee) established by the Fund's investment adviser. In accordance with valuation policies and procedures approved by the Board, the Fund attempts to obtain prices from one or more third party pricing vendors or brokers to value its investments. When current market prices, quotations or currency exchange rates are not readily available or reliable, investments will be fair valued in good faith by the Committee, in accordance with procedures adopted by the Board. Factors used in determining fair value vary by investment type and may include market or investment specific events. The frequency with which these procedures are used cannot be predicted and they may be utilized to a significant extent. The Committee oversees the Fund's valuation policies and procedures and reports to the Board on the Committee's activities and fair value determinations. The Board monitors the appropriateness of the procedures used in valuing the Fund's investments and ratifies the fair value determinations of the Committee.
The Fund categorizes the inputs to valuation techniques used to value its investments into a disclosure hierarchy consisting of three levels as shown below:
- Level 1 – quoted prices in active markets for identical investments
- Level 2 – other significant observable inputs (including quoted prices for similar investments, interest rates, prepayment speeds, etc.)
- Level 3 – unobservable inputs (including the Fund's own assumptions based on the best information available)
Valuation techniques used to value the Fund's investments by major category are as follows:
Equity securities, including restricted securities, for which market quotations are readily available, are valued at the last reported sale price or official closing price as reported by a third party pricing vendor on the primary market or exchange on which they are traded and are categorized as Level 1 in the hierarchy. In the event there were no sales during the day or closing prices are not available, securities are valued at the last quoted bid price or may be valued using the last available price and are generally categorized as Level 2 in the hierarchy. For foreign equity securities, when market or security specific events arise, comparisons to the valuation of American Depositary Receipts (ADRs), futures contracts, Exchange-Traded Funds (ETFs) and certain indexes as well as quoted prices for similar securities may be used and would be categorized as Level 2 in the hierarchy. Utilizing these techniques may result in transfers between Level 1 and Level 2. For equity securities, including restricted securities, where observable inputs are limited, assumptions about market activity and risk are used and these securities may be categorized as Level 3 in the hierarchy.
Exchange-traded options are valued using the last sale price or, in the absence of a sale, the last offering price and are categorized as Level 1 in the hierarchy. Investments in open-end mutual funds, including the Fidelity Central Funds, are valued at their closing net asset value (NAV) each business day and are categorized as Level 1 in the hierarchy.
Changes in valuation techniques may result in transfers in or out of an assigned level within the disclosure hierarchy. The aggregate value of investments by input level as of June 30, 2018 is included at the end of the Fund's Schedule of Investments.
Foreign Currency. The Fund may use foreign currency contracts to facilitate transactions in foreign-denominated securities. Gains and losses from these transactions may arise from changes in the value of the foreign currency or if the counterparties do not perform under the contracts' terms.
Foreign-denominated assets, including investment securities, and liabilities are translated into U.S. dollars at the exchange rates at period end. Purchases and sales of investment securities, income and dividends received and expenses denominated in foreign currencies are translated into U.S. dollars at the exchange rate in effect on the transaction date.
The effects of exchange rate fluctuations on investments are included with the net realized and unrealized gain (loss) on investment securities. Other foreign currency transactions resulting in realized and unrealized gain (loss) are disclosed separately.
Investment Transactions and Income. For financial reporting purposes, the Fund's investment holdings and NAV include trades executed through the end of the last business day of the period. The NAV per share for processing shareholder transactions is calculated as of the close of business of the New York Stock Exchange (NYSE), normally 4:00 p.m. Eastern time and includes trades executed through the end of the prior business day. Gains and losses on securities sold are determined on the basis of identified cost and include proceeds received from litigation. Dividend income is recorded on the ex-dividend date, except for certain dividends from foreign securities where the ex-dividend date may have passed, which are recorded as soon as the Fund is informed of the ex-dividend date. Non-cash dividends included in dividend income, if any, are recorded at the fair market value of the securities received. Income and capital gain distributions from Fidelity Central Funds, if any, are recorded on the ex-dividend date. Certain distributions received by the Fund represent a return of capital or capital gain. The Fund determines the components of these distributions subsequent to the ex-dividend date, based upon receipt of tax filings or other correspondence relating to the underlying investment. These distributions are recorded as a reduction of cost of investments and/or as a realized gain. Investment income is recorded net of foreign taxes withheld where recovery of such taxes is uncertain.
Class Allocations and Expenses. Investment income, realized and unrealized capital gains and losses, common expenses of the Fund, and certain fund-level expense reductions, if any, are allocated daily on a pro-rata basis to each class based on the relative net assets of each class to the total net assets of the Fund. Each class differs with respect to transfer agent and distribution and service plan fees incurred. Certain expense reductions may also differ by class. For the reporting period, the allocated portion of income and expenses to each class as a percent of its average net assets may vary due to the timing of recording these transactions in relation to fluctuating net assets of the classes. Expenses directly attributable to a fund are charged to that fund. Expenses attributable to more than one fund are allocated among the respective funds on the basis of relative net assets or other appropriate methods. Expense estimates are accrued in the period to which they relate and adjustments are made when actual amounts are known.
Income Tax Information and Distributions to Shareholders. Each year, the Fund intends to qualify as a regulated investment company under Subchapter M of the Internal Revenue Code, including distributing substantially all of its taxable income and realized gains. As a result, no provision for U.S. Federal income taxes is required. As of June 30, 2018, the Fund did not have any unrecognized tax benefits in the financial statements; nor is the Fund aware of any tax positions for which it is reasonably possible that the total amounts of unrecognized tax benefits will significantly change in the next twelve months. The Fund files a U.S. federal tax return, in addition to state and local tax returns as required. The Fund's federal income tax returns are subject to examination by the Internal Revenue Service (IRS) for a period of three fiscal years after they are filed. State and local tax returns may be subject to examination for an additional fiscal year depending on the jurisdiction. Foreign taxes are provided for based on the Fund's understanding of the tax rules and rates that exist in the foreign markets in which it invests.
Distributions are declared and recorded on the ex-dividend date. Income and capital gain distributions are declared separately for each class. Income and capital gain distributions are determined in accordance with income tax regulations, which may differ from GAAP. In addition, the Fund claimed a portion of the payment made to redeeming shareholders as a distribution for income tax purposes.
Capital accounts within the financial statements are adjusted for permanent book-tax differences. These adjustments have no impact on net assets or the results of operations. Capital accounts are not adjusted for temporary book-tax differences which will reverse in a subsequent period.
Book-tax differences are primarily due to foreign currency transactions and losses deferred due to wash sales.
As of period end, the cost and unrealized appreciation (depreciation) in securities, and derivatives if applicable, for federal income tax purposes were as follows:
| Gross unrealized appreciation | $723,093,363 |
| Gross unrealized depreciation | (63,001,734) |
| Net unrealized appreciation (depreciation) | $660,091,629 |
| Tax Cost | $1,424,985,869 |
The tax-based components of distributable earnings as of period end were as follows:
| Undistributed ordinary income | $15,869,174 |
| Undistributed long-term capital gain | $184,723,748 |
| Net unrealized appreciation (depreciation) on securities and other investments | $660,084,751 |
The tax character of distributions paid was as follows:
| | June 30, 2018 | June 30, 2017 |
| Ordinary Income | $35,334,838 | $ 52,216,198 |
| Long-term Capital Gains | 308,590,093 | 17,291,428 |
| Total | $343,924,931 | $ 69,507,626 |
Restricted Securities. The Fund may invest in securities that are subject to legal or contractual restrictions on resale. These securities generally may be resold in transactions exempt from registration or to the public if the securities are registered. Disposal of these securities may involve time-consuming negotiations and expense, and prompt sale at an acceptable price may be difficult. Information regarding restricted securities is included at the end of the Fund's Schedule of Investments.
Consolidated Subsidiary. The Fund invests in certain investments through a wholly-owned subsidiary ("Subsidiary"), which may be subject to federal and state taxes upon disposition.
As of period end, the Fund held an investment of $5,061,179 in this Subsidiary, representing .25% of the Fund's net assets. The financial statements have been consolidated and include accounts of the Fund and the Subsidiary. Accordingly, all inter-company transactions and balances have been eliminated.
Any cash held by the Subsidiary is restricted as to its use and is presented as Restricted cash in the Statement of Assets and Liabilities.
4. Derivative Instruments.
Risk Exposures and the Use of Derivative Instruments. The Fund's investment objective allows the Fund to enter into various types of derivative contracts, including options. Derivatives are investments whose value is primarily derived from underlying assets, indices or reference rates and may be transacted on an exchange or over-the-counter (OTC). Derivatives may involve a future commitment to buy or sell a specified asset based on specified terms, to exchange future cash flows at periodic intervals based on a notional principal amount, or for one party to make one or more payments upon the occurrence of specified events in exchange for periodic payments from the other party.
The Fund used derivatives to increase returns and to manage exposure to certain risks as defined below. The success of any strategy involving derivatives depends on analysis of numerous economic factors, and if the strategies for investment do not work as intended, the Fund may not achieve its objectives.
The Fund's use of derivatives increased or decreased its exposure to the following risk:
| Equity Risk | Equity risk relates to the fluctuations in the value of financial instruments as a result of changes in market prices (other than those arising from interest rate risk or foreign exchange risk), whether caused by factors specific to an individual investment, its issuer, or all factors affecting all instruments traded in a market or market segment.
|
The Fund is also exposed to additional risks from investing in derivatives, such as liquidity risk and counterparty credit risk. Liquidity risk is the risk that the Fund will be unable to close out the derivative in the open market in a timely manner. Counterparty credit risk is the risk that the counterparty will not be able to fulfill its obligation to the Fund. Derivative counterparty credit risk is managed through formal evaluation of the creditworthiness of all potential counterparties. On certain OTC derivatives such as options, the Fund attempts to reduce its exposure to counterparty credit risk by entering into an International Swaps and Derivatives Association, Inc. (ISDA) Master Agreement with each of its counterparties. The ISDA Master Agreement gives the Fund the right to terminate all transactions traded under such agreement upon the deterioration in the credit quality of the counterparty beyond specified levels. The ISDA Master Agreement gives each party the right, upon an event of default by the other party or a termination of the agreement, to close out all transactions traded under such agreement and to net amounts owed under each transaction to one net payable by one party to the other. To mitigate counterparty credit risk on bi-lateral OTC derivatives, the Fund receives collateral in the form of cash or securities once the Fund's net unrealized appreciation on outstanding derivative contracts under an ISDA Master Agreement exceeds certain applicable thresholds, subject to certain minimum transfer provisions. The collateral received is held in segregated accounts with the Fund's custodian bank in accordance with the collateral agreements entered into between the Fund, the counterparty and the Fund's custodian bank. The Fund could experience delays and costs in gaining access to the collateral even though it is held by the Fund's custodian bank. The Fund's maximum risk of loss from counterparty credit risk related to bi-lateral OTC derivatives is generally the aggregate unrealized appreciation and unpaid counterparty payments in excess of any collateral pledged by the counterparty to the Fund. The Fund may be required to pledge collateral for the benefit of the counterparties on bi-lateral OTC derivatives in an amount not less than each counterparty's unrealized appreciation on outstanding derivative contracts, subject to certain minimum transfer provisions, and any such pledged collateral is identified in the Schedule of Investments. Counterparty credit risk related to exchange-traded options may be mitigated by the protection provided by the exchange on which they trade.
Investing in derivatives may involve greater risks than investing in the underlying assets directly and, to varying degrees, may involve risk of loss in excess of any initial investment and collateral received and amounts recognized in the Statement of Assets and Liabilities. In addition, there may be the risk that the change in value of the derivative contract does not correspond to the change in value of the underlying instrument.
Options. Options give the purchaser the right, but not the obligation, to buy (call) or sell (put) an underlying security or financial instrument at an agreed exercise or strike price between or on certain dates. Options obligate the seller (writer) to buy (put) or sell (call) an underlying instrument at the exercise or strike price or cash settle an underlying derivative instrument if the holder exercises the option on or before the expiration date.
The Fund used exchange-traded and OTC written covered call options to manage its exposure to the market. When the Fund writes a covered call option, the Fund holds the underlying instrument which must be delivered to the holder upon the exercise of the option.
Upon entering into a written options contract, the Fund will receive a premium. Premiums received are reflected as a liability on the Statement of Assets and Liabilities. Options are valued daily and any unrealized appreciation (depreciation) is reflected on the Statement of Assets and Liabilities. When a written option is exercised, the premium is added to the proceeds from the sale of the underlying instrument in determining the gain or loss realized on that investment. When an option is closed the Fund will realize a gain or loss depending on whether the proceeds or amount paid for the closing sale transaction are greater or less than the premium received. When an option expires, gains and losses are realized to the extent of premiums received. The net realized gain (loss) on closed and expired written options and the change in net unrealized appreciation (depreciation) on written options are presented in the Statement of Operations.
Writing call options tends to decrease exposure to the underlying instrument and risk of loss is the change in value in excess of the premium received.
Any open options at period end are presented in the Schedule of Investments under the caption "Written Options" and are representative of volume of activity during the period.
5. Purchases and Sales of Investments.
Purchases and sales of securities, other than short-term securities, aggregated $899,940,909 and $1,229,414,666, respectively.
6. Fees and Other Transactions with Affiliates.
Management Fee. Fidelity Management & Research Company (the investment adviser) and its affiliates provide the Fund with investment management related services for which the Fund pays a monthly management fee. The management fee is the sum of an individual fund fee rate that is based on an annual rate of .20% of the Fund's average net assets and an annualized group fee rate that averaged .24% during the period. The group fee rate is based upon the average net assets of all the mutual funds advised by the investment adviser, including any mutual funds previously advised by the investment adviser that are currently advised by Fidelity SelectCo, LLC, an affiliate of the investment adviser. The group fee rate decreases as assets under management increase and increases as assets under management decrease. For the reporting period, the total annual management fee rate was .44% of the Fund's average net assets.
Distribution and Service Plan Fees. In accordance with Rule 12b-1 of the 1940 Act, the Fund has adopted separate Distribution and Service Plans for each class of shares. Certain classes pay Fidelity Distributors Corporation (FDC), an affiliate of the investment adviser, separate Distribution and Service Fees, each of which is based on an annual percentage of each class' average net assets. In addition, FDC may pay financial intermediaries for selling shares of the Fund and providing shareholder support services. For the period, the Distribution and Service Fee rates, total fees and amounts retained by FDC were as follows:
| | Distribution Fee | Service Fee | Total Fees | Retained by FDC |
| Class A | -% | .25% | $154,726 | $6,739 |
| Class M | .25% | .25% | 140,024 | 376 |
| Class C | .75% | .25% | 341,704 | 35,842 |
| | | | $636,454 | $ 42,957 |
Sales Load. FDC may receive a front-end sales charge of up to 5.75% for selling Class A shares and 3.50% for selling Class M shares, some of which is paid to financial intermediaries for selling shares of the Fund. Depending on the holding period, FDC may receive contingent deferred sales charges levied on Class A, Class M and Class C redemptions. The deferred sales charges are 1.00% for Class C shares, 1.00% for certain purchases of Class A shares and .25% for certain purchases of Class M shares.
For the period, sales charge amounts retained by FDC were as follows:
| | Retained by FDC |
| Class A | $26,542 |
| Class M | 2,683 |
| Class C(a) | 2,009 |
| | $31,234 |
(a) When Class C shares are initially sold, FDC pays commissions from its own resources to financial intermediaries through which the sales are made.
Transfer Agent Fees. Fidelity Investments Institutional Operations Company, Inc., (FIIOC), an affiliate of the investment adviser, is the transfer, dividend disbursing and shareholder servicing agent for each class of the Fund. FIIOC receives account fees and asset-based fees that vary according to the account size and type of account of the shareholders of the respective classes of the Fund, except for Class Z. FIIOC receives an asset-based fee of Class Z's average net assets. FIIOC pays for typesetting, printing and mailing of shareholder reports, except proxy statements.
For the period, transfer agent fees for each class were as follows:
| | Amount | % of Class-Level Average Net Assets |
| Class A | $123,723 | .20 |
| Class M | 57,225 | .20 |
| Class C | 67,781 | .20 |
| Mega Cap Stock | 3,448,685 | .20 |
| Class I | 274,939 | .18 |
| Class Z | 127,297 | .05 |
| | $4,099,650 | |
Accounting and Security Lending Fees. Fidelity Service Company, Inc. (FSC), an affiliate of the investment adviser, maintains the Fund's accounting records. The accounting fee is based on the level of average net assets for each month. Under a separate contract, FSC administers the security lending program. The security lending fee is based on the number and duration of lending transactions. For the period, the fees were equivalent to an annual rate of .03%.
Brokerage Commissions. The Fund placed a portion of its portfolio transactions with brokerage firms which are affiliates of the investment adviser. Brokerage commissions are included in net realized gain (loss) and change in net unrealized appreciation (depreciation) in the Statement of Operations. The commissions paid to these affiliated firms were $12,963 for the period.
Interfund Lending Program. Pursuant to an Exemptive Order issued by the SEC, the Fund, along with other registered investment companies having management contracts with Fidelity Management & Research Company (FMR) or other affiliated entities of FMR, may participate in an interfund lending program. This program provides an alternative credit facility allowing the funds to borrow from, or lend money to, other participating affiliated funds. At period end, there were no interfund loans outstanding. The Fund's activity in this program during the period for which loans were outstanding was as follows:
| Borrower or Lender | Average Loan Balance | Weighted Average Interest Rate | Interest Expense |
| Borrower | $16,479,385 | 1.63% | $19,432 |
Interfund Trades. The Fund may purchase from or sell securities to other Fidelity Funds under procedures adopted by the Board. The procedures have been designed to ensure these interfund trades are executed in accordance with Rule 17a-7 of the 1940 Act. Interfund trades are included within the respective purchases and sales amounts shown in the Purchases and Sales of Investments note.
Other. During the period, the investment adviser reimbursed the Fund for certain losses in the amount of $5,369.
7. Committed Line of Credit.
The Fund participates with other funds managed by the investment adviser or an affiliate in a $4.25 billion credit facility (the "line of credit") to be utilized for temporary or emergency purposes to fund shareholder redemptions or for other short-term liquidity purposes. The Fund has agreed to pay commitment fees on its pro-rata portion of the line of credit, which amounted to $6,930 and is reflected in Miscellaneous expenses on the Statement of Operations. During the period, the Fund did not borrow on this line of credit.
8. Security Lending.
The Fund lends portfolio securities through a lending agent from time to time in order to earn additional income. For equity securities, a lending agent is used and may loan securities to certain qualified borrowers, including Fidelity Capital Markets (FCM), a broker-dealer affiliated with the Fund. On the settlement date of the loan, the Fund receives collateral (in the form of U.S. Treasury obligations, letters of credit and/or cash) against the loaned securities and maintains collateral in an amount not less than 100% of the market value of the loaned securities during the period of the loan. The market value of the loaned securities is determined at the close of business of the Fund and any additional required collateral is delivered to the Fund on the next business day. The Fund or borrower may terminate the loan at any time, and if the borrower defaults on its obligation to return the securities loaned because of insolvency or other reasons, the Fund may apply collateral received from the borrower against the obligation. The Fund may experience delays and costs in recovering the securities loaned. Any cash collateral received is invested in the Fidelity Securities Lending Cash Central Fund. The value of loaned securities and cash collateral at period end are disclosed on the Fund's Statement of Assets and Liabilities. At period end, there were no security loans outstanding with FCM. Security lending income represents the income earned on investing cash collateral, less rebates paid to borrowers and any lending agent fees associated with the loan, plus any premium payments received for lending certain types of securities. Security lending income is presented in the Statement of Operations as a component of income from Fidelity Central Funds. Total security lending income during the period amounted to $69,639, including $9,575 from securities loaned to FCM.
9. Expense Reductions.
Commissions paid to certain brokers with whom the investment adviser, or its affiliates, places trades on behalf of the Fund include an amount in addition to trade execution, which may be rebated back to the Fund to offset certain expenses. This amount totaled $73,480 for the period. Through arrangements with the Fund's custodian, credits realized as a result of certain uninvested cash balances were used to reduce the Fund's expenses. During the period, these credits reduced the Fund's custody expenses by $4,152.
In addition, during the period the investment adviser reimbursed and/or waived a portion of fund-level operating expenses in the amount of $29,025.
10. Distributions to Shareholders.
Distributions to shareholders of each class were as follows:
| | Year ended
June 30, 2018 | Year ended
June 30, 2017 |
| From net investment income | | |
| Class A | $797,191 | $899,180 |
| Class M | 298,321 | 291,257 |
| Class C | 202,655 | 185,391 |
| Mega Cap Stock | 25,922,911 | 48,569,058 |
| Class I | 2,395,397 | 2,230,910 |
| Class Z | 5,718,363 | 40,402 |
| Total | $35,334,838 | $52,216,198 |
| From net realized gain | | |
| Class A | $8,451,193 | $344,305 |
| Class M | 3,919,910 | 137,941 |
| Class C | 4,788,475 | 163,362 |
| Mega Cap Stock | 224,982,442 | 15,922,546 |
| Class I | 21,104,231 | 711,666 |
| Class Z | 45,343,842 | 11,608 |
| Total | $308,590,093 | $17,291,428 |
11. Share Transactions.
Share transactions for each class were as follows and may contain automatic conversions between classes or exchanges between affiliated funds:
| | Shares | Shares | Dollars | Dollars |
| | Year ended June 30, 2018 | Year ended June 30, 2017 | Year ended June 30, 2018 | Year ended June 30, 2017 |
| Class A | | | | |
| Shares sold | 874,212 | 1,038,892 | $15,067,671 | $18,074,597 |
| Reinvestment of distributions | 559,999 | 70,692 | 9,205,183 | 1,204,625 |
| Shares redeemed | (1,116,309) | (2,254,920) | (19,199,830) | (39,387,612) |
| Net increase (decrease) | 317,902 | (1,145,336) | $5,073,024 | $(20,108,390) |
| Class M | | | | |
| Shares sold | 150,897 | 351,517 | $2,604,152 | $6,011,579 |
| Reinvestment of distributions | 255,533 | 24,971 | 4,196,932 | 425,997 |
| Shares redeemed | (414,715) | (523,179) | (7,130,591) | (8,962,447) |
| Net increase (decrease) | (8,285) | (146,691) | $(329,507) | $(2,524,871) |
| Class C | | | | |
| Shares sold | 194,437 | 321,807 | $3,315,957 | $5,527,295 |
| Reinvestment of distributions | 306,537 | 20,217 | 4,962,564 | 342,413 |
| Shares redeemed | (411,860) | (518,468) | (7,044,158) | (8,770,183) |
| Net increase (decrease) | 89,114 | (176,444) | $1,234,363 | $(2,900,475) |
| Mega Cap Stock | | | | |
| Shares sold | 30,261,141 | 37,223,324 | $526,149,849 | $643,884,050 |
| Reinvestment of distributions | 14,397,242 | 3,517,132 | 239,269,740 | 60,338,870 |
| Shares redeemed | (33,576,247) | (148,979,826) | (587,646,893) | (2,654,363,774) |
| Net increase (decrease) | 11,082,136 | (108,239,370) | $177,772,696 | $(1,950,140,854) |
| Class I | | | | |
| Shares sold | 1,353,002 | 1,883,800 | $23,702,795 | $33,590,247 |
| Reinvestment of distributions | 1,407,682 | 170,239 | 23,366,927 | 2,921,152 |
| Shares redeemed | (2,838,061) | (3,246,889) | (49,414,486) | (56,705,836) |
| Net increase (decrease) | (77,377) | (1,192,850) | $(2,344,764) | $(20,194,437) |
| Class Z | | | | |
| Shares sold | 4,063,436 | 17,352,586 | $69,724,386 | $316,033,855 |
| Reinvestment of distributions | 1,742,762 | 3,045 | 28,819,243 | 52,010 |
| Shares redeemed | (18,308,914) | (320,945) | (307,407,172) | (5,787,246) |
| Net increase (decrease) | (12,502,716) | 17,034,686 | $(208,863,543) | $310,298,619 |
12. Other.
The Fund's organizational documents provide former and current trustees and officers with a limited indemnification against liabilities arising in connection with the performance of their duties to the Fund. In the normal course of business, the Fund may also enter into contracts that provide general indemnifications. The Fund's maximum exposure under these arrangements is unknown as this would be dependent on future claims that may be made against the Fund. The risk of material loss from such claims is considered remote.
Report of Independent Registered Public Accounting Firm
To the Board of Trustees of Fidelity Hastings Street Trust and Shareholders of Fidelity Mega Cap Stock Fund:
Opinion on the Financial Statements
We have audited the accompanying statement of assets and liabilities, including the schedule of investments, of Fidelity Mega Cap Stock Fund (one of the funds constituting Fidelity Hastings Street Trust, referred to hereafter as the "Fund") as of June 30, 2018, the related statement of operations for the year ended June 30, 2018, the statement of changes in net assets for each of the two years in the period ended June 30, 2018, including the related notes, and the financial highlights for each of the periods indicated therein (collectively referred to as the “financial statements”). In our opinion, the financial statements present fairly, in all material respects, the financial position of the Fund as of June 30, 2018, the results of its operations for the year then ended, the changes in its net assets for each of the two years in the period ended June 30, 2018 and the financial highlights for each of the periods indicated therein in conformity with accounting principles generally accepted in the United States of America.
Basis for Opinion
These financial statements are the responsibility of the Fund’s management. Our responsibility is to express an opinion on the Fund’s financial statements based on our audits. We are a public accounting firm registered with the Public Company Accounting Oversight Board (United States) (“PCAOB”) and are required to be independent with respect to the Fund in accordance with the U.S. federal securities laws and the applicable rules and regulations of the Securities and Exchange Commission and the PCAOB.
We conducted our audits of these financial statements in accordance with the standards of the PCAOB. Those standards require that we plan and perform the audit to obtain reasonable assurance about whether the financial statements are free of material misstatement, whether due to error or fraud.
Our audits included performing procedures to assess the risks of material misstatement of the financial statements, whether due to error or fraud, and performing procedures that respond to those risks. Such procedures included examining, on a test basis, evidence regarding the amounts and disclosures in the financial statements. Our audits also included evaluating the accounting principles used and significant estimates made by management, as well as evaluating the overall presentation of the financial statements. Our procedures included confirmation of securities owned as of June 30, 2018 by correspondence with the custodian, and brokers; when replies were not received from brokers, we performed other auditing procedures. We believe that our audits provide a reasonable basis for our opinion.
PricewaterhouseCoopers LLP
Boston, Massachusetts
August 13, 2018
We have served as the auditor of one or more investment companies in the Fidelity group of funds since 1932.
Trustees and Officers
The Trustees, Members of the Advisory Board (if any), and officers of the trust and fund, as applicable, are listed below. The Board of Trustees governs the fund and is responsible for protecting the interests of shareholders. The Trustees are experienced executives who meet periodically throughout the year to oversee the fund's activities, review contractual arrangements with companies that provide services to the fund, oversee management of the risks associated with such activities and contractual arrangements, and review the fund's performance. Except for Michael E. Wiley, each of the Trustees oversees 284 funds. Mr. Wiley oversees 197 funds.
The Trustees hold office without limit in time except that (a) any Trustee may resign; (b) any Trustee may be removed by written instrument, signed by at least two-thirds of the number of Trustees prior to such removal; (c) any Trustee who requests to be retired or who has become incapacitated by illness or injury may be retired by written instrument signed by a majority of the other Trustees; and (d) any Trustee may be removed at any special meeting of shareholders by a two-thirds vote of the outstanding voting securities of the trust. Each Trustee who is not an interested person (as defined in the 1940 Act) of the trust and the fund is referred to herein as an Independent Trustee. Each Independent Trustee shall retire not later than the last day of the calendar year in which his or her 75th birthday occurs. The Independent Trustees may waive this mandatory retirement age policy with respect to individual Trustees. Officers and Advisory Board Members hold office without limit in time, except that any officer or Advisory Board Member may resign or may be removed by a vote of a majority of the Trustees at any regular meeting or any special meeting of the Trustees. Except as indicated, each individual has held the office shown or other offices in the same company for the past five years.
The fund’s Statement of Additional Information (SAI) includes more information about the Trustees. To request a free copy, call Fidelity at 1-800-544-8544.
Experience, Skills, Attributes, and Qualifications of the Trustees. The Governance and Nominating Committee has adopted a statement of policy that describes the experience, qualifications, attributes, and skills that are necessary and desirable for potential Independent Trustee candidates (Statement of Policy). The Board believes that each Trustee satisfied at the time he or she was initially elected or appointed a Trustee, and continues to satisfy, the standards contemplated by the Statement of Policy. The Governance and Nominating Committee also engages professional search firms to help identify potential Independent Trustee candidates who have the experience, qualifications, attributes, and skills consistent with the Statement of Policy. From time to time, additional criteria based on the composition and skills of the current Independent Trustees, as well as experience or skills that may be appropriate in light of future changes to board composition, business conditions, and regulatory or other developments, have also been considered by the professional search firms and the Governance and Nominating Committee. In addition, the Board takes into account the Trustees' commitment and participation in Board and committee meetings, as well as their leadership of standing and ad hoc committees throughout their tenure.
In determining that a particular Trustee was and continues to be qualified to serve as a Trustee, the Board has considered a variety of criteria, none of which, in isolation, was controlling. The Board believes that, collectively, the Trustees have balanced and diverse experience, qualifications, attributes, and skills, which allow the Board to operate effectively in governing the fund and protecting the interests of shareholders. Information about the specific experience, skills, attributes, and qualifications of each Trustee, which in each case led to the Board's conclusion that the Trustee should serve (or continue to serve) as a trustee of the fund, is provided below.
Board Structure and Oversight Function. James C. Curvey is an interested person and currently serves as Chairman. The Trustees have determined that an interested Chairman is appropriate and benefits shareholders because an interested Chairman has a personal and professional stake in the quality and continuity of services provided to the fund. Independent Trustees exercise their informed business judgment to appoint an individual of their choosing to serve as Chairman, regardless of whether the Trustee happens to be independent or a member of management. The Independent Trustees have determined that they can act independently and effectively without having an Independent Trustee serve as Chairman and that a key structural component for assuring that they are in a position to do so is for the Independent Trustees to constitute a substantial majority for the Board. The Independent Trustees also regularly meet in executive session. Ned C. Lautenbach serves as Chairman of the Independent Trustees and as such (i) acts as a liaison between the Independent Trustees and management with respect to matters important to the Independent Trustees and (ii) with management prepares agendas for Board meetings.
Fidelity® funds are overseen by different Boards of Trustees. The fund's Board oversees Fidelity's high income and certain equity funds, and other Boards oversee Fidelity's investment-grade bond, money market, asset allocation, and other equity funds. The asset allocation funds may invest in Fidelity® funds overseen by the fund's Board. The use of separate Boards, each with its own committee structure, allows the Trustees of each group of Fidelity® funds to focus on the unique issues of the funds they oversee, including common research, investment, and operational issues. On occasion, the separate Boards establish joint committees to address issues of overlapping consequences for the Fidelity® funds overseen by each Board.
The Trustees operate using a system of committees to facilitate the timely and efficient consideration of all matters of importance to the Trustees, the fund, and fund shareholders and to facilitate compliance with legal and regulatory requirements and oversight of the fund's activities and associated risks. The Board, acting through its committees, has charged FMR and its affiliates with (i) identifying events or circumstances the occurrence of which could have demonstrably adverse effects on the fund's business and/or reputation; (ii) implementing processes and controls to lessen the possibility that such events or circumstances occur or to mitigate the effects of such events or circumstances if they do occur; and (iii) creating and maintaining a system designed to evaluate continuously business and market conditions in order to facilitate the identification and implementation processes described in (i) and (ii) above. Because the day-to-day operations and activities of the fund are carried out by or through FMR, its affiliates, and other service providers, the fund's exposure to risks is mitigated but not eliminated by the processes overseen by the Trustees. While each of the Board's committees has responsibility for overseeing different aspects of the fund's activities, oversight is exercised primarily through the Operations, Audit, and Compliance Committees. In addition, the Independent Trustees have worked with Fidelity to enhance the Board's oversight of investment and financial risks, legal and regulatory risks, technology risks, and operational risks, including the development of additional risk reporting to the Board. Appropriate personnel, including but not limited to the fund's Chief Compliance Officer (CCO), FMR's internal auditor, the independent accountants, the fund's Treasurer and portfolio management personnel, make periodic reports to the Board's committees, as appropriate, including an annual review of Fidelity's risk management program for the Fidelity® funds. The responsibilities of each standing committee, including their oversight responsibilities, are described further under "Standing Committees of the Trustees."
Interested Trustees*:
Correspondence intended for a Trustee who is an interested person may be sent to Fidelity Investments, 245 Summer Street, Boston, Massachusetts 02210.
Name, Year of Birth; Principal Occupations and Other Relevant Experience+
James C. Curvey (1935)
Year of Election or Appointment: 2007
Trustee
Chairman of the Board of Trustees
Mr. Curvey also serves as Trustee of other Fidelity® funds. Mr. Curvey is Vice Chairman (2007-present) and Director of FMR LLC (diversified financial services company). In addition, Mr. Curvey is an Overseer Emeritus for the Boston Symphony Orchestra, a Director of Artis-Naples, and a Trustee of Brewster Academy in Wolfeboro, New Hampshire. Previously, Mr. Curvey served as a Director of Fidelity Research & Analysis Co. (investment adviser firm, 2009-2018), Director of Fidelity Investments Money Management, Inc. (investment adviser firm, 2009-2014) and a Director of FMR and FMR Co., Inc. (investment adviser firms, 2007-2014).
Charles S. Morrison (1960)
Year of Election or Appointment: 2014
Trustee
Mr. Morrison also serves as Trustee of other funds. He serves as President of Fidelity SelectCo, LLC (investment adviser firm, 2017-present) and Fidelity Management & Research Company (FMR) (investment adviser firm, 2016-present), a Director of Fidelity Investments Money Management, Inc. (FIMM) (investment adviser firm, 2014-present), Director of Fidelity SelectCo, LLC (investment adviser firm, 2014-present), President, Asset Management (2014-present), and is an employee of Fidelity Investments. Previously, Mr. Morrison served as Vice President of Fidelity's Fixed Income and Asset Allocation Funds (2012-2014), President, Fixed Income (2011-2014), Vice President of Fidelity's Money Market Funds (2005-2009), President, Money Market Group Leader of FMR (investment adviser firm, 2009), and Senior Vice President, Money Market Group of FMR (2004-2009). Mr. Morrison also served as Vice President of Fidelity's Bond Funds (2002-2005), certain Balanced Funds (2002-2005), and certain Asset Allocation Funds (2002-2007), and as Senior Vice President (2002-2005) of Fidelity's Bond Division.
* Determined to be an “Interested Trustee” by virtue of, among other things, his or her affiliation with the trust or various entities under common control with FMR.
+ The information includes the Trustee's principal occupation during the last five years and other information relating to the experience, attributes, and skills relevant to the Trustee's qualifications to serve as a Trustee, which led to the conclusion that the Trustee should serve as a Trustee for the fund.
Independent Trustees:
Correspondence intended for an Independent Trustee may be sent to Fidelity Investments, P.O. Box 55235, Boston, Massachusetts 02205-5235.
Name, Year of Birth; Principal Occupations and Other Relevant Experience+
Dennis J. Dirks (1948)
Year of Election or Appointment: 2005
Trustee
Mr. Dirks also serves as Trustee of other Fidelity® funds. Prior to his retirement in May 2003, Mr. Dirks was Chief Operating Officer and a member of the Board of The Depository Trust & Clearing Corporation (DTCC). He also served as President, Chief Operating Officer, and Board member of The Depository Trust Company (DTC) and President and Board member of the National Securities Clearing Corporation (NSCC). In addition, Mr. Dirks served as Chief Executive Officer and Board member of the Government Securities Clearing Corporation, Chief Executive Officer and Board member of the Mortgage-Backed Securities Clearing Corporation, as a Trustee and a member of the Finance Committee of Manhattan College (2005-2008), as a Trustee and a member of the Finance Committee of AHRC of Nassau County (2006-2008), as a member of the Independent Directors Council (IDC) Governing Council (2010-2015), and as a member of the Board of Directors for The Brookville Center for Children’s Services, Inc. (2009-2017). Mr. Dirks is a member of the Finance Committee (2016-present), Board of Directors (2017-present) and Board of Trustees (2018-present) and is Treasurer (2018-present) of the Asolo Repertory Theatre.
Donald F. Donahue (1950)
Year of Election or Appointment: 2018
Trustee
Mr. Donahue also serves as a Trustee of other Fidelity® funds. Mr. Donahue is President and Chief Executive Officer of Miranda Partners, LLC (risk consulting for the financial services industry, 2012-present). Previously, Mr. Donahue served as a Member of the Advisory Board of certain Fidelity® funds (2015-2018) and Chief Executive Officer (2006-2012), Chief Operating Officer (2003-2006), and Managing Director, Customer Marketing and Development (1999-2003) of The Depository Trust & Clearing Corporation (financial markets infrastructure). Mr. Donahue serves as a Member (2007-present) and Co-Chairman (2016-present) of the Board of Directors of United Way of New York, Member of the Board of Directors of NYC Leadership Academy (2012-present) and Member of the Board of Advisors of Ripple Labs, Inc. (financial services, 2015-present). He also served as Chairman (2010-2012) and Member of the Board of Directors (2012-2013) of Omgeo, LLC (financial services), Treasurer of United Way of New York (2012-2016), and Member of the Board of Directors of XBRL US (financial services non-profit, 2009-2012) and the International Securities Services Association (2009-2012).
Alan J. Lacy (1953)
Year of Election or Appointment: 2008
Trustee
Mr. Lacy also serves as Trustee of other Fidelity® funds. Mr. Lacy serves as a Director of Bristol-Myers Squibb Company (global pharmaceuticals, 2008-present). He is a Trustee of the California Chapter of The Nature Conservancy (2015-present) and a Director of the Center for Advanced Study in the Behavioral Sciences at Stanford University (2015-present). In addition, Mr. Lacy served as Senior Adviser (2007-2014) of Oak Hill Capital Partners, L.P. (private equity) and also served as Chief Executive Officer (2005) and Vice Chairman (2005-2006) of Sears Holdings Corporation (retail) and Chief Executive Officer and Chairman of the Board of Sears, Roebuck and Co. (retail, 2000-2005). Previously, Mr. Lacy served as Chairman (2014-2017) and a member (2010-2017) of the Board of Directors of Dave & Buster’s Entertainment, Inc. (restaurant and entertainment complexes), as Chairman (2008-2011) and a member (2006-2015) of the Board of Trustees of the National Parks Conservation Association, and as a member of the Board of Directors for The Hillman Companies, Inc. (hardware wholesalers, 2010-2014), Earth Fare, Inc. (retail grocery, 2010-2014), and The Western Union Company (global money transfer, 2006-2011).
Ned C. Lautenbach (1944)
Year of Election or Appointment: 2000
Trustee
Chairman of the Independent Trustees
Mr. Lautenbach also serves as Trustee of other Fidelity® funds. Mr. Lautenbach currently serves as Vice Chair of the Board of Governors, State University System of Florida (2013-present) and is a member of the Council on Foreign Relations (1994-present). He is also a member and has most recently served as Chairman of the Board of Directors of Artis-Naples (2012-present). Previously, Mr. Lautenbach served as a member and then Lead Director of the Board of Directors of Eaton Corporation (diversified industrial, 1997-2016). He was also a Partner and Advisory Partner at Clayton, Dubilier & Rice, LLC (private equity investment, 1998-2010), as well as a Director of Sony Corporation (2006-2007). In addition, Mr. Lautenbach also had a 30-year career with IBM (technology company) during which time he served as Senior Vice President and a member of the Corporate Executive Committee (1968-1998).
Joseph Mauriello (1944)
Year of Election or Appointment: 2008
Trustee
Mr. Mauriello also serves as Trustee of other Fidelity® funds. Prior to his retirement in January 2006, Mr. Mauriello served in numerous senior management positions including Deputy Chairman and Chief Operating Officer (2004-2005), and Vice Chairman of Financial Services (2002-2004) of KPMG LLP US (professional services, 1965-2005). Mr. Mauriello currently serves as a member of the Board of Directors of XL Group plc. (global insurance and re-insurance, 2006-present) and the Independent Directors Council (IDC) Governing Council (2015-present). Previously, Mr. Mauriello served as a Director of the Hamilton Funds of the Bank of New York (2006-2007) and of Arcadia Resources Inc. (health care services and products, 2007-2012).
Cornelia M. Small (1944)
Year of Election or Appointment: 2005
Trustee
Ms. Small also serves as Trustee of other Fidelity® funds. Ms. Small is a member of the Board of Directors (2009-present) and Chair of the Investment Committee (2010-present) of the Teagle Foundation. Ms. Small also serves on the Investment Committee of the Berkshire Taconic Community Foundation (2008-present). Previously, Ms. Small served as Chairperson (2002-2008) and a member of the Investment Committee and Chairperson (2008-2012) and a member of the Board of Trustees of Smith College. In addition, Ms. Small served as Chief Investment Officer, Director of Global Equity Investments, and a member of the Board of Directors of Scudder, Stevens & Clark and Scudder Kemper Investments.
Garnett A. Smith (1947)
Year of Election or Appointment: 2018
Trustee
Mr. Smith also serves as Trustee of other Fidelity® funds. Prior to Mr. Smith's retirement, he served as Chairman and Chief Executive Officer of Inbrand Corp. (manufacturer of personal absorbent products, 1990-1997). He also served as President (1986-1990) of Inbrand Corp. Prior to his employment with Inbrand Corp., he was employed by a retail fabric chain and North Carolina National Bank. In addition, Mr. Smith served as a Member of the Advisory Board of certain Fidelity® funds (2012-2013) and as a board member of the Jackson Hole Land Trust (2009-2012).
David M. Thomas (1949)
Year of Election or Appointment: 2008
Trustee
Mr. Thomas also serves as Trustee of other Fidelity® funds. Mr. Thomas serves as Non-Executive Chairman of the Board of Directors of Fortune Brands Home and Security (home and security products, 2011-present), as a member of the Board of Directors (2004-present) and Presiding Director (2013-present) of Interpublic Group of Companies, Inc. (marketing communication), and as a member of the Board of Trustees of the University of Florida (2013-present). Previously, Mr. Thomas served as Executive Chairman (2005-2006) and Chairman and Chief Executive Officer (2000-2005) of IMS Health, Inc. (pharmaceutical and healthcare information solutions), and a Director of Fortune Brands, Inc. (consumer products, 2000-2011).
Michael E. Wiley (1950)
Year of Election or Appointment: 2018
Trustee
Mr. Wiley also serves as Trustee or Member of the Advisory Board of other Fidelity® funds. Mr. Wiley serves as a Director of Andeavor Corporation (independent oil refiner and marketer, 2005-present), a Director of Andeavor Logistics LP (natural resources logistics, 2015-present), and a Director of Bill Barrett Corporation (exploration and production, 2005-present). In addition, Mr. Wiley also serves as a Director of Post Oak Bank (privately-held bank, 2004-present). Previously, Mr. Wiley served as a Trustee of other Fidelity® funds (2008-2013), as a Director of Asia Pacific Exploration Consolidated (international oil and gas exploration and production, 2008-2013), as a member of the Board of Trustees of the University of Tulsa (2000-2006; 2007-2010), as a Senior Energy Advisor of Katzenbach Partners, LLC (consulting, 2006-2007), as an Advisory Director of Riverstone Holdings (private investment), Chairman, President, and CEO of Baker Hughes, Inc. (oilfield services, 2000-2004), and as Director of Spinnaker Exploration Company (exploration and production, 2001-2005).
+ The information includes the Trustee's principal occupation during the last five years and other information relating to the experience, attributes, and skills relevant to the Trustee's qualifications to serve as a Trustee, which led to the conclusion that the Trustee should serve as a Trustee for the fund.
Advisory Board Members and Officers:
Correspondence intended for a Member of the Advisory Board (if any) may be sent to Fidelity Investments, P.O. Box 55235, Boston, Massachusetts 02205-5235. Correspondence intended for an officer or Peter S. Lynch may be sent to Fidelity Investments, 245 Summer Street, Boston, Massachusetts 02210. Officers appear below in alphabetical order.
Name, Year of Birth; Principal Occupation
Peter S. Lynch (1944)
Year of Election or Appointment: 2003
Member of the Advisory Board
Mr. Lynch also serves as Member of the Advisory Board of other Fidelity® funds. Mr. Lynch is Vice Chairman and a Director of FMR (investment adviser firm) and FMR Co., Inc. (investment adviser firm). In addition, Mr. Lynch serves as a Trustee of Boston College and as the Chairman of the Inner-City Scholarship Fund. Previously, Mr. Lynch served on the Special Olympics International Board of Directors (1997-2006).
William S. Stavropoulos (1939)
Year of Election or Appointment: 2018
Member of the Advisory Board
Mr. Stavropoulos also serves as Member of the Advisory Board of other Fidelity® funds. Mr. Stavropoulos serves as President and Founder of the Michigan Baseball Foundation, the Great Lakes Loons (2007-present). Mr. Stavropoulos is Chairman Emeritus of the Board of Directors of The Dow Chemical Company, where he previously served in numerous senior management positions, including President, CEO (1995-2000; 2002-2004), Chairman of the Executive Committee (2000-2006), and as a member of the Board of Directors (1990-2006). Currently, Mr. Stavropoulos is Chairman of the Board of Directors of Univar Inc. (global distributor of commodity and specialty chemicals), a Director of Teradata Corporation (data warehousing and technology solutions), and a member of the Advisory Board for Metalmark Capital LLC (private equity investment, 2005-present). Mr. Stavropoulos is an operating advisor to Clayton, Dubilier & Rice, LLC (private equity investment). In addition, Mr. Stavropoulos is a member of the University of Notre Dame Advisory Council for the College of Science, a Trustee of the Rollin L. Gerstacker Foundation, and a Director of Artis-Naples in Naples, Florida. Previously, Mr. Stavropoulos served as Trustee of certain Fidelity® funds (2001-2018) and as a Director of Chemical Financial Corporation (bank holding company, 1993-2012) and Tyco International, Ltd. (multinational manufacturing and services, 2007-2012).
Carol B. Tomé (1957)
Year of Election or Appointment: 2018
Member of the Advisory Board
Ms. Tomé also serves as Member of the Advisory Board of other Fidelity® funds. Ms. Tomé is Chief Financial Officer (2001-present) and Executive Vice President of Corporate Services (2007-present) of The Home Depot, Inc. (home improvement retailer) and a Director (2003-present) and Chair of the Audit Committee (2004-present) of United Parcel Service, Inc. (package delivery and supply chain management). Previously, Ms. Tomé served as Trustee of certain Fidelity® funds (2017), Senior Vice President of Finance and Accounting/Treasurer (2000-2007) and Vice President and Treasurer (1995-2000) of The Home Depot, Inc. and Chair of the Board (2010-2012), Vice Chair of the Board (2009 and 2013), and a Director (2008-2013) of the Federal Reserve Bank of Atlanta. Ms. Tomé is also a director or trustee of many community and professional organizations.
Elizabeth Paige Baumann (1968)
Year of Election or Appointment: 2017
Anti-Money Laundering (AML) Officer
Ms. Baumann also serves as AML Officer of other funds. She is Chief AML Officer (2012-present) and Senior Vice President (2014-present) of FMR LLC (diversified financial services company) and is an employee of Fidelity Investments. Previously, Ms. Baumann served as AML Officer of the funds (2012-2016), and Vice President (2007-2014) and Deputy Anti-Money Laundering Officer (2007-2012) of FMR LLC.
Marc R. Bryant (1966)
Year of Election or Appointment: 2015
Secretary and Chief Legal Officer (CLO)
Mr. Bryant also serves as Secretary and CLO of other funds. Mr. Bryant serves as CLO, Secretary, and Senior Vice President of Fidelity Management & Research Company (investment adviser firm, 2015-present) and FMR Co., Inc. (investment adviser firm, 2015-present); Secretary of Fidelity SelectCo, LLC (investment adviser firm, 2015-present) and Fidelity Investments Money Management, Inc. (investment adviser firm, 2015-present); and CLO of Fidelity Management & Research (Hong Kong) Limited and FMR Investment Management (UK) Limited (investment adviser firms, 2015-present) and Fidelity Management & Research (Japan) Limited (investment adviser firm, 2016-present). He is Senior Vice President and Deputy General Counsel of FMR LLC (diversified financial services company). Previously, Mr. Bryant served as Secretary and CLO of Fidelity Rutland Square Trust II (2010-2014) and Assistant Secretary of Fidelity's Fixed Income and Asset Allocation Funds (2013-2015). Prior to joining Fidelity Investments, Mr. Bryant served as a Senior Vice President and the Head of Global Retail Legal for AllianceBernstein L.P. (2006-2010), and as the General Counsel for ProFund Advisors LLC (2001-2006).
John J. Burke III (1964)
Year of Election or Appointment: 2018
Chief Financial Officer
Mr. Burke also serves as Chief Financial Officer of other funds. Mr. Burke serves as Head of Investment Operations for Fidelity Fund and Investment Operations (2018-present) and is an employee of Fidelity Investments (1998-present). Previously Mr. Burke served as head of Asset Management Investment Operations (2012-2018).
William C. Coffey (1969)
Year of Election or Appointment: 2009
Assistant Secretary
Mr. Coffey also serves as Assistant Secretary of other funds. He is Senior Vice President and Deputy General Counsel of FMR LLC (diversified financial services company, 2010-present), and is an employee of Fidelity Investments. Previously, Mr. Coffey served as Vice President and Associate General Counsel of FMR LLC (2005-2009).
Timothy M. Cohen (1969)
Year of Election or Appointment: 2018
Vice President
Mr. Cohen also serves as Vice President of other funds. Mr. Cohen serves as Co-Head of Global Equity Research (2016-present), a Director of Fidelity Management & Research (Japan) Limited (investment adviser firm, 2016-present), and is an employee of Fidelity Investments. Previously, Mr. Cohen served as Chief Investment Officer - Equity and a Director of Fidelity Management & Research (U.K.) Inc. (investment adviser firm, 2013-2015) and as a Director of Fidelity Management & Research (Hong Kong) Limited (investment adviser firm, 2017).
Jonathan Davis (1968)
Year of Election or Appointment: 2010
Assistant Treasurer
Mr. Davis also serves as Assistant Treasurer of other funds. Mr. Davis serves as Assistant Treasurer of FMR Capital, Inc. (2017-present) and is an employee of Fidelity Investments. Previously, Mr. Davis served as Vice President and Associate General Counsel of FMR LLC (diversified financial services company, 2003-2010).
Adrien E. Deberghes (1967)
Year of Election or Appointment: 2016
Assistant Treasurer
Mr. Deberghes also serves as an officer of other funds. He serves as Assistant Treasurer of FMR Capital, Inc. (2017-present), Executive Vice President of Fidelity Investments Money Management, Inc. (FIMM) (investment adviser firm, 2016-present), and is an employee of Fidelity Investments (2008-present). Previously, Mr. Deberghes served as President and Treasurer of certain Fidelity® funds (2013-2018). Prior to joining Fidelity Investments, Mr. Deberghes was Senior Vice President of Mutual Fund Administration at State Street Corporation (2007-2008), Senior Director of Mutual Fund Administration at Investors Bank & Trust (2005-2007), and Director of Finance for Dunkin' Brands (2000-2005). Previously, Mr. Deberghes served in other fund officer roles.
Laura M. Del Prato (1964)
Year of Election or Appointment: 2018
Assistant Treasurer
Ms. Del Prato also serves as an officer of other funds. Ms. Del Prato is an employee of Fidelity Investments (2017-present). Prior to joining Fidelity Investments, Ms. Del Prato served as a Managing Director and Treasurer of the JPMorgan Mutual Funds (2014-2017). Prior to JPMorgan, Ms. Del Prato served as a partner at Cohen Fund Audit Services (accounting firm, 2012-2013) and KPMG LLP (accounting firm, 2004-2012).
Colm A. Hogan (1973)
Year of Election or Appointment: 2016
Deputy Treasurer
Mr. Hogan also serves as an officer of other funds. Mr. Hogan serves as Assistant Treasurer of FMR Capital, Inc. (2017-present) and is an employee of Fidelity Investments (2005-present). Previously, Mr. Hogan served as Assistant Treasurer of certain Fidelity® funds (2016-2018).
Pamela R. Holding (1964)
Year of Election or Appointment: 2018
Vice President
Ms. Holding also serves as a Vice President of other funds. Ms. Holding serves as Co-Head of Global Equity Research (2018-present) and is an employee of Fidelity Investments (2013-present).
Chris Maher (1972)
Year of Election or Appointment: 2013
Assistant Treasurer
Mr. Maher serves as Assistant Treasurer of other funds. Mr. Maher is Vice President of Valuation Oversight, serves as Assistant Treasurer of FMR Capital, Inc. (2017-present), and is an employee of Fidelity Investments. Previously, Mr. Maher served as Vice President of Asset Management Compliance (2013), Vice President of the Program Management Group of FMR (investment adviser firm, 2010-2013), and Vice President of Valuation Oversight (2008-2010).
Rieco E. Mello (1969)
Year of Election or Appointment: 2017
Assistant Treasurer
Mr. Mello also serves as Assistant Treasurer of other funds. Mr. Mello serves as Assistant Treasurer of FMR Capital, Inc. (2017-present) and is an employee of Fidelity Investments (1995-present).
Kenneth B. Robins (1969)
Year of Election or Appointment: 2016
Chief Compliance Officer
Mr. Robins also serves as an officer of other funds. Mr. Robins serves as Compliance Officer of Fidelity Management & Research Company and FMR Co., Inc. (investment adviser firms, 2016-present) and is an employee of Fidelity Investments (2004-present). Previously, Mr. Robins served as Executive Vice President of Fidelity Investments Money Management, Inc. (investment adviser firm, 2013-2016) and served in other fund officer roles.
Stacie M. Smith (1974)
Year of Election or Appointment: 2016
President and Treasurer
Ms. Smith also serves as an officer of other funds. Ms. Smith serves as Assistant Treasurer of FMR Capital, Inc. (2017-present), is an employee of Fidelity Investments (2009-present), and has served in other fund officer roles. Prior to joining Fidelity Investments, Ms. Smith served as Senior Audit Manager of Ernst & Young LLP (accounting firm, 1996-2009). Previously, Ms. Smith served as Assistant Treasurer (2013-2018) and Deputy Treasurer (2013-2016) of certain Fidelity® funds.
Marc L. Spector (1972)
Year of Election or Appointment: 2016
Assistant Treasurer
Mr. Spector also serves as an officer of other funds. Mr. Spector serves as Assistant Treasurer of FMR Capital, Inc. (2017-present) and is an employee of Fidelity Investments (2016-present). Prior to joining Fidelity Investments, Mr. Spector served as Director at the Siegfried Group (accounting firm, 2013-2016), and prior to Siegfried Group as audit senior manager at Deloitte & Touche (accounting firm, 2005-2013).
Renee Stagnone (1975)
Year of Election or Appointment: 2016
Assistant Treasurer
Ms. Stagnone also serves as an officer of other funds. Ms. Stagnone serves as Assistant Treasurer of FMR Capital, Inc. (2017-present) and is an employee of Fidelity Investments (1997-present). Previously, Ms. Stagnone served as Deputy Treasurer of certain Fidelity® funds (2013-2016).
Shareholder Expense Example
As a shareholder of the Fund, you incur two types of costs: (1) transaction costs, including sales charges (loads) on purchase payments or redemption proceeds, and (2) ongoing costs, including management fees, distribution and/or service (12b-1) fees and other Fund expenses. This Example is intended to help you understand your ongoing costs (in dollars) of investing in the Fund and to compare these costs with the ongoing costs of investing in other mutual funds.
The Example is based on an investment of $1,000 invested at the beginning of the period and held for the entire period (January 1, 2018 to June 30, 2018).
Actual Expenses
The first line of the accompanying table for each class of the Fund provides information about actual account values and actual expenses. You may use the information in this line, together with the amount you invested, to estimate the expenses that you paid over the period. Simply divide your account value by $1,000.00 (for example, an $8,600 account value divided by $1,000.00 = 8.6), then multiply the result by the number in the first line for a class of the Fund under the heading entitled "Expenses Paid During Period" to estimate the expenses you paid on your account during this period. A small balance maintenance fee of $12.00 that is charged once a year may apply for certain accounts with a value of less than $2,000. This fee is not included in the table below. If it was, the estimate of expenses you paid during the period would be higher, and your ending account value lower, by this amount. In addition, the Fund, as a shareholder in the underlying Fidelity Central Funds, will indirectly bear its pro-rata share of the fees and expenses incurred by the underlying Fidelity Central Funds. These fees and expenses are not included in the Fund's annualized expense ratio used to calculate the expense estimate in the table below.
Hypothetical Example for Comparison Purposes
The second line of the accompanying table for each class of the Fund provides information about hypothetical account values and hypothetical expenses based on a Class' actual expense ratio and an assumed rate of return of 5% per year before expenses, which is not the Class' actual return. The hypothetical account values and expenses may not be used to estimate the actual ending account balance or expenses you paid for the period. You may use this information to compare the ongoing costs of investing in the Fund and other funds. To do so, compare this 5% hypothetical example with the 5% hypothetical examples that appear in the shareholder reports of the other funds. A small balance maintenance fee of $12.00 that is charged once a year may apply for certain accounts with a value of less than $2,000. This fee is not included in the table below. If it was, the estimate of expenses you paid during the period would be higher, and your ending account value lower, by this amount. In addition, the Fund, as a shareholder in the underlying Fidelity Central Funds, will indirectly bear its pro-rata share of the fees and expenses incurred by the underlying Fidelity Central Funds. These fees and expenses are not included in the Fund's annualized expense ratio used to calculate the expense estimate in the table below.
Please note that the expenses shown in the table are meant to highlight your ongoing costs only and do not reflect any transaction costs. Therefore, the second line of the table is useful in comparing ongoing costs only, and will not help you determine the relative total costs of owning different funds. In addition, if these transactional costs were included, your costs would have been higher.
| | Annualized Expense Ratio-A | Beginning
Account Value
January 1, 2018 | Ending
Account Value
June 30, 2018 | Expenses Paid
During Period-B
January 1, 2018
to June 30, 2018 |
| Class A | .93% | | | |
| Actual | | $1,000.00 | $1,004.10 | $4.62 |
| Hypothetical-C | | $1,000.00 | $1,020.18 | $4.66 |
| Class M | 1.19% | | | |
| Actual | | $1,000.00 | $1,002.30 | $5.91 |
| Hypothetical-C | | $1,000.00 | $1,018.89 | $5.96 |
| Class C | 1.68% | | | |
| Actual | | $1,000.00 | $1,000.00 | $8.33 |
| Hypothetical-C | | $1,000.00 | $1,016.46 | $8.40 |
| Mega Cap Stock | .67% | | | |
| Actual | | $1,000.00 | $1,005.20 | $3.33 |
| Hypothetical-C | | $1,000.00 | $1,021.47 | $3.36 |
| Class I | .66% | | | |
| Actual | | $1,000.00 | $1,005.20 | $3.28 |
| Hypothetical-C | | $1,000.00 | $1,021.52 | $3.31 |
| Class Z | .53% | | | |
| Actual | | $1,000.00 | $1,005.80 | $2.64 |
| Hypothetical-C | | $1,000.00 | $1,022.17 | $2.66 |
A Annualized expense ratio reflects expenses net of applicable fee waivers.
B Expenses are equal to each Class' annualized expense ratio, multiplied by the average account value over the period, multiplied by 181/365 (to reflect the one-half year period).
C 5% return per year before expenses
Distributions (Unaudited)
The Board of Trustees of Fidelity Mega Cap Stock Fund voted to pay to shareholders of record at the opening of business on record date, the following distributions per share derived from capital gains realized from sales of portfolio securities, and dividends derived from net investment income:
| | Pay Date | Record Date | Dividends | Capital Gains |
| Fidelity Mega Cap Stock Fund | | | | |
| Class A | 08/13/18 | 08/10/18 | $0.125 | $1.633 |
| Class M | 08/13/18 | 08/10/18 | $0.098 | $1.633 |
| Class C | 08/13/18 | 08/10/18 | $0.058 | $1.633 |
| Mega Cap Stock | 08/13/18 | 08/10/18 | $0.145 | $1.633 |
| Class I | 08/13/18 | 08/10/18 | $0.147 | $1.633 |
| Class Z | 08/13/18 | 08/10/18 | $0.153 | $1.633 |
The fund hereby designates as a capital gain dividend with respect to the taxable year ended June 30, 2018, $273,762,945, or, if subsequently determined to be different, the net capital gain of such year.
Class A, Class M, Class C, Mega Cap Stock, Class I and Class Z designate 100% of the dividends distributed in August and December during the fiscal year as qualifying for the dividends–received deduction for corporate shareholders.
Class A, Class M, Class C, Mega Cap Stock, Class I and Class Z designate 100% of the dividends distributed in August and December during the fiscal year as amounts which may be taken into account as a dividend for purposes of the maximum rate under section 1(h)(11) of the Internal Revenue Code.
The fund will notify shareholders in January 2019 of amounts for use in preparing 2018 income tax returns.
Corporate Headquarters
245 Summer St.
Boston, MA 02210
www.fidelity.com
GII-ANN-0818
1.723705.119
Fidelity Advisor® Series Growth & Income Fund
Annual Report June 30, 2018 |
|
Contents
To view a fund's proxy voting guidelines and proxy voting record for the 12-month period ended June 30, visit http://www.fidelity.com/proxyvotingresults or visit the Securities and Exchange Commission's (SEC) web site at http://www.sec.gov.
You may also call 1-877-208-0098 to request a free copy of the proxy voting guidelines.
Standard & Poor's, S&P and S&P 500 are registered service marks of The McGraw-Hill Companies, Inc. and have been licensed for use by Fidelity Distributors Corporation.
Other third-party marks appearing herein are the property of their respective owners.
All other marks appearing herein are registered or unregistered trademarks or service marks of FMR LLC or an affiliated company. © 2018 FMR LLC. All rights reserved.
This report and the financial statements contained herein are submitted for the general information of the shareholders of the Fund. This report is not authorized for distribution to prospective investors in the Fund unless preceded or accompanied by an effective prospectus.
A fund files its complete schedule of portfolio holdings with the SEC for the first and third quarters of each fiscal year on Form N-Q. Forms N-Q are available on the SEC’s web site at http://www.sec.gov. A fund's Forms N-Q may be reviewed and copied at the SEC’s Public Reference Room in Washington, DC. Information regarding the operation of the SEC's Public Reference Room may be obtained by calling 1-800-SEC-0330.
For a complete list of a fund's portfolio holdings, view the most recent holdings listing, semiannual report, or annual report on Fidelity's web site at http://www.fidelity.com, http://www.institutional.fidelity.com, or http://www.401k.com, as applicable.
NOT FDIC INSURED •MAY LOSE VALUE •NO BANK GUARANTEE
Neither the Fund nor Fidelity Distributors Corporation is a bank.
Performance: The Bottom Line
Average annual total return reflects the change in the value of an investment, assuming reinvestment of distributions from dividend income and capital gains (the profits earned upon the sale of securities that have grown in value, if any) and assuming a constant rate of performance each year. The hypothetical investment and the average annual total returns do not reflect the deduction of taxes that a shareholder would pay on fund distributions or the redemption of fund shares. During periods of reimbursement by Fidelity, a fund’s total return will be greater than it would be had the reimbursement not occurred. How a fund did yesterday is no guarantee of how it will do tomorrow.
Average Annual Total Returns
| For the periods ended June 30, 2018 | Past 1 year | Past 5 years | Life of fundA |
| Fidelity Advisor® Series Growth & Income Fund | 11.43% | 11.11% | 12.86% |
A From December 6, 2012
Prior to August 1, 2013, the fund was named Fidelity Advisor® Series Mega Cap Fund, and the fund operated under certain different investment policies and compared its performance to a different additional index. The fund's historical performance may not represent its current investment policies.
$10,000 Over Life of Fund
Let's say hypothetically that $10,000 was invested in Fidelity Advisor® Series Growth & Income Fund on December 6, 2012, when the fund started.
The chart shows how the value of your investment would have changed, and also shows how the S&P 500® Index performed over the same period.

| Period Ending Values |
| $19,610 | Fidelity Advisor® Series Growth & Income Fund |
| $21,581 | S&P 500® Index |
Management's Discussion of Fund Performance
Market Recap: The U.S. equity bellwether S&P 500
® index gained 14.37% for the 12 months ending June 30, 2018, despite a resurgence in volatility that challenged the multiyear bull market. The steady growth seen throughout 2017 extended into the new year, as investors remained upbeat on hopes of continued strong economic and earnings growth. Stocks surged 5.73% in January alone. February was a decidedly different story, though, as volatility spiked amid fear that rising inflation and the potential for the economy to overheat would prompt the U.S. Federal Reserve to pick up the pace of interest rate hikes. The index returned -3.69% for the month, its first negative result since October 2016, and lost further ground in March on fear of a global trade war. The market stabilized in April and went on to achieve a solid gain for May. The uptrend continued through roughly mid-June, when escalating trade tension between the U.S. and China soured investor sentiment, and the index ended the 12 months with a two-week slump. By sector, information technology (+31%) led the way, rising on strong earnings growth from several major index constituents. Consumer discretionary (+24%) also stood out, largely driven by retailers (+50%). Energy gained 21% alongside higher oil prices. Notable laggards included some defensive groups – consumer staples (-4%), telecommunication services (+1%) and utilities (+3%) – that struggled amid rising interest rates and a general preference for risk.
Comments from Portfolio Manager Matthew Fruhan: For the fiscal year, the fund gained 11.43%, trailing the benchmark S&P 500
® index. The fund's underperformance of the benchmark was primarily due to weak security selection, especially in the health care, consumer discretionary and industrials sectors. The fund also was hurt by a significant underweight in the top-performing information technology and consumer discretionary sectors. Within the latter, lacking exposure to two large benchmark components, online retail giant Amazon.com and video-streaming service provider Netflix – neither of which we saw as attractively valued – stood out as significant relative detractors. It also hurt to overweight cable and media giant Comcast, one of our largest positions. In industrials, overweighting General Electric detracted, while in health care, our biggest individual detractor was a non-benchmark stake in drug manufacturer Teva Pharmaceutical Industries. In contrast, an overweight in the energy sector, which outperformed, was beneficial, while security selection in financials notably contributed, even as an overweighting in the group was a partly offsetting negative. Within energy, top individual contributors were energy producer ConocoPhillips and Suncor Energy, the latter a non-benchmark holding. Timely positioning in lagging energy giant Exxon Mobil also helped. Suncor and Exxon Mobil were among the fund's largest positions on June 30. Lastly, not owning poor-performing tobacco manufacturer and benchmark component Philip Morris International provided a meaningful lift.
The views expressed above reflect those of the portfolio manager(s) only through the end of the period as stated on the cover of this report and do not necessarily represent the views of Fidelity or any other person in the Fidelity organization. Any such views are subject to change at any time based upon market or other conditions and Fidelity disclaims any responsibility to update such views. These views may not be relied on as investment advice and, because investment decisions for a Fidelity fund are based on numerous factors, may not be relied on as an indication of trading intent on behalf of any Fidelity fund.
Investment Summary (Unaudited)
Top Ten Stocks as of June 30, 2018
| | % of fund's net assets |
| Microsoft Corp. | 3.9 |
| Bank of America Corp. | 3.1 |
| Exxon Mobil Corp. | 3.0 |
| Apple, Inc. | 2.5 |
| Comcast Corp. Class A | 2.5 |
| JPMorgan Chase & Co. | 2.5 |
| Citigroup, Inc. | 2.5 |
| Chevron Corp. | 2.2 |
| Wells Fargo & Co. | 2.2 |
| Suncor Energy, Inc. | 2.1 |
| | 26.5 |
Top Five Market Sectors as of June 30, 2018
| | % of fund's net assets |
| Financials | 20.0 |
| Information Technology | 16.0 |
| Energy | 14.6 |
| Health Care | 13.6 |
| Industrials | 11.3 |
Asset Allocation (% of fund's net assets)
| As of June 30, 2018 *,** |
| | Stocks | 97.0% |
| | Convertible Securities | 0.4% |
| | Other Investments | 0.1% |
| | Short-Term Investments and Net Other Assets (Liabilities) | 2.5% |

* Foreign investments - 13.8%
** Written options - 0.0%
Percentages shown as 0.0% may reflect amounts less than 0.05%.
Schedule of Investments June 30, 2018
Showing Percentage of Net Assets
| Common Stocks - 97.0% | | | |
| | | Shares | Value |
| CONSUMER DISCRETIONARY - 8.2% | | | |
| Hotels, Restaurants & Leisure - 0.7% | | | |
| Cedar Fair LP (depositary unit) | | 12,400 | $781,324 |
| Dine Brands Global, Inc. | | 36,900 | 2,760,120 |
| Dunkin' Brands Group, Inc. | | 105,100 | 7,259,257 |
| Papa John's International, Inc. (a) | | 21,700 | 1,100,624 |
| Starbucks Corp. | | 3,500 | 170,975 |
| | | | 12,072,300 |
| Media - 4.5% | | | |
| Comcast Corp. Class A | | 1,324,380 | 43,452,908 |
| Interpublic Group of Companies, Inc. | | 412,200 | 9,661,968 |
| Omnicom Group, Inc. | | 45,800 | 3,493,166 |
| The Walt Disney Co. | | 194,600 | 20,396,026 |
| Viacom, Inc. Class B (non-vtg.) | | 43,200 | 1,302,912 |
| | | | 78,306,980 |
| Multiline Retail - 0.3% | | | |
| Target Corp. | | 67,263 | 5,120,060 |
| Specialty Retail - 2.7% | | | |
| L Brands, Inc. | | 184,900 | 6,819,112 |
| Lowe's Companies, Inc. | | 205,477 | 19,637,437 |
| Ross Stores, Inc. | | 74,100 | 6,279,975 |
| TJX Companies, Inc. (b) | | 137,600 | 13,096,768 |
| | | | 45,833,292 |
|
| TOTAL CONSUMER DISCRETIONARY | | | 141,332,632 |
|
| CONSUMER STAPLES - 7.4% | | | |
| Beverages - 1.3% | | | |
| The Coca-Cola Co. | | 492,198 | 21,587,804 |
| Food & Staples Retailing - 1.2% | | | |
| Walmart, Inc. | | 241,800 | 20,710,170 |
| Food Products - 0.4% | | | |
| Campbell Soup Co. (a) | | 48,200 | 1,954,028 |
| The Hershey Co. | | 48,000 | 4,466,880 |
| | | | 6,420,908 |
| Household Products - 1.7% | | | |
| Kimberly-Clark Corp. | | 49,600 | 5,224,864 |
| Procter & Gamble Co. | | 257,387 | 20,091,629 |
| Reckitt Benckiser Group PLC | | 37,982 | 3,120,785 |
| Spectrum Brands Holdings, Inc. | | 13,700 | 1,118,194 |
| | | | 29,555,472 |
| Tobacco - 2.8% | | | |
| Altria Group, Inc. | | 570,800 | 32,415,732 |
| British American Tobacco PLC sponsored ADR | | 314,600 | 15,871,570 |
| | | | 48,287,302 |
|
| TOTAL CONSUMER STAPLES | | | 126,561,656 |
|
| ENERGY - 14.5% | | | |
| Energy Equipment & Services - 1.2% | | | |
| Baker Hughes, a GE Co. Class A | | 271,100 | 8,954,433 |
| Nabors Industries Ltd. | | 179,600 | 1,151,236 |
| National Oilwell Varco, Inc. | | 129,500 | 5,620,300 |
| Oceaneering International, Inc. | | 176,500 | 4,493,690 |
| | | | 20,219,659 |
| Oil, Gas & Consumable Fuels - 13.3% | | | |
| Anadarko Petroleum Corp. | | 50,800 | 3,721,100 |
| BP PLC sponsored ADR | | 372,576 | 17,011,820 |
| Cabot Oil & Gas Corp. | | 284,200 | 6,763,960 |
| Cenovus Energy, Inc. | | 2,079,400 | 21,590,393 |
| Cenovus Energy, Inc. | | 8,800 | 91,344 |
| Chevron Corp. | | 302,988 | 38,306,773 |
| ConocoPhillips Co. | | 163,100 | 11,355,022 |
| Enterprise Products Partners LP | | 95,500 | 2,642,485 |
| Equinor ASA sponsored ADR (a) | | 227,500 | 6,008,275 |
| Exxon Mobil Corp. | | 624,700 | 51,681,431 |
| Golar LNG Ltd. | | 146,000 | 4,301,160 |
| Imperial Oil Ltd. | | 221,300 | 7,356,186 |
| Legacy Reserves LP (c) | | 251,467 | 1,735,122 |
| Suncor Energy, Inc. | | 909,690 | 37,020,055 |
| Teekay LNG Partners LP | | 87,600 | 1,476,060 |
| The Williams Companies, Inc. | | 379,124 | 10,278,052 |
| Williams Partners LP | | 193,080 | 7,837,117 |
| | | | 229,176,355 |
|
| TOTAL ENERGY | | | 249,396,014 |
|
| FINANCIALS - 20.0% | | | |
| Banks - 13.2% | | | |
| Bank of America Corp. | | 1,904,937 | 53,700,174 |
| BNP Paribas SA | | 8,600 | 534,191 |
| Citigroup, Inc. | | 625,336 | 41,847,485 |
| Cullen/Frost Bankers, Inc. | | 2,400 | 259,776 |
| First Hawaiian, Inc. | | 41,600 | 1,207,232 |
| JPMorgan Chase & Co. | | 416,288 | 43,377,210 |
| M&T Bank Corp. | | 900 | 153,135 |
| PNC Financial Services Group, Inc. | | 101,344 | 13,691,574 |
| SunTrust Banks, Inc. | | 292,550 | 19,314,151 |
| U.S. Bancorp | | 308,571 | 15,434,721 |
| Wells Fargo & Co. | | 672,100 | 37,261,224 |
| | | | 226,780,873 |
| Capital Markets - 5.7% | | | |
| Apollo Global Management LLC Class A (b) | | 115,300 | 3,674,611 |
| Charles Schwab Corp. (b) | | 165,654 | 8,464,919 |
| KKR & Co. LP | | 498,478 | 12,387,178 |
| Morgan Stanley | | 234,880 | 11,133,312 |
| Northern Trust Corp. | | 213,510 | 21,968,044 |
| Oaktree Capital Group LLC Class A | | 85,700 | 3,483,705 |
| S&P Global, Inc. | | 37,800 | 7,707,042 |
| State Street Corp. | | 311,374 | 28,985,806 |
| | | | 97,804,617 |
| Insurance - 0.9% | | | |
| Chubb Ltd. | | 13,800 | 1,752,876 |
| Marsh & McLennan Companies, Inc. | | 67,719 | 5,550,926 |
| MetLife, Inc. | | 165,500 | 7,215,800 |
| The Travelers Companies, Inc. | | 7,000 | 856,380 |
| | | | 15,375,982 |
| Thrifts & Mortgage Finance - 0.2% | | | |
| Radian Group, Inc. | | 218,152 | 3,538,425 |
|
| TOTAL FINANCIALS | | | 343,499,897 |
|
| HEALTH CARE - 13.3% | | | |
| Biotechnology - 2.0% | | | |
| Alexion Pharmaceuticals, Inc. (c) | | 91,300 | 11,334,895 |
| Amgen, Inc. | | 101,796 | 18,790,524 |
| Biogen, Inc. (c) | | 3,200 | 928,768 |
| Intercept Pharmaceuticals, Inc. (c) | | 35,700 | 2,995,587 |
| | | | 34,049,774 |
| Health Care Equipment & Supplies - 0.9% | | | |
| Becton, Dickinson & Co. | | 4,300 | 1,030,108 |
| Boston Scientific Corp. (c) | | 87,800 | 2,871,060 |
| Danaher Corp. | | 62,300 | 6,147,764 |
| Fisher & Paykel Healthcare Corp. | | 84,559 | 852,777 |
| ResMed, Inc. | | 15,600 | 1,615,848 |
| Steris PLC | | 13,800 | 1,449,138 |
| Zimmer Biomet Holdings, Inc. | | 13,200 | 1,471,008 |
| | | | 15,437,703 |
| Health Care Providers & Services - 5.5% | | | |
| AmerisourceBergen Corp. | | 120,800 | 10,300,616 |
| Anthem, Inc. | | 43,100 | 10,259,093 |
| Cardinal Health, Inc. | | 215,800 | 10,537,514 |
| Cigna Corp. | | 50,400 | 8,565,480 |
| CVS Health Corp. | | 396,690 | 25,527,002 |
| Fresenius Medical Care AG & Co. KGaA sponsored ADR | | 43,300 | 2,180,155 |
| Humana, Inc. | | 14,000 | 4,166,820 |
| McKesson Corp. | | 84,230 | 11,236,282 |
| Patterson Companies, Inc. (a) | | 193,372 | 4,383,743 |
| UnitedHealth Group, Inc. | | 31,500 | 7,728,210 |
| | | | 94,884,915 |
| Pharmaceuticals - 4.9% | | | |
| Allergan PLC | | 21,400 | 3,567,808 |
| AstraZeneca PLC sponsored ADR | | 179,300 | 6,295,223 |
| Bayer AG | | 94,934 | 10,425,994 |
| GlaxoSmithKline PLC sponsored ADR | | 682,640 | 27,517,218 |
| Johnson & Johnson | | 182,274 | 22,117,127 |
| Novartis AG sponsored ADR | | 8,532 | 644,507 |
| Perrigo Co. PLC | | 12,400 | 904,084 |
| Sanofi SA | | 65,063 | 5,221,925 |
| Teva Pharmaceutical Industries Ltd. sponsored ADR | | 309,149 | 7,518,504 |
| | | | 84,212,390 |
|
| TOTAL HEALTH CARE | | | 228,584,782 |
|
| INDUSTRIALS - 11.2% | | | |
| Aerospace & Defense - 2.1% | | | |
| General Dynamics Corp. | | 37,200 | 6,934,452 |
| Meggitt PLC | | 50,572 | 329,240 |
| Rolls-Royce Holdings PLC | | 300,800 | 3,917,944 |
| United Technologies Corp. | | 206,720 | 25,846,202 |
| | | | 37,027,838 |
| Air Freight & Logistics - 1.6% | | | |
| C.H. Robinson Worldwide, Inc. | | 61,600 | 5,153,456 |
| Expeditors International of Washington, Inc. | | 19,000 | 1,388,900 |
| United Parcel Service, Inc. Class B | | 195,660 | 20,784,962 |
| | | | 27,327,318 |
| Commercial Services & Supplies - 0.2% | | | |
| Healthcare Services Group, Inc. (a) | | 59,000 | 2,548,210 |
| Ritchie Brothers Auctioneers, Inc. | | 25,500 | 869,752 |
| | | | 3,417,962 |
| Electrical Equipment - 0.7% | | | |
| Acuity Brands, Inc. | | 53,200 | 6,164,284 |
| Hubbell, Inc. Class B | | 45,737 | 4,836,230 |
| Rockwell Automation, Inc. | | 5,100 | 847,773 |
| | | | 11,848,287 |
| Industrial Conglomerates - 1.7% | | | |
| 3M Co. | | 1,700 | 334,424 |
| General Electric Co. | | 2,193,166 | 29,848,989 |
| | | | 30,183,413 |
| Machinery - 1.1% | | | |
| Donaldson Co., Inc. | | 37,400 | 1,687,488 |
| Flowserve Corp. | | 221,600 | 8,952,640 |
| PACCAR, Inc. | | 4,900 | 303,604 |
| Snap-On, Inc. | | 14,000 | 2,250,080 |
| Wabtec Corp. | | 60,700 | 5,983,806 |
| | | | 19,177,618 |
| Professional Services - 0.3% | | | |
| Nielsen Holdings PLC | | 144,200 | 4,460,106 |
| Road & Rail - 2.5% | | | |
| CSX Corp. (b) | | 109,412 | 6,978,297 |
| J.B. Hunt Transport Services, Inc. (b) | | 87,865 | 10,679,991 |
| Norfolk Southern Corp. | | 57,980 | 8,747,443 |
| Union Pacific Corp. | | 118,400 | 16,774,912 |
| | | | 43,180,643 |
| Trading Companies & Distributors - 1.0% | | | |
| Bunzl PLC | | 36,900 | 1,117,637 |
| Fastenal Co. | | 112,100 | 5,395,373 |
| Howden Joinery Group PLC | | 52,100 | 368,686 |
| MSC Industrial Direct Co., Inc. Class A | | 25,300 | 2,146,705 |
| Watsco, Inc. | | 43,520 | 7,758,746 |
| | | | 16,787,147 |
|
| TOTAL INDUSTRIALS | | | 193,410,332 |
|
| INFORMATION TECHNOLOGY - 16.0% | | | |
| Communications Equipment - 1.3% | | | |
| Cisco Systems, Inc. | | 508,740 | 21,891,082 |
| Electronic Equipment & Components - 0.1% | | | |
| Avnet, Inc. | | 29,600 | 1,269,544 |
| Philips Lighting NV (d) | | 32,900 | 854,859 |
| | | | 2,124,403 |
| Internet Software & Services - 1.2% | | | |
| Alphabet, Inc.: | | | |
| Class A (c) | | 9,254 | 10,449,524 |
| Class C (c) | | 8,534 | 9,520,957 |
| LogMeIn, Inc. | | 5,700 | 588,525 |
| | | | 20,559,006 |
| IT Services - 3.4% | | | |
| Accenture PLC Class A | | 17,400 | 2,846,466 |
| IBM Corp. | | 21,500 | 3,003,550 |
| MasterCard, Inc. Class A (b) | | 29,450 | 5,787,514 |
| Paychex, Inc. | | 260,114 | 17,778,792 |
| Unisys Corp. (c) | | 232,200 | 2,995,380 |
| Visa, Inc. Class A | | 191,680 | 25,388,016 |
| | | | 57,799,718 |
| Semiconductors & Semiconductor Equipment - 1.7% | | | |
| Analog Devices, Inc. | | 16,600 | 1,592,272 |
| Qualcomm, Inc. | | 487,110 | 27,336,613 |
| United Microelectronics Corp. sponsored ADR | | 255,000 | 719,100 |
| | | | 29,647,985 |
| Software - 5.8% | | | |
| Micro Focus International PLC | | 234,368 | 4,066,595 |
| Microsoft Corp. | | 683,208 | 67,371,143 |
| Oracle Corp. | | 423,413 | 18,655,577 |
| SAP SE sponsored ADR (a) | | 83,700 | 9,680,742 |
| | | | 99,774,057 |
| Technology Hardware, Storage & Peripherals - 2.5% | | | |
| Apple, Inc. | | 235,806 | 43,650,049 |
|
| TOTAL INFORMATION TECHNOLOGY | | | 275,446,300 |
|
| MATERIALS - 1.9% | | | |
| Chemicals - 1.6% | | | |
| CF Industries Holdings, Inc. | | 109,500 | 4,861,800 |
| LyondellBasell Industries NV Class A | | 91,900 | 10,095,215 |
| Nutrien Ltd. | | 181,984 | 9,900,350 |
| The Scotts Miracle-Gro Co. Class A | | 34,400 | 2,860,704 |
| | | | 27,718,069 |
| Metals & Mining - 0.3% | | | |
| BHP Billiton Ltd. sponsored ADR (a) | | 102,200 | 5,111,022 |
|
| TOTAL MATERIALS | | | 32,829,091 |
|
| REAL ESTATE - 1.5% | | | |
| Equity Real Estate Investment Trusts (REITs) - 1.5% | | | |
| American Tower Corp. | | 39,300 | 5,665,881 |
| CoreSite Realty Corp. | | 40,300 | 4,466,046 |
| Equinix, Inc. | | 16,000 | 6,878,240 |
| Omega Healthcare Investors, Inc. | | 34,400 | 1,066,400 |
| Public Storage | | 22,200 | 5,036,292 |
| Sabra Health Care REIT, Inc. | | 61,800 | 1,342,914 |
| Spirit MTA REIT (c) | | 23,200 | 238,960 |
| Spirit Realty Capital, Inc. | | 232,000 | 1,862,960 |
| | | | 26,557,693 |
| TELECOMMUNICATION SERVICES - 1.5% | | | |
| Diversified Telecommunication Services - 1.5% | | | |
| AT&T, Inc. | | 67,868 | 2,179,241 |
| Verizon Communications, Inc. | | 464,659 | 23,376,994 |
| | | | 25,556,235 |
| UTILITIES - 1.5% | | | |
| Electric Utilities - 1.3% | | | |
| Exelon Corp. | | 370,590 | 15,787,134 |
| PPL Corp. | | 173,400 | 4,950,570 |
| Southern Co. | | 38,700 | 1,792,197 |
| | | | 22,529,901 |
| Independent Power and Renewable Electricity Producers - 0.1% | | | |
| The AES Corp. | | 147,100 | 1,972,611 |
| Multi-Utilities - 0.1% | | | |
| Sempra Energy | | 16,000 | 1,857,760 |
|
| TOTAL UTILITIES | | | 26,360,272 |
|
| TOTAL COMMON STOCKS | | | |
| (Cost $1,390,063,928) | | | 1,669,534,904 |
|
| Preferred Stocks - 0.3% | | | |
| Convertible Preferred Stocks - 0.3% | | | |
| HEALTH CARE - 0.2% | | | |
| Health Care Equipment & Supplies - 0.2% | | | |
| Becton, Dickinson & Co. Series A, 6.125% | | 45,900 | 2,835,128 |
| INDUSTRIALS - 0.1% | | | |
| Commercial Services & Supplies - 0.1% | | | |
| Stericycle, Inc. 2.25% | | 26,600 | 1,300,894 |
| UTILITIES - 0.0% | | | |
| Electric Utilities - 0.0% | | | |
| Vistra Energy Corp. 7.00% | | 10,600 | 1,000,110 |
|
| TOTAL CONVERTIBLE PREFERRED STOCKS | | | 5,136,132 |
|
| Nonconvertible Preferred Stocks - 0.0% | | | |
| INDUSTRIALS - 0.0% | | | |
| Aerospace & Defense - 0.0% | | | |
| Rolls-Royce Holdings PLC (C Shares) | | 81,865,970 | 108,043 |
| TOTAL PREFERRED STOCKS | | | |
| (Cost $5,403,833) | | | 5,244,175 |
| | | Principal Amount(e) | Value |
|
| Convertible Bonds - 0.1% | | | |
| HEALTH CARE - 0.1% | | | |
| Pharmaceuticals - 0.1% | | | |
| Bayer Capital Corp. BV 5.625% 11/22/19(d) | EUR | | |
| (Cost $1,566,118) | | EUR 1,400,000 | 1,744,558 |
| | | Shares | Value |
|
| Other - 0.1% | | | |
| ENERGY - 0.1% | | | |
| Oil, Gas & Consumable Fuels - 0.1% | | | |
| Utica Shale Drilling Program (non-operating revenue interest) (f)(g)(h) | | | |
| (Cost $3,197,358) | | 3,197,358 | 1,710,587 |
|
| Money Market Funds - 4.1% | | | |
| Fidelity Cash Central Fund, 1.93% (i) | | 50,690,709 | 50,700,846 |
| Fidelity Securities Lending Cash Central Fund 1.92% (i)(j) | | 19,620,020 | 19,623,944 |
| TOTAL MONEY MARKET FUNDS | | | |
| (Cost $70,323,082) | | | 70,324,790 |
| TOTAL INVESTMENT IN SECURITIES - 101.6% | | | |
| (Cost $1,470,554,319) | | | 1,748,559,014 |
| NET OTHER ASSETS (LIABILITIES) - (1.6)% | | | (27,330,143) |
| NET ASSETS - 100% | | | $1,721,228,871 |
| Written Options | | | | | | |
| | Counterparty | Number of Contracts | Notional Amount | Exercise Price | Expiration Date | Value |
| Call Options | | | | | | |
| Apollo Global Management LLC Class A | Chicago Board Options Exchange | 284 | $905,108 | $34.00 | 7/20/18 | $(2,130) |
| Charles Schwab Corp. | Chicago Board Options Exchange | 327 | 1,670,970 | 60.00 | 9/21/18 | (8,993) |
| CSX Corp. | Chicago Board Options Exchange | 1,091 | 6,958,398 | 70.00 | 8/17/18 | (50,186) |
| J.B. Hunt Transport Services, Inc. | Chicago Board Options Exchange | 175 | 2,127,125 | 135.00 | 7/20/18 | (3,938) |
| MasterCard, Inc. Class A | Chicago Board Options Exchange | 72 | 1,414,944 | 200.00 | 7/20/18 | (16,596) |
| Paychex, Inc. | Bank of America NA | 508 | 3,472,180 | 67.50 | 7/20/18 | (87,382) |
| S&P Global, Inc. | Bank of America NA | 182 | 3,710,798 | 210.00 | 8/17/18 | (62,918) |
| TJX Companies, Inc. | Chicago Board Options Exchange | 487 | 4,635,266 | 97.50 | 10/19/18 | (165,580) |
| TOTAL WRITTEN OPTIONS | | | | | | $(397,723) |
Currency Abbreviations
EUR – European Monetary Unit
Legend
(a) Security or a portion of the security is on loan at period end.
(b) Security or a portion of the security is pledged as collateral for call options written. At period end, the value of securities pledged amounted to $17,711,811.
(c) Non-income producing
(d) Security exempt from registration under Rule 144A of the Securities Act of 1933. These securities may be resold in transactions exempt from registration, normally to qualified institutional buyers. At the end of the period, the value of these securities amounted to $2,599,417 or 0.2% of net assets.
(e) Amount is stated in United States dollars unless otherwise noted.
(f) Investment is owned by a wholly-owned subsidiary (Subsidiary) that is treated as a corporation for U.S. tax purposes.
(g) Restricted securities - Investment in securities not registered under the Securities Act of 1933 (excluding 144A issues). At the end of the period, the value of restricted securities (excluding 144A issues) amounted to $1,710,587 or 0.1% of net assets.
(h) Level 3 security
(i) Affiliated fund that is generally available only to investment companies and other accounts managed by Fidelity Investments. The rate quoted is the annualized seven-day yield of the fund at period end. A complete unaudited listing of the fund's holdings as of its most recent quarter end is available upon request. In addition, each Fidelity Central Fund's financial statements, which are not covered by the Fund's Report of Independent Registered Public Accounting Firm, are available on the SEC's website or upon request.
(j) Investment made with cash collateral received from securities on loan.
Additional information on each restricted holding is as follows:
| Security | Acquisition Date | Acquisition Cost |
| Utica Shale Drilling Program (non-operating revenue interest) | 10/5/16 - 9/1/17 | $3,197,358 |
Affiliated Central Funds
Information regarding fiscal year to date income earned by the Fund from investments in Fidelity Central Funds is as follows:
| Fund | Income earned |
| Fidelity Cash Central Fund | $349,678 |
| Fidelity Securities Lending Cash Central Fund | 128,963 |
| Total | $478,641 |
Amounts in the income column in the above table include any capital gain distributions from underlying funds, which are presented in the corresponding line-item in the Statement of Operations if applicable.
Investment Valuation
The following is a summary of the inputs used, as of June 30, 2018, involving the Fund's assets and liabilities carried at fair value. The inputs or methodology used for valuing securities may not be an indication of the risk associated with investing in those securities. For more information on valuation inputs, and their aggregation into the levels used below, please refer to the Investment Valuation section in the accompanying Notes to Financial Statements.
| | Valuation Inputs at Reporting Date: |
| Description | Total | Level 1 | Level 2 | Level 3 |
| Investments in Securities: | | | | |
| Equities: | | | | |
| Consumer Discretionary | $141,332,632 | $141,332,632 | $-- | $-- |
| Consumer Staples | 126,561,656 | 123,440,871 | 3,120,785 | -- |
| Energy | 249,396,014 | 249,396,014 | -- | -- |
| Financials | 343,499,897 | 343,499,897 | -- | -- |
| Health Care | 231,419,910 | 212,936,863 | 18,483,047 | -- |
| Industrials | 194,819,269 | 189,600,431 | 5,218,838 | -- |
| Information Technology | 275,446,300 | 271,379,705 | 4,066,595 | -- |
| Materials | 32,829,091 | 32,829,091 | -- | -- |
| Real Estate | 26,557,693 | 26,557,693 | -- | -- |
| Telecommunication Services | 25,556,235 | 25,556,235 | -- | -- |
| Utilities | 27,360,382 | 26,360,272 | 1,000,110 | -- |
| Corporate Bonds | 1,744,558 | -- | 1,744,558 | -- |
| Other | 1,710,587 | -- | -- | 1,710,587 |
| Money Market Funds | 70,324,790 | 70,324,790 | -- | -- |
| Total Investments in Securities: | $1,748,559,014 | $1,713,214,494 | $33,633,933 | $1,710,587 |
| Derivative Instruments: | | | | |
| Liabilities | | | | |
| Written Options | $(397,723) | $(247,423) | $(150,300) | $-- |
| Total Liabilities | $(397,723) | $(247,423) | $(150,300) | $-- |
| Total Derivative Instruments: | $(397,723) | $(247,423) | $(150,300) | $-- |
Value of Derivative Instruments
The following table is a summary of the Fund's value of derivative instruments by primary risk exposure as of June 30, 2018. For additional information on derivative instruments, please refer to the Derivative Instruments section in the accompanying Notes to Financial Statements.
| Primary Risk Exposure / Derivative Type | Value |
| | Asset | Liability |
| Equity Risk | | |
| Written Options(a) | $0 | $(397,723) |
| Total Equity Risk | 0 | (397,723) |
| Total Value of Derivatives | $0 | $(397,723) |
(a) Gross value is presented in the Statement of Assets and Liabilities in the written options, at value line-item.
Other Information
Distribution of investments by country or territory of incorporation, as a percentage of Total Net Assets, is as follows (Unaudited):
| United States of America | 86.2% |
| United Kingdom | 5.0% |
| Canada | 4.5% |
| Germany | 1.3% |
| Others (Individually Less Than 1%) | 3.0% |
| | 100.0% |
See accompanying notes which are an integral part of the financial statements.
Financial Statements
Statement of Assets and Liabilities
| | | June 30, 2018 |
| Assets | | |
Investment in securities, at value (including securities loaned of $19,048,354) — See accompanying schedule:
Unaffiliated issuers (cost $1,400,231,237) | $1,678,234,224 | |
| Fidelity Central Funds (cost $70,323,082) | 70,324,790 | |
| Total Investment in Securities (cost $1,470,554,319) | | $1,748,559,014 |
| Restricted cash | | 40,744 |
| Foreign currency held at value (cost $67,187) | | 67,187 |
| Receivable for investments sold | | 1,513,886 |
| Receivable for fund shares sold | | 145,853 |
| Dividends receivable | | 2,463,105 |
| Interest receivable | | 92,575 |
| Distributions receivable from Fidelity Central Funds | | 116,526 |
| Other receivables | | 22,880 |
| Total assets | | 1,753,021,770 |
| Liabilities | | |
| Payable to custodian bank | $345,733 | |
| Payable for investments purchased | 7,966,775 | |
| Payable for fund shares redeemed | 3,430,237 | |
| Written options, at value (premium received $453,217) | 397,723 | |
| Other payables and accrued expenses | 25,496 | |
| Collateral on securities loaned | 19,626,935 | |
| Total liabilities | | 31,792,899 |
| Net Assets | | $1,721,228,871 |
| Net Assets consist of: | | |
| Paid in capital | | $1,359,228,551 |
| Undistributed net investment income | | 7,521,109 |
| Accumulated undistributed net realized gain (loss) on investments and foreign currency transactions | | 76,423,543 |
| Net unrealized appreciation (depreciation) on investments and assets and liabilities in foreign currencies | | 278,055,668 |
| Net Assets, for 110,681,284 shares outstanding | | $1,721,228,871 |
| Net Asset Value, offering price and redemption price per share ($1,721,228,871 ÷ 110,681,284 shares) | | $15.55 |
See accompanying notes which are an integral part of the financial statements.
Statement of Operations
| | | Year ended June 30, 2018 |
| Investment Income | | |
| Dividends | | $41,792,756 |
| Interest | | 92,575 |
| Income from Fidelity Central Funds | | 478,641 |
| Total income | | 42,363,972 |
| Expenses | | |
| Custodian fees and expenses | $75,912 | |
| Independent trustees' fees and expenses | 7,095 | |
| Interest | 1,528 | |
| Miscellaneous | 4,962 | |
| Total expenses before reductions | 89,497 | |
| Expense reductions | (80,367) | |
| Total expenses after reductions | | 9,130 |
| Net investment income (loss) | | 42,354,842 |
| Realized and Unrealized Gain (Loss) | | |
| Net realized gain (loss) on: | | |
| Investment securities: | | |
| Unaffiliated issuers | 95,169,886 | |
| Fidelity Central Funds | (4,085) | |
| Foreign currency transactions | (6,242) | |
| Written options | 3,089,026 | |
| Total net realized gain (loss) | | 98,248,585 |
| Change in net unrealized appreciation (depreciation) on: | | |
| Investment securities: | | |
| Unaffiliated issuers | 44,298,517 | |
| Fidelity Central Funds | 1,647 | |
| Assets and liabilities in foreign currencies | (3,162) | |
| Written options | 443,376 | |
| Total change in net unrealized appreciation (depreciation) | | 44,740,378 |
| Net gain (loss) | | 142,988,963 |
| Net increase (decrease) in net assets resulting from operations | | $185,343,805 |
See accompanying notes which are an integral part of the financial statements.
Statement of Changes in Net Assets
| | Year ended June 30, 2018 | Year ended June 30, 2017 |
| Increase (Decrease) in Net Assets | | |
| Operations | | |
| Net investment income (loss) | $42,354,842 | $21,238,765 |
| Net realized gain (loss) | 98,248,585 | 51,187,058 |
| Change in net unrealized appreciation (depreciation) | 44,740,378 | 148,998,150 |
| Net increase (decrease) in net assets resulting from operations | 185,343,805 | 221,423,973 |
| Distributions to shareholders from net investment income | (37,532,118) | (16,048,453) |
| Distributions to shareholders from net realized gain | (63,783,542) | (3,590,086) |
| Total distributions | (101,315,660) | (19,638,539) |
| Share transactions | | |
| Proceeds from sales of shares | 159,911,687 | 616,483,504 |
| Reinvestment of distributions | 101,315,660 | 19,638,538 |
| Cost of shares redeemed | (270,096,523) | (289,554,483) |
| Net increase (decrease) in net assets resulting from share transactions | (8,869,176) | 346,567,559 |
| Total increase (decrease) in net assets | 75,158,969 | 548,352,993 |
| Net Assets | | |
| Beginning of period | 1,646,069,902 | 1,097,716,909 |
| End of period | $1,721,228,871 | $1,646,069,902 |
| Other Information | | |
| Undistributed net investment income end of period | $7,521,109 | $5,033,416 |
| Shares | | |
| Sold | 10,452,235 | 42,126,779 |
| Issued in reinvestment of distributions | 6,857,979 | 1,475,031 |
| Redeemed | (17,598,788) | (20,778,520) |
| Net increase (decrease) | (288,574) | 22,823,290 |
See accompanying notes which are an integral part of the financial statements.
Financial Highlights
Fidelity Advisor Series Growth & Income Fund
| | | | | | |
| Years ended June 30, | 2018 | 2017 | 2016 | 2015 | 2014 |
| Selected Per–Share Data | | | | | |
| Net asset value, beginning of period | $14.83 | $12.45 | $13.71 | $13.73 | $11.57 |
| Income from Investment Operations | | | | | |
| Net investment income (loss)A | .38 | .25 | .23 | .25 | .23 |
| Net realized and unrealized gain (loss) | 1.25 | 2.36 | (.60) | .45 | 2.33 |
| Total from investment operations | 1.63 | 2.61 | (.37) | .70 | 2.56 |
| Distributions from net investment income | (.34) | (.19) | (.25) | (.23) | (.15) |
| Distributions from net realized gain | (.57) | (.04) | (.64) | (.49) | (.25) |
| Total distributions | (.91) | (.23) | (.89) | (.72) | (.40) |
| Net asset value, end of period | $15.55 | $14.83 | $12.45 | $13.71 | $13.73 |
| Total ReturnB | 11.43% | 21.18% | (2.75)% | 5.29% | 22.48% |
| Ratios to Average Net AssetsC,D | | | | | |
| Expenses before reductions | .01% | .59% | .67% | .67% | .69% |
| Expenses net of fee waivers, if any | - %E | .59% | .67% | .67% | .69% |
| Expenses net of all reductions | - %E | .59% | .67% | .67% | .69% |
| Net investment income (loss) | 2.48% | 1.80% | 1.86% | 1.80% | 1.83% |
| Supplemental Data | | | | | |
| Net assets, end of period (000 omitted) | $1,721,229 | $1,646,070 | $1,097,717 | $1,274,776 | $1,357,854 |
| Portfolio turnover rateF | 42% | 58%G | 33% | 38% | 60%G |
A Calculated based on average shares outstanding during the period.
B Total returns would have been lower if certain expenses had not been reduced during the applicable periods shown.
C Fees and expenses of any underlying Fidelity Central Funds are not included in the Fund's expense ratio. The Fund indirectly bears its proportionate share of the expenses of any underlying Fidelity Central Funds.
D Expense ratios reflect operating expenses of the Fund. Expenses before reductions do not reflect amounts reimbursed by the investment adviser or reductions from brokerage service arrangements or reductions from other expense offset arrangements and do not represent the amount paid by the Fund during periods when reimbursements or reductions occur. Expenses net of fee waivers reflect expenses after reimbursement by the investment adviser but prior to reductions from brokerage service arrangements or other expense offset arrangements. Expenses net of all reductions represent the net expenses paid by the Fund.
E Amount represents less than .005%.
F Amount does not include the portfolio activity of any underlying Fidelity Central Funds.
G Portfolio turnover rate excludes securities received or delivered in-kind.
See accompanying notes which are an integral part of the financial statements.
Notes to Financial Statements
For the period ended June 30, 2018
1. Organization.
Fidelity Advisor Series Growth & Income Fund (the Fund) is a fund of Fidelity Hastings Street Trust (the Trust) and is authorized to issue an unlimited number of shares. Shares of the Fund are only available for purchase by mutual funds for which Fidelity Management & Research Company (FMR) or an affiliate serves as an investment manager. The Trust is registered under the Investment Company Act of 1940, as amended (the 1940 Act), as an open-end management investment company organized as a Massachusetts business trust.
2. Investments in Fidelity Central Funds.
The Fund invests in Fidelity Central Funds, which are open-end investment companies generally available only to other investment companies and accounts managed by the investment adviser and its affiliates. The Fund's Schedule of Investments lists each of the Fidelity Central Funds held as of period end, if any, as an investment of the Fund, but does not include the underlying holdings of each Fidelity Central Fund. As an Investing Fund, the Fund indirectly bears its proportionate share of the expenses of the underlying Fidelity Central Funds.
The Money Market Central Funds seek preservation of capital and current income and are managed by Fidelity Investments Money Management, Inc. (FIMM), an affiliate of the investment adviser. Annualized expenses of the Money Market Central Funds as of their most recent shareholder report date are less than .005%.
A complete unaudited list of holdings for each Fidelity Central Fund is available upon request or at the Securities and Exchange Commission (the SEC) website at www.sec.gov. In addition, the financial statements of the Fidelity Central Funds, which are not covered by the Fund's Report of Independent Registered Public Accounting Firm, are available on the SEC website or upon request.
3. Significant Accounting Policies.
The Fund is an investment company and applies the accounting and reporting guidance of the Financial Accounting Standards Board (FASB) Accounting Standards Codification Topic 946 Financial Services – Investments Companies. The financial statements have been prepared in conformity with accounting principles generally accepted in the United States of America (GAAP), which require management to make certain estimates and assumptions at the date of the financial statements. Actual results could differ from those estimates. Subsequent events, if any, through the date that the financial statements were issued have been evaluated in the preparation of the financial statements. The following summarizes the significant accounting policies of the Fund:
Investment Valuation. Investments are valued as of 4:00 p.m. Eastern time on the last calendar day of the period. The Board of Trustees (the Board) has delegated the day to day responsibility for the valuation of the Fund's investments to the Fair Value Committee (the Committee) established by the Fund's investment adviser. In accordance with valuation policies and procedures approved by the Board, the Fund attempts to obtain prices from one or more third party pricing vendors or brokers to value its investments. When current market prices, quotations or currency exchange rates are not readily available or reliable, investments will be fair valued in good faith by the Committee, in accordance with procedures adopted by the Board. Factors used in determining fair value vary by investment type and may include market or investment specific events, changes in interest rates and credit quality. The frequency with which these procedures are used cannot be predicted and they may be utilized to a significant extent. The Committee oversees the Fund's valuation policies and procedures and reports to the Board on the Committee's activities and fair value determinations. The Board monitors the appropriateness of the procedures used in valuing the Fund's investments and ratifies the fair value determinations of the Committee.
The Fund categorizes the inputs to valuation techniques used to value its investments into a disclosure hierarchy consisting of three levels as shown below:
- Level 1 – quoted prices in active markets for identical investments
- Level 2 – other significant observable inputs (including quoted prices for similar investments, interest rates, prepayment speeds, etc.)
- Level 3 – unobservable inputs (including the Fund's own assumptions based on the best information available)
Valuation techniques used to value the Fund's investments by major category are as follows:
Equity securities, including restricted securities, for which market quotations are readily available, are valued at the last reported sale price or official closing price as reported by a third party pricing vendor on the primary market or exchange on which they are traded and are categorized as Level 1 in the hierarchy. In the event there were no sales during the day or closing prices are not available, securities are valued at the last quoted bid price or may be valued using the last available price and are generally categorized as Level 2 in the hierarchy. For foreign equity securities, when market or security specific events arise, comparisons to the valuation of American Depositary Receipts (ADRs), futures contracts, Exchange-Traded Funds (ETFs) and certain indexes as well as quoted prices for similar securities may be used and would be categorized as Level 2 in the hierarchy. Utilizing these techniques may result in transfers between Level 1 and Level 2. For equity securities, including restricted securities, where observable inputs are limited, assumptions about market activity and risk are used and these securities may be categorized as Level 3 in the hierarchy.
Debt securities, including restricted securities, are valued based on evaluated prices received from third party pricing vendors or from brokers who make markets in such securities. Corporate bonds are valued by pricing vendors who utilize matrix pricing which considers yield or price of bonds of comparable quality, coupon, maturity and type or by broker-supplied prices. When independent prices are unavailable or unreliable, debt securities may be valued utilizing pricing methodologies which consider similar factors that would be used by third party pricing vendors. Debt securities are generally categorized as Level 2 in the hierarchy but may be Level 3 depending on the circumstances.
Exchange-traded options are valued using the last sale price or, in the absence of a sale, the last offering price and are categorized as Level 1 in the hierarchy. Options traded over-the-counter are valued using vendor or broker-supplied valuations and are categorized as Level 2 in the hierarchy. Investments in open-end mutual funds, including the Fidelity Central Funds, are valued at their closing net asset value (NAV) each business day and are categorized as Level 1 in the hierarchy.
Changes in valuation techniques may result in transfers in or out of an assigned level within the disclosure hierarchy. The aggregate value of investments by input level as of June 30, 2018 is included at the end of the Fund's Schedule of Investments.
Foreign Currency. The Fund may use foreign currency contracts to facilitate transactions in foreign-denominated securities. Gains and losses from these transactions may arise from changes in the value of the foreign currency or if the counterparties do not perform under the contracts' terms.
Foreign-denominated assets, including investment securities, and liabilities are translated into U.S. dollars at the exchange rates at period end. Purchases and sales of investment securities, income and dividends received and expenses denominated in foreign currencies are translated into U.S. dollars at the exchange rate in effect on the transaction date.
The effects of exchange rate fluctuations on investments are included with the net realized and unrealized gain (loss) on investment securities. Other foreign currency transactions resulting in realized and unrealized gain (loss) are disclosed separately.
Investment Transactions and Income. For financial reporting purposes, the Fund's investment holdings and NAV include trades executed through the end of the last business day of the period. The NAV per share for processing shareholder transactions is calculated as of the close of business of the New York Stock Exchange (NYSE), normally 4:00 p.m. Eastern time and includes trades executed through the end of the prior business day. Gains and losses on securities sold are determined on the basis of identified cost and include proceeds received from litigation. Dividend income is recorded on the ex-dividend date, except for certain dividends from foreign securities where the ex-dividend date may have passed, which are recorded as soon as the Fund is informed of the ex-dividend date. Non-cash dividends included in dividend income, if any, are recorded at the fair market value of the securities received. Income and capital gain distributions from Fidelity Central Funds, if any, are recorded on the ex-dividend date. Certain distributions received by the Fund represent a return of capital or capital gain. The Fund determines the components of these distributions subsequent to the ex-dividend date, based upon receipt of tax filings or other correspondence relating to the underlying investment. These distributions are recorded as a reduction of cost of investments and/or as a realized gain. Interest income is accrued as earned and includes coupon interest and amortization of premium and accretion of discount on debt securities as applicable. Investment income is recorded net of foreign taxes withheld where recovery of such taxes is uncertain. Debt obligations may be placed on non-accrual status and related interest income may be reduced by ceasing current accruals and writing off interest receivables when the collection of all or a portion of interest has become doubtful based on consistently applied procedures. A debt obligation is removed from non-accrual status when the issuer resumes interest payments or when collectability of interest is reasonably assured.
Expenses. Expenses directly attributable to a fund are charged to that fund. Expenses attributable to more than one fund are allocated among the respective funds on the basis of relative net assets or other appropriate methods. Expense estimates are accrued in the period to which they relate and adjustments are made when actual amounts are known.
Income Tax Information and Distributions to Shareholders. Each year, the Fund intends to qualify as a regulated investment company under Subchapter M of the Internal Revenue Code, including distributing substantially all of its taxable income and realized gains. As a result, no provision for U.S. Federal income taxes is required. As of June 30, 2018, the Fund did not have any unrecognized tax benefits in the financial statements; nor is the Fund aware of any tax positions for which it is reasonably possible that the total amounts of unrecognized tax benefits will significantly change in the next twelve months. The Fund files a U.S. federal tax return, in addition to state and local tax returns as required. The Fund's federal income tax returns are subject to examination by the Internal Revenue Service (IRS) for a period of three fiscal years after they are filed. State and local tax returns may be subject to examination for an additional fiscal year depending on the jurisdiction. Foreign taxes are provided for based on the Fund's understanding of the tax rules and rates that exist in the foreign markets in which it invests.
Distributions are declared and recorded on the ex-dividend date. Income and capital gain distributions are determined in accordance with income tax regulations, which may differ from GAAP.
Capital accounts within the financial statements are adjusted for permanent book-tax differences. These adjustments have no impact on net assets or the results of operations. Capital accounts are not adjusted for temporary book-tax differences which will reverse in a subsequent period.
Book-tax differences are primarily due to foreign currency transactions, passive foreign investment companies (PFIC), equity-debt classifications, certain conversion ratio adjustments, partnerships and losses deferred due to wash sales.
As of period end, the cost and unrealized appreciation (depreciation) in securities, and derivatives if applicable, for federal income tax purposes were as follows:
| Gross unrealized appreciation | $360,682,150 |
| Gross unrealized depreciation | (88,325,930) |
| Net unrealized appreciation (depreciation) | $272,356,220 |
| Tax Cost | $1,475,805,071 |
The tax-based components of distributable earnings as of period end were as follows:
| Undistributed ordinary income | $41,434,627 |
| Undistributed long-term capital gain | $54,063,705 |
| Net unrealized appreciation (depreciation) on securities and other investments | $266,502,332 |
The tax character of distributions paid was as follows:
| | June 30, 2018 | June 30, 2017 |
| Ordinary Income | $42,383,981 | $ 18,336,750 |
| Long-term Capital Gains | 58,931,679 | 1,301,789 |
| Total | $101,315,660 | $ 19,638,539 |
Restricted Securities. The Fund may invest in securities that are subject to legal or contractual restrictions on resale. These securities generally may be resold in transactions exempt from registration or to the public if the securities are registered. Disposal of these securities may involve time-consuming negotiations and expense, and prompt sale at an acceptable price may be difficult. Information regarding restricted securities is included at the end of the Fund's Schedule of Investments.
Consolidated Subsidiary. The Fund invests in certain investments through a wholly-owned subsidiary ("Subsidiary"), which may be subject to federal and state taxes upon disposition.
As of period end, the Fund held an investment of $1,751,331 in this Subsidiary, representing .10% of the Fund's net assets. The financial statements have been consolidated and include accounts of the Fund and the Subsidiary. Accordingly, all inter-company transactions and balances have been eliminated.
Any cash held by the Subsidiary is restricted as to its use and is presented as Restricted cash in the Statement of Assets and Liabilities.
4. Derivative Instruments.
Risk Exposures and the Use of Derivative Instruments. The Fund's investment objective allows the Fund to enter into various types of derivative contracts, including options. Derivatives are investments whose value is primarily derived from underlying assets, indices or reference rates and may be transacted on an exchange or over-the-counter (OTC). Derivatives may involve a future commitment to buy or sell a specified asset based on specified terms, to exchange future cash flows at periodic intervals based on a notional principal amount, or for one party to make one or more payments upon the occurrence of specified events in exchange for periodic payments from the other party.
The Fund used derivatives to increase returns and to manage exposure to certain risks as defined below. The success of any strategy involving derivatives depends on analysis of numerous economic factors, and if the strategies for investment do not work as intended, the Fund may not achieve its objectives.
The Fund's use of derivatives increased or decreased its exposure to the following risk:
| Equity Risk | Equity risk relates to the fluctuations in the value of financial instruments as a result of changes in market prices (other than those arising from interest rate risk or foreign exchange risk), whether caused by factors specific to an individual investment, its issuer, or all factors affecting all instruments traded in a market or market segment.
|
The Fund is also exposed to additional risks from investing in derivatives, such as liquidity risk and counterparty credit risk. Liquidity risk is the risk that the Fund will be unable to close out the derivative in the open market in a timely manner. Counterparty credit risk is the risk that the counterparty will not be able to fulfill its obligation to the Fund. Derivative counterparty credit risk is managed through formal evaluation of the creditworthiness of all potential counterparties. On certain OTC derivatives such as options, the Fund attempts to reduce its exposure to counterparty credit risk by entering into an International Swaps and Derivatives Association, Inc. (ISDA) Master Agreement with each of its counterparties. The ISDA Master Agreement gives the Fund the right to terminate all transactions traded under such agreement upon the deterioration in the credit quality of the counterparty beyond specified levels. The ISDA Master Agreement gives each party the right, upon an event of default by the other party or a termination of the agreement, to close out all transactions traded under such agreement and to net amounts owed under each transaction to one net payable by one party to the other. To mitigate counterparty credit risk on bi-lateral OTC derivatives, the Fund receives collateral in the form of cash or securities once the Fund's net unrealized appreciation on outstanding derivative contracts under an ISDA Master Agreement exceeds certain applicable thresholds, subject to certain minimum transfer provisions. The collateral received is held in segregated accounts with the Fund's custodian bank in accordance with the collateral agreements entered into between the Fund, the counterparty and the Fund's custodian bank. The Fund could experience delays and costs in gaining access to the collateral even though it is held by the Fund's custodian bank. The Fund's maximum risk of loss from counterparty credit risk related to bi-lateral OTC derivatives is generally the aggregate unrealized appreciation and unpaid counterparty payments in excess of any collateral pledged by the counterparty to the Fund. The Fund may be required to pledge collateral for the benefit of the counterparties on bi-lateral OTC derivatives in an amount not less than each counterparty's unrealized appreciation on outstanding derivative contracts, subject to certain minimum transfer provisions, and any such pledged collateral is identified in the Schedule of Investments. Counterparty credit risk related to exchange-traded options may be mitigated by the protection provided by the exchange on which they trade.
Investing in derivatives may involve greater risks than investing in the underlying assets directly and, to varying degrees, may involve risk of loss in excess of any initial investment and collateral received and amounts recognized in the Statement of Assets and Liabilities. In addition, there may be the risk that the change in value of the derivative contract does not correspond to the change in value of the underlying instrument.
Options. Options give the purchaser the right, but not the obligation, to buy (call) or sell (put) an underlying security or financial instrument at an agreed exercise or strike price between or on certain dates. Options obligate the seller (writer) to buy (put) or sell (call) an underlying instrument at the exercise or strike price or cash settle an underlying derivative instrument if the holder exercises the option on or before the expiration date.
The Fund used exchange-traded and OTC written covered call options to manage its exposure to the market. When the Fund writes a covered call option, the Fund holds the underlying instrument which must be delivered to the holder upon the exercise of the option.
Upon entering into a written options contract, the Fund will receive a premium. Premiums received are reflected as a liability on the Statement of Assets and Liabilities. Options are valued daily and any unrealized appreciation (depreciation) is reflected on the Statement of Assets and Liabilities. When a written option is exercised, the premium is added to the proceeds from the sale of the underlying instrument in determining the gain or loss realized on that investment. When an option is closed the Fund will realize a gain or loss depending on whether the proceeds or amount paid for the closing sale transaction are greater or less than the premium received. When an option expires, gains and losses are realized to the extent of premiums received. The net realized gain (loss) on closed and expired written options and the change in net unrealized appreciation (depreciation) on written options are presented in the Statement of Operations.
Writing call options tends to decrease exposure to the underlying instrument and risk of loss is the change in value in excess of the premium received.
Any open options at period end are presented in the Schedule of Investments under the caption "Written Options" and are representative of volume of activity during the period.
5. Purchases and Sales of Investments.
Purchases and sales of securities, other than short-term securities, aggregated $695,283,678 and $786,653,033, respectively.
6. Fees and Other Transactions with Affiliates.
Management Fee. Fidelity Management & Research Company (the investment adviser) and its affiliates provide the Fund with investment management related services for which the Fund does not pay a management fee. Under the management contract, the investment adviser or an affiliate pays all ordinary operating expenses of the Fund, except custody fees, fees and expenses of the independent Trustees, and certain miscellaneous expenses such as proxy and shareholder meeting expenses.
Brokerage Commissions. The Fund placed a portion of its portfolio transactions with brokerage firms which are affiliates of the investment adviser. Brokerage commissions are included in net realized gain (loss) and change in net unrealized appreciation (depreciation) in the Statement of Operations. The commissions paid to these affiliated firms were $13,752 for the period.
Interfund Lending Program. Pursuant to an Exemptive Order issued by the SEC, the Fund, along with other registered investment companies having management contracts with FMR or other affiliated entities of FMR, may participate in an interfund lending program. This program provides an alternative credit facility allowing the funds to borrow from, or lend money to, other participating affiliated funds. At period end, there were no interfund loans outstanding. The Fund's activity in this program during the period for which loans were outstanding was as follows:
| Borrower or Lender | Average Loan Balance | Weighted Average Interest Rate | Interest Expense |
| Borrower | $7,792,400 | 1.41% | $1,528 |
Interfund Trades. The Fund may purchase from or sell securities to other Fidelity Funds under procedures adopted by the Board. The procedures have been designed to ensure these interfund trades are executed in accordance with Rule 17a-7 of the 1940 Act. Interfund trades are included within the respective purchases and sales amounts shown in the Purchases and Sales of Investments note.
Prior Fiscal Year Exchanges In-Kind. During the prior period, certain affiliated entities (Investing Funds) completed exchanges in-kind with the Fund. The Investing Funds delivered investments and cash valued at $504,085,301 in exchange for 34,036,820 shares of the Fund. The amount of in-kind exchanges is included in share transactions in the accompanying Statement of Changes in Net Assets. The Fund recognized no gain or loss for federal income tax purposes.
7. Committed Line of Credit.
The Fund participates with other funds managed by the investment adviser or an affiliate in a $4.25 billion credit facility (the "line of credit") to be utilized for temporary or emergency purposes to fund shareholder redemptions or for other short-term liquidity purposes. The Fund has agreed to pay commitment fees on its pro-rata portion of the line of credit, which amounted to $4,663 and is reflected in Miscellaneous expenses on the Statement of Operations. During the period, the Fund did not borrow on this line of credit.
8. Security Lending.
The Fund lends portfolio securities through a lending agent from time to time in order to earn additional income. For equity securities, a lending agent is used and may loan securities to certain qualified borrowers, including Fidelity Capital Markets (FCM), a broker-dealer affiliated with the Fund. On the settlement date of the loan, the Fund receives collateral (in the form of U.S. Treasury obligations, letters of credit and/or cash) against the loaned securities and maintains collateral in an amount not less than 100% of the market value of the loaned securities during the period of the loan. The market value of the loaned securities is determined at the close of business of the Fund and any additional required collateral is delivered to the Fund on the next business day. The Fund or borrower may terminate the loan at any time, and if the borrower defaults on its obligation to return the securities loaned because of insolvency or other reasons, the Fund may apply collateral received from the borrower against the obligation. The Fund may experience delays and costs in recovering the securities loaned. Any cash collateral received is invested in the Fidelity Securities Lending Cash Central Fund. The value of loaned securities and cash collateral at period end are disclosed on the Fund's Statement of Assets and Liabilities. At period end, there were no security loans outstanding with FCM. Security lending income represents the income earned on investing cash collateral, less rebates paid to borrowers and any lending agent fees associated with the loan, plus any premium payments received for lending certain types of securities. Security lending income is presented in the Statement of Operations as a component of income from Fidelity Central Funds. Total security lending income during the period amounted to $128,963, including $3,221 from securities loaned to FCM.
9. Expense Reductions.
Commissions paid to certain brokers with whom the investment adviser, or its affiliates, places trades on behalf of the Fund include an amount in addition to trade execution, which may be rebated back to the Fund to offset certain expenses. This amount totaled $74,815 for the period. Through arrangements with the Fund's custodian, credits realized as a result of certain uninvested cash balances were used to reduce the Fund's expenses. During the period, these credits reduced the Fund's custody expenses by $367.
In addition, during the period the investment adviser reimbursed and/or waived a portion of operating expenses in the amount of $5,185.
10. Proposed Reorganization.
The Board of Trustees of the Fund approved an Agreement and Plan of Reorganization (the Agreement) between the Fund and Fidelity Series Growth and Income Fund. The Agreement provides for the transfer of all the assets and the assumption of all the liabilities of the Fund in exchange for corresponding shares of Fidelity Series Growth and Income Fund equal in value to the net assets of the Fund on the day the reorganization is effective. The reorganization does not require shareholder approval and is expected to become effective in September 2018. The reorganization is expected to qualify as a tax-free transaction for federal income tax purposes with no gain or loss recognized by the funds or their shareholders.
11. Other.
The Fund's organizational documents provide former and current trustees and officers with a limited indemnification against liabilities arising in connection with the performance of their duties to the Fund. In the normal course of business, the Fund may also enter into contracts that provide general indemnifications. The Fund's maximum exposure under these arrangements is unknown as this would be dependent on future claims that may be made against the Fund. The risk of material loss from such claims is considered remote.
At the end of the period, mutual funds managed by the investment adviser or its affiliates were the owners of record of all of the outstanding shares of the Fund.
Report of Independent Registered Public Accounting Firm
To the Board of Trustees of Fidelity Hastings Street Trust and Shareholders of Fidelity Advisor Series Growth & Income Fund:
Opinion on the Financial Statements
We have audited the accompanying statement of assets and liabilities, including the schedule of investments, of Fidelity Advisor Series Growth & Income Fund (one of the funds constituting Fidelity Hastings Street Trust, referred to hereafter as the "Fund") as of June 30, 2018, the related statement of operations for the year ended June 30, 2018, the statement of changes in net assets for each of the two years in the period ended June 30, 2018, including the related notes, and the financial highlights for each of the five years in the period ended June 30, 2018 (collectively referred to as the “financial statements”). In our opinion, the financial statements present fairly, in all material respects, the financial position of the Fund as of June 30, 2018, the results of its operations for the year then ended, the changes in its net assets for each of the two years in the period ended June 30, 2018 and the financial highlights for each of the five years in the period ended June 30, 2018 in conformity with accounting principles generally accepted in the United States of America.
Basis for Opinion
These financial statements are the responsibility of the Fund’s management. Our responsibility is to express an opinion on the Fund’s financial statements based on our audits. We are a public accounting firm registered with the Public Company Accounting Oversight Board (United States) (“PCAOB”) and are required to be independent with respect to the Fund in accordance with the U.S. federal securities laws and the applicable rules and regulations of the Securities and Exchange Commission and the PCAOB.
We conducted our audits of these financial statements in accordance with the standards of the PCAOB. Those standards require that we plan and perform the audit to obtain reasonable assurance about whether the financial statements are free of material misstatement, whether due to error or fraud.
Our audits included performing procedures to assess the risks of material misstatement of the financial statements, whether due to error or fraud, and performing procedures that respond to those risks. Such procedures included examining, on a test basis, evidence regarding the amounts and disclosures in the financial statements. Our audits also included evaluating the accounting principles used and significant estimates made by management, as well as evaluating the overall presentation of the financial statements. Our procedures included confirmation of securities owned as of June 30, 2018 by correspondence with the custodian, and brokers; when replies were not received from brokers, we performed other auditing procedures. We believe that our audits provide a reasonable basis for our opinion.
PricewaterhouseCoopers LLP
Boston, Massachusetts
August 16, 2018
We have served as the auditor of one or more investment companies in the Fidelity group of funds since 1932.
Trustees and Officers
The Trustees, Members of the Advisory Board (if any), and officers of the trust and fund, as applicable, are listed below. The Board of Trustees governs the fund and is responsible for protecting the interests of shareholders. The Trustees are experienced executives who meet periodically throughout the year to oversee the fund's activities, review contractual arrangements with companies that provide services to the fund, oversee management of the risks associated with such activities and contractual arrangements, and review the fund's performance. Except for Michael E. Wiley, each of the Trustees oversees 284 funds. Mr. Wiley oversees 197 funds.
The Trustees hold office without limit in time except that (a) any Trustee may resign; (b) any Trustee may be removed by written instrument, signed by at least two-thirds of the number of Trustees prior to such removal; (c) any Trustee who requests to be retired or who has become incapacitated by illness or injury may be retired by written instrument signed by a majority of the other Trustees; and (d) any Trustee may be removed at any special meeting of shareholders by a two-thirds vote of the outstanding voting securities of the trust. Each Trustee who is not an interested person (as defined in the 1940 Act) of the trust and the fund is referred to herein as an Independent Trustee. Each Independent Trustee shall retire not later than the last day of the calendar year in which his or her 75th birthday occurs. The Independent Trustees may waive this mandatory retirement age policy with respect to individual Trustees. Officers and Advisory Board Members hold office without limit in time, except that any officer or Advisory Board Member may resign or may be removed by a vote of a majority of the Trustees at any regular meeting or any special meeting of the Trustees. Except as indicated, each individual has held the office shown or other offices in the same company for the past five years.
The fund’s Statement of Additional Information (SAI) includes more information about the Trustees. To request a free copy, call Fidelity at 1-877-208-0098.
Experience, Skills, Attributes, and Qualifications of the Trustees. The Governance and Nominating Committee has adopted a statement of policy that describes the experience, qualifications, attributes, and skills that are necessary and desirable for potential Independent Trustee candidates (Statement of Policy). The Board believes that each Trustee satisfied at the time he or she was initially elected or appointed a Trustee, and continues to satisfy, the standards contemplated by the Statement of Policy. The Governance and Nominating Committee also engages professional search firms to help identify potential Independent Trustee candidates who have the experience, qualifications, attributes, and skills consistent with the Statement of Policy. From time to time, additional criteria based on the composition and skills of the current Independent Trustees, as well as experience or skills that may be appropriate in light of future changes to board composition, business conditions, and regulatory or other developments, have also been considered by the professional search firms and the Governance and Nominating Committee. In addition, the Board takes into account the Trustees' commitment and participation in Board and committee meetings, as well as their leadership of standing and ad hoc committees throughout their tenure.
In determining that a particular Trustee was and continues to be qualified to serve as a Trustee, the Board has considered a variety of criteria, none of which, in isolation, was controlling. The Board believes that, collectively, the Trustees have balanced and diverse experience, qualifications, attributes, and skills, which allow the Board to operate effectively in governing the fund and protecting the interests of shareholders. Information about the specific experience, skills, attributes, and qualifications of each Trustee, which in each case led to the Board's conclusion that the Trustee should serve (or continue to serve) as a trustee of the fund, is provided below.
Board Structure and Oversight Function. James C. Curvey is an interested person and currently serves as Chairman. The Trustees have determined that an interested Chairman is appropriate and benefits shareholders because an interested Chairman has a personal and professional stake in the quality and continuity of services provided to the fund. Independent Trustees exercise their informed business judgment to appoint an individual of their choosing to serve as Chairman, regardless of whether the Trustee happens to be independent or a member of management. The Independent Trustees have determined that they can act independently and effectively without having an Independent Trustee serve as Chairman and that a key structural component for assuring that they are in a position to do so is for the Independent Trustees to constitute a substantial majority for the Board. The Independent Trustees also regularly meet in executive session. Ned C. Lautenbach serves as Chairman of the Independent Trustees and as such (i) acts as a liaison between the Independent Trustees and management with respect to matters important to the Independent Trustees and (ii) with management prepares agendas for Board meetings.
Fidelity® funds are overseen by different Boards of Trustees. The fund's Board oversees Fidelity's high income and certain equity funds, and other Boards oversee Fidelity's investment-grade bond, money market, asset allocation, and other equity funds. The asset allocation funds may invest in Fidelity® funds overseen by the fund's Board. The use of separate Boards, each with its own committee structure, allows the Trustees of each group of Fidelity® funds to focus on the unique issues of the funds they oversee, including common research, investment, and operational issues. On occasion, the separate Boards establish joint committees to address issues of overlapping consequences for the Fidelity® funds overseen by each Board.
The Trustees operate using a system of committees to facilitate the timely and efficient consideration of all matters of importance to the Trustees, the fund, and fund shareholders and to facilitate compliance with legal and regulatory requirements and oversight of the fund's activities and associated risks. The Board, acting through its committees, has charged FMR and its affiliates with (i) identifying events or circumstances the occurrence of which could have demonstrably adverse effects on the fund's business and/or reputation; (ii) implementing processes and controls to lessen the possibility that such events or circumstances occur or to mitigate the effects of such events or circumstances if they do occur; and (iii) creating and maintaining a system designed to evaluate continuously business and market conditions in order to facilitate the identification and implementation processes described in (i) and (ii) above. Because the day-to-day operations and activities of the fund are carried out by or through FMR, its affiliates, and other service providers, the fund's exposure to risks is mitigated but not eliminated by the processes overseen by the Trustees. While each of the Board's committees has responsibility for overseeing different aspects of the fund's activities, oversight is exercised primarily through the Operations, Audit, and Compliance Committees. In addition, the Independent Trustees have worked with Fidelity to enhance the Board's oversight of investment and financial risks, legal and regulatory risks, technology risks, and operational risks, including the development of additional risk reporting to the Board. Appropriate personnel, including but not limited to the fund's Chief Compliance Officer (CCO), FMR's internal auditor, the independent accountants, the fund's Treasurer and portfolio management personnel, make periodic reports to the Board's committees, as appropriate, including an annual review of Fidelity's risk management program for the Fidelity® funds. The responsibilities of each standing committee, including their oversight responsibilities, are described further under "Standing Committees of the Trustees."
Interested Trustees*:
Correspondence intended for a Trustee who is an interested person may be sent to Fidelity Investments, 245 Summer Street, Boston, Massachusetts 02210.
Name, Year of Birth; Principal Occupations and Other Relevant Experience+
James C. Curvey (1935)
Year of Election or Appointment: 2007
Trustee
Chairman of the Board of Trustees
Mr. Curvey also serves as Trustee of other Fidelity® funds. Mr. Curvey is Vice Chairman (2007-present) and Director of FMR LLC (diversified financial services company). In addition, Mr. Curvey is an Overseer Emeritus for the Boston Symphony Orchestra, a Director of Artis-Naples, and a Trustee of Brewster Academy in Wolfeboro, New Hampshire. Previously, Mr. Curvey served as a Director of Fidelity Research & Analysis Co. (investment adviser firm, 2009-2018), Director of Fidelity Investments Money Management, Inc. (investment adviser firm, 2009-2014) and a Director of FMR and FMR Co., Inc. (investment adviser firms, 2007-2014).
Charles S. Morrison (1960)
Year of Election or Appointment: 2014
Trustee
Mr. Morrison also serves as Trustee of other funds. He serves as President of Fidelity SelectCo, LLC (investment adviser firm, 2017-present) and Fidelity Management & Research Company (FMR) (investment adviser firm, 2016-present), a Director of Fidelity Investments Money Management, Inc. (FIMM) (investment adviser firm, 2014-present), Director of Fidelity SelectCo, LLC (investment adviser firm, 2014-present), President, Asset Management (2014-present), and is an employee of Fidelity Investments. Previously, Mr. Morrison served as Vice President of Fidelity's Fixed Income and Asset Allocation Funds (2012-2014), President, Fixed Income (2011-2014), Vice President of Fidelity's Money Market Funds (2005-2009), President, Money Market Group Leader of FMR (investment adviser firm, 2009), and Senior Vice President, Money Market Group of FMR (2004-2009). Mr. Morrison also served as Vice President of Fidelity's Bond Funds (2002-2005), certain Balanced Funds (2002-2005), and certain Asset Allocation Funds (2002-2007), and as Senior Vice President (2002-2005) of Fidelity's Bond Division.
* Determined to be an “Interested Trustee” by virtue of, among other things, his or her affiliation with the trust or various entities under common control with FMR.
+ The information includes the Trustee's principal occupation during the last five years and other information relating to the experience, attributes, and skills relevant to the Trustee's qualifications to serve as a Trustee, which led to the conclusion that the Trustee should serve as a Trustee for the fund.
Independent Trustees:
Correspondence intended for an Independent Trustee may be sent to Fidelity Investments, P.O. Box 55235, Boston, Massachusetts 02205-5235.
Name, Year of Birth; Principal Occupations and Other Relevant Experience+
Dennis J. Dirks (1948)
Year of Election or Appointment: 2005
Trustee
Mr. Dirks also serves as Trustee of other Fidelity® funds. Prior to his retirement in May 2003, Mr. Dirks was Chief Operating Officer and a member of the Board of The Depository Trust & Clearing Corporation (DTCC). He also served as President, Chief Operating Officer, and Board member of The Depository Trust Company (DTC) and President and Board member of the National Securities Clearing Corporation (NSCC). In addition, Mr. Dirks served as Chief Executive Officer and Board member of the Government Securities Clearing Corporation, Chief Executive Officer and Board member of the Mortgage-Backed Securities Clearing Corporation, as a Trustee and a member of the Finance Committee of Manhattan College (2005-2008), as a Trustee and a member of the Finance Committee of AHRC of Nassau County (2006-2008), as a member of the Independent Directors Council (IDC) Governing Council (2010-2015), and as a member of the Board of Directors for The Brookville Center for Children’s Services, Inc. (2009-2017). Mr. Dirks is a member of the Finance Committee (2016-present), Board of Directors (2017-present) and Board of Trustees (2018-present) and is Treasurer (2018-present) of the Asolo Repertory Theatre.
Donald F. Donahue (1950)
Year of Election or Appointment: 2018
Trustee
Mr. Donahue also serves as a Trustee of other Fidelity® funds. Mr. Donahue is President and Chief Executive Officer of Miranda Partners, LLC (risk consulting for the financial services industry, 2012-present). Previously, Mr. Donahue served as a Member of the Advisory Board of certain Fidelity® funds (2015-2018) and Chief Executive Officer (2006-2012), Chief Operating Officer (2003-2006), and Managing Director, Customer Marketing and Development (1999-2003) of The Depository Trust & Clearing Corporation (financial markets infrastructure). Mr. Donahue serves as a Member (2007-present) and Co-Chairman (2016-present) of the Board of Directors of United Way of New York, Member of the Board of Directors of NYC Leadership Academy (2012-present) and Member of the Board of Advisors of Ripple Labs, Inc. (financial services, 2015-present). He also served as Chairman (2010-2012) and Member of the Board of Directors (2012-2013) of Omgeo, LLC (financial services), Treasurer of United Way of New York (2012-2016), and Member of the Board of Directors of XBRL US (financial services non-profit, 2009-2012) and the International Securities Services Association (2009-2012).
Alan J. Lacy (1953)
Year of Election or Appointment: 2008
Trustee
Mr. Lacy also serves as Trustee of other Fidelity® funds. Mr. Lacy serves as a Director of Bristol-Myers Squibb Company (global pharmaceuticals, 2008-present). He is a Trustee of the California Chapter of The Nature Conservancy (2015-present) and a Director of the Center for Advanced Study in the Behavioral Sciences at Stanford University (2015-present). In addition, Mr. Lacy served as Senior Adviser (2007-2014) of Oak Hill Capital Partners, L.P. (private equity) and also served as Chief Executive Officer (2005) and Vice Chairman (2005-2006) of Sears Holdings Corporation (retail) and Chief Executive Officer and Chairman of the Board of Sears, Roebuck and Co. (retail, 2000-2005). Previously, Mr. Lacy served as Chairman (2014-2017) and a member (2010-2017) of the Board of Directors of Dave & Buster’s Entertainment, Inc. (restaurant and entertainment complexes), as Chairman (2008-2011) and a member (2006-2015) of the Board of Trustees of the National Parks Conservation Association, and as a member of the Board of Directors for The Hillman Companies, Inc. (hardware wholesalers, 2010-2014), Earth Fare, Inc. (retail grocery, 2010-2014), and The Western Union Company (global money transfer, 2006-2011).
Ned C. Lautenbach (1944)
Year of Election or Appointment: 2000
Trustee
Chairman of the Independent Trustees
Mr. Lautenbach also serves as Trustee of other Fidelity® funds. Mr. Lautenbach currently serves as Vice Chair of the Board of Governors, State University System of Florida (2013-present) and is a member of the Council on Foreign Relations (1994-present). He is also a member and has most recently served as Chairman of the Board of Directors of Artis-Naples (2012-present). Previously, Mr. Lautenbach served as a member and then Lead Director of the Board of Directors of Eaton Corporation (diversified industrial, 1997-2016). He was also a Partner and Advisory Partner at Clayton, Dubilier & Rice, LLC (private equity investment, 1998-2010), as well as a Director of Sony Corporation (2006-2007). In addition, Mr. Lautenbach also had a 30-year career with IBM (technology company) during which time he served as Senior Vice President and a member of the Corporate Executive Committee (1968-1998).
Joseph Mauriello (1944)
Year of Election or Appointment: 2008
Trustee
Mr. Mauriello also serves as Trustee of other Fidelity® funds. Prior to his retirement in January 2006, Mr. Mauriello served in numerous senior management positions including Deputy Chairman and Chief Operating Officer (2004-2005), and Vice Chairman of Financial Services (2002-2004) of KPMG LLP US (professional services, 1965-2005). Mr. Mauriello currently serves as a member of the Board of Directors of XL Group plc. (global insurance and re-insurance, 2006-present) and the Independent Directors Council (IDC) Governing Council (2015-present). Previously, Mr. Mauriello served as a Director of the Hamilton Funds of the Bank of New York (2006-2007) and of Arcadia Resources Inc. (health care services and products, 2007-2012).
Cornelia M. Small (1944)
Year of Election or Appointment: 2005
Trustee
Ms. Small also serves as Trustee of other Fidelity® funds. Ms. Small is a member of the Board of Directors (2009-present) and Chair of the Investment Committee (2010-present) of the Teagle Foundation. Ms. Small also serves on the Investment Committee of the Berkshire Taconic Community Foundation (2008-present). Previously, Ms. Small served as Chairperson (2002-2008) and a member of the Investment Committee and Chairperson (2008-2012) and a member of the Board of Trustees of Smith College. In addition, Ms. Small served as Chief Investment Officer, Director of Global Equity Investments, and a member of the Board of Directors of Scudder, Stevens & Clark and Scudder Kemper Investments.
Garnett A. Smith (1947)
Year of Election or Appointment: 2018
Trustee
Mr. Smith also serves as Trustee of other Fidelity® funds. Prior to Mr. Smith's retirement, he served as Chairman and Chief Executive Officer of Inbrand Corp. (manufacturer of personal absorbent products, 1990-1997). He also served as President (1986-1990) of Inbrand Corp. Prior to his employment with Inbrand Corp., he was employed by a retail fabric chain and North Carolina National Bank. In addition, Mr. Smith served as a Member of the Advisory Board of certain Fidelity® funds (2012-2013) and as a board member of the Jackson Hole Land Trust (2009-2012).
David M. Thomas (1949)
Year of Election or Appointment: 2008
Trustee
Mr. Thomas also serves as Trustee of other Fidelity® funds. Mr. Thomas serves as Non-Executive Chairman of the Board of Directors of Fortune Brands Home and Security (home and security products, 2011-present), as a member of the Board of Directors (2004-present) and Presiding Director (2013-present) of Interpublic Group of Companies, Inc. (marketing communication), and as a member of the Board of Trustees of the University of Florida (2013-present). Previously, Mr. Thomas served as Executive Chairman (2005-2006) and Chairman and Chief Executive Officer (2000-2005) of IMS Health, Inc. (pharmaceutical and healthcare information solutions), and a Director of Fortune Brands, Inc. (consumer products, 2000-2011).
Michael E. Wiley (1950)
Year of Election or Appointment: 2018
Trustee
Mr. Wiley also serves as Trustee or Member of the Advisory Board of other Fidelity® funds. Mr. Wiley serves as a Director of Andeavor Corporation (independent oil refiner and marketer, 2005-present), a Director of Andeavor Logistics LP (natural resources logistics, 2015-present), and a Director of Bill Barrett Corporation (exploration and production, 2005-present). In addition, Mr. Wiley also serves as a Director of Post Oak Bank (privately-held bank, 2004-present). Previously, Mr. Wiley served as a Trustee of other Fidelity® funds (2008-2013), as a Director of Asia Pacific Exploration Consolidated (international oil and gas exploration and production, 2008-2013), as a member of the Board of Trustees of the University of Tulsa (2000-2006; 2007-2010), as a Senior Energy Advisor of Katzenbach Partners, LLC (consulting, 2006-2007), as an Advisory Director of Riverstone Holdings (private investment), Chairman, President, and CEO of Baker Hughes, Inc. (oilfield services, 2000-2004), and as Director of Spinnaker Exploration Company (exploration and production, 2001-2005).
+ The information includes the Trustee's principal occupation during the last five years and other information relating to the experience, attributes, and skills relevant to the Trustee's qualifications to serve as a Trustee, which led to the conclusion that the Trustee should serve as a Trustee for the fund.
Advisory Board Members and Officers:
Correspondence intended for a Member of the Advisory Board (if any) may be sent to Fidelity Investments, P.O. Box 55235, Boston, Massachusetts 02205-5235. Correspondence intended for an officer or Peter S. Lynch may be sent to Fidelity Investments, 245 Summer Street, Boston, Massachusetts 02210. Officers appear below in alphabetical order.
Name, Year of Birth; Principal Occupation
Peter S. Lynch (1944)
Year of Election or Appointment: 2003
Member of the Advisory Board
Mr. Lynch also serves as Member of the Advisory Board of other Fidelity® funds. Mr. Lynch is Vice Chairman and a Director of FMR (investment adviser firm) and FMR Co., Inc. (investment adviser firm). In addition, Mr. Lynch serves as a Trustee of Boston College and as the Chairman of the Inner-City Scholarship Fund. Previously, Mr. Lynch served on the Special Olympics International Board of Directors (1997-2006).
William S. Stavropoulos (1939)
Year of Election or Appointment: 2018
Member of the Advisory Board
Mr. Stavropoulos also serves as Member of the Advisory Board of other Fidelity® funds. Mr. Stavropoulos serves as President and Founder of the Michigan Baseball Foundation, the Great Lakes Loons (2007-present). Mr. Stavropoulos is Chairman Emeritus of the Board of Directors of The Dow Chemical Company, where he previously served in numerous senior management positions, including President, CEO (1995-2000; 2002-2004), Chairman of the Executive Committee (2000-2006), and as a member of the Board of Directors (1990-2006). Currently, Mr. Stavropoulos is Chairman of the Board of Directors of Univar Inc. (global distributor of commodity and specialty chemicals), a Director of Teradata Corporation (data warehousing and technology solutions), and a member of the Advisory Board for Metalmark Capital LLC (private equity investment, 2005-present). Mr. Stavropoulos is an operating advisor to Clayton, Dubilier & Rice, LLC (private equity investment). In addition, Mr. Stavropoulos is a member of the University of Notre Dame Advisory Council for the College of Science, a Trustee of the Rollin L. Gerstacker Foundation, and a Director of Artis-Naples in Naples, Florida. Previously, Mr. Stavropoulos served as Trustee of certain Fidelity® funds (2001-2018) and as a Director of Chemical Financial Corporation (bank holding company, 1993-2012) and Tyco International, Ltd. (multinational manufacturing and services, 2007-2012).
Carol B. Tomé (1957)
Year of Election or Appointment: 2018
Member of the Advisory Board
Ms. Tomé also serves as Member of the Advisory Board of other Fidelity® funds. Ms. Tomé is Chief Financial Officer (2001-present) and Executive Vice President of Corporate Services (2007-present) of The Home Depot, Inc. (home improvement retailer) and a Director (2003-present) and Chair of the Audit Committee (2004-present) of United Parcel Service, Inc. (package delivery and supply chain management). Previously, Ms. Tomé served as Trustee of certain Fidelity® funds (2017), Senior Vice President of Finance and Accounting/Treasurer (2000-2007) and Vice President and Treasurer (1995-2000) of The Home Depot, Inc. and Chair of the Board (2010-2012), Vice Chair of the Board (2009 and 2013), and a Director (2008-2013) of the Federal Reserve Bank of Atlanta. Ms. Tomé is also a director or trustee of many community and professional organizations.
Elizabeth Paige Baumann (1968)
Year of Election or Appointment: 2017
Anti-Money Laundering (AML) Officer
Ms. Baumann also serves as AML Officer of other funds. She is Chief AML Officer (2012-present) and Senior Vice President (2014-present) of FMR LLC (diversified financial services company) and is an employee of Fidelity Investments. Previously, Ms. Baumann served as AML Officer of the funds (2012-2016), and Vice President (2007-2014) and Deputy Anti-Money Laundering Officer (2007-2012) of FMR LLC.
Marc R. Bryant (1966)
Year of Election or Appointment: 2015
Secretary and Chief Legal Officer (CLO)
Mr. Bryant also serves as Secretary and CLO of other funds. Mr. Bryant serves as CLO, Secretary, and Senior Vice President of Fidelity Management & Research Company (investment adviser firm, 2015-present) and FMR Co., Inc. (investment adviser firm, 2015-present); Secretary of Fidelity SelectCo, LLC (investment adviser firm, 2015-present) and Fidelity Investments Money Management, Inc. (investment adviser firm, 2015-present); and CLO of Fidelity Management & Research (Hong Kong) Limited and FMR Investment Management (UK) Limited (investment adviser firms, 2015-present) and Fidelity Management & Research (Japan) Limited (investment adviser firm, 2016-present). He is Senior Vice President and Deputy General Counsel of FMR LLC (diversified financial services company). Previously, Mr. Bryant served as Secretary and CLO of Fidelity Rutland Square Trust II (2010-2014) and Assistant Secretary of Fidelity's Fixed Income and Asset Allocation Funds (2013-2015). Prior to joining Fidelity Investments, Mr. Bryant served as a Senior Vice President and the Head of Global Retail Legal for AllianceBernstein L.P. (2006-2010), and as the General Counsel for ProFund Advisors LLC (2001-2006).
John J. Burke III (1964)
Year of Election or Appointment: 2018
Chief Financial Officer
Mr. Burke also serves as Chief Financial Officer of other funds. Mr. Burke serves as Head of Investment Operations for Fidelity Fund and Investment Operations (2018-present) and is an employee of Fidelity Investments (1998-present). Previously Mr. Burke served as head of Asset Management Investment Operations (2012-2018).
William C. Coffey (1969)
Year of Election or Appointment: 2009
Assistant Secretary
Mr. Coffey also serves as Assistant Secretary of other funds. He is Senior Vice President and Deputy General Counsel of FMR LLC (diversified financial services company, 2010-present), and is an employee of Fidelity Investments. Previously, Mr. Coffey served as Vice President and Associate General Counsel of FMR LLC (2005-2009).
Timothy M. Cohen (1969)
Year of Election or Appointment: 2018
Vice President
Mr. Cohen also serves as Vice President of other funds. Mr. Cohen serves as Co-Head of Global Equity Research (2016-present), a Director of Fidelity Management & Research (Japan) Limited (investment adviser firm, 2016-present), and is an employee of Fidelity Investments. Previously, Mr. Cohen served as Chief Investment Officer - Equity and a Director of Fidelity Management & Research (U.K.) Inc. (investment adviser firm, 2013-2015) and as a Director of Fidelity Management & Research (Hong Kong) Limited (investment adviser firm, 2017).
Jonathan Davis (1968)
Year of Election or Appointment: 2010
Assistant Treasurer
Mr. Davis also serves as Assistant Treasurer of other funds. Mr. Davis serves as Assistant Treasurer of FMR Capital, Inc. (2017-present) and is an employee of Fidelity Investments. Previously, Mr. Davis served as Vice President and Associate General Counsel of FMR LLC (diversified financial services company, 2003-2010).
Adrien E. Deberghes (1967)
Year of Election or Appointment: 2016
Assistant Treasurer
Mr. Deberghes also serves as an officer of other funds. He serves as Assistant Treasurer of FMR Capital, Inc. (2017-present), Executive Vice President of Fidelity Investments Money Management, Inc. (FIMM) (investment adviser firm, 2016-present), and is an employee of Fidelity Investments (2008-present). Previously, Mr. Deberghes served as President and Treasurer of certain Fidelity® funds (2013-2018). Prior to joining Fidelity Investments, Mr. Deberghes was Senior Vice President of Mutual Fund Administration at State Street Corporation (2007-2008), Senior Director of Mutual Fund Administration at Investors Bank & Trust (2005-2007), and Director of Finance for Dunkin' Brands (2000-2005). Previously, Mr. Deberghes served in other fund officer roles.
Laura M. Del Prato (1964)
Year of Election or Appointment: 2018
Assistant Treasurer
Ms. Del Prato also serves as an officer of other funds. Ms. Del Prato is an employee of Fidelity Investments (2017-present). Prior to joining Fidelity Investments, Ms. Del Prato served as a Managing Director and Treasurer of the JPMorgan Mutual Funds (2014-2017). Prior to JPMorgan, Ms. Del Prato served as a partner at Cohen Fund Audit Services (accounting firm, 2012-2013) and KPMG LLP (accounting firm, 2004-2012).
Colm A. Hogan (1973)
Year of Election or Appointment: 2016
Deputy Treasurer
Mr. Hogan also serves as an officer of other funds. Mr. Hogan serves as Assistant Treasurer of FMR Capital, Inc. (2017-present) and is an employee of Fidelity Investments (2005-present). Previously, Mr. Hogan served as Assistant Treasurer of certain Fidelity® funds (2016-2018).
Pamela R. Holding (1964)
Year of Election or Appointment: 2018
Vice President
Ms. Holding also serves as a Vice President of other funds. Ms. Holding serves as Co-Head of Global Equity Research (2018-present) and is an employee of Fidelity Investments (2013-present).
Chris Maher (1972)
Year of Election or Appointment: 2013
Assistant Treasurer
Mr. Maher serves as Assistant Treasurer of other funds. Mr. Maher is Vice President of Valuation Oversight, serves as Assistant Treasurer of FMR Capital, Inc. (2017-present), and is an employee of Fidelity Investments. Previously, Mr. Maher served as Vice President of Asset Management Compliance (2013), Vice President of the Program Management Group of FMR (investment adviser firm, 2010-2013), and Vice President of Valuation Oversight (2008-2010).
Rieco E. Mello (1969)
Year of Election or Appointment: 2017
Assistant Treasurer
Mr. Mello also serves as Assistant Treasurer of other funds. Mr. Mello serves as Assistant Treasurer of FMR Capital, Inc. (2017-present) and is an employee of Fidelity Investments (1995-present).
Kenneth B. Robins (1969)
Year of Election or Appointment: 2016
Chief Compliance Officer
Mr. Robins also serves as an officer of other funds. Mr. Robins serves as Compliance Officer of Fidelity Management & Research Company and FMR Co., Inc. (investment adviser firms, 2016-present) and is an employee of Fidelity Investments (2004-present). Previously, Mr. Robins served as Executive Vice President of Fidelity Investments Money Management, Inc. (investment adviser firm, 2013-2016) and served in other fund officer roles.
Stacie M. Smith (1974)
Year of Election or Appointment: 2016
President and Treasurer
Ms. Smith also serves as an officer of other funds. Ms. Smith serves as Assistant Treasurer of FMR Capital, Inc. (2017-present), is an employee of Fidelity Investments (2009-present), and has served in other fund officer roles. Prior to joining Fidelity Investments, Ms. Smith served as Senior Audit Manager of Ernst & Young LLP (accounting firm, 1996-2009). Previously, Ms. Smith served as Assistant Treasurer (2013-2018) and Deputy Treasurer (2013-2016) of certain Fidelity® funds.
Marc L. Spector (1972)
Year of Election or Appointment: 2016
Assistant Treasurer
Mr. Spector also serves as an officer of other funds. Mr. Spector serves as Assistant Treasurer of FMR Capital, Inc. (2017-present) and is an employee of Fidelity Investments (2016-present). Prior to joining Fidelity Investments, Mr. Spector served as Director at the Siegfried Group (accounting firm, 2013-2016), and prior to Siegfried Group as audit senior manager at Deloitte & Touche (accounting firm, 2005-2013).
Renee Stagnone (1975)
Year of Election or Appointment: 2016
Assistant Treasurer
Ms. Stagnone also serves as an officer of other funds. Ms. Stagnone serves as Assistant Treasurer of FMR Capital, Inc. (2017-present) and is an employee of Fidelity Investments (1997-present). Previously, Ms. Stagnone served as Deputy Treasurer of certain Fidelity® funds (2013-2016).
Shareholder Expense Example
As a shareholder of the Fund, you incur two types of costs: (1) transaction costs and (2) ongoing costs, including other Fund expenses. This Example is intended to help you understand your ongoing costs (in dollars) of investing in the Fund and to compare these costs with the ongoing costs of investing in other mutual funds.
The Example is based on an investment of $1,000 invested at the beginning of the period and held for the entire period (January 1, 2018 to June 30, 2018).
Actual Expenses
The first line of the accompanying table provides information about actual account values and actual expenses. You may use the information in this line, together with the amount you invested, to estimate the expenses that you paid over the period. Simply divide your account value by $1,000.00 (for example, an $8,600 account value divided by $1,000.00 = 8.6), then multiply the result by the number in the first line under the heading entitled "Expenses Paid During Period" to estimate the expenses you paid on your account during this period. In addition, the Fund, as a shareholder in the underlying Fidelity Central Funds, will indirectly bear its pro-rata share of the fees and expenses incurred by the underlying Fidelity Central Funds. These fees and expenses are not included in the Fund's annualized expense ratio used to calculate the expense estimate in the table below.
Hypothetical Example for Comparison Purposes
The second line of the accompanying table provides information about hypothetical account values and hypothetical expenses based on the Fund's actual expense ratio and an assumed rate of return of 5% per year before expenses, which is not the Fund's actual return. The hypothetical account values and expenses may not be used to estimate the actual ending account balance or expenses you paid for the period. You may use this information to compare the ongoing costs of investing in the Fund and other funds. To do so, compare this 5% hypothetical example with the 5% hypothetical examples that appear in the shareholder reports of the other funds. In addition, the Fund, as a shareholder in the underlying Fidelity Central Funds, will indirectly bear its pro-rata share of the fees and expenses incurred by the underlying Fidelity Central Funds. These fees and expenses are not included in the Fund's annualized expense ratio used to calculate the expense estimate in the table below.
Please note that the expenses shown in the table are meant to highlight your ongoing costs only and do not reflect any transaction costs. Therefore, the second line of the table is useful in comparing ongoing costs only, and will not help you determine the relative total costs of owning different funds.
| | Annualized Expense Ratio-A | Beginning
Account Value
January 1, 2018 | Ending
Account Value
June 30, 2018 | Expenses Paid
During Period-B
January 1, 2018
to June 30, 2018 |
| Actual | .01% | $1,000.00 | $1,006.10 | $.05 |
| Hypothetical-C | | $1,000.00 | $1,024.74 | $.05 |
A Annualized expense ratio reflects expenses net of applicable fee waivers.
B Expenses are equal to the Fund's annualized expense ratio, multiplied by the average account value over the period, multiplied by 181/365 (to reflect the one-half year period).
C 5% return per year before expenses
Distributions (Unaudited)
The Board of Trustees of Fidelity Advisor Series Growth & Income Fund voted to pay on August 13, 2018, to shareholders of record at the opening of business on August 10, 2018, a distribution of $0.758 per share derived from capital gains realized from sales of portfolio securities.
The fund hereby designates as a capital gain dividend with respect to the taxable year ended June 30, 2018, $66,830,561, or, if subsequently determined to be different, the net capital gain of such year.
A total of 0.18% of the dividends distributed during the fiscal year was derived from interest on U.S. Government securities which is generally exempt from state income tax.
The fund designates 100%, 73%, 65%, and 100% of the dividends distributed in July, October, December, and April, respectively during the fiscal year as qualifying for the dividends–received deduction for corporate shareholders.
The fund designates 100%, 80%, 73%, and 100% of the dividends distributed in July, October, December, and April, respectively during the fiscal year as amounts which may be taken into account as a dividend for the purposes of the maximum rate under section 1(h)(11) of the Internal Revenue Code.
The fund will notify shareholders in January 2019 of amounts for use in preparing 2018 income tax returns.
Corporate Headquarters
245 Summer St.
Boston, MA 02210
www.fidelity.com
AMHTI-ANN-0818
1.950941.106
Item 2.
Code of Ethics
As of the end of the period, June 30, 2018, Fidelity Hastings Street Trust (the trust) has adopted a code of ethics, as defined in Item 2 of Form N-CSR, that applies to its President and Treasurer and its Chief Financial Officer. A copy of the code of ethics is filed as an exhibit to this Form N-CSR.
Item 3.
Audit Committee Financial Expert
The Board of Trustees of the trust has determined that Joseph Mauriello is an audit committee financial expert, as defined in Item 3 of Form N-CSR. Mr. Mauriello is independent for purposes of Item 3 of Form N-CSR.
Item 4.
Principal Accountant Fees and Services
Fees and Services
The following table presents fees billed by PricewaterhouseCoopers LLP (“PwC”) in each of the last two fiscal years for services rendered to Fidelity Advisor Series Growth & Income Fund, Fidelity Fund, Fidelity Growth Discovery Fund, Fidelity Mega Cap Stock Fund and Fidelity Series Growth & Income Fund (the “Funds”):
Services Billed by PwC
June 30, 2018 FeesA
| | | | |
| Audit Fees | Audit-Related Fees | Tax Fees | All Other Fees |
Fidelity Advisor Series Growth & Income Fund | $43,000 | $3,500 | $5,400 | $1,700 |
Fidelity Fund | $62,000 | $5,300 | $5,500 | $2,600 |
Fidelity Growth Discovery Fund | $43,000 | $3,800 | $3,300 | $1,800 |
Fidelity Mega Cap Stock Fund | $49,000 | $3,900 | $3,600 | $1,900 |
Fidelity Series Growth & Income Fund | $45,000 | $3,700 | $8,300 | $1,800 |
| | | | |
| Audit Fees | Audit-Related Fees | Tax Fees | All Other Fees |
Fidelity Advisor Series Growth & Income Fund | $37,000 | $3,700 | $5,500 | $1,700 |
Fidelity Fund | $61,000 | $6,000 | $4,900 | $2,800 |
Fidelity Growth Discovery Fund | $43,000 | $4,200 | $4,300 | $2,000 |
Fidelity Mega Cap Stock Fund | $41,000 | $4,100 | $4,100 | $1,900 |
Fidelity Series Growth & Income Fund | $40,000 | $4,000 | $8,300 | $1,900 |
A Amounts may reflect rounding.
The following table presents fees billed by PwC that were required to be approved by the Audit Committee for services that relate directly to the operations and financial reporting of the Funds and that are rendered on behalf of Fidelity Management & Research Company (“FMR”) and entities controlling, controlled by, or under common control with FMR (not including any sub-adviser whose role is primarily portfolio management and is subcontracted with or overseen by another investment adviser) that provide ongoing services to the Funds (“Fund Service Providers”):
Services Billed by PwC
| | |
| June 30, 2018A | June 30, 2017A |
Audit-Related Fees | $7,605,000 | $6,345,000 |
Tax Fees | $20,000 | $160,000 |
All Other Fees | $- | $- |
A Amounts may reflect rounding.
“Audit-Related Fees” represent fees billed for assurance and related services that are reasonably related to the performance of the fund audit or the review of the fund's financial statements and that are not reported under Audit Fees.
“Tax Fees” represent fees billed for tax compliance, tax advice or tax planning that relate directly to the operations and financial reporting of the fund.
“All Other Fees” represent fees billed for services provided to the fund or Fund Service Provider, a significant portion of which are assurance related, that relate directly to the operations and financial reporting of the fund, excluding those services that are reported under Audit Fees, Audit-Related Fees or Tax Fees.
Assurance services must be performed by an independent public accountant.
* * *
The aggregate non-audit fees billed by PwC for services rendered to the Funds, FMR (not including any sub-adviser whose role is primarily portfolio management and is subcontracted with or overseen by another investment adviser), and any Fund Service Provider for each of the last two fiscal years of the Funds are as follows:
| | |
Billed By | June 30, 2018A | June 30, 2017A |
PwC | $10,415,000 | $7,810,000 |
A Amounts may reflect rounding.
The trust's Audit Committee has considered non-audit services that were not pre-approved that were provided by PwC to Fund Service Providers to be compatible with maintaining the independence of PwC in its audit of the Funds, taking into account representations from PwC, in accordance with Public Company Accounting Oversight Board rules, regarding its independence from the Funds and their related entities and FMR’s review of the appropriateness and permissibility under applicable law of such non-audit services prior to their provision to the Fund Service Providers.
Audit Committee Pre-Approval Policies and Procedures
The trust’s Audit Committee must pre-approve all audit and non-audit services provided by a fund’s independent registered public accounting firm relating to the operations or financial reporting of the fund. Prior to the commencement of any audit or non-audit services to a fund, the Audit Committee reviews the services to determine whether they are appropriate and permissible under applicable law.
The Audit Committee has adopted policies and procedures to, among other purposes, provide a framework for the Committee’s consideration of non-audit services by the audit firms that audit the Fidelity funds. The policies and procedures require that any non-audit service provided by a fund audit firm to a Fidelity fund and any non-audit service provided by a fund auditor to a Fund Service Provider that relates directly to the operations and financial reporting of a Fidelity fund (“Covered Service”) are subject to approval by the Audit Committee before such service is provided.
All Covered Services must be approved in advance of provision of the service either: (i) by formal resolution of the Audit Committee, or (ii) by oral or written approval of the service by the Chair of the Audit Committee (or if the Chair is unavailable, such other member of the Audit Committee as may be designated by the Chair to act in the Chair’s absence). The approval contemplated by (ii) above is permitted where the Treasurer determines that action on such an engagement is necessary before the next meeting of the Audit Committee.
Non-audit services provided by a fund audit firm to a Fund Service Provider that do not relate directly to the operations and financial reporting of a Fidelity fund are reported to the Audit Committee periodically.
Non-Audit Services Approved Pursuant to Rule 2-01(c)(7)(i)(C) and (ii) of Regulation S-X (“De Minimis Exception”)
There were no non-audit services approved or required to be approved by the Audit Committee pursuant to the De Minimis Exception during the Funds’ last two fiscal years relating to services provided to (i) the Funds or (ii) any Fund Service Provider that relate directly to the operations and financial reporting of the Funds.
Item 5.
Audit Committee of Listed Registrants
Not applicable.
Item 6.
Investments
(a)
Not applicable.
(b)
Not applicable
Item 7.
Disclosure of Proxy Voting Policies and Procedures for Closed-End Management Investment Companies
Not applicable.
Item 8.
Portfolio Managers of Closed-End Management Investment Companies
Not applicable.
Item 9.
Purchase of Equity Securities by Closed-End Management Investment Company and Affiliated Purchasers
Not applicable.
Item 10.
Submission of Matters to a Vote of Security Holders
There were no material changes to the procedures by which shareholders may recommend nominees to the trust’s Board of Trustees.
Item 11.
Controls and Procedures
(a)(i) The President and Treasurer and the Chief Financial Officer have concluded that the trust’s disclosure controls and procedures (as defined in Rule 30a-3(c) under the Investment Company Act) provide reasonable assurances that material information relating to the trust is made known to them by the appropriate persons, based on their evaluation of these controls and procedures as of a date within 90 days of the filing date of this report.
(a)(ii) There was no change in the trust’s internal control over financial reporting (as defined in Rule 30a-3(d) under the Investment Company Act) that occurred during the period covered by this report that has materially affected, or is reasonably likely to materially affect, the trust’s internal control over financial reporting.
Item 12.
Disclosure of Securities Lending Activities for Closed-End Management
Investment Companies
Not applicable.
Item 13.
Exhibits
| | |
(a) | (1) | Code of Ethics pursuant to Item 2 of Form N-CSR is filed and attached hereto as EX-99.CODE ETH. |
(a) | (2) | Certification pursuant to Rule 30a-2(a) under the Investment Company Act of 1940 (17 CFR 270.30a-2(a)) is filed and attached hereto as Exhibit 99.CERT. |
(a) | (3) | Not applicable. |
(b) | | Certification pursuant to Rule 30a-2(b) under the Investment Company Act of 1940 (17 CFR 270.30a-2(b)) is furnished and attached hereto as Exhibit 99.906CERT. |
SIGNATURES
Pursuant to the requirements of the Securities Exchange Act of 1934 and the Investment Company Act of 1940, the registrant has duly caused this report to be signed on its behalf by the undersigned, thereunto duly authorized.
Fidelity Hastings Street Trust
| |
By: | /s/Stacie M. Smith |
| Stacie M. Smith |
| President and Treasurer |
| |
Date: | August 27, 2018 |
Pursuant to the requirements of the Securities Exchange Act of 1934 and the Investment Company Act of 1940, this report has been signed below by the following persons on behalf of the registrant and in the capacities and on the dates indicated.
| |
By: | /s/ Stacie M. Smith |
| Stacie M. Smith |
| President and Treasurer |
| |
Date: | August 27, 2018 |
| |
By: | /s/John J. Burke III |
| John J. Burke III |
| Chief Financial Officer |
| |
Date: | August 27, 2018 |