Fidelity® Series Emerging Markets Debt Fund
Semi-Annual Report
June 30, 2020

See the inside front cover for important information about access to your fund’s shareholder reports.

Beginning on January 1, 2021, as permitted by regulations adopted by the Securities and Exchange Commission, paper copies of a fund’s shareholder reports will no longer be sent by mail, unless you specifically request paper copies of the reports from the fund or from your financial intermediary, such as a financial advisor, broker-dealer or bank. Instead, the reports will be made available on a website, and you will be notified by mail each time a report is posted and provided with a website link to access the report.
If you already elected to receive shareholder reports electronically, you will not be affected by this change and you need not take any action. You may elect to receive shareholder reports and other communications from a fund electronically, by contacting your financial intermediary. For Fidelity customers, visit Fidelity's web site or call Fidelity using the contact information listed below.
You may elect to receive all future reports in paper free of charge. If you wish to continue receiving paper copies of your shareholder reports, you may contact your financial intermediary or, if you are a Fidelity customer, visit Fidelity’s website, or call Fidelity at the applicable toll-free number listed below. Your election to receive reports in paper will apply to all funds held with the fund complex/your financial intermediary.
| Account Type | Website | Phone Number |
| Brokerage, Mutual Fund, or Annuity Contracts: | fidelity.com/mailpreferences | 1-800-343-3548 |
| Employer Provided Retirement Accounts: | netbenefits.fidelity.com/preferences (choose 'no' under Required Disclosures to continue to print) | 1-800-343-0860 |
| Advisor Sold Accounts Serviced Through Your Financial Intermediary: | Contact Your Financial Intermediary | Your Financial Intermediary's phone number |
| Advisor Sold Accounts Serviced by Fidelity: | institutional.fidelity.com | 1-877-208-0098 |
Contents
To view a fund's proxy voting guidelines and proxy voting record for the 12-month period ended June 30, visit http://www.fidelity.com/proxyvotingresults or visit the Securities and Exchange Commission's (SEC) web site at http://www.sec.gov.
You may also call 1-800-544-8544 to request a free copy of the proxy voting guidelines.
Standard & Poor's, S&P and S&P 500 are registered service marks of The McGraw-Hill Companies, Inc. and have been licensed for use by Fidelity Distributors Corporation.
Other third-party marks appearing herein are the property of their respective owners.
All other marks appearing herein are registered or unregistered trademarks or service marks of FMR LLC or an affiliated company. © 2020 FMR LLC. All rights reserved.
This report and the financial statements contained herein are submitted for the general information of the shareholders of the Fund. This report is not authorized for distribution to prospective investors in the Fund unless preceded or accompanied by an effective prospectus.
A fund files its complete schedule of portfolio holdings with the SEC for the first and third quarters of each fiscal year on Form N-PORT. Forms N-PORT are available on the SEC’s web site at http://www.sec.gov. A fund's Forms N-PORT may be reviewed and copied at the SEC’s Public Reference Room in Washington, DC. Information regarding the operation of the SEC's Public Reference Room may be obtained by calling 1-800-SEC-0330.
For a complete list of a fund's portfolio holdings, view the most recent holdings listing, semiannual report, or annual report on Fidelity's web site at http://www.fidelity.com, http://www.institutional.fidelity.com, or http://www.401k.com, as applicable.
NOT FDIC INSURED •MAY LOSE VALUE •NO BANK GUARANTEE
Neither the Fund nor Fidelity Distributors Corporation is a bank.
Note to Shareholders:
Early in 2020, the outbreak and spread of a new coronavirus emerged as a public health emergency that had a major influence on financial markets, primarily based on its impact on the global economy and the outlook for corporate earnings. The virus causes a respiratory disease known as COVID-19. On March 11, the World Health Organization declared the COVID-19 outbreak a pandemic, citing sustained risk of further global spread.
In the weeks following, as the crisis worsened, we witnessed an escalating human tragedy with wide-scale social and economic consequences from coronavirus-containment measures. The outbreak of COVID-19 prompted a number of measures to limit the spread, including travel and border restrictions, quarantines, and restrictions on large gatherings. In turn, these resulted in lower consumer activity, diminished demand for a wide range of products and services, disruption in manufacturing and supply chains, and – given the wide variability in outcomes regarding the outbreak – significant market uncertainty and volatility. Amid the turmoil, the U.S. government took unprecedented action – in concert with the U.S. Federal Reserve and central banks around the world – to help support consumers, businesses, and the broader economy, and to limit disruption to the financial system.
The situation continues to unfold, and the extent and duration of its impact on financial markets and the economy remain highly uncertain. Extreme events such as the coronavirus crisis are “exogenous shocks” that can have significant adverse effects on mutual funds and their investments. Although multiple asset classes may be affected by market disruption, the duration and impact may not be the same for all types of assets.
Fidelity is committed to helping you stay informed amid news about COVID-19 and during increased market volatility, and we’re taking extra steps to be responsive to customer needs. We encourage you to visit our websites, where we offer ongoing updates, commentary, and analysis on the markets and our funds.
Investment Summary (Unaudited)
Top Five Countries as of June 30, 2020
| (excluding cash equivalents) | % of fund's net assets |
| Mexico | 10.5 |
| Turkey | 7.2 |
| United States of America | 7.1 |
| Argentina | 6.2 |
| Ukraine | 5.5 |
Percentages are adjusted for the effect of futures contracts, if applicable.
Top Five Holdings as of June 30, 2020
| (by issuer, excluding cash equivalents) | % of fund's net assets |
| Turkish Republic | 6.0 |
| Ukraine Government | 5.5 |
| Petroleos Mexicanos | 5.3 |
| U.S. Treasury Obligations | 5.0 |
| Ministry of Finance of the Russian Federation | 4.8 |
| | 26.6 |
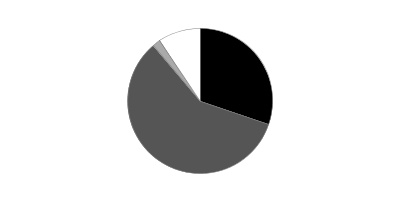
Asset Allocation (% of fund's net assets)
| As of June 30, 2020 |
| | Corporate Bonds | 30.2% |
| | Government Obligations | 58.6% |
| | Preferred Securities | 1.9% |
| | Short-Term Investments and Net Other Assets (Liabilities) | 9.3% |
Schedule of Investments June 30, 2020 (Unaudited)
Showing Percentage of Net Assets
| Nonconvertible Bonds - 30.2% | | | |
| | | Principal Amount(a) | Value |
| Argentina - 1.9% | | | |
| Aeropuertos Argentina 2000 SA: | | | |
| 6.875% 2/1/27 (b) | | $109,375 | $76,426 |
| 9.375% 2/1/27 pay-in-kind (b)(c) | | 7,360,783 | 5,798,917 |
| Banco Macro SA 6.75% 11/4/26 (b)(c) | | 4,110,000 | 3,311,761 |
| Pan American Energy LLC 7.875% 5/7/21 (b) | | 135,000 | 135,253 |
| Tecpetrol SA 4.875% 12/12/22 (b) | | 500,000 | 466,241 |
| Transportadora de Gas del Sur SA 6.75% 5/2/25 (b) | | 1,440,000 | 1,232,613 |
| YPF SA: | | | |
| 8.5% 3/23/21 (b) | | 5,133,000 | 4,337,385 |
| 8.75% 4/4/24 (b) | | 12,438,000 | 10,018,809 |
|
| TOTAL ARGENTINA | | | 25,377,405 |
|
| Azerbaijan - 0.1% | | | |
| Southern Gas Corridor CJSC 6.875% 3/24/26 (b) | | 1,006,000 | 1,154,253 |
| Bahrain - 0.3% | | | |
| The Oil and Gas Holding Co.: | | | |
| 7.5% 10/25/27 (b) | | 1,881,000 | 2,014,433 |
| 7.625% 11/7/24 (b) | | 2,220,000 | 2,404,538 |
|
| TOTAL BAHRAIN | | | 4,418,971 |
|
| Belarus - 0.0% | | | |
| Development Bank of the Republic of Belarus 6.75% 5/2/24 (b) | | 640,000 | 610,000 |
| Bermuda - 0.1% | | | |
| GeoPark Ltd. 6.5% 9/21/24 (b) | | 1,455,000 | 1,330,870 |
| Brazil - 0.0% | | | |
| Embraer SA 5.15% 6/15/22 | | 670,000 | 650,109 |
| British Virgin Islands - 1.6% | | | |
| 1MDB Global Investments Ltd. 4.4% 3/9/23 | | 21,800,000 | 20,498,813 |
| Gold Fields Orogen Holding BVI Ltd. 4.875% 10/7/20 (b) | | 1,760,000 | 1,763,520 |
|
| TOTAL BRITISH VIRGIN ISLANDS | | | 22,262,333 |
|
| Canada - 0.7% | | | |
| First Quantum Minerals Ltd. 7.25% 4/1/23 (b) | | 8,597,000 | 8,210,135 |
| Frontera Energy Corp. 9.7% 6/25/23 (b) | | 1,670,000 | 1,354,266 |
|
| TOTAL CANADA | | | 9,564,401 |
|
| Cayman Islands - 0.5% | | | |
| Comcel Trust 6.875% 2/6/24 (b) | | 3,125,000 | 3,195,844 |
| DP World Crescent Ltd. 3.875% 7/18/29 (Reg. S) | | 970,000 | 951,813 |
| Embraer Overseas Ltd. 5.696% 9/16/23 (b) | | 715,000 | 681,045 |
| NagaCorp Ltd. 9.375% 5/21/21 (b) | | 735,000 | 746,025 |
| Odebrecht Finance Ltd. 7.125% 6/26/42 (b)(d) | | 11,905,000 | 654,775 |
| Sparc Em Spc 0% 12/5/22 (b) | | 294,866 | 283,986 |
|
| TOTAL CAYMAN ISLANDS | | | 6,513,488 |
|
| Colombia - 0.0% | | | |
| Colombia Telecomunicaciones SA 5.375% 9/27/22 (b) | | 674,000 | 673,736 |
| Georgia - 0.6% | | | |
| Georgia Bank Joint Stock Co. 6% 7/26/23 (b) | | 4,975,000 | 4,869,281 |
| Georgian Oil & Gas Corp. 6.75% 4/26/21 (b) | | 2,424,000 | 2,357,339 |
| JSC Georgian Railway 7.75% 7/11/22 (b) | | 898,000 | 910,067 |
|
| TOTAL GEORGIA | | | 8,136,687 |
|
| Indonesia - 0.5% | | | |
| Delta Merlin Dunia Tekstil PT 8.625% 3/12/24 (b)(d) | | 920,000 | 101,488 |
| PT Adaro Indonesia 4.25% 10/31/24 (b) | | 3,560,000 | 3,349,738 |
| PT Bukit Makmur Mandiri Utama 7.75% 2/13/22 (b) | | 4,380,000 | 3,640,875 |
|
| TOTAL INDONESIA | | | 7,092,101 |
|
| Ireland - 0.6% | | | |
| Alfa Bond Issuance PLC 5.95% 4/15/30 (b)(c) | | 1,295,000 | 1,283,669 |
| Bonitron Designated Activity Co. 8.75% 10/30/22 (b) | | 4,041,000 | 4,091,513 |
| Borets Finance DAC 6.5% 4/7/22 (b) | | 725,000 | 723,641 |
| CBOM Finance PLC 5.55% 2/14/23 (b) | | 1,600,000 | 1,641,000 |
|
| TOTAL IRELAND | | | 7,739,823 |
|
| Isle of Man - 0.1% | | | |
| Sasol Financing International PLC 4.5% 11/14/22 | | 1,015,000 | 916,241 |
| Kazakhstan - 0.1% | | | |
| BTA Bank JSC 5.5% 12/21/22 (b) | | 1,475,862 | 1,466,638 |
| Luxembourg - 1.1% | | | |
| CSN Resources SA 7.625% 2/13/23 (b) | | 9,467,000 | 8,756,975 |
| Rumo Luxembourg SARL: | | | |
| 5.25% 1/10/28 (b) | | 790,000 | 790,000 |
| 7.375% 2/9/24 (b) | | 4,900,000 | 5,136,425 |
|
| TOTAL LUXEMBOURG | | | 14,683,400 |
|
| Malaysia - 0.2% | | | |
| Petronas Capital Ltd. 3.5% 4/21/30 (b) | | 2,000,000 | 2,216,275 |
| Mexico - 7.4% | | | |
| America Movil S.A.B. de CV 6.45% 12/5/22 | MXN | 110,740,000 | 4,881,266 |
| Axtel S.A.B. de CV 6.375% 11/14/24 (b) | | 500,000 | 519,260 |
| Credito Real S.A.B. de CV 9.5% 2/7/26 (b) | | 1,370,000 | 1,399,541 |
| Metalsa SA de CV 4.9% 4/24/23 (b) | | 1,688,000 | 1,654,240 |
| Pemex Project Funding Master Trust: | | | |
| 6.625% 6/15/35 | | 17,446,000 | 14,133,115 |
| 8.625% 2/1/22 | | 1,197,000 | 1,251,239 |
| 8.625% 12/1/23 (c) | | 320,000 | 308,800 |
| Petroleos Mexicanos: | | | |
| 3 month U.S. LIBOR + 3.650% 3.9646% 3/11/22 (c)(e) | | 2,448,000 | 2,359,872 |
| 3.5% 1/30/23 | | 4,187,000 | 3,958,809 |
| 4.875% 1/24/22 | | 4,315,000 | 4,267,805 |
| 4.875% 1/18/24 | | 17,292,000 | 16,627,339 |
| 5.375% 3/13/22 | | 1,590,000 | 1,586,025 |
| 5.5% 1/21/21 | | 1,130,000 | 1,130,353 |
| 6.375% 2/4/21 | | 150,000 | 150,563 |
| 6.5% 6/2/41 | | 2,887,000 | 2,206,300 |
| 6.75% 9/21/47 | | 8,407,000 | 6,454,474 |
| 7.69% 1/23/50 (b) | | 39,423,000 | 32,888,638 |
| TV Azteca SA de CV 8.25% 8/9/24 (Reg. S) | | 13,110,000 | 5,960,953 |
|
| TOTAL MEXICO | | | 101,738,592 |
|
| Mongolia - 0.0% | | | |
| Development Bank of Mongolia 7.25% 10/23/23 (b) | | 720,000 | 692,100 |
| Netherlands - 2.0% | | | |
| Cimpor Financial Operations BV 5.75% 7/17/24 (b) | | 4,377,000 | 2,566,016 |
| IHS Netherlands Holdco BV 7.125% 3/18/25 (b) | | 3,545,000 | 3,573,803 |
| Metinvest BV 7.75% 4/23/23 (b) | | 8,178,000 | 8,085,998 |
| Nostrum Oil & Gas Finance BV 8% 7/25/22 (b) | | 15,078,000 | 3,995,670 |
| Petrobras Global Finance BV: | | | |
| 6.25% 3/17/24 | | 2,725,000 | 2,885,945 |
| 8.75% 5/23/26 | | 805,000 | 949,900 |
| VTR Finance BV: | | | |
| 6.375% 7/15/28 (b) | | 1,200,000 | 1,233,000 |
| 6.875% 1/15/24 (b) | | 4,426,000 | 4,520,274 |
|
| TOTAL NETHERLANDS | | | 27,810,606 |
|
| Nigeria - 0.1% | | | |
| Fidelity Bank PLC 10.5% 10/16/22 (b) | | 955,000 | 969,325 |
| Peru - 0.2% | | | |
| Telefonica del Peru SA 7.375% 4/10/27 (b) | PEN | 10,090,000 | 2,847,214 |
| Saudi Arabia - 2.4% | | | |
| Saudi Arabian Oil Co.: | | | |
| 3.5% 4/16/29 (b) | | 12,054,000 | 13,010,786 |
| 4.25% 4/16/39 (b) | | 6,685,000 | 7,470,488 |
| 4.375% 4/16/49 (b) | | 11,201,000 | 12,625,627 |
|
| TOTAL SAUDI ARABIA | | | 33,106,901 |
|
| Singapore - 0.4% | | | |
| Indika Energy Capital II Pte. Ltd. 6.875% 4/10/22 (b) | | 5,150,000 | 5,001,938 |
| South Africa - 2.7% | | | |
| Eskom Holdings SOC Ltd.: | | | |
| 5.75% 1/26/21 (b) | | 34,035,000 | 32,418,338 |
| 6.75% 8/6/23 (b) | | 4,542,000 | 4,292,190 |
|
| TOTAL SOUTH AFRICA | | | 36,710,528 |
|
| Tunisia - 0.3% | | | |
| Banque Centrale de Tunisie 5.75% 1/30/25 (b) | | 4,422,000 | 4,097,259 |
| Turkey - 1.2% | | | |
| Akbank TAS: | | | |
| 5.125% 3/31/25 (b) | | 1,450,000 | 1,362,547 |
| 7.2% 3/16/27 (b)(c) | | 1,450,000 | 1,390,913 |
| Petkim Petrokimya Holding A/S 5.875% 1/26/23 (b) | | 4,773,000 | 4,725,270 |
| T.C. Ziraat Bankasi A/S 5.125% 5/3/22 (b) | | 3,837,000 | 3,756,663 |
| Turkiye Garanti Bankasi A/S 6.125% 5/24/27 (b)(c) | | 1,385,000 | 1,293,244 |
| Turkiye Sinai Kalkinma Bankasi A/S 6% 1/23/25 (b) | | 1,465,000 | 1,392,666 |
| Turkiye Vakiflar Bankasi TAO 5.75% 1/30/23 (b) | | 2,075,000 | 2,017,289 |
|
| TOTAL TURKEY | | | 15,938,592 |
|
| Ukraine - 0.0% | | | |
| VFU Funding PLC (VF Ukraine) 6.2% 2/11/25 (b) | | 270,000 | 267,044 |
| United Arab Emirates - 0.2% | | | |
| ADES International Holding Ltd. 8.625% 4/24/24 (b) | | 3,015,000 | 2,773,800 |
| United Kingdom - 2.7% | | | |
| Biz Finance PLC: | | | |
| 9.625% 4/27/22 (b) | | 3,125,667 | 3,193,064 |
| 9.75% 1/22/25 (b) | | 305,000 | 312,774 |
| DTEK Finance PLC 10.75% 12/31/24 pay-in-kind (c) | | 7,889,000 | 4,652,045 |
| NAK Naftogaz Ukraine: | | | |
| 7.375% 7/19/22 (Reg. S) | | 4,557,000 | 4,532,791 |
| 7.625% 11/8/26 (b) | | 1,235,000 | 1,200,266 |
| Oschadbank Via SSB #1 PLC 9.375% 3/10/23 (b) | | 1,210,800 | 1,239,935 |
| Tullow Oil PLC 6.25% 4/15/22 (b) | | 13,580,000 | 9,986,257 |
| Ukraine Railways via Shortline PLC 9.875% 9/15/21 (b) | | 1,658,700 | 1,666,993 |
| Vedanta Resources PLC: | | | |
| 6.375% 7/30/22 (b) | | 10,500,000 | 7,960,313 |
| 8.25% 6/7/21 (b) | | 2,295,000 | 2,001,699 |
|
| TOTAL UNITED KINGDOM | | | 36,746,137 |
|
| United States of America - 2.1% | | | |
| Azul Investments LLP 5.875% 10/26/24 (b) | | 4,775,000 | 2,077,125 |
| Citgo Holding, Inc. 9.25% 8/1/24 (b) | | 2,682,000 | 2,668,590 |
| Citgo Petroleum Corp. 6.25% 8/15/22 (b) | | 9,243,000 | 9,185,416 |
| Kosmos Energy Ltd. 7.125% 4/4/26 (b) | | 8,885,000 | 7,918,756 |
| Stillwater Mining Co. 6.125% 6/27/22 (b) | | 6,264,000 | 6,323,430 |
|
| TOTAL UNITED STATES OF AMERICA | | | 28,173,317 |
|
| Venezuela - 0.1% | | | |
| Petroleos de Venezuela SA: | | | |
| 5.375% 4/12/27 (d) | | 6,115,000 | 162,048 |
| 5.5% 4/12/37 (d) | | 3,475,000 | 104,250 |
| 6% 5/16/24 (b)(d) | | 8,980,000 | 251,440 |
| 6% 11/15/26 (b)(d) | | 15,840,000 | 459,360 |
| 9.75% 5/17/35 (b)(d) | | 12,585,000 | 377,550 |
| 12.75% 2/17/22 (b)(d) | | 3,065,000 | 91,950 |
|
| TOTAL VENEZUELA | | | 1,446,598 |
|
| TOTAL NONCONVERTIBLE BONDS | | | |
| (Cost $477,245,981) | | | 413,126,682 |
|
| Government Obligations - 58.6% | | | |
| Argentina - 4.3% | | | |
| Argentine Republic: | | | |
| 5.625% 1/26/22 (d) | | 9,935,000 | 4,098,188 |
| 6.875% 4/22/21 (d) | | 51,229,000 | 21,324,071 |
| 7.5% 4/22/26 (d) | | 34,229,000 | 13,755,779 |
| 8.28% 12/31/33 (d) | | 10,211,998 | 4,557,104 |
| City of Buenos Aires: | | | |
| 7.5% 6/1/27 (Reg. S) | | 740,000 | 569,800 |
| 8.95% 2/19/21 (b) | | 1,218,900 | 1,086,345 |
| Mendoza Province 8.375% 5/19/24 (b)(d) | | 465,000 | 219,096 |
| Province of Santa Fe 7% 3/23/23 (b) | | 7,270,000 | 4,734,588 |
| Provincia de Cordoba: | | | |
| 7.125% 6/10/21 (b) | | 9,670,000 | 5,931,941 |
| 7.45% 9/1/24 (b) | | 4,345,000 | 2,552,688 |
|
| TOTAL ARGENTINA | | | 58,829,600 |
|
| Armenia - 0.0% | | | |
| Republic of Armenia 7.15% 3/26/25 (b) | | 370,000 | 414,747 |
| Azerbaijan - 0.0% | | | |
| Azerbaijan Republic 4.75% 3/18/24 (b) | | 25,000 | 26,656 |
| Barbados - 0.4% | | | |
| Barbados Government: | | | |
| 6.5% 2/1/21 (b) | | 1,370,000 | 1,357,156 |
| 6.5% 10/1/29 (b) | | 5,135,000 | 4,626,314 |
|
| TOTAL BARBADOS | | | 5,983,470 |
|
| Belarus - 0.5% | | | |
| Belarus Republic 6.875% 2/28/23 (b) | | 6,525,000 | 6,531,117 |
| Bermuda - 0.2% | | | |
| Bermuda Government 4.75% 2/15/29 (b) | | 2,735,000 | 3,080,294 |
| Brazil - 2.8% | | | |
| Brazilian Federative Republic: | | | |
| 2.875% 6/6/25 | | 960,000 | 946,560 |
| 3.875% 6/12/30 | | 995,000 | 960,175 |
| 4.5% 5/30/29 | | 2,855,000 | 2,936,189 |
| 4.75% 1/14/50 | | 5,420,000 | 5,125,288 |
| 5.625% 1/7/41 | | 6,706,000 | 6,967,953 |
| 5.625% 2/21/47 | | 2,183,000 | 2,277,142 |
| 7.125% 1/20/37 | | 2,115,000 | 2,542,627 |
| 8.25% 1/20/34 | | 12,184,000 | 15,797,318 |
| 12.25% 3/6/30 | | 199,000 | 310,191 |
|
| TOTAL BRAZIL | | | 37,863,443 |
|
| Cameroon - 1.0% | | | |
| Cameroon Republic 9.5% 11/19/25 (b) | | 14,245,000 | 14,285,064 |
| Colombia - 0.1% | | | |
| Colombian Republic 3.125% 4/15/31 | | 1,450,000 | 1,439,850 |
| Dominican Republic - 2.5% | | | |
| Dominican Republic: | | | |
| 4.5% 1/30/30 (b) | | 295,000 | 266,883 |
| 5.5% 1/27/25 (b) | | 1,835,000 | 1,854,497 |
| 5.875% 1/30/60 (b) | | 3,525,000 | 3,028,195 |
| 5.95% 1/25/27 (b) | | 4,186,000 | 4,210,854 |
| 6% 7/19/28 (b) | | 2,584,000 | 2,597,728 |
| 6.4% 6/5/49 (b) | | 4,072,000 | 3,727,153 |
| 6.5% 2/15/48 (Reg. S) | | 475,000 | 437,148 |
| 6.85% 1/27/45 (b) | | 3,736,000 | 3,578,388 |
| 6.875% 1/29/26 (b) | | 6,621,000 | 6,941,705 |
| 7.45% 4/30/44 (b) | | 6,031,000 | 6,196,853 |
| 7.5% 5/6/21 (b) | | 776,667 | 801,666 |
|
| TOTAL DOMINICAN REPUBLIC | | | 33,641,070 |
|
| Egypt - 3.5% | | | |
| Arab Republic of Egypt: | | | |
| 5.75% 5/29/24 (b) | | 980,000 | 984,288 |
| 6.125% 1/31/22 (b) | | 4,308,000 | 4,411,661 |
| 7.0529% 1/15/32 (b) | | 830,000 | 788,500 |
| 7.5% 1/31/27 (b) | | 19,706,000 | 20,611,244 |
| 7.6003% 3/1/29 (b) | | 9,841,000 | 10,019,368 |
| 7.903% 2/21/48 (b) | | 2,635,000 | 2,436,552 |
| 8.5% 1/31/47 (b) | | 7,939,000 | 7,760,373 |
| 8.7002% 3/1/49 (b) | | 820,000 | 803,344 |
|
| TOTAL EGYPT | | | 47,815,330 |
|
| El Salvador - 0.8% | | | |
| El Salvador Republic: | | | |
| 7.1246% 1/20/50 (b) | | 2,327,000 | 1,896,505 |
| 7.625% 9/21/34 (b) | | 1,700,000 | 1,453,500 |
| 7.625% 2/1/41 (b) | | 1,260,000 | 1,065,094 |
| 7.75% 1/24/23 (b) | | 6,810,000 | 6,348,197 |
|
| TOTAL EL SALVADOR | | | 10,763,296 |
|
| Georgia - 0.1% | | | |
| Georgia Republic 6.875% 4/12/21 (b) | | 1,605,000 | 1,633,088 |
| Ghana - 0.5% | | | |
| Ghana Republic: | | | |
| 7.875% 3/26/27 (b) | | 2,800,000 | 2,769,375 |
| 8.125% 1/18/26 (b) | | 3,898,076 | 3,946,802 |
| 9.25% 9/15/22 (b) | | 265,000 | 265,000 |
|
| TOTAL GHANA | | | 6,981,177 |
|
| Guatemala - 0.2% | | | |
| Guatemalan Republic: | | | |
| 5.375% 4/24/32 (b) | | 950,000 | 1,047,672 |
| 5.75% 6/6/22 (b) | | 1,250,000 | 1,305,078 |
|
| TOTAL GUATEMALA | | | 2,352,750 |
|
| Honduras - 0.3% | | | |
| Republic of Honduras: | | | |
| 5.625% 6/24/30 (b) | | 610,000 | 619,913 |
| 8.75% 12/16/20 (b) | | 3,035,000 | 3,087,164 |
|
| TOTAL HONDURAS | | | 3,707,077 |
|
| Indonesia - 4.3% | | | |
| Indonesian Republic: | | | |
| 3.85% 10/15/30 | | 2,650,000 | 2,941,500 |
| 4.1% 4/24/28 | | 4,740,000 | 5,256,956 |
| 5.125% 1/15/45 (b) | | 4,853,000 | 5,921,139 |
| 5.25% 1/17/42 (b) | | 3,100,000 | 3,830,438 |
| 5.95% 1/8/46 (b) | | 2,100,000 | 2,857,009 |
| 6.625% 2/17/37 (b) | | 3,549,000 | 4,859,912 |
| 6.75% 1/15/44 (b) | | 5,105,000 | 7,441,553 |
| 7.75% 1/17/38 (b) | | 9,018,000 | 13,560,818 |
| 8.5% 10/12/35 (b) | | 8,199,000 | 12,787,878 |
|
| TOTAL INDONESIA | | | 59,457,203 |
|
| Iraq - 1.1% | | | |
| Republic of Iraq 5.8% 1/15/28 (Reg. S) | | 16,998,000 | 15,282,264 |
| Ivory Coast - 0.9% | | | |
| Ivory Coast 5.75% 12/31/32 | | 11,855,720 | 11,655,655 |
| Jamaica - 0.3% | | | |
| Jamaican Government: | | | |
| 6.75% 4/28/28 | | 980,000 | 1,103,725 |
| 7.875% 7/28/45 | | 1,685,000 | 2,057,806 |
| 8% 3/15/39 | | 285,000 | 351,530 |
|
| TOTAL JAMAICA | | | 3,513,061 |
|
| Jordan - 0.4% | | | |
| Jordanian Kingdom: | | | |
| 4.95% 7/7/25 (b) | | 1,630,000 | 1,630,000 |
| 5.85% 7/7/30 (b) | | 980,000 | 980,000 |
| 6.125% 1/29/26 (b) | | 3,195,000 | 3,361,739 |
|
| TOTAL JORDAN | | | 5,971,739 |
|
| Kazakhstan - 0.1% | | | |
| Kazakhstan Republic 6.5% 7/21/45 (b) | | 850,000 | 1,254,547 |
| Lebanon - 0.2% | | | |
| Lebanese Republic: | | | |
| 5.8% 12/31/49 (d) | | 5,745,000 | 1,089,755 |
| 6% 1/27/23 (d) | | 1,587,000 | 273,758 |
| 6.1% 10/4/22 (d) | | 685,000 | 119,875 |
| 6.375% 12/31/49 (d) | | 7,477,000 | 1,383,245 |
|
| TOTAL LEBANON | | | 2,866,633 |
|
| Mexico - 3.1% | | | |
| United Mexican States: | | | |
| 3.25% 4/16/30 | | 3,795,000 | 3,762,743 |
| 3.75% 1/11/28 | | 3,415,000 | 3,564,406 |
| 3.9% 4/27/25 | | 1,460,000 | 1,565,120 |
| 4.5% 4/22/29 | | 1,740,000 | 1,885,181 |
| 4.75% 4/27/32 | | 970,000 | 1,068,455 |
| 5.75% 10/12/2110 | | 12,790,000 | 14,204,894 |
| 6.05% 1/11/40 | | 13,217,000 | 16,128,870 |
| 6.5% 6/9/22 | MXN | 11,210,000 | 504,546 |
|
| TOTAL MEXICO | | | 42,684,215 |
|
| Morocco - 0.1% | | | |
| Moroccan Kingdom 5.5% 12/11/42 (b) | | 920,000 | 1,123,550 |
| Nigeria - 1.2% | | | |
| Republic of Nigeria: | | | |
| 6.5% 11/28/27 (b) | | 3,892,000 | 3,684,021 |
| 6.75% 1/28/21 (b) | | 410,000 | 415,509 |
| 7.625% 11/21/25 (b) | | 12,343,000 | 12,593,717 |
|
| TOTAL NIGERIA | | | 16,693,247 |
|
| Oman - 0.7% | | | |
| Sultanate of Oman: | | | |
| 3.875% 3/8/22 (b) | | 670,000 | 660,369 |
| 4.125% 1/17/23 (b) | | 650,000 | 637,406 |
| 4.75% 6/15/26 (b) | | 3,347,000 | 3,094,929 |
| 5.375% 3/8/27 (b) | | 3,016,000 | 2,804,880 |
| 6.75% 1/17/48 (b) | | 3,230,000 | 2,782,847 |
|
| TOTAL OMAN | | | 9,980,431 |
|
| Pakistan - 0.3% | | | |
| Islamic Republic of Pakistan 8.25% 4/15/24 (b) | | 1,180,000 | 1,229,413 |
| The Third Pakistan International Sukuk Co. Ltd.: | | | |
| 5.5% 10/13/21 (b) | | 1,830,000 | 1,791,113 |
| 5.625% 12/5/22 (b) | | 1,005,000 | 977,991 |
|
| TOTAL PAKISTAN | | | 3,998,517 |
|
| Papua New Guinea - 0.1% | | | |
| Papua New Guinea 8.375% 10/4/28 (b) | | 2,090,000 | 2,006,400 |
| Paraguay - 0.3% | | | |
| Republic of Paraguay 4.95% 4/28/31 (b) | | 3,865,000 | 4,290,150 |
| Qatar - 3.6% | | | |
| State of Qatar: | | | |
| 3.75% 4/16/30 (b) | | 13,745,000 | 15,682,186 |
| 4% 3/14/29 (b) | | 5,455,000 | 6,273,250 |
| 4.4% 4/16/50 (b) | | 1,465,000 | 1,814,769 |
| 4.5% 4/23/28 (b) | | 2,565,000 | 3,023,494 |
| 4.817% 3/14/49 (b) | | 11,539,000 | 15,195,421 |
| 5.103% 4/23/48 (b) | | 4,905,000 | 6,669,267 |
|
| TOTAL QATAR | | | 48,658,387 |
|
| Russia - 4.8% | | | |
| Ministry of Finance of the Russian Federation: | | | |
| 4.375% 3/21/29(Reg. S) | | 6,600,000 | 7,491,000 |
| 5.1% 3/28/35 (b) | | 13,200,000 | 16,314,375 |
| 5.1% 3/28/35(Reg. S) | | 4,600,000 | 5,685,313 |
| 5.25% 6/23/47 (b) | | 9,800,000 | 12,945,800 |
| 5.25% 6/23/47(Reg. S) | | 4,000,000 | 5,284,000 |
| 5.625% 4/4/42 (b) | | 4,000,000 | 5,423,750 |
| 5.875% 9/16/43 (b) | | 1,850,000 | 2,602,719 |
| 5.875% 9/16/43 (Reg. S) | | 200,000 | 281,375 |
| 7.25% 5/10/34 | RUB | 27,920,000 | 435,468 |
| 7.6% 7/20/22 | RUB | 345,955,000 | 5,155,042 |
| 8.15% 2/3/27 | RUB | 225,090,000 | 3,644,106 |
|
| TOTAL RUSSIA | | | 65,262,948 |
|
| Rwanda - 0.4% | | | |
| Rwanda Republic 6.625% 5/2/23 (b) | | 5,504,000 | 5,433,480 |
| Saudi Arabia - 0.8% | | | |
| Kingdom of Saudi Arabia: | | | |
| 3.625% 3/4/28 (b) | | 2,760,000 | 3,034,275 |
| 4.5% 4/17/30 (b) | | 2,270,000 | 2,676,330 |
| 4.5% 10/26/46 (b) | | 906,000 | 1,040,994 |
| 4.625% 10/4/47 (b) | | 3,580,000 | 4,170,700 |
|
| TOTAL SAUDI ARABIA | | | 10,922,299 |
|
| Senegal - 0.1% | | | |
| Republic of Senegal 8.75% 5/13/21 (b) | | 1,095,000 | 1,132,983 |
| Sri Lanka - 0.5% | | | |
| Democratic Socialist Republic of Sri Lanka 6.25% 10/4/20 (b) | | 7,373,000 | 6,976,701 |
| Trinidad & Tobago - 0.1% | | | |
| Republic of Trinidad & Tobago 4.5% 6/26/30 (b) | | 1,970,000 | 1,942,913 |
| Turkey - 6.0% | | | |
| Turkish Republic: | | | |
| 3.25% 3/23/23 | | 19,475,000 | 18,409,961 |
| 4.25% 3/13/25 | | 6,975,000 | 6,499,828 |
| 5.125% 3/25/22 | | 8,099,000 | 8,106,593 |
| 5.25% 3/13/30 | | 2,400,000 | 2,148,750 |
| 5.6% 11/14/24 | | 1,400,000 | 1,378,563 |
| 5.75% 5/11/47 | | 11,725,000 | 9,599,844 |
| 6% 1/14/41 | | 2,392,000 | 2,065,343 |
| 6.25% 9/26/22 | | 24,884,000 | 25,195,050 |
| 6.35% 8/10/24 | | 1,615,000 | 1,633,673 |
| 6.75% 5/30/40 | | 3,312,000 | 3,123,630 |
| 7.25% 12/23/23 | | 2,348,000 | 2,438,251 |
| 7.375% 2/5/25 | | 1,241,000 | 1,306,928 |
|
| TOTAL TURKEY | | | 81,906,414 |
|
| Ukraine - 5.5% | | | |
| Ukraine Government: | | | |
| 7.375% 9/25/32 (b) | | 2,130,000 | 2,139,319 |
| 7.75% 9/1/20 (b) | | 17,025,000 | 17,110,125 |
| 7.75% 9/1/21 (b) | | 34,213,000 | 35,359,136 |
| 7.75% 9/1/22 (b) | | 9,514,000 | 9,918,345 |
| 7.75% 9/1/23 (b) | | 740,000 | 775,150 |
| 7.75% 9/1/24 (b) | | 3,644,000 | 3,798,870 |
| 7.75% 9/1/26 (b) | | 2,745,000 | 2,861,663 |
| 7.75% 9/1/27 (b) | | 1,744,000 | 1,814,305 |
| 9.75% 11/1/28 (b) | | 1,210,000 | 1,382,425 |
|
| TOTAL UKRAINE | | | 75,159,338 |
|
| United Arab Emirates - 0.3% | | | |
| Emirate of Abu Dhabi: | | | |
| 3.125% 9/30/49 (b) | | 2,802,000 | 2,917,583 |
| 3.875% 4/16/50 (b) | | 705,000 | 831,019 |
|
| TOTAL UNITED ARAB EMIRATES | | | 3,748,602 |
|
| United States of America - 5.0% | | | |
| U.S. Treasury Notes: | | | |
| 0.375% 4/30/25 | | 8,466,000 | 8,504,362 |
| 2% 11/15/26 | | 54,547,000 | 59,897,273 |
|
| TOTAL UNITED STATES OF AMERICA | | | 68,401,635 |
|
| Uzbekistan - 0.1% | | | |
| Republic of Uzbekistan 4.75% 2/20/24 (b) | | 885,000 | 930,080 |
| Venezuela - 0.2% | | | |
| Venezuelan Republic: | | | |
| 9.25% 9/15/27 (d) | | 27,915,000 | 1,674,900 |
| 11.95% 8/5/31 (Reg. S) (d) | | 17,015,000 | 1,020,900 |
| 12.75% 8/23/22 (d) | | 3,625,000 | 217,500 |
|
| TOTAL VENEZUELA | | | 2,913,300 |
|
| Vietnam - 0.9% | | | |
| Vietnamese Socialist Republic: | | | |
| 6 month U.S. LIBOR + 0.810% 2.625% 3/13/28 (c)(e) | | 425,000 | 381,507 |
| 5.5% 3/12/28 | | 11,977,500 | 11,895,155 |
|
| TOTAL VIETNAM | | | 12,276,662 |
|
| TOTAL GOVERNMENT OBLIGATIONS | | | |
| (Cost $858,731,153) | | | 801,791,383 |
|
| Preferred Securities - 1.9% | | | |
| Cayman Islands - 1.2% | | | |
| Banco Do Brasil SA: | | | |
| 6.25% (b)(c)(f) | | 1,650,000 | 1,468,746 |
| 8.5% (b)(c)(f) | | 1,225,000 | 1,256,202 |
| Banco Mercantil del Norte SA 7.625% (b)(c)(f) | | 1,285,000 | 1,248,294 |
| Cosan Overseas Ltd. 8.25% (f) | | 11,040,000 | 11,198,325 |
| Odebrecht Finance Ltd. 7.5% (b)(d)(f) | | 11,015,000 | 623,036 |
|
| TOTAL CAYMAN ISLANDS | | | 15,794,603 |
|
| Ireland - 0.7% | | | |
| Alfa Bond Issuance PLC 8% (Reg. S) (c)(f) | | 4,735,000 | 4,831,680 |
| Tinkoff Credit Systems 9.25% (Reg. S) (c)(f) | | 4,530,000 | 4,606,259 |
|
| TOTAL IRELAND | | | 9,437,939 |
|
| TOTAL PREFERRED SECURITIES | | | |
| (Cost $31,014,793) | | | 25,232,542 |
| | | Shares | Value |
|
| Money Market Funds - 8.2% | | | |
| Fidelity Cash Central Fund 0.12% (g) | | | |
| (Cost $111,635,723) | | 111,617,964 | 111,640,287 |
| TOTAL INVESTMENT IN SECURITIES - 98.9% | | | |
| (Cost $1,478,627,650) | | | 1,351,790,894 |
| NET OTHER ASSETS (LIABILITIES) - 1.1% | | | 15,533,583 |
| NET ASSETS - 100% | | | $1,367,324,477 |
Currency Abbreviations
MXN – Mexican peso
PEN – Peruvian new sol
RUB – Russian ruble
Categorizations in the Schedule of Investments are based on country or territory of incorporation.
Legend
(a) Amount is stated in United States dollars unless otherwise noted.
(b) Security exempt from registration under Rule 144A of the Securities Act of 1933. These securities may be resold in transactions exempt from registration, normally to qualified institutional buyers. At the end of the period, the value of these securities amounted to $756,213,493 or 55.3% of net assets.
(c) Coupon rates for floating and adjustable rate securities reflect the rates in effect at period end.
(d) Non-income producing - Security is in default.
(e) Coupon is indexed to a floating interest rate which may be multiplied by a specified factor and/or subject to caps or floors.
(f) Security is perpetual in nature with no stated maturity date.
(g) Affiliated fund that is generally available only to investment companies and other accounts managed by Fidelity Investments. The rate quoted is the annualized seven-day yield of the fund at period end. A complete unaudited listing of the fund's holdings as of its most recent quarter end is available upon request. In addition, each Fidelity Central Fund's financial statements are available on the SEC's website or upon request.
Affiliated Central Funds
Information regarding fiscal year to date income earned by the Fund from investments in Fidelity Central Funds is as follows:
| Fund | Income earned |
| Fidelity Cash Central Fund | $432,036 |
| Total | $432,036 |
Amounts in the income column in the above table include any capital gain distributions from underlying funds, which are presented in the corresponding line-item in the Statement of Operations, if applicable.
Investment Valuation
The following is a summary of the inputs used, as of June 30, 2020, involving the Fund's assets and liabilities carried at fair value. The inputs or methodology used for valuing securities may not be an indication of the risk associated with investing in those securities. For more information on valuation inputs, and their aggregation into the levels used below, please refer to the Investment Valuation section in the accompanying Notes to Financial Statements.
| | Valuation Inputs at Reporting Date: |
| Description | Total | Level 1 | Level 2 | Level 3 |
| Investments in Securities: | | | | |
| Corporate Bonds | $413,126,682 | $-- | $413,126,682 | $-- |
| Government Obligations | 801,791,383 | -- | 801,791,383 | -- |
| Preferred Securities | 25,232,542 | -- | 25,232,542 | -- |
| Money Market Funds | 111,640,287 | 111,640,287 | -- | -- |
| Total Investments in Securities: | $1,351,790,894 | $111,640,287 | $1,240,150,607 | $-- |
Other Information
The composition of credit quality ratings as a percentage of Total Net Assets is as follows (Unaudited):
| U.S. Government and U.S. Government Agency Obligations | 5.0% |
| AAA,AA,A | 7.9% |
| BBB | 9.2% |
| BB | 19.0% |
| B | 28.0% |
| CCC,CC,C | 12.2% |
| D | 0.1% |
| Not Rated | 9.3% |
| Short-Term Investments and Net Other Assets | 9.3% |
| | 100% |
We have used ratings from Moody's Investors Service, Inc. Where Moody's® ratings are not available, we have used S&P® ratings. All ratings are as of the date indicated and do not reflect subsequent changes.
See accompanying notes which are an integral part of the financial statements.
Financial Statements
Statement of Assets and Liabilities
| | | June 30, 2020 (Unaudited) |
| Assets | | |
Investment in securities, at value — See accompanying schedule:
Unaffiliated issuers (cost $1,366,991,927) | $1,240,150,607 | |
| Fidelity Central Funds (cost $111,635,723) | 111,640,287 | |
| Total Investment in Securities (cost $1,478,627,650) | | $1,351,790,894 |
| Foreign currency held at value (cost $938) | | 937 |
| Receivable for investments sold | | 3,952,332 |
| Receivable for fund shares sold | | 216,884 |
| Dividends receivable | | 53,365 |
| Interest receivable | | 26,840,065 |
| Distributions receivable from Fidelity Central Funds | | 11,400 |
| Other receivables | | 100 |
| Total assets | | 1,382,865,977 |
| Liabilities | | |
| Payable to custodian bank | $156,440 | |
| Payable for investments purchased | 14,142,530 | |
| Payable for fund shares redeemed | 1,226,311 | |
| Other payables and accrued expenses | 16,219 | |
| Total liabilities | | 15,541,500 |
| Net Assets | | $1,367,324,477 |
| Net Assets consist of: | | |
| Paid in capital | | $1,531,628,338 |
| Total accumulated earnings (loss) | | (164,303,861) |
| Net Assets | | $1,367,324,477 |
| Net Asset Value, offering price and redemption price per share ($1,367,324,477 ÷ 152,479,783 shares) | | $8.97 |
See accompanying notes which are an integral part of the financial statements.
Statement of Operations
| | | Six months ended June 30, 2020 (Unaudited) |
| Investment Income | | |
| Dividends | | $1,034,591 |
| Interest | | 42,371,208 |
| Income from Fidelity Central Funds | | 432,036 |
| Income before foreign taxes withheld | | 43,837,835 |
| Less foreign taxes withheld | | 6,671 |
| Total income | | 43,844,506 |
| Expenses | | |
| Custodian fees and expenses | $15,755 | |
| Independent trustees' fees and expenses | 4,368 | |
| Legal | 2,431 | |
| Miscellaneous | 2,546 | |
| Total expenses before reductions | 25,100 | |
| Expense reductions | (6,567) | |
| Total expenses after reductions | | 18,533 |
| Net investment income (loss) | | 43,825,973 |
| Realized and Unrealized Gain (Loss) | | |
| Net realized gain (loss) on: | | |
| Investment securities: | | |
| Unaffiliated issuers | (26,805,514) | |
| Fidelity Central Funds | 2,499 | |
| Foreign currency transactions | (105,576) | |
| Total net realized gain (loss) | | (26,908,591) |
| Change in net unrealized appreciation (depreciation) on: | | |
| Investment securities: | | |
| Unaffiliated issuers | (76,370,561) | |
| Fidelity Central Funds | (1) | |
| Assets and liabilities in foreign currencies | (8,098) | |
| Total change in net unrealized appreciation (depreciation) | | (76,378,660) |
| Net gain (loss) | | (103,287,251) |
| Net increase (decrease) in net assets resulting from operations | | $(59,461,278) |
See accompanying notes which are an integral part of the financial statements.
Statement of Changes in Net Assets
| | Six months ended June 30, 2020 (Unaudited) | Year ended December 31, 2019 |
| Increase (Decrease) in Net Assets | | |
| Operations | | |
| Net investment income (loss) | $43,825,973 | $85,316,357 |
| Net realized gain (loss) | (26,908,591) | 1,500,190 |
| Change in net unrealized appreciation (depreciation) | (76,378,660) | 46,630,499 |
| Net increase (decrease) in net assets resulting from operations | (59,461,278) | 133,447,046 |
| Distributions to shareholders | (38,155,625) | (79,637,674) |
| Share transactions | | |
| Proceeds from sales of shares | 59,220,415 | 270,395,401 |
| Reinvestment of distributions | 38,155,625 | 79,500,514 |
| Cost of shares redeemed | (96,375,930) | (193,767,304) |
| Net increase (decrease) in net assets resulting from share transactions | 1,000,110 | 156,128,611 |
| Total increase (decrease) in net assets | (96,616,793) | 209,937,983 |
| Net Assets | | |
| Beginning of period | 1,463,941,270 | 1,254,003,287 |
| End of period | $1,367,324,477 | $1,463,941,270 |
| Other Information | | |
| Shares | | |
| Sold | 6,919,251 | 28,479,446 |
| Issued in reinvestment of distributions | 4,322,827 | 8,334,714 |
| Redeemed | (11,307,708) | (20,308,378) |
| Net increase (decrease) | (65,630) | 16,505,782 |
See accompanying notes which are an integral part of the financial statements.
Financial Highlights
Fidelity Series Emerging Markets Debt Fund
| | Six months ended (Unaudited) June 30, | Years endedDecember 31, | | | | |
| | 2020 | 2019 | 2018 | 2017 | 2016 | 2015 |
| Selected Per–Share Data | | | | | | |
| Net asset value, beginning of period | $9.60 | $9.22 | $10.25 | $9.96 | $9.16 | $9.61 |
| Income from Investment Operations | | | | | | |
| Net investment income (loss)A | .287 | .604 | .576 | .672 | .693 | .698 |
| Net realized and unrealized gain (loss) | (.667) | .341 | (1.045) | .369 | .719 | (.546) |
| Total from investment operations | (.380) | .945 | (.469) | 1.041 | 1.412 | .152 |
| Distributions from net investment income | (.250) | (.565) | (.561) | (.709) | (.612) | (.602) |
| Distributions from net realized gain | – | – | – | (.042) | – | – |
| Total distributions | (.250) | (.565) | (.561) | (.751) | (.612) | (.602) |
| Net asset value, end of period | $8.97 | $9.60 | $9.22 | $10.25 | $9.96 | $9.16 |
| Total ReturnB,C | (3.88)% | 10.46% | (4.66)% | 10.66% | 15.70% | 1.51% |
| Ratios to Average Net AssetsD,E | | | | | | |
| Expenses before reductions | - %F,G | - %G | - %G | .32% | .82% | .82% |
| Expenses net of fee waivers, if any | - %F,G | - %G | - %G | .32% | .81% | .82% |
| Expenses net of all reductions | - %F,G | - %G | - %G | .32% | .81% | .82% |
| Net investment income (loss) | 6.49%F | 6.35% | 5.95% | 6.53% | 7.07% | 7.29% |
| Supplemental Data | | | | | | |
| Net assets, end of period (000 omitted) | $1,367,324 | $1,463,941 | $1,254,003 | $1,366,805 | $529,354 | $481,040 |
| Portfolio turnover rateH | 64%F | 61%I | 43% | 57% | 47% | 41% |
A Calculated based on average shares outstanding during the period.
B Total returns for periods of less than one year are not annualized.
C Total returns would have been lower if certain expenses had not been reduced during the applicable periods shown.
D Fees and expenses of any underlying Fidelity Central Funds are not included in the Fund's expense ratio. The Fund indirectly bears its proportionate share of the expenses of any underlying Fidelity Central Funds.
E Expense ratios reflect operating expenses of the Fund. Expenses before reductions do not reflect amounts reimbursed by the investment adviser or reductions from brokerage service arrangements or reductions from other expense offset arrangements and do not represent the amount paid by the Fund during periods when reimbursements or reductions occur. Expenses net of fee waivers reflect expenses after reimbursement by the investment adviser but prior to reductions from brokerage service arrangements or other expense offset arrangements. Expenses net of all reductions represent the net expenses paid by the Fund.
F Annualized
G Amount represents less than .005%.
H Amount does not include the portfolio activity of any underlying Fidelity Central Funds.
I Portfolio turnover rate excludes securities received or delivered in-kind.
See accompanying notes which are an integral part of the financial statements.
Notes to Financial Statements (Unaudited)
For the period ended June 30, 2020
1. Organization.
Fidelity Series Emerging Markets Debt Fund (the Fund) is a non-diversified fund of Fidelity Hastings Street Trust (the Trust) and is authorized to issue an unlimited number of shares. Shares are offered only to certain other Fidelity funds and Fidelity managed 529 plans. The Trust is registered under the Investment Company Act of 1940, as amended (the 1940 Act), as an open-end management investment company organized as a Massachusetts business trust.
Effective January 1, 2020:
Investment advisers Fidelity Investments Money Management, Inc., FMR Co., Inc., and Fidelity SelectCo, LLC, merged with and into Fidelity Management & Research Company. In connection with the merger transactions, the resulting, merged investment adviser was then redomiciled from Massachusetts to Delaware, changed its corporate structure from a corporation to a limited liability company, and changed its name to "Fidelity Management & Research Company LLC".
2. Investments in Fidelity Central Funds.
The Fund invests in Fidelity Central Funds, which are open-end investment companies generally available only to other investment companies and accounts managed by the investment adviser and its affiliates. The Fund's Schedule of Investments lists each of the Fidelity Central Funds held as of period end, if any, as an investment of the Fund, but does not include the underlying holdings of each Fidelity Central Fund. As an Investing Fund, the Fund indirectly bears its proportionate share of the expenses of the underlying Fidelity Central Funds.
The Money Market Central Funds seek preservation of capital and current income and are managed by the investment adviser. Annualized expenses of the Money Market Central Funds as of their most recent shareholder report date ranged from less than .005% to .01%.
A complete unaudited list of holdings for each Fidelity Central Fund is available upon request or at the Securities and Exchange Commission (the SEC) website at www.sec.gov. In addition, the financial statements of the Fidelity Central Funds are available on the SEC website or upon request.
3. Significant Accounting Policies.
The Fund is an investment company and applies the accounting and reporting guidance of the Financial Accounting Standards Board (FASB) Accounting Standards Codification Topic 946 Financial Services – Investments Companies. The financial statements have been prepared in conformity with accounting principles generally accepted in the United States of America (GAAP), which require management to make certain estimates and assumptions at the date of the financial statements. Actual results could differ from those estimates. Subsequent events, if any, through the date that the financial statements were issued have been evaluated in the preparation of the financial statements. The following summarizes the significant accounting policies of the Fund:
Investment Valuation. Investments are valued as of 4:00 p.m. Eastern time on the last calendar day of the period. The Board of Trustees (the Board) has delegated the day to day responsibility for the valuation of the Fund's investments to the Fair Value Committee (the Committee) established by the Fund's investment adviser. In accordance with valuation policies and procedures approved by the Board, the Fund attempts to obtain prices from one or more third party pricing vendors or brokers to value its investments. When current market prices, quotations or currency exchange rates are not readily available or reliable, investments will be fair valued in good faith by the Committee, in accordance with procedures adopted by the Board. Factors used in determining fair value vary by investment type and may include market or investment specific events, changes in interest rates and credit quality. The frequency with which these procedures are used cannot be predicted and they may be utilized to a significant extent. The Committee oversees the Fund's valuation policies and procedures and reports to the Board on the Committee's activities and fair value determinations. The Board monitors the appropriateness of the procedures used in valuing the Fund's investments and ratifies the fair value determinations of the Committee.
The Fund categorizes the inputs to valuation techniques used to value its investments into a disclosure hierarchy consisting of three levels as shown below:
- Level 1 – quoted prices in active markets for identical investments
- Level 2 – other significant observable inputs (including quoted prices for similar investments, interest rates, prepayment speeds, etc.)
- Level 3 – unobservable inputs (including the Fund's own assumptions based on the best information available)
Valuation techniques used to value the Fund's investments by major category are as follows:
Debt securities, including restricted securities, are valued based on evaluated prices received from third party pricing vendors or from brokers who make markets in such securities. Corporate bonds, foreign government and government agency obligations and preferred securities are valued by pricing vendors who utilize matrix pricing which considers yield or price of bonds of comparable quality, coupon, maturity and type or by broker-supplied prices. When independent prices are unavailable or unreliable, debt securities may be valued utilizing pricing methodologies which consider similar factors that would be used by third party pricing vendors. For foreign debt securities, when significant market or security specific events arise, valuations may be determined in good faith in accordance with procedures adopted by the Board. Debt securities are generally categorized as Level 2 in the hierarchy but may be Level 3 depending on the circumstances. The Fund invests a significant portion of its assets in below investment grade securities. The value of these securities can be more volatile due to changes in the credit quality of the issuer and is sensitive to changes in economic, market and regulatory conditions.
Investments in open-end mutual funds, including the Fidelity Central Funds, are valued at their closing net asset value (NAV) each business day and are categorized as Level 1 in the hierarchy.
Changes in valuation techniques may result in transfers in or out of an assigned level within the disclosure hierarchy. The aggregate value of investments by input level as of June 30, 2020 is included at the end of the Fund's Schedule of Investments.
Foreign Currency. The Fund may use foreign currency contracts to facilitate transactions in foreign-denominated securities. Gains and losses from these transactions may arise from changes in the value of the foreign currency or if the counterparties do not perform under the contracts' terms.
Foreign-denominated assets, including investment securities, and liabilities are translated into U.S. dollars at the exchange rates at period end. Purchases and sales of investment securities, income and dividends received and expenses denominated in foreign currencies are translated into U.S. dollars at the exchange rate in effect on the transaction date.
The effects of exchange rate fluctuations on investments are included with the net realized and unrealized gain (loss) on investment securities. Other foreign currency transactions resulting in realized and unrealized gain (loss) are disclosed separately.
Investment Transactions and Income. For financial reporting purposes, the Fund's investment holdings and NAV include trades executed through the end of the last business day of the period. The NAV per share for processing shareholder transactions is calculated as of the close of business of the New York Stock Exchange (NYSE), normally 4:00 p.m. Eastern time and includes trades executed through the end of the prior business day. Gains and losses on securities sold are determined on the basis of identified cost and include proceeds received from litigation. Dividend income is recorded on the ex-dividend date. Income and capital gain distributions from Fidelity Central Funds, if any, are recorded on the ex-dividend date. Interest income is accrued as earned and includes coupon interest and amortization of premium and accretion of discount on debt securities as applicable. Paid in Kind (PIK) income is recorded at the fair market value of the securities received. Investment income is recorded net of foreign taxes withheld where recovery of such taxes is uncertain. Debt obligations may be placed on non-accrual status and related interest income may be reduced by ceasing current accruals and writing off interest receivables when the collection of all or a portion of interest has become doubtful based on consistently applied procedures. A debt obligation is removed from non-accrual status when the issuer resumes interest payments or when collectability of interest is reasonably assured.
Expenses. Expenses directly attributable to a fund are charged to that fund. Expenses attributable to more than one fund are allocated among the respective funds on the basis of relative net assets or other appropriate methods. Expense estimates are accrued in the period to which they relate and adjustments are made when actual amounts are known.
Income Tax Information and Distributions to Shareholders. Each year, the Fund intends to qualify as a regulated investment company under Subchapter M of the Internal Revenue Code, including distributing substantially all of its taxable income and realized gains. As a result, no provision for U.S. Federal income taxes is required. The Fund files a U.S. federal tax return, in addition to state and local tax returns as required. The Fund's federal income tax returns are subject to examination by the Internal Revenue Service (IRS) for a period of three fiscal years after they are filed. State and local tax returns may be subject to examination for an additional fiscal year depending on the jurisdiction. Foreign taxes are provided for based on the Fund's understanding of the tax rules and rates that exist in the foreign markets in which it invests.
Distributions are declared and recorded daily and paid monthly from net investment income. Distributions from realized gains, if any, are declared and recorded on the ex-dividend date. Income and capital gain distributions are determined in accordance with income tax regulations, which may differ from GAAP.
Capital accounts within the financial statements are adjusted for permanent book-tax differences. These adjustments have no impact on net assets or the results of operations. Capital accounts are not adjusted for temporary book-tax differences which will reverse in a subsequent period.
Book-tax differences are primarily due to foreign currency transactions, market discount, capital loss carryforwards and losses deferred due to wash sales and excise tax regulations.
As of period end, the cost and unrealized appreciation (depreciation) in securities, and derivatives if applicable, for federal income tax purposes were as follows:
| Gross unrealized appreciation | $57,175,714 |
| Gross unrealized depreciation | (173,259,166) |
| Net unrealized appreciation (depreciation) | $(116,083,452) |
| Tax cost | $1,467,874,346 |
Capital loss carryforwards are only available to offset future capital gains of the Fund to the extent provided by regulations and may be limited. The capital loss carryforward information presented below, including any applicable limitation, is estimated as of prior fiscal period end and is subject to adjustment.
| No expiration | |
| Short-term | $(1,241,566) |
| Long-term | (22,836,238) |
| Total capital loss carryforward | $(24,077,804) |
Restricted Securities (including Private Placements). The Fund may invest in securities that are subject to legal or contractual restrictions on resale. These securities generally may be resold in transactions exempt from registration or to the public if the securities are registered. Disposal of these securities may involve time-consuming negotiations and expense, and prompt sale at an acceptable price may be difficult. Information regarding restricted securities is included at the end of the Fund's Schedule of Investments.
4. Purchases and Sales of Investments.
Purchases and sales of securities, other than short-term securities and U.S. government securities, are noted in the table below.
| | Purchases ($) | Sales ($) |
| Fidelity Series Emerging Markets Debt Fund | 356,690,866 | 354,670,216 |
5. Fees and Other Transactions with Affiliates.
Management Fee. Fidelity Management & Research Company LLC (the investment adviser) and its affiliates provide the Fund with investment management related services for which the Fund does not pay a management fee. Under the management contract, the investment adviser or an affiliate pays all ordinary operating expenses of the Fund, except custody fees, fees and expenses of the independent Trustees, and certain miscellaneous expenses such as proxy and shareholder meeting expenses.
Interfund Trades. Funds may purchase from or sell securities to other Fidelity Funds under procedures adopted by the Board. The procedures have been designed to ensure these interfund trades are executed in accordance with Rule 17a-7 of the 1940 Act. Interfund trades are included within the respective purchases and sales amounts shown in the Purchases and Sales of Investments note.
Prior Fiscal Year Affiliated Exchanges In-Kind. During the prior period, the Fund received investments in exchange for shares of the Fund. The amount of in-kind exchanges is included in share transactions in the accompanying Statement of Changes in Net Assets. For additional information of the in-kind transactions, please refer to the Fund's prior annual shareholder report.
6. Committed Line of Credit.
Certain Funds participate with other funds managed by the investment adviser or an affiliate in a $4.25 billion credit facility (the "line of credit") to be utilized for temporary or emergency purposes to fund shareholder redemptions or for other short-term liquidity purposes. The participating funds have agreed to pay commitment fees on their pro-rata portion of the line of credit, which are reflected in Miscellaneous expenses on the Statement of Operations, and are as follows:
| | Amount |
| Fidelity Series Emerging Markets Debt Fund | $1,751 |
During the period, there were no borrowings on this line of credit.
7. Expense Reductions.
Through arrangements with the Fund's custodian, credits realized as a result of certain uninvested cash balances were used to reduce the Fund's expenses by $6,567.
8. Other.
The Fund's organizational documents provide former and current trustees and officers with a limited indemnification against liabilities arising in connection with the performance of their duties to the Fund. In the normal course of business, the Fund may also enter into contracts that provide general indemnifications. The Fund's maximum exposure under these arrangements is unknown as this would be dependent on future claims that may be made against the Fund. The risk of material loss from such claims is considered remote.
At the end of the period, mutual funds and accounts managed by the investment adviser or its affiliates were the owners of record of all of the outstanding shares of the Fund.
9. Credit Risk.
The Fund's relatively large investment in countries with limited or developing capital markets may involve greater risks than investments in more developed markets and the prices of such investments may be volatile. The yields of emerging market debt obligations reflect, among other things, perceived credit risk. The consequences of political, social or economic changes in these markets may have disruptive effects on the market prices of the Fund's investments and the income they generate, as well as the Fund's ability to repatriate such amounts.
10. Coronavirus (COVID-19) Pandemic.
An outbreak of COVID-19 first detected in China during December 2019 has since spread globally and was declared a pandemic by the World Health Organization during March 2020. Developments that disrupt global economies and financial markets, such as the COVID-19 pandemic, may magnify factors that affect the Fund's performance.
Shareholder Expense Example
As a shareholder of the Fund, you incur two types of costs: (1) transaction costs and (2) ongoing costs, including other Fund expenses. This Example is intended to help you understand your ongoing costs (in dollars) of investing in the Fund and to compare these costs with the ongoing costs of investing in other mutual funds.
The Example is based on an investment of $1,000 invested at the beginning of the period and held for the entire period (January 1, 2020 to June 30, 2020).
Actual Expenses
The first line of the accompanying table provides information about actual account values and actual expenses. You may use the information in this line, together with the amount you invested, to estimate the expenses that you paid over the period. Simply divide your account value by $1,000.00 (for example, an $8,600 account value divided by $1,000.00 = 8.6), then multiply the result by the number in the first line under the heading entitled "Expenses Paid During Period" to estimate the expenses you paid on your account during this period. In addition, the Fund, as a shareholder in the underlying Fidelity Central Funds, will indirectly bear its pro-rata share of the fees and expenses incurred by the underlying Fidelity Central Funds. These fees and expenses are not included in the Fund's annualized expense ratio used to calculate the expense estimate in the table below.
Hypothetical Example for Comparison Purposes
The second line of the accompanying table provides information about hypothetical account values and hypothetical expenses based on the Fund's actual expense ratio and an assumed rate of return of 5% per year before expenses, which is not the Fund's actual return. The hypothetical account values and expenses may not be used to estimate the actual ending account balance or expenses you paid for the period. You may use this information to compare the ongoing costs of investing in the Fund and other funds. To do so, compare this 5% hypothetical example with the 5% hypothetical examples that appear in the shareholder reports of the other funds. In addition, the Fund, as a shareholder in the underlying Fidelity Central Funds, will indirectly bear its pro-rata share of the fees and expenses incurred by the underlying Fidelity Central Funds. These fees and expenses are not included in the Fund's annualized expense ratio used to calculate the expense estimate in the table below.
Please note that the expenses shown in the table are meant to highlight your ongoing costs only and do not reflect any transaction costs. Therefore, the second line of the table is useful in comparing ongoing costs only, and will not help you determine the relative total costs of owning different funds.
| | Annualized Expense Ratio-A | Beginning
Account Value
January 1, 2020 | Ending
Account Value
June 30, 2020 | Expenses Paid
During Period-B
January 1, 2020
to June 30, 2020 |
| Actual | - %-C | $1,000.00 | $961.20 | $--D |
| Hypothetical-E | | $1,000.00 | $1,024.86 | $--D |
A Annualized expense ratio reflects expenses net of applicable fee waivers.
B Expenses are equal to the Fund's annualized expense ratio, multiplied by the average account value over the period, multiplied by 182/366 (to reflect the one-half year period).
C Amount represents less than .005%
D Amount represents less than $.005.
E 5% return per year before expenses
Board Approval of Investment Advisory Contracts and Management Fees
Fidelity Series Emerging Markets Debt Fund
Each year, the Board of Trustees, including the Independent Trustees (together, the Board), votes on the renewal of the management contract with Fidelity Management & Research Company LLC (FMR) and the sub-advisory agreements (together, the Advisory Contracts) for the fund. FMR and the sub-advisers are referred to herein as the Investment Advisers. The Board, assisted by the advice of fund counsel and Independent Trustees' counsel, requests and considers a broad range of information relevant to the renewal of the Advisory Contracts throughout the year.
Approval of Amended and Restated Advisory Contracts. At its November 2019 meeting, the Board unanimously determined to approve an amended and restated management contract and sub-advisory agreements (Amended and Restated Contracts) for a stub period of January 1, 2020 through January 31, 2020 in connection with a consolidation of certain of Fidelity's advisory businesses. The Board considered that, on or about January 1, 2020, FMR Co., Inc. (FMRC) expected to merge with and into FMR and, after the merger, FMR expected to redomicile as a Delaware limited liability company. The Board also approved the termination of the sub-advisory agreement with FMRC upon the completion of the merger. The Board noted that references to FMR in the Amended and Restated Contracts would be updated to reflect FMR's new form of organization and domicile. The Board also noted Fidelity's assurance that neither the planned consolidation nor the Amended and Restated Contracts will change the investment processes, the level or nature of services provided, the resources and personnel allocated, trading and compliance operations, or any fees paid by the fund.
The Board meets regularly and, at each of its meetings, covers an extensive agenda of topics and materials and considers factors that are relevant to its annual consideration of the renewal of the fund's Advisory Contracts, including the services and support provided to the fund and its shareholders. The Board has established various standing committees (Committees), each composed of and chaired by Independent Trustees with varying backgrounds, to which the Board has assigned specific subject matter responsibilities in order to enhance effective decision-making by the Board. The Board, acting directly and through its Committees, requests and receives information concerning the annual consideration of the renewal of the fund's Advisory Contracts. The Board also meets as needed to review matters specifically related to the Board's annual consideration of the renewal of the Advisory Contracts. Members of the Board may also meet with trustees of other Fidelity funds through joint ad hoc committees to discuss certain matters relevant to all of the Fidelity funds.
At its January 2020 meeting, the Board unanimously determined to renew the fund's Advisory Contracts. In considering whether to renew the Advisory Contracts for the fund, the Board considered all factors it believed relevant and reached a determination, with the assistance of fund counsel and Independent Trustees' counsel and through the exercise of its business judgment, that the renewal of the Advisory Contracts was in the best interests of the fund and its shareholders and the fact that no fee is payable under the management contract was fair and reasonable.
Nature, Extent, and Quality of Services Provided. The Board considered Fidelity's staffing as it relates to the fund, including the backgrounds of investment personnel of Fidelity, and also considered the fund's investment objective, strategies, and related investment philosophy. The Independent Trustees also had discussions with senior management of Fidelity's investment operations and investment groups. The Board considered the structure of the investment personnel compensation program and whether this structure provides appropriate incentives to act in the best interests of the fund.
Resources Dedicated to Investment Management and Support Services. The Board and the Fund Oversight and Research Committees reviewed the general qualifications and capabilities of Fidelity's investment staff, including its size, education, experience, and resources, as well as Fidelity's approach to recruiting, training, managing, and compensating investment personnel. The Board noted that Fidelity has continued to increase the resources devoted to non-U.S. offices, including expansion of Fidelity's global investment organization. The Board also noted that Fidelity's analysts have extensive resources, tools and capabilities that allow them to conduct sophisticated quantitative and fundamental analysis, as well as credit analysis of issuers, counterparties and guarantors. Further, the Board considered that Fidelity's investment professionals have sufficient access to global information and data so as to provide competitive investment results over time, and that those professionals also have access to sophisticated tools that permit them to assess portfolio construction and risk and performance attribution characteristics continuously, as well as to transmit new information and research conclusions rapidly around the world. Additionally, in its deliberations, the Board considered Fidelity's trading, risk management, compliance, and technology and operations capabilities and resources, which are integral parts of the investment management process.
Administrative Services. The Board considered (i) the nature, extent, quality, and cost of advisory and administrative services performed by the Investment Advisers and their affiliates under the Advisory Contracts and under separate agreements covering transfer agency, pricing and bookkeeping, and securities lending services for the fund; (ii) the nature and extent of the supervision of third party service providers, principally custodians, subcustodians, and pricing vendors; and (iii) the resources devoted to, and the record of compliance with, the fund's compliance policies and procedures. The Board also reviewed the allocation of fund brokerage, including allocations to brokers affiliated with the Investment Advisers, the use of brokerage commissions to pay fund expenses, and the use of "soft" commission dollars to pay for research services.
Investment Performance. The Board considered whether the fund has operated in accordance with its investment objective, as well as its record of compliance with its investment restrictions. The Board reviewed the fund's absolute investment performance, as well as the fund's relative investment performance, but did not consider performance to be a material factor in its decision to renew the fund's Advisory Contracts, as the fund is not publicly offered as a stand-alone investment product. In this regard, the Board noted that the fund is designed to offer an investment option for other investment companies managed by Fidelity and ultimately to enhance the performance of those investment companies.
Based on its review, the Board concluded that the nature, extent, and quality of services provided to the fund under the Advisory Contracts should continue to benefit the shareholders of the fund.
Competitiveness of Management Fee and Total Expense Ratio. The Board considered that the fund does not pay FMR a management fee for investment advisory services. The Board also noted that FMR undertakes to pay all operating expenses of the fund with certain exceptions.
In connection with the renewal of the Advisory Contracts, the Board also approved amendments to the management contract for the fund to clarify that the fund pays its non-operating expenses, including brokerage commissions and fees and expenses associated with the fund's securities lending program. The Board considered that the amendments would not change the services provided to the fund or the party responsible for making such payments under the current management contract.
The Board further considered that FMR has contractually agreed to reimburse the fund to the extent that total operating expenses, with certain exceptions, as a percentage of its average net assets, exceed 0.014% through April 30, 2022.
Based on its review, the Board considered that the fund does not pay a management fee and concluded that the total expense ratio of each class of the fund was reasonable in light of the services that the fund and its shareholders receive and the other factors considered.
Costs of the Services and Profitability. The Board considered the level of Fidelity's profits in respect of all the Fidelity funds.
PricewaterhouseCoopers LLP (PwC), auditor to Fidelity and certain Fidelity funds, has been engaged annually by the Board as part of the Board's assessment of Fidelity's profitability analysis. PwC's engagement includes the review and assessment of the methodologies used by Fidelity in determining the revenues and expenses attributable to Fidelity's mutual fund business, and completion of agreed-upon procedures in respect of the mathematical accuracy of the fund profitability information and its conformity to established allocation methodologies. After considering PwC's reports issued under the engagement and information provided by Fidelity, the Board concluded that while other allocation methods may also be reasonable, Fidelity's profitability methodologies are reasonable in all material respects.
The Board also reviewed Fidelity's non-fund businesses and potential indirect benefits such businesses may have received as a result of their association with Fidelity's mutual fund business (i.e., fall-out benefits) as well as cases where Fidelity's affiliates may benefit from the funds' business. The Board noted that changes to fall-out benefits year-over-year reflect business developments at Fidelity's various businesses. The Board considered that a joint ad hoc committee created by it and the boards of other Fidelity funds had recently been established, and met periodically, to evaluate potential fall-out benefits (PFOB Committee). The Board noted that the PFOB Committee, among other things: (i) discussed the legal framework surrounding potential fall-out benefits; (ii) reviewed the Board's responsibilities and approach to potential fall-out benefits; and (iii) reviewed practices employed by competitor funds regarding the review of potential fall-out benefits.
The Board concluded that the costs of the services provided by and the profits realized by Fidelity in connection with the operation of the fund were not relevant to the renewal of the Advisory Contracts because the fund pays no advisory fees and FMR bears all expenses of the fund with certain exceptions.
Economies of Scale. The Board concluded that because the fund pays no advisory fees and FMR bears all expenses of the fund with certain exceptions, the realization of economies of scale was not a material factor in the Board's decision to renew the fund's Advisory Contracts.
Additional Information Requested by the Board. In order to develop fully the factual basis for consideration of the Fidelity funds' advisory contracts, the Board requested and received additional information on certain topics, including: (i) fund flow and performance trends, in particular the underperformance of certain funds and strategies, and Fidelity's long-term strategies for certain funds; (ii) consideration of performance fees for additional funds; (iii) changes in Fidelity's non-fund businesses and the impact of such changes on the funds; (iv) metrics for evaluating index fund and ETF performance and information about ETF trading characteristics; (v) the methodology with respect to evaluating competitive fund data and peer group classifications and fee comparisons; (vi) the expense structures for different funds and classes; (vii) information regarding other accounts managed by Fidelity, including collective investment trusts and separately managed accounts; and (viii) Fidelity's philosophies and strategies for evaluating funds and classes with lower or declining asset levels.
Based on its evaluation of all of the conclusions noted above, and after considering all factors it believed relevant, the Board concluded that the advisory fee arrangements are fair and reasonable, and that the fund's Amended and Restated Contracts should be approved and the fund's Advisory Contracts should be renewed.
Liquidity Risk Management Program
The Securities and Exchange Commission adopted Rule 22e-4 under the Investment Company Act of 1940 (the Liquidity Rule) to promote effective liquidity risk management throughout the open-end investment company industry, thereby reducing the risk that funds will be unable to meet their redemption obligations and mitigating dilution of the interests of fund shareholders.
The Fund has adopted and implemented a liquidity risk management program pursuant to the Liquidity Rule (the Program) effective December 1, 2018. The Program is reasonably designed to assess and manage the Fund’s liquidity risk and to comply with the requirements of the Liquidity Rule. The Fund’s Board of Trustees (the Board) has designated the Fund’s investment adviser as administrator of the Program. The Fidelity advisers have established a Liquidity Risk Management Committee (the LRM Committee) to manage the Program for each of the Fidelity Funds. The LRM Committee monitors the adequacy and effectiveness of implementation of the Program and on a periodic basis assesses each Fund’s liquidity risk based on a variety of factors including (1) the Fund’s investment strategy, (2) portfolio liquidity and cash flow projections during normal and reasonably foreseeable stressed conditions, (3) shareholder redemptions, (4) borrowings and other funding sources and (5) in the case of exchange-traded funds, certain additional factors including the effect of the Fund’s prices and spreads, market participants, and basket compositions on the overall liquidity of the Fund’s portfolio, as applicable.
In accordance with the Program, each of the Fund’s portfolio investments is classified into one of four liquidity categories described below based on a determination of a reasonable expectation for how long it would take to convert the investment to cash (or sell or dispose of the investment) without significantly changing its market value.
- Highly liquid investments – cash or convertible to cash within three business days or less
- Moderately liquid investments – convertible to cash in three to seven calendar days
- Less liquid investments – can be sold or disposed of, but not settled, within seven calendar days
- Illiquid investments – cannot be sold or disposed of within seven calendar days
Liquidity classification determinations take into account a variety of factors including various market, trading and investment-specific considerations, as well as market depth, and generally utilize analysis from a third-party liquidity metrics service.
The Liquidity Rule places a 15% limit on a fund’s illiquid investments and requires funds that do not primarily hold assets that are highly liquid investments to determine and maintain a minimum percentage of the fund’s net assets to be invested in highly liquid investments (highly liquid investment minimum or HLIM). The Program includes provisions reasonably designed to comply with the 15% limit on illiquid investments and for determining, periodically reviewing and complying with the HLIM requirement as applicable.
At a recent meeting of the Fund’s Board of Trustees, the LRM Committee provided a written report to the Board pertaining to the operation, adequacy, and effectiveness of implementation of the Program for the annual period from December 1, 2018 through November 30, 2019. The report concluded that the Program has been implemented and is operating effectively and is reasonably designed to assess and manage the Fund’s liquidity risk.
Proxy Voting Results
A special meeting of shareholders was held on June 9, 2020. The results of votes taken among shareholders on the proposals before them are reported below. Each vote reported represents one dollar of net asset value held on the record date for the meeting.
PROPOSAL 1
To elect a Board of Trustees.
| | # of
Votes | % of
Votes |
| Dennis J. Dirks |
| Affirmative | 16,472,355,224.707 | 98.191 |
| Withheld | 303,479,718.593 | 1.809 |
| TOTAL | 16,775,834,943.300 | 100.000 |
| Donald F. Donahue |
| Affirmative | 16,468,956,948.310 | 98.171 |
| Withheld | 306,877,994.990 | 1.829 |
| TOTAL | 16,775,834,943.300 | 100.000 |
| Bettina Doulton |
| Affirmative | 16,464,248,028.859 | 98.143 |
| Withheld | 311,586,914.440 | 1.857 |
| TOTAL | 16,775,834,943.300 | 100.000 |
| Vicki L. Fuller |
| Affirmative | 16,478,525,021.984 | 98.228 |
| Withheld | 297,309,921.315 | 1.772 |
| TOTAL | 16,775,834,943.300 | 100.000 |
| Patricia L. Kampling |
| Affirmative | 16,439,684,457.400 | 97.996 |
| Withheld | 336,150,485.900 | 2.004 |
| TOTAL | 16,775,834,943.300 | 100.000 |
| Alan J. Lacy |
| Affirmative | 16,412,329,233.918 | 97.833 |
| Withheld | 363,505,709.381 | 2.167 |
| TOTAL | 16,775,834,943.300 | 100.000 |
| Ned C. Lautenbach |
| Affirmative | 16,404,122,470.961 | 97.784 |
| Withheld | 371,712,472.339 | 2.216 |
| TOTAL | 16,775,834,943.300 | 100.000 |
| Robert A. Lawrence |
| Affirmative | 16,427,939,960.409 | 97.926 |
| Withheld | 347,894,982.890 | 2.074 |
| TOTAL | 16,775,834,943.300 | 100.000 |
| Joseph Mauriello |
| Affirmative | 16,416,374,561.038 | 97.857 |
| Withheld | 359,460,382.261 | 2.143 |
| TOTAL | 16,775,834,943.300 | 100.000 |
| Cornelia M. Small |
| Affirmative | 16,433,661,213.198 | 97.960 |
| Withheld | 342,173,730.101 | 2.040 |
| TOTAL | 16,775,834,943.300 | 100.000 |
| Garnett A. Smith |
| Affirmative | 16,423,425,367.640 | 97.899 |
| Withheld | 352,409,575.660 | 2.101 |
| TOTAL | 16,775,834,943.300 | 100.000 |
| David M. Thomas |
| Affirmative | 16,438,311,280.023 | 97.988 |
| Withheld | 337,523,663.277 | 2.012 |
| TOTAL | 16,775,834,943.300 | 100.000 |
| Susan Tomasky |
| Affirmative | 16,453,903,290.163 | 98.081 |
| Withheld | 321,931,653.136 | 1.919 |
| TOTAL | 16,775,834,943.300 | 100.000 |
| Michael E. Wiley |
| Affirmative | 16,433,445,237.257 | 97.959 |
| Withheld | 342,389,706.042 | 2.041 |
| TOTAL | 16,775,834,943.300 | 100.000 |
PROPOSAL 2
To convert a fundamental investment policy to a non-fundamental investment policy.
| | # of
Votes | % of
Votes |
| Affirmative | 1,250,227,619.902 | 100.00 |
| Against | 0.00 | 0.00 |
| Abstain | 0.00 | 0.00 |
| Broker Non-Vote | 0.00 | 0.00 |
| TOTAL | 1,250,227,619.902 | 100.000 |
|
| Proposal 1 reflects trust wide proposal and voting results. |

SED-SANN-0820
1.924253.109