UNITED STATES
SECURITIES AND EXCHANGE COMMISSION
Washington, D.C. 20549
FORM N-CSR
CERTIFIED SHAREHOLDER REPORT OF REGISTERED MANAGEMENT
INVESTMENT COMPANIES
Investment Company Act file number | 811-3207 |
| |
| General Money Market Fund, Inc. | |
| (Exact name of Registrant as specified in charter) | |
| | |
| c/o The Dreyfus Corporation 200 Park Avenue New York, New York 10166 | |
| (Address of principal executive offices) (Zip code) | |
| | |
| John Pak, Esq. 200 Park Avenue New York, New York 10166 | |
| (Name and address of agent for service) | |
|
Registrant's telephone number, including area code: | (212) 922-6000 |
| |
Date of fiscal year end: | 11/30 | |
Date of reporting period: | 11/30/14 | |
| | | | | | | |
FORM N-CSR
Item 1. Reports to Stockholders.
|
| General Money |
| Market Fund, Inc. |
ANNUAL REPORT November 30, 2014

Save time. Save paper. View your next shareholder report online as soon as it’s available. Log into www.dreyfus.com and sign up for Dreyfus eCommunications. It’s simple and only takes a few minutes.
The views expressed in this report reflect those of the portfolio manager only through the end of the period covered and do not necessarily represent the views of Dreyfus or any other person in the Dreyfus organization. Any such views are subject to change at any time based upon market or other conditions and Dreyfus disclaims any responsibility to update such views.These views may not be relied on as investment advice and, because investment decisions for a Dreyfus fund are based on numerous factors, may not be relied on as an indication of trading intent on behalf of any Dreyfus fund.

| | Contents |
| | THE FUND |
| 2 | A Letter from the President |
| 3 | Discussion of Fund Performance |
| 6 | Understanding Your Fund’s Expenses |
| 6 | Comparing Your Fund’s Expenses With Those of Other Funds |
| 7 | Statement of Investments |
| 11 | Statement of Assets and Liabilities |
| 12 | Statement of Operations |
| 13 | Statement of Changes in Net Assets |
| 14 | Financial Highlights |
| 16 | Notes to Financial Statements |
| 25 | Report of Independent Registered Public Accounting Firm |
| 26 | Important Tax Information |
| 27 | Information About the Renewal of the Fund’s Management Agreement |
| 32 | Board Members Information |
| 34 | Officers of the Fund |
| | FOR MORE INFORMATION |
| | Back Cover |
General Money
Market Fund, Inc.
The Fund
A LETTER FROM THE PRESIDENT
Dear Shareholder:
We are pleased to present this annual report for General Money Market Fund, covering the 12-month period from December 1, 2013, through November 30, 2014. For information about how the fund performed during the reporting period, as well as general market perspectives, we provide a Discussion of Fund Performance on the pages that follow.
The U.S. economy generally gained ground over the reporting period despite a weather-related economic soft patch during the first quarter of 2014.This development sparked bouts of volatility among longer term bonds, but short-term rates and yields of money market instruments remained steady, anchored near historical lows by an unchanged federal funds rate. In addition, a degree of uncertainty was removed from the money markets over the summer when the Securities and Exchange Commission issued new rules governing some funds, but the immediate impact on the market was muted when regulators delayed implementation for two years.
In our view, stronger labor markets, greater manufacturing activity, rebounding housing starts, and rising household wealth portend well for the U.S. economy.While some longer term financial assets are likely to benefit from a more robust recovery, the possibility of higher inflation and rising long-term interest rates suggests that selectivity could become a more important determinant of investment success. As always, we urge you to talk regularly with your financial advisor to assess the potential impact of these and other developments on your investments.
Thank you for your continued confidence and support.

J. Charles Cardona
President
The Dreyfus Corporation
December 15, 2014
2
DISCUSSION OF FUND PERFORMANCE
For the period of December 1, 2013 through November 30, 2014, as provided by Bernard W. Kiernan, Jr., Senior Portfolio Manager
Fund and Market Performance Overview
For the 12-month period ended November 30, 2014, General Money Market Fund’s Class A shares produced a yield of 0.01%, and its Class B shares produced a yield of 0.01%.Taking into account the effects of compounding, the fund’s Class A and Class B shares produced effective yields of 0.01% and 0.01%, respectively.1
Despite stronger economic growth over the reporting period, money market yields remained anchored by an unchanged federal funds rate between 0% and 0.25%.
The Fund’s Investment Approach
The fund seeks as high a level of current income as is consistent with the preservation of capital.To pursue its goal, the fund invests in a diversified portfolio of high-quality, short-term dollar-denominated debt securities. These include securities issued or guaranteed as to principal and interest by the U.S. government or its agencies or instrumentalities, certificates of deposit, time deposits, bankers’ acceptances, and other short-term securities issued by domestic or foreign banks or thrifts or their subsidiaries or branches, repurchase agreements, including tri-party repurchase agreements, asset-backed securities, domestic and dollar-denominated foreign commercial paper and other short-term corporate obligations, and dollar-denominated obligations issued or guaranteed by one or more foreign governments or any of their political subdivisions or agencies. Normally, the fund invests at least 25% of its net assets in domestic or dollar-denominated foreign bank obligations.
U.S. Economy Rebounded after Soft Patch
The reporting period began in the midst of a recovering U.S. economy, which in December 2013 prompted the Federal Reserve Board (the “Fed”) to begin tapering its quantitative easing program. This development helped drive yields of 10-year U.S. Treasury securities above 3% by year-end. Long-term rates moderated in
The Fund 3
DISCUSSION OF FUND PERFORMANCE (continued)
January 2014 amid concerns that global economic and political instability could derail the recovery.Yet, corporate earnings remained strong, the unemployment rate declined to 6.6% with the addition of 144,000 jobs, and the Fed continued to reduce quantitative easing. The economy regained strength in February when the manufacturing and service sectors posted gains. The unemployment rate ticked upward to 6.7%, but 222,000 new jobs were created. In March, the unemployment rate stayed unchanged and 203,000 positions were added. Nonetheless, U.S. GDP contracted at a 2.1% annualized rate over the first quarter, largely due to severe winter weather.
Housing markets rebounded in April. 304,000 new jobs were created, and the unemployment rate fell to 6.3%. The Fed again tapered quantitative easing at its April meeting. In May, payrolls rose by 229,000, and the unemployment rate held steady. Meanwhile, manufacturing activity accelerated and personal incomes posted gains. 267,000 jobs were created in June, and the unemployment rate dipped to 6.1%. Manufacturing activity, personal incomes, and home sales continued to grow.The U.S. economy rebounded at a robust 4.6% annualized rate during the second quarter.
The unemployment rate ticked higher to 6.2% in July, when 243,000 new jobs were created. The Fed implemented additional bond purchasing reductions in June and July. August saw higher retail and new home sales, but new job creation fell to 203,000 even as the unemployment rate fell back to 6.1%.
In September, the economic recovery created 271,000 new jobs, and the unemployment rate slid to 5.9%, its lowest level since June 2008. Falling energy prices helped offset rising housing and food prices, contributing to a mild inflation rate of 0.1%.The Fed again reduced quantitative easing in September. U.S. GDP grew at an annualized 5.0% rate during the third quarter, its strongest quarterly performance since 2003.
Early October saw disappointing growth and deflation fears in Europe, which some believed might threaten the U.S. economy. Markets bounced back over the second half of the month when U.S. economic data stayed strong, including a 5.8% unemployment rate and 243,000 new jobs. Personal incomes rose and fuel prices fell, giving consumers
4
greater confidence. In November, the unemployment rate remained unchanged while 321,000 new jobs were added. Hourly earnings rose by a better-than-expected 0.4% during the month, suggesting that the recovery’s benefits may be broadening to include more Americans. Meanwhile, fuel prices continued to decline, contributing to an inflation rate of –0.3% in November and giving consumers greater buying power during the holiday season.
Fed Remains Committed to Low Short-Term Rates
Although the Fed ended its quantitative easing program in the fall, monetary policymakers reiterated that short-term interest rates are likely to remain unchanged for “a considerable time.” In July, regulators issued changes to the rules governing prime money market funds, but they delayed implementation until 2016.Therefore, the industry’s operations and asset flows have so far been relatively unaffected.
We maintained the fund’s market-neutral weighted average maturity in this environment, and we remained focused on well-established issuers with good quality and liquidity characteristics. In our view, these remain prudent strategies until we see more solid evidence that short-term interest rates are set to rise.
December 15, 2014
An investment in the fund is not insured or guaranteed by the FDIC or any other government agency. Although the fund seeks to preserve the value of your investment at $1.00 per share, it is possible to lose money by investing in the fund.
The fund’s short-term corporate and asset-backed securities holdings involve credit and liquidity risks and risk of principal loss.
|
| 1 Effective yield is based upon dividends declared daily and reinvested monthly. Past performance is no guarantee of |
| future results.Yields fluctuate.Yields provided for the fund’s Class A and Class B shares reflect the absorption of |
| certain fund expenses by The Dreyfus Corporation pursuant to an undertaking in effect that may be extended, |
| terminated, or modified at any time. Had these expenses not been absorbed, fund yields would have been lower. |
The Fund 5
UNDERSTANDING YOUR FUND’S EXPENSES (Unaudited)
As a mutual fund investor, you pay ongoing expenses, such as management fees and other expenses. Using the information below, you can estimate how these expenses affect your investment and compare them with the expenses of other funds.You also may pay one-time transaction expenses, including sales charges (loads) and redemption fees, which are not shown in this section and would have resulted in higher total expenses. For more information, see your fund’s prospectus or talk to your financial adviser.
Review your fund’s expenses
The table below shows the expenses you would have paid on a $1,000 investment in General Money Market Fund, Inc. from June 1, 2014 to November 30, 2014. It also shows how much a $1,000 investment would be worth at the close of the period, assuming actual returns and expenses.
Expenses and Value of a $1,000 Investment
assuming actual returns for the six months ended November 30, 2014
| | | | |
| | | Class A | | Class B |
| Expenses paid per $1,000† | $ | .90 | $ | .85 |
| Ending value (after expenses) | $ | 1,000.10 | $ | 1,000.10 |
COMPARING YOUR FUND’S EXPENSES
WITH THOSE OF OTHER FUNDS (Unaudited)
Using the SEC’s method to compare expenses
The Securities and Exchange Commission (SEC) has established guidelines to help investors assess fund expenses. Per these guidelines, the table below shows your fund’s expenses based on a $1,000 investment, assuming a hypothetical 5% annualized return. You can use this information to compare the ongoing expenses (but not transaction expenses or total cost) of investing in the fund with those of other funds. All mutual fund shareholder reports will provide this information to help you make this comparison. Please note that you cannot use this information to estimate your actual ending account balance and expenses paid during the period.
Expenses and Value of a $1,000 Investment
assuming a hypothetical 5% annualized return for the six months ended November 30, 2014
| | | | |
| | | Class A | | Class B |
| Expenses paid per $1,000† | $ | .91 | $ | .86 |
| Ending value (after expenses) | $ | 1,024.17 | $ | 1,024.22 |
|
| † Expenses are equal to the fund’s annualized expense ratio of .18% for Class A and .17% for Class B, multiplied |
| by the average account value over the period, multiplied by 183/365 (to reflect the one-half year period). |
STATEMENT OF INVESTMENTS
November 30, 2014
| | | |
| | Principal | | |
| Negotiable Bank Certificates of Deposit—31.6% | Amount ($) | | Value ($) |
| Bank of Tokyo-Mitsubishi Ltd. (Yankee) | | | |
| 0.25%, 2/17/15—3/26/15 | 650,000,000 | | 650,000,000 |
| Citibank N.A. | | | |
| 0.19%, 2/19/15 | 150,000,000 | | 150,000,000 |
| Commonwealth Bank of Australia (Yankee) | | | |
| 0.23%, 12/22/14 | 200,000,000 | a,b | 200,000,000 |
| Credit Industriel et Commercial (Yankee) | | | |
| 0.18%, 1/5/15 | 15,000,000 | | 15,000,000 |
| DnB Bank (Yankee) | | | |
| 0.23%, 5/18/15 | 15,000,000 | b | 15,000,000 |
| DZ Bank AG (Yankee) | | | |
| 0.26%, 2/2/15 | 100,000,000 | | 100,000,000 |
| HSBC Bank USA (Yankee) | | | |
| 0.23%, 3/25/15—4/1/15 | 77,000,000 | | 77,000,000 |
| Mizuho Bank Ltd/NY (Yankee) | | | |
| 0.20%, 1/9/15—2/4/15 | 600,000,000 | | 600,000,000 |
| National Australia Bank (Yankee) | | | |
| 0.23%, 12/10/14 | 100,000,000 | a,b | 100,000,000 |
| Nordea Bank Finland (Yankee) | | | |
| 0.23%, 5/20/15 | 250,000,000 | | 249,994,104 |
| Norinchukin Bank/NY (Yankee) | | | |
| 0.20%, 2/2/15—2/19/15 | 400,000,000 | | 399,997,342 |
| Oversea-Chinese Banking Corp./NY (Yankee) | | | |
| 0.22%, 5/18/15 | 100,000,000 | | 100,000,000 |
| Rabobank Nederland/NY (Yankee) | | | |
| 0.20%, 12/22/14 | 300,000,000 | | 300,000,000 |
| Skandinaviska Enskilda Banken NY (Yankee) | | | |
| 0.25%, 1/16/15 | 276,000,000 | | 276,000,000 |
| Standard Chartered Bank (Yankee) | | | |
| 0.20%, 12/4/14 | 200,000,000 | b | 200,000,000 |
| Sumitomo Mitsui Banking Corp. (Yankee) | | | |
| 0.25%—0.26%, 2/4/15—3/11/15 | 500,000,000 | b | 500,000,000 |
| Toronto Dominion Bank NY (Yankee) | | | |
| 0.31%, 10/27/15 | 250,000,000 | | 250,000,000 |
| Wells Fargo Bank, NA | | | |
| 0.25%—0.27%, 12/1/14—1/9/15 | 550,000,000 | a | 550,000,000 |
| Total Negotiable Bank Certificates of Deposit | | | |
| (cost $4,732,991,446) | | | 4,732,991,446 |
The Fund 7
STATEMENT OF INVESTMENTS (continued)
| | | | |
| | | Principal | | |
| | Commercial Paper—25.0% | Amount ($) | | Value ($) |
| | ASB Finance Ltd. | | | |
| | 0.25%, 12/23/14 | 125,000,000 | a,b | 124,996,202 |
| | BNP Paribas Finance Inc. | | | |
| | 0.22%, 12/29/14—1/21/15 | 650,000,000 | | 649,854,556 |
| | Caisse Centrale Desjardn | | | |
| | 0.23%, 1/22/15 | 150,000,000 | a,b | 150,000,000 |
| | Credit Suisse New York | | | |
| | 0.22%—0.23%, 12/22/14—1/2/15 | 370,000,000 | | 369,941,150 |
| | DnB Bank | | | |
| | 0.31%, 2/26/15 | 300,000,000 | b | 299,778,875 |
| | General Electric Capital Corp. | | | |
| | 0.23%, 2/3/15 | 100,000,000 | | 99,959,111 |
| | JP Morgan Securities LLC (3A3) | | | |
| | 0.27%, 4/7/15 | 50,000,000 | | 49,952,375 |
| | National Australia Funding (DE) Inc. | | | |
| | 0.23%, 2/17/15 | 400,000,000 | a,b | 400,000,000 |
| | Oversea-Chinese Banking Corp./NY | | | |
| | 0.23%—0.24%, 12/4/14—5/22/15 | 300,000,000 | | 299,712,708 |
| | Rabobank USA Finance Corp. | | | |
| | 0.22%, 2/5/15 | 350,000,000 | | 349,862,042 |
| | Sumitomo Mitsui Banking Corp. | | | |
| | 0.26%, 3/13/15 | 50,000,000 | b | 49,963,167 |
| | Sumitomo Mitsui Trust Bank | | | |
| | 0.19%, 12/16/14 | 400,000,000 | | 399,968,333 |
| | Westpac Banking Corp. | | | |
| | 0.24%—0.25%, 12/23/14—2/12/15 | 500,000,000 | a,b | 500,000,000 |
| | Total Commercial Paper | | | |
| | (cost $3,743,988,519) | | | 3,743,988,519 |
| |
| Asset-Backed Commercial Paper—7.7% | | | |
| | Alpine Securitization Corp. | | | |
| | 0.23%, 12/10/14—12/22/14 | 280,000,000 | b | 279,981,600 |
| | Collateralized Commercial Paper II Co., LLC | | | |
| | 0.30%, 12/11/14—2/5/15 | 422,000,000 | b | 421,894,833 |
| | Collateralized Commercial | | | |
| | Paper Program Co., LLC | | | |
| | 0.30%, 5/6/15 | 200,000,000 | | 199,740,000 |
8
| | | |
| | Principal | | |
| Asset-Backed Commercial Paper (continued) | Amount ($) | | Value ($) |
| Govco | | | |
| 0.18%, 1/14/15 | 50,000,000 | b | 49,989,000 |
| Regency Markets No. 1 LLC | | | |
| 0.14%, 12/16/14 | 194,000,000 | b | 193,988,683 |
| Total Asset-Backed Commercial Paper | | | |
| (cost $1,145,594,116) | | | 1,145,594,116 |
| |
| Time Deposits—30.1% | | | |
| Australia and New Zealand Banking | | | |
| Group Ltd. (Grand Cayman) | | | |
| 0.08%, 12/1/14 | 512,000,000 | | 512,000,000 |
| Credit Agricole (Grand Cayman) | | | |
| 0.09%, 12/1/14 | 650,000,000 | | 650,000,000 |
| DnB Bank (Grand Cayman) | | | |
| 0.06%, 12/1/14 | 400,000,000 | | 400,000,000 |
| DZ Bank AG (Grand Cayman) | | | |
| 0.06%, 12/1/14 | 375,000,000 | | 375,000,000 |
| Lloyds Bank (London) | | | |
| 0.05%, 12/1/14 | 550,000,000 | | 550,000,000 |
| Natixis New York (Grand Cayman) | | | |
| 0.07%, 12/1/14 | 702,000,000 | | 702,000,000 |
| Nordea Bank Finland (Grand Cayman) | | | |
| 0.05%, 12/1/14 | 100,000,000 | | 100,000,000 |
| Skandinaviska Enskilda Banken NY (Grand Cayman) | | | |
| 0.07%, 12/1/14 | 400,000,000 | | 400,000,000 |
| Svenska Handelsbanken Inc (Grand Cayman) | | | |
| 0.06%, 12/1/14 | 120,000,000 | | 120,000,000 |
| Swedbank (Grand Cayman) | | | |
| 0.06%, 12/1/14 | 700,000,000 | | 700,000,000 |
| Total Time Deposits | | | |
| (cost $4,509,000,000) | | | 4,509,000,000 |
| |
| U.S. Government Agency—2.1% | | | |
| Federal Home Loan Bank | | | |
| 0.00%—0.17%, 12/1/14—1/16/15 | | | |
| (cost $312,995,437) | 313,000,000 | | 312,995,437 |
The Fund 9
STATEMENT OF INVESTMENTS (continued)
| | | |
| | Principal | | |
| U.S. Treasury Notes—.8% | Amount ($) | | Value ($) |
| 0.12%, 5/31/15 | | | |
| (cost $116,147,880) | 115,000,000 | | 116,147,880 |
| |
| |
| Repurchase Agreement—2.7% | | | |
| SG Americas Securities, LLC | | | |
| 0.33%, dated 10/2/14-10/3/14, | | | |
| due 1/4/15 in the amount of | | | |
| $400,011,000 (fully collateralized | | | |
| by Various Common Stocks, | | | |
| value $440,000,007) | | | |
| (cost $400,000,000) | 400,000,000 | c | 400,000,000 |
| |
| Total Investments (cost $14,960,717,398) | 100.0 | % | 14,960,717,398 |
| |
| Cash and Receivables (Net) | .0 | % | 2,905,380 |
| |
| Net Assets | 100.0 | % | 14,963,622,778 |
|
| a Variable rate security—interest rate subject to periodic change. |
| b Securities exempt from registration pursuant to Rule 144A under the Securities Act of 1933.These securities may be |
| resold in transactions exempt from registration, normally to qualified institutional buyers.At November 30, 2014, |
| these securities amounted to $3,485,592,360 or 23.3% of net assets. |
| c Investment has a put feature and a variable or floating rate. The interest rate shown is the current rate as of |
| November 30, 2014 and changes periodically. The maturity date reflects early termination date. |
| | | |
| Portfolio Summary (Unaudited)† | | |
| |
| | Value (%) | | Value (%) |
| Banking | 86.1 | Asset-Backed/Multi-Seller Programs | 1.3 |
| Asset-Backed/Banking | 6.4 | Finance | .6 |
| U.S. Government and Agency | 2.9 | | |
| Repurchase Agreement | 2.7 | | 100.0 |
| |
| † Based on net assets. | | | |
| See notes to financial statements. | | | |
10
STATEMENT OF ASSETS AND LIABILITIES
November 30, 2014
| | |
| | Cost | Value |
| Assets ($): | | |
| Investments in securities—See Statement of Investments | 14,960,717,398 | 14,960,717,398 |
| Cash | | 913,478 |
| Interest receivable | | 3,594,592 |
| Prepaid expenses | | 1,049,320 |
| | | 14,966,274,788 |
| Liabilities ($): | | |
| Due to The Dreyfus Corporation and affiliates—Note 2(c) | | 2,129,165 |
| Payable for shares of Common Stock redeemed | | 50,139 |
| Accrued expenses | | 472,706 |
| | | 2,652,010 |
| Net Assets ($) | | 14,963,622,778 |
| Composition of Net Assets ($): | | |
| Paid-in capital | | 14,963,563,464 |
| Accumulated net realized gain (loss) on investments | | 59,314 |
| Net Assets ($) | | 14,963,622,778 |
| |
| |
| Net Asset Value Per Share | | |
| | Class A | Class B |
| Net Assets ($) | 1,921,779,629 | 13,041,843,149 |
| Shares Outstanding | 1,921,751,477 | 13,041,811,987 |
| Net Asset Value Per Share ($) | 1.00 | 1.00 |
| |
| See notes to financial statements. | | |
The Fund 11
STATEMENT OF OPERATIONS
Year Ended November 30, 2014
| | |
| Investment Income ($): | | |
| Interest Income | 25,703,235 | |
| Expenses: | | |
| Management fee—Note 2(a) | 72,506,369 | |
| Shareholder servicing costs—Note 1 and Note 2(c) | 38,240,034 | |
| Distribution, service and prospectus fees—Note 2(b) | 29,441,719 | |
| Registration fees | 914,165 | |
| Shareholders’ reports | 733,422 | |
| Directors’ fees and expenses—Note 2(d) | 700,803 | |
| Custodian fees—Note 2(c) | 494,642 | |
| Professional fees | 76,996 | |
| Miscellaneous | 184,221 | |
| Total Expenses | 143,292,371 | |
| Less—reduction in expenses due to undertaking—Note 2(a) | (118,336,066 | ) |
| Less—reduction in shareholder servicing costs | | |
| due to undertaking—Note 2(c) | (678,877 | ) |
| Less—reduction in fees due to earnings credits—Note 2(c) | (3,131 | ) |
| Net Expenses | 24,274,297 | |
| Investment Income—Net | 1,428,938 | |
| Net Realized Gain (Loss) on Investments—Note 1(b) ($) | 59,314 | |
| Net Increase in Net Assets Resulting from Operations | 1,488,252 | |
| See notes to financial statements. | | |
12
STATEMENT OF CHANGES IN NET ASSETS
| | | | |
| | Year Ended November 30, | |
| | 2014 | | 2013 | |
| Operations ($): | | | | |
| Investment income—net | 1,428,938 | | 1,443,632 | |
| Net realized gain (loss) on investments | 59,314 | | 47,828 | |
| Net Increase (Decrease) in Net Assets | | | | |
| Resulting from Operations | 1,488,252 | | 1,491,460 | |
| Dividends to Shareholders from ($): | | | | |
| Investment income—net: | | | | |
| Class A | (183,251 | ) | (179,238 | ) |
| Class B | (1,267,497 | ) | (1,264,394 | ) |
| Total Dividends | (1,450,748 | ) | (1,443,632 | ) |
| Capital Stock Transactions ($1.00 per share): | | | | |
| Net proceeds from shares sold: | | | | |
| Class A | 5,550,728,591 | | 6,237,396,280 | |
| Class B | 19,564,696,832 | | 22,970,220,466 | |
| Dividends reinvested: | | | | |
| Class A | 182,849 | | 178,448 | |
| Class B | 1,257,176 | | 1,254,766 | |
| Cost of shares redeemed: | | | | |
| Class A | (5,438,058,241 | ) | (6,191,925,223 | ) |
| Class B | (19,201,747,164 | ) | (22,710,008,405 | ) |
| Increase (Decrease) in Net Assets | | | | |
| from Capital Stock Transactions | 477,060,043 | | 307,116,332 | |
| Total Increase (Decrease) in Net Assets | 477,097,547 | | 307,164,160 | |
| Net Assets ($): | | | | |
| Beginning of Period | 14,486,525,231 | | 14,179,361,071 | |
| End of Period | 14,963,622,778 | | 14,486,525,231 | |
| |
| See notes to financial statements. | | | | |
The Fund 13
FINANCIAL HIGHLIGHTS
The following tables describe the performance for each share class for the fiscal periods indicated. All information reflects financial results for a single fund share. Total return shows how much your investment in the fund would have increased (or decreased) during each period, assuming you had reinvested all dividends and distributions.These figures have been derived from the fund’s financial statements.
| | | | | | | | | | |
| | | | Year Ended November 30, | | | |
| Class A Shares | 2014 | | 2013 | | 2012 | | 2011 | | 2010 | |
| Per Share Data ($): | | | | | | | | | | |
| Net asset value, beginning of period | 1.00 | | 1.00 | | 1.00 | | 1.00 | | 1.00 | |
| Investment Operations: | | | | | | | | | | |
| Investment income—neta | .000 | | .000 | | .000 | | .000 | | .000 | |
| Distributions: | | | | | | | | | | |
| Dividends from | | | | | | | | | | |
| investment income—neta | (.000 | ) | (.000 | ) | (.000 | ) | (.000 | ) | (.000 | ) |
| Net asset value, end of period | 1.00 | | 1.00 | | 1.00 | | 1.00 | | 1.00 | |
| Total Return (%) | .01 | | .01 | | .01 | | .03 | | .03 | |
| Ratios/Supplemental Data (%): | | | | | | | | | | |
| Ratio of total expenses | | | | | | | | | | |
| to average net assets | .73 | | .73 | | .74 | | .75 | | .75 | |
| Ratio of net expenses | | | | | | | | | | |
| to average net assets | .17 | | .19 | | .26 | | .22 | | .30 | |
| Ratio of net investment income | | | | | | | | | | |
| to average net assets | .01 | | .01 | | .01 | | .03 | | .03 | |
| Net Assets, end of period | | | | | | | | | | |
| ($ x 1,000) | 1,921,780 | | 1,808,922 | | 1,763,266 | | 1,824,285 | | 1,693,043 | |
| |
| a Amount represents less than $.001 per share. | | | | | | | | | |
| See notes to financial statements. | | | | | | | | | | |
14
| | | | | | | | | | |
| | | | Year Ended November 30, | | | |
| Class B Shares | 2014 | | 2013 | | 2012 | | 2011 | | 2010 | |
| Per Share Data ($): | | | | | | | | | | |
| Net asset value, | | | | | | | | | | |
| beginning of period | 1.00 | | 1.00 | | 1.00 | | 1.00 | | 1.00 | |
| Investment Operations: | | | | | | | | | | |
| Investment income—net | .000 | a | .000 | a | .000 | a | .000 | a | .001 | |
| Distributions: | | | | | | | | | | |
| Dividends from | | | | | | | | | | |
| investment income—net | (.000 | )a | (.000 | )a | (.000 | )a | (.000 | )a | (.001 | ) |
| Net asset value, end of period | 1.00 | | 1.00 | | 1.00 | | 1.00 | | 1.00 | |
| Total Return (%) | .01 | | .01 | | .01 | | .05 | | .05 | |
| Ratios/Supplemental Data (%): | | | | | | | | | |
| Ratio of total expenses | | | | | | | | | | |
| to average net assets | 1.03 | | 1.03 | | 1.03 | | 1.04 | | 1.04 | |
| Ratio of net expenses | | | | | | | | | | |
| to average net assets | .17 | | .19 | | .26 | | .20 | | .28 | |
| Ratio of net investment income | | | | | | | | | | |
| to average net assets | .01 | | .01 | | .01 | | .05 | | .05 | |
| Net Assets, end of period | | | | | | | | | | |
| ($ x 1,000) | 13,041,843 | | 12,677,604 | | 12,416,095 | | 11,943,925 | | 10,916,611 | |
| |
| a Amount represents less than $.001 per share. | | | | | | | | | |
| See notes to financial statements. | | | | | | | | | | |
The Fund 15
NOTES TO FINANCIAL STATEMENTS
NOTE 1—Significant Accounting Policies:
General Money Market Fund, Inc. (the “fund”) is registered under the Investment Company Act of 1940, as amended (the “Act”), as a diversified open-end management investment company. The fund’s investment objective is to seek as high a level of current income as is consistent with the preservation of capital.The Dreyfus Corporation (the “Manager” or “Dreyfus”), a wholly-owned subsidiary of The Bank of New York Mellon Corporation (“BNY Mellon”), serves as the fund’s investment adviser.
MBSC Securities Corporation (the “Distributor”), a wholly-owned subsidiary of the Manager, is the distributor of the fund’s shares, which are sold to the public without a sales charge.The fund is authorized to issue 25.5 billion shares of $.001 par value Common Stock.The fund currently offers two classes of shares: Class A (7 billion shares authorized) and Class B (18.5 billion shares authorized). Class A and Class B shares are identical except for the services offered to and the expenses borne by each class, the allocation of certain transfer agency costs, and certain voting rights. Class A shares are subject to a Service Plan adopted pursuant to Rule 12b-1 under the Act, Class B shares are subject to a Distribution Plan adopted pursuant to Rule 12b-1 under the Act and Class A and Class B shares are subject to a Shareholder Services Plan. In addition, Class B shares are charged directly for sub-accounting services provided by Service Agents (securities dealers, financial institutions or other industry professionals) at an annual rate of .05% of the value of the average daily net assets of Class B shares. During the period ended November 30, 2014, sub-accounting service fees amounted to $6,333,013 for Class B shares and are included in Shareholder servicing costs in the Statement of Operations. Income, expenses (other than expenses attributable to a specific class), and realized and unrealized gains or losses on investments are allocated to each class of shares based on its relative net assets.
16
It is the fund’s policy to maintain a continuous net asset value per share of $1.00; the fund has adopted certain investment, portfolio valuation and dividend and distribution policies to enable it to do so. There is no assurance, however, that the fund will be able to maintain a stable net asset value per share of $1.00.
The Financial Accounting Standards Board (“FASB”) Accounting Standards Codification (“ASC”) is the exclusive reference of authoritative U.S. generally accepted accounting principles (“GAAP”) recognized by the FASB to be applied by nongovernmental entities. Rules and interpretive releases of the Securities and Exchange Commission (“SEC”) under authority of federal laws are also sources of authoritative GAAP for SEC registrants. The fund’s financial statements are prepared in accordance with GAAP, which may require the use of management estimates and assumptions. Actual results could differ from those estimates.
The fund enters into contracts that contain a variety of indemnifications. The fund’s maximum exposure under these arrangements is unknown.The fund does not anticipate recognizing any loss related to these arrangements.
(a) Portfolio valuation: Investments in securities are valued at amortized cost in accordance with Rule 2a-7 under the Act. If amortized cost is determined not to approximate market value, the fair value of the portfolio securities will be determined by procedures established by and under the general supervision of the fund’s Board of Directors (the “Board”).
The fair value of a financial instrument is the amount that would be received to sell an asset or paid to transfer a liability in an orderly transaction between market participants at the measurement date (i.e., the exit price). GAAP establishes a fair value hierarchy that prioritizes the inputs of valuation techniques used to measure fair value.This hierar-
The Fund 17
NOTES TO FINANCIAL STATEMENTS (continued)
chy gives the highest priority to unadjusted quoted prices in active markets for identical assets or liabilities (Level 1 measurements) and the lowest priority to unobservable inputs (Level 3 measurements).
Additionally, GAAP provides guidance on determining whether the volume and activity in a market has decreased significantly and whether such a decrease in activity results in transactions that are not orderly. GAAP requires enhanced disclosures around valuation inputs and techniques used during annual and interim periods.
Various inputs are used in determining the value of the fund’s investments relating to fair value measurements.These inputs are summarized in the three broad levels listed below:
Level 1—unadjusted quoted prices in active markets for identical investments.
Level 2—other significant observable inputs (including quoted prices for similar investments, interest rates, prepayment speeds, credit risk, etc.).
Level 3—significant unobservable inputs (including the fund’s own assumptions in determining the fair value of investments).
The inputs or methodology used for valuing securities are not necessarily an indication of the risk associated with investing in those securities. For example, money market securities are valued using amortized cost, in accordance with rules under the Act. Generally, amortized cost approximates the current fair value of a security, but since the value is not obtained from a quoted price in an active market, such securities are reflected within Level 2 of the fair value hierarchy.
The following is a summary of the inputs used as of November 30, 2014 in valuing the fund’s investments:
| |
| | Short-Term |
| Valuation Inputs | Investments ($)† |
| Level 1—Unadjusted Quoted Prices | — |
| Level 2—Other Significant Observable Inputs | 14,960,717,398 |
| Level 3—Significant Unobservable Inputs | — |
| Total | 14,960,717,398 |
| |
| † | See Statement of Investments for additional detailed categorizations. |
18
At November 30, 2014, there were no transfers between Level 1 and Level 2 of the fair value hierarchy.
(b) Securities transactions and investment income: Securities transactions are recorded on a trade date basis. Interest income, adjusted for accretion of discount and amortization of premium on investments, is earned from settlement date and is recognized on the accrual basis. Realized gains and losses from securities transactions are recorded on the identified cost basis. Cost of investments represents amortized cost.
The fund may enter into repurchase agreements with financial institutions, deemed to be creditworthy by the Manager, subject to the seller’s agreement to repurchase and the fund’s agreement to resell such securities at a mutually agreed upon price. Pursuant to the terms of the repurchase agreement, such securities must have an aggregate market value greater than or equal to the terms of the repurchase price plus accrued interest at all times. If the value of the underlying securities falls below the value of the repurchase price plus accrued interest, the fund will require the seller to deposit additional collateral by the next business day. If the request for additional collateral is not met, or the seller defaults on its repurchase obligation, the fund maintains its right to sell the underlying securities at market value and may claim any resulting loss against the seller.
(c) Dividends to shareholders: It is the policy of the fund to declare dividends daily from investment income-net. Such dividends are paid monthly. Dividends from net realized capital gains, if any, are normally declared and paid annually, but the fund may make distributions on a more frequent basis to comply with the distribution requirements of the Internal Revenue Code of 1986, as amended (the “Code”).To the extent that net realized capital gains can be offset by capital loss carryovers, it is the policy of the fund not to distribute such gains.
(d) Federal income taxes: It is the policy of the fund to continue to qualify as a regulated investment company, if such qualification is in the best interests of its shareholders, by complying with the applicable pro-
The Fund 19
NOTES TO FINANCIAL STATEMENTS (continued)
visions of the Code, and to make distributions of taxable income sufficient to relieve it from substantially all federal income and excise taxes.
As of and during the period ended November 30, 2014, the fund did not have any liabilities for any uncertain tax positions. The fund recognizes interest and penalties, if any, related to uncertain tax positions as income tax expense in the Statement of Operations. During the period ended November 30, 2014, the fund did not incur any interest or penalties.
Each tax year in the four-year period ended November 30, 2014 remains subject to examination by the Internal Revenue Service and state taxing authorities.
At November 30, 2014, the components of accumulated earnings on a tax basis were substantially the same as for financial reporting purposes.
The tax character of distributions paid to shareholders during the fiscal periods ended November 30, 2014 and November 30, 2013 were all ordinary income.
During the period ended November 30, 2014, as a result of permanent book to tax differences, primarily due to dividend reclassification, the fund increased accumulated undistributed investment income-net by $21,810 and decreased accumulated net realized gain (loss) on investments by the same amount. Net assets and net asset value per share were not affected by this reclassification.
At November 30, 2014, the cost of investments for federal income tax purposes was substantially the same as the cost for financial reporting purposes (see the Statement of Investments).
NOTE 2—Management Fee and Other Transactions with Affiliates:
(a) Pursuant to a management agreement (the “Agreement”) with the Manager, the management fee is computed at the annual rate of .50% of the value of the fund’s average daily net assets and is payable monthly. The Agreement provides that if in any full fiscal year the
20
aggregate expenses of the fund (excluding taxes, brokerage commissions and extraordinary expenses) exceed 1 1 / 2% of the value of the fund’s average daily net assets, the fund may deduct from payments to be made to the Manager, or the Manager will bear, such excess expense. During the period ended November 30, 2014, there was no reduction in expenses pursuant to the Agreement.
The Manager has also undertaken to waive receipt of the management fee and/or reimburse operating expenses in order to facilitate a daily yield at or above a certain level which may change from time to time. This undertaking is voluntary and not contractual, and may be terminated at any time. The reduction in expenses, pursuant to the undertaking, amounted to $118,336,066 during the period ended November 30, 2014.
(b) Under the Service Plan with respect to Class A, adopted pursuant to Rule 12b-1 under the Act, Class A shares bear directly the cost, of preparing, printing and distributing prospectuses and statements of additional information and implementing and operating the Service Plan, such aggregate amount not to exceed in any fiscal year of the fund, the greater of $100,000 or .005% of the average daily net assets of Class A. In addition, Class A shares pay the Distributor for distributing their shares, servicing shareholder accounts (“Servicing”) and advertising and marketing relating to Class A shares at an annual rate of .20% of the value of the average daily net assets of Class A. The Distributor may pay one or more Service Agents a fee with respect to Class A shares owned by shareholders with whom the Service Agent has a Servicing relationship or for whom the Service Agent is the dealer or holder of record.The schedule of such fees and the basis upon which such fees will be paid shall be determined from time to time by the Distributor. If a holder of Class A shares ceases to be a client of a Service Agent, but continues to hold Class A shares, the Distributor will be permitted to act as a Service Agent with respect to such fund shareholders and receive payments under the Service Plan for Servicing. The fees
The Fund 21
NOTES TO FINANCIAL STATEMENTS (continued)
payable for Servicing are payable without regard to actual expenses incurred. During the period ended November 30, 2014, Class A shares were charged $3,726,141 pursuant to the Service Plan.
Under the Distribution Plan with respect to Class B, adopted pursuant to Rule 12b-1 under the Act, Class B shares bear directly the costs of preparing, printing and distributing prospectuses and statements of additional information and of implementing and operating the Distribution Plan, such aggregate amount not to exceed in any fiscal year of the fund the greater of $100,000 or .005% of the average daily net assets of Class B. In addition, Class B shares reimburse the Distributor for payments made to third parties for distributing its shares at an annual rate not to exceed .20% of the value of its average daily net assets. During the period ended November 30, 2014, Class B shares were charged $25,715,578 pursuant to the Distribution Plan.
(c) Under the Shareholder Services Plan with respect to Class A (the “Class A Shareholder Services Plan”), Class A shares reimburse the Distributor an amount not to exceed an annual rate of .25% of the value of the average daily net assets of its shares for certain allocated expenses of providing personal services and/or maintaining shareholder accounts. The services provided may include personal services relating to shareholder accounts, such as answering shareholder inquiries regarding the fund and providing reports and other information, and services related to the maintenance of shareholder accounts. During the period ended November 30, 2014, Class A shares were charged $75,478 pursuant to the Class A Shareholder Services Plan.
Under the Shareholder Services Plan with respect to Class B (the “Class B Shareholder Services Plan”), Class B shares pay the Distributor at an annual rate of .25% of the value of the average daily net assets of its shares for servicing shareholder accounts.The services provided may include personal services relating to shareholder accounts, such as answering shareholder inquiries regarding the fund
22
and providing reports and other information, and services related to the maintenance of shareholder accounts. The Distributor may make payments to Service Agents with respect to these services. The Distributor determines the amounts to be paid to Service Agents.
The Manager had undertaken, from December 1, 2013 through November 30, 2014, to reduce the expenses of Class B shares, if the aggregate expenses of Class B shares (excluding taxes, brokerage commissions and extraordinary expenses) exceeded an annual rate of 1.02% of the value of the average daily net assets of its shares. Such expense limitations are voluntary, temporary and may be terminated at any time. During the period ended November 30, 2014, Class B shares were charged $31,665,063 pursuant to the Class B Shareholder Services Plan, of which $678,877 was reimbursed by the Manager.
The fund has arrangements with the transfer agent and the custodian whereby the fund may receive earnings credits when positive cash balances are maintained, which are used to offset transfer agency and custody fees. For financial reporting purposes, the fund includes net earnings credits as an expense offset in the Statement of Operations.
The fund compensates Dreyfus Transfer, Inc., a wholly-owned subsidiary of the Manager, under a transfer agency agreement for providing transfer agency and cash management services for the fund. The majority of transfer agency fees are comprised of amounts paid on a per account basis, while cash management fees are related to fund subscriptions and redemptions. During the period ended November 30, 2014, the fund was charged $137,556 for transfer agency services and $6,552 for cash management services. These fees are included in Shareholder servicing costs in the Statement of Operations. Cash management fees were partially offset by earnings credits of $420.
The fund compensates The Bank of NewYork Mellon under a custody agreement for providing custodial services for the fund. These fees are determined based on net assets, geographic region and transaction
The Fund 23
NOTES TO FINANCIAL STATEMENTS (continued)
activity. During the period ended November 30, 2014, the fund was charged $494,642 pursuant to the custody agreement.These fees were partially offset by earnings credits of $2,711.
The fund compensates The Bank of New York Mellon for performing certain cash management services related to fund subscriptions and redemptions, including shareholder redemption draft processing, under a cash management agreement. During the period ended November 30, 2014, the fund was charged $4,779 pursuant to the agreement, which is included in Shareholder servicing costs in the Statement of Operations.
During the period ended November 30, 2014, the fund was charged $7,919 for services performed by the Chief Compliance Officer and his staff.
The components of “Due to The Dreyfus Corporation and affiliates” in the Statement of Assets and Liabilities consist of: management fees $6,113,001, Distribution Plan fees $2,445,254, Shareholder Services Plan fees $3,215,203, custodian fees $207,742, Chief Compliance Officer fees $1,234 and transfer agency fees $24,764, which are offset against an expense reimbursement currently in effect in the amount of $9,878,033.
(d) Each Board member also serves as a Board member of other funds within the Dreyfus complex. Annual retainer fees and attendance fees are allocated to each fund based on net assets.
NOTE 3—Regulatory Developments:
On July 23, 2014, the SEC adopted amendments to the rules that govern money market mutual funds. In part, the amendments will require structural changes to most types of money market funds to one extent or another; however, the SEC provided for an extended two-year transition period to comply with such structural requirements. At this time, management is evaluating the reforms adopted and the manner for implementing these reforms over time and its impact on the financial statements.
24
REPORT OF INDEPENDENT REGISTERED
PUBLIC ACCOUNTING FIRM
Shareholders and Board of Directors
General Money Market Fund, Inc.
We have audited the accompanying statement of assets and liabilities of General Money Market Fund, Inc., including the statement of investments, as of November 30, 2014, and the related statement of operations for the year then ended, the statement of changes in net assets for each of the two years in the period then ended, and the financial highlights for each of the five years in the period then ended. These financial statements and financial highlights are the responsibility of the Fund’s management. Our responsibility is to express an opinion on these financial statements and financial highlights based on our audits.
We conducted our audits in accordance with the standards of the Public Company Accounting Oversight Board (United States). Those standards require that we plan and perform the audit to obtain reasonable assurance about whether the financial statements and financial highlights are free of material misstatement. We were not engaged to perform an audit of the Fund’s internal control over financial reporting. Our audits included consideration of internal control over financial reporting as a basis for designing audit procedures that are appropriate in the circumstances, but not for the purpose of expressing an opinion on the effectiveness of the Fund’s internal control over financial reporting. Accordingly, we express no such opinion. An audit also includes examining, on a test basis, evidence supporting the amounts and disclosures in the financial statements and financial highlights, assessing the accounting principles used and significant estimates made by management, and evaluating the overall financial statement presentation. Our procedures included confirmation of securities owned as of November 30, 2014 by correspondence with the custodian and others.We believe that our audits provide a reasonable basis for our opinion.
In our opinion, the financial statements and financial highlights referred to above present fairly, in all material respects, the financial position of General Money Market Fund, Inc. at November 30, 2014, the results of its operations for the year then ended, the changes in its net assets for each of the two years in the period then ended, and the financial highlights for each of the five years in the period then ended, in conformity with U.S. generally accepted accounting principles.

New York, New York
January 28, 2015
The Fund 25
IMPORTANT TAX INFORMATION (Unaudited)
For federal tax purposes, the fund hereby reports 88.62% of ordinary income dividends paid during the fiscal year ended November 30, 2014 as qualifying interest related dividends.
26
INFORMATION ABOUT THE RENEWAL OF THE
FUND’S MANAGEMENT AGREEMENT (Unaudited)
At a meeting of the fund’s Board of Directors held on July 22, 2014, the Board considered the renewal of the fund’s Management Agreement pursuant to which Dreyfus provides the fund with investment advisory and administrative services (the “Agreement”). The Board members, none of whom are “interested persons” (as defined in the Investment Company Act of 1940, as amended) of the fund, were assisted in their review by independent legal counsel and met with counsel in executive session separate from Dreyfus representatives. In considering the renewal of the Agreement, the Board considered all factors that it believed to be relevant, including those discussed below.The Board did not identify any one factor as dispositive, and each Board member may have attributed different weights to the factors considered.
Analysis of Nature, Extent, and Quality of Services Provided to the Fund. The Board considered information provided to them at the meeting and in previous presentations from Dreyfus representatives regarding the nature, extent, and quality of the services provided to funds in the Dreyfus fund complex. Dreyfus provided the number of open accounts in the fund, the fund’s asset size and the allocation of fund assets among distribution channels. Dreyfus also had previously provided information regarding the diverse intermediary relationships and distribution channels of funds in the Dreyfus fund complex (such as retail direct or intermediary, in which intermediaries typically are paid by the fund and/or Dreyfus) and Dreyfus’ corresponding need for broad, deep, and diverse resources to be able to provide ongoing shareholder services to each intermediary or distribution channel, as applicable to the fund.
The Board also considered research support available to, and portfolio management capabilities of, the fund’s portfolio management personnel and that Dreyfus also provides oversight of day-to-day fund operations, including fund accounting and administration and assistance in meeting legal and regulatory requirements. The Board also considered Dreyfus’ extensive administrative, accounting, and compliance infrastructures.
The Fund 27
INFORMATION ABOUT THE RENEWAL OF THE FUND’S
MANAGEMENT AGREEMENT (Unaudited) (continued)
Comparative Analysis of the Fund’s Performance and Management Fee and Expense Ratio. The Board reviewed reports prepared by Lipper, Inc. (“Lipper”), an independent provider of investment company data, which included information comparing (1) the fund’s performance with the performance of a group of comparable funds (the “Performance Group”) and with a broader group of funds (the “Performance Universe”), all for various periods ended May 31, 2014, and (2) the fund’s actual and contractual management fees and total expenses with those of a group of comparable funds (the “Expense Group”) and with a broader group of funds (the “Expense Universe”), the information for which was derived in part from fund financial statements available to Lipper as of the date of its analysis. Dreyfus previously had furnished the Board with a description of the methodology Lipper used to select the Performance Group and Performance Universe and the Expense Group and Expense Universe.
Dreyfus representatives stated that the usefulness of performance comparisons may be affected by a number of factors, including different investment limitations that may be applicable to the fund and comparison funds. The Board discussed the results of the comparisons and noted that the fund’s total return performance was at or above the Performance Group and Performance Universe medians for all periods.
The Board also reviewed the range of actual and contractual management fees and total expenses of the Expense Group and Expense Universe funds and discussed the results of the comparisons. The Board noted that the fund’s contractual management fee was above the Expense Group median (highest in the Expense Group) and the fund’s actual management fee, which was zero, and total expenses were below the Expense Group and Expense Universe medians (total expenses were the lowest in the Expense Group).The Board also considered the current fee waiver and expense reimbursement arrangement undertaken by Dreyfus.
28
Dreyfus representatives reviewed with the Board the management or investment advisory fees paid by funds advised or administered by Dreyfus that are in the same Lipper category as the fund (the “Similar Funds”), and explained the nature of the Similar Funds.They discussed differences in fees paid and the relationship of the fees paid in light of any differences in the services provided and other relevant factors.The Board considered the relevance of the fee information provided for the Similar Funds to evaluate the appropriateness and reasonableness of the fund’s management fee.
Analysis of Profitability and Economies of Scale. Dreyfus representatives reviewed the expenses allocated and profit received by Dreyfus and its affiliates and the resulting profitability percentage for managing the fund and the aggregate profitability percentage to Dreyfus and its affiliates for managing the funds in the Dreyfus fund complex, and the method used to determine the expenses and profit. The Board concluded that the profitability results were not unreasonable, given the services rendered and service levels provided by Dreyfus. The Board also noted the fee waiver and expense reimbursement arrangement and its effect on the profitability of Dreyfus and its affiliates. The Board also had been provided with information prepared by an independent consulting firm regarding Dreyfus’ approach to allocating costs to, and determining the profitability of, individual funds and the entire Dreyfus fund complex. The consulting firm also had analyzed where any economies of scale might emerge in connection with the management of a fund.
The Board considered on the advice of its counsel the profitability analysis (1) as part of its evaluation of whether the fees under the Agreement bear a reasonable relationship to the mix of services provided by Dreyfus, including the nature, extent and quality of such services, and (2) in light of the relevant circumstances for the fund and the extent to which economies of scale would be realized if the
The Fund 29
INFORMATION ABOUT THE RENEWAL OF THE FUND’S
MANAGEMENT AGREEMENT (Unaudited) (continued)
fund grows and whether fee levels reflect these economies of scale for the benefit of fund shareholders. Dreyfus representatives noted that a discussion of economies of scale is predicated on a fund having achieved a substantial size with increasing assets and that, if a fund’s assets had been stable or decreasing, the possibility that Dreyfus may have realized any economies of scale would be less. Dreyfus representatives also noted that, as a result of shared and allocated costs among funds in the Dreyfus fund complex, the extent of economies of scale could depend substantially on the level of assets in the complex as a whole, so that increases and decreases in complex-wide assets can affect potential economies of scale in a manner that is disproportionate to, or even in the opposite direction from, changes in the fund’s asset level. The Board also considered potential benefits to Dreyfus from acting as investment adviser and noted that there were no soft dollar arrangements in effect for trading the fund’s investments.
At the conclusion of these discussions, the Board agreed that it had been furnished with sufficient information to make an informed business decision with respect to the renewal of the Agreement. Based on the discussions and considerations as described above, the Board concluded and determined as follows.
The Board concluded that the nature, extent and quality of the services provided by Dreyfus are adequate and appropriate.
The Board was satisfied with the fund’s relative performance.
The Board concluded that the fee paid to Dreyfus was reasonable in light of the considerations described above.
The Board determined that the economies of scale which may accrue to Dreyfus and its affiliates in connection with the management of the fund had been adequately considered by Dreyfus in connection with the fee rate charged to the fund pursuant to the Agreement and that, to the extent in the future it were determined that material economies of scale had not been shared with the fund, the Board would seek to have those economies of scale shared with the fund.
30
In evaluating the Agreement, the Board considered these conclusions and determinations and also relied on its previous knowledge, gained through meetings and other interactions with Dreyfus and its affiliates, of the fund and the services provided to the fund by Dreyfus. The Board also relied on information received on a routine and regular basis throughout the year relating to the operations of the fund and the investment management and other services provided under the Agreement, including information on the investment performance of the fund in comparison to similar mutual funds and benchmark performance measures; general market outlook as applicable to the fund; and compliance reports. In addition, the Board’s consideration of the contractual fee arrangements for this fund had the benefit of a number of years of reviews of prior or similar agreements during which lengthy discussions took place between the Board and Dreyfus representatives. Certain aspects of the arrangements may receive greater scrutiny in some years than in others, and the Board’s conclusions may be based, in part, on their consideration of the same or similar arrangements in prior years. The Board determined that renewal of the Agreement was in the best interests of the fund and its shareholders.
The Fund 31
BOARD MEMBERS INFORMATION (Unaudited)
INDEPENDENT BOARD MEMBERS
|
| Joseph S. DiMartino (71) |
| Chairman of the Board (1995) |
| Principal Occupation During Past 5Years: |
| • Corporate Director and Trustee (1995-present) |
| Other Public Company Board Memberships During Past 5Years: |
| • CBIZ (formerly, Century Business Services, Inc.), a provider of outsourcing functions for small |
| and medium size companies, Director (1997-present) |
| • The Newark Group, a provider of a national market of paper recovery facilities, paperboard |
| mills and paperboard converting plants, Director (2000-2010) |
| • Sunair Services Corporation, a provider of certain outdoor-related services to homes and |
| businesses, Director (2005-2009) |
| No. of Portfolios for which Board Member Serves: 146 |
| ——————— |
| Francine J. Bovich (63) |
| Board Member (2012) |
| Principal Occupation During Past 5Years: |
| • Trustee,The Bradley Trusts, private trust funds (2011-present) |
| • Managing Director, Morgan Stanley Investment Management (1993-2010) |
| Other Public Company Board Membership During Past 5Years: |
| • Annaly Capital Management, Inc., Board Member (May 2014-present) |
| No. of Portfolios for which Board Member Serves: 46 |
| ——————— |
| Peggy C. Davis (71) |
| Board Member (1990) |
| Principal Occupation During Past 5Years: |
| • Shad Professor of Law, New York University School of Law (1983-present) |
| No. of Portfolios for which Board Member Serves: 52 |
| ——————— |
| Diane Dunst (75) |
| Board Member (2007) |
| Principal Occupation During Past 5Years: |
| • President of Huntting House Antiques (1999-present) |
| No. of Portfolios for which Board Member Serves: 14 |
32
|
| Nathan Leventhal (71) |
| Board Member (1989) |
| Principal Occupation During Past 5Years: |
| • Chairman of the Avery-Fisher Artist Program (1997-2014) |
| • Commissioner, NYC Planning Commission (2007-2011) |
| Other Public Company Board Membership During Past 5Years: |
| • Movado Group, Inc., Director (2003-present) |
| No. of Portfolios for which Board Member Serves: 52 |
| |
| ——————— |
| Robin A. Melvin (51) |
| Board Member (2012) |
| Principal Occupation During Past 5Years: |
| • Board Member, Illinois Mentoring Partnership, non-profit organization dedicated to increasing |
| the quantity and quality of mentoring services in Illinois (2013-present) |
| • Director, Boisi Family Foundation, a private family foundation that supports |
| youth-serving organizations that promote the self sufficiency of youth from |
| disadvantaged circumstances (1995-2012) |
| No. of Portfolios for which Board Member Serves: 114 |
| |
| ——————— |
| Once elected all Board Members serve for an indefinite term, but achieve Emeritus status upon reaching age 80.The |
| address of the Board Members and Officers is c/o The Dreyfus Corporation, 200 Park Avenue, NewYork, NewYork |
| 10166.Additional information about the Board Members is available in the fund’s Statement of Additional Information |
| which can be obtained from Dreyfus free of charge by calling this toll free number: 1-800-DREYFUS. |
| Clifford L.Alexander, Jr., Emeritus Board Member |
| Ernest Kafka, Emeritus Board Member |
| Jay I. Meltzer, Emeritus Board Member |
| Daniel Rose, Emeritus Board Member |
| Sander Vanocur, Emeritus Board Member |
The Fund 33
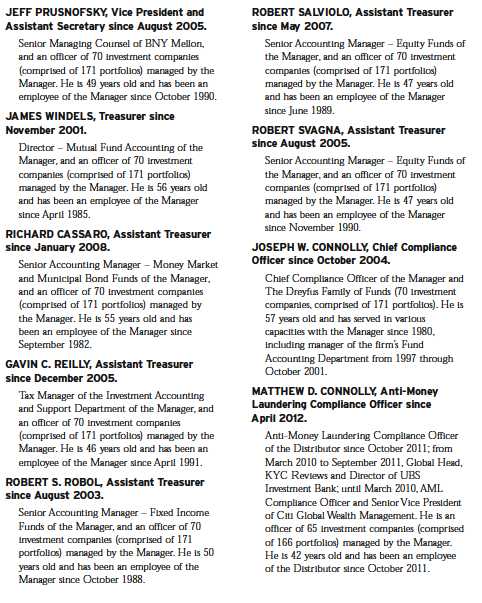
OFFICERS OF THE FUND (Unaudited)
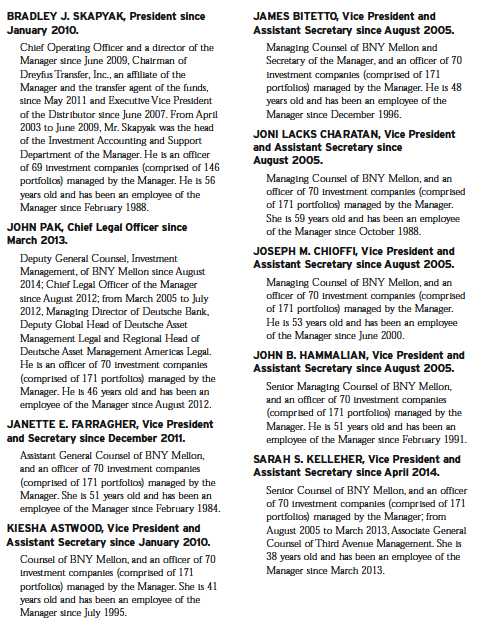
34
The Fund 35
For More Information
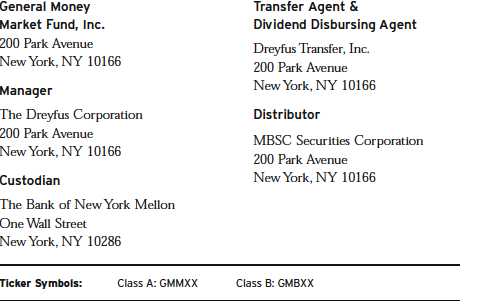
Telephone 1-800-DREYFUS
Mail The Dreyfus Family of Funds, 144 Glenn Curtiss Boulevard, Uniondale, NY 11556-0144
E-mail Send your request to info@dreyfus.com
Internet Information can be viewed online or downloaded at: http://www.dreyfus.com
The fund will disclose daily, on www.dreyfus.com, the fund’s complete schedule of holdings as of the end of the previous business day. The schedule of holdings will remain on the website until the fund files its Form N-Q or Form N-CSR for the period that includes the date of the posted holdings.
The fund files its complete schedule of portfolio holdings with the Securities and Exchange Commission (“SEC”) for the first and third quarters of each fiscal year on Form N-Q. The fund's Forms N-Q are available on the SEC’s website at http://www.sec.gov and may be reviewed and copied at the SEC’s Public Reference Room in Washington, DC. Information on the operation of the Public Reference Room may be obtained by calling 1-800-SEC-0330.
Information regarding how the fund voted proxies relating to portfolio securities for the most recent 12-month period ended June 30 is available on the SEC’s website at http://www.sec.gov and without charge, upon request, by calling 1-800-DREYFUS.

Item 2. Code of Ethics.
The Registrant has adopted a code of ethics that applies to the Registrant's principal executive officer, principal financial officer, principal accounting officer or controller, or persons performing similar functions. There have been no amendments to, or waivers in connection with, the Code of Ethics during the period covered by this Report.
Item 3. Audit Committee Financial Expert.
The Registrant's Board has determined that Joseph S. DiMartino, a member of the Audit Committee of the Board, is an audit committee financial expert as defined by the Securities and Exchange Commission (the "SEC"). Joseph S. DiMartino is "independent" as defined by the SEC for purposes of audit committee financial expert determinations.
Item 4. Principal Accountant Fees and Services.
(a) Audit Fees. The aggregate fees billed for each of the last two fiscal years (the "Reporting Periods") for professional services rendered by the Registrant's principal accountant (the "Auditor") for the audit of the Registrant's annual financial statements or services that are normally provided by the Auditor in connection with the statutory and regulatory filings or engagements for the Reporting Periods, were $31,594 in 2013 and $32,226 in 2014.
(b) Audit-Related Fees. The aggregate fees billed in the Reporting Periods for assurance and related services by the Auditor that are reasonably related to the performance of the audit of the Registrant's financial statements and are not reported under paragraph (a) of this Item 4 were $6,000 in 2013 and $6,120 in 2014. These services consisted of one or more of the following: (i) agreed upon procedures related to compliance with Internal Revenue Code section 817(h), (ii) security counts required by Rule 17f-2 under the Investment Company Act of 1940, as amended, (iii) advisory services as to the accounting or disclosure treatment of Registrant transactions or events and (iv) advisory services to the accounting or disclosure treatment of the actual or potential impact to the Registrant of final or proposed rules, standards or interpretations by the Securities and Exchange Commission, the Financial Accounting Standards Boards or other regulatory or standard-setting bodies.
The aggregate fees billed in the Reporting Periods for non-audit assurance and related services by the Auditor to the Registrant's investment adviser (not including any sub-investment adviser whose role is primarily portfolio management and is subcontracted with or overseen by another investment adviser), and any entity controlling, controlled by or under common control with the investment adviser that provides ongoing services to the Registrant ("Service Affiliates"), that were reasonably related to the performance of the annual audit of the Service Affiliate, which required pre-approval by the Audit Committee were $0 in 2013 and $0 in 2014.
(c) Tax Fees. The aggregate fees billed in the Reporting Periods for professional services rendered by the Auditor for tax compliance, tax advice, and tax planning ("Tax Services") were $3,220 in 2013 and $3,578 in 2014. These services consisted of: (i) review or preparation of U.S. federal, state, local and excise tax returns; (ii) U.S. federal, state and local tax planning, advice and assistance regarding statutory, regulatory or administrative developments; and (iii) tax advice regarding tax qualification matters and/or treatment of various financial instruments held or proposed to be acquired or held. The aggregate fees billed in the Reporting Periods for Tax Services by the Auditor to Service Affiliates, which required pre-approval by the Audit Committee were $0 in 2013 and $0 in 2014.
(d) All Other Fees. The aggregate fees billed in the Reporting Periods for products and services provided by the Auditor, other than the services reported in paragraphs (a) through (c) of this Item, were $987 in 2013 and $1,112 in 2014. [These services consisted of a review of the Registrant's anti-money laundering program].
The aggregate fees billed in the Reporting Periods for Non-Audit Services by the Auditor to Service Affiliates, other than the services reported in paragraphs (b) through (c) of this Item, which required pre-approval by the Audit Committee, were $0 in 2013 and $0 in 2014.
(e)(1) Audit Committee Pre-Approval Policies and Procedures. The Registrant's Audit Committee has established policies and procedures (the "Policy") for pre-approval (within specified fee limits) of the Auditor's engagements for non-audit services to the Registrant and Service Affiliates without specific case-by-case consideration. The pre-approved services in the Policy can include pre-approved audit services, pre-approved audit-related services, pre-approved tax services and pre-approved all other services. Pre-approval considerations include whether the proposed services are compatible with maintaining the Auditor's independence. Pre-approvals pursuant to the Policy are considered annually.
(e)(2) Note: None of the services described in paragraphs (b) through (d) of this Item 4 were approved by the Audit Committee pursuant to paragraph (c)(7)(i)(C) of Rule 2-01 of Regulation S-X.
(f) None of the hours expended on the principal accountant's engagement to audit the registrant's financial statements for the most recent fiscal year were attributed to work performed by persons other than the principal account's full-time, permanent employees.
Non-Audit Fees. The aggregate non-audit fees billed by the Auditor for services rendered to the Registrant, and rendered to Service Affiliates, for the Reporting Periods were $51,023,448 in 2013 and $25,624,689 in 2014.
Auditor Independence. The Registrant's Audit Committee has considered whether the provision of non-audit services that were rendered to Service Affiliates, which were not pre-approved (not requiring pre-approval), is compatible with maintaining the Auditor's independence.
Item 5. Audit Committee of Listed Registrants.
Not applicable. [CLOSED-END FUNDS ONLY]
Item 6. Investments.
(a) Not applicable.
Item 7. Disclosure of Proxy Voting Policies and Procedures for Closed-End Management Investment Companies.
Not applicable. [CLOSED-END FUNDS ONLY]
Item 8. Portfolio Managers of Closed-End Management Investment Companies.
Not applicable. [CLOSED-END FUNDS ONLY, beginning with reports for periods ended on and after December 31, 2005]
Item 9. Purchases of Equity Securities by Closed-End Management Investment Companies and Affiliated Purchasers.
Not applicable. [CLOSED-END FUNDS ONLY]
Item 10. Submission of Matters to a Vote of Security Holders.
There have been no material changes to the procedures applicable to Item 10.
Item 11. Controls and Procedures.
(a) The Registrant's principal executive and principal financial officers have concluded, based on their evaluation of the Registrant's disclosure controls and procedures as of a date within 90 days of the filing date of this report, that the Registrant's disclosure controls and procedures are reasonably designed to ensure that information required to be disclosed by the Registrant on Form N-CSR is recorded, processed, summarized and reported within the required time periods and that information required to be disclosed by the Registrant in the reports that it files or submits on Form N-CSR is accumulated and communicated to the Registrant's management, including its principal executive and principal financial officers, as appropriate to allow timely decisions regarding required disclosure.
(b) There were no changes to the Registrant's internal control over financial reporting that occurred during the second fiscal quarter of the period covered by this report that have materially affected, or are reasonably likely to materially affect, the Registrant's internal control over financial reporting.
Item 12. Exhibits.
(a)(1) Code of ethics referred to in Item 2.
(a)(2) Certifications of principal executive and principal financial officers as required by Rule 30a-2(a) under the Investment Company Act of 1940.
(a)(3) Not applicable.
(b) Certification of principal executive and principal financial officers as required by Rule 30a-2(b) under the Investment Company Act of 1940.
SIGNATURES
Pursuant to the requirements of the Securities Exchange Act of 1934 and the Investment Company Act of 1940, the Registrant has duly caused this Report to be signed on its behalf by the undersigned, thereunto duly authorized.
General Money Market Fund, Inc.
By: /s/Bradley J. Skapyak
Bradley J. Skapyak,
President
Date: January 22, 2015
Pursuant to the requirements of the Securities Exchange Act of 1934 and the Investment Company Act of 1940, this Report has been signed below by the following persons on behalf of the Registrant and in the capacities and on the dates indicated.
By: /s/ Bradley J. Skapyak
Bradley J. Skapyak,
President
Date: January 22, 2015
By: /s/James Windels
James Windels,
Treasurer
Date: January 22, 2015
EXHIBIT INDEX
(a)(1) Code of ethics referred to in Item 2.
(a)(2) Certifications of principal executive and principal financial officers as required by Rule 30a-2(a) under the Investment Company Act of 1940. (EX-99.CERT)
(b) Certification of principal executive and principal financial officers as required by Rule 30a-2(b) under the Investment Company Act of 1940. (EX-99.906CERT)